UNITED STATES
SECURITIES AND EXCHANGE COMMISSION
Washington, D.C. 20549
FORM N-CSR
CERTIFIED SHAREHOLDER REPORT OF REGISTERED
MANAGEMENT INVESTMENT COMPANIES
Investment Company Act file number: 811-3618
BRIGHTHOUSE FUNDS TRUST II
(Exact name of registrant as specified in charter)
11225 North Community House Rd.
Charlotte, NC 28277
(Address of principal executive offices)(Zip code)
| (Name and Address of Agent for Service) | Copy to: | |
| Kristi Slavin -------------------------- c/o Brighthouse Investment Advisers, LLC 11225 North Community House Rd. Charlotte, NC 28277 |
Brian D. McCabe, Esq. -------------------------- Ropes and Gray LLP Prudential Tower 800 Boylston Street Boston, MA 02199 | |
Registrant’s telephone number, including area code: (980) 949-5121
Date of fiscal year end: December 31
Date of reporting period: December 31, 2023
Item 1: Report to Shareholders.
| (a) | The following is a copy of the report transmitted to stockholders pursuant to Rule 30e-1 under the Investment Company Act of 1940 (the “Act”): |
Brighthouse Funds Trust II
Baillie Gifford International Stock Portfolio
Managed By Baillie Gifford Overseas Limited
Portfolio Manager Commentary*
PERFORMANCE
For the twelve months ended December 31, 2023, the Class A, B and E shares of the Baillie Gifford International Stock Portfolio returned 18.59%, 18.36%, and 18.46%, respectively. The Portfolio’s benchmark, the MSCI All Country World ex-U.S. Index¹, returned 15.62%.
MARKET ENVIRONMENT / CONDITIONS
The state of financial markets in 2023 was characterised by the up-and-down nature of investors attempting to guess and react to the Federal Reserve’s response to economic data.
Although international equities performed strongly, recouping most of their losses from 2022, it was anything but a smooth ride, particularly for growth stocks. Higher-quality businesses, with stronger fundamentals, outperformed during the first quarter of the year and it appeared as though the wind was changing. During the third quarter, some unexpectedly stubborn inflation data caused interest rate expectations to jump, grabbing the attention of investors, and reversing share price moves from earlier in the year.
Towards the end of the year a clear picture then emerged that inflation was slowing, leading central banks across the developed world to turn more dovish, and to begin to signal an end to interest rate tightening. Sentiment shifted dramatically and growth stocks rebounded.
PORTFOLIO REVIEW / PERIOD END POSITIONING
The Portfolio outperformed its benchmark, the MSCI All Country World ex-U.S. Index (the “Index”) in 2023. At the regional level, all areas outperformed except Developed Asia Pacific. Emerging Markets was the strongest relative performer, followed by Europe (ex-U.K.) and North America. In terms of sectors, stock selection in Information Technology (“IT”) was strong and the largest contributor, followed by Materials. While there was diversity among the top performers, there was a strong thematic element to the weakest names, with stock selection in Asia and Health Care featuring prominently.
At the stock level, the top contributors include MercadoLibre (Brazil), Ryanair (Ireland) and CRH (Ireland). MercadoLibre is Latin America’s leading e-commerce and digital platform business. The company recently surpassed 100 million monthly active e-commerce users for the first time, and the firm recently opened its first regional fulfilment centre in Rio de Janeiro, which should allow it to increase its same-day shipping footprint. While the stock price may fluctuate from quarter to quarter, operational performance has been remarkably consistent, and we believe it is well-positioned to deliver structural growth in the long term.
Europe’s largest airline, Ryanair, has performed well after emerging from the pandemic and has taken significant market share. Their recent results were strong, with revenues rising by 30% year-on-year, driven by higher fares and passenger volumes. Management also announced plans to pay out 25% of profit after tax through dividends in the future, a sign of confidence that was taken well by the market. We believe Ryanair is uniquely positioned as Europe’s lowest-cost airline and should continue to take market share for many years.
The detractors to performance included AIA (Hong Kong) and Shiseido (Japan). A common thread was sentiment towards Chinese holdings and those facing into Chinese demand after China’s economy did not bounce back as many expected.
AIA is an Asian life insurer. The business has fallen victim to the sentiment around the Chinese economy in 2023, and the share price has diverged from fundamentals during the period. Recent results have been solid, with new business growth up 35% year-on-year. At the same time, management remains stable, and the business is set up for long-term success. We are confident in AIA’s position as a high-quality insurance business, which is well-placed to benefit from the structural growth offered by insurance in Asia.
Shiseido, the luxury Japanese cosmetics manufacturer, has been experiencing weak operational results, with sales still below pre-COVID levels. This has led the new CEO to announce an urgent restructuring plan to reduce costs and improve operational efficiencies. Despite the slower-than-expected recovery from COVID and tourism in Japan, we remain optimistic about Shiseido’s long-term growth potential. We believe the company’s focus on high-end skincare and skew to the Asian market is particularly appealing and has the potential to generate higher margins in the future.
During the fourth quarter, we sold out of Hong Kong Exchanges and Clearing, observing that the current valuation offered little protection from heightened regulatory risks. There are also growing concerns surrounding Hong Kong’s role as an offshore venue for international companies accessing Chinese capital. We took a new position in Chinese homegrown luxury liquor brand Kweichow Moutai and French luxury conglomerate LVMH, best known for its eponymous Louis Vuitton brand.
At the end of the year, the Portfolio’s largest sector overweight positions relative to the Index were Industrials, IT, and Consumer Discretionary. The largest underweight positions were Financials, Health Care, and Energy. At the country level, the largest overweights were Ireland, Netherlands, and Germany. The largest
BHFTII-1
Brighthouse Funds Trust II
Baillie Gifford International Stock Portfolio
Managed By Baillie Gifford Overseas Limited
Portfolio Manager Commentary*—(Continued)
underweights were the U.K., Australia, and Switzerland. Please note, these positions were a result of bottom-up stock selection, rather than top-down allocation.
Jenny Davis
Tom Walsh
Steve Vaughan
Portfolio Managers
Baillie Gifford Overseas Limited
* This commentary may include statements that constitute “forward-looking statements” under the U.S. securities laws. Forward-looking statements include, among other things, projections, estimates, and information about possible or future results related to the Portfolio, market or regulatory developments. The views expressed above are not guarantees of future performance or economic results and involve certain risks, uncertainties and assumptions that could cause actual outcomes and results to differ materially from the views expressed herein. The views expressed above are subject to change at any time based upon economic, market, or other conditions and the subadvisory firm undertakes no obligation to update the views expressed herein. Any discussions of specific securities should not be considered a recommendation to buy or sell those securities. The views expressed above (including any forward-looking statement) may not be relied upon as investment advice or as an indication of the Portfolio’s trading intent. Information about the Portfolio’s holdings, asset allocation or country diversification is historical and is not an indication of future Portfolio composition, which may vary. Direct investment in any index is not possible. The performance of any index mentioned in this commentary has not been adjusted for ongoing management, distribution and operating expenses, and sales charges applicable to mutual fund investments. In addition, the returns do not reflect additional fees charged by separate accounts or variable insurance contracts that an investor in the Portfolio may pay. If these additional fees were reflected, performance would have been lower.
1 The MSCI All Country World ex-U.S. Index is an unmanaged free float-adjusted market capitalization index that is designed to measure equity market performance in the global developed and emerging markets, excluding the U.S. The Index returns shown above were calculated with net dividends: they reflect the reinvestment of dividends after the deduction of the maximum possible withholding taxes.
BHFTII-2
Brighthouse Funds Trust II
Baillie Gifford International Stock Portfolio
A $10,000 INVESTMENT COMPARED TO THE MSCI ALL COUNTRY WORLD EX-U.S. INDEX
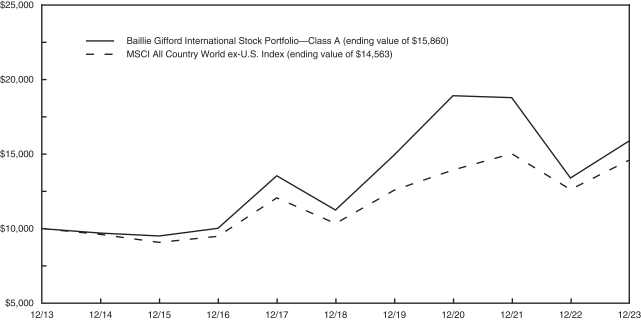
AVERAGE ANNUAL RETURNS (%) FOR THE YEAR ENDED DECEMBER 31, 2023
| 1 Year | 5 Year | 10 Year | ||||||||||
| Baillie Gifford International Stock Portfolio | ||||||||||||
| Class A |
18.59 | 7.15 | 4.72 | |||||||||
| Class B |
18.36 | 6.88 | 4.46 | |||||||||
|
Class E |
18.46 | 6.98 | 4.56 | |||||||||
| MSCI All Country World ex-U.S. Index | 15.62 | 7.08 | 3.83 | |||||||||
Portfolio performance is calculated including reinvestment of all income and capital gain distributions. Performance numbers are net of all Portfolio expenses but do not include any insurance, sales, separate account or administrative charges of variable annuity or life insurance contracts or any additional expenses that participants may bear relating to the operations of their plans. If these charges were included, the returns would be lower. The performance of any index referenced above has not been adjusted for ongoing management, distribution and operating expenses, and sales charges applicable to mutual fund investments. Direct investment in any index is not possible. The performance of Class A shares, as set forth in the line graph above, will differ from that of other classes because of the difference in expenses paid by policyholders investing in the different share classes.
This information represents past performance and is not indicative of future results. Investment return and principal value may fluctuate so that shares, upon redemption, may be worth more or less than the original cost.
PORTFOLIO COMPOSITION AS OF DECEMBER 31, 2023
Top Holdings
| % of Net Assets |
||||
| MercadoLibre, Inc. | 4.5 | |||
| Taiwan Semiconductor Manufacturing Co. Ltd. | 3.8 | |||
| Samsung Electronics Co. Ltd. | 2.9 | |||
| Ryanair Holdings PLC (ADR) | 2.8 | |||
| SAP SE | 2.8 | |||
| CRH PLC | 2.6 | |||
| Atlas Copco AB- B Shares | 2.5 | |||
| AIA Group Ltd. | 2.4 | |||
| Scout24 SE | 2.1 | |||
| Kingspan Group PLC | 2.1 | |||
Top Countries
| % of Net Assets |
||||
| Japan | 12.5 | |||
| Germany | 8.9 | |||
| France | 8.6 | |||
| Ireland | 7.5 | |||
| China | 6.6 | |||
| Netherlands | 5.8 | |||
| Denmark | 4.9 | |||
| Canada | 4.8 | |||
| India | 4.7 | |||
| Brazil | 4.5 | |||
BHFTII-3
Brighthouse Funds Trust II
Baillie Gifford International Stock Portfolio
Understanding Your Portfolio’s Expenses
Shareholder Expense Example
As a shareholder of the Portfolio, you incur ongoing costs, including management fees; distribution and service (12b-1) fees; and other Portfolio expenses. This example is intended to help you understand your ongoing costs (in dollars) (referred to as “expenses”) of investing in the Portfolio and compare these costs with the ongoing costs of investing in other mutual funds. The example is based on an investment of $1,000 invested at the beginning of the period and held for the entire period, July 1, 2023 through December 31, 2023.
Actual Expenses
The first line for each share class of the Portfolio in the table below provides information about actual account values and actual expenses. You may use the information in this line, together with the amount you invested in the particular share class of the Portfolio, to estimate the expenses that you paid over the period. Simply divide your account value by $1,000 (for example, an $8,600 account value divided by $1,000 = 8.6), then multiply the result by the number in the first line under the heading entitled “Expenses Paid During Period” to estimate the expenses you paid on your account during this period.
Hypothetical Example for Comparison Purposes
The second line for each share class of the Portfolio in the table below provides information about hypothetical account values and hypothetical expenses based on the Portfolio’s actual expense ratio and an assumed rate of return of 5% per year before expenses, which is not the Portfolio’s actual return. The hypothetical account values and expenses may not be used to estimate the actual ending account balance or expenses you paid for the period. You may use this information to compare the ongoing costs of investing in the Portfolio and other funds. To do so, compare this 5% hypothetical example with the 5% hypothetical examples that appear in the shareholder reports of the other funds.
Please note that the expenses shown in the table are meant to highlight your ongoing costs only and do not reflect any fees or charges of your variable insurance product or any additional expenses that participants in certain eligible qualified plans may bear relating to the operations of their plan. Therefore, the second line for each share class in the table is useful in comparing ongoing costs only, and will not help you determine the relative total costs of owning different funds. In addition, if these other costs were included, your costs would have been higher.
| Baillie Gifford International Stock Portfolio |
Annualized Expense Ratio |
Beginning Account Value July 1, 2023 |
Ending Account Value December 31, 2023 |
Expenses Paid During Period** July 1, 2023 to December 31, 2023 |
||||||||||||||
| Class A (a) |
Actual | 0.76 | % | $ | 1,000.00 | $ | 1,031.50 | $ | 3.89 | |||||||||
| Hypothetical* | 0.76 | % | $ | 1,000.00 | $ | 1,021.37 | $ | 3.87 | ||||||||||
| Class B (a) |
Actual | 1.01 | % | $ | 1,000.00 | $ | 1,030.20 | $ | 5.17 | |||||||||
| Hypothetical* | 1.01 | % | $ | 1,000.00 | $ | 1,020.11 | $ | 5.14 | ||||||||||
| Class E (a) |
Actual | 0.91 | % | $ | 1,000.00 | $ | 1,031.00 | $ | 4.66 | |||||||||
| Hypothetical* | 0.91 | % | $ | 1,000.00 | $ | 1,020.62 | $ | 4.63 | ||||||||||
| * | Hypothetical assumes a rate of return of 5% per year before expenses. |
| ** | Expenses paid are equal to the Portfolio’s annualized expense ratio for the most recent six month period, as shown above, multiplied by the average account value over the period, multiplied by the number of days (184 days) in the most recent fiscal half-year, divided by 365 (to reflect the one-half year period). |
| (a) | The annualized expense ratio shown reflects the impact of the management fee waiver as described in Note 5 of the Notes to Financial Statements. |
BHFTII-4
Brighthouse Funds Trust II
Baillie Gifford International Stock Portfolio
Schedule of Investments as of December 31, 2023
Common Stocks—99.0% of Net Assets
| Security Description | Shares | Value | ||||||
| Brazil—4.5% | ||||||||
| MercadoLibre, Inc. (a) |
43,210 | $ | 67,906,243 | |||||
|
|
|
|||||||
| Canada—4.8% | ||||||||
| AbCellera Biologics, Inc. (a) (b) |
545,830 | 3,116,689 | ||||||
| Constellation Software, Inc. |
10,235 | 25,376,204 | ||||||
| Lumine Group, Inc. (a) |
560,350 | 12,644,402 | ||||||
| Shopify, Inc. - Class A (a) |
215,803 | 16,811,054 | ||||||
| Topicus.com, Inc. (a) |
212,852 | 14,335,242 | ||||||
|
|
|
|||||||
| 72,283,591 | ||||||||
|
|
|
|||||||
| China—6.6% | ||||||||
| Alibaba Group Holding Ltd. |
970,672 | 9,380,819 | ||||||
| Kweichow Moutai Co. Ltd. - Class A |
57,100 | 13,869,904 | ||||||
| Meituan - Class B (a) |
594,170 | 6,262,580 | ||||||
| Ping An Insurance Group Co. of China Ltd. - Class H |
1,863,500 | 8,429,459 | ||||||
| Prosus NV |
358,629 | 10,693,282 | ||||||
| Silergy Corp. |
758,000 | 12,338,244 | ||||||
| Tencent Holdings Ltd. |
451,100 | 17,042,900 | ||||||
| Tencent Music Entertainment Group (ADR) (a) |
1,759,515 | 15,853,230 | ||||||
| Wuxi Biologics Cayman, Inc. (a) |
1,571,500 | 5,936,329 | ||||||
|
|
|
|||||||
| 99,806,747 | ||||||||
|
|
|
|||||||
| Denmark—4.9% | ||||||||
| Ambu AS - Class B (a) (b) |
439,317 | 6,842,436 | ||||||
| Chr Hansen Holding AS |
135,456 | 11,355,481 | ||||||
| Demant AS (a) |
339,369 | 14,919,417 | ||||||
| DSV AS |
132,803 | 23,361,585 | ||||||
| Novozymes AS - B Shares |
334,727 | 18,430,121 | ||||||
|
|
|
|||||||
| 74,909,040 | ||||||||
|
|
|
|||||||
| Finland—1.2% | ||||||||
| Kone Oyj - Class B |
353,517 | 17,690,835 | ||||||
|
|
|
|||||||
| France—8.6% | ||||||||
| Danone SA |
450,546 | 29,222,994 | ||||||
| Dassault Systemes SE |
539,552 | 26,413,571 | ||||||
| Edenred SE |
426,916 | 25,633,407 | ||||||
| Kering SA |
36,731 | 16,300,520 | ||||||
| LVMH Moet Hennessy Louis Vuitton SE |
18,381 | 14,909,293 | ||||||
| Nexans SA |
86,795 | 7,601,020 | ||||||
| Sartorius Stedim Biotech |
41,955 | 11,143,320 | ||||||
|
|
|
|||||||
| 131,224,125 | ||||||||
|
|
|
|||||||
| Germany—8.9% | ||||||||
| BioNTech SE (ADR) (a) (b) |
79,581 | 8,398,979 | ||||||
| Deutsche Boerse AG |
148,552 | 30,584,851 | ||||||
| Rational AG |
27,918 | 21,569,102 | ||||||
| SAP SE |
272,596 | 41,932,202 | ||||||
| Scout24 SE |
455,061 | 32,196,004 | ||||||
|
|
|
|||||||
| 134,681,138 | ||||||||
|
|
|
|||||||
| Hong Kong—2.4% | ||||||||
| AIA Group Ltd. |
4,244,200 | 36,862,599 | ||||||
|
|
|
|||||||
| India—4.7% | ||||||||
| HDFC Bank Ltd. |
1,471,432 | 30,175,054 | ||||||
| ICICI Lombard General Insurance Co. Ltd. |
793,980 | 13,580,104 | ||||||
| Reliance Industries Ltd. |
867,558 | 26,944,688 | ||||||
|
|
|
|||||||
| 70,699,846 | ||||||||
|
|
|
|||||||
| Ireland—7.5% | ||||||||
| CRH PLC |
573,440 | 39,516,951 | ||||||
| Kingspan Group PLC |
370,040 | 31,979,769 | ||||||
| Ryanair Holdings PLC (ADR) (a) |
321,981 | 42,939,386 | ||||||
|
|
|
|||||||
| 114,436,106 | ||||||||
|
|
|
|||||||
| Italy—1.9% | ||||||||
| FinecoBank Banca Fineco SpA |
1,276,869 | 19,184,609 | ||||||
| Technoprobe SpA (a) (b) |
1,042,634 | 9,965,040 | ||||||
|
|
|
|||||||
| 29,149,649 | ||||||||
|
|
|
|||||||
| Japan—12.5% | ||||||||
| Denso Corp. |
1,241,000 | 18,613,685 | ||||||
| FANUC Corp. |
637,100 | 18,741,979 | ||||||
| Keyence Corp. |
34,100 | 14,947,510 | ||||||
| MonotaRO Co. Ltd. (b) |
1,069,300 | 11,638,696 | ||||||
| Nidec Corp. |
216,900 | 8,839,022 | ||||||
| Nihon M&A Center Holdings, Inc. |
2,031,900 | 11,170,080 | ||||||
| Nintendo Co. Ltd. |
322,800 | 16,868,287 | ||||||
| Recruit Holdings Co. Ltd. |
325,100 | 13,879,593 | ||||||
| Shimano, Inc. (b) |
94,900 | 14,649,585 | ||||||
| Shiseido Co. Ltd. |
432,000 | 13,005,362 | ||||||
| SMC Corp. |
35,400 | 18,930,876 | ||||||
| Sony Group Corp. |
294,500 | 27,905,253 | ||||||
|
|
|
|||||||
| 189,189,928 | ||||||||
|
|
|
|||||||
| Netherlands—5.8% | ||||||||
| Adyen NV (a) |
17,884 | 23,054,554 | ||||||
| ASML Holding NV |
30,824 | 23,272,526 | ||||||
| EXOR NV |
167,043 | 16,746,190 | ||||||
| IMCD NV |
147,254 | 25,693,377 | ||||||
|
|
|
|||||||
| 88,766,647 | ||||||||
|
|
|
|||||||
| Norway—0.6% | ||||||||
| Aker Carbon Capture ASA (a) |
6,509,268 | 8,677,305 | ||||||
|
|
|
|||||||
| Panama—0.8% | ||||||||
| Copa Holdings SA - Class A |
119,529 | 12,707,128 | ||||||
|
|
|
|||||||
| Russia—0.0% | ||||||||
| MMC Norilsk Nickel PJSC (a) (c) (d) |
39,210 | 0 | ||||||
| MMC Norilsk Nickel PJSC (ADR) (a) (c) (d) |
7 | 0 | ||||||
|
|
|
|||||||
| 0 | ||||||||
|
|
|
|||||||
| Singapore—0.5% | ||||||||
| Sea Ltd. (ADR) (a) |
181,235 | 7,340,018 | ||||||
|
|
|
|||||||
| South Africa—1.1% | ||||||||
| Discovery Ltd. |
2,202,548 | 17,303,180 | ||||||
|
|
|
|||||||
See accompanying notes to financial statements.
BHFTII-5
Brighthouse Funds Trust II
Baillie Gifford International Stock Portfolio
Schedule of Investments as of December 31, 2023
Common Stocks—(Continued)
| Security Description | Shares/ Principal Amount* |
Value | ||||||
| South Korea—3.7% | ||||||||
| Coupang, Inc. (a) |
758,507 | $ | 12,280,228 | |||||
| Samsung Electronics Co. Ltd. |
722,399 | 43,936,246 | ||||||
|
|
|
|||||||
| 56,216,474 | ||||||||
|
|
|
|||||||
| Spain—1.7% | ||||||||
| Amadeus IT Group SA |
350,325 | 25,125,326 | ||||||
|
|
|
|||||||
| Sweden—4.4% | ||||||||
| Atlas Copco AB - B Shares |
2,556,437 | 37,898,334 | ||||||
| Epiroc AB - B Shares |
1,309,683 | 22,918,096 | ||||||
| MIPS AB |
166,328 | 6,057,540 | ||||||
|
|
|
|||||||
| 66,873,970 | ||||||||
|
|
|
|||||||
| Switzerland—3.5% | ||||||||
| Cie Financiere Richemont SA - Class A |
131,825 | 18,183,059 | ||||||
| Nestle SA |
261,576 | 30,274,119 | ||||||
| Wizz Air Holdings PLC (a) |
194,084 | 5,446,671 | ||||||
|
|
|
|||||||
| 53,903,849 | ||||||||
|
|
|
|||||||
| Taiwan—3.8% | ||||||||
| Taiwan Semiconductor Manufacturing Co. Ltd. |
2,977,000 | 57,293,803 | ||||||
|
|
|
|||||||
| United Kingdom—3.8% | ||||||||
| Experian PLC |
575,744 | 23,462,587 | ||||||
| Oxford Nanopore Technologies PLC (a) |
1,868,921 | 4,951,914 | ||||||
| Rio Tinto PLC |
404,829 | 30,065,851 | ||||||
|
|
|
|||||||
| 58,480,352 | ||||||||
|
|
|
|||||||
| United States—0.8% | ||||||||
| Spotify Technology SA (a) |
64,713 | 12,160,220 | ||||||
|
|
|
|||||||
| Total Common Stocks |
1,503,688,119 | |||||||
|
|
|
|||||||
| Warrants—0.0% |
| |||||||
| Canada—0.0% | ||||||||
| Constellation Software, Inc. Expires 03/31/40 (a) |
10,541 | 0 | ||||||
|
|
|
|||||||
| Short-Term Investment—0.6% |
| |||||||
| Repurchase Agreement—0.6% | ||||||||
| Fixed Income Clearing Corp. |
9,660,824 | 9,660,824 | ||||||
|
|
|
|||||||
| Total Short-Term Investments |
9,660,824 | |||||||
|
|
|
|||||||
| Securities Lending Reinvestments (e)—0.8% |
| |||||||
| Security Description | Shares/ Principal Amount* |
Value | ||||||
| Repurchase Agreements—0.2% | ||||||||
| Bank of Nova Scotia |
827,050 | 827,050 | ||||||
| Barclays Bank PLC |
| |||||||
| Repurchase Agreement dated 12/29/23 at 5.330%, due on 01/02/24 with a maturity value of $14,570; collateralized by U.S. Treasury Obligations with rates ranging from 0.000% - 5.500%, maturity dates ranging from 01/31/24 - 05/15/48, and an aggregate market value of $14,860. |
14,561 | 14,561 | ||||||
| Repurchase Agreement dated 12/29/23 at 5.450%, due on 01/02/24 with a maturity value of $100,061; collateralized by various Common Stock with an aggregate market value of $111,481. |
100,000 | 100,000 | ||||||
| Deutsche Bank Securities, Inc. |
656,144 | 656,144 | ||||||
| NBC Global Finance Ltd. |
700,000 | 700,000 | ||||||
| Societe Generale |
| |||||||
| Repurchase Agreement dated 12/29/23 at 5.330%, due on 01/02/24 with a maturity value of $13,586; collateralized by U.S. Treasury Obligations with rates ranging from 0.625% - 4.750%, maturity dates ranging from 04/15/26 - 08/15/51, and an aggregate market value of $13,880. |
13,578 | 13,578 | ||||||
| Repurchase Agreement dated 12/29/23 at 5.330%, due on 01/02/24 with a maturity value of $100,059; collateralized by U.S. Treasury Obligations with rates ranging from 0.625% - 5.240%, maturity dates ranging from 04/30/24 - 05/15/32, and an aggregate market value of $102,000. |
100,000 | 100,000 | ||||||
| Repurchase Agreement dated 12/29/23 at 5.510%, due on 01/02/24 with a maturity value of $41,803; collateralized by various Common Stock with an aggregate market value of $46,503. |
41,777 | 41,777 | ||||||
| TD Prime Services LLC |
317,033 | 317,033 | ||||||
|
|
|
|||||||
| 2,770,143 | ||||||||
|
|
|
|||||||
| Mutual Funds—0.6% | ||||||||
| Dreyfus Treasury Obligations Cash Management Fund, Institutional Class 5.250% (f) |
1,000,000 | 1,000,000 | ||||||
| Fidelity Investments Money Market Government Portfolio, Class I |
1,000,000 | 1,000,000 | ||||||
See accompanying notes to financial statements.
BHFTII-6
Brighthouse Funds Trust II
Baillie Gifford International Stock Portfolio
Schedule of Investments as of December 31, 2023
Securities Lending Reinvestments (e)—(Continued)
| Security Description | Shares | Value | ||||||
| Mutual Funds—(Continued) | ||||||||
| Fidelity Investments Money Market Government Portfolio, Institutional Class 5.290% (f) |
1,000,000 | $ | 1,000,000 | |||||
| Goldman Sachs Financial Square Government Fund, Institutional Shares 5.230% (f) |
1,400,000 | 1,400,000 | ||||||
| RBC U.S. Government Money Market Fund, Institutional Share 5.230% (f) |
1,400,000 | 1,400,000 | ||||||
| State Street Institutional U.S. Government Money Market Fund, Premier Class 5.320% (f) |
1,400,000 | 1,400,000 | ||||||
| STIT-Government & Agency Portfolio, Institutional Class 5.270% (f) |
992,137 | 992,137 | ||||||
| Western Asset Institutional Government Reserves Fund, Institutional Class 5.270% (f) |
400,000 | 400,000 | ||||||
|
|
|
|||||||
| 8,592,137 | ||||||||
|
|
|
|||||||
| Total Securities Lending Reinvestments |
11,362,280 | |||||||
|
|
|
|||||||
| Total Investments—100.4% |
1,524,711,223 | |||||||
| Other assets and liabilities (net)—(0.4)% |
(6,745,772 | ) | ||||||
|
|
|
|||||||
| Net Assets—100.0% | $ | 1,517,965,451 | ||||||
|
|
|
|||||||
| * | Principal amount stated in U.S. dollars unless otherwise noted. | |||
| (a) | Non-income producing security. | |||
| (b) | All or a portion of the security was held on loan. As of December 31, 2023, the market value of securities loaned was $39,258,699 and the collateral received consisted of cash in the amount of $11,362,280 and non-cash collateral with a value of $29,993,923. The cash collateral investments are disclosed in the Schedule of Investments and categorized as Securities Lending Reinvestments. The non-cash collateral received consists of U.S. government securities that are held in safe-keeping by the lending agent, or a third-party custodian, and cannot be sold or repledged by the Portfolio. As such, this collateral is excluded from the Statement of Assets and Liabilities. | |||
| (c) | Security was valued in good faith under procedures subject to oversight by the Board of Trustees. As of December 31, 2023, these securities represent less than 0.05% of net assets. | |||
| (d) | Significant unobservable inputs were used in the valuation of this portfolio security; i.e. Level 3. | |||
| (e) | Represents investment of cash collateral received from securities on loan as of December 31, 2023. | |||
| (f) | The rate shown represents the annualized seven-day yield as of December 31, 2023. | |||
| Ten Largest Industries as of |
% of |
|||
| Machinery |
9.1 | |||
| Software |
8.0 | |||
| Semiconductors & Semiconductor Equipment |
6.8 | |||
| Broadline Retail |
6.6 | |||
| Insurance |
5.0 | |||
| Financial Services |
4.3 | |||
| Passenger Airlines |
4.0 | |||
| Food Products |
3.9 | |||
| Entertainment |
3.4 | |||
| Textiles, Apparel & Luxury Goods |
3.3 | |||
Glossary of Abbreviations
Other Abbreviations
(ADR)— American Depositary Receipt
See accompanying notes to financial statements.
BHFTII-7
Brighthouse Funds Trust II
Baillie Gifford International Stock Portfolio
Schedule of Investments as of December 31, 2023
Fair Value Hierarchy
Accounting principles generally accepted in the United States of America (“GAAP”) define fair market value as the price that the Portfolio would receive to sell an asset or pay to transfer a liability in an orderly transaction between market participants at the measurement date. It establishes a fair value hierarchy that prioritizes inputs to valuation methods and requires disclosure of the fair value hierarchy, separately for each major category of assets and liabilities, that segregates fair value measurements into three levels. Levels 1, 2 and 3 of the fair value hierarchy are defined as follows:
Level 1 - unadjusted quoted prices in active markets for identical investments
Level 2 - other significant observable inputs (including, but not limited to, quoted prices for similar assets or liabilities in markets that are either active or inactive; inputs other than quoted prices that are observable such as interest rates, yield curves, volatilities, prepayment speeds, loss severities, credit risks, default rates, or other market corroborated inputs)
Level 3 - significant unobservable inputs based on the best information available in the circumstances, to the extent observable inputs are unavailable (including the Portfolio’s own assumptions used in determining the fair value of investments and derivative financial instruments)
The inputs or methodologies used for valuing investments are not necessarily an indication of the risk associated with investing in them. Changes to the inputs or methodologies used may result in transfers between levels. A reconciliation of Level 3 securities, if any, will be disclosed following the fair value hierarchy table. For more information about the Portfolio’s policy regarding the valuation of investments, please refer to the Notes to Financial Statements.
The following table summarizes the fair value hierarchy of the Portfolio’s investments as of December 31, 2023:
| Description | Level 1 | Level 2 | Level 3 | Total | ||||||||||||
| Common Stocks |
| |||||||||||||||
| Brazil |
$ | 67,906,243 | $ | — | $ | — | $ | 67,906,243 | ||||||||
| Canada |
72,283,591 | — | — | 72,283,591 | ||||||||||||
| China |
15,853,230 | 83,953,517 | — | 99,806,747 | ||||||||||||
| Denmark |
— | 74,909,040 | — | 74,909,040 | ||||||||||||
| Finland |
— | 17,690,835 | — | 17,690,835 | ||||||||||||
| France |
— | 131,224,125 | — | 131,224,125 | ||||||||||||
| Germany |
8,398,979 | 126,282,159 | — | 134,681,138 | ||||||||||||
| Hong Kong |
— | 36,862,599 | — | 36,862,599 | ||||||||||||
| India |
— | 70,699,846 | — | 70,699,846 | ||||||||||||
| Ireland |
42,939,386 | 71,496,720 | — | 114,436,106 | ||||||||||||
| Italy |
— | 29,149,649 | — | 29,149,649 | ||||||||||||
| Japan |
— | 189,189,928 | — | 189,189,928 | ||||||||||||
| Netherlands |
— | 88,766,647 | — | 88,766,647 | ||||||||||||
| Norway |
— | 8,677,305 | — | 8,677,305 | ||||||||||||
| Panama |
12,707,128 | — | — | 12,707,128 | ||||||||||||
| Russia |
— | — | 0 | 0 | ||||||||||||
| Singapore |
7,340,018 | — | — | 7,340,018 | ||||||||||||
| South Africa |
— | 17,303,180 | — | 17,303,180 | ||||||||||||
| South Korea |
12,280,228 | 43,936,246 | — | 56,216,474 | ||||||||||||
| Spain |
— | 25,125,326 | — | 25,125,326 | ||||||||||||
| Sweden |
— | 66,873,970 | — | 66,873,970 | ||||||||||||
| Switzerland |
— | 53,903,849 | — | 53,903,849 | ||||||||||||
| Taiwan |
— | 57,293,803 | — | 57,293,803 | ||||||||||||
| United Kingdom |
— | 58,480,352 | — | 58,480,352 | ||||||||||||
| United States |
12,160,220 | — | — | 12,160,220 | ||||||||||||
| Total Common Stocks |
251,869,023 | 1,251,819,096 | 0 | 1,503,688,119 | ||||||||||||
| Total Warrants* |
— | 0 | — | 0 | ||||||||||||
| Total Short-Term Investment* |
— | 9,660,824 | — | 9,660,824 | ||||||||||||
| Securities Lending Reinvestments | ||||||||||||||||
| Repurchase Agreements |
— | 2,770,143 | — | 2,770,143 | ||||||||||||
| Mutual Funds |
8,592,137 | — | — | 8,592,137 | ||||||||||||
| Total Securities Lending Reinvestments |
8,592,137 | 2,770,143 | — | 11,362,280 | ||||||||||||
| Total Investments |
$ | 260,461,160 | $ | 1,264,250,063 | $ | 0 | $ | 1,524,711,223 | ||||||||
| Collateral for Securities Loaned (Liability) |
$ | — | $ | (11,362,280 | ) | $ | — | $ | (11,362,280 | ) | ||||||
| * | See Schedule of Investments for additional detailed categorizations. | |||
Level 3 investments at the beginning and/or end of the period in relation to net assets were not significant and accordingly, a reconciliation of Level 3 assets for the year ended December 31, 2023 is not presented.
See accompanying notes to financial statements.
BHFTII-8
Brighthouse Funds Trust II
Baillie Gifford International Stock Portfolio
Statement of Assets and Liabilities
December 31, 2023
| Assets |
||||
| Investments at value (a) (b) |
$ | 1,524,711,223 | ||
| Cash denominated in foreign currencies (c) |
147,080 | |||
| Receivable for: |
||||
| Investments sold |
7,019,933 | |||
| Fund shares sold |
5,882 | |||
| Dividends and interest |
3,071,493 | |||
| Prepaid expenses |
5,565 | |||
|
|
|
|||
| Total Assets |
1,534,961,176 | |||
| Liabilities |
||||
| Collateral for securities loaned |
11,362,280 | |||
| Payables for: |
||||
| Fund shares redeemed |
3,111,420 | |||
| Foreign taxes |
1,165,188 | |||
| Accrued Expenses: |
||||
| Management fees |
862,998 | |||
| Distribution and service fees |
53,769 | |||
| Deferred trustees’ fees |
192,719 | |||
| Other expenses |
247,351 | |||
|
|
|
|||
| Total Liabilities |
16,995,725 | |||
|
|
|
|||
| Net Assets |
$ | 1,517,965,451 | ||
|
|
|
|||
| Net Assets Consist of: |
||||
| Paid in surplus |
$ | 1,225,046,076 | ||
| Distributable earnings (Accumulated losses) (d) |
292,919,375 | |||
|
|
|
|||
| Net Assets |
$ | 1,517,965,451 | ||
|
|
|
|||
| Net Assets |
||||
| Class A |
$ | 1,252,910,916 | ||
| Class B |
252,232,085 | |||
| Class E |
12,822,450 | |||
| Capital Shares Outstanding* |
||||
| Class A |
119,685,967 | |||
| Class B |
24,641,490 | |||
| Class E |
1,242,652 | |||
| Net Asset Value, Offering Price and Redemption Price Per Share |
||||
| Class A |
$ | 10.47 | ||
| Class B |
10.24 | |||
| Class E |
10.32 |
| * | The Portfolio is authorized to issue an unlimited number of shares. | |||
| (a) | Identified cost of investments was $1,323,114,622. | |||
| (b) | Includes securities loaned at value of $39,258,699. | |||
| (c) | Identified cost of cash denominated in foreign currencies was $145,961. | |||
| (d) | Includes foreign capital gains tax of $1,165,188. |
Statement of Operations
Year Ended December 31, 2023
| Investment Income |
||||
| Dividends (a) |
$ | 21,402,631 | ||
| Interest |
374,790 | |||
| Securities lending income |
130,464 | |||
|
|
|
|||
| Total investment income |
21,907,885 | |||
| Expenses |
||||
| Management fees |
11,977,893 | |||
| Administration fees |
70,107 | |||
| Custodian and accounting fees |
439,553 | |||
| Distribution and service fees—Class B |
605,070 | |||
| Distribution and service fees—Class E |
19,035 | |||
| Audit and tax services |
55,516 | |||
| Legal |
46,603 | |||
| Trustees’ fees and expenses |
46,220 | |||
| Shareholder reporting |
62,057 | |||
| Insurance |
13,502 | |||
| Miscellaneous |
112,621 | |||
|
|
|
|||
| Total expenses |
13,448,177 | |||
| Less management fee waiver |
(1,740,579 | ) | ||
|
|
|
|||
| Net expenses |
11,707,598 | |||
|
|
|
|||
| Net Investment Income |
10,200,287 | |||
|
|
|
|||
| Net Realized and Unrealized Gain (Loss) |
||||
| Net realized gain (loss) on: | ||||
| Investments (b) |
95,299,356 | |||
| Foreign currency transactions |
(156,130 | ) | ||
|
|
|
|||
| Net realized gain (loss) |
95,143,226 | |||
|
|
|
|||
| Net change in unrealized appreciation (depreciation) on: | ||||
| Investments (c) |
159,320,365 | |||
| Foreign currency transactions |
114,876 | |||
|
|
|
|||
| Net change in unrealized appreciation (depreciation) |
159,435,241 | |||
|
|
|
|||
| Net realized and unrealized gain (loss) |
254,578,467 | |||
|
|
|
|||
| Net Increase (Decrease) in Net Assets From Operations |
$ | 264,778,754 | ||
|
|
|
| (a) | Net of foreign withholding taxes of $2,713,718. | |||
| (b) | Net of foreign capital gains tax of $391,467. | |||
| (c) | Includes change in foreign capital gains tax of $(326,435). | |||
See accompanying notes to financial statements.
BHFTII-9
Brighthouse Funds Trust II
Baillie Gifford International Stock Portfolio
Statements of Changes in Net Assets
| Year Ended December 31, 2023 |
Year Ended December 31, 2022 |
|||||||
| Increase (Decrease) in Net Assets: |
||||||||
| From Operations |
||||||||
| Net investment income (loss) |
$ | 10,200,287 | $ | 14,049,843 | ||||
| Net realized gain (loss) |
95,143,226 | (7,159,041 | ) | |||||
| Net change in unrealized appreciation (depreciation) |
159,435,241 | (566,852,538 | ) | |||||
|
|
|
|
|
|||||
| Increase (decrease) in net assets from operations |
264,778,754 | (559,961,736 | ) | |||||
|
|
|
|
|
|||||
| From Distributions to Shareholders |
||||||||
| Class A |
(15,780,357 | ) | (134,239,803 | ) | ||||
| Class B |
(2,542,855 | ) | (26,054,352 | ) | ||||
| Class E |
(149,458 | ) | (1,305,016 | ) | ||||
|
|
|
|
|
|||||
| Total distributions |
(18,472,670 | ) | (161,599,171 | ) | ||||
|
|
|
|
|
|||||
| Increase (decrease) in net assets from capital share transactions |
(241,906,630 | ) | 284,393,897 | |||||
|
|
|
|
|
|||||
| Total increase (decrease) in net assets |
4,399,454 | (437,167,010 | ) | |||||
| Net Assets |
||||||||
| Beginning of period |
1,513,565,997 | 1,950,733,007 | ||||||
|
|
|
|
|
|||||
| End of period |
$ | 1,517,965,451 | $ | 1,513,565,997 | ||||
|
|
|
|
|
|||||
Other Information:
Capital Shares
Transactions in capital shares were as follows:
| Year Ended December 31, 2023 |
Year Ended December 31, 2022 |
|||||||||||||||
| Shares | Value | Shares | Value | |||||||||||||
| Class A |
||||||||||||||||
| Sales |
1,460,858 | $ | 14,324,493 | 17,224,110 | $ | 168,503,659 | ||||||||||
| Reinvestments |
1,538,046 | 15,780,357 | 15,202,696 | 134,239,803 | ||||||||||||
| Redemptions |
(24,288,372 | ) | (241,235,816 | ) | (5,820,248 | ) | (54,499,542 | ) | ||||||||
|
|
|
|
|
|
|
|
|
|||||||||
| Net increase (decrease) |
(21,289,468 | ) | $ | (211,130,966 | ) | 26,606,558 | $ | 248,243,920 | ||||||||
|
|
|
|
|
|
|
|
|
|||||||||
| Class B |
||||||||||||||||
| Sales |
1,245,271 | $ | 11,508,905 | 3,446,318 | $ | 34,824,334 | ||||||||||
| Reinvestments |
253,020 | 2,542,855 | 3,015,550 | 26,054,352 | ||||||||||||
| Redemptions |
(4,512,498 | ) | (43,462,046 | ) | (2,622,705 | ) | (25,523,509 | ) | ||||||||
|
|
|
|
|
|
|
|
|
|||||||||
| Net increase (decrease) |
(3,014,207 | ) | $ | (29,410,286 | ) | 3,839,163 | $ | 35,355,177 | ||||||||
|
|
|
|
|
|
|
|
|
|||||||||
| Class E |
||||||||||||||||
| Sales |
62,385 | $ | 576,517 | 140,004 | $ | 1,326,914 | ||||||||||
| Reinvestments |
14,754 | 149,458 | 149,830 | 1,305,016 | ||||||||||||
| Redemptions |
(216,422 | ) | (2,091,353 | ) | (188,517 | ) | (1,837,130 | ) | ||||||||
|
|
|
|
|
|
|
|
|
|||||||||
| Net increase (decrease) |
(139,283 | ) | $ | (1,365,378 | ) | 101,317 | $ | 794,800 | ||||||||
|
|
|
|
|
|
|
|
|
|||||||||
| Increase (decrease) derived from capital shares transactions |
$ | (241,906,630 | ) | $ | 284,393,897 | |||||||||||
|
|
|
|
|
|||||||||||||
See accompanying notes to financial statements.
BHFTII-10
Brighthouse Funds Trust II
Baillie Gifford International Stock Portfolio
Financial Highlights
| Selected per share data | ||||||||||||||||||||
| Class A | ||||||||||||||||||||
| Year Ended December 31, | ||||||||||||||||||||
| 2023 | 2022 | 2021 | 2020 | 2019 | ||||||||||||||||
| Net Asset Value, Beginning of Period |
$ | 8.94 | $ | 14.04 | $ | 15.78 | $ | 13.58 | $ | 11.02 | ||||||||||
|
|
|
|
|
|
|
|
|
|
|
|||||||||||
| Income (Loss) from Investment Operations |
| |||||||||||||||||||
| Net investment income (loss) (a) |
0.07 | 0.09 | 0.14 | 0.09 | 0.25 | |||||||||||||||
| Net realized and unrealized gain (loss) |
1.59 | (4.12 | ) | (0.16 | ) | 3.18 | 3.24 | |||||||||||||
|
|
|
|
|
|
|
|
|
|
|
|||||||||||
| Total income (loss) from investment operations |
1.66 | (4.03 | ) | (0.02 | ) | 3.27 | 3.49 | |||||||||||||
|
|
|
|
|
|
|
|
|
|
|
|||||||||||
| Less Distributions |
| |||||||||||||||||||
| Distributions from net investment income |
(0.13 | ) | (0.12 | ) | (0.15 | ) | (0.27 | ) | (0.17 | ) | ||||||||||
| Distributions from net realized capital gains |
0.00 | (0.95 | ) | (1.57 | ) | (0.80 | ) | (0.76 | ) | |||||||||||
|
|
|
|
|
|
|
|
|
|
|
|||||||||||
| Total distributions |
(0.13 | ) | (1.07 | ) | (1.72 | ) | (1.07 | ) | (0.93 | ) | ||||||||||
|
|
|
|
|
|
|
|
|
|
|
|||||||||||
| Net Asset Value, End of Period |
$ | 10.47 | $ | 8.94 | $ | 14.04 | $ | 15.78 | $ | 13.58 | ||||||||||
|
|
|
|
|
|
|
|
|
|
|
|||||||||||
| Total Return (%) (b) |
18.59 | (28.60 | ) | (0.76 | ) | 26.58 | 32.82 | |||||||||||||
| Ratios/Supplemental Data |
| |||||||||||||||||||
| Gross ratio of expenses to average net assets (%) |
0.86 | 0.85 | 0.84 | 0.84 | 0.84 | |||||||||||||||
| Net ratio of expenses to average net assets (%) (c) |
0.75 | 0.73 | 0.71 | 0.72 | 0.72 | |||||||||||||||
| Ratio of net investment income (loss) to average net assets (%) |
0.73 | 0.93 | 0.93 | 0.67 | 2.02 | |||||||||||||||
| Portfolio turnover rate (%) |
11 | 18 | 14 | 20 | 12 | |||||||||||||||
| Net assets, end of period (in millions) |
$ | 1,252.9 | $ | 1,259.7 | $ | 1,605.6 | $ | 1,681.6 | $ | 1,598.2 | ||||||||||
| Class B | ||||||||||||||||||||
| Year Ended December 31, | ||||||||||||||||||||
| 2023 | 2022 | 2021 | 2020 | 2019 | ||||||||||||||||
| Net Asset Value, Beginning of Period |
$ | 8.74 | $ | 13.75 | $ | 15.49 | $ | 13.35 | $ | 10.85 | ||||||||||
|
|
|
|
|
|
|
|
|
|
|
|||||||||||
| Income (Loss) from Investment Operations |
| |||||||||||||||||||
| Net investment income (loss) (a) |
0.05 | 0.07 | 0.10 | 0.05 | 0.22 | |||||||||||||||
| Net realized and unrealized gain (loss) |
1.55 | (4.04 | ) | (0.15 | ) | 3.13 | 3.18 | |||||||||||||
|
|
|
|
|
|
|
|
|
|
|
|||||||||||
| Total income (loss) from investment operations |
1.60 | (3.97 | ) | (0.05 | ) | 3.18 | 3.40 | |||||||||||||
|
|
|
|
|
|
|
|
|
|
|
|||||||||||
| Less Distributions |
| |||||||||||||||||||
| Distributions from net investment income |
(0.10 | ) | (0.09 | ) | (0.12 | ) | (0.24 | ) | (0.14 | ) | ||||||||||
| Distributions from net realized capital gains |
0.00 | (0.95 | ) | (1.57 | ) | (0.80 | ) | (0.76 | ) | |||||||||||
|
|
|
|
|
|
|
|
|
|
|
|||||||||||
| Total distributions |
(0.10 | ) | (1.04 | ) | (1.69 | ) | (1.04 | ) | (0.90 | ) | ||||||||||
|
|
|
|
|
|
|
|
|
|
|
|||||||||||
| Net Asset Value, End of Period |
$ | 10.24 | $ | 8.74 | $ | 13.75 | $ | 15.49 | $ | 13.35 | ||||||||||
|
|
|
|
|
|
|
|
|
|
|
|||||||||||
| Total Return (%) (b) |
18.36 | (28.81 | ) | (0.99 | ) | 26.26 | 32.41 | |||||||||||||
| Ratios/Supplemental Data |
| |||||||||||||||||||
| Gross ratio of expenses to average net assets (%) |
1.11 | 1.10 | 1.09 | 1.09 | 1.09 | |||||||||||||||
| Net ratio of expenses to average net assets (%) (c) |
1.00 | 0.98 | 0.96 | 0.97 | 0.97 | |||||||||||||||
| Ratio of net investment income (loss) to average net assets (%) |
0.47 | 0.69 | 0.69 | 0.41 | 1.76 | |||||||||||||||
| Portfolio turnover rate (%) |
11 | 18 | 14 | 20 | 12 | |||||||||||||||
| Net assets, end of period (in millions) |
$ | 252.2 | $ | 241.7 | $ | 327.4 | $ | 353.2 | $ | 315.3 | ||||||||||
Please see following page for Financial Highlights footnote legend.
See accompanying notes to financial statements.
BHFTII-11
Brighthouse Funds Trust II
Baillie Gifford International Stock Portfolio
Financial Highlights
| Selected per share data | ||||||||||||||||||||
| Class E | ||||||||||||||||||||
| Year Ended December 31, | ||||||||||||||||||||
| 2023 | 2022 | 2021 | 2020 | 2019 | ||||||||||||||||
| Net Asset Value, Beginning of Period |
$ | 8.81 | $ | 13.85 | $ | 15.59 | $ | 13.43 | $ | 10.91 | ||||||||||
|
|
|
|
|
|
|
|
|
|
|
|||||||||||
| Income (Loss) from Investment Operations |
||||||||||||||||||||
| Net investment income (loss) (a) |
0.06 | 0.08 | 0.12 | 0.07 | 0.23 | |||||||||||||||
| Net realized and unrealized gain (loss) |
1.56 | (4.07 | ) | (0.16 | ) | 3.14 | 3.20 | |||||||||||||
|
|
|
|
|
|
|
|
|
|
|
|||||||||||
| Total income (loss) from investment operations |
1.62 | (3.99 | ) | (0.04 | ) | 3.21 | 3.43 | |||||||||||||
|
|
|
|
|
|
|
|
|
|
|
|||||||||||
| Less Distributions |
||||||||||||||||||||
| Distributions from net investment income |
(0.11 | ) | (0.10 | ) | (0.13 | ) | (0.25 | ) | (0.15 | ) | ||||||||||
| Distributions from net realized capital gains |
0.00 | (0.95 | ) | (1.57 | ) | (0.80 | ) | (0.76 | ) | |||||||||||
|
|
|
|
|
|
|
|
|
|
|
|||||||||||
| Total distributions |
(0.11 | ) | (1.05 | ) | (1.70 | ) | (1.05 | ) | (0.91 | ) | ||||||||||
|
|
|
|
|
|
|
|
|
|
|
|||||||||||
| Net Asset Value, End of Period |
$ | 10.32 | $ | 8.81 | $ | 13.85 | $ | 15.59 | $ | 13.43 | ||||||||||
|
|
|
|
|
|
|
|
|
|
|
|||||||||||
| Total Return (%) (b) |
18.46 | (28.74 | ) | (0.91 | ) | 26.37 | 32.56 | |||||||||||||
| Ratios/Supplemental Data |
||||||||||||||||||||
| Gross ratio of expenses to average net assets (%) |
1.01 | 1.00 | 0.99 | 0.99 | 0.99 | |||||||||||||||
| Net ratio of expenses to average net assets (%) (c) |
0.90 | 0.88 | 0.86 | 0.87 | 0.87 | |||||||||||||||
| Ratio of net investment income (loss) to average net assets (%) |
0.58 | 0.79 | 0.79 | 0.50 | 1.87 | |||||||||||||||
| Portfolio turnover rate (%) |
11 | 18 | 14 | 20 | 12 | |||||||||||||||
| Net assets, end of period (in millions) |
$ | 12.8 | $ | 12.2 | $ | 17.7 | $ | 19.9 | $ | 18.2 | ||||||||||
| (a) | Per share amounts based on average shares outstanding during the period. | |||
| (b) | Total return does not reflect any insurance, sales, separate account or administrative charges of variable annuity or life insurance contracts or any additional expenses that contract owners may bear under their variable contracts. If these charges were included, the returns would be lower. | |||
| (c) | Includes the effects of management fee waivers (see Note 5 of the Notes to Financial Statements). | |||
See accompanying notes to financial statements.
BHFTII-12
Brighthouse Funds Trust II
Baillie Gifford International Stock Portfolio
Notes to Financial Statements—December 31, 2023
1. Organization
Brighthouse Funds Trust II (the “Trust”) is organized as a Delaware statutory trust and registered under the Investment Company Act of 1940, as amended (the “1940 Act”), as an open-end management investment company. The Trust, which is managed by Brighthouse Investment Advisers, LLC (“Brighthouse Investment Advisers” or the “Adviser”), currently offers twenty-nine series (the “Portfolios”), each of which operates as a distinct investment vehicle of the Trust.The series included in this report is Baillie Gifford International Stock Portfolio (the “Portfolio”), which is diversified. Shares of the Portfolio are not offered directly to the general public and are currently available only to separate accounts of insurance companies, including insurance companies affiliated with the Adviser.
The Portfolio has registered and offers three classes of shares: Class A, B and E shares. Shares of each class of the Portfolio represent an equal pro rata interest in the Portfolio and generally give the shareholder the same voting, dividend, liquidation, and other rights. Investment income, realized and unrealized capital gains and losses, the common expenses of the Portfolio, and certain Portfolio-level expense reductions, if any, are allocated on a pro rata basis to each class based on the relative net assets of each class to the net assets of the Portfolio. Each class of shares differs in its respective distribution plan and such distribution expenses are allocated to the corresponding class of shares.
2. Significant Accounting Policies
The preparation of financial statements in conformity with accounting principles generally accepted in the United States of America (“GAAP”) requires management to make estimates and assumptions that affect the reported amounts of assets and liabilities and disclosure of contingent assets and liabilities as of the date of the financial statements and the reported amounts of income and expenses during the reporting period. Actual results could differ from those estimates. In the preparation of these financial statements, management has evaluated events and transactions subsequent to December 31, 2023 through the date the financial statements were issued.
The Portfolio is an investment company and follows the accounting and reporting guidance of the Financial Accounting Standards Board (“FASB”) Accounting Standards Codification Topic 946—Financial Services—Investment Companies. The following is a summary of significant accounting policies consistently followed by the Portfolio in the preparation of its financial statements.
Investment Valuation and Fair Value Measurements - The Portfolio values its investments for purposes of calculating its net asset value (“NAV”) using procedures that allow for a variety of methodologies to be used to value the Portfolio’s investments. The specific methodology used for an investment may vary based on the market data available for a specific investment at the time the Portfolio calculates its NAV or based on other considerations. The procedures also permit a level of judgment to be used in the valuation process.
Domestic and foreign equity securities, such as common stock, exchange-traded funds, rights, warrants, and preferred stock, that are traded on a securities exchange on a valuation date are generally valued at their last quoted sale price or official closing price on the primary exchange for such security, or, if no sales occurred on that day, at the last reported bid price. Equity securities traded over-the-counter (“OTC”) are generally valued at the last reported bid price. In the event of a major exchange closing during the trading day, the Adviser may use other market information obtained from quotation reporting systems, established market makers, or pricing services in valuing the securities. Valuation adjustments may be applied to certain foreign equity securities that are traded solely on foreign exchanges that close before the time as of which the Portfolio determines its NAV to account for the market movement between the close of the foreign exchanges and the time as of which the Portfolio determines its NAV. The Portfolio may use a systematic fair valuation model provided by a pricing service to value securities principally traded in these foreign markets to adjust for possible market movements or other changes that may occur between the close of the foreign exchanges and the time as of which the Portfolio determines its NAV. Foreign equity securities valued using these valuation adjustments are generally categorized as Level 2 within the fair value hierarchy. Equity securities that are actively traded, and have no valuation adjustments applied, are categorized as Level 1 within the fair value hierarchy. Other equity securities traded on inactive markets or valued in reference to similar instruments traded on active markets are generally categorized as Level 2 within the fair value hierarchy.
Investments in registered open-end management investment companies are valued at reported NAV per share on the valuation date and are categorized as Level 1 within the fair value hierarchy.
Debt securities, including corporate, convertible and municipal bonds and notes; obligations of the U.S. Treasury and U.S. government agencies; foreign sovereign issues; and non-U.S. bonds, are generally valued based upon evaluated or composite bid quotations obtained from third-party pricing services and/or brokers and dealers selected by the Adviser (each a “pricing service”). Such pricing services may use matrix pricing, which considers observable inputs including, among other things, issuer details, maturity dates, interest rates, yield curves, rates of prepayment, credit risks/spreads, default rates, reported trades, broker-dealer quotes and quoted prices for similar assets. Short-term obligations with a remaining maturity of sixty days or less may be valued at amortized cost in the absence of market quotes, so long as the amortized cost value of such short-term debt instrument is approximately the same as the fair value of the instrument as determined without the use of amortized cost valuation. Floating rate loans are generally valued based upon
BHFTII-13
Brighthouse Funds Trust II
Baillie Gifford International Stock Portfolio
Notes to Financial Statements—December 31, 2023—(Continued)
an evaluated or composite average of aggregate bid and ask quotations supplied by brokers or dealers, as obtained from the pricing service. Securities that use similar valuation techniques and inputs as described above are generally categorized as Level 2 within the fair value hierarchy.
Foreign currency forward contracts are valued through a third-party pricing service by interpolating between forward and spot currency rates in the London foreign exchange markets as of a designated hour on a valuation day. These contracts are generally categorized as Level 2 within the fair value hierarchy.
Options, whether on securities, indices, futures contracts, or otherwise, traded on exchanges are valued at the last sale price available as of the close of business on a valuation day or, if there is no such price available, at the last reported bid price. These types of options are categorized as Level 1 within the fair value hierarchy. Futures contracts that are traded on commodity exchanges are valued at their settlement prices established by the exchanges on which they are traded as of the close of such exchanges and are categorized as Level 1 within the fair value hierarchy.
Options, including options on swaps (“swaptions”) and currencies, and synthetic futures contracts that are traded OTC are generally valued based upon interdealer bid and ask prices or prices provided by pricing service providers who use a series of techniques, including simulation pricing models, to determine the value of the contracts. The pricing models use inputs that are observed from actively quoted markets such as issuer details, indices, spreads, interest rates, yield curves, credit curves, measures of volatility and exchange rates. These contracts are generally categorized as Level 2 within the fair value hierarchy.
If no current market quotation is readily available or market value quotations are deemed to be unreliable for an investment, the fair value of the investment will be determined in accordance with procedures. A market quotation is readily available only when that quotation is a quoted price (unadjusted) in active markets for identical investments that the Portfolio can access at the measurement date, provided that a quotation will not be readily available if it is not reliable.
Pursuant to Rule 2a-5 under the 1940 Act, the Board of Trustees (the “Board” or “Trustees” ) of the Trust has designated Brighthouse Investment Advisers, acting through its Valuation Committee (“Committee”), as the Portfolio’s “valuation designee” to perform the Portfolio’s fair value determinations. The Board oversees Brighthouse Investment Advisers in its role as the Valuation Designee and receives reports from Brighthouse Investment Advisers regarding its process and the valuation of the Portfolio’s investments to assist with such oversight.
No single standard for determining the fair value of an investment can be set forth because fair value depends upon the facts and circumstances with respect to each investment. Information relating to any relevant factors may be obtained by the Committee from any appropriate source, including the subadviser of the Portfolio, the Custodian, a pricing service, market maker and/or broker for such security or the issuer. Appropriate methodologies for determining fair value under particular circumstances may include: matrix pricing, a discounted cash flow analysis, comparisons of securities with comparable characteristics, value based on multiples of earnings, discount from market price of similar marketable securities, or a combination of these and other methods.
Foreign Currency Translation - The books and records of the Portfolio are maintained in U.S. dollars. The values of securities, currencies, and other assets and liabilities denominated in currencies other than the U.S. dollar are translated into U.S. dollars based upon foreign exchange rates prevailing at the end of the period. Purchases and sales of investment securities, income, and expenses are translated on the respective dates of such transactions. Because the values of investment securities are translated at the foreign exchange rates prevailing at the end of the period, that portion of the results of operations arising from changes in exchange rates and that portion of the results of operations reflecting fluctuations arising from changes in market prices of the investment securities are not separated. Such fluctuations are included in the net realized and unrealized gain or loss on investments.
Net realized foreign exchange gains or losses arise from activity in forward foreign currency exchange contracts, sales of foreign currency, currency gains or losses realized between the trade and settlement dates on securities transactions, and the difference between the amounts of dividends, interest, and foreign withholding taxes recorded by the Portfolio and the U.S. dollar-equivalent of the amounts actually received or paid by the Portfolio. Net unrealized foreign exchange gains and losses arise from changes in the value of assets and liabilities, other than investment securities, resulting from changes in foreign exchange rates.
Investment Transactions and Related Investment Income - Portfolio security transactions are recorded on the trade date. Dividend income is recorded on the ex-dividend date or, for certain foreign securities, when notified. Interest income, which includes amortization of premium and accretion of discount on debt securities, is recorded on the accrual basis. Realized gains and losses on investments are determined on the identified cost basis, which is the same basis used for federal income tax purposes. Foreign income and foreign capital gains on some foreign securities may be subject to foreign taxes, which are accrued as applicable. These foreign taxes have been provided for in accordance with the Portfolio’s understanding of the applicable countries’ tax rules and rates.
In consideration of recent decisions rendered by European courts, the Portfolio has filed tax reclaims for previously withheld taxes on dividends earned in certain European Union (“EU”) countries. These filings are subject to various administrative and judicial proceedings within these countries. During the year ended December 31, 2023, the Portfolio received EU tax reclaim payments in the
BHFTII-14
Brighthouse Funds Trust II
Baillie Gifford International Stock Portfolio
Notes to Financial Statements—December 31, 2023—(Continued)
amount of $391,574 that were not previously accrued for due to uncertainty of collectability. Such amount is included in dividends on the Statement of Operations. No other amounts for additional tax reclaims are reflected in the financial statements due to the uncertainty as to the ultimate resolution of proceedings, the likelihood of receipt of these reclaims, and the potential timing of payment.
Dividends and Distributions to Shareholders - The Portfolio records dividends and distributions on the ex-dividend date. Net realized gains from securities transactions (if any) are generally distributed annually to shareholders. The timing and characterization of certain income and capital gains distributions are determined in accordance with federal tax regulations that may differ from GAAP. Permanent book and tax basis differences relating to shareholder distributions will result in reclassification between distributable earnings (accumulated losses) and paid in surplus. Book-tax differences are primarily due to spin-off reversal. These adjustments have no impact on net assets or the results of operations.
Income Taxes - It is the Portfolio’s policy to comply with the requirements of the Internal Revenue Code of 1986, as amended, and regulations thereunder, applicable to regulated investment companies, and to distribute, with respect to each taxable year, all of its taxable income to shareholders. Therefore, no federal income tax provision is required. The Portfolio files U.S. federal tax returns. No income tax returns are currently under examination. The Portfolio’s federal tax returns remain subject to examination by the Internal Revenue Service for three fiscal years after the returns are filed. As of December 31, 2023, the Portfolio had no uncertain tax positions that would require financial statement recognition, derecognition or disclosure.
Repurchase Agreements - The Portfolio may enter into repurchase agreements, under the terms of a Master Repurchase Agreement (“MRA”), or Global Master Repurchase Agreement (“GMRA”), with selected commercial banks and broker-dealers, under which the Portfolio acquires securities as collateral and agrees to resell the securities at an agreed-upon time and at an agreed-upon price. The Portfolio, through the Custodian or a subcustodian, under a tri-party repurchase agreement, receives delivery of the underlying securities collateralizing any repurchase agreements. It is the Portfolio’s policy that the market value of the collateral be equal to at least 100% of the repurchase price in the case of a repurchase agreement of one-day duration and equal to at least 102% of the repurchase price in the case of all other repurchase agreements. In the event of default or failure by a party to perform an obligation in connection with any repurchase transaction, the MRA or GMRA gives the non-defaulting party the right to set-off claims and to apply property held by it in connection with any repurchase transaction against obligations owed to it under the agreement.
At December 31, 2023, the Portfolio had direct investments in repurchase agreements with a gross value of $9,660,824. Additionally, the Portfolio invested cash collateral for loans of portfolio securities in repurchase agreements with a gross value of $2,770,143. The combined value of all repurchase agreements is included as part of investments at value on the Statement of Assets and Liabilities. The value of the related collateral exceeded the value of the repurchase agreements at December 31, 2023.
Securities Lending - The Portfolio may lend its portfolio securities to certain qualified brokers who borrow securities in order to complete certain securities transactions. By lending its portfolio securities, the Portfolio attempts to increase its net investment income through the receipt of income on collateral held from securities on loan. Any gain or loss in the market price of the loaned securities that might occur, any interest earned, and any dividends declared during the term of the loan, would accrue to the account of the Portfolio.
The Trust has entered into a Non-Custodial Securities Lending Agreement with JPMorgan Chase Bank, N.A. (the “Lending Agent”). Under the agreement, the Lending Agent is authorized to loan portfolio securities on the Portfolio’s behalf. In exchange, the Portfolio generally receives cash, U.S. Government securities, letters of credit, or other collateral deemed appropriate by the Adviser. The Portfolio receives collateral equal to at least 102% of the market value for loans secured by government securities or cash in the same currency as the loaned shares and 105% for all other loaned securities at each loan’s inception. Collateral representing at least 100% of the market value of the loaned securities is maintained for the duration of the loan. Any cash collateral received by the Portfolio is generally invested by the Lending Agent in short-term investments, which may include certificates of deposit, commercial paper, repurchase agreements, including repurchase agreements with respect to equity securities, time deposits, master demand notes and money market funds. The market value of investments made with cash collateral received are disclosed in the Schedule of Investments and the valuation techniques are described in Note 2. The value of the securities on loan may change each business day. If the market value of the collateral at the close of trading on a business day is less than 100% of the market value of the loaned securities at the close of trading on that day, the borrower is required to deliver, by the close of business on the following business day, an additional amount of collateral, so that the total amount of posted collateral is equal to at least 100% of the market value of all the loaned securities as of such preceding day. A portion of the income earned on the collateral is rebated to the borrower of the securities and the remainder is split between the Lending Agent and the Portfolio. On loans collateralized by U.S. government securities, a fee is received from the borrower and is allocated between the Portfolio and the Lending Agent.
Income received by the Portfolio in securities lending transactions during the year ended December 31, 2023 is reflected as securities lending income on the Statement of Operations. The values of any securities loaned by the Portfolio and the related collateral at December 31, 2023 are disclosed in the footnotes to the Schedule of Investments. The value of the related collateral received by the Portfolio exceeded the value of the securities out on loan at December 31, 2023.
BHFTII-15
Brighthouse Funds Trust II
Baillie Gifford International Stock Portfolio
Notes to Financial Statements—December 31, 2023—(Continued)
The risks associated with lending portfolio securities include, but are not limited to, possible delays in receiving additional collateral or in the recovery of the loaned securities, possible loss of rights in the collateral should the borrower fail financially, as well as risk of loss in the value of the collateral or the value of the investments made with the collateral. To the extent the Portfolio uses cash collateral it receives to invest in repurchase agreements with respect to equity securities, it is subject to the risk of loss if the value of the equity securities declines and the counterparty defaults on its obligation to repurchase such securities. The Lending Agent shall indemnify the Portfolio in the case of default of any securities borrower, subject to the terms of the Non-Custodial Securities Lending Agreement.
All securities on loan are classified as Common Stocks in the Portfolio’s Schedule of Investments as of December 31, 2023. For all securities on loan, the remaining contractual maturity of the agreements is overnight and continuous.
3. Certain Risks
In the normal course of business, the Portfolio invests in securities and enters into transactions where risks exist. Those risks include:
Market Risk: The value of securities held by the Portfolio may decline in response to certain events, including those directly involving the issuers whose securities are owned by the Portfolio; conditions affecting the general economy; overall market changes; local, regional or global political, social or economic instability; currency, interest rate, and price fluctuations, or other factors including terrorism, war, natural disasters and the spread of infectious illness including epidemics or pandemics such as the COVID-19 pandemic. These events may also adversely affect the liquidity of securities held by the Portfolio.
Credit and Counterparty Risk: The Portfolio may be exposed to counterparty risk, or the risk that an entity with which the Portfolio has unsettled or open transactions may default. The potential loss could exceed the value of the financial assets and liabilities recorded in the financial statements. Financial assets that potentially expose the Portfolio to credit and counterparty risk consist principally of cash due from counterparties and investments. The Portfolio manages counterparty risk by entering into agreements only with counterparties that it believes have the financial resources to honor their obligations and by monitoring the financial stability of those counterparties. The Subadviser may attempt to mitigate counterparty risk by (i) periodically assessing the creditworthiness of its trading partners, (ii) monitoring and/or limiting the amount of its net exposure to each individual counterparty based on its assessment, and (iii) requiring collateral from the counterparty for certain transactions. In order to preserve certain safeguards for non-standard settlement trades, the Portfolio restricts its exposure to credit and counterparty losses by entering into master netting agreements (“Master Agreements”) with counterparties (approved brokers) with whom it undertakes a significant volume of transactions. Master Agreements govern the terms of certain transactions and reduce the counterparty risk associated with relevant transactions by specifying credit protection mechanisms and providing standardization that improves legal certainty. Master Agreements can also help limit counterparty risk by specifying collateral posting arrangements at pre-arranged exposure levels.
Repurchase and reverse repurchase agreements are primarily executed under GMRAs or MRAs, which provide the right to set-off. Each repurchase and reverse repurchase agreement is initially collateralized at the transaction level. In the event of default, the total market value exposure will be offset against collateral exchanged to date, which would result in a net receivable/(payable) that would be due from/to the counterparty.
Foreign Investment Risk: The investments by the Portfolio in foreign securities, whether direct or indirect, involve risks not present in domestic investments. Because securities may be denominated in foreign currencies, may require settlement in foreign currencies and may pay interest or dividends in foreign currencies, changes in the relationship of these foreign currencies to the U.S. dollar can significantly affect the value of the investments and earnings of the Portfolio. Foreign investments may also subject the Portfolio to foreign government exchange restrictions, expropriation, taxation, unexpected market closures or other political, social or economic developments, such as the imposition of economic sanctions against one or more countries, organizations, entities and/or individuals, all of which could affect the market and/or credit risk of the investments. In addition to the risks described above, risks may arise from forward foreign currency contracts with respect to the potential inability of counterparties to meet the terms of their contracts.
China Investment Risk: Investments in China are subject to all of the risks described under “Foreign Investment Risk” above. In addition, U.S. or foreign government sanctions, restrictions on investments in Chinese companies or other intervention could negatively affect the implementation of the Portfolio’s investment strategies, such as by precluding the Portfolio from making certain investments in Chinese issuers or causing the Portfolio to sell investments at disadvantageous times. For example, pursuant to Executive Order 14032 (issued on June 3, 2021), U.S. persons are prohibited from purchasing or investing in publicly-traded securities of companies designated to the “Non-SDN Chinese Military-Industrial Complex Companies List,” a list which can change from time to time (“Chinese Military Companies Sanctions”). The Chinese Military Companies Sanctions or other similar actions targeting investment in China could impair the market value of the Portfolio’s investments and limit the Portfolio’s ability to buy, sell, receive or deliver certain securities. As a result, the Portfolio may incur losses.
Additional risks associated with each type of investment are described above within the respective security type notes. The Portfolio’s prospectus includes a discussion of the principal risks of investing in the Portfolio.
BHFTII-16
Brighthouse Funds Trust II
Baillie Gifford International Stock Portfolio
Notes to Financial Statements—December 31, 2023—(Continued)
4. Investment Transactions
Aggregate cost of purchases and proceeds of sales of investment securities, excluding short-term securities, for the year ended December 31, 2023 were as follows:
| Purchases |
Sales | |||||||||||
| U.S. Government |
Non-U.S. Government | U.S. Government | Non-U.S. Government | |||||||||
| $0 | $ | 167,820,077 | $ | 0 | $ | 412,480,472 | ||||||
5. Investment Management Fees and Other Transactions with Affiliates
Investment Management Agreement - Brighthouse Investment Advisers is the investment adviser to the Portfolio. The Trust has entered into an investment management agreement with Brighthouse Investment Advisers with respect to the Portfolio. For providing investment management services to the Portfolio, Brighthouse Investment Advisers receives monthly compensation at the following annual rates:
|
Management |
% per annum | Average daily net assets | ||||
| $11,977,893 | 0.860 | % | Of the first $500 million | |||
| 0.800 | % | Of the next $500 million | ||||
| 0.750 | % | On amounts in excess of $1 billion | ||||
Brighthouse Investment Advisers has entered into an investment subadvisory agreement with respect to managing the Portfolio. Baillie Gifford Overseas Limited is compensated by Brighthouse Investment Advisers to provide subadvisory services for the Portfolio.
Management Fee Waivers - Pursuant to a management fee waiver agreement, the Adviser has agreed, for the period May 1, 2023 to April 30, 2024, to reduce its advisory fees set out above under “Investment Management Agreement” for each class of the Portfolio as follows:
| % per annum reduction |
Average daily net assets | |
| 0.080% | On amounts over $156.25 million and under $400 million | |
| 0.180% | Of the next $100 million | |
| 0.120% | Of the next to $400 million | |
| 0.150% | On amounts in excess of $900 million |
An identical expense agreement was in place for the period April 29, 2022 to April 30, 2023. Amounts waived for the year ended December 31, 2023 are shown as management fee waiver in the Statement of Operations.
Certain officers and trustees of the Trust may also be officers of the Adviser; however, such officers and trustees receive no compensation from the Trust.
Transfer Agency Agreement - Brighthouse Life Insurance Company serves as the transfer agent for the Trust. Brighthouse Life Insurance Company receives no fees for its services to the Trust.
Distribution and Service Fees - The Trust has a distribution agreement with Brighthouse Securities, LLC (the “Distributor”) pursuant to which the Distributor serves as the general distributor of shares of each class (each a “Class”) of each Portfolio. The Distributor is an affiliate of the Trust. The Trust has adopted a Distribution and Services Plan (the “D&S Plan”) relating to Class B, Class D, Class E, Class F and Class G shares of each Portfolio, under Rule 12b-1 under the 1940 Act, pursuant to which the Trust may pay the Distributor a fee (the “Service Fee”) at an annual rate not to exceed 0.25% of each such Portfolio’s average daily net assets attributable to the Class B, Class D, Class E, Class F and Class G shares of the Trust. Each Portfolio may not offer shares of each Class. The D&S Plan also authorizes the Trust, on behalf of each of its Portfolios, to pay to the Distributor a distribution fee (the “Distribution Fee” and together with the Service Fee, the “Fees”) at an annual rate of up to 0.25% of each Portfolio’s average daily net assets attributable to the Class B, Class D, Class E, Class F, and Class G shares in consideration of the services rendered in connection with the sale of such shares by the Distributor. Under the Distribution Agreement with respect to the Trust, Fees are currently paid at an annual rate of 0.25% of average daily net assets in the case of Class B shares, 0.10% of average daily net assets in the case of Class D shares, 0.15% of average daily net assets in the case of Class E shares, 0.20% of average daily net assets in the case of Class F shares and 0.30% of average daily net assets in the case of Class G shares. The D&S Plan is known as a “compensation plan” because the Trust makes payments to the Distributor for services rendered regardless of the actual level of expenditures by the Distributor. Amounts incurred by the Portfolio for the year ended December 31, 2023 are shown as Distribution and service fees in the Statement of Operations.
BHFTII-17
Brighthouse Funds Trust II
Baillie Gifford International Stock Portfolio
Notes to Financial Statements—December 31, 2023—(Continued)
Deferred Trustee Compensation - Each Trustee who is not currently an employee of the Adviser or any of its affiliates receives compensation from the Trust for his or her service to the Trust. A deferred compensation plan (the “Plan”) is available to the Trustees on a voluntary basis. Deferred amounts remain in the Trust until distributed in accordance with the provisions of the Plan. The value of a participating Trustee’s deferral account is based on theoretical investments of deferred amounts on the normal payment dates in certain portfolios of the Trust or Brighthouse Funds Trust I, an affiliate of the Trust, as designated by the participating Trustee. Changes in the value of participants’ deferral accounts are reflected as a component of Trustees’ fees and expenses in the Statement of Operations. The portion of the accrued obligations allocated to the Portfolio under the Plan is reflected as Deferred trustees’ fees in the Statement of Assets and Liabilities.
6. Contractual Obligations
Under the Trust’s organizational documents, its officers and Trustees may be indemnified against certain liabilities and expenses arising out of the performance of their duties to the Trust. Additionally, the Trust has a variety of indemnification obligations under contracts with its service providers. The Trust’s maximum exposure under these arrangements is unknown, as this would involve future claims that may be made against the Trust that have not yet occurred.
7. Income Tax Information
The cost basis of investments for federal income tax purposes at December 31, 2023 was as follows:
| Cost basis of investments |
$ | 1,334,389,710 | ||
|
|
|
|||
| Gross unrealized appreciation |
387,312,339 | |||
| Gross unrealized (depreciation) |
(196,990,826 | ) | ||
|
|
|
|||
| Net unrealized appreciation (depreciation) |
$ | 190,321,513 | ||
|
|
|
The tax character of distributions paid for the years ended December 31, 2023 and 2022 were as follows:
| Ordinary Income |
Long-Term Capital Gain | Total | ||||||||||||||||||
| 2023 |
2022 | 2023 | 2022 | 2023 | 2022 | |||||||||||||||
| $18,472,670 | $ | 26,355,135 | $ | — | $ | 135,244,036 | $ | 18,472,670 | $ | 161,599,171 | ||||||||||
As of December 31, 2023, the components of distributable earnings (accumulated losses) on a federal income tax basis were as follows:
| Undistributed |
Undistributed Long-Term Capital Gain |
Net Unrealized Appreciation (Depreciation) |
Accumulated Capital Losses |
Total | ||||||||||||
| $11,503,056 | $ | 92,356,803 | $ | 189,252,236 | $ | — | $ | 293,112,095 | ||||||||
The Portfolio utilizes the provisions of the federal income tax laws that provide for the carryforward of capital losses for prior years, offsetting such losses against any future realized capital gains. Net capital losses may be carried forward indefinitely and their character is retained as short-term and/or long-term losses.
As of December 31, 2023, the Portfolio had no accumulated capital losses.
During the year ended December 31, 2023, the Portfolio utilized accumulated short-term capital losses of $3,326,288.
8. Recent Accounting Pronouncement & Regulatory Updates
In June 2022, FASB issued Accounting Standards Update 2022-03—Fair Value Measurement (Topic 820)—Fair Value Measurement of Equity Securities Subject to Contractual Sale Restrictions (“ASU 2022-03”). ASU 2022-03 clarifies the guidance in Topic 820 to indicate that a contractual sale restriction should not be considered in the fair value of an equity security subject to such a restriction, and requires entities with investments in equity securities subject to contractual sale restrictions to disclose certain qualitative and quantitative information about such securities. ASU 2022-03 is effective for fiscal years, and interim periods within those fiscal years, beginning after December 15, 2023. ASU 2022-03 is only applicable to an equity security in which the contractual arrangement that restricts its sale is executed or modified on or after the adoption date.
Effective January 24, 2023, the Securities and Exchange Commission adopted rule and form amendments that require open-end management investment companies to transmit concise and visually engaging annual and semiannual reports to shareholders that highlight certain information deemed by the SEC to be particularly important for investors. Certain other information, including financial statements, will no longer appear in shareholder reports but will, as required, be available online, delivered free of charge upon request, and filed on a semiannual basis on Form N-CSR. The rule and form amendments have a compliance date of July 24, 2024. Accordingly, the rule and form amendments will not impact the Portfolio until its 2024 semiannual shareholder report.
BHFTII-18
Brighthouse Funds Trust II
Baillie Gifford International Stock Portfolio
Report of Independent Registered Public Accounting Firm
To the Board of Trustees of Brighthouse Funds Trust II and Shareholders of the Baillie Gifford International Stock Portfolio:
Opinion on the Financial Statements and Financial Highlights
We have audited the accompanying statement of assets and liabilities, including the schedule of investments, of the Baillie Gifford International Stock Portfolio (the “Fund”) (one of the funds constituting the Brighthouse Funds Trust II), as of December 31, 2023, the related statement of operations for the year then ended, the statements of changes in net assets for each of the two years in the period then ended, the financial highlights for each of the five years in the period then ended, and the related notes. In our opinion, the financial statements and financial highlights present fairly, in all material respects, the financial position of the Fund as of December 31, 2023, and the results of its operations for the year then ended, the changes in its net assets for each of the two years in the period then ended, and the financial highlights for each of the five years in the period then ended in conformity with accounting principles generally accepted in the United States of America.
Basis for Opinion
These financial statements and financial highlights are the responsibility of the Fund’s management. Our responsibility is to express an opinion on the Fund’s financial statements and financial highlights based on our audits. We are a public accounting firm registered with the Public Company Accounting Oversight Board (United States) (PCAOB) and are required to be independent with respect to the Fund in accordance with the U.S. federal securities laws and the applicable rules and regulations of the Securities and Exchange Commission and the PCAOB.
We conducted our audits in accordance with the standards of the PCAOB. Those standards require that we plan and perform the audit to obtain reasonable assurance about whether the financial statements and financial highlights are free of material misstatement, whether due to error or fraud. The Fund is not required to have, nor were we engaged to perform, an audit of its internal control over financial reporting. As part of our audits we are required to obtain an understanding of internal control over financial reporting but not for the purpose of expressing an opinion on the effectiveness of the Fund’s internal control over financial reporting. Accordingly, we express no such opinion.
Our audits included performing procedures to assess the risks of material misstatement of the financial statements and financial highlights, whether due to error or fraud, and performing procedures that respond to those risks. Such procedures included examining, on a test basis, evidence regarding the amounts and disclosures in the financial statements and financial highlights. Our audits also included evaluating the accounting principles used and significant estimates made by management, as well as evaluating the overall presentation of the financial statements and financial highlights. Our procedures included confirmation of securities owned as of December 31, 2023, by correspondence with the custodian and brokers; when replies were not received from brokers, we performed other auditing procedures. We believe that our audits provide a reasonable basis for our opinion.
/s/ Deloitte & Touche LLP
Boston, Massachusetts
February 23, 2024
We have served as the auditor of one or more Brighthouse investment companies since 1983.
BHFTII-19
Brighthouse Funds Trust II
Trustees and Officers
MANAGEMENT OF THE TRUSTS
The Boards of Trustees (the “Board”) of Brighthouse Funds Trust I and Brighthouse Funds Trust II (“Trust I” and “Trust II”, respectively, and collectively the “Trusts”) supervise the Trusts and are responsible for representing the interests of shareholders. The Trustees, the Chairman of the Board and the Chairmen of each subcommittee are the same for both Trusts. The Trustees of each Trust meet periodically throughout the year to oversee the Portfolios’ activities, reviewing, among other things, each Portfolio’s performance and its contractual arrangements with various service providers. The Trustees of each Trust elect the officers of the Trust, who are responsible for administering the Trust’s day-to-day operations.
Trustees and Officers
The Trustees and executive officers of the Trusts, as well as their ages and their principal occupations during the past five years, are set forth below. Unless otherwise indicated, the business address of each is c/o Brighthouse Funds Trust I and Brighthouse Funds Trust II, 11225 N. Community House Rd., Charolette, North Carolina 28277. Each Trustee who is deemed an “interested person,” as such term is defined in the 1940 Act, is referred to as an “Interested Trustee.” Those Trustees who are not “interested persons,” as such term is defined in the 1940 Act, are referred to as “Independent Trustees.” There is no limit to the term a Trustee may serve, other than pursuant to the retirement policy adopted by the Independent Trustees. Trustees serve until their death, resignation, retirement or removal in accordance with Trust I’s and Trust II’s respective organizational documents and policies adopted by the Board of the Trust from time to time. Officers hold office at the pleasure of each Board and serve until their removal or resignation in accordance with the Trusts’ respective organizational documents and policies adopted by the Board of each Trust from time to time.
Trustees of the Trusts
| Name and Year of Birth |
Position(s) |
Term of Office |
Principal Occupation(s) During the Past |
Number of |
Other Directorships
Held | |||||
| Interested Trustee | ||||||||||
| John Rosenthal* (1960) |
Trustee | Indefinite; From May 2016 (Trust I and Trust II) to present | Chief Investment Officer, Brighthouse Financial, Inc. (2016 to present). | 73 | None | |||||
| Independent Trustees | ||||||||||
| Dawn M. Vroegop (1966) |
Trustee and Chair of the Board | Indefinite; From December 2000 (Trust I)/May 2009 (Trust II) to present as Trustee; From May 2016 (Trust I and Trust II) until present as Chair | Retired; Private Investor. | 73 | Trustee, Driehaus Mutual Funds (8 portfolios).** | |||||
| Stephen M. Alderman (1959) |
Trustee | Indefinite; From December 2000 (Trust I)/April 2012 (Trust II) to present | Vice President and General Counsel, IHR Aerial Solutions, LLC; Until 2022, General Counsel, Illini Hi-Reach, Inc.; Until 2020, Shareholder in the law firm of Garfield & Merel, Ltd. | 73 | None | |||||
| Robert J. Boulware (1956) |
Trustee | Indefinite; From March 2008 (Trust I)/April 2012 (Trust II) to present | Managing Member, Pilgrim Funds, LLC (private equity fund). | 73 | Trustee, Vertical Capital Income Fund (closed-end fund);** Trustee, The Private Shares Fund (closed-end fund);** Until 2021, Director, Mid-Con Energy Partners, LP (energy);** Until 2020, Director, Gainsco, Inc. (auto insurance).** | |||||
BHFTII-20
Brighthouse Funds Trust II
Trustees and Officers—(Continued)
| Name and Year of Birth |
Position(s) |
Term of Office |
Principal Occupation(s) During the Past |
Number of |
Other Directorships
Held | |||||
| Susan C. Gause (1952) |
Trustee | Indefinite; From March 2008 (Trust I)/April 2012 (Trust II) to present | Private Investor. | 73 | Trustee, HSBC Funds (4 portfolios).** | |||||
| Nancy Hawthorne (1951) |
Trustee | Indefinite; From May 2003 (Trust II)/April 2012 (Trust I) to present | Private Investor. | 73 | Trustee, First Eagle Credit Opportunities Fund;** Trustee and Chair of the Board of Trustees, First Eagle Global Opportunities Fund;** Director, Avid Technology, Inc;** Director, CRA International, Inc.** | |||||
Executive Officers of the Trusts
| Name and Year of Birth |
Position(s) |
Term of Office |
Principal Occupation(s) | |||
| Kristi Slavin (1973) | President and Chief Executive Officer, of Trust I and Trust II | From May 2016 (Trust I and Trust II) to present |
President, Brighthouse Investment Advisers, LLC (2016-present). | |||
| Alan R. Otis (1971) | Chief Financial Officer and Treasurer, of Trust I and Trust II | From November 2017 (Trust I and Trust II) to present |
Executive Vice President, Brighthouse Investment Advisers, LLC (2017-present); formerly, Vice President, Brighthouse Investment Advisers, LLC (2012-2017); Assistant Treasurer, Trust I and Trust II (2012-2017). | |||
| Thomas Watterson (1985) | Secretary, of Trust I and Trust II | From November 2023 (Trust I and Trust II) to present |
Executive Vice President, Chief Legal Officer and Secretary, Brighthouse Investment Advisers, LLC (2023-Present); Managing Corporate Counsel, Brighthouse Financial Inc. (2023-present); Managing Counsel and Director, The Bank of New York Mellon Corporation (2019-2023); Counsel and Vice President, The Bank of New York Mellon Corporation (2016-2019). | |||
| Katie Hellmann (1980) | Chief Compliance Officer (“CCO”), of Trust I and Trust II | From May 2023 (Trust I and Trust II) to present |
Chief Compliance Officer, Brighthouse Investment Advisers, LLC (2023-present) and Head of Funds and Investments Compliance (2023-present). Deputy Chief Compliance Officer, Transamerica Asset Management (2022-2023). Leader and Senior Compliance Counsel – Funds Compliance, Edward Jones (2017-2022). | |||
| Rosemary Morgan (1983) | Anti-Money Laundering Officer, of Trust I and Trust II | From May 2023 (Trust I and Trust II) to present |
Chief Privacy Officer, Leader of Compliance Programs and Assistant General Counsel, Brighthouse Financial, Inc. (2019-2022); Chief Privacy Officer, Head of Compliance Programs & Contracts Law, Brighthouse Financial, Inc. (2022-2023), Chief Compliance Officer and Associate General Counsel, Brighthouse Financial, Inc. (2023-present); Vice President and Chief Compliance Officer, Brighthouse Life Insurance Company (2023-present); Vice President and Chief Compliance Officer (2023-present), Brighthouse Life Insurance Company of NY; Vice President and Chief Compliance Officer (2023-present), New England Life Insurance Company. | |||
| Anna Koska (1981) | Vice President, of Trust I and Trust II | From June 2022 (Trust I and Trust II) to present |
Vice President, Investment and Advisory Services, Brighthouse Investment Advisers, LLC (2022-present); Director of Investment and Advisory Services, Brighthouse Investment Advisers, LLC (2019-2022); Senior Portfolio Analyst, Brighthouse Investment Advisers, LLC (2017-2019). | |||
| * | Mr. Rosenthal is an “interested person” of the Trusts because of his position with Brighthouse Financial, Inc. (“Brighthouse Financial”), an affiliate of BIA. |
| ** | Indicates a directorship with a registered investment company or a company subject to the reporting requirements of the Securities Exchange Act of 1934, as amended. |
| (1) | Previous positions during the past five years with the Trusts, MetLife, Inc. or the Adviser are omitted if not materially different. |
| (2) | The Fund Complex includes 44 Trust I Portfolios and 29 Trust II Portfolios. |
BHFTII-21
Brighthouse Funds Trust II
Baillie Gifford International Stock Portfolio
Board of Trustees’ Consideration of Advisory and Sub-Advisory Agreements
At a meeting held on November 13-14, 2023 (the “November Meeting”), the Boards of Trustees (the “Board”) of Brighthouse Funds Trust I and Brighthouse Funds Trust II (“BFT I” and “BFT II,” respectively, and collectively, the “Trusts”), including a majority of the Trustees who are not “interested persons” of the Trusts (the “Independent Trustees”) under the Investment Company Act of 1940 (the “1940 Act”), approved the continuation of the Trusts’ advisory agreements (each an “Advisory Agreement”) with Brighthouse Investment Advisers, LLC (the “Adviser”) and the applicable sub-advisory and sub-sub-advisory agreements (each a “Sub-Advisory Agreement” and collectively with the Advisory Agreement, the “Agreements”) between the Adviser and the investment sub-advisers and sub-sub-adviser (each a “Sub-Adviser,” and collectively, the “Sub-Advisers”) for the series of the Trusts (each a “Portfolio,” and collectively, the “Portfolios”) for the annual contract renewal period from January 1, 2024 through December 31, 2024.
The Board met with personnel of the Adviser on September 28-29, 2023 (the “September Meeting”) for the specific purpose of giving preliminary consideration to the proposed continuation of the Agreements, including consideration to information that the Adviser and Sub-Advisers had provided for the Board’s review at the request of the Independent Trustees. At the September Meeting, the Adviser reviewed with the Board the performance and fees experienced by each Portfolio, as well as other information. During and after the September Meeting, the Independent Trustees requested additional information and clarifications that the Adviser addressed at the November Meeting (the September Meeting and the November Meeting are referred to collectively as, the “Meetings”). During the contract renewal process, and throughout the year, the Independent Trustees were advised by independent legal counsel, and they met with independent legal counsel in executive sessions outside of the presence of management on a number of occasions to discuss, among other things, the renewal of the Agreements.
In considering the continuation of the Agreements, the Board reviewed a variety of materials that were provided for the specific purpose of assisting the Board in the renewal process, along with various information and materials that were provided to and discussed with the Board throughout the year, at regularly scheduled meetings of the Board and its committees. In particular, information for each Portfolio included, but was not limited to, reports on investment performance, expenses, legal and compliance matters, and asset pricing. Information about the Adviser and each Sub-Adviser included, but was not limited to, reports on the business, operations, and performance of the Adviser and the Sub-Advisers and reports that the Adviser and Sub-Advisers had prepared specifically for the renewal process.
In considering the continuation of the Agreements, the Board also reviewed, among other things, a report for each Portfolio that was prepared by Broadridge (“Broadridge”), an independent organization, which set forth comparative performance and expense information for each Portfolio. In addition, the Independent Trustees reviewed a report that was prepared by JDL Consultants, LLC (“JDL”), an independent consultant to the Independent Trustees, which examined the Broadridge reports for each Portfolio (“JDL Report”). The Independent Trustees met in executive session with representatives of JDL during the September Meeting to review the JDL Report.
At the November Meeting, the Board, including a majority of the Independent Trustees, concluded that the nature, extent, and quality of services provided by the Adviser and each Sub-Adviser supported the renewal of the Agreements. The Board also concluded that the investment services provided to and the performance of each Portfolio was such that each Agreement should continue, and that the fees paid by each Portfolio to the Adviser appeared to be reasonable in light of the nature, extent, and quality of the services provided by the Adviser and each Sub-Adviser. Further, the Board concluded that the Adviser’s profitability in providing services under the Advisory Agreements did not appear unreasonable in light of the nature, extent, and quality of the services provided by the Adviser. The Board reviewed the extent to which the investment advisory fees paid by the Portfolios shared economies of scale with investors or entailed the potential to share economies of scale with investors and concluded that those considerations generally supported the renewal of each Agreement. Finally, the Board considered the Adviser’s recommendation that it approve the renewal of each Sub-Advisory Agreement.
In approving the continuation of each Agreement, the Board, including the Independent Trustees, gave attention to all of the information that was furnished, and each Trustee placed varying degrees of importance on the various pieces of information that were provided to them. The Board evaluated the information provided to it on a Portfolio-by-Portfolio basis, and its decision was made separately with respect to each Portfolio. The following paragraphs provide more information about some of the primary factors that were relevant to the Board’s decisions. The Board did not identify any single factor as determinative, and the Trustees generally attributed different weights to various factors for the various Portfolios.
Nature, extent and quality of services. The Board evaluated the nature, extent, and quality of the services that the Adviser and the Sub-Advisers, as relevant, provided to the Portfolios. The Board considered the Adviser’s services as investment manager to the Portfolios, including its services relating to the hiring and oversight of the Sub-Advisers and, in particular, their investment programs and personnel, succession management of key personnel, trading practices, compliance programs and personnel, and risk management
BHFTII-22
Brighthouse Funds Trust II
Baillie Gifford International Stock Portfolio
Board of Trustees’ Consideration of Advisory and Sub-Advisory Agreements—(Continued)
programs, among other things. The Adviser’s services in coordinating and overseeing the activities of the Trusts’ other service providers were also considered. The Board also considered the systems and processes required by the Adviser to meet additional regulatory and compliance requirements resulting from U.S. Securities and Exchange Commission and other regulatory initiatives, including related to liquidity, valuation, and derivatives risk management. The Board considered information received from the Trusts’ Chief Compliance Officer regarding the Portfolios’ compliance policies and procedures that were established pursuant to Rule 38a-l under the 1940 Act, and relevant aspects of the Adviser’s and Sub-Advisers’ compliance policies and procedures. The Board also noted that it was the practice of the Adviser’s investment, compliance, and legal staff to conduct periodic meetings (through various media) with the Sub-Advisers throughout the year in order to review and assess the services that are provided to the Portfolios, and that personnel of the Adviser routinely prepare and present reports to the Board regarding those meetings. In addition, during the Meetings and throughout the year, the Board considered the expertise, experience, and performance of the personnel of the Adviser who performed the various services that are mentioned above.
With respect to the services provided by each of the Sub-Advisers, the Board considered a variety of information that the Adviser and each Sub-Adviser prepared for the Board’s review. The Board considered each Sub-Adviser’s investment process, each Sub-Adviser’s overall organization and business plans and the investment performance experienced by the Portfolio (as described in more detail below). The Board took into account that each Sub-Adviser’s responsibilities include, among other things, the development and maintenance of an investment program for the applicable Portfolio, the selection of investments and the placement of orders for the purchase and sale of such assets, and the implementation of compliance controls related to the performance of these services. The Board considered, based on the information provided, each Sub-Adviser’s staffing with respect to the management of the Portfolio and other information relating to the Sub-Adviser’s business and operations. The Board also considered the Sub-Adviser’s overall resources and information with respect to any recent turnover of key personnel at the Sub-Adviser. The Board reviewed each Sub-Adviser’s investment experience, as well as information provided regarding the Sub-Adviser’s personnel who provide services to the Portfolios. The Board also considered, among other things, information about each Sub-Adviser’s compliance program, including regarding any compliance matters involving a Sub-Adviser that had been brought to the Board’s attention during the year, as well as the Adviser’s assessment of the financial condition of each Sub-Adviser.
Performance. The Board placed emphasis on the performance of each Portfolio in the context of the performance of the relevant markets in which the Portfolio invests. The Board considered the Adviser’s quarterly presentations to the Board of detailed information about each Portfolio’s investment strategies and performance results and composition, including discussions regarding the relevant effects of market conditions. The Board reviewed and considered the reports prepared by Broadridge, which provided a statistical analysis comparing each Portfolio’s investment performance to that of comparable funds underlying variable insurance products (the “Performance Universe”), and the JDL Report. The Board also compared the performance of each Portfolio to that of comparable funds and other accounts that were managed by the relevant Sub-Adviser, to the extent such information was provided. The Board considered each Portfolio’s performance for periods subsequent to the performance period covered by the Broadridge reports and considered the Adviser’s assessment of the same. The Board also noted that while it found the data provided by Broadridge generally useful, it recognized the limitations of such data, including, in particular, that notable differences may exist between a Portfolio and the other funds in a Broadridge category (for example, with respect to investment strategies) and that the results of the performance comparisons may vary depending on (i) the end dates for the performance periods that were selected and (ii) the selection of the peer groups.
The Board focused particular attention on Portfolios with less favorable performance records. The Board noted the Adviser’s focus on each Sub-Adviser’s performance and that the Adviser had been active in monitoring and responding to any performance issues with respect to the Portfolios.
Fees and Expenses. The Board gave consideration to the level and method of computing the fees payable under the Agreements. The Board reviewed and considered the information in the JDL Report concerning fees and expenses. The Board also reviewed and considered the Broadridge report for each Portfolio, which included various comparisons of the Portfolio’s fees (at December 31, 2022 and various asset levels) and expenses with those of its peers, including, as applicable, a broad group of peer funds (“Expense Universe”), a narrower group of peer funds (“Expense Group”), a broad group of peer sub-advised funds (“Sub-advised Expense Universe”), and a narrower group of peer sub-advised funds (“Sub-advised Expense Group”). In particular, the Board reviewed comparisons of each Portfolio’s contractual management fees with its Expense Group and Sub-advised Expense Universe, contractual sub-adviser fees with its Sub-advised Expense Universe and Sub-advised Expense Group, and total expenses with its Expense Universe, Expense Group and Sub-advised Expense Universe. The Board considered that Broadridge selected the peer funds, which were funds underlying variable insurance products that Broadridge deemed to be comparable to the Portfolios. The Board considered that the fee
BHFTII-23
Brighthouse Funds Trust II
Baillie Gifford International Stock Portfolio
Board of Trustees’ Consideration of Advisory and Sub-Advisory Agreements—(Continued)
and expense information in the Broadridge report for each Portfolio reflected information as of the Portfolio’s most recent fiscal year end at the time the Broadridge report was issued and that historical asset levels may differ from current asset levels, particularly in a period of market volatility. In addition, the Board compared the fee payable to a Sub-Adviser by the Adviser with respect to the Portfolio to the fee payable to the Sub-Adviser by other comparable funds and other accounts, to the extent such information was provided.
The Board noted that the sub-advisory fees for the Portfolios are negotiated at arm’s length by the Adviser and are paid by the Adviser out of its advisory fees. The Board also considered that the Adviser had entered into expense limitation or management fee waiver agreements with certain of the Portfolios pursuant to which the Adviser had agreed to waive a portion of its advisory fee and/or reimburse certain expenses as a means of limiting a Portfolio’s total annual operating expenses or passing through the benefit of a subadvisory fee concession to a Portfolio, as applicable.
Profitability. The Board examined the profitability to the Adviser of each Advisory Agreement, on a Portfolio-by-Portfolio basis. The Board also considered that an affiliate of the Adviser, Brighthouse Securities, LLC, serves as distributor for the Trusts, and, as such, receives Rule 12b-1 payments to support the distribution of the Portfolios. The Board considered the profitability to the Sub-Advisers and their affiliates of their relationships with the Portfolios, to the extent provided, and the Board considered the ability of the Adviser to negotiate with a Sub-Adviser at arm’s length. In reviewing the profitability information, the Board recognized that expense allocation methodologies are inherently subjective and various methodologies may be reasonable while producing different results.
Economies of scale. The Board considered each Portfolio’s fees in light of its size. The Board noted the fee schedules for the Portfolios that contain breakpoints that reduce the fee rate above specified asset levels, including breakpoints in the Advisory Agreements and any corresponding Sub-Advisory Agreement. The Board noted those Portfolios that did not have breakpoints in their advisory fees and considered management’s explanation of the same.
The Board considered the effective fees under the Advisory Agreement and Sub-Advisory Agreement for each Portfolio as a percentage of assets at different asset levels and possible economies of scale that may be realized if the assets of the Portfolio grow. The Board examined, among other data, the effect of a Portfolio’s growth in size, and reduction in size, on various fee schedules. The Board also generally noted that if a Portfolio’s assets increase over time, the Portfolio may realize economies of scale if assets increase proportionally more than certain other expenses.
Other factors. The Board considered other benefits that may be realized by the Adviser and its affiliates from their relationships with the Trusts. Among the benefits realized by the Adviser, the Board recognized that Brighthouse Securities, LLC, as the distributor for the Trusts, receives payments pursuant to Rule 12b-1 from the Portfolios to help compensate for the provision of shareholder services and distribution activities. The Board considered that a Sub-Adviser may engage in soft dollar transactions in managing a Portfolio. In addition, the Board considered that a Sub-Adviser may be affiliated with registered broker-dealers that may, from time to time, receive brokerage commissions from a Portfolio in connection with the sale of portfolio securities (subject to applicable best execution obligations). The Board also considered that a Sub-Adviser and its affiliates could benefit from the opportunity to provide advisory services to additional portfolios of the Trusts and overall reputational benefits.
The Board considered information from the Adviser and Sub-Advisers pertaining to potential conflicts of interest, and the manner in which any potential conflicts were mitigated. In its review, the Board considered information regarding various business relationships among the Adviser and its affiliates and various Sub-Advisers and their affiliates. The Board also considered information about services and/or payments provided to the Adviser by the Sub-Advisers in connection with marketing activities. The Board considered representations from the Adviser that such business relationships and any payments were not considered in the Adviser’s recommendation to renew any of the Sub-Advisory Agreements.
* * * * *
Baillie Gifford International Stock Portfolio. The Board also considered the following information in relation to the Agreements with the Adviser and Baillie Gifford Overseas Limited regarding the Portfolio:
Among other data relating specifically to the Portfolio’s performance, the Board considered that the Portfolio outperformed the median of its Performance Universe and the average of its Morningstar Category for the one-year period ended June 30, 2023 and underperformed the median of its Performance Universe and the average of its Morningstar Category for the three- and five-year periods ended June 30, 2023. The Board further considered that the Portfolio underperformed its benchmark, the MSCI All Country World ex-U.S. Index, for the one-, three-, and five-year periods ended October 31, 2023. The Board took into account management’s discussion of the Portfolio’s performance, including with respect to prevailing market conditions. The Board also noted the presence of certain management fee waivers in effect for the Portfolio.
BHFTII-24
Brighthouse Funds Trust II
Baillie Gifford International Stock Portfolio
Board of Trustees’ Consideration of Advisory and Sub-Advisory Agreements—(Continued)
The Board also considered that the Portfolio’s actual management fees and total expenses (exclusive of 12b-1 fees) were below the Expense Group median, the Expense Universe median, and the Sub-advised Expense Universe median. The Board noted that the Portfolio’s contractual management fees were above the asset-weighted average of the Investment Classification/Morningstar Category selected by Broadridge at the Portfolio’s current size. The Board also noted that the Portfolio’s contractual sub-advisory fees were below the averages of the Sub-advised Expense Group and the Sub-advised Expense Universe at the Portfolio’s current size.
BHFTII-25
Brighthouse Funds Trust II
BlackRock Bond Income Portfolio
Managed By BlackRock Advisors, LLC
Portfolio Manager Commentary*
PERFORMANCE
For the twelve months ended December 31, 2023, the Class A, B and E shares of the BlackRock Bond Income Portfolio returned 5.84%, 5.59%, and 5.68%, respectively. The Portfolio’s benchmark, the Bloomberg U.S. Aggregate Bond Index¹, returned 5.53%.
MARKET ENVIRONMENT / CONDITIONS
In mid-March, investors saw the failures of Silicon Valley Bank and Credit Suisse. A potential credit crunch and uncertainty in the U.S. banking system drove the front end of the curve to rally nearly 1.00% with the 2-Year U.S. Treasury moving the most in one-day since October 1987. On March 22nd, the Federal Reserve (the “Fed”) increased the Federal Funds Rate by 0.25%. The Consumer Price Index had a modest start to the year turning negative but picked up again in the latter half of the first quarter. The labor market set recent records with the unemployment rate dropping down to the lowest rate in more than five decades. After ten consecutive rate hikes over the past year and a half, the Fed decided on their first pause in June. Following this announcement, front-end yields initially sold off as the Fed moved its projections for the Federal Funds Rate in 2023 higher than the market expected, but then moved lower following a more dovish press conference. On the legislative front, the U.S. Senate voted to suspend the $31.4 trillion debt ceiling with support from both political parties. In the third quarter, the July Federal Open Market Committee (the “FOMC”) meeting resumed rate hikes following the June skip in rate hikes. In the final month of the quarter, Fed chair Jerome Powell announced that the Fed would hold rates steady. The meeting maintained the stance that a soft landing is a primary objective for the FOMC. In the fourth quarter, markets moved from a fear of growth to a more muted stance as economic data showed a deceleration in both inflation and growth expectations across most developed markets. In December, the FOMC meeting maintained a dovish tone. Overall, the fourth quarter demonstrated a dynamic economic landscape marked by fluctuations in inflation expectations, nuanced labor market signals, and indications of economic slowdown.
PORTFOLIO REVIEW / PERIOD END POSITIONING
Over the year, the Portfolio outperformed the benchmark. The Portfolio’s allocation to structured products, namely Collateralized Loan Obligations and Non-Agency Mortgages was the most notable contributor to performance. Additionally, U.S. Investment Grade Credit selection and Agency Mortgage-Backed Security (“MBS”) positioning and selection contributed to performance. The Portfolio’s duration and yield curve positioning was the largest detractor, where we remained tactical throughout the year and were early to move to an overweight duration position over the summer on the view of inflation softening. Throughout most of the year, we held a short Japanese 10-year rate position, which detracted from performance albeit we did see some pullback in performance following the Bank of Japan’s decision to readjust its extremely dovish policy stance.
From an interest rate perspective, the Portfolio was extremely tactical over the year. After coming into the year overweight the front end of the U.S. curve, we moved to an underweight duration position in February after rates had rallied and given our view that inflation would stay stickier than the market expected in the spring. We moved closer to neutral ahead of the regional banking stress and held a more modest active duration position through much of the second quarter. Towards the end of the first half, we increased top-line duration to an overweight position, on the view that inflation would slow more than expected in the second half of the year. The Portfolio generally held that position into November when the market narrative finally shifted to one of more dovish monetary policy from the Fed which in our view seemed overdone. We increased these positions as rates rallied in December and the market priced in the first rate cut for as early as March 2024. The Portfolio ended the year with an effective duration of 5.95 years, 0.22 years underweight relative to the benchmark index.
From a spread sector perspective, coming into 2023, we favored high-quality markets given the lack of additional spread pickup available from moving down in quality given our view of the potential for slowing growth and market perceived risk of a recession. We started the year with an overweight to U.S. Investment Grade Credit and U.S. Agency MBS. Security selection proved essential in sectors seeing a wide array of dispersion. The Portfolio kept positions in U.S. High Yield and Emerging Market Debt to near historically low levels over the year given valuations and our macro view.
In general, the Portfolio reduced positioning in Investment Grade Credit ahead of regional banking stress in the first quarter, holding a slightly underweight position for most of the year favoring Utilities and select Industrials. While remaining tactical, the Portfolio increased its Agency Mortgage overweight in the second half of the year as spreads reached extremely attractive levels and on the view interest rate volatility would move lower. Into year end, the Portfolio added to U.S. Investment Grade Credit mainly in Financials as they had underperformed, while maintaining our overall underweight. The Portfolio remained overweight Utilities and select portions of Industrials and maintained our allocation to High Yield Credit while remaining cautious. We also modestly reduced our Agency MBS overweight given strong performance into year end. The Portfolio maintained its allocation to securitized assets over the year but trimmed at the margins, favoring select, top-of-the-capital structure, segments of the structured product market, while being cautious in non-Agency given declining fundamentals and technical headwinds.
BHFTII-1
Brighthouse Funds Trust II
BlackRock Bond Income Portfolio
Managed By BlackRock Advisors, LLC
Portfolio Manager Commentary*—(Continued)
The Portfolio held derivatives during the period as a part of our investment strategy. Derivatives are used as a means to manage risk and/or take outright views on interest rates, credit risk and/or foreign exchange positions. During the year, derivatives held in the Portfolio performed as expected and did not have significant impact on performance.
Rick Rieder
David Rogal
Chi Chen
Portfolio Managers
BlackRock Advisors, LLC
* This commentary may include statements that constitute “forward-looking statements” under the U.S. securities laws. Forward-looking statements include, among other things, projections, estimates, and information about possible or future results related to the Portfolio, market or regulatory developments. The views expressed above are not guarantees of future performance or economic results and involve certain risks, uncertainties and assumptions that could cause actual outcomes and results to differ materially from the views expressed herein. The views expressed above are subject to change at any time based upon economic, market, or other conditions and the subadvisory firm undertakes no obligation to update the views expressed herein. Any discussions of specific securities should not be considered a recommendation to buy or sell those securities. The views expressed above (including any forward-looking statement) may not be relied upon as investment advice or as an indication of the Portfolio’s trading intent. Information about the Portfolio’s holdings, asset allocation or country diversification is historical and is not an indication of future Portfolio composition, which may vary. Direct investment in any index is not possible. The performance of any index mentioned in this commentary has not been adjusted for ongoing management, distribution and operating expenses, and sales charges applicable to mutual fund investments. In addition, the returns do not reflect additional fees charged by separate accounts or variable insurance contracts that an investor in the Portfolio may pay. If these additional fees were reflected, performance would have been lower.
1 The Bloomberg U.S. Aggregate Bond Index is a broad-based benchmark that measures the investment grade, U.S. dollar-denominated, fixed-rate taxable bond market, including Treasuries, government-related and corporate securities, mortgage-backed securities, asset-backed securities, and commercial mortgage-backed securities.
BHFTII-2
Brighthouse Funds Trust II
BlackRock Bond Income Portfolio
A $10,000 INVESTMENT COMPARED TO THE BLOOMBERG U.S. AGGREGATE BOND INDEX
AVERAGE ANNUAL RETURNS (%) FOR THE YEAR ENDED DECEMBER 31, 2023
| 1 Year | 5 Year | 10 Year | ||||||||||
| BlackRock Bond Income Portfolio | ||||||||||||
| Class A |
5.84 | 1.53 | 2.20 | |||||||||
| Class B |
5.59 | 1.28 | 1.95 | |||||||||
|
Class E |
5.68 | 1.38 | 2.05 | |||||||||
| Bloomberg U.S. Aggregate Bond Index | 5.53 | 1.10 | 1.81 | |||||||||
Portfolio performance is calculated including reinvestment of all income and capital gain distributions. Performance numbers are net of all Portfolio expenses but do not include any insurance, sales, separate account or administrative charges of variable annuity or life insurance contracts or any additional expenses that participants may bear relating to the operations of their plans. If these charges were included, the returns would be lower. The performance of any index referenced above has not been adjusted for ongoing management, distribution and operating expenses, and sales charges applicable to mutual fund investments. Direct investment in any index is not possible. The performance of Class A shares, as set forth in the line graph above, will differ from that of other classes because of the difference in expenses paid by policyholders investing in the different share classes.
This information represents past performance and is not indicative of future results. Investment return and principal value may fluctuate so that shares, upon redemption, may be worth more or less than the original cost.
PORTFOLIO COMPOSITION AS OF DECEMBER 31, 2023
Top Sectors
| % of Net Assets |
||||
| Agency Mortgage-Backed Securities | 35.7 | |||
| Corporate Bonds & Notes | 26.3 | |||
| U.S. Treasury | 24.2 | |||
| Asset-Backed Securities | 9.8 | |||
| Non-Agency Mortgage-Backed Securities | 8.0 | |||
| Foreign Government | 2.0 | |||
| Floating Rate Loans | 0.7 | |||
| Municipals | 0.7 | |||
| Equities | 0.4 | |||
| Purchased Options | 0.1 | |||
BHFTII-3
Brighthouse Funds Trust II
BlackRock Bond Income Portfolio
Understanding Your Portfolio’s Expenses
Shareholder Expense Example
As a shareholder of the Portfolio, you incur ongoing costs, including management fees; distribution and service (12b-1) fees; and other Portfolio expenses. This example is intended to help you understand your ongoing costs (in dollars) (referred to as “expenses”) of investing in the Portfolio and compare these costs with the ongoing costs of investing in other mutual funds. The example is based on an investment of $1,000 invested at the beginning of the period and held for the entire period, July 1, 2023 through December 31, 2023.
Actual Expenses
The first line for each share class of the Portfolio in the table below provides information about actual account values and actual expenses. You may use the information in this line, together with the amount you invested in the particular share class of the Portfolio, to estimate the expenses that you paid over the period. Simply divide your account value by $1,000 (for example, an $8,600 account value divided by $1,000 = 8.6), then multiply the result by the number in the first line under the heading entitled “Expenses Paid During Period” to estimate the expenses you paid on your account during this period.
Hypothetical Example for Comparison Purposes
The second line for each share class of the Portfolio in the table below provides information about hypothetical account values and hypothetical expenses based on the Portfolio’s actual expense ratio and an assumed rate of return of 5% per year before expenses, which is not the Portfolio’s actual return. The hypothetical account values and expenses may not be used to estimate the actual ending account balance or expenses you paid for the period. You may use this information to compare the ongoing costs of investing in the Portfolio and other funds. To do so, compare this 5% hypothetical example with the 5% hypothetical examples that appear in the shareholder reports of the other funds.
Please note that the expenses shown in the table are meant to highlight your ongoing costs only and do not reflect any fees or charges of your variable insurance product or any additional expenses that participants in certain eligible qualified plans may bear relating to the operations of their plan. Therefore, the second line for each share class in the table is useful in comparing ongoing costs only, and will not help you determine the relative total costs of owning different funds. In addition, if these other costs were included, your costs would have been higher.
| BlackRock Bond Income Portfolio |
Annualized Expense Ratio |
Beginning Account Value July 1, 2023 |
Ending Account Value December 31, 2023 |
Expenses Paid During Period** July 1, 2023 to December 31, 2023 |
||||||||||||||
| Class A (a) |
Actual | 0.40 | % | $ | 1,000.00 | $ | 1,030.40 | $ | 2.05 | |||||||||
| Hypothetical* | 0.40 | % | $ | 1,000.00 | $ | 1,023.19 | $ | 2.04 | ||||||||||
| Class B (a) |
Actual | 0.65 | % | $ | 1,000.00 | $ | 1,029.20 | $ | 3.32 | |||||||||
| Hypothetical* | 0.65 | % | $ | 1,000.00 | $ | 1,021.93 | $ | 3.31 | ||||||||||
| Class E (a) |
Actual | 0.55 | % | $ | 1,000.00 | $ | 1,029.70 | $ | 2.81 | |||||||||
| Hypothetical* | 0.55 | % | $ | 1,000.00 | $ | 1,022.43 | $ | 2.80 | ||||||||||
| * | Hypothetical assumes a rate of return of 5% per year before expenses. |
| ** | Expenses paid are equal to the Portfolio’s annualized expense ratio for the most recent six month period, as shown above, multiplied by the average account value over the period, multiplied by the number of days (184 days) in the most recent fiscal half-year, divided by 365 (to reflect the one-half year period). |
| (a) | The annualized expense ratio shown reflects the impact of the management fee waiver as described in Note 6 of the Notes to Financial Statements. |
BHFTII-4
Brighthouse Funds Trust II
BlackRock Bond Income Portfolio
Schedule of Investments as of December 31, 2023
U.S. Treasury & Government Agencies—59.9% of Net Assets
| Security Description | Principal Amount* |
Value | ||||||
| Agency Sponsored Mortgage - Backed—35.7% | ||||||||
| Federal Home Loan Mortgage Corp. | ||||||||
| 1.500%, 04/01/36 |
3,249,056 | $ | 2,853,060 | |||||
| 1.500%, 05/01/36 |
572,582 | 500,510 | ||||||
| 1.500%, 08/01/50 |
883,274 | 690,736 | ||||||
| 1.500%, 10/01/50 |
2,199,023 | 1,718,345 | ||||||
| 2.000%, 09/01/35 |
747,921 | 674,913 | ||||||
| 2.000%, 01/01/36 |
1,607,642 | 1,448,360 | ||||||
| 2.000%, 02/01/36 |
1,922,656 | 1,735,179 | ||||||
| 2.000%, 03/01/36 |
298,130 | 268,947 | ||||||
| 2.000%, 05/01/36 |
1,776,923 | 1,604,359 | ||||||
| 2.000%, 06/01/36 |
1,205,590 | 1,088,503 | ||||||
| 2.000%, 07/01/36 |
512,098 | 462,357 | ||||||
| 2.000%, 04/01/37 |
562,955 | 507,839 | ||||||
| 2.000%, 02/01/42 |
421,196 | 359,637 | ||||||
| 2.000%, 03/01/42 |
1,513,425 | 1,291,760 | ||||||
| 2.000%, 04/01/42 |
439,592 | 375,069 | ||||||
| 2.000%, 08/01/50 |
322,781 | 268,338 | ||||||
| 2.000%, 09/01/50 |
438,105 | 360,321 | ||||||
| 2.000%, 11/01/50 |
601,945 | 501,000 | ||||||
| 2.000%, 02/01/51 |
15,382,079 | 12,629,849 | ||||||
| 2.000%, 03/01/51 |
3,517,091 | 2,886,882 | ||||||
| 2.000%, 04/01/51 |
1,806,966 | 1,504,336 | ||||||
| 2.000%, 05/01/51 |
1,085,612 | 902,644 | ||||||
| 2.000%, 07/01/51 |
4,160,563 | 3,484,960 | ||||||
| 2.000%, 09/01/51 |
1,459,892 | 1,206,066 | ||||||
| 2.000%, 10/01/51 |
4,369,363 | 3,575,598 | ||||||
| 2.000%, 12/01/51 |
3,018,624 | 2,505,238 | ||||||
| 2.000%, 01/01/52 |
14,869,736 | 12,356,590 | ||||||
| 2.000%, 02/01/52 |
1,634,898 | 1,351,963 | ||||||
| 2.500%, 04/01/27 |
14,155 | 13,562 | ||||||
| 2.500%, 10/01/28 |
96,799 | 92,892 | ||||||
| 2.500%, 08/01/29 |
206,277 | 194,495 | ||||||
| 2.500%, 12/01/29 |
98,433 | 92,373 | ||||||
| 2.500%, 05/01/30 |
305,583 | 290,248 | ||||||
| 2.500%, 07/01/30 |
193,214 | 183,056 | ||||||
| 2.500%, 08/01/30 |
710,836 | 674,705 | ||||||
| 2.500%, 09/01/30 |
799,192 | 758,255 | ||||||
| 2.500%, 04/01/31 |
615,544 | 583,157 | ||||||
| 2.500%, 07/01/50 |
418,612 | 361,115 | ||||||
| 2.500%, 02/01/51 |
3,517,695 | 3,055,098 | ||||||
| 2.500%, 05/01/51 |
12,167,313 | 10,525,184 | ||||||
| 2.500%, 11/01/51 |
10,844,092 | 9,360,398 | ||||||
| 2.500%, 12/01/51 |
5,435,053 | 4,675,556 | ||||||
| 2.500%, 01/01/52 |
29,578,302 | 25,450,719 | ||||||
| 2.500%, 04/01/52 |
8,984,966 | 7,744,013 | ||||||
| 3.000%, 09/01/27 |
99,820 | 97,032 | ||||||
| 3.000%, 07/01/28 |
60,438 | 58,643 | ||||||
| 3.000%, 01/01/30 |
215,866 | 208,149 | ||||||
| 3.000%, 04/01/30 |
1,165,649 | 1,121,740 | ||||||
| 3.000%, 05/01/30 |
212,444 | 204,786 | ||||||
| 3.000%, 06/01/30 |
7,779 | 7,499 | ||||||
| 3.000%, 07/01/30 |
432,347 | 416,049 | ||||||
| 3.000%, 08/01/30 |
136,315 | 131,158 | ||||||
| 3.000%, 09/01/37 |
52,462 | 48,643 | ||||||
| 3.000%, 06/01/38 |
1,080,151 | 1,007,490 | ||||||
| 3.000%, 01/01/43 |
730,104 | 671,964 | ||||||
| Agency Sponsored Mortgage - Backed—(Continued) | ||||||||
| Federal Home Loan Mortgage Corp. | ||||||||
| 3.000%, 03/01/43 |
1,255,326 | 1,155,354 | ||||||
| 3.000%, 06/01/44 |
6,537,929 | 6,008,823 | ||||||
| 3.000%, 12/01/46 |
773,698 | 704,598 | ||||||
| 3.000%, 02/01/47 |
544,116 | 496,178 | ||||||
| 3.000%, 08/01/50 |
4,599,289 | 4,143,792 | ||||||
| 3.000%, 09/01/50 |
2,071,880 | 1,881,167 | ||||||
| 3.000%, 07/01/51 |
419,034 | 376,400 | ||||||
| 3.000%, 10/01/51 |
599,231 | 535,141 | ||||||
| 3.000%, 02/01/52 |
309,055 | 278,244 | ||||||
| 3.000%, 03/01/52 |
8,883,820 | 7,962,426 | ||||||
| 3.000%, 08/01/52 |
15,926,695 | 14,251,711 | ||||||
| 3.500%, 01/01/34 |
474,009 | 455,708 | ||||||
| 3.500%, 05/01/35 |
1,752,471 | 1,689,503 | ||||||
| 3.500%, 04/01/42 |
873,873 | 828,390 | ||||||
| 3.500%, 05/01/42 |
26,658 | 25,240 | ||||||
| 3.500%, 08/01/42 |
728,975 | 690,492 | ||||||
| 3.500%, 10/01/42 |
38,544 | 36,452 | ||||||
| 3.500%, 06/01/43 |
121,016 | 113,783 | ||||||
| 3.500%, 01/01/44 |
264,473 | 249,303 | ||||||
| 3.500%, 05/01/44 |
46,331 | 43,614 | ||||||
| 3.500%, 06/01/44 |
111,368 | 103,534 | ||||||
| 3.500%, 07/01/44 |
45,455 | 42,797 | ||||||
| 3.500%, 09/01/44 |
101,213 | 95,311 | ||||||
| 3.500%, 09/01/45 |
76,903 | 71,881 | ||||||
| 3.500%, 03/01/46 |
2,451,698 | 2,314,390 | ||||||
| 3.500%, 09/01/46 |
561,107 | 521,663 | ||||||
| 3.500%, 03/01/47 |
671,948 | 635,052 | ||||||
| 3.500%, 10/01/47 |
613,998 | 582,068 | ||||||
| 3.500%, 12/01/47 |
726,020 | 688,264 | ||||||
| 3.500%, 01/01/48 |
3,606,276 | 3,393,600 | ||||||
| 3.500%, 06/01/48 |
963,466 | 904,170 | ||||||
| 3.500%, 08/01/50 |
308,205 | 286,788 | ||||||
| 4.000%, 08/01/40 |
83,066 | 80,999 | ||||||
| 4.000%, 09/01/40 |
106,371 | 103,879 | ||||||
| 4.000%, 10/01/40 |
60,100 | 58,692 | ||||||
| 4.000%, 11/01/40 |
204,169 | 199,385 | ||||||
| 4.000%, 04/01/41 |
4,973 | 4,856 | ||||||
| 4.000%, 10/01/41 |
178,507 | 173,881 | ||||||
| 4.000%, 09/01/43 |
170,763 | 166,213 | ||||||
| 4.000%, 04/01/44 |
394,523 | 381,340 | ||||||
| 4.000%, 07/01/44 |
68,714 | 66,933 | ||||||
| 4.000%, 01/01/45 |
4,907,864 | 4,778,888 | ||||||
| 4.000%, 02/01/45 |
96,907 | 94,284 | ||||||
| 4.000%, 09/01/45 |
529,616 | 515,326 | ||||||
| 4.000%, 12/01/45 |
3,094,523 | 2,988,180 | ||||||
| 4.000%, 01/01/47 |
385,677 | 371,941 | ||||||
| 4.000%, 07/01/47 |
1,157,457 | 1,116,218 | ||||||
| 4.000%, 01/01/48 |
897,724 | 864,786 | ||||||
| 4.000%, 04/01/48 |
2,515,979 | 2,402,747 | ||||||
| 4.000%, 06/01/48 |
1,089,134 | 1,049,998 | ||||||
| 4.000%, 05/01/49 |
109,511 | 105,462 | ||||||
| 4.000%, 07/01/49 |
278,886 | 268,741 | ||||||
| 4.000%, 03/01/50 |
2,273,775 | 2,187,137 | ||||||
| 4.000%, 06/01/50 |
1,618,924 | 1,552,887 | ||||||
| 4.000%, 07/01/50 |
910,737 | 876,154 | ||||||
See accompanying notes to financial statements.
BHFTII-5
Brighthouse Funds Trust II
BlackRock Bond Income Portfolio
Schedule of Investments as of December 31, 2023
U.S. Treasury & Government Agencies—(Continued)
| Security Description | Principal Amount* |
Value | ||||||
| Agency Sponsored Mortgage - Backed—(Continued) | ||||||||
| Federal Home Loan Mortgage Corp. | ||||||||
| 4.000%, 02/01/51 |
843,879 | $ | 812,658 | |||||
| 4.000%, 06/01/52 |
2,303,101 | 2,217,909 | ||||||
| 4.500%, 02/01/39 |
379,752 | 379,333 | ||||||
| 4.500%, 08/01/39 |
263,108 | 261,519 | ||||||
| 4.500%, 12/01/39 |
80,896 | 80,906 | ||||||
| 4.500%, 07/01/40 |
29,152 | 29,155 | ||||||
| 4.500%, 05/01/41 |
390,869 | 390,899 | ||||||
| 4.500%, 05/01/42 |
445,383 | 445,441 | ||||||
| 4.500%, 10/01/43 |
76,208 | 75,568 | ||||||
| 4.500%, 12/01/43 |
473,911 | 473,625 | ||||||
| 4.500%, 04/01/47 |
875,976 | 868,875 | ||||||
| 4.500%, 05/01/47 |
330,604 | 327,991 | ||||||
| 4.500%, 07/01/47 |
699,291 | 693,613 | ||||||
| 4.500%, 02/01/49 |
965,626 | 951,126 | ||||||
| 4.500%, 04/01/49 |
523,953 | 516,036 | ||||||
| 4.500%, 07/01/52 |
1,730,917 | 1,678,396 | ||||||
| 4.500%, 08/01/52 |
472,308 | 457,977 | ||||||
| 5.000%, 10/01/41 |
218,237 | 222,067 | ||||||
| 5.000%, 11/01/41 |
1,545,895 | 1,572,389 | ||||||
| 5.000%, 06/01/52 |
27,045 | 26,923 | ||||||
| 5.000%, 07/01/52 |
497,565 | 499,040 | ||||||
| 5.000%, 08/01/52 |
1,100,033 | 1,096,154 | ||||||
| 5.000%, 09/01/52 |
38,802 | 38,662 | ||||||
| 5.000%, 10/01/52 |
131,469 | 130,722 | ||||||
| 5.000%, 11/01/52 |
868,205 | 860,049 | ||||||
| 5.000%, 12/01/52 |
3,950,756 | 3,913,506 | ||||||
| 5.000%, 01/01/53 |
1,145,913 | 1,134,840 | ||||||
| 5.000%, 02/01/53 |
335,659 | 332,366 | ||||||
| 5.500%, 02/01/35 |
54,166 | 55,855 | ||||||
| 5.500%, 09/01/39 |
64,551 | 66,572 | ||||||
| 5.500%, 01/01/40 |
74,457 | 76,786 | ||||||
| 5.500%, 06/01/41 |
781,753 | 806,194 | ||||||
| 5.500%, 01/01/53 |
1,018,722 | 1,024,373 | ||||||
| 5.500%, 03/01/53 |
1,505,624 | 1,514,055 | ||||||
| 5.500%, 05/01/53 |
4,052,435 | 4,075,775 | ||||||
| 5.500%, 08/01/53 |
299,755 | 301,198 | ||||||
| 6.000%, 11/01/52 |
69,868 | 71,087 | ||||||
| 6.000%, 01/01/53 |
1,278,820 | 1,300,375 | ||||||
| 6.000%, 02/01/53 |
683,661 | 694,837 | ||||||
| 6.000%, 03/01/53 |
431,934 | 438,816 | ||||||
| 6.000%, 04/01/53 |
698,112 | 709,444 | ||||||
| 6.000%, 05/01/53 |
2,454,460 | 2,493,765 | ||||||
| 6.000%, 06/01/53 |
1,492,337 | 1,517,685 | ||||||
| 6.500%, 11/01/53 |
612,338 | 629,006 | ||||||
| Federal Home Loan Mortgage Corp. Multifamily Structured Pass-Through Certificates |
6,207,224 | 198,118 | ||||||
| 5.028%, 10/25/31 |
341,000 | 344,031 | ||||||
| Federal Home Loan Mortgage Corp. REMICS |
1,161,521 | 149,684 | ||||||
| 3.000%, 02/25/52 (b) |
627,431 | 97,037 | ||||||
| 3.500%, 03/25/51 (b) |
364,683 | 63,817 | ||||||
| 4.000%, 12/25/50 (b) |
234,477 | 47,123 | ||||||
| Federal Home Loan Mortgage Corp. STRIPS |
5,055,113 | 835,020 | ||||||
| Agency Sponsored Mortgage - Backed—(Continued) | ||||||||
| Federal National Mortgage Association | ||||||||
| 1.500%, 12/01/35 |
164,745 | 143,968 | ||||||
| 1.500%, 03/01/36 |
362,691 | 317,713 | ||||||
| 1.500%, 05/01/36 |
584,427 | 511,940 | ||||||
| 1.500%, 06/01/36 |
2,077,982 | 1,816,427 | ||||||
| 1.500%, 12/01/36 |
949,501 | 829,643 | ||||||
| 1.500%, 02/01/37 |
603,180 | 528,326 | ||||||
| 1.500%, 11/01/41 |
18,640,110 | 15,447,517 | ||||||
| 1.500%, 12/01/41 |
9,498,469 | 7,871,589 | ||||||
| 1.500%, 10/01/50 |
2,300,393 | 1,794,752 | ||||||
| 1.500%, 11/01/50 |
1,997,621 | 1,562,233 | ||||||
| 1.500%, 03/01/51 |
2,683,133 | 2,093,192 | ||||||
| 2.000%, 10/01/31 |
75,313 | 70,066 | ||||||
| 2.000%, 11/01/31 |
973,639 | 904,278 | ||||||
| 2.000%, 12/01/31 |
106,065 | 98,563 | ||||||
| 2.000%, 03/01/32 |
697,118 | 645,513 | ||||||
| 2.000%, 06/01/35 |
760,996 | 687,108 | ||||||
| 2.000%, 09/01/35 |
252,580 | 227,856 | ||||||
| 2.000%, 02/01/36 |
264,714 | 238,809 | ||||||
| 2.000%, 03/01/36 |
447,389 | 403,602 | ||||||
| 2.000%, 04/01/36 |
625,733 | 564,980 | ||||||
| 2.000%, 05/01/36 |
427,390 | 385,886 | ||||||
| 2.000%, 07/01/36 |
704,808 | 635,831 | ||||||
| 2.000%, 09/01/36 |
909,090 | 820,639 | ||||||
| 2.000%, 11/01/36 |
314,004 | 283,404 | ||||||
| 2.000%, 01/01/37 |
307,236 | 277,297 | ||||||
| 2.000%, 02/01/37 |
1,126,798 | 1,013,748 | ||||||
| 2.000%, 03/01/37 |
2,903,372 | 2,618,015 | ||||||
| 2.000%, 04/01/37 |
942,105 | 849,832 | ||||||
| 2.000%, 10/01/40 |
311,707 | 268,338 | ||||||
| 2.000%, 12/01/40 |
1,370,474 | 1,179,781 | ||||||
| 2.000%, 12/01/41 |
1,345,966 | 1,150,304 | ||||||
| 2.000%, 02/01/42 |
687,277 | 586,946 | ||||||
| 2.000%, 03/01/42 |
6,647,990 | 5,675,426 | ||||||
| 2.000%, 04/01/42 |
1,030,128 | 879,430 | ||||||
| 2.000%, 08/01/42 |
4,139,993 | 3,539,512 | ||||||
| 2.000%, 08/01/50 |
744,745 | 613,183 | ||||||
| 2.000%, 09/01/50 |
1,574,113 | 1,294,775 | ||||||
| 2.000%, 10/01/50 |
2,010,010 | 1,653,383 | ||||||
| 2.000%, 11/01/50 |
367,621 | 302,257 | ||||||
| 2.000%, 12/01/50 |
2,104,028 | 1,750,367 | ||||||
| 2.000%, 01/01/51 |
13,676,557 | 11,242,903 | ||||||
| 2.000%, 02/01/51 |
1,623,410 | 1,332,513 | ||||||
| 2.000%, 03/01/51 |
1,636,035 | 1,360,624 | ||||||
| 2.000%, 04/01/51 |
3,114,042 | 2,589,698 | ||||||
| 2.000%, 08/01/51 |
12,043,514 | 9,885,000 | ||||||
| 2.000%, 11/01/51 |
20,704,321 | 17,003,161 | ||||||
| 2.000%, 12/01/51 |
6,802,184 | 5,630,085 | ||||||
| 2.000%, 01/01/52 |
7,214,205 | 6,000,208 | ||||||
| 2.000%, 02/01/52 |
11,125,552 | 9,193,904 | ||||||
| 2.000%, 03/01/52 |
4,650,053 | 3,855,132 | ||||||
| 2.500%, 09/01/27 |
56,169 | 54,143 | ||||||
| 2.500%, 02/01/28 |
7,607 | 7,311 | ||||||
| 2.500%, 04/01/28 |
19,280 | 18,523 | ||||||
| 2.500%, 08/01/28 |
59,528 | 57,099 | ||||||
| 2.500%, 01/01/30 |
360,990 | 338,441 | ||||||
See accompanying notes to financial statements.
BHFTII-6
Brighthouse Funds Trust II
BlackRock Bond Income Portfolio
Schedule of Investments as of December 31, 2023
U.S. Treasury & Government Agencies—(Continued)
| Security Description | Principal Amount* |
Value | ||||||
| Agency Sponsored Mortgage - Backed—(Continued) | ||||||||
| Federal National Mortgage Association | ||||||||
| 2.500%, 02/01/30 |
35,686 | $ | 34,090 | |||||
| 2.500%, 03/01/30 |
67,640 | 64,208 | ||||||
| 2.500%, 07/01/30 |
219,838 | 207,796 | ||||||
| 2.500%, 08/01/30 |
761,337 | 722,208 | ||||||
| 2.500%, 09/01/30 |
482,106 | 456,542 | ||||||
| 2.500%, 11/01/30 |
900,643 | 852,752 | ||||||
| 2.500%, 03/01/31 |
37,301 | 35,848 | ||||||
| 2.500%, 06/01/31 |
278,062 | 262,421 | ||||||
| 2.500%, 07/01/31 |
150,561 | 142,256 | ||||||
| 2.500%, 08/01/31 |
21,555 | 20,352 | ||||||
| 2.500%, 10/01/31 |
1,325,311 | 1,251,286 | ||||||
| 2.500%, 11/01/31 |
827,079 | 780,888 | ||||||
| 2.500%, 02/01/32 |
39,744 | 37,495 | ||||||
| 2.500%, 03/01/32 |
150,502 | 141,412 | ||||||
| 2.500%, 08/01/32 |
904,380 | 852,080 | ||||||
| 2.500%, 02/01/33 |
1,607,709 | 1,522,119 | ||||||
| 2.500%, 07/01/50 |
8,694,225 | 7,526,915 | ||||||
| 2.500%, 08/01/50 |
6,309,358 | 5,457,746 | ||||||
| 2.500%, 11/01/50 |
2,198,886 | 1,916,842 | ||||||
| 2.500%, 01/01/51 |
431,713 | 372,854 | ||||||
| 2.500%, 09/01/51 |
5,412,750 | 4,651,707 | ||||||
| 2.500%, 11/01/51 |
8,379,171 | 7,166,923 | ||||||
| 2.500%, 01/01/52 |
28,843,673 | 24,826,889 | ||||||
| 2.500%, 02/01/52 |
6,021,420 | 5,188,757 | ||||||
| 3.000%, 04/01/28 |
44,809 | 42,816 | ||||||
| 3.000%, 05/01/28 |
52,784 | 51,067 | ||||||
| 3.000%, 10/01/28 |
105,135 | 101,604 | ||||||
| 3.000%, 11/01/28 |
737,013 | 712,400 | ||||||
| 3.000%, 12/01/28 |
181,344 | 173,193 | ||||||
| 3.000%, 01/01/29 |
97,509 | 93,115 | ||||||
| 3.000%, 04/01/29 |
352,069 | 334,514 | ||||||
| 3.000%, 05/01/29 |
534,190 | 507,941 | ||||||
| 3.000%, 08/01/29 |
517,166 | 491,820 | ||||||
| 3.000%, 10/01/29 |
146,482 | 141,121 | ||||||
| 3.000%, 03/01/30 |
315,534 | 303,932 | ||||||
| 3.000%, 04/01/30 |
263,338 | 253,520 | ||||||
| 3.000%, 05/01/30 |
407,553 | 392,351 | ||||||
| 3.000%, 07/01/30 |
311,458 | 298,823 | ||||||
| 3.000%, 08/01/30 |
1,341,708 | 1,288,966 | ||||||
| 3.000%, 09/01/30 |
365,781 | 351,639 | ||||||
| 3.000%, 08/01/31 |
1,206,407 | 1,156,010 | ||||||
| 3.000%, 09/01/31 |
167,649 | 161,167 | ||||||
| 3.000%, 03/01/32 |
299,508 | 286,007 | ||||||
| 3.000%, 10/01/36 |
42,253 | 39,327 | ||||||
| 3.000%, 11/01/36 |
472,133 | 439,429 | ||||||
| 3.000%, 12/01/36 |
758,628 | 706,174 | ||||||
| 3.000%, 03/01/43 |
4,157,585 | 3,812,588 | ||||||
| 3.000%, 04/01/43 |
2,344,961 | 2,155,162 | ||||||
| 3.000%, 05/01/43 |
1,196,314 | 1,099,486 | ||||||
| 3.000%, 06/01/43 |
40,670 | 37,311 | ||||||
| 3.000%, 06/01/46 |
24,776 | 22,610 | ||||||
| 3.000%, 08/01/46 |
32,579 | 29,800 | ||||||
| 3.000%, 11/01/46 |
1,376,983 | 1,251,570 | ||||||
| 3.000%, 02/01/47 |
341,461 | 310,382 | ||||||
| 3.000%, 03/01/47 |
1,412,228 | 1,279,629 | ||||||
| Agency Sponsored Mortgage - Backed—(Continued) | ||||||||
| Federal National Mortgage Association | ||||||||
| 3.000%, 03/01/50 |
498,762 | 449,609 | ||||||
| 3.000%, 08/01/50 |
1,968,907 | 1,762,714 | ||||||
| 3.000%, 11/01/51 |
2,416,255 | 2,151,201 | ||||||
| 3.000%, 12/01/51 |
1,067,602 | 954,715 | ||||||
| 3.000%, 04/01/52 |
350,738 | 314,223 | ||||||
| 3.000%, 05/01/52 |
550,925 | 491,230 | ||||||
| 3.500%, 08/01/28 |
90,039 | 86,850 | ||||||
| 3.500%, 10/01/28 |
798,567 | 770,596 | ||||||
| 3.500%, 11/01/28 |
763,689 | 736,144 | ||||||
| 3.500%, 02/01/29 |
1,033,911 | 998,642 | ||||||
| 3.500%, 04/01/29 |
180,350 | 173,753 | ||||||
| 3.500%, 05/01/29 |
712,733 | 687,640 | ||||||
| 3.500%, 07/01/29 |
289,375 | 279,289 | ||||||
| 3.500%, 09/01/29 |
61,135 | 58,929 | ||||||
| 3.500%, 08/01/30 |
209,555 | 204,266 | ||||||
| 3.500%, 11/01/32 |
89,740 | 87,238 | ||||||
| 3.500%, 01/01/33 |
51,571 | 50,630 | ||||||
| 3.500%, 01/01/42 |
209,668 | 198,749 | ||||||
| 3.500%, 04/01/42 |
138,734 | 131,237 | ||||||
| 3.500%, 05/01/42 |
13,519 | 12,770 | ||||||
| 3.500%, 06/01/42 |
36,019 | 34,077 | ||||||
| 3.500%, 07/01/42 |
46,772 | 44,152 | ||||||
| 3.500%, 02/01/45 |
1,418,573 | 1,340,120 | ||||||
| 3.500%, 05/01/47 |
655,501 | 615,181 | ||||||
| 3.500%, 11/01/47 |
452,563 | 422,359 | ||||||
| 3.500%, 12/01/47 |
454,014 | 423,443 | ||||||
| 3.500%, 01/01/48 |
1,334,954 | 1,250,548 | ||||||
| 3.500%, 02/01/48 |
208,459 | 194,546 | ||||||
| 3.500%, 03/01/48 |
1,162,613 | 1,085,017 | ||||||
| 3.500%, 04/01/48 |
785,218 | 739,999 | ||||||
| 3.500%, 06/01/49 |
7,713,332 | 7,186,569 | ||||||
| 3.500%, 01/01/51 |
18,319,428 | 16,992,254 | ||||||
| 4.000%, 08/01/33 |
316,606 | 311,124 | ||||||
| 4.000%, 10/01/33 |
2,170,964 | 2,149,978 | ||||||
| 4.000%, 01/01/41 |
90,672 | 87,416 | ||||||
| 4.000%, 01/01/42 |
407,818 | 396,696 | ||||||
| 4.000%, 02/01/42 |
724,748 | 701,041 | ||||||
| 4.000%, 05/01/42 |
128,339 | 124,839 | ||||||
| 4.000%, 12/01/44 |
253,246 | 246,339 | ||||||
| 4.000%, 08/01/45 |
106,338 | 102,726 | ||||||
| 4.000%, 11/01/46 |
143,059 | 137,918 | ||||||
| 4.000%, 04/01/47 |
36,765 | 35,444 | ||||||
| 4.000%, 06/01/47 |
459,829 | 444,946 | ||||||
| 4.000%, 07/01/47 |
969,863 | 932,328 | ||||||
| 4.000%, 08/01/47 |
301,526 | 290,658 | ||||||
| 4.000%, 09/01/47 |
662,890 | 637,323 | ||||||
| 4.000%, 10/01/47 |
601,346 | 577,635 | ||||||
| 4.000%, 01/01/48 |
1,927,570 | 1,856,138 | ||||||
| 4.000%, 04/01/48 |
46,214 | 44,501 | ||||||
| 4.000%, 05/01/48 |
52,698 | 50,542 | ||||||
| 4.000%, 06/01/48 |
38,721 | 37,139 | ||||||
| 4.000%, 07/01/48 |
226,426 | 217,960 | ||||||
| 4.000%, 08/01/48 |
607,544 | 585,422 | ||||||
| 4.000%, 09/01/48 |
254,074 | 244,293 | ||||||
| 4.000%, 10/01/48 |
1,085,186 | 1,044,458 | ||||||
See accompanying notes to financial statements.
BHFTII-7
Brighthouse Funds Trust II
BlackRock Bond Income Portfolio
Schedule of Investments as of December 31, 2023
U.S. Treasury & Government Agencies—(Continued)
| Security Description | Principal Amount* |
Value | ||||||
| Agency Sponsored Mortgage - Backed—(Continued) | ||||||||
| Federal National Mortgage Association | ||||||||
| 4.000%, 05/01/49 |
2,012,458 | $ | 1,940,140 | |||||
| 4.000%, 09/01/49 |
1,012,379 | 968,249 | ||||||
| 4.000%, 03/01/50 |
2,422,935 | 2,324,392 | ||||||
| 4.000%, 04/01/50 |
240,439 | 230,264 | ||||||
| 4.000%, 05/01/50 |
940,368 | 903,205 | ||||||
| 4.000%, 06/01/50 |
575,568 | 550,244 | ||||||
| 4.000%, 08/01/50 |
632,273 | 608,987 | ||||||
| 4.000%, 11/01/50 |
541,397 | 521,636 | ||||||
| 4.000%, 01/01/51 |
3,082,462 | 2,953,341 | ||||||
| 4.000%, 03/01/51 |
2,452,317 | 2,355,716 | ||||||
| 4.000%, 05/01/51 |
10,922,506 | 10,465,968 | ||||||
| 4.000%, 08/01/51 |
1,654,393 | 1,592,536 | ||||||
| 4.000%, 10/01/51 |
6,059,808 | 5,800,742 | ||||||
| 4.000%, 04/01/52 |
1,191,823 | 1,138,322 | ||||||
| 4.000%, 05/01/52 |
5,751,464 | 5,533,618 | ||||||
| 4.500%, 02/01/25 |
8,931 | 8,882 | ||||||
| 4.500%, 04/01/25 |
4,127 | 4,104 | ||||||
| 4.500%, 07/01/25 |
6,561 | 6,524 | ||||||
| 4.500%, 06/01/26 |
88,400 | 87,910 | ||||||
| 4.500%, 08/01/39 |
354,396 | 353,679 | ||||||
| 4.500%, 11/01/39 |
309,500 | 309,101 | ||||||
| 4.500%, 01/01/40 |
13,173 | 13,156 | ||||||
| 4.500%, 04/01/40 |
25,987 | 25,953 | ||||||
| 4.500%, 05/01/40 |
63,683 | 63,601 | ||||||
| 4.500%, 06/01/40 |
63,439 | 63,357 | ||||||
| 4.500%, 07/01/40 |
132,581 | 132,410 | ||||||
| 4.500%, 11/01/40 |
262,224 | 261,886 | ||||||
| 4.500%, 07/01/41 |
56,182 | 56,109 | ||||||
| 4.500%, 09/01/41 |
233,153 | 232,852 | ||||||
| 4.500%, 10/01/41 |
67,628 | 67,541 | ||||||
| 4.500%, 01/01/42 |
54,134 | 54,064 | ||||||
| 4.500%, 08/01/42 |
311,514 | 311,112 | ||||||
| 4.500%, 09/01/43 |
245,309 | 242,327 | ||||||
| 4.500%, 10/01/43 |
557,813 | 551,102 | ||||||
| 4.500%, 11/01/43 |
1,297,714 | 1,282,166 | ||||||
| 4.500%, 12/01/43 |
537,345 | 533,335 | ||||||
| 4.500%, 01/01/44 |
478,290 | 474,813 | ||||||
| 4.500%, 06/01/44 |
1,820,373 | 1,806,787 | ||||||
| 4.500%, 07/01/45 |
513,330 | 509,500 | ||||||
| 4.500%, 09/01/45 |
259,733 | 257,795 | ||||||
| 4.500%, 11/01/45 |
947,669 | 940,587 | ||||||
| 4.500%, 12/01/45 |
350,880 | 348,261 | ||||||
| 4.500%, 07/01/46 |
1,690,124 | 1,677,880 | ||||||
| 4.500%, 09/01/46 |
298,060 | 295,836 | ||||||
| 4.500%, 09/01/47 |
27,719 | 27,441 | ||||||
| 4.500%, 10/01/47 |
206,270 | 202,838 | ||||||
| 4.500%, 11/01/47 |
1,067,724 | 1,056,179 | ||||||
| 4.500%, 12/01/47 |
36,493 | 35,998 | ||||||
| 4.500%, 01/01/48 |
1,039,666 | 1,027,409 | ||||||
| 4.500%, 02/01/48 |
53,554 | 52,933 | ||||||
| 4.500%, 03/01/48 |
97,853 | 96,633 | ||||||
| 4.500%, 04/01/48 |
557,010 | 552,974 | ||||||
| 4.500%, 05/01/48 |
5,034,302 | 4,978,926 | ||||||
| 4.500%, 07/01/48 |
73,902 | 73,061 | ||||||
| 4.500%, 08/01/48 |
1,064,358 | 1,052,685 | ||||||
| Agency Sponsored Mortgage - Backed—(Continued) | ||||||||
| Federal National Mortgage Association | ||||||||
| 4.500%, 11/01/48 |
641,628 | 632,609 | ||||||
| 4.500%, 02/01/49 |
5,610,985 | 5,570,327 | ||||||
| 4.500%, 05/01/49 |
5,109,915 | 5,068,106 | ||||||
| 4.500%, 07/01/52 |
256,708 | 248,919 | ||||||
| 5.000%, 11/01/32 |
1,790 | 1,819 | ||||||
| 5.000%, 09/01/35 |
69,316 | 70,433 | ||||||
| 5.000%, 06/01/39 |
2,966,311 | 3,014,146 | ||||||
| 5.000%, 04/01/41 |
4,990 | 5,000 | ||||||
| 5.000%, 07/01/41 |
97,139 | 98,595 | ||||||
| 5.000%, 08/01/41 |
77,546 | 78,803 | ||||||
| 5.000%, 01/01/42 |
43,499 | 44,150 | ||||||
| 5.000%, 07/01/52 |
1,032,971 | 1,033,854 | ||||||
| 5.000%, 12/01/52 |
442,509 | 438,148 | ||||||
| 5.000%, 01/01/53 |
3,606,196 | 3,571,230 | ||||||
| 5.500%, 11/01/32 |
301,164 | 309,968 | ||||||
| 5.500%, 12/01/32 |
54,471 | 56,090 | ||||||
| 5.500%, 01/01/33 |
206,968 | 213,120 | ||||||
| 5.500%, 12/01/33 |
76,003 | 78,263 | ||||||
| 5.500%, 05/01/34 |
638,760 | 657,772 | ||||||
| 5.500%, 08/01/37 |
669,125 | 689,050 | ||||||
| 5.500%, 02/01/38 |
133,449 | 137,433 | ||||||
| 5.500%, 03/01/38 |
64,452 | 66,377 | ||||||
| 5.500%, 06/01/38 |
42,033 | 42,854 | ||||||
| 5.500%, 12/01/38 |
75,239 | 77,097 | ||||||
| 5.500%, 01/01/39 |
123,381 | 127,059 | ||||||
| 5.500%, 08/01/39 |
87,566 | 90,181 | ||||||
| 5.500%, 12/01/39 |
173,097 | 178,270 | ||||||
| 5.500%, 04/01/40 |
15,463 | 15,925 | ||||||
| 5.500%, 04/01/41 |
96,704 | 99,596 | ||||||
| 5.500%, 01/01/53 |
979,692 | 985,911 | ||||||
| 5.500%, 05/01/53 |
4,958,697 | 4,985,128 | ||||||
| 5.500%, 06/01/53 |
1,431,477 | 1,439,254 | ||||||
| 6.000%, 02/01/34 |
75,387 | 78,329 | ||||||
| 6.000%, 08/01/34 |
55,370 | 57,675 | ||||||
| 6.000%, 04/01/35 |
876,723 | 909,968 | ||||||
| 6.000%, 06/01/36 |
107,735 | 112,536 | ||||||
| 6.000%, 02/01/38 |
139,646 | 145,805 | ||||||
| 6.000%, 03/01/38 |
66,922 | 69,899 | ||||||
| 6.000%, 05/01/38 |
181,116 | 189,150 | ||||||
| 6.000%, 10/01/38 |
214,487 | 224,024 | ||||||
| 6.000%, 12/01/38 |
77,941 | 81,419 | ||||||
| 6.000%, 04/01/40 |
706,407 | 737,744 | ||||||
| 6.000%, 09/01/40 |
76,928 | 80,243 | ||||||
| 6.000%, 06/01/41 |
175,711 | 183,549 | ||||||
| 6.000%, 11/01/52 |
75,748 | 76,912 | ||||||
| 6.000%, 01/01/53 |
1,759,083 | 1,788,011 | ||||||
| 6.000%, 04/01/53 |
454,240 | 461,955 | ||||||
| 6.000%, 05/01/53 |
2,177,434 | 2,214,522 | ||||||
| 6.000%, 07/01/53 |
2,373,896 | 2,414,217 | ||||||
| 6.000%, 08/01/53 |
4,450,891 | 4,519,971 | ||||||
| 6.500%, 05/01/40 |
1,032,641 | 1,079,061 | ||||||
| 6.500%, 08/01/53 |
1,980,155 | 2,034,052 | ||||||
| 6.500%, 10/01/53 |
1,495,383 | 1,536,085 | ||||||
| Federal National Mortgage Association Interest STRIPS | ||||||||
| 3.000%, 03/25/50 (b) |
2,045,136 | 349,239 | ||||||
See accompanying notes to financial statements.
BHFTII-8
Brighthouse Funds Trust II
BlackRock Bond Income Portfolio
Schedule of Investments as of December 31, 2023
U.S. Treasury & Government Agencies—(Continued)
| Security Description | Principal Amount* |
Value | ||||||
| Agency Sponsored Mortgage - Backed—(Continued) | ||||||||
| Federal National Mortgage Association Interest STRIPS | ||||||||
| 3.000%, 07/25/52 (b) |
2,823,030 | $ | 459,450 | |||||
| 3.500%, 08/25/49 (b) |
622,841 | 110,453 | ||||||
| Federal National Mortgage Association REMICS |
2,232,700 | 359,824 | ||||||
| 3.500%, 02/25/51 (b) |
560,050 | 97,681 | ||||||
| 4.000%, 06/25/51 (b) |
631,064 | 122,552 | ||||||
| 5.000%, 04/25/35 |
372 | 370 | ||||||
| FREMF Mortgage Trust |
25,179,074 | 93,784 | ||||||
| 4.232%, 08/25/50 (144A) (a) |
304,000 | 290,327 | ||||||
| Government National Mortgage Association | ||||||||
| 0.921%, 02/16/50 (a) (b) |
92,656 | 1,608 | ||||||
| 2.000%, 08/20/50 |
6,820,899 | 5,775,576 | ||||||
| 2.000%, 11/20/50 |
875,234 | 741,110 | ||||||
| 2.000%, 01/20/51 |
10,225,625 | 8,662,248 | ||||||
| 2.000%, 02/20/51 |
765,117 | 648,029 | ||||||
| 2.500%, 04/20/51 |
5,954,717 | 5,212,417 | ||||||
| 2.500%, 10/20/51 |
3,527,968 | 3,085,104 | ||||||
| 2.500%, 12/20/51 |
2,410,084 | 2,107,523 | ||||||
| 2.500%, 05/20/52 |
4,950,947 | 4,327,978 | ||||||
| 2.500%, 06/20/52 |
3,865,472 | 3,379,121 | ||||||
| 2.500%, 07/20/52 |
2,641,399 | 2,309,921 | ||||||
| 2.500%, 12/20/52 |
436,041 | 381,389 | ||||||
| 2.500%, 01/20/53 |
1,853,452 | 1,620,325 | ||||||
| 3.000%, 12/20/44 |
36,791 | 33,903 | ||||||
| 3.000%, 02/15/45 |
420,132 | 384,609 | ||||||
| 3.000%, 09/20/47 |
745,125 | 682,796 | ||||||
| 3.000%, 03/20/49 |
18,104 | 16,556 | ||||||
| 3.000%, 05/20/50 |
293,006 | 266,865 | ||||||
| 3.000%, 01/20/51 |
20,843,594 | 18,975,929 | ||||||
| 3.500%, 01/15/42 |
122,092 | 115,321 | ||||||
| 3.500%, 02/15/42 |
61,773 | 58,346 | ||||||
| 3.500%, 04/15/42 |
159,378 | 150,537 | ||||||
| 3.500%, 05/15/42 |
176,907 | 167,102 | ||||||
| 3.500%, 08/15/42 |
178,899 | 168,975 | ||||||
| 3.500%, 11/15/42 |
54,719 | 51,683 | ||||||
| 3.500%, 12/15/42 |
516,644 | 487,983 | ||||||
| 3.500%, 01/15/43 |
136,779 | 129,225 | ||||||
| 3.500%, 02/15/43 |
293,157 | 276,925 | ||||||
| 3.500%, 03/15/43 |
222,776 | 210,419 | ||||||
| 3.500%, 04/15/43 |
703,844 | 664,794 | ||||||
| 3.500%, 04/20/43 |
681,422 | 647,222 | ||||||
| 3.500%, 05/15/43 |
1,010,001 | 953,955 | ||||||
| 3.500%, 05/20/43 |
374,089 | 355,353 | ||||||
| 3.500%, 06/15/43 |
296,771 | 280,306 | ||||||
| 3.500%, 07/15/43 |
830,900 | 784,829 | ||||||
| 3.500%, 07/20/43 |
28,929 | 27,483 | ||||||
| 3.500%, 02/20/44 |
730,150 | 692,727 | ||||||
| 3.500%, 03/20/45 |
26,107 | 24,641 | ||||||
| 3.500%, 04/20/45 |
38,885 | 36,760 | ||||||
| 3.500%, 05/20/45 |
158,948 | 150,059 | ||||||
| 3.500%, 07/20/45 |
28,623 | 26,993 | ||||||
| 3.500%, 08/20/45 |
38,518 | 36,361 | ||||||
| 3.500%, 10/20/45 |
72,944 | 68,785 | ||||||
| 3.500%, 11/20/45 |
26,919 | 25,383 | ||||||
| Agency Sponsored Mortgage - Backed—(Continued) | ||||||||
| Government National Mortgage Association | ||||||||
| 3.500%, 12/20/45 |
405,824 | 382,658 | ||||||
| 3.500%, 01/20/46 |
81,355 | 76,841 | ||||||
| 3.500%, 05/20/46 |
336,894 | 317,636 | ||||||
| 3.500%, 09/20/46 |
127,857 | 120,303 | ||||||
| 3.500%, 10/20/46 |
793,308 | 747,007 | ||||||
| 3.500%, 03/20/48 |
31,225 | 29,395 | ||||||
| 3.500%, 04/20/48 |
12,707 | 11,962 | ||||||
| 4.000%, 04/20/39 |
14,112 | 13,833 | ||||||
| 4.000%, 07/20/39 |
103,760 | 101,704 | ||||||
| 4.000%, 09/20/40 |
26,842 | 26,310 | ||||||
| 4.000%, 10/20/40 |
311,109 | 304,936 | ||||||
| 4.000%, 11/20/40 |
173,017 | 169,585 | ||||||
| 4.000%, 12/20/40 |
661,777 | 648,646 | ||||||
| 4.000%, 01/20/41 |
590,356 | 578,642 | ||||||
| 4.000%, 02/20/41 |
10,435 | 10,228 | ||||||
| 4.000%, 03/15/41 |
243,077 | 237,129 | ||||||
| 4.000%, 12/15/41 |
21,789 | 21,256 | ||||||
| 4.000%, 07/20/43 |
62,623 | 61,263 | ||||||
| 4.000%, 08/20/44 |
232,291 | 226,011 | ||||||
| 4.000%, 10/20/46 |
36,796 | 35,485 | ||||||
| 4.000%, 05/20/47 |
155,531 | 150,333 | ||||||
| 4.000%, 06/20/47 |
399,437 | 385,058 | ||||||
| 4.000%, 11/20/47 |
459,875 | 443,932 | ||||||
| 4.000%, 12/20/47 |
227,297 | 219,039 | ||||||
| 4.000%, 05/20/50 |
457,608 | 441,176 | ||||||
| 4.500%, 12/20/39 |
23,955 | 23,980 | ||||||
| 4.500%, 01/20/40 |
28,978 | 29,004 | ||||||
| 4.500%, 02/20/40 |
23,914 | 23,936 | ||||||
| 4.500%, 05/20/40 |
1,502 | 1,503 | ||||||
| 4.500%, 02/15/42 |
2,871,745 | 2,852,248 | ||||||
| 4.500%, 03/15/47 |
68,808 | 67,886 | ||||||
| 4.500%, 04/15/47 |
141,235 | 139,440 | ||||||
| 4.500%, 05/15/47 |
50,105 | 49,663 | ||||||
| 4.500%, 09/20/48 |
230,677 | 227,708 | ||||||
| 4.500%, 03/20/49 |
932,057 | 920,814 | ||||||
| 4.500%, 04/20/49 |
201,814 | 199,367 | ||||||
| 4.500%, 05/20/49 |
793,130 | 782,181 | ||||||
| 4.500%, 04/20/50 |
22,607 | 22,060 | ||||||
| 5.000%, 10/20/33 |
275,603 | 281,000 | ||||||
| 5.000%, 12/15/38 |
95,152 | 96,117 | ||||||
| 5.000%, 07/15/39 |
155,505 | 156,890 | ||||||
| 5.000%, 10/15/39 |
115,238 | 116,049 | ||||||
| 5.000%, 10/20/39 |
87,096 | 88,521 | ||||||
| 5.000%, 09/15/40 |
7,203 | 7,237 | ||||||
| 5.000%, 12/15/40 |
313,069 | 316,022 | ||||||
| 5.000%, 07/20/42 |
123,217 | 125,045 | ||||||
| 5.500%, 04/15/33 |
8,899 | 8,995 | ||||||
| 6.500%, 04/15/33 |
29,518 | 31,243 | ||||||
| Government National Mortgage Association REMICS |
1,566,783 | 237,878 | ||||||
| 3.000%, 02/20/51 (b) |
1,340,889 | 204,255 | ||||||
| 3.000%, 05/20/51 (b) |
4,621,041 | 696,459 | ||||||
| 3.000%, 08/20/51 (b) |
1,339,154 | 206,347 | ||||||
| Government National Mortgage Association, TBA | ||||||||
| 2.000%, TBA (c) |
18,782,300 | 15,901,124 | ||||||
See accompanying notes to financial statements.
BHFTII-9
Brighthouse Funds Trust II
BlackRock Bond Income Portfolio
Schedule of Investments as of December 31, 2023
U.S. Treasury & Government Agencies—(Continued)
| Security Description | Principal Amount* |
Value | ||||||
| Agency Sponsored Mortgage - Backed—(Continued) | ||||||||
| Government National Mortgage Association, TBA | ||||||||
| 2.500%, TBA (c) |
12,408,369 | $ | 10,853,476 | |||||
| 3.000%, TBA (c) |
6,010,470 | 5,441,339 | ||||||
| 3.500%, TBA (c) |
11,989,496 | 11,165,218 | ||||||
| 4.000%, TBA (c) |
10,055,500 | 9,599,885 | ||||||
| 4.500%, TBA (c) |
6,883,000 | 6,717,395 | ||||||
| 5.000%, TBA (c) |
10,155,000 | 10,083,610 | ||||||
| 5.500%, TBA (c) |
9,174,000 | 9,239,961 | ||||||
| 6.000%, TBA (c) |
6,823,000 | 6,937,339 | ||||||
| 6.500%, TBA (c) |
4,864,000 | 4,978,950 | ||||||
| Seasoned Credit Risk Transfer Trust |
782,404 | 90,335 | ||||||
| 0.635%, 07/25/56 (144A) (a) (b) |
944,696 | 96,579 | ||||||
| 3.074%, 05/25/57 (a) |
158,619 | 57,405 | ||||||
| Seasoned Loans Structured Transaction Trust |
2,150,729 | 2,057,993 | ||||||
| Uniform Mortgage-Backed Security, TBA |
15,965,469 | 13,386,679 | ||||||
| 3.000%, TBA (c) |
6,589,974 | 5,793,462 | ||||||
| 3.500%, TBA (c) |
26,832,006 | 24,515,069 | ||||||
| 4.500%, TBA (c) |
41,364,600 | 40,148,888 | ||||||
| 5.000%, TBA (c) |
38,871,629 | 38,455,581 | ||||||
| 5.500%, TBA (c) |
90,610,216 | 90,992,478 | ||||||
| 6.500%, TBA (c) |
6,604,800 | 6,768,114 | ||||||
|
|
|
|||||||
| 1,004,402,719 | ||||||||
|
|
|
|||||||
| U.S. Treasury—24.2% | ||||||||
| U.S. Treasury Bonds |
10,822,000 | 6,974,272 | ||||||
| 1.125%, 08/15/40 |
10,822,000 | 6,907,480 | ||||||
| 1.375%, 11/15/40 |
10,822,000 | 7,180,143 | ||||||
| 1.375%, 08/15/50 |
9,651,000 | 5,377,794 | ||||||
| 1.625%, 11/15/50 |
7,108,000 | 4,234,813 | ||||||
| 1.875%, 11/15/51 |
6,799,000 | 4,298,243 | ||||||
| 2.250%, 08/15/49 |
8,941,000 | 6,242,634 | ||||||
| 2.375%, 05/15/51 |
11,094,500 | 7,916,966 | ||||||
| 2.500%, 02/15/45 |
20,100,000 | 15,220,254 | ||||||
| 2.750%, 11/15/47 |
20,100,000 | 15,645,024 | ||||||
| 2.875%, 05/15/43 |
3,865,000 | 3,172,772 | ||||||
| 2.875%, 11/15/46 |
3,706,000 | 2,967,551 | ||||||
| 3.000%, 05/15/47 |
7,399,700 | 6,043,763 | ||||||
| 3.000%, 02/15/48 (d) (e) |
23,806,000 | 19,399,100 | ||||||
| 3.000%, 02/15/49 (d) (e) |
27,047,500 | 22,008,847 | ||||||
| 3.000%, 08/15/52 |
16,709,800 | 13,664,831 | ||||||
| 3.125%, 02/15/43 |
3,865,000 | 3,303,669 | ||||||
| 3.125%, 08/15/44 |
7,210,100 | 6,105,208 | ||||||
| 3.625%, 08/15/43 |
10,664,000 | 9,803,798 | ||||||
| 3.625%, 02/15/53 |
7,334,000 | 6,772,491 | ||||||
| 3.625%, 05/15/53 |
8,889,500 | 8,218,621 | ||||||
| 3.750%, 11/15/43 |
10,664,000 | 9,965,841 | ||||||
| 3.875%, 02/15/43 |
4,892,500 | 4,664,693 | ||||||
| 4.000%, 11/15/42 |
6,181,700 | 6,007,598 | ||||||
| 4.000%, 11/15/52 |
6,799,000 | 6,708,170 | ||||||
| 4.250%, 05/15/39 |
1,010,000 | 1,040,379 | ||||||
| 4.375%, 11/15/39 |
1,010,000 | 1,052,096 | ||||||
| U.S. Treasury—(Continued) | ||||||||
| U.S. Treasury Bonds |
7,210,800 | 7,487,120 | ||||||
| 4.375%, 05/15/41 |
2,090,500 | 2,154,848 | ||||||
| 4.500%, 08/15/39 |
15,430,200 | 16,328,286 | ||||||
| 4.750%, 02/15/41 |
2,090,500 | 2,260,108 | ||||||
| U.S. Treasury Inflation-Indexed Bond |
3,446,750 | 3,121,056 | ||||||
| U.S. Treasury Inflation-Indexed Note |
33,258,760 | 32,241,637 | ||||||
| U.S. Treasury Notes |
6,272,000 | 5,891,025 | ||||||
| 0.375%, 09/30/27 |
7,108,000 | 6,234,216 | ||||||
| 0.500%, 02/28/26 |
14,020,400 | 12,956,273 | ||||||
| 0.500%, 05/31/27 |
15,364,000 | 13,679,961 | ||||||
| 0.500%, 08/31/27 |
19,598,300 | 17,315,404 | ||||||
| 0.625%, 07/31/26 |
4,181,000 | 3,829,698 | ||||||
| 0.750%, 05/31/26 |
12,344,000 | 11,394,573 | ||||||
| 0.875%, 06/30/26 |
13,598,000 | 12,574,432 | ||||||
| 1.250%, 08/15/31 |
28,432,000 | 23,526,369 | ||||||
| 1.500%, 10/31/24 |
374,600 | 364,445 | ||||||
| 1.500%, 02/15/25 |
6,900,000 | 6,658,770 | ||||||
| 1.500%, 08/15/26 |
10,766,000 | 10,076,303 | ||||||
| 1.500%, 02/15/30 |
5,471,000 | 4,766,395 | ||||||
| 1.625%, 11/30/26 |
23,362,000 | 21,834,344 | ||||||
| 1.625%, 05/15/31 |
16,205,000 | 13,900,219 | ||||||
| 1.750%, 07/31/24 |
3,357,000 | 3,293,663 | ||||||
| 1.750%, 12/31/24 |
41,246,000 | 40,028,666 | ||||||
| 2.000%, 02/15/25 |
9,276,000 | 9,003,155 | ||||||
| 2.125%, 07/31/24 |
7,432,000 | 7,306,585 | ||||||
| 2.125%, 05/15/25 |
8,178,000 | 7,917,007 | ||||||
| 2.375%, 05/15/29 |
5,471,000 | 5,070,933 | ||||||
| 2.625%, 04/15/25 |
14,421,500 | 14,068,286 | ||||||
| 2.625%, 02/15/29 |
5,471,000 | 5,150,861 | ||||||
| 2.750%, 08/15/32 (e) |
40,818,000 | 37,380,359 | ||||||
| 2.875%, 06/15/25 |
6,900,000 | 6,743,672 | ||||||
| 2.875%, 05/15/32 |
1,745,500 | 1,617,451 | ||||||
| 3.125%, 11/15/28 |
4,225,000 | 4,081,416 | ||||||
| 3.750%, 05/31/30 |
6,900,000 | 6,838,816 | ||||||
| 3.875%, 11/30/27 |
6,857,000 | 6,842,536 | ||||||
| 3.875%, 09/30/29 |
9,774,200 | 9,754,346 | ||||||
| 3.875%, 12/31/29 |
24,904,000 | 24,860,223 | ||||||
| 4.000%, 12/15/25 |
15,949,000 | 15,863,648 | ||||||
| 4.125%, 08/31/30 |
16,560,300 | 16,767,951 | ||||||
| 4.500%, 11/15/33 |
17,740,000 | 18,624,228 | ||||||
|
|
|
|||||||
| 680,706,335 | ||||||||
|
|
|
|||||||
| Total U.S. Treasury & Government Agencies |
1,685,109,054 | |||||||
|
|
|
|||||||
| Corporate Bonds & Notes—26.3% |
| |||||||
| Aerospace/Defense—1.0% | ||||||||
| BAE Systems PLC |
3,925,000 | 3,621,661 | ||||||
| Boeing Co. |
399,000 | 295,683 | ||||||
See accompanying notes to financial statements.
BHFTII-10
Brighthouse Funds Trust II
BlackRock Bond Income Portfolio
Schedule of Investments as of December 31, 2023
Corporate Bonds & Notes—(Continued)
| Security Description | Principal Amount* |
Value | ||||||
| Aerospace/Defense—(Continued) | ||||||||
| Boeing Co. |
1,132,000 | $ | 866,057 | |||||
| 5.930%, 05/01/60 |
1,260,000 | 1,304,717 | ||||||
| L3Harris Technologies, Inc. | ||||||||
| 1.800%, 01/15/31 |
1,612,000 | 1,324,012 | ||||||
| 2.900%, 12/15/29 |
1,061,000 | 958,771 | ||||||
| 3.850%, 12/15/26 |
1,477,000 | 1,447,651 | ||||||
| 4.400%, 06/15/28 |
1,058,000 | 1,045,742 | ||||||
| 5.400%, 07/31/33 (g) |
2,000,000 | 2,079,488 | ||||||
| Lockheed Martin Corp. |
1,906,000 | 1,745,286 | ||||||
| 4.450%, 05/15/28 |
936,000 | 940,960 | ||||||
| 4.500%, 05/15/36 |
287,000 | 283,946 | ||||||
| Northrop Grumman Corp. |
1,304,000 | 1,315,077 | ||||||
| 4.950%, 03/15/53 |
1,202,000 | 1,190,520 | ||||||
| RTX Corp. |
3,741,000 | 2,473,124 | ||||||
| 4.125%, 11/16/28 |
2,648,000 | 2,587,028 | ||||||
| 4.200%, 12/15/44 |
425,000 | 345,665 | ||||||
| 5.150%, 02/27/33 |
1,057,000 | 1,077,236 | ||||||
| 6.100%, 03/15/34 |
1,780,000 | 1,931,736 | ||||||
| 7.000%, 11/01/28 |
805,000 | 869,538 | ||||||
|
|
|
|||||||
| 27,703,898 | ||||||||
|
|
|
|||||||
| Agriculture—0.5% | ||||||||
| Altria Group, Inc. |
683,000 | 556,966 | ||||||
| 4.250%, 08/09/42 |
1,627,000 | 1,321,485 | ||||||
| 4.500%, 05/02/43 |
691,000 | 576,265 | ||||||
| 4.800%, 02/14/29 |
1,622,000 | 1,616,818 | ||||||
| 6.200%, 11/01/28 |
260,000 | 272,675 | ||||||
| 6.875%, 11/01/33 |
2,009,000 | 2,211,292 | ||||||
| BAT Capital Corp. |
1,151,000 | 912,276 | ||||||
| 7.081%, 08/02/53 |
2,521,000 | 2,695,092 | ||||||
| Frigorifico Concepcion SA |
220,000 | 185,735 | ||||||
| Philip Morris International, Inc. |
713,000 | 725,703 | ||||||
| Reynolds American, Inc. |
1,988,000 | 1,860,880 | ||||||
|
|
|
|||||||
| 12,935,187 | ||||||||
|
|
|
|||||||
| Airlines—0.2% | ||||||||
| ABRA Global Finance |
355,919 | 267,232 | ||||||
| Air Canada Pass-Through Trust |
5,106 | 4,832 | ||||||
| Allegiant Travel Co. |
175,000 | 171,227 | ||||||
| American Airlines Pass-Through Trust |
871,713 | 762,092 | ||||||
| Avianca Midco 2 PLC |
211,534 | 185,759 | ||||||
| Airlines—(Continued) | ||||||||
| Azul Secured Finance LLP |
395,000 | 408,498 | ||||||
| Delta Air Lines Pass-Through Trust |
2,258,000 | 2,239,801 | ||||||
| Turkish Airlines Pass-Through Trust |
608,413 | 565,649 | ||||||
| United Airlines Pass-Through Trust |
15,002 | 12,686 | ||||||
| 2.875%, 04/07/30 |
366,624 | 327,572 | ||||||
| 3.100%, 01/07/30 |
11,618 | 10,591 | ||||||
| 3.650%, 04/07/27 |
41,319 | 38,821 | ||||||
| 4.000%, 10/11/27 |
160,517 | 153,304 | ||||||
| 4.875%, 07/15/27 |
386,080 | 373,969 | ||||||
|
|
|
|||||||
| 5,522,033 | ||||||||
|
|
|
|||||||
| Apparel—0.0% | ||||||||
| Tapestry, Inc. |
455,000 | 485,431 | ||||||
| William Carter Co. |
21,000 | 20,738 | ||||||
|
|
|
|||||||
| 506,169 | ||||||||
|
|
|
|||||||
| Auto Manufacturers—0.1% | ||||||||
| Ford Motor Co. |
105,000 | 87,329 | ||||||
| Ford Motor Credit Co. LLC |
1,588,000 | 1,710,967 | ||||||
|
|
|
|||||||
| 1,798,296 | ||||||||
|
|
|
|||||||
| Auto Parts & Equipment—0.0% | ||||||||
| Dana, Inc. |
73,000 | 64,702 | ||||||
| Metalsa Sapi de CV |
209,000 | 171,961 | ||||||
| Tenneco, Inc. |
410,000 | 350,038 | ||||||
| Tupy Overseas SA |
209,000 | 179,745 | ||||||
|
|
|
|||||||
| 766,446 | ||||||||
|
|
|
|||||||
| Banks—6.8% | ||||||||
| Bangkok Bank PCL |
200,000 | 205,299 | ||||||
| Bank of America Corp. |
884,000 | 732,899 | ||||||
| 3.419%, 3M TSFR + 1.302%, 12/20/28 (a) |
2,350,000 | 2,213,533 | ||||||
| 3.970%, 3M TSFR + 1.332%, 03/05/29 (a) |
932,000 | 890,165 | ||||||
| 4.571%, SOFR + 1.830%, 04/27/33 (a) |
3,448,000 | 3,286,570 | ||||||
| 5.288%, SOFR + 1.910%, 04/25/34 (a) |
881,000 | 883,027 | ||||||
| 5.819%, SOFR + 1.570%, 09/15/29 (a) |
7,387,000 | 7,625,407 | ||||||
| 5.872%, SOFR + 1.840%, 09/15/34 (a) (g) |
5,438,000 | 5,692,336 | ||||||
| Barclays PLC |
2,047,000 | 2,126,321 | ||||||
See accompanying notes to financial statements.
BHFTII-11
Brighthouse Funds Trust II
BlackRock Bond Income Portfolio
Schedule of Investments as of December 31, 2023
Corporate Bonds & Notes—(Continued)
| Security Description | Principal Amount* |
Value | ||||||
| Banks—(Continued) | ||||||||
| Citigroup, Inc. | ||||||||
| 1.462%, SOFR + 0.770%, 06/09/27 (a) |
778,000 | $ | 711,980 | |||||
| 3.057%, SOFR + 1.351%, 01/25/33 (a) |
3,822,000 | 3,260,861 | ||||||
| 3.070%, SOFR + 1.280%, 02/24/28 (a) |
1,531,000 | 1,442,627 | ||||||
| 3.520%, 3M TSFR + 1.413%, 10/27/28 (a) |
1,944,000 | 1,838,565 | ||||||
| 3.887%, 3M TSFR + 1.825%, 01/10/28 (a) |
748,000 | 723,307 | ||||||
| 4.150%, 5Y H15 + 3.000%, 11/15/26 (a) |
64,000 | 54,927 | ||||||
| 4.658%, SOFR + 1.887%, 05/24/28 (a) |
1,161,000 | 1,151,735 | ||||||
| 6.270%, SOFR + 2.338%, 11/17/33 (a) (g) |
4,283,000 | 4,582,857 | ||||||
| Credit Suisse AG |
900,000 | 862,644 | ||||||
| 3.625%, 09/09/24 |
1,586,000 | 1,563,509 | ||||||
| 3.700%, 02/21/25 |
4,712,000 | 4,615,067 | ||||||
| 4.750%, 08/09/24 |
1,598,000 | 1,588,102 | ||||||
| 5.000%, 07/09/27 |
2,859,000 | 2,859,605 | ||||||
| 7.500%, 02/15/28 |
3,873,000 | 4,241,733 | ||||||
| 7.950%, 01/09/25 |
3,370,000 | 3,444,212 | ||||||
| Deutsche Bank AG |
2,582,000 | 2,618,322 | ||||||
| Goldman Sachs Group, Inc. |
1,977,000 | 1,808,600 | ||||||
| 2.615%, SOFR + 1.281%, 04/22/32 (a) (g) |
2,598,000 | 2,180,784 | ||||||
| 2.650%, SOFR + 1.264%, 10/21/32 (a) |
5,677,000 | 4,730,712 | ||||||
| 3.102%, SOFR + 1.410%, 02/24/33 (a) |
1,279,000 | 1,097,912 | ||||||
| 3.814%, 3M TSFR + 1.420%, 04/23/29 (a) |
751,000 | 712,976 | ||||||
| 4.223%, 3M TSFR + 1.563%, 05/01/29 (a) |
2,093,000 | 2,024,615 | ||||||
| 4.482%, SOFR + 1.725%, 08/23/28 (a) |
2,852,000 | 2,801,649 | ||||||
| 5.923%, SOFR + 0.505%, 09/10/24 (a) |
2,198,000 | 2,194,479 | ||||||
| 6.484%, SOFR + 1.770%, 10/24/29 (a) |
2,475,000 | 2,626,093 | ||||||
| 6.561%, SOFR + 1.950%, 10/24/34 (a) |
5,484,000 | 6,026,436 | ||||||
| JPMorgan Chase & Co. |
1,437,000 | 1,168,130 | ||||||
| 2.580%, 3M TSFR + 1.250%, 04/22/32 (a) |
742,000 | 627,610 | ||||||
| 2.963%, SOFR + 1.260%, 01/25/33 (a) |
1,984,000 | 1,699,965 | ||||||
| 3.650%, 5Y H15 + 2.850%, 06/01/26 (a) |
64,000 | 58,569 | ||||||
| 4.565%, SOFR + 1.750%, 06/14/30 (a) |
1,220,000 | 1,193,844 | ||||||
| 5.299%, SOFR + 1.450%, 07/24/29 (a) |
772,000 | 783,357 | ||||||
| 6.070%, SOFR + 1.330%, 10/22/27 (a) |
875,000 | 900,123 | ||||||
| 6.254%, SOFR + 1.810%, 10/23/34 (a) |
9,641,000 | 10,450,719 | ||||||
| Morgan Stanley |
691,000 | 551,779 | ||||||
| 2.239%, SOFR + 1.178%, 07/21/32 (a) |
1,931,000 | 1,576,163 | ||||||
| 2.511%, SOFR + 1.200%, 10/20/32 (a) |
4,751,000 | 3,934,011 | ||||||
| 2.699%, SOFR + 1.143%, 01/22/31 (a) (g) |
3,485,000 | 3,046,505 | ||||||
| 3.772%, 3M TSFR + 1.402%, 01/24/29 (a) |
2,687,000 | 2,562,544 | ||||||
| 4.431%, 3M TSFR + 1.890%, 01/23/30 (a) |
350,000 | 340,892 | ||||||
| 5.164%, SOFR + 1.590%, 04/20/29 (a) |
2,535,000 | 2,549,491 | ||||||
| 5.250%, SOFR + 1.870%, 04/21/34 (a) |
1,557,000 | 1,556,841 | ||||||
| 5.424%, SOFR + 1.880%, 07/21/34 (a) (g) |
6,052,000 | 6,142,041 | ||||||
| 5.449%, SOFR + 1.630%, 07/20/29 (a) |
6,634,000 | 6,759,725 | ||||||
| 6.407%, SOFR + 1.830%, 11/01/29 (a) |
9,674,000 | 10,252,356 | ||||||
| 6.627%, SOFR + 2.050%, 11/01/34 (a) |
8,386,000 | 9,283,751 | ||||||
| Morgan Stanley Bank NA |
540,000 | 539,636 | ||||||
| UBS Group AG | ||||||||
| 0.650%, 1Y EUR Swap + 0.770%, 01/14/28 (EUR) (a) |
500,000 | 504,228 | ||||||
| Banks—(Continued) | ||||||||
| UBS Group AG | ||||||||
| 1.305%, SOFR + 0.980%, 02/02/27 (144A) (a) |
2,312,000 | 2,116,003 | ||||||
| 2.746%, 1Y H15 + 1.100%, 02/11/33 (144A) (a) |
360,000 | 295,281 | ||||||
| 3.750%, 03/26/25 |
664,000 | 650,486 | ||||||
| 6.301%, 1Y H15 + 2.000%, 09/22/34 (144A) (a) |
1,946,000 | 2,060,081 | ||||||
| 6.442%, SOFR + 3.700%, 08/11/28 (144A) (a) |
493,000 | 511,980 | ||||||
| 9.016%, SOFR + 5.020%, 11/15/33 (144A) (a) |
1,396,000 | 1,716,013 | ||||||
| 9.250%, 5Y H15 + 4.758%, 11/13/33 (144A) (a) |
275,000 | 304,773 | ||||||
| Wells Fargo & Co. |
276,000 | 277,199 | ||||||
| 5.557%, SOFR + 1.990%, 07/25/34 (a) |
7,053,000 | 7,180,721 | ||||||
| 5.574%, SOFR + 1.740%, 07/25/29 (a) |
3,476,000 | 3,549,233 | ||||||
| 6.303%, SOFR + 1.790%, 10/23/29 (a) |
3,975,000 | 4,189,339 | ||||||
| 6.491%, SOFR + 2.060%, 10/23/34 (a) |
9,231,000 | 10,042,293 | ||||||
| Wells Fargo Bank NA |
5,985,000 | 6,082,514 | ||||||
|
|
|
|||||||
| 190,878,062 | ||||||||
|
|
|
|||||||
| Biotechnology—0.6% | ||||||||
| Amgen, Inc. |
2,441,000 | 2,389,739 | ||||||
| 4.400%, 02/22/62 |
3,100,000 | 2,617,117 | ||||||
| 5.250%, 03/02/30 |
3,833,000 | 3,940,310 | ||||||
| 5.750%, 03/02/63 |
2,275,000 | 2,386,803 | ||||||
| Gilead Sciences, Inc. |
1,957,000 | 1,639,699 | ||||||
| 2.600%, 10/01/40 |
806,000 | 593,564 | ||||||
| 4.500%, 02/01/45 |
2,427,000 | 2,244,661 | ||||||
| 5.650%, 12/01/41 |
447,000 | 477,150 | ||||||
|
|
|
|||||||
| 16,289,043 | ||||||||
|
|
|
|||||||
| Building Materials—0.0% | ||||||||
| Owens Corning |
649,000 | 608,768 | ||||||
| 3.950%, 08/15/29 |
307,000 | 292,383 | ||||||
|
|
|
|||||||
| 901,151 | ||||||||
|
|
|
|||||||
| Chemicals—0.1% | ||||||||
| Braskem Netherlands Finance BV |
200,000 | 168,417 | ||||||
| Eastman Chemical Co. |
552,000 | 570,336 | ||||||
| MEGlobal BV |
200,000 | 179,730 | ||||||
| OCP SA |
200,000 | 171,800 | ||||||
| Olympus Water U.S. Holding Corp. |
1,024,000 | 1,086,866 | ||||||
| Rain Carbon, Inc. |
41,000 | 40,078 | ||||||
| Sasol Financing USA LLC |
654,000 | 649,994 | ||||||
| 8.750%, 05/03/29 (144A) |
200,000 | 203,925 | ||||||
|
|
|
|||||||
| 3,071,146 | ||||||||
|
|
|
|||||||
See accompanying notes to financial statements.
BHFTII-12
Brighthouse Funds Trust II
BlackRock Bond Income Portfolio
Schedule of Investments as of December 31, 2023
Corporate Bonds & Notes—(Continued)
| Security Description | Principal Amount* |
Value | ||||||
| Commercial Services—0.2% | ||||||||
| DP World Salaam |
200,000 | $ | 199,196 | |||||
| Garda World Security Corp. |
62,000 | 64,146 | ||||||
| 9.500%, 11/01/27 (144A) |
109,000 | 109,888 | ||||||
| Global Payments, Inc. |
450,000 | 414,269 | ||||||
| 5.300%, 08/15/29 |
961,000 | 967,280 | ||||||
| GTCR W-2 Merger Sub LLC/GTCR W Dutch Finance Sub BV |
102,000 | 140,415 | ||||||
| GXO Logistics, Inc. |
418,000 | 342,742 | ||||||
| Moody’s Corp. |
291,000 | 277,689 | ||||||
| 4.250%, 02/01/29 |
933,000 | 923,488 | ||||||
| RELX Capital, Inc. |
288,000 | 290,263 | ||||||
| S&P Global, Inc. |
635,000 | 566,788 | ||||||
| 5.250%, 09/15/33 (144A) (g) |
2,732,000 | 2,858,263 | ||||||
|
|
|
|||||||
| 7,154,427 | ||||||||
|
|
|
|||||||
| Computers—0.2% | ||||||||
| Booz Allen Hamilton, Inc. |
289,000 | 305,299 | ||||||
| Dell International LLC/EMC Corp. |
3,398,000 | 3,403,407 | ||||||
| 6.020%, 06/15/26 |
317,000 | 324,484 | ||||||
| Hewlett Packard Enterprise Co. |
771,000 | 788,178 | ||||||
|
|
|
|||||||
| 4,821,368 | ||||||||
|
|
|
|||||||
| Diversified Financial Services—0.2% | ||||||||
| ASG Finance Designated Activity Co. |
254,000 | 245,745 | ||||||
| Nasdaq, Inc. |
2,457,000 | 2,552,456 | ||||||
| 6.100%, 06/28/63 |
1,078,000 | 1,163,787 | ||||||
| Nationstar Mortgage Holdings, Inc. |
260,000 | 235,074 | ||||||
| 5.500%, 08/15/28 (144A) |
295,000 | 283,666 | ||||||
| 5.750%, 11/15/31 (144A) (g) |
128,000 | 119,348 | ||||||
| 6.000%, 01/15/27 (144A) |
65,000 | 64,513 | ||||||
| PennyMac Financial Services, Inc. |
207,000 | 213,079 | ||||||
| United Wholesale Mortgage LLC |
820,000 | 814,816 | ||||||
|
|
|
|||||||
| 5,692,484 | ||||||||
|
|
|
|||||||
| Electric—2.7% | ||||||||
| AEP Texas, Inc. |
1,039,000 | 741,968 | ||||||
| 3.800%, 10/01/47 |
1,082,000 | 819,007 | ||||||
| 3.950%, 06/01/28 |
1,104,000 | 1,062,207 | ||||||
| Electric—(Continued) | ||||||||
| AEP Texas, Inc. |
766,000 | 739,822 | ||||||
| 5.400%, 06/01/33 |
1,371,000 | 1,391,897 | ||||||
| AEP Transmission Co. LLC |
678,000 | 438,788 | ||||||
| 3.150%, 09/15/49 |
674,000 | 483,413 | ||||||
| 3.650%, 04/01/50 |
528,000 | 415,887 | ||||||
| 3.800%, 06/15/49 |
851,000 | 675,986 | ||||||
| AES Panama Generation Holdings SRL |
196,419 | 164,992 | ||||||
| Alabama Power Co. |
411,000 | 287,230 | ||||||
| 3.125%, 07/15/51 |
602,000 | 425,938 | ||||||
| 3.750%, 03/01/45 |
339,000 | 275,411 | ||||||
| 3.850%, 12/01/42 |
380,000 | 320,172 | ||||||
| 4.150%, 08/15/44 |
435,000 | 372,515 | ||||||
| 5.200%, 06/01/41 |
450,000 | 443,657 | ||||||
| 5.500%, 03/15/41 |
285,000 | 284,678 | ||||||
| Ameren Illinois Co. |
513,000 | 348,345 | ||||||
| 3.700%, 12/01/47 |
699,000 | 570,509 | ||||||
| American Transmission Systems, Inc. |
1,923,000 | 1,626,935 | ||||||
| Baltimore Gas & Electric Co. |
411,000 | 279,130 | ||||||
| 3.200%, 09/15/49 |
407,000 | 295,994 | ||||||
| 3.500%, 08/15/46 |
573,000 | 438,149 | ||||||
| 3.750%, 08/15/47 |
954,000 | 754,683 | ||||||
| 4.250%, 09/15/48 |
622,000 | 537,323 | ||||||
| 5.400%, 06/01/53 (g) |
661,000 | 682,046 | ||||||
| CenterPoint Energy Houston Electric LLC |
849,000 | 720,542 | ||||||
| 4.850%, 10/01/52 |
551,000 | 536,418 | ||||||
| Commonwealth Edison Co. |
1,072,000 | 696,191 | ||||||
| 3.125%, 03/15/51 |
928,000 | 656,905 | ||||||
| 3.200%, 11/15/49 |
1,306,000 | 936,889 | ||||||
| Consumers Energy Co. |
631,000 | 464,238 | ||||||
| 3.750%, 02/15/50 |
982,000 | 807,985 | ||||||
| 4.200%, 09/01/52 |
513,000 | 451,319 | ||||||
| 4.625%, 05/15/33 |
281,000 | 280,524 | ||||||
| Dominion Energy South Carolina, Inc. |
415,000 | 478,439 | ||||||
| DTE Electric Co. |
809,000 | 591,879 | ||||||
| 4.050%, 05/15/48 |
1,373,000 | 1,162,662 | ||||||
| Duke Energy Carolinas LLC |
1,195,000 | 867,094 | ||||||
| 3.450%, 04/15/51 |
1,269,000 | 955,915 | ||||||
| 3.700%, 12/01/47 |
462,000 | 362,238 | ||||||
| 3.875%, 03/15/46 |
871,000 | 705,324 | ||||||
| 3.950%, 03/15/48 |
814,000 | 669,683 | ||||||
| Duke Energy Florida LLC |
1,896,000 | 1,690,442 | ||||||
| 3.000%, 12/15/51 |
1,266,000 | 863,840 | ||||||
| 5.950%, 11/15/52 |
1,610,000 | 1,761,534 | ||||||
See accompanying notes to financial statements.
BHFTII-13
Brighthouse Funds Trust II
BlackRock Bond Income Portfolio
Schedule of Investments as of December 31, 2023
Corporate Bonds & Notes—(Continued)
| Security Description | Principal Amount* |
Value | ||||||
| Electric—(Continued) | ||||||||
| Duke Energy Ohio, Inc. |
276,000 | $ | 289,065 | |||||
| Duke Energy Progress LLC |
1,651,000 | 1,037,130 | ||||||
| 3.450%, 03/15/29 |
1,483,000 | 1,414,368 | ||||||
| 4.000%, 04/01/52 |
750,000 | 616,290 | ||||||
| 5.350%, 03/15/53 |
1,077,000 | 1,090,983 | ||||||
| Edison International |
337,000 | 334,626 | ||||||
| 5.250%, 11/15/28 |
1,183,000 | 1,190,272 | ||||||
| 5.750%, 06/15/27 |
1,470,000 | 1,501,021 | ||||||
| 6.950%, 11/15/29 |
1,891,000 | 2,052,152 | ||||||
| Entergy Arkansas LLC |
469,000 | 294,858 | ||||||
| Eversource Energy |
1,132,000 | 1,163,485 | ||||||
| FirstEnergy Corp. |
272,000 | 262,480 | ||||||
| 2.250%, 09/01/30 |
849,000 | 715,111 | ||||||
| 3.400%, 03/01/50 |
850,000 | 599,066 | ||||||
| 4.150%, 07/15/27 |
1,223,000 | 1,176,287 | ||||||
| FirstEnergy Transmission LLC |
1,418,000 | 1,225,405 | ||||||
| Florida Power & Light Co. |
592,000 | 410,072 | ||||||
| 3.150%, 10/01/49 |
798,000 | 585,426 | ||||||
| 5.300%, 04/01/53 |
272,000 | 284,339 | ||||||
| Generacion Mediterranea SA/Central Termica Roca SA |
161,979 | 141,894 | ||||||
| Georgia Power Co. |
637,000 | 630,175 | ||||||
| MidAmerican Energy Co. |
338,000 | 293,827 | ||||||
| 5.850%, 09/15/54 |
297,000 | 328,572 | ||||||
| Northern States Power Co. |
1,310,000 | 965,440 | ||||||
| 4.000%, 08/15/45 |
471,000 | 389,673 | ||||||
| 5.100%, 05/15/53 |
795,000 | 801,472 | ||||||
| Ohio Power Co. |
1,570,000 | 1,274,221 | ||||||
| 2.600%, 04/01/30 |
800,000 | 700,568 | ||||||
| 2.900%, 10/01/51 |
1,309,000 | 886,458 | ||||||
| 4.000%, 06/01/49 |
1,169,000 | 949,981 | ||||||
| 5.000%, 06/01/33 (g) |
1,744,000 | 1,753,893 | ||||||
| Oncor Electric Delivery Co. LLC |
928,000 | 663,801 | ||||||
| Pacific Gas & Electric Co. |
2,931,000 | 2,023,491 | ||||||
| 3.950%, 12/01/47 |
910,000 | 665,299 | ||||||
| 4.250%, 03/15/46 |
474,000 | 364,297 | ||||||
| 4.950%, 07/01/50 |
1,514,000 | 1,293,244 | ||||||
| 6.700%, 04/01/53 |
320,000 | 347,199 | ||||||
| PECO Energy Co. |
1,205,000 | 811,115 | ||||||
| 2.850%, 09/15/51 |
846,000 | 568,819 | ||||||
| 3.000%, 09/15/49 |
467,000 | 331,957 | ||||||
| Electric—(Continued) | ||||||||
| PECO Energy Co. |
1,079,000 | 763,244 | ||||||
| 3.700%, 09/15/47 |
353,000 | 283,671 | ||||||
| Public Service Co. of New Hampshire |
1,050,000 | 1,062,813 | ||||||
| Public Service Electric & Gas Co. |
563,000 | 326,033 | ||||||
| 3.150%, 01/01/50 |
602,000 | 443,190 | ||||||
| San Diego Gas & Electric Co. |
1,096,000 | 779,681 | ||||||
| 4.100%, 06/15/49 |
435,000 | 357,912 | ||||||
| 5.350%, 04/01/53 |
997,000 | 1,008,655 | ||||||
| Southern California Edison Co. |
1,850,000 | 1,587,625 | ||||||
| 2.500%, 06/01/31 |
1,051,000 | 899,903 | ||||||
| 2.850%, 08/01/29 |
305,000 | 277,945 | ||||||
| 5.625%, 02/01/36 |
613,000 | 624,149 | ||||||
| 5.650%, 10/01/28 |
2,276,000 | 2,372,192 | ||||||
| 5.950%, 11/01/32 |
1,386,000 | 1,489,009 | ||||||
| Union Electric Co. |
440,000 | 453,642 | ||||||
| Virginia Electric & Power Co. |
655,000 | 558,666 | ||||||
| 4.450%, 02/15/44 |
314,000 | 279,905 | ||||||
| 4.650%, 08/15/43 |
627,000 | 573,649 | ||||||
|
|
|
|||||||
| 77,106,459 | ||||||||
|
|
|
|||||||
| Energy-Alternate Sources—0.0% | ||||||||
| Continuum Energy Levanter Pte. Ltd. |
178,250 | 167,248 | ||||||
| SCC Power PLC |
685,086 | 114,752 | ||||||
| 8.000%, 4.000% PIK, 12/31/28 (144A) (h) |
1,264,774 | 564,721 | ||||||
|
|
|
|||||||
| 846,721 | ||||||||
|
|
|
|||||||
| Entertainment—0.2% | ||||||||
| Affinity Interactive |
194,000 | 172,899 | ||||||
| Caesars Entertainment, Inc. |
433,000 | 443,868 | ||||||
| Churchill Downs, Inc. |
155,000 | 151,124 | ||||||
| HR Ottawa LP |
3,772,000 | 3,592,830 | ||||||
| Midwest Gaming Borrower LLC/Midwest Gaming Finance Corp. |
310,000 | 288,300 | ||||||
| Wynn Resorts Finance LLC/Wynn Resorts Capital Corp. |
316,000 | 298,236 | ||||||
|
|
|
|||||||
| 4,947,257 | ||||||||
|
|
|
|||||||
| Environmental Control—0.1% | ||||||||
| Clean Harbors, Inc. |
72,000 | 70,552 | ||||||
| Covanta Holding Corp. |
135,000 | 117,948 | ||||||
See accompanying notes to financial statements.
BHFTII-14
Brighthouse Funds Trust II
BlackRock Bond Income Portfolio
Schedule of Investments as of December 31, 2023
Corporate Bonds & Notes—(Continued)
| Security Description | Principal Amount* |
Value | ||||||
| Environmental Control—(Continued) | ||||||||
| Republic Services, Inc. |
550,000 | $ | 563,200 | |||||
| Waste Management, Inc. |
1,069,000 | 1,090,425 | ||||||
|
|
|
|||||||
| 1,842,125 | ||||||||
|
|
|
|||||||
| Food—0.0% | ||||||||
| Pilgrim’s Pride Corp. |
436,000 | 448,611 | ||||||
|
|
|
|||||||
| Gas—0.3% | ||||||||
| AmeriGas Partners LP/AmeriGas Finance Corp. |
309,000 | 319,097 | ||||||
| Atmos Energy Corp. |
393,000 | 299,502 | ||||||
| 4.125%, 03/15/49 |
368,000 | 316,101 | ||||||
| CenterPoint Energy Resources Corp. |
282,000 | 274,537 | ||||||
| 5.250%, 03/01/28 |
663,000 | 679,872 | ||||||
| NiSource, Inc. |
2,322,000 | 2,235,500 | ||||||
| 5.250%, 03/30/28 |
1,266,000 | 1,290,834 | ||||||
| 5.400%, 06/30/33 |
1,702,000 | 1,754,894 | ||||||
| Piedmont Natural Gas Co., Inc. |
558,000 | 476,452 | ||||||
| Promigas SA ESP/Gases del Pacifico SAC |
207,000 | 184,072 | ||||||
|
|
|
|||||||
| 7,830,861 | ||||||||
|
|
|
|||||||
| Healthcare-Products—0.1% | ||||||||
| Agilent Technologies, Inc. |
334,000 | 287,665 | ||||||
| Bausch & Lomb Escrow Corp. |
32,000 | 33,758 | ||||||
| Thermo Fisher Scientific, Inc. |
1,306,000 | 1,347,726 | ||||||
| 5.086%, 08/10/33 |
2,108,000 | 2,197,139 | ||||||
|
|
|
|||||||
| 3,866,288 | ||||||||
|
|
|
|||||||
| Healthcare-Services—0.6% | ||||||||
| Elevance Health, Inc. |
885,000 | 693,416 | ||||||
| 4.550%, 05/15/52 (g) |
315,000 | 287,388 | ||||||
| 4.850%, 08/15/54 |
521,000 | 459,027 | ||||||
| HCA, Inc. |
2,871,000 | 2,602,637 | ||||||
| 5.250%, 04/15/25 |
1,126,000 | 1,124,692 | ||||||
| 5.875%, 02/15/26 |
3,693,000 | 3,724,409 | ||||||
| 5.875%, 02/01/29 |
2,813,000 | 2,903,721 | ||||||
| 7.690%, 06/15/25 |
259,000 | 267,475 | ||||||
| Select Medical Corp. |
1,082,000 | 1,087,382 | ||||||
| UnitedHealth Group, Inc. | ||||||||
| 3.125%, 05/15/60 |
547,000 | 388,668 | ||||||
| 3.250%, 05/15/51 |
399,000 | 302,169 | ||||||
| Healthcare-Services—(Continued) | ||||||||
| UnitedHealth Group, Inc. | ||||||||
| 3.750%, 10/15/47 |
570,000 | 469,401 | ||||||
| 4.250%, 04/15/47 |
549,000 | 489,669 | ||||||
| 4.750%, 05/15/52 |
950,000 | 913,288 | ||||||
| 5.200%, 04/15/63 (g) |
807,000 | 823,598 | ||||||
| 6.050%, 02/15/63 |
319,000 | 367,850 | ||||||
|
|
|
|||||||
| 16,904,790 | ||||||||
|
|
|
|||||||
| Home Builders—0.3% | ||||||||
| Ashton Woods USA LLC/Ashton Woods Finance Co. |
103,000 | 91,593 | ||||||
| 4.625%, 04/01/30 (144A) |
254,000 | 227,531 | ||||||
| 6.625%, 01/15/28 (144A) |
727,000 | 705,507 | ||||||
| Beazer Homes USA, Inc. |
1,030,000 | 1,038,851 | ||||||
| Brookfield Residential Properties, Inc./Brookfield Residential U.S. LLC |
135,000 | 119,832 | ||||||
| Forestar Group, Inc. |
141,000 | 134,313 | ||||||
| 5.000%, 03/01/28 (144A) |
383,000 | 368,450 | ||||||
| Homes By West Bay LLC |
1,259,000 | 1,189,755 | ||||||
| Landsea Homes Corp. |
3,104,000 | 3,014,915 | ||||||
| LGI Homes, Inc. |
530,000 | 563,788 | ||||||
| M/I Homes, Inc. |
598,000 | 575,489 | ||||||
| Mattamy Group Corp. |
337,000 | 312,316 | ||||||
| 5.250%, 12/15/27 (144A) |
328,000 | 318,882 | ||||||
| New Home Co., Inc. |
110,000 | 102,575 | ||||||
| Tri Pointe Homes, Inc. |
35,000 | 34,519 | ||||||
| Weekley Homes LLC/Weekley Finance Corp. |
175,000 | 163,047 | ||||||
|
|
|
|||||||
| 8,961,363 | ||||||||
|
|
|
|||||||
| Insurance—0.1% | ||||||||
| Ambac Assurance Corp. |
162,922 | 211,798 | ||||||
| Aon Corp./Aon Global Holdings PLC |
613,000 | 500,744 | ||||||
| 2.600%, 12/02/31 |
332,000 | 281,517 | ||||||
| Hartford Financial Services Group, Inc. |
337,000 | 294,771 | ||||||
| Marsh & McLennan Cos., Inc. |
506,000 | 340,308 | ||||||
| 5.450%, 03/15/53 |
319,000 | 333,468 | ||||||
|
|
|
|||||||
| 1,962,606 | ||||||||
|
|
|
|||||||
See accompanying notes to financial statements.
BHFTII-15
Brighthouse Funds Trust II
BlackRock Bond Income Portfolio
Schedule of Investments as of December 31, 2023
Corporate Bonds & Notes—(Continued)
| Security Description | Principal Amount* |
Value | ||||||
| Internet—0.1% | ||||||||
| EquipmentShare.com, Inc. |
1,150,000 | $ | 1,183,177 | |||||
| Meta Platforms, Inc. |
1,249,000 | 1,162,810 | ||||||
| Rakuten Group, Inc. |
1,900,000 | 1,823,999 | ||||||
| 10.250%, 11/30/24 (144A) |
200,000 | 204,000 | ||||||
|
|
|
|||||||
| 4,373,986 | ||||||||
|
|
|
|||||||
| Iron/Steel—0.0% | ||||||||
| Big River Steel LLC/BRS Finance Corp. |
269,000 | 274,267 | ||||||
| Mineral Resources Ltd. |
343,000 | 364,873 | ||||||
|
|
|
|||||||
| 639,140 | ||||||||
|
|
|
|||||||
| Lodging—0.1% | ||||||||
| Full House Resorts, Inc. |
129,000 | 121,260 | ||||||
| Grupo Posadas SAB de CV |
205,810 | 171,337 | ||||||
| Sands China Ltd. |
200,000 | 198,330 | ||||||
| Sonder Holdings, Inc. |
1,515,329 | 1,320,306 | ||||||
|
|
|
|||||||
| 1,811,233 | ||||||||
|
|
|
|||||||
| Machinery-Diversified—0.1% | ||||||||
| CNH Industrial Capital LLC |
1,862,000 | 1,860,566 | ||||||
| 5.450%, 10/14/25 |
693,000 | 696,017 | ||||||
| GrafTech Global Enterprises, Inc. |
63,000 | 48,589 | ||||||
| Otis Worldwide Corp. |
957,000 | 983,577 | ||||||
| TK Elevator U.S. Newco, Inc. |
471,000 | 462,690 | ||||||
|
|
|
|||||||
| 4,051,439 | ||||||||
|
|
|
|||||||
| Media—0.5% | ||||||||
| Charter Communications Operating LLC/Charter Communications Operating Capital Corp. |
1,486,000 | 966,538 | ||||||
| 3.900%, 06/01/52 |
3,691,000 | 2,481,755 | ||||||
| 3.950%, 06/30/62 |
1,581,000 | 994,627 | ||||||
| 4.800%, 03/01/50 |
510,000 | 394,777 | ||||||
| 5.375%, 05/01/47 |
699,000 | 594,026 | ||||||
| Comcast Corp. |
340,000 | 278,639 | ||||||
| 2.937%, 11/01/56 |
3,049,000 | 2,005,388 | ||||||
| 2.987%, 11/01/63 |
1,001,000 | 645,203 | ||||||
| 3.250%, 11/01/39 |
394,000 | 319,140 | ||||||
| 4.800%, 05/15/33 |
1,442,000 | 1,459,818 | ||||||
| Cox Communications, Inc. |
190,000 | 186,810 | ||||||
| Media—(Continued) | ||||||||
| CSC Holdings LLC |
1,043,000 | 1,020,999 | ||||||
| 5.500%, 04/15/27 (144A) |
400,000 | 369,719 | ||||||
| DISH DBS Corp. |
570,000 | 534,525 | ||||||
| FactSet Research Systems, Inc. |
2,231,000 | 1,997,923 | ||||||
| Nexstar Media, Inc. |
349,000 | 321,597 | ||||||
|
|
|
|||||||
| 14,571,484 | ||||||||
|
|
|
|||||||
| Mining—0.1% | ||||||||
| FMG Resources August 2006 Pty. Ltd. |
234,000 | 213,996 | ||||||
| Freeport Indonesia PT |
200,000 | 196,500 | ||||||
| Glencore Funding LLC |
927,000 | 786,572 | ||||||
| 6.375%, 10/06/30 (144A) |
1,775,000 | 1,905,647 | ||||||
| Newmont Corp. |
1,052,000 | 907,983 | ||||||
| Vedanta Resources Finance II PLC |
412,000 | 306,425 | ||||||
|
|
|
|||||||
| 4,317,123 | ||||||||
|
|
|
|||||||
| Miscellaneous Manufacturing—0.1% | ||||||||
| Textron, Inc. |
1,079,000 | 919,348 | ||||||
| 3.900%, 09/17/29 |
1,538,000 | 1,462,112 | ||||||
|
|
|
|||||||
| 2,381,460 | ||||||||
|
|
|
|||||||
| Oil & Gas—2.0% | ||||||||
| Antero Resources Corp. |
1,864,000 | 1,786,571 | ||||||
| 7.625%, 02/01/29 (144A) (g) |
1,388,000 | 1,424,264 | ||||||
| Apache Corp. |
475,000 | 373,840 | ||||||
| 5.250%, 02/01/42 |
1,463,000 | 1,224,312 | ||||||
| Calumet Specialty Products Partners LP/Calumet Finance Corp. |
522,000 | 518,508 | ||||||
| Civitas Resources, Inc. |
||||||||
| 5.000%, 10/15/26 (144A) |
294,000 | 285,122 | ||||||
| 8.375%, 07/01/28 (144A) |
638,000 | 666,037 | ||||||
| Devon Energy Corp. |
1,155,000 | 1,108,939 | ||||||
| Diamondback Energy, Inc. |
7,135,000 | 6,341,756 | ||||||
| 3.250%, 12/01/26 |
8,219,000 | 7,959,980 | ||||||
| 3.500%, 12/01/29 |
11,200,000 | 10,401,656 | ||||||
| Ecopetrol SA |
42,000 | 41,038 | ||||||
| 8.875%, 01/13/33 |
71,000 | 77,140 | ||||||
| EDO Sukuk Ltd. |
250,000 | 257,500 | ||||||
See accompanying notes to financial statements.
BHFTII-16
Brighthouse Funds Trust II
BlackRock Bond Income Portfolio
Schedule of Investments as of December 31, 2023
Corporate Bonds & Notes—(Continued)
| Security Description | Principal Amount* |
Value | ||||||
| Oil & Gas—(Continued) | ||||||||
| Empresa Nacional del Petroleo |
200,000 | $ | 189,649 | |||||
| Energian Israel Finance Ltd. |
20,591 | 19,639 | ||||||
| EQT Corp. |
1,663,000 | 1,577,870 | ||||||
| 3.625%, 05/15/31 (144A) |
1,274,000 | 1,137,771 | ||||||
| 3.900%, 10/01/27 (g) |
3,175,000 | 3,037,352 | ||||||
| 5.000%, 01/15/29 (g) |
1,411,000 | 1,397,767 | ||||||
| 5.700%, 04/01/28 |
1,030,000 | 1,045,262 | ||||||
| 7.000%, 02/01/30 (g) |
777,000 | 833,907 | ||||||
| Hess Corp. |
295,000 | 309,799 | ||||||
| 6.000%, 01/15/40 |
287,000 | 312,092 | ||||||
| Leviathan Bond Ltd. |
2,998 | 2,729 | ||||||
| MC Brazil Downstream Trading Sarl |
220,329 | 172,683 | ||||||
| Northern Oil & Gas, Inc. |
107,000 | 111,451 | ||||||
| Ovintiv, Inc. |
945,000 | 964,222 | ||||||
| Permian Resources Operating LLC |
134,000 | 130,645 | ||||||
| 7.000%, 01/15/32 (144A) |
140,000 | 144,434 | ||||||
| 8.000%, 04/15/27 (144A) |
358,000 | 371,094 | ||||||
| Petroleos Mexicanos |
181,000 | 180,449 | ||||||
| 6.500%, 03/13/27 |
765,000 | 713,080 | ||||||
| 6.875%, 08/04/26 |
957,000 | 929,266 | ||||||
| 7.190%, 09/12/24 (MXN) |
4,225,600 | 237,352 | ||||||
| 8.750%, 06/02/29 |
69,800 | 67,859 | ||||||
| Petrorio Luxembourg Trading SARL |
186,000 | 182,567 | ||||||
| Pioneer Midco LLC |
1,117,728 | 1,117,728 | ||||||
| Pioneer Natural Resources Co. |
584,000 | 496,136 | ||||||
| Shelf Drilling Holdings Ltd. |
1,295,000 | 1,267,239 | ||||||
| Shelf Drilling North Sea Holdings Ltd. |
548,000 | 545,328 | ||||||
| Sitio Royalties Operating Partnership LP/Sitio Finance Corp. |
200,000 | 207,244 | ||||||
| Sunoco LP/Sunoco Finance Corp. |
314,000 | 290,705 | ||||||
| Transocean Titan Financing Ltd. |
110,000 | 114,124 | ||||||
| Transocean, Inc. |
110,200 | 115,133 | ||||||
| Vantage Drilling International |
343,000 | 337,860 | ||||||
| Viper Energy, Inc. |
2,858,000 | 2,806,033 | ||||||
| 7.375%, 11/01/31 (144A) |
1,040,000 | 1,076,400 | ||||||
| Oil & Gas—(Continued) | ||||||||
| YPF SA |
111,000 | 83,851 | ||||||
| 8.500%, 06/27/29 |
28,000 | 25,902 | ||||||
|
|
|
|||||||
| 55,019,285 | ||||||||
|
|
|
|||||||
| Packaging & Containers—0.1% | ||||||||
| Amcor Finance USA, Inc. |
275,000 | 285,919 | ||||||
| Ardagh Metal Packaging Finance USA LLC/Ardagh Metal Packaging Finance PLC |
376,000 | 328,934 | ||||||
| Ardagh Packaging Finance PLC/Ardagh Holdings USA, Inc. |
376,000 | 365,668 | ||||||
| 5.250%, 08/15/27 (144A) (g) |
200,000 | 155,373 | ||||||
| Berry Global, Inc. |
388,000 | 392,252 | ||||||
| Clydesdale Acquisition Holdings, Inc. |
192,000 | 179,014 | ||||||
| Mauser Packaging Solutions Holding Co. |
736,000 | 749,013 | ||||||
| Trivium Packaging Finance BV |
317,000 | 311,012 | ||||||
|
|
|
|||||||
| 2,767,185 | ||||||||
|
|
|
|||||||
| Pharmaceuticals—0.8% | ||||||||
| AbbVie, Inc. |
3,716,000 | 3,634,365 | ||||||
| 4.550%, 03/15/35 |
3,556,000 | 3,487,208 | ||||||
| Bayer U.S. Finance LLC |
2,752,000 | 2,831,420 | ||||||
| CVS Health Corp. |
629,000 | 448,431 | ||||||
| 5.125%, 07/20/45 |
298,000 | 281,933 | ||||||
| 5.625%, 02/21/53 |
1,531,000 | 1,551,831 | ||||||
| Pfizer Investment Enterprises Pte. Ltd. |
2,924,000 | 2,930,564 | ||||||
| 5.300%, 05/19/53 |
4,788,000 | 4,887,993 | ||||||
| Takeda Pharmaceutical Co. Ltd. |
1,906,000 | 1,633,204 | ||||||
|
|
|
|||||||
| 21,686,949 | ||||||||
|
|
|
|||||||
| Pipelines—3.4% | ||||||||
| Buckeye Partners LP |
130,000 | 126,014 | ||||||
| 4.350%, 10/15/24 |
500,000 | 489,989 | ||||||
| Cameron LNG LLC |
3,003,000 | 2,556,962 | ||||||
| 3.402%, 01/15/38 (144A) |
1,949,000 | 1,644,046 | ||||||
| Cheniere Corpus Christi Holdings LLC |
1,822,000 | 1,451,566 | ||||||
| 3.700%, 11/15/29 |
2,777,000 | 2,622,800 | ||||||
| 5.125%, 06/30/27 |
5,713,000 | 5,740,740 | ||||||
| 5.875%, 03/31/25 |
4,223,000 | 4,232,000 | ||||||
| Cheniere Energy Partners LP | ||||||||
| 3.250%, 01/31/32 |
4,680,000 | 3,987,509 | ||||||
See accompanying notes to financial statements.
BHFTII-17
Brighthouse Funds Trust II
BlackRock Bond Income Portfolio
Schedule of Investments as of December 31, 2023
Corporate Bonds & Notes—(Continued)
| Security Description | Principal Amount* |
Value | ||||||
| Pipelines—(Continued) | ||||||||
| Cheniere Energy Partners LP | ||||||||
| 4.000%, 03/01/31 |
1,431,000 | $ | 1,300,983 | |||||
| 4.500%, 10/01/29 (g) |
4,093,000 | 3,914,819 | ||||||
| 5.950%, 06/30/33 (144A) |
1,035,000 | 1,062,676 | ||||||
| El Paso Natural Gas Co. LLC |
174,000 | 202,747 | ||||||
| Energy Transfer LP |
298,000 | 283,643 | ||||||
| 4.950%, 01/15/43 |
375,000 | 326,030 | ||||||
| 5.000%, 05/15/50 (g) |
3,241,000 | 2,889,580 | ||||||
| 5.150%, 02/01/43 |
492,000 | 437,532 | ||||||
| 5.300%, 04/15/47 |
763,000 | 699,553 | ||||||
| 5.400%, 10/01/47 |
1,815,000 | 1,691,185 | ||||||
| 5.625%, 05/01/27 (144A) |
100,000 | 99,659 | ||||||
| 5.750%, 04/01/25 |
1,114,000 | 1,114,446 | ||||||
| 6.000%, 02/01/29 (144A) |
508,000 | 512,564 | ||||||
| 6.100%, 02/15/42 |
353,000 | 353,867 | ||||||
| 6.125%, 12/15/45 |
335,000 | 337,411 | ||||||
| 6.400%, 12/01/30 |
161,000 | 172,141 | ||||||
| 7.375%, 02/01/31 (144A) (g) |
6,270,000 | 6,589,367 | ||||||
| Kinder Morgan Energy Partners LP |
653,000 | 559,915 | ||||||
| 5.800%, 03/15/35 |
562,000 | 572,199 | ||||||
| Kinder Morgan, Inc. |
1,120,000 | 1,104,296 | ||||||
| 5.200%, 06/01/33 (g) |
648,000 | 644,098 | ||||||
| NGPL PipeCo LLC |
2,904,000 | 2,521,492 | ||||||
| 4.875%, 08/15/27 (144A) |
1,672,000 | 1,640,700 | ||||||
| 7.768%, 12/15/37 (144A) |
387,000 | 430,402 | ||||||
| Northwest Pipeline LLC |
2,901,000 | 2,864,113 | ||||||
| ONEOK, Inc. |
367,000 | 306,987 | ||||||
| 6.625%, 09/01/53 (g) |
1,130,000 | 1,264,625 | ||||||
| Sabine Pass Liquefaction LLC |
2,923,000 | 2,935,613 | ||||||
| 5.625%, 03/01/25 |
6,525,000 | 6,537,485 | ||||||
| 5.750%, 05/15/24 |
220,000 | 219,872 | ||||||
| 5.875%, 06/30/26 |
6,215,000 | 6,326,847 | ||||||
| 5.900%, 09/15/37 (g) |
680,000 | 716,521 | ||||||
| Targa Resources Corp. |
2,296,000 | 2,111,020 | ||||||
| 5.200%, 07/01/27 |
1,434,000 | 1,440,884 | ||||||
| 6.150%, 03/01/29 |
799,000 | 835,512 | ||||||
| 6.500%, 03/30/34 (g) |
825,000 | 890,397 | ||||||
| Targa Resources Partners LP/Targa Resources Partners Finance Corp. |
874,000 | 798,076 | ||||||
| 4.875%, 02/01/31 |
1,602,000 | 1,556,199 | ||||||
| 5.000%, 01/15/28 |
2,787,000 | 2,752,447 | ||||||
| 5.500%, 03/01/30 |
2,248,000 | 2,247,595 | ||||||
| Texas Eastern Transmission LP |
2,623,000 | 2,473,177 | ||||||
| Transcontinental Gas Pipe Line Co. LLC | ||||||||
| 3.950%, 05/15/50 |
592,000 | 477,681 | ||||||
| Pipelines—(Continued) | ||||||||
| Transcontinental Gas Pipe Line Co. LLC | ||||||||
| 4.000%, 03/15/28 |
1,812,000 | 1,755,310 | ||||||
| 4.600%, 03/15/48 |
1,753,000 | 1,578,444 | ||||||
| 7.850%, 02/01/26 |
2,334,000 | 2,443,962 | ||||||
| Venture Global LNG, Inc. |
466,000 | 470,612 | ||||||
| Western Midstream Operating LP |
2,000 | 1,952 | ||||||
| 6.350%, 01/15/29 |
251,000 | 262,147 | ||||||
|
|
|
|||||||
| 95,580,409 | ||||||||
|
|
|
|||||||
| Real Estate—0.2% | ||||||||
| Five Point Operating Co. LP/Five Point Capital Corp. |
470,000 | 465,300 | ||||||
| Howard Hughes Corp. |
416,000 | 399,828 | ||||||
| Lessen, Inc. |
1,727,283 | 1,578,391 | ||||||
| Resort Communities Loanco LP |
4,248,000 | 4,120,560 | ||||||
|
|
|
|||||||
| 6,564,079 | ||||||||
|
|
|
|||||||
| Real Estate Investment Trusts—1.2% | ||||||||
| American Tower Corp. |
1,989,000 | 1,630,351 | ||||||
| 2.100%, 06/15/30 |
1,202,000 | 1,008,252 | ||||||
| 2.300%, 09/15/31 † |
428,000 | 353,882 | ||||||
| 2.700%, 04/15/31 |
1,781,000 | 1,529,360 | ||||||
| 4.050%, 03/15/32 |
302,000 | 282,753 | ||||||
| Crown Castle, Inc. |
1,111,000 | 904,862 | ||||||
| 3.100%, 11/15/29 |
1,778,000 | 1,590,776 | ||||||
| 3.300%, 07/01/30 |
2,357,000 | 2,113,160 | ||||||
| Equinix, Inc. |
315,000 | 280,946 | ||||||
| 2.150%, 07/15/30 |
660,000 | 559,172 | ||||||
| 2.500%, 05/15/31 |
333,000 | 282,658 | ||||||
| 3.200%, 11/18/29 |
978,000 | 898,227 | ||||||
| Extra Space Storage LP |
610,000 | 623,815 | ||||||
| GLP Capital LP/GLP Financing II, Inc. |
3,648,000 | 3,079,832 | ||||||
| 4.000%, 01/15/30 |
2,544,000 | 2,321,350 | ||||||
| 4.000%, 01/15/31 (g) |
1,848,000 | 1,664,371 | ||||||
| 5.300%, 01/15/29 |
1,547,000 | 1,538,055 | ||||||
| 5.750%, 06/01/28 |
2,350,000 | 2,371,103 | ||||||
| 6.750%, 12/01/33 |
790,000 | 852,276 | ||||||
| NNN REIT, Inc. |
473,000 | 315,098 | ||||||
| 3.500%, 04/15/51 |
889,000 | 642,128 | ||||||
| Park Intermediate Holdings LLC/PK Domestic Property LLC/PK Finance Co-Issuer |
454,000 | 420,239 | ||||||
| Realty Income Corp. |
486,000 | 445,461 | ||||||
| 3.250%, 01/15/31 (g) |
685,000 | 622,365 | ||||||
See accompanying notes to financial statements.
BHFTII-18
Brighthouse Funds Trust II
BlackRock Bond Income Portfolio
Schedule of Investments as of December 31, 2023
Corporate Bonds & Notes—(Continued)
| Security Description | Principal Amount* |
Value | ||||||
| Real Estate Investment Trusts—(Continued) | ||||||||
| Service Properties Trust |
237,000 | $ | 231,371 | |||||
| 5.500%, 12/15/27 |
71,000 | 65,005 | ||||||
| 7.500%, 09/15/25 |
680,000 | 687,557 | ||||||
| 8.625%, 11/15/31 (144A) |
419,000 | 438,874 | ||||||
| VICI Properties LP |
2,147,000 | 2,101,831 | ||||||
| 4.950%, 02/15/30 |
4,039,000 | 3,919,122 | ||||||
| VICI Properties LP/VICI Note Co., Inc. |
786,000 | 741,948 | ||||||
| XHR LP |
70,000 | 64,434 | ||||||
|
|
|
|||||||
| 34,580,634 | ||||||||
|
|
|
|||||||
| Retail—0.1% | ||||||||
| Lowe’s Cos., Inc. |
2,294,000 | 1,675,711 | ||||||
| 4.250%, 09/15/44 |
352,000 | 288,994 | ||||||
| 4.500%, 04/15/30 |
930,000 | 924,599 | ||||||
|
|
|
|||||||
| 2,889,304 | ||||||||
|
|
|
|||||||
| Semiconductors—0.3% | ||||||||
| Broadcom, Inc. |
2,917,000 | 2,394,810 | ||||||
| 3.187%, 11/15/36 (144A) |
1,510,000 | 1,223,635 | ||||||
| 3.419%, 04/15/33 (144A) |
808,000 | 709,672 | ||||||
| 3.469%, 04/15/34 (144A) |
918,000 | 798,664 | ||||||
| Intel Corp. |
394,000 | 271,072 | ||||||
| KLA Corp. |
605,000 | 611,199 | ||||||
| 5.000%, 03/15/49 |
318,000 | 315,283 | ||||||
| 5.250%, 07/15/62 |
380,000 | 396,337 | ||||||
| NXP BV/NXP Funding LLC/NXP USA, Inc. |
1,407,000 | 1,366,932 | ||||||
|
|
|
|||||||
| 8,087,604 | ||||||||
|
|
|
|||||||
| Shipbuilding—0.2% | ||||||||
| Huntington Ingalls Industries, Inc. |
2,739,000 | 2,407,700 | ||||||
| 3.483%, 12/01/27 |
1,997,000 | 1,887,865 | ||||||
| 4.200%, 05/01/30 |
598,000 | 569,900 | ||||||
|
|
|
|||||||
| 4,865,465 | ||||||||
|
|
|
|||||||
| Software—0.5% | ||||||||
| Autodesk, Inc. |
326,000 | 278,920 | ||||||
| Cloud Software Group, Inc. |
77,000 | 73,185 | ||||||
| MSCI, Inc. | ||||||||
| 3.250%, 08/15/33 (144A) |
1,411,000 | 1,179,295 | ||||||
| 3.625%, 09/01/30 (144A) |
676,000 | 611,641 | ||||||
| 3.625%, 11/01/31 (144A) |
1,116,000 | 982,235 | ||||||
| 3.875%, 02/15/31 (144A) |
2,220,000 | 2,028,371 | ||||||
| 4.000%, 11/15/29 (144A) |
851,000 | 799,836 | ||||||
| Software—(Continued) | ||||||||
| Oracle Corp. |
4,533,000 | 3,614,634 | ||||||
| 3.600%, 04/01/50 |
414,000 | 306,652 | ||||||
| 3.950%, 03/25/51 |
1,804,000 | 1,412,650 | ||||||
| 4.000%, 07/15/46 |
1,575,000 | 1,262,430 | ||||||
| 4.500%, 07/08/44 |
925,000 | 806,629 | ||||||
| Playtika Holding Corp. |
82,000 | 71,549 | ||||||
|
|
|
|||||||
| 13,428,027 | ||||||||
|
|
|
|||||||
| Telecommunications—1.8% | ||||||||
| AT&T, Inc. |
482,000 | 346,547 | ||||||
| 3.650%, 09/15/59 |
3,682,000 | 2,638,861 | ||||||
| 3.800%, 12/01/57 |
5,901,000 | 4,386,464 | ||||||
| 4.500%, 05/15/35 |
1,076,000 | 1,019,209 | ||||||
| 5.400%, 02/15/34 |
2,476,000 | 2,553,561 | ||||||
| CommScope Technologies LLC |
130,000 | 105,950 | ||||||
| Digicel Group Holdings Ltd. |
||||||||
| Zero Coupon, 12/31/30 (144A) (m) |
242,322 | 55,735 | ||||||
| Digicel International Finance Ltd./Digicel international Holdings Ltd. |
48,530 | 971 | ||||||
| 8.750%, 05/25/24 (144A) |
121,567 | 113,723 | ||||||
| 13.000%, 12/31/25 (144A) |
73,953 | 49,918 | ||||||
| Kenbourne Invest SA |
210,000 | 111,000 | ||||||
| 6.875%, 11/26/24 (144A) |
310,000 | 214,489 | ||||||
| Level 3 Financing, Inc. |
426,000 | 255,600 | ||||||
| Level 3 New Money TSA |
1,046,137 | 1,046,137 | ||||||
| Motorola Solutions, Inc. |
3,030,000 | 2,589,740 | ||||||
| 5.500%, 09/01/44 |
1,134,000 | 1,126,340 | ||||||
| 5.600%, 06/01/32 |
2,486,000 | 2,564,575 | ||||||
| Sprint LLC |
3,629,000 | 3,644,739 | ||||||
| 7.625%, 02/15/25 |
6,236,000 | 6,345,043 | ||||||
| 7.625%, 03/01/26 |
398,000 | 415,799 | ||||||
| T-Mobile USA, Inc. |
3,087,000 | 2,927,407 | ||||||
| Verizon Communications, Inc. | ||||||||
| 1.750%, 01/20/31 (g) |
2,704,000 | 2,223,984 | ||||||
| 2.355%, 03/15/32 |
9,517,000 | 7,915,968 | ||||||
| 2.550%, 03/21/31 |
947,000 | 816,550 | ||||||
| 2.650%, 11/20/40 |
965,000 | 695,301 | ||||||
| 2.850%, 09/03/41 |
439,000 | 324,317 | ||||||
| 3.000%, 11/20/60 |
911,000 | 597,176 | ||||||
| 3.150%, 03/22/30 |
1,255,000 | 1,147,084 | ||||||
| 4.400%, 11/01/34 (g) |
2,965,000 | 2,852,579 | ||||||
| 5.850%, 09/15/35 |
293,000 | 314,116 | ||||||
|
|
|
|||||||
| 49,398,883 | ||||||||
|
|
|
|||||||
See accompanying notes to financial statements.
BHFTII-19
Brighthouse Funds Trust II
BlackRock Bond Income Portfolio
Schedule of Investments as of December 31, 2023
Corporate Bonds & Notes—(Continued)
| Security Description | Principal Amount* |
Value | ||||||
| Transportation—0.4% | ||||||||
| Burlington Northern Santa Fe LLC |
458,000 | $ | 330,876 | |||||
| 3.300%, 09/15/51 |
1,338,000 | 1,016,397 | ||||||
| 4.550%, 09/01/44 |
634,000 | 591,560 | ||||||
| 5.200%, 04/15/54 |
785,000 | 816,992 | ||||||
| CSX Corp. |
810,000 | 522,120 | ||||||
| 4.250%, 11/01/66 |
537,000 | 457,315 | ||||||
| 4.500%, 03/15/49 |
400,000 | 365,651 | ||||||
| 4.500%, 11/15/52 |
680,000 | 631,031 | ||||||
| Norfolk Southern Corp. |
2,510,000 | 1,785,268 | ||||||
| 4.050%, 08/15/52 |
451,000 | 380,940 | ||||||
| 5.350%, 08/01/54 |
887,000 | 921,805 | ||||||
| Ryder System, Inc. |
544,000 | 551,073 | ||||||
| Union Pacific Corp. |
582,000 | 391,442 | ||||||
| 3.750%, 02/05/70 |
1,260,000 | 971,532 | ||||||
| 3.839%, 03/20/60 |
499,000 | 407,056 | ||||||
| 3.850%, 02/14/72 |
690,000 | 547,989 | ||||||
| Union Pacific Railroad Co. Pass-Through Trust |
575,106 | 553,440 | ||||||
|
|
|
|||||||
| 11,242,487 | ||||||||
|
|
|
|||||||
| Total Corporate Bonds & Notes |
741,012,967 | |||||||
|
|
|
|||||||
| Asset-Backed Securities—9.8% |
| |||||||
| Asset-Backed - Credit Card—0.0% | ||||||||
| BA Credit Card Trust |
1,308,000 | 1,323,220 | ||||||
|
|
|
|||||||
| Asset-Backed - Home Equity—0.9% | ||||||||
| Ace Securities Corp. |
||||||||
| Zero Coupon, 08/15/30 |
614,343 | 530,718 | ||||||
| ACE Securities Corp. Home Equity Loan Trust |
1,007,533 | 169,924 | ||||||
| Argent Mortgage Loan Trust |
1,768,882 | 1,337,992 | ||||||
| Bayview Financial Revolving Asset Trust |
3,421,268 | 2,874,259 | ||||||
| 6.471%, 1M TSFR + 1.114%, 12/28/40 (144A) (a) |
134,216 | 136,986 | ||||||
| Bear Stearns Asset-Backed Securities I Trust |
2,511,121 | 2,633,785 | ||||||
| 6.250%, 12/25/35 (l) |
1,196,497 | 1,025,906 | ||||||
| 6.250%, 02/25/36 (l) |
1,461,182 | 1,077,725 | ||||||
| 7.195%, 1M TSFR + 1.839%, 08/25/34 (a) |
8,609 | 8,207 | ||||||
| Bear Stearns Asset-Backed Securities Trust |
2,034,389 | 1,840,973 | ||||||
| 7.111%, 1M TSFR + 5.364%, 06/25/35 (a) |
2,142,000 | 2,153,782 | ||||||
| Bear Stearns Structured Products Trust |
1,341,117 | 1,316,217 | ||||||
| Asset-Backed - Home Equity—(Continued) | ||||||||
| Citigroup Mortgage Loan Trust, Inc. |
1,633,805 | 1,058,891 | ||||||
| 5.740%, 1M TSFR + 0.384%, 05/25/37 (a) |
742,146 | 481,547 | ||||||
| CSMC Trust |
3,007,542 | 2,973,783 | ||||||
| CWHEQ Home Equity Loan Trust |
35,709 | 42,948 | ||||||
| Home Equity Mortgage Loan Asset-Backed Trust |
114,613 | 110,304 | ||||||
| Home Equity Mortgage Trust |
463,945 | 50,733 | ||||||
| Irwin Home Equity Loan Trust |
38,982 | 36,875 | ||||||
| MASTR Asset-Backed Securities Trust |
621,846 | 477,239 | ||||||
| 5.990%, 1M TSFR + 0.634%, 06/25/36 (144A) (a) |
320,223 | 280,577 | ||||||
| Morgan Stanley Mortgage Loan Trust |
3,264,290 | 1,181,150 | ||||||
| Option One Mortgage Loan Trust |
930,000 | 749,117 | ||||||
| 5.820%, 03/25/37 (l) |
769,770 | 681,130 | ||||||
| 5.866%, 01/25/37 (l) |
2,284,419 | 1,883,596 | ||||||
| Yale Mortgage Loan Trust |
714,278 | 227,665 | ||||||
|
|
|
|||||||
| 25,342,029 | ||||||||
|
|
|
|||||||
| Asset-Backed - Manufactured Housing—0.4% | ||||||||
| Bank of America Manufactured Housing Contract Trust |
470,000 | 98,185 | ||||||
| 7.315%, 12/10/25 (a) |
4,000,000 | 674,105 | ||||||
| BCMSC Trust |
1,270,292 | 142,245 | ||||||
| 7.830%, 06/15/30 (a) |
1,178,847 | 136,449 | ||||||
| 8.290%, 06/15/30 (a) |
850,435 | 104,219 | ||||||
| Cascade MH Asset Trust |
1,631,453 | 1,562,406 | ||||||
| Conseco Finance Corp. |
1,465,503 | 1,380,320 | ||||||
| 7.500%, 03/01/30 (a) |
356,756 | 123,476 | ||||||
| 7.860%, 03/01/30 (a) |
333,130 | 120,150 | ||||||
| Conseco Finance Securitizations Corp. |
878,314 | 238,311 | ||||||
| 8.060%, 09/01/29 (a) |
586,391 | 108,313 | ||||||
| 8.200%, 05/01/31 |
1,604,918 | 448,589 | ||||||
| Credit Suisse First Boston Mortgage Securities Corp. |
259,736 | 259,067 | ||||||
| Credit-Based Asset Servicing & Securitization LLC |
3,983,201 | 3,020,855 | ||||||
| Greenpoint Manufactured Housing |
56,535 | 56,412 | ||||||
| 9.230%, 12/15/29 (a) |
358,373 | 340,526 | ||||||
| Lehman ABS Manufactured Housing Contract Trust |
683,850 | 688,219 | ||||||
See accompanying notes to financial statements.
BHFTII-20
Brighthouse Funds Trust II
BlackRock Bond Income Portfolio
Schedule of Investments as of December 31, 2023
Asset-Backed Securities—(Continued)
| Security Description | Principal Amount* |
Value | ||||||
| Asset-Backed - Manufactured Housing—(Continued) | ||||||||
| Oakwood Mortgage Investors, Inc. |
158,340 | $ | 82,316 | |||||
| 7.620%, 06/15/32 (a) |
806,728 | 783,638 | ||||||
| Origen Manufactured Housing Contract Trust |
161,838 | 157,375 | ||||||
| 7.820%, 03/15/32 (a) |
200,504 | 194,900 | ||||||
|
|
|
|||||||
| 10,720,076 | ||||||||
|
|
|
|||||||
| Asset-Backed - Other—7.7% | ||||||||
| 510 Loan Acquisition Trust |
757,816 | 755,044 | ||||||
| 522 Funding CLO Ltd. |
625,000 | 624,994 | ||||||
| 9.327%, 3M TSFR + 3.912%, 04/20/30 (144A) (a) |
360,000 | 360,016 | ||||||
| AGL CLO 12 Ltd. |
1,310,000 | 1,309,147 | ||||||
| AGL CLO 14 Ltd. |
1,330,000 | 1,329,943 | ||||||
| AGL Core CLO 15 Ltd. |
250,000 | 249,615 | ||||||
| AGL Core CLO 4 Ltd. |
860,000 | 857,940 | ||||||
| AIMCO CLO |
940,000 | 939,504 | ||||||
| 7.264%, 3M TSFR + 1.862%, 10/17/34 (144A) (a) |
250,000 | 246,427 | ||||||
| Allegro CLO II-S Ltd. |
502,699 | 502,495 | ||||||
| ALM Ltd. |
1,220,000 | 1,218,336 | ||||||
| ALME Loan Funding V DAC |
270,000 | 293,955 | ||||||
| AMMC CLO XIII Ltd. |
72,716 | 72,716 | ||||||
| Anchorage Capital CLO 17 Ltd. |
1,890,000 | 1,881,391 | ||||||
| Anchorage Capital CLO 3-R Ltd. |
1,270,000 | 1,263,901 | ||||||
| 7.502%, 3M TSFR + 2.112%, 01/28/31 (144A) (a) |
250,000 | 244,526 | ||||||
| Anchorage Capital CLO 6 Ltd. |
594,869 | 594,845 | ||||||
| Anchorage Capital CLO 7 Ltd. |
730,980 | 730,230 | ||||||
| 7.402%, 3M TSFR + 2.012%, 01/28/31 (144A) (a) |
1,480,000 | 1,479,945 | ||||||
| 9.152%, 3M TSFR + 3.762%, 01/28/31 (144A) (a) |
250,000 | 244,919 | ||||||
| Anchorage Capital CLO 8 Ltd. |
1,050,000 | 1,049,535 | ||||||
| Anchorage Capital CLO Ltd. |
544,291 | 544,772 | ||||||
| 7.805%, 3M TSFR + 2.412%, 10/13/30 (144A) (a) |
590,000 | 587,448 | ||||||
| Apidos CLO XXII Ltd. |
250,000 | 249,171 | ||||||
| Apidos CLO XXVI Ltd. |
250,000 | 248,117 | ||||||
| Asset-Backed - Other—(Continued) | ||||||||
| ARES European CLO XII DAC |
297,000 | 321,182 | ||||||
| ARES LII CLO Ltd. |
1,330,000 | 1,326,421 | ||||||
| ARES LIX CLO Ltd. |
250,000 | 247,690 | ||||||
| ARES LVI CLO Ltd. |
350,000 | 349,565 | ||||||
| ARES XXXVII CLO Ltd. |
346,357 | 346,347 | ||||||
| Arm Master Trust LLC Agricultural Loan Backed Notes |
370,000 | 354,642 | ||||||
| Armada Euro CLO III DAC |
250,000 | 271,903 | ||||||
| ASSURANT CLO Ltd. |
472,445 | 471,762 | ||||||
| Avoca CLO XXII DAC |
150,000 | 158,249 | ||||||
| 6.865%, 3M EURIBOR + 2.900%, 04/15/35 (144A) (EUR) (a) |
250,000 | 254,905 | ||||||
| Bain Capital Credit CLO Ltd. |
250,000 | 247,222 | ||||||
| 7.258%, 3M TSFR + 1.862%, 07/19/31 (144A) (a) |
250,000 | 247,581 | ||||||
| 8.760%, 3M TSFR + 3.362%, 07/24/34 (144A) (a) |
250,000 | 243,516 | ||||||
| Ballyrock CLO Ltd. |
250,000 | 248,115 | ||||||
| Bankers Healthcare Group Securitization Trust |
100,000 | 95,752 | ||||||
| Bardot CLO Ltd. |
250,000 | 245,988 | ||||||
| Barings CLO Ltd. |
250,000 | 249,438 | ||||||
| 6.867%, 3M TSFR + 1.452%, 10/20/30 (144A) (a) |
684,312 | 684,719 | ||||||
| 7.077%, 3M TSFR + 1.662%, 01/20/31 (144A) (a) |
250,000 | 246,982 | ||||||
| Battalion CLO 18 Ltd. |
298,000 | 296,174 | ||||||
| Battalion CLO VIII Ltd. |
1,105,230 | 1,104,655 | ||||||
| 7.207%, 3M TSFR + 1.812%, 07/18/30 (144A) (a) |
642,000 | 640,878 | ||||||
| Battalion CLO XI Ltd. |
250,000 | 246,207 | ||||||
| Battalion CLO XX Ltd. |
730,000 | 726,070 | ||||||
| Benefit Street Partners CLO III Ltd. |
290,000 | 289,716 | ||||||
| Benefit Street Partners CLO V-B Ltd. |
992,749 | 990,795 | ||||||
| Benefit Street Partners CLO VIII Ltd. |
1,689,877 | 1,689,020 | ||||||
| Benefit Street Partners CLO XII Ltd. |
270,000 | 266,247 | ||||||
| Benefit Street Partners CLO XX Ltd. |
250,000 | 247,508 | ||||||
See accompanying notes to financial statements.
BHFTII-21
Brighthouse Funds Trust II
BlackRock Bond Income Portfolio
Schedule of Investments as of December 31, 2023
Asset-Backed Securities—(Continued)
| Security Description | Principal Amount* |
Value | ||||||
| Asset-Backed - Other—(Continued) | ||||||||
| BHG Securitization Trust |
130,000 | $ | 112,093 | |||||
| BlueMountain CLO Ltd. |
524,845 | 525,027 | ||||||
| BlueMountain CLO XXII Ltd. |
660,000 | 655,000 | ||||||
| BlueMountain CLO XXVIII Ltd. |
100,000 | 99,952 | ||||||
| BlueMountain EUR CLO DAC |
560,000 | 597,572 | ||||||
| Bridge Street CLO II Ltd. |
250,000 | 249,527 | ||||||
| Buttermilk Park CLO Ltd. |
250,000 | 249,947 | ||||||
| C-BASS Trust |
155,255 | 97,251 | ||||||
| Canyon Capital CLO Ltd. |
460,000 | 459,126 | ||||||
| Canyon CLO Ltd. |
290,000 | 286,833 | ||||||
| Carlyle Global Market Strategies CLO Ltd. |
923,210 | 920,796 | ||||||
| Carlyle U.S. CLO Ltd. |
610,000 | 609,980 | ||||||
| 6.836%, 3M TSFR + 1.442%, 01/15/30 (144A) (a) |
1,346,644 | 1,345,976 | ||||||
| Carrington Mortgage Loan Trust |
126,404 | 122,311 | ||||||
| CBAM Ltd. |
1,509,964 | 1,510,085 | ||||||
| Cedar Funding II CLO Ltd. |
535,000 | 532,650 | ||||||
| 7.027%, 3M TSFR + 1.612%, 04/20/34 (144A) (a) |
510,000 | 499,332 | ||||||
| Cedar Funding IX CLO Ltd. |
373,779 | 373,041 | ||||||
| Cedar Funding V CLO Ltd. |
770,000 | 769,592 | ||||||
| Cedar Funding VI CLO Ltd. |
3,020,000 | 3,003,302 | ||||||
| Cedar Funding XI CLO Ltd. |
250,000 | 248,113 | ||||||
| Chase Funding Trust |
19,738 | 19,625 | ||||||
| CIFC Funding Ltd. |
||||||||
| 6.657%, 3M TSFR + 1.262%, 04/18/31 (144A) (a) |
1,265,327 | 1,265,351 | ||||||
| 6.684%, 3M TSFR + 1.272%, 04/23/29 (144A) (a) |
725,266 | 725,236 | ||||||
| 6.706%, 3M TSFR + 1.312%, 07/15/33 (144A) (a) |
1,100,000 | 1,099,972 | ||||||
| 6.796%, 3M TSFR + 1.402%, 07/15/34 (144A) (a) |
280,000 | 279,866 | ||||||
| 6.806%, 3M TSFR + 1.412%, 07/15/36 (144A) (a) |
250,000 | 249,989 | ||||||
| 6.807%, 3M TSFR + 1.392%, 10/20/34 (144A) (a) |
1,190,000 | 1,189,559 | ||||||
| 7.249%, 3M TSFR + 1.862%, 04/27/31 (144A) (a) |
250,000 | 249,058 | ||||||
| 7.406%, 3M TSFR + 2.012%, 07/16/30 (144A) (a) |
250,000 | 249,996 | ||||||
| Citigroup Mortgage Loan Trust, Inc. |
564,114 | 384,940 | ||||||
| Clear Creek CLO Ltd. |
149,019 | 148,946 | ||||||
| Asset-Backed - Other—(Continued) | ||||||||
| Clontarf Park CLO DAC |
310,000 | 334,664 | ||||||
| Clover CLO LLC |
250,000 | 249,872 | ||||||
| Countrywide Asset-Backed Certificates Trust |
698,726 | 606,875 | ||||||
| 5.790%, 1M TSFR + 0.434%, 09/25/46 (a) |
1,065 | 1,063 | ||||||
| Credit-Based Asset Servicing & Securitization LLC |
140,087 | 116,009 | ||||||
| CVC Cordatus Loan Fund IV DAC |
250,000 | 262,898 | ||||||
| CWHEQ Revolving Home Equity Loan Resuritization Trust |
21,328 | 21,315 | ||||||
| CWHEQ Revolving Home Equity Loan Trust |
119,752 | 117,920 | ||||||
| 5.656%, 1M TSFR + 0.294%, 05/15/35 (a) |
44,991 | 44,777 | ||||||
| Diameter Capital CLO 1 Ltd. |
250,000 | 249,172 | ||||||
| Dryden 43 Senior Loan Fund |
910,000 | 906,882 | ||||||
| Dryden 45 Senior Loan Fund |
540,000 | 534,598 | ||||||
| Dryden 53 CLO Ltd. |
5,642,183 | 5,642,533 | ||||||
| Dryden 65 CLO Ltd. |
250,000 | 247,953 | ||||||
| Dryden 77 CLO Ltd. |
610,000 | 609,966 | ||||||
| Dryden 87 CLO Ltd. |
400,000 | 399,035 | ||||||
| Dryden XXVIII Senior Loan Fund |
1,939,219 | 1,938,339 | ||||||
| Eaton Vance CLO Ltd. |
710,000 | 704,862 | ||||||
| Elmwood CLO II Ltd. |
750,000 | 749,956 | ||||||
| 7.327%, 3M TSFR + 1.912%, 04/20/34 (144A) (a) |
250,000 | 249,988 | ||||||
| 12.477%, 3M TSFR + 7.062%, 04/20/34 (144A) (a) |
250,000 | 248,192 | ||||||
| Elmwood CLO X Ltd. |
1,220,000 | 1,219,930 | ||||||
| 7.627%, 3M TSFR + 2.212%, 10/20/34 (144A) (a) |
250,000 | 247,475 | ||||||
| Elmwood CLO XII Ltd. |
250,000 | 249,864 | ||||||
| Equity One Mortgage Pass-Through Trust |
2,987,903 | 2,342,867 | ||||||
| Euro-Galaxy III CLO DAC |
290,000 | 310,563 | ||||||
| Fairstone Financial Issuance Trust I |
323,000 | 233,331 | ||||||
| Fidelity Grand Harbour CLO DAC |
250,000 | 262,148 | ||||||
| First Franklin Mortgage Loan Trust | ||||||||
| 5.620%, 1M TSFR + 0.264%, 12/25/36 (a) |
1,495,317 | 1,239,383 | ||||||
| 5.710%, 1M TSFR + 0.354%, 10/25/36 (a) |
139,544 | 92,060 | ||||||
See accompanying notes to financial statements.
BHFTII-22
Brighthouse Funds Trust II
BlackRock Bond Income Portfolio
Schedule of Investments as of December 31, 2023
Asset-Backed Securities—(Continued)
| Security Description | Principal Amount* |
Value | ||||||
| Asset-Backed - Other—(Continued) | ||||||||
| First Franklin Mortgage Loan Trust | ||||||||
| 5.750%, 1M TSFR + 0.394%, 12/25/36 (a) |
3,742,533 | $ | 1,498,806 | |||||
| 5.890%, 1M TSFR + 0.534%, 12/25/36 (a) |
6,884,623 | 2,780,244 | ||||||
| Flatiron CLO 18 Ltd. |
230,368 | 230,307 | ||||||
| Flatiron CLO 21 Ltd. |
2,390,000 | 2,389,904 | ||||||
| Foundation Finance Trust |
593,071 | 538,067 | ||||||
| Fremont Home Loan Trust |
647,619 | 491,754 | ||||||
| FS Rialto Issuer LLC |
566,000 | 556,265 | ||||||
| Galaxy XXII CLO Ltd. |
660,000 | 660,125 | ||||||
| Galaxy XXVIII CLO Ltd. |
243,284 | 243,363 | ||||||
| Generate CLO 6 Ltd. |
250,000 | 250,030 | ||||||
| Gilbert Park CLO Ltd. |
861,000 | 851,541 | ||||||
| GoldenTree Loan Management U.S. CLO 1 Ltd. |
910,000 | 909,965 | ||||||
| Goldman Home Improvement Trust Issuer Trust |
403,000 | 367,775 | ||||||
| Grippen Park CLO Ltd. |
250,000 | 248,750 | ||||||
| Henley CLO IV DAC |
100,000 | 105,760 | ||||||
| Highbridge Loan Management |
260,336 | 260,288 | ||||||
| Home Partners of America Trust |
1,362,531 | 1,189,271 | ||||||
| HPS Loan Management Ltd. |
958,141 | 956,756 | ||||||
| 6.817%, 3M TSFR + 1.402%, 04/20/34 (144A) (a) |
1,160,000 | 1,159,994 | ||||||
| Invesco Euro CLO V DAC |
100,000 | 105,518 | ||||||
| Knollwood CDO Ltd. |
1,176,180 | 118 | ||||||
| LCM 26 Ltd. |
1,910,117 | 1,908,182 | ||||||
| LCM 29 Ltd. |
250,000 | 248,583 | ||||||
| Lehman ABS Mortgage Loan Trust |
125,864 | 79,499 | ||||||
| Loanpal Solar Loan Ltd. |
806,057 | 627,088 | ||||||
| 2.750%, 07/20/47 (144A) |
853,576 | 673,804 | ||||||
| Logan CLO I Ltd. |
730,000 | 729,606 | ||||||
| Long Beach Mortgage Loan Trust |
453,869 | 208,390 | ||||||
| 5.790%, 1M TSFR + 0.434%, 08/25/36 (a) |
510,941 | 199,353 | ||||||
| Asset-Backed - Other—(Continued) | ||||||||
| Madison Park Euro Funding XVI DAC |
250,000 | $ | 257,251 | |||||
| Madison Park Funding XIII Ltd. |
983,712 | 983,366 | ||||||
| Madison Park Funding XIX Ltd. |
||||||||
| 6.918%, 3M TSFR + 1.600%, 01/22/37 (144A) (a) |
1,094,000 | 1,094,000 | ||||||
| 6.594%, 3M TSFR + 1.182%, 01/22/28 (144A) (a) |
772,572 | 772,186 | ||||||
| Madison Park Funding XLV Ltd. |
790,000 | 790,007 | ||||||
| Madison Park Funding XVIII Ltd. |
4,887,464 | 4,882,812 | ||||||
| Madison Park Funding XXIII Ltd. |
250,000 | 247,276 | ||||||
| Madison Park Funding XXV Ltd. |
250,000 | 249,559 | ||||||
| Madison Park Funding XXVI Ltd. |
1,957,550 | 1,957,523 | ||||||
| Madison Park Funding XXXVII Ltd. |
350,000 | 348,721 | ||||||
| Madison Park Funding XXXVIII Ltd. |
860,000 | 859,089 | ||||||
| Marble Point CLO XI Ltd. |
491,895 | 491,940 | ||||||
| Mariner CLO LLC |
125,423 | 125,233 | ||||||
| 7.174%, 3M TSFR + 1.762%, 07/23/29 (144A) (a) |
522,000 | 520,242 | ||||||
| 7.724%, 3M TSFR + 2.312%, 07/23/29 (144A) (a) |
1,015,000 | 1,010,599 | ||||||
| Mariner Finance Issuance Trust |
137,089 | 136,788 | ||||||
| 4.010%, 07/20/32 (144A) |
490,000 | 485,858 | ||||||
| 4.680%, 11/20/36 (144A) |
400,000 | 328,402 | ||||||
| Merrill Lynch First Franklin Mortgage Loan Trust |
7,451,036 | 5,431,831 | ||||||
| Mill City Solar Loan Ltd. |
971,011 | 856,897 | ||||||
| Mosaic Solar Loan Trust |
131,729 | 115,001 | ||||||
| 2.880%, 09/20/40 (144A) |
110,553 | 98,211 | ||||||
| MP CLO III Ltd. |
769,837 | 769,271 | ||||||
| Neuberger Berman CLO XVI-S Ltd. |
440,000 | 437,603 | ||||||
| Neuberger Berman Loan Advisers CLO 26 Ltd. |
1,702,504 | 1,701,974 | ||||||
| Neuberger Berman Loan Advisers CLO 37 Ltd. |
250,000 | 248,759 | ||||||
| Neuberger Berman Loan Advisers CLO 42 Ltd. |
680,000 | 680,006 | ||||||
| Nomura Asset Acceptance Corp. Alternative Loan Trust |
65,082 | 74,546 | ||||||
| Oak Hill European Credit Partners V DAC |
250,000 | 268,214 | ||||||
See accompanying notes to financial statements.
BHFTII-23
Brighthouse Funds Trust II
BlackRock Bond Income Portfolio
Schedule of Investments as of December 31, 2023
Asset-Backed Securities—(Continued)
| Security Description | Principal Amount* |
Value | ||||||
| Asset-Backed - Other—(Continued) | ||||||||
| Oceana Australian Fixed Income Trust |
304,000 | $ | 206,912 | |||||
| 12.500%, 08/31/26 (AUD) † (i) (j) |
456,000 | 310,928 | ||||||
| 12.500%, 08/31/27 (AUD) † (i) (j) |
759,000 | 517,893 | ||||||
| OCP CLO Ltd. |
250,000 | 249,087 | ||||||
| 6.721%, 3M TSFR + 1.342%, 04/26/31 (144A) (a) |
155,793 | 155,666 | ||||||
| 6.767%, 3M TSFR + 1.352%, 07/20/32 (144A) (a) |
500,000 | 499,741 | ||||||
| 6.857%, 3M TSFR + 1.442%, 12/02/34 (144A) (a) |
330,000 | 328,549 | ||||||
| 7.041%, 3M TSFR + 1.662%, 04/26/31 (144A) (a) |
180,000 | 176,827 | ||||||
| 7.560%, 3M TSFR + 2.162%, 04/24/29 (144A) (a) |
911,000 | 911,151 | ||||||
| 7.579%, 3M TSFR + 2.212%, 11/20/30 (144A) (a) |
250,000 | 248,502 | ||||||
| Octagon Investment Partners 18-R Ltd. |
2,083,837 | 2,079,561 | ||||||
| Octagon Investment Partners 33 Ltd. |
224,603 | 224,485 | ||||||
| Octagon Investment Partners 37 Ltd. |
250,000 | 248,483 | ||||||
| Octagon Investment Partners 51 Ltd. |
1,170,000 | 1,169,946 | ||||||
| Octagon Investment Partners XV Ltd. |
250,000 | 248,099 | ||||||
| Octagon Investment Partners XVI Ltd. |
3,342,149 | 3,335,966 | ||||||
| Octagon Investment Partners XVII Ltd. |
3,310,968 | 3,305,237 | ||||||
| OHA Credit Funding 2 Ltd. |
2,340,000 | 2,339,979 | ||||||
| OHA Credit Funding 3 Ltd. |
550,000 | 549,806 | ||||||
| 7.327%, 3M TSFR + 1.912%, 07/02/35 (144A) (a) |
343,000 | 342,668 | ||||||
| OHA Credit Funding 4 Ltd. |
250,000 | 249,878 | ||||||
| OHA Loan Funding Ltd. |
5,603,977 | 5,604,571 | ||||||
| OneMain Financial Issuance Trust |
3,280,000 | 3,068,295 | ||||||
| OZLM Funding IV Ltd. |
6,194,354 | 6,191,381 | ||||||
| OZLM XVIII Ltd. |
479,900 | 479,341 | ||||||
| OZLM XXI Ltd. |
320,000 | 316,327 | ||||||
| OZLM XXII Ltd. |
205,055 | 204,900 | ||||||
| Palmer Square CLO Ltd. |
560,000 | 559,091 | ||||||
| 6.687%, 3M TSFR + 1.292%, 04/18/31 (144A) (a) |
811,424 | 811,015 | ||||||
| 6.756%, 3M TSFR + 1.362%, 07/16/31 (144A) (a) |
1,148,097 | 1,148,108 | ||||||
| 6.759%, 3M TSFR + 1.392%, 05/21/34 (144A) (a) |
4,195,000 | 4,194,773 | ||||||
| 6.794%, 3M TSFR + 1.392%, 01/17/31 (144A) (a) |
851,387 | 851,409 | ||||||
| 6.806%, 3M TSFR + 1.412%, 01/15/35 (144A) (a) |
250,000 | 249,813 | ||||||
| 7.025%, 3M TSFR + 1.650%, 11/15/36 (144A) (a) |
250,000 | 250,000 | ||||||
| 7.329%, 3M TSFR + 1.962%, 05/21/34 (144A) (a) |
250,000 | 249,877 | ||||||
| 11.256%, 3M TSFR + 5.862%, 07/16/31 (144A) (a) |
250,000 | 242,672 | ||||||
| Asset-Backed - Other—(Continued) | ||||||||
| Palmer Square Loan Funding Ltd. |
270,000 | 269,987 | ||||||
| Pikes Peak CLO 1 |
250,000 | 250,116 | ||||||
| Pikes Peak CLO 8 |
1,180,000 | 1,174,926 | ||||||
| Post CLO Ltd. |
250,000 | 246,874 | ||||||
| PRET LLC |
1,082,537 | 1,067,516 | ||||||
| 8.112%, 11/25/53 (144A) (l) |
1,174,012 | 1,191,812 | ||||||
| Prima Capital CRE Securitization Ltd. |
1,740,000 | 1,633,863 | ||||||
| 4.000%, 08/24/49 (144A) |
177,987 | 168,429 | ||||||
| Progress Residential Trust |
500,000 | 446,108 | ||||||
| 3.395%, 04/19/38 (144A) |
967,000 | 865,742 | ||||||
| 3.407%, 05/17/38 (144A) |
1,340,000 | 1,196,017 | ||||||
| 3.436%, 05/17/26 (144A) |
1,070,000 | 957,996 | ||||||
| 3.666%, 12/17/40 (144A) |
345,518 | 298,925 | ||||||
| 4.053%, 11/17/40 (144A) |
221,000 | 183,241 | ||||||
| 4.608%, 12/17/40 (144A) |
1,395,972 | 1,208,716 | ||||||
| Race Point IX CLO Ltd. |
691,495 | 689,864 | ||||||
| Rad CLO 15 Ltd. |
250,000 | 249,567 | ||||||
| Rad CLO 2 Ltd. |
540,000 | 539,986 | ||||||
| Rad CLO 3 Ltd. |
250,000 | 249,085 | ||||||
| 8.406%, 3M TSFR + 3.012%, 04/15/32 (144A) (a) |
250,000 | 245,391 | ||||||
| Rad CLO 4 Ltd. |
250,000 | 250,020 | ||||||
| Redwood Funding Trust |
798,212 | 788,628 | ||||||
| Regatta VI Funding Ltd. |
760,000 | 759,477 | ||||||
| Regatta VII Funding Ltd. |
280,000 | 279,856 | ||||||
| Regatta XVI Funding Ltd. |
250,000 | 249,796 | ||||||
| Regional Management Issuance Trust |
173,000 | 153,043 | ||||||
| 3.875%, 10/17/33 (i) (j) |
3,710,000 | 3,278,898 | ||||||
| Riserva CLO Ltd. |
940,000 | 934,760 | ||||||
| Rockford Tower CLO Ltd. |
856,000 | 852,755 | ||||||
| 6.867%, 3M TSFR + 1.452%, 10/20/30 (144A) (a) |
2,961,605 | 2,960,148 | ||||||
| 7.156%, 3M TSFR + 1.762%, 10/15/29 (144A) (a) |
1,781,000 | 1,778,679 | ||||||
| 7.279%, 3M TSFR + 1.912%, 08/20/32 (144A) (a) |
250,000 | 249,600 | ||||||
| 8.506%, 3M TSFR + 3.112%, 10/15/29 (144A) (a) |
939,000 | 933,171 | ||||||
| Romark WM-R Ltd. |
234,395 | 234,123 | ||||||
| RR 1 LLC |
1,620,000 | 1,619,464 | ||||||
See accompanying notes to financial statements.
BHFTII-24
Brighthouse Funds Trust II
BlackRock Bond Income Portfolio
Schedule of Investments as of December 31, 2023
Asset-Backed Securities—(Continued)
| Security Description | Principal Amount* |
Value | ||||||
| Asset-Backed - Other—(Continued) | ||||||||
| RR 3 Ltd. |
691,151 | $ | 690,794 | |||||
| RR 5 Ltd. |
250,000 | 249,757 | ||||||
| RRX 4 Ltd. |
1,860,000 | 1,860,004 | ||||||
| RRX 5 Ltd. |
250,000 | 248,461 | ||||||
| Service Experts Issuer LLC |
729,714 | 678,043 | ||||||
| SG Mortgage Securities Trust |
570,000 | 402,117 | ||||||
| Signal Peak CLO 1 Ltd. |
1,750,000 | 1,742,144 | ||||||
| 7.464%, 3M TSFR + 2.062%, 04/17/34 (144A) (a) |
490,000 | 486,239 | ||||||
| Signal Peak CLO 2 LLC |
1,412,000 | 1,412,031 | ||||||
| Silver Creek CLO Ltd. |
724,440 | 724,508 | ||||||
| Sixth Street CLO XIX Ltd. |
2,890,000 | 2,885,922 | ||||||
| Sound Point CLO II Ltd. |
436,560 | 436,051 | ||||||
| Sound Point CLO XII Ltd. |
780,000 | 780,183 | ||||||
| Sound Point CLO XV Ltd. |
||||||||
| 6.574%, 3M TSFR + 1.162%, 01/23/29 (144A) (a) |
37,912 | 37,903 | ||||||
| Sound Point CLO XXVIII Ltd. |
350,000 | 349,825 | ||||||
| Soundview Home Loan Trust |
13,865 | 11,888 | ||||||
| Steele Creek CLO Ltd. |
573,971 | 573,956 | ||||||
| Symphony CLO XXIII Ltd. |
250,000 | 249,031 | ||||||
| Symphony CLO XXVI Ltd. |
398,000 | 396,463 | ||||||
| TCI-Flatiron CLO Ltd. |
470,808 | 470,187 | ||||||
| TCW CLO AMR Ltd. |
250,000 | 249,074 | ||||||
| TIAA CLO III Ltd. |
484,714 | 484,458 | ||||||
| TICP CLO VI Ltd. |
820,000 | 817,838 | ||||||
| TICP CLO XII Ltd. |
250,000 | 249,997 | ||||||
| Trestles CLO IV Ltd. |
1,170,000 | 1,169,417 | ||||||
| Trestles CLO Ltd. |
250,000 | 244,587 | ||||||
| Tricon American Homes Trust |
260,000 | 252,894 | ||||||
| 4.960%, 05/17/37 (144A) |
180,000 | 175,576 | ||||||
| Tricon Residential Trust | ||||||||
| 3.692%, 07/17/38 (144A) |
795,000 | 712,616 | ||||||
| Asset-Backed - Other—(Continued) | ||||||||
| Tricon Residential Trust | ||||||||
| 4.133%, 07/17/38 (144A) |
639,000 | 570,376 | ||||||
| Trinitas CLO IV Ltd. |
160,000 | 157,788 | ||||||
| Trinitas CLO XIV Ltd. |
560,000 | 553,705 | ||||||
| Venture 32 CLO Ltd. |
417,084 | 416,538 | ||||||
| VOLT CVI LLC |
1,580,069 | 1,505,321 | ||||||
| Voya CLO Ltd. |
1,708,511 | 1,707,408 | ||||||
| 6.717%, 3M TSFR + 1.302%, 04/20/34 (144A) (a) |
357,000 | 354,099 | ||||||
| 6.786%, 3M TSFR + 1.392%, 10/15/30 (144A) (a) |
798,833 | 798,844 | ||||||
| Voya Euro CLO V DAC |
340,000 | 363,522 | ||||||
| 7.065%, 3M EURIBOR + 3.100%, 04/15/35 (144A) (EUR) (a) |
250,000 | 259,675 | ||||||
| Washington Mutual Asset-Backed Certificates WMABS Trust |
512,509 | 380,529 | ||||||
| 5.830%, 1M TSFR + 0.474%, 09/25/36 (a) |
1,677,857 | 458,772 | ||||||
| Whitebox CLO I Ltd. |
500,000 | 499,338 | ||||||
| 12.060%, 3M TSFR + 6.662%, 07/24/32 (144A) (a) |
250,000 | 230,607 | ||||||
| Whitebox CLO III Ltd. |
||||||||
| 9.006%, 3M TSFR + 3.612%, 10/15/34 (144A) (a) |
250,000 | 250,015 | ||||||
| 12.506%, 3M TSFR + 7.112%, 10/15/34 (144A) (a) |
250,000 | 244,776 | ||||||
|
|
|
|||||||
| 215,615,779 | ||||||||
|
|
|
|||||||
| Asset-Backed - Student Loan—0.8% | ||||||||
| College Avenue Student Loans LLC |
146,137 | 128,161 | ||||||
| 2.720%, 06/25/52 (144A) |
89,611 | 79,642 | ||||||
| 4.110%, 07/26/55 (144A) |
100,000 | 86,620 | ||||||
| Navient Private Education Loan Trust |
281,573 | 277,503 | ||||||
| Navient Private Education Refi Loan Trust |
280,000 | 257,362 | ||||||
| 2.690%, 07/15/69 (144A) |
450,000 | 358,330 | ||||||
| 3.480%, 04/15/60 (144A) |
710,000 | 628,247 | ||||||
| 4.000%, 04/15/60 (144A) |
230,000 | 208,816 | ||||||
| Nelnet Student Loan Trust |
2,102,119 | 1,694,398 | ||||||
| 2.680%, 04/20/62 (144A) |
3,120,000 | 2,556,626 | ||||||
| 2.850%, 04/20/62 (144A) |
3,661,000 | 2,985,873 | ||||||
| 2.900%, 04/20/62 (144A) |
1,640,000 | 1,367,583 | ||||||
| 3.360%, 04/20/62 (144A) |
110,000 | 88,821 | ||||||
| 3.500%, 04/20/62 (144A) |
170,000 | 132,222 | ||||||
| 3.570%, 04/20/62 (144A) |
142,000 | 115,949 | ||||||
| 3.750%, 04/20/62 (144A) |
277,000 | 224,264 | ||||||
| 4.380%, 04/20/62 (144A) |
100,000 | 77,867 | ||||||
| 4.440%, 04/20/62 (144A) |
160,000 | 131,674 | ||||||
| 4.750%, 04/20/62 (144A) |
260,000 | 216,739 | ||||||
| 4.930%, 04/20/62 (144A) |
374,000 | 311,262 | ||||||
| 7.574%, SOFR30A + 2.250%, 11/25/53 (144A) (a) |
800,000 | 797,584 | ||||||
See accompanying notes to financial statements.
BHFTII-25
Brighthouse Funds Trust II
BlackRock Bond Income Portfolio
Schedule of Investments as of December 31, 2023
Asset-Backed Securities—(Continued)
| Security Description | Principal Amount* |
Value | ||||||
| Asset-Backed - Student Loan—(Continued) | ||||||||
| Prodigy Finance Ltd. |
374,258 | $ | 371,035 | |||||
| 7.970%, 1M TSFR + 2.614%, 07/25/51 (144A) (a) |
86,204 | 85,706 | ||||||
| Scholar Funding Trust |
2,570,487 | 2,524,952 | ||||||
| SLM Private Education Loan Trust |
2,391,869 | 2,515,444 | ||||||
| SMB Private Education Loan Trust |
150,000 | 137,869 | ||||||
| 2.990%, 01/15/53 (144A) |
1,339,466 | 1,138,511 | ||||||
| 3.000%, 01/15/53 (144A) |
90,613 | 77,714 | ||||||
| 3.500%, 12/17/40 (144A) |
1,142,870 | 1,106,009 | ||||||
| 3.860%, 01/15/53 (144A) |
751,346 | 675,690 | ||||||
| 3.930%, 01/15/53 (144A) |
88,378 | 81,660 | ||||||
|
|
|
|||||||
| 21,440,133 | ||||||||
|
|
|
|||||||
| Total Asset-Backed Securities |
274,441,237 | |||||||
|
|
|
|||||||
| Mortgage-Backed Securities—8.0% |
| |||||||
| Collateralized Mortgage Obligations—3.6% | ||||||||
| Agate Bay Mortgage Trust |
104,000 | 64,147 | ||||||
| 3.534%, 04/25/45 (144A) (a) |
150,000 | 98,636 | ||||||
| 3.655%, 01/25/45 (144A) (a) |
130,000 | 85,202 | ||||||
| Ajax Mortgage Loan Trust |
||||||||
| Zero Coupon, 12/25/57 (144A) (a) |
21,826 | 9,204 | ||||||
| Zero Coupon, 11/25/58 (144A) |
7,232 | 4,714 | ||||||
| 1.740%, 12/25/60 (144A) (a) |
3,835,409 | 3,335,906 | ||||||
| 1.875%, 06/25/61 (144A) (a) |
12,526,365 | 11,937,918 | ||||||
| 2.000%, 03/25/60 (144A) (l) |
3,817,908 | 3,661,723 | ||||||
| 2.115%, 01/25/61 (144A) (l) |
1,661,438 | 1,608,102 | ||||||
| 2.250%, 06/25/60 (144A) (l) |
550,575 | 542,589 | ||||||
| 2.250%, 09/27/60 (144A) (l) |
53,959 | 53,289 | ||||||
| 2.693%, 12/25/60 (144A) (a) |
744,000 | 619,190 | ||||||
| 2.940%, 12/25/60 (144A) (a) |
293,000 | 241,291 | ||||||
| 3.729%, 12/25/60 (144A) (a) |
449,000 | 376,350 | ||||||
| American Home Mortgage Assets Trust |
311,824 | 210,725 | ||||||
| American Home Mortgage Investment Trust |
3,776,336 | 2,016,722 | ||||||
| Angel Oak Mortgage Trust |
1,840,000 | 1,786,061 | ||||||
| APS Resecuritization Trust |
171,736 | 171,637 | ||||||
| Banc of America Alternative Loan Trust |
683,205 | 661,973 | ||||||
| Barclays Mortgage Trust |
2,843,835 | 2,624,915 | ||||||
| Chase Mortgage Finance Trust |
1,303,339 | 1,254,511 | ||||||
| 6.000%, 12/25/37 |
6,240,709 | 2,625,423 | ||||||
| CHL Mortgage Pass-Through Trust |
3,102,478 | 944,701 | ||||||
| Collateralized Mortgage Obligations—(Continued) | ||||||||
| CHL Mortgage Pass-Through Trust |
2,881,808 | 1,293,639 | ||||||
| 6.000%, 08/25/37 |
5,614,273 | 2,478,672 | ||||||
| 6.000%, 01/25/38 |
938,104 | 429,940 | ||||||
| Countrywide Alternative Loan Trust |
856,945 | 709,155 | ||||||
| 5.500%, 04/25/37 |
529,032 | 273,987 | ||||||
| 5.662%, 1M TSFR + 0.304%, 03/20/47 (a) |
829,678 | 675,335 | ||||||
| 5.672%, 1M TSFR + 0.314%, 07/20/46 (a) |
1,364,234 | 1,086,138 | ||||||
| 5.750%, 1M TSFR + 0.394%, 04/25/47 (a) |
393,718 | 344,494 | ||||||
| 5.762%, 1M TSFR + 0.404%, 12/20/46 (a) |
3,545,107 | 3,055,539 | ||||||
| 5.850%, 1M TSFR + 0.494%, 10/25/46 (a) |
534,829 | 480,590 | ||||||
| 5.930%, 1M TSFR + 0.574%, 11/25/36 (a) |
527,322 | 426,439 | ||||||
| 5.932%, 1M TSFR + 0.574%, 05/20/46 (a) |
2,236,340 | 1,881,386 | ||||||
| 5.970%, 1M TSFR + 0.614%, 07/25/46 (a) |
2,424,212 | 2,035,693 | ||||||
| 6.000%, 04/25/37 |
89,900 | 43,039 | ||||||
| 6.000%, 05/25/37 |
1,947,139 | 962,312 | ||||||
| 6.030%, 1M TSFR + 0.394%, 08/25/35 (a) |
4,846,518 | 4,406,386 | ||||||
| 6.742%, 12M MTA + 1.730%, 11/25/46 (a) |
1,586,462 | 1,219,433 | ||||||
| Countrywide Home Reperforming Loan REMIC Trust |
191,381 | 178,849 | ||||||
| Cross Mortgage Trust |
498,026 | 506,138 | ||||||
| CSFB Mortgage-Backed Pass-Through Certificates |
409,170 | 96,010 | ||||||
| CSMC Trust |
560,000 | 519,898 | ||||||
| 9.441%, 12/25/67 (144A) (a) |
2,142,073 | 2,213,631 | ||||||
| CSMC Trust Capital Certificates |
1,704,388 | 1,635,273 | ||||||
| 6.500%, 10/27/37 (144A) |
2,614,596 | 1,051,858 | ||||||
| Deutsche Alt-A Securities, Inc. Mortgage Loan Trust |
271,788 | 241,394 | ||||||
| GreenPoint Mortgage Funding Trust |
89,034 | 78,072 | ||||||
| GS Mortgage-Backed Securities Corp. Trust |
251,897 | 214,278 | ||||||
| GSR Mortgage Loan Trust |
367,062 | 235,457 | ||||||
| HarborView Mortgage Loan Trust |
1,090,908 | 866,021 | ||||||
| Impac Secured Assets Trust |
144,269 | 127,999 | ||||||
| IndyMac INDX Mortgage Loan Trust |
624,694 | 416,947 | ||||||
| JP Morgan Alternative Loan Trust |
129,419 | 116,040 | ||||||
| 5.890%, 1M TSFR + 0.534%, 03/25/37 (a) |
635,444 | 588,294 | ||||||
| JP Morgan Mortgage Trust | ||||||||
| 0.269%, 02/25/52 (144A) (a) (b) |
8,749,179 | 114,298 | ||||||
| 0.500%, 02/25/52 (144A) (a) (b) |
8,749,936 | 238,512 | ||||||
| 2.500%, 02/25/52 (144A) (a) |
6,828,000 | 5,499,192 | ||||||
| 3.203%, 02/25/52 (144A) (a) |
124,505 | 49,629 | ||||||
| 3.269%, 02/25/52 (144A) (a) |
959,306 | 757,918 | ||||||
| 6.500%, 08/25/36 |
182,661 | 61,471 | ||||||
| Legacy Mortgage Asset Trust |
2,787,911 | 2,691,468 | ||||||
See accompanying notes to financial statements.
BHFTII-26
Brighthouse Funds Trust II
BlackRock Bond Income Portfolio
Schedule of Investments as of December 31, 2023
Mortgage-Backed Securities—(Continued)
| Security Description | Principal Amount* |
Value | ||||||
| Collateralized Mortgage Obligations—(Continued) | ||||||||
| Legacy Mortgage Asset Trust |
795,112 | $ | 757,298 | |||||
| 5.734%, 01/25/60 (144A) (l) |
52,726 | 52,681 | ||||||
| MASTR Resecuritization Trust |
216,857 | 95,247 | ||||||
| Merrill Lynch Mortgage Investors Trust |
434,137 | 303,776 | ||||||
| MFA Trust |
540,000 | 415,910 | ||||||
| Morgan Stanley Resecuritization Trust |
3,641,341 | 3,093,018 | ||||||
| Mortgage Loan Resecuritization Trust |
728,733 | 694,588 | ||||||
| New Residential Mortgage Loan Trust |
197,131 | 189,535 | ||||||
| Nomura Asset Acceptance Corp. Alternative Loan Trust |
217,215 | 41,043 | ||||||
| NYMT Loan Trust |
1,846,373 | 1,838,042 | ||||||
| Preston Ridge Partners Mortgage LLC |
924,368 | 921,379 | ||||||
| Residential Asset Securitization Trust |
11,326,874 | 1,449,326 | ||||||
| 6.020%, 1M TSFR + 0.664%, 09/25/37 (a) |
11,326,874 | 3,333,375 | ||||||
| 6.250%, 12/25/36 |
3,603,353 | 2,538,006 | ||||||
| RFMSI Trust |
774,425 | 542,949 | ||||||
| RMF Buyout Issuance Trust |
509,000 | 449,469 | ||||||
| Sequoia Mortgage Trust |
148,138 | 108,331 | ||||||
| Structured Adjustable Rate Mortgage Loan Trust |
165,762 | 92,192 | ||||||
| 4.236%, 04/25/47 (a) |
509,889 | 237,819 | ||||||
| Structured Asset Mortgage Investments II Trust |
771,705 | 650,992 | ||||||
| 5.890%, 1M TSFR + 0.534%, 05/25/46 (a) |
135,255 | 93,494 | ||||||
| 5.930%, 1M TSFR + 0.574%, 02/25/36 (a) |
537,077 | 453,073 | ||||||
| Visio Trust |
169,000 | 127,504 | ||||||
| Vista Point Securitization Trust |
100,000 | 88,434 | ||||||
| Voyager OPTONE Delaware Trust |
2,937,548 | 678,255 | ||||||
| WaMu Mortgage Pass-Through Certificates Trust | ||||||||
| 3.325%, 04/25/37 (a) |
4,113,054 | 3,561,897 | ||||||
| 5.762%, 12M MTA + 0.750%, 06/25/47 (a) |
1,366,856 | 1,093,027 | ||||||
| Washington Mutual Mortgage Pass-Through Certificates WMALT Trust |
893,849 | 308,452 | ||||||
| 5.712%, 12M MTA + 0.700%, 01/25/47 (a) |
2,185,178 | 1,735,765 | ||||||
| 5.990%, 1M TSFR + 0.634%, 12/25/35 (a) |
1,862,518 | 1,540,660 | ||||||
|
|
|
|||||||
| 102,721,290 | ||||||||
|
|
|
|||||||
| Commercial Mortgage-Backed Securities—4.4% | ||||||||
| 1211 Avenue of the Americas Trust |
230,000 | 197,685 | ||||||
| 245 Park Avenue Trust |
5,000,000 | 27,930 | ||||||
| 3.657%, 06/05/37 (144A) (a) |
207,000 | 165,770 | ||||||
| 280 Park Avenue Mortgage Trust |
500,000 | 455,000 | ||||||
| 7.777%, 1M TSFR + 2.419%, 09/15/34 (144A) (a) |
1,473,000 | 1,323,478 | ||||||
| ALEN Mortgage Trust |
453,000 | 274,949 | ||||||
| Arbor Multifamily Mortgage Securities Trust |
126,000 | 69,724 | ||||||
| Ashford Hospitality Trust |
138,000 | 132,109 | ||||||
| Atrium Hotel Portfolio Trust |
1,041,000 | 903,373 | ||||||
| BAMLL Commercial Mortgage Securities Trust |
250,000 | 221,899 | ||||||
| 6.809%, 1M TSFR + 1.447%, 11/15/33 (144A) † (a) |
510,000 | 450,515 | ||||||
| 6.909%, 1M TSFR + 1.547%, 11/15/32 (144A) † (a) |
300,000 | 251,068 | ||||||
| 7.409%, 1M TSFR + 2.047%, 11/15/32 (144A) † (a) |
630,000 | 537,558 | ||||||
| Bank |
8,619,000 | 156,343 | ||||||
| Bank of America Merrill Lynch Commercial Mortgage Trust |
4,070,000 | 67,133 | ||||||
| 1.241%, 02/15/50 (144A) (a) (b) |
2,000,000 | 66,339 | ||||||
| Bayview Commercial Asset Trust |
76,369 | 71,596 | ||||||
| 5.875%, 1M TSFR + 0.519%, 03/25/37 (144A) (a) |
116,359 | 106,804 | ||||||
| 5.920%, 1M TSFR + 0.564%, 01/25/36 (144A) (a) |
56,947 | 51,965 | ||||||
| 5.920%, 1M TSFR + 0.564%, 10/25/36 (144A) (a) |
77,709 | 73,022 | ||||||
| 6.010%, 1M TSFR + 0.654%, 04/25/36 (144A) (a) |
65,105 | 59,670 | ||||||
| 6.145%, 1M TSFR + 0.789%, 01/25/36 (144A) (a) |
42,394 | 38,941 | ||||||
| 6.970%, 1M TSFR + 1.614%, 12/25/37 (144A) (a) |
957,016 | 816,417 | ||||||
| BB-UBS Trust |
85,480,000 | 322,815 | ||||||
| 4.026%, 11/05/36 (144A) (a) |
330,000 | 281,946 | ||||||
| BBCMS Mortgage Trust |
280,000 | 259,700 | ||||||
| Beast Mortgage Trust | ||||||||
| 6.227%, 1M TSFR + 0.864%, 04/15/36 (144A) (a) |
5,500,000 | 5,393,035 | ||||||
| 6.577%, 1M TSFR + 1.214%, 04/15/36 (144A) (a) |
604,000 | 583,524 | ||||||
| 6.827%, 1M TSFR + 1.464%, 04/15/36 (144A) (a) |
751,000 | 724,840 | ||||||
| 7.077%, 1M TSFR + 1.714%, 04/15/36 (144A) (a) |
697,000 | 667,211 | ||||||
| 7.577%, 1M TSFR + 2.214%, 04/15/36 (144A) (a) |
589,000 | 556,055 | ||||||
| 8.377%, 1M TSFR + 3.014%, 04/15/36 (144A) (a) |
576,000 | 544,991 | ||||||
| 9.277%, 1M TSFR + 3.914%, 04/15/36 (144A) (a) |
778,000 | 725,017 | ||||||
| 10.379%, 1M TSFR + 5.017%, 04/15/36 (144A) (a) |
555,000 | 516,098 | ||||||
| Benchmark Mortgage Trust |
3,439,348 | 133,042 | ||||||
| 1.267%, 02/15/54 (a) (b) |
5,085,597 | 308,076 | ||||||
| BFLD Trust |
663,000 | 67,164 | ||||||
| BHMS Mortgage Trust |
3,160,000 | 3,135,559 | ||||||
See accompanying notes to financial statements.
BHFTII-27
Brighthouse Funds Trust II
BlackRock Bond Income Portfolio
Schedule of Investments as of December 31, 2023
Mortgage-Backed Securities—(Continued)
| Security Description | Principal Amount* |
Value | ||||||
| Commercial Mortgage-Backed Securities—(Continued) | ||||||||
| BPR Trust |
492,000 | $ | 469,558 | |||||
| BWAY Mortgage Trust |
1,495,000 | 1,373,560 | ||||||
| 3.454%, 03/10/33 (144A) |
1,206,304 | 1,132,427 | ||||||
| 3.633%, 03/10/33 (144A) |
600,000 | 528,169 | ||||||
| BX Commercial Mortgage Trust |
2,162,100 | 1,848,288 | ||||||
| 6.387%, 1M TSFR + 1.024%, 02/15/33 (144A) (a) |
2,391,915 | 2,342,685 | ||||||
| 7.121%, 1M TSFR + 1.761%, 12/09/40 (144A) (a) |
845,000 | 845,523 | ||||||
| 7.627%, 1M TSFR + 2.264%, 02/15/33 (144A) (a) |
1,466,417 | 1,436,634 | ||||||
| 7.776%, 1M TSFR + 2.414%, 10/15/36 (144A) † (a) |
3,944,000 | 3,883,847 | ||||||
| 8.126%, 1M TSFR + 2.764%, 10/15/36 (144A) † (a) |
2,955,292 | 2,907,054 | ||||||
| 8.277%, 1M TSFR + 2.914%, 06/15/38 (144A) (a) |
641,141 | 612,245 | ||||||
| 8.949%, 1M TSFR + 3.589%, 12/09/40 (144A) (a) |
1,154,000 | 1,153,638 | ||||||
| 9.727%, 1M TSFR + 4.364%, 02/15/33 (144A) (a) |
979,005 | 959,372 | ||||||
| BX Trust |
4,738,000 | 4,182,267 | ||||||
| 3.944%, 12/09/41 (144A) (a) |
2,772,000 | 2,388,056 | ||||||
| 6.212%, 1M TSFR + 0.850%, 01/15/39 (144A) (a) |
1,260,000 | 1,233,149 | ||||||
| 6.376%, 1M TSFR + 1.014%, 10/15/36 (144A) (a) |
3,857,000 | 3,769,839 | ||||||
| 7.372%, 1M TSFR + 2.010%, 10/15/36 (144A) (a) |
344,000 | 327,591 | ||||||
| 7.527%, 1M TSFR + 2.165%, 08/15/39 (144A) (a) |
755,000 | 755,710 | ||||||
| 7.727%, 1M TSFR + 2.364%, 01/15/34 (144A) (a) |
214,553 | 207,044 | ||||||
| 7.877%, 1M TSFR + 2.514%, 02/15/36 (144A) (a) |
1,742,188 | 1,645,054 | ||||||
| 8.052%, 1M TSFR + 2.690%, 05/15/38 (144A) (a) |
5,434,000 | 5,444,211 | ||||||
| 8.477%, 1M TSFR + 3.114%, 01/15/34 (144A) (a) |
329,493 | 319,032 | ||||||
| 8.477%, 1M TSFR + 3.114%, 02/15/36 (144A) (a) |
893,170 | 832,383 | ||||||
| 8.575%, 1M TSFR + 3.213%, 08/15/42 (144A) (a) |
943,000 | 943,886 | ||||||
| 8.619%, 1M TSFR + 3.257%, 10/15/36 (144A) (a) |
302,000 | 282,797 | ||||||
| BXP Trust |
327,000 | 201,381 | ||||||
| 3.552%, 08/13/37 (144A) (a) |
760,000 | 532,840 | ||||||
| Cassia SRL |
1,267,640 | 1,352,843 | ||||||
| CD Mortgage Trust |
350,000 | 324,811 | ||||||
| 3.956%, 08/15/50 (a) |
363,000 | 313,078 | ||||||
| CENT Trust |
2,110,000 | 2,120,574 | ||||||
| CFCRE Commercial Mortgage Trust |
2,370,000 | 33,917 | ||||||
| CFK Trust |
728,000 | 643,792 | ||||||
| Citigroup Commercial Mortgage Trust |
7,730,000 | 345,808 | ||||||
| Cold Storage Trust |
2,948,972 | 2,935,053 | ||||||
| 8.238%, 1M TSFR + 2.880%, 11/15/37 (144A) (a) |
1,582,615 | 1,570,775 | ||||||
| COMM Mortgage Trust |
60,958,000 | 47,580 | ||||||
| 3.179%, 10/10/36 (144A) (a) |
270,000 | 212,882 | ||||||
| CRSO Trust |
5,522,122 | 5,749,073 | ||||||
| Commercial Mortgage-Backed Securities—(Continued) | ||||||||
| CSAIL Commercial Mortgage Trust |
3,940,000 | 37,976 | ||||||
| 0.536%, 09/15/52 (a) (b) |
4,150,000 | 109,125 | ||||||
| 1.320%, 09/15/52 (a) (b) |
3,005,689 | 159,344 | ||||||
| 1.543%, 06/15/52 (a) (b) |
7,025,352 | 437,639 | ||||||
| 4.237%, 06/15/52 (a) |
70,000 | 55,567 | ||||||
| CSMC Trust |
301,000 | 138,405 | ||||||
| 6.359%, 1M TSFR + 0.997%, 12/15/30 (144A) (a) |
280,000 | 264,934 | ||||||
| 8.505%, 1M TSFR + 3.143%, 09/09/24 (144A) (a) |
3,058,000 | 3,090,573 | ||||||
| 8.977%, 1M TSFR + 3.614%, 11/15/38 (144A) (a) |
191,000 | 185,431 | ||||||
| 10.589%, 1M TSFR + 5.226%, 10/15/37 (144A) (a) |
587,000 | 525,048 | ||||||
| DBJPM Mortgage Trust |
2,060,000 | 57,713 | ||||||
| 3.276%, 05/10/49 |
240,000 | 227,972 | ||||||
| DBUBS Mortgage Trust |
1,257,563 | 924,345 | ||||||
| ELP Commercial Mortgage Trust |
411,663 | 384,915 | ||||||
| Extended Stay America Trust |
700,080 | 687,770 | ||||||
| 8.327%, 1M TSFR + 2.964%, 07/15/38 (144A) (a) |
1,260,144 | 1,236,404 | ||||||
| 9.177%, 1M TSFR + 3.814%, 07/15/38 (144A) (a) |
3,778,565 | 3,697,324 | ||||||
| GCT Commercial Mortgage Trust |
100,000 | 20,179 | ||||||
| GS Mortgage Securities Corp. Trust |
687,964 | 482,125 | ||||||
| 7.453%, 1M TSFR + 2.091%, 03/15/28 (144A) (a) |
130,000 | 129,511 | ||||||
| GS Mortgage Securities Corportation II |
840,000 | 822,636 | ||||||
| GS Mortgage Securities Trust |
3,095,344 | 255,549 | ||||||
| 3.805%, 10/10/35 (144A) (a) |
200,000 | 157,188 | ||||||
| 3.806%, 11/10/52 (a) |
60,000 | 46,206 | ||||||
| 4.401%, 07/10/48 (a) |
110,000 | 99,462 | ||||||
| 4.529%, 04/10/47 (a) |
50,000 | 48,570 | ||||||
| HMH Trust |
1,210,000 | 1,050,119 | ||||||
| HONO Mortgage Trust |
287,000 | 265,981 | ||||||
| 9.877%, 1M TSFR + 4.514%, 10/15/36 (144A) (a) |
263,000 | 239,767 | ||||||
| Hudson Yards Mortgage Trust |
662,050 | 472,636 | ||||||
| IMT Trust |
540,000 | 531,170 | ||||||
| 3.497%, 06/15/34 (144A) (a) |
570,000 | 555,980 | ||||||
| INTOWN Mortgage Trust |
1,100,000 | 1,103,447 | ||||||
| JP Morgan Chase Commercial Mortgage Securities Trust |
4,900,000 | 164 | ||||||
| 0.750%, 08/15/49 (144A) (a) (b) |
5,300,000 | 87,039 | ||||||
| 6.619%, 1M TSFR + 1.257%, 06/15/35 (144A) (a) |
310,107 | 276,584 | ||||||
| 7.177%, 1M TSFR + 1.814%, 04/15/38 (144A) (a) |
787,000 | 775,108 | ||||||
| 7.569%, 1M TSFR + 2.207%, 07/15/36 (144A) (a) |
570,000 | 549,228 | ||||||
| 7.927%, 1M TSFR + 2.564%, 04/15/38 (144A) (a) |
1,030,000 | 996,317 | ||||||
See accompanying notes to financial statements.
BHFTII-28
Brighthouse Funds Trust II
BlackRock Bond Income Portfolio
Schedule of Investments as of December 31, 2023
Mortgage-Backed Securities—(Continued)
| Security Description | Principal Amount* |
Value | ||||||
| Commercial Mortgage-Backed Securities—(Continued) | ||||||||
| JP Morgan Chase Commercial Mortgage Securities Trust |
450,000 | $ | 435,212 | |||||
| 8.497%, 1M TSFR + 3.134%, 10/15/33 (144A) (a) |
180,000 | 145,616 | ||||||
| 8.901%, 1M TSFR + 3.540%, 04/15/37 (144A) (a) |
899,153 | 611,897 | ||||||
| JPMBB Commercial Mortgage Securities Trust |
538,543 | 2,963 | ||||||
| 0.781%, 09/15/47 (a) (b) |
1,069,575 | 2,086 | ||||||
| 4.136%, 12/15/48 (144A) (a) |
300,000 | 246,031 | ||||||
| JPMDB Commercial Mortgage Securities Trust |
2,067,000 | 36,121 | ||||||
| KNDL Mortgage Trust |
865,000 | 852,740 | ||||||
| KSL Commercial Mortgage Trust |
745,000 | 744,689 | ||||||
| 9.637%, 1M TSFR + 4.287%, 12/15/36 (144A) (a) |
2,340,000 | 2,341,433 | ||||||
| Lehman Brothers Small Balance Commercial Mortgage Trust |
201,897 | 191,783 | ||||||
| LSTAR Commercial Mortgage Trust |
608,400 | 10,047 | ||||||
| 3.134%, 04/20/48 (144A) (a) |
34,422 | 33,535 | ||||||
| LUXE Trust |
100,000 | 97,505 | ||||||
| Med Trust |
388,933 | 377,396 | ||||||
| 10.727%, 1M TSFR + 5.364%, 11/15/38 (144A) (a) |
3,660,167 | 3,501,251 | ||||||
| MF1 Trust |
163,000 | 151,124 | ||||||
| MFT Mortgage Trust |
350,781 | 193,605 | ||||||
| MHC Commercial Mortgage Trust |
1,443,698 | 1,420,272 | ||||||
| 8.077%, 1M TSFR + 2.715%, 04/15/38 (144A) (a) |
178,041 | 173,128 | ||||||
| Morgan Stanley Bank of America Merrill Lynch Trust |
1,810,000 | 20,564 | ||||||
| 4.517%, 10/15/48 (a) |
170,000 | 142,234 | ||||||
| Morgan Stanley Capital I Trust |
2,324,053 | 92,445 | ||||||
| 2.150%, 06/15/50 (144A) (a) (b) |
1,190,000 | 71,611 | ||||||
| 8.209%, 1M TSFR + 2.851%, 07/15/35 (144A) (a) |
10,000 | 9,605 | ||||||
| MSWF Commercial Mortgage Trust |
8,250,000 | 548,892 | ||||||
| 6.014%, 12/15/56 (a) |
490,000 | 527,727 | ||||||
| Natixis Commercial Mortgage Securities Trust |
265,000 | 252,663 | ||||||
| 8.500%, 06/15/35 (144A) (a) |
34,769 | 32,102 | ||||||
| NJ Trust |
350,000 | 364,894 | ||||||
| Olympic Tower Mortgage Trust |
13,300,000 | 152,076 | ||||||
| 3.945%, 05/10/39 (144A) (a) |
1,049,000 | 649,806 | ||||||
| One Bryant Park Trust |
128,000 | 108,369 | ||||||
| One Market Plaza Trust |
||||||||
| Zero Coupon, 02/10/32 (144A) (a) (b) |
21,110,000 | 211 | ||||||
| 0.090%, 02/10/32 (144A) (a) (b) |
4,222,000 | 7,304 | ||||||
| Commercial Mortgage-Backed Securities—(Continued) | ||||||||
| One New York Plaza Trust |
160,000 | 122,977 | ||||||
| SREIT Trust |
672,700 | 640,618 | ||||||
| 8.101%, 1M TSFR + 2.739%, 11/15/38 (144A) (a) |
851,608 | 811,234 | ||||||
| TYSN Mortgage Trust |
320,000 | 333,058 | ||||||
| UBS Commercial Mortgage Trust |
7,079,824 | 278,571 | ||||||
| 1.457%, 10/15/52 (a) (b) |
6,748,225 | 414,505 | ||||||
| Velocity Commercial Capital Loan Trust |
2,499,193 | 2,016,329 | ||||||
| 2.980%, 02/25/50 (144A) (a) |
123,651 | 99,428 | ||||||
| 4.240%, 11/25/47 (144A) (a) |
66,639 | 56,408 | ||||||
| 4.480%, 12/26/51 (144A) (a) |
279,662 | 202,950 | ||||||
| 5.000%, 11/25/47 (144A) (a) |
39,173 | 31,927 | ||||||
| Wells Fargo Commercial Mortgage Trust |
889,136 | 12,939 | ||||||
| 1.246%, 08/15/49 (144A) (a) (b) |
1,430,000 | 38,000 | ||||||
| 1.410%, 05/15/52 (a) (b) |
4,758,485 | 251,507 | ||||||
| 3.580%, 02/15/48 |
1,342,000 | 1,286,281 | ||||||
| 3.749%, 06/15/36 (144A) (a) |
170,000 | 148,125 | ||||||
| 4.904%, 01/15/52 (a) |
622,000 | 563,605 | ||||||
| 7.567%, 1M TSFR + 2.204%, 02/15/37 (144A) (a) |
300,000 | 293,155 | ||||||
| 8.217%, 1M TSFR + 2.854%, 02/15/37 (144A) (a) |
260,000 | 253,702 | ||||||
|
|
|
|||||||
| 122,536,494 | ||||||||
|
|
|
|||||||
| Total Mortgage-Backed Securities |
225,257,784 | |||||||
|
|
|
|||||||
| Foreign Government—2.0% |
| |||||||
| Banks—0.0% | ||||||||
| Bank Gospodarstwa Krajowego |
200,000 | 211,000 | ||||||
| Corp. Financiera de Desarrollo SA |
200,000 | 197,000 | ||||||
|
|
|
|||||||
| 408,000 | ||||||||
|
|
|
|||||||
| Sovereign—2.0% | ||||||||
| Argentina Republic Government International Bonds |
215,000 | 73,383 | ||||||
| 4.250%, 01/09/38 (l) |
193,000 | 76,124 | ||||||
| Bahrain Government International Bond |
200,000 | 188,058 | ||||||
| Benin Government International Bond |
139,000 | 125,303 | ||||||
| Brazil Letras do Tesouro Nacional |
||||||||
| Zero Coupon, 04/01/24 (BRL) |
4,000,000 | 802,304 | ||||||
| Chile Government International Bond |
200,000 | 178,568 | ||||||
| Colombia Government International Bonds |
200,000 | 190,533 | ||||||
| 4.125%, 05/15/51 |
400,000 | 265,426 | ||||||
| 8.000%, 04/20/33 |
361,000 | 393,770 | ||||||
See accompanying notes to financial statements.
BHFTII-29
Brighthouse Funds Trust II
BlackRock Bond Income Portfolio
Schedule of Investments as of December 31, 2023
Foreign Government—(Continued)
| Security Description | Principal Amount* |
Value | ||||||
| Sovereign—(Continued) | ||||||||
| Colombia TES |
2,338,000,000 | $ | 533,983 | |||||
| 6.000%, 04/28/28 (COP) |
4,106,500,000 | 933,763 | ||||||
| 7.500%, 08/26/26 (COP) |
6,791,600,000 | 1,675,056 | ||||||
| 7.750%, 09/18/30 (COP) |
2,499,100,000 | 586,705 | ||||||
| Dominican Republic International Bonds |
150,000 | 138,000 | ||||||
| 5.950%, 01/25/27 |
100,000 | 100,205 | ||||||
| 6.875%, 01/29/26 |
100,000 | 101,665 | ||||||
| Egypt Government International Bonds |
200,000 | 116,430 | ||||||
| 7.625%, 05/29/32 |
200,000 | 138,667 | ||||||
| 8.500%, 01/31/47 |
200,000 | 123,983 | ||||||
| European Union |
2,020,000 | 1,979,290 | ||||||
| 3.000%, 03/04/53 (EUR) |
5,755,000 | 6,232,649 | ||||||
| Guatemala Government Bonds |
558,000 | 542,097 | ||||||
| 5.250%, 08/10/29 (144A) |
73,000 | 71,467 | ||||||
| 6.600%, 06/13/36 (144A) |
200,000 | 205,800 | ||||||
| Hungary Government International Bond |
200,000 | 200,909 | ||||||
| Indonesia Government International Bonds |
662,000 | 599,552 | ||||||
| 3.050%, 03/12/51 |
1,965,000 | 1,494,332 | ||||||
| 6.750%, 01/15/44 |
200,000 | 246,088 | ||||||
| Indonesia Treasury Bonds |
3,382,000,000 | 215,210 | ||||||
| 7.000%, 05/15/27 (IDR) |
15,307,000,000 | 1,009,186 | ||||||
| 8.375%, 09/15/26 (IDR) |
5,620,000,000 | 382,205 | ||||||
| Ivory Coast Government International Bond |
100,000 | 92,807 | ||||||
| Mexican Bonos |
13,600,000 | 758,239 | ||||||
| 8.500%, 03/01/29 (MXN) |
77,570,000 | 4,445,349 | ||||||
| 8.500%, 05/31/29 (MXN) |
138,097,000 | 7,954,992 | ||||||
| 8.500%, 11/18/38 (MXN) |
13,835,400 | 776,961 | ||||||
| Mexico Government International Bonds |
2,305,000 | 1,948,483 | ||||||
| 4.500%, 01/31/50 |
4,504,000 | 3,676,107 | ||||||
| Morocco Government International Bond |
200,000 | 210,812 | ||||||
| Nigeria Government International Bonds |
200,000 | 170,260 | ||||||
| 8.375%, 03/24/29 (144A) |
200,000 | 191,518 | ||||||
| Oman Government International Bond |
200,000 | 203,624 | ||||||
| Panama Government International Bonds |
721,000 | 613,030 | ||||||
| 3.875%, 03/17/28 |
1,279,000 | 1,178,718 | ||||||
| 4.500%, 04/01/56 |
1,811,000 | 1,213,082 | ||||||
| 6.400%, 02/14/35 |
451,000 | 439,755 | ||||||
| 6.853%, 03/28/54 |
200,000 | 186,883 | ||||||
| Peru Government International Bonds |
80,000 | 62,645 | ||||||
| Sovereign—(Continued) | ||||||||
| Peru Government International Bonds |
21,000 | 18,287 | ||||||
| 3.550%, 03/10/51 |
1,587,000 | 1,201,121 | ||||||
| Philippines Government International Bonds |
1,834,000 | 1,728,593 | ||||||
| 3.200%, 07/06/46 |
2,044,000 | 1,578,990 | ||||||
| Qatar Government International Bond |
566,000 | 539,115 | ||||||
| Republic of Poland Government Bond |
5,693,000 | 1,291,807 | ||||||
| 4.250%, 02/14/43 (EUR) |
26,000 | 30,177 | ||||||
| Republic of South Africa Government International Bond |
200,000 | 147,712 | ||||||
| 7.000%, 02/28/31 (ZAR) |
25,715,700 | 1,175,956 | ||||||
| Romania Government International Bonds |
37,000 | 32,475 | ||||||
| 2.125%, 03/07/28 (EUR) |
209,000 | 209,095 | ||||||
| 2.500%, 02/08/30 (EUR) |
31,000 | 29,582 | ||||||
| 2.875%, 03/11/29 (EUR) |
29,000 | 28,948 | ||||||
| 5.250%, 11/25/27 (144A) |
14,000 | 13,888 | ||||||
| Russia Federal Bond - OFZ |
59,043,000 | 201,772 | ||||||
| Saudi Government International Bonds |
309,000 | 217,018 | ||||||
| 4.500%, 04/17/30 |
200,000 | 200,096 | ||||||
| Ukraine Government International Bonds |
194,000 | 43,369 | ||||||
| 7.253%, 03/15/35 (m) |
485,000 | 113,975 | ||||||
| 7.375%, 09/25/34 (144A) (m) |
274,000 | 63,732 | ||||||
| 7.375%, 09/25/34 (m) |
557,000 | 129,558 | ||||||
| 7.750%, 09/01/28 (m) |
100,000 | 27,460 | ||||||
| 7.750%, 09/01/29 (m) |
294,000 | 79,708 | ||||||
| 1.258%, 08/01/41 (a) (m) |
253,000 | 113,028 | ||||||
| Uruguay Government International Bonds |
1,266,587 | 1,275,073 | ||||||
| 5.100%, 06/18/50 |
1,118,733 | 1,121,909 | ||||||
| 5.750%, 10/28/34 |
64,385 | 69,568 | ||||||
|
|
|
|||||||
| 55,725,988 | ||||||||
|
|
|
|||||||
| Total Foreign Government |
56,133,988 | |||||||
|
|
|
|||||||
| Floating Rate Loans (o)—0.7% |
| |||||||
| Agriculture—0.0% | ||||||||
| Hydrofarm Holdings LLC | ||||||||
| 2021 Term Loan, 11.150%, 3M TSFR + 5.500%, 10/25/28 |
371,420 | 306,422 | ||||||
|
|
|
|||||||
| Airlines—0.0% | ||||||||
| Kestrel Bidco, Inc. |
522 | 522 | ||||||
|
|
|
|||||||
| Apparel—0.0% | ||||||||
| Fanatics Commerce Intermediate Holdco LLC |
138,039 | 138,039 | ||||||
|
|
|
|||||||
See accompanying notes to financial statements.
BHFTII-30
Brighthouse Funds Trust II
BlackRock Bond Income Portfolio
Schedule of Investments as of December 31, 2023
Floating Rate Loans (o)—(Continued)
| Security Description | Principal Amount* |
Value | ||||||
| Auto Parts & Equipment—0.0% | ||||||||
| Emerald Technologies Acquisitionco, Inc. |
265,148 | $ | 241,285 | |||||
|
|
|
|||||||
| Beverages—0.0% | ||||||||
| City Brewing Co. LLC |
||||||||
| Closing Date Term Loan, 9.164%, 1M TSFR + 3.500%, 04/05/28 |
343,103 | 272,552 | ||||||
| Naked Juice LLC |
||||||||
| 2nd Lien Term Loan, 11.448%, 3M TSFR + 6.000%, 01/24/30 |
75,000 | 61,500 | ||||||
| Triton Water Holdings, Inc. |
166,266 | 165,008 | ||||||
|
|
|
|||||||
| 499,060 | ||||||||
|
|
|
|||||||
| Chemicals—0.1% | ||||||||
| Aruba Investments, Inc. |
||||||||
| 2020 USD Term Loan, 9.456%, 1M TSFR + 4.000%, 11/24/27 |
182,932 | 181,408 | ||||||
| Eastman Chemical Co. |
||||||||
| 2021 Term Loan B, 10.860%, 3M TSFR + 5.250%, 11/01/28 |
394,965 | 387,066 | ||||||
| SCIH Salt Holdings, Inc. |
||||||||
| 2021 Incremental Term Loan B, 9.356%, 1M TSFR + 4.000%, 03/16/27 |
367,021 | 367,853 | ||||||
|
|
|
|||||||
| 936,327 | ||||||||
|
|
|
|||||||
| Commercial Services—0.1% | ||||||||
| Allied Universal Holdco LLC |
||||||||
| 2021 USD Incremental Term Loan B, 9.206%, 1M TSFR + 3.750%, 05/12/28 |
605,072 | 602,520 | ||||||
| American Auto Auction Group LLC |
||||||||
| 2021 Term Loan B, 10.498%, 3M TSFR + 5.000%, 12/30/27 |
249,757 | 246,843 | ||||||
| Digital Room Holdings, Inc. |
||||||||
| 2021 Term Loan, 10.606%, 1M TSFR + 5.250%, 12/21/28 |
507,953 | 465,623 | ||||||
| Interface Security Systems LLC |
1,590,148 | 1,180,685 | ||||||
| Signal Parent, Inc. |
546,000 | 495,495 | ||||||
| Vaco Holdings LLC |
||||||||
| 2022 Term Loan, 10.434%, 3M TSFR + 5.000%, 01/21/29 |
273,951 | 271,325 | ||||||
|
|
|
|||||||
| 3,262,491 | ||||||||
|
|
|
|||||||
| Computers—0.1% | ||||||||
| Alorica, Inc. |
||||||||
| First Lien 2022 Term Loan, 12.231%, 1M TSFR + 6.875%, 12/21/27 † (i) (j) |
853,580 | 836,508 | ||||||
| Coreweave Compute Acquisition Co. II LLC |
||||||||
| Delayed Draw Term Loan, 14.098% - 14.148%, 3M TSFR + 8.750%, 06/30/28 † (i) (j) (p) |
2,512,000 | 2,471,306 | ||||||
|
|
|
|||||||
| 3,307,814 | ||||||||
|
|
|
|||||||
| Cosmetics/Personal Care—0.0% | ||||||||
| Conair Holdings LLC |
94,621 | 93,044 | ||||||
| Euro Parfums Fze |
||||||||
| Facility A Term Loan, 10.780%, SOFR + 6.750%, 06/23/28 (i) (j) |
222,000 | 217,005 | ||||||
|
|
|
|||||||
| 310,049 | ||||||||
|
|
|
|||||||
| Engineering & Construction—0.1% | ||||||||
| Orion Group Holdco LLC |
||||||||
| 2022 1st Amendment Term Loan, 11.860%, 3M TSFR + 6.500%, 03/19/27 † (i) (j) |
35,562 | 35,562 | ||||||
| 2022 First A&R Amendment Incremental DDTL, 11.860%, 3M TSFR + 6.500%, 03/19/27 † (i) (j) |
159,039 | 159,039 | ||||||
| 2023 Delayed Draw Term Loan, 11.646%, 3M TSFR + 6.250%, 03/19/27 † (i) (j) |
683,384 | 679,147 | ||||||
| 2023 Term Loan B, 11.610%, 3M TSFR + 6.250%, 03/19/27 † (i) (j) |
186,667 | 185,510 | ||||||
| Delayed Draw Term Loan, 11.110%, 3M TSFR + 6.000%, 03/19/27 † (i) (j) |
60,077 | 59,326 | ||||||
| First Lien Delayed Draw Term Loan, 11.348%, 3M TSFR + 6.000%, 03/19/27 † (i) (j) |
356,095 | 356,095 | ||||||
| First Lien Term Loan, 11.610%, 3M TSFR + 6.000%, 03/19/27 † (i) (j) |
30,411 | 30,411 | ||||||
| Term Loan, 11.610%, 3M TSFR + 6.000%, 03/19/27 † (i) (j) |
6,001 | 5,926 | ||||||
|
|
|
|||||||
| 1,511,016 | ||||||||
|
|
|
|||||||
| Entertainment—0.1% | ||||||||
| Bally’s Corp. |
||||||||
| 2021 Term Loan B, 8.927%, 3M TSFR + 3.250%, 10/02/28 |
1,311,292 | 1,247,203 | ||||||
| ECL Entertainment LLC |
||||||||
| 2023 Term Loan B, 10.110%, 3M TSFR + 4.750%, 08/31/30 |
737,153 | 739,303 | ||||||
| J&J Ventures Gaming LLC |
316,583 | 314,456 | ||||||
| Maverick Gaming LLC |
478,131 | 360,988 | ||||||
|
|
|
|||||||
| 2,661,950 | ||||||||
|
|
|
|||||||
| Food—0.1% | ||||||||
| BCPE North Star U.S. HoldCo 2, Inc. |
784,708 | 708,199 | ||||||
| Shearer’s Foods, Inc. |
||||||||
| 2021 Term Loan, 8.970%, 1M TSFR + 3.500%, 09/23/27 |
161,585 | 161,989 | ||||||
|
|
|
|||||||
| 870,188 | ||||||||
|
|
|
|||||||
| Hand/Machine Tools—0.0% | ||||||||
| Apex Tool Group LLC |
||||||||
| 2022 Term Loan, 10.707%, 1M TSFR + 5.250%, 02/08/29 |
478,790 | 422,446 | ||||||
|
|
|
|||||||
See accompanying notes to financial statements.
BHFTII-31
Brighthouse Funds Trust II
BlackRock Bond Income Portfolio
Schedule of Investments as of December 31, 2023
Floating Rate Loans (o)—(Continued)
| Security Description | Principal Amount* |
Value | ||||||
| Healthcare-Services—0.0% | ||||||||
| Medical Solutions Holdings, Inc. |
||||||||
| 2021 2nd Lien Term Loan, 12.456%, 1M TSFR + 7.000%, 11/01/29 |
274,000 | $ | 234,955 | |||||
|
|
|
|||||||
| Household Products/Wares—0.0% | ||||||||
| Kronos Acquisition Holdings, Inc. |
||||||||
| 2021 1st Lien Term Loan, 11.538%, 3M TSFR + 6.000%, 12/22/26 |
121,903 | 122,360 | ||||||
|
|
|
|||||||
| Housewares—0.0% | ||||||||
| Springs Windows Fashions LLC |
||||||||
| 2021 Term Loan B, 9.470%, 1M TSFR + 4.000%, 10/06/28 |
336,998 | 301,023 | ||||||
|
|
|
|||||||
| Lodging—0.1% | ||||||||
| Aimbridge Acquisition Co., Inc. |
||||||||
| 2019 Term Loan B, 9.220%, 1M TSFR + 3.750%, 02/02/26 |
368,497 | 344,487 | ||||||
| 2020 Incremental Term Loan B, 10.220%, 1M TSFR + 4.750%, 02/02/26 |
149,676 | 140,072 | ||||||
| Fertitta Entertainment LLC |
||||||||
| 2022 Term Loan B, 9.356%, 1M TSFR + 4.000%, 01/27/29 |
53,164 | 53,242 | ||||||
| Spectacle Gary Holdings LLC |
||||||||
| 2021 Term Loan B, 9.748%, 3M TSFR + 4.250%, 12/11/28 |
1,367,378 | 1,340,885 | ||||||
|
|
|
|||||||
| 1,878,686 | ||||||||
|
|
|
|||||||
| Machinery-Diversified—0.0% | ||||||||
| Davis-Standard LLC |
339,928 | 340,460 | ||||||
|
|
|
|||||||
| Media—0.0% | ||||||||
| DirecTV Financing LLC |
317,807 | 318,999 | ||||||
| Gray Television, Inc. |
||||||||
| 2021 Term Loan D, 8.457%, 1M TSFR + 3.000%, 12/01/28 |
811 | 806 | ||||||
|
|
|
|||||||
| 319,805 | ||||||||
|
|
|
|||||||
| Mining—0.0% | ||||||||
| American Rock Salt Co. LLC |
||||||||
| 2021 Term Loan, 9.470%, 1M TSFR + 4.000%, 06/09/28 |
96,143 | 91,015 | ||||||
|
|
|
|||||||
| Oil & Gas—0.0% | ||||||||
| Ecopetrol SA |
| |||||||
| 2023 Term Loan, 10.127%, 3M TSFR + 4.750%, 09/06/30 (i) (j) |
350,000 | 347,375 | ||||||
|
|
|
|||||||
| Pipelines—0.0% | ||||||||
| DT Midstream, Inc. |
129,511 | 130,253 | ||||||
|
|
|
|||||||
| Retail—0.0% | ||||||||
| Park River Holdings, Inc. |
89,085 | 87,062 | ||||||
| WOOF Holdings, Inc. |
||||||||
| 1st Lien Term Loan, 9.360%, 3M TSFR + 3.750%, 12/21/27 |
140,326 | 114,541 | ||||||
|
|
|
|||||||
| 201,603 | ||||||||
|
|
|
|||||||
| Software—0.0% | ||||||||
| ConnectWise LLC |
||||||||
| 2021 Term Loan B, 8.970%, 1M TSFR + 3.500%, 09/29/28 |
182,446 | 182,035 | ||||||
|
|
|
|||||||
| Telecommunications—0.0% | ||||||||
| Connect Finco Sarl |
||||||||
| 2021 Term Loan B, 8.856%, 1M TSFR + 3.500%, 12/11/26 |
526,319 | 527,159 | ||||||
| Level 3 Financing, Inc. |
||||||||
| 2019 Term Loan B, 7.220%, 1M TSFR + 1.750%, 03/01/27 † |
200,000 | 190,167 | ||||||
|
|
|
|||||||
| 717,326 | ||||||||
|
|
|
|||||||
| Total Floating Rate Loans |
19,334,505 | |||||||
|
|
|
|||||||
| Municipals—0.7% |
| |||||||
| American Municipal Power, Inc. |
510,000 | 689,289 | ||||||
| Bay Area Toll Authority |
1,215,000 | 1,537,925 | ||||||
| City of San Antonio Electric & Gas Systems Revenue |
875,000 | 939,262 | ||||||
| Los Angeles Community College District, General Obligation Unlimited |
785,000 | 938,763 | ||||||
| Los Angeles Unified School District, General Obligation Unlimited |
2,020,000 | 2,281,667 | ||||||
| Massachusetts Housing Finance Agency |
115,000 | 110,459 | ||||||
| Metropolitan Transportation Authority |
170,000 | 187,324 | ||||||
| 6.814%, 11/15/40 |
330,000 | 365,631 | ||||||
| Municipal Electric Authority of Georgia |
455,000 | 519,193 | ||||||
| New Jersey Turnpike Authority |
492,000 | 613,019 | ||||||
| New York City Municipal Water Finance Authority |
270,000 | 300,537 | ||||||
| New York State Dormitory Authority |
355,000 | 367,016 | ||||||
| Port Authority of New York & New Jersey |
1,350,000 | 1,314,833 | ||||||
| State of California, General Obligation Unlimited |
3,765,000 | 3,629,833 | ||||||
| 7.550%, 04/01/39 |
780,000 | 984,835 | ||||||
See accompanying notes to financial statements.
BHFTII-32
Brighthouse Funds Trust II
BlackRock Bond Income Portfolio
Schedule of Investments as of December 31, 2023
Municipals—(Continued)
| Security Description | Shares/ Principal |
Value | ||||||
| State of Illinois, General Obligation Unlimited |
3,010,000 | $ | 2,978,214 | |||||
| State of Texas, General Obligation Unlimited |
820,000 | 878,200 | ||||||
| University of California |
239,000 | 224,991 | ||||||
|
|
|
|||||||
| Total Municipals |
18,860,991 | |||||||
|
|
|
|||||||
| Common Stocks—0.2% |
| |||||||
| Chemicals—0.0% | ||||||||
| Element Solutions, Inc. |
13,168 | 304,708 | ||||||
|
|
|
|||||||
| Energy Equipment & Services—0.0% | ||||||||
| Transocean Ltd. (g) (q) |
83,817 | 532,238 | ||||||
|
|
|
|||||||
| Financial Services—0.0% | ||||||||
| Mr. Cooper Group, Inc. (q) |
4,073 | 265,234 | ||||||
|
|
|
|||||||
| Health Care Providers & Services—0.0% | ||||||||
| HCA Healthcare, Inc. |
576 | 155,912 | ||||||
|
|
|
|||||||
| Hotel & Resort REITs—0.0% | ||||||||
| DiamondRock Hospitality Co. (g) |
19,436 | 182,504 | ||||||
| Park Hotels & Resorts, Inc. |
10,415 | 159,349 | ||||||
| Service Properties Trust |
33,695 | 287,755 | ||||||
| Sunstone Hotel Investors, Inc. (e) |
11,698 | 125,520 | ||||||
| Xenia Hotels & Resorts, Inc. (g) |
7,166 | 97,601 | ||||||
|
|
|
|||||||
| 852,729 | ||||||||
|
|
|
|||||||
| Hotels, Restaurants & Leisure—0.1% | ||||||||
| Boyd Gaming Corp. |
1,711 | 107,126 | ||||||
| Caesars Entertainment, Inc. (q) |
2,213 | 103,745 | ||||||
| Genius Sports Ltd. (g) (q) |
118,626 | 733,109 | ||||||
| Golden Entertainment, Inc. |
3,057 | 122,066 | ||||||
|
|
|
|||||||
| 1,066,046 | ||||||||
|
|
|
|||||||
| Machinery—0.0% | ||||||||
| Sarcos Technology & Robotics Corp. (g) (q) |
1,162 | 838 | ||||||
|
|
|
|||||||
| Oil, Gas & Consumable Fuels—0.1% | ||||||||
| California Resources Corp. |
6,165 | 337,102 | ||||||
| Cheniere Energy, Inc. |
1,526 | 260,503 | ||||||
| Chesapeake Energy Corp. (g) |
1,311 | 100,868 | ||||||
| Green Plains, Inc. (e) (q) |
11,216 | 282,868 | ||||||
| Marathon Petroleum Corp. |
1,868 | 277,137 | ||||||
| Phillips 66 |
2,678 | 356,549 | ||||||
| Valero Energy Corp. |
1,020 | 132,600 | ||||||
|
|
|
|||||||
| 1,747,627 | ||||||||
|
|
|
|||||||
| Real Estate Management & Development—0.0% | ||||||||
| Forestar Group, Inc. (g) (q) |
7,291 | 241,113 | ||||||
|
|
|
|||||||
| Total Common Stocks |
5,166,445 | |||||||
|
|
|
|||||||
| Preferred Stocks—0.2% |
| |||||||
| Home Builders—0.1% | ||||||||
| Dream Finders Homes, Inc., 9.000% † (i) (j) |
2,628 | 2,493,315 | ||||||
|
|
|
|||||||
| IT Services—0.1% | ||||||||
| Versa Networks, Inc. - Series E , 12.000% PIK † (h) (i) (j) |
678,151 | 2,210,772 | ||||||
|
|
|
|||||||
| Software—0.0% | ||||||||
| Lessen Holdings, Inc. † (i) (j) (q) |
23,458 | 152,606 | ||||||
|
|
|
|||||||
| Total Preferred Stocks |
4,856,693 | |||||||
|
|
|
|||||||
| Convertible Bonds—0.1% |
| |||||||
| Automobiles—0.1% | ||||||||
| FreeWire Technologies, Inc. |
1,429,736 | 1,504,797 | ||||||
|
|
|
|||||||
| Energy-Alternate Sources—0.0% | ||||||||
| Stem, Inc. |
102,000 | 51,807 | ||||||
|
|
|
|||||||
| Media—0.0% | ||||||||
| DISH Network Corp. |
||||||||
| Zero Coupon, 12/15/25 |
320,000 | 198,400 | ||||||
|
|
|
|||||||
| Total Convertible Bonds |
1,755,004 | |||||||
|
|
|
|||||||
| Warrants—0.0% |
| |||||||
| Automobiles—0.0% | ||||||||
| FreeWire Technologies, Inc. Tranche A † (i) (j) (q) |
136,947 | 8,217 | ||||||
| FreeWire Technologies, Inc. Tranche B † (i) (j) (q) |
6,847 | 411 | ||||||
| FreeWire Technologies, Inc. Tranche B |
130,100 | 1 | ||||||
|
|
|
|||||||
| 8,629 | ||||||||
|
|
|
|||||||
| Health Care Providers & Services—0.0% | ||||||||
| Cano Health, Inc. (q) |
29,597 | 21 | ||||||
|
|
|
|||||||
| Health Care Technology—0.0% | ||||||||
| Pear Therapeutics, Inc. (q) |
10,748 | 0 | ||||||
|
|
|
|||||||
| Hotels, Restaurants & Leisure—0.0% | ||||||||
| Sonder Holdings, Inc. (i) (j) (q) |
20,820 | 0 | ||||||
|
|
|
|||||||
See accompanying notes to financial statements.
BHFTII-33
Brighthouse Funds Trust II
BlackRock Bond Income Portfolio
Schedule of Investments as of December 31, 2023
Warrants—(Continued)
| Security Description | Shares/ Principal |
Value | ||||||
| IT Services—0.0% | ||||||||
| Versa Networks, Inc. † (i) (j) (q) |
83,584 | $ | 235,707 | |||||
|
|
|
|||||||
| Machinery—0.0% | ||||||||
| Sarcos Technology & Robotics Corp. (q) |
102,425 | 553 | ||||||
|
|
|
|||||||
| Software—0.0% | ||||||||
| Aurora Innovation, Inc. (q) |
2,636 | 1,361 | ||||||
| Latch, Inc. (q) |
6,439 | 0 | ||||||
|
|
|
|||||||
| 1,361 | ||||||||
|
|
|
|||||||
| Specialty Retail—0.0% | ||||||||
| EVgo, Inc. (q) |
12,581 | 3,787 | ||||||
|
|
|
|||||||
| Total Warrants |
250,058 | |||||||
|
|
|
|||||||
| Escrow Shares—0.0% |
| |||||||
| Oil & Gas—0.0% | ||||||||
| Chesapeake Energy Corp. (i) (j) (q) |
100,000 | 0 | ||||||
|
|
|
|||||||
| Savings & Loans—0.0% | ||||||||
| Washington Mutual, Inc. (i) (j) (m) |
1,247,000 | 0 | ||||||
| Washington Mutual, Inc. (i) (j) (m) |
3,780,000 | 0 | ||||||
| Washington Mutual, Inc. (i) (j) (m) |
1,310,000 | 0 | ||||||
| Washington Mutual, Inc. (i) (j) (m) |
2,440,000 | 0 | ||||||
|
|
|
|||||||
| 0 | ||||||||
|
|
|
|||||||
| Total Escrow Shares |
0 | |||||||
|
|
|
|||||||
| Short-Term Investment—2.4% |
| |||||||
| Repurchase Agreement—2.4% | ||||||||
| Fixed Income Clearing Corp. Repurchase Agreement dated 12/29/23 at 2.500%, due on 01/02/24 with a maturity value of $68,098,058; collateralized by U.S. Treasury Note at 4.625%, maturing 03/15/26, with a market value of $69,440,733. |
68,079,147 | 68,079,147 | ||||||
|
|
|
|||||||
| Total Short-Term Investments |
68,079,147 | |||||||
|
|
|
|||||||
| Securities Lending Reinvestments (r)—0.2% |
| |||||||
| Repurchase Agreements—0.1% | ||||||||
| Bank of Nova Scotia |
120,000 | 120,000 | ||||||
| Repurchase Agreements—(Continued) | ||||||||
| Barclays Bank PLC |
||||||||
| Repurchase Agreement dated 12/29/23 at 5.330%, due on 01/02/24 with a maturity value of $8; collateralized by U.S. Treasury Obligations with rates ranging from 0.000% - 5.500%, maturity dates ranging from 01/31/24 - 05/15/48, and an aggregate market value of $8. |
8 | 8 | ||||||
| Repurchase Agreement dated 12/29/23 at 5.450%, due on 01/02/24 with a maturity value of $99,544; collateralized by various Common Stock with an aggregate market value of $110,906. |
99,484 | 99,484 | ||||||
| Deutsche Bank Securities, Inc. |
537,587 | 537,587 | ||||||
| NBC Global Finance Ltd. |
200,000 | 200,000 | ||||||
| Societe Generale |
200,000 | 200,000 | ||||||
| TD Prime Services LLC |
850,000 | 850,000 | ||||||
|
|
|
|||||||
| 2,007,079 | ||||||||
|
|
|
|||||||
| Mutual Funds—0.1% | ||||||||
| Allspring Government Money Market Fund, Select Class 5.280% (s) |
1,000,000 | 1,000,000 | ||||||
| State Street Institutional U.S. Government Money Market Fund, Premier Class 5.320% (s) |
1,000,000 | 1,000,000 | ||||||
| STIT-Government & Agency Portfolio, Institutional Class 5.270% (s) |
1,000,000 | 1,000,000 | ||||||
See accompanying notes to financial statements.
BHFTII-34
Brighthouse Funds Trust II
BlackRock Bond Income Portfolio
Schedule of Investments as of December 31, 2023
Securities Lending Reinvestments (r)—(Continued)
| Security Description | Shares | Value | ||||||
| Mutual Funds—(Continued) | ||||||||
| Western Asset Institutional Government Reserves Fund, Institutional Class 5.270% (s) |
150,000 | $ | 150,000 | |||||
|
|
|
|||||||
| 3,150,000 | ||||||||
|
|
|
|||||||
| Total Securities Lending Reinvestments |
5,157,079 | |||||||
|
|
|
|||||||
| Total Purchased Options—0.1% (t) |
3,578,237 | |||||||
| Total Investments—110.6% |
3,108,993,189 | |||||||
| Unfunded Loan Commitments—(0.0)% (Cost $(1,171,829)) |
(1,171,829 | ) | ||||||
| Net Investments—110.6% |
3,107,821,360 | |||||||
| Other assets and liabilities (net)—(10.6)% |
(296,494,975 | ) | ||||||
|
|
|
|||||||
| Net Assets—100.0% | $ | 2,811,326,385 | ||||||
|
|
|
|||||||
| * | Principal and notional amounts stated in U.S. dollars unless otherwise noted. | |||
| † | Restricted securities are not registered under the Securities Act of 1933 and are subject to legal restrictions on resale. These securities generally may be resold in transactions exempt from registration or to the public if the securities are subsequently registered. Disposal of these securities may involve time-consuming negotiations and prompt sale at an acceptable price may be difficult. As of December 31, 2023, the market value of restricted securities was $28,662,969, which is 1.0% of net assets. See details shown in the Restricted Securities table that follows. | |||
| (a) | Variable or floating rate security. The stated rate represents the rate at December 31, 2023. Maturity date shown for callable securities reflects the earliest possible call date. For securities based on a published reference index and spread, the index and spread are indicated in the description above. For certain variable rate securities, the coupon rate is determined by the issuer/agent based on current market conditions. For certain asset- and mortgage-backed securities, the coupon rate may fluctuate based on changes of the underlying collateral or prepayments of principal. These securities do not indicate a reference index and spread in their description above. | |||
| (b) | Interest only security. | |||
| (c) | TBA (To Be Announced) Securities are purchased on a forward commitment basis with an approximate principal amount and no defined maturity date. The actual principal and maturity date will be determined upon settlement date. | |||
| (d) | All or a portion of the security was pledged as collateral against open futures contracts. As of December 31, 2023, the market value of securities pledged was $7,034,464. | |||
| (e) | All or a portion of the security was pledged as collateral against open OTC swap contracts, open OTC option contracts and forward foreign currency exchange contracts. As of December 31, 2023, the market value of securities pledged was $7,086,951. | |||
| (f) | Principal amount of security is adjusted for inflation. | |||
| (g) | All or a portion of the security was held on loan. As of December 31, 2023, the market value of securities loaned was $40,984,559 and the collateral received consisted of cash in the amount of $5,157,079 and non-cash collateral with a value of $37,213,500. The cash collateral investments are disclosed in the Schedule of Investments and categorized as Securities Lending Reinvestments. The non-cash collateral received consists of U.S. government securities that are held in safe-keeping by the lending agent, or a third- party custodian, and cannot be sold or repledged by the Portfolio. As such, this collateral is excluded from the Statement of Assets and Liabilities. | |||
| (h) | Payment-in-kind security for which part of the income earned may be paid as additional principal. | |||
| (i) | Significant unobservable inputs were used in the valuation of this portfolio security; i.e. Level 3. | |||
| (j) | Security was valued in good faith under procedures subject to oversight by the Board of Trustees. As of December 31, 2023, these securities represent 1.1% of net assets. | |||
| (k) | Perpetual bond with no specified maturity date. | |||
| (l) | Security is a “step-up” bond where coupon increases or steps up at a predetermined date. Rate shown is current coupon rate. | |||
| (m) | Non-income producing; security is in default and/or issuer is in bankruptcy. | |||
| (n) | Principal only security. | |||
| (o) | Floating rate loans (“Senior Loans”) often require prepayments from excess cash flows or permit the borrowers to repay at their election. The degree to which borrowers repay, whether as a contractual requirement or at their election, cannot be predicted with accuracy. As a result, the actual remaining maturity may be substantially less than the stated maturities shown. However, Senior Loans will generally have an expected average life of approximately two to four years. Senior Loans typically have rates of interest which are determined periodically by reference to a base lending rate, plus a spread. These base rates are primarily the Secured Overnight Financing Rate and secondarily, the prime rate offered by one or more major United States banks. Base lending rates may be subject to a floor, or a minimum rate. | |||
| (p) | Unfunded or partially unfunded loan commitments. The Portfolio may enter into certain credit agreements for which all or a portion may be unfunded. The Portfolio is obligated to fund these commitments at the borrower’s discretion. | |||
| (q) | Non-income producing security. | |||
| (r) | Represents investment of cash collateral received from securities on loan as of December 31, 2023. | |||
| (s) | The rate shown represents the annualized seven-day yield as of December 31, 2023. | |||
| (t) | For a breakout of open positions, see details shown in the Purchased Options table that follows. | |||
| (144A) | Securities exempt from registration under Rule 144A of the Securities Act of 1933. These securities may be resold in transactions exempt from registration, normally to qualified institutional buyers. As of December 31, 2023, the market value of 144A securities was $490,321,568, which is 17.4% of net assets. | |||
| Restricted Securities |
Acquisition Date |
Shares/ Principal Amount |
Cost | Value | ||||||||||||
| Alorica, Inc., 12.231%, 12/21/27 |
01/26/23 | 853,580 | $ | 846,662 | $ | 836,508 | ||||||||||
| American Tower Corp., 2.300%, 09/15/31 |
08/14/23 | 428,000 | 336,246 | 353,882 | ||||||||||||
| BAMLL Commercial Mortgage Securities Trust, 7.409%, 11/15/32 |
12/04/17 | 630,000 | 630,000 | 537,558 | ||||||||||||
| BAMLL Commercial Mortgage Securities Trust, 6.909%, 11/15/32 |
12/04/17 | 300,000 | 300,000 | 251,068 | ||||||||||||
| BAMLL Commercial Mortgage Securities Trust, 6.809%, 11/15/33 |
06/20/19 | 510,000 | 509,283 | 450,515 | ||||||||||||
| BX Commercial Mortgage Trust, 7.776%, 10/15/36 |
10/09/19-01/21/21 | 3,944,000 | 3,944,651 | 3,883,847 | ||||||||||||
| BX Commercial Mortgage Trust, 8.126%, 10/15/36 |
10/09/19-01/19/21 | 2,955,292 | 2,944,213 | 2,907,054 | ||||||||||||
| Coreweave Compute Acquisition Co. II LLC, 14.098%-14.148%, 06/30/28 |
07/31/23 | 2,512,000 | 2,510,200 | 2,471,306 | ||||||||||||
| Davis-Standard LLC, 11.206%, 12/10/28 |
12/10/21 | 339,928 | 332,632 | 340,460 | ||||||||||||
| Digicel International Finance Ltd./Digicel international Holdings Ltd., 8.000%, 12/31/26 |
05/20/20 | 48,530 | 39,743 | 971 | ||||||||||||
| Dream Finders Homes, Inc. |
09/29/21 | 2,628 | 2,601,720 | 2,493,315 | ||||||||||||
| FreeWire Technologies, Inc., 14.140%, 03/31/25 |
04/27/22-09/29/23 | 1,429,736 | 1,411,361 | 1,504,797 | ||||||||||||
| FreeWire Technologies, Inc. 04/26/27 |
04/27/22 | 136,947 | — | 8,217 | ||||||||||||
| FreeWire Technologies, Inc. 04/26/29 |
05/03/23 | 6,847 | — | 411 | ||||||||||||
| FreeWire Technologies, Inc. 04/26/29 |
05/03/23 | 130,100 | — | 1 | ||||||||||||
See accompanying notes to financial statements.
BHFTII-35
Brighthouse Funds Trust II
BlackRock Bond Income Portfolio
Schedule of Investments as of December 31, 2023
| Restricted Securities |
Acquisition Date |
Shares/ Principal Amount |
Cost | Value | ||||||||||||
| Knollwood CDO Ltd., 8.868%, 01/10/39 |
02/10/04 | 1,176,180 | $ | 1,176,180 | $ | 118 | ||||||||||
| Landsea Homes Corp., 11.000%, 07/17/28 |
07/17/23 | 3,104,000 | 3,010,880 | 3,014,915 | ||||||||||||
| Lessen Holdings, Inc |
01/05/23 | 23,458 | 303,694 | 152,606 | ||||||||||||
| Lessen, Inc., 12.580%, 01/05/28 |
01/05/23 | 1,727,283 | 1,669,375 | 1,578,391 | ||||||||||||
| Level 3 Financing, Inc., 4.625%, 09/15/27 |
11/01/23-11/09/23 | 426,000 | 253,682 | 255,600 | ||||||||||||
| Level 3 Financing, Inc., 7.220%, 03/01/27 |
08/23/23-09/25/23 | 200,000 | 188,715 | 190,167 | ||||||||||||
| Oceana Australian Fixed Income Trust, 12.500%, 08/31/27 |
08/31/23 | 759,000 | 491,794 | 517,893 | ||||||||||||
| Oceana Australian Fixed Income Trust, 12.500%, 08/31/26 |
08/31/23 | 456,000 | 295,465 | 310,928 | ||||||||||||
| Oceana Australian Fixed Income Trust, 12.000%, 08/31/25 |
08/31/23 | 304,000 | 196,977 | 206,912 | ||||||||||||
| Orion Group Holdco LLC, 11.860%, 03/19/27 |
09/06/23 | 35,562 | 35,293 | 35,562 | ||||||||||||
| Orion Group Holdco LLC, 11.860%, 03/19/27 |
09/06/23 | 159,039 | 157,839 | 159,039 | ||||||||||||
| Orion Group Holdco LLC, 11.110%, 03/19/27 |
09/06/23 | 60,077 | 59,723 | 59,326 | ||||||||||||
| Orion Group Holdco LLC, 11.348%, 03/19/27 |
09/06/23 | 356,095 | 353,709 | 356,095 | ||||||||||||
| Orion Group Holdco LLC, 11.610%, 03/19/27 |
09/06/23 | 30,411 | 30,221 | 30,411 | ||||||||||||
| Orion Group Holdco LLC, 11.610%, 03/19/27 |
09/06/23 | 6,001 | 5,966 | 5,926 | ||||||||||||
| Orion Group Holdco LLC, 11.610%, 03/19/27 |
09/06/23 | 186,667 | 184,121 | 185,510 | ||||||||||||
| Orion Group Holdco LLC, 11.646%, 03/19/27 |
09/06/23-11/17/23 | 683,384 | 681,971 | 679,147 | ||||||||||||
| Pioneer Midco, 11.625%, 11/18/30 |
01/27/23-09/28/23 | 1,117,728 | 1,099,773 | 1,117,728 | ||||||||||||
| Sonder Holdings, Inc., 13.500%, 01/19/27 |
01/19/22-09/29/23 | 1,515,329 | 1,488,648 | 1,320,306 | ||||||||||||
| Versa Networks, Inc. 10/07/32 |
10/14/22 | 83,584 | — | 235,707 | ||||||||||||
| Versa Networks, Inc. - Series E |
10/14/22 | 678,151 | 1,978,985 | 2,210,772 | ||||||||||||
|
|
|
|||||||||||||||
| $ | 28,662,969 | |||||||||||||||
|
|
|
|||||||||||||||
TBA Forward Sale Commitments
| Security Description |
Interest Rate | Maturity | Face Amount |
Cost | Value | |||||||||||||||
| Uniform Mortgage-Backed Security |
1.500 | % | TBA | $ | (3,996,762 | ) | $ | (3,172,613 | ) | $ | (3,274,910 | ) | ||||||||
| Uniform Mortgage-Backed Security |
2.500 | % | TBA | (11,591,800 | ) | (8,800,479 | ) | (9,477,925 | ) | |||||||||||
| Uniform Mortgage-Backed Security |
4.000 | % | TBA | (33,026,300 | ) | (30,545,072 | ) | (31,265,546 | ) | |||||||||||
| Uniform Mortgage-Backed Security |
6.000 | % | TBA | (4,516,100 | ) | (4,446,314 | ) | (4,585,253 | ) | |||||||||||
|
|
|
|
|
|||||||||||||||||
| Totals |
|
$ | (46,964,478 | ) | $ | (48,603,634 | ) | |||||||||||||
|
|
|
|
|
|||||||||||||||||
Forward Foreign Currency Exchange Contracts
| Contracts to Buy |
Counterparty |
Settlement Date |
In Exchange for |
Unrealized Appreciation/ (Depreciation) |
||||||||||||||||||
| AUD | 307,000 | BBP |
01/18/24 | USD | 201,732 | $ | 7,574 | |||||||||||||||
| AUD | 312,000 | BBP |
01/18/24 | USD | 205,517 | 7,199 | ||||||||||||||||
| AUD | 415,000 | BBP |
01/18/24 | USD | 280,339 | 2,599 | ||||||||||||||||
| AUD | 408,000 | DBAG |
01/18/24 | USD | 274,092 | 4,075 | ||||||||||||||||
| AUD | 412,000 | JPMC |
01/18/24 | USD | 263,544 | 17,350 | ||||||||||||||||
| AUD | 412,000 | JPMC |
01/18/24 | USD | 263,544 | 17,350 | ||||||||||||||||
| AUD | 202,000 | MSIP |
01/18/24 | USD | 134,496 | 3,223 | ||||||||||||||||
| AUD | 202,000 | MSIP |
01/18/24 | USD | 134,496 | 3,223 | ||||||||||||||||
| AUD | 408,000 | UBSA |
01/18/24 | USD | 273,878 | 4,288 | ||||||||||||||||
| BRL | 1,942,201 | BNP |
01/03/24 | USD | 395,000 | 4,827 | ||||||||||||||||
| BRL | 674,040 | CBNA |
01/03/24 | USD | 139,227 | (467 | ) | |||||||||||||||
| BRL | 674,040 | CBNA |
01/03/24 | USD | 139,227 | (467 | ) | |||||||||||||||
| BRL | 1,002,660 | CBNA |
01/03/24 | USD | 204,000 | 2,411 | ||||||||||||||||
| BRL | 1,002,660 | CBNA |
01/03/24 | USD | 204,000 | 2,411 | ||||||||||||||||
| BRL | 503,819 | GSI |
01/03/24 | USD | 102,000 | 1,718 | ||||||||||||||||
| BRL | 503,819 | GSI |
01/03/24 | USD | 102,000 | 1,718 | ||||||||||||||||
See accompanying notes to financial statements.
BHFTII-36
Brighthouse Funds Trust II
BlackRock Bond Income Portfolio
Schedule of Investments as of December 31, 2023
Forward Foreign Currency Exchange Contracts—(Continued)
| Contracts to Buy |
Counterparty |
Settlement Date |
In Exchange for |
Unrealized Appreciation/ (Depreciation) |
||||||||||||||||||
| BRL | 998,837 | GSI |
01/03/24 | USD | 203,000 | $ | 2,624 | |||||||||||||||
| BRL | 998,837 | GSI |
01/03/24 | USD | 203,000 | 2,624 | ||||||||||||||||
| BRL | 1,943,550 | GSI |
01/03/24 | USD | 401,452 | (1,347 | ) | |||||||||||||||
| BRL | 1,812,384 | MSIP |
01/03/24 | USD | 374,359 | (1,256 | ) | |||||||||||||||
| BRL | 1,812,384 | MSIP |
01/03/24 | USD | 374,359 | (1,256 | ) | |||||||||||||||
| BRL | 1,820,103 | MSIP |
02/02/24 | USD | 372,000 | 2,084 | ||||||||||||||||
| BRL | 1,820,103 | MSIP |
02/02/24 | USD | 372,000 | 2,084 | ||||||||||||||||
| CAD | 293,424 | HSBC |
01/18/24 | USD | 213,000 | 8,496 | ||||||||||||||||
| CAD | 373,263 | MSIP |
01/18/24 | USD | 280,000 | 1,764 | ||||||||||||||||
| CAD | 434,032 | MSIP |
01/18/24 | USD | 321,000 | 6,636 | ||||||||||||||||
| CAD | 475,948 | MSIP |
01/18/24 | USD | 352,000 | 7,277 | ||||||||||||||||
| CHF | 117,095 | CBNA |
01/18/24 | USD | 136,000 | 3,428 | ||||||||||||||||
| CLP | 120,902,500 | BNP |
01/18/24 | USD | 137,000 | 127 | ||||||||||||||||
| CLP | 174,519,100 | BNP |
01/18/24 | USD | 203,000 | (5,062 | ) | |||||||||||||||
| CLP | 117,619,600 | CBNA |
01/18/24 | USD | 136,000 | (2,597 | ) | |||||||||||||||
| CLP | 117,619,600 | CBNA |
01/18/24 | USD | 136,000 | (2,597 | ) | |||||||||||||||
| CLP | 119,265,200 | CBNA |
01/18/24 | USD | 136,000 | (730 | ) | |||||||||||||||
| CLP | 119,265,200 | CBNA |
01/18/24 | USD | 136,000 | (730 | ) | |||||||||||||||
| COP | 535,258,500 | CBNA |
01/18/24 | USD | 133,000 | 4,705 | ||||||||||||||||
| COP | 535,258,500 | CBNA |
01/18/24 | USD | 133,000 | 4,705 | ||||||||||||||||
| COP | 544,978,000 | CBNA |
01/18/24 | USD | 134,000 | 6,205 | ||||||||||||||||
| COP | 549,869,000 | CBNA |
01/18/24 | USD | 134,000 | 7,463 | ||||||||||||||||
| COP | 533,469,650 | GSI |
01/18/24 | USD | 133,000 | 4,244 | ||||||||||||||||
| COP | 533,469,650 | GSI |
01/18/24 | USD | 133,000 | 4,244 | ||||||||||||||||
| COP | 1,616,206,320 | GSI |
01/18/24 | USD | 408,000 | 7,797 | ||||||||||||||||
| COP | 1,923,651,360 | BNP |
08/15/24 | USD | 444,867 | 30,646 | ||||||||||||||||
| COP | 748,086,640 | BBP |
08/15/24 | USD | 175,638 | 9,284 | ||||||||||||||||
| COP | 2,771,224,000 | MSIP |
08/15/24 | USD | 641,042 | 43,985 | ||||||||||||||||
| EUR | 191,000 | BNP |
01/18/24 | USD | 210,086 | 892 | ||||||||||||||||
| EUR | 250,000 | BNP |
01/18/24 | USD | 273,365 | 2,784 | ||||||||||||||||
| EUR | 123,000 | BBP |
01/18/24 | USD | 134,016 | 1,849 | ||||||||||||||||
| EUR | 534,000 | TDB |
01/18/24 | USD | 573,097 | 16,756 | ||||||||||||||||
| EUR | 927,000 | TDB |
01/18/24 | USD | 994,871 | 29,088 | ||||||||||||||||
| EUR | 256,000 | UBSA |
01/18/24 | USD | 275,502 | 7,274 | ||||||||||||||||
| GBP | 164,000 | BNP |
01/18/24 | USD | 209,400 | (341 | ) | |||||||||||||||
| GBP | 107,000 | BBP |
01/18/24 | USD | 132,741 | 3,658 | ||||||||||||||||
| GBP | 107,000 | BBP |
01/18/24 | USD | 132,741 | 3,658 | ||||||||||||||||
| GBP | 255,000 | UBSA |
01/18/24 | USD | 313,081 | 11,981 | ||||||||||||||||
| GBP | 255,000 | UBSA |
01/18/24 | USD | 313,081 | 11,981 | ||||||||||||||||
| HUF | 26,676,983 | BNP |
01/18/24 | USD | 75,000 | 1,736 | ||||||||||||||||
| HUF | 77,185,403 | BNP |
01/18/24 | USD | 217,000 | 5,023 | ||||||||||||||||
| HUF | 48,834,366 | BBP |
01/18/24 | USD | 140,000 | 472 | ||||||||||||||||
| IDR | 3,975,490,200 | BBP |
01/18/24 | USD | 253,000 | 5,162 | ||||||||||||||||
| IDR | 3,975,490,200 | BBP |
01/18/24 | USD | 253,000 | 5,162 | ||||||||||||||||
| IDR | 2,099,840,000 | CBNA |
01/18/24 | USD | 136,000 | 360 | ||||||||||||||||
| IDR | 2,099,840,000 | CBNA |
01/18/24 | USD | 136,000 | 360 | ||||||||||||||||
| IDR | 77,716,119 | CBNA |
01/31/24 | USD | 5,004 | 42 | ||||||||||||||||
| IDR | 11,137,506,328 | CBNA |
01/31/24 | USD | 717,161 | 6,005 | ||||||||||||||||
| IDR | 29,498,747,434 | CBNA |
03/20/24 | USD | 1,895,307 | 18,899 | ||||||||||||||||
| INR | 17,350,840 | BOA |
01/18/24 | USD | 208,000 | 409 | ||||||||||||||||
| INR | 17,350,840 | BOA |
01/18/24 | USD | 208,000 | 409 | ||||||||||||||||
| JPY | 15,075,893 | BNP |
01/18/24 | USD | 105,000 | 2,140 | ||||||||||||||||
| JPY | 19,773,314 | BNP |
01/18/24 | USD | 134,000 | 6,523 | ||||||||||||||||
| JPY | 19,795,581 | BNP |
01/18/24 | USD | 134,000 | 6,681 | ||||||||||||||||
| JPY | 20,007,940 | BNP |
01/18/24 | USD | 134,000 | 8,190 | ||||||||||||||||
| JPY | 9,800,926 | BBP |
01/18/24 | USD | 68,000 | 1,652 | ||||||||||||||||
| JPY | 9,800,926 | BBP |
01/18/24 | USD | 68,000 | 1,652 | ||||||||||||||||
See accompanying notes to financial statements.
BHFTII-37
Brighthouse Funds Trust II
BlackRock Bond Income Portfolio
Schedule of Investments as of December 31, 2023
Forward Foreign Currency Exchange Contracts—(Continued)
| Contracts to Buy |
Counterparty |
Settlement Date |
In Exchange for |
Unrealized Appreciation/ (Depreciation) |
||||||||||||||||||
| JPY | 19,814,566 | BBP |
01/18/24 | USD | 134,000 | $ | 6,816 | |||||||||||||||
| JPY | 29,377,641 | BBP |
01/18/24 | USD | 205,000 | 3,778 | ||||||||||||||||
| JPY | 19,734,025 | CBNA |
01/18/24 | USD | 135,000 | 5,244 | ||||||||||||||||
| JPY | 19,734,025 | CBNA |
01/18/24 | USD | 135,000 | 5,244 | ||||||||||||||||
| JPY | 19,642,885 | GSI |
01/18/24 | USD | 134,000 | 5,596 | ||||||||||||||||
| JPY | 34,659,794 | UBSA |
01/18/24 | USD | 231,000 | 15,317 | ||||||||||||||||
| JPY | 36,008,760 | UBSA |
01/18/24 | USD | 240,000 | 15,903 | ||||||||||||||||
| KRW | 171,975,600 | CBNA |
01/18/24 | USD | 134,000 | (350 | ) | |||||||||||||||
| KRW | 171,975,600 | CBNA |
01/18/24 | USD | 134,000 | (350 | ) | |||||||||||||||
| KRW | 176,392,000 | CBNA |
01/18/24 | USD | 136,000 | 1,082 | ||||||||||||||||
| KRW | 176,392,000 | CBNA |
01/18/24 | USD | 136,000 | 1,082 | ||||||||||||||||
| KRW | 177,177,400 | MSIP |
01/18/24 | USD | 136,000 | 1,692 | ||||||||||||||||
| MXN | 4,717,631 | BNP |
01/18/24 | USD | 269,000 | 8,162 | ||||||||||||||||
| MXN | 2,411,568 | BBP |
01/18/24 | USD | 139,000 | 2,680 | ||||||||||||||||
| MXN | 3,506,913 | BBP |
01/18/24 | USD | 201,000 | 5,032 | ||||||||||||||||
| MXN | 3,574,269 | BBP |
01/18/24 | USD | 204,000 | 5,989 | ||||||||||||||||
| MXN | 1,787,224 | GSI |
01/18/24 | USD | 102,000 | 3,000 | ||||||||||||||||
| MXN | 1,787,224 | GSI |
01/18/24 | USD | 102,000 | 3,000 | ||||||||||||||||
| MXN | 2,332,687 | GSI |
01/18/24 | USD | 133,000 | 4,046 | ||||||||||||||||
| MXN | 2,332,687 | GSI |
01/18/24 | USD | 133,000 | 4,046 | ||||||||||||||||
| MXN | 3,445,777 | GSI |
01/18/24 | USD | 196,000 | 6,440 | ||||||||||||||||
| MXN | 3,445,777 | GSI |
01/18/24 | USD | 196,000 | 6,440 | ||||||||||||||||
| MXN | 3,599,976 | GSI |
01/18/24 | USD | 206,000 | 5,499 | ||||||||||||||||
| MXN | 1,120,699 | UBSA |
01/18/24 | USD | 63,000 | 2,841 | ||||||||||||||||
| MXN | 1,120,704 | UBSA |
01/18/24 | USD | 63,000 | 2,842 | ||||||||||||||||
| MXN | 22,790,406 | UBSA |
01/18/24 | USD | 1,300,249 | 38,691 | ||||||||||||||||
| MYR | 1,314,799 | BBP |
01/18/24 | USD | 281,000 | 5,420 | ||||||||||||||||
| MYR | 1,314,799 | BBP |
01/18/24 | USD | 281,000 | 5,420 | ||||||||||||||||
| NOK | 1,440,156 | CBNA |
01/18/24 | USD | 134,000 | 7,802 | ||||||||||||||||
| NOK | 2,998,476 | GSI |
01/18/24 | USD | 275,000 | 20,239 | ||||||||||||||||
| PLN | 535,719 | BOA |
01/18/24 | USD | 134,000 | 2,126 | ||||||||||||||||
| PLN | 535,719 | BOA |
01/18/24 | USD | 134,000 | 2,126 | ||||||||||||||||
| PLN | 554,570 | CBNA |
01/18/24 | USD | 140,000 | 916 | ||||||||||||||||
| PLN | 812,591 | CBNA |
01/18/24 | USD | 199,000 | 7,479 | ||||||||||||||||
| PLN | 812,591 | CBNA |
01/18/24 | USD | 199,000 | 7,479 | ||||||||||||||||
| PLN | 1,083,517 | CBNA |
01/18/24 | USD | 270,000 | 5,321 | ||||||||||||||||
| PLN | 1,084,896 | CBNA |
01/18/24 | USD | 269,000 | 6,672 | ||||||||||||||||
| PLN | 529,506 | UBSA |
01/18/24 | USD | 134,000 | 547 | ||||||||||||||||
| PLN | 529,506 | UBSA |
01/18/24 | USD | 134,000 | 547 | ||||||||||||||||
| PLN | 811,294 | UBSA |
01/18/24 | USD | 201,000 | 5,149 | ||||||||||||||||
| PLN | 811,294 | UBSA |
01/18/24 | USD | 201,000 | 5,150 | ||||||||||||||||
| PLN | 819,373 | UBSA |
01/18/24 | USD | 204,000 | 4,202 | ||||||||||||||||
| PLN | 1,588,036 | UBSA |
01/18/24 | USD | 392,000 | 11,519 | ||||||||||||||||
| THB | 14,425,385 | JPMC |
01/18/24 | USD | 403,000 | 20,169 | ||||||||||||||||
| THB | 14,425,385 | JPMC |
01/18/24 | USD | 403,000 | 20,169 | ||||||||||||||||
| TRY | 1,635,700 | BBP |
12/04/24 | USD | 41,971 | (755 | ) | |||||||||||||||
| TRY | 1,619,343 | GSI |
12/04/24 | USD | 42,203 | (1,399 | ) | |||||||||||||||
| TRY | 1,635,700 | GSI |
12/04/24 | USD | 41,828 | (612 | ) | |||||||||||||||
| TRY | 3,271,400 | GSI |
12/04/24 | USD | 84,044 | (1,611 | ) | |||||||||||||||
| TRY | 4,907,100 | GSI |
12/04/24 | USD | 125,968 | (2,320 | ) | |||||||||||||||
| ZAR | 3,921,813 | BOA |
01/18/24 | USD | 210,000 | 4,128 | ||||||||||||||||
| ZAR | 2,458,917 | BBP |
01/18/24 | USD | 133,000 | 1,255 | ||||||||||||||||
| ZAR | 2,458,917 | BBP |
01/18/24 | USD | 133,000 | 1,255 | ||||||||||||||||
| ZAR | 4,945,712 | BBP |
01/18/24 | USD | 269,000 | 1,032 | ||||||||||||||||
| ZAR | 4,945,712 | BBP |
01/18/24 | USD | 269,000 | 1,032 | ||||||||||||||||
| ZAR | 2,473,095 | CBNA |
01/18/24 | USD | 133,000 | 2,029 | ||||||||||||||||
| ZAR | 2,473,095 | CBNA |
01/18/24 | USD | 133,000 | 2,029 | ||||||||||||||||
See accompanying notes to financial statements.
BHFTII-38
Brighthouse Funds Trust II
BlackRock Bond Income Portfolio
Schedule of Investments as of December 31, 2023
Forward Foreign Currency Exchange Contracts—(Continued)
| Contracts to Buy |
Counterparty |
Settlement Date |
In Exchange for |
Unrealized Appreciation/ (Depreciation) |
||||||||||||||||||
| ZAR | 2,508,171 | CBNA |
01/18/24 | USD | 134,000 | $ | 2,944 | |||||||||||||||
| ZAR | 3,711,334 | CBNA |
01/18/24 | USD | 200,000 | 2,636 | ||||||||||||||||
| ZAR | 3,888,950 | CBNA |
01/18/24 | USD | 205,000 | 7,333 | ||||||||||||||||
| ZAR | 4,840,303 | CBNA |
01/18/24 | USD | 262,000 | 2,276 | ||||||||||||||||
| ZAR | 3,299,271 | DBAG |
01/18/24 | USD | 175,500 | 4,637 | ||||||||||||||||
| ZAR | 3,675,256 | DBAG |
01/18/24 | USD | 195,500 | 5,166 | ||||||||||||||||
| Contracts to Deliver |
||||||||||||||||||||||
| AUD | 307,000 | BNP |
01/18/24 | USD | 203,588 | (5,718 | ) | |||||||||||||||
| AUD | 206,000 | BBP |
01/18/24 | USD | 136,923 | (3,524 | ) | |||||||||||||||
| AUD | 206,000 | BBP |
01/18/24 | USD | 136,923 | (3,524 | ) | |||||||||||||||
| AUD | 416,000 | GSI |
01/18/24 | USD | 273,423 | (10,197 | ) | |||||||||||||||
| AUD | 312,000 | GSI |
01/18/24 | USD | 205,528 | (7,187 | ) | |||||||||||||||
| AUD | 204,000 | MSIP |
01/18/24 | USD | 132,951 | (6,132 | ) | |||||||||||||||
| AUD | 204,000 | MSIP |
01/18/24 | USD | 132,951 | (6,132 | ) | |||||||||||||||
| AUD | 1,692,000 | CIBC |
03/20/24 | USD | 1,141,561 | (14,119 | ) | |||||||||||||||
| BRL | 1,942,201 | BNP |
01/03/24 | USD | 401,173 | 1,346 | ||||||||||||||||
| BRL | 1,002,660 | CBNA |
01/03/24 | USD | 207,105 | 695 | ||||||||||||||||
| BRL | 1,002,660 | CBNA |
01/03/24 | USD | 207,106 | 695 | ||||||||||||||||
| BRL | 674,040 | CBNA |
01/03/24 | USD | 137,000 | (1,760 | ) | |||||||||||||||
| BRL | 674,040 | CBNA |
01/03/24 | USD | 137,000 | (1,760 | ) | |||||||||||||||
| BRL | 1,943,550 | GSI |
01/03/24 | USD | 395,000 | (5,105 | ) | |||||||||||||||
| BRL | 998,837 | GSI |
01/03/24 | USD | 206,316 | 692 | ||||||||||||||||
| BRL | 998,837 | GSI |
01/03/24 | USD | 206,316 | 692 | ||||||||||||||||
| BRL | 503,819 | GSI |
01/03/24 | USD | 104,067 | 349 | ||||||||||||||||
| BRL | 503,819 | GSI |
01/03/24 | USD | 104,067 | 349 | ||||||||||||||||
| BRL | 1,812,384 | MSIP |
01/03/24 | USD | 372,000 | (1,103 | ) | |||||||||||||||
| BRL | 1,812,384 | MSIP |
01/03/24 | USD | 372,000 | (1,103 | ) | |||||||||||||||
| BRL | 3,796,586 | SSBT |
04/02/24 | USD | 724,844 | (50,306 | ) | |||||||||||||||
| CAD | 551,170 | MSIP |
01/18/24 | USD | 400,000 | (16,059 | ) | |||||||||||||||
| CAD | 300,388 | MSIP |
01/18/24 | USD | 218,000 | (8,752 | ) | |||||||||||||||
| CAD | 184,275 | UBSA |
01/18/24 | USD | 134,000 | (5,103 | ) | |||||||||||||||
| CAD | 184,275 | UBSA |
01/18/24 | USD | 134,000 | (5,103 | ) | |||||||||||||||
| CAD | 1,542,000 | DBAG |
03/20/24 | USD | 1,153,430 | (11,526 | ) | |||||||||||||||
| CHF | 118,887 | GSI |
01/18/24 | USD | 136,000 | (5,561 | ) | |||||||||||||||
| CLP | 118,472,080 | BNP |
01/18/24 | USD | 134,000 | (370 | ) | |||||||||||||||
| CLP | 118,472,080 | BNP |
01/18/24 | USD | 134,000 | (370 | ) | |||||||||||||||
| CLP | 35,035,620 | BBP |
01/18/24 | USD | 38,000 | (1,737 | ) | |||||||||||||||
| CLP | 35,035,620 | BBP |
01/18/24 | USD | 38,000 | (1,737 | ) | |||||||||||||||
| CLP | 117,933,400 | CBNA |
01/18/24 | USD | 134,000 | 241 | ||||||||||||||||
| CLP | 117,933,400 | CBNA |
01/18/24 | USD | 134,000 | 241 | ||||||||||||||||
| CLP | 176,788,640 | MSIP |
01/18/24 | USD | 203,000 | 2,488 | ||||||||||||||||
| CLP | 119,651,690 | MSIP |
01/18/24 | USD | 137,000 | 1,292 | ||||||||||||||||
| CNH | 960,711 | CBNA |
01/18/24 | USD | 135,000 | 37 | ||||||||||||||||
| CNH | 960,711 | CBNA |
01/18/24 | USD | 135,000 | 37 | ||||||||||||||||
| CNH | 485,793 | UBSA |
01/18/24 | USD | 68,000 | (246 | ) | |||||||||||||||
| CNH | 485,793 | UBSA |
01/18/24 | USD | 68,000 | (246 | ) | |||||||||||||||
| COP | 1,923,651,360 | BNP |
01/09/24 | USD | 465,369 | (30,434 | ) | |||||||||||||||
| COP | 748,086,640 | BBP |
01/09/24 | USD | 183,839 | (8,973 | ) | |||||||||||||||
| COP | 2,771,224,000 | CBNA |
01/09/24 | USD | 680,832 | (33,425 | ) | |||||||||||||||
| COP | 1,454,191,718 | BNP |
01/18/24 | USD | 356,498 | (17,618 | ) | |||||||||||||||
| COP | 546,604,400 | BNP |
01/18/24 | USD | 136,000 | (4,624 | ) | |||||||||||||||
| COP | 541,226,000 | BOA |
01/18/24 | USD | 134,000 | (5,240 | ) | |||||||||||||||
| COP | 552,714,880 | CBNA |
01/18/24 | USD | 136,000 | (6,196 | ) | |||||||||||||||
| COP | 550,043,840 | GSI |
01/18/24 | USD | 136,000 | (5,508 | ) | |||||||||||||||
| COP | 537,474,000 | GSI |
01/18/24 | USD | 134,000 | (4,275 | ) | |||||||||||||||
See accompanying notes to financial statements.
BHFTII-39
Brighthouse Funds Trust II
BlackRock Bond Income Portfolio
Schedule of Investments as of December 31, 2023
Forward Foreign Currency Exchange Contracts—(Continued)
| Contracts to Deliver |
Counterparty |
Settlement Date |
In Exchange for |
Unrealized Appreciation/ (Depreciation) |
||||||||||||||||||
| COP | 537,474,000 | GSI |
01/18/24 | USD | 134,000 | $ | (4,275 | ) | ||||||||||||||
| COP | 597,870,000 | SCB |
01/18/24 | USD | 146,000 | (7,813 | ) | |||||||||||||||
| COP | 597,870,000 | SCB |
01/18/24 | USD | 146,000 | (7,813 | ) | |||||||||||||||
| COP | 548,730,000 | SCB |
01/18/24 | USD | 134,000 | (7,170 | ) | |||||||||||||||
| COP | 6,156,491,196 | CBNA |
03/20/24 | USD | 1,507,658 | (56,780 | ) | |||||||||||||||
| COP | 6,156,491,196 | GSI |
03/20/24 | USD | 1,509,684 | (54,754 | ) | |||||||||||||||
| COP | 1,071,650,610 | GSI |
03/20/24 | USD | 262,707 | (9,612 | ) | |||||||||||||||
| EUR | 322,000 | BNP |
01/18/24 | USD | 349,582 | (6,097 | ) | |||||||||||||||
| EUR | 322,000 | BNP |
01/18/24 | USD | 349,582 | (6,097 | ) | |||||||||||||||
| EUR | 202,000 | BNP |
01/18/24 | USD | 216,836 | (6,292 | ) | |||||||||||||||
| EUR | 124,000 | BNP |
01/18/24 | USD | 135,273 | (1,697 | ) | |||||||||||||||
| EUR | 124,000 | BNP |
01/18/24 | USD | 135,273 | (1,697 | ) | |||||||||||||||
| EUR | 228,000 | BNY |
01/18/24 | USD | 244,694 | (7,153 | ) | |||||||||||||||
| EUR | 250,000 | BBP |
01/18/24 | USD | 274,905 | (1,244 | ) | |||||||||||||||
| EUR | 123,000 | BBP |
01/18/24 | USD | 134,935 | (930 | ) | |||||||||||||||
| EUR | 123,000 | BBP |
01/18/24 | USD | 134,706 | (1,159 | ) | |||||||||||||||
| EUR | 123,000 | BBP |
01/18/24 | USD | 134,706 | (1,159 | ) | |||||||||||||||
| EUR | 185,000 | GSI |
01/18/24 | USD | 203,444 | (906 | ) | |||||||||||||||
| EUR | 185,000 | GSI |
01/18/24 | USD | 203,444 | (906 | ) | |||||||||||||||
| EUR | 123,000 | GSI |
01/18/24 | USD | 135,082 | (783 | ) | |||||||||||||||
| EUR | 123,000 | GSI |
01/18/24 | USD | 135,082 | (783 | ) | |||||||||||||||
| EUR | 256,000 | UBSA |
01/18/24 | USD | 277,097 | (5,679 | ) | |||||||||||||||
| EUR | 108,430 | CBNA |
02/06/24 | USD | 117,352 | (2,508 | ) | |||||||||||||||
| EUR | 79,897 | CBNA |
02/06/24 | USD | 86,471 | (1,848 | ) | |||||||||||||||
| EUR | 38,315 | CBNA |
02/06/24 | USD | 41,468 | (886 | ) | |||||||||||||||
| EUR | 263,574 | BBP |
03/14/24 | USD | 284,629 | (7,166 | ) | |||||||||||||||
| EUR | 25,957 | BBP |
03/14/24 | USD | 28,031 | (706 | ) | |||||||||||||||
| EUR | 12,000 | TDB |
03/20/24 | USD | 13,243 | (45 | ) | |||||||||||||||
| EUR | 11,746,000 | UBSA |
03/20/24 | USD | 12,889,062 | (117,804 | ) | |||||||||||||||
| GBP | 215,000 | BBP |
01/18/24 | USD | 269,827 | (4,245 | ) | |||||||||||||||
| GBP | 215,000 | BBP |
01/18/24 | USD | 269,827 | (4,245 | ) | |||||||||||||||
| GBP | 164,000 | BBP |
01/18/24 | USD | 205,387 | (3,673 | ) | |||||||||||||||
| IDR | 9,268,630,561 | BNP |
01/18/24 | USD | 596,207 | (5,684 | ) | |||||||||||||||
| IDR | 5,441,348,398 | BNP |
01/18/24 | USD | 350,761 | (2,592 | ) | |||||||||||||||
| IDR | 5,184,537,223 | BBP |
01/18/24 | USD | 335,851 | (825 | ) | |||||||||||||||
| IDR | 3,822,208,940 | BBP |
01/18/24 | USD | 246,594 | (1,614 | ) | |||||||||||||||
| IDR | 1,229,921,472 | BBP |
01/18/24 | USD | 79,427 | (443 | ) | |||||||||||||||
| IDR | 11,215,222,447 | CBNA |
01/31/24 | USD | 727,128 | (1,084 | ) | |||||||||||||||
| JPY | 29,756,127 | BNP |
01/18/24 | USD | 203,000 | (8,468 | ) | |||||||||||||||
| JPY | 29,230,347 | BNP |
01/18/24 | USD | 205,000 | (2,731 | ) | |||||||||||||||
| JPY | 19,712,480 | BNP |
01/18/24 | USD | 134,000 | (6,091 | ) | |||||||||||||||
| JPY | 29,171,827 | BBP |
01/18/24 | USD | 199,000 | (8,315 | ) | |||||||||||||||
| JPY | 19,675,340 | GSI |
01/18/24 | USD | 134,000 | (5,827 | ) | |||||||||||||||
| JPY | 31,806,652 | MSIP |
01/18/24 | USD | 212,000 | (14,040 | ) | |||||||||||||||
| KRW | 176,244,848 | UBSA |
01/18/24 | USD | 136,000 | (968 | ) | |||||||||||||||
| MXN | 16,682,635 | BBP |
01/18/24 | USD | 953,697 | (26,411 | ) | |||||||||||||||
| MXN | 58,989,372 | CBNA |
01/18/24 | USD | 3,274,677 | (190,959 | ) | |||||||||||||||
| MXN | 4,668,210 | CBNA |
01/18/24 | USD | 269,000 | (5,258 | ) | |||||||||||||||
| MXN | 4,094,569 | CBNA |
01/18/24 | USD | 227,302 | (13,255 | ) | |||||||||||||||
| MXN | 3,574,193 | CBNA |
01/18/24 | USD | 201,000 | (8,984 | ) | |||||||||||||||
| MXN | 2,406,604 | CBNA |
01/18/24 | USD | 139,000 | (2,388 | ) | |||||||||||||||
| MXN | 2,412,920 | GSI |
01/18/24 | USD | 137,000 | (4,760 | ) | |||||||||||||||
| MXN | 2,412,920 | GSI |
01/18/24 | USD | 137,000 | (4,760 | ) | |||||||||||||||
| MXN | 3,588,351 | MSIP |
01/18/24 | USD | 206,000 | (4,816 | ) | |||||||||||||||
| MXN | 3,552,047 | MSIP |
01/18/24 | USD | 204,000 | (4,683 | ) | |||||||||||||||
| MXN | 4,472,124 | TDB |
01/18/24 | USD | 256,656 | (6,082 | ) | |||||||||||||||
| NOK | 1,426,683 | MSIP |
01/18/24 | USD | 134,000 | (6,476 | ) | |||||||||||||||
See accompanying notes to financial statements.
BHFTII-40
Brighthouse Funds Trust II
BlackRock Bond Income Portfolio
Schedule of Investments as of December 31, 2023
Forward Foreign Currency Exchange Contracts—(Continued)
| Contracts to Deliver |
Counterparty |
Settlement Date |
In Exchange for |
Unrealized Appreciation/ (Depreciation) |
||||||||||||||||||
| NOK | 3,022,705 | UBSA |
01/18/24 | USD | 275,000 | $ | (22,625 | ) | ||||||||||||||
| NOK | 1,454,351 | UBSA |
01/18/24 | USD | 139,000 | (4,200 | ) | |||||||||||||||
| PLN | 2,404,787 | BNP |
01/18/24 | USD | 580,505 | (30,550 | ) | |||||||||||||||
| PLN | 1,621,098 | BNP |
01/18/24 | USD | 392,000 | (19,920 | ) | |||||||||||||||
| PLN | 823,730 | BNP |
01/18/24 | USD | 205,000 | (4,310 | ) | |||||||||||||||
| PLN | 575,387 | BNP |
01/18/24 | USD | 139,000 | (7,206 | ) | |||||||||||||||
| PLN | 574,718 | BNP |
01/18/24 | USD | 139,000 | (7,036 | ) | |||||||||||||||
| PLN | 1,081,580 | CBNA |
01/18/24 | USD | 269,000 | (5,829 | ) | |||||||||||||||
| PLN | 2,647,936 | DBAG |
01/18/24 | USD | 657,413 | (15,427 | ) | |||||||||||||||
| PLN | 1,082,882 | GSI |
01/18/24 | USD | 269,000 | (6,160 | ) | |||||||||||||||
| PLN | 557,069 | UBSA |
01/18/24 | USD | 140,000 | (1,551 | ) | |||||||||||||||
| TWD | 6,901,109 | MSIP |
01/17/24 | USD | 214,500 | (10,742 | ) | |||||||||||||||
| TWD | 6,901,109 | MSIP |
01/17/24 | USD | 214,500 | (10,742 | ) | |||||||||||||||
| TWD | 3,271,800 | CBNA |
01/18/24 | USD | 105,000 | (1,800 | ) | |||||||||||||||
| ZAR | 2,541,602 | BOA |
01/18/24 | USD | 135,000 | (3,769 | ) | |||||||||||||||
| ZAR | 2,541,602 | BOA |
01/18/24 | USD | 135,000 | (3,769 | ) | |||||||||||||||
| ZAR | 3,853,067 | BBP |
01/18/24 | USD | 210,000 | (374 | ) | |||||||||||||||
| ZAR | 3,693,470 | CBNA |
01/18/24 | USD | 200,000 | (1,660 | ) | |||||||||||||||
| ZAR | 2,567,484 | CBNA |
01/18/24 | USD | 135,000 | (5,182 | ) | |||||||||||||||
| ZAR | 2,567,484 | CBNA |
01/18/24 | USD | 135,000 | (5,182 | ) | |||||||||||||||
| ZAR | 2,557,238 | CBNA |
01/18/24 | USD | 135,000 | (4,623 | ) | |||||||||||||||
| ZAR | 2,557,238 | CBNA |
01/18/24 | USD | 135,000 | (4,623 | ) | |||||||||||||||
| ZAR | 2,508,349 | CBNA |
01/18/24 | USD | 134,000 | (2,954 | ) | |||||||||||||||
| ZAR | 2,461,781 | CBNA |
01/18/24 | USD | 134,000 | (411 | ) | |||||||||||||||
| ZAR | 2,461,781 | CBNA |
01/18/24 | USD | 134,000 | (411 | ) | |||||||||||||||
| ZAR | 4,925,407 | DBAG |
01/18/24 | USD | 262,000 | (6,923 | ) | |||||||||||||||
| ZAR | 3,857,383 | HSBC |
01/18/24 | USD | 205,000 | (5,610 | ) | |||||||||||||||
| ZAR | 20,979,601 | DBAG |
02/05/24 | USD | 1,107,162 | (36,576 | ) | |||||||||||||||
| Cross Currency |
||||||||||||||||||||||
| COP | 599,778,000 | SCB |
01/18/24 | GBP | 120,000 | 1,333 | ||||||||||||||||
| COP | 599,778,000 | SCB |
01/18/24 | GBP | 120,000 | 1,333 | ||||||||||||||||
| EUR | 95,000 | GSI |
01/18/24 | MXN | 1,782,672 | 204 | ||||||||||||||||
| EUR | 95,000 | GSI |
01/18/24 | MXN | 1,782,672 | 204 | ||||||||||||||||
| EUR | 511,000 | BNP |
01/18/24 | GBP | 442,750 | 50 | ||||||||||||||||
| EUR | 127,000 | BNP |
01/18/24 | MXN | 2,396,914 | (536 | ) | |||||||||||||||
| EUR | 127,000 | BNP |
01/18/24 | MXN | 2,396,914 | (536 | ) | |||||||||||||||
| EUR | 124,000 | MSIP |
01/18/24 | MXN | 2,341,936 | (619 | ) | |||||||||||||||
| EUR | 124,000 | MSIP |
01/18/24 | MXN | 2,341,936 | (619 | ) | |||||||||||||||
| EUR | 127,000 | BNP |
01/18/24 | MXN | 2,404,163 | (961 | ) | |||||||||||||||
| EUR | 127,000 | BNP |
01/18/24 | MXN | 2,404,163 | (962 | ) | |||||||||||||||
| EUR | 126,000 | BNP |
01/18/24 | MXN | 2,388,438 | (1,142 | ) | |||||||||||||||
| EUR | 126,000 | BNP |
01/18/24 | MXN | 2,388,438 | (1,142 | ) | |||||||||||||||
| EUR | 244,000 | BNP |
01/18/24 | NOK | 2,754,772 | (1,722 | ) | |||||||||||||||
| EUR | 244,000 | BNP |
01/18/24 | NOK | 2,754,772 | (1,722 | ) | |||||||||||||||
| EUR | 125,000 | BNP |
01/18/24 | PLN | 555,509 | (3,080 | ) | |||||||||||||||
| EUR | 125,000 | BNP |
01/18/24 | PLN | 555,509 | (3,080 | ) | |||||||||||||||
| EUR | 124,000 | UBSA |
01/18/24 | PLN | 552,252 | (3,357 | ) | |||||||||||||||
| EUR | 124,000 | UBSA |
01/18/24 | PLN | 552,252 | (3,357 | ) | |||||||||||||||
| EUR | 92,000 | GSI |
01/18/24 | NOK | 1,071,283 | (3,859 | ) | |||||||||||||||
| EUR | 92,000 | GSI |
01/18/24 | NOK | 1,071,283 | (3,859 | ) | |||||||||||||||
| HUF | 47,699,556 | BNP |
01/18/24 | EUR | 125,000 | (867 | ) | |||||||||||||||
| HUF | 47,699,556 | BNP |
01/18/24 | EUR | 125,000 | (867 | ) | |||||||||||||||
| MXN | 2,374,662 | GSI |
01/18/24 | EUR | 124,000 | 2,542 | ||||||||||||||||
| MXN | 2,374,662 | GSI |
01/18/24 | EUR | 124,000 | 2,542 | ||||||||||||||||
| MXN | 2,400,697 | GSI |
01/18/24 | EUR | 126,000 | 1,862 | ||||||||||||||||
See accompanying notes to financial statements.
BHFTII-41
Brighthouse Funds Trust II
BlackRock Bond Income Portfolio
Schedule of Investments as of December 31, 2023
Forward Foreign Currency Exchange Contracts—(Continued)
| Cross Currency |
Counterparty |
Settlement Date |
In Exchange for |
Unrealized Appreciation/ (Depreciation) |
||||||||||||||||||
| MXN | 2,400,697 | GSI |
01/18/24 | EUR | 126,000 | $ | 1,862 | |||||||||||||||
| MXN | 2,418,207 | CBNA |
01/18/24 | EUR | 127,000 | 1,787 | ||||||||||||||||
| MXN | 2,418,207 | CBNA |
01/18/24 | EUR | 127,000 | 1,787 | ||||||||||||||||
| MXN | 1,793,892 | CBNA |
01/18/24 | EUR | 95,000 | 455 | ||||||||||||||||
| MXN | 1,793,892 | CBNA |
01/18/24 | EUR | 95,000 | 455 | ||||||||||||||||
| NOK | 1,358,324 | BBP |
01/18/24 | EUR | 115,456 | 6,213 | ||||||||||||||||
| NOK | 1,358,324 | BBP |
01/18/24 | EUR | 115,456 | 6,213 | ||||||||||||||||
| NOK | 1,079,459 | UBSA |
01/18/24 | EUR | 92,000 | 4,664 | ||||||||||||||||
| NOK | 1,079,459 | UBSA |
01/18/24 | EUR | 92,000 | 4,664 | ||||||||||||||||
| NOK | 1,357,480 | BNP |
01/18/24 | EUR | 118,000 | 3,319 | ||||||||||||||||
| NOK | 1,357,480 | BNP |
01/18/24 | EUR | 118,000 | 3,319 | ||||||||||||||||
| NOK | 3,598,147 | BNP |
01/18/24 | EUR | 320,000 | 814 | ||||||||||||||||
| NOK | 124,069 | CBNA |
01/18/24 | EUR | 10,544 | 569 | ||||||||||||||||
| NOK | 124,069 | CBNA |
01/18/24 | EUR | 10,544 | 569 | ||||||||||||||||
| ZAR | 2,723,929 | DBAG |
01/18/24 | EUR | 135,000 | (396 | ) | |||||||||||||||
| ZAR | 2,723,875 | DBAG |
01/18/24 | EUR | 135,000 | (399 | ) | |||||||||||||||
|
|
|
|||||||||||||||||||||
| Net Unrealized Depreciation |
|
$ | (455,940 | ) | ||||||||||||||||||
|
|
|
|||||||||||||||||||||
Futures Contracts
| Futures Contracts—Long |
Expiration Date |
Number of Contracts |
Notional Value |
Value/ Unrealized Appreciation/ (Depreciation) |
||||||||||||||||
| 3 Month SOFR Futures |
06/18/24 | 528 | USD | 125,419,800 | $ | 264,472 | ||||||||||||||
| 3 Month SONIA Futures |
03/18/25 | 23 | GBP | 5,542,138 | 9,004 | |||||||||||||||
| Australian 10 Year Treasury Bond Futures |
03/15/24 | 112 | AUD | 13,066,561 | 250,182 | |||||||||||||||
| U.S. Treasury Long Bond Futures |
03/19/24 | 329 | USD | 41,104,438 | 1,372,788 | |||||||||||||||
| U.S. Treasury Note 5 Year Futures |
03/28/24 | 2,000 | USD | 217,546,876 | 3,842,922 | |||||||||||||||
| U.S. Treasury Ultra Long Bond Futures |
03/19/24 | 13 | USD | 1,736,719 | (1,154 | ) | ||||||||||||||
| Futures Contracts—Short |
||||||||||||||||||||
| 3 Month SOFR Futures |
09/17/24 | (14 | ) | USD | (3,341,975 | ) | (18,227 | ) | ||||||||||||
| 3 Month SOFR Futures |
06/17/25 | (556 | ) | USD | (134,246,200 | ) | (659,726 | ) | ||||||||||||
| 3 Month SOFR Futures |
12/17/24 | (1,076 | ) | USD | (257,984,450 | ) | (1,146,788 | ) | ||||||||||||
| Canada Government Bond 10 Year Futures |
03/19/24 | (411 | ) | CAD | (51,037,980 | ) | (1,858,012 | ) | ||||||||||||
| Euro STOXX 50 Index Futures |
03/15/24 | (37 | ) | EUR | (1,680,910 | ) | 15,245 | |||||||||||||
| Euro STOXX Banks Index Futures |
03/15/24 | (234 | ) | EUR | (1,394,640 | ) | 15,158 | |||||||||||||
| Euro-Bobl Futures |
03/07/24 | (8 | ) | EUR | (954,240 | ) | (15,904 | ) | ||||||||||||
| Euro-Buxl 30 Year Bond Futures |
03/07/24 | (71 | ) | EUR | (10,062,120 | ) | (720,059 | ) | ||||||||||||
| Japanese Government 10 Year Bond Futures |
03/13/24 | (1 | ) | JPY | (146,710,000 | ) | (6,157 | ) | ||||||||||||
| Russell 2000 Index E-Mini Futures |
03/15/24 | (31 | ) | USD | (3,173,935 | ) | (219,799 | ) | ||||||||||||
| U.S. Treasury Note 10 Year Futures |
03/19/24 | (162 | ) | USD | (18,288,281 | ) | (266,930 | ) | ||||||||||||
| U.S. Treasury Note 2 Year Futures |
03/28/24 | (1,066 | ) | USD | (219,504,390 | ) | (548,506 | ) | ||||||||||||
| U.S. Treasury Note Ultra 10 Year Futures |
03/19/24 | (302 | ) | USD | (35,640,719 | ) | (199,643 | ) | ||||||||||||
|
|
|
|||||||||||||||||||
| Net Unrealized Appreciation |
|
$ | 108,866 | |||||||||||||||||
|
|
|
|||||||||||||||||||
See accompanying notes to financial statements.
BHFTII-42
Brighthouse Funds Trust II
BlackRock Bond Income Portfolio
Schedule of Investments as of December 31, 2023
Purchased Options
| Foreign Currency Options |
Strike Price |
Counterparty | Expiration Date |
Number of Contracts |
Notional Amount |
Premiums Paid |
Market Value |
Unrealized Appreciation/ (Depreciation) |
||||||||||||||||||||||||||||
| BRL Call/USD Put |
BRL | 4.890 | GSI | 01/04/24 | 408,000 | USD | 408,000 | $ | 5,201 | $ | 3,990 | $ | (1,211 | ) | ||||||||||||||||||||||
| EUR Call/CZK Put |
CZK | 24.900 | GSI | 01/08/24 | 870,000 | EUR | 870,000 | 5,280 | 865 | (4,415 | ) | |||||||||||||||||||||||||
| KRW Call/USD Put |
KRW | 1,280.000 | GSI | 02/22/24 | 350,000 | USD | 350,000 | 3,053 | 3,220 | 167 | ||||||||||||||||||||||||||
| MXN Call/USD Put |
MXN | 16.980 | GSI | 01/15/24 | 934,000 | USD | 934,000 | 3,475 | 6,679 | 3,204 | ||||||||||||||||||||||||||
| PLN Call/EUR Put |
PLN | 4.280 | BOA | 02/02/24 | 74,000 | EUR | 74,000 | 5,923 | 15,395 | 9,472 | ||||||||||||||||||||||||||
| USD Call/EUR Put |
USD | 1.035 | BNP | 01/12/24 | 74,000 | EUR | 74,000 | 8,864 | — | (8,864 | ) | |||||||||||||||||||||||||
| USD Call/EUR Put |
USD | 1.095 | BOA | 01/25/24 | 509,000 | EUR | 509,000 | 3,091 | 2,038 | (1,053 | ) | |||||||||||||||||||||||||
| USD Call/EUR Put |
USD | 1.095 | BNP | 01/31/24 | 634,000 | EUR | 634,000 | 2,486 | 2,901 | 415 | ||||||||||||||||||||||||||
| USD Call/EUR Put |
USD | 1.054 | BOA | 03/27/24 | 64,000 | EUR | 64,000 | 7,026 | 4,464 | (2,562 | ) | |||||||||||||||||||||||||
|
|
|
|
|
|
|
|||||||||||||||||||||||||||||||
| Totals |
|
$ | 44,399 | $ | 39,552 | $ | (4,847 | ) | ||||||||||||||||||||||||||||
|
|
|
|
|
|
|
|||||||||||||||||||||||||||||||
| Interest Rate Swaptions |
Strike Rate |
Counterparty | Floating Rate Index |
Pay/ Receive Floating Rate |
Expiration Date |
Number of Contracts |
Notional Amount |
Premiums Paid |
Market Value |
Unrealized Appreciation/ (Depreciation) |
||||||||||||||||||||||||||||
| Call - OTC - 5 Yr IRS |
4.235% | CBNA | SOFR | Pay | 03/26/24 | 56,337,000 | USD | 56,337,000 | $ | 867,589 | $ | 2,069,016 | $ | 1,201,427 | ||||||||||||||||||||||||
| Put - OTC - 5 Yr. IRS |
4.235% | CBNA | SOFR | Receive | 03/26/24 | 56,337,000 | USD | 56,337,000 | 867,590 | 78,222 | (789,368 | ) | ||||||||||||||||||||||||||
| Put - OTC - 10 Yr. IRS |
2.834% | JPMC | 6M EURIBOR | Receive | 03/12/24 | 41,586,000 | EUR | 41,586,000 | 438,490 | 249,259 | (189,231 | ) | ||||||||||||||||||||||||||
|
|
|
|
|
|
|
|||||||||||||||||||||||||||||||||
| Totals |
|
$ | 2,173,669 | $ | 2,396,497 | $ | 222,828 | |||||||||||||||||||||||||||||||
|
|
|
|
|
|
|
|||||||||||||||||||||||||||||||||
| Options on Exchange-Traded Futures Contracts |
Strike Price |
Expiration Date |
Number of Contracts |
Notional Amount |
Premiums Paid |
Market Value |
Unrealized Appreciation/ (Depreciation) |
|||||||||||||||||||||||||
| Call - 3 Month SOFR Futures |
USD | 94.938 | 03/15/24 | 2,761 | USD | 6,902,500 | $ | 654,692 | $ | 1,121,657 | $ | 466,965 | ||||||||||||||||||||
| Put - U.S. Treasury Note 2 Year Futures |
USD | 102.500 | 01/26/24 | 27 | USD | 54,000 | 13,542 | 5,906 | (7,636 | ) | ||||||||||||||||||||||
| Put - U.S. Treasury Note 2 Year Futures |
USD | 102.500 | 02/23/24 | 36 | USD | 72,000 | 24,781 | 14,625 | (10,156 | ) | ||||||||||||||||||||||
|
|
|
|
|
|
|
|||||||||||||||||||||||||||
| Totals |
|
$ | 693,015 | $ | 1,142,188 | $ | 449,173 | |||||||||||||||||||||||||
|
|
|
|
|
|
|
|||||||||||||||||||||||||||
Written Options
| Foreign Currency Options |
Strike Price |
Counterparty | Expiration Date |
Number of Contracts |
Notional Amount |
Premiums Received |
Market Value |
Unrealized Appreciation/ (Depreciation) |
||||||||||||||||||||||||||||||
| EUR Call/CZK Put |
CZK | 25.350 | GSI | 01/08/24 | (1,118,000 | ) | EUR | (1,118,000 | ) | $ | (2,656 | ) | $ | (90 | ) | $ | 2,566 | |||||||||||||||||||||
| USD Call/BRL Put |
BRL | 5.050 | GSI | 01/04/24 | (408,000 | ) | USD | (408,000 | ) | (1,932 | ) | (9 | ) | 1,923 | ||||||||||||||||||||||||
| USD Call/EUR Put |
USD | 1.083 | BOA | 01/25/24 | (509,000 | ) | EUR | (509,000 | ) | (1,262 | ) | (734 | ) | 528 | ||||||||||||||||||||||||
| USD Call/KRW Put |
KRW | 1,330.000 | GSI | 02/22/24 | (350,000 | ) | USD | (350,000 | ) | (2,182 | ) | (1,653 | ) | 529 | ||||||||||||||||||||||||
| USD Call/MXN Put |
MXN | 19.000 | UBSA | 01/04/24 | (392,000 | ) | USD | (392,000 | ) | (2,168 | ) | — | 2,168 | |||||||||||||||||||||||||
|
|
|
|
|
|
|
|||||||||||||||||||||||||||||||||
| Totals |
|
$ | (10,200 | ) | $ | (2,486 | ) | $ | 7,714 | |||||||||||||||||||||||||||||
|
|
|
|
|
|
|
|||||||||||||||||||||||||||||||||
| Interest Rate Swaptions |
Strike Rate |
Counterparty | Floating Rate Index |
Pay/ Receive Floating Rate |
Expiration Date |
Number of Contracts |
Notional Amount |
Premiums Received |
Market Value |
Unrealized Appreciation/ (Depreciation) |
||||||||||||||||||||||||||||
| Call - OTC - 10 Yr. IRS |
3.360% | BOA | SOFR | Receive | 12/22/25 | (251,472 | ) | USD | (251,472 | ) | $ | (11,223 | ) | $ | (11,266 | ) | $ | (43 | ) | |||||||||||||||||||
| Call - OTC - 10 Yr. IRS |
4.538% | JPMC | SOFR | Receive | 10/20/25 | (183,444 | ) | USD | (183,444 | ) | (9,402 | ) | (19,879 | ) | (10,477 | ) | ||||||||||||||||||||||
| Call - OTC - 10 Yr. IRS |
4.170% | JPMC | SOFR | Receive | 09/28/26 | (297,317 | ) | USD | (297,317 | ) | (16,129 | ) | (26,006 | ) | (9,877 | ) | ||||||||||||||||||||||
| Call - OTC - 10 Yr. IRS |
4.481% | JPMC | SOFR | Receive | 10/20/25 | (366,967 | ) | USD | (366,967 | ) | (18,807 | ) | (38,430 | ) | (19,623 | ) | ||||||||||||||||||||||
| Call - OTC - 10 Yr. IRS |
3.956% | CBNA | SOFR | Receive | 11/28/25 | (645,408 | ) | USD | (645,408 | ) | (29,624 | ) | (47,513 | ) | (17,889 | ) | ||||||||||||||||||||||
| Call - OTC - 10 Yr. IRS |
3.956% | DBAG | SOFR | Receive | 11/17/25 | (742,192 | ) | USD | (742,192 | ) | (34,401 | ) | (54,546 | ) | (20,145 | ) | ||||||||||||||||||||||
| Call - OTC - 10 Yr. IRS |
3.965% | CBNA | SOFR | Receive | 11/20/25 | (1,095,107 | ) | USD | (1,095,107 | ) | (50,923 | ) | (81,070 | ) | (30,147 | ) | ||||||||||||||||||||||
| Call - OTC - 10 Yr. IRS |
4.000% | BOA | SOFR | Receive | 11/17/25 | (1,257,993 | ) | USD | (1,257,993 | ) | (58,968 | ) | (95,543 | ) | (36,575 | ) | ||||||||||||||||||||||
| Call - OTC - 10 Yr. IRS |
3.403% | MSIP | SOFR | Receive | 12/15/25 | (7,801,000 | ) | USD | (7,801,000 | ) | (350,655 | ) | (362,902 | ) | (12,247 | ) | ||||||||||||||||||||||
See accompanying notes to financial statements.
BHFTII-43
Brighthouse Funds Trust II
BlackRock Bond Income Portfolio
Schedule of Investments as of December 31, 2023
Written Options—(Continued)
| Interest Rate Swaptions |
Strike Rate |
Counterparty | Floating Rate Index |
Pay/ Receive Floating Rate |
Expiration Date |
Number of Contracts |
Notional Amount |
Premiums Received |
Market Value |
Unrealized Appreciation/ (Depreciation) |
||||||||||||||||||||||||||||
| Call - OTC - 5 Yr. IRS |
3.903% | DBAG | SOFR | Receive | 11/14/24 | (37,760,488 | ) | USD | (37,760,488 | ) | $ | (838,283 | ) | $ | (1,399,372 | ) | $ | (561,089 | ) | |||||||||||||||||||
| Call - OTC - 5 Yr. IRS |
3.958% | BBP | SOFR | Receive | 03/14/24 | (56,337,500 | ) | USD | (56,337,500 | ) | (795,767 | ) | (1,416,227 | ) | (620,460 | ) | ||||||||||||||||||||||
| Call - OTC - 5 Yr. IRS |
3.750% | CBNA | SOFR | Receive | 06/12/24 | (140,843,750 | ) | USD | (140,843,750 | ) | (2,238,675 | ) | (3,504,763 | ) | (1,266,088 | ) | ||||||||||||||||||||||
| Put - OTC - 10 Yr. IRS |
3.234% | JPMC | 6M EURIBOR | Pay | 03/12/24 | (41,586,000 | ) | EUR | (41,586,000 | ) | (135,755 | ) | (73,540 | ) | 62,215 | |||||||||||||||||||||||
| Put - OTC - 10 Yr. IRS |
4.538% | JPMC | SOFR | Pay | 10/20/25 | (183,444 | ) | USD | (183,444 | ) | (9,402 | ) | (2,931 | ) | 6,471 | |||||||||||||||||||||||
| Put - OTC - 10 Yr. IRS |
4.481% | JPMC | SOFR | Pay | 10/20/25 | (366,967 | ) | USD | (366,967 | ) | (18,807 | ) | (6,155 | ) | 12,652 | |||||||||||||||||||||||
| Put - OTC - 10 Yr. IRS |
4.170% | JPMC | SOFR | Pay | 09/28/26 | (297,317 | ) | USD | (297,317 | ) | (16,129 | ) | (8,809 | ) | 7,320 | |||||||||||||||||||||||
| Put - OTC - 10 Yr. IRS |
3.360% | BOA | SOFR | Pay | 12/22/25 | (251,472 | ) | USD | (251,472 | ) | (10,768 | ) | (11,455 | ) | (687 | ) | ||||||||||||||||||||||
| Put - OTC - 10 Yr. IRS |
3.956% | CBNA | SOFR | Pay | 11/28/25 | (645,408 | ) | USD | (645,408 | ) | (29,624 | ) | (17,735 | ) | 11,889 | |||||||||||||||||||||||
| Put - OTC - 10 Yr. IRS |
3.956% | DBAG | SOFR | Pay | 11/17/25 | (742,192 | ) | USD | (742,192 | ) | (34,401 | ) | (20,169 | ) | 14,232 | |||||||||||||||||||||||
| Put - OTC - 10 Yr. IRS |
3.965% | CBNA | SOFR | Pay | 11/20/25 | (1,095,107 | ) | USD | (1,095,107 | ) | (50,923 | ) | (29,641 | ) | 21,282 | |||||||||||||||||||||||
| Put - OTC - 10 Yr. IRS |
4.000% | BOA | SOFR | Pay | 11/17/25 | (1,257,993 | ) | USD | (1,257,993 | ) | (58,968 | ) | (32,939 | ) | 26,029 | |||||||||||||||||||||||
| Put - OTC - 10 Yr. IRS |
3.403% | MSIP | SOFR | Pay | 12/15/25 | (7,801,000 | ) | USD | (7,801,000 | ) | (350,655 | ) | (341,986 | ) | 8,669 | |||||||||||||||||||||||
| Put - OTC - 5 Yr. IRS |
3.958% | BBP | SOFR | Pay | 03/14/24 | (56,337,500 | ) | USD | (56,337,500 | ) | (795,767 | ) | (152,458 | ) | 643,309 | |||||||||||||||||||||||
| Put - OTC - 5 Yr. IRS |
3.903% | DBAG | SOFR | Pay | 11/14/24 | (37,760,488 | ) | USD | (37,760,488 | ) | (838,283 | ) | (332,890 | ) | 505,393 | |||||||||||||||||||||||
| Put - OTC - 5 Yr. IRS |
3.750% | CBNA | SOFR | Pay | 06/12/24 | (140,843,750 | ) | USD | (140,843,750 | ) | (2,162,089 | ) | (1,088,404 | ) | 1,073,685 | |||||||||||||||||||||||
|
|
|
|
|
|
|
|||||||||||||||||||||||||||||||||
| Totals |
|
$ | (8,964,428 | ) | $ | (9,176,629 | ) | $ | (212,201 | ) | ||||||||||||||||||||||||||||
|
|
|
|
|
|
|
|||||||||||||||||||||||||||||||||
| Options on Exchange-Traded Futures Contracts |
Strike Price |
Expiration Date |
Number of Contracts |
Notional Amount |
Premiums Received |
Market Value |
Unrealized Appreciation/ (Depreciation) |
|||||||||||||||||||||||||
| Call - 1 Year Mid-Curve SOFR Futures |
USD | 96.500 | 03/15/24 | (1,381 | ) | USD | (3,452,500 | ) | $ | (618,395 | ) | $ | (1,165,219 | ) | $ | (546,824 | ) | |||||||||||||||
| Call - U.S. Treasury Note 2 Year Futures |
USD | 104.500 | 02/23/24 | (18 | ) | USD | (36,000 | ) | (1,941 | ) | (2,250 | ) | (309 | ) | ||||||||||||||||||
| Put - U.S. Treasury Note 2 Year Futures |
USD | 102.000 | 01/26/24 | (54 | ) | USD | (108,000 | ) | (8,354 | ) | (2,531 | ) | 5,823 | |||||||||||||||||||
| Put - U.S. Treasury Note 2 Year Futures |
USD | 102.000 | 02/23/24 | (36 | ) | USD | (72,000 | ) | (10,632 | ) | (5,625 | ) | 5,007 | |||||||||||||||||||
|
|
|
|
|
|
|
|||||||||||||||||||||||||||
| Totals |
|
$ | (639,322 | ) | $ | (1,175,625 | ) | $ | (536,303 | ) | ||||||||||||||||||||||
|
|
|
|
|
|
|
|||||||||||||||||||||||||||
Swap Agreements
Centrally Cleared Interest Rate Swaps
| Pay/Receive |
Floating Rate Index |
Payment Frequency |
Fixed Rate |
Payment Frequency |
Maturity Date |
Notional Amount |
Market Value |
Upfront Premiums Paid/(Received) |
Unrealized Appreciation/ (Depreciation) |
|||||||||||||||||||||||||||||
| Pay |
12M CPTFE | Maturity | 2.512 | % | Maturity | 12/15/53 | EUR | 2,170,000 | $ | 50,864 | $ | 104 | $ | 50,760 | ||||||||||||||||||||||||
| Pay |
12M SOFR | Annually | 3.331 | % | Annually | 06/17/29 | USD | 11,241,768 | 8,747 | 106 | 8,641 | |||||||||||||||||||||||||||
| Pay |
12M SOFR | Annually | 3.363 | % | Annually | 06/17/29 | USD | 8,431,138 | 18,638 | 79 | 18,559 | |||||||||||||||||||||||||||
| Pay |
12M SOFR | Annually | 3.425 | % | Annually | 06/17/29 | USD | 6,323,449 | 31,529 | 59 | 31,470 | |||||||||||||||||||||||||||
| Pay |
12M SOFR | Annually | 3.439 | % | Annually | 06/17/29 | USD | 8,431,279 | 47,512 | 79 | 47,433 | |||||||||||||||||||||||||||
| Pay |
12M SOFR | Annually | 3.408 | % | Annually | 06/17/29 | USD | 16,862,700 | 71,623 | 158 | 71,465 | |||||||||||||||||||||||||||
| Pay |
1M TIIE | Monthly | 11.700 | % | Monthly | 02/12/24 | MXN | 38,764,000 | 554 | (1 | ) | 555 | ||||||||||||||||||||||||||
| Pay |
1M TIIE | Monthly | 11.720 | % | Monthly | 02/14/24 | MXN | 23,117,000 | 382 | — | 382 | |||||||||||||||||||||||||||
| Pay |
1M TIIE | Monthly | 8.950 | % | Monthly | 11/08/28 | MXN | 14,718,000 | 12,910 | 8 | 12,902 | |||||||||||||||||||||||||||
| Pay |
1M TIIE | Monthly | 9.685 | % | Monthly | 10/25/28 | MXN | 15,240,000 | 39,095 | 8 | 39,087 | |||||||||||||||||||||||||||
| Pay |
3M KCOD | Quarterly | 3.188 | % | Quarterly | 09/20/26 | KRW | 788,915,870 | 1,202 | 5 | 1,197 | |||||||||||||||||||||||||||
| Pay |
3M KCOD | Quarterly | 3.330 | % | Quarterly | 09/20/26 | KRW | 773,676,291 | 3,427 | 5 | 3,422 | |||||||||||||||||||||||||||
| Pay |
3M KCOD | Quarterly | 3.380 | % | Quarterly | 09/20/26 | KRW | 773,792,354 | 4,217 | 5 | 4,212 | |||||||||||||||||||||||||||
| Pay |
3M KCOD | Quarterly | 3.383 | % | Quarterly | 09/20/26 | KRW | 773,792,355 | 4,256 | 5 | 4,251 | |||||||||||||||||||||||||||
| Pay |
6M CDOR | Semi-Annually | 3.540 | % | Semi-Annually | 06/15/33 | CAD | 9,276,034 | 270,245 | 113 | 270,132 | |||||||||||||||||||||||||||
| Pay |
6M CDOR | Semi-Annually | 4.002 | % | Semi-Annually | 09/21/33 | CAD | 2,265,000 | 132,703 | 28 | 132,675 | |||||||||||||||||||||||||||
| Pay |
6M EURIBOR | Semi-Annually | 3.151 | % | Semi-Annually | 07/21/28 | EUR | 937,000 | 31,122 | 9 | 31,113 | |||||||||||||||||||||||||||
| Pay |
6M EURIBOR | Semi-Annually | 3.216 | % | Semi-Annually | 11/08/33 | EUR | 5,438,257 | 372,280 | 99 | 372,181 | |||||||||||||||||||||||||||
| Pay |
6M EURIBOR | Semi-Annually | 3.224 | % | Semi-Annually | 11/08/33 | EUR | 5,438,256 | 376,470 | 99 | 376,371 | |||||||||||||||||||||||||||
| Pay |
6M EURIBOR | Semi-Annually | 3.529 | % | Semi-Annually | 11/08/25 | EUR | 24,069,750 | 288,448 | 113 | 288,335 | |||||||||||||||||||||||||||
See accompanying notes to financial statements.
BHFTII-44
Brighthouse Funds Trust II
BlackRock Bond Income Portfolio
Schedule of Investments as of December 31, 2023
Centrally Cleared Interest Rate Swaps—(Continued)
| Pay/Receive |
Floating Rate Index |
Payment Frequency |
Fixed Rate |
Payment Frequency |
Maturity Date |
Notional Amount |
Market Value |
Upfront Premiums Paid/(Received) |
Unrealized Appreciation/ (Depreciation) |
|||||||||||||||||||||||||||||
| Pay |
6M EURIBOR | Semi-Annually | 3.535 | % | Semi-Annually | 11/08/25 | EUR | 24,069,750 | $ | 291,530 | $ | 113 | $ | 291,417 | ||||||||||||||||||||||||
| Receive |
1M TIIE | Monthly | 11.245 | % | Monthly | 11/07/24 | MXN | 66,865,000 | (9,923 | ) | 6 | (9,929 | ) | |||||||||||||||||||||||||
| Receive |
1M TIIE | Monthly | 10.950 | % | Monthly | 12/03/24 | MXN | 67,453,000 | (2,917 | ) | 7 | (2,924 | ) | |||||||||||||||||||||||||
| Receive |
6M CDOR | Semi-Annually | 3.404 | % | Semi-Annually | 06/15/53 | CAD | 4,122,000 | (261,464 | ) | 109 | (261,573 | ) | |||||||||||||||||||||||||
| Receive |
6M CDOR | Semi-Annually | 3.722 | % | Semi-Annually | 09/21/53 | CAD | 990,000 | (109,886 | ) | 26 | (109,912 | ) | |||||||||||||||||||||||||
| Receive |
6M EURIBOR | Annually | 3.157 | % | Annually | 11/08/28 | EUR | 20,082,375 | (701,842 | ) | 204 | (702,046 | ) | |||||||||||||||||||||||||
| Receive |
6M EURIBOR | Annually | 3.165 | % | Annually | 11/08/28 | EUR | 20,082,375 | (709,377 | ) | 204 | (709,581 | ) | |||||||||||||||||||||||||
| Receive |
6M PRIBOR | Semi-Annually | 4.098 | % | Semi-Annually | 03/20/26 | CZK | 20,900,000 | (4,329 | ) | 4 | (4,333 | ) | |||||||||||||||||||||||||
| Receive |
6M WIBOR | Annually | 5.135 | % | Annually | 12/20/25 | PLN | 3,744,000 | (3,115 | ) | 4 | (3,119 | ) | |||||||||||||||||||||||||
|
|
|
|
|
|
|
|||||||||||||||||||||||||||||||||
| Totals |
|
$ | 254,901 | $ | 1,758 | $ | 253,143 | |||||||||||||||||||||||||||||||
|
|
|
|
|
|
|
|||||||||||||||||||||||||||||||||
OTC Interest Rate Swaps
| Pay/Receive |
Floating Rate Index |
Payment Frequency |
Fixed Rate |
Payment Frequency |
Maturity Date |
Counterparty | Notional Amount |
Market Value |
Upfront Premium Paid/(Received) |
Unrealized Appreciation/ (Depreciation) (1) |
||||||||||||||||||||||||||||||||
| Pay |
1-Day CDI | Maturity | 10.108 | % | Maturity | 01/02/26 | GSI | BRL | 1,931,920 | $ | 1,130 | $ | — | $ | 1,130 | |||||||||||||||||||||||||||
| Pay |
1-Day CDI | Maturity | 9.980 | % | Maturity | 01/02/26 | HSBC | BRL | 6,147,000 | 222 | — | 222 | ||||||||||||||||||||||||||||||
| Pay |
1-Day CDI | Maturity | 11.745 | % | Maturity | 01/02/26 | CBNA | BRL | 5,106,000 | 37,290 | — | 37,290 | ||||||||||||||||||||||||||||||
| Pay |
1-Day CDI | Maturity | 11.800 | % | Maturity | 01/02/26 | CBNA | BRL | 5,263,226 | 40,177 | — | 40,177 | ||||||||||||||||||||||||||||||
| Pay |
1-Day CDI | Maturity | 11.865 | % | Maturity | 01/02/25 | BOA | BRL | 5,259,958 | 12,177 | — | 12,177 | ||||||||||||||||||||||||||||||
| Pay |
1-Day CDI | Maturity | 10.345 | % | Maturity | 01/04/27 | CBNA | BRL | 5,535,000 | 21,175 | — | 21,175 | ||||||||||||||||||||||||||||||
| Pay |
1-Day CDI | Maturity | 10.575 | % | Maturity | 01/02/26 | CBNA | BRL | 8,064,000 | 29,031 | — | 29,031 | ||||||||||||||||||||||||||||||
| Pay |
1-Day CDI | Maturity | 11.103 | % | Maturity | 01/02/25 | BBP | BRL | 7,703,000 | 12,072 | — | 12,072 | ||||||||||||||||||||||||||||||
| Receive |
1-Day CDI | Maturity | 12.615 | % | Maturity | 01/02/24 | CBNA | BRL | 27,165,140 | (88 | ) | — | (88 | ) | ||||||||||||||||||||||||||||
| Receive |
12M COIRR | Maturity | 10.176 | % | Maturity | 06/20/25 | CBNA | COP | 3,997,331,802 | (8,723 | ) | — | (8,723 | ) | ||||||||||||||||||||||||||||
| Receive |
12M COIRR | Maturity | 8.620 | % | Maturity | 11/05/25 | JPMC | COP | 7,068,327,000 | (19,946 | ) | — | (19,946 | ) | ||||||||||||||||||||||||||||
|
|
|
|
|
|
|
|||||||||||||||||||||||||||||||||||||
| Totals |
|
$ | 124,517 | $ | — | $ | 124,517 | |||||||||||||||||||||||||||||||||||
|
|
|
|
|
|
|
|||||||||||||||||||||||||||||||||||||
Centrally Cleared Credit Default Swaps on Credit Indices—Buy Protection (a)
| Reference Obligation |
Fixed Deal (Pay) Rate |
Payment Frequency |
Maturity Date |
Implied Credit Spread at December 31, 2023 (b) |
Notional Amount (c) |
Market Value |
Upfront Premiums Paid/(Received) |
Unrealized Appreciation/ (Depreciation) |
||||||||||||||||||||||
| CDX.NA.HY.41.V2 |
(5.000 | %) | Quarterly | 12/20/28 | 3.563 | % | USD | 6,020,090 | $ | (351,134 | ) | $ | (34,861 | ) | $ | (316,273 | ) | |||||||||||||
| ITRX.EUR.40.V1 |
(1.000 | %) | Quarterly | 12/20/28 | 0.579 | % | EUR | 2,890,000 | (62,275 | ) | (34,705 | ) | (27,570 | ) | ||||||||||||||||
| ITRX.FINSR.40.V1 |
(1.000 | %) | Quarterly | 12/20/28 | 0.669 | % | EUR | 9,090,000 | (153,494 | ) | (62,799 | ) | (90,695 | ) | ||||||||||||||||
| ITRX.EUR.XOVER.40.V1 |
(5.000 | %) | Quarterly | 12/20/28 | 3.090 | % | EUR | 2,163,623 | (191,386 | ) | (44,678 | ) | (146,708 | ) | ||||||||||||||||
|
|
|
|
|
|
|
|||||||||||||||||||||||||
| Totals |
|
$ | (758,289 | ) | $ | (177,043 | ) | $ | (581,246 | ) | ||||||||||||||||||||
|
|
|
|
|
|
|
|||||||||||||||||||||||||
Centrally Cleared Credit Default Swaps on Credit Indices—Sell Protection (d)
| Reference Obligation |
Fixed Deal Receive Rate |
Payment Frequency |
Maturity Date |
Implied Credit Spread at December 31, 2023 (b) |
Notional Amount (c) |
Market Value |
Upfront Premiums Paid/(Received) |
Unrealized Appreciation/ (Depreciation) |
||||||||||||||||||||||||||||
| CDX.NA.HY.40.V2 |
5.000 | % | Quarterly | 06/20/28 | 3.363 | % | USD | 6,523,110 | $ | 400,017 | $ | (14,568 | ) | $ | 414,585 | |||||||||||||||||||||
|
|
|
|
|
|
|
|||||||||||||||||||||||||||||||
See accompanying notes to financial statements.
BHFTII-45
Brighthouse Funds Trust II
BlackRock Bond Income Portfolio
Schedule of Investments as of December 31, 2023
OTC Credit Default Swaps on Corporate and Sovereign Issues—Buy Protection (a)
| Reference Obligation |
Fixed Deal (Pay) Rate |
Payment Frequency |
Maturity Date |
Counterparty | Implied Credit Spread at December 31, 2023 (b) |
Notional Amount (c) |
Market Value |
Upfront Premium Paid/(Received) |
Unrealized Appreciation/ (Depreciation) |
|||||||||||||||||||||||||||||
| Abbott Laboratories |
(1.000 | %) | Quarterly | 12/20/28 | JPMC | 0.467 | % | USD | 1,238,000 | $ | (29,855 | ) | $ | (23,232 | ) | $ | (6,623 | ) | ||||||||||||||||||||
| American Electric Power Co. Inc. |
(1.000 | %) | Quarterly | 12/20/28 | BOA | 0.392 | % | USD | 1,266,659 | (35,264 | ) | (28,840 | ) | (6,424 | ) | |||||||||||||||||||||||
| American Electric Power Co. Inc. |
(1.000 | %) | Quarterly | 12/20/28 | DBAG | 0.392 | % | USD | 1,587,341 | (44,191 | ) | (31,943 | ) | (12,248 | ) | |||||||||||||||||||||||
| American Electric Power Co. Inc. |
(1.000 | %) | Quarterly | 12/20/28 | GSI | 0.392 | % | USD | 3,000,000 | (82,686 | ) | (72,253 | ) | (10,433 | ) | |||||||||||||||||||||||
| American Express Co. |
(1.000 | %) | Quarterly | 12/20/28 | CBNA | 0.407 | % | USD | 3,000,000 | (80,553 | ) | (63,933 | ) | (16,620 | ) | |||||||||||||||||||||||
| Avis Budget Group, Inc. |
(5.000 | %) | Quarterly | 12/20/24 | JPMC | 0.803 | % | USD | 460,000 | (18,450 | ) | 7,496 | (25,946 | ) | ||||||||||||||||||||||||
| Avis Budget Group, Inc. |
(5.000 | %) | Quarterly | 06/20/25 | JPMC | 1.224 | % | USD | 480,000 | (25,763 | ) | 17,539 | (43,302 | ) | ||||||||||||||||||||||||
| Beazer Homes USA, Inc. |
(5.000 | %) | Quarterly | 06/20/24 | BNP | 0.398 | % | USD | 250,000 | (5,445 | ) | (1,383 | ) | (4,062 | ) | |||||||||||||||||||||||
| Beazer Homes USA, Inc. |
(5.000 | %) | Quarterly | 06/20/24 | BNP | 0.398 | % | USD | 250,000 | (5,445 | ) | (1,493 | ) | (3,952 | ) | |||||||||||||||||||||||
| Beazer Homes USA, Inc. |
(5.000 | %) | Quarterly | 06/20/24 | BBP | 0.398 | % | USD | 250,000 | (5,445 | ) | (1,567 | ) | (3,878 | ) | |||||||||||||||||||||||
| Boeing Co. |
(1.000 | %) | Quarterly | 12/20/24 | BNP | 0.261 | % | USD | 460,000 | (3,261 | ) | (1,782 | ) | (1,479 | ) | |||||||||||||||||||||||
| Boeing Co. |
(1.000 | %) | Quarterly | 12/20/24 | MSIP | 0.261 | % | USD | 1,185,000 | (8,400 | ) | (2,720 | ) | (5,680 | ) | |||||||||||||||||||||||
| Brazil Government International Bond |
(1.000 | %) | Quarterly | 12/20/24 | BBP | 0.279 | % | USD | 314,000 | (2,175 | ) | 1,512 | (3,687 | ) | ||||||||||||||||||||||||
| Brazil Government International Bond |
(1.000 | %) | Quarterly | 12/20/24 | BBP | 0.279 | % | USD | 520,000 | (3,602 | ) | 2,552 | (6,154 | ) | ||||||||||||||||||||||||
| Brazil Government International Bond |
(1.000 | %) | Quarterly | 12/20/24 | BBP | 0.279 | % | USD | 524,000 | (3,629 | ) | 2,571 | (6,200 | ) | ||||||||||||||||||||||||
| Brazil Government International Bond |
(1.000 | %) | Quarterly | 12/20/24 | BBP | 0.279 | % | USD | 525,000 | (3,636 | ) | 2,576 | (6,212 | ) | ||||||||||||||||||||||||
| Brazil Government International Bond |
(1.000 | %) | Quarterly | 12/20/24 | BBP | 0.279 | % | USD | 526,000 | (3,643 | ) | 2,532 | (6,175 | ) | ||||||||||||||||||||||||
| Brazil Government International Bond |
(1.000 | %) | Quarterly | 12/20/24 | BBP | 0.279 | % | USD | 740,000 | (5,125 | ) | 3,562 | (8,687 | ) | ||||||||||||||||||||||||
| Brazil Government International Bond |
(1.000 | %) | Quarterly | 12/20/28 | GSI | 1.314 | % | USD | 659,500 | 9,226 | 27,041 | (17,815 | ) | |||||||||||||||||||||||||
| Colombia Government International Bond |
(1.000 | %) | Quarterly | 12/20/28 | JPMC | 1.556 | % | USD | 781,000 | 19,278 | 37,570 | (18,292 | ) | |||||||||||||||||||||||||
| Deutsche Bank AG |
(1.000 | %) | Quarterly | 06/20/28 | JPMC | 1.143 | % | EUR | 600,000 | 3,922 | 44,887 | (40,965 | ) | |||||||||||||||||||||||||
| Deutsche Bank AG |
(1.000 | %) | Quarterly | 06/20/28 | JPMC | 1.143 | % | EUR | 352,000 | 2,301 | 17,056 | (14,755 | ) | |||||||||||||||||||||||||
| Deutsche Bank AG |
(1.000 | %) | Quarterly | 06/20/28 | JPMC | 1.143 | % | EUR | 131,000 | 856 | 6,704 | (5,848 | ) | |||||||||||||||||||||||||
| Deutsche Bank AG |
(1.000 | %) | Quarterly | 06/20/28 | JPMC | 1.143 | % | EUR | 117,000 | 765 | 5,669 | (4,904 | ) | |||||||||||||||||||||||||
| Dominion Energy, Inc. |
(1.000 | %) | Quarterly | 12/20/28 | BOA | 0.565 | % | USD | 663,056 | (13,183 | ) | (10,130 | ) | (3,053 | ) | |||||||||||||||||||||||
| Dominion Energy, Inc. |
(1.000 | %) | Quarterly | 12/20/28 | BOA | 0.565 | % | USD | 1,266,703 | (25,185 | ) | (20,393 | ) | (4,792 | ) | |||||||||||||||||||||||
| Dominion Energy, Inc. |
(1.000 | %) | Quarterly | 12/20/28 | BBP | 0.565 | % | USD | 319,704 | (6,356 | ) | (4,998 | ) | (1,358 | ) | |||||||||||||||||||||||
| Dominion Energy, Inc. |
(1.000 | %) | Quarterly | 12/20/28 | CBNA | 0.565 | % | USD | 629,537 | (12,516 | ) | (9,344 | ) | (3,172 | ) | |||||||||||||||||||||||
See accompanying notes to financial statements.
BHFTII-46
Brighthouse Funds Trust II
BlackRock Bond Income Portfolio
Schedule of Investments as of December 31, 2023
OTC Credit Default Swaps on Corporate and Sovereign Issues—Buy Protection (a)—(Continued)
| Reference Obligation |
Fixed Deal (Pay) Rate |
Payment Frequency |
Maturity Date |
Counterparty | Implied Credit Spread at December 31, 2023 (b) |
Notional Amount (c) |
Market Value |
Upfront Premium Paid/(Received) |
Unrealized Appreciation/ (Depreciation) |
|||||||||||||||||||||||||||||
| Mexico Government International Bond |
(1.000 | %) | Quarterly | 12/20/28 | BNP | 0.883 | % | USD | 305,000 | $ | (1,606 | ) | $ | 3,083 | $ | (4,689 | ) | |||||||||||||||||||||
| Mexico Government International Bond |
(1.000 | %) | Quarterly | 12/20/28 | BNP | 0.883 | % | USD | 310,000 | (1,632 | ) | 2,869 | (4,501 | ) | ||||||||||||||||||||||||
| Mexico Government International Bond |
(1.000 | %) | Quarterly | 12/20/28 | BNP | 0.883 | % | USD | 310,000 | (1,632 | ) | 3,200 | (4,832 | ) | ||||||||||||||||||||||||
| Mexico Government International Bond |
(1.000 | %) | Quarterly | 12/20/28 | BNP | 0.883 | % | USD | 314,000 | (1,653 | ) | 3,241 | (4,894 | ) | ||||||||||||||||||||||||
| Mexico Government International Bond |
(1.000 | %) | Quarterly | 12/20/28 | JPMC | 0.883 | % | USD | 251,900 | (1,326 | ) | 2,493 | (3,819 | ) | ||||||||||||||||||||||||
| Mexico Government International Bond |
(1.000 | %) | Quarterly | 12/20/28 | BBP | 0.883 | % | USD | 1,142,816 | (6,016 | ) | 8,961 | (14,977 | ) | ||||||||||||||||||||||||
| Republic of South Africa Government International Bond |
(1.000 | %) | Quarterly | 12/20/28 | BBP | 2.039 | % | USD | 303,196 | 13,801 | 23,465 | (9,664 | ) | |||||||||||||||||||||||||
| Republic of South Africa Government International Bond |
(1.000 | %) | Quarterly | 12/20/28 | BBP | 2.039 | % | USD | 274,247 | 12,483 | 21,329 | (8,846 | ) | |||||||||||||||||||||||||
| Republic of South Africa Government International Bond |
(1.000 | %) | Quarterly | 12/20/28 | BBP | 2.039 | % | USD | 242,557 | 11,041 | 18,957 | (7,916 | ) | |||||||||||||||||||||||||
| Tenet Healthcare Corp. |
(5.000 | %) | Quarterly | 06/20/24 | BBP | 0.397 | % | USD | 499,000 | (10,869 | ) | (551 | ) | (10,318 | ) | |||||||||||||||||||||||
| UBS Group AG |
(1.000 | %) | Quarterly | 06/20/28 | BNP | 0.687 | % | EUR | 134,000 | (1,949 | ) | 5,409 | (7,358 | ) | ||||||||||||||||||||||||
| UBS Group AG |
(1.000 | %) | Quarterly | 06/20/28 | JPMC | 0.687 | % | EUR | 37,000 | (538 | ) | 1,837 | (2,375 | ) | ||||||||||||||||||||||||
| UBS Group AG |
(1.000 | %) | Quarterly | 06/20/28 | JPMC | 0.687 | % | EUR | 112,000 | (1,629 | ) | 5,341 | (6,970 | ) | ||||||||||||||||||||||||
| UBS Group AG |
(1.000 | %) | Quarterly | 06/20/28 | JPMC | 0.687 | % | EUR | 117,000 | (1,702 | ) | 6,275 | (7,977 | ) | ||||||||||||||||||||||||
| UBS Group AG |
(1.000 | %) | Quarterly | 06/20/28 | JPMC | 0.687 | % | EUR | 1,000,000 | (14,545 | ) | 31,972 | (46,517 | ) | ||||||||||||||||||||||||
|
|
|
|
|
|
|
|||||||||||||||||||||||||||||||||
| Totals |
|
$ | (395,232 | ) | $ | 43,137 | $ | (438,369 | ) | |||||||||||||||||||||||||||||
|
|
|
|
|
|
|
|||||||||||||||||||||||||||||||||
OTC Credit Default Swaps on Credit Indices—Buy Protection (a)
| Reference Obligation |
Fixed Deal (Pay) Rate |
Payment Frequency |
Maturity Date |
Counterparty | Implied Credit Spread at December 31, 2023 (b) |
Notional Amount (c) |
Market Value |
Upfront Premium Paid/(Received) |
Unrealized Appreciation/ (Depreciation) |
|||||||||||||||||||||||||||||
| CMBX.NA.6.AAA |
(0.500 | %) | Monthly | 05/11/63 | DBAG | 0.500 | % | USD | 1,001,000 | $ | — | $ | 145 | $ | (145 | ) | ||||||||||||||||||||||
| CMBX.NA.6.AAA |
(0.500 | %) | Monthly | 05/11/63 | DBAG | 0.500 | % | USD | 2,340,000 | — | (883 | ) | 883 | |||||||||||||||||||||||||
| CMBX.NA.9.AAA |
(0.500 | %) | Monthly | 09/17/58 | MSIP | 0.469 | % | USD | 21,858 | (11 | ) | 295 | (306 | ) | ||||||||||||||||||||||||
| CMBX.NA.9.AAA |
(0.500 | %) | Monthly | 09/17/58 | MSIP | 0.469 | % | USD | 1,090,000 | (539 | ) | 13,409 | (13,948 | ) | ||||||||||||||||||||||||
| CMBX.NA.9.BBB- |
(3.000 | %) | Monthly | 09/17/58 | CBNA | 14.758 | % | USD | 500,000 | 87,406 | 15,545 | 71,861 | ||||||||||||||||||||||||||
| CMBX.NA.9.BBB- |
(3.000 | %) | Monthly | 09/17/58 | MSIP | 14.758 | % | USD | 105,000 | 18,355 | 5,346 | 13,009 | ||||||||||||||||||||||||||
|
|
|
|
|
|
|
|||||||||||||||||||||||||||||||||
| Totals |
|
$ | 105,211 | $ | 33,857 | $ | 71,354 | |||||||||||||||||||||||||||||||
|
|
|
|
|
|
|
|||||||||||||||||||||||||||||||||
See accompanying notes to financial statements.
BHFTII-47
Brighthouse Funds Trust II
BlackRock Bond Income Portfolio
Schedule of Investments as of December 31, 2023
OTC Credit Default Swaps on Credit Indices—Sell Protection (d)
| Reference Obligation |
Fixed Deal Receive Rate |
Payment Frequency |
Maturity Date |
Counterparty | Implied Credit Spread at December 31, 2023 (b) |
Notional Amount (c) |
Market Value |
Upfront Premium Paid/(Received) |
Unrealized Appreciation/ (Depreciation) |
|||||||||||||||||||||||||||||
| CMBX.NA.10.BBB- |
3.000 | % | Monthly | 11/17/59 | JPMC | 13.993 | % | USD | 40,000 | $ | (9,593 | ) | $ | (3,575 | ) | $ | (6,018 | ) | ||||||||||||||||||||
| CMBX.NA.14.BBB- |
3.000 | % | Monthly | 12/16/72 | GSI | 7.231 | % | USD | 186,000 | (36,642 | ) | (30,792 | ) | (5,850 | ) | |||||||||||||||||||||||
| CMBX.NA.9.BBB- |
3.000 | % | Monthly | 09/17/58 | DBAG | 14.758 | % | USD | 467,000 | (81,637 | ) | (57,312 | ) | (24,325 | ) | |||||||||||||||||||||||
| CMBX.NA.9.BBB- |
3.000 | % | Monthly | 09/17/58 | MSIP | 14.758 | % | USD | 138,000 | (24,124 | ) | (168 | ) | (23,956 | ) | |||||||||||||||||||||||
|
|
|
|
|
|
|
|||||||||||||||||||||||||||||||||
| Totals |
|
$ | (151,996 | ) | $ | (91,847 | ) | $ | (60,149 | ) | ||||||||||||||||||||||||||||
|
|
|
|
|
|
|
|||||||||||||||||||||||||||||||||
| (a) | If the Portfolio is a buyer of protection and a credit event occurs, as defined under the terms of that particular swap agreement, the Portfolio will either (i) receive from the seller of protection an amount equal to the notional amount of the swap and deliver the referenced obligation or underlying securities comprising the referenced index or (ii) receive a net settlement amount in the form of cash or securities equal to the notional amount of the swap less the recovery value of the referenced obligation or underlying securities comprising the referenced index. |
| (b) | Implied credit spreads, represented in absolute terms, utilized in determining the market value of credit default swap agreements on corporate issues or indices as of period end serve as an indicator of the current status of the payment/performance risk and represent the likelihood or risk of default for the credit derivative. The implied credit spread of a particular referenced entity reflects the cost of buying/selling protection and may include upfront payments required to be made to enter into the agreement. Wider credit spreads represent a deterioration of the referenced entity’s credit soundness and a greater likelihood or risk of default or other credit event occurring as defined under the terms of the agreement. A credit spread identified as “Defaulted” indicates a credit event has occurred for the referenced entity or obligation. |
| (c) | The maximum potential amount of future undiscounted payments that the Portfolio could be required to make under a credit default swap contract would be the notional amount of the contract. These potential amounts would be partially offset by any recovery values of the referenced debt obligation or net amounts received from the settlement of purchased protection credit default swap contracts entered into by the Portfolio for the same referenced debt obligation. |
| (d) | If the Portfolio is a seller of protection and a credit event occurs, as defined under the terms of that particular swap agreement, the Portfolio will either (i) pay to the buyer of protection an amount equal to the notional amount of the swap and take delivery of the referenced obligation or underlying securities comprising the referenced index or (ii) pay a net settlement amount in the form of cash or securities equal to the notional amount of the swap less the recovery value of the referenced obligation or underlying securities comprising the referenced index. |
| (1) | There was no upfront premium paid or (received), therefore Market Value equals Unrealized Appreciation/(Depreciation). |
Securities in the amount of $10,378 have been received at the custodian bank as collateral for OTC swap contracts, and forward foreign currency exchange contracts.
Glossary of Abbreviations
Counterparties
| (BBP)— | Barclays Bank PLC | |||
| (BNP)— | BNP Paribas SA | |||
| (BNY)— | Bank of New York Mellon | |||
| (BOA)— | Bank of America NA | |||
| (CBNA)— | Citibank NA | |||
| (CIBC)— | Canadian Imperial Bank of Commerce | |||
| (DBAG)— | Deutsche Bank AG | |||
| (GSI)— | Goldman Sachs International | |||
| (HSBC)— | HSBC Bank PLC | |||
| (JPMC)— | JPMorgan Chase Bank NA | |||
| (MSIP)— | Morgan Stanley & Co. International PLC | |||
| (SCB)— | Standard Chartered Bank | |||
| (SSBT)— | State Street Bank and Trust | |||
| (TDB)— | Toronto Dominion Bank | |||
| (UBSA)— | UBS AG | |||
Currencies
| (AUD)— | Australian Dollar | |||
| (BRL)— | Brazilian Real | |||
| (CAD)— | Canadian Dollar | |||
| (CHF)— | Swiss Franc | |||
| (CLP)— | Chilean Peso | |||
| (CNH)— | Chinese Renminbi | |||
| (COP)— | Colombian Peso | |||
| (CZK)— | Czech Koruna | |||
| (EUR)— | Euro | |||
| (GBP)— | British Pound | |||
| (HUF)— | Hungarian Forint | |||
| (IDR)— | Indonesian Rupiah | |||
| (INR)— | Indian Rupee | |||
| (JPY)— | Japanese Yen | |||
| (KRW)— | South Korean Won | |||
| (MXN)— | Mexican Peso | |||
| (MYR)— | Malaysian Ringgit | |||
| (NOK)— | Norwegian Krone | |||
| (PLN)— | Polish Zloty | |||
| (RUB)— | Russian Ruble | |||
| (THB)— | Thai Baht | |||
| (TRY)— | Turkish Lira | |||
| (TWD)— | Taiwanese Dollar | |||
| (USD)— | United States Dollar | |||
| (ZAR)— | South African Rand | |||
See accompanying notes to financial statements.
BHFTII-48
Brighthouse Funds Trust II
BlackRock Bond Income Portfolio
Schedule of Investments as of December 31, 2023
Glossary of Abbreviations—(Continued)
Index Abbreviations
| (CDI)— | Brazil Interbank Deposit Rate | |||
| (CDOR)— | Canadian Dollar Offered Rate | |||
| (CDX.NA.HY)— | Markit North America High Yield CDS Index | |||
| (CMBX.NA.AAA)— | Markit North America AAA Rated CMBS Index | |||
| (CMBX.NA.BBB-)— | Markit North America BBB- Rated CMBS Index | |||
| (COIRR) — | Colombia Overnight Interbank Reference Rate | |||
| (CPTFE)— | Eurozone Harmonized Index of Consumer Prices ex-Tobacco | |||
| (EURIBOR)— | Euro InterBank Offered Rate | |||
| (H15)— | U.S. Treasury Yield Curve Rate T-Note Constant Maturity Index | |||
| (ITRX.EUR)— | Markit iTraxx Europe CDS Index | |||
| (ITRX.EUR.XOVER)— | Markit iTraxx Europe Crossover CDS Index | |||
| (ITRX.FINSR)— | Markit iTraxx Europe Senior Financial CDS Index | |||
| (KCOD)— | South Korean Certificate of Deposit Rate | |||
| (LIBOR)— | London Interbank Offered Rate | |||
| (MTA)— | Monthly Treasury Average Index | |||
| (PRIBOR)— | Prague Interbank Offered Rate | |||
| (SOFR)— | Secured Overnight Financing Rate | |||
| (SOFR30A)— | Secured Overnight Financing Rate 30-Day Average | |||
| (SONIA)— | Sterling Overnight Index Average Deposit Rate | |||
| (TIIE)— | Mexican Interbank Equilibrium Interest Rate | |||
| (TSFR)— | Term Secured Overnight Financing Rate | |||
| (WIBOR)— | Warsaw Interbank Offered Rate | |||
Other Abbreviations
| (CDO)— | Collateralized Debt Obligation | |||
| (CLO)— | Collateralized Loan Obligation | |||
| (DAC)— | Designated Activity Company | |||
| (ICE)— | Intercontinental Exchange, Inc. | |||
| (IRS)— | Interest Rate Swap | |||
| (REMIC)— | Real Estate Mortgage Investment Conduit | |||
Fair Value Hierarchy
Accounting principles generally accepted in the United States of America (“GAAP”) define fair market value as the price that the Portfolio would receive to sell an asset or pay to transfer a liability in an orderly transaction between market participants at the measurement date. It establishes a fair value hierarchy that prioritizes inputs to valuation methods and requires disclosure of the fair value hierarchy, separately for each major category of assets and liabilities, that segregates fair value measurements into three levels. Levels 1, 2 and 3 of the fair value hierarchy are defined as follows:
Level 1 - unadjusted quoted prices in active markets for identical investments
Level 2 - other significant observable inputs (including, but not limited to, quoted prices for similar assets or liabilities in markets that are either active or inactive; inputs other than quoted prices that are observable such as interest rates, yield curves, volatilities, prepayment speeds, loss severities, credit risks, default rates, or other market corroborated inputs)
Level 3 - significant unobservable inputs based on the best information available in the circumstances, to the extent observable inputs are unavailable (including the Portfolio’s own assumptions used in determining the fair value of investments and derivative financial instruments)
The inputs or methodologies used for valuing investments are not necessarily an indication of the risk associated with investing in them. Changes to the inputs or methodologies used may result in transfers between levels. A reconciliation of Level 3 securities, if any, will be disclosed following the fair value hierarchy table. For more information about the Portfolio’s policy regarding the valuation of investments, please refer to the Notes to Financial Statements.
The following table summarizes the fair value hierarchy of the Portfolio’s investments as of December 31, 2023:
| Description | Level 1 | Level 2 | Level 3 | Total | ||||||||||||
| Total U.S. Treasury & Government Agencies* |
$ | — | $ | 1,685,109,054 | $ | — | $ | 1,685,109,054 | ||||||||
| Corporate Bonds & Notes |
| |||||||||||||||
| Aerospace/Defense |
— | 27,703,898 | — | 27,703,898 | ||||||||||||
| Agriculture |
— | 12,935,187 | — | 12,935,187 | ||||||||||||
| Airlines |
— | 5,522,033 | — | 5,522,033 | ||||||||||||
| Apparel |
— | 506,169 | — | 506,169 | ||||||||||||
| Auto Manufacturers |
— | 1,798,296 | — | 1,798,296 | ||||||||||||
| Auto Parts & Equipment |
— | 766,446 | — | 766,446 | ||||||||||||
| Banks |
— | 190,878,062 | — | 190,878,062 | ||||||||||||
| Biotechnology |
— | 16,289,043 | — | 16,289,043 | ||||||||||||
| Building Materials |
— | 901,151 | — | 901,151 | ||||||||||||
| Chemicals |
— | 3,071,146 | — | 3,071,146 | ||||||||||||
| Commercial Services |
— | 7,154,427 | — | 7,154,427 | ||||||||||||
| Computers |
— | 4,821,368 | — | 4,821,368 | ||||||||||||
| Diversified Financial Services |
— | 5,692,484 | — | 5,692,484 | ||||||||||||
| Electric |
— | 77,106,459 | — | 77,106,459 | ||||||||||||
| Energy-Alternate Sources |
— | 846,721 | — | 846,721 | ||||||||||||
| Entertainment |
— | 4,947,257 | — | 4,947,257 | ||||||||||||
| Environmental Control |
— | 1,842,125 | — | 1,842,125 | ||||||||||||
| Food |
— | 448,611 | — | 448,611 | ||||||||||||
| Gas |
— | 7,830,861 | — | 7,830,861 | ||||||||||||
| Healthcare-Products |
— | 3,866,288 | — | 3,866,288 | ||||||||||||
See accompanying notes to financial statements.
BHFTII-49
Brighthouse Funds Trust II
BlackRock Bond Income Portfolio
Schedule of Investments as of December 31, 2023
Fair Value Hierarchy—(Continued)
| Description | Level 1 | Level 2 | Level 3 | Total | ||||||||||||
| Healthcare-Services |
$ | — | $ | 16,904,790 | $ | — | $ | 16,904,790 | ||||||||
| Home Builders |
— | 4,756,693 | 4,204,670 | 8,961,363 | ||||||||||||
| Insurance |
— | 1,962,606 | — | 1,962,606 | ||||||||||||
| Internet |
— | 4,373,986 | — | 4,373,986 | ||||||||||||
| Iron/Steel |
— | 639,140 | — | 639,140 | ||||||||||||
| Lodging |
— | 490,927 | 1,320,306 | 1,811,233 | ||||||||||||
| Machinery-Diversified |
— | 4,051,439 | — | 4,051,439 | ||||||||||||
| Media |
— | 14,571,484 | — | 14,571,484 | ||||||||||||
| Mining |
— | 4,317,123 | — | 4,317,123 | ||||||||||||
| Miscellaneous Manufacturing |
— | 2,381,460 | — | 2,381,460 | ||||||||||||
| Oil & Gas |
— | 53,901,557 | 1,117,728 | 55,019,285 | ||||||||||||
| Packaging & Containers |
— | 2,767,185 | — | 2,767,185 | ||||||||||||
| Pharmaceuticals |
— | 21,686,949 | — | 21,686,949 | ||||||||||||
| Pipelines |
— | 95,580,409 | — | 95,580,409 | ||||||||||||
| Real Estate |
— | 865,128 | 5,698,951 | 6,564,079 | ||||||||||||
| Real Estate Investment Trusts |
— | 34,580,634 | — | 34,580,634 | ||||||||||||
| Retail |
— | 2,889,304 | — | 2,889,304 | ||||||||||||
| Semiconductors |
— | 8,087,604 | — | 8,087,604 | ||||||||||||
| Shipbuilding |
— | 4,865,465 | — | 4,865,465 | ||||||||||||
| Software |
— | 13,428,027 | — | 13,428,027 | ||||||||||||
| Telecommunications |
— | 48,352,746 | 1,046,137 | 49,398,883 | ||||||||||||
| Transportation |
— | 11,242,487 | — | 11,242,487 | ||||||||||||
| Total Corporate Bonds & Notes |
— | 727,625,175 | 13,387,792 | 741,012,967 | ||||||||||||
| Asset-Backed Securities |
| |||||||||||||||
| Asset-Backed - Credit Card |
— | 1,323,220 | — | 1,323,220 | ||||||||||||
| Asset-Backed - Home Equity |
— | 25,342,029 | — | 25,342,029 | ||||||||||||
| Asset-Backed - Manufactured Housing |
— | 10,720,076 | — | 10,720,076 | ||||||||||||
| Asset-Backed - Other |
— | 211,301,148 | 4,314,631 | 215,615,779 | ||||||||||||
| Asset-Backed - Student Loan |
— | 21,440,133 | — | 21,440,133 | ||||||||||||
| Total Asset-Backed Securities |
— | 270,126,606 | 4,314,631 | 274,441,237 | ||||||||||||
| Total Mortgage-Backed Securities* |
— | 225,257,784 | — | 225,257,784 | ||||||||||||
| Total Foreign Government* |
— | 56,133,988 | — | 56,133,988 | ||||||||||||
| Floating Rate Loans |
| |||||||||||||||
| Agriculture |
— | 306,422 | — | 306,422 | ||||||||||||
| Airlines |
— | 522 | — | 522 | ||||||||||||
| Apparel |
— | 138,039 | — | 138,039 | ||||||||||||
| Auto Parts & Equipment |
— | 241,285 | — | 241,285 | ||||||||||||
| Beverages |
— | 499,060 | — | 499,060 | ||||||||||||
| Chemicals |
— | 936,327 | — | 936,327 | ||||||||||||
| Commercial Services |
— | 2,081,806 | 1,180,685 | 3,262,491 | ||||||||||||
| Computers (Less Unfunded Loan Commitments of $1,171,829) |
— | — | 2,135,985 | 2,135,985 | ||||||||||||
| Cosmetics/Personal Care |
— | 93,044 | 217,005 | 310,049 | ||||||||||||
| Engineering & Construction |
— | — | 1,511,016 | 1,511,016 | ||||||||||||
| Entertainment |
— | 2,661,950 | — | 2,661,950 | ||||||||||||
| Food |
— | 870,188 | — | 870,188 | ||||||||||||
| Hand/Machine Tools |
— | 422,446 | — | 422,446 | ||||||||||||
| Healthcare-Services |
— | 234,955 | — | 234,955 | ||||||||||||
| Household Products/Wares |
— | 122,360 | — | 122,360 | ||||||||||||
| Housewares |
— | 301,023 | — | 301,023 | ||||||||||||
| Lodging |
— | 1,878,686 | — | 1,878,686 | ||||||||||||
| Machinery-Diversified |
— | 340,460 | — | 340,460 | ||||||||||||
| Media |
— | 319,805 | — | 319,805 | ||||||||||||
| Mining |
— | 91,015 | — | 91,015 | ||||||||||||
| Oil & Gas |
— | — | 347,375 | 347,375 | ||||||||||||
| Pipelines |
— | 130,253 | — | 130,253 | ||||||||||||
| Retail |
— | 201,603 | — | 201,603 | ||||||||||||
| Software |
— | 182,035 | — | 182,035 | ||||||||||||
| Telecommunications |
— | 717,326 | — | 717,326 | ||||||||||||
| Total Floating Rate Loans (Less Unfunded Loan Commitments of $1,171,829) |
— | 12,770,610 | 5,392,066 | 18,162,676 | ||||||||||||
| Total Municipals* |
— | 18,860,991 | — | 18,860,991 | ||||||||||||
See accompanying notes to financial statements.
BHFTII-50
Brighthouse Funds Trust II
BlackRock Bond Income Portfolio
Schedule of Investments as of December 31, 2023
Fair Value Hierarchy—(Continued)
| Description | Level 1 | Level 2 | Level 3 | Total | ||||||||||||
| Total Common Stocks* |
$ | 5,166,445 | $ | — | $ | — | $ | 5,166,445 | ||||||||
| Total Preferred Stocks* |
— | — | 4,856,693 | 4,856,693 | ||||||||||||
| Convertible Bonds |
| |||||||||||||||
| Automobiles |
— | — | 1,504,797 | 1,504,797 | ||||||||||||
| Energy-Alternate Sources |
— | 51,807 | — | 51,807 | ||||||||||||
| Media |
— | 198,400 | — | 198,400 | ||||||||||||
| Total Convertible Bonds |
— | 250,207 | 1,504,797 | 1,755,004 | ||||||||||||
| Warrants |
| |||||||||||||||
| Automobiles |
— | — | 8,629 | 8,629 | ||||||||||||
| Health Care Providers & Services |
21 | — | — | 21 | ||||||||||||
| Health Care Technology |
0 | — | — | 0 | ||||||||||||
| Hotels, Restaurants & Leisure |
— | — | 0 | 0 | ||||||||||||
| IT Services |
— | — | 235,707 | 235,707 | ||||||||||||
| Machinery |
553 | — | — | 553 | ||||||||||||
| Software |
1,361 | — | — | 1,361 | ||||||||||||
| Specialty Retail |
3,787 | — | — | 3,787 | ||||||||||||
| Total Warrants |
5,722 | — | 244,336 | 250,058 | ||||||||||||
| Total Escrow Shares* |
— | — | 0 | 0 | ||||||||||||
| Total Short-Term Investment* |
— | 68,079,147 | — | 68,079,147 | ||||||||||||
| Securities Lending Reinvestments |
| |||||||||||||||
| Repurchase Agreements |
— | 2,007,079 | — | 2,007,079 | ||||||||||||
| Mutual Funds |
3,150,000 | — | — | 3,150,000 | ||||||||||||
| Total Securities Lending Reinvestments |
3,150,000 | 2,007,079 | — | 5,157,079 | ||||||||||||
| Purchased Options |
| |||||||||||||||
| Foreign Currency Options at Value |
— | 39,552 | — | 39,552 | ||||||||||||
| Interest Rate Swaptions at Value |
— | 2,396,497 | — | 2,396,497 | ||||||||||||
| Options on Exchange-Traded Futures Contracts at Value |
1,142,188 | — | — | 1,142,188 | ||||||||||||
| Total Purchased Options |
1,142,188 | 2,436,049 | — | 3,578,237 | ||||||||||||
| Total Net Investments |
$ | 9,464,355 | $ | 3,068,656,690 | $ | 29,700,315 | $ | 3,107,821,360 | ||||||||
| Collateral for Securities Loaned (Liability) |
$ | — | $ | (5,157,079 | ) | $ | — | $ | (5,157,079 | ) | ||||||
| TBA Forward Sales Commitments (Liability) |
$ | — | $ | (48,603,634 | ) | $ | — | $ | (48,603,634 | ) | ||||||
| Forward Contracts |
| |||||||||||||||
| Forward Foreign Currency Exchange Contracts (Unrealized Appreciation) |
$ | — | $ | 793,766 | $ | — | $ | 793,766 | ||||||||
| Forward Foreign Currency Exchange Contracts (Unrealized Depreciation) |
— | (1,249,706 | ) | — | (1,249,706 | ) | ||||||||||
| Total Forward Contracts |
$ | — | $ | (455,940 | ) | $ | — | $ | (455,940 | ) | ||||||
| Futures Contracts |
| |||||||||||||||
| Futures Contracts (Unrealized Appreciation) |
$ | 5,769,771 | $ | — | $ | — | $ | 5,769,771 | ||||||||
| Futures Contracts (Unrealized Depreciation) |
(5,660,905 | ) | — | — | (5,660,905 | ) | ||||||||||
| Total Futures Contracts |
$ | 108,866 | $ | — | $ | — | $ | 108,866 | ||||||||
| Written Options |
| |||||||||||||||
| Foreign Currency Options at Value |
$ | — | $ | (2,486 | ) | $ | — | $ | (2,486 | ) | ||||||
| Interest Rate Swaptions at Value |
— | (9,176,629 | ) | — | (9,176,629 | ) | ||||||||||
| Options on Exchange-Traded Futures Contracts at Value |
(1,175,625 | ) | — | — | (1,175,625 | ) | ||||||||||
| Total Written Options |
$ | (1,175,625 | ) | $ | (9,179,115 | ) | $ | — | $ | (10,354,740 | ) | |||||
| Centrally Cleared Swap Contracts |
| |||||||||||||||
| Centrally Cleared Swap Contracts (Unrealized Appreciation) |
$ | — | $ | 2,471,145 | $ | — | $ | 2,471,145 | ||||||||
| Centrally Cleared Swap Contracts (Unrealized Depreciation) |
— | (2,384,663 | ) | — | (2,384,663 | ) | ||||||||||
| Total Centrally Cleared Swap Contracts |
$ | — | $ | 86,482 | $ | — | $ | 86,482 | ||||||||
| OTC Swap Contracts |
| |||||||||||||||
| OTC Swap Contracts at Value (Assets) |
$ | — | $ | 332,708 | $ | — | $ | 332,708 | ||||||||
| OTC Swap Contracts at Value (Liabilities) |
— | (650,208 | ) | — | (650,208 | ) | ||||||||||
| Total OTC Swap Contracts |
$ | — | $ | (317,500 | ) | $ | — | $ | (317,500 | ) | ||||||
| * | See Schedule of Investments for additional detailed categorizations. |
See accompanying notes to financial statements.
BHFTII-51
Brighthouse Funds Trust II
BlackRock Bond Income Portfolio
Schedule of Investments as of December 31, 2023
Fair Value Hierarchy—(Continued)
Following is a reconciliation of Level 3 assets for which significant unobservable inputs were used to determine fair value:
| Investments in Securities |
Balance as of December 31, 2022 |
Purchases | Sales | Realized Gain/ (Loss) |
Transfers In |
Amortization Prem/Desc |
Change in Unrealized Appreciation/ (Depreciation) |
Balance as of December 31, 2023 |
Change in Unrealized Appreciation/ (Depreciation) from Investments Held at December 31, 2023 |
|||||||||||||||||||||||||||
| Corporate Bonds | ||||||||||||||||||||||||||||||||||||
| Home Builders |
$ | 1,144,179 | $ | 3,010,880 | $ | — | $ | — | $ | — | $ | 3,822 | $ | 45,789 | $ | 4,204,670 | $ | 45,789 | ||||||||||||||||||
| Lodging |
1,346,113 | 274,169 | (288,335 | ) | 42,146 | — | 8,348 | (62,135 | ) | 1,320,306 | (62,135 | ) | ||||||||||||||||||||||||
| Oil & Gas |
1,953,719 | 1,099,773 | (1,990,950 | ) | 39,819 | — | — | 15,367 | 1,117,728 | 17,955 | ||||||||||||||||||||||||||
| Real Estate |
1,115,229 | 5,778,752 | (1,192,407 | ) | 34,428 | — | 26,716 | (63,767 | ) | 5,698,951 | (90,984 | ) | ||||||||||||||||||||||||
| Telecommunications |
— | 1,046,137 | — | — | — | — | — | 1,046,137 | — | |||||||||||||||||||||||||||
| Asset-Backed Securities | ||||||||||||||||||||||||||||||||||||
| Asset-Backed - Other |
— | 984,236 | — | — | 3,166,485 | — | 163,910 | 4,314,631 | 163,910 | |||||||||||||||||||||||||||
| Floating Rate Loans | ||||||||||||||||||||||||||||||||||||
| Commercial Services |
1,214,558 | 339,703 | — | — | — | 702 | (374,278 | ) | 1,180,685 | (374,278 | ) | |||||||||||||||||||||||||
| Computers* |
— | 2,200,516 | (17,420 | ) | 156 | — | 1,781 | (49,048 | ) | 2,135,985 | (49,048 | ) | ||||||||||||||||||||||||
| Cosmetics/Personal Care |
— | 215,340 | — | — | — | 191 | 1,474 | 217,005 | 1,474 | |||||||||||||||||||||||||||
| Engineering & Construction |
— | 1,852,618 | (344,216 | ) | 17 | — | 424 | 2,173 | 1,511,016 | 2,173 | ||||||||||||||||||||||||||
| Oil & Gas |
— | 347,375 | — | — | — | 28 | (28 | ) | 347,375 | (28 | ) | |||||||||||||||||||||||||
| Preferred Stocks | ||||||||||||||||||||||||||||||||||||
| Home Builders |
2,394,765 | — | — | — | — | — | 98,550 | 2,493,315 | 98,550 | |||||||||||||||||||||||||||
| IT Services |
1,810,663 | — | — | — | — | — | 400,109 | 2,210,772 | 400,109 | |||||||||||||||||||||||||||
| Software |
— | 303,694 | — | — | — | — | (151,088 | ) | 152,606 | (151,088 | ) | |||||||||||||||||||||||||
| Convertible Bonds | ||||||||||||||||||||||||||||||||||||
| Automobiles |
1,123,937 | 204,736 | — | — | — | — | 176,124 | 1,504,797 | 176,124 | |||||||||||||||||||||||||||
| Warants | ||||||||||||||||||||||||||||||||||||
| Automobiles |
106,819 | — | — | — | — | — | (98,190 | ) | 8,629 | (98,190 | ) | |||||||||||||||||||||||||
| Hotels, Restaurants & Leisure |
208 | — | — | — | — | — | (208 | ) | — | (208 | ) | |||||||||||||||||||||||||
| IT Services |
215,647 | — | — | — | — | — | 20,060 | 235,707 | 20,060 | |||||||||||||||||||||||||||
| Escrow Shares | ||||||||||||||||||||||||||||||||||||
| Savings & Loans |
1 | — | — | — | — | — | (1 | ) | — | (1 | ) | |||||||||||||||||||||||||
|
|
|
|
|
|
|
|
|
|
|
|
|
|
|
|
|
|
|
|||||||||||||||||||
| $ | 12,425,838 | $ | 17,657,929 | $ | (3,833,328 | ) | $ | 116,566 | $ | 3,166,485 | $ | 42,012 | $ | 124,813 | $ | 29,700,315 | $ | 100,184 | ||||||||||||||||||
|
|
|
|
|
|
|
|
|
|
|
|
|
|
|
|
|
|
|
|||||||||||||||||||
| * | Values are net of unfunded loan commitments. |
| Fair Value at December 31, 2023 |
Valuation Technique(s) | Unobservable Input | Range | Weighted Average |
Relationship Between Fair Value and Input; if input value increases then Fair Value: |
|||||||||||||||||||||||
| Corporate Bonds | ||||||||||||||||||||||||||||
| Home Builders |
$ | 4,204,670 | Market Yield Analysis | Midpoint Yield Spread | 7.11 | % | 7.53 | % | 7.41 | % | Decrease | |||||||||||||||||
| Reference Index Spread | 4.27 | % | 4.39 | % | 4.30 | % | Decrease | |||||||||||||||||||||
| Lodging |
1,320,306 | Market Yield Analysis | Midpoint Yield Spread | 14.25 | % | 14.25 | % | 14.25 | % | Decrease | ||||||||||||||||||
| Reference Index Spread | 4.50 | % | 4.50 | % | 4.50 | % | Decrease | |||||||||||||||||||||
| Oil & Gas |
1,117,728 | Market Yield Analysis | Midpoint Yield Spread | 7.75 | % | 7.75 | % | 7.75 | % | Decrease | ||||||||||||||||||
| Reference Index Spread | 4.24 | % | 4.24 | % | 4.24 | % | Decrease | |||||||||||||||||||||
| Real Estate |
5,698,951 | Market Yield Analysis | Midpoint Yield Spread | 11.54 | % | 11.54 | % | 11.54 | % | Decrease | ||||||||||||||||||
| Reference Index Spread | 4.08 | % | 4.08 | % | 4.08 | % | Decrease | |||||||||||||||||||||
| Market Transaction | Transaction Price | $ | 97.00 | $ | 97.00 | $ | 97.00 | Increase | ||||||||||||||||||||
| Telecommunications |
1,046,137 | Market Transaction | Transaction Price | $ | 100.00 | $ | 100.00 | $ | 100.00 | Increase | ||||||||||||||||||
| Asset-Backed Securities | ||||||||||||||||||||||||||||
| Asset-Backed - Other |
4,314,631 | Market Yield Analysis | Midpoint Yield Spread | 4.08 | % | 8.51 | % | 5.12 | % | Decrease | ||||||||||||||||||
| Reference Index Spread | 3.94 | % | 4.46 | % | 4.35 | % | Decrease | |||||||||||||||||||||
See accompanying notes to financial statements.
BHFTII-52
Brighthouse Funds Trust II
BlackRock Bond Income Portfolio
Schedule of Investments as of December 31, 2023
Fair Value Hierarchy—(Continued)
| Fair Value at December 31, 2023 |
Valuation Technique(s) | Unobservable Input | Range | Weighted Average |
Relationship Between Fair Value and Input; if input value increases then Fair Value: |
|||||||||||||||||||
| Floating Rate Loans | ||||||||||||||||||||||||
| Commercial Services |
$ | 1,180,685 | EV Coverage Analysis | EV/EBITDA Multiple | 14.50x | 14.50x | 14.50x | Increase | ||||||||||||||||
| Loan/EV Coverage Ratio | 0.74x | 0.74x | 0.74x | Increase | ||||||||||||||||||||
| Computers* |
2,135,985 | Market Yield Analysis | Midpoint Yield Spread | 7.50 | % | 9.63 | % | 9.09 | % | Decrease | ||||||||||||||
| Reference Index Spread | 4.92 | % | 5.25 | % | 5.17 | % | Decrease | |||||||||||||||||
| Cosmetics/Personal Care |
217,005 | Market Yield Analysis | Midpoint Yield Spread | 7.50 | % | 7.50 | % | 7.50 | % | Decrease | ||||||||||||||
| Reference Index Spread | 4.03 | % | 4.03 | % | 4.03 | % | Decrease | |||||||||||||||||
| Engineering & Construction |
1,511,016 | Market Yield Analysis | Midpoint Yield Spread | 6.50 | % | 6.50 | % | 6.50 | % | Decrease | ||||||||||||||
| Reference Index Spread | 4.47 | % | 4.47 | % | 4.47 | % | Decrease | |||||||||||||||||
| Oil & Gas |
347,375 | Market Transaction | Transaction Price | $ | 99.25 | $ | 99.25 | $ | 99.25 | Increase | ||||||||||||||
| Preferred Stock | ||||||||||||||||||||||||
| Home Builders |
2,493,315 | Market Yield Analysis | Midpoint Yield Spread | 6.34 | % | 6.34 | % | 6.34 | % | Decrease | ||||||||||||||
| Reference Index Spread | 4.09 | % | 4.09 | % | 4.09 | % | Decrease | |||||||||||||||||
| IT Services |
2,210,772 | Comparable Company Analysis | EV/Revenue Multiple | 9.50x | 9.50x | 9.50x | Increase | |||||||||||||||||
| Accrued Dividend/Share | $ | 0.43 | $ | 0.43 | $ | 0.43 | Increase | |||||||||||||||||
| Software |
152,606 | Comparable Company Analysis | EV/Gross Profit Multiple | 4.50x | 4.50x | 4.50x | Increase | |||||||||||||||||
| Convertible Bonds | ||||||||||||||||||||||||
| Automobiles |
1,504,797 | Scenario Analysis | EV/Revenue Multiple | 4.22x | 4.22x | 4.22x | Increase | |||||||||||||||||
| Years to Conversion | 0.50 | 1.32 | 0.83 | Decrease | ||||||||||||||||||||
| Discount Rate | 55.76 | % | 55.76 | % | 55.76 | % | Decrease | |||||||||||||||||
| Warrants | ||||||||||||||||||||||||
| Automobiles |
8,629 | Black-Scholes Model | Strike Price | $ | 3.35 | $ | 3.35 | $ | 3.35 | Decrease | ||||||||||||||
| Volatility Rate | 60.00 | % | 60.00 | % | 60.00 | % | Increase | |||||||||||||||||
| Risk Free Rate | 4.82 | % | 5.33 | % | 4.84 | % | Decrease | |||||||||||||||||
| Hotels, Restaurants & Leisure |
0 | Black-Scholes Model | Strike Price | $ | 230.00 | $ | 230.00 | $ | 230.00 | Decrease | ||||||||||||||
| Volatility Rate | 44.00 | % | 44.00 | % | 44.00 | % | Increase | |||||||||||||||||
| Risk Free Rate | 4.42 | % | 4.42 | % | 4.42 | % | Decrease | |||||||||||||||||
| IT Services |
235,707 | Comparable Company Analysis | EV/Revenue Multiple | 9.50x | 9.50x | 9.50x | Increase | |||||||||||||||||
| * | Market values are net of unfunded loan commitments. | |||
See accompanying notes to financial statements.
BHFTII-53
Brighthouse Funds Trust II
BlackRock Bond Income Portfolio
Statement of Assets and Liabilities
December 31, 2023
| Assets |
| |||
| Investments at value (a) (b) (c) |
$ | 3,107,821,360 | ||
| Cash |
1,707,789 | |||
| Cash denominated in foreign currencies (d) |
8,101,276 | |||
| Cash collateral (e) |
3,633,520 | |||
| OTC swap contracts at market value (f) |
332,708 | |||
| Unrealized appreciation on forward foreign currency exchange contracts |
793,766 | |||
| Receivable for: |
||||
| Investments sold |
706,022 | |||
| TBA securities sold (g) |
217,514,683 | |||
| Fund shares sold |
876,935 | |||
| Dividends and interest |
23,180,205 | |||
| Interest on OTC swap contracts |
841 | |||
| Variation margin on futures contracts |
117,134 | |||
| Variation margin on centrally cleared swap contracts |
19,780 | |||
| Prepaid expenses |
10,626 | |||
| Other assets |
178,199 | |||
|
|
|
|||
| Total Assets |
3,364,994,844 | |||
| Liabilities |
||||
| Written options at value (h) |
10,354,740 | |||
| TBA Forward sales commitments, at value |
48,603,634 | |||
| OTC swap contracts at market value (i) |
650,208 | |||
| Cash collateral (j) |
215,100 | |||
| Unrealized depreciation on forward foreign currency exchange contracts |
1,249,706 | |||
| Collateral for securities loaned |
5,157,079 | |||
| Payables for: |
||||
| Investments purchased |
7,881,277 | |||
| TBA securities purchased (g) |
477,420,329 | |||
| Premium on purchased options |
2,486 | |||
| Fund shares redeemed |
319,193 | |||
| Foreign taxes |
7,325 | |||
| Interest on forward sales commitments |
214,661 | |||
| Interest on OTC swap contracts |
12,852 | |||
| Accrued Expenses: |
||||
| Management fees |
803,164 | |||
| Distribution and service fees |
97,885 | |||
| Deferred trustees’ fees |
169,190 | |||
| Other expenses |
509,630 | |||
|
|
|
|||
| Total Liabilities |
553,668,459 | |||
|
|
|
|||
| Net Assets |
$ | 2,811,326,385 | ||
|
|
|
|||
| Net Assets Consist of: |
||||
| Paid in surplus |
$ | 3,260,292,125 | ||
| Distributable earnings (Accumulated losses) (k) |
(448,965,740 | ) | ||
|
|
|
|||
| Net Assets |
$ | 2,811,326,385 | ||
|
|
|
|||
| Net Assets |
||||
| Class A |
$ | 2,314,203,460 | ||
| Class B |
422,700,505 | |||
| Class E |
74,422,420 | |||
| Capital Shares Outstanding* |
||||
| Class A |
25,081,948 | |||
| Class B |
4,682,295 | |||
| Class E |
815,291 | |||
| Net Asset Value, Offering Price and Redemption Price Per Share |
||||
| Class A |
$ | 92.27 | ||
| Class B |
90.28 | |||
| Class E |
91.28 | |||
| * | The Portfolio is authorized to issue an unlimited number of shares. | |||
| (a) | Identified cost of investments was $3,237,634,591. | |||
| (b) | Includes securities loaned at value of $40,984,559. | |||
| (c) | Investments at value is net of unfunded loan commitments of $1,171,829. | |||
| (d) | Identified cost of cash denominated in foreign currencies was $8,036,881. | |||
| (e) | Includes collateral of $847,000 for OTC swap contracts, OTC option contracts, and forward foreign currency exchange contracts and $2,786,520 for centrally cleared swap contracts. | |||
| (f) | Net premium paid on OTC swap contracts was $222,831. | |||
| (g) | Included within TBA securities sold is $99,131,576 related to TBA forward sale commitments and included within TBA securities purchased is $52,073,360 related to TBA forward sale commitments. | |||
| (h) | Premiums received on written options were $9,613,950. | |||
| (i) | Net premium received on OTC swap contracts was $237,684. | |||
| (j) | Includes collateral of $95,100 for OTC swap contracts, OTC option contracts, and forward foreign currency exchange contracts and $120,000 for TBAs. | |||
| (k) | Includes foreign capital gains tax of $7,325. | |||
Statement of Operations
Year Ended December 31, 2023
| Investment Income |
||||
| Dividends |
$ | 341,849 | ||
| Interest (a) |
121,190,756 | |||
| Securities lending income |
48,492 | |||
|
|
|
|||
| Total investment income |
121,581,097 | |||
| Expenses |
||||
| Management fees |
9,921,521 | |||
| Administration fees |
131,665 | |||
| Custodian and accounting fees |
860,005 | |||
| Distribution and service fees—Class B |
1,035,164 | |||
| Distribution and service fees—Class E |
112,010 | |||
| Audit and tax services |
138,739 | |||
| Legal |
46,604 | |||
| Trustees’ fees and expenses |
46,220 | |||
| Shareholder reporting |
99,074 | |||
| Insurance |
26,986 | |||
| Miscellaneous |
48,661 | |||
|
|
|
|||
| Total expenses |
12,466,649 | |||
| Less management fee waiver |
(348,207 | ) | ||
|
|
|
|||
| Net expenses |
12,118,442 | |||
|
|
|
|||
| Net Investment Income |
109,462,655 | |||
|
|
|
|||
| Net Realized and Unrealized Gain (Loss) |
||||
| Net realized gain (loss) on: | ||||
| Investments (b) |
(94,873,059 | ) | ||
| Purchased options |
(3,589,383 | ) | ||
| Futures contracts |
3,943,632 | |||
| Written options |
(2,518,681 | ) | ||
| Swap contracts |
(2,213,459 | ) | ||
| Foreign currency transactions |
343,399 | |||
| Forward foreign currency transactions |
(1,578,257 | ) | ||
|
|
|
|||
| Net realized gain (loss) |
(100,485,808 | ) | ||
|
|
|
|||
| Net change in unrealized appreciation (depreciation) on: | ||||
| Investments (c) |
149,030,061 | |||
| Purchased options |
(2,509,921 | ) | ||
| Futures contracts |
(1,451,801 | ) | ||
| Written options |
4,818,590 | |||
| Swap contracts |
(2,767,136 | ) | ||
| Foreign currency transactions |
113,370 | |||
| Forward foreign currency transactions |
(479,208 | ) | ||
|
|
|
|||
| Net change in unrealized appreciation (depreciation) |
146,753,955 | |||
|
|
|
|||
| Net realized and unrealized gain (loss) |
46,268,147 | |||
|
|
|
|||
| Net Increase (Decrease) in Net Assets From Operations |
$ | 155,730,802 | ||
|
|
|
| (a) | Net of foreign withholding taxes of $16,118. | |||
| (b) | Net of foreign capital gains tax of $1,611. | |||
| (c) | Includes change in foreign capital gains tax of $(7,325). | |||
See accompanying notes to financial statements.
BHFTII-54
Brighthouse Funds Trust II
BlackRock Bond Income Portfolio
Statements of Changes in Net Assets
| Year Ended December 31, 2023 |
Year Ended December 31, 2022 |
|||||||
| Increase (Decrease) in Net Assets: |
||||||||
| From Operations |
||||||||
| Net investment income (loss) |
$ | 109,462,655 | $ | 78,952,028 | ||||
| Net realized gain (loss) |
(100,485,808 | ) | (292,564,852 | ) | ||||
| Net change in unrealized appreciation (depreciation) |
146,753,955 | (291,166,063 | ) | |||||
|
|
|
|
|
|||||
| Increase (decrease) in net assets from operations |
155,730,802 | (504,778,887 | ) | |||||
|
|
|
|
|
|||||
| From Distributions to Shareholders |
||||||||
| Class A |
(72,850,562 | ) | (79,174,618 | ) | ||||
| Class B |
(11,997,790 | ) | (12,754,723 | ) | ||||
| Class E |
(2,239,363 | ) | (2,489,604 | ) | ||||
|
|
|
|
|
|||||
| Total distributions |
(87,087,715 | ) | (94,418,945 | ) | ||||
|
|
|
|
|
|||||
| Increase (decrease) in net assets from capital share transactions |
(98,659,860 | ) | (224,190,087 | ) | ||||
|
|
|
|
|
|||||
| Total increase (decrease) in net assets |
(30,016,773 | ) | (823,387,919 | ) | ||||
| Net Assets |
||||||||
| Beginning of period |
2,841,343,158 | 3,664,731,077 | ||||||
|
|
|
|
|
|||||
| End of period |
$ | 2,811,326,385 | $ | 2,841,343,158 | ||||
|
|
|
|
|
|||||
Other Information:
Capital Shares
Transactions in capital shares were as follows:
| Year Ended December 31, 2023 |
Year Ended December 31, 2022 |
|||||||||||||||
| Shares | Value | Shares | Value | |||||||||||||
| Class A |
||||||||||||||||
| Sales |
462,273 | $ | 42,101,151 | 828,712 | $ | 81,045,920 | ||||||||||
| Reinvestments |
814,883 | 72,850,562 | 864,540 | 79,174,618 | ||||||||||||
| Redemptions |
(2,356,487 | ) | (211,363,083 | ) | (3,500,402 | ) | (335,535,124 | ) | ||||||||
|
|
|
|
|
|
|
|
|
|||||||||
| Net increase (decrease) |
(1,079,331 | ) | $ | (96,411,370 | ) | (1,807,150 | ) | $ | (175,314,586 | ) | ||||||
|
|
|
|
|
|
|
|
|
|||||||||
| Class B |
||||||||||||||||
| Sales |
417,169 | $ | 36,754,794 | 289,179 | $ | 27,400,438 | ||||||||||
| Reinvestments |
136,977 | 11,997,790 | 142,098 | 12,754,723 | ||||||||||||
| Redemptions |
(529,916 | ) | (46,635,838 | ) | (872,740 | ) | (82,239,899 | ) | ||||||||
|
|
|
|
|
|
|
|
|
|||||||||
| Net increase (decrease) |
24,230 | $ | 2,116,746 | (441,463 | ) | $ | (42,084,738 | ) | ||||||||
|
|
|
|
|
|
|
|
|
|||||||||
| Class E |
||||||||||||||||
| Sales |
56,223 | $ | 5,010,538 | 46,302 | $ | 4,481,669 | ||||||||||
| Reinvestments |
25,298 | 2,239,363 | 27,452 | 2,489,604 | ||||||||||||
| Redemptions |
(129,944 | ) | (11,615,137 | ) | (146,119 | ) | (13,762,036 | ) | ||||||||
|
|
|
|
|
|
|
|
|
|||||||||
| Net increase (decrease) |
(48,423 | ) | $ | (4,365,236 | ) | (72,365 | ) | $ | (6,790,763 | ) | ||||||
|
|
|
|
|
|
|
|
|
|||||||||
| Increase (decrease) derived from capital shares transactions |
$ | (98,659,860 | ) | $ | (224,190,087 | ) | ||||||||||
|
|
|
|
|
|||||||||||||
See accompanying notes to financial statements.
BHFTII-55
Brighthouse Funds Trust II
BlackRock Bond Income Portfolio
Financial Highlights
| Selected per share data | ||||||||||||||||||||
| Class A | ||||||||||||||||||||
| Year Ended December 31, | ||||||||||||||||||||
| 2023 | 2022 | 2021 | 2020 | 2019 | ||||||||||||||||
| Net Asset Value, Beginning of Period |
$ | 89.99 | $ | 108.15 | $ | 113.91 | $ | 108.84 | $ | 102.94 | ||||||||||
|
|
|
|
|
|
|
|
|
|
|
|||||||||||
| Income (Loss) from Investment Operations |
||||||||||||||||||||
| Net investment income (loss) (a) |
3.55 | 2.45 | 2.04 | 2.67 | 3.39 | |||||||||||||||
| Net realized and unrealized gain (loss) |
1.61 | (17.68 | ) | (2.58 | ) | 6.54 | 6.56 | |||||||||||||
|
|
|
|
|
|
|
|
|
|
|
|||||||||||
| Total income (loss) from investment operations |
5.16 | (15.23 | ) | (0.54 | ) | 9.21 | 9.95 | |||||||||||||
|
|
|
|
|
|
|
|
|
|
|
|||||||||||
| Less Distributions |
||||||||||||||||||||
| Distributions from net investment income |
(2.88 | ) | (2.81 | ) | (3.05 | ) | (4.14 | ) | (4.05 | ) | ||||||||||
| Distributions from net realized capital gains |
0.00 | (0.12 | ) | (2.17 | ) | 0.00 | 0.00 | |||||||||||||
|
|
|
|
|
|
|
|
|
|
|
|||||||||||
| Total distributions |
(2.88 | ) | (2.93 | ) | (5.22 | ) | (4.14 | ) | (4.05 | ) | ||||||||||
|
|
|
|
|
|
|
|
|
|
|
|||||||||||
| Net Asset Value, End of Period |
$ | 92.27 | $ | 89.99 | $ | 108.15 | $ | 113.91 | $ | 108.84 | ||||||||||
|
|
|
|
|
|
|
|
|
|
|
|||||||||||
| Total Return (%) (b) |
5.84 | (14.15 | ) | (0.43 | ) | 8.60 | 9.83 | |||||||||||||
| Ratios/Supplemental Data |
||||||||||||||||||||
| Gross ratio of expenses to average net assets (%) |
0.40 | 0.39 | 0.37 | 0.39 | 0.39 | |||||||||||||||
| Gross ratio of expenses to average net assets excluding interest expense (%) |
0.40 | 0.39 | 0.37 | 0.39 | 0.38 | |||||||||||||||
| Net ratio of expenses to average net assets (%) (c) |
0.39 | 0.38 | 0.37 | 0.39 | 0.39 | |||||||||||||||
| Net ratio of expenses to average net assets excluding interest expense (%) (c) |
0.39 | 0.38 | 0.37 | 0.39 | 0.38 | |||||||||||||||
| Ratio of net investment income (loss) to average net assets (%) |
3.93 | 2.55 | 1.86 | 2.40 | 3.18 | |||||||||||||||
| Portfolio turnover rate (%) |
435 | (d) | 376 | (d) | 486 | (d) | 437 | (d) | 482 | (d) | ||||||||||
| Net assets, end of period (in millions) |
$ | 2,314.2 | $ | 2,354.2 | $ | 3,024.7 | $ | 2,797.7 | $ | 2,846.1 | ||||||||||
| Class B | ||||||||||||||||||||
| Year Ended December 31, | ||||||||||||||||||||
| 2023 | 2022 | 2021 | 2020 | 2019 | ||||||||||||||||
| Net Asset Value, Beginning of Period |
$ | 88.08 | $ | 105.87 | $ | 111.65 | $ | 106.74 | $ | 101.01 | ||||||||||
|
|
|
|
|
|
|
|
|
|
|
|||||||||||
| Income (Loss) from Investment Operations |
||||||||||||||||||||
| Net investment income (loss) (a) |
3.26 | 2.16 | 1.73 | 2.34 | 3.06 | |||||||||||||||
| Net realized and unrealized gain (loss) |
1.57 | (17.30 | ) | (2.54 | ) | 6.42 | 6.44 | |||||||||||||
|
|
|
|
|
|
|
|
|
|
|
|||||||||||
| Total income (loss) from investment operations |
4.83 | (15.14 | ) | (0.81 | ) | 8.76 | 9.50 | |||||||||||||
|
|
|
|
|
|
|
|
|
|
|
|||||||||||
| Less Distributions |
||||||||||||||||||||
| Distributions from net investment income |
(2.63 | ) | (2.53 | ) | (2.80 | ) | (3.85 | ) | (3.77 | ) | ||||||||||
| Distributions from net realized capital gains |
0.00 | (0.12 | ) | (2.17 | ) | 0.00 | 0.00 | |||||||||||||
|
|
|
|
|
|
|
|
|
|
|
|||||||||||
| Total distributions |
(2.63 | ) | (2.65 | ) | (4.97 | ) | (3.85 | ) | (3.77 | ) | ||||||||||
|
|
|
|
|
|
|
|
|
|
|
|||||||||||
| Net Asset Value, End of Period |
$ | 90.28 | $ | 88.08 | $ | 105.87 | $ | 111.65 | $ | 106.74 | ||||||||||
|
|
|
|
|
|
|
|
|
|
|
|||||||||||
| Total Return (%) (b) |
5.59 | (14.36 | ) | (0.69 | ) | 8.34 | 9.55 | |||||||||||||
| Ratios/Supplemental Data |
||||||||||||||||||||
| Gross ratio of expenses to average net assets (%) |
0.65 | 0.64 | 0.62 | 0.64 | 0.64 | |||||||||||||||
| Gross ratio of expenses to average net assets excluding interest expense (%) |
0.65 | 0.64 | 0.62 | 0.64 | 0.63 | |||||||||||||||
| Net ratio of expenses to average net assets (%) (c) |
0.64 | 0.63 | 0.62 | 0.64 | 0.64 | |||||||||||||||
| Net ratio of expenses to average net assets excluding interest expense (%) (c) |
0.64 | 0.63 | 0.62 | 0.64 | 0.63 | |||||||||||||||
| Ratio of net investment income (loss) to average net assets (%) |
3.69 | 2.30 | 1.61 | 2.14 | 2.93 | |||||||||||||||
| Portfolio turnover rate (%) |
435 | (d) | 376 | (d) | 486 | (d) | 437 | (d) | 482 | (d) | ||||||||||
| Net assets, end of period (in millions) |
$ | 422.7 | $ | 410.3 | $ | 539.9 | $ | 516.4 | $ | 468.9 | ||||||||||
Please see following page for Financial Highlights footnote legend.
See accompanying notes to financial statements.
BHFTII-56
Brighthouse Funds Trust II
BlackRock Bond Income Portfolio
Financial Highlights
| Selected per share data | ||||||||||||||||||||
| Class E | ||||||||||||||||||||
| Year Ended December 31, | ||||||||||||||||||||
| 2023 | 2022 | 2021 | 2020 | 2019 | ||||||||||||||||
| Net Asset Value, Beginning of Period |
$ | 89.04 | $ | 107.01 | $ | 112.78 | $ | 107.78 | $ | 101.96 | ||||||||||
|
|
|
|
|
|
|
|
|
|
|
|||||||||||
| Income (Loss) from Investment Operations |
||||||||||||||||||||
| Net investment income (loss) (a) |
3.38 | 2.28 | 1.86 | 2.48 | 3.20 | |||||||||||||||
| Net realized and unrealized gain (loss) |
1.58 | (17.48 | ) | (2.57 | ) | 6.48 | 6.49 | |||||||||||||
|
|
|
|
|
|
|
|
|
|
|
|||||||||||
| Total income (loss) from investment operations |
4.96 | (15.20 | ) | (0.71 | ) | 8.96 | 9.69 | |||||||||||||
|
|
|
|
|
|
|
|
|
|
|
|||||||||||
| Less Distributions |
||||||||||||||||||||
| Distributions from net investment income |
(2.72 | ) | (2.65 | ) | (2.89 | ) | (3.96 | ) | (3.87 | ) | ||||||||||
| Distributions from net realized capital gains |
0.00 | (0.12 | ) | (2.17 | ) | 0.00 | 0.00 | |||||||||||||
|
|
|
|
|
|
|
|
|
|
|
|||||||||||
| Total distributions |
(2.72 | ) | (2.77 | ) | (5.06 | ) | (3.96 | ) | (3.87 | ) | ||||||||||
|
|
|
|
|
|
|
|
|
|
|
|||||||||||
| Net Asset Value, End of Period |
$ | 91.28 | $ | 89.04 | $ | 107.01 | $ | 112.78 | $ | 107.78 | ||||||||||
|
|
|
|
|
|
|
|
|
|
|
|||||||||||
| Total Return (%) (b) |
5.68 | (14.27 | ) | (0.60 | ) | 8.44 | 9.66 | |||||||||||||
| Ratios/Supplemental Data |
||||||||||||||||||||
| Gross ratio of expenses to average net assets (%) |
0.55 | 0.54 | 0.52 | 0.54 | 0.54 | |||||||||||||||
| Gross ratio of expenses to average net assets excluding interest expense (%) |
0.55 | 0.54 | 0.52 | 0.54 | 0.53 | |||||||||||||||
| Net ratio of expenses to average net assets (%) (c) |
0.54 | 0.53 | 0.52 | 0.54 | 0.54 | |||||||||||||||
| Net ratio of expenses to average net assets excluding interest expense (%) (c) |
0.54 | 0.53 | 0.52 | 0.54 | 0.53 | |||||||||||||||
| Ratio of net investment income (loss) to average net assets (%) |
3.78 | 2.40 | 1.71 | 2.25 | 3.03 | |||||||||||||||
| Portfolio turnover rate (%) |
435 | (d) | 376 | (d) | 486 | (d) | 437 | (d) | 482 | (d) | ||||||||||
| Net assets, end of period (in millions) |
$ | 74.4 | $ | 76.9 | $ | 100.2 | $ | 93.6 | $ | 95.5 | ||||||||||
| (a) | Per share amounts based on average shares outstanding during the period. | |||
| (b) | Total return does not reflect any insurance, sales, separate account or administrative charges of variable annuity or life insurance contracts or any additional expenses that contract owners may bear under their variable contracts. If these charges were included, the returns would be lower. | |||
| (c) | Includes the effects of management fee waivers (see Note 6 of the Notes to Financial Statements). | |||
| (d) | Includes mortgage dollar roll and TBA transactions; excluding these transactions the portfolio turnover rates would have been 130%, 64%, 82%, 93%, and 81%, for the years ended December 31, 2023, 2022, 2021, 2020, and 2019, respectively. | |||
See accompanying notes to financial statements.
BHFTII-57
Brighthouse Funds Trust II
BlackRock Bond Income Portfolio
Notes to Financial Statements—December 31, 2023
1. Organization
Brighthouse Funds Trust II (the “Trust”) is organized as a Delaware statutory trust and registered under the Investment Company Act of 1940, as amended (the “1940 Act”), as an open-end management investment company. The Trust, which is managed by Brighthouse Investment Advisers, LLC (“Brighthouse Investment Advisers” or the “Adviser”), currently offers twenty-nine series (the “Portfolios”), each of which operates as a distinct investment vehicle of the Trust.The series included in this report is BlackRock Bond Income Portfolio (the “Portfolio”), which is diversified. Shares of the Portfolio are not offered directly to the general public and are currently available only to separate accounts of insurance companies, including insurance companies affiliated with the Adviser.
The Portfolio has registered and offers three classes of shares: Class A, B and E shares. Shares of each class of the Portfolio represent an equal pro rata interest in the Portfolio and generally give the shareholder the same voting, dividend, liquidation, and other rights. Investment income, realized and unrealized capital gains and losses, the common expenses of the Portfolio, and certain Portfolio-level expense reductions, if any, are allocated on a pro rata basis to each class based on the relative net assets of each class to the net assets of the Portfolio. Each class of shares differs in its respective distribution plan and such distribution expenses are allocated to the corresponding class of shares.
2. Significant Accounting Policies
The preparation of financial statements in conformity with accounting principles generally accepted in the United States of America (“GAAP”) requires management to make estimates and assumptions that affect the reported amounts of assets and liabilities and disclosure of contingent assets and liabilities as of the date of the financial statements and the reported amounts of income and expenses during the reporting period. Actual results could differ from those estimates. In the preparation of these financial statements, management has evaluated events and transactions subsequent to December 31, 2023 through the date the financial statements were issued.
The Portfolio is an investment company and follows the accounting and reporting guidance of the Financial Accounting Standards Board (“FASB”) Accounting Standards Codification Topic 946—Financial Services—Investment Companies. The following is a summary of significant accounting policies consistently followed by the Portfolio in the preparation of its financial statements.
Investment Valuation and Fair Value Measurements - The Portfolio values its investments for purposes of calculating its net asset value (“NAV”) using procedures that allow for a variety of methodologies to be used to value the Portfolio’s investments. The specific methodology used for an investment may vary based on the market data available for a specific investment at the time the Portfolio calculates its NAV or based on other considerations. The procedures also permit a level of judgment to be used in the valuation process.
Debt securities, including corporate, convertible and municipal bonds and notes; obligations of the U.S. Treasury and U.S. government agencies; foreign sovereign issues; and non-U.S. bonds, are generally valued based upon evaluated or composite bid quotations obtained from third-party pricing services and/or brokers and dealers selected by the Adviser (each a “pricing service”). Such pricing services may use matrix pricing, which considers observable inputs including, among other things, issuer details, maturity dates, interest rates, yield curves, rates of prepayment, credit risks/spreads, default rates, reported trades, broker-dealer quotes and quoted prices for similar assets. Short-term obligations with a remaining maturity of sixty days or less may be valued at amortized cost in the absence of market quotes, so long as the amortized cost value of such short-term debt instrument is approximately the same as the fair value of the instrument as determined without the use of amortized cost valuation. Floating rate loans are generally valued based upon an evaluated or composite average of aggregate bid and ask quotations supplied by brokers or dealers, as obtained from the pricing service. Securities that use similar valuation techniques and inputs as described above are generally categorized as Level 2 within the fair value hierarchy.
Mortgage- and asset-backed securities are generally valued based upon evaluated or composite bid quotations obtained from pricing services selected by the Adviser. These securities are usually issued as separate tranches, or classes, of securities within each deal. The pricing models for these securities usually consider tranche-level attributes, current market data, estimated cash flows and market-based yield spreads for each tranche and incorporate deal collateral performance, as available. Mortgage- and asset-backed securities that use similar valuation techniques and inputs as described above are generally categorized as Level 2 within the fair value hierarchy.
Domestic and foreign equity securities, such as common stock, exchange-traded funds, rights, warrants, and preferred stock, that are traded on a securities exchange on a valuation date are generally valued at their last quoted sale price or official closing price on the primary exchange for such security, or, if no sales occurred on that day, at the last reported bid price. Equity securities traded over-the-counter (“OTC”) are generally valued at the last reported bid price. In the event of a major exchange closing during the trading day, the Adviser may use other market information obtained from quotation reporting systems, established market makers, or pricing services in valuing the securities. Valuation adjustments may be applied to certain foreign equity securities that are traded solely on foreign exchanges that close before the time as of which the Portfolio determines its NAV to account for the market
BHFTII-58
Brighthouse Funds Trust II
BlackRock Bond Income Portfolio
Notes to Financial Statements—December 31, 2023—(Continued)
movement between the close of the foreign exchanges and the time as of which the Portfolio determines its NAV. The Portfolio may use a systematic fair valuation model provided by a pricing service to value securities principally traded in these foreign markets to adjust for possible market movements or other changes that may occur between the close of the foreign exchanges and the time as of which the Portfolio determines its NAV. Foreign equity securities valued using these valuation adjustments are generally categorized as Level 2 within the fair value hierarchy. Equity securities that are actively traded, and have no valuation adjustments applied, are categorized as Level 1 within the fair value hierarchy. Other equity securities traded on inactive markets or valued in reference to similar instruments traded on active markets are generally categorized as Level 2 within the fair value hierarchy.
Investments in registered open-end management investment companies are valued at reported NAV per share on the valuation date and are categorized as Level 1 within the fair value hierarchy.
Foreign currency forward contracts are valued through a third-party pricing service by interpolating between forward and spot currency rates in the London foreign exchange markets as of a designated hour on a valuation day. These contracts are generally categorized as Level 2 within the fair value hierarchy.
Options, whether on securities, indices, futures contracts, or otherwise, traded on exchanges are valued at the last sale price available as of the close of business on a valuation day or, if there is no such price available, at the last reported bid price. These types of options are categorized as Level 1 within the fair value hierarchy. Futures contracts that are traded on commodity exchanges are valued at their settlement prices established by the exchanges on which they are traded as of the close of such exchanges and are categorized as Level 1 within the fair value hierarchy.
Options, including options on swaps (“swaptions”) and currencies, and synthetic futures contracts that are traded OTC are generally valued based upon interdealer bid and ask prices or prices provided by pricing service providers who use a series of techniques, including simulation pricing models, to determine the value of the contracts. The pricing models use inputs that are observed from actively quoted markets such as issuer details, indices, spreads, interest rates, yield curves, credit curves, measures of volatility and exchange rates. These contracts are generally categorized as Level 2 within the fair value hierarchy.
Swap contracts (other than centrally cleared swaps listed or traded on a multilateral or trade facility platform) are marked-to-market daily based on quotations and prices supplied by market makers, broker-dealers and other pricing services. Such quotations and prices are derived utilizing observable data, including the underlying reference securities or indices, credit spread quotations and expected default recovery rates determined by the pricing service. These contracts are generally categorized as Level 2 within the fair value hierarchy.
Centrally cleared swaps listed or traded on a multilateral or trade facility platform, such as a registered exchange, are valued at the daily settlement price determined by the respective exchange or a pricing service when the exchange price is not available. For centrally cleared credit default swaps, the clearing facility requires its members to provide actionable price levels across complete term structures. These levels along with external third-party prices are used to produce daily settlement prices. These securities are categorized as Level 2 within the fair value hierarchy. Centrally cleared interest rate swaps are valued using a pricing model that references the underlying rates, including, but not limited to, the overnight index swap rate, the respective interbank offered forward rate or other interest rates, yield curves or credit spreads to produce the daily settlement price. These securities are categorized as Level 2 within the fair value hierarchy.
If no current market quotation is readily available or market value quotations are deemed to be unreliable for an investment, the fair value of the investment will be determined in accordance with procedures. A market quotation is readily available only when that quotation is a quoted price (unadjusted) in active markets for identical investments that the Portfolio can access at the measurement date, provided that a quotation will not be readily available if it is not reliable.
Pursuant to Rule 2a-5 under the 1940 Act, the Board of Trustees (the “Board” or “Trustees” ) of the Trust has designated Brighthouse Investment Advisers, acting through its Valuation Committee (“Committee”), as the Portfolio’s “valuation designee” to perform the Portfolio’s fair value determinations. The Board oversees Brighthouse Investment Advisers in its role as the Valuation Designee and receives reports from Brighthouse Investment Advisers regarding its process and the valuation of the Portfolio’s investments to assist with such oversight.
No single standard for determining the fair value of an investment can be set forth because fair value depends upon the facts and circumstances with respect to each investment. Information relating to any relevant factors may be obtained by the Committee from any appropriate source, including the subadviser of the Portfolio, the Custodian, a pricing service, market maker and/or broker for such security or the issuer. Appropriate methodologies for determining fair value under particular circumstances may include: matrix pricing, a discounted cash flow analysis, comparisons of securities with comparable characteristics, value based on multiples of earnings, discount from market price of similar marketable securities, or a combination of these and other methods.
Foreign Currency Translation - The books and records of the Portfolio are maintained in U.S. dollars. The values of securities, currencies, and other assets and liabilities denominated in currencies other than the U.S. dollar are translated into U.S. dollars based
BHFTII-59
Brighthouse Funds Trust II
BlackRock Bond Income Portfolio
Notes to Financial Statements—December 31, 2023—(Continued)
upon foreign exchange rates prevailing at the end of the period. Purchases and sales of investment securities, income, and expenses are translated on the respective dates of such transactions. Because the values of investment securities are translated at the foreign exchange rates prevailing at the end of the period, that portion of the results of operations arising from changes in exchange rates and that portion of the results of operations reflecting fluctuations arising from changes in market prices of the investment securities are not separated. Such fluctuations are included in the net realized and unrealized gain or loss on investments.
Net realized foreign exchange gains or losses arise from activity in forward foreign currency exchange contracts, sales of foreign currency, currency gains or losses realized between the trade and settlement dates on securities transactions, and the difference between the amounts of dividends, interest, and foreign withholding taxes recorded by the Portfolio and the U.S. dollar-equivalent of the amounts actually received or paid by the Portfolio. Net unrealized foreign exchange gains and losses arise from changes in the value of assets and liabilities, other than investment securities, resulting from changes in foreign exchange rates.
Investment Transactions and Related Investment Income - Portfolio security transactions are recorded on the trade date. Dividend income is recorded on the ex-dividend date or, for certain foreign securities, when notified. Interest income, which includes amortization of premium and accretion of discount on debt securities, is recorded on the accrual basis. Realized gains and losses on investments are determined on the identified cost basis, which is the same basis used for federal income tax purposes. Foreign income and foreign capital gains on some foreign securities may be subject to foreign taxes, which are accrued as applicable. These foreign taxes have been provided for in accordance with the Portfolio’s understanding of the applicable countries’ tax rules and rates.
Dividends and Distributions to Shareholders - The Portfolio records dividends and distributions on the ex-dividend date. Net realized gains from securities transactions (if any) are generally distributed annually to shareholders. The timing and characterization of certain income and capital gains distributions are determined in accordance with federal tax regulations that may differ from GAAP. Permanent book and tax basis differences relating to shareholder distributions will result in reclassification between distributable earnings (accumulated losses) and paid in surplus. These adjustments have no impact on net assets or the results of operations.
Income Taxes - It is the Portfolio’s policy to comply with the requirements of the Internal Revenue Code of 1986, as amended, and regulations thereunder, applicable to regulated investment companies, and to distribute, with respect to each taxable year, all of its taxable income to shareholders. Therefore, no federal income tax provision is required. The Portfolio files U.S. federal tax returns. No income tax returns are currently under examination. The Portfolio’s federal tax returns remain subject to examination by the Internal Revenue Service for three fiscal years after the returns are filed. As of December 31, 2023, the Portfolio had no uncertain tax positions that would require financial statement recognition, derecognition or disclosure.
High-Yield Debt Securities - The Portfolio may invest in high-yield debt securities, or “junk bonds,” which are securities that are rated below “investment grade” or, if not rated, are of equivalent quality. A portfolio with high-yield debt securities generally will be exposed to greater market risk and credit risk than a portfolio that invests only in investment grade debt securities because issuers of high-yield debt securities are generally less secure financially, are more likely to default on their obligations, and their securities are more sensitive to interest rate changes and downturns in the economy. In addition, the secondary market for lower-rated debt securities may not be as liquid as that for more highly rated debt securities. As a result, the Portfolio’s subadviser may find it more difficult to value or sell lower-rated debt securities and may have to sell them at prices significantly lower than the values assigned to them by the Portfolio.
Floating Rate Loans - The Portfolio may invest in loans arranged through private negotiation between one or more financial institutions. The Portfolio’s investment in any such loan may be in the form of a participation in or an assignment of the loan. In connection with purchasing participations, the Portfolio generally will have no right to enforce compliance by the borrower with the terms of the loan agreement relating to the loan, nor any rights of set-off against the borrower. The purchase of assignments will typically result in the Portfolio having a direct contractual relationship with the borrower, and the Portfolio may enforce compliance by the borrower with the terms of the loan agreement. The Portfolio may not benefit directly from any collateral supporting the loan in which it has purchased the participation or assignment.
The Portfolio may invest in multiple series or tranches of a loan, which may have varying terms and carry different associated risks. When the Portfolio purchases assignments, it acquires direct rights against the borrower of the loan. These loans may include participations in bridge loans, which are loans taken out by borrowers for a short period (typically less than one year) pending arrangement of more permanent financing.
The Portfolio will assume the credit risk of both the borrower and the lender that is selling the participation. In the event of the insolvency of the lender selling the participation, the Portfolio may be treated as a general creditor of the lender and may not benefit from any set-off between the lender and the borrower.
Unfunded Loan Commitments - The Portfolio may enter into certain credit agreements, all or a portion of which may be unfunded. The Portfolio is obligated to fund these commitments at the borrower’s discretion. These commitments, if any, are disclosed in the Schedule of Investments. As of December 31, 2023, the Portfolio had open unfunded loan commitments of $1,171,829. At December 31, 2023, the Portfolio had sufficient cash and/or securities to cover these commitments.
BHFTII-60
Brighthouse Funds Trust II
BlackRock Bond Income Portfolio
Notes to Financial Statements—December 31, 2023—(Continued)
Inflation-Indexed Bonds - The Portfolio may invest in inflation-indexed bonds. Inflation-indexed bonds are fixed income securities whose principal value is periodically adjusted according to the rate of inflation. The interest rate on these bonds is generally fixed at issuance at a rate lower than typical bonds. Over the life of an inflation-indexed bond, however, interest will be paid based on a principal value that is adjusted for inflation. Any increase or decrease in the principal amount of an inflation-indexed bond will be included as interest income on the Statement of Operations, even though investors do not receive their principal until maturity. Repayment of the original bond principal upon maturity (as adjusted for inflation) is guaranteed in the case of U.S. Treasury Inflation-Protected Securities (“TIPS”). For bonds that do not provide a similar guarantee, the adjusted principal value of the bond repaid at maturity may be less than the original principal.
Collateralized Obligations - The Portfolio may invest in collateralized bond obligations (“CBOs”), collateralized loan obligations (“CLOs”), other collateralized debt obligations (“CDOs”), and other similarly structured securities. CDOs, CBOs and CLOs are types of asset-backed securities. A CBO is a trust that is backed by a diversified pool of high risk, below investment grade fixed-income securities. The collateral can be from many types of fixed-income securities such as high yield debt, residential privately issued mortgage-related securities, commercial privately issued mortgage-related securities, trust preferred securities and emerging market debt. A CLO is a trust typically collateralized by a pool of loans that may include, among others, domestic and foreign senior secured loans, senior unsecured loans, and subordinate corporate loans, including loans that may be rated below investment grade or equivalent unrated loans. Other CDOs are trusts backed by other types of assets representing obligations of various parties.
For CDOs, CBOs and CLOs, the cash flow from the trust is split into two or more portions, called tranches, varying in risk and yield. The riskiest portion is typically the “equity” or “first loss” tranche, which bears the bulk of defaults from the bonds or loans in the trust and serves to protect the other, more senior tranches from default in all but the most severe circumstances. Senior tranches are paid from the cash flows from the underlying assets before the junior tranches and equity tranches. Losses are first borne by the equity tranches, next by the junior tranches, and finally by the senior tranches. The risks of an investment in a CBO, CLO or other CDO depend largely on the quality and type of the collateral securities and the class of the instrument in which a Portfolio invests. If some debt instruments go into default and the cash collected by the CBO, CLO or CDO is insufficient to pay all of its investors, those in the lowest, most junior tranches suffer losses first. Since they are partially protected from defaults, senior tranches typically have higher ratings and lower potential yields than their underlying securities, and can be rated investment grade. Despite the protection from the equity tranche, more senior tranches can experience substantial losses due to actual defaults, increased sensitivity to defaults due to collateral default and disappearance of protecting tranches, market anticipation of defaults, as well as aversion to CBO, CLO or other CDO securities as a class.
Mortgage-Related and Other Asset-Backed Securities - The Portfolio may invest in mortgage-related or other asset-backed securities. These securities may include mortgage pass-through securities, collateralized mortgage obligations (“CMOs”), commercial mortgage-backed securities, CMO residuals, stripped mortgage-backed securities (“SMBS”), and other securities that directly or indirectly represent a participation in, or are secured by or payable from, mortgage loans on real property or other receivables. The value of some mortgage- or asset-backed securities may be particularly sensitive to changes in prevailing interest rates. Early repayment of principal on some mortgage-related securities may expose the Portfolio to a lower rate of return upon reinvestment of principal. The value of these securities may fluctuate in response to the market’s perception of the creditworthiness of the issuers. Additionally, although mortgages and mortgage-related securities are generally supported by some form of government or private guarantee and/or insurance, there is no assurance that private guarantors or insurers will meet their obligations.
In one type of SMBS, one class receives all of the interest from the mortgage assets (the interest-only or “IO” class), while the other class will receive all of the principal (the principal-only or “PO” class). Because principal will not be received at the maturity of an IO, adjustments are made to the book value of the security until maturity. These adjustments are netted against payments received for the IOs and the net amount is included in interest income on the Statement of Operations of the Portfolio. Payments received for POs are treated as reductions to the cost and par value of the securities. Details of mortgage-related and other asset-backed securities held by the Portfolio are included in the Portfolio’s Schedule of Investments.
The Portfolio may invest a significant portion of its assets in securities of issuers that hold mortgage- and asset-backed securities and direct investments in securities backed by commercial and residential mortgage loans and other financial assets. The value and related income of these securities are sensitive to changes in economic conditions, including delinquencies and/or defaults, and may be negatively impacted by increased volatility of market prices and periods of illiquidity.
Mortgage Dollar Rolls - The Portfolio may enter into mortgage “dollar rolls” in which a Portfolio sells to-be-announced (“TBA”) mortgage-backed securities for delivery in the current month and simultaneously contracts to repurchase substantially similar (same type, coupon, and maturity) securities on a specified future date. For the duration of the transaction, or roll period, the Portfolio foregoes principal (including prepayments of principal) and interest paid on the securities sold. Dollar rolls are accounted for as purchase and sale transactions; gain or loss is recognized at the commencement of the term of the dollar roll and each time the mortgage-backed security is rolled.
BHFTII-61
Brighthouse Funds Trust II
BlackRock Bond Income Portfolio
Notes to Financial Statements—December 31, 2023—(Continued)
Mortgage dollar roll transactions involve the risk that the market value of the securities that the Portfolio is required to repurchase or reacquire may be less than the agreed-upon repurchase price of those securities and that the investment performance of securities purchased with proceeds from these transactions does not exceed the income, capital appreciation, and gain or loss that would have been realized on the securities transferred or sold, as applicable, as part of the treasury or mortgage dollar roll.
TBA Purchase and Forward Sale Commitments - The Portfolio may enter into TBA commitments to purchase or sell securities for a fixed price at a future date. TBA commitments are considered securities in themselves, and involve a risk of loss if the value of the security to be purchased or sold declines or increases prior to the settlement date, which is in addition to the risk of decline in the value of the Portfolio’s other assets. TBA forward sale commitments are valued at the current market value of the underlying securities, according to the procedures described under “Investment Valuation and Fair Value Measurements”.
When-Issued and Delayed-Delivery Securities - The Portfolio may purchase securities on a when-issued or delayed-delivery basis. Settlement of such transactions will occur beyond the customary settlement period. The Portfolio may purchase securities under such conditions only with the intention of actually acquiring them, but may enter into a separate agreement to sell the securities before the settlement date. Since the value of securities purchased may fluctuate prior to settlement, the Portfolio may be required to pay more at settlement than the security is worth. In addition, the Portfolio is not entitled to any of the interest earned prior to settlement.
Repurchase Agreements - The Portfolio may enter into repurchase agreements, under the terms of a Master Repurchase Agreement (“MRA”), or Global Master Repurchase Agreement (“GMRA”), with selected commercial banks and broker-dealers, under which the Portfolio acquires securities as collateral and agrees to resell the securities at an agreed-upon time and at an agreed-upon price. The Portfolio, through the Custodian or a subcustodian, under a tri-party repurchase agreement, receives delivery of the underlying securities collateralizing any repurchase agreements. It is the Portfolio’s policy that the market value of the collateral be equal to at least 100% of the repurchase price in the case of a repurchase agreement of one-day duration and equal to at least 102% of the repurchase price in the case of all other repurchase agreements. In the event of default or failure by a party to perform an obligation in connection with any repurchase transaction, the MRA or GMRA gives the non-defaulting party the right to set-off claims and to apply property held by it in connection with any repurchase transaction against obligations owed to it under the agreement.
At December 31, 2023, the Portfolio had direct investments in repurchase agreements with a gross value of $68,079,147. Additionally, the Portfolio invested cash collateral for loans of portfolio securities in repurchase agreements with a gross value of $2,007,079. The combined value of all repurchase agreements is included as part of investments at value on the Statement of Assets and Liabilities. The value of the related collateral exceeded the value of the repurchase agreements at December 31, 2023.
Securities Lending - The Portfolio may lend its portfolio securities to certain qualified brokers who borrow securities in order to complete certain securities transactions. By lending its portfolio securities, the Portfolio attempts to increase its net investment income through the receipt of income on collateral held from securities on loan. Any gain or loss in the market price of the loaned securities that might occur, any interest earned, and any dividends declared during the term of the loan, would accrue to the account of the Portfolio.
The Trust has entered into a Non-Custodial Securities Lending Agreement with JPMorgan Chase Bank, N.A. (the “Lending Agent”). Under the agreement, the Lending Agent is authorized to loan portfolio securities on the Portfolio’s behalf. In exchange, the Portfolio generally receives cash, U.S. Government securities, letters of credit, or other collateral deemed appropriate by the Adviser. The Portfolio receives collateral equal to at least 102% of the market value for loans secured by government securities or cash in the same currency as the loaned shares and 105% for all other loaned securities at each loan’s inception. Collateral representing at least 100% of the market value of the loaned securities is maintained for the duration of the loan. Any cash collateral received by the Portfolio is generally invested by the Lending Agent in short-term investments, which may include certificates of deposit, commercial paper, repurchase agreements, including repurchase agreements with respect to equity securities, time deposits, master demand notes and money market funds. The market value of investments made with cash collateral received are disclosed in the Schedule of Investments and the valuation techniques are described in Note 2. The value of the securities on loan may change each business day. If the market value of the collateral at the close of trading on a business day is less than 100% of the market value of the loaned securities at the close of trading on that day, the borrower is required to deliver, by the close of business on the following business day, an additional amount of collateral, so that the total amount of posted collateral is equal to at least 100% of the market value of all the loaned securities as of such preceding day. A portion of the income earned on the collateral is rebated to the borrower of the securities and the remainder is split between the Lending Agent and the Portfolio. On loans collateralized by U.S. government securities, a fee is received from the borrower and is allocated between the Portfolio and the Lending Agent.
Income received by the Portfolio in securities lending transactions during the year ended December 31, 2023 is reflected as securities lending income on the Statement of Operations. The values of any securities loaned by the Portfolio and the related collateral at December 31, 2023 are disclosed in the footnotes to the Schedule of Investments. The value of the related collateral received by the Portfolio exceeded the value of the securities out on loan at December 31, 2023.
BHFTII-62
Brighthouse Funds Trust II
BlackRock Bond Income Portfolio
Notes to Financial Statements—December 31, 2023—(Continued)
The risks associated with lending portfolio securities include, but are not limited to, possible delays in receiving additional collateral or in the recovery of the loaned securities, possible loss of rights in the collateral should the borrower fail financially, as well as risk of loss in the value of the collateral or the value of the investments made with the collateral. To the extent the Portfolio uses cash collateral it receives to invest in repurchase agreements with respect to equity securities, it is subject to the risk of loss if the value of the equity securities declines and the counterparty defaults on its obligation to repurchase such securities. The Lending Agent shall indemnify the Portfolio in the case of default of any securities borrower, subject to the terms of the Non-Custodial Securities Lending Agreement.
The following table provides a breakdown of transactions accounted for as secured borrowings, the gross obligations by the type of collateral pledged, and the remaining contractual maturities of those transactions.
| Remaining Contractual Maturity of the Agreements As of December 31, 2023 |
||||||||||||||||||||
| Overnight and Continuous |
Up to 30 Days |
31 - 90 Days |
Greater than 90 days |
Total | ||||||||||||||||
| Securities Lending Transactions | ||||||||||||||||||||
| Common Stocks |
$ | (19,696 | ) | $ | — | $ | — | $ | — | $ | (19,696 | ) | ||||||||
| Corporate Bonds & Notes |
(5,137,383 | ) | — | — | — | (5,137,383 | ) | |||||||||||||
| Total Borrowings |
$ | (5,157,079 | ) | $ | — | $ | — | $ | — | $ | (5,157,079 | ) | ||||||||
| Gross amount of recognized liabilities for securities lending transactions |
|
$ | (5,157,079 | ) | ||||||||||||||||
|
|
|
|||||||||||||||||||
3. Investments in Derivative Instruments
Forward Foreign Currency Exchange Contracts - The Portfolio may enter into forward foreign currency exchange contracts to obtain investment exposure, enhance return or hedge or protect its portfolio holdings against the risk of future movements in certain foreign currency exchange rates. When entering into these contracts, the Portfolio agrees to buy or sell a fixed quantity of foreign currency for an agreed-upon price on an agreed-upon future date. These contracts are valued daily and the Portfolio’s net equity therein, representing unrealized gain or loss on the contracts as measured by the difference between the forward foreign exchange rates at the dates of entry into the contracts and the forward foreign exchange rates at the valuation date, is included in the Statement of Assets and Liabilities. When a contract is closed, the Portfolio recognizes a realized gain or loss equal to the difference between the value of the contract at the time it was opened and the value at the time it was closed.
Realized and unrealized gains and losses on forward foreign currency exchange contracts are included in the Statement of Operations. These contracts involve market and/or credit risk in excess of the amount recognized in the Statement of Assets and Liabilities. The use of forward foreign currency exchange contracts does not eliminate fluctuations in the underlying prices of the securities of the Portfolio, but it does establish a rate of exchange that can be achieved in the future. Although forward foreign currency exchange contracts may limit the risk of loss due to a decline in the value of the currency holdings, they also limit any potential gain that might result should the value of the currency increase. In addition, the Portfolio could be exposed to losses if the counterparties to the contracts are unable or unwilling to meet the terms of the contracts. The Portfolio may also experience losses even when such contracts are used for hedging purposes. The Portfolio’s maximum potential loss from such contracts is the aggregate face value in U.S. dollars at the time the contract was opened.
Futures Contracts - The Portfolio may buy and sell futures contracts as a hedge, to maintain investment exposure to a target asset class or to enhance return. The Portfolio may be subject to fluctuations in equity prices, interest rates, commodity prices, and foreign currency exchange rates in the normal course of pursuing its investment objective. Futures contracts are standardized agreements to buy or sell a security, or deliver a final cash settlement price in connection with an index, interest rate, currency, or other asset. The Portfolio must deposit an amount (“initial margin”) equal to a certain percentage of the face value of the futures contract. The initial margin may be in the form of cash or securities, which is returned when the Portfolio’s obligations under the contract have been satisfied. If cash is deposited as the initial margin, it is shown as cash collateral on the Statement of Assets and Liabilities. Futures contracts are marked-to-market daily and subsequent payments (“variation margin”) are made or received by the Portfolio depending on whether unrealized gains or losses are incurred. These amounts are reflected as receivables or payables on the Statement of Assets and Liabilities and as a component of net change in unrealized appreciation/depreciation on the Statement of Operations. When the contract is closed or expires, the Portfolio records a realized gain or loss equal to the difference between the value of the contract at the time it was opened and the value at the time it was closed. Risks of entering into futures contracts (and related options) include the possibility that the market for these instruments may be illiquid and that a change in the value of the futures contract or option may not correlate perfectly with changes in the value of the underlying asset. The exchange’s clearinghouse, as counterparty to all futures, guarantees the futures contracts against default.
Options Contracts -An option contract purchased by the Portfolio gives the Portfolio the right, but not the obligation, to buy (call) or sell (put) an underlying instrument at a fixed exercise price during a specified period or on a specified date. Call options written by the
BHFTII-63
Brighthouse Funds Trust II
BlackRock Bond Income Portfolio
Notes to Financial Statements—December 31, 2023—(Continued)
Portfolio give the holder the right to buy the underlying instrument from the Portfolio at a fixed exercise price; put options written by the Portfolio give the holder the right to sell the underlying instrument to the Portfolio at a fixed exercise price.
The Portfolio may use options to hedge against changes in values of securities the Portfolio owns or expects to purchase, to maintain investment exposure to a target asset class or to enhance return. When the Portfolio owns the underlying instrument, writing puts or buying calls tend to increase the Portfolio’s exposure to the underlying instrument and writing calls or buying puts tends to decrease the Portfolio’s exposure to the underlying instrument. Options can also be used to hedge other Portfolio investments. For options used to hedge the Portfolio’s investments, the potential risk to the Portfolio is that the change in value of options contracts may not correspond perfectly to the change in value of the hedged instruments. The Portfolio also bears the risk of an unfavorable change in the value of the underlying instrument or the risk that the Portfolio may not be able to enter into a closing transaction due to an illiquid market. The Portfolio’s maximum risk of loss from counterparty credit risk, as opposed to investment and other types of risk, in respect of purchased options is typically the premium initially paid for the option plus any unrealized gains.
The main risk associated with purchasing an option is that the option expires without being exercised. In this case, the option is worthless when it expires and the premium paid for the option is considered a realized loss. The risk associated with writing a call option on an underlying instrument that the Portfolio owns is that the Portfolio may forgo the opportunity for a profit if the market value of the underlying instrument increases and the option is exercised, requiring the Portfolio to sell the underlying instrument at a price below its market value. When the Portfolio writes a call option on a security it does not own, its exposure on such an option is theoretically unlimited. The risk in writing a put option is that the Portfolio may incur a loss if the market value of the underlying instrument decreases and the option is exercised, requiring the Portfolio to purchase the underlying instrument at a price above its market value. In addition, the Portfolio risks not being able to enter into a closing transaction for the written option as the result of an illiquid market for the option.
Purchases of put and call options are recorded as investments, the value of which are marked-to-market daily. When the Portfolio enters into a closing sale transaction, the Portfolio will realize a gain or loss depending on whether the sales proceeds from the closing sale transaction are greater or less than the premium initially paid for the option. When the Portfolio exercises a put option, it will realize a gain or loss from the sale of the underlying instrument and the proceeds from such sale will be decreased by the premium originally paid for the put option. When the Portfolio exercises a call option, the cost of the security which the Portfolio purchases upon exercise will be increased by the premium originally paid for the call option.
The premium received by the Portfolio for a written option is recorded as an asset and an equivalent liability. The liability is subsequently marked-to-market to reflect the current value of the option written. When a written option expires without being exercised or the Portfolio enters into a closing purchase transaction, the Portfolio realizes a gain (or loss if the cost of the closing purchase transaction exceeds the premium received when the option was sold) without regard to any unrealized gain or loss on the underlying instrument and the liability related to such option is eliminated. When a written call option is exercised, the Portfolio realizes a gain or loss, as adjusted for the premium received, from the sale of the underlying instrument. When a written put option is exercised, the premium received by the Portfolio is offset against the amount paid for the purchase of the underlying instrument.
An Option on Exchange-Traded Futures Contract (“Futures Option”) is an option contract in which the underlying instrument is a single futures contract.
Swaptions are similar to options on securities except that instead of selling or purchasing the right to buy or sell a security, the writer or purchaser of the swaptions is granting or buying the right to enter into a previously agreed upon interest rate or credit default swap agreement at any time before the expiration of the option.
Swap Agreements - The Portfolio may enter into swap agreements in which the Portfolio and a counterparty agree to either make periodic net payments on a specified notional amount or a net payment upon termination. Swap agreements are either privately negotiated in the OTC market (“OTC swaps”) or executed in a multilateral or other trade facility platform, such as a registered swap execution facility (“centrally cleared swaps”). The Portfolio may enter into swap agreements for the purposes of managing exposure to interest rate, credit or market risk, or for other purposes. In connection with these agreements, securities or cash may be paid or received, as applicable, by the Portfolio as collateral or margin in accordance with the terms of the respective swap agreements to provide assets of value and recourse in the event of default or bankruptcy/insolvency. Securities posted by the Portfolio as collateral for swap contracts are identified in the Schedule of Investments and restricted cash, if any, is reflected on the Statement of Assets and Liabilities.
Swap agreements are marked-to-market daily. The fair value of an OTC swap is reflected on the Statement of Assets and Liabilities. The changes in value, if any, are reflected as a component of net change in unrealized appreciation/depreciation on the Statement of Operations. Daily changes in valuation of centrally cleared swaps, if any, are recorded as a receivable or payable for variation margin on the Statement of Assets and Liabilities and as a component of unrealized appreciation/depreciation on the Statement of Operations. The Portfolio may pay or receive an upfront payment upon entering into a swap agreement. Upon termination or maturity of the swap, upfront premiums are recorded as realized gains or losses on the Statement of Operations. A liquidation payment received
BHFTII-64
Brighthouse Funds Trust II
BlackRock Bond Income Portfolio
Notes to Financial Statements—December 31, 2023—(Continued)
or made at the termination of the swap is recorded as realized gain or loss on the Statement of Operations. Net periodic payments received or paid by the Portfolio are included as part of realized gains or losses on the Statement of Operations.
Swap transactions involve, to varying degrees, elements of interest rate, credit, and market risk in excess of the amounts recognized in the Statement of Assets and Liabilities. Such risks include the possibility that there will be no liquid market for these agreements, that the counterparty to the agreements may default on its obligation to perform, or that there may be unfavorable changes in market conditions or interest rates. In addition, entering into swap agreements involves documentation risk resulting from the possibility that the parties to a swap agreement may disagree as to the meaning of contractual terms in the agreement. The Portfolio may enter into swap transactions with counterparties in accordance with guidelines established by the Board. These guidelines provide for a minimum credit rating for each counterparty and various credit enhancement techniques (for example, collateralization of amounts due from counterparties) to limit exposure to counterparties that have lower credit ratings. The Portfolio’s maximum risk of loss from counterparty credit risk is the discounted value of the net cash flows to be received from the counterparty over the contract’s remaining life, to the extent that amount is positive, or the fair value of the contract. The risk may be mitigated by having a master netting arrangement between the Portfolio and the counterparty and by the posting of collateral by the counterparty to cover the Portfolio’s exposure to the counterparty. Counterparty risk related to centrally cleared swaps is mitigated due to the protection against defaults provided by the clearinghouse. A party to a cleared swap is subject to the credit risk of the clearinghouse and the clearing member through which it holds its cleared position.
Centrally Cleared Swaps: Certain swaps are required to be (or are capable of being) cleared through a regulated clearinghouse. Since the Portfolio is not a member of a clearinghouse and only members of a clearinghouse (“clearing members” or “clearing brokers”) can participate directly in the clearinghouse, the Portfolio holds cleared swaps through accounts at a clearing member. The Portfolio typically will be required to post margin required by the clearinghouse and/or its clearing member; the margin required by a clearinghouse and/or clearing member may be greater than the margin the Portfolio would be required to post in an uncleared derivative transaction.
Credit Default Swaps: The Portfolio is subject to credit risk in the normal course of pursuing its investment objectives. The Portfolio may enter into credit default swaps to manage its exposure to the market or certain sectors of the market, to reduce its risk exposure to defaults of corporate and/or sovereign issuers, or to create exposure to corporate and/or sovereign issuers to which it is not otherwise exposed. Credit default swaps involve one party making a stream of payments (referred to as the buyer of protection) to another party (referred to as the seller of protection) in exchange for the right to receive a specified return if a credit event occurs for the referenced entity, obligation or index. A credit event is defined under the terms of each swap agreement and may include, but is not limited to, underlying entity default, bankruptcy, write-down, principal shortfall or interest shortfall. As the seller of protection, if an underlying credit event occurs, the Portfolio will either pay the buyer an amount equal to the notional amount of the swap and take delivery of the referenced obligation (or underlying security comprising the relevant component of the referenced index), or pay a net settlement amount in the form of cash or securities equal to the notional amount of the swap less the recovery value of the referenced obligation (or underlying security comprising the relevant component of the referenced index). In return, the Portfolio would receive from the counterparty an upfront or periodic stream of payments throughout the life of the credit default swap agreement provided that no credit event has occurred. As the seller of protection, the Portfolio will effectively add leverage to its portfolio because, in addition to its total net assets, the Portfolio would be subject to investment exposure on the notional amount of the credit default swap.
The Portfolio may also purchase credit default swap contracts in order to hedge against the risk of default of debt securities held in its portfolio. This would involve the risk that the investment may be worthless when it expires and would only generate income in the event of an actual default by the issuer of the underlying obligation (as opposed to a credit downgrade or other indication of financial instability). It would also involve credit risk, whereby the seller may fail to satisfy its payment obligations to the Portfolio in the event of a default. As the buyer of protection, if an underlying credit event occurs, the Portfolio will either receive from the seller of protection an amount equal to the notional amount of the swap and deliver the referenced obligation (or underlying security comprising the relevant component of the referenced index), or receive a net settlement amount in the form of cash or securities equal to the notional amount of the swap less the recovery value of the referenced obligation (or underlying security comprising the relevant component of the referenced index). If no credit event occurs and the Portfolio is a buyer of protection, the Portfolio will typically recover nothing under the credit default swap agreement, but it will have had to pay the required upfront payment or stream of continuing payments under the credit default swap agreement. Recovery values are at times established through the credit event auction process in which market participants are ensured that a transparent price has been set for the defaulted obligation.
Credit default swap agreements on credit indices involve one party making a stream of payments to another party in exchange for the right to receive a specified return in the event of a write-down, principal shortfall, interest shortfall or default of all or part of the referenced entities comprising the credit index. A credit index is a basket of credit instruments or exposures designed to be representative of some part of the credit market as a whole. An index credit default swap references all the names in the index, and if there is a credit event involving an entity in the index, the credit event is settled based on that entity’s weight in the index. A Portfolio may use credit default swaps on credit indices as a hedge for credit default swaps or bonds held in the portfolio, which is less
BHFTII-65
Brighthouse Funds Trust II
BlackRock Bond Income Portfolio
Notes to Financial Statements—December 31, 2023—(Continued)
expensive than it would be to buy many individual credit default swaps to achieve similar effect. Credit default swaps on indices are benchmarks for protecting investors owning bonds against default, and may be used to speculate on changes in credit quality.
Implied credit spreads, represented in absolute terms, utilized in determining the market value of credit default swap agreements on a credit index or corporate or sovereign issuer, serve as some indication of the status of the payment/performance risk and the likelihood or risk of default for the credit derivative. The implied credit spread of a particular referenced entity or index also reflects the cost of buying/selling protection and may reflect upfront payments required to be made to enter into the agreement. Wider credit spreads generally represent a deterioration of the referenced entity’s credit soundness and a greater likelihood or risk of default or other credit event occurring as defined under the terms of the particular swap agreement. When no implied credit spread is available for a credit default swap, the current unrealized appreciation/depreciation on the position may be used as an indicator of the current status of the payment/performance risk.
The maximum potential amount of future payments (undiscounted) that the Portfolio as a seller of protection could be required to make under a credit default swap agreement equals the notional amount of the agreement. Notional amounts of all credit default swap agreements outstanding as of December 31, 2023, for which the Portfolio is the seller of protection, are disclosed in the Schedule of Investments. These potential amounts would be partially offset by any recovery values of the respective referenced obligations, upfront payments received upon entering into the agreement or net amounts received from the settlement of buy protection credit default swap agreements entered into by the Portfolio for the same referenced entity or entities.
Interest Rate Swaps: The Portfolio may enter into interest rate swaps to manage its exposure to interest rates, to adjust its interest rate sensitivity (duration), to preserve a return or spread on a particular investment, or otherwise as a substitute for a direct investment in debt securities. The Portfolio is subject to interest rate risk exposure in the normal course of pursuing its investment objectives. Because the Portfolio holds fixed rate bonds, the value of these bonds may decrease if interest rates rise. To help hedge against this risk and to maintain its ability to generate income at prevailing market rates, the Portfolio may enter into interest rate swap agreements. Interest rate swaps are agreements in which one party pays a stream of interest payments, either fixed or floating rate, for another party’s stream of interest payments, either fixed or floating, on the same notional amount for a specified period of time. Other forms of interest rate swap agreements may include: (1) interest rate caps, under which, in return for a premium, one party agrees to make payments to the other to the extent that interest rates exceed a specified rate, or “cap”; (2) interest rate floors, under which, in return for a premium, one party agrees to make payments to the other to the extent that interest rates fall below a specified rate, or “floor”; (3) interest rate collars, under which a party sells a cap and purchases a floor or vice versa in an attempt to protect itself against interest rate movements exceeding given minimum or maximum levels; and (4) basis swaps, under which two parties can exchange variable interest rates based on different segments of money market reference rates. The Portfolio’s maximum risk of loss from counterparty credit risk, as opposed to investment and other types of risk, in respect of interest rate swaps is typically the discounted net value of the cash flows to be received from the counterparty over the contract’s remaining life, to the extent that amount is positive.
Total Return Swaps: The Portfolio may enter into total return swap agreements to obtain exposure to a security or market without owning such security or investing directly in that market or to transfer the risk/return of one market (e.g., fixed income) to another market (e.g., equity) (equity risk and/or interest rate risk). Total return swaps are agreements in which one party agrees to make periodic payments to another party based on the change in market value of the assets underlying the contract, which may include a specified security, basket of securities or securities indices during the specific period, in return for periodic payments based on a fixed or floating rate or the total return from other underlying assets. When the Portfolio pays interest in exchange for the total return of an underlying asset and the value of the underlying asset decreases, the Portfolio may be required to pay the change in value to the counterparty in addition to the interest payment; conversely, when the Portfolio receives interest in exchange for the total return of an underlying asset and the value of the underlying asset decreases, the Portfolio may receive the change in value in addition to the interest payment. To the extent the total return of the instrument or index underlying the transaction exceeds or falls short of the offsetting interest rate obligation, the Portfolio will receive a payment from or make a payment to the counterparty. Total return swaps can also be structured without an interest payment, so that one party pays the other party if the value of the underlying asset increases and receives payment from the other party if the value of the underlying asset decreases.
Currency Swaps: The Portfolio may enter into currency swap agreements to gain or mitigate exposure to currency risk. A currency swap is an agreement to exchange cash flows on a notional amount of two or more currencies based on the relative value differential among them. Such swaps may involve initial and final exchanges that correspond to the agreed upon notional amount. Currency swaps usually involve the delivery of the entire principal value of one designated currency in exchange for the other designated currency. Therefore, the entire principal value of a currency swap is subject to the risk that the other party to the swap will default on its contractual delivery obligations. If there is a default by the counterparty, the Portfolio may have contractual remedies pursuant to the agreements related to the transaction.
BHFTII-66
Brighthouse Funds Trust II
BlackRock Bond Income Portfolio
Notes to Financial Statements—December 31, 2023—(Continued)
The following table summarizes the fair value of derivatives held by the Portfolio at December 31, 2023 by category of risk exposure:
| Asset Derivatives |
Liability Derivatives |
|||||||||||
| Risk Exposure |
Statement of Assets & |
Fair Value | Statement of Assets & |
Fair Value | ||||||||
| Interest Rate |
Investments at market value (a) (b) | $ | 3,538,685 | |||||||||
| OTC swap contracts at market value (c) | 153,274 | OTC swap contracts at market value (c) | $ | 28,757 | ||||||||
| Unrealized appreciation on centrally cleared swap contracts (d) (e) | 2,056,560 | Unrealized depreciation on centrally cleared swap contracts (d) (e) | 1,803,417 | |||||||||
| Unrealized appreciation on futures contracts (e) (f) | 5,739,368 | Unrealized depreciation on futures contracts (e) (f) | 5,441,106 | |||||||||
| Written options at value (g) | 10,352,254 | |||||||||||
| Credit |
OTC swap contracts at market value (c) | 179,434 | OTC swap contracts at market value (c) | 621,451 | ||||||||
| Unrealized appreciation on centrally cleared swap contracts (d) (e) | 414,585 | Unrealized depreciation on centrally cleared swap contracts (d) (e) | 581,246 | |||||||||
| Equity |
Unrealized appreciation on futures contracts (e) (f) | 30,403 | Unrealized depreciation on futures contracts (e) (f) | 219,799 | ||||||||
| Foreign Exchange | Investments at market value (a) | 39,552 | ||||||||||
| Unrealized appreciation on forward foreign currency exchange contracts | 793,766 | Unrealized depreciation on forward foreign currency exchange contracts |
1,249,706 | |||||||||
| Written options at value | 2,486 | |||||||||||
|
|
|
|
|
|||||||||
| Total | $ | 12,945,627 | $ | 20,300,222 | ||||||||
|
|
|
|
|
|||||||||
| (a) | Represents purchased options which are part of investments at value as shown in the Statement of Assets and Liabilities. | |||
| (b) | Includes exchange-traded options with a value of $1,142,188 that are not subject to a master netting agreements. | |||
| (c) | Excludes OTC swap interest receivable of $841 and OTC swap interest payable of $12,852. | |||
| (d) | Represents the unrealized appreciation/depreciation of centrally cleared swaps as reported in the Schedule of Investments. Only the variation margin is reported within the Statement of Assets and Liabilities. | |||
| (e) | Financial instrument not subject to a master netting agreement. | |||
| (f) | Includes cumulative appreciation/depreciation of futures contracts as reported in the Schedule of Investments. Only the current day’s variation margin is reported within the Statement of Assets and Liabilities. | |||
| (g) | Includes exchange-traded options with a value of $1,175,625 that are not subject to a master netting agreements. | |||
The Portfolio is required to disclose the impact of offsetting assets and liabilities represented in the Statement of Assets and Liabilities to enable users of the financial statements to evaluate the effect or potential effect of netting arrangements on its financial position for recognized assets and liabilities.
The following table presents the Portfolio’s derivative assets by counterparty net of amounts available for offset under a master netting agreement (“MNA”) (see Note 4), or similar agreement, and net of the related collateral received by the Portfolio as of December 31, 2023.
| Counterparty |
Derivative Assets subject to an MNA by Counterparty |
Financial Instruments available for offset |
Collateral Received† |
Net Amount* |
||||||||||||
| Bank of America NA |
$ | 43,272 | $ | (43,272 | ) | $ | — | $ | — | |||||||
| Barclays Bank PLC |
151,453 | (151,453 | ) | — | — | |||||||||||
| BNP Paribas SA |
89,480 | (89,480 | ) | — | — | |||||||||||
| Citibank NA |
2,494,447 | (2,494,447 | ) | — | — | |||||||||||
| Deutsche Bank AG |
13,878 | (13,878 | ) | — | — | |||||||||||
| Goldman Sachs International |
119,683 | (119,683 | ) | — | — | |||||||||||
| HSBC Bank PLC |
8,718 | (5,610 | ) | (3,108 | ) | — | ||||||||||
| JPMorgan Chase Bank NA |
351,419 | (299,097 | ) | — | 52,322 | |||||||||||
| Morgan Stanley & Co. International PLC |
94,103 | (94,103 | ) | — | — | |||||||||||
| Standard Chartered Bank |
2,666 | (2,666 | ) | — | — | |||||||||||
| Toronto Dominion Bank |
45,844 | (6,127 | ) | — | 39,717 | |||||||||||
| UBS AG |
147,560 | (147,560 | ) | — | — | |||||||||||
|
|
|
|
|
|
|
|
|
|||||||||
| $ | 3,562,523 | $ | (3,467,376 | ) | $ | (3,108 | ) | $ | 92,039 | |||||||
|
|
|
|
|
|
|
|
|
|||||||||
BHFTII-67
Brighthouse Funds Trust II
BlackRock Bond Income Portfolio
Notes to Financial Statements—December 31, 2023—(Continued)
The following table presents the Portfolio’s derivative liabilities by counterparty net of amounts available for offset under an MNA, or similar agreement, and net of the related collateral pledged by the Portfolio as of December 31, 2023.
| Counterparty |
Derivative Liabilities subject to an MNA by Counterparty |
Financial Instruments available for offset |
Collateral Pledged† |
Net Amount** |
||||||||||||
| Bank of America NA |
$ | 238,347 | $ | (43,272 | ) | $ | (195,075 | ) | $ | — | ||||||
| Bank of New York Mellon |
7,153 | — | — | 7,153 | ||||||||||||
| Barclays Bank PLC |
1,701,940 | (151,453 | ) | (1,550,487 | ) | — | ||||||||||
| BNP Paribas SA |
220,245 | (89,480 | ) | (65,962 | ) | 64,803 | ||||||||||
| Canadian Imperial Bank of Commerce |
14,119 | — | — | 14,119 | ||||||||||||
| Citibank NA |
5,239,060 | (2,494,447 | ) | (2,744,613 | ) | — | ||||||||||
| Deutsche Bank AG |
2,004,052 | (13,878 | ) | (1,990,174 | ) | — | ||||||||||
| Goldman Sachs International |
267,446 | (119,683 | ) | (147,763 | ) | — | ||||||||||
| HSBC Bank PLC |
5,610 | (5,610 | ) | — | — | |||||||||||
| JPMorgan Chase Bank NA |
299,097 | (299,097 | ) | — | — | |||||||||||
| Morgan Stanley & Co. International PLC |
832,492 | (94,103 | ) | (738,389 | ) | — | ||||||||||
| Standard Chartered Bank |
22,796 | (2,666 | ) | — | 20,130 | |||||||||||
| State Street Bank and Trust |
50,306 | — | — | 50,306 | ||||||||||||
| Toronto Dominion Bank |
6,127 | (6,127 | ) | — | — | |||||||||||
| UBS AG |
170,239 | (147,560 | ) | (9,821 | ) | 12,858 | ||||||||||
|
|
|
|
|
|
|
|
|
|||||||||
| $ | 11,079,029 | $ | (3,467,376 | ) | $ | (7,442,284 | ) | $ | 169,369 | |||||||
|
|
|
|
|
|
|
|
|
|||||||||
| * | Net amount represents the net amount receivable from the counterparty in the event of default. | |||
| ** | Net amount represents the net amount payable due to the counterparty in the event of default. | |||
| † | In some instances, the actual collateral received and/or pledged may be more than the amount shown here due to overcollateralization. | |||
The following tables summarize the effect of derivative instruments on the Statement of Operations, classified by derivative type and category of risk exposure, for the year ended December 31, 2023:
| Statement of Operations Location—Net |
Interest Rate | Credit | Equity | Foreign Exchange |
Total | |||||||||||||||
| Purchased options |
$ | (1,853,973 | ) | $ | — | $ | (216,847 | ) | $ | (1,518,563 | ) | $ | (3,589,383 | ) | ||||||
| Forward foreign currency transactions |
— | — | — | (1,578,257 | ) | (1,578,257 | ) | |||||||||||||
| Swap contracts |
(1,582,951 | ) | (591,509 | ) | (38,999 | ) | — | (2,213,459 | ) | |||||||||||
| Futures contracts |
5,541,754 | — | (1,598,122 | ) | — | 3,943,632 | ||||||||||||||
| Written options |
(2,977,305 | ) | — | 72,612 | 386,012 | (2,518,681 | ) | |||||||||||||
|
|
|
|
|
|
|
|
|
|
|
|||||||||||
| $ | (872,475 | ) | $ | (591,509 | ) | $ | (1,781,356 | ) | $ | (2,710,808 | ) | $ | (5,956,148 | ) | ||||||
|
|
|
|
|
|
|
|
|
|
|
|||||||||||
| Statement of Operations Location—Net |
Interest Rate | Credit | Equity | Foreign Exchange |
Total | |||||||||||||||
| Purchased options |
$ | (2,550,516 | ) | $ | — | $ | — | $ | 40,595 | $ | (2,509,921 | ) | ||||||||
| Forward foreign currency transactions |
— | — | — | (479,208 | ) | (479,208 | ) | |||||||||||||
| Swap contracts |
(2,719,974 | ) | (47,162 | ) | — | — | (2,767,136 | ) | ||||||||||||
| Futures contracts |
(915,392 | ) | — | (536,409 | ) | — | (1,451,801 | ) | ||||||||||||
| Written options |
4,827,346 | — | — | (8,756 | ) | 4,818,590 | ||||||||||||||
|
|
|
|
|
|
|
|
|
|
|
|||||||||||
| $ | (1,358,536 | ) | $ | (47,162 | ) | $ | (536,409 | ) | $ | (447,369 | ) | $ | (2,389,476 | ) | ||||||
|
|
|
|
|
|
|
|
|
|
|
|||||||||||
For the year ended December 31, 2023, the average notional par or face amount outstanding for each derivative type was as follows:
| Derivative Description |
Average Notional Par or Face Amount‡ |
|||
| Purchased options |
$ | 858,575,724 | ||
| Forward foreign currency transactions |
74,079,003 | |||
| Futures contracts long |
628,219,548 | |||
| Futures contracts short |
(427,926,435 | ) | ||
| Swap contracts |
340,549,559 | |||
| Written options |
(1,061,674,340 | ) | ||
| ‡ | Averages are based on activity levels during the period for which the amounts are outstanding. | |||
BHFTII-68
Brighthouse Funds Trust II
BlackRock Bond Income Portfolio
Notes to Financial Statements—December 31, 2023—(Continued)
4. Certain Risks
In the normal course of business, the Portfolio invests in securities and enters into transactions where risks exist. Those risks include:
Market Risk: The value of securities held by the Portfolio may decline in response to certain events, including those directly involving the issuers whose securities are owned by the Portfolio; conditions affecting the general economy; overall market changes; local, regional or global political, social or economic instability; currency, interest rate, and price fluctuations, or other factors including terrorism, war, natural disasters and the spread of infectious illness including epidemics or pandemics such as the COVID-19 pandemic. These events may also adversely affect the liquidity of securities held by the Portfolio.
Credit and Counterparty Risk: The Portfolio may be exposed to counterparty risk, or the risk that an entity with which the Portfolio has unsettled or open transactions may default. The potential loss could exceed the value of the financial assets and liabilities recorded in the financial statements. Financial assets that potentially expose the Portfolio to credit and counterparty risk consist principally of cash due from counterparties and investments. The Portfolio manages counterparty risk by entering into agreements only with counterparties that it believes have the financial resources to honor their obligations and by monitoring the financial stability of those counterparties. The Subadviser may attempt to mitigate counterparty risk by (i) periodically assessing the creditworthiness of its trading partners, (ii) monitoring and/or limiting the amount of its net exposure to each individual counterparty based on its assessment, and (iii) requiring collateral from the counterparty for certain transactions. In order to preserve certain safeguards for non-standard settlement trades, the Portfolio restricts its exposure to credit and counterparty losses by entering into master netting agreements (“Master Agreements”) with counterparties (approved brokers) with whom it undertakes a significant volume of transactions. Master Agreements govern the terms of certain transactions and reduce the counterparty risk associated with relevant transactions by specifying credit protection mechanisms and providing standardization that improves legal certainty. Master Agreements can also help limit counterparty risk by specifying collateral posting arrangements at pre-arranged exposure levels. Collateral requirements may differ by type of derivative or investment, as applicable. Collateral or margin requirements are set by the broker or exchange clearinghouse for exchange-traded derivatives (e.g., futures contracts and exchange-traded options), while collateral terms are contract specific for OTC traded derivatives (e.g., forward foreign currency exchange contracts, swap agreements and OTC options).
For derivatives traded under an International Swaps and Derivatives Association, Inc. Master Agreement (“ISDA Master Agreement”) or similar master agreement, the collateral requirements are netted across all transactions traded under such agreement and one amount is posted from one party to the other to collateralize such obligations. The ISDA Master Agreement gives each party to the agreement the right to terminate all transactions traded under such agreement if there is a certain deterioration in the credit quality of the other party. The ISDA Master Agreement gives the Portfolio the right, upon an event of default by the applicable counterparty or a termination of the agreement, to close out all transactions traded under such agreement and to net amounts owed under each transaction to one net amount payable by one party to the other. This right to close out and net payments across all transactions traded under the ISDA Master Agreement could result in a reduction of the Portfolio’s credit risk to such counterparty equal to any amounts payable by the Portfolio under the applicable transactions, if any. However, absent an event of default by the counterparty or a termination of the agreement, the ISDA Master Agreement does not result in an offset of reported amounts of assets and liabilities in the Statement of Assets and Liabilities across transactions between the Portfolio and the applicable counterparty. The enforceability of the right to offset may vary by jurisdiction. Cash collateral that has been pledged to cover obligations of the Portfolio under derivative contracts, if any, will be reported separately in the Statement of Assets and Liabilities. Securities pledged as collateral, if any, for the same purpose are noted in the Schedule of Investments.
Repurchase and reverse repurchase agreements are primarily executed under GMRAs or MRAs, which provide the right to set-off. Each repurchase and reverse repurchase agreement is initially collateralized at the transaction level. In the event of default, the total market value exposure will be offset against collateral exchanged to date, which would result in a net receivable/(payable) that would be due from/to the counterparty.
Master Securities Forward Transaction Agreements (“MSFTA”) govern the considerations and factors surrounding the settlement of certain forward settling transactions, such as TBA securities and delayed-delivery or secured borrowings transactions by and between the Portfolio and select counterparties. The MSFTA maintains provisions for, among other things, initiation and confirmation, payment and transfer, events of default, termination, and maintenance of collateral.
Customer Account Agreements and related addenda govern cleared derivatives transactions such as futures, options on futures, and cleared OTC derivatives. Cleared derivative transactions require posting of initial margin as determined by each relevant clearinghouse. The Portfolio’s clearing broker may also require additional initial margin. Clearinghouse-related initial margin is held by the clearinghouse and additional initial margin is held by the Portfolio’s clearing broker. In a cleared derivative transaction, the Portfolio’s counterparty is a clearinghouse rather than a bank or broker. The clearinghouse stands between the buyer and the seller of the contract; therefore, credit risk is limited to failure of or default by the clearinghouse. While offset rights may exist under applicable law, the Portfolio does not have a contractual right of offset against a clearing broker or clearinghouse in the event of a default (including the bankruptcy or insolvency). Additionally, credit risk exists in cleared derivative transactions with respect to initial and
BHFTII-69
Brighthouse Funds Trust II
BlackRock Bond Income Portfolio
Notes to Financial Statements—December 31, 2023—(Continued)
variation margin that is held in a clearing broker’s customer accounts. While clearing brokers are required to segregate, by account class, customer margin from their own assets, in the event that a clearing broker becomes insolvent or goes into bankruptcy and at that time there is a shortfall in the aggregate amount of margin held by the clearing broker for all its clients, typically the shortfall would be allocated on a pro-rata basis across all the clearing broker’s customers, for the relevant account class, potentially resulting in losses to the Portfolio. Variation margin, which accounts for changes in market value, is exchanged daily, but may not be netted between futures and cleared OTC derivatives.
Foreign Investment Risk: The investments by the Portfolio in foreign securities, whether direct or indirect, involve risks not present in domestic investments. Because securities may be denominated in foreign currencies, may require settlement in foreign currencies and may pay interest or dividends in foreign currencies, changes in the relationship of these foreign currencies to the U.S. dollar can significantly affect the value of the investments and earnings of the Portfolio. Foreign investments may also subject the Portfolio to foreign government exchange restrictions, expropriation, taxation, unexpected market closures or other political, social or economic developments, such as the imposition of economic sanctions against one or more countries, organizations, entities and/or individuals, all of which could affect the market and/or credit risk of the investments. In addition to the risks described above, risks may arise from forward foreign currency contracts with respect to the potential inability of counterparties to meet the terms of their contracts.
LIBOR Replacement Risk: LIBOR was the offered rate at which major international banks could obtain wholesale, unsecured funding. The terms of investments, financings or other transactions (including certain derivatives transactions) to which the Portfolio may be a party have historically been tied to LIBOR. In connection with the global transition away from LIBOR led by regulators and market participants, LIBOR was last published on a representative basis at the end of June 2023. The United Kingdom’s Financial Conduct Authority, which regulates LIBOR, has ceased publishing all LIBOR settings, but some USD LIBOR settings will continue to be published under a synthetic methodology until September 30, 2024 for certain legacy contracts. Alternative reference rates to LIBOR have been established in most major currencies (e.g., the Secured Overnight Financing Rate for U.S. dollar LIBOR and the Sterling Overnight Index Average for GBP LIBOR) and the transition to new reference rates continues. The full impact of the transition on the Portfolio, the financial instruments in which the Portfolio invests and financial markets more generally cannot yet be fully determined.
Additional risks associated with each type of investment are described above within the respective security type notes. The Portfolio’s prospectus includes a discussion of the principal risks of investing in the Portfolio.
5. Investment Transactions
Aggregate cost of purchases and proceeds of sales of investment securities, including mortgage dollar roll and TBA transactions but excluding short-term securities, for the year ended December 31, 2023 were as follows:
| Purchases |
Sales | |||||||||||
| U.S. Government |
Non-U.S. Government | U.S. Government | Non-U.S. Government | |||||||||
| $10,772,610,714 | $ | 1,814,031,303 | $ | 10,438,574,657 | $ | 1,873,961,398 | ||||||
Purchases and sales of mortgage dollar rolls and TBA transactions for the year ended December 31, 2023 were as follows:
| Purchases |
Sales | |||
| $9,025,999,000 | $ | 8,938,691,007 | ||
6. Investment Management Fees and Other Transactions with Affiliates
Investment Management Agreement - Brighthouse Investment Advisers is the investment adviser to the Portfolio. The Trust has entered into an investment management agreement with Brighthouse Investment Advisers with respect to the Portfolio. For providing investment management services to the Portfolio, Brighthouse Investment Advisers receives monthly compensation at the following annual rates:
| Management |
% per annum | Average Daily Net Assets | ||||
| $9,921,521 | 0.400 | % | Of the first $1 billion | |||
| 0.350 | % | Of the next $1 billion | ||||
| 0.300 | % | Of the next $1 billion | ||||
| 0.250 | % | On amounts in excess of $3 billion | ||||
BHFTII-70
Brighthouse Funds Trust II
BlackRock Bond Income Portfolio
Notes to Financial Statements—December 31, 2023—(Continued)
Brighthouse Investment Advisers has entered into an investment subadvisory agreement with respect to managing the Portfolio. BlackRock Advisors, LLC is compensated by Brighthouse Investment Advisers to provide subadvisory services for the Portfolio.
Management Fee Waivers - Pursuant to a management fee waiver agreement, the Adviser has agreed, for the period May 1, 2023 to April 30, 2024, to reduce its advisory fees set out above under “Investment Management Agreement” for each class of the Portfolio as follows:
| % per annum reduction |
Average Daily Net Assets | |||
| 0.030% | Of the first $ | 1 billion | ||
| 0.025% | Of the next $ | 1 billion | ||
Any reductions in total advisory fees paid by the Portfolio due to these waivers may be reduced or eliminated by changes in the advisory fee structure at higher asset levels. Brighthouse Investment Advisers will receive advisory fees equal to 0.325% of the Portfolio’s average daily net assets for amounts over $2 billion but less than $3 billion (0.025% over the contractual advisory fee rate) and 0.325% for amounts over $3 billion but less than $3.4 billion (0.075% over the contractual advisory fee rate). As a result, the dollar amount of the waiver will be reduced as assets grow beyond $2 billion up to $3.4 billion, but the advisory fee net of waivers will never exceed the contractual dollar amount that would otherwise be payable under the advisory fee.
An identical agreement was in place for the period April 29, 2022 to April 30, 2023. Amounts waived for the year ended December 31, 2023 are shown as a management fee waiver in the Statement of Operations.
Certain officers and trustees of the Trust may also be officers of the Adviser; however, such officers and trustees receive no compensation from the Trust.
Transfer Agency Agreement - Brighthouse Life Insurance Company serves as the transfer agent for the Trust. Brighthouse Life Insurance Company receives no fees for its services to the Trust.
Distribution and Service Fees - The Trust has a distribution agreement with Brighthouse Securities, LLC (the “Distributor”) pursuant to which the Distributor serves as the general distributor of shares of each class (each a “Class”) of each Portfolio. The Distributor is an affiliate of the Trust. The Trust has adopted a Distribution and Services Plan (the “D&S Plan”) relating to Class B, Class D, Class E, Class F and Class G shares of each Portfolio, under Rule 12b-1 under the 1940 Act, pursuant to which the Trust may pay the Distributor a fee (the “Service Fee”) at an annual rate not to exceed 0.25% of each such Portfolio’s average daily net assets attributable to the Class B, Class D, Class E, Class F and Class G shares of the Trust. Each Portfolio may not offer shares of each Class. The D&S Plan also authorizes the Trust, on behalf of each of its Portfolios, to pay to the Distributor a distribution fee (the “Distribution Fee” and together with the Service Fee, the “Fees”) at an annual rate of up to 0.25% of each Portfolio’s average daily net assets attributable to the Class B, Class D, Class E, Class F, and Class G shares in consideration of the services rendered in connection with the sale of such shares by the Distributor. Under the Distribution Agreement with respect to the Trust, Fees are currently paid at an annual rate of 0.25% of average daily net assets in the case of Class B shares, 0.10% of average daily net assets in the case of Class D shares, 0.15% of average daily net assets in the case of Class E shares, 0.20% of average daily net assets in the case of Class F shares and 0.30% of average daily net assets in the case of Class G shares. The D&S Plan is known as a “compensation plan” because the Trust makes payments to the Distributor for services rendered regardless of the actual level of expenditures by the Distributor. Amounts incurred by the Portfolio for the year ended December 31, 2023 are shown as Distribution and service fees in the Statement of Operations.
Deferred Trustee Compensation - Each Trustee who is not currently an employee of the Adviser or any of its affiliates receives compensation from the Trust for his or her service to the Trust. A deferred compensation plan (the “Plan”) is available to the Trustees on a voluntary basis. Deferred amounts remain in the Trust until distributed in accordance with the provisions of the Plan. The value of a participating Trustee’s deferral account is based on theoretical investments of deferred amounts on the normal payment dates in certain portfolios of the Trust or Brighthouse Funds Trust I, an affiliate of the Trust, as designated by the participating Trustee. Changes in the value of participants’ deferral accounts are reflected as a component of Trustees’ fees and expenses in the Statement of Operations. The portion of the accrued obligations allocated to the Portfolio under the Plan is reflected as Deferred trustees’ fees in the Statement of Assets and Liabilities.
7. Contractual Obligations
Under the Trust’s organizational documents, its officers and Trustees may be indemnified against certain liabilities and expenses arising out of the performance of their duties to the Trust. Additionally, the Trust has a variety of indemnification obligations under contracts with its service providers. The Trust’s maximum exposure under these arrangements is unknown, as this would involve future claims that may be made against the Trust that have not yet occurred.
BHFTII-71
Brighthouse Funds Trust II
BlackRock Bond Income Portfolio
Notes to Financial Statements—December 31, 2023—(Continued)
8. Income Tax Information
The cost basis of investments for federal income tax purposes at December 31, 2023 was as follows:
| Cost basis of investments |
$ | 3,253,619,639 | ||
|
|
|
|||
| Gross unrealized appreciation |
42,537,247 | |||
| Gross unrealized (depreciation) |
(190,312,408 | ) | ||
|
|
|
|||
| Net unrealized appreciation (depreciation) |
$ | (147,775,161 | ) | |
|
|
|
The tax character of distributions paid for the years ended December 31, 2023 and 2022 were as follows:
| Ordinary Income |
Long-Term Capital Gain | Total | ||||||||||||||||||
| 2023 |
2022 | 2023 | 2022 | 2023 | 2022 | |||||||||||||||
| $87,087,715 | $ | 90,815,649 | $ | — | $ | 3,603,296 | $ | 87,087,715 | $ | 94,418,945 | ||||||||||
As of December 31, 2023, the components of distributable earnings (accumulated losses) on a federal income tax basis were as follows:
| Undistributed |
Undistributed Long-Term Capital Gain |
Net Unrealized Appreciation (Depreciation) |
Accumulated Capital Losses |
Total | ||||||||||||
| $113,778,658 |
$ | — | $ | (149,337,909 | ) | $ | (413,237,297 | ) | $ | (448,796,548 | ) | |||||
The Portfolio utilizes the provisions of the federal income tax laws that provide for the carryforward of capital losses for prior years, offsetting such losses against any future realized capital gains. Net capital losses may be carried forward indefinitely and their character is retained as short-term and/or long-term losses.
As of December 31, 2023, the Portfolio had accumulated short-term capital losses of $174,044,463 and accumulated long-term capital losses of $239,192,834.
9. Recent Accounting Pronouncement & Regulatory Updates
In June 2022, FASB issued Accounting Standards Update 2022-03—Fair Value Measurement (Topic 820)—Fair Value Measurement of Equity Securities Subject to Contractual Sale Restrictions (“ASU 2022-03”). ASU 2022-03 clarifies the guidance in Topic 820 to indicate that a contractual sale restriction should not be considered in the fair value of an equity security subject to such a restriction, and requires entities with investments in equity securities subject to contractual sale restrictions to disclose certain qualitative and quantitative information about such securities. ASU 2022-03 is effective for fiscal years, and interim periods within those fiscal years, beginning after December 15, 2023. ASU 2022-03 is only applicable to an equity security in which the contractual arrangement that restricts its sale is executed or modified on or after the adoption date.
Effective January 24, 2023, the Securities and Exchange Commission adopted rule and form amendments that require open-end management investment companies to transmit concise and visually engaging annual and semiannual reports to shareholders that highlight certain information deemed by the SEC to be particularly important for investors. Certain other information, including financial statements, will no longer appear in shareholder reports but will, as required, be available online, delivered free of charge upon request, and filed on a semiannual basis on Form N-CSR. The rule and form amendments have a compliance date of July 24, 2024. Accordingly, the rule and form amendments will not impact the Portfolio until its 2024 semiannual shareholder report.
BHFTII-72
Brighthouse Funds Trust II
BlackRock Bond Income Portfolio
Report of Independent Registered Public Accounting Firm
To the Board of Trustees of Brighthouse Funds Trust II and Shareholders of the BlackRock Bond Income Portfolio:
Opinion on the Financial Statements and Financial Highlights
We have audited the accompanying statement of assets and liabilities, including the schedule of investments, of the BlackRock Bond Income Portfolio (the “Fund”) (one of the funds constituting the Brighthouse Funds Trust II), as of December 31, 2023, the related statement of operations for the year then ended, the statements of changes in net assets for each of the two years in the period then ended, the financial highlights for each of the five years in the period then ended, and the related notes. In our opinion, the financial statements and financial highlights present fairly, in all material respects, the financial position of the Fund as of December 31, 2023, and the results of its operations for the year then ended, the changes in its net assets for each of the two years in the period then ended, and the financial highlights for each of the five years in the period then ended in conformity with accounting principles generally accepted in the United States of America.
Basis for Opinion
These financial statements and financial highlights are the responsibility of the Fund’s management. Our responsibility is to express an opinion on the Fund’s financial statements and financial highlights based on our audits. We are a public accounting firm registered with the Public Company Accounting Oversight Board (United States) (PCAOB) and are required to be independent with respect to the Fund in accordance with the U.S. federal securities laws and the applicable rules and regulations of the Securities and Exchange Commission and the PCAOB.
We conducted our audits in accordance with the standards of the PCAOB. Those standards require that we plan and perform the audit to obtain reasonable assurance about whether the financial statements and financial highlights are free of material misstatement, whether due to error or fraud. The Fund is not required to have, nor were we engaged to perform, an audit of its internal control over financial reporting. As part of our audits we are required to obtain an understanding of internal control over financial reporting but not for the purpose of expressing an opinion on the effectiveness of the Fund’s internal control over financial reporting. Accordingly, we express no such opinion.
Our audits included performing procedures to assess the risks of material misstatement of the financial statements and financial highlights, whether due to error or fraud, and performing procedures that respond to those risks. Such procedures included examining, on a test basis, evidence regarding the amounts and disclosures in the financial statements and financial highlights. Our audits also included evaluating the accounting principles used and significant estimates made by management, as well as evaluating the overall presentation of the financial statements and financial highlights. Our procedures included confirmation of securities owned as of December 31, 2023, by correspondence with the custodian, brokers and agent banks; when replies were not received from brokers or agent banks, we performed other auditing procedures. We believe that our audits provide a reasonable basis for our opinion.
/s/ Deloitte & Touche LLP
Boston, Massachusetts
February 23, 2024
We have served as the auditor of one or more Brighthouse investment companies since 1983.
BHFTII-73
Brighthouse Funds Trust II
Trustees and Officers
MANAGEMENT OF THE TRUSTS
The Boards of Trustees (the “Board”) of Brighthouse Funds Trust I and Brighthouse Funds Trust II (“Trust I” and “Trust II”, respectively, and collectively the “Trusts”) supervise the Trusts and are responsible for representing the interests of shareholders. The Trustees, the Chairman of the Board and the Chairmen of each subcommittee are the same for both Trusts. The Trustees of each Trust meet periodically throughout the year to oversee the Portfolios’ activities, reviewing, among other things, each Portfolio’s performance and its contractual arrangements with various service providers. The Trustees of each Trust elect the officers of the Trust, who are responsible for administering the Trust’s day-to-day operations.
Trustees and Officers
The Trustees and executive officers of the Trusts, as well as their ages and their principal occupations during the past five years, are set forth below. Unless otherwise indicated, the business address of each is c/o Brighthouse Funds Trust I and Brighthouse Funds Trust II, 11225 N. Community House Rd., Charolette, North Carolina 28277. Each Trustee who is deemed an “interested person,” as such term is defined in the 1940 Act, is referred to as an “Interested Trustee.” Those Trustees who are not “interested persons,” as such term is defined in the 1940 Act, are referred to as “Independent Trustees.” There is no limit to the term a Trustee may serve, other than pursuant to the retirement policy adopted by the Independent Trustees. Trustees serve until their death, resignation, retirement or removal in accordance with Trust I’s and Trust II’s respective organizational documents and policies adopted by the Board of the Trust from time to time. Officers hold office at the pleasure of each Board and serve until their removal or resignation in accordance with the Trusts’ respective organizational documents and policies adopted by the Board of each Trust from time to time.
Trustees of the Trusts
| Name and Year of Birth |
Position(s) |
Term of Office |
Principal Occupation(s) During the Past |
Number of |
Other Directorships
Held | |||||
| Interested Trustee | ||||||||||
| John Rosenthal* (1960) |
Trustee | Indefinite; From May 2016 (Trust I and Trust II) to present | Chief Investment Officer, Brighthouse Financial, Inc. (2016 to present). | 73 | None | |||||
| Independent Trustees | ||||||||||
| Dawn M. Vroegop (1966) |
Trustee and Chair of the Board | Indefinite; From December 2000 (Trust I)/May 2009 (Trust II) to present as Trustee; From May 2016 (Trust I and Trust II) until present as Chair | Retired; Private Investor. | 73 | Trustee, Driehaus Mutual Funds (8 portfolios).** | |||||
| Stephen M. Alderman (1959) |
Trustee | Indefinite; From December 2000 (Trust I)/April 2012 (Trust II) to present | Vice President and General Counsel, IHR Aerial Solutions, LLC; Until 2022, General Counsel, Illini Hi-Reach, Inc.; Until 2020, Shareholder in the law firm of Garfield & Merel, Ltd. | 73 | None | |||||
| Robert J. Boulware (1956) |
Trustee | Indefinite; From March 2008 (Trust I)/April 2012 (Trust II) to present | Managing Member, Pilgrim Funds, LLC (private equity fund). | 73 | Trustee, Vertical Capital Income Fund (closed-end fund);** Trustee, The Private Shares Fund (closed-end fund);** Until 2021, Director, Mid-Con Energy Partners, LP (energy);** Until 2020, Director, Gainsco, Inc. (auto insurance).** | |||||
BHFTII-74
Brighthouse Funds Trust II
Trustees and Officers—(Continued)
| Name and Year of Birth |
Position(s) |
Term of Office |
Principal Occupation(s) During the Past |
Number of |
Other Directorships
Held | |||||
| Susan C. Gause (1952) |
Trustee | Indefinite; From March 2008 (Trust I)/April 2012 (Trust II) to present | Private Investor. | 73 | Trustee, HSBC Funds (4 portfolios).** | |||||
| Nancy Hawthorne (1951) |
Trustee | Indefinite; From May 2003 (Trust II)/April 2012 (Trust I) to present | Private Investor. | 73 | Trustee, First Eagle Credit Opportunities Fund;** Trustee and Chair of the Board of Trustees, First Eagle Global Opportunities Fund;** Director, Avid Technology, Inc;** Director, CRA International, Inc.** | |||||
Executive Officers of the Trusts
| Name and Year of Birth |
Position(s) |
Term of Office |
Principal Occupation(s) | |||
| Kristi Slavin (1973) | President and Chief Executive Officer, of Trust I and Trust II | From May 2016 (Trust I and Trust II) to present |
President, Brighthouse Investment Advisers, LLC (2016-present). | |||
| Alan R. Otis (1971) | Chief Financial Officer and Treasurer, of Trust I and Trust II | From November 2017 (Trust I and Trust II) to present |
Executive Vice President, Brighthouse Investment Advisers, LLC (2017-present); formerly, Vice President, Brighthouse Investment Advisers, LLC (2012-2017); Assistant Treasurer, Trust I and Trust II (2012-2017). | |||
| Thomas Watterson (1985) | Secretary, of Trust I and Trust II | From November 2023 (Trust I and Trust II) to present |
Executive Vice President, Chief Legal Officer and Secretary, Brighthouse Investment Advisers, LLC (2023-Present); Managing Corporate Counsel, Brighthouse Financial Inc. (2023-present); Managing Counsel and Director, The Bank of New York Mellon Corporation (2019-2023); Counsel and Vice President, The Bank of New York Mellon Corporation (2016-2019). | |||
| Katie Hellmann (1980) | Chief Compliance Officer (“CCO”), of Trust I and Trust II | From May 2023 (Trust I and Trust II) to present |
Chief Compliance Officer, Brighthouse Investment Advisers, LLC (2023-present) and Head of Funds and Investments Compliance (2023-present). Deputy Chief Compliance Officer, Transamerica Asset Management (2022-2023). Leader and Senior Compliance Counsel – Funds Compliance, Edward Jones (2017-2022). | |||
| Rosemary Morgan (1983) | Anti-Money Laundering Officer, of Trust I and Trust II | From May 2023 (Trust I and Trust II) to present |
Chief Privacy Officer, Leader of Compliance Programs and Assistant General Counsel, Brighthouse Financial, Inc. (2019-2022); Chief Privacy Officer, Head of Compliance Programs & Contracts Law, Brighthouse Financial, Inc. (2022-2023), Chief Compliance Officer and Associate General Counsel, Brighthouse Financial, Inc. (2023-present); Vice President and Chief Compliance Officer, Brighthouse Life Insurance Company (2023-present); Vice President and Chief Compliance Officer (2023-present), Brighthouse Life Insurance Company of NY; Vice President and Chief Compliance Officer (2023-present), New England Life Insurance Company. | |||
| Anna Koska (1981) | Vice President, of Trust I and Trust II | From June 2022 (Trust I and Trust II) to present |
Vice President, Investment and Advisory Services, Brighthouse Investment Advisers, LLC (2022-present); Director of Investment and Advisory Services, Brighthouse Investment Advisers, LLC (2019-2022); Senior Portfolio Analyst, Brighthouse Investment Advisers, LLC (2017-2019). | |||
| * | Mr. Rosenthal is an “interested person” of the Trusts because of his position with Brighthouse Financial, Inc. (“Brighthouse Financial”), an affiliate of BIA. |
| ** | Indicates a directorship with a registered investment company or a company subject to the reporting requirements of the Securities Exchange Act of 1934, as amended. |
| (1) | Previous positions during the past five years with the Trusts, MetLife, Inc. or the Adviser are omitted if not materially different. |
| (2) | The Fund Complex includes 44 Trust I Portfolios and 29 Trust II Portfolios. |
BHFTII-75
Brighthouse Funds Trust II
BlackRock Bond Income Portfolio
Board of Trustees’ Consideration of Advisory and Sub-Advisory Agreements
At a meeting held on November 13-14, 2023 (the “November Meeting”), the Boards of Trustees (the “Board”) of Brighthouse Funds Trust I and Brighthouse Funds Trust II (“BFT I” and “BFT II,” respectively, and collectively, the “Trusts”), including a majority of the Trustees who are not “interested persons” of the Trusts (the “Independent Trustees”) under the Investment Company Act of 1940 (the “1940 Act”), approved the continuation of the Trusts’ advisory agreements (each an “Advisory Agreement”) with Brighthouse Investment Advisers, LLC (the “Adviser”) and the applicable sub-advisory and sub-sub-advisory agreements (each a “Sub-Advisory Agreement” and collectively with the Advisory Agreement, the “Agreements”) between the Adviser and the investment sub-advisers and sub-sub-adviser (each a “Sub-Adviser,” and collectively, the “Sub-Advisers”) for the series of the Trusts (each a “Portfolio,” and collectively, the “Portfolios”) for the annual contract renewal period from January 1, 2024 through December 31, 2024.
The Board met with personnel of the Adviser on September 28-29, 2023 (the “September Meeting”) for the specific purpose of giving preliminary consideration to the proposed continuation of the Agreements, including consideration to information that the Adviser and Sub-Advisers had provided for the Board’s review at the request of the Independent Trustees. At the September Meeting, the Adviser reviewed with the Board the performance and fees experienced by each Portfolio, as well as other information. During and after the September Meeting, the Independent Trustees requested additional information and clarifications that the Adviser addressed at the November Meeting (the September Meeting and the November Meeting are referred to collectively as, the “Meetings”). During the contract renewal process, and throughout the year, the Independent Trustees were advised by independent legal counsel, and they met with independent legal counsel in executive sessions outside of the presence of management on a number of occasions to discuss, among other things, the renewal of the Agreements.
In considering the continuation of the Agreements, the Board reviewed a variety of materials that were provided for the specific purpose of assisting the Board in the renewal process, along with various information and materials that were provided to and discussed with the Board throughout the year, at regularly scheduled meetings of the Board and its committees. In particular, information for each Portfolio included, but was not limited to, reports on investment performance, expenses, legal and compliance matters, and asset pricing. Information about the Adviser and each Sub-Adviser included, but was not limited to, reports on the business, operations, and performance of the Adviser and the Sub-Advisers and reports that the Adviser and Sub-Advisers had prepared specifically for the renewal process.
In considering the continuation of the Agreements, the Board also reviewed, among other things, a report for each Portfolio that was prepared by Broadridge (“Broadridge”), an independent organization, which set forth comparative performance and expense information for each Portfolio. In addition, the Independent Trustees reviewed a report that was prepared by JDL Consultants, LLC (“JDL”), an independent consultant to the Independent Trustees, which examined the Broadridge reports for each Portfolio (“JDL Report”). The Independent Trustees met in executive session with representatives of JDL during the September Meeting to review the JDL Report.
At the November Meeting, the Board, including a majority of the Independent Trustees, concluded that the nature, extent, and quality of services provided by the Adviser and each Sub-Adviser supported the renewal of the Agreements. The Board also concluded that the investment services provided to and the performance of each Portfolio was such that each Agreement should continue, and that the fees paid by each Portfolio to the Adviser appeared to be reasonable in light of the nature, extent, and quality of the services provided by the Adviser and each Sub-Adviser. Further, the Board concluded that the Adviser’s profitability in providing services under the Advisory Agreements did not appear unreasonable in light of the nature, extent, and quality of the services provided by the Adviser. The Board reviewed the extent to which the investment advisory fees paid by the Portfolios shared economies of scale with investors or entailed the potential to share economies of scale with investors and concluded that those considerations generally supported the renewal of each Agreement. Finally, the Board considered the Adviser’s recommendation that it approve the renewal of each Sub-Advisory Agreement.
In approving the continuation of each Agreement, the Board, including the Independent Trustees, gave attention to all of the information that was furnished, and each Trustee placed varying degrees of importance on the various pieces of information that were provided to them. The Board evaluated the information provided to it on a Portfolio-by-Portfolio basis, and its decision was made separately with respect to each Portfolio. The following paragraphs provide more information about some of the primary factors that were relevant to the Board’s decisions. The Board did not identify any single factor as determinative, and the Trustees generally attributed different weights to various factors for the various Portfolios.
Nature, extent and quality of services. The Board evaluated the nature, extent, and quality of the services that the Adviser and the Sub-Advisers, as relevant, provided to the Portfolios. The Board considered the Adviser’s services as investment manager to the Portfolios, including its services relating to the hiring and oversight of the Sub-Advisers and, in particular, their investment programs and personnel, succession management of key personnel, trading practices, compliance programs and personnel, and risk management
BHFTII-76
Brighthouse Funds Trust II
BlackRock Bond Income Portfolio
Board of Trustees’ Consideration of Advisory and Sub-Advisory Agreements—(Continued)
programs, among other things. The Adviser’s services in coordinating and overseeing the activities of the Trusts’ other service providers were also considered. The Board also considered the systems and processes required by the Adviser to meet additional regulatory and compliance requirements resulting from U.S. Securities and Exchange Commission and other regulatory initiatives, including related to liquidity, valuation, and derivatives risk management. The Board considered information received from the Trusts’ Chief Compliance Officer regarding the Portfolios’ compliance policies and procedures that were established pursuant to Rule 38a-l under the 1940 Act, and relevant aspects of the Adviser’s and Sub-Advisers’ compliance policies and procedures. The Board also noted that it was the practice of the Adviser’s investment, compliance, and legal staff to conduct periodic meetings (through various media) with the Sub-Advisers throughout the year in order to review and assess the services that are provided to the Portfolios, and that personnel of the Adviser routinely prepare and present reports to the Board regarding those meetings. In addition, during the Meetings and throughout the year, the Board considered the expertise, experience, and performance of the personnel of the Adviser who performed the various services that are mentioned above.
With respect to the services provided by each of the Sub-Advisers, the Board considered a variety of information that the Adviser and each Sub-Adviser prepared for the Board’s review. The Board considered each Sub-Adviser’s investment process, each Sub-Adviser’s overall organization and business plans and the investment performance experienced by the Portfolio (as described in more detail below). The Board took into account that each Sub-Adviser’s responsibilities include, among other things, the development and maintenance of an investment program for the applicable Portfolio, the selection of investments and the placement of orders for the purchase and sale of such assets, and the implementation of compliance controls related to the performance of these services. The Board considered, based on the information provided, each Sub-Adviser’s staffing with respect to the management of the Portfolio and other information relating to the Sub-Adviser’s business and operations. The Board also considered the Sub-Adviser’s overall resources and information with respect to any recent turnover of key personnel at the Sub-Adviser. The Board reviewed each Sub-Adviser’s investment experience, as well as information provided regarding the Sub-Adviser’s personnel who provide services to the Portfolios. The Board also considered, among other things, information about each Sub-Adviser’s compliance program, including regarding any compliance matters involving a Sub-Adviser that had been brought to the Board’s attention during the year, as well as the Adviser’s assessment of the financial condition of each Sub-Adviser.
Performance. The Board placed emphasis on the performance of each Portfolio in the context of the performance of the relevant markets in which the Portfolio invests. The Board considered the Adviser’s quarterly presentations to the Board of detailed information about each Portfolio’s investment strategies and performance results and composition, including discussions regarding the relevant effects of market conditions. The Board reviewed and considered the reports prepared by Broadridge, which provided a statistical analysis comparing each Portfolio’s investment performance to that of comparable funds underlying variable insurance products (the “Performance Universe”), and the JDL Report. The Board also compared the performance of each Portfolio to that of comparable funds and other accounts that were managed by the relevant Sub-Adviser, to the extent such information was provided. The Board considered each Portfolio’s performance for periods subsequent to the performance period covered by the Broadridge reports and considered the Adviser’s assessment of the same. The Board also noted that while it found the data provided by Broadridge generally useful, it recognized the limitations of such data, including, in particular, that notable differences may exist between a Portfolio and the other funds in a Broadridge category (for example, with respect to investment strategies) and that the results of the performance comparisons may vary depending on (i) the end dates for the performance periods that were selected and (ii) the selection of the peer groups.
The Board focused particular attention on Portfolios with less favorable performance records. The Board noted the Adviser’s focus on each Sub-Adviser’s performance and that the Adviser had been active in monitoring and responding to any performance issues with respect to the Portfolios.
Fees and Expenses. The Board gave consideration to the level and method of computing the fees payable under the Agreements. The Board reviewed and considered the information in the JDL Report concerning fees and expenses. The Board also reviewed and considered the Broadridge report for each Portfolio, which included various comparisons of the Portfolio’s fees (at December 31, 2022 and various asset levels) and expenses with those of its peers, including, as applicable, a broad group of peer funds (“Expense Universe”), a narrower group of peer funds (“Expense Group”), a broad group of peer sub-advised funds (“Sub-advised Expense Universe”), and a narrower group of peer sub-advised funds (“Sub-advised Expense Group”). In particular, the Board reviewed comparisons of each Portfolio’s contractual management fees with its Expense Group and Sub-advised Expense Universe, contractual sub-adviser fees with its Sub-advised Expense Universe and Sub-advised Expense Group, and total expenses with its Expense Universe, Expense Group and Sub-advised Expense Universe. The Board considered that Broadridge selected the peer funds, which were funds underlying variable insurance products that Broadridge deemed to be comparable to the Portfolios. The Board considered that the fee and expense information in the Broadridge report for each Portfolio reflected information as of the Portfolio’s most recent fiscal year
BHFTII-77
Brighthouse Funds Trust II
BlackRock Bond Income Portfolio
Board of Trustees’ Consideration of Advisory and Sub-Advisory Agreements—(Continued)
end at the time the Broadridge report was issued and that historical asset levels may differ from current asset levels, particularly in a period of market volatility. In addition, the Board compared the fee payable to a Sub-Adviser by the Adviser with respect to the Portfolio to the fee payable to the Sub-Adviser by other comparable funds and other accounts, to the extent such information was provided.
The Board noted that the sub-advisory fees for the Portfolios are negotiated at arm’s length by the Adviser and are paid by the Adviser out of its advisory fees. The Board also considered that the Adviser had entered into expense limitation or management fee waiver agreements with certain of the Portfolios pursuant to which the Adviser had agreed to waive a portion of its advisory fee and/or reimburse certain expenses as a means of limiting a Portfolio’s total annual operating expenses or passing through the benefit of a subadvisory fee concession to a Portfolio, as applicable.
Profitability. The Board examined the profitability to the Adviser of each Advisory Agreement, on a Portfolio-by-Portfolio basis. The Board also considered that an affiliate of the Adviser, Brighthouse Securities, LLC, serves as distributor for the Trusts, and, as such, receives Rule 12b-1 payments to support the distribution of the Portfolios. The Board considered the profitability to the Sub-Advisers and their affiliates of their relationships with the Portfolios, to the extent provided, and the Board considered the ability of the Adviser to negotiate with a Sub-Adviser at arm’s length. In reviewing the profitability information, the Board recognized that expense allocation methodologies are inherently subjective and various methodologies may be reasonable while producing different results.
Economies of scale. The Board considered each Portfolio’s fees in light of its size. The Board noted the fee schedules for the Portfolios that contain breakpoints that reduce the fee rate above specified asset levels, including breakpoints in the Advisory Agreements and any corresponding Sub-Advisory Agreement. The Board noted those Portfolios that did not have breakpoints in their advisory fees and considered management’s explanation of the same.
The Board considered the effective fees under the Advisory Agreement and Sub-Advisory Agreement for each Portfolio as a percentage of assets at different asset levels and possible economies of scale that may be realized if the assets of the Portfolio grow. The Board examined, among other data, the effect of a Portfolio’s growth in size, and reduction in size, on various fee schedules. The Board also generally noted that if a Portfolio’s assets increase over time, the Portfolio may realize economies of scale if assets increase proportionally more than certain other expenses.
Other factors. The Board considered other benefits that may be realized by the Adviser and its affiliates from their relationships with the Trusts. Among the benefits realized by the Adviser, the Board recognized that Brighthouse Securities, LLC, as the distributor for the Trusts, receives payments pursuant to Rule 12b-1 from the Portfolios to help compensate for the provision of shareholder services and distribution activities. The Board considered that a Sub- Adviser may engage in soft dollar transactions in managing a Portfolio. In addition, the Board considered that a Sub-Adviser may be affiliated with registered broker-dealers that may, from time to time, receive brokerage commissions from a Portfolio in connection with the sale of portfolio securities (subject to applicable best execution obligations). The Board also considered that a Sub-Adviser and its affiliates could benefit from the opportunity to provide advisory services to additional portfolios of the Trusts and overall reputational benefits.
The Board considered information from the Adviser and Sub-Advisers pertaining to potential conflicts of interest, and the manner in which any potential conflicts were mitigated. In its review, the Board considered information regarding various business relationships among the Adviser and its affiliates and various Sub-Advisers and their affiliates. The Board also considered information about services and/or payments provided to the Adviser by the Sub-Advisers in connection with marketing activities. The Board considered representations from the Adviser that such business relationships and any payments were not considered in the Adviser’s recommendation to renew any of the Sub-Advisory Agreements.
* * * * *
BlackRock Bond Income Portfolio. The Board also considered the following information in relation to the Agreements with the Adviser and BlackRock Advisors, LLC regarding the Portfolio:
Among other data relating specifically to the Portfolio’s performance, the Board considered that the Portfolio outperformed the median of its Performance Universe and the average of its Morningstar Category for the one-, three-, and five-year periods ended June 30, 2023. The Board further considered that the Portfolio outperformed its benchmark, the Bloomberg U.S. Aggregate Bond Index, for the one-, three-, and five-year periods ended October 31, 2023. The Board also noted the presence of certain management fee waivers in effect for the Portfolio.
The Board also considered that the Portfolio’s actual management fees and total expenses (exclusive of 12b-l fees) were below the Expense Group median, the Expense Universe median, and the Sub-advised Expense Universe median. The Board noted that the Portfolio’s contractual management fees were below the asset-weighted average of the Investment Classification/Morningstar Category selected by Broadridge at the Portfolio’s current size. The Board also noted that the Portfolio’s contractual sub-advisory fees were below the averages of the Sub-advised Expense Group and the Sub-advised Expense Universe at the Portfolio’s current size.
BHFTII-78
Brighthouse Funds Trust II
BlackRock Capital Appreciation Portfolio
Managed By BlackRock Advisors, LLC
Portfolio Manager Annual Commentary*
PERFORMANCE
For the twelve months ended December 31, 2023, the Class A, B and E shares of the BlackRock Capital Appreciation Portfolio returned 49.61%, 49.23%, and 49.33%, respectively. The Portfolio’s benchmark, the Russell 1000 Growth Index¹, returned 42.68%.
MARKET ENVIRONMENT / CONDITIONS
The final quarter of the year began with relatively low expectations as rising interest rates remained. By October, U.S. equity markets reached new lows as investor sentiment and confidence continued to wane. Inflation data softened faster than expected, keeping the Federal Reserve quite neutral on monetary policy, and simultaneously increasing investor confidence. Slowly but surely, as positive economic data and better-than expected corporate earnings were released, markets began to turn. Consumer spending and economic growth remained strong in the fourth quarter thanks to a resilient jobs market, indicating that the U.S. consumer remains relatively healthy. The majority of 2023 was certainly difficult to navigate with inflation, recession fears, and heightened volatility, yet in the end, we experienced a powerful rally in the U.S. equity market to close out the year. In terms of style, growth stocks outperformed value stocks as the Russell 1000 Growth Index returned 42.68% and the Russell 1000 Value Index returned 11.46% during the fourth quarter.
PORTFOLIO REVIEW / PERIOD END POSITIONING
The Portfolio outperformed its benchmark, the Russell 1000 Growth Index, during 2023. Stock selection in the Information Technology (“IT”) sector was the largest contributor to relative returns. Sector positioning in the Consumer Staples sector and both stock selection and sector positioning in Industrials were the next largest contributors to relative performance. Stock selection in Communication Services, as well as Portfolio’s cash position, were the largest detractors from relative returns.
At the sector level, IT was the largest contributor to relative performance driven by an overweight to the Semiconductors & Semiconductor Equipment industries. Notably, overweight positions in NVIDIA Corp. and Broadcom, Inc. added to returns as both companies benefited from potential tailwinds from growth in Artificial Intelligence (“AI”). Additionally, within IT services, an off-benchmark position in Shopify, Inc. proved beneficial as the company saw double-digit revenue growth and better-than-expected results, driven by an increase in enterprise merchant base and growth in the Point-of-Sale categories and the Shop Pay checkout solution. Elsewhere in IT, an overweight position in Intuit, Inc. was a notable contributor. Intuit, Inc. offers financial management and compliance software for small businesses, accountants, and consumers. Shares of the stock outperformed during the period as the company reiterated its full-year guidance, signaling confidence in its strategic direction and market position. Next, underweight positioning in Consumer Staples was beneficial due to our decision to not invest in beverages companies given the limited growth and mounting competitive threats. The next key contributor was Industrials where security selection among Aerospace and Defense names contributed to return. Most notably, an off-benchmark position in TransDigm Group boosted performance. In addition to the above-mentioned contributors, an overweight position in Amazon.com, Inc. within Consumer Discretionary proved beneficial.
The largest detractor to relative performance was stock selection in Communication Services, driven by an underweight to companies in the Interactive Media & Services sub-industry. Specifically, an underweight position in Meta Platforms, Inc. detracted from relative returns. The stock rose after reporting AI improvements in monetization across their social media platforms. Additionally, the company unveiled a new mixed reality headset, along with new AI features of its WhatsApp platform. Additionally, an overweight position in Match Group, Inc. detracted from relative returns. Shares of Match Group struggled during the year as the company posted disappointing earnings amid the deteriorating macro-economic conditions. Next, the Portfolio’s cash position proved costly amid rising stock prices. Elsewhere in the Portfolio, an off-benchmark position in Danaher Corp. and an overweight position in Thermo Fisher Scientific, Inc. within Health Care negatively impacted performance. Shares of the life sciences and medical diagnostics company, Danaher Corp, remained under pressure after management was forced to lower expectations for one of its key businesses. Similarly, Thermo Fisher Scientific shares suffered losses amid stagnant revenue and a recently slashed growth forecast driven by declining sales of its Life Sciences segment due to lower COVID-19-related demand.
BHFTII-1
Brighthouse Funds Trust II
BlackRock Capital Appreciation Portfolio
Managed By BlackRock Advisors, LLC
Portfolio Manager Annual Commentary*—(Continued)
The largest sector overweight in the Portfolio at year-end was Financials, followed by Health Care. Consumer Staples and Communication Services where the largest Portfolio underweights.
Phil Ruvinsky
Caroline Bottinelli
Portfolio Managers
BlackRock Advisors, LLC
* This commentary may include statements that constitute “forward-looking statements” under the U.S. securities laws. Forward-looking statements include, among other things, projections, estimates, and information about possible or future results related to the Portfolio, market or regulatory developments. The views expressed above are not guarantees of future performance or economic results and involve certain risks, uncertainties and assumptions that could cause actual outcomes and results to differ materially from the views expressed herein. The views expressed above are subject to change at any time based upon economic, market, or other conditions and the subadvisory firm undertakes no obligation to update the views expressed herein. Any discussions of specific securities should not be considered a recommendation to buy or sell those securities. The views expressed above (including any forward-looking statement) may not be relied upon as investment advice or as an indication of the Portfolio’s trading intent. Information about the Portfolio’s holdings, asset allocation or country diversification is historical and is not an indication of future Portfolio composition, which may vary. Direct investment in any index is not possible. The performance of any index mentioned in this commentary has not been adjusted for ongoing management, distribution and operating expenses, and sales charges applicable to mutual fund investments. In addition, the returns do not reflect additional fees charged by separate accounts or variable insurance contracts that an investor in the Portfolio may pay. If these additional fees were reflected, performance would have been lower.
1 The Russell 1000 Growth Index is an unmanaged measure of performance of the largest capitalized U.S. companies, within the Russell 1000 companies, that have higher price-to-book ratios and forecasted growth values.
BHFTII-2
Brighthouse Funds Trust II
BlackRock Capital Appreciation Portfolio
A $10,000 INVESTMENT COMPARED TO THE RUSSELL 1000 GROWTH INDEX
AVERAGE ANNUAL RETURNS (%) FOR THE YEAR ENDED DECEMBER 31, 2023
| 1 Year | 5 Year | 10 Year | ||||||||||
| BlackRock Capital Appreciation Portfolio | ||||||||||||
| Class A |
49.61 | 16.15 | 12.88 | |||||||||
| Class B |
49.23 | 15.86 | 12.60 | |||||||||
| Class E |
49.33 | 15.98 | 12.71 | |||||||||
| Russell 1000 Growth Index | 42.68 | 19.50 | 14.86 | |||||||||
Portfolio performance is calculated including reinvestment of all income and capital gain distributions. Performance numbers are net of all Portfolio expenses but do not include any insurance, sales, separate account or administrative charges of variable annuity or life insurance contracts or any additional expenses that participants may bear relating to the operations of their plans. If these charges were included, the returns would be lower. The performance of any index referenced above has not been adjusted for ongoing management, distribution and operating expenses, and sales charges applicable to mutual fund investments. Direct investment in any index is not possible. The performance of Class A shares, as set forth in the line graph above, will differ from that of other classes because of the difference in expenses paid by policyholders investing in the different share classes.
This information represents past performance and is not indicative of future results. Investment return and principal value may fluctuate so that shares, upon redemption, may be worth more or less than the original cost.
PORTFOLIO COMPOSITION AS OF DECEMBER 31, 2023
Top Holdings
| % of Net Assets |
||||
| Microsoft Corp. | 9.7 | |||
| Amazon.com, Inc. | 8.7 | |||
| Apple, Inc. | 8.7 | |||
| NVIDIA Corp. | 6.3 | |||
| Intuit, Inc. | 4.5 | |||
| Alphabet, Inc. - Class A | 4.3 | |||
| Visa, Inc. - Class A | 4.1 | |||
| Broadcom, Inc. | 3.8 | |||
| ASML Holding NV | 3.1 | |||
| Tesla, Inc. | 2.8 | |||
Top Sectors
| % of Net Assets |
||||
| Information Technology | 45.9 | |||
| Health Care | 13.7 | |||
| Consumer Discretionary | 13.6 | |||
| Financials | 11.3 | |||
| Communication Services | 8.7 | |||
| Industrials | 4.3 | |||
| Materials | 1.1 | |||
| Energy | 0.8 | |||
| Real Estate | 0.6 | |||
BHFTII-3
Brighthouse Funds Trust II
BlackRock Capital Appreciation Portfolio
Understanding Your Portfolio’s Expenses
Shareholder Expense Example
As a shareholder of the Portfolio, you incur ongoing costs, including management fees; distribution and service (12b-1) fees; and other Portfolio expenses. This example is intended to help you understand your ongoing costs (in dollars) (referred to as “expenses”) of investing in the Portfolio and compare these costs with the ongoing costs of investing in other mutual funds. The example is based on an investment of $1,000 invested at the beginning of the period and held for the entire period, July 1, 2023 through December 31, 2023.
Actual Expenses
The first line for each share class of the Portfolio in the table below provides information about actual account values and actual expenses. You may use the information in this line, together with the amount you invested in the particular share class of the Portfolio, to estimate the expenses that you paid over the period. Simply divide your account value by $1,000 (for example, an $8,600 account value divided by $1,000 = 8.6), then multiply the result by the number in the first line under the heading entitled “Expenses Paid During Period” to estimate the expenses you paid on your account during this period.
Hypothetical Example for Comparison Purposes
The second line for each share class of the Portfolio in the table below provides information about hypothetical account values and hypothetical expenses based on the Portfolio’s actual expense ratio and an assumed rate of return of 5% per year before expenses, which is not the Portfolio’s actual return. The hypothetical account values and expenses may not be used to estimate the actual ending account balance or expenses you paid for the period. You may use this information to compare the ongoing costs of investing in the Portfolio and other funds. To do so, compare this 5% hypothetical example with the 5% hypothetical examples that appear in the shareholder reports of the other funds.
Please note that the expenses shown in the table are meant to highlight your ongoing costs only and do not reflect any fees or charges of your variable insurance product or any additional expenses that participants in certain eligible qualified plans may bear relating to the operations of their plan. Therefore, the second line for each share class in the table is useful in comparing ongoing costs only, and will not help you determine the relative total costs of owning different funds. In addition, if these other costs were included, your costs would have been higher.
| BlackRock Capital Appreciation Portfolio |
Annualized Expense Ratio |
Beginning Account Value July 1, 2023 |
Ending Account Value December 31, 2023 |
Expenses Paid During Period** July 1, 2023 to December 31, 2023 |
||||||||||||||
| Class A (a) |
Actual | 0.57 | % | $ | 1,000.00 | $ | 1,116.80 | $ | 3.04 | |||||||||
| Hypothetical* | 0.57 | % | $ | 1,000.00 | $ | 1,022.33 | $ | 2.91 | ||||||||||
| Class B (a) |
Actual | 0.82 | % | $ | 1,000.00 | $ | 1,115.20 | $ | 4.37 | |||||||||
| Hypothetical* | 0.82 | % | $ | 1,000.00 | $ | 1,021.07 | $ | 4.18 | ||||||||||
| Class E (a) |
Actual | 0.72 | % | $ | 1,000.00 | $ | 1,116.00 | $ | 3.84 | |||||||||
| Hypothetical* | 0.72 | % | $ | 1,000.00 | $ | 1,021.58 | $ | 3.67 | ||||||||||
| * | Hypothetical assumes a rate of return of 5% per year before expenses. |
| ** | Expenses paid are equal to the Portfolio’s annualized expense ratio for the most recent six month period, as shown above, multiplied by the average account value over the period, multiplied by the number of days (184 days) in the most recent fiscal half-year, divided by 365 (to reflect the one-half year period). |
| (a) | The annualized expense ratio shown reflects the impact of the management fee waiver as described in Note 5 of the Notes to Financial Statements. |
BHFTII-4
Brighthouse Funds Trust II
BlackRock Capital Appreciation Portfolio
Schedule of Investments as of December 31, 2023
Common Stocks—99.5% of Net Assets
| Security Description | Shares | Value | ||||||
| Aerospace & Defense—2.0% | ||||||||
| TransDigm Group, Inc. |
33,325 | $ | 33,711,570 | |||||
|
|
|
|||||||
| Automobiles—2.8% | ||||||||
| Tesla, Inc. (a) |
183,786 | 45,667,145 | ||||||
|
|
|
|||||||
| Broadline Retail—8.7% | ||||||||
| Amazon.com, Inc. (a) |
939,761 | 142,787,286 | ||||||
|
|
|
|||||||
| Capital Markets—5.4% | ||||||||
| Blackstone, Inc. |
175,066 | 22,919,641 | ||||||
| MSCI, Inc. |
61,719 | 34,911,352 | ||||||
| S&P Global, Inc. |
71,621 | 31,550,483 | ||||||
|
|
|
|||||||
| 89,381,476 | ||||||||
|
|
|
|||||||
| Chemicals—1.1% | ||||||||
| Sherwin-Williams Co. |
58,460 | 18,233,674 | ||||||
|
|
|
|||||||
| Commercial Services & Supplies—2.3% | ||||||||
| Cintas Corp. |
5,220 | 3,145,885 | ||||||
| Copart, Inc. (a) |
441,238 | 21,620,662 | ||||||
| Veralto Corp. (b) |
98 | 8,061 | ||||||
| Waste Connections, Inc. |
86,540 | 12,917,826 | ||||||
|
|
|
|||||||
| 37,692,434 | ||||||||
|
|
|
|||||||
| Entertainment—2.4% | ||||||||
| Netflix, Inc. (a) |
80,771 | 39,325,785 | ||||||
|
|
|
|||||||
| Financial Services—5.8% | ||||||||
| Mastercard, Inc. - Class A |
67,111 | 28,623,513 | ||||||
| Visa, Inc. - Class A (b) |
257,955 | 67,158,584 | ||||||
|
|
|
|||||||
| 95,782,097 | ||||||||
|
|
|
|||||||
| Health Care Equipment & Supplies—4.6% | ||||||||
| Align Technology, Inc. (a) |
31,326 | 8,583,324 | ||||||
| Boston Scientific Corp. (a) |
273,493 | 15,810,630 | ||||||
| IDEXX Laboratories, Inc. (a) |
35,907 | 19,930,180 | ||||||
| Intuitive Surgical, Inc. (a) |
91,760 | 30,956,154 | ||||||
|
|
|
|||||||
| 75,280,288 | ||||||||
|
|
|
|||||||
| Health Care Providers & Services—2.6% | ||||||||
| UnitedHealth Group, Inc. |
80,167 | 42,205,521 | ||||||
|
|
|
|||||||
| Hotels, Restaurants & Leisure—0.3% | ||||||||
| Chipotle Mexican Grill, Inc. (a) |
1,824 | 4,171,415 | ||||||
|
|
|
|||||||
| Interactive Media & Services—5.8% | ||||||||
| Alphabet, Inc. - Class A (a) |
509,044 | 71,108,356 | ||||||
| Meta Platforms, Inc. - Class A (a) |
69,490 | 24,596,681 | ||||||
|
|
|
|||||||
| 95,705,037 | ||||||||
|
|
|
|||||||
| IT Services—1.8% | ||||||||
| MongoDB, Inc. (a) |
20,689 | 8,458,697 | ||||||
| Shopify, Inc. - Class A (a) |
270,202 | 21,048,736 | ||||||
|
|
|
|||||||
| 29,507,433 | ||||||||
|
|
|
|||||||
| Life Sciences Tools & Services—3.0% | ||||||||
| Danaher Corp. |
103,438 | 23,929,347 | ||||||
| Thermo Fisher Scientific, Inc. |
46,371 | 24,613,263 | ||||||
|
|
|
|||||||
| 48,542,610 | ||||||||
|
|
|
|||||||
| Oil, Gas & Consumable Fuels—0.7% | ||||||||
| Cheniere Energy, Inc. |
72,189 | 12,323,384 | ||||||
|
|
|
|||||||
| Pharmaceuticals—3.6% | ||||||||
| Eli Lilly & Co. |
76,509 | 44,598,626 | ||||||
| Zoetis, Inc. |
74,451 | 14,694,394 | ||||||
|
|
|
|||||||
| 59,293,020 | ||||||||
|
|
|
|||||||
| Real Estate Management & Development—0.6% | ||||||||
| CoStar Group, Inc. (a) |
116,844 | 10,210,997 | ||||||
|
|
|
|||||||
| Semiconductors & Semiconductor Equipment—14.6% | ||||||||
| ASML Holding NV |
66,799 | 50,561,499 | ||||||
| Broadcom, Inc. |
55,922 | 62,422,933 | ||||||
| KLA Corp. |
38,949 | 22,641,054 | ||||||
| NVIDIA Corp. |
210,470 | 104,228,953 | ||||||
|
|
|
|||||||
| 239,854,439 | ||||||||
|
|
|
|||||||
| Software—20.8% | ||||||||
| Cadence Design Systems, Inc. (a) |
127,051 | 34,604,881 | ||||||
| Intuit, Inc. |
117,280 | 73,303,518 | ||||||
| Microsoft Corp. |
421,583 | 158,532,071 | ||||||
| Palo Alto Networks, Inc. (a) |
73,257 | 21,602,024 | ||||||
| Roper Technologies, Inc. |
50,336 | 27,441,677 | ||||||
| ServiceNow, Inc. (a) |
37,405 | 26,426,259 | ||||||
|
|
|
|||||||
| 341,910,430 | ||||||||
|
|
|
|||||||
| Specialty Retail—0.6% | ||||||||
| Ross Stores, Inc. |
69,010 | 9,550,294 | ||||||
|
|
|
|||||||
| Technology Hardware, Storage & Peripherals—8.7% | ||||||||
| Apple, Inc. |
738,771 | 142,235,581 | ||||||
|
|
|
|||||||
| Textiles, Apparel & Luxury Goods—1.3% | ||||||||
| LVMH Moet Hennessy Louis Vuitton SE |
26,159 | 21,218,226 | ||||||
|
|
|
|||||||
| Total Common Stocks |
1,634,590,142 | |||||||
|
|
|
|||||||
| Preferred Stock—0.5% |
| |||||||
| Interactive Media & Services—0.5% | ||||||||
| Bytedance Ltd. - Series E-1 † (a) (c) (d) |
49,026 | 8,000,878 | ||||||
|
|
|
|||||||
See accompanying notes to financial statements.
BHFTII-5
Brighthouse Funds Trust II
BlackRock Capital Appreciation Portfolio
Schedule of Investments as of December 31, 2023
Short-Term Investment—0.1%
| Security Description | Principal Amount* |
Value | ||||||
| Repurchase Agreement—0.1% | ||||||||
| Fixed Income Clearing Corp. |
1,288,605 | $ | 1,288,605 | |||||
|
|
|
|||||||
| Total Short-Term Investments |
1,288,605 | |||||||
|
|
|
|||||||
| Securities Lending Reinvestments(e)—0.0% |
|
|||||||
| Repurchase Agreements—0.0% | ||||||||
| Barclays Bank PLC |
||||||||
| Repurchase Agreement dated 12/29/23 at 5.330%, due on 01/02/24 with a maturity value of $1,107; collateralized by U.S. Treasury Obligations with rates ranging from 0.000% - 5.500%, maturity dates ranging from 01/31/24 - 05/15/48, and an aggregate market value of $1,129. |
1,106 | 1,106 | ||||||
| Repurchase Agreement dated 12/29/23 at 5.450%, due on 01/02/24 with a maturity value of $516; collateralized by various Common Stock with an aggregate market value of $575. |
516 | 516 | ||||||
| Cantor Fitzgerald & Co. |
8 | 8 | ||||||
| Deutsche Bank Securities, Inc. |
1,622 | 1,622 | ||||||
| HSBC Securities, Inc. |
1,622 | 1,622 | ||||||
| ING Financial Markets LLC |
1,622 | 1,622 | ||||||
| Societe Generale |
877 | 877 | ||||||
|
|
|
|||||||
| 7,373 | ||||||||
|
|
|
|||||||
| Total Securities Lending Reinvestments |
7,373 | |||||||
|
|
|
|||||||
| Total Investments - 100.1% |
1,643,886,998 | |||||||
| Other assets and liabilities (net) - (0.1)% |
(1,916,755 | ) | ||||||
|
|
|
|||||||
| Net Assets—100.0% | $ | 1,641,970,243 | ||||||
|
|
|
|||||||
| * | Principal amount stated in U.S. dollars unless otherwise noted. |
| † | Restricted securities are not registered under the Securities Act of 1933 and are subject to legal restrictions on resale. These securities generally may be resold in transactions exempt from registration or to the public if the securities are subsequently registered. Disposal of these securities may involve time-consuming negotiations and prompt sale at an acceptable price may be difficult. As of December 31, 2023, the market value of restricted securities was $8,000,878, which is 0.5% of net assets. See details shown in the Restricted Securities table that follows. |
| (a) | Non-income producing security. |
| (b) | All or a portion of the security was held on loan. As of December 31, 2023, the market value of securities loaned was $24,738,063 and the collateral received consisted of cash in the amount of $7,373 and non-cash collateral with a value of $25,267,915. The cash collateral investments are disclosed in the Schedule of Investments and categorized as Securities Lending Reinvestments. The non-cash collateral received consists of U.S. government securities that are held in safe-keeping by the lending agent, or a third-party custodian, and cannot be sold or repledged by the Portfolio. As such, this collateral is excluded from the Statement of Assets and Liabilities. |
| (c) | Significant unobservable inputs were used in the valuation of this portfolio security; i.e. Level 3. |
| (d) | Security was valued in good faith under procedures subject to oversight by the Board of Trustees. As of December 31, 2023, these securities represent 0.5% of net assets. |
| (e) | Represents investment of cash collateral received from securities on loan as of December 31, 2023. |
| Restricted Securities |
Acquisition Date |
Shares | Cost | Value | ||||||||||||
| Bytedance Ltd. - Series E-1 |
12/10/20 | 49,026 | $ | 5,371,984 | $ | 8,000,878 | ||||||||||
|
|
|
|||||||||||||||
See accompanying notes to financial statements.
BHFTII-6
Brighthouse Funds Trust II
BlackRock Capital Appreciation Portfolio
Schedule of Investments as of December 31, 2023
Fair Value Hierarchy
Accounting principles generally accepted in the United States of America (“GAAP”) define fair market value as the price that the Portfolio would receive to sell an asset or pay to transfer a liability in an orderly transaction between market participants at the measurement date. It establishes a fair value hierarchy that prioritizes inputs to valuation methods and requires disclosure of the fair value hierarchy, separately for each major category of assets and liabilities, that segregates fair value measurements into three levels. Levels 1, 2 and 3 of the fair value hierarchy are defined as follows:
Level 1—unadjusted quoted prices in active markets for identical investments
Level 2—other significant observable inputs (including, but not limited to, quoted prices for similar assets or liabilities in markets that are either active or inactive; inputs other than quoted prices that are observable such as interest rates, yield curves, volatilities, prepayment speeds, loss severities, credit risks, default rates, or other market corroborated inputs)
Level 3—significant unobservable inputs based on the best information available in the circumstances, to the extent observable inputs are unavailable (including the Portfolio’s own assumptions used in determining the fair value of investments and derivative financial instruments)
The inputs or methodologies used for valuing investments are not necessarily an indication of the risk associated with investing in them. Changes to the inputs or methodologies used may result in transfers between levels. A reconciliation of Level 3 securities, if any, will be disclosed following the fair value hierarchy table. For more information about the Portfolio’s policy regarding the valuation of investments, please refer to the Notes to Financial Statements.
The following table summarizes the fair value hierarchy of the Portfolio’s investments as of December 31, 2023:
| Description | Level 1 | Level 2 | Level 3 | Total | ||||||||||||
| Common Stocks |
| |||||||||||||||
| Aerospace & Defense |
$ | 33,711,570 | $ | — | $ | — | $ | 33,711,570 | ||||||||
| Automobiles |
45,667,145 | — | — | 45,667,145 | ||||||||||||
| Broadline Retail |
142,787,286 | — | — | 142,787,286 | ||||||||||||
| Capital Markets |
89,381,476 | — | — | 89,381,476 | ||||||||||||
| Chemicals |
18,233,674 | — | — | 18,233,674 | ||||||||||||
| Commercial Services & Supplies |
37,692,434 | — | — | 37,692,434 | ||||||||||||
| Entertainment |
39,325,785 | — | — | 39,325,785 | ||||||||||||
| Financial Services |
95,782,097 | — | — | 95,782,097 | ||||||||||||
| Health Care Equipment & Supplies |
75,280,288 | — | — | 75,280,288 | ||||||||||||
| Health Care Providers & Services |
42,205,521 | — | — | 42,205,521 | ||||||||||||
| Hotels, Restaurants & Leisure |
4,171,415 | — | — | 4,171,415 | ||||||||||||
| Interactive Media & Services |
95,705,037 | — | — | 95,705,037 | ||||||||||||
| IT Services |
29,507,433 | — | — | 29,507,433 | ||||||||||||
| Life Sciences Tools & Services |
48,542,610 | — | — | 48,542,610 | ||||||||||||
| Oil, Gas & Consumable Fuels |
12,323,384 | — | — | 12,323,384 | ||||||||||||
| Pharmaceuticals |
59,293,020 | — | — | 59,293,020 | ||||||||||||
| Real Estate Management & Development |
10,210,997 | — | — | 10,210,997 | ||||||||||||
| Semiconductors & Semiconductor Equipment |
239,854,439 | — | — | 239,854,439 | ||||||||||||
| Software |
341,910,430 | — | — | 341,910,430 | ||||||||||||
| Specialty Retail |
9,550,294 | — | — | 9,550,294 | ||||||||||||
| Technology Hardware, Storage & Peripherals |
142,235,581 | — | — | 142,235,581 | ||||||||||||
| Textiles, Apparel & Luxury Goods |
— | 21,218,226 | — | 21,218,226 | ||||||||||||
| Total Common Stocks |
1,613,371,916 | 21,218,226 | — | 1,634,590,142 | ||||||||||||
| Total Preferred Stock* |
— | — | 8,000,878 | 8,000,878 | ||||||||||||
| Total Short-Term Investment* |
— | 1,288,605 | — | 1,288,605 | ||||||||||||
| Total Securities Lending Reinvestments* |
— | 7,373 | — | 7,373 | ||||||||||||
| Total Investments |
$ | 1,613,371,916 | $ | 22,514,204 | $ | 8,000,878 | $ | 1,643,886,998 | ||||||||
| Collateral for Securities Loaned (Liability) |
$ | — | $ | (7,373 | ) | $ | — | $ | (7,373 | ) | ||||||
| * | See Schedule of Investments for additional detailed categorizations. |
Level 3 investments at the beginning and/or end of the period in relation to net assets were not significant and accordingly, a reconciliation of Level 3 assets for the year ended December 31, 2023 is not presented.
See accompanying notes to financial statements.
BHFTII-7
Brighthouse Funds Trust II
BlackRock Capital Appreciation Portfolio
Statement of Assets and Liabilities
December 31, 2023
| Assets |
||||
| Investments at value (a) (b) |
$ | 1,643,886,998 | ||
| Receivable for: |
||||
| Fund shares sold |
186,235 | |||
| Dividends and interest |
73,097 | |||
| Prepaid expenses |
5,967 | |||
|
|
|
|||
| Total Assets |
1,644,152,297 | |||
|
|
|
|||
| Liabilities |
||||
| Collateral for securities loaned |
7,373 | |||
| Payables for: |
||||
| Fund shares redeemed |
1,061,589 | |||
| Accrued Expenses: |
||||
| Management fees |
736,334 | |||
| Distribution and service fees |
63,682 | |||
| Deferred trustees’ fees |
171,105 | |||
| Other expenses |
141,971 | |||
|
|
|
|||
| Total Liabilities |
2,182,054 | |||
|
|
|
|||
| Net Assets |
$ | 1,641,970,243 | ||
|
|
|
|||
| Net Assets Consist of: |
||||
| Paid in surplus |
$ | 954,898,117 | ||
| Distributable earnings (Accumulated losses) |
687,072,126 | |||
|
|
|
|||
| Net Assets |
$ | 1,641,970,243 | ||
|
|
|
|||
| Net Assets |
||||
| Class A |
$ | 1,320,739,777 | ||
| Class B |
277,076,819 | |||
| Class E |
44,153,647 | |||
| Capital Shares Outstanding* |
||||
| Class A |
36,441,394 | |||
| Class B |
8,519,723 | |||
| Class E |
1,285,306 | |||
| Net Asset Value, Offering Price and Redemption Price Per Share |
||||
| Class A |
$ | 36.24 | ||
| Class B |
32.52 | |||
| Class E |
34.35 |
| * | The Portfolio is authorized to issue an unlimited number of shares. | |||
| (a) | Identified cost of investments was $1,060,689,881. | |||
| (b) | Includes securities loaned at value of $24,738,063. | |||
Statement of Operations
Year Ended December 31, 2023
| Investment Income |
| |||
| Dividends (a) |
$ | 10,613,610 | ||
| Interest |
47,281 | |||
| Securities lending income |
75,166 | |||
|
|
|
|||
| Total investment income |
10,736,057 | |||
|
|
|
|||
| Expenses |
| |||
| Management fees |
10,691,577 | |||
| Administration fees |
71,321 | |||
| Custodian and accounting fees |
118,208 | |||
| Distribution and service fee—Class B |
626,004 | |||
| Distribution and service fees—Class E |
57,990 | |||
| Audit and tax services |
49,026 | |||
| Legal |
46,604 | |||
| Trustees’ fees and expenses |
46,220 | |||
| Shareholder reporting |
70,207 | |||
| Insurance |
13,508 | |||
| Miscellaneous |
31,430 | |||
|
|
|
|||
| Total expenses |
11,822,095 | |||
| Less management fee waiver |
(2,333,620 | ) | ||
|
|
|
|||
| Net expenses |
9,488,475 | |||
|
|
|
|||
| Net Investment Income |
1,247,582 | |||
|
|
|
|||
| Net Realized and Unrealized Gain (Loss) |
| |||
| Net realized gain (loss) on : |
| |||
| Investments |
105,190,281 | |||
| Foreign currency transactions |
(47,298 | ) | ||
|
|
|
|||
| Net realized gain (loss) |
105,142,983 | |||
|
|
|
|||
| Net change in unrealized appreciation (depreciation) on: |
| |||
| Investments |
500,027,834 | |||
| Foreign currency transactions |
4,021 | |||
|
|
|
|||
| Net change in unrealized appreciation (depreciation) |
500,031,855 | |||
|
|
|
|||
| Net realized and unrealized gain (loss) |
605,174,838 | |||
|
|
|
|||
| Net Increase (Decrease) in Net Assets From Operations |
$ | 606,422,420 | ||
|
|
|
|||
| (a) | Net of foreign withholding taxes of $229,705. | |||
See accompanying notes to financial statements.
BHFTII-8
Brighthouse Funds Trust II
BlackRock Capital Appreciation Portfolio
Statements of Changes in Net Assets
| Year Ended December 31, 2023 |
Year Ended December 31, 2022 |
|||||||
| Increase (Decrease) in Net Assets: |
||||||||
| From Operations |
||||||||
| Net investment income (loss) |
$ | 1,247,582 | $ | 586,473 | ||||
| Net realized gain (loss) |
105,142,983 | 28,995,964 | ||||||
| Net change in unrealized appreciation (depreciation) |
500,031,855 | (817,775,118 | ) | |||||
|
|
|
|
|
|||||
| Increase (decrease) in net assets from operations |
606,422,420 | (788,192,681 | ) | |||||
|
|
|
|
|
|||||
| From Distributions to Shareholders |
||||||||
| Class A |
(24,750,989 | ) | (342,728,460 | ) | ||||
| Class B |
(5,413,650 | ) | (72,719,560 | ) | ||||
| Class E |
(781,635 | ) | (10,974,815 | ) | ||||
|
|
|
|
|
|||||
| Total distributions |
(30,946,274 | ) | (426,422,835 | ) | ||||
|
|
|
|
|
|||||
| Increase (decrease) in net assets from capital share transactions |
(247,151,205 | ) | 432,788,786 | |||||
|
|
|
|
|
|||||
| Total increase (decrease) in net assets |
328,324,941 | (781,826,730 | ) | |||||
| Net Assets |
||||||||
| Beginning of period |
1,313,645,302 | 2,095,472,032 | ||||||
|
|
|
|
|
|||||
| End of period |
$ | 1,641,970,243 | $ | 1,313,645,302 | ||||
|
|
|
|
|
|||||
Other Information:
Capital Shares
Transactions in capital shares were as follows:
| Year Ended December 31, 2023 |
Year Ended December 31, 2022 |
|||||||||||||||
| Shares | Value | Shares | Value | |||||||||||||
| Class A |
||||||||||||||||
| Sales |
704,723 | $ | 21,495,617 | 2,073,985 | $ | 75,245,501 | ||||||||||
| Reinvestments |
777,355 | 24,750,989 | 12,928,271 | 342,728,460 | ||||||||||||
| Redemptions |
(8,261,069 | ) | (260,161,256 | ) | (2,091,770 | ) | (71,487,091 | ) | ||||||||
|
|
|
|
|
|
|
|
|
|||||||||
| Net increase (decrease) |
(6,778,991 | ) | $ | (213,914,650 | ) | 12,910,486 | $ | 346,486,870 | ||||||||
|
|
|
|
|
|
|
|
|
|||||||||
| Class B |
||||||||||||||||
| Sales |
567,948 | $ | 15,974,499 | 1,213,218 | $ | 38,839,865 | ||||||||||
| Reinvestments |
189,222 | 5,413,650 | 3,040,115 | 72,719,560 | ||||||||||||
| Redemptions |
(1,874,754 | ) | (52,470,571 | ) | (1,037,865 | ) | (33,008,809 | ) | ||||||||
|
|
|
|
|
|
|
|
|
|||||||||
| Net increase (decrease) |
(1,117,584 | ) | $ | (31,082,422 | ) | 3,215,468 | $ | 78,550,616 | ||||||||
|
|
|
|
|
|
|
|
|
|||||||||
| Class E |
||||||||||||||||
| Sales |
186,039 | $ | 5,487,594 | 125,002 | $ | 4,240,294 | ||||||||||
| Reinvestments |
25,882 | 781,635 | 435,509 | 10,974,815 | ||||||||||||
| Redemptions |
(286,171 | ) | (8,423,362 | ) | (227,543 | ) | (7,463,809 | ) | ||||||||
|
|
|
|
|
|
|
|
|
|||||||||
| Net increase (decrease) |
(74,250 | ) | $ | (2,154,133 | ) | 332,968 | $ | 7,751,300 | ||||||||
|
|
|
|
|
|
|
|
|
|||||||||
| Increase (decrease) derived from capital shares transactions |
$ | (247,151,205 | ) | $ | 432,788,786 | |||||||||||
|
|
|
|
|
|||||||||||||
See accompanying notes to financial statements.
BHFTII-9
Brighthouse Funds Trust II
BlackRock Capital Appreciation Portfolio
Financial Highlights
| Selected per share data | ||||||||||||||||||||
| Class A | ||||||||||||||||||||
| Year Ended December 31, | ||||||||||||||||||||
| 2023 | 2022 | 2021 | 2020 | 2019 | ||||||||||||||||
| Net Asset Value, Beginning of Period |
$ | 24.69 | $ | 56.20 | $ | 53.39 | $ | 43.16 | $ | 38.83 | ||||||||||
|
|
|
|
|
|
|
|
|
|
|
|||||||||||
| Income (Loss) from Investment Operations |
||||||||||||||||||||
| Net investment income (loss) (a) |
0.04 | 0.03 | (0.09 | ) | (0.07 | ) | (0.00 | )(b) | ||||||||||||
| Net realized and unrealized gain (loss) |
12.12 | (20.40 | ) | 10.57 | 16.02 | 12.03 | ||||||||||||||
|
|
|
|
|
|
|
|
|
|
|
|||||||||||
| Total income (loss) from investment operations |
12.16 | (20.37 | ) | 10.48 | 15.95 | 12.03 | ||||||||||||||
|
|
|
|
|
|
|
|
|
|
|
|||||||||||
| Less Distributions |
||||||||||||||||||||
| Distributions from net investment income |
(0.01 | ) | 0.00 | 0.00 | 0.00 | (0.10 | ) | |||||||||||||
| Distributions from net realized capital gains |
(0.60 | ) | (11.14 | ) | (7.67 | ) | (5.72 | ) | (7.60 | ) | ||||||||||
|
|
|
|
|
|
|
|
|
|
|
|||||||||||
| Total distributions |
(0.61 | ) | (11.14 | ) | (7.67 | ) | (5.72 | ) | (7.70 | ) | ||||||||||
|
|
|
|
|
|
|
|
|
|
|
|||||||||||
| Net Asset Value, End of Period |
$ | 36.24 | $ | 24.69 | $ | 56.20 | $ | 53.39 | $ | 43.16 | ||||||||||
|
|
|
|
|
|
|
|
|
|
|
|||||||||||
| Total Return (%) (c) |
49.61 | (37.61 | ) | 21.20 | 40.66 | 32.85 | ||||||||||||||
| Ratios/Supplemental Data |
||||||||||||||||||||
| Gross ratio of expenses to average net assets (%) |
0.73 | 0.73 | 0.71 | 0.72 | 0.72 | |||||||||||||||
| Net ratio of expenses to average net assets (%) (d) |
0.58 | 0.63 | 0.62 | 0.63 | 0.63 | |||||||||||||||
| Ratio of net investment income (loss) to average net assets (%) |
0.13 | 0.08 | (0.17 | ) | (0.14 | ) | (0.00 | )(e) | ||||||||||||
| Portfolio turnover rate (%) |
22 | 65 | 41 | 37 | 43 | |||||||||||||||
| Net assets, end of period (in millions) |
$ | 1,320.7 | $ | 1,067.3 | $ | 1,703.3 | $ | 1,651.2 | $ | 1,526.1 | ||||||||||
| Class B | ||||||||||||||||||||
| Year Ended December 31, | ||||||||||||||||||||
| 2023 | 2022 | 2021 | 2020 | 2019 | ||||||||||||||||
| Net Asset Value, Beginning of Period |
$ | 22.25 | $ | 52.39 | $ | 50.37 | $ | 41.11 | $ | 37.29 | ||||||||||
|
|
|
|
|
|
|
|
|
|
|
|||||||||||
| Income (Loss) from Investment Operations |
||||||||||||||||||||
| Net investment income (loss) (a) |
(0.03 | ) | (0.05 | ) | (0.22 | ) | (0.17 | ) | (0.10 | ) | ||||||||||
| Net realized and unrealized gain (loss) |
10.90 | (18.95 | ) | 9.91 | 15.15 | 11.52 | ||||||||||||||
|
|
|
|
|
|
|
|
|
|
|
|||||||||||
| Total income (loss) from investment operations |
10.87 | (19.00 | ) | 9.69 | 14.98 | 11.42 | ||||||||||||||
|
|
|
|
|
|
|
|
|
|
|
|||||||||||
| Less Distributions |
||||||||||||||||||||
| Distributions from net realized capital gains |
(0.60 | ) | (11.14 | ) | (7.67 | ) | (5.72 | ) | (7.60 | ) | ||||||||||
|
|
|
|
|
|
|
|
|
|
|
|||||||||||
| Total distributions |
(0.60 | ) | (11.14 | ) | (7.67 | ) | (5.72 | ) | (7.60 | ) | ||||||||||
|
|
|
|
|
|
|
|
|
|
|
|||||||||||
| Net Asset Value, End of Period |
$ | 32.52 | $ | 22.25 | $ | 52.39 | $ | 50.37 | $ | 41.11 | ||||||||||
|
|
|
|
|
|
|
|
|
|
|
|||||||||||
| Total Return (%) (c) |
49.23 | (37.75 | ) | 20.88 | 40.31 | 32.52 | ||||||||||||||
| Ratios/Supplemental Data |
||||||||||||||||||||
| Gross ratio of expenses to average net assets (%) |
0.98 | 0.98 | 0.96 | 0.97 | 0.97 | |||||||||||||||
| Net ratio of expenses to average net assets (%) (d) |
0.83 | 0.88 | 0.87 | 0.88 | 0.88 | |||||||||||||||
| Ratio of net investment income (loss) to average net assets (%) |
(0.12 | ) | (0.17 | ) | (0.42 | ) | (0.39 | ) | (0.25 | ) | ||||||||||
| Portfolio turnover rate (%) |
22 | 65 | 41 | 37 | 43 | |||||||||||||||
| Net assets, end of period (in millions) |
$ | 277.1 | $ | 214.5 | $ | 336.4 | $ | 294.1 | $ | 220.5 | ||||||||||
Please see following page for Financial Highlights footnote legend.
See accompanying notes to financial statements.
BHFTII-10
Brighthouse Funds Trust II
BlackRock Capital Appreciation Portfolio
Financial Highlights
| Selected per share data | ||||||||||||||||||||
| Class E | ||||||||||||||||||||
| Year Ended December 31, | ||||||||||||||||||||
| 2023 | 2022 | 2021 | 2020 | 2019 | ||||||||||||||||
| Net Asset Value, Beginning of Period |
$ | 23.46 | $ | 54.28 | $ | 51.88 | $ | 42.15 | $ | 38.06 | ||||||||||
|
|
|
|
|
|
|
|
|
|
|
|||||||||||
| Income (Loss) from Investment Operations |
||||||||||||||||||||
| Net investment income (loss) (a) |
(0.01 | ) | (0.02 | ) | (0.17 | ) | (0.13 | ) | (0.06 | ) | ||||||||||
| Net realized and unrealized gain (loss) |
11.50 | (19.66 | ) | 10.24 | 15.58 | 11.78 | ||||||||||||||
|
|
|
|
|
|
|
|
|
|
|
|||||||||||
| Total income (loss) from investment operations |
11.49 | (19.68 | ) | 10.07 | 15.45 | 11.72 | ||||||||||||||
|
|
|
|
|
|
|
|
|
|
|
|||||||||||
| Less Distributions |
||||||||||||||||||||
| Distributions from net investment income |
0.00 | 0.00 | 0.00 | 0.00 | (0.03 | ) | ||||||||||||||
| Distributions from net realized capital gains |
(0.60 | ) | (11.14 | ) | (7.67 | ) | (5.72 | ) | (7.60 | ) | ||||||||||
|
|
|
|
|
|
|
|
|
|
|
|||||||||||
| Total distributions |
(0.60 | ) | (11.14 | ) | (7.67 | ) | (5.72 | ) | (7.63 | ) | ||||||||||
|
|
|
|
|
|
|
|
|
|
|
|||||||||||
| Net Asset Value, End of Period |
$ | 34.35 | $ | 23.46 | $ | 54.28 | $ | 51.88 | $ | 42.15 | ||||||||||
|
|
|
|
|
|
|
|
|
|
|
|||||||||||
| Total Return (%) (c) |
49.33 | (37.68 | ) | 21.02 | 40.44 | 32.66 | ||||||||||||||
| Ratios/Supplemental Data |
||||||||||||||||||||
| Gross ratio of expenses to average net assets (%) |
0.88 | 0.88 | 0.86 | 0.87 | 0.87 | |||||||||||||||
| Net ratio of expenses to average net assets (%) (d) |
0.73 | 0.78 | 0.77 | 0.78 | 0.78 | |||||||||||||||
| Ratio of net investment income (loss) to average net assets (%) |
(0.02 | ) | (0.07 | ) | (0.32 | ) | (0.29 | ) | (0.15 | ) | ||||||||||
| Portfolio turnover rate (%) |
22 | 65 | 41 | 37 | 43 | |||||||||||||||
| Net assets, end of period (in millions) |
$ | 44.2 | $ | 31.9 | $ | 55.7 | $ | 52.8 | $ | 42.9 | ||||||||||
| (a) | Per share amounts based on average shares outstanding during the period. | |||
| (b) | Net investment income (loss) was less than $0.01. | |||
| (c) | Total return does not reflect any insurance, sales, separate account or administrative charges of variable annuity or life insurance contracts or any additional expenses that contract owners may bear under their variable contracts. If these charges were included, the returns would be lower. | |||
| (d) | Includes the effects of management fee waivers (see Note 5 of the Notes to Financial Statements). | |||
| (e) | Ratio of net investment income (loss) to average net assets was less than 0.01%. | |||
See accompanying notes to financial statements.
BHFTII-11
Brighthouse Funds Trust II
BlackRock Capital Appreciation Portfolio
Notes to Financial Statements—December 31, 2023
1. Organization
Brighthouse Funds Trust II (the “Trust”) is organized as a Delaware statutory trust and registered under the Investment Company Act of 1940, as amended (the “1940 Act”), as an open-end management investment company. The Trust, which is managed by Brighthouse Investment Advisers, LLC (“Brighthouse Investment Advisers” or the “Adviser”), currently offers twenty-nine series (the “Portfolios”), each of which operates as a distinct investment vehicle of the Trust. The series included in this report is BlackRock Capital Appreciation Portfolio (the “Portfolio”), which is diversified. Shares of the Portfolio are not offered directly to the general public and are currently available only to separate accounts of insurance companies, including insurance companies affiliated with the Adviser.
The Portfolio has registered and offers three classes of shares: Class A, B and E shares. Shares of each class of the Portfolio represent an equal pro rata interest in the Portfolio and generally give the shareholder the same voting, dividend, liquidation, and other rights. Investment income, realized and unrealized capital gains and losses, the common expenses of the Portfolio, and certain Portfolio-level expense reductions, if any, are allocated on a pro rata basis to each class based on the relative net assets of each class to the net assets of the Portfolio. Each class of shares differs in its respective distribution plan and such distribution expenses are allocated to the corresponding class of shares.
2. Significant Accounting Policies
The preparation of financial statements in conformity with accounting principles generally accepted in the United States of America (“GAAP”) requires management to make estimates and assumptions that affect the reported amounts of assets and liabilities and disclosure of contingent assets and liabilities as of the date of the financial statements and the reported amounts of income and expenses during the reporting period. Actual results could differ from those estimates. In the preparation of these financial statements, management has evaluated events and transactions subsequent to December 31, 2023 through the date the financial statements were issued.
The Portfolio is an investment company and follows the accounting and reporting guidance of the Financial Accounting Standards Board (“FASB”) Accounting Standards Codification Topic 946- Financial Services- Investment Companies. The following is a summary of significant accounting policies consistently followed by the Portfolio in the preparation of its financial statements.
Investment Valuation and Fair Value Measurements - The Portfolio values its investments for purposes of calculating its net asset value (“NAV”) using procedures that allow for a variety of methodologies to be used to value the Portfolio’s investments. The specific methodology used for an investment may vary based on the market data available for a specific investment at the time the Portfolio calculates its NAV or based on other considerations. The procedures also permit a level of judgment to be used in the valuation process.
Domestic and foreign equity securities, such as common stock, exchange-traded funds, rights, warrants, and preferred stock, that are traded on a securities exchange on a valuation date are generally valued at their last quoted sale price or official closing price on the primary exchange for such security, or, if no sales occurred on that day, at the last reported bid price. Equity securities traded over-the-counter (“OTC”) are generally valued at the last reported bid price. In the event of a major exchange closing during the trading day, the Adviser may use other market information obtained from quotation reporting systems, established market makers, or pricing services in valuing the securities. Valuation adjustments may be applied to certain foreign equity securities that are traded solely on foreign exchanges that close before the time as of which the Portfolio determines its NAV to account for the market movement between the close of the foreign exchanges and the time as of which the Portfolio determines its NAV. The Portfolio may use a systematic fair valuation model provided by a pricing service to value securities principally traded in these foreign markets to adjust for possible market movements or other changes that may occur between the close of the foreign exchanges and the time as of which the Portfolio determines its NAV. Foreign equity securities valued using these valuation adjustments are generally categorized as Level 2 within the fair value hierarchy. Equity securities that are actively traded, and have no valuation adjustments applied, are categorized as Level 1 within the fair value hierarchy. Other equity securities traded on inactive markets or valued in reference to similar instruments traded on active markets are generally categorized as Level 2 within the fair value hierarchy.
Investments in registered open-end management investment companies are valued at reported NAV per share on the valuation date and are categorized as Level 1 within the fair value hierarchy.
Debt securities, including corporate, convertible and municipal bonds and notes; obligations of the U.S. Treasury and U.S. government agencies; foreign sovereign issues; and non-U.S. bonds, are generally valued based upon evaluated or composite bid quotations obtained from third-party pricing services and/or brokers and dealers selected by the Adviser (each a “pricing service”). Such pricing services may use matrix pricing, which considers observable inputs including, among other things, issuer details, maturity dates, interest rates, yield curves, rates of prepayment, credit risks/spreads, default rates, reported trades, broker-dealer quotes and quoted prices for similar assets. Short-term obligations with a remaining maturity of sixty days or less may be valued at amortized cost in the absence of market quotes, so long as the amortized cost value of such short-term debt instrument is approximately the same as the fair value of the instrument as determined without the use of amortized cost valuation. Floating rate loans are generally valued based upon
BHFTII-12
Brighthouse Funds Trust II
BlackRock Capital Appreciation Portfolio
Notes to Financial Statements—December 31, 2023—(Continued)
an evaluated or composite average of aggregate bid and ask quotations supplied by brokers or dealers, as obtained from the pricing service. Securities that use similar valuation techniques and inputs as described above are generally categorized as Level 2 within the fair value hierarchy.
Options, whether on securities, indices, futures contracts, or otherwise, traded on exchanges are valued at the last sale price available as of the close of business on a valuation day or, if there is no such price available, at the last reported bid price. These types of options are categorized as Level 1 within the fair value hierarchy. Futures contracts that are traded on commodity exchanges are valued at their settlement prices established by the exchanges on which they are traded as of the close of such exchanges and are categorized as Level 1 within the fair value hierarchy.
If no current market quotation is readily available or market value quotations are deemed to be unreliable for an investment, the fair value of the investment will be determined in accordance with procedures. A market quotation is readily available only when that quotation is a quoted price (unadjusted) in active markets for identical investments that the Portfolio can access at the measurement date, provided that a quotation will not be readily available if it is not reliable.
Pursuant to Rule 2a-5 under the 1940 Act, the Board of Trustees (the “Board” or “Trustees”) of the Trust has designated Brighthouse Investment Advisers, acting through its Valuation Committee (“Committee”), as the Portfolio’s “valuation designee” to perform the Portfolio’s fair value determinations. The Board oversees Brighthouse Investment Advisers in its role as the Valuation Designee and receives reports from Brighthouse Investment Advisers regarding its process and the valuation of the Portfolio’s investments to assist with such oversight.
No single standard for determining the fair value of an investment can be set forth because fair value depends upon the facts and circumstances with respect to each investment. Information relating to any relevant factors may be obtained by the Committee from any appropriate source, including the subadviser of the Portfolio, the Custodian, a pricing service, market maker and/or broker for such security or the issuer. Appropriate methodologies for determining fair value under particular circumstances may include: matrix pricing, a discounted cash flow analysis, comparisons of securities with comparable characteristics, value based on multiples of earnings, discount from market price of similar marketable securities, or a combination of these and other methods.
Foreign Currency Translation - The books and records of the Portfolio are maintained in U.S. dollars. The values of securities, currencies, and other assets and liabilities denominated in currencies other than the U.S. dollar are translated into U.S. dollars based upon foreign exchange rates prevailing at the end of the period. Purchases and sales of investment securities, income, and expenses are translated on the respective dates of such transactions. Because the values of investment securities are translated at the foreign exchange rates prevailing at the end of the period, that portion of the results of operations arising from changes in exchange rates and that portion of the results of operations reflecting fluctuations arising from changes in market prices of the investment securities are not separated. Such fluctuations are included in the net realized and unrealized gain or loss on investments.
Net realized foreign exchange gains or losses arise from activity in forward foreign currency exchange contracts, sales of foreign currency, currency gains or losses realized between the trade and settlement dates on securities transactions, and the difference between the amounts of dividends, interest, and foreign withholding taxes recorded by the Portfolio and the U.S. dollar-equivalent of the amounts actually received or paid by the Portfolio. Net unrealized foreign exchange gains and losses arise from changes in the value of assets and liabilities, other than investment securities, resulting from changes in foreign exchange rates.
Investment Transactions and Related Investment Income - Portfolio security transactions are recorded on the trade date. Dividend income is recorded on the ex-dividend date or, for certain foreign securities, when notified. Interest income, which includes amortization of premium and accretion of discount on debt securities, is recorded on the accrual basis. Realized gains and losses on investments are determined on the identified cost basis, which is the same basis used for federal income tax purposes. Foreign income and foreign capital gains on some foreign securities may be subject to foreign taxes, which are accrued as applicable. These foreign taxes have been provided for in accordance with the Portfolio’s understanding of the applicable countries’ tax rules and rates.
In consideration of recent decisions rendered by European courts, the Portfolio has filed tax reclaims for previously withheld taxes on dividends earned in certain European Union (“EU”) countries. These filings are subject to various administrative and judicial proceedings within these countries. During the year ended December 31, 2023, the Portfolio received EU tax reclaim payments in the amount of $54,141 that were not previously accrued for due to uncertainty of collectability. Such amount is included in dividends on the Statement of Operations. No other amounts for additional tax reclaims are reflected in the financial statements due to the uncertainty as to the ultimate resolution of proceedings, the likelihood of receipt of these reclaims, and the potential timing of payment.
Dividends and Distributions to Shareholders - The Portfolio records dividends and distributions on the ex-dividend date. Net realized gains from securities transactions (if any) are generally distributed annually to shareholders. The timing and characterization of certain income and capital gains distributions are determined in accordance with federal tax regulations that may differ from GAAP. Permanent book and tax basis differences relating to shareholder distributions will result in reclassification between distributable earnings (accumulated losses) and paid in surplus. These adjustments have no impact on net assets or the results of operations.
BHFTII-13
Brighthouse Funds Trust II
BlackRock Capital Appreciation Portfolio
Notes to Financial Statements—December 31, 2023—(Continued)
Income Taxes - It is the Portfolio’s policy to comply with the requirements of the Internal Revenue Code of 1986, as amended, and regulations thereunder, applicable to regulated investment companies, and to distribute, with respect to each taxable year, all of its taxable income to shareholders. Therefore, no federal income tax provision is required. The Portfolio files U.S. federal tax returns. No income tax returns are currently under examination. The Portfolio’s federal tax returns remain subject to examination by the Internal Revenue Service for three fiscal years after the returns are filed. As of December 31, 2023, the Portfolio had no uncertain tax positions that would require financial statement recognition, derecognition or disclosure.
Repurchase Agreements - The Portfolio may enter into repurchase agreements, under the terms of a Master Repurchase Agreement (“MRA”), or Global Master Repurchase Agreement (“GMRA”), with selected commercial banks and broker-dealers, under which the Portfolio acquires securities as collateral and agrees to resell the securities at an agreed-upon time and at an agreed-upon price. The Portfolio, through the Custodian or a subcustodian, under a tri-party repurchase agreement, receives delivery of the underlying securities collateralizing any repurchase agreements. It is the Portfolio’s policy that the market value of the collateral be equal to at least 100% of the repurchase price in the case of a repurchase agreement of one-day duration and equal to at least 102% of the repurchase price in the case of all other repurchase agreements. In the event of default or failure by a party to perform an obligation in connection with any repurchase transaction, the MRA or GMRA gives the non-defaulting party the right to set-off claims and to apply property held by it in connection with any repurchase transaction against obligations owed to it under the agreement.
At December 31, 2023, the Portfolio had direct investments in repurchase agreements with a gross value of $1,288,605. Additionally, the Portfolio invested cash collateral for loans of portfolio securities in repurchase agreements with a gross value of $7,373. The combined value of all repurchase agreements is included as part of investments at value on the Statement of Assets and Liabilities. The value of the related collateral exceeded the value of the repurchase agreements at December 31, 2023.
Securities Lending - The Portfolio may lend its portfolio securities to certain qualified brokers who borrow securities in order to complete certain securities transactions. By lending its portfolio securities, the Portfolio attempts to increase its net investment income through the receipt of income on collateral held from securities on loan. Any gain or loss in the market price of the loaned securities that might occur, any interest earned, and any dividends declared during the term of the loan, would accrue to the account of the Portfolio.
The Trust has entered into a Non-Custodial Securities Lending Agreement with JPMorgan Chase Bank, N.A. (the “Lending Agent”). Under the agreement, the Lending Agent is authorized to loan portfolio securities on the Portfolio’s behalf. In exchange, the Portfolio generally receives cash, U.S. Government securities, letters of credit, or other collateral deemed appropriate by the Adviser. The Portfolio receives collateral equal to at least 102% of the market value for loans secured by government securities or cash in the same currency as the loaned shares and 105% for all other loaned securities at each loan’s inception. Collateral representing at least 100% of the market value of the loaned securities is maintained for the duration of the loan. Any cash collateral received by the Portfolio is generally invested by the Lending Agent in short-term investments, which may include certificates of deposit, commercial paper, repurchase agreements, including repurchase agreements with respect to equity securities, time deposits, master demand notes and money market funds. The market value of investments made with cash collateral received are disclosed in the Schedule of Investments and the valuation techniques are described in Note 2. The value of the securities on loan may change each business day. If the market value of the collateral at the close of trading on a business day is less than 100% of the market value of the loaned securities at the close of trading on that day, the borrower is required to deliver, by the close of business on the following business day, an additional amount of collateral, so that the total amount of posted collateral is equal to at least 100% of the market value of all the loaned securities as of such preceding day. A portion of the income earned on the collateral is rebated to the borrower of the securities and the remainder is split between the Lending Agent and the Portfolio. On loans collateralized by U.S. government securities, a fee is received from the borrower and is allocated between the Portfolio and the Lending Agent.
Income received by the Portfolio in securities lending transactions during the year ended December 31, 2023 is reflected as securities lending income on the Statement of Operations. The values of any securities loaned by the Portfolio and the related collateral at December 31, 2023 are disclosed in the footnotes to the Schedule of Investments. The value of the related collateral received by the Portfolio exceeded the value of the securities out on loan at December 31, 2023.
The risks associated with lending portfolio securities include, but are not limited to, possible delays in receiving additional collateral or in the recovery of the loaned securities, possible loss of rights in the collateral should the borrower fail financially, as well as risk of loss in the value of the collateral or the value of the investments made with the collateral. To the extent the Portfolio uses cash collateral it receives to invest in repurchase agreements with respect to equity securities, it is subject to the risk of loss if the value of the equity securities declines and the counterparty defaults on its obligation to repurchase such securities. The Lending Agent shall indemnify the Portfolio in the case of default of any securities borrower, subject to the terms of the Non-Custodial Securities Lending Agreement.
All securities on loan are classified as Common Stocks in the Portfolio’s Schedule of Investments as of December 31, 2023. For all securities on loan, the remaining contractual maturity of the agreements is overnight and continuous.
BHFTII-14
Brighthouse Funds Trust II
BlackRock Capital Appreciation Portfolio
Notes to Financial Statements—December 31, 2023—(Continued)
3. Certain Risks
In the normal course of business, the Portfolio invests in securities and enters into transactions where risks exist. Those risks include:
Market Risk: The value of securities held by the Portfolio may decline in response to certain events, including those directly involving the issuers whose securities are owned by the Portfolio; conditions affecting the general economy; overall market changes; local, regional or global political, social or economic instability; currency, interest rate, and price fluctuations, or other factors including terrorism, war, natural disasters and the spread of infectious illness including epidemics or pandemics such as the COVID-19 pandemic. These events may also adversely affect the liquidity of securities held by the Portfolio.
Credit and Counterparty Risk: The Portfolio may be exposed to counterparty risk, or the risk that an entity with which the Portfolio has unsettled or open transactions may default. The potential loss could exceed the value of the financial assets and liabilities recorded in the financial statements. Financial assets that potentially expose the Portfolio to credit and counterparty risk consist principally of cash due from counterparties and investments. The Portfolio manages counterparty risk by entering into agreements only with counterparties that it believes have the financial resources to honor their obligations and by monitoring the financial stability of those counterparties. The Subadviser may attempt to mitigate counterparty risk by (i) periodically assessing the creditworthiness of its trading partners, (ii) monitoring and/or limiting the amount of its net exposure to each individual counterparty based on its assessment, and (iii) requiring collateral from the counterparty for certain transactions. In order to preserve certain safeguards for non-standard settlement trades, the Portfolio restricts its exposure to credit and counterparty losses by entering into master netting agreements (“Master Agreements”) with counterparties (approved brokers) with whom it undertakes a significant volume of transactions. Master Agreements govern the terms of certain transactions and reduce the counterparty risk associated with relevant transactions by specifying credit protection mechanisms and providing standardization that improves legal certainty. Master Agreements can also help limit counterparty risk by specifying collateral posting arrangements at pre-arranged exposure levels.
Repurchase and reverse repurchase agreements are primarily executed under GMRAs or MRAs, which provide the right to set-off. Each repurchase and reverse repurchase agreement is initially collateralized at the transaction level. In the event of default, the total market value exposure will be offset against collateral exchanged to date, which would result in a net receivable/(payable) that would be due from/to the counterparty.
Additional risks associated with each type of investment are described above within the respective security type notes. The Portfolio’s prospectus includes a discussion of the principal risks of investing in the Portfolio.
4. Investment Transactions
Aggregate cost of purchases and proceeds of sales of investment securities, excluding short-term securities, for the year ended December 31, 2023 were as follows:
| Purchases | Sales | |||||||||||||
| U.S. Government | Non-U.S. Government | U.S. Government | Non-U.S. Government | |||||||||||
| $ | 0 | $ | 336,650,160 | $ | 0 | $ | 611,419,691 | |||||||
5. Investment Management Fees and Other Transactions with Affiliates
Investment Management Agreement - Brighthouse Investment Advisers is the investment adviser to the Portfolio. The Trust has entered into an investment management agreement with Brighthouse Investment Advisers with respect to the Portfolio. For providing investment management services to the Portfolio, Brighthouse Investment Advisers receives monthly compensation at the following annual rates:
| Management Fees earned by |
% per annum |
Average daily net assets | ||||
| $10,691,577 | 0.730 | % | Of the first $1 billion | |||
| 0.650 | % | On amounts in excess of $1 billion | ||||
Brighthouse Investment Advisers has entered into an investment subadvisory agreement with respect to managing the Portfolio. BlackRock Advisors, LLC is compensated by Brighthouse Investment Advisers to provide subadvisory services for the Portfolio.
BHFTII-15
Brighthouse Funds Trust II
BlackRock Capital Appreciation Portfolio
Notes to Financial Statements—December 31, 2023—(Continued)
Management Fee Waivers - Pursuant to a management fee waiver agreement, the Adviser has agreed, for the period May 1, 2023 to April 30, 2024, to reduce its advisory fees set out above under “Investment Management Agreement” for each class of the Portfolio as follows:
| % per annum reduction |
Average daily net assets | |
| 0.115% | Of the first $350 million | |
| 0.165% | On the next $350 million | |
| 0.225% | On the next $300 million | |
| 0.160% | On amounts in excess of $1 billion |
An identical expense agreement was in place for the period March 1, 2023 to April 30, 2023.
Prior to March 1, 2023, the Adviser had agreed, for the period April 29, 2022 to February 28, 2023 to reduce its advisory fees set out above under “Investment Management Agreement” for each class of the Portfolio as follows:
| % per annum reduction |
Average daily net assets | |
| 0.115% | Of the first $1 billion | |
| 0.050% | On the next $500 million | |
| 0.090% | On the next $1 billion | |
| 0.110% | On amounts in excess of $2.5 billion |
Amounts waived for the year ended December 31, 2023 are shown as management fee waivers in the Statement of Operations.
Certain officers and trustees of the Trust may also be officers of the Adviser; however, such officers and trustees receive no compensation from the Trust.
Transfer Agency Agreement - Brighthouse Life Insurance Company serves as the transfer agent for the Trust. Brighthouse Life Insurance Company receives no fees for its services to the Trust.
Distribution and Service Fees - The Trust has a distribution agreement with Brighthouse Securities, LLC (the “Distributor”) pursuant to which the Distributor serves as the general distributor of shares of each class (each a “Class”) of each Portfolio. The Distributor is an affiliate of the Trust. The Trust has adopted a Distribution and Services Plan (the “D&S Plan”) relating to Class B, Class D, Class E, Class F and Class G shares of each Portfolio, under Rule 12b-1 under the 1940 Act, pursuant to which the Trust may pay the Distributor a fee (the “Service Fee”) at an annual rate not to exceed 0.25% of each such Portfolio’s average daily net assets attributable to the Class B, Class D, Class E, Class F and Class G shares of the Trust. Each Portfolio may not offer shares of each Class. The D&S Plan also authorizes the Trust, on behalf of each of its Portfolios, to pay to the Distributor a distribution fee (the “Distribution Fee” and together with the Service Fee, the “Fees”) at an annual rate of up to 0.25% of each Portfolio’s average daily net assets attributable to the Class B, Class D, Class E, Class F, and Class G shares in consideration of the services rendered in connection with the sale of such shares by the Distributor. Under the Distribution Agreement with respect to the Trust, Fees are currently paid at an annual rate of 0.25% of average daily net assets in the case of Class B shares, 0.10% of average daily net assets in the case of Class D shares, 0.15% of average daily net assets in the case of Class E shares, 0.20% of average daily net assets in the case of Class F shares and 0.30% of average daily net assets in the case of Class G shares. The D&S Plan is known as a “compensation plan” because the Trust makes payments to the Distributor for services rendered regardless of the actual level of expenditures by the Distributor. Amounts incurred by the Portfolio for the year ended December 31, 2023 are shown as Distribution and service fees in the Statement of Operations.
Deferred Trustee Compensation - Each Trustee who is not currently an employee of the Adviser or any of its affiliates receives compensation from the Trust for his or her service to the Trust. A deferred compensation plan (the “Plan”) is available to the Trustees on a voluntary basis. Deferred amounts remain in the Trust until distributed in accordance with the provisions of the Plan. The value of a participating Trustee’s deferral account is based on theoretical investments of deferred amounts on the normal payment dates in certain portfolios of the Trust or Brighthouse Funds Trust I, an affiliate of the Trust, as designated by the participating Trustee. Changes in the value of participants’ deferral accounts are reflected as a component of Trustees’ fees and expenses in the Statement of Operations. The portion of the accrued obligations allocated to the Portfolio under the Plan is reflected as Deferred trustees’ fees in the Statement of Assets and Liabilities.
6. Contractual Obligations
Under the Trust’s organizational documents, its officers and Trustees may be indemnified against certain liabilities and expenses arising out of the performance of their duties to the Trust. Additionally, the Trust has a variety of indemnification obligations under contracts with its service providers. The Trust’s maximum exposure under these arrangements is unknown, as this would involve future claims that may be made against the Trust that have not yet occurred.
BHFTII-16
Brighthouse Funds Trust II
BlackRock Capital Appreciation Portfolio
Notes to Financial Statements—December 31, 2023—(Continued)
7. Income Tax Information
The cost basis of investments for federal income tax purposes at December 31, 2023 was as follows:
| Cost basis of investments |
$ | 1,062,674,077 | ||
|
|
|
|||
| Gross unrealized appreciation |
589,628,547 | |||
| Gross unrealized (depreciation) |
(8,415,627 | ) | ||
|
|
|
|||
| Net unrealized appreciation (depreciation) |
$ | 581,212,920 | ||
|
|
|
The tax character of distributions paid for the years ended December 31, 2023 and 2022 were as follows:
| Ordinary Income | Long-Term Capital Gain | Total | ||||||||||||||||||||
| 2023 | 2022 | 2023 | 2022 | 2023 | 2022 | |||||||||||||||||
| $ | 524,044 | $ | 174,966 | $ | 30,422,230 | $ | 426,247,869 | $ | 30,946,274 | $ | 426,422,835 | |||||||||||
As of December 31, 2023, the components of distributable earnings (accumulated losses) on a federal income tax basis were as follows:
| Undistributed Ordinary Income |
Undistributed Long-Term Capital Gain |
Net Unrealized Appreciation (Depreciation) |
Accumulated Capital Losses |
Total | ||||||||||||||
| $ | 25,398,102 | $ | 80,629,419 | $ | 581,215,710 | $ | — | $ | 687,243,231 | |||||||||
The Portfolio utilizes the provisions of the federal income tax laws that provide for the carryforward of capital losses for prior years, offsetting such losses against any future realized capital gains. Net capital losses may be carried forward indefinitely and their character is retained as short-term and/or long-term losses.
As of December 31, 2023, the Portfolio had no accumulated capital losses.
8. Recent Accounting Pronouncement & Regulatory Updates
In June 2022, FASB issued Accounting Standards Update 2022-03—Fair Value Measurement (Topic 820)—Fair Value Measurement of Equity Securities Subject to Contractual Sale Restrictions (“ASU 2022-03”). ASU 2022-03 clarifies the guidance in Topic 820 to indicate that a contractual sale restriction should not be considered in the fair value of an equity security subject to such a restriction, and requires entities with investments in equity securities subject to contractual sale restrictions to disclose certain qualitative and quantitative information about such securities. ASU 2022-03 is effective for fiscal years, and interim periods within those fiscal years, beginning after December 15, 2023. ASU 2022-03 is only applicable to an equity security in which the contractual arrangement that restricts its sale is executed or modified on or after the adoption date.
Effective January 24, 2023, the Securities and Exchange Commission adopted rule and form amendments that require open-end management investment companies to transmit concise and visually engaging annual and semiannual reports to shareholders that highlight certain information deemed by the SEC to be particularly important for investors. Certain other information, including financial statements, will no longer appear in shareholder reports but will, as required, be available online, delivered free of charge upon request, and filed on a semiannual basis on Form N-CSR. The rule and form amendments have a compliance date of July 24, 2024. Accordingly, the rule and form amendments will not impact the Portfolio until its 2024 semiannual shareholder report.
BHFTII-17
Brighthouse Funds Trust II
BlackRock Capital Appreciation Portfolio
Report of Independent Registered Public Accounting Firm
To the Board of Trustees of Brighthouse Funds Trust II and Shareholders of the BlackRock Capital Appreciation Portfolio:
Opinion on the Financial Statements and Financial Highlights
We have audited the accompanying statement of assets and liabilities, including the schedule of investments, of the BlackRock Capital Appreciation Portfolio (the “Fund”) (one of the funds constituting the Brighthouse Funds Trust II), as of December 31, 2023, the related statement of operations for the year then ended, the statements of changes in net assets for each of the two years in the period then ended, the financial highlights for each of the five years in the period then ended, and the related notes. In our opinion, the financial statements and financial highlights present fairly, in all material respects, the financial position of the Fund as of December 31, 2023, and the results of its operations for the year then ended, the changes in its net assets for each of the two years in the period then ended, and the financial highlights for each of the five years in the period then ended in conformity with accounting principles generally accepted in the United States of America.
Basis for Opinion
These financial statements and financial highlights are the responsibility of the Fund’s management. Our responsibility is to express an opinion on the Fund’s financial statements and financial highlights based on our audits. We are a public accounting firm registered with the Public Company Accounting Oversight Board (United States) (PCAOB) and are required to be independent with respect to the Fund in accordance with the U.S. federal securities laws and the applicable rules and regulations of the Securities and Exchange Commission and the PCAOB.
We conducted our audits in accordance with the standards of the PCAOB. Those standards require that we plan and perform the audit to obtain reasonable assurance about whether the financial statements and financial highlights are free of material misstatement, whether due to error or fraud. The Fund is not required to have, nor were we engaged to perform, an audit of its internal control over financial reporting. As part of our audits we are required to obtain an understanding of internal control over financial reporting but not for the purpose of expressing an opinion on the effectiveness of the Fund’s internal control over financial reporting. Accordingly, we express no such opinion.
Our audits included performing procedures to assess the risks of material misstatement of the financial statements and financial highlights, whether due to error or fraud, and performing procedures that respond to those risks. Such procedures included examining, on a test basis, evidence regarding the amounts and disclosures in the financial statements and financial highlights. Our audits also included evaluating the accounting principles used and significant estimates made by management, as well as evaluating the overall presentation of the financial statements and financial highlights. Our procedures included confirmation of securities owned as of December 31, 2023, by correspondence with the custodian and brokers; when replies were not received from brokers, we performed other auditing procedures. We believe that our audits provide a reasonable basis for our opinion.
/s/ Deloitte & Touche LLP
Boston, Massachusetts
February 23, 2024
We have served as the auditor of one or more Brighthouse investment companies since 1983.
BHFTII-18
Brighthouse Funds Trust II
Trustees and Officers
MANAGEMENT OF THE TRUSTS
The Boards of Trustees (the “Board”) of Brighthouse Funds Trust I and Brighthouse Funds Trust II (“Trust I” and “Trust II”, respectively, and collectively the “Trusts”) supervise the Trusts and are responsible for representing the interests of shareholders. The Trustees, the Chairman of the Board and the Chairmen of each subcommittee are the same for both Trusts. The Trustees of each Trust meet periodically throughout the year to oversee the Portfolios’ activities, reviewing, among other things, each Portfolio’s performance and its contractual arrangements with various service providers. The Trustees of each Trust elect the officers of the Trust, who are responsible for administering the Trust’s day-to-day operations.
Trustees and Officers
The Trustees and executive officers of the Trusts, as well as their ages and their principal occupations during the past five years, are set forth below. Unless otherwise indicated, the business address of each is c/o Brighthouse Funds Trust I and Brighthouse Funds Trust II, 11225 N. Community House Rd., Charolette, North Carolina 28277. Each Trustee who is deemed an “interested person,” as such term is defined in the 1940 Act, is referred to as an “Interested Trustee.” Those Trustees who are not “interested persons,” as such term is defined in the 1940 Act, are referred to as “Independent Trustees.” There is no limit to the term a Trustee may serve, other than pursuant to the retirement policy adopted by the Independent Trustees. Trustees serve until their death, resignation, retirement or removal in accordance with Trust I’s and Trust II’s respective organizational documents and policies adopted by the Board of the Trust from time to time. Officers hold office at the pleasure of each Board and serve until their removal or resignation in accordance with the Trusts’ respective organizational documents and policies adopted by the Board of each Trust from time to time.
Trustees of the Trusts
| Name and Year of Birth |
Position(s) |
Term of Office |
Principal Occupation(s) During the Past |
Number of |
Other Directorships Held | |||||
| Interested Trustee | ||||||||||
| John Rosenthal* (1960) |
Trustee | Indefinite; From May 2016 (Trust I and Trust II) to present | Chief Investment Officer, Brighthouse Financial, Inc. (2016 to present). | 73 | None | |||||
| Independent Trustees | ||||||||||
| Dawn M. Vroegop (1966) |
Trustee and Chair of the Board | Indefinite; From December 2000 (Trust I)/May 2009 (Trust II) to present as Trustee; From May 2016 (Trust I and Trust II) until present as Chair | Retired; Private Investor. | 73 | Trustee, Driehaus Mutual Funds (8 portfolios).** | |||||
| Stephen M. Alderman (1959) |
Trustee | Indefinite; From December 2000 (Trust I)/April 2012 (Trust II) to present | Vice President and General Counsel, IHR Aerial Solutions, LLC; Until 2022, General Counsel, Illini Hi-Reach, Inc.; Until 2020, Shareholder in the law firm of Garfield & Merel, Ltd. | 73 | None | |||||
| Robert J. Boulware (1956) |
Trustee | Indefinite; From March 2008 (Trust I)/April 2012 (Trust II) to present | Managing Member, Pilgrim Funds, LLC (private equity fund). | 73 | Trustee, Vertical Capital Income Fund (closed-end fund);** Trustee, The Private Shares Fund (closed- end fund);** Until 2021, Director, Mid- Con Energy Partners, LP (energy);** Until 2020, Director, Gainsco, Inc. (auto insurance).** | |||||
BHFTII-19
Brighthouse Funds Trust II
Trustees and Officers—(Continued)
| Name and Year of Birth |
Position(s) |
Term of Office |
Principal Occupation(s) During the Past |
Number of |
Other Directorships Held | |||||
| Susan C. Gause (1952) |
Trustee | Indefinite; From March 2008 (Trust I)/April 2012 (Trust II) to present | Private Investor. | 73 | Trustee, HSBC Funds (4 portfolios).** | |||||
| Nancy Hawthorne (1951) |
Trustee | Indefinite; From May 2003 (Trust II)/April 2012 (Trust I) to present | Private Investor. | 73 | Trustee, First Eagle Credit Opportunities Fund;** Trustee and Chair of the Board of Trustees, First Eagle Global Opportunities Fund;** Director, Avid Technology, Inc;** Director, CRA International, Inc.** | |||||
Executive Officers of the Trusts
| Name and Year of Birth |
Position(s) |
Term of Office |
Principal Occupation(s) | |||
| Kristi Slavin (1973) | President and Chief Executive Officer, of Trust I and Trust II | From May 2016 (Trust I and Trust II) to present |
President, Brighthouse Investment Advisers, LLC (2016-present). | |||
| Alan R. Otis (1971) | Chief Financial Officer and Treasurer, of Trust I and Trust II | From November 2017 (Trust I and Trust II) to present |
Executive Vice President, Brighthouse Investment Advisers, LLC (2017-present); formerly, Vice President, Brighthouse Investment Advisers, LLC (2012-2017); Assistant Treasurer, Trust I and Trust II (2012-2017). | |||
| Thomas Watterson (1985) | Secretary, of Trust I and Trust II | From November 2023 (Trust I and Trust II) to present |
Executive Vice President, Chief Legal Officer and Secretary, Brighthouse Investment Advisers, LLC (2023-Present); Managing Corporate Counsel, Brighthouse Financial Inc. (2023-present); Managing Counsel and Director, The Bank of New York Mellon Corporation (2019-2023); Counsel and Vice President, The Bank of New York Mellon Corporation (2016-2019). | |||
| Katie Hellmann (1980) | Chief Compliance Officer (“CCO”), of Trust I and Trust II | From May 2023 (Trust I and Trust II) to present |
Chief Compliance Officer, Brighthouse Investment Advisers, LLC (2023-present) and Head of Funds and Investments Compliance (2023-present). Deputy Chief Compliance Officer, Transamerica Asset Management (2022-2023). Leader and Senior Compliance Counsel – Funds Compliance, Edward Jones (2017-2022). | |||
| Rosemary Morgan (1983) | Anti-Money Laundering Officer, of Trust I and Trust II | From May 2023 (Trust I and Trust II) to present |
Chief Privacy Officer, Leader of Compliance Programs and Assistant General Counsel, Brighthouse Financial, Inc. (2019-2022); Chief Privacy Officer, Head of Compliance Programs & Contracts Law, Brighthouse Financial, Inc. (2022-2023), Chief Compliance Officer and Associate General Counsel, Brighthouse Financial, Inc. (2023-present); Vice President and Chief Compliance Officer, Brighthouse Life Insurance Company (2023-present); Vice President and Chief Compliance Officer (2023-present), Brighthouse Life Insurance Company of NY; Vice President and Chief Compliance Officer (2023-present), New England Life Insurance Company. | |||
| Anna Koska (1981) | Vice President, of Trust I and Trust II | From June 2022 (Trust I and Trust II) to present |
Vice President, Investment and Advisory Services, Brighthouse Investment Advisers, LLC (2022-present); Director of Investment and Advisory Services, Brighthouse Investment Advisers, LLC (2019-2022); Senior Portfolio Analyst, Brighthouse Investment Advisers, LLC (2017-2019). | |||
| * | Mr. Rosenthal is an “interested person” of the Trusts because of his position with Brighthouse Financial, Inc. (“Brighthouse Financial”), an affiliate of BIA. |
| ** | Indicates a directorship with a registered investment company or a company subject to the reporting requirements of the Securities Exchange Act of 1934, as amended. |
| (1) | Previous positions during the past five years with the Trusts, MetLife, Inc. or the Adviser are omitted if not materially different. |
| (2) | The Fund Complex includes 44 Trust I Portfolios and 29 Trust II Portfolios. |
BHFTII-20
Brighthouse Funds Trust II
BlackRock Capital Appreciation Portfolio
Board of Trustees’ Consideration of Advisory and Sub-Advisory Agreements
At a meeting held on November 13-14, 2023 (the “November Meeting”), the Boards of Trustees (the “Board”) of Brighthouse Funds Trust I and Brighthouse Funds Trust II (“BFT I” and “BFT II,” respectively, and collectively, the “Trusts”), including a majority of the Trustees who are not “interested persons” of the Trusts (the “Independent Trustees”) under the Investment Company Act of 1940 (the “1940 Act”), approved the continuation of the Trusts’ advisory agreements (each an “Advisory Agreement”) with Brighthouse Investment Advisers, LLC (the “Adviser”) and the applicable sub-advisory and sub-sub-advisory agreements (each a “Sub-Advisory Agreement” and collectively with the Advisory Agreement, the “Agreements”) between the Adviser and the investment sub-advisers and sub-sub-adviser (each a “Sub-Adviser,” and collectively, the “Sub-Advisers”) for the series of the Trusts (each a “Portfolio,” and collectively, the “Portfolios”) for the annual contract renewal period from January 1, 2024 through December 31, 2024.
The Board met with personnel of the Adviser on September 28-29, 2023 (the “September Meeting”) for the specific purpose of giving preliminary consideration to the proposed continuation of the Agreements, including consideration to information that the Adviser and Sub-Advisers had provided for the Board’s review at the request of the Independent Trustees. At the September Meeting, the Adviser reviewed with the Board the performance and fees experienced by each Portfolio, as well as other information. During and after the September Meeting, the Independent Trustees requested additional information and clarifications that the Adviser addressed at the November Meeting (the September Meeting and the November Meeting are referred to collectively as, the “Meetings”). During the contract renewal process, and throughout the year, the Independent Trustees were advised by independent legal counsel, and they met with independent legal counsel in executive sessions outside of the presence of management on a number of occasions to discuss, among other things, the renewal of the Agreements.
In considering the continuation of the Agreements, the Board reviewed a variety of materials that were provided for the specific purpose of assisting the Board in the renewal process, along with various information and materials that were provided to and discussed with the Board throughout the year, at regularly scheduled meetings of the Board and its committees. In particular, information for each Portfolio included, but was not limited to, reports on investment performance, expenses, legal and compliance matters, and asset pricing. Information about the Adviser and each Sub-Adviser included, but was not limited to, reports on the business, operations, and performance of the Adviser and the Sub-Advisers and reports that the Adviser and Sub-Advisers had prepared specifically for the renewal process.
In considering the continuation of the Agreements, the Board also reviewed, among other things, a report for each Portfolio that was prepared by Broadridge (“Broadridge”), an independent organization, which set forth comparative performance and expense information for each Portfolio. In addition, the Independent Trustees reviewed a report that was prepared by JDL Consultants, LLC (“JDL”), an independent consultant to the Independent Trustees, which examined the Broadridge reports for each Portfolio (“JDL Report”). The Independent Trustees met in executive session with representatives of JDL during the September Meeting to review the JDL Report.
At the November Meeting, the Board, including a majority of the Independent Trustees, concluded that the nature, extent, and quality of services provided by the Adviser and each Sub-Adviser supported the renewal of the Agreements. The Board also concluded that the investment services provided to and the performance of each Portfolio was such that each Agreement should continue, and that the fees paid by each Portfolio to the Adviser appeared to be reasonable in light of the nature, extent, and quality of the services provided by the Adviser and each Sub-Adviser. Further, the Board concluded that the Adviser’s profitability in providing services under the Advisory Agreements did not appear unreasonable in light of the nature, extent, and quality of the services provided by the Adviser. The Board reviewed the extent to which the investment advisory fees paid by the Portfolios shared economies of scale with investors or entailed the potential to share economies of scale with investors and concluded that those considerations generally supported the renewal of each Agreement. Finally, the Board considered the Adviser’s recommendation that it approve the renewal of each Sub-Advisory Agreement.
In approving the continuation of each Agreement, the Board, including the Independent Trustees, gave attention to all of the information that was furnished, and each Trustee placed varying degrees of importance on the various pieces of information that were provided to them. The Board evaluated the information provided to it on a Portfolio-by-Portfolio basis, and its decision was made separately with respect to each Portfolio. The following paragraphs provide more information about some of the primary factors that were relevant to the Board’s decisions. The Board did not identify any single factor as determinative, and the Trustees generally attributed different weights to various factors for the various Portfolios.
Nature, extent and quality of services. The Board evaluated the nature, extent, and quality of the services that the Adviser and the Sub-Advisers, as relevant, provided to the Portfolios. The Board considered the Adviser’s services as investment manager to the Portfolios, including its services relating to the hiring and oversight of the Sub-Advisers and, in particular, their investment programs and personnel, succession management of key personnel, trading practices, compliance programs and personnel, and risk management
BHFTII-21
Brighthouse Funds Trust II
BlackRock Capital Appreciation Portfolio
Board of Trustees’ Consideration of Advisory and Sub-Advisory Agreements—(Continued)
programs, among other things. The Adviser’s services in coordinating and overseeing the activities of the Trusts’ other service providers were also considered. The Board also considered the systems and processes required by the Adviser to meet additional regulatory and compliance requirements resulting from U.S. Securities and Exchange Commission and other regulatory initiatives, including related to liquidity, valuation, and derivatives risk management. The Board considered information received from the Trusts’ Chief Compliance Officer regarding the Portfolios’ compliance policies and procedures that were established pursuant to Rule 38a-l under the 1940 Act, and relevant aspects of the Adviser’s and Sub-Advisers’ compliance policies and procedures. The Board also noted that it was the practice of the Adviser’s investment, compliance, and legal staff to conduct periodic meetings (through various media) with the Sub-Advisers throughout the year in order to review and assess the services that are provided to the Portfolios, and that personnel of the Adviser routinely prepare and present reports to the Board regarding those meetings. In addition, during the Meetings and throughout the year, the Board considered the expertise, experience, and performance of the personnel of the Adviser who performed the various services that are mentioned above.
With respect to the services provided by each of the Sub-Advisers, the Board considered a variety of information that the Adviser and each Sub-Adviser prepared for the Board’s review. The Board considered each Sub-Adviser’s investment process, each Sub-Adviser’s overall organization and business plans and the investment performance experienced by the Portfolio (as described in more detail below). The Board took into account that each Sub-Adviser’s responsibilities include, among other things, the development and maintenance of an investment program for the applicable Portfolio, the selection of investments and the placement of orders for the purchase and sale of such assets, and the implementation of compliance controls related to the performance of these services. The Board considered, based on the information provided, each Sub-Adviser’s staffing with respect to the management of the Portfolio and other information relating to the Sub-Adviser’s business and operations. The Board also considered the Sub-Adviser’s overall resources and information with respect to any recent turnover of key personnel at the Sub-Adviser. The Board reviewed each Sub-Adviser’s investment experience, as well as information provided regarding the Sub-Adviser’s personnel who provide services to the Portfolios. The Board also considered, among other things, information about each Sub-Adviser’s compliance program, including regarding any compliance matters involving a Sub-Adviser that had been brought to the Board’s attention during the year, as well as the Adviser’s assessment of the financial condition of each Sub-Adviser.
Performance. The Board placed emphasis on the performance of each Portfolio in the context of the performance of the relevant markets in which the Portfolio invests. The Board considered the Adviser’s quarterly presentations to the Board of detailed information about each Portfolio’s investment strategies and performance results and composition, including discussions regarding the relevant effects of market conditions. The Board reviewed and considered the reports prepared by Broadridge, which provided a statistical analysis comparing each Portfolio’s investment performance to that of comparable funds underlying variable insurance products (the “Performance Universe”), and the JDL Report. The Board also compared the performance of each Portfolio to that of comparable funds and other accounts that were managed by the relevant Sub-Adviser, to the extent such information was provided. The Board considered each Portfolio’s performance for periods subsequent to the performance period covered by the Broadridge reports and considered the Adviser’s assessment of the same. The Board also noted that while it found the data provided by Broadridge generally useful, it recognized the limitations of such data, including, in particular, that notable differences may exist between a Portfolio and the other funds in a Broadridge category (for example, with respect to investment strategies) and that the results of the performance comparisons may vary depending on (i) the end dates for the performance periods that were selected and (ii) the selection of the peer groups.
The Board focused particular attention on Portfolios with less favorable performance records. The Board noted the Adviser’s focus on each Sub-Adviser’s performance and that the Adviser had been active in monitoring and responding to any performance issues with respect to the Portfolios.
Fees and Expenses. The Board gave consideration to the level and method of computing the fees payable under the Agreements. The Board reviewed and considered the information in the JDL Report concerning fees and expenses. The Board also reviewed and considered the Broadridge report for each Portfolio, which included various comparisons of the Portfolio’s fees (at December 31, 2022 and various asset levels) and expenses with those of its peers, including, as applicable, a broad group of peer funds (“Expense Universe”), a narrower group of peer funds (“Expense Group”), a broad group of peer sub-advised funds (“Sub-advised Expense Universe”), and a narrower group of peer sub-advised funds (“Sub-advised Expense Group”). In particular, the Board reviewed comparisons of each Portfolio’s contractual management fees with its Expense Group and Sub-advised Expense Universe, contractual sub-adviser fees with its Sub-advised Expense Universe and Sub-advised Expense Group, and total expenses with its Expense Universe, Expense Group and Sub-advised Expense Universe. The Board considered that Broadridge selected the peer funds, which were funds underlying variable insurance products that Broadridge deemed to be comparable to the Portfolios. The Board considered that the fee and expense information in the Broadridge report for each Portfolio reflected information as of the Portfolio’s most recent fiscal year
BHFTII-22
Brighthouse Funds Trust II
BlackRock Capital Appreciation Portfolio
Board of Trustees’ Consideration of Advisory and Sub-Advisory Agreements—(Continued)
end at the time the Broadridge report was issued and that historical asset levels may differ from current asset levels, particularly in a period of market volatility. In addition, the Board compared the fee payable to a Sub-Adviser by the Adviser with respect to the Portfolio to the fee payable to the Sub-Adviser by other comparable funds and other accounts, to the extent such information was provided.
The Board noted that the sub-advisory fees for the Portfolios are negotiated at arm’s length by the Adviser and are paid by the Adviser out of its advisory fees. The Board also considered that the Adviser had entered into expense limitation or management fee waiver agreements with certain of the Portfolios pursuant to which the Adviser had agreed to waive a portion of its advisory fee and/or reimburse certain expenses as a means of limiting a Portfolio’s total annual operating expenses or passing through the benefit of a subadvisory fee concession to a Portfolio, as applicable.
Profitability. The Board examined the profitability to the Adviser of each Advisory Agreement, on a Portfolio-by-Portfolio basis. The Board also considered that an affiliate of the Adviser, Brighthouse Securities, LLC, serves as distributor for the Trusts, and, as such, receives Rule 12b-1 payments to support the distribution of the Portfolios. The Board considered the profitability to the Sub-Advisers and their affiliates of their relationships with the Portfolios, to the extent provided, and the Board considered the ability of the Adviser to negotiate with a Sub-Adviser at arm’s length. In reviewing the profitability information, the Board recognized that expense allocation methodologies are inherently subjective and various methodologies may be reasonable while producing different results.
Economies of scale. The Board considered each Portfolio’s fees in light of its size. The Board noted the fee schedules for the Portfolios that contain breakpoints that reduce the fee rate above specified asset levels, including breakpoints in the Advisory Agreements and any corresponding Sub-Advisory Agreement. The Board noted those Portfolios that did not have breakpoints in their advisory fees and considered management’s explanation of the same.
The Board considered the effective fees under the Advisory Agreement and Sub-Advisory Agreement for each Portfolio as a percentage of assets at different asset levels and possible economies of scale that may be realized if the assets of the Portfolio grow. The Board examined, among other data, the effect of a Portfolio’s growth in size, and reduction in size, on various fee schedules. The Board also generally noted that if a Portfolio’s assets increase over time, the Portfolio may realize economies of scale if assets increase proportionally more than certain other expenses.
Other factors. The Board considered other benefits that may be realized by the Adviser and its affiliates from their relationships with the Trusts. Among the benefits realized by the Adviser, the Board recognized that Brighthouse Securities, LLC, as the distributor for the Trusts, receives payments pursuant to Rule 12b-1 from the Portfolios to help compensate for the provision of shareholder services and distribution activities. The Board considered that a Sub-Adviser may engage in soft dollar transactions in managing a Portfolio. In addition, the Board considered that a Sub-Adviser may be affiliated with registered broker-dealers that may, from time to time, receive brokerage commissions from a Portfolio in connection with the sale of portfolio securities (subject to applicable best execution obligations). The Board also considered that a Sub-Adviser and its affiliates could benefit from the opportunity to provide advisory services to additional portfolios of the Trusts and overall reputational benefits.
The Board considered information from the Adviser and Sub-Advisers pertaining to potential conflicts of interest, and the manner in which any potential conflicts were mitigated. In its review, the Board considered information regarding various business relationships among the Adviser and its affiliates and various Sub-Advisers and their affiliates. The Board also considered information about services and/or payments provided to the Adviser by the Sub-Advisers in connection with marketing activities. The Board considered representations from the Adviser that such business relationships and any payments were not considered in the Adviser’s recommendation to renew any of the Sub-Advisory Agreements.
* * * * *
BlackRock Capital Appreciation Portfolio. The Board also considered the following information in relation to the Agreements with the Adviser and BlackRock Advisors, LLC regarding the Portfolio:
Among other data relating specifically to the Portfolio’s performance, the Board considered that the Portfolio outperformed the median of its Performance Universe and the average of its Morningstar Category for the one-year period ended June 30, 2023 and underperformed the median of its Performance Universe and the average of its Morningstar Category for the three-and five-year periods ended June 30, 2023. The Board further considered that the Portfolio outperformed its benchmark, the Russell 1000 Growth Index, for the one-year period ended October 31, 2023 and underperformed the same benchmark for the three-and five-year periods ended October 31, 2023. The Board took into account management’s discussion of the Portfolio’s performance, including with respect to prevailing market conditions. The Board also noted the presence of certain management fee waivers in effect for the Portfolio. In
BHFTII-23
Brighthouse Funds Trust II
BlackRock Capital Appreciation Portfolio
Board of Trustees’ Consideration of Advisory and Sub-Advisory Agreements—(Continued)
addition, the Board considered that the Adviser had negotiated reductions to the Portfolio’s sub-advisory fee schedule and that the Adviser agreed to waive a portion of its advisory fee in order for contract holders to benefit from the lower sub-advisory fee effective March 1, 2023.
The Board also considered that the Portfolio’s actual management fees and total expenses (exclusive of 12b-1 fees) were below the Expense Group median, the Expense Universe median, and the Sub-advised Expense Universe median. The Board noted that the Portfolio’s contractual management fees were above the asset-weighted average of the Investment Classification/Morningstar Category selected by Broadridge at the Portfolio’s current size. The Board also noted that the Portfolio’s contractual sub-advisory fees were below the averages of the Sub-advised Expense Group and the Sub-advised Expense Universe at the Portfolio’s current size.
BHFTII-24
Brighthouse Funds Trust II
BlackRock Ultra-Short Term Bond Portfolio
Managed By BlackRock Advisors, LLC
Portfolio Manager Commentary*
PERFORMANCE
For the twelve months ended December 31, 2023, the Class A, B and E shares of the BlackRock Ultra-Short Term Bond Portfolio returned 5.05%, 4.80%, and 4.90%, respectively. The Portfolio’s benchmark, the Bank of America/Merrill Lynch 3-Month U.S. Treasury Bill Index¹, returned 5.01%.
MARKET ENVIRONMENT / CONDITIONS
To stem stubborn inflationary pressures, the Federal Reserve (the “Fed”) continued their hiking cycle in 2023 by raising rates a total of 1.00% through their July 2023 meeting. This brought the total amount of hikes over the course of this entire cycle, from March 2022 through July 2023, to 5.25%. As data showed more durable signs of disinflation and labor markets showed evidence of cooling, Fed commentary turned to indicate satisfaction that rate hikes to date were having their desired effect. The Fed opted to maintain rates in the 5.25% to 5.50% range at their September, November, and December meetings. U.S. Treasury bills outstanding increased by approximately $2 trillion while the Fed reverse repo facility, which is predominantly utilized by U.S. Government money market funds as an outlet for excess liquidity, decreased by approximately $1.5 trillion during the year. The 3-month U.S. Treasury bill yield ended the period at 5.33%, up from 4.31% at the start of the year. 3-month tier one commercial paper yields started the year at 4.65%, reached a peak of 5.64% on October 25th and ended December at 5.54%. The Secured Overnight Financing Rate (“SOFR”), which began the year at 4.30%, ended 2023 at 5.38%.
PORTFOLIO REVIEW / PERIOD END POSITIONING
Portfolio positioning at December 31, 2023 reflected our outlook that the next move by the Fed will be to cut their benchmark rate, likely during the first half of 2024. As of December 31, 2023, federal funds futures contract pricing implied nearly 1.60% in cuts over 2024 with more than 0.75% of easing implied through the Fed’s June meeting. The Portfolio’s positioning has shifted away from maintaining a very short duration bias towards a longer duration bias through the purchase of fixed rate securities with maturities of 9 months to 1 year. Floating rate securities indexed to SOFR were added as they represented better value in our view than very short-term fixed rate investments. Repurchase agreements continued to make up a substantial amount of the Portfolio at year-end.
Weighted Average Maturity (the average amount of time until the securities in the Portfolio mature or the coupon resets and describes interest rate sensitivity) increased significantly-from 16 days at the beginning of the year to 50 days to end December. The Weighted Average Life (the average amount of time until the securities in the Portfolio mature and describes credit sensitivity) increased from 59 days to 60 days over the period. Fixed rate investments with final maturities of up to 1 year were added at yields as high as 6.00%. Our allocation to floating rate instruments decreased to 15% and was comprised of securities indexed to SOFR and the federal funds effective rate. These contributed 0.86% to gross yield while fixed rate investments contributed the balance. We continued to focus our investments within the issues of the top two to five systemically important issuers domiciled in each of a select group of countries.
Eric Hiatt
Edward Ingold
Portfolio Managers
BlackRock Advisors, LLC
* This commentary may include statements that constitute “forward-looking statements” under the U.S. securities laws. Forward-looking statements include, among other things, projections, estimates, and information about possible or future results related to the Portfolio, market or regulatory developments. The views expressed above are not guarantees of future performance or economic results and involve certain risks, uncertainties and assumptions that could cause actual outcomes and results to differ materially from the views expressed herein. The views expressed above are subject to change at any time based upon economic, market, or other conditions and the subadvisory firm undertakes no obligation to update the views expressed herein. Any discussions of specific securities should not be considered a recommendation to buy or sell those securities. The views expressed above (including any forward-looking statement) may not be relied upon as investment advice or as an indication of the Portfolio’s trading intent. Information about the Portfolio’s holdings, asset allocation or country diversification is historical and is not an indication of future Portfolio composition, which may vary. Direct investment in any index is not possible. The performance of any index mentioned in this commentary has not been adjusted for ongoing management, distribution and operating expenses, and sales charges applicable to mutual fund investments. In addition, the returns do not reflect additional fees charged by separate accounts or variable insurance contracts that an investor in the Portfolio may pay. If these additional fees were reflected, performance would have been lower.
1 The Bank of America/Merrill Lynch 3-Month U.S. Treasury Bill Index is composed of a single 90-day Treasury Bill issue, or potentially a seasoned 6-month or 1-year Treasury Bill issue, that is replaced on a monthly basis.
BHFTII-1
Brighthouse Funds Trust II
BlackRock Ultra-Short Term Bond Portfolio
A $10,000 INVESTMENT COMPARED TO THE BANK OF AMERICA/MERRILL LYNCH 3-MONTH U.S. TREASURY BILL INDEX
AVERAGE ANNUAL RETURNS (%) FOR THE YEAR ENDED DECEMBER 31, 2023
| 1 Year | 5 Year | 10 Year | ||||||||||
| BlackRock Ultra-Short Term Bond Portfolio | ||||||||||||
| Class A |
5.05 | 1.76 | 1.18 | |||||||||
| Class B |
4.80 | 1.50 | 0.98 | |||||||||
| Class E |
4.90 | 1.60 | 1.06 | |||||||||
| Bank of America/Merrill Lynch 3-Month U.S. Treasury Bill Index | 5.01 | 1.88 | 1.25 | |||||||||
Portfolio performance is calculated including reinvestment of all income and capital gain distributions. Performance numbers are net of all Portfolio expenses but do not include any insurance, sales, separate account or administrative charges of variable annuity or life insurance contracts or any additional expenses that participants may bear relating to the operations of their plans. If these charges were included, the returns would be lower. The performance of any index referenced above has not been adjusted for ongoing management, distribution and operating expenses, and sales charges applicable to mutual fund investments. Direct investment in any index is not possible. The performance of Class A shares, as set forth in the line graph above, will differ from that of other classes because of the difference in expenses paid by policyholders investing in the different share classes.
This information represents past performance and is not indicative of future results. Investment return and principal value may fluctuate so that shares, upon redemption, may be worth more or less than the original cost.
| PORTFOLIO COMPOSITION AS OF DECEMBER 31, 2023 | ||
Top Issuers
| % of Net Assets |
||||
| BofA Securities, Inc. | 12.8 | |||
| JPMorgan Securities LLC | 8.5 | |||
| Bank of America NA | 3.6 | |||
| U.S. Treasury Bill | 3.2 | |||
| Royal Bank of Canada | 2.8 | |||
| Britannia Funding Co. LLC | 2.6 | |||
| Citibank NA | 2.6 | |||
| Alinghi Funding Co. LLC | 2.4 | |||
| Aquitaine Funding Co. LLC | 2.1 | |||
| DNB Bank ASA | 2.0 | |||
BHFTII-2
Brighthouse Funds Trust II
BlackRock Ultra-Short Term Bond Portfolio
Understanding Your Portfolio’s Expenses
Shareholder Expense Example
As a shareholder of the Portfolio, you incur ongoing costs, including management fees; distribution and service (12b-1) fees; and other Portfolio expenses. This example is intended to help you understand your ongoing costs (in dollars) (referred to as “expenses”) of investing in the Portfolio and compare these costs with the ongoing costs of investing in other mutual funds. The example is based on an investment of $1,000 invested at the beginning of the period and held for the entire period, July 1, 2023 through December 31, 2023.
Actual Expenses
The first line for each share class of the Portfolio in the table below provides information about actual account values and actual expenses. You may use the information in this line, together with the amount you invested in the particular share class of the Portfolio, to estimate the expenses that you paid over the period. Simply divide your account value by $1,000 (for example, an $8,600 account value divided by $1,000 = 8.6), then multiply the result by the number in the first line under the heading entitled “Expenses Paid During Period” to estimate the expenses you paid on your account during this period.
Hypothetical Example for Comparison Purposes
The second line for each share class of the Portfolio in the table below provides information about hypothetical account values and hypothetical expenses based on the Portfolio’s actual expense ratio and an assumed rate of return of 5% per year before expenses, which is not the Portfolio’s actual return. The hypothetical account values and expenses may not be used to estimate the actual ending account balance or expenses you paid for the period. You may use this information to compare the ongoing costs of investing in the Portfolio and other funds. To do so, compare this 5% hypothetical example with the 5% hypothetical examples that appear in the shareholder reports of the other funds.
Please note that the expenses shown in the table are meant to highlight your ongoing costs only and do not reflect any fees or charges of your variable insurance product or any additional expenses that participants in certain eligible qualified plans may bear relating to the operations of their plan. Therefore, the second line for each share class in the table is useful in comparing ongoing costs only, and will not help you determine the relative total costs of owning different funds. In addition, if these other costs were included, your costs would have been higher.
| BlackRock Ultra-Short Term Bond Portfolio |
Annualized Expense Ratio |
Beginning Account Value July 1, 2023 |
Ending Account Value December 31, 2023 |
Expenses Paid During Period** July 1, 2023 to December 31, 2023 |
||||||||||||||
| Class A (a) |
Actual | 0.36 | % | $ | 1,000.00 | $ | 1,026.80 | $ | 1.84 | |||||||||
| Hypothetical* | 0.36 | % | $ | 1,000.00 | $ | 1,023.39 | $ | 1.84 | ||||||||||
| Class B (a) |
Actual | 0.61 | % | $ | 1,000.00 | $ | 1,025.60 | $ | 3.11 | |||||||||
| Hypothetical* | 0.61 | % | $ | 1,000.00 | $ | 1,022.13 | $ | 3.11 | ||||||||||
| Class E (a) |
Actual | 0.51 | % | $ | 1,000.00 | $ | 1,026.00 | $ | 2.60 | |||||||||
| Hypothetical* | 0.51 | % | $ | 1,000.00 | $ | 1,022.64 | $ | 2.60 | ||||||||||
| * | Hypothetical assumes a rate of return of 5% per year before expenses. |
| ** | Expenses paid are equal to the Portfolio’s annualized expense ratio for the most recent six month period, as shown above, multiplied by the average account value over the period, multiplied by the number of days (184 days) in the most recent fiscal half-year, divided by 365 (to reflect the one-half year period). |
| (a) | The annualized expense ratio shown reflects the impact of the management fee waiver as described in Note 4 of the Notes to Financial Statements. |
BHFTII-3
Brighthouse Funds Trust II
BlackRock Ultra-Short Term Bond Portfolio
Schedule of Investments as of December 31, 2023
Corporate Bonds & Notes—0.5% of Net Assets
| Security Description | Principal Amount* |
Value | ||||||
| Auto Manufacturers—0.3% | ||||||||
| Toyota Motor Credit Corp. 5.771%, SOFR + 0.380%, 02/22/24 (a) |
2,270,000 | $ | 2,270,250 | |||||
|
|
|
|||||||
| Beverages—0.2% | ||||||||
| PepsiCo, Inc. |
1,580,000 | 1,582,445 | ||||||
|
|
|
|||||||
| Total Corporate Bonds & Notes |
3,852,695 | |||||||
|
|
|
|||||||
| Short-Term Investments—99.2% | ||||||||
| Certificate of Deposit—21.8% | ||||||||
| Bank of America NA |
||||||||
| 6.030%, SOFR + 0.640%, 07/15/24 (a) |
2,000,000 | 2,003,650 | ||||||
| 5.250%, 01/31/24 |
5,000,000 | 4,997,179 | ||||||
| 5.440%, 02/06/24 |
4,597,000 | 4,595,429 | ||||||
| 5.750%, 01/09/24 |
5,000,000 | 5,000,294 | ||||||
| 5.750%, 11/14/24 |
3,000,000 | 3,014,094 | ||||||
| 5.900%, 05/14/24 |
5,000,000 | 5,005,344 | ||||||
| 6.000%, 08/21/24 |
3,000,000 | 3,011,698 | ||||||
| Bank of Montreal |
3,000,000 | 3,009,879 | ||||||
| Bank of Nova Scotia |
2,000,000 | 2,000,510 | ||||||
| 5.800%, 11/08/24 |
2,000,000 | 2,009,107 | ||||||
| 5.820%, 06/13/24 |
3,000,000 | 3,003,161 | ||||||
| BNP Paribas SA |
4,000,000 | 3,998,759 | ||||||
| 5.720%, 08/19/24 |
3,000,000 | 3,007,102 | ||||||
| 5.940%, SOFR + 0.630%, 02/05/24 (a) |
3,000,000 | 3,001,638 | ||||||
| Canadian Imperial Bank of Commerce |
4,000,000 | 3,999,060 | ||||||
| 5.600%, 03/04/24 |
3,000,000 | 2,999,396 | ||||||
| 5.930%, 06/28/24 |
3,000,000 | 3,006,804 | ||||||
| Citibank NA |
1,450,000 | 1,450,447 | ||||||
| 5.800%, 03/04/24 |
3,000,000 | 3,000,744 | ||||||
| 5.800%, 03/18/24 |
4,000,000 | 4,002,018 | ||||||
| 5.880%, 05/08/24 |
4,500,000 | 4,504,400 | ||||||
| 5.890%, 05/10/24 |
3,000,000 | 3,003,157 | ||||||
| 5.920%, 06/20/24 |
4,000,000 | 4,008,602 | ||||||
| Commonwealth Bank of Australia |
2,500,000 | 2,512,676 | ||||||
| Credit Industriel et Commercial |
2,000,000 | 2,001,131 | ||||||
| HSBC Bank USA NA |
4,000,000 | 4,004,912 | ||||||
| Korea Development Bank |
3,000,000 | 3,001,068 | ||||||
| Mitsubishi UFJ Trust & Banking Corp. |
6,500,000 | 6,502,161 | ||||||
| Mizuho Bank Ltd. |
7,000,000 | 7,002,849 | ||||||
| 5.820%, SOFR + 0.430%, 01/31/24 (a) |
7,000,000 | 7,001,985 | ||||||
| Nordea Bank Abp |
2,000,000 | 2,002,936 | ||||||
| 5.820%, SOFR + 0.510%, 04/12/24 (a) |
4,500,000 | 4,504,129 | ||||||
| 5.830%, SOFR + 0.520%, 04/18/24 (a) |
5,000,000 | 5,004,895 | ||||||
| Standard Chartered Bank |
4,000,000 | 4,000,017 | ||||||
| State Street Bank & Trust Co. |
5,000,000 | 5,004,747 | ||||||
| Sumitomo Mitsui Banking Corp. |
7,490,000 | 7,492,781 | ||||||
| Sumitomo Mitsui Trust Bank Ltd. |
8,000,000 | 8,002,192 | ||||||
| Svenska Handelsbanken AB |
3,000,000 | 3,003,725 | ||||||
| Toronto-Dominion Bank |
3,000,000 | 2,999,320 | ||||||
| 5.810%, 01/29/24 |
5,000,000 | 5,001,552 | ||||||
| 6.000%, 10/02/24 |
2,000,000 | 2,009,886 | ||||||
| Wells Fargo Bank NA |
5,000,000 | 5,001,340 | ||||||
| 5.950%, SOFR + 0.640%, 07/17/24 (a) |
2,000,000 | 2,003,826 | ||||||
| Westpac Banking Corp. |
3,000,000 | 3,003,784 | ||||||
|
|
|
|||||||
| 168,694,384 | ||||||||
|
|
|
|||||||
| Commercial Paper—49.0% | ||||||||
| Alinghi Funding Co. LLC |
12,000,000 | 11,980,292 | ||||||
| 5.752%, 03/28/24 (b) |
2,000,000 | 1,972,900 | ||||||
| 5.913%, 05/14/24 (b) |
5,000,000 | 4,898,866 | ||||||
| Aquitaine Funding Co. LLC |
7,000,000 | 6,980,067 | ||||||
| 5.314%, 01/26/24 (b) |
9,000,000 | 8,962,040 | ||||||
| ASB Bank Ltd. |
15,000,000 | 14,977,829 | ||||||
| Australia & New Zealand Banking Group Ltd. |
3,000,000 | 2,898,291 | ||||||
| 5.789%, 07/30/24 (b) |
3,000,000 | 2,908,606 | ||||||
| 5.810%, SOFR + 0.500%, 04/02/24 (a) |
2,000,000 | 2,001,830 | ||||||
| Autobahn Funding Co. LLC |
7,000,000 | 6,989,609 | ||||||
| Bank of Montreal |
3,000,000 | 2,995,579 | ||||||
| 5.736%, 11/07/24 (b) |
4,000,000 | 3,826,581 | ||||||
| 5.813%, 11/06/24 (b) |
2,500,000 | 2,391,924 | ||||||
| Barton Capital SA |
7,000,000 | 6,981,208 | ||||||
| Bedford Row Funding Corp. |
8,000,000 | 7,994,084 | ||||||
| Bennington Stark Capital Co. LLC |
6,000,000 | 5,994,637 | ||||||
| BNZ International Funding Ltd. |
4,500,000 | 4,449,516 | ||||||
| BPCE SA |
7,250,000 | 7,206,742 | ||||||
See accompanying notes to financial statements.
BHFTII-4
Brighthouse Funds Trust II
BlackRock Ultra-Short Term Bond Portfolio
Schedule of Investments as of December 31, 2023
Short-Term Investments—(Continued)
| Security Description | Principal Amount* |
Value | ||||||
| Commercial Paper—(Continued) | ||||||||
| Britannia Funding Co. LLC |
10,000,000 | $ | 9,951,970 | |||||
| 5.505%, 02/22/24 (b) |
2,500,000 | 2,479,216 | ||||||
| 5.537%, 02/16/24 (b) |
8,000,000 | 7,940,855 | ||||||
| Cabot Trail Funding LLC |
3,300,000 | 3,298,049 | ||||||
| Caisse d’Amortissement de la Dette Sociale |
15,000,000 | 14,868,045 | ||||||
| CDP Financial, Inc. |
4,000,000 | 3,911,291 | ||||||
| 5.670%, SOFR + 0.360%, 01/08/24 (a) |
4,000,000 | 4,000,236 | ||||||
| 5.760%, 07/23/24 (b) |
4,000,000 | 3,881,603 | ||||||
| Chariot Funding LLC |
15,000,000 | 14,973,269 | ||||||
| Columbia Funding Co. LLC |
8,000,000 | 7,959,376 | ||||||
| 5.698%, 03/05/24 (b) |
2,000,000 | 1,979,613 | ||||||
| Commonwealth Bank of Australia |
5,000,000 | 4,998,286 | ||||||
| Compass Group PLC |
5,500,000 | 5,495,933 | ||||||
| Concord Minutemen Capital Co. LLC |
4,000,000 | 4,000,414 | ||||||
| Credit Industriel et Commercial |
6,000,000 | 5,962,592 | ||||||
| DNB Bank ASA |
4,000,000 | 3,813,960 | ||||||
| 5.657%, 05/28/24 (144A) (b) |
6,000,000 | 5,868,598 | ||||||
| 5.790%, SOFR + 0.480%, 04/29/24 (a) |
3,250,000 | 3,253,360 | ||||||
| 5.843%, 07/30/24 (144A) (b) |
3,000,000 | 2,908,855 | ||||||
| Federation des Caisses Desjardins du Quebec |
15,000,000 | 14,988,908 | ||||||
| FMS Wertmanagement |
2,000,000 | 1,963,505 | ||||||
| 5.627%, 05/03/24 (b) |
2,000,000 | 1,963,237 | ||||||
| Gotham Funding Corp. |
3,000,000 | 2,988,377 | ||||||
| Great Bear Funding LLC |
6,000,000 | 5,995,549 | ||||||
| HSBC Bank PLC |
5,000,000 | 5,009,107 | ||||||
| ING U.S. Funding LLC |
2,000,000 | 1,929,064 | ||||||
| 5.792%, 05/01/24 (b) |
5,500,000 | 5,398,618 | ||||||
| 5.822%, 07/01/24 (b) |
2,000,000 | 1,946,293 | ||||||
| Kreditanstalt fuer Wiederaufbau |
5,000,000 | 4,908,999 | ||||||
| Macquarie Bank Ltd. |
4,000,000 | 3,972,925 | ||||||
| 5.697%, 04/08/24 (b) |
1,920,000 | 1,890,288 | ||||||
| 5.740%, SOFR + 0.420%, 01/16/24 (144A) (a) |
8,000,000 | 8,001,309 | ||||||
| 5.774%, 04/18/24 (b) |
5,000,000 | 4,915,310 | ||||||
| National Bank of Canada |
3,553,000 | 3,523,247 | ||||||
| Natixis SA |
5,000,000 | 4,970,478 | ||||||
| Nieuw Amsterdam Receivables Corp. BV |
10,000,000 | 9,929,652 | ||||||
| Old Line Funding LLC |
6,000,000 | 6,000,454 | ||||||
| Ontario Teachers’ Finance Trust |
4,000,000 | 3,925,034 | ||||||
| Podium Funding Trust |
9,000,000 | 8,975,995 | ||||||
| Province of British Columbia Canada |
8,000,000 | 7,896,393 | ||||||
| 5.512%, 02/21/24 (b) |
5,000,000 | 4,959,950 | ||||||
| Royal Bank of Canada |
3,000,000 | 2,869,392 | ||||||
| 5.910%, SOFR + 0.600%, 05/23/24 (a) |
3,550,000 | 3,555,594 | ||||||
| Starbird Funding Corp. |
7,000,000 | 6,861,628 | ||||||
| Sumitomo Mitsui Trust Bank Ltd. |
5,000,000 | 4,976,346 | ||||||
| Svenska Handelsbanken AB |
3,000,000 | 2,907,401 | ||||||
| 5.811%, 06/03/24 (b) |
2,000,000 | 1,953,837 | ||||||
| Swedbank AB |
3,000,000 | 2,966,370 | ||||||
| UBS AG |
3,000,000 | 2,968,306 | ||||||
| Versailles Commercial Paper LLC |
5,000,000 | 4,997,032 | ||||||
| Westpac Banking Corp. |
3,000,000 | 2,966,756 | ||||||
| 5.725%, 11/07/24 (b) |
2,000,000 | 1,913,480 | ||||||
| 5.731%, 11/14/24 (144A) (b) |
3,000,000 | 2,867,464 | ||||||
| 5.791%, 09/12/24 (b) |
2,500,000 | 2,409,940 | ||||||
| 5.830%, SOFR + 0.520%, 04/19/24 (a) |
2,000,000 | 2,001,976 | ||||||
|
|
|
|||||||
| 380,224,336 | ||||||||
|
|
|
|||||||
| Repurchase Agreements—23.2% | ||||||||
| BofA Securities, Inc. |
99,000,000 | 99,000,000 | ||||||
| JPMorgan Securities LLC |
66,200,000 | 66,200,000 | ||||||
See accompanying notes to financial statements.
BHFTII-5
Brighthouse Funds Trust II
BlackRock Ultra-Short Term Bond Portfolio
Schedule of Investments as of December 31, 2023
Short-Term Investments—(Continued)
| Security Description | Principal Amount* |
Value | ||||||
| Repurchase Agreements—(Continued) | ||||||||
| TD Securities (USA) LLC |
15,000,000 | $ | 15,000,000 | |||||
|
|
|
|||||||
| 180,200,000 | ||||||||
|
|
|
|||||||
| U.S. Treasury—3.2% | ||||||||
| U.S. Treasury Bill |
25,000,000 | 24,948,885 | ||||||
|
|
|
|||||||
| Time Deposit—2.0% | ||||||||
| Royal Bank of Canada |
15,000,000 | 15,000,000 | ||||||
|
|
|
|||||||
| Total Short-Term Investments |
769,067,605 | |||||||
|
|
|
|||||||
| Total Investments—99.7% |
772,920,300 | |||||||
| Other assets and liabilities (net)—0.3% |
2,690,651 | |||||||
|
|
|
|||||||
| Net Assets—100.0% | $ | 775,610,951 | ||||||
|
|
|
|||||||
| * | Principal amount stated in U.S. dollars unless otherwise noted. | |||||
| (a) | Variable or floating rate security. The stated rate represents the rate at December 31, 2023. Maturity date shown for callable securities reflects the earliest possible call date. For securities based on a published reference index and spread, the index and spread are indicated in the description above. For certain variable rate securities, the coupon rate is determined by the issuer/agent based on current market conditions. For certain asset- and mortgage-backed securities, the coupon rate may fluctuate based on changes of the underlying collateral or prepayments of principal. These securities do not indicate a reference index and spread in their description above. | |||||
| (b) | The rate shown represents current yield to maturity. | |||||
| (144A) | Securities exempt from registration under Rule 144A of the Securities Act of 1933. These securities may be resold in transactions exempt from registration, normally to qualified institutional buyers. As of December 31, 2023, the market value of 144A securities was $108,006,703, which is 13.9% of net assets. | |||||
| Glossary of Abbreviations
| ||||
| Index Abbreviations | ||||
| (SOFR)— Secured Overnight Financing Rate | ||||
See accompanying notes to financial statements.
BHFTII-6
Brighthouse Funds Trust II
BlackRock Ultra-Short Term Bond Portfolio
Schedule of Investments as of December 31, 2023
Fair Value Hierarchy
Accounting principles generally accepted in the United States of America (“GAAP”) define fair market value as the price that the Portfolio would receive to sell an asset or pay to transfer a liability in an orderly transaction between market participants at the measurement date. It establishes a fair value hierarchy that prioritizes inputs to valuation methods and requires disclosure of the fair value hierarchy, separately for each major category of assets and liabilities, that segregates fair value measurements into three levels. Levels 1, 2 and 3 of the fair value hierarchy are defined as follows:
Level 1—unadjusted quoted prices in active markets for identical investments
Level 2—other significant observable inputs (including, but not limited to, quoted prices for similar assets or liabilities in markets that are either active or inactive; inputs other than quoted prices that are observable such as interest rates, yield curves, volatilities, prepayment speeds, loss severities, credit risks, default rates, or other market corroborated inputs)
Level 3—significant unobservable inputs based on the best information available in the circumstances, to the extent observable inputs are unavailable (including the Portfolio’s own assumptions used in determining the fair value of investments and derivative financial instruments)
The inputs or methodologies used for valuing investments are not necessarily an indication of the risk associated with investing in them. Changes to the inputs or methodologies used may result in transfers between levels. A reconciliation of Level 3 securities, if any, will be disclosed following the fair value hierarchy table. For more information about the Portfolio’s policy regarding the valuation of investments, please refer to the Notes to Financial Statements.
The following table summarizes the fair value hierarchy of the Portfolio’s investments as of December 31, 2023:
| Description | Level 1 | Level 2 | Level 3 | Total | ||||||||||||
| Total Corporate Bonds & Notes* |
$ | — | $ | 3,852,695 | $ | — | $ | 3,852,695 | ||||||||
| Total Short-Term Investments* |
— | 769,067,605 | — | 769,067,605 | ||||||||||||
| Total Investments |
$ | — | $ | 772,920,300 | $ | — | $ | 772,920,300 | ||||||||
| * | See Schedule of Investments for additional detailed categorizations. |
See accompanying notes to financial statements.
BHFTII-7
Brighthouse Funds Trust II
BlackRock Ultra-Short Term Bond Portfolio
Statement of Assets and Liabilities
December 31, 2023
| Assets |
| |||
| Investments at value (a) |
$ | 592,720,300 | ||
| Repurchase Agreements at value which equals cost |
180,200,000 | |||
| Cash |
261,546 | |||
| Receivable for: |
||||
| Fund shares sold |
461,115 | |||
| Interest |
3,285,096 | |||
| Prepaid expenses |
3,343 | |||
|
|
|
|||
| Total Assets |
776,931,400 | |||
|
|
|
|||
| Liabilities |
| |||
| Payables for: |
||||
| Fund shares redeemed |
731,613 | |||
| Accrued Expenses: |
| |||
| Management fees |
217,998 | |||
| Distribution and service fees |
92,077 | |||
| Deferred trustees’ fees |
169,184 | |||
| Other expenses |
109,577 | |||
|
|
|
|||
| Total Liabilities |
1,320,449 | |||
|
|
|
|||
| Net Assets |
$ | 775,610,951 | ||
|
|
|
|||
| Net Assets Consist of: | ||||
| Paid in surplus |
$ | 730,809,662 | ||
| Distributable earnings (Accumulated losses) |
44,801,289 | |||
|
|
|
|||
| Net Assets |
$ | 775,610,951 | ||
|
|
|
|||
| Net Assets |
||||
| Class A |
$ | 315,970,555 | ||
| Class B |
389,752,275 | |||
| Class E |
69,888,121 | |||
| Capital Shares Outstanding* |
||||
| Class A |
3,020,943 | |||
| Class B |
3,739,314 | |||
| Class E |
669,203 | |||
| Net Asset Value, Offering Price and Redemption Price Per Share |
||||
| Class A |
$ | 104.59 | ||
| Class B |
104.23 | |||
| Class E |
104.43 | |||
| * | The Portfolio is authorized to issue an unlimited number of shares. |
| (a) | Identified cost of investments, excluding repurchase agreements, was $592,486,695. |
Statement of Operations
Year Ended December 31, 2023
| Investment Income |
| |||
| Interest |
$ | 49,303,171 | ||
| Payments by affiliates (a) |
71,108 | |||
|
|
|
|||
| Total investment income |
49,374,279 | |||
|
|
|
|||
| Expenses |
| |||
| Management fees |
3,269,400 | |||
| Administration fees |
49,923 | |||
| Custodian and accounting fees |
84,167 | |||
| Distribution and service fees—Class B |
1,010,167 | |||
| Distribution and service fees—Class E |
111,552 | |||
| Audit and tax services |
44,396 | |||
| Legal |
46,603 | |||
| Trustees’ fees and expenses |
46,220 | |||
| Shareholder reporting |
51,791 | |||
| Insurance |
8,733 | |||
| Miscellaneous |
21,455 | |||
|
|
|
|||
| Total expenses |
4,744,407 | |||
| Less management fee waiver |
(223,935 | ) | ||
|
|
|
|||
| Net expenses |
4,520,472 | |||
|
|
|
|||
| Net Investment Income |
44,853,807 | |||
|
|
|
|||
| Net Realized and Unrealized Gain (Loss) |
||||
| Net realized gain on investments |
13,558 | |||
| Net change in unrealized appreciation on investments |
400,602 | |||
|
|
|
|||
| Net realized and unrealized gain (loss) |
414,160 | |||
|
|
|
|||
| Net Increase (Decrease) in Net Assets From Operations |
$ | 45,267,967 | ||
|
|
|
|||
| (a) | See Note 4 of the Notes to Financial Statements. |
See accompanying notes to financial statements.
BHFTII-8
Brighthouse Funds Trust II
BlackRock Ultra-Short Term Bond Portfolio
Statements of Changes in Net Assets
| Year Ended December 31, 2023 |
Year Ended December 31, 2022 |
|||||||
| Increase (Decrease) in Net Assets: |
||||||||
| From Operations |
||||||||
| Net investment income (loss) |
$ | 44,853,807 | $ | 13,738,733 | ||||
| Net realized gain (loss) |
13,558 | 1,410 | ||||||
| Net change in unrealized appreciation (depreciation) |
400,602 | (114,591 | ) | |||||
|
|
|
|
|
|||||
| Increase (decrease) in net assets from operations |
45,267,967 | 13,625,552 | ||||||
|
|
|
|
|
|||||
| From Distributions to Shareholders |
||||||||
| Class A |
(7,042,474 | ) | 0 | |||||
| Class B |
(5,670,280 | ) | 0 | |||||
| Class E |
(1,148,518 | ) | 0 | |||||
|
|
|
|
|
|||||
| Total distributions |
(13,861,272 | ) | 0 | |||||
|
|
|
|
|
|||||
| Increase (decrease) in net assets from capital share transactions |
(226,262,674 | ) | (97,548,844 | ) | ||||
|
|
|
|
|
|||||
| Total increase (decrease) in net assets |
(194,855,979 | ) | (83,923,292 | ) | ||||
| Net Assets |
||||||||
| Beginning of period |
970,466,930 | 1,054,390,222 | ||||||
|
|
|
|
|
|||||
| End of period |
$ | 775,610,951 | $ | 970,466,930 | ||||
|
|
|
|
|
|||||
Other Information:
Capital Shares
Transactions in capital shares were as follows:
| Year Ended December 31, 2023 |
Year Ended December 31, 2022 |
|||||||||||||||
| Shares | Value | Shares | Value | |||||||||||||
| Class A |
||||||||||||||||
| Sales |
5,591,315 | $ | 571,728,225 | 1,343,555 | $ | 134,616,181 | ||||||||||
| Reinvestments |
69,275 | 7,042,474 | 0 | 0 | ||||||||||||
| Redemptions |
(7,280,326 | ) | (748,500,901 | ) | (2,381,726 | ) | (239,273,664 | ) | ||||||||
|
|
|
|
|
|
|
|
|
|||||||||
| Net increase (decrease) |
(1,619,736 | ) | $ | (169,730,202 | ) | (1,038,171 | ) | $ | (104,657,483 | ) | ||||||
|
|
|
|
|
|
|
|
|
|||||||||
| Class B |
||||||||||||||||
| Sales |
963,322 | $ | 98,330,432 | 1,731,329 | $ | 172,978,838 | ||||||||||
| Reinvestments |
55,898 | 5,670,280 | 0 | 0 | ||||||||||||
| Redemptions |
(1,454,800 | ) | (148,765,455 | ) | (1,624,592 | ) | (162,260,675 | ) | ||||||||
|
|
|
|
|
|
|
|
|
|||||||||
| Net increase (decrease) |
(435,580 | ) | $ | (44,764,743 | ) | 106,737 | $ | 10,718,163 | ||||||||
|
|
|
|
|
|
|
|
|
|||||||||
| Class E |
||||||||||||||||
| Sales |
70,271 | $ | 7,208,726 | 179,641 | $ | 17,969,425 | ||||||||||
| Reinvestments |
11,307 | 1,148,518 | 0 | 0 | ||||||||||||
| Redemptions |
(196,308 | ) | (20,124,973 | ) | (215,777 | ) | (21,578,949 | ) | ||||||||
|
|
|
|
|
|
|
|
|
|||||||||
| Net increase (decrease) |
(114,730 | ) | $ | (11,767,729 | ) | (36,136 | ) | $ | (3,609,524 | ) | ||||||
|
|
|
|
|
|
|
|
|
|||||||||
| Increase (decrease) derived from capital shares transactions |
$ | (226,262,674 | ) | $ | (97,548,844 | ) | ||||||||||
|
|
|
|
|
|||||||||||||
See accompanying notes to financial statements.
BHFTII-9
Brighthouse Funds Trust II
BlackRock Ultra-Short Term Bond Portfolio
Financial Highlights
| Selected per share data | ||||||||||||||||||||
| Class A | ||||||||||||||||||||
| Year Ended December 31, | ||||||||||||||||||||
| 2023 | 2022 | 2021 | 2020 | 2019 | ||||||||||||||||
| Net Asset Value, Beginning of Period |
$ | 101.26 | $ | 99.82 | $ | 100.35 | $ | 101.88 | $ | 101.58 | ||||||||||
|
|
|
|
|
|
|
|
|
|
|
|||||||||||
| Income (Loss) from Investment Operations |
||||||||||||||||||||
| Net investment income (loss) (a) |
5.03 | 1.41 | (0.20 | ) | 0.40 | 2.12 | ||||||||||||||
| Net realized and unrealized gain (loss) |
0.04 | 0.03 | 0.01 | 0.04 | 0.02 | |||||||||||||||
|
|
|
|
|
|
|
|
|
|
|
|||||||||||
| Total income (loss) from investment operations |
5.07 | 1.44 | (0.19 | ) | 0.44 | 2.14 | ||||||||||||||
|
|
|
|
|
|
|
|
|
|
|
|||||||||||
| Less Distributions |
||||||||||||||||||||
| Distributions from net investment income |
(1.74 | ) | 0.00 | (0.34 | ) | (1.97 | ) | (1.84 | ) | |||||||||||
| Distributions from net realized capital gains |
(0.00 | )(b) | 0.00 | 0.00 | 0.00 | 0.00 | ||||||||||||||
|
|
|
|
|
|
|
|
|
|
|
|||||||||||
| Total distributions |
(1.74 | ) | 0.00 | (0.34 | ) | (1.97 | ) | (1.84 | ) | |||||||||||
|
|
|
|
|
|
|
|
|
|
|
|||||||||||
| Net Asset Value, End of Period |
$ | 104.59 | $ | 101.26 | $ | 99.82 | $ | 100.35 | $ | 101.88 | ||||||||||
|
|
|
|
|
|
|
|
|
|
|
|||||||||||
| Total Return (%) (c) |
5.05 | 1.44 | (0.19 | ) | 0.43 | 2.13 | ||||||||||||||
| Ratios/Supplemental Data |
||||||||||||||||||||
| Gross ratio of expenses to average net assets (%) |
0.39 | 0.38 | 0.38 | 0.39 | 0.39 | |||||||||||||||
| Net ratio of expenses to average net assets (%) (d) |
0.36 | 0.36 | 0.36 | 0.36 | 0.37 | |||||||||||||||
| Ratio of net investment income (loss) to average net assets (%) |
4.89 | 1.41 | (0.20 | ) | 0.40 | 2.08 | ||||||||||||||
| Portfolio turnover rate (%) |
0 | (e) | 0 | (e) | 0 | (e) | 0 | (e) | 0 | (e) | ||||||||||
| Net assets, end of period (in millions) |
$ | 316.0 | $ | 469.9 | $ | 566.9 | $ | 377.4 | $ | 320.7 | ||||||||||
| Class B | ||||||||||||||||||||
| Year Ended December 31, | ||||||||||||||||||||
| 2023 | 2022 | 2021 | 2020 | 2019 | ||||||||||||||||
| Net Asset Value, Beginning of Period |
$ | 100.91 | $ | 99.72 | $ | 100.24 | $ | 101.77 | $ | 101.46 | ||||||||||
|
|
|
|
|
|
|
|
|
|
|
|||||||||||
| Income (Loss) from Investment Operations |
||||||||||||||||||||
| Net investment income (loss) (a) |
4.75 | 1.23 | (0.44 | ) | 0.16 | 1.87 | ||||||||||||||
| Net realized and unrealized gain (loss) |
0.05 | (0.04 | ) | (0.01 | ) | 0.04 | 0.02 | |||||||||||||
|
|
|
|
|
|
|
|
|
|
|
|||||||||||
| Total income (loss) from investment operations |
4.80 | 1.19 | (0.45 | ) | 0.20 | 1.89 | ||||||||||||||
|
|
|
|
|
|
|
|
|
|
|
|||||||||||
| Less Distributions |
||||||||||||||||||||
| Distributions from net investment income |
(1.48 | ) | 0.00 | (0.07 | ) | (1.73 | ) | (1.58 | ) | |||||||||||
| Distributions from net realized capital gains |
(0.00 | )(b) | 0.00 | 0.00 | 0.00 | 0.00 | ||||||||||||||
|
|
|
|
|
|
|
|
|
|
|
|||||||||||
| Total distributions |
(1.48 | ) | 0.00 | (0.07 | ) | (1.73 | ) | (1.58 | ) | |||||||||||
|
|
|
|
|
|
|
|
|
|
|
|||||||||||
| Net Asset Value, End of Period |
$ | 104.23 | $ | 100.91 | $ | 99.72 | $ | 100.24 | $ | 101.77 | ||||||||||
|
|
|
|
|
|
|
|
|
|
|
|||||||||||
| Total Return (%) (c) |
4.80 | 1.18 | (0.45 | ) | 0.19 | 1.88 | ||||||||||||||
| Ratios/Supplemental Data |
||||||||||||||||||||
| Gross ratio of expenses to average net assets (%) |
0.64 | 0.63 | 0.63 | 0.64 | 0.64 | |||||||||||||||
| Net ratio of expenses to average net assets (%) (d) |
0.61 | 0.61 | 0.61 | 0.61 | 0.62 | |||||||||||||||
| Ratio of net investment income (loss) to average net assets (%) |
4.64 | 1.23 | (0.44 | ) | 0.16 | 1.84 | ||||||||||||||
| Portfolio turnover rate (%) |
0 | (e) | 0 | (e) | 0 | (e) | 0 | (e) | 0 | (e) | ||||||||||
| Net assets, end of period (in millions) |
$ | 389.8 | $ | 421.3 | $ | 405.7 | $ | 446.3 | $ | 391.7 | ||||||||||
Please see following page for Financial Highlights footnote legend.
See accompanying notes to financial statements.
BHFTII-10
Brighthouse Funds Trust II
BlackRock Ultra-Short Term Bond Portfolio
Financial Highlights
Selected per share data
| Class E | ||||||||||||||||||||
| Year Ended December 31, | ||||||||||||||||||||
| 2023 | 2022 | 2021 | 2020 | 2019 | ||||||||||||||||
| Net Asset Value, Beginning of Period |
$ | 101.10 | $ | 99.81 | $ | 100.33 | $ | 101.85 | $ | 101.53 | ||||||||||
|
|
|
|
|
|
|
|
|
|
|
|||||||||||
| Income (Loss) from Investment Operations |
||||||||||||||||||||
| Net investment income (loss) (a) |
4.85 | 1.28 | (0.34 | ) | 0.31 | 1.97 | ||||||||||||||
| Net realized and unrealized gain (loss) |
0.05 | 0.01 | 0.00 | (0.02 | ) | 0.02 | ||||||||||||||
|
|
|
|
|
|
|
|
|
|
|
|||||||||||
| Total income (loss) from investment operations |
4.90 | 1.29 | (0.34 | ) | 0.29 | 1.99 | ||||||||||||||
|
|
|
|
|
|
|
|
|
|
|
|||||||||||
| Less Distributions |
||||||||||||||||||||
| Distributions from net investment income |
(1.57 | ) | 0.00 | (0.18 | ) | (1.81 | ) | (1.67 | ) | |||||||||||
| Distributions from net realized capital gains |
(0.00 | )(b) | 0.00 | 0.00 | 0.00 | 0.00 | ||||||||||||||
|
|
|
|
|
|
|
|
|
|
|
|||||||||||
| Total distributions |
(1.57 | ) | 0.00 | (0.18 | ) | (1.81 | ) | (1.67 | ) | |||||||||||
|
|
|
|
|
|
|
|
|
|
|
|||||||||||
| Net Asset Value, End of Period |
$ | 104.43 | $ | 101.10 | $ | 99.81 | $ | 100.33 | $ | 101.85 | ||||||||||
|
|
|
|
|
|
|
|
|
|
|
|||||||||||
| Total Return (%) (c) |
4.90 | 1.28 | (0.34 | ) | 0.29 | 1.98 | ||||||||||||||
| Ratios/Supplemental Data |
||||||||||||||||||||
| Gross ratio of expenses to average net assets (%) |
0.54 | 0.53 | 0.53 | 0.54 | 0.54 | |||||||||||||||
| Net ratio of expenses to average net assets (%) (d) |
0.51 | 0.51 | 0.51 | 0.51 | 0.52 | |||||||||||||||
| Ratio of net investment income (loss) to average net assets (%) |
4.73 | 1.28 | (0.34 | ) | 0.30 | 1.94 | ||||||||||||||
| Portfolio turnover rate (%) |
0 | (e) | 0 | (e) | 0 | (e) | 0 | (e) | 0 | (e) | ||||||||||
| Net assets, end of period (in millions) |
$ | 69.9 | $ | 79.3 | $ | 81.8 | $ | 90.2 | $ | 96.7 | ||||||||||
| (a) | Per share amounts based on average shares outstanding during the period. | |||
| (b) | Distributions from net realized capital gains were less than $0.01 per share. | |||
| (c) | Total return does not reflect any insurance, sales, separate account or administrative charges of variable annuity or life insurance contracts or any additional expenses that contract owners may bear under their variable contracts. If these charges were included, the returns would be lower. | |||
| (d) | Includes the effects of management fee waivers (see Note 4 of the Notes to Financial Statements). | |||
| (e) | There were no long term transactions during the years ended December 31, 2023 , 2022, 2021, 2020 and 2019. | |||
See accompanying notes to financial statements.
BHFTII-11
Brighthouse Funds Trust II
BlackRock Ultra-Short Term Bond Portfolio
Notes to Financial Statements—December 31, 2023
1. Organization
Brighthouse Funds Trust II (the “Trust”) is organized as a Delaware statutory trust and registered under the Investment Company Act of 1940, as amended (the “1940 Act”), as an open-end management investment company. The Trust, which is managed by Brighthouse Investment Advisers, LLC (“Brighthouse Investment Advisers” or the “Adviser”), currently offers twenty-nine series (the “Portfolios”), each of which operates as a distinct investment vehicle of the Trust. The series included in this report is BlackRock Ultra-Short Term Bond Portfolio (the “Portfolio”), which is diversified. Shares of the Portfolio are not offered directly to the general public and are currently available only to separate accounts of insurance companies, including insurance companies affiliated with the Adviser.
The Portfolio has registered and offers three classes of shares: Class A, B and E shares. Shares of each class of the Portfolio represent an equal pro rata interest in the Portfolio and generally give the shareholder the same voting, dividend, liquidation, and other rights. Investment income, realized and unrealized capital gains and losses, the common expenses of the Portfolio, and certain Portfolio-level expense reductions, if any, are allocated on a pro rata basis to each class based on the relative net assets of each class to the net assets of the Portfolio. Each class of shares differs in its respective distribution plan and such distribution expenses are allocated to the corresponding class of shares.
2. Significant Accounting Policies
The preparation of financial statements in conformity with accounting principles generally accepted in the United States of America (“GAAP”) requires management to make estimates and assumptions that affect the reported amounts of assets and liabilities and disclosure of contingent assets and liabilities as of the date of the financial statements and the reported amounts of income and expenses during the reporting period. Actual results could differ from those estimates. In the preparation of these financial statements, management has evaluated events and transactions subsequent to December 31, 2023 through the date the financial statements were issued.
The Portfolio is an investment company and follows the accounting and reporting guidance of the Financial Accounting Standards Board (“FASB”) Accounting Standards Codification Topic 946- Financial Services- Investment Companies. The following is a summary of significant accounting policies consistently followed by the Portfolio in the preparation of its financial statements.
Investment Valuation and Fair Value Measurements - The Portfolio values its investments for purposes of calculating its net asset value (“NAV”) using procedures that allow for a variety of methodology to be used to value the Portfolio’s investments. The specific methodology used for an investment may vary based on the market data available for a specific investment at the time the Portfolio calculates its NAV or based on other considerations. The procedures also permit a level of judgment to be used in the valuation process.
Debt securities, including corporate, convertible and municipal bonds and notes; obligations of the U.S. Treasury and U.S. government agencies; foreign sovereign issues; and non-U.S. bonds, are generally valued based upon evaluated or composite bid quotations obtained from third-party pricing services and/or brokers and dealers selected by the Adviser (each a “pricing service”). Such pricing services may use matrix pricing, which considers observable inputs including, among other things, issuer details, maturity dates, interest rates, yield curves, rates of prepayment, credit risks/spreads, default rates, reported trades, broker-dealer quotes and quoted prices for similar assets. Short-term obligations with a remaining maturity of sixty days or less may be valued at amortized cost in the absence of market quotes, so long as the amortized cost value of such short-term debt instrument is approximately the same as the fair value of the instrument as determined without the use of amortized cost valuation. Floating rate loans are generally valued based upon an evaluated or composite average of aggregate bid and ask quotations supplied by brokers or dealers, as obtained from the pricing service. Securities that use similar valuation techniques and inputs as described above are generally categorized as Level 2 within the fair value hierarchy.
If no current market quotation is readily available or market value quotations are deemed to be unreliable for an investment, the fair value of the investment will be determined in accordance with procedures. A market quotation is readily available only when that quotation is a quoted price (unadjusted) in active markets for identical investments that the Portfolio can access at the measurement date, provided that a quotation will not be readily available if it is not reliable.
Pursuant to Rule 2a-5 under the 1940 Act, the Board of Trustees (the “Board” or “Trustees”) of the Trust has designated Brighthouse Investment Advisers, acting through its Valuation Committee (“Committee”), as the Portfolio’s “valuation designee” to perform the Portfolio’s fair value determinations. The Board oversees Brighthouse Investment Advisers in its role as the Valuation Designee and receives reports from Brighthouse Investment Advisers regarding its process and the valuation of the Portfolio’s investments to assist with such oversight.
No single standard for determining the fair value of an investment can be set forth because fair value depends upon the facts and circumstances with respect to each investment. Information relating to any relevant factors may be obtained by the Committee from any appropriate source, including the subadviser of the Portfolio, the Custodian, a pricing service, market maker and/or broker for
BHFTII-12
Brighthouse Funds Trust II
BlackRock Ultra-Short Term Bond Portfolio
Notes to Financial Statements—December 31, 2023—(Continued)
such security or the issuer. Appropriate methodologies for determining fair value under particular circumstances may include: matrix pricing, a discounted cash flow analysis, comparisons of securities with comparable characteristics, value based on multiples of earnings, discount from market price of similar marketable securities, or a combination of these and other methods.
Investment Transactions and Related Investment Income - Portfolio security transactions are recorded on the trade date. Dividend income is recorded on the ex-dividend date or, for certain foreign securities, when notified. Interest income, which includes amortization of premium and accretion of discount on debt securities, is recorded on the accrual basis. Realized gains and losses on investments are determined on the identified cost basis, which is the same basis used for federal income tax purposes. Foreign income and foreign capital gains on some foreign securities may be subject to foreign taxes, which are accrued as applicable. These foreign taxes have been provided for in accordance with the Portfolio’s understanding of the applicable countries’ tax rules and rates.
Dividends and Distributions to Shareholders - The Portfolio records dividends and distributions on the ex-dividend date. Net realized gains from securities transactions (if any) are generally distributed annually to shareholders. The timing and characterization of certain income and capital gains distributions are determined in accordance with federal tax regulations that may differ from GAAP. Permanent book and tax basis differences relating to shareholder distributions will result in reclassification between distributable earnings (accumulated losses) and paid in surplus. These adjustments have no impact on net assets or the results of operations.
Income Taxes - It is the Portfolio’s policy to comply with the requirements of the Internal Revenue Code of 1986, as amended, and regulations thereunder, applicable to regulated investment companies, and to distribute, with respect to each taxable year, all of its taxable income to shareholders. Therefore, no federal income tax provision is required. The Portfolio files U.S. federal tax returns. No income tax returns are currently under examination. The Portfolio’s federal tax returns remain subject to examination by the Internal Revenue Service for three fiscal years after the returns are filed. As of December 31, 2023, the Portfolio had no uncertain tax positions that would require financial statement recognition, derecognition or disclosure.
Repurchase Agreements - The Portfolio may enter into repurchase agreements, under the terms of a Master Repurchase Agreement (“MRA”), or Global Master Repurchase Agreement (“GMRA”), with selected commercial banks and broker-dealers, under which the Portfolio acquires securities as collateral and agrees to resell the securities at an agreed-upon time and at an agreed-upon price. The Portfolio, through the Custodian or a subcustodian, under a tri-party repurchase agreement, receives delivery of the underlying securities collateralizing any repurchase agreements. It is the Portfolio’s policy that the market value of the collateral be equal to at least 100% of the repurchase price in the case of a repurchase agreement of one-day duration and equal to at least 102% of the repurchase price in the case of all other repurchase agreements. In the event of default or failure by a party to perform an obligation in connection with any repurchase transaction, the MRA or GMRA gives the non-defaulting party the right to set-off claims and to apply property held by it in connection with any repurchase transaction against obligations owed to it under the agreement.
At December 31, 2023, the Portfolio had investments in repurchase agreements with a gross value of $180,200,000, which is reflected as Repurchase agreements on the Statement of Assets and Liabilities. The value of the related collateral exceeded the value of the repurchase agreements at December 31, 2023.
3. Certain Risks
In the normal course of business, the Portfolio invests in securities and enters into transactions where risks exist. Those risks include:
Market Risk: The value of securities held by the Portfolio may decline in response to certain events, including those directly involving the issuers whose securities are owned by the Portfolio; conditions affecting the general economy; overall market changes; local, regional or global political, social or economic instability; currency, interest rate, and price fluctuations, or other factors including terrorism, war, natural disasters and the spread of infectious illness including epidemics or pandemics such as the COVID-19 pandemic. These events may also adversely affect the liquidity of securities held by the Portfolio.
Credit and Counterparty Risk: The Portfolio may be exposed to counterparty risk, or the risk that an entity with which the Portfolio has unsettled or open transactions may default. The potential loss could exceed the value of the financial assets and liabilities recorded in the financial statements. Financial assets that potentially expose the Portfolio to credit and counterparty risk consist principally of cash due from counterparties and investments. The Portfolio manages counterparty risk by entering into agreements only with counterparties that it believes have the financial resources to honor their obligations and by monitoring the financial stability of those counterparties. The Subadviser may attempt to mitigate counterparty risk by (i) periodically assessing the creditworthiness of its trading partners, (ii) monitoring and/or limiting the amount of its net exposure to each individual counterparty based on its assessment, and (iii) requiring collateral from the counterparty for certain transactions. In order to preserve certain safeguards for non-standard settlement trades, the Portfolio restricts its exposure to credit and counterparty losses by entering into master netting agreements (“Master Agreements”) with counterparties (approved brokers) with whom it undertakes a significant volume of transactions. Master Agreements govern the terms of certain transactions and reduce the counterparty risk associated with relevant transactions by specifying credit protection mechanisms and providing standardization that improves legal certainty. Master Agreements can also help limit counterparty risk by specifying collateral posting arrangements at pre-arranged exposure levels.
BHFTII-13
Brighthouse Funds Trust II
BlackRock Ultra-Short Term Bond Portfolio
Notes to Financial Statements—December 31, 2023—(Continued)
Repurchase and reverse repurchase agreements are primarily executed under GMRAs or MRAs, which provide the right to set-off. Each repurchase and reverse repurchase agreement is initially collateralized at the transaction level. In the event of default, the total market value exposure will be offset against collateral exchanged to date, which would result in a net receivable/(payable) that would be due from/to the counterparty.
Additional risks associated with each type of investment are described above within the respective security type notes. The Portfolio’s prospectus includes a discussion of the principal risks of investing in the Portfolio.
4. Investment Management Fees and Other Transactions with Affiliates
Investment Management Agreement - Brighthouse Investment Advisers is the investment adviser to the Portfolio. The Trust has entered into an investment management agreement with Brighthouse Investment Advisers with respect to the Portfolio. For providing investment management services to the Portfolio, Brighthouse Investment Advisers receives monthly compensation at the following annual rates:
|
Management |
% per annum | Average daily net assets | ||||
| $3,269,400 | 0.350 | % | Of the first $1 billion | |||
| 0.300 | % | Of amount in excess of $1 billion | ||||
Brighthouse Investment Advisers has entered into an investment subadvisory agreement with respect to managing the Portfolio. BlackRock Advisors, LLC is compensated by Brighthouse Investment Advisers to provide subadvisory services for the Portfolio.
Management Fee Waivers - Pursuant to a management fee waiver agreement, the Adviser has agreed, for the period May 1, 2023 to April 30, 2024, to reduce its advisory fees set out above under “Investment Management Agreement” as follows:
| % per annum reduction |
Average daily net assets | |
| 0.025% | Of the first $1 billion |
An identical expense agreement was in place for the period April 29, 2022 to April 30, 2023. Amounts waived for the year ended December 31, 2023 are shown as management fee waivers in the Statement of Operations.
Certain officers and trustees of the Trust may also be officers of the Adviser; however, such officers and trustees receive no compensation from the Trust.
During the year ended December 31, 2023, the Subadviser voluntarily reimbursed the Portfolio for a loss of interest income that occurred as a result of an operational error. The error did not result in a breach of regulatory or investment guidelines for the Portfolio. This reimbursement is reflected as payments by affiliates in the Statement of Operations.
Transfer Agency Agreement - Brighthouse Life Insurance Company serves as the transfer agent for the Trust. Brighthouse Life Insurance Company receives no fees for its services to the Trust.
Distribution and Service Fees - The Trust has a distribution agreement with Brighthouse Securities, LLC (the “Distributor”) pursuant to which the Distributor serves as the general distributor of shares of each class (each a “Class”) of each Portfolio. The Distributor is an affiliate of the Trust. The Trust has adopted a Distribution and Services Plan (the “D&S Plan”) relating to Class B, Class D, Class E, Class F and Class G shares of each Portfolio, under Rule 12b-1 under the 1940 Act, pursuant to which the Trust may pay the Distributor a fee (the “Service Fee”) at an annual rate not to exceed 0.25% of each such Portfolio’s average daily net assets attributable to the Class B, Class D, Class E, Class F and Class G shares of the Trust. Each Portfolio may not offer shares of each Class. The D&S Plan also authorizes the Trust, on behalf of each of its Portfolios, to pay to the Distributor a distribution fee (the “Distribution Fee” and together with the Service Fee, the “Fees”) at an annual rate of up to 0.25% of each Portfolio’s average daily net assets attributable to the Class B, Class D, Class E, Class F, and Class G shares in consideration of the services rendered in connection with the sale of such shares by the Distributor. Under the Distribution Agreement with respect to the Trust, Fees are currently paid at an annual rate of 0.25% of average daily net assets in the case of Class B shares, 0.10% of average daily net assets in the case of Class D shares, 0.15% of average daily net assets in the case of Class E shares, 0.20% of average daily net assets in the case of Class F shares and 0.30% of average daily net assets in the case of Class G shares. The D&S Plan is known as a “compensation plan” because the Trust makes payments to the Distributor for services rendered regardless of the actual level of expenditures by the Distributor. Amounts incurred by the Portfolio for the year ended December 31, 2023 are shown as Distribution and service fees in the Statement of Operations.
BHFTII-14
Brighthouse Funds Trust II
BlackRock Ultra-Short Term Bond Portfolio
Notes to Financial Statements—December 31, 2023—(Continued)
Deferred Trustee Compensation - Each Trustee who is not currently an employee of the Adviser or any of its affiliates receives compensation from the Trust for his or her service to the Trust. A deferred compensation plan (the “Plan”) is available to the Trustees on a voluntary basis. Deferred amounts remain in the Trust until distributed in accordance with the provisions of the Plan. The value of a participating Trustee’s deferral account is based on theoretical investments of deferred amounts on the normal payment dates in certain portfolios of the Trust or Brighthouse Funds Trust I, an affiliate of the Trust, as designated by the participating Trustee. Changes in the value of participants’ deferral accounts are reflected as a component of Trustees’ fees and expenses in the Statement of Operations. The portion of the accrued obligations allocated to the Portfolio under the Plan is reflected as Deferred trustees’ fees in the Statement of Assets and Liabilities.
5. Contractual Obligations
Under the Trust’s organizational documents, its officers and Trustees may be indemnified against certain liabilities and expenses arising out of the performance of their duties to the Trust. Additionally, the Trust has a variety of indemnification obligations under contracts with its service providers. The Trust’s maximum exposure under these arrangements is unknown, as this would involve future claims that may be made against the Trust that have not yet occurred.
6. Income Tax Information
The cost basis of investments for federal income tax purposes at December 31, 2023 was as follows:
| Cost basis of investments |
$ | 772,686,697 | ||
|
|
|
|||
| Gross unrealized appreciation |
334,535 | |||
| Gross unrealized (depreciation) |
(100,932 | ) | ||
|
|
|
|||
| Net unrealized appreciation (depreciation) |
$ | 233,603 | ||
|
|
|
The tax character of distributions paid for the years ended December 31, 2023 and 2022 were as follows:
| Ordinary Income |
Long-Term Capital Gain | Total | ||||||||||||||||||
| 2023 |
2022 | 2023 | 2022 | 2023 | 2022 | |||||||||||||||
| $13,861,272 | $ | — | $ | — | $ | — | $ | 13,861,272 | $ | — | ||||||||||
As of December 31, 2023, the components of distributable earnings (accumulated losses) on a federal income tax basis were as follows:
| Undistributed |
Undistributed Long-Term Capital Gain |
Net Unrealized Appreciation (Depreciation) |
Accumulated Capital Losses |
Total | ||||||||||||
| $44,736,871 | $ | — | $ | 233,603 | $ | — | $ | 44,970,474 | ||||||||
The Portfolio utilizes the provisions of the federal income tax laws that provide for the carryforward of capital losses for prior years, offsetting such losses against any future realized capital gains. Net capital losses may be carried forward indefinitely and their character is retained as short-term and/or long-term losses.
As of December 31, 2023, the Portfolio had no accumulated capital losses.
7. Regulatory Updates
Effective January 24, 2023, the SEC adopted rule and form amendments to require open-end mutual funds to transmit concise and visually engaging streamlined annual and semiannual reports to shareholders that highlight key information. Other information, including financial statements, will no longer appear in a streamlined shareholder report but must be available online, delivered free of charge upon request, and filed on a semiannual basis on Form N-CSR. The rule and form amendments have a compliance date of July 24, 2024. Accordingly, the rule and form amendments will not impact the Portfolios until the 2024 semiannual shareholder reports.
BHFTII-15
Brighthouse Funds Trust II
BlackRock Ultra-Short Term Bond Portfolio
Report of Independent Registered Public Accounting Firm
To the Board of Trustees of Brighthouse Funds Trust II and Shareholders of the BlackRock Ultra-Short Term Bond Portfolio:
Opinion on the Financial Statements and Financial Highlights
We have audited the accompanying statement of assets and liabilities, including the schedule of investments, of the BlackRock Ultra-Short Term Bond Portfolio (the “Fund”) (one of the funds constituting the Brighthouse Funds Trust II), as of December 31, 2023, the related statement of operations for the year then ended, the statements of changes in net assets for each of the two years in the period then ended, the financial highlights for each of the five years in the period then ended, and the related notes. In our opinion, the financial statements and financial highlights present fairly, in all material respects, the financial position of the Fund as of December 31, 2023, and the results of its operations for the year then ended, the changes in its net assets for each of the two years in the period then ended, and the financial highlights for each of the five years in the period then ended in conformity with accounting principles generally accepted in the United States of America.
Basis for Opinion
These financial statements and financial highlights are the responsibility of the Fund’s management. Our responsibility is to express an opinion on the Fund’s financial statements and financial highlights based on our audits. We are a public accounting firm registered with the Public Company Accounting Oversight Board (United States) (PCAOB) and are required to be independent with respect to the Fund in accordance with the U.S. federal securities laws and the applicable rules and regulations of the Securities and Exchange Commission and the PCAOB.
We conducted our audits in accordance with the standards of the PCAOB. Those standards require that we plan and perform the audit to obtain reasonable assurance about whether the financial statements and financial highlights are free of material misstatement, whether due to error or fraud. The Fund is not required to have, nor were we engaged to perform, an audit of its internal control over financial reporting. As part of our audits we are required to obtain an understanding of internal control over financial reporting but not for the purpose of expressing an opinion on the effectiveness of the Fund’s internal control over financial reporting. Accordingly, we express no such opinion.
Our audits included performing procedures to assess the risks of material misstatement of the financial statements and financial highlights, whether due to error or fraud, and performing procedures that respond to those risks. Such procedures included examining, on a test basis, evidence regarding the amounts and disclosures in the financial statements and financial highlights. Our audits also included evaluating the accounting principles used and significant estimates made by management, as well as evaluating the overall presentation of the financial statements and financial highlights. Our procedures included confirmation of securities owned as of December 31, 2023, by correspondence with the custodian and brokers; when replies were not received from brokers, we performed other auditing procedures. We believe that our audits provide a reasonable basis for our opinion.
/s/ Deloitte & Touche LLP
Boston, Massachusetts
February 23, 2024
We have served as the auditor of one or more Brighthouse investment companies since 1983.
BHFTII-16
Brighthouse Funds Trust II
Trustees and Officers
MANAGEMENT OF THE TRUSTS
The Boards of Trustees (the “Board”) of Brighthouse Funds Trust I and Brighthouse Funds Trust II (“Trust I” and “Trust II”, respectively, and collectively the “Trusts”) supervise the Trusts and are responsible for representing the interests of shareholders. The Trustees, the Chairman of the Board and the Chairmen of each subcommittee are the same for both Trusts. The Trustees of each Trust meet periodically throughout the year to oversee the Portfolios’ activities, reviewing, among other things, each Portfolio’s performance and its contractual arrangements with various service providers. The Trustees of each Trust elect the officers of the Trust, who are responsible for administering the Trust’s day-to-day operations.
Trustees and Officers
The Trustees and executive officers of the Trusts, as well as their ages and their principal occupations during the past five years, are set forth below. Unless otherwise indicated, the business address of each is c/o Brighthouse Funds Trust I and Brighthouse Funds Trust II, 11225 N. Community House Rd., Charolette, North Carolina 28277. Each Trustee who is deemed an “interested person,” as such term is defined in the 1940 Act, is referred to as an “Interested Trustee.” Those Trustees who are not “interested persons,” as such term is defined in the 1940 Act, are referred to as “Independent Trustees.” There is no limit to the term a Trustee may serve, other than pursuant to the retirement policy adopted by the Independent Trustees. Trustees serve until their death, resignation, retirement or removal in accordance with Trust I’s and Trust II’s respective organizational documents and policies adopted by the Board of the Trust from time to time. Officers hold office at the pleasure of each Board and serve until their removal or resignation in accordance with the Trusts’ respective organizational documents and policies adopted by the Board of each Trust from time to time.
Trustees of the Trusts
| Name and Year of Birth |
Position(s) |
Term of Office |
Principal Occupation(s) During the Past |
Number of |
Other Directorships Held | |||||
| Interested Trustee | ||||||||||
| John Rosenthal* (1960) |
Trustee | Indefinite; From May 2016 (Trust I and Trust II) to present | Chief Investment Officer, Brighthouse Financial, Inc. (2016 to present). | 73 | None | |||||
| Independent Trustees | ||||||||||
| Dawn M. Vroegop (1966) |
Trustee and Chair of the Board | Indefinite; From December 2000 (Trust I)/May 2009 (Trust II) to present as Trustee; From May 2016 (Trust I and Trust II) until present as Chair | Retired; Private Investor. | 73 | Trustee, Driehaus Mutual Funds (8 portfolios).** | |||||
| Stephen M. Alderman (1959) |
Trustee | Indefinite; From December 2000 (Trust I)/April 2012 (Trust II) to present | Vice President and General Counsel, IHR Aerial Solutions, LLC; Until 2022, General Counsel, Illini Hi-Reach, Inc.; Until 2020, Shareholder in the law firm of Garfield & Merel, Ltd. | 73 | None | |||||
| Robert J. Boulware (1956) |
Trustee | Indefinite; From March 2008 (Trust I)/April 2012 (Trust II) to present | Managing Member, Pilgrim Funds, LLC (private equity fund). | 73 | Trustee, Vertical Capital Income Fund (closed-end fund);** Trustee, The Private Shares Fund (closed- end fund);** Until 2021, Director, Mid- Con Energy Partners, LP (energy);** Until 2020, Director, Gainsco, Inc. (auto insurance).** | |||||
BHFTII-17
Brighthouse Funds Trust II
Trustees and Officers—(Continued)
| Name and Year of Birth |
Position(s) |
Term of Office |
Principal Occupation(s) During the Past |
Number of |
Other Directorships Held | |||||
| Susan C. Gause (1952) |
Trustee | Indefinite; From March 2008 (Trust I)/April 2012 (Trust II) to present | Private Investor. | 73 | Trustee, HSBC Funds (4 portfolios).** | |||||
| Nancy Hawthorne (1951) |
Trustee | Indefinite; From May 2003 (Trust II)/April 2012 (Trust I) to present | Private Investor. | 73 | Trustee, First Eagle Credit Opportunities Fund;** Trustee and Chair of the Board of Trustees, First Eagle Global Opportunities Fund;** Director, Avid Technology, Inc;** Director, CRA International, Inc.** | |||||
Executive Officers of the Trusts
| Name and Year of Birth |
Position(s) |
Term of Office |
Principal Occupation(s) | |||
| Kristi Slavin (1973) | President and Chief Executive Officer, of Trust I and Trust II | From May 2016 (Trust I and Trust II) to present |
President, Brighthouse Investment Advisers, LLC (2016-present). | |||
| Alan R. Otis (1971) | Chief Financial Officer and Treasurer, of Trust I and Trust II | From November 2017 (Trust I and Trust II) to present |
Executive Vice President, Brighthouse Investment Advisers, LLC (2017-present); formerly, Vice President, Brighthouse Investment Advisers, LLC (2012-2017); Assistant Treasurer, Trust I and Trust II (2012-2017). | |||
| Thomas Watterson (1985) | Secretary, of Trust I and Trust II | From November 2023 (Trust I and Trust II) to present |
Executive Vice President, Chief Legal Officer and Secretary, Brighthouse Investment Advisers, LLC (2023-Present); Managing Corporate Counsel, Brighthouse Financial Inc. (2023-present); Managing Counsel and Director, The Bank of New York Mellon Corporation (2019-2023); Counsel and Vice President, The Bank of New York Mellon Corporation (2016-2019). | |||
| Katie Hellmann (1980) | Chief Compliance Officer (“CCO”), of Trust I and Trust II | From May 2023 (Trust I and Trust II) to present |
Chief Compliance Officer, Brighthouse Investment Advisers, LLC (2023-present) and Head of Funds and Investments Compliance (2023-present). Deputy Chief Compliance Officer, Transamerica Asset Management (2022-2023). Leader and Senior Compliance Counsel – Funds Compliance, Edward Jones (2017-2022). | |||
| Rosemary Morgan (1983) | Anti-Money Laundering Officer, of Trust I and Trust II | From May 2023 (Trust I and Trust II) to present |
Chief Privacy Officer, Leader of Compliance Programs and Assistant General Counsel, Brighthouse Financial, Inc. (2019-2022); Chief Privacy Officer, Head of Compliance Programs & Contracts Law, Brighthouse Financial, Inc. (2022-2023), Chief Compliance Officer and Associate General Counsel, Brighthouse Financial, Inc. (2023-present); Vice President and Chief Compliance Officer, Brighthouse Life Insurance Company (2023-present); Vice President and Chief Compliance Officer (2023-present), Brighthouse Life Insurance Company of NY; Vice President and Chief Compliance Officer (2023-present), New England Life Insurance Company. | |||
| Anna Koska (1981) | Vice President, of Trust I and Trust II | From June 2022 (Trust I and Trust II) to present |
Vice President, Investment and Advisory Services, Brighthouse Investment Advisers, LLC (2022-present); Director of Investment and Advisory Services, Brighthouse Investment Advisers, LLC (2019-2022); Senior Portfolio Analyst, Brighthouse Investment Advisers, LLC (2017-2019). | |||
| * | Mr. Rosenthal is an “interested person” of the Trusts because of his position with Brighthouse Financial, Inc. (“Brighthouse Financial”), an affiliate of BIA. |
| ** | Indicates a directorship with a registered investment company or a company subject to the reporting requirements of the Securities Exchange Act of 1934, as amended. |
| (1) | Previous positions during the past five years with the Trusts, MetLife, Inc. or the Adviser are omitted if not materially different. |
| (2) | The Fund Complex includes 44 Trust I Portfolios and 29 Trust II Portfolios. |
BHFTII-18
Brighthouse Funds Trust II
BlackRock Ultra-Short Term Bond Portfolio
Board of Trustees’ Consideration of Advisory and Sub-Advisory Agreements
At a meeting held on November 13-14, 2023 (the “November Meeting”), the Boards of Trustees (the “Board”) of Brighthouse Funds Trust I and Brighthouse Funds Trust II (“BFT I” and “BFT II,” respectively, and collectively, the “Trusts”), including a majority of the Trustees who are not “interested persons” of the Trusts (the “Independent Trustees”) under the Investment Company Act of 1940 (the “1940 Act”), approved the continuation of the Trusts’ advisory agreements (each an “Advisory Agreement”) with Brighthouse Investment Advisers, LLC (the “Adviser”) and the applicable sub-advisory and sub-sub-advisory agreements (each a “Sub-Advisory Agreement” and collectively with the Advisory Agreement, the “Agreements”) between the Adviser and the investment sub-advisers and sub-sub-adviser (each a “Sub-Adviser,” and collectively, the “Sub-Advisers”) for the series of the Trusts (each a “Portfolio,” and collectively, the “Portfolios”) for the annual contract renewal period from January 1, 2024 through December 31, 2024.
The Board met with personnel of the Adviser on September 28-29, 2023 (the “September Meeting”) for the specific purpose of giving preliminary consideration to the proposed continuation of the Agreements, including consideration to information that the Adviser and Sub-Advisers had provided for the Board’s review at the request of the Independent Trustees. At the September Meeting, the Adviser reviewed with the Board the performance and fees experienced by each Portfolio, as well as other information. During and after the September Meeting, the Independent Trustees requested additional information and clarifications that the Adviser addressed at the November Meeting (the September Meeting and the November Meeting are referred to collectively as, the “Meetings”). During the contract renewal process, and throughout the year, the Independent Trustees were advised by independent legal counsel, and they met with independent legal counsel in executive sessions outside of the presence of management on a number of occasions to discuss, among other things, the renewal of the Agreements.
In considering the continuation of the Agreements, the Board reviewed a variety of materials that were provided for the specific purpose of assisting the Board in the renewal process, along with various information and materials that were provided to and discussed with the Board throughout the year, at regularly scheduled meetings of the Board and its committees. In particular, information for each Portfolio included, but was not limited to, reports on investment performance, expenses, legal and compliance matters, and asset pricing. Information about the Adviser and each Sub-Adviser included, but was not limited to, reports on the business, operations, and performance of the Adviser and the Sub-Advisers and reports that the Adviser and Sub-Advisers had prepared specifically for the renewal process.
In considering the continuation of the Agreements, the Board also reviewed, among other things, a report for each Portfolio that was prepared by Broadridge (“Broadridge”), an independent organization, which set forth comparative performance and expense information for each Portfolio. In addition, the Independent Trustees reviewed a report that was prepared by JDL Consultants, LLC (“JDL”), an independent consultant to the Independent Trustees, which examined the Broadridge reports for each Portfolio (“JDL Report”). The Independent Trustees met in executive session with representatives of JDL during the September Meeting to review the JDL Report.
At the November Meeting, the Board, including a majority of the Independent Trustees, concluded that the nature, extent, and quality of services provided by the Adviser and each Sub-Adviser supported the renewal of the Agreements. The Board also concluded that the investment services provided to and the performance of each Portfolio was such that each Agreement should continue, and that the fees paid by each Portfolio to the Adviser appeared to be reasonable in light of the nature, extent, and quality of the services provided by the Adviser and each Sub-Adviser. Further, the Board concluded that the Adviser’s profitability in providing services under the Advisory Agreements did not appear unreasonable in light of the nature, extent, and quality of the services provided by the Adviser. The Board reviewed the extent to which the investment advisory fees paid by the Portfolios shared economies of scale with investors or entailed the potential to share economies of scale with investors and concluded that those considerations generally supported the renewal of each Agreement. Finally, the Board considered the Adviser’s recommendation that it approve the renewal of each Sub-Advisory Agreement.
In approving the continuation of each Agreement, the Board, including the Independent Trustees, gave attention to all of the information that was furnished, and each Trustee placed varying degrees of importance on the various pieces of information that were provided to them. The Board evaluated the information provided to it on a Portfolio-by-Portfolio basis, and its decision was made separately with respect to each Portfolio. The following paragraphs provide more information about some of the primary factors that were relevant to the Board’s decisions. The Board did not identify any single factor as determinative, and the Trustees generally attributed different weights to various factors for the various Portfolios.
Nature, extent and quality of services. The Board evaluated the nature, extent, and quality of the services that the Adviser and the Sub-Advisers, as relevant, provided to the Portfolios. The Board considered the Adviser’s services as investment manager to the Portfolios, including its services relating to the hiring and oversight of the Sub-Advisers and, in particular, their investment programs
BHFTII-19
Brighthouse Funds Trust II
BlackRock Ultra-Short Term Bond Portfolio
Board of Trustees’ Consideration of Advisory and Sub-Advisory Agreements—(Continued)
and personnel, succession management of key personnel, trading practices, compliance programs and personnel, and risk management programs, among other things. The Adviser’s services in coordinating and overseeing the activities of the Trusts’ other service providers were also considered. The Board also considered the systems and processes required by the Adviser to meet additional regulatory and compliance requirements resulting from U.S. Securities and Exchange Commission and other regulatory initiatives, including related to liquidity, valuation, and derivatives risk management. The Board considered information received from the Trusts’ Chief Compliance Officer regarding the Portfolios’ compliance policies and procedures that were established pursuant to Rule 38a-l under the 1940 Act, and relevant aspects of the Adviser’s and Sub-Advisers’ compliance policies and procedures. The Board also noted that it was the practice of the Adviser’s investment, compliance, and legal staff to conduct periodic meetings (through various media) with the Sub-Advisers throughout the year in order to review and assess the services that are provided to the Portfolios, and that personnel of the Adviser routinely prepare and present reports to the Board regarding those meetings. In addition, during the Meetings and throughout the year, the Board considered the expertise, experience, and performance of the personnel of the Adviser who performed the various services that are mentioned above.
With respect to the services provided by each of the Sub-Advisers, the Board considered a variety of information that the Adviser and each Sub-Adviser prepared for the Board’s review. The Board considered each Sub-Adviser’s investment process, each Sub-Adviser’s overall organization and business plans and the investment performance experienced by the Portfolio (as described in more detail below). The Board took into account that each Sub-Adviser’s responsibilities include, among other things, the development and maintenance of an investment program for the applicable Portfolio, the selection of investments and the placement of orders for the purchase and sale of such assets, and the implementation of compliance controls related to the performance of these services. The Board considered, based on the information provided, each Sub-Adviser’s staffing with respect to the management of the Portfolio and other information relating to the Sub-Adviser’s business and operations. The Board also considered the Sub-Adviser’s overall resources and information with respect to any recent turnover of key personnel at the Sub-Adviser. The Board reviewed each Sub-Adviser’s investment experience, as well as information provided regarding the Sub-Adviser’s personnel who provide services to the Portfolios. The Board also considered, among other things, information about each Sub-Adviser’s compliance program, including regarding any compliance matters involving a Sub-Adviser that had been brought to the Board’s attention during the year, as well as the Adviser’s assessment of the financial condition of each Sub-Adviser.
Performance. The Board placed emphasis on the performance of each Portfolio in the context of the performance of the relevant markets in which the Portfolio invests. The Board considered the Adviser’s quarterly presentations to the Board of detailed information about each Portfolio’s investment strategies and performance results and composition, including discussions regarding the relevant effects of market conditions. The Board reviewed and considered the reports prepared by Broadridge, which provided a statistical analysis comparing each Portfolio’s investment performance to that of comparable funds underlying variable insurance products (the “Performance Universe”), and the JDL Report. The Board also compared the performance of each Portfolio to that of comparable funds and other accounts that were managed by the relevant Sub-Adviser, to the extent such information was provided. The Board considered each Portfolio’s performance for periods subsequent to the performance period covered by the Broadridge reports and considered the Adviser’s assessment of the same. The Board also noted that while it found the data provided by Broadridge generally useful, it recognized the limitations of such data, including, in particular, that notable differences may exist between a Portfolio and the other funds in a Broadridge category (for example, with respect to investment strategies) and that the results of the performance comparisons may vary depending on (i) the end dates for the performance periods that were selected and (ii) the selection of the peer groups.
The Board focused particular attention on Portfolios with less favorable performance records. The Board noted the Adviser’s focus on each Sub-Adviser’s performance and that the Adviser had been active in monitoring and responding to any performance issues with respect to the Portfolios.
Fees and Expenses. The Board gave consideration to the level and method of computing the fees payable under the Agreements. The Board reviewed and considered the information in the JDL Report concerning fees and expenses. The Board also reviewed and considered the Broadridge report for each Portfolio, which included various comparisons of the Portfolio’s fees (at December 31, 2022 and various asset levels) and expenses with those of its peers, including, as applicable, a broad group of peer funds (“Expense Universe”), a narrower group of peer funds (“Expense Group”), a broad group of peer sub-advised funds (“Sub-advised Expense Universe”), and a narrower group of peer sub-advised funds (“Sub-advised Expense Group”). In particular, the Board reviewed comparisons of each Portfolio’s contractual management fees with its Expense Group and Sub-advised Expense Universe, contractual sub-adviser fees with its Sub-advised Expense Universe and Sub-advised Expense Group, and total expenses with its Expense Universe, Expense Group and Sub-advised Expense Universe. The Board considered that Broadridge selected the peer funds, which were funds underlying variable insurance products that Broadridge deemed to be comparable to the Portfolios. The Board considered that the fee
BHFTII-20
Brighthouse Funds Trust II
BlackRock Ultra-Short Term Bond Portfolio
Board of Trustees’ Consideration of Advisory and Sub-Advisory Agreements—(Continued)
and expense information in the Broadridge report for each Portfolio reflected information as of the Portfolio’s most recent fiscal year end at the time the Broadridge report was issued and that historical asset levels may differ from current asset levels, particularly in a period of market volatility. In addition, the Board compared the fee payable to a Sub-Adviser by the Adviser with respect to the Portfolio to the fee payable to the Sub-Adviser by other comparable funds and other accounts, to the extent such information was provided.
The Board noted that the sub-advisory fees for the Portfolios are negotiated at arm’s length by the Adviser and are paid by the Adviser out of its advisory fees. The Board also considered that the Adviser had entered into expense limitation or management fee waiver agreements with certain of the Portfolios pursuant to which the Adviser had agreed to waive a portion of its advisory fee and/or reimburse certain expenses as a means of limiting a Portfolio’s total annual operating expenses or passing through the benefit of a subadvisory fee concession to a Portfolio, as applicable.
Profitability. The Board examined the profitability to the Adviser of each Advisory Agreement, on a Portfolio-by-Portfolio basis. The Board also considered that an affiliate of the Adviser, Brighthouse Securities, LLC, serves as distributor for the Trusts, and, as such, receives Rule 12b-1 payments to support the distribution of the Portfolios. The Board considered the profitability to the Sub-Advisers and their affiliates of their relationships with the Portfolios, to the extent provided, and the Board considered the ability of the Adviser to negotiate with a Sub-Adviser at arm’s length. In reviewing the profitability information, the Board recognized that expense allocation methodologies are inherently subjective and various methodologies may be reasonable while producing different results.
Economies of scale. The Board considered each Portfolio’s fees in light of its size. The Board noted the fee schedules for the Portfolios that contain breakpoints that reduce the fee rate above specified asset levels, including breakpoints in the Advisory Agreements and any corresponding Sub-Advisory Agreement. The Board noted those Portfolios that did not have breakpoints in their advisory fees and considered management’s explanation of the same.
The Board considered the effective fees under the Advisory Agreement and Sub-Advisory Agreement for each Portfolio as a percentage of assets at different asset levels and possible economies of scale that may be realized if the assets of the Portfolio grow. The Board examined, among other data, the effect of a Portfolio’s growth in size, and reduction in size, on various fee schedules. The Board also generally noted that if a Portfolio’s assets increase over time, the Portfolio may realize economies of scale if assets increase proportionally more than certain other expenses.
Other factors. The Board considered other benefits that may be realized by the Adviser and its affiliates from their relationships with the Trusts. Among the benefits realized by the Adviser, the Board recognized that Brighthouse Securities, LLC, as the distributor for the Trusts, receives payments pursuant to Rule 12b-1 from the Portfolios to help compensate for the provision of shareholder services and distribution activities. The Board considered that a Sub-Adviser may engage in soft dollar transactions in managing a Portfolio. In addition, the Board considered that a Sub-Adviser may be affiliated with registered broker-dealers that may, from time to time, receive brokerage commissions from a Portfolio in connection with the sale of portfolio securities (subject to applicable best execution obligations). The Board also considered that a Sub-Adviser and its affiliates could benefit from the opportunity to provide advisory services to additional portfolios of the Trusts and overall reputational benefits.
The Board considered information from the Adviser and Sub-Advisers pertaining to potential conflicts of interest, and the manner in which any potential conflicts were mitigated. In its review, the Board considered information regarding various business relationships among the Adviser and its affiliates and various Sub-Advisers and their affiliates. The Board also considered information about services and/or payments provided to the Adviser by the Sub-Advisers in connection with marketing activities. The Board considered representations from the Adviser that such business relationships and any payments were not considered in the Adviser’s recommendation to renew any of the Sub-Advisory Agreements.
* * * * *
BlackRock Ultra-Short Term Bond Portfolio. The Board also considered the following information in relation to the Agreements with the Adviser and BlackRock Advisors, LLC regarding the Portfolio:
Among other data relating specifically to the Portfolio’s performance, the Board considered that the Portfolio outperformed the median of its Performance Universe and the average of its Morningstar Category for the one-, three-, and five-year periods ended June 30, 2023. The Board further considered that the Portfolio outperformed its benchmark, the Bank of America/Merrill Lynch 3-Month Treasury Bill Index, for the one-year period ended October 31, 2023 and underperformed the same benchmark for the three- and five-year periods ended October 31, 2023. The Board also noted the presence of certain management fee waivers in effect for the Portfolio.
BHFTII-21
Brighthouse Funds Trust II
BlackRock Ultra-Short Term Bond Portfolio
Board of Trustees’ Consideration of Advisory and Sub-Advisory Agreements—(Continued)
The Board also considered that the Portfolio’s actual management fees and total expenses (exclusive of 12b-1 fees) were below the Expense Group median, the Expense Universe median, and the Sub-advised Expense Universe median. The Board noted that the Portfolio’s contractual management fees were below the asset-weighted average of the Investment Classification/Morningstar Category selected by Broadridge at the Portfolio’s current size. The Board also noted that the Portfolio’s contractual sub-advisory fees were below the averages of the Sub-advised Expense Group and the Sub-advised Expense Universe at the Portfolio’s current size.
BHFTII-22
Brighthouse Funds Trust II
Brighthouse Asset Allocation 20 Portfolio
Managed by Brighthouse Investment Advisers, LLC
Portfolio Manager Commentary*
PERFORMANCE
For the twelve months ended December 31, 2023, the Class A and B shares of the Brighthouse Asset Allocation 20 Portfolio returned 8.08% and 7.83%, respectively. The Portfolio’s benchmark, the Dow Jones Conservative Portfolio Index¹, returned 6.93%.
MARKET ENVIRONMENT / CONDITIONS
Markets carried the momentum of late 2022 and ended the first quarter of 2023 on a positive note. After a string of seven consecutive rate hikes by the U.S. Federal Reserve (the “Fed”) in 2022, signs of high inflation began to wane, and speculation arose monetary tightening may soon end. At its February and March meetings, the Fed scaled back the magnitude of rate hikes and implemented increases of 0.25%, respectively. In March, the Fed moved quicky to inject liquidity into the banking sector after a few well-publicized bank failures surfaced. Bond and equity investors cheered the decisive action to quell the risk.
Investor enthusiasm began to falter in the second quarter of 2023. Bond markets were being pressured by central bank actions to raise rates as inflationary concerns continued to exist. In May, the Fed enacted its tenth consecutive rate hike before it voted to hold rates in check at its June meeting. The yield on the 10-year U.S. Treasury Bond rose throughout the quarter and negatively impacted government and investment grade credit bonds. In June, economic growth, as measured by the real gross domestic product (“GDP”) rate was positive as the first quarter 2023 real GDP growth rate reported a 2% annual gain. However, it marked the third straight quarter of decelerating GDP levels and raised doubts over the strength of the economy.
Conditions deteriorated in the third quarter with broad market declines amid a global equity correction and a worsening bond slump over the last two quarters. Equities pulled back after having established gains in the first half of the year. The possibility rates may remain higher and with central bank comments absent any definitive near-term relief, markets retreated. Globally, the European Union lowered its growth forecast and concern over China’s property sector pressured markets with Moody’s downgrading China’s property sector outlook to negative. The resilience of core bonds held up in the early part of the third quarter before prices declined sharply in the final two months of the quarter. The 10-Year U.S. Treasury yield moved aggressively over the period and rose 78 basis points (“bps”) and 50 bps in September alone. Though the Fed paused hiking rates at its September meeting, economic data showed a relatively healthy economy and kept hawkish monetary policies at the forefront.
The final two months of the year witnessed a robust turnaround for bonds and equities. Inflationary fears subsided and investors rejoiced that the cycle of rate hikes and aggressive monetary policies appeared to have levelled off and central banks may have their eyes focused instead on potential interest rate cuts for 2024. In the U.S., Fed officials kept their hands on the pause button during the fourth quarter and maintained the Federal Fund Rate at a range of 5.25% to 5.50%. Bond prices surged as the 10-Year U.S. Treasury yield fell 100 bps between October and the end of the year. Not to be outdone, several major broad-based equity markets had double-digit gains during the quarter.
For the full year ended 2023, the S&P 500 Index returned 26.29%. International stocks, as measured by the MSCI EAFE Index, gained 18.24%, and emerging market stocks, as measured by the MSCI Emerging Markets Index, returned 9.83%. Within fixed income, core bonds, as measured by the Bloomberg U.S. Aggregate Bond Index, returned 5.53% for the year ended December 31, 2023.
PORTFOLIO REVIEW / PERIOD-END POSITIONING
The Brighthouse Asset Allocation 20 Portfolio invests in underlying portfolios of the Brighthouse Funds Trust I and the Brighthouse Funds Trust II to maintain a broad asset allocation of approximately 20% to equities and 80% to fixed income.
Over the twelve-month period, the Portfolio outperformed the Dow Jones Conservative Portfolio Index. Performance strength within the underlying fixed income and mid cap equity portfolios offset weakness within the underlying large cap equity and international equity portfolios.
On an absolute return basis, the top performing underlying fixed income portfolios were the BlackRock High Yield Portfolio and the Brighthouse/Eaton Vance Floating Rate Portfolio as below investment grade bonds (“high yield”) performed well relative to higher credit quality rated bonds. The Western Asset Management Strategic Bond Opportunities Portfolio outperformed its benchmark by 3.9%. Allocations to high yield bonds and bank loans were primary contributors. Exposures to non-agency mortgage-backed securities (“MBS”) and emerging market debt aided returns. The PIMCO Total Return Portfolio exceeded its benchmark by 0.7%. The Portfolio’s yield curve positioning and duration management made positive contributions. Overweight exposures to both non-agency MBS, particularly collateralized loan obligations (“CLOs”) and agency MBS and security selection to investment grade bonds lifted relative results. The PIMCO Inflation Protected Bond Portfolio underperformed its benchmark by 0.2%. An overweight to U.S. inflation expectations detracted as inflationary pressures moderated over the period. The Brighthouse/Templeton International Bond Portfolio underperformed its benchmark by 2.1%. Currency positioning in the euro, Japanese yen, and South Korean won were the primary detractors from relative results during the period.
Performance from the underlying domestic equity portfolios was mixed for the period. Large cap and small cap portfolios underperformed, while mid cap portfolios were positive contributors. In large cap, the Brighthouse/Wellington Core Equity Opportunities Portfolio underperformed its benchmark by 18.9%. Negative security selection in the Industrials, Consumer Discretionary, and
BHFTII-1
Brighthouse Funds Trust II
Brighthouse Asset Allocation 20 Portfolio
Managed by Brighthouse Investment Advisers, LLC
Portfolio Manager Commentary*—(Continued)
Information Technology (“IT”) sectors were key detractors during the year. An underweight position in the IT and Communication Services sectors, and an overweight in the Consumer Discretionary sector further pressured results. The MFS Value Portfolio underperformed its benchmark by 3.3%. Security selection weakness in the Industrials and Communication Services sectors, along with an underweight to Communication Services drove the relative underperformance. On the positive side, the BlackRock Capital Appreciation Portfolio beat its benchmark by 6.9%. Contributions in security selection were made primarily in the IT, Health Care, and Financials sectors. An underweight to Consumer Staples also helped relative outperformance. Within mid cap, the Brighthouse/Artisan Mid Cap Value Portfolio outperformed its benchmark by 5.8%. Security selection in the Financials, IT, and Consumer Discretionary sectors were the largest relative contributors to results. The T. Rowe Price Mid Cap Growth Portfolio’s absolute performance lifted overall mid cap results. In small cap, the Brighthouse Small Cap Value Portfolio underperformed its benchmark by 0.4%. Negative security selection in the IT and Energy sectors detracted from relative results. The T. Rowe Price Small Cap Growth Portfolio’s absolute performance benefited overall results.
The underlying non-U.S. equity portfolios underperformed over the period. Within developed markets, VanEck Global Natural Resources Portfolio’s negative absolute performance was a detractor to overall international equity results. Security selection weakness in the Materials sector to the diversified metals & mining and copper sub-industries negatively impacted performance. The MFS Research International Portfolio underperformed its benchmark by 5.2%. Security selection weakness in the Financials, Consumer Discretionary, and Consumer Staples sectors were leading detractors over the period. On the positive side, the Harris Oakmark International Portfolio outperformed its benchmark by 1.0%. Positive security selection in the Industrials, Communication Services, and Consumer Staples sectors benefited results. From a country perspective, an overweight position in Germany and an underweight to Hong Kong positively impacted performance. In emerging markets, the Brighthouse/abrdn Emerging Markets Equity Portfolio underperformed its benchmark by 3.2%. Negative security selection in the Consumer Discretionary, IT, and Health Care sectors were leading detractors to relative performance.
Investment Committee
Brighthouse Investment Advisers, LLC
* This commentary may include statements that constitute “forward-looking statements” under the U.S. securities laws. Forward-looking statements include, among other things, projections, estimates, and information about possible or future results related to the Portfolio, market or regulatory developments. The views expressed above are not guarantees of future performance or economic results and involve certain risks, uncertainties and assumptions that could cause actual outcomes and results to differ materially from the views expressed herein. The views expressed above are subject to change at any time based upon economic, market, or other conditions and the advisory firm undertakes no obligation to update the views expressed herein. Any discussions of specific securities should not be considered a recommendation to buy or sell those securities. The views expressed above (including any forward-looking statement) may not be relied upon as investment advice or as an indication of the Portfolio’s trading intent. Information about the Portfolio’s holdings, asset allocation or country diversification is historical and is not an indication of future Portfolio composition, which may vary. Direct investment in any index is not possible. The performance of any index mentioned in this commentary has not been adjusted for ongoing management, distribution and operating expenses, and sales charges applicable to mutual fund investments. In addition, the returns do not reflect additional fees charged by separate accounts or variable insurance contracts that an investor in the Portfolio may pay. If these additional fees were reflected, performance would have been lower.
1 The Dow Jones Conservative Portfolio Index is a member of the Dow Jones Relative Risk Index Series and is designed to measure a total portfolio of stocks, bonds, and cash, allocated to represent an investor’s desired risk profile. The Dow Jones Conservative Portfolio Index level is set to 20% of the Dow Jones Global Stock CMAC Index’s downside risk over the past 36 months.
BHFTII-2
Brighthouse Funds Trust II
Brighthouse Asset Allocation 20 Portfolio
A $10,000 INVESTMENT COMPARED TO THE DOW JONES CONSERVATIVE PORTFOLIO INDEX
AVERAGE ANNUAL RETURNS (%) FOR THE YEAR ENDED DECEMBER 31, 2023
| 1 Year |
5 Year |
10 Year |
||||||||||
| Brighthouse Asset Allocation 20 Portfolio |
||||||||||||
| Class A |
8.08 | 3.88 | 3.31 | |||||||||
|
Class B |
7.83 | 3.62 | 3.05 | |||||||||
| Dow Jones Conservative Portfolio Index |
6.93 | 1.57 | 1.90 | |||||||||
Portfolio performance is calculated including reinvestment of all income and capital gain distributions. Performance numbers are net of all Portfolio expenses but do not include any insurance, sales, separate account or administrative charges of variable annuity or life insurance contracts or any additional expenses that participants may bear relating to the operations of their plans. If these charges were included, the returns would be lower. The performance of any index referenced above has not been adjusted for ongoing management, distribution and operating expenses, and sales charges applicable to mutual fund investments. Direct investment in any index is not possible. The performance of Class A shares, as set forth in the line graph above, will differ from that of other classes because of the difference in expenses paid by policyholders investing in the different share classes.
This information represents past performance and is not indicative of future results. Investment return and principal value may fluctuate so that shares, upon redemption, may be worth more or less than the original cost.
PORTFOLIO COMPOSITION AS OF DECEMBER 31, 2023
Top Holdings
| % of Net Assets |
||||
| Western Asset Management U.S. Government Portfolio (Class A) | 13.0 | |||
| PIMCO Total Return Portfolio (Class A) | 12.5 | |||
| BlackRock Bond Income Portfolio (Class A) | 12.3 | |||
| TCW Core Fixed Income Portfolio (Class A) | 9.5 | |||
| PIMCO Inflation Protected Bond Portfolio (Class A) | 8.5 | |||
| JPMorgan Core Bond Portfolio (Class A) | 7.8 | |||
| Western Asset Management Strategic Bond Opportunities Portfolio (Class A) | 5.0 | |||
| Brighthouse/Franklin Low Duration Total Return Portfolio (Class A) | 5.0 | |||
| MFS Value Portfolio (Class A) | 2.3 | |||
| Invesco Comstock Portfolio (Class A) | 2.0 | |||
Asset Allocation
| % of Net Assets |
||||
| Investment Grade Fixed Income | 68.6 | |||
| U.S. Large Cap Equities | 10.8 | |||
| High Yield Fixed Income | 7.5 | |||
| International Developed Market Equities | 3.8 | |||
| International Fixed Income | 3.5 | |||
| U.S. Small Cap Equities | 3.2 | |||
| Global Equities | 1.5 | |||
| Real Estate Equities | 0.5 | |||
| U.S. Mid Cap Equities | 0.4 | |||
| Emerging Market Equities | 0.3 | |||
BHFTII-3
Brighthouse Funds Trust II
Brighthouse Asset Allocation 20 Portfolio
Understanding Your Portfolio’s Expenses
Shareholder Expense Example
As a shareholder of the Portfolio, you incur ongoing costs, including management fees; distribution and service (12b-1) fees; and other Portfolio expenses. This example is intended to help you understand your ongoing costs (in dollars) (referred to as “expenses”) of investing in the Portfolio and compare these costs with the ongoing costs of investing in other mutual funds. The example is based on an investment of $1,000 invested at the beginning of the period and held for the entire period, July 1, 2023 through December 31, 2023.
Actual Expenses
The first line for each share class of the Portfolio in the table below provides information about actual account values and actual expenses. You may use the information in this line, together with the amount you invested in the particular share class of the Portfolio, to estimate the expenses that you paid over the period. Simply divide your account value by $1,000 (for example, an $8,600 account value divided by $1,000 = 8.6), then multiply the result by the number in the first line under the heading entitled “Expenses Paid During Period” to estimate the expenses you paid on your account during this period.
Hypothetical Example for Comparison Purposes
The second line for each share class of the Portfolio in the table below provides information about hypothetical account values and hypothetical expenses based on the Portfolio’s actual expense ratio and an assumed rate of return of 5% per year before expenses, which is not the Portfolio’s actual return. The hypothetical account values and expenses may not be used to estimate the actual ending account balance or expenses you paid for the period. You may use this information to compare the ongoing costs of investing in the Portfolio and other funds. To do so, compare this 5% hypothetical example with the 5% hypothetical examples that appear in the shareholder reports of the other funds.
Please note that the expenses shown in the table are meant to highlight your ongoing costs only and do not reflect any fees or charges of your variable insurance product or any additional expenses that participants in certain eligible qualified plans may bear relating to the operations of their plan. Therefore, the second line for each share class in the table is useful in comparing ongoing costs only, and will not help you determine the relative total costs of owning different funds. In addition, if these other costs were included, your costs would have been higher.
| Brighthouse Asset Allocation 20 Portfolio |
Annualized Expense Ratio |
Beginning Account Value July 1, 2023 |
Ending Account Value December 31, 2023 |
Expenses Paid During Period** July 1, 2023 to December 31, 2023 |
||||||||||||||
| Class A (a) (b) |
Actual | 0.64 | % | $ | 1,000.00 | $ | 1,041.50 | $ | 3.29 | |||||||||
| Hypothetical* | 0.64 | % | $ | 1,000.00 | $ | 1,021.98 | $ | 3.26 | ||||||||||
| Class B (a) (b) |
Actual | 0.89 | % | $ | 1,000.00 | $ | 1,040.70 | $ | 4.58 | |||||||||
| Hypothetical* | 0.89 | % | $ | 1,000.00 | $ | 1,020.72 | $ | 4.53 | ||||||||||
| * | Hypothetical assumes a rate of return of 5% per year before expenses. |
| ** | Expenses paid are equal to the Portfolio’s annualized expense ratio for the most recent six month period, as shown above, multiplied by the average account value over the period, multiplied by the number of days (184 days) in the most recent fiscal half-year, divided by 365 (to reflect the one-half year period). |
| (a) | The annualized expense ratio shown reflects an expense limitation agreement between Brighthouse Investment Advisers, LLC and the Portfolio as described in Note 5 of the Notes to Financial Statements. |
| (b) | The annualized expense ratio reflects the expenses of both the Portfolio and the Underlying Portfolios in which it invests. |
BHFTII-4
Brighthouse Funds Trust II
Brighthouse Asset Allocation 20 Portfolio
Schedule of Investments as of December 31, 2023
Mutual Funds—100.1% of Net Assets
| Security Description | Shares | Value | ||||||
| Affiliated Investment Companies—100.1% | ||||||||
| AB International Bond Portfolio (Class A) (a) |
938,855 | $ | 7,492,067 | |||||
| Baillie Gifford International Stock Portfolio (Class A) (b) |
360,153 | 3,770,798 | ||||||
| BlackRock Bond Income Portfolio (Class A) (b) |
496,480 | 45,805,220 | ||||||
| BlackRock Capital Appreciation Portfolio (Class A) (b) |
77,320 | 2,802,066 | ||||||
| BlackRock High Yield Portfolio (Class A) (a) |
381,878 | 2,814,442 | ||||||
| Brighthouse Small Cap Value Portfolio (Class A) (a) |
263,922 | 3,708,104 | ||||||
| Brighthouse/abrdn Emerging Markets Equity Portfolio (Class A) (a) |
106,918 | 944,090 | ||||||
| Brighthouse/Artisan International Portfolio (Class A) (a) |
273,301 | 2,812,265 | ||||||
| Brighthouse/Artisan Mid Cap Value Portfolio (Class A) (b) |
4,304 | 935,487 | ||||||
| Brighthouse/Eaton Vance Floating Rate Portfolio (Class A) (a) |
654,464 | 6,492,281 | ||||||
| Brighthouse/Franklin Low Duration Total Return Portfolio (Class A) (a) |
2,110,654 | 18,552,650 | ||||||
| Brighthouse/Templeton International Bond Portfolio (Class A) (a) (c) |
719,522 | 5,648,249 | ||||||
| Brighthouse/Wellington Core Equity Opportunities Portfolio (Class A) (b) |
230,613 | 6,577,074 | ||||||
| Brighthouse/Wellington Large Cap Research Portfolio (Class A) (a) |
271,338 | 3,749,893 | ||||||
| CBRE Global Real Estate Portfolio (Class A) (a) |
178,033 | 1,876,468 | ||||||
| Harris Oakmark International Portfolio (Class A) (a) |
285,609 | 3,747,189 | ||||||
| Invesco Comstock Portfolio (Class A) (a) |
588,147 | 7,492,989 | ||||||
| Invesco Global Equity Portfolio (Class A) (a) |
39,129 | 936,749 | ||||||
| Jennison Growth Portfolio (Class A) (b) (c) |
195,420 | 2,800,375 | ||||||
| JPMorgan Core Bond Portfolio (Class A) (a) |
3,193,951 | 28,969,139 | ||||||
| JPMorgan Small Cap Value Portfolio (Class A) (a) |
163,885 | 1,850,266 | ||||||
| Loomis Sayles Small Cap Growth Portfolio (Class A) (b) (c) |
87,200 | 926,063 | ||||||
| MFS Research International Portfolio (Class A) (a) |
310,313 | 3,754,782 | ||||||
| MFS Value Portfolio (Class A) (b) |
607,107 | 8,450,934 | ||||||
| Neuberger Berman Genesis Portfolio (Class A) (b) |
100,191 | 1,850,531 | ||||||
| Affiliated Investment Companies—(Continued) | ||||||||
| PIMCO Inflation Protected Bond Portfolio (Class A) (a) |
3,330,604 | 31,640,735 | ||||||
| PIMCO Total Return Portfolio (Class A) (a) |
4,712,672 | 46,749,711 | ||||||
| T. Rowe Price Large Cap Growth Portfolio (Class A) (b) (c) |
135,524 | 2,805,343 | ||||||
| T. Rowe Price Large Cap Value Portfolio (Class A) (a) |
213,624 | 5,628,986 | ||||||
| T. Rowe Price Mid Cap Growth Portfolio (Class A) (a) |
98,224 | 934,106 | ||||||
| T. Rowe Price Small Cap Growth Portfolio (Class A) (b) |
186,227 | 3,705,922 | ||||||
| TCW Core Fixed Income Portfolio (Class A) (a) |
3,988,519 | 35,537,702 | ||||||
| VanEck Global Natural Resources Portfolio (Class A) (b) |
389,114 | 4,626,560 | ||||||
| Western Asset Management Strategic Bond Opportunities Portfolio (Class A) (b) |
1,708,811 | 18,745,651 | ||||||
| Western Asset Management U.S. Government Portfolio (Class A) (b) |
4,613,895 | 48,630,458 | ||||||
|
|
|
|||||||
| Total Mutual Funds |
373,765,345 | |||||||
|
|
|
|||||||
| Total Investments—100.1% |
373,765,345 | |||||||
| Other assets and liabilities (net)—(0.1)% |
(284,629 | ) | ||||||
|
|
|
|||||||
| Net Assets—100.0% | $ | 373,480,716 | ||||||
|
|
|
|||||||
| (a) | A Portfolio of Brighthouse Funds Trust I. (See Note 6 of the Notes to Financial Statements for a summary of transactions in the securities of affiliated Underlying Portfolios.) | |||
| (b) | A Portfolio of Brighthouse Funds Trust II. (See Note 6 of the Notes to Financial Statements for a summary of transactions in the securities of affiliated Underlying Portfolios.) | |||
| (c) | Non-income producing security. | |||
Fair Value Hierarchy
Accounting principles generally accepted in the United States of America (“GAAP”) define fair market value as the price that the Portfolio would receive to sell an asset or pay to transfer a liability in an orderly transaction between market participants at the measurement date. It establishes a fair value hierarchy that prioritizes inputs to valuation methods and requires disclosure of the fair value hierarchy, separately for each major category of assets and liabilities, that segregates fair value measurements into three levels. Levels 1, 2 and 3 of the fair value hierarchy are defined as follows:
Level 1 - unadjusted quoted prices in active markets for identical investments
Level 2 - other significant observable inputs (including, but not limited to, quoted prices for similar assets or liabilities in markets that are either active or inactive; inputs other than quoted prices that are observable such as interest rates, yield curves, volatilities, prepayment speeds, loss severities, credit risks, default rates, or other market corroborated inputs)
Level 3 - significant unobservable inputs based on the best information available in the circumstances, to the extent observable inputs are unavailable (including the Portfolio’s own assumptions used in determining the fair value of investments and derivative financial instruments)
The inputs or methodologies used for valuing investments are not necessarily an indication of the risk associated with investing in them. Changes to the inputs or methodologies used may result in transfers between levels. A reconciliation of Level 3 securities, if any, will be disclosed following the fair value hierarchy table. For more information about the Portfolio’s policy regarding the valuation of investments, please refer to the Notes to Financial Statements.
The following table summarizes the fair value hierarchy of the Portfolio’s investments as of December 31, 2023:
| Description | Level 1 | Level 2 | Level 3 | Total | ||||||||||||
| Mutual Funds | ||||||||||||||||
| Affiliated Investment Companies |
$ | 373,765,345 | $ | — | $ | — | $ | 373,765,345 | ||||||||
| Total Investments |
$ | 373,765,345 | $ | — | $ | — | $ | 373,765,345 | ||||||||
See accompanying notes to financial statements.
BHFTII-5
Brighthouse Funds Trust II
Brighthouse Asset Allocation 20 Portfolio
Statement of Assets and Liabilities
December 31, 2023
| Assets |
||||
| Affiliated investments at value (a) |
$ | 373,765,345 | ||
| Receivable for: |
||||
| Affiliated investments sold |
20,721 | |||
| Fund shares sold |
112,332 | |||
| Due from investment adviser |
28,381 | |||
|
|
|
|||
| Total Assets |
373,926,779 | |||
| Liabilities |
||||
| Payables for: |
||||
| Affiliated investments purchased |
28,149 | |||
| Fund shares redeemed |
104,904 | |||
| Accrued Expenses: |
||||
| Management fees |
31,551 | |||
| Distribution and service fees |
74,190 | |||
| Deferred trustees’ fees |
169,435 | |||
| Other expenses |
37,834 | |||
|
|
|
|||
| Total Liabilities |
446,063 | |||
|
|
|
|||
| Net Assets |
$ | 373,480,716 | ||
|
|
|
|||
| Net Assets Consist of: |
||||
| Paid in surplus |
$ | 414,161,120 | ||
| Distributable earnings (Accumulated losses) |
(40,680,404 | ) | ||
|
|
|
|||
| Net Assets |
$ | 373,480,716 | ||
|
|
|
|||
| Net Assets |
||||
| Class A |
$ | 22,300,494 | ||
| Class B |
351,180,222 | |||
| Capital Shares Outstanding* |
||||
| Class A |
2,339,750 | |||
| Class B |
37,181,309 | |||
| Net Asset Value, Offering Price and Redemption Price Per Share |
||||
| Class A |
$ | 9.53 | ||
| Class B |
9.45 |
| * | The Portfolio is authorized to issue an unlimited number of shares. | |||
| (a) | Identified cost of affiliated investments was $408,602,296. | |||
Statement of Operations
Year Ended December 31, 2023
| Investment Income |
||||
| Dividends from affiliated investments |
$ | 11,296,165 | ||
|
|
|
|||
| Total investment income |
11,296,165 | |||
| Expenses |
||||
| Management fees |
389,299 | |||
| Administration fees |
30,250 | |||
| Custodian and accounting fees |
27,625 | |||
| Distribution and service fees—Class B |
917,587 | |||
| Audit and tax services |
35,076 | |||
| Legal |
46,604 | |||
| Trustees’ fees and expenses |
46,220 | |||
| Miscellaneous |
10,661 | |||
|
|
|
|||
| Total expenses |
1,503,322 | |||
| Less expenses reimbursed by the Adviser |
(196,436 | ) | ||
|
|
|
|||
| Net expenses |
1,306,886 | |||
|
|
|
|||
| Net Investment Income |
9,989,279 | |||
|
|
|
|||
| Net Realized and Unrealized Gain (Loss) |
||||
| Net realized gain (loss) on: | ||||
| Affiliated investments |
(10,690,993 | ) | ||
| Capital gain distributions from affiliated investments |
5,400,738 | |||
|
|
|
|||
| Net realized gain (loss) |
(5,290,255 | ) | ||
|
|
|
|||
| Net change in unrealized appreciation on affiliated investments |
23,620,274 | |||
|
|
|
|||
| Net realized and unrealized gain (loss) |
18,330,019 | |||
|
|
|
|||
| Net Increase (Decrease) in Net Assets From Operations |
$ | 28,319,298 | ||
|
|
|
See accompanying notes to financial statements.
BHFTII-6
Brighthouse Funds Trust II
Brighthouse Asset Allocation 20 Portfolio
Statements of Changes in Net Assets
| Year Ended December 31, 2023 |
Year Ended December 31, 2022 |
|||||||
| Increase (Decrease) in Net Assets: |
||||||||
| From Operations |
||||||||
| Net investment income (loss) |
$ | 9,989,279 | $ | 12,337,874 | ||||
| Net realized gain (loss) |
(5,290,255 | ) | 8,987,133 | |||||
| Net change in unrealized appreciation (depreciation) |
23,620,274 | (87,544,388 | ) | |||||
|
|
|
|
|
|||||
| Increase (decrease) in net assets from operations |
28,319,298 | (66,219,381 | ) | |||||
|
|
|
|
|
|||||
| From Distributions to Shareholders |
||||||||
| Class A |
(1,314,562 | ) | (1,631,574 | ) | ||||
| Class B |
(21,134,058 | ) | (27,018,620 | ) | ||||
|
|
|
|
|
|||||
| Total distributions |
(22,448,620 | ) | (28,650,194 | ) | ||||
|
|
|
|
|
|||||
| Increase (decrease) in net assets from capital share transactions |
(31,973,191 | ) | (45,486,317 | ) | ||||
|
|
|
|
|
|||||
| Total increase (decrease) in net assets |
(26,102,513 | ) | (140,355,892 | ) | ||||
| Net Assets |
||||||||
| Beginning of period |
399,583,229 | 539,939,121 | ||||||
|
|
|
|
|
|||||
| End of period |
$ | 373,480,716 | $ | 399,583,229 | ||||
|
|
|
|
|
|||||
Other Information:
Capital Shares
Transactions in capital shares were as follows:
| Year Ended December 31, 2023 |
Year Ended December 31, 2022 |
|||||||||||||||
| Shares | Value | Shares | Value | |||||||||||||
| Class A |
||||||||||||||||
| Sales |
372,477 | $ | 3,487,210 | 200,276 | $ | 2,033,937 | ||||||||||
| Reinvestments |
144,141 | 1,314,562 | 172,836 | 1,631,574 | ||||||||||||
| Redemptions |
(589,151 | ) | (5,504,463 | ) | (476,811 | ) | (4,786,365 | ) | ||||||||
|
|
|
|
|
|
|
|
|
|||||||||
| Net increase (decrease) |
(72,533 | ) | $ | (702,691 | ) | (103,699 | ) | $ | (1,120,854 | ) | ||||||
|
|
|
|
|
|
|
|
|
|||||||||
| Class B |
||||||||||||||||
| Sales |
2,871,278 | $ | 26,875,162 | 2,815,223 | $ | 28,467,864 | ||||||||||
| Reinvestments |
2,335,255 | 21,134,058 | 2,883,524 | 27,018,620 | ||||||||||||
| Redemptions |
(8,613,342 | ) | (79,279,720 | ) | (10,047,452 | ) | (99,851,947 | ) | ||||||||
|
|
|
|
|
|
|
|
|
|||||||||
| Net increase (decrease) |
(3,406,809 | ) | $ | (31,270,500 | ) | (4,348,705 | ) | $ | (44,365,463 | ) | ||||||
|
|
|
|
|
|
|
|
|
|||||||||
| Increase (decrease) derived from capital shares transactions |
$ | (31,973,191 | ) | $ | (45,486,317 | ) | ||||||||||
|
|
|
|
|
|||||||||||||
See accompanying notes to financial statements.
BHFTII-7
Brighthouse Funds Trust II
Brighthouse Asset Allocation 20 Portfolio
Financial Highlights
| Selected per share data | ||||||||||||||||||||
| Class A | ||||||||||||||||||||
| Year Ended December 31, | ||||||||||||||||||||
| 2023 | 2022 | 2021 | 2020 | 2019 | ||||||||||||||||
| Net Asset Value, Beginning of Period |
$ | 9.37 | $ | 11.48 | $ | 11.55 | $ | 11.11 | $ | 10.35 | ||||||||||
|
|
|
|
|
|
|
|
|
|
|
|||||||||||
| Income (Loss) from Investment Operations |
||||||||||||||||||||
| Net investment income (loss) (a) |
0.26 | 0.30 | 0.22 | 0.35 | 0.33 | |||||||||||||||
| Net realized and unrealized gain (loss) |
0.47 | (1.74 | ) | 0.24 | 0.68 | 0.91 | ||||||||||||||
|
|
|
|
|
|
|
|
|
|
|
|||||||||||
| Total income (loss) from investment operations |
0.73 | (1.44 | ) | 0.46 | 1.03 | 1.24 | ||||||||||||||
|
|
|
|
|
|
|
|
|
|
|
|||||||||||
| Less Distributions |
||||||||||||||||||||
| Distributions from net investment income |
(0.36 | ) | (0.35 | ) | (0.38 | ) | (0.34 | ) | (0.27 | ) | ||||||||||
| Distributions from net realized capital gains |
(0.21 | ) | (0.32 | ) | (0.15 | ) | (0.25 | ) | (0.21 | ) | ||||||||||
|
|
|
|
|
|
|
|
|
|
|
|||||||||||
| Total distributions |
(0.57 | ) | (0.67 | ) | (0.53 | ) | (0.59 | ) | (0.48 | ) | ||||||||||
|
|
|
|
|
|
|
|
|
|
|
|||||||||||
| Net Asset Value, End of Period |
$ | 9.53 | $ | 9.37 | $ | 11.48 | $ | 11.55 | $ | 11.11 | ||||||||||
|
|
|
|
|
|
|
|
|
|
|
|||||||||||
| Total Return (%) (b) |
8.08 | (12.54 | ) | 4.01 | 9.70 | 12.14 | ||||||||||||||
| Ratios/Supplemental Data |
||||||||||||||||||||
| Gross ratio of expenses to average net assets (%) (c) |
0.15 | 0.13 | 0.13 | 0.13 | 0.13 | |||||||||||||||
| Net ratio of expenses to average net assets (%) (c) (d) |
0.10 | 0.10 | 0.10 | 0.10 | 0.10 | |||||||||||||||
| Ratio of net investment income (loss) to average net assets (%) (e) |
2.76 | 2.95 | 1.90 | 3.17 | 3.05 | |||||||||||||||
| Portfolio turnover rate (%) |
9 | 9 | 8 | 14 | 13 | |||||||||||||||
| Net assets, end of period (in millions) |
$ | 22.3 | $ | 22.6 | $ | 28.9 | $ | 31.3 | $ | 34.0 | ||||||||||
| Class B | ||||||||||||||||||||
| Year Ended December 31, | ||||||||||||||||||||
| 2023 | 2022 | 2021 | 2020 | 2019 | ||||||||||||||||
| Net Asset Value, Beginning of Period |
$ | 9.29 | $ | 11.37 | $ | 11.45 | $ | 11.01 | $ | 10.27 | ||||||||||
|
|
|
|
|
|
|
|
|
|
|
|||||||||||
| Income (Loss) from Investment Operations |
||||||||||||||||||||
| Net investment income (loss) (a) |
0.24 | 0.27 | 0.19 | 0.32 | 0.30 | |||||||||||||||
| Net realized and unrealized gain (loss) |
0.46 | (1.71 | ) | 0.23 | 0.69 | 0.89 | ||||||||||||||
|
|
|
|
|
|
|
|
|
|
|
|||||||||||
| Total income (loss) from investment operations |
0.70 | (1.44 | ) | 0.42 | 1.01 | 1.19 | ||||||||||||||
|
|
|
|
|
|
|
|
|
|
|
|||||||||||
| Less Distributions |
||||||||||||||||||||
| Distributions from net investment income |
(0.33 | ) | (0.32 | ) | (0.35 | ) | (0.32 | ) | (0.24 | ) | ||||||||||
| Distributions from net realized capital gains |
(0.21 | ) | (0.32 | ) | (0.15 | ) | (0.25 | ) | (0.21 | ) | ||||||||||
|
|
|
|
|
|
|
|
|
|
|
|||||||||||
| Total distributions |
(0.54 | ) | (0.64 | ) | (0.50 | ) | (0.57 | ) | (0.45 | ) | ||||||||||
|
|
|
|
|
|
|
|
|
|
|
|||||||||||
| Net Asset Value, End of Period |
$ | 9.45 | $ | 9.29 | $ | 11.37 | $ | 11.45 | $ | 11.01 | ||||||||||
|
|
|
|
|
|
|
|
|
|
|
|||||||||||
| Total Return (%) (b) |
7.83 | (12.69 | ) | 3.69 | 9.52 | 11.74 | ||||||||||||||
| Ratios/Supplemental Data |
||||||||||||||||||||
| Gross ratio of expenses to average net assets (%) (c) |
0.40 | 0.38 | 0.38 | 0.38 | 0.38 | |||||||||||||||
| Net ratio of expenses to average net assets (%) (c) (d) |
0.35 | 0.35 | 0.35 | 0.35 | 0.35 | |||||||||||||||
| Ratio of net investment income (loss) to average net assets (%) (e) |
2.55 | 2.69 | 1.62 | 2.96 | 2.82 | |||||||||||||||
| Portfolio turnover rate (%) |
9 | 9 | 8 | 14 | 13 | |||||||||||||||
| Net assets, end of period (in millions) |
$ | 351.2 | $ | 377.0 | $ | 511.1 | $ | 568.2 | $ | 525.9 | ||||||||||
| (a) | Per share amounts based on average shares outstanding during the period. | |||
| (b) | Total return does not reflect any insurance, sales, separate account or administrative charges of variable annuity or life insurance contracts or any additional expenses that contract owners may bear under their variable contracts. If these charges were included, the returns would be lower. | |||
| (c) | The ratio of operating expenses to average net assets does not include expenses of the Underlying Portfolios in which the Asset Allocation Portfolio invests. | |||
| (d) | Includes the effects of expenses reimbursed by the Adviser (see Note 5 of the Notes to Financial Statements). | |||
| (e) | Recognition of net investment income by the Asset Allocation Portfolio is affected by the timing of the declaration of dividends by the Underlying Portfolios in which it invests. | |||
See accompanying notes to financial statements.
BHFTII-8
Brighthouse Funds Trust II
Brighthouse Asset Allocation 20 Portfolio
Notes to Financial Statements—December 31, 2023
1. Organization
Brighthouse Funds Trust II (the “Trust”) is organized as a Delaware statutory trust and registered under the Investment Company Act of 1940, as amended (the “1940 Act”), as an open-end management investment company. The Trust, which is managed by Brighthouse Investment Advisers, LLC (“Brighthouse Investment Advisers” or the “Adviser”), currently offers twenty-nine series (the “Portfolios”), each of which operates as a distinct investment vehicle of the Trust. The series included in this report is Brighthouse Asset Allocation 20 Portfolio (the “Asset Allocation Portfolio”), which is diversified. The Asset Allocation Portfolio operates under a “fund of funds” structure, investing substantially all of its assets in other Portfolios advised by Brighthouse Investment Advisers (each, an “Underlying Portfolio,” and, collectively, the “Underlying Portfolios”). Shares of the Portfolio are not offered directly to the general public and are currently available only to separate accounts of insurance companies, including insurance companies affiliated with the Adviser.
The Asset Allocation Portfolio has registered and offers two classes of shares: Class A and B shares. Shares of each class of the Asset Allocation Portfolio represent an equal pro rata interest in the Asset Allocation Portfolio and generally give the shareholder the same voting, dividend, liquidation, and other rights. Investment income, realized and unrealized capital gains and losses, the common expenses of the Asset Allocation Portfolio, and certain Asset Allocation Portfolio-level expense reductions, if any, are allocated on a pro rata basis to each class based on the relative net assets of each class to the net assets of the Asset Allocation Portfolio. Each class of shares differs in its respective distribution plan and such distribution expenses are allocated to the corresponding class of shares.
2. Significant Accounting Policies
The preparation of financial statements in conformity with accounting principles generally accepted in the United States of America (“GAAP”) requires management to make estimates and assumptions that affect the reported amounts of assets and liabilities and disclosure of contingent assets and liabilities as of the date of the financial statements and the reported amounts of income and expenses during the reporting period. Actual results could differ from those estimates. In the preparation of these financial statements, management has evaluated events and transactions subsequent to December 31, 2023 through the date the financial statements were issued.
The Asset Allocation Portfolio is an investment company and follows the accounting and reporting guidance of the Financial Accounting Standards Board (“FASB”) Accounting Standards Codification Topic 946—Financial Services—Investment Companies. The following is a summary of significant accounting policies consistently followed by the Asset Allocation Portfolio in the preparation of its financial statements.
Investment Valuation and Fair Value Measurements - The Asset Allocation Portfolio values its investments for purposes of calculating its net asset value (“NAV”) using procedures that allow for a variety of methodologies to be used to value the Asset Allocation Portfolio’s investments. The specific methodology used for an investment may vary based on the market data available for a specific investment at the time the Asset Allocation Portfolio calculates its NAV or based on other considerations. The procedures also permit a level of judgment to be used in the valuation process.
Investments in the Underlying Portfolios are valued at their closing daily NAV on the valuation date. Investments in the Underlying Portfolios are categorized as Level 1 within the fair value hierarchy. For information about the use of fair value pricing by the Underlying Portfolios, please refer to the prospectuses of the Underlying Portfolios.
Investment Transactions and Related Investment Income - The Asset Allocation Portfolio’s security transactions are recorded on the trade date. Dividend income is recorded on the ex-dividend date. Interest income is recorded on the accrual basis. Realized gains and losses on investments and unrealized appreciation and depreciation are determined on the identified cost basis, which is the same basis used for federal income tax purposes. Capital gains distributions received from the Underlying Portfolios are recorded as net realized gain in the Statement of Operations.
Dividends and Distributions to Shareholders - The Asset Allocation Portfolio records dividends and distributions on the ex-dividend date. Net realized gains from securities transactions (if any) are generally distributed annually to shareholders. The timing and characterization of certain income and capital gains distributions are determined in accordance with federal tax regulations that may differ from GAAP. Permanent book and tax basis differences relating to shareholder distributions will result in reclassification between distributable earnings (accumulated losses) and paid in surplus. These adjustments have no impact on net assets or the results of operations.
Income Taxes - It is the Asset Allocation Portfolio’s policy to comply with the requirements of the Internal Revenue Code of 1986, as amended, and regulations thereunder, applicable to regulated investment companies, and to distribute, with respect to each taxable year, all of its taxable income to shareholders. Therefore, no federal income tax provision is required. The Asset Allocation Portfolio files U.S. federal tax returns. No income tax returns are currently under examination. The Asset Allocation Portfolio’s federal tax returns remain subject to examination by the Internal Revenue Service for three fiscal years after the returns are filed. As of December 31, 2023, the Asset Allocation Portfolio had no uncertain tax positions that would require financial statement recognition, derecognition or disclosure.
BHFTII-9
Brighthouse Funds Trust II
Brighthouse Asset Allocation 20 Portfolio
Notes to Financial Statements—December 31, 2023—(Continued)
3. Certain Risks
In the normal course of business, the Underlying Portfolios invest in securities and enter into transactions where risks exist. Those risks include:
Market Risk: The value of securities held by the Underlying Portfolios may decline in response to certain events, including those directly involving the issuers whose securities are owned by the Underlying Portfolios; conditions affecting the general economy; overall market changes; local, regional or global political, social or economic instability; currency, interest rate, and price fluctuations, or other factors including terrorism, war, natural disasters and the spread of infectious illness including epidemics or pandemics such as the COVID-19 pandemic. These events may also adversely affect the liquidity of securities held by the Underlying Portfolios.
Credit and Counterparty Risk: The Underlying Portfolios may be exposed to counterparty risk, or the risk that an entity with which the Underlying Portfolios have unsettled or open transactions may default. The potential loss could exceed the value of the financial assets and liabilities recorded in the financial statements. Financial assets that potentially expose the Underlying Portfolios to credit and counterparty risk consist principally of cash due from counterparties and investments. The Underlying Portfolios manage counterparty risk by entering into agreements only with counterparties that they believe have the financial resources to honor their obligations and by monitoring the financial stability of those counterparties. The Subadviser may attempt to mitigate counterparty risk by (i) periodically assessing the creditworthiness of their trading partners, (ii) monitoring and/or limiting the amount of their net exposure to each individual counterparty based on the adviser’s assessment, and (iii) requiring collateral from the counterparty for certain transactions. In order to preserve certain safeguards for non-standard settlement trades, the Underlying Portfolios restrict their exposure to credit and counterparty losses by entering into master netting agreements (“Master Agreements”) with counterparties (approved brokers) with whom the Underlying Portfolios undertake a significant volume of transactions. Master Agreements govern the terms of certain transactions and reduce the counterparty risk associated with relevant transactions by specifying credit protection mechanisms and providing standardization that improves legal certainty. Master Agreements can also help limit counterparty risk by specifying collateral posting arrangements at pre-arranged exposure levels.
The Asset Allocation Portfolio’s prospectus includes a discussion of the principal risks of investing in the Asset Allocation Portfolio and in the Underlying Portfolios in which it invests.
4. Investment Transactions
Aggregate cost of purchases and proceeds of sales of shares of the Underlying Portfolios by the Asset Allocation Portfolio, for the year ended December 31, 2023 were as follows:
| Purchases |
Sales | |||||||||||
| U.S. Government |
Non-U.S. Government | U.S. Government | Non-U.S. Government | |||||||||
| $0 | $ | 34,914,647 | $ | 0 | $ | 73,974,694 | ||||||
5. Investment Management Fees and Other Transactions with Affiliates
Investment Management Agreement - Brighthouse Investment Advisers is the investment adviser to the Asset Allocation Portfolio. The Trust has entered into an investment management agreement with Brighthouse Investment Advisers with respect to the Asset Allocation Portfolio. For providing investment management services to the Asset Allocation Portfolio, Brighthouse Investment Advisers receives monthly compensation at the following annual rates:
|
Management |
% per annum | Average Daily Net Assets | ||||
| $389,299 | 0.100 | % | Of the first $500 million | |||
| 0.075 | % | Of the next $500 million | ||||
| 0.050 | % | On amounts in excess of $1 billion | ||||
In addition to the above management fee paid to Brighthouse Investment Advisers, the Asset Allocation Portfolio indirectly pays Brighthouse Investment Advisers an investment advisory fee through its investments in the Underlying Portfolios.
Certain officers and trustees of the Trust may also be officers of the Adviser however, such officers and trustees receive no compensation from the Trust.
Expense Limitation Agreement - Pursuant to an expense agreement relating to each class of the Asset Allocation Portfolio, Brighthouse Investment Advisers has contractually agreed, from May 1, 2023 to April 30, 2024, to waive a portion of its advisory fees or
BHFTII-10
Brighthouse Funds Trust II
Brighthouse Asset Allocation 20 Portfolio
Notes to Financial Statements—December 31, 2023—(Continued)
pay a portion of the other operating expenses (not including acquired fund fees and expenses, brokerage costs, interest, taxes, or extraordinary expenses) to the extent total operating expenses exceed stated annual expense limits (based on the Asset Allocation Portfolio’s then-current fiscal year). For the Asset Allocation Portfolio, this subsidy, and identical subsidies in effect in earlier periods, are subject to the obligation of each class of the Asset Allocation Portfolio to repay Brighthouse Investment Advisers in future years, if any, when a class’ expenses fall below the stated expense limit pertaining to that class that was in effect at the time of the subsidy in question. Such deferred expenses may be charged to a class in a subsequent year to the extent that the charge does not cause the total expenses in such subsequent year to exceed the class’ stated expense limit that was in effect at the time of the subsidy in question; provided, however, that no class of the Asset Allocation Portfolio is obligated to repay any expense paid by Brighthouse Investment Advisers more than five years after the end of the fiscal year in which such expense was incurred. The expense limits (annual rates as a percentage of each class of the Asset Allocation Portfolio’s net average daily net assets) in effect from May 1, 2023 to April 30, 2024 are 0.10% and 0.35% for Class A and B, respectively.
As of December 31, 2023, the amount of expenses deferred in 2019 subject to repayment until December 31, 2024 was $187,177. The amount of expenses deferred in 2020 subject to repayment until December 31, 2025 was $180,341. The amount of expenses deferred in 2021 subject to repayment until December 31, 2026 was $172,017. The amount of expenses deferred in 2022 subject to repayment until December 31, 2027 was $151,581. The amount of expenses deferred in 2023 subject to repayment until December 31, 2028 was $196,436.
Transfer Agency Agreement - Brighthouse Life Insurance Company serves as the transfer agent for the Trust. Brighthouse Life Insurance Company receives no fees for its services to the Trust.
Distribution and Service Fees - The Trust has a distribution agreement with Brighthouse Securities, LLC (the “Distributor”) pursuant to which the Distributor serves as the general distributor of shares of each class (each a “Class”) of each Portfolio. The Distributor is an affiliate of the Trust. The Trust has adopted a Distribution and Services Plan (the “D&S Plan”) relating to Class B, Class D, Class E, Class F and Class G shares of each Portfolio, under Rule 12b-1 under the 1940 Act, pursuant to which the Trust may pay the Distributor a fee (the “Service Fee”) at an annual rate not to exceed 0.25% of each such Portfolio’s average daily net assets attributable to the Class B, Class D, Class E, Class F and Class G shares of the Trust. Each Portfolio may not offer shares of each Class. The D&S Plan also authorizes the Trust, on behalf of each of its Portfolios, to pay to the Distributor a distribution fee (the “Distribution Fee” and together with the Service Fee, the “Fees”) at an annual rate of up to 0.25% of each Portfolio’s average daily net assets attributable to the Class B, Class D, Class E, Class F, and Class G shares in consideration of the services rendered in connection with the sale of such shares by the Distributor. Under the Distribution Agreement with respect to the Trust, Fees are currently paid at an annual rate of 0.25% of average daily net assets in the case of Class B shares, 0.10% of average daily net assets in the case of Class D shares, 0.15% of average daily net assets in the case of Class E shares, 0.20% of average daily net assets in the case of Class F shares and 0.30% of average daily net assets in the case of Class G shares. The D&S Plan is known as a “compensation plan” because the Trust makes payments to the Distributor for services rendered regardless of the actual level of expenditures by the Distributor. Amounts incurred by the Portfolio for the year ended December 31, 2023 are shown as Distribution and service fees in the Statement of Operations.
Deferred Trustee Compensation - Each Trustee who is not currently an employee of the Adviser or any of its affiliates receives compensation from the Trust for his or her service to the Trust. A deferred compensation plan (the “Plan”) is available to the Trustees on a voluntary basis. Deferred amounts remain in the Trust until distributed in accordance with the provisions of the Plan. The value of a participating Trustee’s deferral account is based on theoretical investments of deferred amounts on the normal payment dates in certain portfolios of the Trust or Brighthouse Funds Trust I, an affiliate of the Trust, as designated by the participating Trustee. Changes in the value of participants’ deferral accounts are reflected as a component of Trustees’ fees and expenses in the Statement of Operations. The portion of the accrued obligations allocated to the Portfolio under the Plan is reflected as Deferred trustees’ fees in the Statement of Assets and Liabilities.
BHFTII-11
Brighthouse Funds Trust II
Brighthouse Asset Allocation 20 Portfolio
Notes to Financial Statements—December 31, 2023—(Continued)
6. Transactions in Securities of Affiliated Issuers
The Asset Allocation Portfolio does not invest in the Underlying Portfolios for the purpose of exercising control; however, investments by the Asset Allocation Portfolio within its principal investment strategies may represent a significant portion of the Underlying Portfolios’ net assets. Transactions in the Underlying Portfolios for the year ended December 31, 2023 were as follows:
| Security Description |
Market Value December 31, 2022 |
Purchases | Sales | Realized Gain/(Loss) |
Change in Unrealized Appreciation/ (Depreciation) |
Ending Value as of December 31, 2023 |
||||||||||||||||||
| AB International Bond Portfolio (Class A) |
$ | 8,038,634 | $ | 577,016 | $ | (1,382,795 | ) | $ | (428,152 | ) | $ | 687,364 | $ | 7,492,067 | ||||||||||
| Baillie Gifford International Stock Portfolio (Class A) |
4,942,699 | 600,189 | (2,535,593 | ) | (428,045 | ) | 1,191,548 | 3,770,798 | ||||||||||||||||
| BlackRock Bond Income Portfolio (Class A) |
48,974,793 | 2,616,436 | (6,862,688 | ) | (1,699,393 | ) | 2,776,072 | 45,805,220 | ||||||||||||||||
| BlackRock Capital Appreciation Portfolio (Class A) |
2,915,546 | 216,516 | (1,480,818 | ) | (652,711 | ) | 1,803,533 | 2,802,066 | ||||||||||||||||
| BlackRock High Yield Portfolio (Class A) |
2,002,992 | 1,359,026 | (703,933 | ) | (22,217 | ) | 178,574 | 2,814,442 | ||||||||||||||||
| Brighthouse Small Cap Value Portfolio (Class A) |
3,949,496 | 973,396 | (1,387,200 | ) | 266,876 | (94,464 | ) | 3,708,104 | ||||||||||||||||
| Brighthouse/abrdn Emerging Markets Equity Portfolio (Class A) |
1,001,075 | 123,374 | (234,964 | ) | (46,569 | ) | 101,174 | 944,090 | ||||||||||||||||
| Brighthouse/Artisan International Portfolio (Class A) |
3,007,815 | 157,832 | (705,905 | ) | (101,433 | ) | 453,956 | 2,812,265 | ||||||||||||||||
| Brighthouse/Artisan Mid Cap Value Portfolio (Class A) |
983,691 | 213,587 | (295,092 | ) | 43,919 | (10,618 | ) | 935,487 | ||||||||||||||||
| Brighthouse/Eaton Vance Floating Rate Portfolio (Class A) |
8,055,508 | 726,339 | (2,647,575 | ) | (111,561 | ) | 469,570 | 6,492,281 | ||||||||||||||||
| Brighthouse/Franklin Low Duration Total Return Portfolio (Class A) |
20,123,127 | 1,648,043 | (3,573,714 | ) | (572,212 | ) | 927,406 | 18,552,650 | ||||||||||||||||
| Brighthouse/Templeton International Bond Portfolio (Class A) |
6,053,494 | 263,582 | (866,170 | ) | (308,944 | ) | 506,287 | 5,648,249 | ||||||||||||||||
| Brighthouse/Wellington Core Equity Opportunities Portfolio (Class A) |
7,030,208 | 1,106,648 | (1,207,908 | ) | (196,787 | ) | (155,087 | ) | 6,577,074 | |||||||||||||||
| Brighthouse/Wellington Large Cap Research Portfolio (Class A) |
3,960,447 | 367,766 | (1,237,204 | ) | (37,389 | ) | 696,273 | 3,749,893 | ||||||||||||||||
| CBRE Global Real Estate Portfolio (Class A) |
1,998,299 | 258,205 | (567,649 | ) | 5,969 | 181,644 | 1,876,468 | |||||||||||||||||
| Harris Oakmark International Portfolio (Class A) |
4,009,661 | 429,058 | (1,335,543 | ) | 538,464 | 105,549 | 3,747,189 | |||||||||||||||||
| Invesco Comstock Portfolio (Class A) |
7,984,596 | 2,036,658 | (1,893,463 | ) | 568,881 | (1,203,683 | ) | 7,492,989 | ||||||||||||||||
| Invesco Global Equity Portfolio (Class A) |
983,156 | 101,807 | (389,058 | ) | 38,328 | 202,516 | 936,749 | |||||||||||||||||
| Jennison Growth Portfolio (Class A) |
2,908,781 | 208,638 | (1,600,055 | ) | (982,105 | ) | 2,265,116 | 2,800,375 | ||||||||||||||||
| JPMorgan Core Bond Portfolio (Class A) |
31,015,567 | 1,709,127 | (4,491,000 | ) | (722,583 | ) | 1,458,028 | 28,969,139 | ||||||||||||||||
| JPMorgan Small Cap Value Portfolio (Class A) |
1,963,910 | 559,842 | (741,765 | ) | 41,911 | 26,368 | 1,850,266 | |||||||||||||||||
| Loomis Sayles Small Cap Growth Portfolio (Class A) |
990,143 | 106,849 | (286,838 | ) | (60,196 | ) | 176,105 | 926,063 | ||||||||||||||||
| MFS Research International Portfolio (Class A) |
3,008,098 | 1,389,656 | (888,624 | ) | (705 | ) | 246,357 | 3,754,782 | ||||||||||||||||
| MFS Value Portfolio (Class A) |
9,020,191 | 1,508,954 | (1,521,042 | ) | (155,045 | ) | (402,124 | ) | 8,450,934 | |||||||||||||||
| Neuberger Berman Genesis Portfolio (Class A) |
1,956,771 | 408,527 | (634,739 | ) | 20,257 | 99,715 | 1,850,531 | |||||||||||||||||
| PIMCO Inflation Protected Bond Portfolio (Class A) |
36,172,230 | 1,992,853 | (6,936,770 | ) | (862,785 | ) | 1,275,207 | 31,640,735 | ||||||||||||||||
| PIMCO Total Return Portfolio (Class A) |
48,070,166 | 3,839,501 | (6,386,677 | ) | (1,742,846 | ) | 2,969,567 | 46,749,711 | ||||||||||||||||
| T. Rowe Price Large Cap Growth Portfolio (Class A) |
2,907,452 | 184,413 | (1,443,884 | ) | (438,065 | ) | 1,595,427 | 2,805,343 | ||||||||||||||||
| T. Rowe Price Large Cap Value Portfolio (Class A) |
5,997,413 | 1,370,612 | (1,289,083 | ) | (10,081 | ) | (439,875 | ) | 5,628,986 | |||||||||||||||
| T. Rowe Price Mid Cap Growth Portfolio (Class A) |
987,964 | 113,013 | (301,057 | ) | (13,683 | ) | 147,869 | 934,106 | ||||||||||||||||
| T. Rowe Price Small Cap Growth Portfolio (Class A) |
3,953,583 | 411,354 | (1,345,876 | ) | (101,873 | ) | 788,734 | 3,705,922 | ||||||||||||||||
| TCW Core Fixed Income Portfolio (Class A) |
37,904,804 | 2,094,334 | (5,337,351 | ) | (781,323 | ) | 1,657,238 | 35,537,702 | ||||||||||||||||
| VanEck Global Natural Resources Portfolio (Class A) |
4,825,517 | 996,681 | (896,261 | ) | 432,420 | (731,797 | ) | 4,626,560 | ||||||||||||||||
| Western Asset Management Strategic Bond Opportunities Portfolio (Class A) |
20,000,819 | 1,600,902 | (3,269,785 | ) | (698,186 | ) | 1,111,901 | 18,745,651 | ||||||||||||||||
| Western Asset Management U.S. Government Portfolio (Class A) |
52,197,465 | 2,643,913 | (7,296,615 | ) | (1,473,129 | ) | 2,558,824 | 48,630,458 | ||||||||||||||||
|
|
|
|
|
|
|
|
|
|
|
|
|
|||||||||||||
| $ | 399,896,111 | $ | 34,914,647 | $ | (73,974,694 | ) | $ | (10,690,993 | ) | $ | 23,620,274 | $ | 373,765,345 | |||||||||||
|
|
|
|
|
|
|
|
|
|
|
|
|
|||||||||||||
| Security Description |
Capital Gain Distributions from Affiliated Investments |
Income earned from affiliates during the period |
Number of shares held at December 31, 2023 |
|||||||||
| AB International Bond Portfolio (Class A) |
$ | — | $ | 409,530 | 938,855 | |||||||
| Baillie Gifford International Stock Portfolio (Class A) |
— | 49,648 | 360,153 | |||||||||
| BlackRock Bond Income Portfolio (Class A) |
— | 1,511,025 | 496,480 | |||||||||
| BlackRock Capital Appreciation Portfolio (Class A) |
56,184 | 1,215 | 77,320 | |||||||||
| BlackRock High Yield Portfolio (Class A) |
— | 161,541 | 381,878 | |||||||||
| Brighthouse Small Cap Value Portfolio (Class A) |
329,891 | 49,597 | 263,922 | |||||||||
| Brighthouse/abrdn Emerging Markets Equity Portfolio (Class A) |
— | 12,341 | 106,918 | |||||||||
| Brighthouse/Artisan International Portfolio (Class A) |
— | 52,350 | 273,301 | |||||||||
| Brighthouse/Artisan Mid Cap Value Portfolio (Class A) |
127,292 | 8,392 | 4,304 | |||||||||
| Brighthouse/Eaton Vance Floating Rate Portfolio (Class A) |
— | 397,454 | 654,464 | |||||||||
| Brighthouse/Franklin Low Duration Total Return Portfolio (Class A) |
— | 722,175 | 2,110,654 | |||||||||
| Brighthouse/Templeton International Bond Portfolio (Class A) |
— | — | 719,522 | |||||||||
| Brighthouse/Wellington Core Equity Opportunities Portfolio (Class A) |
738,166 | 99,989 | 230,613 | |||||||||
BHFTII-12
Brighthouse Funds Trust II
Brighthouse Asset Allocation 20 Portfolio
Notes to Financial Statements—December 31, 2023—(Continued)
| Security Description |
Capital Gain Distributions from Affiliated Investments |
Income earned from affiliates during the period |
Number of shares held at December 31, 2023 |
|||||||||
| Brighthouse/Wellington Large Cap Research Portfolio (Class A) |
$ | 213,267 | $ | 32,532 | 271,338 | |||||||
| CBRE Global Real Estate Portfolio (Class A) |
— | 54,512 | 178,033 | |||||||||
| Harris Oakmark International Portfolio (Class A) |
— | 82,662 | 285,609 | |||||||||
| Invesco Comstock Portfolio (Class A) |
1,388,867 | 175,820 | 588,147 | |||||||||
| Invesco Global Equity Portfolio (Class A) |
55,658 | 3,598 | 39,129 | |||||||||
| Jennison Growth Portfolio (Class A) |
— | — | 195,420 | |||||||||
| JPMorgan Core Bond Portfolio (Class A) |
— | 944,464 | 3,193,951 | |||||||||
| JPMorgan Small Cap Value Portfolio (Class A) |
166,574 | 26,941 | 163,885 | |||||||||
| Loomis Sayles Small Cap Growth Portfolio (Class A) |
— | — | 87,200 | |||||||||
| MFS Research International Portfolio (Class A) |
75,693 | 67,829 | 310,313 | |||||||||
| MFS Value Portfolio (Class A) |
1,062,062 | 168,074 | 607,107 | |||||||||
| Neuberger Berman Genesis Portfolio (Class A) |
171,495 | 2,525 | 100,191 | |||||||||
| PIMCO Inflation Protected Bond Portfolio (Class A) |
— | 796,968 | 3,330,604 | |||||||||
| PIMCO Total Return Portfolio (Class A) |
— | 1,528,431 | 4,712,672 | |||||||||
| T. Rowe Price Large Cap Growth Portfolio (Class A) |
— | — | 135,524 | |||||||||
| T. Rowe Price Large Cap Value Portfolio (Class A) |
873,651 | 125,341 | 213,624 | |||||||||
| T. Rowe Price Mid Cap Growth Portfolio (Class A) |
48,679 | — | 98,224 | |||||||||
| T. Rowe Price Small Cap Growth Portfolio (Class A) |
93,259 | 2,134 | 186,227 | |||||||||
| TCW Core Fixed Income Portfolio (Class A) |
— | 1,157,111 | 3,988,519 | |||||||||
| VanEck Global Natural Resources Portfolio (Class A) |
— | 153,168 | 389,114 | |||||||||
| Western Asset Management Strategic Bond Opportunities Portfolio (Class A) |
— | 1,304,770 | 1,708,811 | |||||||||
| Western Asset Management U.S. Government Portfolio (Class A) |
— | 1,194,028 | 4,613,895 | |||||||||
|
|
|
|
|
|||||||||
| $ | 5,400,738 | $ | 11,296,165 | |||||||||
|
|
|
|
|
|||||||||
7. Contractual Obligations
Under the Trust’s organizational documents, its officers and Trustees may be indemnified against certain liabilities and expenses arising out of the performance of their duties to the Trust. Additionally, the Trust has a variety of indemnification obligations under contracts with its service providers. The Trust’s maximum exposure under these arrangements is unknown, as this would involve future claims that may be made against the Trust that have not yet occurred.
8. Income Tax Information
The cost basis of investments for federal income tax purposes at December 31, 2023 was as follows:
| Cost basis of investments |
$ | 420,761,958 | ||
|
|
|
|||
| Gross unrealized appreciation |
2,801,134 | |||
| Gross unrealized (depreciation) |
(49,797,747 | ) | ||
|
|
|
|||
| Net unrealized appreciation (depreciation) |
$ | (46,996,613 | ) | |
|
|
|
The tax character of distributions paid for the years ended December 31, 2023 and 2022 were as follows:
| Ordinary Income |
Long-Term Capital Gain | Total | ||||||||||||||||||
| 2023 |
2022 | 2023 | 2022 | 2023 | 2022 | |||||||||||||||
| $13,830,052 | $ | 14,563,737 | $ | 8,618,568 | $ | 14,086,457 | $ | 22,448,620 | $ | 28,650,194 | ||||||||||
As of December 31, 2023, the components of distributable earnings (accumulated losses) on a federal income tax basis were as follows:
| Undistributed |
Undistributed Long-Term Capital Gain |
Net Unrealized Appreciation (Depreciation) |
Accumulated Capital Losses |
Total | ||||||||||||
| $9,778,675 | $ | — | $ | (46,996,613 | ) | $ | (3,293,030 | ) | $ | (40,510,968 | ) | |||||
The Asset Allocation Portfolio utilizes the provisions of the federal income tax laws that provide for the carryforward of capital losses for prior years, offsetting such losses against any future realized capital gains. Net capital losses may be carried forward indefinitely and their character is retained as short-term and/or long-term losses.
As of December 31, 2023, the Asset Allocation Portfolio had accumulated long-term capital losses of $3,293,030.
BHFTII-13
Brighthouse Funds Trust II
Brighthouse Asset Allocation 20 Portfolio
Notes to Financial Statements—December 31, 2023—(Continued)
9. Regulatory Updates
Effective January 24, 2023, the Securities and Exchange Commission adopted rule and form amendments that require open-end management investment companies to transmit concise and visually engaging annual and semiannual reports to shareholders that highlight certain information deemed by the SEC to be particularly important for investors. Certain other information, including financial statements, will no longer appear in shareholder reports but will, as required, be available online, delivered free of charge upon request, and filed on a semiannual basis on Form N-CSR. The rule and form amendments have a compliance date of July 24, 2024. Accordingly, the rule and form amendments will not impact the Portfolio until its 2024 semiannual shareholder report.
BHFTII-14
Brighthouse Funds Trust II
Brighthouse Asset Allocation 20 Portfolio
Report of Independent Registered Public Accounting Firm
To the Board of Trustees of Brighthouse Funds Trust II and Shareholders of the Brighthouse Asset Allocation 20 Portfolio:
Opinion on the Financial Statements and Financial Highlights
We have audited the accompanying statement of assets and liabilities, including the schedule of investments, of the Brighthouse Asset Allocation 20 Portfolio (the “Fund”) (one of the funds constituting the Brighthouse Funds Trust II), as of December 31, 2023, the related statement of operations for the year then ended, the statements of changes in net assets for each of the two years in the period then ended, the financial highlights for each of the five years in the period then ended, and the related notes. In our opinion, the financial statements and financial highlights present fairly, in all material respects, the financial position of the Fund as of December 31, 2023, and the results of its operations for the year then ended, the changes in its net assets for each of the two years in the period then ended, and the financial highlights for each of the five years in the period then ended in conformity with accounting principles generally accepted in the United States of America.
Basis for Opinion
These financial statements and financial highlights are the responsibility of the Fund’s management. Our responsibility is to express an opinion on the Fund’s financial statements and financial highlights based on our audits. We are a public accounting firm registered with the Public Company Accounting Oversight Board (United States) (PCAOB) and are required to be independent with respect to the Fund in accordance with the U.S. federal securities laws and the applicable rules and regulations of the Securities and Exchange Commission and the PCAOB.
We conducted our audits in accordance with the standards of the PCAOB. Those standards require that we plan and perform the audit to obtain reasonable assurance about whether the financial statements and financial highlights are free of material misstatement, whether due to error or fraud. The Fund is not required to have, nor were we engaged to perform, an audit of its internal control over financial reporting. As part of our audits we are required to obtain an understanding of internal control over financial reporting but not for the purpose of expressing an opinion on the effectiveness of the Fund’s internal control over financial reporting. Accordingly, we express no such opinion.
Our audits included performing procedures to assess the risks of material misstatement of the financial statements and financial highlights, whether due to error or fraud, and performing procedures that respond to those risks. Such procedures included examining, on a test basis, evidence regarding the amounts and disclosures in the financial statements and financial highlights. Our audits also included evaluating the accounting principles used and significant estimates made by management, as well as evaluating the overall presentation of the financial statements and financial highlights. Our procedures included confirmation of securities owned as of December 31, 2023, by correspondence with the transfer agent. We believe that our audits provide a reasonable basis for our opinion.
/s/ Deloitte & Touche LLP
Boston, Massachusetts
February 23, 2024
We have served as the auditor of one or more Brighthouse investment companies since 1983.
BHFTII-15
Brighthouse Funds Trust II
Trustees and Officers
MANAGEMENT OF THE TRUSTS
The Boards of Trustees (the “Board”) of Brighthouse Funds Trust I and Brighthouse Funds Trust II (“Trust I” and “Trust II”, respectively, and collectively the “Trusts”) supervise the Trusts and are responsible for representing the interests of shareholders. The Trustees, the Chairman of the Board and the Chairmen of each subcommittee are the same for both Trusts. The Trustees of each Trust meet periodically throughout the year to oversee the Portfolios’ activities, reviewing, among other things, each Portfolio’s performance and its contractual arrangements with various service providers. The Trustees of each Trust elect the officers of the Trust, who are responsible for administering the Trust’s day-to-day operations.
Trustees and Officers
The Trustees and executive officers of the Trusts, as well as their ages and their principal occupations during the past five years, are set forth below. Unless otherwise indicated, the business address of each is c/o Brighthouse Funds Trust I and Brighthouse Funds Trust II, 11225 N. Community House Rd., Charolette, North Carolina 28277. Each Trustee who is deemed an “interested person,” as such term is defined in the 1940 Act, is referred to as an “Interested Trustee.” Those Trustees who are not “interested persons,” as such term is defined in the 1940 Act, are referred to as “Independent Trustees.” There is no limit to the term a Trustee may serve, other than pursuant to the retirement policy adopted by the Independent Trustees. Trustees serve until their death, resignation, retirement or removal in accordance with Trust I’s and Trust II’s respective organizational documents and policies adopted by the Board of the Trust from time to time. Officers hold office at the pleasure of each Board and serve until their removal or resignation in accordance with the Trusts’ respective organizational documents and policies adopted by the Board of each Trust from time to time.
Trustees of the Trusts
| Name and Year of Birth |
Position(s) |
Term of Office |
Principal Occupation(s) During the Past |
Number of |
Other Directorships
Held | |||||
| Interested Trustee | ||||||||||
| John Rosenthal* (1960) |
Trustee | Indefinite; From May 2016 (Trust I and Trust II) to present | Chief Investment Officer, Brighthouse Financial, Inc. (2016 to present). | 73 | None | |||||
| Independent Trustees | ||||||||||
| Dawn M. Vroegop (1966) |
Trustee and Chair of the Board | Indefinite; From December 2000 (Trust I)/May 2009 (Trust II) to present as Trustee; From May 2016 (Trust I and Trust II) until present as Chair | Retired; Private Investor. | 73 | Trustee, Driehaus Mutual Funds (8 portfolios).** | |||||
| Stephen M. Alderman (1959) |
Trustee | Indefinite; From December 2000 (Trust I)/April 2012 (Trust II) to present | Vice President and General Counsel, IHR Aerial Solutions, LLC; Until 2022, General Counsel, Illini Hi-Reach, Inc.; Until 2020, Shareholder in the law firm of Garfield & Merel, Ltd. | 73 | None | |||||
| Robert J. Boulware (1956) |
Trustee | Indefinite; From March 2008 (Trust I)/April 2012 (Trust II) to present | Managing Member, Pilgrim Funds, LLC (private equity fund). | 73 | Trustee, Vertical Capital Income Fund (closed-end fund);** Trustee, The Private Shares Fund (closed-end fund);** Until 2021, Director, Mid-Con Energy Partners, LP (energy);** Until 2020, Director, Gainsco, Inc. (auto insurance).** | |||||
BHFTII-16
Brighthouse Funds Trust II
Trustees and Officers—(Continued)
| Name and Year of Birth |
Position(s) |
Term of Office |
Principal Occupation(s) During the Past |
Number of |
Other Directorships
Held | |||||
| Susan C. Gause (1952) |
Trustee | Indefinite; From March 2008 (Trust I)/April 2012 (Trust II) to present | Private Investor. | 73 | Trustee, HSBC Funds (4 portfolios).** | |||||
| Nancy Hawthorne (1951) |
Trustee | Indefinite; From May 2003 (Trust II)/April 2012 (Trust I) to present | Private Investor. | 73 | Trustee, First Eagle Credit Opportunities Fund;** Trustee and Chair of the Board of Trustees, First Eagle Global Opportunities Fund;** Director, Avid Technology, Inc;** Director, CRA International, Inc.** | |||||
Executive Officers of the Trusts
| Name and Year of Birth |
Position(s) |
Term of Office |
Principal Occupation(s) | |||
| Kristi Slavin (1973) | President and Chief Executive Officer, of Trust I and Trust II | From May 2016 (Trust I and Trust II) to present |
President, Brighthouse Investment Advisers, LLC (2016-present). | |||
| Alan R. Otis (1971) | Chief Financial Officer and Treasurer, of Trust I and Trust II | From November 2017 (Trust I and Trust II) to present |
Executive Vice President, Brighthouse Investment Advisers, LLC (2017-present); formerly, Vice President, Brighthouse Investment Advisers, LLC (2012-2017); Assistant Treasurer, Trust I and Trust II (2012-2017). | |||
| Thomas Watterson (1985) | Secretary, of Trust I and Trust II | From November 2023 (Trust I and Trust II) to present |
Executive Vice President, Chief Legal Officer and Secretary, Brighthouse Investment Advisers, LLC (2023-Present); Managing Corporate Counsel, Brighthouse Financial Inc. (2023-present); Managing Counsel and Director, The Bank of New York Mellon Corporation (2019-2023); Counsel and Vice President, The Bank of New York Mellon Corporation (2016-2019). | |||
| Katie Hellmann (1980) | Chief Compliance Officer (“CCO”), of Trust I and Trust II | From May 2023 (Trust I and Trust II) to present |
Chief Compliance Officer, Brighthouse Investment Advisers, LLC (2023-present) and Head of Funds and Investments Compliance (2023-present). Deputy Chief Compliance Officer, Transamerica Asset Management (2022-2023). Leader and Senior Compliance Counsel – Funds Compliance, Edward Jones (2017-2022). | |||
| Rosemary Morgan (1983) | Anti-Money Laundering Officer, of Trust I and Trust II | From May 2023 (Trust I and Trust II) to present |
Chief Privacy Officer, Leader of Compliance Programs and Assistant General Counsel, Brighthouse Financial, Inc. (2019-2022); Chief Privacy Officer, Head of Compliance Programs & Contracts Law, Brighthouse Financial, Inc. (2022-2023), Chief Compliance Officer and Associate General Counsel, Brighthouse Financial, Inc. (2023-present); Vice President and Chief Compliance Officer, Brighthouse Life Insurance Company (2023-present); Vice President and Chief Compliance Officer (2023-present), Brighthouse Life Insurance Company of NY; Vice President and Chief Compliance Officer (2023-present), New England Life Insurance Company. | |||
| Anna Koska (1981) | Vice President, of Trust I and Trust II | From June 2022 (Trust I and Trust II) to present |
Vice President, Investment and Advisory Services, Brighthouse Investment Advisers, LLC (2022-present); Director of Investment and Advisory Services, Brighthouse Investment Advisers, LLC (2019-2022); Senior Portfolio Analyst, Brighthouse Investment Advisers, LLC (2017-2019). | |||
| * | Mr. Rosenthal is an “interested person” of the Trusts because of his position with Brighthouse Financial, Inc. (“Brighthouse Financial”), an affiliate of BIA. |
| ** | Indicates a directorship with a registered investment company or a company subject to the reporting requirements of the Securities Exchange Act of 1934, as amended. |
| (1) | Previous positions during the past five years with the Trusts, MetLife, Inc. or the Adviser are omitted if not materially different. |
| (2) | The Fund Complex includes 44 Trust I Portfolios and 29 Trust II Portfolios. |
BHFTII-17
Brighthouse Funds Trust II
Brighthouse Asset Allocation 20 Portfolio
Board of Trustees’ Consideration of Advisory Agreements
At a meeting held on November 13-14, 2023 (the “November Meeting”), the Boards of Trustees (the “Board”) of Brighthouse Funds Trust I and Brighthouse Funds Trust II (“BFT I” and “BFT II,” respectively, and collectively, the “Trusts”), including a majority of the Trustees who are not “interested persons” of the Trusts (the “Independent Trustees”) under the Investment Company Act of 1940 (the “1940 Act”), approved the continuation of the Trusts’ advisory agreements (the “Advisory Agreements” or “Agreements”) with Brighthouse Investment Advisers, LLC (the “Adviser”) for the series of the Trusts (each a “Portfolio,” and collectively, the “Portfolios”) for the annual contract renewal period from January 1, 2024 through December 31, 2024.
The Board met with personnel of the Adviser on September 28-29, 2023 (the “September Meeting”) for the specific purpose of giving preliminary consideration to the proposed continuation of the Agreements, including consideration to information that the Adviser had provided for the Board’s review at the request of the Independent Trustees. At the September Meeting, the Adviser reviewed with the Board the performance and fees experienced by each Portfolio, as well as other information. During and after the September Meeting, the Independent Trustees requested additional information and clarifications that the Adviser addressed at the November Meeting (the September Meeting and the November Meeting are referred to collectively as, the “Meetings”). During the contract renewal process, and throughout the year, the Independent Trustees were advised by independent legal counsel, and they met with independent legal counsel in executive sessions outside of the presence of management on a number of occasions to discuss, among other things, the renewal of the Agreements.
In considering the continuation of the Agreements, the Board reviewed a variety of materials that were provided for the specific purpose of assisting the Board in the renewal process, along with various information and materials that were provided to and discussed with the Board throughout the year, at regularly scheduled meetings of the Board and its committees. In particular, information for each Portfolio included, but was not limited to, reports on investment performance, expenses, legal and compliance matters, and asset pricing. Information about the Adviser included, but was not limited to, reports on the business, operations, and performance of the Adviser and reports that the Adviser had prepared specifically for the renewal process.
In considering the continuation of the Agreements, the Board also reviewed, among other things, a report for each Portfolio that was prepared by Broadridge (“Broadridge”), an independent organization, which set forth comparative performance and expense information for each Portfolio. In addition, the Independent Trustees reviewed a report that was prepared by JDL Consultants, LLC (“JDL”), an independent consultant to the Independent Trustees, which examined the Broadridge reports for each Portfolio (“JDL Report”). The Independent Trustees met in executive session with representatives of JDL during the September Meeting to review the JDL Report.
At the November Meeting, the Board, including a majority of the Independent Trustees, concluded that the nature, extent, and quality of services provided by the Adviser supported the renewal of the Agreements. The Board also concluded that the investment services provided to and the performance of each Portfolio was such that each Agreement should continue, and that the fees paid by each Portfolio to the Adviser appeared to be reasonable in light of the nature, extent, and quality of the services provided by the Adviser. Further, the Board concluded that the Adviser’s profitability in providing services under the Advisory Agreements did not appear unreasonable in light of the nature, extent, and quality of the services provided by the Adviser. The Board reviewed the extent to which the investment advisory fees paid by the Portfolios shared economies of scale with investors or entailed the potential to share economies of scale with investors and concluded that those considerations generally supported the renewal of each Agreement.
In approving the continuation of each Agreement, the Board, including the Independent Trustees, gave attention to all of the information that was furnished, and each Trustee placed varying degrees of importance on the various pieces of information that were provided to them. The Board evaluated the information provided to it on a Portfolio-by-Portfolio basis, and its decision was made separately with respect to each Portfolio. The following paragraphs provide more information about some of the primary factors that were relevant to the Board’s decisions. The Board did not identify any single factor as determinative, and the Trustees generally attributed different weights to various factors for the various Portfolios.
Nature, extent and quality of services. The Board evaluated the nature, extent and quality of the services that the Adviser has provided to the Brighthouse Asset Allocation 20 Portfolio, Brighthouse Asset Allocation 40 Portfolio, Brighthouse Asset Allocation 60 Portfolio Brighthouse Asset Allocation 80 Portfolio and Brighthouse Asset Allocation 100 Portfolio (the “Asset Allocation Portfolios”) and the American Funds Balanced Allocation Portfolio, American Funds Growth Allocation Portfolio and American Funds Moderate Allocation Portfolio (the “American Funds of Funds”). The Board considered the Adviser’s services as investment manager to the Portfolios, including information with respect to investment programs and personnel, succession management of key personnel, oversight of transition management (as applicable), actions taken with respect to regulatory developments, compliance programs and personnel, and risk management programs, among other things. The Adviser’s services in coordinating and overseeing the activities of the Trusts’ other service providers were also considered. The Board also considered the systems and processes required by the Adviser
BHFTII-18
Brighthouse Funds Trust II
Brighthouse Asset Allocation 20 Portfolio
Board of Trustees’ Consideration of Advisory Agreements—(Continued)
to meet additional regulatory and compliance requirements resulting from U.S. Securities and Exchange Commission and other regulatory initiatives, including related to liquidity, valuation, and derivatives risk management. The Board considered information received from the Trusts’ Chief Compliance Officer regarding the Portfolios’ compliance policies and procedures that were established pursuant to Rule 38a-l under the 1940 Act and relevant aspects of the Adviser’s compliance policies and procedures. The Board also noted that the Adviser’s investment, compliance, and legal staff reviews and assesses the services that are provided to the Portfolios, and that personnel of the Adviser routinely prepare and present reports to the Independent Trustees regarding material information related to those reviews and assessments. In addition, during the Meetings and throughout the year, the Board considered the expertise, experience, and performance of the personnel of the Adviser who performed the various services that are mentioned above.
With respect to the Asset Allocation Portfolios, the Board noted that the Adviser employs at its own expense an independent consultant to provide research and consulting services with respect to the periodic asset allocation targets for each of the Asset Allocation Portfolios and investments in other Portfolios of the Trusts (the “Underlying Portfolios”). Additionally, the Board considered that a committee, consisting of investment professionals from the Adviser, meets regularly to review the management of the Asset Allocation Portfolios and the American Funds of Funds, including asset allocations and performance metrics.
Performance. The Board placed emphasis on the performance of each Portfolio in the context of the performance of the relevant markets in which the Portfolio invests. The Board considered the Adviser’s quarterly presentations to the Board of detailed information about each Portfolio’s investment strategies and performance results and composition, including discussions regarding the relevant effects of market conditions. The Board reviewed and considered the reports prepared by Broadridge, which provided a statistical analysis comparing each Portfolio’s investment performance to that of comparable funds underlying variable insurance products (the “Performance Universe”), and the JDL Report. The Board considered each Portfolio’s performance for periods subsequent to the performance period covered by the Broadridge reports, and considered the Adviser’s assessment of the same. The Board also noted that while it found the data provided by Broadridge generally useful, it recognized the limitations of such data, including, in particular, that notable differences may exist between a Portfolio and the other funds in a Broadridge category (for example, with respect to investment strategies) and that the results of the performance comparisons may vary depending on (i) the end dates for the performance periods that were selected, and (ii) the selection of the peer groups.
Fees and Expenses. The Board gave consideration to the level and method of computing the fees payable under the Agreements. The Board reviewed and considered the information in the JDL Report concerning fees and expenses. The Board also reviewed and considered the Broadridge report for each Portfolio, which included various comparisons of the Portfolio’s fees (at December 31, 2022 and various asset levels) and expenses, with those of its peers, including, as applicable, a broad group of peer funds (“Expense Universe”) and a narrower group of peer funds (“Expense Group”). In particular, the Board reviewed comparisons of each Portfolio’s contractual management fees with its Expense Group and total expenses with its Expense Universe and Expense Group. The Board considered that Broadridge selected the peer funds, which were funds underlying variable insurance products that Broadridge deemed to be comparable to the Portfolios. The Board considered that the fee and expense information in the Broadridge report for each Portfolio reflected information as of the Portfolio’s most recent fiscal year end at the time the Broadridge report was issued and that historical asset levels may differ from current asset levels, particularly in a period of market volatility.
The Board also considered that the Adviser had entered into an expense limitation and management fee waiver agreement with Brighthouse Asset Allocation 20 Portfolio pursuant to which the Adviser had agreed to waive a portion of its advisory fee and/or reimburse certain expenses as a means of limiting the Portfolio’s total annual operating expenses.
Profitability. The Board examined the profitability to the Adviser of each Advisory Agreement, on a Portfolio-by-Portfolio basis. In the case of the Asset Allocation Portfolios, the Board also considered the Adviser’s analysis of its profitability that was attributable to its management of the Underlying Portfolios of the Trust in which the Asset Allocation Portfolios invest. The Board also considered that an affiliate of the Adviser, Brighthouse Securities, LLC, serves as distributor for the Trusts, and, as such, receives Rule 12b-1 payments to support the distribution of the Portfolios. In reviewing the profitability information, the Board recognized that expense allocation methodologies are inherently subjective and various methodologies may be reasonable while producing different results.
Economies of scale. The Board considered each Portfolio’s fees in light of its size. The Board noted the fee schedules for the Portfolios contain breakpoints that reduce the fee rate above specified asset levels.
The Board considered the effective fees under the Advisory Agreement for each Portfolio as a percentage of assets at different asset levels and possible economies of scale that may be realized if the assets of the Portfolio grow. The Board examined, among other data, the effect of a Portfolio’s growth in size, and reduction in size, on various fee schedules. The Board also generally noted that if a Portfolio’s assets increase over time, the Portfolio may realize economies of scale if assets increase proportionally more than certain other expenses.
BHFTII-19
Brighthouse Funds Trust II
Brighthouse Asset Allocation 20 Portfolio
Board of Trustees’ Consideration of Advisory Agreements—(Continued)
Other factors. The Board considered other benefits that may be realized by the Adviser and its affiliates from their relationships with the Trusts. Among the benefits realized by the Adviser, the Board recognized that Brighthouse Securities, LLC, as the distributor for the Trusts, receives payments pursuant to Rule 12b-1 from the Portfolios to help compensate for the provision of distribution and shareholder services activities.
The Board considered information from the Adviser pertaining to potential conflicts of interest, and the manner in which any potential conflicts were mitigated.
* * * * *
Brighthouse Asset Allocation 20 Portfolio. The Board also considered the following information in relation to the Agreement with the Adviser regarding the Portfolio:
Among other data relating specifically to the Portfolio’s performance, the Board considered that the Portfolio underperformed the median of its Performance Universe and the average of its Morningstar category for the one-year period ended June 30, 2023 and outperformed the median of its Performance Universe and the average of its Morningstar Category for the three- and five-year periods ended June 30, 2023. The Board further considered that the Portfolio underperformed the Brighthouse AA 20 Narrow Index for the one-year period ended October 31, 2023 and outperformed the same index for the three- and five-year periods ended October 31, 2023. The Board also took into account that the Portfolio underperformed its benchmark, the Dow Jones Conservative Portfolio Index, for the one-year period ended October 31, 2023 and outperformed the same benchmark for the three- and five-year periods ended October 31, 2023. The Board also noted the presence of the expense cap in effect for the Portfolio.
The Board considered that the Portfolio’s actual management fees were equal to the Expense Group median and below the Expense Universe median. The Board also considered that the Portfolio’s total expenses (inclusive of underlying fund expenses and exclusive of 12b-l fees) were below the Expense Group median and the Expense Universe median. The Board noted that the Portfolio’s contractual management fees were below the asset-weighted average of the Investment Classification/Morningstar Category selected by Broadridge at the Portfolio’s current size.
BHFTII-20
Brighthouse Funds Trust II
Brighthouse Asset Allocation 40 Portfolio
Managed by Brighthouse Investment Advisers, LLC
Portfolio Manager Commentary*
PERFORMANCE
For the twelve months ended December 31, 2023, the Class A and B shares of the Brighthouse Asset Allocation 40 Portfolio returned 10.82% and 10.52%, respectively. The Portfolio’s benchmark, the Dow Jones Moderately Conservative Portfolio Index¹, returned 9.81%.
MARKET ENVIRONMENT / CONDITIONS
Markets carried the momentum of late 2022 and ended the first quarter of 2023 on a positive note. After a string of seven consecutive rate hikes by the U.S. Federal Reserve (the “Fed”) in 2022, signs of high inflation began to wane, and speculation arose monetary tightening may soon end. At its February and March meetings, the Fed scaled back the magnitude of rate hikes and implemented increases of 0.25%, respectively. In March, the Fed moved quicky to inject liquidity into the banking sector after a few well-publicized bank failures surfaced. Bond and equity investors cheered the decisive action to quell the risk.
Investor enthusiasm began to falter in the second quarter of 2023. Bond markets were being pressured by central bank actions to raise rates as inflationary concerns continued to exist. In May, the Fed enacted its tenth consecutive rate hike before it voted to hold rates in check at its June meeting. The yield on the 10-year U.S. Treasury Bond rose throughout the quarter and negatively impacted government and investment grade credit bonds. In June, economic growth, as measured by the real gross domestic product (“GDP”) rate was positive as the first quarter 2023 real GDP growth rate reported a 2% annual gain. However, it marked the third straight quarter of decelerating GDP levels and raised doubts over the strength of the economy.
Conditions deteriorated in the third quarter with broad market declines amid a global equity correction and a worsening bond slump over the last two quarters. Equities pulled back after having established gains in the first half of the year. The possibility rates may remain higher and with central bank comments absent any definitive near-term relief, markets retreated. Globally, the European Union lowered its growth forecast and concern over China’s property sector pressured markets with Moody’s downgrading China’s property sector outlook to negative. The resilience of core bonds held up in the early part of the third quarter before prices declined sharply in the final two months of the quarter. The 10-Year U.S. Treasury yield moved aggressively over the period and rose 78 basis points (“bps”) and 50 bps in September alone. Though the Fed paused hiking rates at its September meeting, economic data showed a relatively healthy economy and kept hawkish monetary policies at the forefront.
The final two months of the year witnessed a robust turnaround for bonds and equities. Inflationary fears subsided and investors rejoiced that the cycle of rate hikes and aggressive monetary policies appeared to have levelled off and central banks may have their eyes focused instead on potential interest rate cuts for 2024. In the U.S., Fed officials kept their hands on the pause button during the fourth quarter and maintained the Federal Fund Rate at a range of 5.25% to 5.50%. Bond prices surged as the 10-Year U.S. Treasury yield fell 100 bps between October and the end of the year. Not to be outdone, several major broad-based equity markets had double-digit gains during the quarter.
For the full year ended 2023, the S&P 500 Index returned 26.29%. International stocks, as measured by the MSCI EAFE Index, gained 18.24%, and emerging market stocks, as measured by the MSCI Emerging Markets Index, returned 9.83%. Within fixed income, core bonds, as measured by the Bloomberg U.S. Aggregate Bond Index, returned 5.53% for the year ended December 31, 2023.
PORTFOLIO REVIEW / PERIOD-END POSITIONING
The Brighthouse Asset Allocation 40 Portfolio invests in underlying portfolios of the Brighthouse Funds Trust I and the Brighthouse Funds Trust II to maintain a broad asset allocation of approximately 40% to equities and 60% to fixed income.
Over the twelve-month period, the Portfolio outperformed the Dow Jones Moderately Conservative Portfolio Index. Performance strength within the underlying fixed income and mid cap equity portfolios offset weakness within the underlying large cap equity and non-U.S. equity portfolios.
On an absolute return basis, the top performing underlying fixed income portfolios were the BlackRock High Yield Portfolio and the Brighthouse/Eaton Vance Floating Rate Portfolio as below investment grade bonds (“high yield”) performed well relative to higher credit quality rated bonds. The Western Asset Management Strategic Bond Opportunities Portfolio outperformed its benchmark by 3.9%. Allocations to high yield bonds and bank loans were primary contributors. Exposures to non-agency mortgage-backed securities (“MBS”) and emerging market debt aided returns. The PIMCO Total Return Portfolio exceeded its benchmark by 0.7%. The Portfolio’s yield curve positioning and duration management made positive contributions. Overweight exposures to both non-agency MBS, particularly collateralized loan obligations (“CLOs”) and agency MBS and security selection to investment grade bonds lifted relative results. The PIMCO Inflation Protected Bond Portfolio underperformed its benchmark by 0.2%. An overweight to U.S. inflation expectations detracted as inflationary pressures moderated over the period. The Brighthouse/Templeton International Bond Portfolio underperformed its benchmark by 2.1%. Currency positioning in the euro, Japanese yen, and South Korean won were the primary detractors from relative results during the period.
Performance from the underlying domestic equity portfolios was mixed for the period. Large cap and small cap portfolios underperformed, while mid cap portfolios were positive contributors. In large cap, the Brighthouse/Wellington Core Equity Opportunities Portfolio underperformed its benchmark by 18.9%. Negative security selection in the Industrials, Consumer Discretionary, and Information Technology
BHFTII-1
Brighthouse Funds Trust II
Brighthouse Asset Allocation 40 Portfolio
Managed by Brighthouse Investment Advisers, LLC
Portfolio Manager Commentary*—(Continued)
(“IT”) sectors were key detractors during the year. An underweight position in the IT and Communication Services sectors, and an overweight in the Consumer Discretionary sector further pressured results. The MFS Value Portfolio underperformed its benchmark by 3.3%. Security selection weakness in the Industrials and Communication Services sectors, along with an underweight to Communication Services drove the relative underperformance. On the positive side, the BlackRock Capital Appreciation Portfolio beat its benchmark by 6.9%. Contributions in security selection were made primarily in the IT, Health Care, and Financials sectors. An underweight to Consumer Staples also helped relative outperformance. Within mid cap, the Brighthouse/Artisan Mid Cap Value Portfolio outperformed its benchmark by 5.8%. Security selection in the Financials, IT, and Consumer Discretionary sectors were the largest relative contributors to results. The T. Rowe Price Mid Cap Growth Portfolio’s absolute performance lifted overall mid cap results. In small cap, the Brighthouse Small Cap Value Portfolio underperformed its benchmark by 0.4%. Negative security selection in the IT and Energy sectors detracted from relative results. The JPMorgan Small Cap Value Portfolio underperformed its benchmark by 1.4%. Security selection in the Health Care and IT sectors and an underweight to the Energy sector weighed negatively on relative results.
The underlying non-U.S. equity portfolios underperformed over the period. Within developed markets, VanEck Global Natural Resources Portfolio’s negative absolute performance was a detractor to overall international equity results. Security selection weakness in the Materials sector to the diversified metals & mining and copper sub-industries negatively impacted performance. The Brighthouse/Artisan International Portfolio underperformed its benchmark by 1.0%. Security selection weakness in the Consumer Staples sector and an underweight to the IT sector detracted over the period. On a country basis, positioning in Japan was a key detractor. On the positive side, the Invesco Global Equity Portfolio outperformed its benchmark by 12.8%. Overweight positions in the IT and Communication Services sector and an underweight to Consumer Staples, as well as positive security selection in the Communication Services, Real Estate, and Health Care sectors were major contributors to results. In emerging markets, the Brighthouse/abrdn Emerging Markets Equity Portfolio underperformed its benchmark by 3.2%. Negative security selection in the Consumer Discretionary, IT, and Health Care sectors were leading detractors to relative performance. At the country level, exposures in China and Hong Kong detracted during the period. Conversely, the SSGA Emerging Markets Enhanced Index Portfolio outperformed its benchmark by 3.0%. Positive security selection in the IT, Financials, Utilities, and Industrials sectors were top relative contributors. At the country level, security selection was strongest in India, Taiwan, and China.
Investment Committee
Brighthouse Investment Advisers, LLC
* This commentary may include statements that constitute “forward-looking statements” under the U.S. securities laws. Forward-looking statements include, among other things, projections, estimates, and information about possible or future results related to the Portfolio, market or regulatory developments. The views expressed above are not guarantees of future performance or economic results and involve certain risks, uncertainties and assumptions that could cause actual outcomes and results to differ materially from the views expressed herein. The views expressed above are subject to change at any time based upon economic, market, or other conditions and the advisory firm undertakes no obligation to update the views expressed herein. Any discussions of specific securities should not be considered a recommendation to buy or sell those securities. The views expressed above (including any forward-looking statement) may not be relied upon as investment advice or as an indication of the Portfolio’s trading intent. Information about the Portfolio’s holdings, asset allocation or country diversification is historical and is not an indication of future Portfolio composition, which may vary. Direct investment in any index is not possible. The performance of any index mentioned in this commentary has not been adjusted for ongoing management, distribution and operating expenses, and sales charges applicable to mutual fund investments. In addition, the returns do not reflect additional fees charged by separate accounts or variable insurance contracts that an investor in the Portfolio may pay. If these additional fees were reflected, performance would have been lower.
1 The The Dow Jones Moderately Conservative Portfolio Index is a member of the Dow Jones Relative Risk Index Series and is designed to measure a total portfolio of stocks, bonds, and cash, allocated to represent an investor’s desired risk profile. The Dow Jones Moderately Conservative Portfolio Index level is set to 40% of the Dow Jones Global Stock CMAC Index’s downside risk over the past 36 months.
BHFTII-2
Brighthouse Funds Trust II
Brighthouse Asset Allocation 40 Portfolio
A $10,000 INVESTMENT COMPARED TO THE DOW JONES MODERATELY CONSERVATIVE PORTFOLIO INDEX
AVERAGE ANNUAL RETURNS (%) FOR THE YEAR ENDED DECEMBER 31, 2023
| 1 Year |
5 Year |
10 Year |
||||||||||
| Brighthouse Asset Allocation 40 Portfolio |
||||||||||||
| Class A |
10.82 | 5.87 | 4.60 | |||||||||
|
Class B |
10.52 | 5.60 | 4.34 | |||||||||
| Dow Jones Moderately Conservative Portfolio Index |
9.81 | 4.35 | 3.82 | |||||||||
Portfolio performance is calculated including reinvestment of all income and capital gain distributions. Performance numbers are net of all Portfolio expenses but do not include any insurance, sales, separate account or administrative charges of variable annuity or life insurance contracts or any additional expenses that participants may bear relating to the operations of their plans. If these charges were included, the returns would be lower. The performance of any index referenced above has not been adjusted for ongoing management, distribution and operating expenses, and sales charges applicable to mutual fund investments. Direct investment in any index is not possible. The performance of Class A shares, as set forth in the line graph above, will differ from that of other classes because of the difference in expenses paid by policyholders investing in the different share classes.
This information represents past performance and is not indicative of future results. Investment return and principal value may fluctuate so that shares, upon redemption, may be worth more or less than the original cost.
PORTFOLIO COMPOSITION AS OF DECEMBER 31, 2023
Top Holdings
| % of Net Assets |
||||
| PIMCO Total Return Portfolio (Class A) | 9.5 | |||
| BlackRock Bond Income Portfolio (Class A) | 9.5 | |||
| Western Asset Management U.S. Government Portfolio (Class A) | 8.0 | |||
| TCW Core Fixed Income Portfolio (Class A) | 7.3 | |||
| PIMCO Inflation Protected Bond Portfolio (Class A) | 5.4 | |||
| Western Asset Management Strategic Bond Opportunities Portfolio (Class A) | 4.0 | |||
| MFS Value Portfolio (Class A) | 3.8 | |||
| JPMorgan Core Bond Portfolio (Class A) | 3.8 | |||
| T. Rowe Price Large Cap Value Portfolio (Class A) | 3.5 | |||
| AB International Bond Portfolio (Class A) | 3.5 | |||
Asset Allocation
| % of Net Assets |
||||
| Investment Grade Fixed Income | 46.4 | |||
| U.S. Large Cap Equities | 21.8 | |||
| International Developed Market Equities | 8.9 | |||
| High Yield Fixed Income | 6.5 | |||
| International Fixed Income | 6.0 | |||
| U.S. Small Cap Equities | 4.3 | |||
| Global Equities | 2.9 | |||
| Emerging Market Equities | 1.5 | |||
| U.S. Mid Cap Equities | 0.9 | |||
| Real Estate Equities | 0.8 | |||
BHFTII-3
Brighthouse Funds Trust II
Brighthouse Asset Allocation 40 Portfolio
Understanding Your Portfolio’s Expenses
Shareholder Expense Example
As a shareholder of the Portfolio, you incur ongoing costs, including management fees; distribution and service (12b-1) fees; and other Portfolio expenses. This example is intended to help you understand your ongoing costs (in dollars) (referred to as “expenses”) of investing in the Portfolio and compare these costs with the ongoing costs of investing in other mutual funds. The example is based on an investment of $1,000 invested at the beginning of the period and held for the entire period, July 1, 2023 through December 31, 2023.
Actual Expenses
The first line for each share class of the Portfolio in the table below provides information about actual account values and actual expenses. You may use the information in this line, together with the amount you invested in the particular share class of the Portfolio, to estimate the expenses that you paid over the period. Simply divide your account value by $1,000 (for example, an $8,600 account value divided by $1,000 = 8.6), then multiply the result by the number in the first line under the heading entitled “Expenses Paid During Period” to estimate the expenses you paid on your account during this period.
Hypothetical Example for Comparison Purposes
The second line for each share class of the Portfolio in the table below provides information about hypothetical account values and hypothetical expenses based on the Portfolio’s actual expense ratio and an assumed rate of return of 5% per year before expenses, which is not the Portfolio’s actual return. The hypothetical account values and expenses may not be used to estimate the actual ending account balance or expenses you paid for the period. You may use this information to compare the ongoing costs of investing in the Portfolio and other funds. To do so, compare this 5% hypothetical example with the 5% hypothetical examples that appear in the shareholder reports of the other funds.
Please note that the expenses shown in the table are meant to highlight your ongoing costs only and do not reflect any fees or charges of your variable insurance product or any additional expenses that participants in certain eligible qualified plans may bear relating to the operations of their plan. Therefore, the second line for each share class in the table is useful in comparing ongoing costs only, and will not help you determine the relative total costs of owning different funds. In addition, if these other costs were included, your costs would have been higher.
| Brighthouse Asset Allocation 40 Portfolio |
Annualized Expense Ratio |
Beginning Account Value July 1, 2023 |
Ending Account Value December 31, 2023 |
Expenses Paid During Period** July 1, 2023 to December 31, 2023 |
||||||||||||||
| Class A (a) |
Actual | 0.64 | % | $ | 1,000.00 | $ | 1,047.70 | $ | 3.30 | |||||||||
| Hypothetical* | 0.64 | % | $ | 1,000.00 | $ | 1,021.98 | $ | 3.26 | ||||||||||
| Class B (a) |
Actual | 0.89 | % | $ | 1,000.00 | $ | 1,046.10 | $ | 4.59 | |||||||||
| Hypothetical* | 0.89 | % | $ | 1,000.00 | $ | 1,020.72 | $ | 4.53 | ||||||||||
| * | Hypothetical assumes a rate of return of 5% per year before expenses. |
| ** | Expenses paid are equal to the Portfolio’s annualized expense ratio for the most recent six month period, as shown above, multiplied by the average account value over the period, multiplied by the number of days (184 days) in the most recent fiscal half-year, divided by 365 (to reflect the one-half year period). |
| (a) | The annualized expense ratio reflects the expenses of both the Portfolio and the Underlying Portfolios in which it invests. |
BHFTII-4
Brighthouse Funds Trust II
Brighthouse Asset Allocation 40 Portfolio
Schedule of Investments as of December 31, 2023
Mutual Funds—100.0% of Net Assets
| Security Description | Shares | Value | ||||||
| Affiliated Investment Companies—100.0% | ||||||||
| AB International Bond Portfolio (Class A) (a) |
16,022,712 | $ | 127,861,243 | |||||
| Allspring Mid Cap Value Portfolio (Class A) (a) |
816,006 | 9,163,750 | ||||||
| Baillie Gifford International Stock Portfolio (Class A) (b) |
8,773,637 | 91,859,984 | ||||||
| BlackRock Bond Income Portfolio (Class A) (b) |
3,757,505 | 346,667,373 | ||||||
| BlackRock Capital Appreciation Portfolio (Class A) (b) |
1,766,449 | 64,016,115 | ||||||
| BlackRock High Yield Portfolio (Class A) (a) |
3,724,543 | 27,449,885 | ||||||
| Brighthouse Small Cap Value Portfolio (Class A) (a) |
3,227,020 | 45,339,627 | ||||||
| Brighthouse/abrdn Emerging Markets Equity Portfolio (Class A) (a) |
3,093,387 | 27,314,604 | ||||||
| Brighthouse/Artisan International Portfolio (Class A) (a) |
6,245,774 | 64,269,012 | ||||||
| Brighthouse/Artisan Mid Cap Value Portfolio (Class A) (b) |
42,112 | 9,153,818 | ||||||
| Brighthouse/Eaton Vance Floating Rate Portfolio (Class A) (a) |
6,191,020 | 61,414,917 | ||||||
| Brighthouse/Franklin Low Duration Total Return Portfolio (Class A) (a) |
12,016,992 | 105,629,356 | ||||||
| Brighthouse/Templeton International Bond Portfolio (Class A) (a) (c) |
11,701,900 | 91,859,914 | ||||||
| Brighthouse/Wellington Core Equity Opportunities Portfolio (Class A) (b) |
4,158,229 | 118,592,693 | ||||||
| Brighthouse/Wellington Large Cap Research Portfolio (Class A) (a) |
5,976,545 | 82,595,851 | ||||||
| CBRE Global Real Estate Portfolio (Class A) (a) |
2,595,879 | 27,360,570 | ||||||
| Harris Oakmark International Portfolio (Class A) (a) |
7,692,657 | 100,927,658 | ||||||
| Invesco Comstock Portfolio (Class A) (a) |
9,347,203 | 119,083,366 | ||||||
| Invesco Global Equity Portfolio (Class A) (a) |
1,532,733 | 36,693,637 | ||||||
| Invesco Small Cap Growth Portfolio (Class A) (a) (c) |
2,219,068 | 18,196,356 | ||||||
| Jennison Growth Portfolio (Class A) (b) (c) |
3,186,465 | 45,662,043 | ||||||
| JPMorgan Core Bond Portfolio (Class A) (a) |
15,072,801 | 136,710,302 | ||||||
| JPMorgan Small Cap Value Portfolio (Class A) (a) |
2,406,515 | 27,169,558 | ||||||
| Loomis Sayles Growth Portfolio (Class A) (a) |
2,358,480 | 36,580,024 | ||||||
| Loomis Sayles Small Cap Growth Portfolio (Class A) (b) (c) |
852,945 | 9,058,275 | ||||||
| MFS Research International Portfolio (Class A) (a) |
5,314,202 | 64,301,840 | ||||||
| Affiliated Investment Companies—(Continued) | ||||||||
| MFS Value Portfolio (Class A) (b) |
9,894,581 | 137,732,562 | ||||||
| Neuberger Berman Genesis Portfolio (Class A) (b) |
980,002 | 18,100,628 | ||||||
| PIMCO Inflation Protected Bond Portfolio (Class A) (a) |
20,750,166 | 197,126,582 | ||||||
| PIMCO Total Return Portfolio (Class A) (a) |
34,990,550 | 347,106,255 | ||||||
| SSGA Emerging Markets Enhanced Index Portfolio (Class A) (a) |
2,806,975 | 27,424,142 | ||||||
| T. Rowe Price Large Cap Growth Portfolio (Class A) (b) (c) |
2,644,366 | 54,738,381 | ||||||
| T. Rowe Price Large Cap Value Portfolio (Class A) (a) |
4,877,487 | 128,521,790 | ||||||
| T. Rowe Price Mid Cap Growth Portfolio (Class A) (a) |
1,923,378 | 18,291,325 | ||||||
| T. Rowe Price Small Cap Growth Portfolio (Class A) (b) |
2,281,413 | 45,400,120 | ||||||
| TCW Core Fixed Income Portfolio (Class A) (a) |
29,746,513 | 265,041,430 | ||||||
| VanEck Global Natural Resources Portfolio (Class A) (b) |
5,775,109 | 68,666,043 | ||||||
| Western Asset Management Strategic Bond Opportunities Portfolio (Class A) (b) |
13,366,230 | 146,627,541 | ||||||
| Western Asset Management U.S. Government Portfolio (Class A) (b) |
27,512,750 | 289,984,386 | ||||||
|
|
|
|||||||
| Total Mutual Funds |
3,639,692,956 | |||||||
|
|
|
|||||||
| Total Investments—100.0% |
3,639,692,956 | |||||||
| Other assets and liabilities (net)—0.0% |
(1,216,921 | ) | ||||||
|
|
|
|||||||
| Net Assets—100.0% | $ | 3,638,476,035 | ||||||
|
|
|
|||||||
| (a) | A Portfolio of Brighthouse Funds Trust I. (See Note 6 of the Notes to Financial Statements for a summary of transactions in the securities of affiliated Underlying Portfolios.) | |||
| (b) | A Portfolio of Brighthouse Funds Trust II. (See Note 6 of the Notes to Financial Statements for a summary of transactions in the securities of affiliated Underlying Portfolios.) | |||
| (c) | Non-income producing security. | |||
Fair Value Hierarchy
Accounting principles generally accepted in the United States of America (“GAAP”) define fair market value as the price that the Portfolio would receive to sell an asset or pay to transfer a liability in an orderly transaction between market participants at the measurement date. It establishes a fair value hierarchy that prioritizes inputs to valuation methods and requires disclosure of the fair value hierarchy, separately for each major category of assets and liabilities, that segregates fair value measurements into three levels. Levels 1, 2 and 3 of the fair value hierarchy are defined as follows:
Level 1 - unadjusted quoted prices in active markets for identical investments
Level 2 - other significant observable inputs (including, but not limited to, quoted prices for similar assets or liabilities in markets that are either active or inactive; inputs other than quoted prices that are observable such as interest rates, yield curves, volatilities, prepayment speeds, loss severities, credit risks, default rates, or other market corroborated inputs)
Level 3 - significant unobservable inputs based on the best information available in the circumstances, to the extent observable inputs are unavailable (including the Portfolio’s own assumptions used in determining the fair value of investments and derivative financial instruments)
The inputs or methodologies used for valuing investments are not necessarily an indication of the risk associated with investing in them. Changes to the inputs or methodologies used may result in transfers between levels. A reconciliation of Level 3 securities, if any, will be disclosed following the fair value hierarchy table. For more information about the Portfolio’s policy regarding the valuation of investments, please refer to the Notes to Financial Statements.
The following table summarizes the fair value hierarchy of the Portfolio’s investments as of December 31, 2023:
| Description | Level 1 | Level 2 | Level 3 | Total | ||||||||||||
| Mutual Funds | ||||||||||||||||
| Affiliated Investment Companies |
$ | 3,639,692,956 | $ | — | $ | — | $ | 3,639,692,956 | ||||||||
| Total Investments |
$ | 3,639,692,956 | $ | — | $ | — | $ | 3,639,692,956 | ||||||||
See accompanying notes to financial statements.
BHFTII-5
Brighthouse Funds Trust II
Brighthouse Asset Allocation 40 Portfolio
Statement of Assets and Liabilities
December 31, 2023
| Assets |
||||
| Affiliated investments at value (a) |
$ | 3,639,692,956 | ||
| Receivable for: |
||||
| Affiliated investments sold |
1,287,159 | |||
| Fund shares sold |
493,739 | |||
|
|
|
|||
| Total Assets |
3,641,473,854 | |||
| Liabilities |
||||
| Payables for: |
||||
| Fund shares redeemed |
1,780,898 | |||
| Accrued Expenses: |
||||
| Management fees |
184,576 | |||
| Distribution and service fees |
751,126 | |||
| Deferred trustees’ fees |
243,261 | |||
| Other expenses |
37,958 | |||
|
|
|
|||
| Total Liabilities |
2,997,819 | |||
|
|
|
|||
| Net Assets |
$ | 3,638,476,035 | ||
|
|
|
|||
| Net Assets Consist of: |
||||
| Paid in surplus |
$ | 3,880,866,966 | ||
| Distributable earnings (Accumulated losses) |
(242,390,931 | ) | ||
|
|
|
|||
| Net Assets |
$ | 3,638,476,035 | ||
|
|
|
|||
| Net Assets |
||||
| Class A |
$ | 59,706,439 | ||
| Class B |
3,578,769,596 | |||
| Capital Shares Outstanding* |
||||
| Class A |
6,178,245 | |||
| Class B |
375,386,964 | |||
| Net Asset Value, Offering Price and Redemption Price Per Share |
||||
| Class A |
$ | 9.66 | ||
| Class B |
9.53 |
| * | The Portfolio is authorized to issue an unlimited number of shares. | |||
| (a) | Identified cost of affiliated investments was $3,913,792,714. | |||
Statement of Operations
Year Ended December 31, 2023
| Investment Income |
||||
| Dividends from affiliated investments |
$ | 93,977,561 | ||
|
|
|
|||
| Total investment income |
93,977,561 | |||
| Expenses |
||||
| Management fees |
2,218,259 | |||
| Administration fees |
30,250 | |||
| Custodian and accounting fees |
27,625 | |||
| Distribution and service fees—Class B |
9,067,394 | |||
| Audit and tax services |
35,076 | |||
| Legal |
46,604 | |||
| Trustees’ fees and expenses |
46,220 | |||
| Miscellaneous |
13,561 | |||
|
|
|
|||
| Total expenses |
11,484,989 | |||
|
|
|
|||
| Net Investment Income |
82,492,572 | |||
|
|
|
|||
| Net Realized and Unrealized Gain (Loss) |
||||
| Net realized gain (loss) on: | ||||
| Affiliated investments |
(91,785,643 | ) | ||
| Capital gain distributions from affiliated investments |
94,047,279 | |||
|
|
|
|||
| Net realized gain (loss) |
2,261,636 | |||
|
|
|
|||
| Net change in unrealized appreciation on affiliated investments |
285,025,927 | |||
|
|
|
|||
| Net realized and unrealized gain (loss) |
287,287,563 | |||
|
|
|
|||
| Net Increase (Decrease) in Net Assets From Operations |
$ | 369,780,135 | ||
|
|
|
See accompanying notes to financial statements.
BHFTII-6
Brighthouse Funds Trust II
Brighthouse Asset Allocation 40 Portfolio
Statements of Changes in Net Assets
| Year Ended December 31, 2023 |
Year Ended December 31, 2022 |
|||||||
| Increase (Decrease) in Net Assets: |
||||||||
| From Operations |
||||||||
| Net investment income (loss) |
$ | 82,492,572 | $ | 101,969,680 | ||||
| Net realized gain (loss) |
2,261,636 | 213,876,496 | ||||||
| Net change in unrealized appreciation (depreciation) |
285,025,927 | (988,037,005 | ) | |||||
|
|
|
|
|
|||||
| Increase (decrease) in net assets from operations |
369,780,135 | (672,190,829 | ) | |||||
|
|
|
|
|
|||||
| From Distributions to Shareholders |
||||||||
| Class A |
(5,241,886 | ) | (5,460,511 | ) | ||||
| Class B |
(315,438,785 | ) | (332,950,156 | ) | ||||
|
|
|
|
|
|||||
| Total distributions |
(320,680,671 | ) | (338,410,667 | ) | ||||
|
|
|
|
|
|||||
| Increase (decrease) in net assets from capital share transactions |
(192,207,553 | ) | (225,146,277 | ) | ||||
|
|
|
|
|
|||||
| Total increase (decrease) in net assets |
(143,108,089 | ) | (1,235,747,773 | ) | ||||
| Net Assets |
||||||||
| Beginning of period |
3,781,584,124 | 5,017,331,897 | ||||||
|
|
|
|
|
|||||
| End of period |
$ | 3,638,476,035 | $ | 3,781,584,124 | ||||
|
|
|
|
|
|||||
Other Information:
Capital Shares
Transactions in capital shares were as follows:
| Year Ended December 31, 2023 |
Year Ended December 31, 2022 |
|||||||||||||||
| Shares | Value | Shares | Value | |||||||||||||
| Class A |
||||||||||||||||
| Sales |
415,259 | $ | 3,988,606 | 246,521 | $ | 2,578,682 | ||||||||||
| Reinvestments |
571,012 | 5,241,886 | 572,981 | 5,460,511 | ||||||||||||
| Redemptions |
(1,123,741 | ) | (10,704,277 | ) | (854,544 | ) | (8,693,683 | ) | ||||||||
|
|
|
|
|
|
|
|
|
|||||||||
| Net increase (decrease) |
(137,470 | ) | $ | (1,473,785 | ) | (35,042 | ) | $ | (654,490 | ) | ||||||
|
|
|
|
|
|
|
|
|
|||||||||
| Class B |
||||||||||||||||
| Sales |
4,961,476 | $ | 47,298,754 | 3,574,700 | $ | 36,098,792 | ||||||||||
| Reinvestments |
34,778,256 | 315,438,785 | 35,345,027 | 332,950,156 | ||||||||||||
| Redemptions |
(59,092,822 | ) | (553,471,307 | ) | (58,011,666 | ) | (593,540,735 | ) | ||||||||
|
|
|
|
|
|
|
|
|
|||||||||
| Net increase (decrease) |
(19,353,090 | ) | $ | (190,733,768 | ) | (19,091,939 | ) | $ | (224,491,787 | ) | ||||||
|
|
|
|
|
|
|
|
|
|||||||||
| Increase (decrease) derived from capital shares transactions |
$ | (192,207,553 | ) | $ | (225,146,277 | ) | ||||||||||
|
|
|
|
|
|||||||||||||
See accompanying notes to financial statements.
BHFTII-7
Brighthouse Funds Trust II
Brighthouse Asset Allocation 40 Portfolio
Financial Highlights
| Selected per share data | ||||||||||||||||||||
| Class A | ||||||||||||||||||||
| Year Ended December 31, | ||||||||||||||||||||
| 2023 | 2022 | 2021 | 2020 | 2019 | ||||||||||||||||
| Net Asset Value, Beginning of Period |
$ | 9.55 | $ | 12.09 | $ | 11.98 | $ | 11.66 | $ | 10.85 | ||||||||||
|
|
|
|
|
|
|
|
|
|
|
|||||||||||
| Income (Loss) from Investment Operations |
||||||||||||||||||||
| Net investment income (loss) (a) |
0.23 | 0.28 | 0.19 | 0.32 | 0.31 | |||||||||||||||
| Net realized and unrealized gain (loss) |
0.76 | (1.93 | ) | 0.71 | 0.88 | 1.37 | ||||||||||||||
|
|
|
|
|
|
|
|
|
|
|
|||||||||||
| Total income (loss) from investment operations |
0.99 | (1.65 | ) | 0.90 | 1.20 | 1.68 | ||||||||||||||
|
|
|
|
|
|
|
|
|
|
|
|||||||||||
| Less Distributions |
||||||||||||||||||||
| Distributions from net investment income |
(0.37 | ) | (0.31 | ) | (0.36 | ) | (0.34 | ) | (0.29 | ) | ||||||||||
| Distributions from net realized capital gains |
(0.51 | ) | (0.58 | ) | (0.43 | ) | (0.54 | ) | (0.58 | ) | ||||||||||
|
|
|
|
|
|
|
|
|
|
|
|||||||||||
| Total distributions |
(0.88 | ) | (0.89 | ) | (0.79 | ) | (0.88 | ) | (0.87 | ) | ||||||||||
|
|
|
|
|
|
|
|
|
|
|
|||||||||||
| Net Asset Value, End of Period |
$ | 9.66 | $ | 9.55 | $ | 12.09 | $ | 11.98 | $ | 11.66 | ||||||||||
|
|
|
|
|
|
|
|
|
|
|
|||||||||||
| Total Return (%) (b) |
10.82 | (13.63 | ) | 7.68 | 11.31 | 15.94 | ||||||||||||||
| Ratios/Supplemental Data |
||||||||||||||||||||
| Ratio of expenses to average net assets (%) (c) |
0.07 | 0.06 | 0.06 | 0.06 | 0.06 | |||||||||||||||
| Ratio of net investment income (loss) to average net assets (%) (d) |
2.47 | 2.67 | 1.60 | 2.88 | 2.69 | |||||||||||||||
| Portfolio turnover rate (%) |
6 | 10 | 7 | 9 | 11 | |||||||||||||||
| Net assets, end of period (in millions) |
$ | 59.7 | $ | 60.3 | $ | 76.8 | $ | 75.7 | $ | 74.5 | ||||||||||
| Class B | ||||||||||||||||||||
| Year Ended December 31, | ||||||||||||||||||||
| 2023 | 2022 | 2021 | 2020 | 2019 | ||||||||||||||||
| Net Asset Value, Beginning of Period |
$ | 9.43 | $ | 11.94 | $ | 11.84 | $ | 11.53 | $ | 10.74 | ||||||||||
|
|
|
|
|
|
|
|
|
|
|
|||||||||||
| Income (Loss) from Investment Operations |
||||||||||||||||||||
| Net investment income (loss) (a) |
0.21 | 0.25 | 0.16 | 0.29 | 0.27 | |||||||||||||||
| Net realized and unrealized gain (loss) |
0.74 | (1.90 | ) | 0.70 | 0.87 | 1.35 | ||||||||||||||
|
|
|
|
|
|
|
|
|
|
|
|||||||||||
| Total income (loss) from investment operations |
0.95 | (1.65 | ) | 0.86 | 1.16 | 1.62 | ||||||||||||||
|
|
|
|
|
|
|
|
|
|
|
|||||||||||
| Less Distributions |
||||||||||||||||||||
| Distributions from net investment income |
(0.34 | ) | (0.28 | ) | (0.33 | ) | (0.31 | ) | (0.25 | ) | ||||||||||
| Distributions from net realized capital gains |
(0.51 | ) | (0.58 | ) | (0.43 | ) | (0.54 | ) | (0.58 | ) | ||||||||||
|
|
|
|
|
|
|
|
|
|
|
|||||||||||
| Total distributions |
(0.85 | ) | (0.86 | ) | (0.76 | ) | (0.85 | ) | (0.83 | ) | ||||||||||
|
|
|
|
|
|
|
|
|
|
|
|||||||||||
| Net Asset Value, End of Period |
$ | 9.53 | $ | 9.43 | $ | 11.94 | $ | 11.84 | $ | 11.53 | ||||||||||
|
|
|
|
|
|
|
|
|
|
|
|||||||||||
| Total Return (%) (b) |
10.52 | (13.84 | ) | 7.42 | 11.04 | 15.60 | ||||||||||||||
| Ratios/Supplemental Data |
||||||||||||||||||||
| Ratio of expenses to average net assets (%) (c) |
0.32 | 0.31 | 0.31 | 0.31 | 0.31 | |||||||||||||||
| Ratio of net investment income (loss) to average net assets (%) (d) |
2.23 | 2.42 | 1.34 | 2.63 | 2.44 | |||||||||||||||
| Portfolio turnover rate (%) |
6 | 10 | 7 | 9 | 11 | |||||||||||||||
| Net assets, end of period (in millions) |
$ | 3,578.8 | $ | 3,721.3 | $ | 4,940.6 | $ | 5,241.0 | $ | 5,311.0 | ||||||||||
| (a) | Per share amounts based on average shares outstanding during the period. | |||
| (b) | Total return does not reflect any insurance, sales, separate account or administrative charges of variable annuity or life insurance contracts or any additional expenses that contract owners may bear under their variable contracts. If these charges were included, the returns would be lower. | |||
| (c) | The ratio of operating expenses to average net assets does not include expenses of the Underlying Portfolios in which the Asset Allocation Portfolio invests. | |||
| (d) | Recognition of net investment income by the Asset Allocation Portfolio is affected by the timing of the declaration of dividends by the Underlying Portfolios in which it invests. | |||
See accompanying notes to financial statements.
BHFTII-8
Brighthouse Funds Trust II
Brighthouse Asset Allocation 40 Portfolio
Notes to Financial Statements—December 31, 2023
1. Organization
Brighthouse Funds Trust II (the “Trust”) is organized as a Delaware statutory trust and registered under the Investment Company Act of 1940, as amended (the “1940 Act”), as an open-end management investment company. The Trust, which is managed by Brighthouse Investment Advisers, LLC (“Brighthouse Investment Advisers” or the “Adviser”), currently offers twenty-nine series (the “Portfolios”), each of which operates as a distinct investment vehicle of the Trust. The series included in this report is Brighthouse Asset Allocation 40 Portfolio (the “Asset Allocation Portfolio”), which is diversified. The Asset Allocation Portfolio operates under a “fund of funds” structure, investing substantially all of its assets in other Portfolios advised by Brighthouse Investment Advisers (each, an “Underlying Portfolio,” and, collectively, the “Underlying Portfolios”). Shares of the Portfolio are not offered directly to the general public and are currently available only to separate accounts of insurance companies, including insurance companies affiliated with the Adviser.
The Asset Allocation Portfolio has registered and offers two classes of shares: Class A and B shares. Shares of each class of the Asset Allocation Portfolio represent an equal pro rata interest in the Asset Allocation Portfolio and generally give the shareholder the same voting, dividend, liquidation, and other rights. Investment income, realized and unrealized capital gains and losses, the common expenses of the Asset Allocation Portfolio, and certain Asset Allocation Portfolio-level expense reductions, if any, are allocated on a pro rata basis to each class based on the relative net assets of each class to the net assets of the Asset Allocation Portfolio. Each class of shares differs in its respective distribution plan and such distribution expenses are allocated to the corresponding class of shares.
2. Significant Accounting Policies
The preparation of financial statements in conformity with accounting principles generally accepted in the United States of America (“GAAP”) requires management to make estimates and assumptions that affect the reported amounts of assets and liabilities and disclosure of contingent assets and liabilities as of the date of the financial statements and the reported amounts of income and expenses during the reporting period. Actual results could differ from those estimates. In the preparation of these financial statements, management has evaluated events and transactions subsequent to December 31, 2023 through the date the financial statements were issued.
The Asset Allocation Portfolio is an investment company and follows the accounting and reporting guidance of the Financial Accounting Standards Board (“FASB”) Accounting Standards Codification Topic 946—Financial Services—Investment Companies. The following is a summary of significant accounting policies consistently followed by the Asset Allocation Portfolio in the preparation of its financial statements.
Investment Valuation and Fair Value Measurements - The Asset Allocation Portfolio values its investments for purposes of calculating its net asset value (“NAV”) using procedures that allow for a variety of methodologies to be used to value the Asset Allocation Portfolio’s investments. The specific methodology used for an investment may vary based on the market data available for a specific investment at the time the Asset Allocation Portfolio calculates its NAV or based on other considerations. The procedures also permit a level of judgment to be used in the valuation process.
Investments in the Underlying Portfolios are valued at their closing daily NAV on the valuation date. Investments in the Underlying Portfolios are categorized as Level 1 within the fair value hierarchy. For information about the use of fair value pricing by the Underlying Portfolios, please refer to the prospectuses of the Underlying Portfolios.
Investment Transactions and Related Investment Income - The Asset Allocation Portfolio’s security transactions are recorded on the trade date. Dividend income is recorded on the ex-dividend date. Interest income is recorded on the accrual basis. Realized gains and losses on investments and unrealized appreciation and depreciation are determined on the identified cost basis, which is the same basis used for federal income tax purposes. Capital gains distributions received from the Underlying Portfolios are recorded as net realized gain in the Statement of Operations.
Dividends and Distributions to Shareholders - The Asset Allocation Portfolio records dividends and distributions on the ex-dividend date. Net realized gains from securities transactions (if any) are generally distributed annually to shareholders. The timing and characterization of certain income and capital gains distributions are determined in accordance with federal tax regulations that may differ from GAAP. Permanent book and tax basis differences relating to shareholder distributions will result in reclassification between distributable earnings (accumulated losses) and paid in surplus. These adjustments have no impact on net assets or the results of operations.
Income Taxes - It is the Asset Allocation Portfolio’s policy to comply with the requirements of the Internal Revenue Code of 1986, as amended, and regulations thereunder, applicable to regulated investment companies, and to distribute, with respect to each taxable year, all of its taxable income to shareholders. Therefore, no federal income tax provision is required. The Asset Allocation Portfolio files U.S. federal tax returns. No income tax returns are currently under examination. The Asset Allocation Portfolio’s federal tax returns remain subject to examination by the Internal Revenue Service for three fiscal years after the returns are filed. As of December 31, 2023, the Asset Allocation Portfolio had no uncertain tax positions that would require financial statement recognition, derecognition or disclosure.
BHFTII-9
Brighthouse Funds Trust II
Brighthouse Asset Allocation 40 Portfolio
Notes to Financial Statements—December 31, 2023—(Continued)
3. Certain Risks
In the normal course of business, the Underlying Portfolios invest in securities and enter into transactions where risks exist. Those risks include:
Market Risk: The value of securities held by the Underlying Portfolios may decline in response to certain events, including those directly involving the issuers whose securities are owned by the Underlying Portfolios; conditions affecting the general economy; overall market changes; local, regional or global political, social or economic instability; currency, interest rate, and price fluctuations, or other factors including terrorism, war, natural disasters and the spread of infectious illness including epidemics or pandemics such as the COVID-19 pandemic. These events may also adversely affect the liquidity of securities held by the Underlying Portfolios.
Credit and Counterparty Risk: The Underlying Portfolios may be exposed to counterparty risk, or the risk that an entity with which the Underlying Portfolios have unsettled or open transactions may default. The potential loss could exceed the value of the financial assets and liabilities recorded in the financial statements. Financial assets that potentially expose the Underlying Portfolios to credit and counterparty risk consist principally of cash due from counterparties and investments. The Underlying Portfolios manage counterparty risk by entering into agreements only with counterparties that they believe have the financial resources to honor their obligations and by monitoring the financial stability of those counterparties. The Subadviser may attempt to mitigate counterparty risk by (i) periodically assessing the creditworthiness of their trading partners, (ii) monitoring and/or limiting the amount of their net exposure to each individual counterparty based on the adviser’s assessment, and (iii) requiring collateral from the counterparty for certain transactions. In order to preserve certain safeguards for non-standard settlement trades, the Underlying Portfolios restrict their exposure to credit and counterparty losses by entering into master netting agreements (“Master Agreements”) with counterparties (approved brokers) with whom the Underlying Portfolios undertake a significant volume of transactions. Master Agreements govern the terms of certain transactions and reduce the counterparty risk associated with relevant transactions by specifying credit protection mechanisms and providing standardization that improves legal certainty. Master Agreements can also help limit counterparty risk by specifying collateral posting arrangements at pre-arranged exposure levels.
The Asset Allocation Portfolio’s prospectus includes a discussion of the principal risks of investing in the Asset Allocation Portfolio and in the Underlying Portfolios in which it invests.
4. Investment Transactions
Aggregate cost of purchases and proceeds of sales of shares of the Underlying Portfolios by the Asset Allocation Portfolio, for the year ended December 31, 2023 were as follows:
| Purchases |
Sales | |||||||||||
| U.S. Government |
Non-U.S. Government | U.S. Government | Non-U.S. Government | |||||||||
| $0 | $ | 221,397,164 | $ | 0 | $ | 557,809,284 | ||||||
5. Investment Management Fees and Other Transactions with Affiliates
Investment Management Agreement - Brighthouse Investment Advisers is the investment adviser to the Asset Allocation Portfolio. The Trust has entered into an investment management agreement with Brighthouse Investment Advisers with respect to the Asset Allocation Portfolio. For providing investment management services to the Asset Allocation Portfolio, Brighthouse Investment Advisers receives monthly compensation at the following annual rates:
|
Management |
% per annum | Average Daily Net Assets | ||||
| $2,218,259 | 0.100 | % | Of the first $500 million | |||
| 0.075 | % | Of the next $500 million | ||||
| 0.050 | % | On amounts in excess of $1 billion | ||||
In addition to the above management fee paid to Brighthouse Investment Advisers, the Asset Allocation Portfolio indirectly pays Brighthouse Investment Advisers an investment advisory fee through its investments in the Underlying Portfolios.
Certain officers and trustees of the Trust may also be officers of the Adviser however, such officers and trustees receive no compensation from the Trust.
Transfer Agency Agreement - Brighthouse Life Insurance Company serves as the transfer agent for the Trust. Brighthouse Life Insurance Company receives no fees for its services to the Trust.
BHFTII-10
Brighthouse Funds Trust II
Brighthouse Asset Allocation 40 Portfolio
Notes to Financial Statements—December 31, 2023—(Continued)
Distribution and Service Fees - The Trust has a distribution agreement with Brighthouse Securities, LLC (the “Distributor”) pursuant to which the Distributor serves as the general distributor of shares of each class (each a “Class”) of each Portfolio. The Distributor is an affiliate of the Trust. The Trust has adopted a Distribution and Services Plan (the “D&S Plan”) relating to Class B, Class D, Class E, Class F and Class G shares of each Portfolio, under Rule 12b-1 under the 1940 Act, pursuant to which the Trust may pay the Distributor a fee (the “Service Fee”) at an annual rate not to exceed 0.25% of each such Portfolio’s average daily net assets attributable to the Class B, Class D, Class E, Class F and Class G shares of the Trust. Each Portfolio may not offer shares of each Class. The D&S Plan also authorizes the Trust, on behalf of each of its Portfolios, to pay to the Distributor a distribution fee (the “Distribution Fee” and together with the Service Fee, the “Fees”) at an annual rate of up to 0.25% of each Portfolio’s average daily net assets attributable to the Class B, Class D, Class E, Class F, and Class G shares in consideration of the services rendered in connection with the sale of such shares by the Distributor. Under the Distribution Agreement with respect to the Trust, Fees are currently paid at an annual rate of 0.25% of average daily net assets in the case of Class B shares, 0.10% of average daily net assets in the case of Class D shares, 0.15% of average daily net assets in the case of Class E shares, 0.20% of average daily net assets in the case of Class F shares and 0.30% of average daily net assets in the case of Class G shares. The D&S Plan is known as a “compensation plan” because the Trust makes payments to the Distributor for services rendered regardless of the actual level of expenditures by the Distributor. Amounts incurred by the Portfolio for the year ended December 31, 2023 are shown as Distribution and service fees in the Statement of Operations.
Deferred Trustee Compensation - Each Trustee who is not currently an employee of the Adviser or any of its affiliates receives compensation from the Trust for his or her service to the Trust. A deferred compensation plan (the “Plan”) is available to the Trustees on a voluntary basis. Deferred amounts remain in the Trust until distributed in accordance with the provisions of the Plan. The value of a participating Trustee’s deferral account is based on theoretical investments of deferred amounts on the normal payment dates in certain portfolios of the Trust or Brighthouse Funds Trust I, an affiliate of the Trust, as designated by the participating Trustee. Changes in the value of participants’ deferral accounts are reflected as a component of Trustees’ fees and expenses in the Statement of Operations. The portion of the accrued obligations allocated to the Portfolio under the Plan is reflected as Deferred trustees’ fees in the Statement of Assets and Liabilities.
6. Transactions in Securities of Affiliated Issuers
The Asset Allocation Portfolio does not invest in the Underlying Portfolios for the purpose of exercising control; however, investments by the Asset Allocation Portfolio within its principal investment strategies may represent a significant portion of the Underlying Portfolios’ net assets. Transactions in the Underlying Portfolios for the year ended December 31, 2023 were as follows:
| Security Description |
Market Value December 31, 2022 |
Purchases | Sales | Realized Gain/(Loss) |
Change in Unrealized Appreciation/ (Depreciation) |
Ending Value as of December 31, 2023 |
||||||||||||||||||
| AB International Bond Portfolio (Class A) |
$ | 133,583,365 | $ | 6,829,891 | $ | (17,017,226 | ) | $ | (5,332,953 | ) | $ | 9,798,166 | $ | 127,861,243 | ||||||||||
| Allspring Mid Cap Value Portfolio (Class A) |
9,526,484 | 1,541,534 | (1,370,874 | ) | 115,324 | (648,718 | ) | 9,163,750 | ||||||||||||||||
| Baillie Gifford International Stock Portfolio (Class A) |
103,687,984 | 1,842,455 | (30,150,555 | ) | (3,455,904 | ) | 19,936,004 | 91,859,984 | ||||||||||||||||
| BlackRock Bond Income Portfolio (Class A) |
361,877,370 | 11,190,236 | (34,960,857 | ) | (7,877,883 | ) | 16,438,507 | 346,667,373 | ||||||||||||||||
| BlackRock Capital Appreciation Portfolio (Class A) |
61,609,306 | 1,313,483 | (24,081,490 | ) | (5,844,510 | ) | 31,019,326 | 64,016,115 | ||||||||||||||||
| BlackRock High Yield Portfolio (Class A) |
18,972,342 | 10,166,869 | (3,235,055 | ) | (567,282 | ) | 2,113,011 | 27,449,885 | ||||||||||||||||
| Brighthouse Small Cap Value Portfolio (Class A) |
46,920,769 | 6,430,136 | (10,060,723 | ) | 1,925,675 | 123,770 | 45,339,627 | |||||||||||||||||
| Brighthouse/abrdn Emerging Markets Equity Portfolio (Class A) |
28,442,571 | 494,532 | (3,160,921 | ) | 454,187 | 1,084,235 | 27,314,604 | |||||||||||||||||
| Brighthouse/Artisan International Portfolio (Class A) |
66,707,754 | 1,183,483 | (11,527,673 | ) | (682,243 | ) | 8,587,691 | 64,269,012 | ||||||||||||||||
| Brighthouse/Artisan Mid Cap Value Portfolio (Class A) |
9,305,872 | 1,412,743 | (1,887,030 | ) | 42,140 | 280,093 | 9,153,818 | |||||||||||||||||
| Brighthouse/Eaton Vance Floating Rate Portfolio (Class A) |
75,905,148 | 3,880,823 | (21,748,033 | ) | (1,192,067 | ) | 4,569,046 | 61,414,917 | ||||||||||||||||
| Brighthouse/Franklin Low Duration Total Return Portfolio (Class A) |
114,130,802 | 4,268,044 | (14,831,158 | ) | (2,359,643 | ) | 4,421,311 | 105,629,356 | ||||||||||||||||
| Brighthouse/Templeton International Bond Portfolio (Class A) |
95,512,235 | 39,050 | (6,923,716 | ) | (3,404,031 | ) | 6,636,376 | 91,859,914 | ||||||||||||||||
| Brighthouse/Wellington Core Equity Opportunities Portfolio (Class A) |
124,065,411 | 14,737,364 | (14,298,208 | ) | (127,955 | ) | (5,783,919 | ) | 118,592,693 | |||||||||||||||
| Brighthouse/Wellington Large Cap Research Portfolio (Class A) |
84,947,422 | 5,282,870 | (21,759,885 | ) | (1,044,754 | ) | 15,170,198 | 82,595,851 | ||||||||||||||||
| CBRE Global Real Estate Portfolio (Class A) |
28,490,412 | 1,279,730 | (5,102,352 | ) | (705,684 | ) | 3,398,464 | 27,360,570 | ||||||||||||||||
| Harris Oakmark International Portfolio (Class A) |
104,476,162 | 3,562,327 | (24,117,863 | ) | (4,084,554 | ) | 21,091,586 | 100,927,658 | ||||||||||||||||
| Invesco Comstock Portfolio (Class A) |
123,850,607 | 25,711,794 | (20,789,643 | ) | (4,000,641 | ) | (5,688,751 | ) | 119,083,366 | |||||||||||||||
| Invesco Global Equity Portfolio (Class A) |
37,314,772 | 2,287,602 | (12,039,817 | ) | 1,602,284 | 7,528,796 | 36,693,637 | |||||||||||||||||
| Invesco Small Cap Growth Portfolio (Class A) |
18,477,079 | 261,297 | (2,782,190 | ) | (2,110,017 | ) | 4,350,187 | 18,196,356 | ||||||||||||||||
| Jennison Growth Portfolio (Class A) |
42,706,490 | 46,338 | (17,000,097 | ) | (4,542,083 | ) | 24,451,395 | 45,662,043 | ||||||||||||||||
| JPMorgan Core Bond Portfolio (Class A) |
142,884,002 | 4,367,947 | (14,147,498 | ) | (2,181,806 | ) | 5,787,657 | 136,710,302 | ||||||||||||||||
| JPMorgan Small Cap Value Portfolio (Class A) |
27,823,369 | 4,185,387 | (5,791,804 | ) | (2,655,161 | ) | 3,607,767 | 27,169,558 | ||||||||||||||||
| Loomis Sayles Growth Portfolio (Class A) |
36,886,768 | 2,143,045 | (16,436,295 | ) | (2,577,480 | ) | 16,563,986 | 36,580,024 | ||||||||||||||||
| Loomis Sayles Small Cap Growth Portfolio (Class A) |
9,426,843 | 159,988 | (1,629,195 | ) | (362,409 | ) | 1,463,048 | 9,058,275 | ||||||||||||||||
| MFS Research International Portfolio (Class A) |
57,031,204 | 8,829,183 | (6,562,884 | ) | 1,429,660 | 3,574,677 | 64,301,840 | |||||||||||||||||
| MFS Value Portfolio (Class A) |
143,147,343 | 20,118,810 | (16,929,173 | ) | (1,750,507 | ) | (6,853,911 | ) | 137,732,562 | |||||||||||||||
BHFTII-11
Brighthouse Funds Trust II
Brighthouse Asset Allocation 40 Portfolio
Notes to Financial Statements—December 31, 2023—(Continued)
| Security Description |
Market Value December 31, 2022 |
Purchases | Sales | Realized Gain/(Loss) |
Change in Unrealized Appreciation/ (Depreciation) |
Ending Value as of December 31, 2023 |
||||||||||||||||||
| Neuberger Berman Genesis Portfolio (Class A) |
$ | 18,494,073 | $ | 1,845,311 | $ | (3,360,465 | ) | $ | (108,090 | ) | $ | 1,229,799 | $ | 18,100,628 | ||||||||||
| PIMCO Inflation Protected Bond Portfolio (Class A) |
227,954,341 | 5,094,555 | (38,752,276 | ) | (8,509,299 | ) | 11,339,261 | 197,126,582 | ||||||||||||||||
| PIMCO Total Return Portfolio (Class A) |
343,295,896 | 12,823,146 | (19,063,498 | ) | (4,319,787 | ) | 14,370,498 | 347,106,255 | ||||||||||||||||
| SSGA Emerging Markets Enhanced Index Portfolio (Class A) |
28,541,428 | 968,816 | (4,596,311 | ) | (249,410 | ) | 2,759,619 | 27,424,142 | ||||||||||||||||
| T. Rowe Price Large Cap Growth Portfolio (Class A) |
51,075,483 | 415,173 | (18,193,250 | ) | (5,122,482 | ) | 26,563,457 | 54,738,381 | ||||||||||||||||
| T. Rowe Price Large Cap Value Portfolio (Class A) |
133,606,976 | 23,783,341 | (19,167,298 | ) | (4,858,667 | ) | (4,842,562 | ) | 128,521,790 | |||||||||||||||
| T. Rowe Price Mid Cap Growth Portfolio (Class A) |
18,816,635 | 962,017 | (4,049,699 | ) | (589,172 | ) | 3,151,544 | 18,291,325 | ||||||||||||||||
| T. Rowe Price Small Cap Growth Portfolio (Class A) |
47,006,077 | 1,544,061 | (11,355,395 | ) | (4,020,421 | ) | 12,225,798 | 45,400,120 | ||||||||||||||||
| TCW Core Fixed Income Portfolio (Class A) |
275,726,126 | 8,426,782 | (26,026,230 | ) | (3,930,880 | ) | 10,845,632 | 265,041,430 | ||||||||||||||||
| VanEck Global Natural Resources Portfolio (Class A) |
73,093,724 | 4,916,871 | (4,826,959 | ) | 1,216,353 | (5,733,946 | ) | 68,666,043 | ||||||||||||||||
| Western Asset Management Strategic Bond Opportunities Portfolio (Class A) |
152,375,575 | 9,893,507 | (19,040,052 | ) | (5,049,397 | ) | 8,447,908 | 146,627,541 | ||||||||||||||||
| Western Asset Management U.S. Government Portfolio (Class A) |
305,168,572 | 7,156,623 | (29,035,636 | ) | (4,954,094 | ) | 11,648,921 | 289,984,386 | ||||||||||||||||
|
|
|
|
|
|
|
|
|
|
|
|
|
|||||||||||||
| $ | 3,782,864,792 | $ | 221,397,164 | $ | (557,809,284 | ) | $ | (91,785,643 | ) | $ | 285,025,927 | $ | 3,639,692,956 | |||||||||||
|
|
|
|
|
|
|
|
|
|
|
|
|
|||||||||||||
| Security Description |
Capital Gain Distributions from Affiliated Investments |
Income earned from affiliates during the period |
Number of shares held at December 31, 2023 |
|||||||||
| AB International Bond Portfolio (Class A) |
$ | — | $ | 6,799,817 | 16,022,712 | |||||||
| Allspring Mid Cap Value Portfolio (Class A) |
1,268,751 | 120,141 | 816,006 | |||||||||
| Baillie Gifford International Stock Portfolio (Class A) |
— | 1,191,801 | 8,773,637 | |||||||||
| BlackRock Bond Income Portfolio (Class A) |
— | 11,067,544 | 3,757,505 | |||||||||
| BlackRock Capital Appreciation Portfolio (Class A) |
1,256,707 | 27,183 | 1,766,449 | |||||||||
| BlackRock High Yield Portfolio (Class A) |
— | 1,506,471 | 3,724,543 | |||||||||
| Brighthouse Small Cap Value Portfolio (Class A) |
3,903,525 | 586,870 | 3,227,020 | |||||||||
| Brighthouse/abrdn Emerging Markets Equity Portfolio (Class A) |
— | 351,964 | 3,093,387 | |||||||||
| Brighthouse/Artisan International Portfolio (Class A) |
— | 1,143,272 | 6,245,774 | |||||||||
| Brighthouse/Artisan Mid Cap Value Portfolio (Class A) |
1,212,052 | 79,904 | 42,112 | |||||||||
| Brighthouse/Eaton Vance Floating Rate Portfolio (Class A) |
— | 3,784,440 | 6,191,020 | |||||||||
| Brighthouse/Franklin Low Duration Total Return Portfolio (Class A) |
— | 4,102,816 | 12,016,992 | |||||||||
| Brighthouse/Templeton International Bond Portfolio (Class A) |
— | — | 11,701,900 | |||||||||
| Brighthouse/Wellington Core Equity Opportunities Portfolio (Class A) |
12,882,159 | 1,744,962 | 4,158,229 | |||||||||
| Brighthouse/Wellington Large Cap Research Portfolio (Class A) |
4,575,720 | 697,991 | 5,976,545 | |||||||||
| CBRE Global Real Estate Portfolio (Class A) |
— | 767,931 | 2,595,879 | |||||||||
| Harris Oakmark International Portfolio (Class A) |
— | 2,157,299 | 7,692,657 | |||||||||
| Invesco Comstock Portfolio (Class A) |
21,455,304 | 2,716,078 | 9,347,203 | |||||||||
| Invesco Global Equity Portfolio (Class A) |
2,129,363 | 137,646 | 1,532,733 | |||||||||
| Invesco Small Cap Growth Portfolio (Class A) |
— | — | 2,219,068 | |||||||||
| Jennison Growth Portfolio (Class A) |
— | — | 3,186,465 | |||||||||
| JPMorgan Core Bond Portfolio (Class A) |
— | 4,313,068 | 15,072,801 | |||||||||
| JPMorgan Small Cap Value Portfolio (Class A) |
2,362,337 | 382,069 | 2,406,515 | |||||||||
| Loomis Sayles Growth Portfolio (Class A) |
2,134,278 | — | 2,358,480 | |||||||||
| Loomis Sayles Small Cap Growth Portfolio (Class A) |
— | — | 852,945 | |||||||||
| MFS Research International Portfolio (Class A) |
1,197,874 | 1,073,419 | 5,314,202 | |||||||||
| MFS Value Portfolio (Class A) |
16,748,114 | 2,650,439 | 9,894,581 | |||||||||
| Neuberger Berman Genesis Portfolio (Class A) |
1,628,938 | 23,984 | 980,002 | |||||||||
| PIMCO Inflation Protected Bond Portfolio (Class A) |
— | 4,891,374 | 20,750,166 | |||||||||
| PIMCO Total Return Portfolio (Class A) |
— | 10,606,508 | 34,990,550 | |||||||||
| SSGA Emerging Markets Enhanced Index Portfolio (Class A) |
— | 934,145 | 2,806,975 | |||||||||
| T. Rowe Price Large Cap Growth Portfolio (Class A) |
— | — | 2,644,366 | |||||||||
| T. Rowe Price Large Cap Value Portfolio (Class A) |
19,251,819 | 2,762,019 | 4,877,487 | |||||||||
| T. Rowe Price Mid Cap Growth Portfolio (Class A) |
928,683 | — | 1,923,378 | |||||||||
| T. Rowe Price Small Cap Growth Portfolio (Class A) |
1,111,655 | 25,438 | 2,281,413 | |||||||||
| TCW Core Fixed Income Portfolio (Class A) |
— | 8,323,962 | 29,746,513 | |||||||||
| VanEck Global Natural Resources Portfolio (Class A) |
— | 2,191,040 | 5,775,109 | |||||||||
| Western Asset Management Strategic Bond Opportunities Portfolio (Class A) |
— | 9,875,722 | 13,366,230 | |||||||||
| Western Asset Management U.S. Government Portfolio (Class A) |
— | 6,940,244 | 27,512,750 | |||||||||
|
|
|
|
|
|||||||||
| $ | 94,047,279 | $ | 93,977,561 | |||||||||
|
|
|
|
|
|||||||||
BHFTII-12
Brighthouse Funds Trust II
Brighthouse Asset Allocation 40 Portfolio
Notes to Financial Statements—December 31, 2023—(Continued)
7. Contractual Obligations
Under the Trust’s organizational documents, its officers and Trustees may be indemnified against certain liabilities and expenses arising out of the performance of their duties to the Trust. Additionally, the Trust has a variety of indemnification obligations under contracts with its service providers. The Trust’s maximum exposure under these arrangements is unknown, as this would involve future claims that may be made against the Trust that have not yet occurred.
8. Income Tax Information
The cost basis of investments for federal income tax purposes at December 31, 2023 was as follows:
| Cost basis of investments |
$ | 3,970,148,460 | ||
|
|
|
|||
| Gross unrealized appreciation |
76,335,647 | |||
| Gross unrealized (depreciation) |
(406,791,151 | ) | ||
|
|
|
|||
| Net unrealized appreciation (depreciation) |
$ | (330,455,504 | ) | |
|
|
|
The tax character of distributions paid for the years ended December 31, 2023 and 2022 were as follows:
| Ordinary Income |
Long-Term Capital Gain | Total | ||||||||||||||||||
| 2023 |
2022 | 2023 | 2022 | 2023 | 2022 | |||||||||||||||
| $128,146,172 |
$ | 109,123,662 | $ | 192,534,499 | $ | 229,287,005 | $ | 320,680,671 | $ | 338,410,667 | ||||||||||
As of December 31, 2023, the components of distributable earnings (accumulated losses) on a federal income tax basis were as follows:
| Undistributed |
Undistributed Long-Term Capital Gain |
Net Unrealized Appreciation (Depreciation) |
Accumulated Capital Losses |
Total | ||||||||||||
| $82,946,483 |
$ | 5,361,352 | $ | (330,455,504 | ) | $ | — | $ | (242,147,669 | ) | ||||||
The Asset Allocation Portfolio utilizes the provisions of the federal income tax laws that provide for the carryforward of capital losses for prior years, offsetting such losses against any future realized capital gains. Net capital losses may be carried forward indefinitely and their character is retained as short-term and/or long-term losses.
As of December 31, 2023, the Asset Allocation Portfolio had no accumulated capital losses.
9. Regulatory Updates
Effective January 24, 2023, the Securities and Exchange Commission adopted rule and form amendments that require open-end management investment companies to transmit concise and visually engaging annual and semiannual reports to shareholders that highlight certain information deemed by the SEC to be particularly important for investors. Certain other information, including financial statements, will no longer appear in shareholder reports but will, as required, be available online, delivered free of charge upon request, and filed on a semiannual basis on Form N-CSR. The rule and form amendments have a compliance date of July 24, 2024. Accordingly, the rule and form amendments will not impact the Portfolio until its 2024 semiannual shareholder report.
BHFTII-13
Brighthouse Funds Trust II
Brighthouse Asset Allocation 40 Portfolio
Report of Independent Registered Public Accounting Firm
To the Board of Trustees of Brighthouse Funds Trust II and Shareholders of the Brighthouse Asset Allocation 40 Portfolio:
Opinion on the Financial Statements and Financial Highlights
We have audited the accompanying statement of assets and liabilities, including the schedule of investments, of the Brighthouse Asset Allocation 40 Portfolio (the “Fund”) (one of the funds constituting the Brighthouse Funds Trust II), as of December 31, 2023, the related statement of operations for the year then ended, the statements of changes in net assets for each of the two years in the period then ended, the financial highlights for each of the five years in the period then ended, and the related notes. In our opinion, the financial statements and financial highlights present fairly, in all material respects, the financial position of the Fund as of December 31, 2023, and the results of its operations for the year then ended, the changes in its net assets for each of the two years in the period then ended, and the financial highlights for each of the five years in the period then ended in conformity with accounting principles generally accepted in the United States of America.
Basis for Opinion
These financial statements and financial highlights are the responsibility of the Fund’s management. Our responsibility is to express an opinion on the Fund’s financial statements and financial highlights based on our audits. We are a public accounting firm registered with the Public Company Accounting Oversight Board (United States) (PCAOB) and are required to be independent with respect to the Fund in accordance with the U.S. federal securities laws and the applicable rules and regulations of the Securities and Exchange Commission and the PCAOB.
We conducted our audits in accordance with the standards of the PCAOB. Those standards require that we plan and perform the audit to obtain reasonable assurance about whether the financial statements and financial highlights are free of material misstatement, whether due to error or fraud. The Fund is not required to have, nor were we engaged to perform, an audit of its internal control over financial reporting. As part of our audits we are required to obtain an understanding of internal control over financial reporting but not for the purpose of expressing an opinion on the effectiveness of the Fund’s internal control over financial reporting. Accordingly, we express no such opinion.
Our audits included performing procedures to assess the risks of material misstatement of the financial statements and financial highlights, whether due to error or fraud, and performing procedures that respond to those risks. Such procedures included examining, on a test basis, evidence regarding the amounts and disclosures in the financial statements and financial highlights. Our audits also included evaluating the accounting principles used and significant estimates made by management, as well as evaluating the overall presentation of the financial statements and financial highlights. Our procedures included confirmation of securities owned as of December 31, 2023, by correspondence with the transfer agent. We believe that our audits provide a reasonable basis for our opinion.
/s/ Deloitte & Touche LLP
Boston, Massachusetts
February 23, 2024
We have served as the auditor of one or more Brighthouse investment companies since 1983.
BHFTII-14
Brighthouse Funds Trust II
Trustees and Officers
MANAGEMENT OF THE TRUSTS
The Boards of Trustees (the “Board”) of Brighthouse Funds Trust I and Brighthouse Funds Trust II (“Trust I” and “Trust II”, respectively, and collectively the “Trusts”) supervise the Trusts and are responsible for representing the interests of shareholders. The Trustees, the Chairman of the Board and the Chairmen of each subcommittee are the same for both Trusts. The Trustees of each Trust meet periodically throughout the year to oversee the Portfolios’ activities, reviewing, among other things, each Portfolio’s performance and its contractual arrangements with various service providers. The Trustees of each Trust elect the officers of the Trust, who are responsible for administering the Trust’s day-to-day operations.
Trustees and Officers
The Trustees and executive officers of the Trusts, as well as their ages and their principal occupations during the past five years, are set forth below. Unless otherwise indicated, the business address of each is c/o Brighthouse Funds Trust I and Brighthouse Funds Trust II, 11225 N. Community House Rd., Charolette, North Carolina 28277. Each Trustee who is deemed an “interested person,” as such term is defined in the 1940 Act, is referred to as an “Interested Trustee.” Those Trustees who are not “interested persons,” as such term is defined in the 1940 Act, are referred to as “Independent Trustees.” There is no limit to the term a Trustee may serve, other than pursuant to the retirement policy adopted by the Independent Trustees. Trustees serve until their death, resignation, retirement or removal in accordance with Trust I’s and Trust II’s respective organizational documents and policies adopted by the Board of the Trust from time to time. Officers hold office at the pleasure of each Board and serve until their removal or resignation in accordance with the Trusts’ respective organizational documents and policies adopted by the Board of each Trust from time to time.
Trustees of the Trusts
| Name and Year of Birth |
Position(s) |
Term of Office |
Principal Occupation(s) During the Past |
Number of |
Other Directorships Held | |||||
| Interested Trustee | ||||||||||
| John Rosenthal* (1960) |
Trustee | Indefinite; From May 2016 (Trust I and Trust II) to present | Chief Investment Officer, Brighthouse Financial, Inc. (2016 to present). | 73 | None | |||||
| Independent Trustees | ||||||||||
| Dawn M. Vroegop (1966) |
Trustee and Chair of the Board | Indefinite; From December 2000 (Trust I)/May 2009 (Trust II) to present as Trustee; From May 2016 (Trust I and Trust II) until present as Chair | Retired; Private Investor. | 73 | Trustee, Driehaus Mutual Funds (8 portfolios).** | |||||
| Stephen M. Alderman (1959) |
Trustee | Indefinite; From December 2000 (Trust I)/April 2012 (Trust II) to present | Vice President and General Counsel, IHR Aerial Solutions, LLC; Until 2022, General Counsel, Illini Hi-Reach, Inc.; Until 2020, Shareholder in the law firm of Garfield & Merel, Ltd. | 73 | None | |||||
| Robert J. Boulware (1956) |
Trustee | Indefinite; From March 2008 (Trust I)/April 2012 (Trust II) to present | Managing Member, Pilgrim Funds, LLC (private equity fund). | 73 | Trustee, Vertical Capital Income Fund (closed-end fund);** Trustee, The Private Shares Fund (closed-end fund);** Until 2021, Director, Mid-Con Energy Partners, LP (energy);** Until 2020, Director, Gainsco, Inc. (auto insurance).** | |||||
BHFTII-15
Brighthouse Funds Trust II
Trustees and Officers—(Continued)
| Name and Year of Birth |
Position(s) |
Term of Office |
Principal Occupation(s) During the Past |
Number of |
Other Directorships Held | |||||
| Susan C. Gause (1952) |
Trustee | Indefinite; From March 2008 (Trust I)/April 2012 (Trust II) to present | Private Investor. | 73 | Trustee, HSBC Funds (4 portfolios).** | |||||
| Nancy Hawthorne (1951) |
Trustee | Indefinite; From May 2003 (Trust II)/April 2012 (Trust I) to present | Private Investor. | 73 | Trustee, First Eagle Credit Opportunities Fund;** Trustee and Chair of the Board of Trustees, First Eagle Global Opportunities Fund;** Director, Avid Technology, Inc;** Director, CRA International, Inc.** | |||||
Executive Officers of the Trusts
| Name and Year of Birth |
Position(s) |
Term of Office |
Principal Occupation(s) | |||
| Kristi Slavin (1973) | President and Chief Executive Officer, of Trust I and Trust II | From May 2016 (Trust I and Trust II) to present |
President, Brighthouse Investment Advisers, LLC (2016-present). | |||
| Alan R. Otis (1971) | Chief Financial Officer and Treasurer, of Trust I and Trust II | From November 2017 (Trust I and Trust II) to present |
Executive Vice President, Brighthouse Investment Advisers, LLC (2017-present); formerly, Vice President, Brighthouse Investment Advisers, LLC (2012-2017); Assistant Treasurer, Trust I and Trust II (2012-2017). | |||
| Thomas Watterson (1985) | Secretary, of Trust I and Trust II | From November 2023 (Trust I and Trust II) to present |
Executive Vice President, Chief Legal Officer and Secretary, Brighthouse Investment Advisers, LLC (2023-Present); Managing Corporate Counsel, Brighthouse Financial Inc. (2023-present); Managing Counsel and Director, The Bank of New York Mellon Corporation (2019-2023); Counsel and Vice President, The Bank of New York Mellon Corporation (2016-2019). | |||
| Katie Hellmann (1980) | Chief Compliance Officer (“CCO”), of Trust I and Trust II | From May 2023 (Trust I and Trust II) to present |
Chief Compliance Officer, Brighthouse Investment Advisers, LLC (2023-present) and Head of Funds and Investments Compliance (2023-present). Deputy Chief Compliance Officer, Transamerica Asset Management (2022-2023). Leader and Senior Compliance Counsel – Funds Compliance, Edward Jones (2017-2022). | |||
| Rosemary Morgan (1983) | Anti-Money Laundering Officer, of Trust I and Trust II | From May 2023 (Trust I and Trust II) to present |
Chief Privacy Officer, Leader of Compliance Programs and Assistant General Counsel, Brighthouse Financial, Inc. (2019-2022); Chief Privacy Officer, Head of Compliance Programs & Contracts Law, Brighthouse Financial, Inc. (2022-2023), Chief Compliance Officer and Associate General Counsel, Brighthouse Financial, Inc. (2023-present); Vice President and Chief Compliance Officer, Brighthouse Life Insurance Company (2023-present); Vice President and Chief Compliance Officer (2023-present), Brighthouse Life Insurance Company of NY; Vice President and Chief Compliance Officer (2023-present), New England Life Insurance Company. | |||
| Anna Koska (1981) | Vice President, of Trust I and Trust II | From June 2022 (Trust I and Trust II) to present |
Vice President, Investment and Advisory Services, Brighthouse Investment Advisers, LLC (2022-present); Director of Investment and Advisory Services, Brighthouse Investment Advisers, LLC (2019-2022); Senior Portfolio Analyst, Brighthouse Investment Advisers, LLC (2017-2019). | |||
| * | Mr. Rosenthal is an “interested person” of the Trusts because of his position with Brighthouse Financial, Inc. (“Brighthouse Financial”), an affiliate of BIA. |
| ** | Indicates a directorship with a registered investment company or a company subject to the reporting requirements of the Securities Exchange Act of 1934, as amended. |
| (1) | Previous positions during the past five years with the Trusts, MetLife, Inc. or the Adviser are omitted if not materially different. |
| (2) | The Fund Complex includes 44 Trust I Portfolios and 29 Trust II Portfolios. |
BHFTII-16
Brighthouse Funds Trust II
Brighthouse Asset Allocation 40 Portfolio
Board of Trustees’ Consideration of Advisory Agreements
At a meeting held on November 13-14, 2023 (the “November Meeting”), the Boards of Trustees (the “Board”) of Brighthouse Funds Trust I and Brighthouse Funds Trust II (“BFT I” and “BFT II,” respectively, and collectively, the “Trusts”), including a majority of the Trustees who are not “interested persons” of the Trusts (the “Independent Trustees”) under the Investment Company Act of 1940 (the “1940 Act”), approved the continuation of the Trusts’ advisory agreements (the “Advisory Agreements” or “Agreements”) with Brighthouse Investment Advisers, LLC (the “Adviser”) for the series of the Trusts (each a “Portfolio,” and collectively, the “Portfolios”) for the annual contract renewal period from January 1, 2024 through December 31, 2024.
The Board met with personnel of the Adviser on September 28-29, 2023 (the “September Meeting”) for the specific purpose of giving preliminary consideration to the proposed continuation of the Agreements, including consideration to information that the Adviser had provided for the Board’s review at the request of the Independent Trustees. At the September Meeting, the Adviser reviewed with the Board the performance and fees experienced by each Portfolio, as well as other information. During and after the September Meeting, the Independent Trustees requested additional information and clarifications that the Adviser addressed at the November Meeting (the September Meeting and the November Meeting are referred to collectively as, the “Meetings”). During the contract renewal process, and throughout the year, the Independent Trustees were advised by independent legal counsel, and they met with independent legal counsel in executive sessions outside of the presence of management on a number of occasions to discuss, among other things, the renewal of the Agreements.
In considering the continuation of the Agreements, the Board reviewed a variety of materials that were provided for the specific purpose of assisting the Board in the renewal process, along with various information and materials that were provided to and discussed with the Board throughout the year, at regularly scheduled meetings of the Board and its committees. In particular, information for each Portfolio included, but was not limited to, reports on investment performance, expenses, legal and compliance matters, and asset pricing. Information about the Adviser included, but was not limited to, reports on the business, operations, and performance of the Adviser and reports that the Adviser had prepared specifically for the renewal process.
In considering the continuation of the Agreements, the Board also reviewed, among other things, a report for each Portfolio that was prepared by Broadridge (“Broadridge”), an independent organization, which set forth comparative performance and expense information for each Portfolio. In addition, the Independent Trustees reviewed a report that was prepared by JDL Consultants, LLC (“JDL”), an independent consultant to the Independent Trustees, which examined the Broadridge reports for each Portfolio (“JDL Report”). The Independent Trustees met in executive session with representatives of JDL during the September Meeting to review the JDL Report.
At the November Meeting, the Board, including a majority of the Independent Trustees, concluded that the nature, extent, and quality of services provided by the Adviser supported the renewal of the Agreements. The Board also concluded that the investment services provided to and the performance of each Portfolio was such that each Agreement should continue, and that the fees paid by each Portfolio to the Adviser appeared to be reasonable in light of the nature, extent, and quality of the services provided by the Adviser. Further, the Board concluded that the Adviser’s profitability in providing services under the Advisory Agreements did not appear unreasonable in light of the nature, extent, and quality of the services provided by the Adviser. The Board reviewed the extent to which the investment advisory fees paid by the Portfolios shared economies of scale with investors or entailed the potential to share economies of scale with investors and concluded that those considerations generally supported the renewal of each Agreement.
In approving the continuation of each Agreement, the Board, including the Independent Trustees, gave attention to all of the information that was furnished, and each Trustee placed varying degrees of importance on the various pieces of information that were provided to them. The Board evaluated the information provided to it on a Portfolio-by-Portfolio basis, and its decision was made separately with respect to each Portfolio. The following paragraphs provide more information about some of the primary factors that were relevant to the Board’s decisions. The Board did not identify any single factor as determinative, and the Trustees generally attributed different weights to various factors for the various Portfolios.
Nature, extent and quality of services. The Board evaluated the nature, extent and quality of the services that the Adviser has provided to the Brighthouse Asset Allocation 20 Portfolio, Brighthouse Asset Allocation 40 Portfolio, Brighthouse Asset Allocation 60 Portfolio Brighthouse Asset Allocation 80 Portfolio and Brighthouse Asset Allocation 100 Portfolio (the “Asset Allocation Portfolios”) and the American Funds Balanced Allocation Portfolio, American Funds Growth Allocation Portfolio and American Funds Moderate Allocation Portfolio (the “American Funds of Funds”). The Board considered the Adviser’s services as investment manager to the Portfolios, including information with respect to investment programs and personnel, succession management of key personnel, oversight of transition management (as applicable), actions taken with respect to regulatory developments, compliance programs and personnel, and risk management programs, among other things. The Adviser’s services in coordinating and overseeing the activities of the Trusts’ other service providers were also considered. The Board also considered the systems and processes required by the Adviser
BHFTII-17
Brighthouse Funds Trust II
Brighthouse Asset Allocation 40 Portfolio
Board of Trustees’ Consideration of Advisory Agreements—(Continued)
to meet additional regulatory and compliance requirements resulting from U.S. Securities and Exchange Commission and other regulatory initiatives, including related to liquidity, valuation, and derivatives risk management. The Board considered information received from the Trusts’ Chief Compliance Officer regarding the Portfolios’ compliance policies and procedures that were established pursuant to Rule 38a-l under the 1940 Act and relevant aspects of the Adviser’s compliance policies and procedures. The Board also noted that the Adviser’s investment, compliance, and legal staff reviews and assesses the services that are provided to the Portfolios, and that personnel of the Adviser routinely prepare and present reports to the Independent Trustees regarding material information related to those reviews and assessments. In addition, during the Meetings and throughout the year, the Board considered the expertise, experience, and performance of the personnel of the Adviser who performed the various services that are mentioned above.
With respect to the Asset Allocation Portfolios, the Board noted that the Adviser employs at its own expense an independent consultant to provide research and consulting services with respect to the periodic asset allocation targets for each of the Asset Allocation Portfolios and investments in other Portfolios of the Trusts (the “Underlying Portfolios”). Additionally, the Board considered that a committee, consisting of investment professionals from the Adviser, meets regularly to review the management of the Asset Allocation Portfolios and the American Funds of Funds, including asset allocations and performance metrics.
Performance. The Board placed emphasis on the performance of each Portfolio in the context of the performance of the relevant markets in which the Portfolio invests. The Board considered the Adviser’s quarterly presentations to the Board of detailed information about each Portfolio’s investment strategies and performance results and composition, including discussions regarding the relevant effects of market conditions. The Board reviewed and considered the reports prepared by Broadridge, which provided a statistical analysis comparing each Portfolio’s investment performance to that of comparable funds underlying variable insurance products (the “Performance Universe”), and the JDL Report. The Board considered each Portfolio’s performance for periods subsequent to the performance period covered by the Broadridge reports, and considered the Adviser’s assessment of the same. The Board also noted that while it found the data provided by Broadridge generally useful, it recognized the limitations of such data, including, in particular, that notable differences may exist between a Portfolio and the other funds in a Broadridge category (for example, with respect to investment strategies) and that the results of the performance comparisons may vary depending on (i) the end dates for the performance periods that were selected, and (ii) the selection of the peer groups.
Fees and Expenses. The Board gave consideration to the level and method of computing the fees payable under the Agreements. The Board reviewed and considered the information in the JDL Report concerning fees and expenses. The Board also reviewed and considered the Broadridge report for each Portfolio, which included various comparisons of the Portfolio’s fees (at December 31, 2022 and various asset levels) and expenses, with those of its peers, including, as applicable, a broad group of peer funds (“Expense Universe”) and a narrower group of peer funds (“Expense Group”). In particular, the Board reviewed comparisons of each Portfolio’s contractual management fees with its Expense Group and total expenses with its Expense Universe and Expense Group. The Board considered that Broadridge selected the peer funds, which were funds underlying variable insurance products that Broadridge deemed to be comparable to the Portfolios. The Board considered that the fee and expense information in the Broadridge report for each Portfolio reflected information as of the Portfolio’s most recent fiscal year end at the time the Broadridge report was issued and that historical asset levels may differ from current asset levels, particularly in a period of market volatility.
The Board also considered that the Adviser had entered into an expense limitation and management fee waiver agreement with Brighthouse Asset Allocation 20 Portfolio pursuant to which the Adviser had agreed to waive a portion of its advisory fee and/or reimburse certain expenses as a means of limiting the Portfolio’s total annual operating expenses.
Profitability. The Board examined the profitability to the Adviser of each Advisory Agreement, on a Portfolio-by-Portfolio basis. In the case of the Asset Allocation Portfolios, the Board also considered the Adviser’s analysis of its profitability that was attributable to its management of the Underlying Portfolios of the Trust in which the Asset Allocation Portfolios invest. The Board also considered that an affiliate of the Adviser, Brighthouse Securities, LLC, serves as distributor for the Trusts, and, as such, receives Rule 12b-1 payments to support the distribution of the Portfolios. In reviewing the profitability information, the Board recognized that expense allocation methodologies are inherently subjective and various methodologies may be reasonable while producing different results.
Economies of scale. The Board considered each Portfolio’s fees in light of its size. The Board noted the fee schedules for the Portfolios contain breakpoints that reduce the fee rate above specified asset levels.
The Board considered the effective fees under the Advisory Agreement for each Portfolio as a percentage of assets at different asset levels and possible economies of scale that may be realized if the assets of the Portfolio grow. The Board examined, among other data, the effect of a Portfolio’s growth in size, and reduction in size, on various fee schedules. The Board also generally noted that if a Portfolio’s assets increase over time, the Portfolio may realize economies of scale if assets increase proportionally more than certain other expenses.
BHFTII-18
Brighthouse Funds Trust II
Brighthouse Asset Allocation 40 Portfolio
Board of Trustees’ Consideration of Advisory Agreements—(Continued)
Other factors. The Board considered other benefits that may be realized by the Adviser and its affiliates from their relationships with the Trusts. Among the benefits realized by the Adviser, the Board recognized that Brighthouse Securities, LLC, as the distributor for the Trusts, receives payments pursuant to Rule 12b-1 from the Portfolios to help compensate for the provision of distribution and shareholder services activities.
The Board considered information from the Adviser pertaining to potential conflicts of interest, and the manner in which any potential conflicts were mitigated.
* * * * *
Brighthouse Asset Allocation 40 Portfolio. The Board also considered the following information in relation to the Agreement with the Adviser regarding the Portfolio:
Among other data relating specifically to the Portfolio’s performance, the Board considered that the Portfolio outperformed the median of its Performance Universe and the average of its Morningstar Category for the one-, three-, and five-year periods ended June 30, 2023. The Board further considered that the Portfolio underperformed the Brighthouse AA 40 Narrow Index for the one- and five-year periods ended October 31, 2023 and outperformed the same index for the three-year period ended October 31, 2023. In addition, the Board noted that the Portfolio outperformed its benchmark, the Dow Jones Moderately Conservative Portfolio Index, for the one-, three-, and five-year periods ended October 31, 2023.
The Board also considered that the Portfolio’s actual management fees and total expenses (inclusive of underlying fund expenses and exclusive of 12b-l fees) were below the Expense Group median and the Expense Universe median. The Board noted that the Portfolio’s contractual management fees were below the asset-weighted average of the Investment Classification/Morningstar Category selected by Broadridge at the Portfolio’s current size.
BHFTII-19
Brighthouse Funds Trust II
Brighthouse Asset Allocation 60 Portfolio
Managed by Brighthouse Investment Advisers, LLC
Portfolio Manager Commentary*
PERFORMANCE
For the twelve months ended December 31, 2023, the Class A and B shares of the Brighthouse Asset Allocation 60 Portfolio returned 13.93% and 13.59%, respectively. The Portfolio’s benchmark, the Dow Jones Moderate Portfolio Index¹, returned 12.70%.
MARKET ENVIRONMENT / CONDITIONS
Markets carried the momentum of late 2022 and ended the first quarter of 2023 on a positive note. After a string of seven consecutive rate hikes by the U.S. Federal Reserve (the “Fed”) in 2022, signs of high inflation began to wane, and speculation arose monetary tightening may soon end. At its February and March meetings, the Fed scaled back the magnitude of rate hikes and implemented increases of 0.25%, respectively. In March, the Fed moved quicky to inject liquidity into the banking sector after a few well-publicized bank failures surfaced. Bond and equity investors cheered the decisive action to quell the risk.
Investor enthusiasm began to falter in the second quarter of 2023. Bond markets were being pressured by central bank actions to raise rates as inflationary concerns continued to exist. In May, the Fed enacted its tenth consecutive rate hike before it voted to hold rates in check at its June meeting. The yield on the 10-year U.S. Treasury Bond rose throughout the quarter and negatively impacted government and investment grade credit bonds. In June, economic growth, as measured by the real gross domestic product (“GDP”) rate was positive as the first quarter 2023 real GDP growth rate reported a 2% annual gain. However, it marked the third straight quarter of decelerating GDP levels and raised doubts over the strength of the economy.
Conditions deteriorated in the third quarter with broad market declines amid a global equity correction and a worsening bond slump over the last two quarters. Equities pulled back after having established gains in the first half of the year. The possibility rates may remain higher and with central bank comments absent any definitive near-term relief, markets retreated. Globally, the European Union lowered its growth forecast and concern over China’s property sector pressured markets with Moody’s downgrading China’s property sector outlook to negative. The resilience of core bonds held up in the early part of the third quarter before prices declined sharply in the final two months of the quarter. The 10-Year U.S. Treasury yield moved aggressively over the period and rose 78 basis points (“bps”) and 50 bps in September alone. Though the Fed paused hiking rates at its September meeting, economic data showed a relatively healthy economy and kept hawkish monetary policies at the forefront.
The final two months of the year witnessed a robust turnaround for bonds and equities. Inflationary fears subsided and investors rejoiced that the cycle of rate hikes and aggressive monetary policies appeared to have levelled off and central banks may have their eyes focused instead on potential interest rate cuts for 2024. In the U.S., Fed officials kept their hands on the pause button during the fourth quarter and maintained the Federal Fund Rate at a range of 5.25% to 5.50%. Bond prices surged as the 10-Year U.S. Treasury yield fell 100 bps between October and the end of the year. Not to be outdone, several major broad-based equity markets had double-digit gains during the quarter.
For the full year ended 2023, the S&P 500 Index returned 26.29%. International stocks, as measured by the MSCI EAFE Index, gained 18.24%, and emerging market stocks, as measured by the MSCI Emerging Markets Index, returned 9.83%. Within fixed income, core bonds, as measured by the Bloomberg U.S. Aggregate Bond Index, returned 5.53% for the year ended December 31, 2023.
PORTFOLIO REVIEW / PERIOD-END POSITIONING
The Brighthouse Asset Allocation 60 Portfolio invests in underlying portfolios of the Brighthouse Funds Trust I and the Brighthouse Funds Trust II to maintain a broad asset allocation of approximately 60% to equities and 40% to fixed income.
Over the twelve-month period, the Portfolio outperformed the Dow Jones Moderate Portfolio Index. Performance strength within the underlying fixed income and mid cap portfolios offset performance weakness within the underlying large cap, small cap, and international equity portfolios.
On an absolute return basis, the top performing underlying fixed income portfolios were the BlackRock High Yield Portfolio and the Brighthouse/Eaton Vance Floating Rate Portfolio as below investment grade bonds (“high yield”) performed well relative to higher credit quality rated bonds. The Western Asset Management Strategic Bond Opportunities Portfolio outperformed its benchmark by 3.9%. Allocations to high yield bonds and bank loans were primary contributors. Exposures to non-agency mortgage-backed securities (“MBS”) and emerging market debt aided returns. The BlackRock Bond Income Portfolio exceeded its benchmark by 0.3%. The Portfolio’s allocation to collateralized loan obligations (“CLOs”) and non-agency MBS drove its relative results. Contributions were made by positive security selections within U.S. investment grade credit bonds and Agency MBS. The Brighthouse/Templeton International Bond Portfolio underperformed its benchmark by 2.1%. Currency positioning in the euro, Japanese yen, and South Korean won were the primary detractors from relative results during the period.
Performance from the underlying domestic equity portfolios was mixed for the period. Large cap and small cap portfolios underperformed, while mid cap portfolios were positive contributors. In large cap, the Brighthouse/Wellington Core Equity Opportunities Portfolio underperformed its benchmark by 18.9%. Negative security selection in the Industrials, Consumer Discretionary, and Information Technology (“IT”) sectors were key detractors during the year. An underweight position in the IT and Communication Services sectors, and an overweight in the Consumer Discretionary sector further pressured results. The T. Rowe Price Large Cap Value Portfo-
BHFTII-1
Brighthouse Funds Trust II
Brighthouse Asset Allocation 60 Portfolio
Managed by Brighthouse Investment Advisers, LLC
Portfolio Manager Commentary*—(Continued)
lio underperformed its benchmark by 1.6%. Relative performance was hurt by an overweight in the Health Care, Consumer Staples, and Utilities sectors and an underweight in the Communication Services sector. On a positive note, the Jennison Growth Portfolio beat its benchmark by 10.6%. Security selection was the main driver of the relative outperformance. Selection in the IT sector had the largest positive impact on results. Both security selection and an underweight to the Industrials and Consumer Staples sectors contributed to performance. Within mid cap, the Brighthouse/Artisan Mid Cap Value Portfolio outperformed its benchmark by 5.8%. Security selection in the Financials, IT, and Consumer Discretionary sectors were the largest relative contributors to results. The T. Rowe Price Mid Cap Growth Portfolio’s absolute performance lifted overall mid cap results. In small cap, the Invesco Small Cap Growth Portfolio underperformed its benchmark by 6.3%. Negative security selection in the Health Care, IT, and Consumer Discretionary sectors were the major detractors to results. The JPMorgan Small Cap Value Portfolio underperformed its benchmark by 1.4%. Security selection in the Health Care and IT sectors and an underweight to the Energy sector weighed negatively on relative results.
The underlying non-U.S. equity portfolios underperformed over the period. Within developed markets, VanEck Global Natural Resources Portfolio’s negative absolute performance was a detractor to overall international equity results. Security selection weakness in the Materials sector to the diversified metals & mining and copper sub-industries negatively impacted performance. The MFS Research International Portfolio underperformed its benchmark by 5.2%. Security selection weakness in the Financials, Consumer Discretionary, and Consumer Staples sectors were leading detractors over the period. On the positive side, the Harris Oakmark International Portfolio outperformed its benchmark by 1.0%. Positive security selection in the Industrials, Communication Services, and Consumer Staples sectors benefited results. From a country perspective, an overweight position in Germany and an underweight to Hong Kong positively impacted performance. In emerging markets, the Brighthouse/abrdn Emerging Markets Equity Portfolio underperformed its benchmark by 3.2%. Negative security selection in the Consumer Discretionary, IT, and Health Care sectors were leading detractors to relative performance. At the country level, exposures in China and Hong Kong detracted during the period. Conversely, the SSGA Emerging Markets Enhanced Index Portfolio outperformed its benchmark by 3.0%. Positive security selection in the IT, Financials, Utilities, and Industrials sectors were top relative contributors. At the country level, security selection was strongest in India, Taiwan, and China.
Investment Committee
Brighthouse Investment Advisers, LLC
* This commentary may include statements that constitute “forward-looking statements” under the U.S. securities laws. Forward-looking statements include, among other things, projections, estimates, and information about possible or future results related to the Portfolio, market or regulatory developments. The views expressed above are not guarantees of future performance or economic results and involve certain risks, uncertainties and assumptions that could cause actual outcomes and results to differ materially from the views expressed herein. The views expressed above are subject to change at any time based upon economic, market, or other conditions and the advisory firm undertakes no obligation to update the views expressed herein. Any discussions of specific securities should not be considered a recommendation to buy or sell those securities. The views expressed above (including any forward-looking statement) may not be relied upon as investment advice or as an indication of the Portfolio’s trading intent. Information about the Portfolio’s holdings, asset allocation or country diversification is historical and is not an indication of future Portfolio composition, which may vary. Direct investment in any index is not possible. The performance of any index mentioned in this commentary has not been adjusted for ongoing management, distribution and operating expenses, and sales charges applicable to mutual fund investments. In addition, the returns do not reflect additional fees charged by separate accounts or variable insurance contracts that an investor in the Portfolio may pay. If these additional fees were reflected, performance would have been lower.
1 The Dow Jones Moderate Portfolio Index is a member of the Dow Jones Relative Risk Index Series and is designed to measure a total portfolio of stocks, bonds, and cash, allocated to represent an investor’s desired risk profile. The Dow Jones Moderate Portfolio Index level is set to 60% of the Dow Jones Global Stock CMAC Index’s downside risk over the past 36 months.
BHFTII-2
Brighthouse Funds Trust II
Brighthouse Asset Allocation 60 Portfolio
A $10,000 INVESTMENT COMPARED TO THE DOW JONES MODERATE PORTFOLIO INDEX
AVERAGE ANNUAL RETURNS (%) FOR THE YEAR ENDED DECEMBER 31, 2023
| 1 Year | 5 Year | 10 Year | ||||||||||
| Brighthouse Asset Allocation 60 Portfolio | ||||||||||||
| Class A |
13.93 | 8.00 | 5.93 | |||||||||
|
Class B |
13.59 | 7.72 | 5.67 | |||||||||
| Dow Jones Moderate Portfolio Index | 12.70 | 6.89 | 5.49 | |||||||||
Portfolio performance is calculated including reinvestment of all income and capital gain distributions. Performance numbers are net of all Portfolio expenses but do not include any insurance, sales, separate account or administrative charges of variable annuity or life insurance contracts or any additional expenses that participants may bear relating to the operations of their plans. If these charges were included, the returns would be lower. The performance of any index referenced above has not been adjusted for ongoing management, distribution and operating expenses, and sales charges applicable to mutual fund investments. Direct investment in any index is not possible. The performance of Class A shares, as set forth in the line graph above, will differ from that of other classes because of the difference in expenses paid by policyholders investing in the different share classes.
This information represents past performance and is not indicative of future results. Investment return and principal value may fluctuate so that shares, upon redemption, may be worth more or less than the original cost.
PORTFOLIO COMPOSITION AS OF DECEMBER 31, 2023
Top Holdings
| % of Net Assets |
||||
| BlackRock Bond Income Portfolio (Class A) | 7.0 | |||
| PIMCO Total Return Portfolio (Class A) | 6.2 | |||
| TCW Core Fixed Income Portfolio (Class A) | 5.2 | |||
| MFS Value Portfolio (Class A) | 5.0 | |||
| T. Rowe Price Large Cap Value Portfolio (Class A) | 4.5 | |||
| Brighthouse/Wellington Core Equity Opportunities Portfolio (Class A) | 4.2 | |||
| Harris Oakmark International Portfolio (Class A) | 4.0 | |||
| Invesco Comstock Portfolio (Class A) | 4.0 | |||
| Western Asset Management U.S. Government Portfolio (Class A) | 4.0 | |||
| Baillie Gifford International Stock Portfolio (Class A) | 3.5 | |||
Asset Allocation
| % of Net Assets |
||||
| U.S. Large Cap Equities | 31.0 | |||
| Investment Grade Fixed Income | 29.5 | |||
| International Developed Market Equities | 14.1 | |||
| U.S. Small Cap Equities | 7.0 | |||
| International Fixed Income | 4.8 | |||
| High Yield Fixed Income | 4.6 | |||
| Global Equities | 4.0 | |||
| Emerging Market Equities | 2.5 | |||
| Real Estate Equities | 1.5 | |||
| U.S. Mid Cap Equities | 1.0 | |||
BHFTII-3
Brighthouse Funds Trust II
Brighthouse Asset Allocation 60 Portfolio
Understanding Your Portfolio’s Expenses
Shareholder Expense Example
As a shareholder of the Portfolio, you incur ongoing costs, including management fees; distribution and service (12b-1) fees; and other Portfolio expenses. This example is intended to help you understand your ongoing costs (in dollars) (referred to as “expenses”) of investing in the Portfolio and compare these costs with the ongoing costs of investing in other mutual funds. The example is based on an investment of $1,000 invested at the beginning of the period and held for the entire period, July 1, 2023 through December 31, 2023.
Actual Expenses
The first line for each share class of the Portfolio in the table below provides information about actual account values and actual expenses. You may use the information in this line, together with the amount you invested in the particular share class of the Portfolio, to estimate the expenses that you paid over the period. Simply divide your account value by $1,000 (for example, an $8,600 account value divided by $1,000 = 8.6), then multiply the result by the number in the first line under the heading entitled “Expenses Paid During Period” to estimate the expenses you paid on your account during this period.
Hypothetical Example for Comparison Purposes
The second line for each share class of the Portfolio in the table below provides information about hypothetical account values and hypothetical expenses based on the Portfolio’s actual expense ratio and an assumed rate of return of 5% per year before expenses, which is not the Portfolio’s actual return. The hypothetical account values and expenses may not be used to estimate the actual ending account balance or expenses you paid for the period. You may use this information to compare the ongoing costs of investing in the Portfolio and other funds. To do so, compare this 5% hypothetical example with the 5% hypothetical examples that appear in the shareholder reports of the other funds.
Please note that the expenses shown in the table are meant to highlight your ongoing costs only and do not reflect any fees or charges of your variable insurance product or any additional expenses that participants in certain eligible qualified plans may bear relating to the operations of their plan. Therefore, the second line for each share class in the table is useful in comparing ongoing costs only, and will not help you determine the relative total costs of owning different funds. In addition, if these other costs were included, your costs would have been higher.
| Brighthouse Asset Allocation 60 Portfolio |
Annualized Expense Ratio |
Beginning Account Value July 1, 2023 |
Ending Account Value December 31, 2023 |
Expenses Paid During Period** July 1, 2023 to December 31, 2023 |
||||||||||||||
| Class A (a) |
Actual | 0.66 | % | $ | 1,000.00 | $ | 1,054.30 | $ | 3.42 | |||||||||
| Hypothetical* | 0.66 | % | $ | 1,000.00 | $ | 1,021.88 | $ | 3.36 | ||||||||||
| Class B (a) |
Actual | 0.91 | % | $ | 1,000.00 | $ | 1,052.40 | $ | 4.71 | |||||||||
| Hypothetical* | 0.91 | % | $ | 1,000.00 | $ | 1,020.62 | $ | 4.63 | ||||||||||
| * | Hypothetical assumes a rate of return of 5% per year before expenses. |
| ** | Expenses paid are equal to the Portfolio’s annualized expense ratio for the most recent six month period, as shown above, multiplied by the average account value over the period, multiplied by the number of days (184 days) in the most recent fiscal half-year, divided by 365 (to reflect the one-half year period). |
| (a) | The annualized expense ratio reflects the expenses of both the Portfolio and the Underlying Portfolios in which it invests. |
BHFTII-4
Brighthouse Funds Trust II
Brighthouse Asset Allocation 60 Portfolio
Schedule of Investments as of December 31, 2023
Mutual Funds—100.0% of Net Assets
| Security Description | Shares | Value | ||||||
| Affiliated Investment Companies—100.0% | ||||||||
| AB International Bond Portfolio (Class A) (a) |
29,908,287 | $ | 238,668,128 | |||||
| Allspring Mid Cap Value Portfolio (Class A) (a) |
2,145,423 | 24,093,099 | ||||||
| Baillie Gifford International Stock Portfolio (Class A) (b) |
32,281,776 | 337,990,195 | ||||||
| BlackRock Bond Income Portfolio (Class A) (b) |
7,230,541 | 667,089,669 | ||||||
| BlackRock Capital Appreciation Portfolio (Class A) (b) |
6,577,659 | 238,374,372 | ||||||
| BlackRock High Yield Portfolio (Class A) (a) |
11,037,229 | 81,344,379 | ||||||
| Brighthouse Small Cap Value Portfolio (Class A) (a) |
11,909,718 | 167,331,531 | ||||||
| Brighthouse/abrdn Emerging Markets Equity Portfolio (Class A) (a) |
16,402,825 | 144,836,948 | ||||||
| Brighthouse/Artisan International Portfolio (Class A) (a) |
27,872,638 | 286,809,442 | ||||||
| Brighthouse/Artisan Mid Cap Value Portfolio (Class A) (b) |
110,742 | 24,071,898 | ||||||
| Brighthouse/Dimensional International Small Company Portfolio (Class A) (b) |
9,589,735 | 96,568,627 | ||||||
| Brighthouse/Eaton Vance Floating Rate Portfolio (Class A) (a) |
16,558,515 | 164,260,464 | ||||||
| Brighthouse/Franklin Low Duration Total Return Portfolio (Class A) (a) |
21,382,839 | 187,955,153 | ||||||
| Brighthouse/Templeton International Bond Portfolio (Class A) (a) (c) |
27,678,906 | 217,279,411 | ||||||
| Brighthouse/Wellington Core Equity Opportunities Portfolio (Class A) (b) |
14,124,313 | 402,825,402 | ||||||
| Brighthouse/Wellington Large Cap Research Portfolio (Class A) (a) |
20,793,313 | 287,363,592 | ||||||
| CBRE Global Real Estate Portfolio (Class A) (a) |
13,650,168 | 143,872,774 | ||||||
| Harris Oakmark International Portfolio (Class A) (a) |
29,410,936 | 385,871,485 | ||||||
| Invesco Comstock Portfolio (Class A) (a) |
30,263,118 | 385,552,120 | ||||||
| Invesco Global Equity Portfolio (Class A) (a) |
4,029,819 | 96,473,866 | ||||||
| Invesco Small Cap Growth Portfolio (Class A) (a) (c) |
14,600,754 | 119,726,183 | ||||||
| Jennison Growth Portfolio (Class A) (b) (c) |
18,282,226 | 261,984,294 | ||||||
| JPMorgan Core Bond Portfolio (Class A) (a) |
26,258,067 | 238,160,672 | ||||||
| JPMorgan Small Cap Value Portfolio (Class A) (a) |
6,345,671 | 71,642,627 | ||||||
| Loomis Sayles Growth Portfolio (Class A) (a) |
17,065,521 | 264,686,225 | ||||||
| Loomis Sayles Small Cap Growth Portfolio (Class A) (b) (c) |
6,748,225 | 71,666,153 | ||||||
| MFS Research International Portfolio (Class A) (a) |
19,880,996 | 240,560,058 | ||||||
| MFS Value Portfolio (Class A) (b) |
34,351,512 | 478,173,048 | ||||||
| Affiliated Investment Companies—(Continued) | ||||||||
| Neuberger Berman Genesis Portfolio (Class A) (b) |
3,875,542 | 71,581,269 | ||||||
| PIMCO Inflation Protected Bond Portfolio (Class A) (a) |
27,421,873 | 260,507,792 | ||||||
| PIMCO Total Return Portfolio (Class A) (a) |
60,136,773 | 596,556,786 | ||||||
| SSGA Emerging Markets Enhanced Index Portfolio (Class A) (a) |
9,883,756 | 96,564,299 | ||||||
| T. Rowe Price Large Cap Growth Portfolio (Class A) (b) (c) |
10,329,935 | 213,829,648 | ||||||
| T. Rowe Price Large Cap Value Portfolio (Class A) (a) |
16,482,922 | 434,324,996 | ||||||
| T. Rowe Price Mid Cap Growth Portfolio (Class A) (a) |
5,058,006 | 48,101,632 | ||||||
| T. Rowe Price Small Cap Growth Portfolio (Class A) (b) |
8,404,252 | 167,244,622 | ||||||
| TCW Core Fixed Income Portfolio (Class A) (a) |
55,294,857 | 492,677,177 | ||||||
| VanEck Global Natural Resources Portfolio (Class A) (b) |
24,034,536 | 285,770,630 | ||||||
| Western Asset Management Strategic Bond Opportunities Portfolio (Class A) (b) |
17,499,239 | 191,966,649 | ||||||
| Western Asset Management U.S. Government Portfolio (Class A) (b) |
35,992,737 | 379,363,443 | ||||||
|
|
|
|||||||
| Total Mutual Funds |
9,563,720,758 | |||||||
|
|
|
|||||||
| Total Investments—100.0% |
9,563,720,758 | |||||||
| Other assets and liabilities (net)—0.0% |
(2,598,482 | ) | ||||||
|
|
|
|||||||
| Net Assets—100.0% | $ | 9,561,122,276 | ||||||
|
|
|
|||||||
| (a) | A Portfolio of Brighthouse Funds Trust I. (See Note 6 of the Notes to Financial Statements for a summary of transactions in the securities of affiliated Underlying Portfolios.) | |||
| (b) | A Portfolio of Brighthouse Funds Trust II. (See Note 6 of the Notes to Financial Statements for a summary of transactions in the securities of affiliated Underlying Portfolios.) | |||
| (c) | Non-income producing security. | |||
Fair Value Hierarchy
Accounting principles generally accepted in the United States of America (“GAAP”) define fair market value as the price that the Portfolio would receive to sell an asset or pay to transfer a liability in an orderly transaction between market participants at the measurement date. It establishes a fair value hierarchy that prioritizes inputs to valuation methods and requires disclosure of the fair value hierarchy, separately for each major category of assets and liabilities, that segregates fair value measurements into three levels. Levels 1, 2 and 3 of the fair value hierarchy are defined as follows:
Level 1 - unadjusted quoted prices in active markets for identical investments
Level 2 - other significant observable inputs (including, but not limited to, quoted prices for similar assets or liabilities in markets that are either active or inactive; inputs other than quoted prices that are observable such as interest rates, yield curves, volatilities, prepayment speeds, loss severities, credit risks, default rates, or other market corroborated inputs)
Level 3 - significant unobservable inputs based on the best information available in the circumstances, to the extent observable inputs are unavailable (including the Portfolio’s own assumptions used in determining the fair value of investments and derivative financial instruments)
The inputs or methodologies used for valuing investments are not necessarily an indication of the risk associated with investing in them. Changes to the inputs or methodologies used may result in transfers between levels. A reconciliation of Level 3 securities, if any, will be disclosed following the fair value hierarchy table. For more information about the Portfolio’s policy regarding the valuation of investments, please refer to the Notes to Financial Statements.
The following table summarizes the fair value hierarchy of the Portfolio’s investments as of December 31, 2023:
| Description | Level 1 | Level 2 | Level 3 | Total | ||||||||||||
| Mutual Funds | ||||||||||||||||
| Affiliated Investment Companies |
$ | 9,563,720,758 | $ | — | $ | — | $ | 9,563,720,758 | ||||||||
| Total Investments |
$ | 9,563,720,758 | $ | — | $ | — | $ | 9,563,720,758 | ||||||||
See accompanying notes to financial statements.
BHFTII-5
Brighthouse Funds Trust II
Brighthouse Asset Allocation 60 Portfolio
Statement of Assets and Liabilities
December 31, 2023
| Assets |
||||
| Affiliated investments at value (a) |
$ | 9,563,720,758 | ||
| Receivable for: |
||||
| Affiliated investments sold |
4,287,377 | |||
| Fund shares sold |
208,531 | |||
|
|
|
|||
| Total Assets |
9,568,216,666 | |||
| Liabilities |
||||
| Payables for: |
||||
| Fund shares redeemed |
4,495,908 | |||
| Accrued Expenses: |
||||
| Management fees |
429,472 | |||
| Distribution and service fees |
1,924,679 | |||
| Deferred trustees’ fees |
206,348 | |||
| Other expenses |
37,983 | |||
|
|
|
|||
| Total Liabilities |
7,094,390 | |||
|
|
|
|||
| Net Assets |
$ | 9,561,122,276 | ||
|
|
|
|||
| Net Assets Consist of: |
||||
| Paid in surplus |
$ | 9,836,869,193 | ||
| Distributable earnings (Accumulated losses) |
(275,746,917 | ) | ||
|
|
|
|||
| Net Assets |
$ | 9,561,122,276 | ||
|
|
|
|||
| Net Assets |
||||
| Class A |
$ | 302,571,666 | ||
| Class B |
9,258,550,610 | |||
| Capital Shares Outstanding* |
||||
| Class A |
30,534,065 | |||
| Class B |
941,161,285 | |||
| Net Asset Value, Offering Price and Redemption Price Per Share |
||||
| Class A |
$ | 9.91 | ||
| Class B |
9.84 |
| * | The Portfolio is authorized to issue an unlimited number of shares. | |||
| (a) | Identified cost of affiliated investments was $10,082,102,539. | |||
Statement of Operations
Year Ended December 31, 2023
| Investment Income |
||||
| Dividends from affiliated investments |
$ | 200,005,097 | ||
|
|
|
|||
| Total investment income |
200,005,097 | |||
| Expenses |
||||
| Management fees |
5,061,559 | |||
| Administration fees |
30,250 | |||
| Custodian and accounting fees |
27,625 | |||
| Distribution and service fees—Class B |
22,695,855 | |||
| Audit and tax services |
35,076 | |||
| Legal |
46,604 | |||
| Trustees’ fees and expenses |
46,220 | |||
| Miscellaneous |
17,561 | |||
|
|
|
|||
| Total expenses |
27,960,750 | |||
|
|
|
|||
| Net Investment Income |
172,044,347 | |||
|
|
|
|||
| Net Realized and Unrealized Gain (Loss) |
||||
| Net realized gain (loss) on: | ||||
| Affiliated investments |
(168,518,311 | ) | ||
| Capital gain distributions from affiliated investments |
314,500,154 | |||
|
|
|
|||
| Net realized gain (loss) |
145,981,843 | |||
|
|
|
|||
| Net change in unrealized appreciation on affiliated investments |
881,964,825 | |||
|
|
|
|||
| Net realized and unrealized gain (loss) |
1,027,946,668 | |||
|
|
|
|||
| Net Increase (Decrease) in Net Assets From Operations |
$ | 1,199,991,015 | ||
|
|
|
See accompanying notes to financial statements.
BHFTII-6
Brighthouse Funds Trust II
Brighthouse Asset Allocation 60 Portfolio
Statements of Changes in Net Assets
| Year Ended December 31, 2023 |
Year Ended December 31, 2022 |
|||||||
| Increase (Decrease) in Net Assets: |
||||||||
| From Operations |
||||||||
| Net investment income (loss) |
$ | 172,044,347 | $ | 198,397,685 | ||||
| Net realized gain (loss) |
145,981,843 | 857,766,817 | ||||||
| Net change in unrealized appreciation (depreciation) |
881,964,825 | (2,924,278,898 | ) | |||||
|
|
|
|
|
|||||
| Increase (decrease) in net assets from operations |
1,199,991,015 | (1,868,114,396 | ) | |||||
|
|
|
|
|
|||||
| From Distributions to Shareholders |
||||||||
| Class A |
(34,030,387 | ) | (31,316,809 | ) | ||||
| Class B |
(1,029,809,947 | ) | (986,071,675 | ) | ||||
|
|
|
|
|
|||||
| Total distributions |
(1,063,840,334 | ) | (1,017,388,484 | ) | ||||
|
|
|
|
|
|||||
| Increase (decrease) in net assets from capital share transactions |
22,926,574 | (180,447,658 | ) | |||||
|
|
|
|
|
|||||
| Total increase (decrease) in net assets |
159,077,255 | (3,065,950,538 | ) | |||||
| Net Assets |
||||||||
| Beginning of period |
9,402,045,021 | 12,467,995,559 | ||||||
|
|
|
|
|
|||||
| End of period |
$ | 9,561,122,276 | $ | 9,402,045,021 | ||||
|
|
|
|
|
|||||
Other Information:
Capital Shares
Transactions in capital shares were as follows:
| Year Ended December 31, 2023 |
Year Ended December 31, 2022 |
|||||||||||||||
| Shares | Value | Shares | Value | |||||||||||||
| Class A |
||||||||||||||||
| Sales |
949,534 | $ | 9,306,239 | 717,156 | $ | 7,636,905 | ||||||||||
| Reinvestments |
3,639,614 | 34,030,387 | 3,221,894 | 31,316,809 | ||||||||||||
| Redemptions |
(3,421,030 | ) | (33,298,152 | ) | (2,908,461 | ) | (30,839,009 | ) | ||||||||
|
|
|
|
|
|
|
|
|
|||||||||
| Net increase (decrease) |
1,168,118 | $ | 10,038,474 | 1,030,589 | $ | 8,114,705 | ||||||||||
|
|
|
|
|
|
|
|
|
|||||||||
| Class B |
||||||||||||||||
| Sales |
21,653,001 | $ | 206,627,377 | 6,780,407 | $ | 72,246,244 | ||||||||||
| Reinvestments |
110,851,447 | 1,029,809,947 | 101,972,252 | 986,071,675 | ||||||||||||
| Redemptions |
(126,560,195 | ) | (1,223,549,224 | ) | (116,595,920 | ) | (1,246,880,282 | ) | ||||||||
|
|
|
|
|
|
|
|
|
|||||||||
| Net increase (decrease) |
5,944,253 | $ | 12,888,100 | (7,843,261 | ) | $ | (188,562,363 | ) | ||||||||
|
|
|
|
|
|
|
|
|
|||||||||
| Increase (decrease) derived from capital shares transactions |
$ | 22,926,574 | $ | (180,447,658 | ) | |||||||||||
|
|
|
|
|
|||||||||||||
See accompanying notes to financial statements.
BHFTII-7
Brighthouse Funds Trust II
Brighthouse Asset Allocation 60 Portfolio
Financial Highlights
| Selected per share data | ||||||||||||||||||||
| Class A | ||||||||||||||||||||
| Year Ended December 31, | ||||||||||||||||||||
| 2023 | 2022 | 2021 | 2020 | 2019 | ||||||||||||||||
| Net Asset Value, Beginning of Period |
$ | 9.81 | $ | 12.92 | $ | 12.55 | $ | 12.17 | $ | 11.30 | ||||||||||
|
|
|
|
|
|
|
|
|
|
|
|||||||||||
| Income (Loss) from Investment Operations |
||||||||||||||||||||
| Net investment income (loss) (a) |
0.20 | 0.23 | 0.17 | 0.28 | 0.26 | |||||||||||||||
| Net realized and unrealized gain (loss) |
1.10 | (2.20 | ) | 1.20 | 1.22 | 1.88 | ||||||||||||||
|
|
|
|
|
|
|
|
|
|
|
|||||||||||
| Total income (loss) from investment operations |
1.30 | (1.97 | ) | 1.37 | 1.50 | 2.14 | ||||||||||||||
|
|
|
|
|
|
|
|
|
|
|
|||||||||||
| Less Distributions |
||||||||||||||||||||
| Distributions from net investment income |
(0.35 | ) | (0.28 | ) | (0.31 | ) | (0.29 | ) | (0.28 | ) | ||||||||||
| Distributions from net realized capital gains |
(0.85 | ) | (0.86 | ) | (0.69 | ) | (0.83 | ) | (0.99 | ) | ||||||||||
|
|
|
|
|
|
|
|
|
|
|
|||||||||||
| Total distributions |
(1.20 | ) | (1.14 | ) | (1.00 | ) | (1.12 | ) | (1.27 | ) | ||||||||||
|
|
|
|
|
|
|
|
|
|
|
|||||||||||
| Net Asset Value, End of Period |
$ | 9.91 | $ | 9.81 | $ | 12.92 | $ | 12.55 | $ | 12.17 | ||||||||||
|
|
|
|
|
|
|
|
|
|
|
|||||||||||
| Total Return (%) (b) |
13.93 | (15.17 | ) | 11.17 | 14.09 | 19.85 | ||||||||||||||
| Ratios/Supplemental Data |
||||||||||||||||||||
| Ratio of expenses to average net assets (%) (c) |
0.06 | 0.06 | 0.05 | 0.05 | 0.05 | |||||||||||||||
| Ratio of net investment income (loss) to average net assets (%) (d) |
2.08 | 2.16 | 1.33 | 2.43 | 2.21 | |||||||||||||||
| Portfolio turnover rate (%) |
8 | 14 | 9 | 10 | 13 | |||||||||||||||
| Net assets, end of period (in millions) |
$ | 302.6 | $ | 288.1 | $ | 366.2 | $ | 343.6 | $ | 327.6 | ||||||||||
| Class B | ||||||||||||||||||||
| Year Ended December 31, | ||||||||||||||||||||
| 2023 | 2022 | 2021 | 2020 | 2019 | ||||||||||||||||
| Net Asset Value, Beginning of Period |
$ | 9.75 | $ | 12.83 | $ | 12.47 | $ | 12.09 | $ | 11.24 | ||||||||||
|
|
|
|
|
|
|
|
|
|
|
|||||||||||
| Income (Loss) from Investment Operations |
||||||||||||||||||||
| Net investment income (loss) (a) |
0.18 | 0.20 | 0.14 | 0.25 | 0.23 | |||||||||||||||
| Net realized and unrealized gain (loss) |
1.08 | (2.18 | ) | 1.19 | 1.22 | 1.85 | ||||||||||||||
|
|
|
|
|
|
|
|
|
|
|
|||||||||||
| Total income (loss) from investment operations |
1.26 | (1.98 | ) | 1.33 | 1.47 | 2.08 | ||||||||||||||
|
|
|
|
|
|
|
|
|
|
|
|||||||||||
| Less Distributions |
||||||||||||||||||||
| Distributions from net investment income |
(0.32 | ) | (0.24 | ) | (0.28 | ) | (0.26 | ) | (0.24 | ) | ||||||||||
| Distributions from net realized capital gains |
(0.85 | ) | (0.86 | ) | (0.69 | ) | (0.83 | ) | (0.99 | ) | ||||||||||
|
|
|
|
|
|
|
|
|
|
|
|||||||||||
| Total distributions |
(1.17 | ) | (1.10 | ) | (0.97 | ) | (1.09 | ) | (1.23 | ) | ||||||||||
|
|
|
|
|
|
|
|
|
|
|
|||||||||||
| Net Asset Value, End of Period |
$ | 9.84 | $ | 9.75 | $ | 12.83 | $ | 12.47 | $ | 12.09 | ||||||||||
|
|
|
|
|
|
|
|
|
|
|
|||||||||||
| Total Return (%) (b) |
13.59 | (15.33 | ) | 10.90 | 13.85 | 19.42 | ||||||||||||||
| Ratios/Supplemental Data |
||||||||||||||||||||
| Ratio of expenses to average net assets (%) (c) |
0.31 | 0.31 | 0.30 | 0.30 | 0.30 | |||||||||||||||
| Ratio of net investment income (loss) to average net assets (%) (d) |
1.83 | 1.90 | 1.08 | 2.18 | 1.98 | |||||||||||||||
| Portfolio turnover rate (%) |
8 | 14 | 9 | 10 | 13 | |||||||||||||||
| Net assets, end of period (in millions) |
$ | 9,258.6 | $ | 9,113.9 | $ | 12,101.8 | $ | 12,299.1 | $ | 12,158.4 | ||||||||||
| (a) | Per share amounts based on average shares outstanding during the period. | |||
| (b) | Total return does not reflect any insurance, sales, separate account or administrative charges of variable annuity or life insurance contracts or any additional expenses that contract owners may bear under their variable contracts. If these charges were included, the returns would be lower. | |||
| (c) | The ratio of operating expenses to average net assets does not include expenses of the Underlying Portfolios in which the Asset Allocation Portfolio invests. | |||
| (d) | Recognition of net investment income by the Asset Allocation Portfolio is affected by the timing of the declaration of dividends by the Underlying Portfolios in which it invests. | |||
See accompanying notes to financial statements.
BHFTII-8
Brighthouse Funds Trust II
Brighthouse Asset Allocation 60 Portfolio
Notes to Financial Statements—December 31, 2023
1. Organization
Brighthouse Funds Trust II (the “Trust”) is organized as a Delaware statutory trust and registered under the Investment Company Act of 1940, as amended (the “1940 Act”), as an open-end management investment company. The Trust, which is managed by Brighthouse Investment Advisers, LLC (“Brighthouse Investment Advisers” or the “Adviser”), currently offers twenty-nine series (the “Portfolios”), each of which operates as a distinct investment vehicle of the Trust. The series included in this report is Brighthouse Asset Allocation 60 Portfolio (the “Asset Allocation Portfolio”), which is diversified. The Asset Allocation Portfolio operates under a “fund of funds” structure, investing substantially all of its assets in other Portfolios advised by Brighthouse Investment Advisers (each, an “Underlying Portfolio,” and, collectively, the “Underlying Portfolios”). Shares of the Portfolio are not offered directly to the general public and are currently available only to separate accounts of insurance companies, including insurance companies affiliated with the Adviser.
The Asset Allocation Portfolio has registered and offers two classes of shares: Class A and B shares. Shares of each class of the Asset Allocation Portfolio represent an equal pro rata interest in the Asset Allocation Portfolio and generally give the shareholder the same voting, dividend, liquidation, and other rights. Investment income, realized and unrealized capital gains and losses, the common expenses of the Asset Allocation Portfolio, and certain Asset Allocation Portfolio-level expense reductions, if any, are allocated on a pro rata basis to each class based on the relative net assets of each class to the net assets of the Asset Allocation Portfolio. Each class of shares differs in its respective distribution plan and such distribution expenses are allocated to the corresponding class of shares.
2. Significant Accounting Policies
The preparation of financial statements in conformity with accounting principles generally accepted in the United States of America (“GAAP”) requires management to make estimates and assumptions that affect the reported amounts of assets and liabilities and disclosure of contingent assets and liabilities as of the date of the financial statements and the reported amounts of income and expenses during the reporting period. Actual results could differ from those estimates. In the preparation of these financial statements, management has evaluated events and transactions subsequent to December 31, 2023 through the date the financial statements were issued.
The Asset Allocation Portfolio is an investment company and follows the accounting and reporting guidance of the Financial Accounting Standards Board (“FASB”) Accounting Standards Codification Topic 946—Financial Services—Investment Companies. The following is a summary of significant accounting policies consistently followed by the Asset Allocation Portfolio in the preparation of its financial statements.
Investment Valuation and Fair Value Measurements - The Asset Allocation Portfolio values its investments for purposes of calculating its net asset value (“NAV”) using procedures that allow for a variety of methodologies to be used to value the Asset Allocation Portfolio’s investments. The specific methodology used for an investment may vary based on the market data available for a specific investment at the time the Asset Allocation Portfolio calculates its NAV or based on other considerations. The procedures also permit a level of judgment to be used in the valuation process.
Investments in the Underlying Portfolios are valued at their closing daily NAV on the valuation date. Investments in the Underlying Portfolios are categorized as Level 1 within the fair value hierarchy. For information about the use of fair value pricing by the Underlying Portfolios, please refer to the prospectuses of the Underlying Portfolios.
Investment Transactions and Related Investment Income - The Asset Allocation Portfolio’s security transactions are recorded on the trade date. Dividend income is recorded on the ex-dividend date. Interest income is recorded on the accrual basis. Realized gains and losses on investments and unrealized appreciation and depreciation are determined on the identified cost basis, which is the same basis used for federal income tax purposes. Capital gains distributions received from the Underlying Portfolios are recorded as net realized gain in the Statement of Operations.
Dividends and Distributions to Shareholders - The Asset Allocation Portfolio records dividends and distributions on the ex-dividend date. Net realized gains from securities transactions (if any) are generally distributed annually to shareholders. The timing and characterization of certain income and capital gains distributions are determined in accordance with federal tax regulations that may differ from GAAP. Permanent book and tax basis differences relating to shareholder distributions will result in reclassification between distributable earnings (accumulated losses) and paid in surplus. These adjustments have no impact on net assets or the results of operations.
Income Taxes - It is the Asset Allocation Portfolio’s policy to comply with the requirements of the Internal Revenue Code of 1986, as amended, and regulations thereunder, applicable to regulated investment companies, and to distribute, with respect to each taxable year, all of its taxable income to shareholders. Therefore, no federal income tax provision is required. The Asset Allocation Portfolio files U.S. federal tax returns. No income tax returns are currently under examination. The Asset Allocation Portfolio’s federal tax returns remain subject to examination by the Internal Revenue Service for three fiscal years after the returns are filed. As of December 31, 2023, the Asset Allocation Portfolio had no uncertain tax positions that would require financial statement recognition, derecognition or disclosure.
BHFTII-9
Brighthouse Funds Trust II
Brighthouse Asset Allocation 60 Portfolio
Notes to Financial Statements—December 31, 2023—(Continued)
3. Certain Risks
In the normal course of business, the Underlying Portfolios invest in securities and enter into transactions where risks exist. Those risks include:
Market Risk: The value of securities held by the Underlying Portfolios may decline in response to certain events, including those directly involving the issuers whose securities are owned by the Underlying Portfolios; conditions affecting the general economy; overall market changes; local, regional or global political, social or economic instability; currency, interest rate, and price fluctuations, or other factors including terrorism, war, natural disasters and the spread of infectious illness including epidemics or pandemics such as the COVID-19 pandemic. These events may also adversely affect the liquidity of securities held by the Underlying Portfolios.
Credit and Counterparty Risk: The Underlying Portfolios may be exposed to counterparty risk, or the risk that an entity with which the Underlying Portfolios have unsettled or open transactions may default. The potential loss could exceed the value of the financial assets and liabilities recorded in the financial statements. Financial assets that potentially expose the Underlying Portfolios to credit and counterparty risk consist principally of cash due from counterparties and investments. The Underlying Portfolios manage counterparty risk by entering into agreements only with counterparties that they believe have the financial resources to honor their obligations and by monitoring the financial stability of those counterparties. The Subadviser may attempt to mitigate counterparty risk by (i) periodically assessing the creditworthiness of their trading partners, (ii) monitoring and/or limiting the amount of their net exposure to each individual counterparty based on the adviser’s assessment, and (iii) requiring collateral from the counterparty for certain transactions. In order to preserve certain safeguards for non-standard settlement trades, the Underlying Portfolios restrict their exposure to credit and counterparty losses by entering into master netting agreements (“Master Agreements”) with counterparties (approved brokers) with whom the Underlying Portfolios undertake a significant volume of transactions. Master Agreements govern the terms of certain transactions and reduce the counterparty risk associated with relevant transactions by specifying credit protection mechanisms and providing standardization that improves legal certainty. Master Agreements can also help limit counterparty risk by specifying collateral posting arrangements at pre-arranged exposure levels.
The Asset Allocation Portfolio’s prospectus includes a discussion of the principal risks of investing in the Asset Allocation Portfolio and in the Underlying Portfolios in which it invests.
4. Investment Transactions
Aggregate cost of purchases and proceeds of sales of shares of the Underlying Portfolios by the Asset Allocation Portfolio, for the year ended December 31, 2023 were as follows:
| Purchases |
Sales | |||||||||||
| U.S. Government |
Non-U.S. Government | U.S. Government | Non-U.S. Government | |||||||||
| $0 | $ | 718,507,342 | $ | 0 | $ | 1,272,929,093 | ||||||
5. Investment Management Fees and Other Transactions with Affiliates
Investment Management Agreement - Brighthouse Investment Advisers is the investment adviser to the Asset Allocation Portfolio. The Trust has entered into an investment management agreement with Brighthouse Investment Advisers with respect to the Asset Allocation Portfolio. For providing investment management services to the Asset Allocation Portfolio, Brighthouse Investment Advisers receives monthly compensation at the following annual rates:
| Management |
% per annum | Average Daily Net Assets | ||||
| $5,061,559 | 0.100 | % | Of the first $500 million | |||
| 0.075 | % | Of the next $500 million | ||||
| 0.050 | % | On amounts in excess of $1 billion | ||||
In addition to the above management fee paid to Brighthouse Investment Advisers, the Asset Allocation Portfolio indirectly pays Brighthouse Investment Advisers an investment advisory fee through its investments in the Underlying Portfolios.
Certain officers and trustees of the Trust may also be officers of the Adviser however, such officers and trustees receive no compensation from the Trust.
Transfer Agency Agreement - Brighthouse Life Insurance Company serves as the transfer agent for the Trust. Brighthouse Life Insurance Company receives no fees for its services to the Trust.
BHFTII-10
Brighthouse Funds Trust II
Brighthouse Asset Allocation 60 Portfolio
Notes to Financial Statements—December 31, 2023—(Continued)
Distribution and Service Fees - The Trust has a distribution agreement with Brighthouse Securities, LLC (the “Distributor”) pursuant to which the Distributor serves as the general distributor of shares of each class (each a “Class”) of each Portfolio. The Distributor is an affiliate of the Trust. The Trust has adopted a Distribution and Services Plan (the “D&S Plan”) relating to Class B, Class D, Class E, Class F and Class G shares of each Portfolio, under Rule 12b-1 under the 1940 Act, pursuant to which the Trust may pay the Distributor a fee (the “Service Fee”) at an annual rate not to exceed 0.25% of each such Portfolio’s average daily net assets attributable to the Class B, Class D, Class E, Class F and Class G shares of the Trust. Each Portfolio may not offer shares of each Class. The D&S Plan also authorizes the Trust, on behalf of each of its Portfolios, to pay to the Distributor a distribution fee (the “Distribution Fee” and together with the Service Fee, the “Fees”) at an annual rate of up to 0.25% of each Portfolio’s average daily net assets attributable to the Class B, Class D, Class E, Class F, and Class G shares in consideration of the services rendered in connection with the sale of such shares by the Distributor. Under the Distribution Agreement with respect to the Trust, Fees are currently paid at an annual rate of 0.25% of average daily net assets in the case of Class B shares, 0.10% of average daily net assets in the case of Class D shares, 0.15% of average daily net assets in the case of Class E shares, 0.20% of average daily net assets in the case of Class F shares and 0.30% of average daily net assets in the case of Class G shares. The D&S Plan is known as a “compensation plan” because the Trust makes payments to the Distributor for services rendered regardless of the actual level of expenditures by the Distributor. Amounts incurred by the Portfolio for the year ended December 31, 2023 are shown as Distribution and service fees in the Statement of Operations.
Deferred Trustee Compensation - Each Trustee who is not currently an employee of the Adviser or any of its affiliates receives compensation from the Trust for his or her service to the Trust. A deferred compensation plan (the “Plan”) is available to the Trustees on a voluntary basis. Deferred amounts remain in the Trust until distributed in accordance with the provisions of the Plan. The value of a participating Trustee’s deferral account is based on theoretical investments of deferred amounts on the normal payment dates in certain portfolios of the Trust or Brighthouse Funds Trust I, an affiliate of the Trust, as designated by the participating Trustee. Changes in the value of participants’ deferral accounts are reflected as a component of Trustees’ fees and expenses in the Statement of Operations. The portion of the accrued obligations allocated to the Portfolio under the Plan is reflected as Deferred trustees’ fees in the Statement of Assets and Liabilities.
6. Transactions in Securities of Affiliated Issuers
The Asset Allocation Portfolio does not invest in the Underlying Portfolios for the purpose of exercising control; however, investments by the Asset Allocation Portfolio within its principal investment strategies may represent a significant portion of the Underlying Portfolios net assets. Transactions in the Underlying Portfolios for the year ended December 31, 2023 were as follows:
| Security Description |
Market Value December 31, 2022 |
Purchases | Sales | Realized Gain/(Loss) |
Change in Unrealized Appreciation/ (Depreciation) |
Ending Value as of December 31, 2023 |
||||||||||||||||||
| AB International Bond Portfolio (Class A) |
$ | 238,012,589 | $ | 15,107,626 | $ | (22,721,486 | ) | $ | (7,293,946 | ) | $ | 15,563,345 | $ | 238,668,128 | ||||||||||
| Allspring Mid Cap Value Portfolio (Class A) |
24,020,584 | 3,678,941 | (2,293,219 | ) | (125,398 | ) | (1,187,809 | ) | 24,093,099 | |||||||||||||||
| Baillie Gifford International Stock Portfolio (Class A) |
356,399,230 | 5,898,987 | (81,557,734 | ) | 11,262,829 | 45,986,883 | 337,990,195 | |||||||||||||||||
| BlackRock Bond Income Portfolio (Class A) |
661,196,454 | 28,806,742 | (39,262,397 | ) | (8,075,902 | ) | 24,424,772 | 667,089,669 | ||||||||||||||||
| BlackRock Capital Appreciation Portfolio (Class A) |
216,061,354 | 4,849,000 | (73,331,379 | ) | (16,131,026 | ) | 106,926,423 | 238,374,372 | ||||||||||||||||
| BlackRock High Yield Portfolio (Class A) |
56,753,133 | 24,531,968 | (4,676,938 | ) | (836,575 | ) | 5,572,791 | 81,344,379 | ||||||||||||||||
| Brighthouse Small Cap Value Portfolio (Class A) |
165,404,593 | 22,743,948 | (28,261,665 | ) | (4,828,685 | ) | 12,273,340 | 167,331,531 | ||||||||||||||||
| Brighthouse/abrdn Emerging Markets Equity Portfolio (Class A) |
142,841,489 | 6,986,071 | (12,958,770 | ) | (1,384,922 | ) | 9,353,080 | 144,836,948 | ||||||||||||||||
| Brighthouse/Artisan International Portfolio (Class A) |
287,810,301 | 5,577,003 | (41,072,694 | ) | (811,436 | ) | 35,306,268 | 286,809,442 | ||||||||||||||||
| Brighthouse/Artisan Mid Cap Value Portfolio (Class A) |
23,464,028 | 3,487,928 | (3,713,349 | ) | 127,674 | 705,617 | 24,071,898 | |||||||||||||||||
| Brighthouse/Dimensional International Small Company Portfolio (Class A) |
97,065,984 | 7,057,953 | (14,606,954 | ) | (6,458,911 | ) | 13,510,555 | 96,568,627 | ||||||||||||||||
| Brighthouse/Eaton Vance Floating Rate Portfolio (Class A) |
188,810,057 | 16,417,766 | (49,609,166 | ) | (3,255,097 | ) | 11,896,904 | 164,260,464 | ||||||||||||||||
| Brighthouse/Franklin Low Duration Total Return Portfolio (Class A) |
188,913,317 | 14,661,226 | (19,208,423 | ) | (3,235,849 | ) | 6,824,882 | 187,955,153 | ||||||||||||||||
| Brighthouse/Templeton International Bond Portfolio (Class A) |
218,891,130 | 4,166,132 | (13,466,219 | ) | (8,461,348 | ) | 16,149,716 | 217,279,411 | ||||||||||||||||
| Brighthouse/Wellington Core Equity Opportunities Portfolio (Class A) |
407,555,796 | 49,427,040 | (34,797,979 | ) | (2,369,190 | ) | (16,990,265 | ) | 402,825,402 | |||||||||||||||
| Brighthouse/Wellington Large Cap Research Portfolio (Class A) |
283,735,584 | 18,701,935 | (62,770,858 | ) | (2,613,038 | ) | 50,309,969 | 287,363,592 | ||||||||||||||||
| CBRE Global Real Estate Portfolio (Class A) |
141,330,594 | 4,994,568 | (16,112,260 | ) | (15,531 | ) | 13,675,403 | 143,872,774 | ||||||||||||||||
| Harris Oakmark International Portfolio (Class A) |
383,747,870 | 12,643,056 | (73,028,208 | ) | 6,021,805 | 56,486,962 | 385,871,485 | |||||||||||||||||
| Invesco Comstock Portfolio (Class A) |
383,153,318 | 78,028,735 | (45,947,559 | ) | (6,790,182 | ) | (22,892,192 | ) | 385,552,120 | |||||||||||||||
| Invesco Global Equity Portfolio (Class A) |
93,011,230 | 6,134,043 | (25,768,764 | ) | (430,075 | ) | 23,527,432 | 96,473,866 | ||||||||||||||||
| Invesco Small Cap Growth Portfolio (Class A) |
115,438,043 | 1,491,873 | (11,266,857 | ) | (6,569,471 | ) | 20,632,595 | 119,726,183 | ||||||||||||||||
| Jennison Growth Portfolio (Class A) |
231,899,722 | 4,686,201 | (85,781,387 | ) | (24,307,329 | ) | 135,487,087 | 261,984,294 | ||||||||||||||||
| JPMorgan Core Bond Portfolio (Class A) |
235,439,248 | 10,632,544 | (14,135,047 | ) | (2,275,541 | ) | 8,499,468 | 238,160,672 | ||||||||||||||||
| JPMorgan Small Cap Value Portfolio (Class A) |
69,758,558 | 10,379,177 | (10,909,548 | ) | (3,863,622 | ) | 6,278,062 | 71,642,627 | ||||||||||||||||
| Loomis Sayles Growth Portfolio (Class A) |
252,955,367 | 17,781,953 | (103,501,087 | ) | (12,184,970 | ) | 109,634,962 | 264,686,225 | ||||||||||||||||
| Loomis Sayles Small Cap Growth Portfolio (Class A) |
71,003,198 | 1,420,143 | (9,080,186 | ) | (1,324,920 | ) | 9,647,918 | 71,666,153 | ||||||||||||||||
| MFS Research International Portfolio (Class A) |
216,056,767 | 25,678,759 | (20,680,976 | ) | 2,285,799 | 17,219,709 | 240,560,058 | |||||||||||||||||
BHFTII-11
Brighthouse Funds Trust II
Brighthouse Asset Allocation 60 Portfolio
Notes to Financial Statements—December 31, 2023—(Continued)
| Security Description |
Market Value December 31, 2022 |
Purchases | Sales | Realized Gain/(Loss) |
Change in Unrealized Appreciation/ (Depreciation) |
Ending Value as of December 31, 2023 |
||||||||||||||||||
| MFS Value Portfolio (Class A) |
$ | 479,249,425 | $ | 68,013,480 | $ | (40,655,425 | ) | $ | (9,449,701 | ) | $ | (18,984,731 | ) | $ | 478,173,048 | |||||||||
| Neuberger Berman Genesis Portfolio (Class A) |
69,763,127 | 6,931,939 | (9,359,187 | ) | 1,933,406 | 2,311,984 | 71,581,269 | |||||||||||||||||
| PIMCO Inflation Protected Bond Portfolio (Class A) |
281,203,277 | 14,381,555 | (38,819,515 | ) | (7,196,638 | ) | 10,939,113 | 260,507,792 | ||||||||||||||||
| PIMCO Total Return Portfolio (Class A) |
567,330,604 | 28,553,534 | (16,542,321 | ) | (3,846,807 | ) | 21,061,776 | 596,556,786 | ||||||||||||||||
| SSGA Emerging Markets Enhanced Index Portfolio (Class A) |
94,375,591 | 5,601,929 | (11,896,034 | ) | (672,835 | ) | 9,155,648 | 96,564,299 | ||||||||||||||||
| T. Rowe Price Large Cap Growth Portfolio (Class A) |
189,383,527 | 6,386,712 | (63,531,151 | ) | (17,483,358 | ) | 99,073,918 | 213,829,648 | ||||||||||||||||
| T. Rowe Price Large Cap Value Portfolio (Class A) |
430,629,718 | 74,224,477 | (39,554,230 | ) | (10,954,577 | ) | (20,020,392 | ) | 434,324,996 | |||||||||||||||
| T. Rowe Price Mid Cap Growth Portfolio (Class A) |
47,316,826 | 2,480,201 | (8,199,538 | ) | (1,897,746 | ) | 8,401,889 | 48,101,632 | ||||||||||||||||
| T. Rowe Price Small Cap Growth Portfolio (Class A) |
165,128,960 | 4,429,564 | (31,470,991 | ) | (5,148,391 | ) | 34,305,480 | 167,244,622 | ||||||||||||||||
| TCW Core Fixed Income Portfolio (Class A) |
485,642,185 | 21,797,822 | (27,578,640 | ) | (4,236,664 | ) | 17,052,474 | 492,677,177 | ||||||||||||||||
| VanEck Global Natural Resources Portfolio (Class A) |
276,985,369 | 48,450,900 | (24,768,294 | ) | 2,093,114 | (16,990,459 | ) | 285,770,630 | ||||||||||||||||
| Western Asset Management Strategic Bond Opportunities Portfolio (Class A) |
189,006,694 | 15,000,776 | (16,469,722 | ) | (4,147,315 | ) | 8,576,216 | 191,966,649 | ||||||||||||||||
| Western Asset Management U.S. Government Portfolio (Class A) |
377,951,154 | 16,283,135 | (23,562,936 | ) | (3,565,942 | ) | 12,258,032 | 379,363,443 | ||||||||||||||||
|
|
|
|
|
|
|
|
|
|
|
|
|
|||||||||||||
| $ | 9,404,695,995 | $ | 718,507,342 | $ | (1,272,929,093 | ) | $ | (168,518,311 | ) | $ | 881,964,825 | $ | 9,563,720,758 | |||||||||||
|
|
|
|
|
|
|
|
|
|
|
|
|
|||||||||||||
| Security Description |
Capital Gain Distributions from Affiliated Investments |
Income earned from affiliates during the period |
Number of shares held at December 31, 2023 |
|||||||||
| AB International Bond Portfolio (Class A) |
$ | — | $ | 12,287,913 | 29,908,287 | |||||||
| Allspring Mid Cap Value Portfolio (Class A) |
3,174,144 | 300,567 | 2,145,423 | |||||||||
| Baillie Gifford International Stock Portfolio (Class A) |
— | 4,254,565 | 32,281,776 | |||||||||
| BlackRock Bond Income Portfolio (Class A) |
— | 20,611,680 | 7,230,541 | |||||||||
| BlackRock Capital Appreciation Portfolio (Class A) |
4,655,029 | 100,691 | 6,577,659 | |||||||||
| BlackRock High Yield Portfolio (Class A) |
— | 4,188,708 | 11,037,229 | |||||||||
| Brighthouse Small Cap Value Portfolio (Class A) |
13,766,326 | 2,069,680 | 11,909,718 | |||||||||
| Brighthouse/abrdn Emerging Markets Equity Portfolio (Class A) |
— | 1,792,036 | 16,402,825 | |||||||||
| Brighthouse/Artisan International Portfolio (Class A) |
— | 4,976,857 | 27,872,638 | |||||||||
| Brighthouse/Artisan Mid Cap Value Portfolio (Class A) |
3,067,168 | 202,201 | 110,742 | |||||||||
| Brighthouse/Dimensional International Small Company Portfolio (Class A) |
3,018,264 | 2,422,180 | 9,589,735 | |||||||||
| Brighthouse/Eaton Vance Floating Rate Portfolio (Class A) |
— | 9,541,863 | 16,558,515 | |||||||||
| Brighthouse/Franklin Low Duration Total Return Portfolio (Class A) |
— | 6,914,808 | 21,382,839 | |||||||||
| Brighthouse/Templeton International Bond Portfolio (Class A) |
— | — | 27,678,906 | |||||||||
| Brighthouse/Wellington Core Equity Opportunities Portfolio (Class A) |
42,659,579 | 5,778,482 | 14,124,313 | |||||||||
| Brighthouse/Wellington Large Cap Research Portfolio (Class A) |
15,612,594 | 2,381,582 | 20,793,313 | |||||||||
| CBRE Global Real Estate Portfolio (Class A) |
— | 3,838,743 | 13,650,168 | |||||||||
| Harris Oakmark International Portfolio (Class A) |
— | 7,964,387 | 29,410,936 | |||||||||
| Invesco Comstock Portfolio (Class A) |
66,503,898 | 8,418,885 | 30,263,118 | |||||||||
| Invesco Global Equity Portfolio (Class A) |
5,467,846 | 353,451 | 4,029,819 | |||||||||
| Invesco Small Cap Growth Portfolio (Class A) |
— | — | 14,600,754 | |||||||||
| Jennison Growth Portfolio (Class A) |
— | — | 18,282,226 | |||||||||
| JPMorgan Core Bond Portfolio (Class A) |
— | 7,265,218 | 26,258,067 | |||||||||
| JPMorgan Small Cap Value Portfolio (Class A) |
5,949,567 | 962,245 | 6,345,671 | |||||||||
| Loomis Sayles Growth Portfolio (Class A) |
15,285,384 | — | 17,065,521 | |||||||||
| Loomis Sayles Small Cap Growth Portfolio (Class A) |
— | — | 6,748,225 | |||||||||
| MFS Research International Portfolio (Class A) |
4,268,174 | 3,824,727 | 19,880,996 | |||||||||
| MFS Value Portfolio (Class A) |
56,350,218 | 8,917,590 | 34,351,512 | |||||||||
| Neuberger Berman Genesis Portfolio (Class A) |
6,191,907 | 91,169 | 3,875,542 | |||||||||
| PIMCO Inflation Protected Bond Portfolio (Class A) |
— | 6,179,795 | 27,421,873 | |||||||||
| PIMCO Total Return Portfolio (Class A) |
— | 17,747,156 | 60,136,773 | |||||||||
| SSGA Emerging Markets Enhanced Index Portfolio (Class A) |
— | 3,189,175 | 9,883,756 | |||||||||
| T. Rowe Price Large Cap Growth Portfolio (Class A) |
— | — | 10,329,935 | |||||||||
| T. Rowe Price Large Cap Value Portfolio (Class A) |
62,181,351 | 8,921,030 | 16,482,922 | |||||||||
| T. Rowe Price Mid Cap Growth Portfolio (Class A) |
2,370,643 | — | 5,058,006 | |||||||||
| T. Rowe Price Small Cap Growth Portfolio (Class A) |
3,978,062 | 91,031 | 8,404,252 | |||||||||
| TCW Core Fixed Income Portfolio (Class A) |
— | 14,939,180 | 55,294,857 | |||||||||
| VanEck Global Natural Resources Portfolio (Class A) |
— | 8,238,160 | 24,034,536 | |||||||||
| Western Asset Management Strategic Bond Opportunities Portfolio (Class A) |
— | 12,474,648 | 17,499,239 | |||||||||
| Western Asset Management U.S. Government Portfolio (Class A) |
— | 8,764,694 | 35,992,737 | |||||||||
|
|
|
|
|
|||||||||
| $ | 314,500,154 | $ | 200,005,097 | |||||||||
|
|
|
|
|
|||||||||
BHFTII-12
Brighthouse Funds Trust II
Brighthouse Asset Allocation 60 Portfolio
Notes to Financial Statements—December 31, 2023—(Continued)
7. Contractual Obligations
Under the Trust’s organizational documents, its officers and Trustees may be indemnified against certain liabilities and expenses arising out of the performance of their duties to the Trust. Additionally, the Trust has a variety of indemnification obligations under contracts with its service providers. The Trust’s maximum exposure under these arrangements is unknown, as this would involve future claims that may be made against the Trust that have not yet occurred.
8. Income Tax Information
The cost basis of investments for federal income tax purposes at December 31, 2023 was as follows:
| Cost basis of investments |
$ | 10,169,736,973 | ||
|
|
|
|||
| Gross unrealized appreciation |
237,425,727 | |||
| Gross unrealized (depreciation) |
(843,441,942 | ) | ||
|
|
|
|||
| Net unrealized appreciation (depreciation) |
$ | (606,016,215 | ) | |
|
|
|
The tax character of distributions paid for the years ended December 31, 2023 and 2022 were as follows:
| Ordinary Income |
Long-Term Capital Gain | Total | ||||||||||||||||||
| 2023 |
2022 | 2023 | 2022 | 2023 | 2022 | |||||||||||||||
| $292,562,238 | $ | 221,924,534 | $ | 771,278,096 | $ | 795,463,950 | $ | 1,063,840,334 | $ | 1,017,388,484 | ||||||||||
As of December 31, 2023, the components of distributable earnings (accumulated losses) on a federal income tax basis were as follows:
| Undistributed |
Undistributed Long-Term Capital Gain |
Net Unrealized Appreciation (Depreciation) |
Accumulated Capital Losses |
Total | ||||||||||||
| $174,018,450 | $ | 156,457,197 | $ | (606,016,215 | ) | $ | — | $ | (275,540,568 | ) | ||||||
The Asset Allocation Portfolio utilizes the provisions of the federal income tax laws that provide for the carryforward of capital losses for prior years, offsetting such losses against any future realized capital gains. Net capital losses may be carried forward indefinitely and their character is retained as short-term and/or long-term losses.
As of December 31, 2023, the Asset Allocation Portfolio had no accumulated capital losses.
9. Regulatory Updates
Effective January 24, 2023, the Securities and Exchange Commission adopted rule and form amendments that require open-end management investment companies to transmit concise and visually engaging annual and semiannual reports to shareholders that highlight certain information deemed by the SEC to be particularly important for investors. Certain other information, including financial statements, will no longer appear in shareholder reports but will, as required, be available online, delivered free of charge upon request, and filed on a semiannual basis on Form N-CSR. The rule and form amendments have a compliance date of July 24, 2024. Accordingly, the rule and form amendments will not impact the Portfolio until its 2024 semiannual shareholder report.
BHFTII-13
Brighthouse Funds Trust II
Brighthouse Asset Allocation 60 Portfolio
Report of Independent Registered Public Accounting Firm
To the Board of Trustees of Brighthouse Funds Trust II and Shareholders of the Brighthouse Asset Allocation 60 Portfolio:
Opinion on the Financial Statements and Financial Highlights
We have audited the accompanying statement of assets and liabilities, including the schedule of investments, of the Brighthouse Asset Allocation 60 Portfolio (the “Fund”) (one of the funds constituting the Brighthouse Funds Trust II), as of December 31, 2023, the related statement of operations for the year then ended, the statements of changes in net assets for each of the two years in the period then ended, the financial highlights for each of the five years in the period then ended, and the related notes. In our opinion, the financial statements and financial highlights present fairly, in all material respects, the financial position of the Fund as of December 31, 2023, and the results of its operations for the year then ended, the changes in its net assets for each of the two years in the period then ended, and the financial highlights for each of the five years in the period then ended in conformity with accounting principles generally accepted in the United States of America.
Basis for Opinion
These financial statements and financial highlights are the responsibility of the Fund’s management. Our responsibility is to express an opinion on the Fund’s financial statements and financial highlights based on our audits. We are a public accounting firm registered with the Public Company Accounting Oversight Board (United States) (PCAOB) and are required to be independent with respect to the Fund in accordance with the U.S. federal securities laws and the applicable rules and regulations of the Securities and Exchange Commission and the PCAOB.
We conducted our audits in accordance with the standards of the PCAOB. Those standards require that we plan and perform the audit to obtain reasonable assurance about whether the financial statements and financial highlights are free of material misstatement, whether due to error or fraud. The Fund is not required to have, nor were we engaged to perform, an audit of its internal control over financial reporting. As part of our audits we are required to obtain an understanding of internal control over financial reporting but not for the purpose of expressing an opinion on the effectiveness of the Fund’s internal control over financial reporting. Accordingly, we express no such opinion.
Our audits included performing procedures to assess the risks of material misstatement of the financial statements and financial highlights, whether due to error or fraud, and performing procedures that respond to those risks. Such procedures included examining, on a test basis, evidence regarding the amounts and disclosures in the financial statements and financial highlights. Our audits also included evaluating the accounting principles used and significant estimates made by management, as well as evaluating the overall presentation of the financial statements and financial highlights. Our procedures included confirmation of securities owned as of December 31, 2023, by correspondence with the transfer agent. We believe that our audits provide a reasonable basis for our opinion.
/s/ Deloitte & Touche LLP
Boston, Massachusetts
February 23, 2024
We have served as the auditor of one or more Brighthouse investment companies since 1983.
BHFTII-14
Brighthouse Funds Trust II
Trustees and Officers
MANAGEMENT OF THE TRUSTS
The Boards of Trustees (the “Board”) of Brighthouse Funds Trust I and Brighthouse Funds Trust II (“Trust I” and “Trust II”, respectively, and collectively the “Trusts”) supervise the Trusts and are responsible for representing the interests of shareholders. The Trustees, the Chairman of the Board and the Chairmen of each subcommittee are the same for both Trusts. The Trustees of each Trust meet periodically throughout the year to oversee the Portfolios’ activities, reviewing, among other things, each Portfolio’s performance and its contractual arrangements with various service providers. The Trustees of each Trust elect the officers of the Trust, who are responsible for administering the Trust’s day-to-day operations.
Trustees and Officers
The Trustees and executive officers of the Trusts, as well as their ages and their principal occupations during the past five years, are set forth below. Unless otherwise indicated, the business address of each is c/o Brighthouse Funds Trust I and Brighthouse Funds Trust II, 11225 N. Community House Rd., Charolette, North Carolina 28277. Each Trustee who is deemed an “interested person,” as such term is defined in the 1940 Act, is referred to as an “Interested Trustee.” Those Trustees who are not “interested persons,” as such term is defined in the 1940 Act, are referred to as “Independent Trustees.” There is no limit to the term a Trustee may serve, other than pursuant to the retirement policy adopted by the Independent Trustees. Trustees serve until their death, resignation, retirement or removal in accordance with Trust I’s and Trust II’s respective organizational documents and policies adopted by the Board of the Trust from time to time. Officers hold office at the pleasure of each Board and serve until their removal or resignation in accordance with the Trusts’ respective organizational documents and policies adopted by the Board of each Trust from time to time.
Trustees of the Trusts
| Name and Year of Birth |
Position(s) |
Term of Office |
Principal Occupation(s) During the Past |
Number of |
Other Directorships Held | |||||
| Interested Trustee | ||||||||||
| John Rosenthal* (1960) |
Trustee | Indefinite; From May 2016 (Trust I and Trust II) to present | Chief Investment Officer, Brighthouse Financial, Inc. (2016 to present). | 73 | None | |||||
| Independent Trustees | ||||||||||
| Dawn M. Vroegop (1966) |
Trustee and Chair of the Board | Indefinite; From December 2000 (Trust I)/May 2009 (Trust II) to present as Trustee; From May 2016 (Trust I and Trust II) until present as Chair | Retired; Private Investor. | 73 | Trustee, Driehaus Mutual Funds (8 portfolios).** | |||||
| Stephen M. Alderman (1959) |
Trustee | Indefinite; From December 2000 (Trust I)/April 2012 (Trust II) to present | Vice President and General Counsel, IHR Aerial Solutions, LLC; Until 2022, General Counsel, Illini Hi-Reach, Inc.; Until 2020, Shareholder in the law firm of Garfield & Merel, Ltd. | 73 | None | |||||
| Robert J. Boulware (1956) |
Trustee | Indefinite; From March 2008 (Trust I)/April 2012 (Trust II) to present | Managing Member, Pilgrim Funds, LLC (private equity fund). | 73 | Trustee, Vertical Capital Income Fund (closed-end fund);** Trustee, The Private Shares Fund (closed-end fund);** Until 2021, Director, Mid-Con Energy Partners, LP (energy);** Until 2020, Director, Gainsco, Inc. (auto insurance).** | |||||
BHFTII-15
Brighthouse Funds Trust II
Trustees and Officers—(Continued)
| Name and Year of Birth |
Position(s) |
Term of Office |
Principal Occupation(s) During the Past |
Number of |
Other Directorships Held | |||||
| Susan C. Gause (1952) |
Trustee | Indefinite; From March 2008 (Trust I)/April 2012 (Trust II) to present | Private Investor. | 73 | Trustee, HSBC Funds (4 portfolios).** | |||||
| Nancy Hawthorne (1951) |
Trustee | Indefinite; From May 2003 (Trust II)/April 2012 (Trust I) to present | Private Investor. | 73 | Trustee, First Eagle Credit Opportunities Fund;** Trustee and Chair of the Board of Trustees, First Eagle Global Opportunities Fund;** Director, Avid Technology, Inc;** Director, CRA International, Inc.** | |||||
Executive Officers of the Trusts
| Name and Year of Birth |
Position(s) |
Term of Office |
Principal Occupation(s) | |||
| Kristi Slavin (1973) | President and Chief Executive Officer, of Trust I and Trust II | From May 2016 (Trust I and Trust II) to present |
President, Brighthouse Investment Advisers, LLC (2016-present). | |||
| Alan R. Otis (1971) | Chief Financial Officer and Treasurer, of Trust I and Trust II | From November 2017 (Trust I and Trust II) to present |
Executive Vice President, Brighthouse Investment Advisers, LLC (2017-present); formerly, Vice President, Brighthouse Investment Advisers, LLC (2012-2017); Assistant Treasurer, Trust I and Trust II (2012-2017). | |||
| Thomas Watterson (1985) | Secretary, of Trust I and Trust II | From November 2023 (Trust I and Trust II) to present |
Executive Vice President, Chief Legal Officer and Secretary, Brighthouse Investment Advisers, LLC (2023-Present); Managing Corporate Counsel, Brighthouse Financial Inc. (2023-present); Managing Counsel and Director, The Bank of New York Mellon Corporation (2019-2023); Counsel and Vice President, The Bank of New York Mellon Corporation (2016-2019). | |||
| Katie Hellmann (1980) | Chief Compliance Officer (“CCO”), of Trust I and Trust II | From May 2023 (Trust I and Trust II) to present |
Chief Compliance Officer, Brighthouse Investment Advisers, LLC (2023-present) and Head of Funds and Investments Compliance (2023-present). Deputy Chief Compliance Officer, Transamerica Asset Management (2022-2023). Leader and Senior Compliance Counsel – Funds Compliance, Edward Jones (2017-2022). | |||
| Rosemary Morgan (1983) | Anti-Money Laundering Officer, of Trust I and Trust II | From May 2023 (Trust I and Trust II) to present |
Chief Privacy Officer, Leader of Compliance Programs and Assistant General Counsel, Brighthouse Financial, Inc. (2019-2022); Chief Privacy Officer, Head of Compliance Programs & Contracts Law, Brighthouse Financial, Inc. (2022-2023), Chief Compliance Officer and Associate General Counsel, Brighthouse Financial, Inc. (2023-present); Vice President and Chief Compliance Officer, Brighthouse Life Insurance Company (2023-present); Vice President and Chief Compliance Officer (2023-present), Brighthouse Life Insurance Company of NY; Vice President and Chief Compliance Officer (2023-present), New England Life Insurance Company. | |||
| Anna Koska (1981) | Vice President, of Trust I and Trust II | From June 2022 (Trust I and Trust II) to present |
Vice President, Investment and Advisory Services, Brighthouse Investment Advisers, LLC (2022-present); Director of Investment and Advisory Services, Brighthouse Investment Advisers, LLC (2019-2022); Senior Portfolio Analyst, Brighthouse Investment Advisers, LLC (2017-2019). | |||
| * | Mr. Rosenthal is an “interested person” of the Trusts because of his position with Brighthouse Financial, Inc. (“Brighthouse Financial”), an affiliate of BIA. |
| ** | Indicates a directorship with a registered investment company or a company subject to the reporting requirements of the Securities Exchange Act of 1934, as amended. |
| (1) | Previous positions during the past five years with the Trusts, MetLife, Inc. or the Adviser are omitted if not materially different. |
| (2) | The Fund Complex includes 44 Trust I Portfolios and 29 Trust II Portfolios. |
BHFTII-16
Brighthouse Funds Trust II
Brighthouse Asset Allocation 60 Portfolio
Board of Trustees’ Consideration of Advisory Agreements
At a meeting held on November 13-14, 2023 (the “November Meeting”), the Boards of Trustees (the “Board”) of Brighthouse Funds Trust I and Brighthouse Funds Trust II (“BFT I” and “BFT II,” respectively, and collectively, the “Trusts”), including a majority of the Trustees who are not “interested persons” of the Trusts (the “Independent Trustees”) under the Investment Company Act of 1940 (the “1940 Act”), approved the continuation of the Trusts’ advisory agreements (the “Advisory Agreements” or “Agreements”) with Brighthouse Investment Advisers, LLC (the “Adviser”) for the series of the Trusts (each a “Portfolio,” and collectively, the “Portfolios”) for the annual contract renewal period from January 1, 2024 through December 31, 2024.
The Board met with personnel of the Adviser on September 28-29, 2023 (the “September Meeting”) for the specific purpose of giving preliminary consideration to the proposed continuation of the Agreements, including consideration to information that the Adviser had provided for the Board’s review at the request of the Independent Trustees. At the September Meeting, the Adviser reviewed with the Board the performance and fees experienced by each Portfolio, as well as other information. During and after the September Meeting, the Independent Trustees requested additional information and clarifications that the Adviser addressed at the November Meeting (the September Meeting and the November Meeting are referred to collectively as, the “Meetings”). During the contract renewal process, and throughout the year, the Independent Trustees were advised by independent legal counsel, and they met with independent legal counsel in executive sessions outside of the presence of management on a number of occasions to discuss, among other things, the renewal of the Agreements.
In considering the continuation of the Agreements, the Board reviewed a variety of materials that were provided for the specific purpose of assisting the Board in the renewal process, along with various information and materials that were provided to and discussed with the Board throughout the year, at regularly scheduled meetings of the Board and its committees. In particular, information for each Portfolio included, but was not limited to, reports on investment performance, expenses, legal and compliance matters, and asset pricing. Information about the Adviser included, but was not limited to, reports on the business, operations, and performance of the Adviser and reports that the Adviser had prepared specifically for the renewal process.
In considering the continuation of the Agreements, the Board also reviewed, among other things, a report for each Portfolio that was prepared by Broadridge (“Broadridge”), an independent organization, which set forth comparative performance and expense information for each Portfolio. In addition, the Independent Trustees reviewed a report that was prepared by JDL Consultants, LLC (“JDL”), an independent consultant to the Independent Trustees, which examined the Broadridge reports for each Portfolio (“JDL Report”). The Independent Trustees met in executive session with representatives of JDL during the September Meeting to review the JDL Report.
At the November Meeting, the Board, including a majority of the Independent Trustees, concluded that the nature, extent, and quality of services provided by the Adviser supported the renewal of the Agreements. The Board also concluded that the investment services provided to and the performance of each Portfolio was such that each Agreement should continue, and that the fees paid by each Portfolio to the Adviser appeared to be reasonable in light of the nature, extent, and quality of the services provided by the Adviser. Further, the Board concluded that the Adviser’s profitability in providing services under the Advisory Agreements did not appear unreasonable in light of the nature, extent, and quality of the services provided by the Adviser. The Board reviewed the extent to which the investment advisory fees paid by the Portfolios shared economies of scale with investors or entailed the potential to share economies of scale with investors and concluded that those considerations generally supported the renewal of each Agreement.
In approving the continuation of each Agreement, the Board, including the Independent Trustees, gave attention to all of the information that was furnished, and each Trustee placed varying degrees of importance on the various pieces of information that were provided to them. The Board evaluated the information provided to it on a Portfolio-by-Portfolio basis, and its decision was made separately with respect to each Portfolio. The following paragraphs provide more information about some of the primary factors that were relevant to the Board’s decisions. The Board did not identify any single factor as determinative, and the Trustees generally attributed different weights to various factors for the various Portfolios.
Nature, extent and quality of services. The Board evaluated the nature, extent and quality of the services that the Adviser has provided to the Brighthouse Asset Allocation 20 Portfolio, Brighthouse Asset Allocation 40 Portfolio, Brighthouse Asset Allocation 60 Portfolio Brighthouse Asset Allocation 80 Portfolio and Brighthouse Asset Allocation 100 Portfolio (the “Asset Allocation Portfolios”) and the American Funds Balanced Allocation Portfolio, American Funds Growth Allocation Portfolio and American Funds Moderate Allocation Portfolio (the “American Funds of Funds”). The Board considered the Adviser’s services as investment manager to the Portfolios, including information with respect to investment programs and personnel, succession management of key personnel, oversight of transition management (as applicable), actions taken with respect to regulatory developments, compliance programs and personnel, and risk management programs, among other things. The Adviser’s services in coordinating and overseeing the activities of the Trusts’ other service providers were also considered. The Board also considered the systems and processes required by the Adviser
BHFTII-17
Brighthouse Funds Trust II
Brighthouse Asset Allocation 60 Portfolio
Board of Trustees’ Consideration of Advisory Agreements—(Continued)
to meet additional regulatory and compliance requirements resulting from U.S. Securities and Exchange Commission and other regulatory initiatives, including related to liquidity, valuation, and derivatives risk management. The Board considered information received from the Trusts’ Chief Compliance Officer regarding the Portfolios’ compliance policies and procedures that were established pursuant to Rule 38a-l under the 1940 Act and relevant aspects of the Adviser’s compliance policies and procedures. The Board also noted that the Adviser’s investment, compliance, and legal staff reviews and assesses the services that are provided to the Portfolios, and that personnel of the Adviser routinely prepare and present reports to the Independent Trustees regarding material information related to those reviews and assessments. In addition, during the Meetings and throughout the year, the Board considered the expertise, experience, and performance of the personnel of the Adviser who performed the various services that are mentioned above.
With respect to the Asset Allocation Portfolios, the Board noted that the Adviser employs at its own expense an independent consultant to provide research and consulting services with respect to the periodic asset allocation targets for each of the Asset Allocation Portfolios and investments in other Portfolios of the Trusts (the “Underlying Portfolios”). Additionally, the Board considered that a committee, consisting of investment professionals from the Adviser, meets regularly to review the management of the Asset Allocation Portfolios and the American Funds of Funds, including asset allocations and performance metrics.
Performance. The Board placed emphasis on the performance of each Portfolio in the context of the performance of the relevant markets in which the Portfolio invests. The Board considered the Adviser’s quarterly presentations to the Board of detailed information about each Portfolio’s investment strategies and performance results and composition, including discussions regarding the relevant effects of market conditions. The Board reviewed and considered the reports prepared by Broadridge, which provided a statistical analysis comparing each Portfolio’s investment performance to that of comparable funds underlying variable insurance products (the “Performance Universe”), and the JDL Report. The Board considered each Portfolio’s performance for periods subsequent to the performance period covered by the Broadridge reports, and considered the Adviser’s assessment of the same. The Board also noted that while it found the data provided by Broadridge generally useful, it recognized the limitations of such data, including, in particular, that notable differences may exist between a Portfolio and the other funds in a Broadridge category (for example, with respect to investment strategies) and that the results of the performance comparisons may vary depending on (i) the end dates for the performance periods that were selected, and (ii) the selection of the peer groups.
Fees and Expenses. The Board gave consideration to the level and method of computing the fees payable under the Agreements. The Board reviewed and considered the information in the JDL Report concerning fees and expenses. The Board also reviewed and considered the Broadridge report for each Portfolio, which included various comparisons of the Portfolio’s fees (at December 31, 2022 and various asset levels) and expenses, with those of its peers, including, as applicable, a broad group of peer funds (“Expense Universe”) and a narrower group of peer funds (“Expense Group”). In particular, the Board reviewed comparisons of each Portfolio’s contractual management fees with its Expense Group and total expenses with its Expense Universe and Expense Group. The Board considered that Broadridge selected the peer funds, which were funds underlying variable insurance products that Broadridge deemed to be comparable to the Portfolios. The Board considered that the fee and expense information in the Broadridge report for each Portfolio reflected information as of the Portfolio’s most recent fiscal year end at the time the Broadridge report was issued and that historical asset levels may differ from current asset levels, particularly in a period of market volatility.
The Board also considered that the Adviser had entered into an expense limitation and management fee waiver agreement with Brighthouse Asset Allocation 20 Portfolio pursuant to which the Adviser had agreed to waive a portion of its advisory fee and/or reimburse certain expenses as a means of limiting the Portfolio’s total annual operating expenses.
Profitability. The Board examined the profitability to the Adviser of each Advisory Agreement, on a Portfolio-by-Portfolio basis. In the case of the Asset Allocation Portfolios, the Board also considered the Adviser’s analysis of its profitability that was attributable to its management of the Underlying Portfolios of the Trust in which the Asset Allocation Portfolios invest. The Board also considered that an affiliate of the Adviser, Brighthouse Securities, LLC, serves as distributor for the Trusts, and, as such, receives Rule 12b-1 payments to support the distribution of the Portfolios. In reviewing the profitability information, the Board recognized that expense allocation methodologies are inherently subjective and various methodologies may be reasonable while producing different results.
Economies of scale. The Board considered each Portfolio’s fees in light of its size. The Board noted the fee schedules for the Portfolios contain breakpoints that reduce the fee rate above specified asset levels.
The Board considered the effective fees under the Advisory Agreement for each Portfolio as a percentage of assets at different asset levels and possible economies of scale that may be realized if the assets of the Portfolio grow. The Board examined, among other data, the effect of a Portfolio’s growth in size, and reduction in size, on various fee schedules. The Board also generally noted that if a Portfolio’s assets increase over time, the Portfolio may realize economies of scale if assets increase proportionally more than certain other expenses.
BHFTII-18
Brighthouse Funds Trust II
Brighthouse Asset Allocation 60 Portfolio
Board of Trustees’ Consideration of Advisory Agreements—(Continued)
Other factors. The Board considered other benefits that may be realized by the Adviser and its affiliates from their relationships with the Trusts. Among the benefits realized by the Adviser, the Board recognized that Brighthouse Securities, LLC, as the distributor for the Trusts, receives payments pursuant to Rule 12b-1 from the Portfolios to help compensate for the provision of distribution and shareholder services activities.
The Board considered information from the Adviser pertaining to potential conflicts of interest, and the manner in which any potential conflicts were mitigated.
* * * * *
Brighthouse Asset Allocation 60 Portfolio. The Board also considered the following information in relation to the Agreement with the Adviser regarding the Portfolio:
Among other data relating specifically to the Portfolio’s performance, the Board considered that the Portfolio outperformed the median of its Performance Universe and the average of its Morningstar Category for the one- and three-year periods ended June 30, 2023 and underperformed the median of its Performance Universe and the average of its Morningstar Category for the five-year period ended June 30, 2023. The Board further considered that the Portfolio underperformed the Brighthouse AA 60 Narrow Index for the one- and five-year periods ended October 31, 2023 and outperformed the same index for the three-year period ended October 31, 2023. The Board also noted that the Portfolio outperformed its benchmark, the Dow Jones Moderate Portfolio Index, for the one-, three-, and five-year periods ended October 31, 2023.
The Board also considered that the Portfolio’s actual management fees were below the Expense Group median and the Expense Universe median. The Board also considered that the Portfolio’s total expenses (inclusive of underlying fund expenses and exclusive of 12b-1 fees) were below the Expense Group median and above the Expense Universe median. The Board noted that the Portfolio’s contractual management fees were below the asset-weighted average of the Investment Classification/Morningstar Category selected by Broadridge at the Portfolio’s current size.
BHFTII-19
Brighthouse Funds Trust II
Brighthouse Asset Allocation 80 Portfolio
Managed by Brighthouse Investment Advisers, LLC
Portfolio Manager Commentary*
PERFORMANCE
For the twelve months ended December 31, 2023, the Class A and B shares of the Brighthouse Asset Allocation 80 Portfolio returned 17.51% and 17.30%, respectively. The Portfolio’s benchmark, the Dow Jones Moderately Aggressive Portfolio Index¹, returned 15.59%.
MARKET ENVIRONMENT / CONDITIONS
Markets carried the momentum of late 2022 and ended the first quarter of 2023 on a positive note. After a string of seven consecutive rate hikes by the U.S. Federal Reserve (the “Fed”) in 2022, signs of high inflation began to wane, and speculation arose monetary tightening may soon end. At its February and March meetings, the Fed scaled back the magnitude of rate hikes and implemented increases of 0.25%, respectively. In March, the Fed moved quicky to inject liquidity into the banking sector after a few well-publicized bank failures surfaced. Bond and equity investors cheered the decisive action to quell the risk.
Investor enthusiasm began to falter in the second quarter of 2023. Bond markets were being pressured by central bank actions to raise rates as inflationary concerns continued to exist. In May, the Fed enacted its tenth consecutive rate hike before it voted to hold rates in check at its June meeting. The yield on the 10-year U.S. Treasury Bond rose throughout the quarter and negatively impacted government and investment grade credit bonds. In June, economic growth, as measured by the real gross domestic product (“GDP”) rate was positive as the first quarter 2023 real GDP growth rate reported a 2% annual gain. However, it marked the third straight quarter of decelerating GDP levels and raised doubts over the strength of the economy.
Conditions deteriorated in the third quarter with broad market declines amid a global equity correction and a worsening bond slump over the last two quarters. Equities pulled back after having established gains in the first half of the year. The possibility rates may remain higher and with central bank comments absent any definitive near-term relief, markets retreated. Globally, the European Union lowered its growth forecast and concern over China’s property sector pressured markets with Moody’s downgrading China’s property sector outlook to negative. The resilience of core bonds held up in the early part of the third quarter before prices declined sharply in the final two months of the quarter. The 10-Year U.S. Treasury yield moved aggressively over the period and rose 78 basis points (“bps”) and 50 bps in September alone. Though the Fed paused hiking rates at its September meeting, economic data showed a relatively healthy economy and kept hawkish monetary policies at the forefront.
The final two months of the year witnessed a robust turnaround for bonds and equities. Inflationary fears subsided and investors rejoiced that the cycle of rate hikes and aggressive monetary policies appeared to have levelled off and central banks may have their eyes focused instead on potential interest rate cuts for 2024. In the U.S., Fed officials kept their hands on the pause button during the fourth quarter and maintained the Federal Fund Rate at a range of 5.25% to 5.50%. Bond prices surged as the 10-Year U.S. Treasury yield fell 100 bps between October and the end of the year. Not to be outdone, several major broad-based equity markets had double-digit gains during the quarter.
For the full year ended 2023, the S&P 500 Index returned 26.29%. International stocks, as measured by the MSCI EAFE Index, gained 18.24%, and emerging market stocks, as measured by the MSCI Emerging Markets Index, returned 9.83%. Within fixed income, core bonds, as measured by the Bloomberg U.S. Aggregate Bond Index, returned 5.53% for the year ended December 31, 2023.
PORTFOLIO REVIEW / PERIOD-END POSITIONING
The Brighthouse Asset Allocation 80 Portfolio invests in underlying portfolios of the Brighthouse Funds Trust I and the Brighthouse Funds Trust II to maintain a broad asset allocation of approximately 80% to equities and 20% to fixed income.
Over the twelve-month period, the Portfolio outperformed the Dow Jones Moderately Aggressive Portfolio Index. Performance strength within the underlying fixed income and mid cap equity portfolios offset weakness within the underlying large cap, small cap, and international equity portfolios.
On an absolute return basis, the top performing underlying fixed income portfolios were the BlackRock High Yield Portfolio and the Brighthouse/Eaton Vance Floating Rate Portfolio as below investment grade bonds (“high yield”) performed well relative to higher credit quality rated bonds. The Western Asset Management Strategic Bond Opportunities Portfolio outperformed its benchmark by 3.9%. Allocations to high yield bonds and bank loans were primary contributors. Exposures to non-agency mortgage-backed securities (“MBS”) and emerging market debt aided returns. The BlackRock Bond Income Portfolio exceeded its benchmark by 0.3%. The Portfolio’s allocation to collateralized loan obligations (“CLOs”) and non-agency MBS drove its relative results. Contributions were made by positive security selections within U.S. investment grade credit bonds and Agency MBS. The Brighthouse/Templeton International Bond Portfolio underperformed its benchmark by 2.1%. Currency positioning in the euro, Japanese yen, and South Korean won were the primary detractors from relative results during the period.
Performance from the underlying domestic equity portfolios was mixed for the period. Large cap and small cap portfolios underperformed, while mid cap portfolios were positive contributors. In large cap, the Brighthouse/Wellington Core Equity Opportunities Portfolio underperformed its benchmark by 18.9%. Negative security selection in the Industrials, Consumer Discretionary, and Information Technology (“IT”) sectors were key detractors during the year. An underweight position in the IT and Communication Services sectors, and an overweight in the Consumer Discretionary sector
BHFTII-1
Brighthouse Funds Trust II
Brighthouse Asset Allocation 80 Portfolio
Managed by Brighthouse Investment Advisers, LLC
Portfolio Manager Commentary*—(Continued)
further pressured results. The MFS Value Portfolio underperformed its benchmark by 3.3%. Security selection weakness in the Industrials and Communication Services sectors, along with an underweight to Communication Services drove the relative underperformance. On a positive note, the Jennison Growth Portfolio beat its benchmark by 10.6%. Security selection was the main driver of the relative outperformance. Selection in the IT sector had the largest positive impact on results. Both security selection and an underweight to the Industrials and Consumer Staples sectors contributed to performance. Within mid cap, the Morgan Stanley Discovery Portfolio outperformed its benchmark by 15.4%. Security selection in the Financials and Consumer Discretionary sectors were the largest contributors to relative results. Overweight allocations to the IT and Communication Services sectors and lack of exposure to Energy further aided results. The T. Rowe Price Mid Cap Growth Portfolio’s absolute performance lifted overall mid cap results. In small cap, the Invesco Small Cap Growth Portfolio underperformed its benchmark by 6.3%. Negative security selection in the Health Care, IT, and Consumer Discretionary sectors were the major detractors to results. The Loomis Sayles Small Cap Growth Portfolio underperformed its benchmark by 6.8%. Negative security selection primarily in Health Care, IT, and Industrials were the main detractors on relative results.
The underlying non-U.S. equity portfolios underperformed over the period. Within developed markets, VanEck Global Natural Resources Portfolio’s negative absolute performance was a detractor to overall international equity results. Security selection weakness in the Materials sector to the diversified metals & mining and copper sub-industries negatively impacted performance. The MFS Research International Portfolio underperformed its benchmark by 5.2%. Security selection weakness in the Financials, Consumer Discretionary, and Consumer Staples sectors were leading detractors over the period. On the positive side, the Harris Oakmark International Portfolio outperformed its benchmark by 1.0%. Positive security selection in the Industrials, Communication Services, and Consumer Staples sectors benefited results. From a country perspective, an overweight position in Germany and an underweight to Hong Kong positively impacted performance. In emerging markets, the Brighthouse/abrdn Emerging Markets Equity Portfolio underperformed its benchmark by 3.2%. Negative security selection in the Consumer Discretionary, IT, and Health Care sectors were leading detractors to relative performance. At the country level, exposures in China and Hong Kong detracted during the period. Conversely, the SSGA Emerging Markets Enhanced Index Portfolio outperformed its benchmark by 3.0%. Positive security selection in the IT, Financials, Utilities, and Industrials sectors were top relative contributors. At the country level, security selection was strongest in India, Taiwan, and China.
Investment Committee
Brighthouse Investment Advisers, LLC
* This commentary may include statements that constitute “forward-looking statements” under the U.S. securities laws. Forward-looking statements include, among other things, projections, estimates, and information about possible or future results related to the Portfolio, market or regulatory developments. The views expressed above are not guarantees of future performance or economic results and involve certain risks, uncertainties and assumptions that could cause actual outcomes and results to differ materially from the views expressed herein. The views expressed above are subject to change at any time based upon economic, market, or other conditions and the advisory firm undertakes no obligation to update the views expressed herein. Any discussions of specific securities should not be considered a recommendation to buy or sell those securities. The views expressed above (including any forward-looking statement) may not be relied upon as investment advice or as an indication of the Portfolio’s trading intent. Information about the Portfolio’s holdings, asset allocation or country diversification is historical and is not an indication of future Portfolio composition, which may vary. Direct investment in any index is not possible. The performance of any index mentioned in this commentary has not been adjusted for ongoing management, distribution and operating expenses, and sales charges applicable to mutual fund investments. In addition, the returns do not reflect additional fees charged by separate accounts or variable insurance contracts that an investor in the Portfolio may pay. If these additional fees were reflected, performance would have been lower.
1 The Dow Jones Moderately Aggressive Portfolio Index is a member of the Dow Jones Relative Risk Index Series and is designed to measure a total portfolio of stocks, bonds, and cash, allocated to represent an investor’s desired risk profile. The Dow Jones Moderately Aggressive Portfolio Index level is set to 80% of the Dow Jones Global Stock CMAC Index’s downside risk over the past 36 months.
BHFTII-2
Brighthouse Funds Trust II
Brighthouse Asset Allocation 80 Portfolio
A $10,000 INVESTMENT COMPARED TO THE DOW JONES MODERATELY AGGRESSIVE PORTFOLIO INDEX
AVERAGE ANNUAL RETURNS (%) FOR THE YEAR ENDED DECEMBER 31, 2023
| 1 Year | 5 Year | 10 Year | ||||||||||
| Brighthouse Asset Allocation 80 Portfolio | ||||||||||||
| Class A |
17.51 | 10.02 | 7.17 | |||||||||
|
Class B |
17.30 | 9.75 | 6.91 | |||||||||
| Dow Jones Moderately Aggressive Portfolio Index | 15.59 | 9.31 | 6.94 | |||||||||
Portfolio performance is calculated including reinvestment of all income and capital gain distributions. Performance numbers are net of all Portfolio expenses but do not include any insurance, sales, separate account or administrative charges of variable annuity or life insurance contracts or any additional expenses that participants may bear relating to the operations of their plans. If these charges were included, the returns would be lower. The performance of any index referenced above has not been adjusted for ongoing management, distribution and operating expenses, and sales charges applicable to mutual fund investments. Direct investment in any index is not possible. The performance of Class A shares, as set forth in the line graph above, will differ from that of other classes because of the difference in expenses paid by policyholders investing in the different share classes.
This information represents past performance and is not indicative of future results. Investment return and principal value may fluctuate so that shares, upon redemption, may be worth more or less than the original cost.
PORTFOLIO COMPOSITION AS OF DECEMBER 31, 2023
Top Holdings
| % of Net Assets |
||||
| MFS Value Portfolio (Class A) | 5.8 | |||
| T. Rowe Price Large Cap Value Portfolio (Class A) | 5.1 | |||
| Invesco Comstock Portfolio (Class A) | 5.0 | |||
| Harris Oakmark International Portfolio (Class A) | 4.8 | |||
| Baillie Gifford International Stock Portfolio (Class A) | 4.6 | |||
| Loomis Sayles Growth Portfolio (Class A) | 4.5 | |||
| Jennison Growth Portfolio (Class A) | 4.5 | |||
| Brighthouse/Wellington Core Equity Opportunities Portfolio (Class A) | 4.5 | |||
| Brighthouse/Artisan International Portfolio (Class A) | 4.0 | |||
| T. Rowe Price Large Cap Growth Portfolio (Class A) | 4.0 | |||
Asset Allocation
| % of Net Assets |
||||
| U.S. Large Cap Equities | 39.9 | |||
| International Developed Market Equities | 18.8 | |||
| Investment Grade Fixed Income | 12.8 | |||
| U.S. Small Cap Equities | 10.1 | |||
| Global Equities | 4.5 | |||
| Emerging Market Equities | 3.5 | |||
| High Yield Fixed Income | 3.2 | |||
| U.S. Mid Cap Equities | 2.5 | |||
| Real Estate Equities | 2.5 | |||
| International Fixed Income | 2.2 | |||
BHFTII-3
Brighthouse Funds Trust II
Brighthouse Asset Allocation 80 Portfolio
Understanding Your Portfolio’s Expenses
Shareholder Expense Example
As a shareholder of the Portfolio, you incur ongoing costs, including management fees; distribution and service (12b-1) fees; and other Portfolio expenses. This example is intended to help you understand your ongoing costs (in dollars) (referred to as “expenses”) of investing in the Portfolio and compare these costs with the ongoing costs of investing in other mutual funds. The example is based on an investment of $1,000 invested at the beginning of the period and held for the entire period, July 1, 2023 through December 31, 2023.
Actual Expenses
The first line for each share class of the Portfolio in the table below provides information about actual account values and actual expenses. You may use the information in this line, together with the amount you invested in the particular share class of the Portfolio, to estimate the expenses that you paid over the period. Simply divide your account value by $1,000 (for example, an $8,600 account value divided by $1,000 = 8.6), then multiply the result by the number in the first line under the heading entitled “Expenses Paid During Period” to estimate the expenses you paid on your account during this period.
Hypothetical Example for Comparison Purposes
The second line for each share class of the Portfolio in the table below provides information about hypothetical account values and hypothetical expenses based on the Portfolio’s actual expense ratio and an assumed rate of return of 5% per year before expenses, which is not the Portfolio’s actual return. The hypothetical account values and expenses may not be used to estimate the actual ending account balance or expenses you paid for the period. You may use this information to compare the ongoing costs of investing in the Portfolio and other funds. To do so, compare this 5% hypothetical example with the 5% hypothetical examples that appear in the shareholder reports of the other funds.
Please note that the expenses shown in the table are meant to highlight your ongoing costs only and do not reflect any fees or charges of your variable insurance product or any additional expenses that participants in certain eligible qualified plans may bear relating to the operations of their plan. Therefore, the second line for each share class in the table is useful in comparing ongoing costs only, and will not help you determine the relative total costs of owning different funds. In addition, if these other costs were included, your costs would have been higher.
| Brighthouse Asset Allocation 80 Portfolio |
Annualized Expense Ratio |
Beginning Account Value July 1, 2023 |
Ending Account Value December 31, 2023 |
Expenses Paid During Period** July 1, 2023 to December 31, 2023 |
||||||||||||||
| Class A (a) |
Actual | 0.70 | % | $ | 1,000.00 | $ | 1,059.60 | $ | 3.63 | |||||||||
| Hypothetical* | 0.70 | % | $ | 1,000.00 | $ | 1,021.68 | $ | 3.57 | ||||||||||
| Class B (a) |
Actual | 0.95 | % | $ | 1,000.00 | $ | 1,059.00 | $ | 4.93 | |||||||||
| Hypothetical* | 0.95 | % | $ | 1,000.00 | $ | 1,020.42 | $ | 4.84 | ||||||||||
| * | Hypothetical assumes a rate of return of 5% per year before expenses. |
| ** | Expenses paid are equal to the Portfolio’s annualized expense ratio for the most recent six month period, as shown above, multiplied by the average account value over the period, multiplied by the number of days (184 days) in the most recent fiscal half-year, divided by 365 (to reflect the one-half year period). |
| (a) | The annualized expense ratio reflects the expenses of both the Portfolio and the Underlying Portfolios in which it invests. |
BHFTII-4
Brighthouse Funds Trust II
Brighthouse Asset Allocation 80 Portfolio
Schedule of Investments as of December 31, 2023
Mutual Funds—100.0% of Net Assets
| Security Description | Shares | Value | ||||||
| Affiliated Investment Companies—100.0% | ||||||||
| AB International Bond Portfolio (Class A) (a) |
7,799,914 | $ | 62,243,310 | |||||
| Allspring Mid Cap Value Portfolio (Class A) (a) |
5,673,550 | 63,713,970 | ||||||
| Baillie Gifford International Stock Portfolio (Class A) (b) |
36,667,064 | 383,904,156 | ||||||
| BlackRock Bond Income Portfolio (Class A) (b) |
3,589,328 | 331,151,359 | ||||||
| BlackRock Capital Appreciation Portfolio (Class A) (b) |
6,982,872 | 253,059,281 | ||||||
| BlackRock High Yield Portfolio (Class A) (a) |
8,450,442 | 62,279,758 | ||||||
| Brighthouse Small Cap Value Portfolio (Class A) (a) |
15,020,322 | 211,035,527 | ||||||
| Brighthouse/abrdn Emerging Markets Equity Portfolio (Class A) (a) |
19,173,419 | 169,301,292 | ||||||
| Brighthouse/Artisan International Portfolio (Class A) (a) |
32,829,727 | 337,817,894 | ||||||
| Brighthouse/Artisan Mid Cap Value Portfolio (Class A) (b) |
97,568 | 21,208,298 | ||||||
| Brighthouse/Dimensional International Small Company Portfolio (Class A) (b) |
16,932,384 | 170,509,109 | ||||||
| Brighthouse/Eaton Vance Floating Rate Portfolio (Class A) (a) |
8,179,055 | 81,136,221 | ||||||
| Brighthouse/Templeton International Bond Portfolio (Class A) (a) (c) |
16,108,084 | 126,448,462 | ||||||
| Brighthouse/Wellington Core Equity Opportunities Portfolio (Class A) (b) |
13,183,084 | 375,981,542 | ||||||
| Brighthouse/Wellington Large Cap Research Portfolio (Class A) (a) |
21,419,789 | 296,021,480 | ||||||
| CBRE Global Real Estate Portfolio (Class A) (a) |
20,140,702 | 212,283,000 | ||||||
| Frontier Mid Cap Growth Portfolio (Class A) (b) (c) |
1,686,810 | 42,355,797 | ||||||
| Harris Oakmark International Portfolio (Class A) (a) |
30,558,816 | 400,931,668 | ||||||
| Invesco Comstock Portfolio (Class A) (a) |
33,288,382 | 424,093,992 | ||||||
| Invesco Global Equity Portfolio (Class A) (a) |
5,325,631 | 127,495,600 | ||||||
| Invesco Small Cap Growth Portfolio (Class A) (a) (c) |
23,192,255 | 190,176,492 | ||||||
| Jennison Growth Portfolio (Class A) (b) (c) |
26,450,847 | 379,040,643 | ||||||
| JPMorgan Core Bond Portfolio (Class A) (a) |
15,949,999 | 144,666,492 | ||||||
| JPMorgan Small Cap Value Portfolio (Class A) (a) |
11,201,825 | 126,468,607 | ||||||
| Loomis Sayles Growth Portfolio (Class A) (a) |
24,584,798 | 381,310,220 | ||||||
| Loomis Sayles Small Cap Growth Portfolio (Class A) (b) (c) |
13,903,356 | 147,653,646 | ||||||
| MFS Research International Portfolio (Class A) (a) |
24,084,768 | 291,425,698 | ||||||
| Affiliated Investment Companies—(Continued) | ||||||||
| MFS Value Portfolio (Class A) (b) |
34,787,135 | 484,236,916 | ||||||
| Morgan Stanley Discovery Portfolio (Class A) (a) (c) |
3,659,853 | 20,934,360 | ||||||
| Neuberger Berman Genesis Portfolio (Class A) (b) |
1,140,750 | 21,069,652 | ||||||
| PIMCO Inflation Protected Bond Portfolio (Class A) (a) |
10,797,371 | 102,575,021 | ||||||
| PIMCO Total Return Portfolio (Class A) (a) |
27,183,066 | 269,656,011 | ||||||
| SSGA Emerging Markets Enhanced Index Portfolio (Class A) (a) |
12,931,748 | 126,343,174 | ||||||
| T. Rowe Price Large Cap Growth Portfolio (Class A) (b) (c) |
16,179,836 | 334,922,596 | ||||||
| T. Rowe Price Large Cap Value Portfolio (Class A) (a) |
16,127,510 | 424,959,879 | ||||||
| T. Rowe Price Mid Cap Growth Portfolio (Class A) (a) |
4,458,787 | 42,403,066 | ||||||
| T. Rowe Price Small Cap Growth Portfolio (Class A) (b) |
7,427,391 | 147,805,077 | ||||||
| TCW Core Fixed Income Portfolio (Class A) (a) |
25,649,437 | 228,536,482 | ||||||
| VanEck Global Natural Resources Portfolio (Class A) (b) |
21,186,262 | 251,904,650 | ||||||
| Victory Sycamore Mid Cap Value Portfolio (Class A) (a) |
1,091,802 | 21,202,795 | ||||||
| Western Asset Management Strategic Bond Opportunities Portfolio (Class A) (b) |
11,422,950 | 125,309,764 | ||||||
|
|
|
|||||||
| Total Mutual Funds |
8,415,572,957 | |||||||
|
|
|
|||||||
| Total Investments—100.0% |
8,415,572,957 | |||||||
| Other assets and liabilities (net)—0.0% |
(2,311,253 | ) | ||||||
|
|
|
|||||||
| Net Assets—100.0% | $ | 8,413,261,704 | ||||||
|
|
|
|||||||
| (a) | A Portfolio of Brighthouse Funds Trust I. (See Note 6 of the Notes to Financial Statements for a summary of transactions in the securities of affiliated Underlying Portfolios.) | |||
| (b) | A Portfolio of Brighthouse Funds Trust II. (See Note 6 of the Notes to Financial Statements for a summary of transactions in the securities of affiliated Underlying Portfolios.) | |||
| (c) | Non-income producing security. | |||
Fair Value Hierarchy
Accounting principles generally accepted in the United States of America (“GAAP”) define fair market value as the price that the Portfolio would receive to sell an asset or pay to transfer a liability in an orderly transaction between market participants at the measurement date. It establishes a fair value hierarchy that prioritizes inputs to valuation methods and requires disclosure of the fair value hierarchy, separately for each major category of assets and liabilities, that segregates fair value measurements into three levels. Levels 1, 2 and 3 of the fair value hierarchy are defined as follows:
Level 1 - unadjusted quoted prices in active markets for identical investments
Level 2 - other significant observable inputs (including, but not limited to, quoted prices for similar assets or liabilities in markets that are either active or inactive; inputs other than quoted prices that are observable such as interest rates, yield curves, volatilities, prepayment speeds, loss severities, credit risks, default rates, or other market corroborated inputs)
Level 3 - significant unobservable inputs based on the best information available in the circumstances, to the extent observable inputs are unavailable (including the Portfolio’s own assumptions used in determining the fair value of investments and derivative financial instruments)
The inputs or methodologies used for valuing investments are not necessarily an indication of the risk associated with investing in them. Changes to the inputs or methodologies used may result in transfers between levels. A reconciliation of Level 3 securities, if any, will be disclosed following the fair value hierarchy table. For more information about the Portfolio’s policy regarding the valuation of investments, please refer to the Notes to Financial Statements.
The following table summarizes the fair value hierarchy of the Portfolio’s investments as of December 31, 2023:
| Description | Level 1 | Level 2 | Level 3 | Total | ||||||||||||
| Mutual Funds | ||||||||||||||||
| Affiliated Investment Companies |
$ | 8,415,572,957 | $ | — | $ | — | $ | 8,415,572,957 | ||||||||
| Total Investments |
$ | 8,415,572,957 | $ | — | $ | — | $ | 8,415,572,957 | ||||||||
See accompanying notes to financial statements.
BHFTII-5
Brighthouse Funds Trust II
Brighthouse Asset Allocation 80 Portfolio
Statement of Assets and Liabilities
December 31, 2023
| Assets |
||||
| Affiliated investments at value (a) |
$ | 8,415,572,957 | ||
| Receivable for: |
||||
| Affiliated investments sold |
3,084,781 | |||
| Fund shares sold |
449,839 | |||
|
|
|
|||
| Total Assets |
8,419,107,577 | |||
| Liabilities |
||||
| Payables for: |
||||
| Fund shares redeemed |
3,534,619 | |||
| Accrued Expenses: |
||||
| Management fees |
382,154 | |||
| Distribution and service fees |
1,659,363 | |||
| Deferred trustees’ fees |
231,759 | |||
| Other expenses |
37,978 | |||
|
|
|
|||
| Total Liabilities |
5,845,873 | |||
|
|
|
|||
| Net Assets |
$ | 8,413,261,704 | ||
|
|
|
|||
| Net Assets Consist of: |
||||
| Paid in surplus |
$ | 8,458,969,648 | ||
| Distributable earnings (Accumulated losses) |
(45,707,944 | ) | ||
|
|
|
|||
| Net Assets |
$ | 8,413,261,704 | ||
|
|
|
|||
| Net Assets |
||||
| Class A |
$ | 440,109,193 | ||
| Class B |
7,973,152,511 | |||
| Capital Shares Outstanding* |
||||
| Class A |
41,268,150 | |||
| Class B |
753,030,457 | |||
| Net Asset Value, Offering Price and Redemption Price Per Share |
||||
| Class A |
$ | 10.66 | ||
| Class B |
10.59 |
| * | The Portfolio is authorized to issue an unlimited number of shares. | |||
| (a) | Identified cost of affiliated investments was $8,669,046,767. | |||
Statement of Operations
Year Ended December 31, 2023
| Investment Income |
||||
| Dividends from affiliated investments |
$ | 137,902,870 | ||
|
|
|
|||
| Total investment income |
137,902,870 | |||
| Expenses |
||||
| Management fees |
4,461,813 | |||
| Administration fees |
30,250 | |||
| Custodian and accounting fees |
27,625 | |||
| Distribution and service fees—Class B |
19,364,397 | |||
| Audit and tax services |
35,076 | |||
| Legal |
46,604 | |||
| Trustees’ fees and expenses |
46,220 | |||
| Miscellaneous |
16,661 | |||
|
|
|
|||
| Total expenses |
24,028,646 | |||
|
|
|
|||
| Net Investment Income |
113,874,224 | |||
|
|
|
|||
| Net Realized and Unrealized Gain (Loss) |
||||
| Net realized gain (loss) on: | ||||
| Affiliated investments |
(166,100,681 | ) | ||
| Capital gain distributions from affiliated investments |
335,479,639 | |||
|
|
|
|||
| Net realized gain (loss) |
169,378,958 | |||
|
|
|
|||
| Net change in unrealized appreciation on affiliated investments |
1,023,923,591 | |||
|
|
|
|||
| Net realized and unrealized gain (loss) |
1,193,302,549 | |||
|
|
|
|||
| Net Increase (Decrease) in Net Assets From Operations |
$ | 1,307,176,773 | ||
|
|
|
See accompanying notes to financial statements.
BHFTII-6
Brighthouse Funds Trust II
Brighthouse Asset Allocation 80 Portfolio
Statements of Changes in Net Assets
| Year Ended December 31, 2023 |
Year Ended December 31, 2022 |
|||||||
| Increase (Decrease) in Net Assets: |
||||||||
| From Operations |
||||||||
| Net investment income (loss) |
$ | 113,874,224 | $ | 122,477,177 | ||||
| Net realized gain (loss) |
169,378,958 | 1,075,265,324 | ||||||
| Net change in unrealized appreciation (depreciation) |
1,023,923,591 | (3,101,268,321 | ) | |||||
|
|
|
|
|
|||||
| Increase (decrease) in net assets from operations |
1,307,176,773 | (1,903,525,820 | ) | |||||
|
|
|
|
|
|||||
| From Distributions to Shareholders |
||||||||
| Class A |
(63,726,018 | ) | (50,275,861 | ) | ||||
| Class B |
(1,136,911,895 | ) | (943,317,777 | ) | ||||
|
|
|
|
|
|||||
| Total distributions |
(1,200,637,913 | ) | (993,593,638 | ) | ||||
|
|
|
|
|
|||||
| Increase (decrease) in net assets from capital share transactions |
292,332,472 | 54,355,090 | ||||||
|
|
|
|
|
|||||
| Total increase (decrease) in net assets |
398,871,332 | (2,842,764,368 | ) | |||||
| Net Assets |
||||||||
| Beginning of period |
8,014,390,372 | 10,857,154,740 | ||||||
|
|
|
|
|
|||||
| End of period |
$ | 8,413,261,704 | $ | 8,014,390,372 | ||||
|
|
|
|
|
|||||
Other Information:
Capital Shares
Transactions in capital shares were as follows:
| Year Ended December 31, 2023 |
Year Ended December 31, 2022 |
|||||||||||||||
| Shares | Value | Shares | Value | |||||||||||||
| Class A |
||||||||||||||||
| Sales |
870,173 | $ | 9,136,688 | 876,857 | $ | 10,286,189 | ||||||||||
| Reinvestments |
6,385,373 | 63,726,018 | 4,811,087 | 50,275,861 | ||||||||||||
| Redemptions |
(4,701,173 | ) | (48,895,424 | ) | (2,553,348 | ) | (29,925,719 | ) | ||||||||
|
|
|
|
|
|
|
|
|
|||||||||
| Net increase (decrease) |
2,554,373 | $ | 23,967,282 | 3,134,596 | $ | 30,636,331 | ||||||||||
|
|
|
|
|
|
|
|
|
|||||||||
| Class B |
||||||||||||||||
| Sales |
8,334,892 | $ | 86,368,913 | 4,989,874 | $ | 57,789,390 | ||||||||||
| Reinvestments |
114,608,054 | 1,136,911,895 | 90,703,632 | 943,317,777 | ||||||||||||
| Redemptions |
(91,459,986 | ) | (954,915,618 | ) | (83,177,128 | ) | (977,388,408 | ) | ||||||||
|
|
|
|
|
|
|
|
|
|||||||||
| Net increase (decrease) |
31,482,960 | $ | 268,365,190 | 12,516,378 | $ | 23,718,759 | ||||||||||
|
|
|
|
|
|
|
|
|
|||||||||
| Increase (decrease) derived from capital shares transactions |
$ | 292,332,472 | $ | 54,355,090 | ||||||||||||
|
|
|
|
|
|||||||||||||
See accompanying notes to financial statements.
BHFTII-7
Brighthouse Funds Trust II
Brighthouse Asset Allocation 80 Portfolio
Financial Highlights
| Selected per share data | ||||||||||||||||||||
| Class A | ||||||||||||||||||||
| Year Ended December 31, | ||||||||||||||||||||
| 2023 | 2022 | 2021 | 2020 | 2019 | ||||||||||||||||
| Net Asset Value, Beginning of Period |
$ | 10.61 | $ | 14.67 | $ | 13.91 | $ | 13.48 | $ | 12.36 | ||||||||||
|
|
|
|
|
|
|
|
|
|
|
|||||||||||
| Income (Loss) from Investment Operations |
||||||||||||||||||||
| Net investment income (loss) (a) |
0.17 | 0.19 | 0.16 | 0.25 | 0.24 | |||||||||||||||
| Net realized and unrealized gain (loss) |
1.57 | (2.81 | ) | 1.86 | 1.68 | 2.57 | ||||||||||||||
|
|
|
|
|
|
|
|
|
|
|
|||||||||||
| Total income (loss) from investment operations |
1.74 | (2.62 | ) | 2.02 | 1.93 | 2.81 | ||||||||||||||
|
|
|
|
|
|
|
|
|
|
|
|||||||||||
| Less Distributions |
||||||||||||||||||||
| Distributions from net investment income |
(0.37 | ) | (0.26 | ) | (0.28 | ) | (0.27 | ) | (0.28 | ) | ||||||||||
| Distributions from net realized capital gains |
(1.32 | ) | (1.18 | ) | (0.98 | ) | (1.23 | ) | (1.41 | ) | ||||||||||
|
|
|
|
|
|
|
|
|
|
|
|||||||||||
| Total distributions |
(1.69 | ) | (1.44 | ) | (1.26 | ) | (1.50 | ) | (1.69 | ) | ||||||||||
|
|
|
|
|
|
|
|
|
|
|
|||||||||||
| Net Asset Value, End of Period |
$ | 10.66 | $ | 10.61 | $ | 14.67 | $ | 13.91 | $ | 13.48 | ||||||||||
|
|
|
|
|
|
|
|
|
|
|
|||||||||||
| Total Return (%) (b) |
17.51 | (17.71 | ) | 14.87 | 17.01 | 24.04 | ||||||||||||||
| Ratios/Supplemental Data |
||||||||||||||||||||
| Ratio of expenses to average net assets (%) (c) |
0.06 | 0.06 | 0.06 | 0.06 | 0.06 | |||||||||||||||
| Ratio of net investment income (loss) to average net assets (%) (d) |
1.64 | 1.62 | 1.08 | 2.01 | 1.82 | |||||||||||||||
| Portfolio turnover rate (%) |
8 | 14 | 10 | 12 | 13 | |||||||||||||||
| Net assets, end of period (in millions) |
$ | 440.1 | $ | 410.6 | $ | 522.1 | $ | 484.8 | $ | 439.2 | ||||||||||
| Class B | ||||||||||||||||||||
| Year Ended December 31, | ||||||||||||||||||||
| 2023 | 2022 | 2021 | 2020 | 2019 | ||||||||||||||||
| Net Asset Value, Beginning of Period |
$ | 10.54 | $ | 14.58 | $ | 13.82 | $ | 13.41 | $ | 12.30 | ||||||||||
|
|
|
|
|
|
|
|
|
|
|
|||||||||||
| Income (Loss) from Investment Operations |
||||||||||||||||||||
| Net investment income (loss) (a) |
0.14 | 0.16 | 0.12 | 0.22 | 0.21 | |||||||||||||||
| Net realized and unrealized gain (loss) |
1.57 | (2.80 | ) | 1.87 | 1.66 | 2.55 | ||||||||||||||
|
|
|
|
|
|
|
|
|
|
|
|||||||||||
| Total income (loss) from investment operations |
1.71 | (2.64 | ) | 1.99 | 1.88 | 2.76 | ||||||||||||||
|
|
|
|
|
|
|
|
|
|
|
|||||||||||
| Less Distributions |
||||||||||||||||||||
| Distributions from net investment income |
(0.34 | ) | (0.22 | ) | (0.25 | ) | (0.24 | ) | (0.24 | ) | ||||||||||
| Distributions from net realized capital gains |
(1.32 | ) | (1.18 | ) | (0.98 | ) | (1.23 | ) | (1.41 | ) | ||||||||||
|
|
|
|
|
|
|
|
|
|
|
|||||||||||
| Total distributions |
(1.66 | ) | (1.40 | ) | (1.23 | ) | (1.47 | ) | (1.65 | ) | ||||||||||
|
|
|
|
|
|
|
|
|
|
|
|||||||||||
| Net Asset Value, End of Period |
$ | 10.59 | $ | 10.54 | $ | 14.58 | $ | 13.82 | $ | 13.41 | ||||||||||
|
|
|
|
|
|
|
|
|
|
|
|||||||||||
| Total Return (%) (b) |
17.30 | (17.97 | ) | 14.71 | 16.59 | 23.73 | ||||||||||||||
| Ratios/Supplemental Data |
||||||||||||||||||||
| Ratio of expenses to average net assets (%) (c) |
0.31 | 0.31 | 0.31 | 0.31 | 0.31 | |||||||||||||||
| Ratio of net investment income (loss) to average net assets (%) (d) |
1.38 | 1.37 | 0.83 | 1.76 | 1.58 | |||||||||||||||
| Portfolio turnover rate (%) |
8 | 14 | 10 | 12 | 13 | |||||||||||||||
| Net assets, end of period (in millions) |
$ | 7,973.2 | $ | 7,603.8 | $ | 10,335.0 | $ | 10,204.2 | $ | 9,862.7 | ||||||||||
| (a) | Per share amounts based on average shares outstanding during the period. | |||
| (b) | Total return does not reflect any insurance, sales, separate account or administrative charges of variable annuity or life insurance contracts or any additional expenses that contract owners may bear under their variable contracts. If these charges were included, the returns would be lower. | |||
| (c) | The ratio of operating expenses to average net assets does not include expenses of the Underlying Portfolios in which the Asset Allocation Portfolio invests. | |||
| (d) | Recognition of net investment income by the Asset Allocation Portfolio is affected by the timing of the declaration of dividends by the Underlying Portfolios in which it invests. | |||
See accompanying notes to financial statements.
BHFTII-8
Brighthouse Funds Trust II
Brighthouse Asset Allocation 80 Portfolio
Notes to Financial Statements—December 31, 2023
1. Organization
Brighthouse Funds Trust II (the “Trust”) is organized as a Delaware statutory trust and registered under the Investment Company Act of 1940, as amended (the “1940 Act”), as an open-end management investment company. The Trust, which is managed by Brighthouse Investment Advisers, LLC (“Brighthouse Investment Advisers” or the “Adviser”), currently offers twenty-nine series (the “Portfolios”), each of which operates as a distinct investment vehicle of the Trust. The series included in this report is Brighthouse Asset Allocation 80 Portfolio (the “Asset Allocation Portfolio”), which is diversified. The Asset Allocation Portfolio operates under a “fund of funds” structure, investing substantially all of its assets in other Portfolios advised by Brighthouse Investment Advisers (each, an “Underlying Portfolio,” and, collectively, the “Underlying Portfolios”). Shares of the Portfolio are not offered directly to the general public and are currently available only to separate accounts of insurance companies, including insurance companies affiliated with the Adviser.
The Asset Allocation Portfolio has registered and offers two classes of shares: Class A and B shares. Shares of each class of the Asset Allocation Portfolio represent an equal pro rata interest in the Asset Allocation Portfolio and generally give the shareholder the same voting, dividend, liquidation, and other rights. Investment income, realized and unrealized capital gains and losses, the common expenses of the Asset Allocation Portfolio, and certain Asset Allocation Portfolio-level expense reductions, if any, are allocated on a pro rata basis to each class based on the relative net assets of each class to the net assets of the Asset Allocation Portfolio. Each class of shares differs in its respective distribution plan and such distribution expenses are allocated to the corresponding class of shares.
2. Significant Accounting Policies
The preparation of financial statements in conformity with accounting principles generally accepted in the United States of America (“GAAP”) requires management to make estimates and assumptions that affect the reported amounts of assets and liabilities and disclosure of contingent assets and liabilities as of the date of the financial statements and the reported amounts of income and expenses during the reporting period. Actual results could differ from those estimates. In the preparation of these financial statements, management has evaluated events and transactions subsequent to December 31, 2023 through the date the financial statements were issued.
The Asset Allocation Portfolio is an investment company and follows the accounting and reporting guidance of the Financial Accounting Standards Board (“FASB”) Accounting Standards Codification Topic 946—Financial Services—Investment Companies. The following is a summary of significant accounting policies consistently followed by the Asset Allocation Portfolio in the preparation of its financial statements.
Investment Valuation and Fair Value Measurements - The Asset Allocation Portfolio values its investments for purposes of calculating its net asset value (“NAV”) using procedures that allow for a variety of methodologies to be used to value the Asset Allocation Portfolio’s investments. The specific methodology used for an investment may vary based on the market data available for a specific investment at the time the Asset Allocation Portfolio calculates its NAV or based on other considerations. The procedures also permit a level of judgment to be used in the valuation process.
Investments in the Underlying Portfolios are valued at their closing daily NAV on the valuation date. Investments in the Underlying Portfolios are categorized as Level 1 within the fair value hierarchy. For information about the use of fair value pricing by the Underlying Portfolios, please refer to the prospectuses of the Underlying Portfolios.
Investment Transactions and Related Investment Income - The Asset Allocation Portfolio’s security transactions are recorded on the trade date. Dividend income is recorded on the ex-dividend date. Interest income is recorded on the accrual basis. Realized gains and losses on investments and unrealized appreciation and depreciation are determined on the identified cost basis, which is the same basis used for federal income tax purposes. Capital gains distributions received from the Underlying Portfolios are recorded as net realized gain in the Statement of Operations.
Dividends and Distributions to Shareholders - The Asset Allocation Portfolio records dividends and distributions on the ex-dividend date. Net realized gains from securities transactions (if any) are generally distributed annually to shareholders. The timing and characterization of certain income and capital gains distributions are determined in accordance with federal tax regulations that may differ from GAAP. Permanent book and tax basis differences relating to shareholder distributions will result in reclassification between distributable earnings (accumulated losses) and paid in surplus. These adjustments have no impact on net assets or the results of operations.
Income Taxes - It is the Asset Allocation Portfolio’s policy to comply with the requirements of the Internal Revenue Code of 1986, as amended, and regulations thereunder, applicable to regulated investment companies, and to distribute, with respect to each taxable year, all of its taxable income to shareholders. Therefore, no federal income tax provision is required. The Asset Allocation Portfolio files U.S. federal tax returns. No income tax returns are currently under examination. The Asset Allocation Portfolio’s federal tax returns remain subject to examination by the Internal Revenue Service for three fiscal years after the returns are filed. As of December 31, 2023, the Asset Allocation Portfolio had no uncertain tax positions that would require financial statement recognition, derecognition or disclosure.
BHFTII-9
Brighthouse Funds Trust II
Brighthouse Asset Allocation 80 Portfolio
Notes to Financial Statements—December 31, 2023—(Continued)
3. Certain Risks
In the normal course of business, the Underlying Portfolios invest in securities and enter into transactions where risks exist. Those risks include:
Market Risk: The value of securities held by the Underlying Portfolios may decline in response to certain events, including those directly involving the issuers whose securities are owned by the Underlying Portfolios; conditions affecting the general economy; overall market changes; local, regional or global political, social or economic instability; currency, interest rate, and price fluctuations, or other factors including terrorism, war, natural disasters and the spread of infectious illness including epidemics or pandemics such as the COVID-19 pandemic. These events may also adversely affect the liquidity of securities held by the Underlying Portfolios.
Credit and Counterparty Risk: The Underlying Portfolios may be exposed to counterparty risk, or the risk that an entity with which the Underlying Portfolios have unsettled or open transactions may default. The potential loss could exceed the value of the financial assets and liabilities recorded in the financial statements. Financial assets that potentially expose the Underlying Portfolios to credit and counterparty risk consist principally of cash due from counterparties and investments. The Underlying Portfolios manage counterparty risk by entering into agreements only with counterparties that they believe have the financial resources to honor their obligations and by monitoring the financial stability of those counterparties. The Subadviser may attempt to mitigate counterparty risk by (i) periodically assessing the creditworthiness of their trading partners, (ii) monitoring and/or limiting the amount of their net exposure to each individual counterparty based on the adviser’s assessment, and (iii) requiring collateral from the counterparty for certain transactions. In order to preserve certain safeguards for non-standard settlement trades, the Underlying Portfolios restrict their exposure to credit and counterparty losses by entering into master netting agreements (“Master Agreements”) with counterparties (approved brokers) with whom the Underlying Portfolios undertake a significant volume of transactions. Master Agreements govern the terms of certain transactions and reduce the counterparty risk associated with relevant transactions by specifying credit protection mechanisms and providing standardization that improves legal certainty. Master Agreements can also help limit counterparty risk by specifying collateral posting arrangements at pre-arranged exposure levels.
The Asset Allocation Portfolio’s prospectus includes a discussion of the principal risks of investing in the Asset Allocation Portfolio and in the Underlying Portfolios in which it invests.
4. Investment Transactions
Aggregate cost of purchases and proceeds of sales of shares of the Underlying Portfolios by the Asset Allocation Portfolio, for the year ended December 31, 2023 were as follows:
| Purchases |
Sales | |||||||||||
| U.S. Government |
Non-U.S. Government | U.S. Government | Non-U.S. Government | |||||||||
| $0 | $ | 614,942,033 | $ | 0 | $ | 1,073,876,074 | ||||||
5. Investment Management Fees and Other Transactions with Affiliates
Investment Management Agreement - Brighthouse Investment Advisers is the investment adviser to the Asset Allocation Portfolio. The Trust has entered into an investment management agreement with Brighthouse Investment Advisers with respect to the Asset Allocation Portfolio. For providing investment management services to the Asset Allocation Portfolio, Brighthouse Investment Advisers receives monthly compensation at the following annual rates:
| Management |
% per annum | Average Daily Net Assets | ||||
| $4,461,813 | 0.100 | % | Of the first $500 million | |||
| 0.075 | % | Of the next $500 million | ||||
| 0.050 | % | On amounts in excess of $1 billion | ||||
In addition to the above management fee paid to Brighthouse Investment Advisers, the Asset Allocation Portfolio indirectly pays Brighthouse Investment Advisers an investment advisory fee through its investments in the Underlying Portfolios.
Certain officers and trustees of the Trust may also be officers of the Adviser however, such officers and trustees receive no compensation from the Trust.
Transfer Agency Agreement - Brighthouse Life Insurance Company serves as the transfer agent for the Trust. Brighthouse Life Insurance Company receives no fees for its services to the Trust.
BHFTII-10
Brighthouse Funds Trust II
Brighthouse Asset Allocation 80 Portfolio
Notes to Financial Statements—December 31, 2023—(Continued)
Distribution and Service Fees - The Trust has a distribution agreement with Brighthouse Securities, LLC (the “Distributor”) pursuant to which the Distributor serves as the general distributor of shares of each class (each a “Class”) of each Portfolio. The Distributor is an affiliate of the Trust. The Trust has adopted a Distribution and Services Plan (the “D&S Plan”) relating to Class B, Class D, Class E, Class F and Class G shares of each Portfolio, under Rule 12b-1 under the 1940 Act, pursuant to which the Trust may pay the Distributor a fee (the “Service Fee”) at an annual rate not to exceed 0.25% of each such Portfolio’s average daily net assets attributable to the Class B, Class D, Class E, Class F and Class G shares of the Trust. Each Portfolio may not offer shares of each Class. The D&S Plan also authorizes the Trust, on behalf of each of its Portfolios, to pay to the Distributor a distribution fee (the “Distribution Fee” and together with the Service Fee, the “Fees”) at an annual rate of up to 0.25% of each Portfolio’s average daily net assets attributable to the Class B, Class D, Class E, Class F, and Class G shares in consideration of the services rendered in connection with the sale of such shares by the Distributor. Under the Distribution Agreement with respect to the Trust, Fees are currently paid at an annual rate of 0.25% of average daily net assets in the case of Class B shares, 0.10% of average daily net assets in the case of Class D shares, 0.15% of average daily net assets in the case of Class E shares, 0.20% of average daily net assets in the case of Class F shares and 0.30% of average daily net assets in the case of Class G shares. The D&S Plan is known as a “compensation plan” because the Trust makes payments to the Distributor for services rendered regardless of the actual level of expenditures by the Distributor. Amounts incurred by the Portfolio for the year ended December 31, 2023 are shown as Distribution and service fees in the Statement of Operations.
Deferred Trustee Compensation - Each Trustee who is not currently an employee of the Adviser or any of its affiliates receives compensation from the Trust for his or her service to the Trust. A deferred compensation plan (the “Plan”) is available to the Trustees on a voluntary basis. Deferred amounts remain in the Trust until distributed in accordance with the provisions of the Plan. The value of a participating Trustee’s deferral account is based on theoretical investments of deferred amounts on the normal payment dates in certain portfolios of the Trust or Brighthouse Funds Trust I, an affiliate of the Trust, as designated by the participating Trustee. Changes in the value of participants’ deferral accounts are reflected as a component of Trustees’ fees and expenses in the Statement of Operations. The portion of the accrued obligations allocated to the Portfolio under the Plan is reflected as Deferred trustees’ fees in the Statement of Assets and Liabilities.
6. Transactions in Securities of Affiliated Issuers
The Asset Allocation Portfolio does not invest in the Underlying Portfolios for the purpose of exercising control; however, investments by the Asset Allocation Portfolio within its principal investment strategies may represent a significant portion of the Underlying Portfolios’ net assets. Transactions in the Underlying Portfolios for the year ended December 31, 2023 were as follows:
| Security Description |
Market Value December 31, 2022 |
Purchases | Sales | Realized Gain/(Loss) |
Change in Unrealized Appreciation/ (Depreciation) |
Ending Value as of December 31, 2023 |
||||||||||||||||||
| AB International Bond Portfolio (Class A) |
$ | 60,878,089 | $ | 3,219,134 | $ | (4,019,408 | ) | $ | (1,327,995 | ) | $ | 3,493,490 | $ | 62,243,310 | ||||||||||
| Allspring Mid Cap Value Portfolio (Class A) |
82,786,743 | 8,986,402 | (24,826,757 | ) | (218,700 | ) | (3,013,718 | ) | 63,713,970 | |||||||||||||||
| Baillie Gifford International Stock Portfolio (Class A) |
366,667,917 | 5,065,021 | (47,993,775 | ) | 6,938,271 | 53,226,722 | 383,904,156 | |||||||||||||||||
| BlackRock Bond Income Portfolio (Class A) |
319,902,101 | 10,656,083 | (7,615,443 | ) | (1,484,985 | ) | 9,693,603 | 331,151,359 | ||||||||||||||||
| BlackRock Capital Appreciation Portfolio (Class A) |
219,189,246 | 5,998,536 | (66,747,066 | ) | (8,566,036 | ) | 103,184,601 | 253,059,281 | ||||||||||||||||
| BlackRock High Yield Portfolio (Class A) |
40,377,760 | 21,294,525 | (2,921,239 | ) | (556,318 | ) | 4,085,030 | 62,279,758 | ||||||||||||||||
| Brighthouse Small Cap Value Portfolio (Class A) |
203,265,084 | 24,153,282 | (25,322,085 | ) | (4,845,911 | ) | 13,785,157 | 211,035,527 | ||||||||||||||||
| Brighthouse/abrdn Emerging Markets Equity Portfolio (Class A) |
162,565,082 | 4,838,893 | (7,019,556 | ) | (772,520 | ) | 9,689,393 | 169,301,292 | ||||||||||||||||
| Brighthouse/Artisan International Portfolio (Class A) |
331,491,076 | 5,789,707 | (39,460,920 | ) | (879,856 | ) | 40,877,887 | 337,817,894 | ||||||||||||||||
| Brighthouse/Artisan Mid Cap Value Portfolio (Class A) |
20,174,549 | 2,846,004 | (2,527,441 | ) | (46,638 | ) | 761,824 | 21,208,298 | ||||||||||||||||
| Brighthouse/Dimensional International Small Company Portfolio (Class A) |
167,751,321 | 9,452,557 | (18,959,635 | ) | (9,899,783 | ) | 22,164,649 | 170,509,109 | ||||||||||||||||
| Brighthouse/Eaton Vance Floating Rate Portfolio (Class A) |
80,303,249 | 7,093,960 | (10,101,755 | ) | (817,940 | ) | 4,658,707 | 81,136,221 | ||||||||||||||||
| Brighthouse/Templeton International Bond Portfolio (Class A) |
145,861,576 | 68,935 | (24,106,484 | ) | (11,494,723 | ) | 16,119,158 | 126,448,462 | ||||||||||||||||
| Brighthouse/Wellington Core Equity Opportunities Portfolio (Class A) |
371,828,653 | 44,506,227 | (22,752,253 | ) | (1,498,799 | ) | (16,102,286 | ) | 375,981,542 | |||||||||||||||
| Brighthouse/Wellington Large Cap Research Portfolio (Class A) |
283,557,371 | 18,431,514 | (54,206,610 | ) | (3,926,611 | ) | 52,165,816 | 296,021,480 | ||||||||||||||||
| CBRE Global Real Estate Portfolio (Class A) |
199,267,779 | 5,698,764 | (12,326,185 | ) | (2,999,811 | ) | 22,642,453 | 212,283,000 | ||||||||||||||||
| Frontier Mid Cap Growth Portfolio (Class A) |
39,715,577 | 46,868 | (4,383,206 | ) | (2,184,846 | ) | 9,161,404 | 42,355,797 | ||||||||||||||||
| Harris Oakmark International Portfolio (Class A) |
413,118,840 | 8,742,713 | (88,271,090 | ) | (15,658,773 | ) | 82,999,978 | 400,931,668 | ||||||||||||||||
| Invesco Comstock Portfolio (Class A) |
412,052,170 | 81,256,071 | (37,106,134 | ) | (6,745,599 | ) | (25,362,516 | ) | 424,093,992 | |||||||||||||||
| Invesco Global Equity Portfolio (Class A) |
118,411,002 | 7,717,017 | (28,522,874 | ) | 3,334,776 | 26,555,679 | 127,495,600 | |||||||||||||||||
| Invesco Small Cap Growth Portfolio (Class A) |
177,469,077 | 195,743 | (9,175,585 | ) | (5,215,498 | ) | 26,902,755 | 190,176,492 | ||||||||||||||||
| Jennison Growth Portfolio (Class A) |
323,594,745 | 10,154,311 | (113,406,792 | ) | (30,001,739 | ) | 188,700,118 | 379,040,643 | ||||||||||||||||
| JPMorgan Core Bond Portfolio (Class A) |
139,562,871 | 5,087,291 | (3,794,202 | ) | (635,672 | ) | 4,446,204 | 144,666,492 | ||||||||||||||||
| JPMorgan Small Cap Value Portfolio (Class A) |
119,952,862 | 15,710,292 | (13,231,722 | ) | (6,184,295 | ) | 10,221,470 | 126,468,607 | ||||||||||||||||
| Loomis Sayles Growth Portfolio (Class A) |
353,599,546 | 22,381,670 | (132,737,632 | ) | (252,468 | ) | 138,319,104 | 381,310,220 | ||||||||||||||||
| Loomis Sayles Small Cap Growth Portfolio (Class A) |
142,176,620 | 198,273 | (11,350,816 | ) | (3,473,756 | ) | 20,103,325 | 147,653,646 | ||||||||||||||||
| MFS Research International Portfolio (Class A) |
270,045,144 | 20,135,421 | (23,192,488 | ) | 5,316,873 | 19,120,748 | 291,425,698 | |||||||||||||||||
| MFS Value Portfolio (Class A) |
474,463,843 | 64,657,675 | (27,157,991 | ) | (11,453,654 | ) | (16,272,957 | ) | 484,236,916 | |||||||||||||||
BHFTII-11
Brighthouse Funds Trust II
Brighthouse Asset Allocation 80 Portfolio
Notes to Financial Statements—December 31, 2023—(Continued)
| Security Description |
Market Value December 31, 2022 |
Purchases | Sales | Realized Gain/(Loss) |
Change in Unrealized Appreciation/ (Depreciation) |
Ending Value as of December 31, 2023 |
||||||||||||||||||
| Morgan Stanley Discovery Portfolio (Class A) |
$ | 15,858,278 | $ | 3,165,353 | $ | (5,090,953 | ) | $ | (19,583,392 | ) | $ | 26,585,074 | $ | 20,934,360 | ||||||||||
| Neuberger Berman Genesis Portfolio (Class A) |
19,977,964 | 1,835,566 | (1,942,968 | ) | 109,491 | 1,089,599 | 21,069,652 | |||||||||||||||||
| PIMCO Inflation Protected Bond Portfolio (Class A) |
119,448,646 | 4,272,267 | (22,894,201 | ) | (1,309,087 | ) | 3,057,396 | 102,575,021 | ||||||||||||||||
| PIMCO Total Return Portfolio (Class A) |
240,892,804 | 27,611,152 | (6,275,823 | ) | (1,623,298 | ) | 9,051,176 | 269,656,011 | ||||||||||||||||
| SSGA Emerging Markets Enhanced Index Portfolio (Class A) |
120,566,907 | 5,009,953 | (10,045,751 | ) | (663,120 | ) | 11,475,185 | 126,343,174 | ||||||||||||||||
| T. Rowe Price Large Cap Growth Portfolio (Class A) |
287,332,637 | 10,354,770 | (89,187,601 | ) | (13,381,171 | ) | 139,803,961 | 334,922,596 | ||||||||||||||||
| T. Rowe Price Large Cap Value Portfolio (Class A) |
410,991,461 | 68,297,506 | (24,814,214 | ) | (8,257,994 | ) | (21,256,880 | ) | 424,959,879 | |||||||||||||||
| T. Rowe Price Mid Cap Growth Portfolio (Class A) |
40,639,923 | 2,082,669 | (5,962,596 | ) | (1,496,766 | ) | 7,139,836 | 42,403,066 | ||||||||||||||||
| T. Rowe Price Small Cap Growth Portfolio (Class A) |
141,644,615 | 3,583,813 | (22,706,880 | ) | (3,994,742 | ) | 29,278,271 | 147,805,077 | ||||||||||||||||
| TCW Core Fixed Income Portfolio (Class A) |
220,378,476 | 8,067,664 | (5,887,144 | ) | (818,555 | ) | 6,796,041 | 228,536,482 | ||||||||||||||||
| VanEck Global Natural Resources Portfolio (Class A) |
238,546,020 | 36,062,025 | (9,286,970 | ) | 2,114,276 | (15,530,701 | ) | 251,904,650 | ||||||||||||||||
| Victory Sycamore Mid Cap Value Portfolio (Class A) |
— | 22,127,976 | (525,234 | ) | (41,684 | ) | (358,263 | ) | 21,202,795 | |||||||||||||||
| Western Asset Management Strategic Bond Opportunities Portfolio (Class A) |
120,376,464 | 8,088,430 | (6,018,595 | ) | (1,601,633 | ) | 4,465,098 | 125,309,764 | ||||||||||||||||
|
|
|
|
|
|
|
|
|
|
|
|
|
|||||||||||||
| $ | 8,016,684,088 | $ | 614,942,033 | $ | (1,073,876,074 | ) | $ | (166,100,681 | ) | $ | 1,023,923,591 | $ | 8,415,572,957 | |||||||||||
|
|
|
|
|
|
|
|
|
|
|
|
|
|||||||||||||
| Security Description |
Capital Gain Distributions from Affiliated Investments |
Income earned from affiliates during the period |
Number of shares held at December 31, 2023 |
|||||||||
| AB International Bond Portfolio (Class A) |
$ | — | $ | 3,180,577 | 7,799,914 | |||||||
| Allspring Mid Cap Value Portfolio (Class A) |
8,200,110 | 776,488 | 5,673,550 | |||||||||
| Baillie Gifford International Stock Portfolio (Class A) |
— | 4,770,898 | 36,667,064 | |||||||||
| BlackRock Bond Income Portfolio (Class A) |
— | 10,117,157 | 3,589,328 | |||||||||
| BlackRock Capital Appreciation Portfolio (Class A) |
4,979,376 | 107,707 | 6,982,872 | |||||||||
| BlackRock High Yield Portfolio (Class A) |
— | 3,189,463 | 8,450,442 | |||||||||
| Brighthouse Small Cap Value Portfolio (Class A) |
17,027,760 | 2,560,015 | 15,020,322 | |||||||||
| Brighthouse/abrdn Emerging Markets Equity Portfolio (Class A) |
— | 2,066,638 | 19,173,419 | |||||||||
| Brighthouse/Artisan International Portfolio (Class A) |
— | 5,776,189 | 32,829,727 | |||||||||
| Brighthouse/Artisan Mid Cap Value Portfolio (Class A) |
2,669,001 | 175,952 | 97,568 | |||||||||
| Brighthouse/Dimensional International Small Company Portfolio (Class A) |
5,241,717 | 4,206,519 | 16,932,384 | |||||||||
| Brighthouse/Eaton Vance Floating Rate Portfolio (Class A) |
— | 4,752,264 | 8,179,055 | |||||||||
| Brighthouse/Templeton International Bond Portfolio (Class A) |
— | — | 16,108,084 | |||||||||
| Brighthouse/Wellington Core Equity Opportunities Portfolio (Class A) |
39,129,415 | 5,300,302 | 13,183,084 | |||||||||
| Brighthouse/Wellington Large Cap Research Portfolio (Class A) |
15,990,788 | 2,439,273 | 21,419,789 | |||||||||
| CBRE Global Real Estate Portfolio (Class A) |
— | 5,523,519 | 20,140,702 | |||||||||
| Frontier Mid Cap Growth Portfolio (Class A) |
— | — | 1,686,810 | |||||||||
| Harris Oakmark International Portfolio (Class A) |
— | 8,324,216 | 30,558,816 | |||||||||
| Invesco Comstock Portfolio (Class A) |
72,100,844 | 9,127,416 | 33,288,382 | |||||||||
| Invesco Global Equity Portfolio (Class A) |
7,246,708 | 468,440 | 5,325,631 | |||||||||
| Invesco Small Cap Growth Portfolio (Class A) |
— | — | 23,192,255 | |||||||||
| Jennison Growth Portfolio (Class A) |
— | — | 26,450,847 | |||||||||
| JPMorgan Core Bond Portfolio (Class A) |
— | 4,363,984 | 15,949,999 | |||||||||
| JPMorgan Small Cap Value Portfolio (Class A) |
10,306,139 | 1,666,849 | 11,201,825 | |||||||||
| Loomis Sayles Growth Portfolio (Class A) |
22,372,237 | — | 24,584,798 | |||||||||
| Loomis Sayles Small Cap Growth Portfolio (Class A) |
— | — | 13,903,356 | |||||||||
| MFS Research International Portfolio (Class A) |
5,170,510 | 4,633,314 | 24,084,768 | |||||||||
| MFS Value Portfolio (Class A) |
55,777,681 | 8,826,984 | 34,787,135 | |||||||||
| Morgan Stanley Discovery Portfolio (Class A) |
— | — | 3,659,853 | |||||||||
| Neuberger Berman Genesis Portfolio (Class A) |
1,801,044 | 26,518 | 1,140,750 | |||||||||
| PIMCO Inflation Protected Bond Portfolio (Class A) |
— | 2,427,235 | 10,797,371 | |||||||||
| PIMCO Total Return Portfolio (Class A) |
— | 7,903,375 | 27,183,066 | |||||||||
| SSGA Emerging Markets Enhanced Index Portfolio (Class A) |
— | 4,153,916 | 12,931,748 | |||||||||
| T. Rowe Price Large Cap Growth Portfolio (Class A) |
— | — | 16,179,836 | |||||||||
| T. Rowe Price Large Cap Value Portfolio (Class A) |
59,684,351 | 8,562,791 | 16,127,510 | |||||||||
| T. Rowe Price Mid Cap Growth Portfolio (Class A) |
2,074,905 | — | 4,458,787 | |||||||||
| T. Rowe Price Small Cap Growth Portfolio (Class A) |
3,492,656 | 79,923 | 7,427,391 | |||||||||
| TCW Core Fixed Income Portfolio (Class A) |
— | 6,860,861 | 25,649,437 | |||||||||
| VanEck Global Natural Resources Portfolio (Class A) |
— | 7,129,241 | 21,186,262 | |||||||||
| Victory Sycamore Mid Cap Value Portfolio (Class A) |
2,214,397 | 331,573 | 1,091,802 | |||||||||
| Western Asset Management Strategic Bond Opportunities Portfolio (Class A) |
— | 8,073,273 | 11,422,950 | |||||||||
|
|
|
|
|
|||||||||
| $ | 335,479,639 | $ | 137,902,870 | |||||||||
|
|
|
|
|
|||||||||
BHFTII-12
Brighthouse Funds Trust II
Brighthouse Asset Allocation 80 Portfolio
Notes to Financial Statements—December 31, 2023—(Continued)
7. Contractual Obligations
Under the Trust’s organizational documents, its officers and Trustees may be indemnified against certain liabilities and expenses arising out of the performance of their duties to the Trust. Additionally, the Trust has a variety of indemnification obligations under contracts with its service providers. The Trust’s maximum exposure under these arrangements is unknown, as this would involve future claims that may be made against the Trust that have not yet occurred.
8. Income Tax Information
The cost basis of investments for federal income tax purposes at December 31, 2023 was as follows:
| Cost basis of investments |
$ | 8,744,900,870 | ||
|
|
|
|||
| Gross unrealized appreciation |
253,560,448 | |||
| Gross unrealized (depreciation) |
(582,888,361 | ) | ||
|
|
|
|||
| Net unrealized appreciation (depreciation) |
$ | (329,327,913 | ) | |
|
|
|
The tax character of distributions paid for the years ended December 31, 2023 and 2022 were as follows:
| Ordinary Income |
Long-Term Capital Gain | Total | ||||||||||||||||||
| 2023 |
2022 | 2023 | 2022 | 2023 | 2022 | |||||||||||||||
| $248,138,575 | $ | 159,297,210 | $ | 952,499,338 | $ | 834,296,428 | $ | 1,200,637,913 | $ | 993,593,638 | ||||||||||
As of December 31, 2023, the components of distributable earnings (accumulated losses) on a federal income tax basis were as follows:
| Undistributed |
Undistributed Long-Term Capital Gain |
Net Unrealized Appreciation (Depreciation) |
Accumulated Capital Losses |
Total | ||||||||||||
| $116,297,212 | $ | 167,554,517 | $ | (329,327,913 | ) | $ | — | $ | (45,476,184 | ) | ||||||
The Asset Allocation Portfolio utilizes the provisions of the federal income tax laws that provide for the carryforward of capital losses for prior years, offsetting such losses against any future realized capital gains. Net capital losses may be carried forward indefinitely and their character is retained as short-term and/or long-term losses.
As of December 31, 2023, the Asset Allocation Portfolio had no accumulated capital losses.
9. Regulatory Updates
Effective January 24, 2023, the Securities and Exchange Commission adopted rule and form amendments that require open-end management investment companies to transmit concise and visually engaging annual and semiannual reports to shareholders that highlight certain information deemed by the SEC to be particularly important for investors. Certain other information, including financial statements, will no longer appear in shareholder reports but will, as required, be available online, delivered free of charge upon request, and filed on a semiannual basis on Form N-CSR. The rule and form amendments have a compliance date of July 24, 2024. Accordingly, the rule and form amendments will not impact the Portfolio until its 2024 semiannual shareholder report.
BHFTII-13
Brighthouse Funds Trust II
Brighthouse Asset Allocation 80 Portfolio
Report of Independent Registered Public Accounting Firm
To the Board of Trustees of Brighthouse Funds Trust II and Shareholders of the Brighthouse Asset Allocation 80 Portfolio:
Opinion on the Financial Statements and Financial Highlights
We have audited the accompanying statement of assets and liabilities, including the schedule of investments, of the Brighthouse Asset Allocation 80 Portfolio (the “Fund”) (one of the funds constituting the Brighthouse Funds Trust II), as of December 31, 2023, the related statement of operations for the year then ended, the statements of changes in net assets for each of the two years in the period then ended, the financial highlights for each of the five years in the period then ended, and the related notes. In our opinion, the financial statements and financial highlights present fairly, in all material respects, the financial position of the Fund as of December 31, 2023, and the results of its operations for the year then ended, the changes in its net assets for each of the two years in the period then ended, and the financial highlights for each of the five years in the period then ended in conformity with accounting principles generally accepted in the United States of America.
Basis for Opinion
These financial statements and financial highlights are the responsibility of the Fund’s management. Our responsibility is to express an opinion on the Fund’s financial statements and financial highlights based on our audits. We are a public accounting firm registered with the Public Company Accounting Oversight Board (United States) (PCAOB) and are required to be independent with respect to the Fund in accordance with the U.S. federal securities laws and the applicable rules and regulations of the Securities and Exchange Commission and the PCAOB.
We conducted our audits in accordance with the standards of the PCAOB. Those standards require that we plan and perform the audit to obtain reasonable assurance about whether the financial statements and financial highlights are free of material misstatement, whether due to error or fraud. The Fund is not required to have, nor were we engaged to perform, an audit of its internal control over financial reporting. As part of our audits we are required to obtain an understanding of internal control over financial reporting but not for the purpose of expressing an opinion on the effectiveness of the Fund’s internal control over financial reporting. Accordingly, we express no such opinion.
Our audits included performing procedures to assess the risks of material misstatement of the financial statements and financial highlights, whether due to error or fraud, and performing procedures that respond to those risks. Such procedures included examining, on a test basis, evidence regarding the amounts and disclosures in the financial statements and financial highlights. Our audits also included evaluating the accounting principles used and significant estimates made by management, as well as evaluating the overall presentation of the financial statements and financial highlights. Our procedures included confirmation of securities owned as of December 31, 2023, by correspondence with the transfer agent. We believe that our audits provide a reasonable basis for our opinion.
/s/ Deloitte & Touche LLP
Boston, Massachusetts
February 23, 2024
We have served as the auditor of one or more Brighthouse investment companies since 1983.
BHFTII-14
Brighthouse Funds Trust II
Trustees and Officers
MANAGEMENT OF THE TRUSTS
The Boards of Trustees (the “Board”) of Brighthouse Funds Trust I and Brighthouse Funds Trust II (“Trust I” and “Trust II”, respectively, and collectively the “Trusts”) supervise the Trusts and are responsible for representing the interests of shareholders. The Trustees, the Chairman of the Board and the Chairmen of each subcommittee are the same for both Trusts. The Trustees of each Trust meet periodically throughout the year to oversee the Portfolios’ activities, reviewing, among other things, each Portfolio’s performance and its contractual arrangements with various service providers. The Trustees of each Trust elect the officers of the Trust, who are responsible for administering the Trust’s day-to-day operations.
Trustees and Officers
The Trustees and executive officers of the Trusts, as well as their ages and their principal occupations during the past five years, are set forth below. Unless otherwise indicated, the business address of each is c/o Brighthouse Funds Trust I and Brighthouse Funds Trust II, 11225 N. Community House Rd., Charolette, North Carolina 28277. Each Trustee who is deemed an “interested person,” as such term is defined in the 1940 Act, is referred to as an “Interested Trustee.” Those Trustees who are not “interested persons,” as such term is defined in the 1940 Act, are referred to as “Independent Trustees.” There is no limit to the term a Trustee may serve, other than pursuant to the retirement policy adopted by the Independent Trustees. Trustees serve until their death, resignation, retirement or removal in accordance with Trust I’s and Trust II’s respective organizational documents and policies adopted by the Board of the Trust from time to time. Officers hold office at the pleasure of each Board and serve until their removal or resignation in accordance with the Trusts’ respective organizational documents and policies adopted by the Board of each Trust from time to time.
Trustees of the Trusts
| Name and Year of Birth |
Position(s) |
Term of Office |
Principal Occupation(s) During the Past |
Number of |
Other Directorships Held | |||||
| Interested Trustee | ||||||||||
| John Rosenthal* (1960) |
Trustee | Indefinite; From May 2016 (Trust I and Trust II) to present | Chief Investment Officer, Brighthouse Financial, Inc. (2016 to present). | 73 | None | |||||
| Independent Trustees | ||||||||||
| Dawn M. Vroegop (1966) |
Trustee and Chair of the Board | Indefinite; From December 2000 (Trust I)/May 2009 (Trust II) to present as Trustee; From May 2016 (Trust I and Trust II) until present as Chair | Retired; Private Investor. | 73 | Trustee, Driehaus Mutual Funds (8 portfolios).** | |||||
| Stephen M. Alderman (1959) |
Trustee | Indefinite; From December 2000 (Trust I)/April 2012 (Trust II) to present | Vice President and General Counsel, IHR Aerial Solutions, LLC; Until 2022, General Counsel, Illini Hi-Reach, Inc.; Until 2020, Shareholder in the law firm of Garfield & Merel, Ltd. | 73 | None | |||||
| Robert J. Boulware (1956) |
Trustee | Indefinite; From March 2008 (Trust I)/April 2012 (Trust II) to present | Managing Member, Pilgrim Funds, LLC (private equity fund). | 73 | Trustee, Vertical Capital Income Fund (closed-end fund);** Trustee, The Private Shares Fund (closed-end fund);** Until 2021, Director, Mid-Con Energy Partners, LP (energy);** Until 2020, Director, Gainsco, Inc. (auto insurance).** | |||||
BHFTII-15
Brighthouse Funds Trust II
Trustees and Officers—(Continued)
| Name and Year of Birth |
Position(s) |
Term of Office |
Principal Occupation(s) During the Past |
Number of |
Other Directorships Held | |||||
| Susan C. Gause (1952) |
Trustee | Indefinite; From March 2008 (Trust I)/April 2012 (Trust II) to present | Private Investor. | 73 | Trustee, HSBC Funds (4 portfolios).** | |||||
| Nancy Hawthorne (1951) |
Trustee | Indefinite; From May 2003 (Trust II)/April 2012 (Trust I) to present | Private Investor. | 73 | Trustee, First Eagle Credit Opportunities Fund;** Trustee and Chair of the Board of Trustees, First Eagle Global Opportunities Fund;** Director, Avid Technology, Inc;** Director, CRA International, Inc.** | |||||
Executive Officers of the Trusts
| Name and Year of Birth |
Position(s) |
Term of Office |
Principal Occupation(s) | |||
| Kristi Slavin (1973) | President and Chief Executive Officer, of Trust I and Trust II | From May 2016 (Trust I and Trust II) to present |
President, Brighthouse Investment Advisers, LLC (2016-present). | |||
| Alan R. Otis (1971) | Chief Financial Officer and Treasurer, of Trust I and Trust II | From November 2017 (Trust I and Trust II) to present |
Executive Vice President, Brighthouse Investment Advisers, LLC (2017-present); formerly, Vice President, Brighthouse Investment Advisers, LLC (2012-2017); Assistant Treasurer, Trust I and Trust II (2012-2017). | |||
| Thomas Watterson (1985) | Secretary, of Trust I and Trust II | From November 2023 (Trust I and Trust II) to present |
Executive Vice President, Chief Legal Officer and Secretary, Brighthouse Investment Advisers, LLC (2023-Present); Managing Corporate Counsel, Brighthouse Financial Inc. (2023-present); Managing Counsel and Director, The Bank of New York Mellon Corporation (2019-2023); Counsel and Vice President, The Bank of New York Mellon Corporation (2016-2019). | |||
| Katie Hellmann (1980) | Chief Compliance Officer (“CCO”), of Trust I and Trust II | From May 2023 (Trust I and Trust II) to present |
Chief Compliance Officer, Brighthouse Investment Advisers, LLC (2023-present) and Head of Funds and Investments Compliance (2023-present). Deputy Chief Compliance Officer, Transamerica Asset Management (2022-2023). Leader and Senior Compliance Counsel – Funds Compliance, Edward Jones (2017-2022). | |||
| Rosemary Morgan (1983) | Anti-Money Laundering Officer, of Trust I and Trust II | From May 2023 (Trust I and Trust II) to present |
Chief Privacy Officer, Leader of Compliance Programs and Assistant General Counsel, Brighthouse Financial, Inc. (2019-2022); Chief Privacy Officer, Head of Compliance Programs & Contracts Law, Brighthouse Financial, Inc. (2022-2023), Chief Compliance Officer and Associate General Counsel, Brighthouse Financial, Inc. (2023-present); Vice President and Chief Compliance Officer, Brighthouse Life Insurance Company (2023-present); Vice President and Chief Compliance Officer (2023-present), Brighthouse Life Insurance Company of NY; Vice President and Chief Compliance Officer (2023-present), New England Life Insurance Company. | |||
| Anna Koska (1981) | Vice President, of Trust I and Trust II | From June 2022 (Trust I and Trust II) to present |
Vice President, Investment and Advisory Services, Brighthouse Investment Advisers, LLC (2022-present); Director of Investment and Advisory Services, Brighthouse Investment Advisers, LLC (2019-2022); Senior Portfolio Analyst, Brighthouse Investment Advisers, LLC (2017-2019). | |||
| * | Mr. Rosenthal is an “interested person” of the Trusts because of his position with Brighthouse Financial, Inc. (“Brighthouse Financial”), an affiliate of BIA. |
| ** | Indicates a directorship with a registered investment company or a company subject to the reporting requirements of the Securities Exchange Act of 1934, as amended. |
| (1) | Previous positions during the past five years with the Trusts, MetLife, Inc. or the Adviser are omitted if not materially different. |
| (2) | The Fund Complex includes 44 Trust I Portfolios and 29 Trust II Portfolios. |
BHFTII-16
Brighthouse Funds Trust II
Brighthouse Asset Allocation 80 Portfolio
Board of Trustees’ Consideration of Advisory Agreements
At a meeting held on November 13-14, 2023 (the “November Meeting”), the Boards of Trustees (the “Board”) of Brighthouse Funds Trust I and Brighthouse Funds Trust II (“BFT I” and “BFT II,” respectively, and collectively, the “Trusts”), including a majority of the Trustees who are not “interested persons” of the Trusts (the “Independent Trustees”) under the Investment Company Act of 1940 (the “1940 Act”), approved the continuation of the Trusts’ advisory agreements (the “Advisory Agreements” or “Agreements”) with Brighthouse Investment Advisers, LLC (the “Adviser”) for the series of the Trusts (each a “Portfolio,” and collectively, the “Portfolios”) for the annual contract renewal period from January 1, 2024 through December 31, 2024.
The Board met with personnel of the Adviser on September 28-29, 2023 (the “September Meeting”) for the specific purpose of giving preliminary consideration to the proposed continuation of the Agreements, including consideration to information that the Adviser had provided for the Board’s review at the request of the Independent Trustees. At the September Meeting, the Adviser reviewed with the Board the performance and fees experienced by each Portfolio, as well as other information. During and after the September Meeting, the Independent Trustees requested additional information and clarifications that the Adviser addressed at the November Meeting (the September Meeting and the November Meeting are referred to collectively as, the “Meetings”). During the contract renewal process, and throughout the year, the Independent Trustees were advised by independent legal counsel, and they met with independent legal counsel in executive sessions outside of the presence of management on a number of occasions to discuss, among other things, the renewal of the Agreements.
In considering the continuation of the Agreements, the Board reviewed a variety of materials that were provided for the specific purpose of assisting the Board in the renewal process, along with various information and materials that were provided to and discussed with the Board throughout the year, at regularly scheduled meetings of the Board and its committees. In particular, information for each Portfolio included, but was not limited to, reports on investment performance, expenses, legal and compliance matters, and asset pricing. Information about the Adviser included, but was not limited to, reports on the business, operations, and performance of the Adviser and reports that the Adviser had prepared specifically for the renewal process.
In considering the continuation of the Agreements, the Board also reviewed, among other things, a report for each Portfolio that was prepared by Broadridge (“Broadridge”), an independent organization, which set forth comparative performance and expense information for each Portfolio. In addition, the Independent Trustees reviewed a report that was prepared by JDL Consultants, LLC (“JDL”), an independent consultant to the Independent Trustees, which examined the Broadridge reports for each Portfolio (“JDL Report”). The Independent Trustees met in executive session with representatives of JDL during the September Meeting to review the JDL Report.
At the November Meeting, the Board, including a majority of the Independent Trustees, concluded that the nature, extent, and quality of services provided by the Adviser supported the renewal of the Agreements. The Board also concluded that the investment services provided to and the performance of each Portfolio was such that each Agreement should continue, and that the fees paid by each Portfolio to the Adviser appeared to be reasonable in light of the nature, extent, and quality of the services provided by the Adviser. Further, the Board concluded that the Adviser’s profitability in providing services under the Advisory Agreements did not appear unreasonable in light of the nature, extent, and quality of the services provided by the Adviser. The Board reviewed the extent to which the investment advisory fees paid by the Portfolios shared economies of scale with investors or entailed the potential to share economies of scale with investors and concluded that those considerations generally supported the renewal of each Agreement.
In approving the continuation of each Agreement, the Board, including the Independent Trustees, gave attention to all of the information that was furnished, and each Trustee placed varying degrees of importance on the various pieces of information that were provided to them. The Board evaluated the information provided to it on a Portfolio-by-Portfolio basis, and its decision was made separately with respect to each Portfolio. The following paragraphs provide more information about some of the primary factors that were relevant to the Board’s decisions. The Board did not identify any single factor as determinative, and the Trustees generally attributed different weights to various factors for the various Portfolios.
Nature, extent and quality of services. The Board evaluated the nature, extent and quality of the services that the Adviser has provided to the Brighthouse Asset Allocation 20 Portfolio, Brighthouse Asset Allocation 40 Portfolio, Brighthouse Asset Allocation 60 Portfolio Brighthouse Asset Allocation 80 Portfolio and Brighthouse Asset Allocation 100 Portfolio (the “Asset Allocation Portfolios”) and the American Funds Balanced Allocation Portfolio, American Funds Growth Allocation Portfolio and American Funds Moderate Allocation Portfolio (the “American Funds of Funds”). The Board considered the Adviser’s services as investment manager to the Portfolios, including information with respect to investment programs and personnel, succession management of key personnel, oversight of transition management (as applicable), actions taken with respect to regulatory developments, compliance programs and personnel, and risk management programs, among other things. The Adviser’s services in coordinating and overseeing the activities of the Trusts’ other service providers were also considered. The Board also considered the systems and processes required by the Adviser
BHFTII-17
Brighthouse Funds Trust II
Brighthouse Asset Allocation 80 Portfolio
Board of Trustees’ Consideration of Advisory Agreements—(Continued)
to meet additional regulatory and compliance requirements resulting from U.S. Securities and Exchange Commission and other regulatory initiatives, including related to liquidity, valuation, and derivatives risk management. The Board considered information received from the Trusts’ Chief Compliance Officer regarding the Portfolios’ compliance policies and procedures that were established pursuant to Rule 38a-l under the 1940 Act and relevant aspects of the Adviser’s compliance policies and procedures. The Board also noted that the Adviser’s investment, compliance, and legal staff reviews and assesses the services that are provided to the Portfolios, and that personnel of the Adviser routinely prepare and present reports to the Independent Trustees regarding material information related to those reviews and assessments. In addition, during the Meetings and throughout the year, the Board considered the expertise, experience, and performance of the personnel of the Adviser who performed the various services that are mentioned above.
With respect to the Asset Allocation Portfolios, the Board noted that the Adviser employs at its own expense an independent consultant to provide research and consulting services with respect to the periodic asset allocation targets for each of the Asset Allocation Portfolios and investments in other Portfolios of the Trusts (the “Underlying Portfolios”). Additionally, the Board considered that a committee, consisting of investment professionals from the Adviser, meets regularly to review the management of the Asset Allocation Portfolios and the American Funds of Funds, including asset allocations and performance metrics.
Performance. The Board placed emphasis on the performance of each Portfolio in the context of the performance of the relevant markets in which the Portfolio invests. The Board considered the Adviser’s quarterly presentations to the Board of detailed information about each Portfolio’s investment strategies and performance results and composition, including discussions regarding the relevant effects of market conditions. The Board reviewed and considered the reports prepared by Broadridge, which provided a statistical analysis comparing each Portfolio’s investment performance to that of comparable funds underlying variable insurance products (the “Performance Universe”), and the JDL Report. The Board considered each Portfolio’s performance for periods subsequent to the performance period covered by the Broadridge reports, and considered the Adviser’s assessment of the same. The Board also noted that while it found the data provided by Broadridge generally useful, it recognized the limitations of such data, including, in particular, that notable differences may exist between a Portfolio and the other funds in a Broadridge category (for example, with respect to investment strategies) and that the results of the performance comparisons may vary depending on (i) the end dates for the performance periods that were selected, and (ii) the selection of the peer groups.
Fees and Expenses. The Board gave consideration to the level and method of computing the fees payable under the Agreements. The Board reviewed and considered the information in the JDL Report concerning fees and expenses. The Board also reviewed and considered the Broadridge report for each Portfolio, which included various comparisons of the Portfolio’s fees (at December 31, 2022 and various asset levels) and expenses, with those of its peers, including, as applicable, a broad group of peer funds (“Expense Universe”) and a narrower group of peer funds (“Expense Group”). In particular, the Board reviewed comparisons of each Portfolio’s contractual management fees with its Expense Group and total expenses with its Expense Universe and Expense Group. The Board considered that Broadridge selected the peer funds, which were funds underlying variable insurance products that Broadridge deemed to be comparable to the Portfolios. The Board considered that the fee and expense information in the Broadridge report for each Portfolio reflected information as of the Portfolio’s most recent fiscal year end at the time the Broadridge report was issued and that historical asset levels may differ from current asset levels, particularly in a period of market volatility.
The Board also considered that the Adviser had entered into an expense limitation and management fee waiver agreement with Brighthouse Asset Allocation 20 Portfolio pursuant to which the Adviser had agreed to waive a portion of its advisory fee and/or reimburse certain expenses as a means of limiting the Portfolio’s total annual operating expenses.
Profitability. The Board examined the profitability to the Adviser of each Advisory Agreement, on a Portfolio-by-Portfolio basis. In the case of the Asset Allocation Portfolios, the Board also considered the Adviser’s analysis of its profitability that was attributable to its management of the Underlying Portfolios of the Trust in which the Asset Allocation Portfolios invest. The Board also considered that an affiliate of the Adviser, Brighthouse Securities, LLC, serves as distributor for the Trusts, and, as such, receives Rule 12b-1 payments to support the distribution of the Portfolios. In reviewing the profitability information, the Board recognized that expense allocation methodologies are inherently subjective and various methodologies may be reasonable while producing different results.
Economies of scale. The Board considered each Portfolio’s fees in light of its size. The Board noted the fee schedules for the Portfolios contain breakpoints that reduce the fee rate above specified asset levels.
The Board considered the effective fees under the Advisory Agreement for each Portfolio as a percentage of assets at different asset levels and possible economies of scale that may be realized if the assets of the Portfolio grow. The Board examined, among other data, the effect of a Portfolio’s growth in size, and reduction in size, on various fee schedules. The Board also generally noted that if a
BHFTII-18
Brighthouse Funds Trust II
Brighthouse Asset Allocation 80 Portfolio
Board of Trustees’ Consideration of Advisory Agreements—(Continued)
Portfolio’s assets increase over time, the Portfolio may realize economies of scale if assets increase proportionally more than certain other expenses.
Other factors. The Board considered other benefits that may be realized by the Adviser and its affiliates from their relationships with the Trusts. Among the benefits realized by the Adviser, the Board recognized that Brighthouse Securities, LLC, as the distributor for the Trusts, receives payments pursuant to Rule 12b-1 from the Portfolios to help compensate for the provision of distribution and shareholder services activities.
The Board considered information from the Adviser pertaining to potential conflicts of interest, and the manner in which any potential conflicts were mitigated.
* * * * *
Brighthouse Asset Allocation 80 Portfolio. The Board also considered the following information in relation to the Agreement with the Adviser regarding the Portfolio:
Among other data relating specifically to the Portfolio’s performance, the Board considered that the Portfolio outperformed the median of its Performance Universe and the average of its Morningstar Category for the one-, three-, and five-year periods ended June 30, 2023. The Board further considered that the Portfolio underperformed the Brighthouse AA 80 Narrow Index for the one-, three-, and five-year periods ended October 31, 2023. The Board also took into account that the Portfolio outperformed its benchmark, the Dow Jones Moderately Aggressive Portfolio Index, for the one-, three-, and five-year periods ended October 31, 2023.
The Board also considered that the Portfolio’s actual management fees were equal to the Expense Group median and below the Expense Universe median. The Board also considered that the Portfolio’s total expenses (inclusive of underlying fund expenses and exclusive of 12b-1 fees) were below the Expense Group median and the Expense Universe median. The Board noted that the Portfolio’s contractual management fees were below the asset-weighted average of the Investment Classification/Morningstar Category selected by Broadridge at the Portfolio’s current size.
BHFTII-19
Brighthouse Funds Trust II
Brighthouse/Artisan Mid Cap Value Portfolio
Managed By Artisan Partners Limited Partnership
Portfolio Manager Commentary*
PERFORMANCE
For the twelve months ended December 31, 2023, the Class A, B and E shares of the Brighthouse/Artisan Mid Cap Value Portfolio returned 18.53%, 18.24%, and 18.35%, respectively. The Portfolio’s benchmark, the Russell Midcap Value Index¹, returned 12.71%.
MARKET ENVIRONMENT / CONDITIONS
United States (“U.S.”) stocks closed out 2023 strongly with a huge rally in the final two months of the year sparked by a big drop in long-term U.S. Treasury yields. The Russell Midcap Value Index (the “Index”) surged 20% from its October lows to finish at its high of the year. The Index’s fourth quarter gain of 12.11% constituted the bulk of its 2023 calendar year return of 12.71%. The rally kicked off in late October just days after high profile investors Bill Ackman and Bill Gross acknowledged they had covered their U.S. Treasuries shorts and also coinciding with the U.S. Treasury department’s shift in issuance from long-dated bonds in favor of shorter term debt. At that time, the market was pricing what may prove to be a cycle-peak cost of capital and was also grappling with fears an aggressive Federal Reserve (the “Fed”) would tip the economy into recession. As inflation continued easing and economic growth remained resilient, investors sensed rates had likely peaked and the threat of a significant recession had faded. The revival of animal spirits was also supported by improved corporate fundamentals as earnings growth turned positive after a few quarters of modest weakness. Yields continued to decline into year-end as inflation neared more comfortable levels, leading to increased bets of a dovish pivot by the Fed in the first half of 2024.
Up until the final two months of the year, the story of 2023 for U.S. equities was extremely narrow leadership. Through three quarters, nearly all the Standard & Poor’s 500 year-to-date gains were generated by the “Magnificent Seven”, as the largest seven U.S. stocks were dubbed. Narrow breadth was also evident in dispersion of returns by market cap, sector and style as large-cap, cyclicals and growth stocks were big winners by wide margins in comparison to small caps, defensive sectors and value stocks. Market breadth meaningfully improved in the fourth quarter as many left-behind stocks benefited from soft landing/no landing hopes and substantial easing in financial conditions as the 10-Year Treasury yield declined more than 100bps to fall below 4%. Full-year returns were led by large-caps over mid and small caps, and growth stocks led value stocks. The top-performing sectors in the Index in 2023 were Industrials, Consumer Discretionary and Information Technology (“IT”). Defensive sectors trailed, with Consumer Staples, Utilities and Health Care sectors generating negative returns.
PORTFOLIO REVIEW / PERIOD ENDING POSITIONING
During the reporting period, the Portfolio outperformed the Index, driven by positive stock selection. Financials, Consumer Discretionary and IT holdings were key sources of relative strength. Key contributors in these sectors were banks First Citizens BancShares and Fifth Third Bancorp, investment bank Moelis & Co., mobility infrastructure technology company Vontier, and travel and leisure companies Expedia Group and Marriott International. On the downside, the Portfolio’s Industrials, Consumer Staples and Communication Services underperformed. The biggest individual detractors were Cable One, a small cable company operating in rural U.S. markets; Liberty SiriusXM, tracking stocks for Liberty Media’s stakes in Sirius XM Holdings and Live Nation Entertainment; Dollar General, a discount retail chain in the U.S.; Northern Trust, a provider of asset servicing and investment management; and Baxter International, a medical technology company.
During the reporting period, the largest sector weighting changes were increases to Health Care and Real Estate and decreases to Communication Services and Real Estate. At period end, the Portfolio maintained above-benchmark weightings in the Communications Services, Consumer Discretionary and Health Care sectors. Conversely, the largest sector underweights were Industrials, Materials and Utilities.
Daniel L. Kane
Thomas Reynolds
Craig Inman
Portfolio Managers
Artisan Partners Limited Partnership
* This commentary may include statements that constitute “forward-looking statements” under the U.S. securities laws. Forward-looking statements include, among other things, projections, estimates, and information about possible or future results related to the Portfolio, market or regulatory developments. The views expressed above are not guarantees of future performance or economic results and involve certain risks, uncertainties and assumptions that could cause actual outcomes and results to differ materially from the views expressed herein. The views expressed above are subject to change at any time based upon economic, market, or other conditions and the subadvisory firm undertakes no obligation to update the views expressed herein. Any discussions of specific securities should not be considered a recommendation to buy or sell those securities. The views expressed above (including any forward-looking statement) may not be relied upon as investment advice or as an indication of the Portfolio’s trading intent. Information about the Portfolio’s holdings, asset allocation or country diversification is historical and is not an indication of future Portfolio composition, which may vary. Direct investment in any index is not possible. The performance of any index mentioned in this commentary has not been adjusted for ongoing management, distribution and operating expenses, and sales charges applicable to mutual fund investments. In addition, the returns do not reflect additional fees charged by separate accounts or variable insurance contracts that an investor in the Portfolio may pay. If these additional fees were reflected, performance would have been lower.
1 The Russell Midcap Value Index is an unmanaged measure of performance of those Russell Midcap companies (the 800 smallest companies in the Russell 1000 Index) with lower price-to-book ratios and lower forecasted growth values.
BHFTII-1
Brighthouse Funds Trust II
Brighthouse/Artisan Mid Cap Value Portfolio
A $10,000 INVESTMENT COMPARED TO THE RUSSELL MIDCAP VALUE INDEX
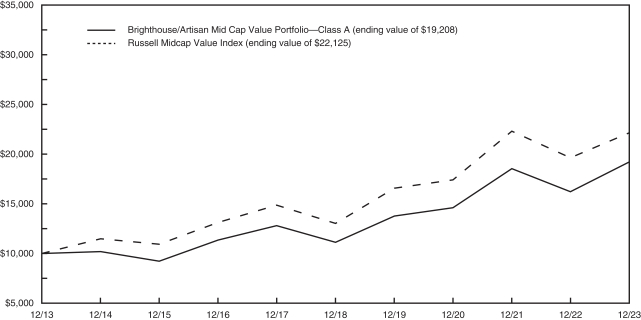
AVERAGE ANNUAL RETURNS (%) FOR THE YEAR ENDED DECEMBER 31, 2023
| 1 Year | 5 Year | 10 Year | ||||||||||
| Brighthouse/Artisan Mid Cap Value Portfolio | ||||||||||||
| Class A |
18.53 | 11.56 | 6.75 | |||||||||
| Class B |
18.24 | 11.28 | 6.48 | |||||||||
| Class E |
18.35 | 11.39 | 6.59 | |||||||||
| Russell Midcap Value Index | 12.71 | 11.16 | 8.26 | |||||||||
Portfolio performance is calculated including reinvestment of all income and capital gain distributions. Performance numbers are net of all Portfolio expenses but do not include any insurance, sales, separate account or administrative charges of variable annuity or life insurance contracts or any additional expenses that participants may bear relating to the operations of their plans. If these charges were included, the returns would be lower. The performance of any index referenced above has not been adjusted for ongoing management, distribution and operating expenses, and sales charges applicable to mutual fund investments. Direct investment in any index is not possible. The performance of Class A shares, as set forth in the line graph above, will differ from that of other classes because of the difference in expenses paid by policyholders investing in the different share classes.
This information represents past performance and is not indicative of future results. Investment return and principal value may fluctuate so that shares, upon redemption, may be worth more or less than the original cost.
PORTFOLIO COMPOSITION AS OF DECEMBER 31, 2023
Top Holdings
| % of Net Assets |
||||
| First Citizens BancShares, Inc. - Class A | 4.4 | |||
| Analog Devices, Inc. | 3.9 | |||
| U-Haul Holding Co. (Non-Voting Shares) | 3.4 | |||
| Vontier Corp. | 3.1 | |||
| Marriott International, Inc. - Class A | 3.1 | |||
| Globe Life, Inc. | 3.0 | |||
| Expedia Group, Inc. | 3.0 | |||
| Lamar Advertising Co. - Class A | 2.6 | |||
| NOV, Inc. | 2.6 | |||
| Fifth Third Bancorp | 2.5 | |||
Top Sectors
| % of Net Assets |
||||
| Financials | 22.0 | |||
| Consumer Discretionary | 12.4 | |||
| Industrials | 11.5 | |||
| Communication Services | 11.3 | |||
| Health Care | 11.0 | |||
| Information Technology | 9.9 | |||
| Real Estate | 7.6 | |||
| Consumer Staples | 6.5 | |||
| Energy | 2.6 | |||
| Utilities | 2.1 | |||
BHFTII-2
Brighthouse Funds Trust II
Brighthouse/Artisan Mid Cap Value Portfolio
Understanding Your Portfolio’s Expenses
Shareholder Expense Example
As a shareholder of the Portfolio, you incur ongoing costs, including management fees; distribution and service (12b-1) fees; and other Portfolio expenses. This example is intended to help you understand your ongoing costs (in dollars) (referred to as “expenses”) of investing in the Portfolio and compare these costs with the ongoing costs of investing in other mutual funds. The example is based on an investment of $1,000 invested at the beginning of the period and held for the entire period, July 1, 2023 through December 31, 2023.
Actual Expenses
The first line for each share class of the Portfolio in the table below provides information about actual account values and actual expenses. You may use the information in this line, together with the amount you invested in the particular share class of the Portfolio, to estimate the expenses that you paid over the period. Simply divide your account value by $1,000 (for example, an $8,600 account value divided by $1,000 = 8.6), then multiply the result by the number in the first line under the heading entitled “Expenses Paid During Period” to estimate the expenses you paid on your account during this period.
Hypothetical Example for Comparison Purposes
The second line for each share class of the Portfolio in the table below provides information about hypothetical account values and hypothetical expenses based on the Portfolio’s actual expense ratio and an assumed rate of return of 5% per year before expenses, which is not the Portfolio’s actual return. The hypothetical account values and expenses may not be used to estimate the actual ending account balance or expenses you paid for the period. You may use this information to compare the ongoing costs of investing in the Portfolio and other funds. To do so, compare this 5% hypothetical example with the 5% hypothetical examples that appear in the shareholder reports of the other funds.
Please note that the expenses shown in the table are meant to highlight your ongoing costs only and do not reflect any fees or charges of your variable insurance product or any additional expenses that participants in certain eligible qualified plans may bear relating to the operations of their plan. Therefore, the second line for each share class in the table is useful in comparing ongoing costs only, and will not help you determine the relative total costs of owning different funds. In addition, if these other costs were included, your costs would have been higher.
| Brighthouse/Artisan Mid Cap Value Portfolio |
Annualized Expense Ratio |
Beginning Account Value July 1, 2023 |
Ending Account Value December 31, 2023 |
Expenses Paid During Period** July 1, 2023 to December 31, 2023 |
||||||||||||||
| Class A (a) |
Actual | 0.77 | % | $ | 1,000.00 | $ | 1,081.00 | $ | 4.04 | |||||||||
| Hypothetical* | 0.77 | % | $ | 1,000.00 | $ | 1,021.32 | $ | 3.92 | ||||||||||
| Class B (a) |
Actual | 1.02 | % | $ | 1,000.00 | $ | 1,079.70 | $ | 5.35 | |||||||||
| Hypothetical* | 1.02 | % | $ | 1,000.00 | $ | 1,020.06 | $ | 5.19 | ||||||||||
| Class E (a) |
Actual | 0.92 | % | $ | 1,000.00 | $ | 1,080.20 | $ | 4.82 | |||||||||
| Hypothetical* | 0.92 | % | $ | 1,000.00 | $ | 1,020.57 | $ | 4.69 | ||||||||||
| * | Hypothetical assumes a rate of return of 5% per year before expenses. |
| ** | Expenses paid are equal to the Portfolio’s annualized expense ratio for the most recent six month period, as shown above, multiplied by the average account value over the period, multiplied by the number of days (184 days) in the most recent fiscal half-year, divided by 365 (to reflect the one-half year period). |
| (a) | The annualized expense ratio shown reflects the impact of the management fee waiver as described in Note 5 of the Notes to Financial Statements. |
BHFTII-3
Brighthouse Funds Trust II
Brighthouse/Artisan Mid Cap Value Portfolio
Schedule of Investments as of December 31, 2023
Common Stocks—96.9% of Net Assets
| Security Description | Shares | Value | ||||||
| Aerospace & Defense—1.7% | ||||||||
| CAE, Inc. (a) |
606,618 | $ | 13,096,883 | |||||
|
|
|
|||||||
| Air Freight & Logistics—2.0% | ||||||||
| Expeditors International of Washington, Inc. |
125,650 | 15,982,680 | ||||||
|
|
|
|||||||
| Automobile Components—3.1% | ||||||||
| BorgWarner, Inc. |
236,916 | 8,493,439 | ||||||
| Gentex Corp. (b) |
494,888 | 16,163,042 | ||||||
|
|
|
|||||||
| 24,656,481 | ||||||||
|
|
|
|||||||
| Banks—11.2% | ||||||||
| Fifth Third Bancorp |
571,909 | 19,725,142 | ||||||
| First Citizens BancShares, Inc. - Class A |
24,490 | 34,750,575 | ||||||
| M&T Bank Corp. (b) |
132,229 | 18,125,951 | ||||||
| WaFd, Inc. |
466,954 | 15,390,804 | ||||||
|
|
|
|||||||
| 87,992,472 | ||||||||
|
|
|
|||||||
| Capital Markets—2.2% | ||||||||
| Moelis & Co. - Class A (b) |
302,515 | 16,980,167 | ||||||
|
|
|
|||||||
| Consumer Staples Distribution & Retail—4.6% | ||||||||
| Dollar General Corp. |
71,072 | 9,662,238 | ||||||
| Kroger Co. |
310,241 | 14,181,116 | ||||||
| Sysco Corp. |
164,830 | 12,054,018 | ||||||
|
|
|
|||||||
| 35,897,372 | ||||||||
|
|
|
|||||||
| Electric Utilities—2.1% | ||||||||
| OGE Energy Corp. (b) |
478,692 | 16,720,712 | ||||||
|
|
|
|||||||
| Electrical Equipment—2.2% | ||||||||
| nVent Electric PLC |
294,984 | 17,430,604 | ||||||
|
|
|
|||||||
| Electronic Equipment, Instruments & Components—3.1% | ||||||||
| Vontier Corp. |
713,660 | 24,656,953 | ||||||
|
|
|
|||||||
| Energy Equipment & Services—2.6% | ||||||||
| NOV, Inc. |
997,986 | 20,239,156 | ||||||
|
|
|
|||||||
| Entertainment—3.3% | ||||||||
| Electronic Arts, Inc. |
101,920 | 13,943,675 | ||||||
| Warner Bros. Discovery, Inc. (a) (b) |
1,066,847 | 12,140,719 | ||||||
|
|
|
|||||||
| 26,084,394 | ||||||||
|
|
|
|||||||
| Financial Services—2.1% | ||||||||
| Corebridge Financial, Inc. (b) |
755,712 | 16,368,722 | ||||||
|
|
|
|||||||
| Food Products—2.0% | ||||||||
| Tyson Foods, Inc. - Class A (b) |
288,257 | 15,493,814 | ||||||
|
|
|
|||||||
| Ground Transportation—3.8% | ||||||||
| U-Haul Holding Co. (a) (b) |
43,469 | 3,121,074 | ||||||
| U-Haul Holding Co. (Non-Voting Shares) |
380,075 | 26,772,483 | ||||||
|
|
|
|||||||
| 29,893,557 | ||||||||
|
|
|
|||||||
| Health Care Equipment & Supplies—4.6% | ||||||||
| Baxter International, Inc. |
458,880 | 17,740,301 | ||||||
| Dentsply Sirona, Inc. (b) |
527,744 | 18,782,409 | ||||||
|
|
|
|||||||
| 36,522,710 | ||||||||
|
|
|
|||||||
| Health Care Providers & Services—2.3% | ||||||||
| Centene Corp. (a) |
244,501 | 18,144,419 | ||||||
|
|
|
|||||||
| Hotels, Restaurants & Leisure—7.7% | ||||||||
| Expedia Group, Inc. (a) |
155,037 | 23,533,066 | ||||||
| Marriott International, Inc. - Class A |
108,502 | 24,468,286 | ||||||
| Vail Resorts, Inc. (b) |
59,244 | 12,646,817 | ||||||
|
|
|
|||||||
| 60,648,169 | ||||||||
|
|
|
|||||||
| Insurance—6.6% | ||||||||
| Arch Capital Group Ltd. (a) |
239,688 | 17,801,628 | ||||||
| Globe Life, Inc. |
195,123 | 23,750,371 | ||||||
| Progressive Corp. |
65,622 | 10,452,272 | ||||||
|
|
|
|||||||
| 52,004,271 | ||||||||
|
|
|
|||||||
| Interactive Media & Services—1.7% | ||||||||
| IAC, Inc. (a) |
262,196 | 13,733,826 | ||||||
|
|
|
|||||||
| Life Sciences Tools & Services—4.0% | ||||||||
| Bio-Rad Laboratories, Inc. - Class A (a) |
42,009 | 13,564,286 | ||||||
| Waters Corp. (a) (b) |
55,142 | 18,154,401 | ||||||
|
|
|
|||||||
| 31,718,687 | ||||||||
|
|
|
|||||||
| Machinery—1.8% | ||||||||
| Otis Worldwide Corp. (b) |
155,000 | 13,867,850 | ||||||
|
|
|
|||||||
| Media—6.3% | ||||||||
| Cable One, Inc. (b) |
29,034 | 16,160,034 | ||||||
| News Corp. - Class A (b) |
800,296 | 19,647,267 | ||||||
| Omnicom Group, Inc. |
158,728 | 13,731,559 | ||||||
|
|
|
|||||||
| 49,538,860 | ||||||||
|
|
|
|||||||
| Real Estate Management & Development —1.4% | ||||||||
| Jones Lang LaSalle, Inc. (a) (b) |
56,145 | 10,604,106 | ||||||
|
|
|
|||||||
| Retail REITs—1.9% | ||||||||
| NNN REIT, Inc. |
355,297 | 15,313,301 | ||||||
|
|
|
|||||||
| Semiconductors & Semiconductor Equipment—3.9% | ||||||||
| Analog Devices, Inc. |
154,921 | 30,761,114 | ||||||
|
|
|
|||||||
| Software—1.7% | ||||||||
| Check Point Software Technologies Ltd. (a) (b) |
85,954 | 13,132,912 | ||||||
|
|
|
|||||||
| Specialized REITs—4.3% | ||||||||
| Lamar Advertising Co. - Class A (b) |
192,972 | 20,509,064 | ||||||
| Public Storage |
43,055 | 13,131,775 | ||||||
|
|
|
|||||||
| 33,640,839 | ||||||||
|
|
|
|||||||
| Specialty Retail—1.5% | ||||||||
| AutoNation, Inc. (a) (b) |
79,986 | 12,012,297 | ||||||
|
|
|
|||||||
| Technology Hardware, Storage & Peripherals—1.2% | ||||||||
| NetApp, Inc. |
111,199 | 9,803,304 | ||||||
|
|
|
|||||||
| Total Common Stocks |
762,940,632 | |||||||
|
|
|
|||||||
| Escrow Shares—0.0% |
| |||||||
| Wireless Telecommunication Services—0.0% | ||||||||
| GCI Liberty, Inc. (a) (c) (d) |
108,185 | 0 | ||||||
|
|
|
|||||||
See accompanying notes to financial statements.
BHFTII-4
Brighthouse Funds Trust II
Brighthouse/Artisan Mid Cap Value Portfolio
Schedule of Investments as of December 31, 2023
Short-Term Investment—3.2%
| Security Description | Principal Amount* |
Value | ||||||
| Repurchase Agreement—3.2% | ||||||||
| Fixed Income Clearing Corp. |
25,027,565 | $ | 25,027,565 | |||||
|
|
|
|||||||
| Total Short-Term Investments |
25,027,565 | |||||||
|
|
|
|||||||
| Securities Lending Reinvestments (e)—10.5% |
| |||||||
| Certificates of Deposit—0.4% | ||||||||
| Mizuho Bank Ltd. |
1,000,000 | 1,000,453 | ||||||
| Royal Bank of Canada |
1,000,000 | 1,000,620 | ||||||
| Sumitomo Mitsui Trust Bank Ltd. |
1,000,000 | 1,000,595 | ||||||
|
|
|
|||||||
| 3,001,668 | ||||||||
|
|
|
|||||||
| Commercial Paper—0.2% | ||||||||
| Australia & New Zealand Banking Group Ltd. |
1,000,000 | 983,338 | ||||||
| 5.730%, SOFR + 0.330%, 04/18/24 (f) |
1,000,000 | 1,000,224 | ||||||
|
|
|
|||||||
| 1,983,562 | ||||||||
|
|
|
|||||||
| Repurchase Agreements—5.7% | ||||||||
| Bank of Nova Scotia |
6,300,000 | 6,300,000 | ||||||
| Barclays Bank PLC |
|
1,300,000 |
|
|
1,300,000 |
| ||
| Repurchase Agreement dated 12/29/23 at 5.450%, due on 01/02/24 with a maturity value of $1,500,908; collateralized by various Common Stock with an aggregate market value of $1,672,218. |
1,500,000 | 1,500,000 | ||||||
| Cantor Fitzgerald & Co. |
10,000,000 | 10,000,000 | ||||||
| Citigroup Global Markets, Inc. Repurchase Agreement dated 12/29/23 at 5.620%, due on 02/02/24 with a maturity value of $4,021,856; collateralized by U.S. Treasury Obligations with rates ranging from 0.125% - 3.750%, maturity dates ranging from 01/15/30 - 08/15/32, and various Common Stock with an aggregate market value of $4,080,004. |
|
4,000,000 |
|
|
4,000,000 |
| ||
| Repurchase Agreements—(Continued) | ||||||||
| Citigroup Global Markets, Inc. |
2,000,000 | 2,000,000 | ||||||
| ING Financial Markets LLC |
6,792,636 | 6,792,636 | ||||||
| National Bank of Canada |
8,000,000 | 8,000,000 | ||||||
| NBC Global Finance Ltd. |
1,300,000 | 1,300,000 | ||||||
| Royal Bank of Canada Toronto |
1,000,000 | 1,000,000 | ||||||
| Societe Generale |
1,200,000 | 1,200,000 | ||||||
| Repurchase Agreement dated 12/29/23 at 5.330%, due on 01/02/24 with a maturity value of $1,000,592; collateralized by U.S. Treasury Obligations with rates ranging from 0.625% - 5.240%, maturity dates ranging from 04/30/24 - 05/15/32, and an aggregate market value of $1,020,000. |
1,000,000 | 1,000,000 | ||||||
| TD Prime Services LLC |
192,967 | 192,967 | ||||||
|
|
|
|||||||
| 44,585,603 | ||||||||
|
|
|
|||||||
| Time Deposits—0.6% | ||||||||
| DZ Bank AG (NY) |
2,000,000 | 2,000,000 | ||||||
| First Abu Dhabi Bank USA NV |
3,000,000 | 3,000,000 | ||||||
|
|
|
|||||||
| 5,000,000 | ||||||||
|
|
|
|||||||
See accompanying notes to financial statements.
BHFTII-5
Brighthouse Funds Trust II
Brighthouse/Artisan Mid Cap Value Portfolio
Schedule of Investments as of December 31, 2023
Securities Lending Reinvestments (e)—(Continued)
| Security Description | Shares | Value | ||||||
| Mutual Funds—3.6% |
||||||||
| BlackRock Liquidity Funds FedFund, Institutional Shares |
5,000,000 | $ | 5,000,000 | |||||
| Dreyfus Treasury Obligations Cash Management Fund, Institutional Class 5.250% (g) |
5,000,000 | 5,000,000 | ||||||
| Fidelity Investments Money Market Government Portfolio, Class I |
5,000,000 | 5,000,000 | ||||||
| Goldman Sachs Financial Square Government Fund, Institutional Shares 5.230% (g) |
2,000,000 | 2,000,000 | ||||||
| Morgan Stanley Liquidity Funds Government Portfolio, Institutional Shares 5.200% (g) |
2,000,000 | 2,000,000 | ||||||
| RBC U.S. Government Money Market Fund, Institutional Share |
2,000,000 | 2,000,000 | ||||||
| STIT-Government & Agency Portfolio, Institutional Class |
5,000,000 | 5,000,000 | ||||||
| Western Asset Institutional Government Reserves Fund, Institutional Class 5.270% (g) |
2,000,000 | 2,000,000 | ||||||
|
|
|
|||||||
| 28,000,000 | ||||||||
|
|
|
|||||||
| Total Securities Lending Reinvestments |
82,570,833 | |||||||
|
|
|
|||||||
| Total Investments—110.6% |
870,539,030 | |||||||
| Other assets and liabilities (net)—(10.6)% |
(83,274,540 | ) | ||||||
|
|
|
|||||||
| Net Assets—100.0% |
$ | 787,264,490 | ||||||
|
|
|
|||||||
| * | Principal amount stated in U.S. dollars unless otherwise noted. | |
| (a) | Non-income producing security. | |
| (b) | All or a portion of the security was held on loan. As of December 31, 2023, the market value of securities loaned was $87,026,196 and the collateral received consisted of cash in the amount of $82,556,934 and non-cash collateral with a value of $7,168,442. The cash collateral investments are disclosed in the Schedule of Investments and categorized as Securities Lending Reinvestments. The non-cash collateral received consists of U.S. government securities that are held in safe-keeping by the lending agent, or a third-party custodian, and cannot be sold or repledged by the Portfolio. As such, this collateral is excluded from the Statement of Assets and Liabilities. | |
| (c) | Security was valued in good faith under procedures subject to oversight by the Board of Trustees. As of December 31, 2023, these securities represent less than 0.05% of net assets. | |
| (d) | Significant unobservable inputs were used in the valuation of this portfolio security; i.e. Level 3. | |
| (e) | Represents investment of cash collateral received from securities on loan as of December 31, 2023. | |
| (f) | Variable or floating rate security. The stated rate represents the rate at December 31, 2023. Maturity date shown for callable securities reflects the earliest possible call date. For securities based on a published reference index and spread, the index and spread are indicated in the description above. For certain variable rate securities, the coupon rate is determined by the issuer/agent based on current market conditions. For certain asset- and mortgage-backed securities, the coupon rate may fluctuate based on changes of the underlying collateral or prepayments of principal. These securities do not indicate a reference index and spread in their description above. | |
| (g) | The rate shown represents the annualized seven-day yield as of December 31, 2023. |
Glossary of Abbreviations
Index Abbreviations
(FEDEFF PRV)— Effective Federal Funds Rate
(SOFR)— Secured Overnight Financing Rate
Other Abbreviations
(REIT)— Real Estate Investment Trust
See accompanying notes to financial statements.
BHFTII-6
Brighthouse Funds Trust II
Brighthouse/Artisan Mid Cap Value Portfolio
Schedule of Investments as of December 31, 2023
Fair Value Hierarchy
Accounting principles generally accepted in the United States of America (“GAAP”) define fair market value as the price that the Portfolio would receive to sell an asset or pay to transfer a liability in an orderly transaction between market participants at the measurement date. It establishes a fair value hierarchy that prioritizes inputs to valuation methods and requires disclosure of the fair value hierarchy, separately for each major category of assets and liabilities, that segregates fair value measurements into three levels. Levels 1, 2 and 3 of the fair value hierarchy are defined as follows:
Level 1 - unadjusted quoted prices in active markets for identical investments
Level 2 - other significant observable inputs (including, but not limited to, quoted prices for similar assets or liabilities in markets that are either active or inactive; inputs other than quoted prices that are observable such as interest rates, yield curves, volatilities, prepayment speeds, loss severities, credit risks, default rates, or other market corroborated inputs)
Level 3 - significant unobservable inputs based on the best information available in the circumstances, to the extent observable inputs are unavailable (including the Portfolio’s own assumptions used in determining the fair value of investments and derivative financial instruments)
The inputs or methodologies used for valuing investments are not necessarily an indication of the risk associated with investing in them. Changes to the inputs or methodologies used may result in transfers between levels. A reconciliation of Level 3 securities, if any, will be disclosed following the fair value hierarchy table. For more information about the Portfolio’s policy regarding the valuation of investments, please refer to the Notes to Financial Statements.
The following table summarizes the fair value hierarchy of the Portfolio’s investments as of December 31, 2023:
| Description | Level 1 | Level 2 | Level 3 | Total | ||||||||||||
| Total Common Stocks* |
$ | 762,940,632 | $ | — | $ | — | $ | 762,940,632 | ||||||||
| Total Escrow Shares* |
— | — | 0 | 0 | ||||||||||||
| Total Short-Term Investment* |
— | 25,027,565 | — | 25,027,565 | ||||||||||||
| Securities Lending Reinvestments | ||||||||||||||||
| Certificates of Deposit |
— | 3,001,668 | — | 3,001,668 | ||||||||||||
| Commercial Paper |
— | 1,983,562 | — | 1,983,562 | ||||||||||||
| Repurchase Agreements |
— | 44,585,603 | — | 44,585,603 | ||||||||||||
| Time Deposits |
— | 5,000,000 | — | 5,000,000 | ||||||||||||
| Mutual Funds |
28,000,000 | — | — | 28,000,000 | ||||||||||||
| Total Securities Lending Reinvestments |
28,000,000 | 54,570,833 | — | 82,570,833 | ||||||||||||
| Total Investments |
$ | 790,940,632 | $ | 79,598,398 | $ | 0 | $ | 870,539,030 | ||||||||
| Collateral for Securities Loaned (Liability) |
$ | — | $ | (82,556,934 | ) | $ | — | $ | (82,556,934 | ) | ||||||
| * | See Schedule of Investments for additional detailed categorizations. | |||
Level 3 investments at the beginning and/or end of the period in relation to net assets were not significant and accordingly, a reconciliation of Level 3 assets for the year ended December 31, 2023 is not presented.
See accompanying notes to financial statements.
BHFTII-7
Brighthouse Funds Trust II
Brighthouse/Artisan Mid Cap Value Portfolio
| Statement of Assets and Liabilities |
| |||
| December 31, 2023
|
| |||
| Assets |
| |||
| Investments at value (a) (b) |
$ | 870,539,030 | ||
| Receivable for: |
| |||
| Fund shares sold |
85,568 | |||
| Dividends and interest |
864,419 | |||
| Prepaid expenses |
2,705 | |||
|
|
|
|||
| Total Assets |
871,491,722 | |||
|
|
|
|||
| Liabilities |
| |||
| Due to custodian |
217,803 | |||
| Collateral for securities loaned |
82,556,934 | |||
| Payables for: |
| |||
| Fund shares redeemed |
639,621 | |||
| Accrued Expenses: |
| |||
| Management fees |
474,629 | |||
| Distribution and service fees |
62,852 | |||
| Deferred trustees’ fees |
169,240 | |||
| Other expenses |
106,153 | |||
|
|
|
|||
| Total Liabilities |
84,227,232 | |||
|
|
|
|||
| Net Assets |
$ | 787,264,490 | ||
|
|
|
|||
| Net Assets Consist of: |
| |||
| Paid in surplus |
$ | 484,222,324 | ||
| Distributable earnings (Accumulated losses) |
303,042,166 | |||
|
|
|
|||
| Net Assets |
$ | 787,264,490 | ||
|
|
|
|||
| Net Assets |
| |||
| Class A |
$ | 465,658,645 | ||
| Class B |
270,655,348 | |||
| Class E |
50,950,497 | |||
| Capital Shares Outstanding* |
| |||
| Class A |
2,142,182 | |||
| Class B |
1,322,611 | |||
| Class E |
241,582 | |||
| Net Asset Value, Offering Price and Redemption Price Per Share |
| |||
| Class A |
$ | 217.38 | ||
| Class B |
204.64 | |||
| Class E |
210.90 | |||
| * | The Portfolio is authorized to issue an unlimited number of shares. | |||
| (a) | Identified cost of investments was $643,595,615. | |||
| (b) | Includes securities loaned at value of $87,026,196. | |||
| Statement of Operations |
| |||
| Year Ended December 31, 2023
|
| |||
| Investment Income |
| |||
| Dividends |
$ | 15,139,207 | ||
| Interest |
311,206 | |||
| Securities lending income |
157,467 | |||
|
|
|
|||
| Total investment income |
15,607,880 | |||
|
|
|
|||
| Expenses |
| |||
| Management fees |
6,259,971 | |||
| Administration fees |
43,472 | |||
| Custodian and accounting fees |
48,566 | |||
| Distribution and service fees—Class B |
655,111 | |||
| Distribution and service fees—Class E |
74,396 | |||
| Audit and tax services |
49,026 | |||
| Legal |
46,604 | |||
| Trustees’ fees and expenses |
46,220 | |||
| Shareholder reporting |
64,197 | |||
| Insurance |
7,080 | |||
| Miscellaneous |
16,790 | |||
|
|
|
|||
| Total expenses |
7,311,433 | |||
| Less management fee waiver |
(739,752 | ) | ||
|
|
|
|||
| Net expenses |
6,571,681 | |||
|
|
|
|||
| Net Investment Income |
9,036,199 | |||
|
|
|
|||
| Net Realized and Unrealized Gain (Loss) |
| |||
| Net realized gain on investments |
68,910,923 | |||
| Net change in unrealized appreciation on investments |
52,226,660 | |||
|
|
|
|||
| Net realized and unrealized gain (loss) | 121,137,583 | |||
|
|
|
|||
| Net Increase (Decrease) in Net Assets From Operations |
$ | 130,173,782 | ||
|
|
|
|||
See accompanying notes to financial statements.
BHFTII-8
Brighthouse Funds Trust II
Brighthouse/Artisan Mid Cap Value Portfolio
Statements of Changes in Net Assets
| Year Ended December 31, 2023 |
Year Ended December 31, 2022 |
|||||||||||
| Increase (Decrease) in Net Assets: |
| |||||||||||
| From Operations |
| |||||||||||
| Net investment income (loss) |
$ | 9,036,199 | $ | 6,876,244 | ||||||||
| Net realized gain (loss) |
68,910,923 | 99,659,665 | ||||||||||
| Net change in unrealized appreciation (depreciation) |
52,226,660 | (225,784,953 | ) | |||||||||
|
|
|
|
|
|||||||||
| Increase (decrease) in net assets from operations |
130,173,782 | (119,249,044 | ) | |||||||||
|
|
|
|
|
|||||||||
| From Distributions to Shareholders |
| |||||||||||
| Class A |
(62,025,079 | ) | (77,121,043 | ) | ||||||||
| Class B |
(37,339,491 | ) | (45,576,841 | ) | ||||||||
| Class E |
(6,880,844 | ) | (8,681,396 | ) | ||||||||
|
|
|
|
|
|||||||||
| Total distributions |
(106,245,414 | ) | (131,379,280 | ) | ||||||||
|
|
|
|
|
|||||||||
| Increase (decrease) in net assets from capital share transactions |
7,615,109 | 10,876,023 | ||||||||||
|
|
|
|
|
|||||||||
| Total increase (decrease) in net assets |
31,543,477 | (239,752,301 | ) | |||||||||
| Net Assets |
| |||||||||||
| Beginning of period |
755,721,013 | 995,473,314 | ||||||||||
|
|
|
|
|
|||||||||
| End of period |
$ | 787,264,490 | $ | 755,721,013 | ||||||||
|
|
|
|
|
|||||||||
Other Information:
Capital Shares
Transactions in capital shares were as follows:
| Year Ended December 31, 2023 |
Year Ended December 31, 2022 |
|||||||||||||||
| Shares | Value | Shares | Value | |||||||||||||
| Class A |
| |||||||||||||||
| Sales |
27,853 | $ | 5,759,736 | 25,791 | $ | 6,409,072 | ||||||||||
| Reinvestments |
314,784 | 62,025,079 | 370,098 | 77,121,043 | ||||||||||||
| Redemptions |
(311,887 | ) | (65,909,261 | ) | (312,371 | ) | (77,879,258 | ) | ||||||||
|
|
|
|
|
|
|
|
|
|||||||||
| Net increase (decrease) |
30,750 | $ | 1,875,554 | 83,518 | $ | 5,650,857 | ||||||||||
|
|
|
|
|
|
|
|
|
|||||||||
| Class B |
| |||||||||||||||
| Sales |
28,325 | $ | 5,709,537 | 40,367 | $ | 9,529,397 | ||||||||||
| Reinvestments |
201,020 | 37,339,491 | 230,163 | 45,576,841 | ||||||||||||
| Redemptions |
(186,662 | ) | (37,034,794 | ) | (214,871 | ) | (50,620,534 | ) | ||||||||
|
|
|
|
|
|
|
|
|
|||||||||
| Net increase (decrease) |
42,683 | $ | 6,014,234 | 55,659 | $ | 4,485,704 | ||||||||||
|
|
|
|
|
|
|
|
|
|||||||||
| Class E |
| |||||||||||||||
| Sales |
2,019 | $ | 416,738 | 1,437 | $ | 331,304 | ||||||||||
| Reinvestments |
35,963 | 6,880,844 | 42,738 | 8,681,396 | ||||||||||||
| Redemptions |
(37,066 | ) | (7,572,261 | ) | (34,537 | ) | (8,273,238 | ) | ||||||||
|
|
|
|
|
|
|
|
|
|||||||||
| Net increase (decrease) |
916 | $ | (274,679 | ) | 9,638 | $ | 739,462 | |||||||||
|
|
|
|
|
|
|
|
|
|||||||||
| Increase (decrease) derived from capital shares transactions |
$ | 7,615,109 | $ | 10,876,023 | ||||||||||||
|
|
|
|
|
|||||||||||||
See accompanying notes to financial statements.
BHFTII-9
Brighthouse Funds Trust II
Brighthouse/Artisan Mid Cap Value Portfolio
Financial Highlights
| Selected per share data | ||||||||||||||||||||
| Class A | ||||||||||||||||||||
| Year Ended December 31, | ||||||||||||||||||||
| 2023 | 2022 | 2021 | 2020 | 2019 | ||||||||||||||||
| Net Asset Value, Beginning of Period |
$ | 212.25 | $ | 290.67 | $ | 236.08 | $ | 229.44 | $ | 211.86 | ||||||||||
|
|
|
|
|
|
|
|
|
|
|
|||||||||||
| Income (Loss) from Investment Operations |
||||||||||||||||||||
| Net investment income (loss) (a) |
2.69 | 2.19 | 2.42 | 2.44 | 2.34 | |||||||||||||||
| Net realized and unrealized gain (loss) |
33.45 | (39.64 | ) | 60.63 | 10.26 | 45.48 | ||||||||||||||
|
|
|
|
|
|
|
|
|
|
|
|||||||||||
| Total income (loss) from investment operations |
36.14 | (37.45 | ) | 63.05 | 12.70 | 47.82 | ||||||||||||||
|
|
|
|
|
|
|
|
|
|
|
|||||||||||
| Less Distributions |
||||||||||||||||||||
| Distributions from net investment income |
(1.92 | ) | (2.54 | ) | (2.58 | ) | (1.90 | ) | (1.85 | ) | ||||||||||
| Distributions from net realized capital gains |
(29.09 | ) | (38.43 | ) | (5.88 | ) | (4.16 | ) | (28.39 | ) | ||||||||||
|
|
|
|
|
|
|
|
|
|
|
|||||||||||
| Total distributions |
(31.01 | ) | (40.97 | ) | (8.46 | ) | (6.06 | ) | (30.24 | ) | ||||||||||
|
|
|
|
|
|
|
|
|
|
|
|||||||||||
| Net Asset Value, End of Period |
$ | 217.38 | $ | 212.25 | $ | 290.67 | $ | 236.08 | $ | 229.44 | ||||||||||
|
|
|
|
|
|
|
|
|
|
|
|||||||||||
| Total Return (%)(b) |
18.53 | (12.62 | ) | 26.91 | 6.25 | 23.75 | ||||||||||||||
| Ratios/Supplemental Data |
||||||||||||||||||||
| Gross ratio of expenses to average net assets (%) |
0.86 | 0.85 | 0.85 | 0.87 | 0.86 | |||||||||||||||
| Net ratio of expenses to average net assets (%) (c) |
0.77 | 0.76 | 0.77 | 0.78 | 0.81 | |||||||||||||||
| Ratio of net investment income (loss) to average net assets (%) |
1.28 | 0.91 | 0.88 | 1.25 | 1.03 | |||||||||||||||
| Portfolio turnover rate (%) |
21 | 20 | 12 | 44 | 15 | |||||||||||||||
| Net assets, end of period (in millions) |
$ | 465.7 | $ | 448.2 | $ | 589.4 | $ | 564.1 | $ | 546.9 | ||||||||||
| Class B | ||||||||||||||||||||
| Year Ended December 31, | ||||||||||||||||||||
| 2023 | 2022 | 2021 | 2020 | 2019 | ||||||||||||||||
| Net Asset Value, Beginning of Period |
$ | 201.42 | $ | 278.02 | $ | 226.22 | $ | 220.07 | $ | 204.18 | ||||||||||
|
|
|
|
|
|
|
|
|
|
|
|||||||||||
| Income (Loss) from Investment Operations |
||||||||||||||||||||
| Net investment income (loss) (a) |
2.05 | 1.51 | 1.65 | 1.88 | 1.70 | |||||||||||||||
| Net realized and unrealized gain (loss) |
31.59 | (37.89 | ) | 58.07 | 9.79 | 43.77 | ||||||||||||||
|
|
|
|
|
|
|
|
|
|
|
|||||||||||
| Total income (loss) from investment operations |
33.64 | (36.38) | 59.72 | 11.67 | 45.47 | |||||||||||||||
|
|
|
|
|
|
|
|
|
|
|
|||||||||||
| Less Distributions |
||||||||||||||||||||
| Distributions from net investment income |
(1.33 | ) | (1.79 | ) | (2.04 | ) | (1.36 | ) | (1.19 | ) | ||||||||||
| Distributions from net realized capital gains |
(29.09 | ) | (38.43 | ) | (5.88 | ) | (4.16 | ) | (28.39 | ) | ||||||||||
|
|
|
|
|
|
|
|
|
|
|
|||||||||||
| Total distributions |
(30.42) | (40.22) | (7.92) | (5.52) | (29.58) | |||||||||||||||
|
|
|
|
|
|
|
|
|
|
|
|||||||||||
| Net Asset Value, End of Period |
$204.64 | $201.42 | $278.02 | $226.22 | $220.07 | |||||||||||||||
|
|
|
|
|
|
|
|
|
|
|
|||||||||||
| Total Return (%) (b) |
18.24 | (12.84) | 26.59 | 5.98 | 23.44 | |||||||||||||||
| Ratios/Supplemental Data |
||||||||||||||||||||
| Gross ratio of expenses to average net assets (%) |
1.11 | 1.10 | 1.10 | 1.12 | 1.11 | |||||||||||||||
| Net ratio of expenses to average net assets (%) (c) |
1.02 | 1.01 | 1.02 | 1.03 | 1.06 | |||||||||||||||
| Ratio of net investment income (loss) to average net assets (%) |
1.03 | 0.66 | 0.63 | 1.00 | 0.78 | |||||||||||||||
| Portfolio turnover rate (%) |
21 | 20 | 12 | 44 | 15 | |||||||||||||||
| Net assets, end of period (in millions) |
$ | 270.7 | $ | 257.8 | $ | 340.4 | $ | 318.9 | $ | 323.0 | ||||||||||
| Please see following page for Financial Highlights footnote legend. |
See accompanying notes to financial statements.
BHFTII-10
Brighthouse Funds Trust II
Brighthouse/Artisan Mid Cap Value Portfolio
Financial Highlights
| Class E | ||||||||||||||||||||
| Year Ended December 31, | ||||||||||||||||||||
| 2023 | 2022 | 2021 | 2020 | 2019 | ||||||||||||||||
| Net Asset Value, Beginning of Period |
$ | 206.73 | $ | 284.18 | $ | 231.04 | $ | 224.61 | $ | 207.89 | ||||||||||
|
|
|
|
|
|
|
|
|
|
|
|||||||||||
| Income (Loss) from Investment Operations |
||||||||||||||||||||
| Net investment income (loss)(a) |
2.31 | 1.79 | 1.95 | 2.12 | 1.95 | |||||||||||||||
| Net realized and unrealized gain (loss) |
32.50 | (38.74 | ) | 59.32 | 10.02 | 44.61 | ||||||||||||||
|
|
|
|
|
|
|
|
|
|
|
|||||||||||
| Total income (loss) from investment operations |
34.81 | (36.95 | ) | 61.27 | 12.14 | 46.56 | ||||||||||||||
|
|
|
|
|
|
|
|
|
|
|
|||||||||||
| Less Distributions |
||||||||||||||||||||
| Distributions from net investment income |
(1.55 | ) | (2.07 | ) | (2.25 | ) | (1.55 | ) | (1.45 | ) | ||||||||||
| Distributions from net realized capital gains |
(29.09 | ) | (38.43 | ) | (5.88 | ) | (4.16 | ) | (28.39 | ) | ||||||||||
|
|
|
|
|
|
|
|
|
|
|
|||||||||||
| Total distributions |
(30.64 | ) | (40.50 | ) | (8.13 | ) | (5.71 | ) | (29.84 | ) | ||||||||||
|
|
|
|
|
|
|
|
|
|
|
|||||||||||
| Net Asset Value, End of Period |
$ | 210.90 | $ | 206.73 | $ | 284.18 | $ | 231.04 | $ | 224.61 | ||||||||||
|
|
|
|
|
|
|
|
|
|
|
|||||||||||
| Total Return (%)(b) |
18.35 | (12.75 | ) | 26.71 | 6.09 | 23.56 | ||||||||||||||
| Ratios/Supplemental Data |
||||||||||||||||||||
| Gross ratio of expenses to average net assets (%) |
1.01 | 1.00 | 1.00 | 1.02 | 1.01 | |||||||||||||||
| Net ratio of expenses to average net assets (%)(c) |
0.92 | 0.91 | 0.92 | 0.93 | 0.96 | |||||||||||||||
| Ratio of net investment income (loss) to average net assets (%) |
1.13 | 0.76 | 0.73 | 1.10 | 0.88 | |||||||||||||||
| Portfolio turnover rate (%) |
21 | 20 | 12 | 44 | 15 | |||||||||||||||
| Net assets, end of period (in millions) |
$ | 51.0 | $ | 49.8 | $ | 65.7 | $ | 64.3 | $ | 65.8 | ||||||||||
| (a) | Per share amounts based on average shares outstanding during the period. | |||||||||
| (b) | Total return does not reflect any insurance, sales, separate account or administrative charges of variable annuity or life insurance contracts or any additional expenses that contract owners may bear under their variable contracts. If these charges were included, the returns would be lower. | |||||||||
| (c) | Includes the effects of management fee waivers (see Note 5 of the Notes to Financial Statements). | |||||||||
See accompanying notes to financial statements.
BHFTII-11
Brighthouse Funds Trust II
Brighthouse/Artisan Mid Cap Value Portfolio
Notes to Financial Statements—December 31, 2023
1. Organization
Brighthouse Funds Trust II (the “Trust”) is organized as a Delaware statutory trust and registered under the Investment Company Act of 1940, as amended (the “1940 Act”), as an open-end management investment company. The Trust, which is managed by Brighthouse Investment Advisers, LLC (“Brighthouse Investment Advisers” or the “Adviser”), currently offers twenty-nine series (the “Portfolios”), each of which operates as a distinct investment vehicle of the Trust. The series included in this report is Brighthouse/Artisan Mid Cap Value Portfolio (the “Portfolio”), which is diversified. Shares of the Portfolio are not offered directly to the general public and are currently available only to separate accounts of insurance companies, including insurance companies affiliated with the Adviser.
The Portfolio has registered and offers three classes of shares: Class A, B and E shares. Shares of each class of the Portfolio represent an equal pro rata interest in the Portfolio and generally give the shareholder the same voting, dividend, liquidation, and other rights. Investment income, realized and unrealized capital gains and losses, the common expenses of the Portfolio, and certain Portfolio-level expense reductions, if any, are allocated on a pro rata basis to each class based on the relative net assets of each class to the net assets of the Portfolio. Each class of shares differs in its respective distribution plan and such distribution expenses are allocated to the corresponding class of shares.
2. Significant Accounting Policies
The preparation of financial statements in conformity with accounting principles generally accepted in the United States of America (“GAAP”) requires management to make estimates and assumptions that affect the reported amounts of assets and liabilities and disclosure of contingent assets and liabilities as of the date of the financial statements and the reported amounts of income and expenses during the reporting period. Actual results could differ from those estimates. In the preparation of these financial statements, management has evaluated events and transactions subsequent to December 31, 2023 through the date the financial statements were issued.
The Portfolio is an investment company and follows the accounting and reporting guidance of the Financial Accounting Standards Board (“FASB”) Accounting Standards Codification Topic 946- Financial Services- Investment Companies. The following is a summary of significant accounting policies consistently followed by the Portfolio in the preparation of its financial statements.
Investment Valuation and Fair Value Measurements - The Portfolio values its investments for purposes of calculating its net asset value (“NAV”) using procedures that allow for a variety of methodologies to be used to value the Portfolio’s investments. The specific methodology used for an investment may vary based on the market data available for a specific investment at the time the Portfolio calculates its NAV or based on other considerations. The procedures also permit a level of judgment to be used in the valuation process.
Domestic and foreign equity securities, such as common stock, exchange-traded funds, rights, warrants, and preferred stock, that are traded on a securities exchange on a valuation date are generally valued at their last quoted sale price or official closing price on the primary exchange for such security, or, if no sales occurred on that day, at the last reported bid price. Equity securities traded over-the-counter (“OTC”) are generally valued at the last reported bid price. In the event of a major exchange closing during the trading day, the Adviser may use other market information obtained from quotation reporting systems, established market makers, or pricing services in valuing the securities. Valuation adjustments may be applied to certain foreign equity securities that are traded solely on foreign exchanges that close before the time as of which the Portfolio determines its NAV to account for the market movement between the close of the foreign exchanges and the time as of which the Portfolio determines its NAV. The Portfolio may use a systematic fair valuation model provided by a pricing service to value securities principally traded in these foreign markets to adjust for possible market movements or other changes that may occur between the close of the foreign exchanges and the time as of which the Portfolio determines its NAV. Foreign equity securities valued using these valuation adjustments are generally categorized as Level 2 within the fair value hierarchy. Equity securities that are actively traded, and have no valuation adjustments applied, are categorized as Level 1 within the fair value hierarchy. Other equity securities traded on inactive markets or valued in reference to similar instruments traded on active markets are generally categorized as Level 2 within the fair value hierarchy.
Investments in registered open-end management investment companies are valued at reported NAV per share on the valuation date and are categorized as Level 1 within the fair value hierarchy.
Debt securities, including corporate, convertible and municipal bonds and notes; obligations of the U.S. Treasury and U.S. government agencies; foreign sovereign issues; and non-U.S. bonds, are generally valued based upon evaluated or composite bid quotations obtained from third-party pricing services and/or brokers and dealers selected by the Adviser (each a “pricing service”). Such pricing services may use matrix pricing, which considers observable inputs including, among other things, issuer details, maturity dates, interest rates, yield curves, rates of prepayment, credit risks/spreads, default rates, reported trades, broker-dealer quotes and quoted prices for similar assets. Short-term obligations with a remaining maturity of sixty days or less may be valued at amortized cost in the absence of market quotes, so long as the amortized cost value of such short-term debt instrument is approximately the same as the fair value of the instrument as determined without the use of amortized cost valuation. Floating rate loans are generally valued based upon
BHFTII-12
Brighthouse Funds Trust II
Brighthouse/Artisan Mid Cap Value Portfolio
Notes to Financial Statements—December 31, 2023—(Continued)
an evaluated or composite average of aggregate bid and ask quotations supplied by brokers or dealers, as obtained from the pricing service. Securities that use similar valuation techniques and inputs as described above are generally categorized as Level 2 within the fair value hierarchy.
Options, whether on securities, indices, futures contracts, or otherwise, traded on exchanges are valued at the last sale price available as of the close of business on a valuation day or, if there is no such price available, at the last reported bid price. These types of options are categorized as Level 1 within the fair value hierarchy. Futures contracts that are traded on commodity exchanges are valued at their settlement prices established by the exchanges on which they are traded as of the close of such exchanges and are categorized as Level 1 within the fair value hierarchy.
If no current market quotation is readily available or market value quotations are deemed to be unreliable for an investment, the fair value of the investment will be determined in accordance with procedures. A market quotation is readily available only when that quotation is a quoted price (unadjusted) in active markets for identical investments that the Portfolio can access at the measurement date, provided that a quotation will not be readily available if it is not reliable.
Pursuant to Rule 2a-5 under the 1940 Act, the Board of Trustees (the “Board” or “Trustees”) of the Trust has designated Brighthouse Investment Advisers, acting through its Valuation Committee (“Committee”), as the Portfolio’s “valuation designee” to perform the Portfolio’s fair value determinations. The Board oversees Brighthouse Investment Advisers in its role as the Valuation Designee and receives reports from Brighthouse Investment Advisers regarding its process and the valuation of the Portfolio’s investments to assist with such oversight.
No single standard for determining the fair value of an investment can be set forth because fair value depends upon the facts and circumstances with respect to each investment. Information relating to any relevant factors may be obtained by the Committee from any appropriate source, including the subadviser of the Portfolio, the Custodian, a pricing service, market maker and/or broker for such security or the issuer. Appropriate methodologies for determining fair value under particular circumstances may include: matrix pricing, a discounted cash flow analysis, comparisons of securities with comparable characteristics, value based on multiples of earnings, discount from market price of similar marketable securities, or a combination of these and other methods.
Foreign Currency Translation - The books and records of the Portfolio are maintained in U.S. dollars. The values of securities, currencies, and other assets and liabilities denominated in currencies other than the U.S. dollar are translated into U.S. dollars based upon foreign exchange rates prevailing at the end of the period. Purchases and sales of investment securities, income, and expenses are translated on the respective dates of such transactions. Because the values of investment securities are translated at the foreign exchange rates prevailing at the end of the period, that portion of the results of operations arising from changes in exchange rates and that portion of the results of operations reflecting fluctuations arising from changes in market prices of the investment securities are not separated. Such fluctuations are included in the net realized and unrealized gain or loss on investments.
Net realized foreign exchange gains or losses arise from activity in forward foreign currency exchange contracts, sales of foreign currency, currency gains or losses realized between the trade and settlement dates on securities transactions, and the difference between the amounts of dividends, interest, and foreign withholding taxes recorded by the Portfolio and the U.S. dollar-equivalent of the amounts actually received or paid by the Portfolio. Net unrealized foreign exchange gains and losses arise from changes in the value of assets and liabilities, other than investment securities, resulting from changes in foreign exchange rates.
Investment Transactions and Related Investment Income - Portfolio security transactions are recorded on the trade date. Dividend income is recorded on the ex-dividend date or, for certain foreign securities, when notified. Interest income, which includes amortization of premium and accretion of discount on debt securities, is recorded on the accrual basis. Realized gains and losses on investments are determined on the identified cost basis, which is the same basis used for federal income tax purposes. Foreign income and foreign capital gains on some foreign securities may be subject to foreign taxes, which are accrued as applicable. These foreign taxes have been provided for in accordance with the Portfolio’s understanding of the applicable countries’ tax rules and rates.
Dividends and Distributions to Shareholders - The Portfolio records dividends and distributions on the ex-dividend date. Net realized gains from securities transactions (if any) are generally distributed annually to shareholders. The timing and characterization of certain income and capital gains distributions are determined in accordance with federal tax regulations that may differ from GAAP. Permanent book and tax basis differences relating to shareholder distributions will result in reclassification between distributable earnings (accumulated losses) and paid in surplus. These adjustments have no impact on net assets or the results of operations.
Income Taxes - It is the Portfolio’s policy to comply with the requirements of the Internal Revenue Code of 1986, as amended, and regulations thereunder, applicable to regulated investment companies, and to distribute, with respect to each taxable year, all of its taxable income to shareholders. Therefore, no federal income tax provision is required. The Portfolio files U.S. federal tax returns. No income tax returns are currently under examination. The Portfolio’s federal tax returns remain subject to examination by the Internal Revenue Service for three fiscal years after the returns are filed. As of December 31, 2023, the Portfolio had no uncertain tax positions that would require financial statement recognition, derecognition or disclosure.
BHFTII-13
Brighthouse Funds Trust II
Brighthouse/Artisan Mid Cap Value Portfolio
Notes to Financial Statements—December 31, 2023—(Continued)
Due to Custodian - Pursuant to the custodian agreement, the Custodian may, in its discretion, advance funds to the Portfolio to make properly authorized payments. When such payments result in an overdraft, the Portfolio is obligated to repay the Custodian at the current rate of interest charged by the Custodian for secured loans. This obligation is payable on demand to the Custodian. The Custodian has a lien on the Portfolio’s assets to the extent of any overdraft. At December 31, 2023, the Portfolio had a payment of $217,803 due to the Custodian pursuant to the foregoing arrangement. Based on the short-term nature of these payments and the variable interest rate, the carrying value of the overdraft advances approximated its fair value and such inputs would be considered Level 2 in the fair value hierarchy at December 31, 2023. The Portfolio’s average overdraft advances during the year ended December 31, 2023 were not significant.
Repurchase Agreements - The Portfolio may enter into repurchase agreements, under the terms of a Master Repurchase Agreement (“MRA”), or Global Master Repurchase Agreement (“GMRA”), with selected commercial banks and broker-dealers, under which the Portfolio acquires securities as collateral and agrees to resell the securities at an agreed-upon time and at an agreed-upon price. The Portfolio, through the Custodian or a subcustodian, under a tri-party repurchase agreement, receives delivery of the underlying securities collateralizing any repurchase agreements. It is the Portfolio’s policy that the market value of the collateral be equal to at least 100% of the repurchase price in the case of a repurchase agreement of one-day duration and equal to at least 102% of the repurchase price in the case of all other repurchase agreements. In the event of default or failure by a party to perform an obligation in connection with any repurchase transaction, the MRA or GMRA gives the non-defaulting party the right to set-off claims and to apply property held by it in connection with any repurchase transaction against obligations owed to it under the agreement.
At December 31, 2023, the Portfolio had direct investments in repurchase agreements with a gross value of $25,027,565. Additionally, the Portfolio invested cash collateral for loans of portfolio securities in repurchase agreements with a gross value of $44,585,603. The combined value of all repurchase agreements is included as part of investments at value on the Statement of Assets and Liabilities. The value of the related collateral exceeded the value of the repurchase agreements at December 31, 2023.
Securities Lending - The Portfolio may lend its portfolio securities to certain qualified brokers who borrow securities in order to complete certain securities transactions. By lending its portfolio securities, the Portfolio attempts to increase its net investment income through the receipt of income on collateral held from securities on loan. Any gain or loss in the market price of the loaned securities that might occur, any interest earned, and any dividends declared during the term of the loan, would accrue to the account of the Portfolio.
The Trust has entered into a Non-Custodial Securities Lending Agreement with JPMorgan Chase Bank, N.A. (the “Lending Agent”). Under the agreement, the Lending Agent is authorized to loan portfolio securities on the Portfolio’s behalf. In exchange, the Portfolio generally receives cash, U.S. Government securities, letters of credit, or other collateral deemed appropriate by the Adviser. The Portfolio receives collateral equal to at least 102% of the market value for loans secured by government securities or cash in the same currency as the loaned shares and 105% for all other loaned securities at each loan’s inception. Collateral representing at least 100% of the market value of the loaned securities is maintained for the duration of the loan. Any cash collateral received by the Portfolio is generally invested by the Lending Agent in short-term investments, which may include certificates of deposit, commercial paper, repurchase agreements, including repurchase agreements with respect to equity securities, time deposits, master demand notes and money market funds. The market value of investments made with cash collateral received are disclosed in the Schedule of Investments and the valuation techniques are described in Note 2. The value of the securities on loan may change each business day. If the market value of the collateral at the close of trading on a business day is less than 100% of the market value of the loaned securities at the close of trading on that day, the borrower is required to deliver, by the close of business on the following business day, an additional amount of collateral, so that the total amount of posted collateral is equal to at least 100% of the market value of all the loaned securities as of such preceding day. A portion of the income earned on the collateral is rebated to the borrower of the securities and the remainder is split between the Lending Agent and the Portfolio. On loans collateralized by U.S. government securities, a fee is received from the borrower and is allocated between the Portfolio and the Lending Agent.
Income received by the Portfolio in securities lending transactions during the year ended December 31, 2023 is reflected as securities lending income on the Statement of Operations. The values of any securities loaned by the Portfolio and the related collateral at December 31, 2023 are disclosed in the footnotes to the Schedule of Investments. The value of the related collateral received by the Portfolio exceeded the value of the securities out on loan at December 31, 2023.
The risks associated with lending portfolio securities include, but are not limited to, possible delays in receiving additional collateral or in the recovery of the loaned securities, possible loss of rights in the collateral should the borrower fail financially, as well as risk of loss in the value of the collateral or the value of the investments made with the collateral. To the extent the Portfolio uses cash collateral it receives to invest in repurchase agreements with respect to equity securities, it is subject to the risk of loss if the value of the equity securities declines and the counterparty defaults on its obligation to repurchase such securities. The Lending Agent shall indemnify the Portfolio in the case of default of any securities borrower, subject to the terms of the Non-Custodial Securities Lending Agreement.
BHFTII-14
Brighthouse Funds Trust II
Brighthouse/Artisan Mid Cap Value Portfolio
Notes to Financial Statements—December 31, 2023—(Continued)
All securities on loan are classified as Common Stocks in the Portfolio’s Schedule of Investments as of December 31, 2023. For all securities on loan, the remaining contractual maturity of the agreements is overnight and continuous.
3. Certain Risks
In the normal course of business, the Portfolio invests in securities and enters into transactions where risks exist. Those risks include:
Market Risk: The value of securities held by the Portfolio may decline in response to certain events, including those directly involving the issuers whose securities are owned by the Portfolio; conditions affecting the general economy; overall market changes; local, regional or global political, social or economic instability; currency, interest rate, and price fluctuations, or other factors including terrorism, war, natural disasters and the spread of infectious illness including epidemics or pandemics such as the COVID-19 pandemic. These events may also adversely affect the liquidity of securities held by the Portfolio.
Credit and Counterparty Risk: The Portfolio may be exposed to counterparty risk, or the risk that an entity with which the Portfolio has unsettled or open transactions may default. The potential loss could exceed the value of the financial assets and liabilities recorded in the financial statements. Financial assets that potentially expose the Portfolio to credit and counterparty risk consist principally of cash due from counterparties and investments. The Portfolio manages counterparty risk by entering into agreements only with counterparties that it believes have the financial resources to honor their obligations and by monitoring the financial stability of those counterparties. The Subadviser may attempt to mitigate counterparty risk by (i) periodically assessing the creditworthiness of its trading partners, (ii) monitoring and/or limiting the amount of its net exposure to each individual counterparty based on its assessment, and (iii) requiring collateral from the counterparty for certain transactions. In order to preserve certain safeguards for non-standard settlement trades, the Portfolio restricts its exposure to credit and counterparty losses by entering into master netting agreements (“Master Agreements”) with counterparties (approved brokers) with whom it undertakes a significant volume of transactions. Master Agreements govern the terms of certain transactions and reduce the counterparty risk associated with relevant transactions by specifying credit protection mechanisms and providing standardization that improves legal certainty. Master Agreements can also help limit counterparty risk by specifying collateral posting arrangements at pre-arranged exposure levels.
Repurchase and reverse repurchase agreements are primarily executed under GMRAs or MRAs, which provide the right to set-off. Each repurchase and reverse repurchase agreement is initially collateralized at the transaction level. In the event of default, the total market value exposure will be offset against collateral exchanged to date, which would result in a net receivable/(payable) that would be due from/to the counterparty.
Additional risks associated with each type of investment are described above within the respective security type notes. The Portfolio’s prospectus includes a discussion of the principal risks of investing in the Portfolio.
4. Investment Transactions
Aggregate cost of purchases and proceeds of sales of investment securities, excluding short-term securities, for the year ended December 31, 2023 were as follows:
| Purchases |
Sales | |||||||||||
| U.S. Government |
Non-U.S. Government | U.S. Government | Non-U.S. Government | |||||||||
| $0 | $ | 154,790,828 | $ | 0 | $ | 246,629,262 | ||||||
5. Investment Management Fees and Other Transactions with Affiliates
Investment Management Agreement - Brighthouse Investment Advisers is the investment adviser to the Portfolio. The Trust has entered into an investment management agreement with Brighthouse Investment Advisers with respect to the Portfolio. For providing investment management services to the Portfolio, Brighthouse Investment Advisers receives monthly compensation at the following annual rates:
|
Management |
% per annum | Average Daily Net Assets | ||||
| $6,259,971 | 0.820 | % | Of the first $1 billion | |||
| 0.780 | % | On amounts in excess of $1 billion | ||||
Brighthouse Investment Advisers has entered into an investment subadvisory agreement with respect to managing the Portfolio. Artisan Partners Limited Partnership is compensated by Brighthouse Investment Advisers to provide subadvisory services for the Portfolio.
BHFTII-15
Brighthouse Funds Trust II
Brighthouse/Artisan Mid Cap Value Portfolio
Notes to Financial Statements—December 31, 2023—(Continued)
Management Fee Waiver - Pursuant to a management fee waiver agreement, the Adviser has agreed, for the period May 1, 2023 to April 30, 2024, to reduce its advisory fees set out above under “Investment Management Agreement” for each class of the Portfolio as follows:
| % per annum reduction |
Average Daily Net Assets | |
| 0.090% | First $500 million | |
| 0.110% | $500 million to $1 billion | |
| 0.130% | Over of $1 billion |
An identical agreement was in place for the period from April 29, 2022 through April 30, 2023. Amounts waived for the year ended December 31, 2023 are shown as management fee waivers in the Statement of Operations.
Certain officers and trustees of the Trust may also be officers of the Adviser; however, such officers and trustees receive no compensation from the Trust.
Transfer Agency Agreement - Brighthouse Life Insurance Company serves as the transfer agent for the Trust. Brighthouse Life Insurance Company receives no fees for its services to the Trust.
Distribution and Service Fees - The Trust has a distribution agreement with Brighthouse Securities, LLC (the “Distributor”) pursuant to which the Distributor serves as the general distributor of shares of each class (each a “Class”) of each Portfolio. The Distributor is an affiliate of the Trust. The Trust has adopted a Distribution and Services Plan (the “D&S Plan”) relating to Class B, Class D, Class E, Class F and Class G shares of each Portfolio, under Rule 12b-1 under the 1940 Act, pursuant to which the Trust may pay the Distributor a fee (the “Service Fee”) at an annual rate not to exceed 0.25% of each such Portfolio’s average daily net assets attributable to the Class B, Class D, Class E, Class F and Class G shares of the Trust. Each Portfolio may not offer shares of each Class. The D&S Plan also authorizes the Trust, on behalf of each of its Portfolios, to pay to the Distributor a distribution fee (the “Distribution Fee” and together with the Service Fee, the “Fees”) at an annual rate of up to 0.25% of each Portfolio’s average daily net assets attributable to the Class B, Class D, Class E, Class F, and Class G shares in consideration of the services rendered in connection with the sale of such shares by the Distributor. Under the Distribution Agreement with respect to the Trust, Fees are currently paid at an annual rate of 0.25% of average daily net assets in the case of Class B shares, 0.10% of average daily net assets in the case of Class D shares, 0.15% of average daily net assets in the case of Class E shares, 0.20% of average daily net assets in the case of Class F shares and 0.30% of average daily net assets in the case of Class G shares. The D&S Plan is known as a “compensation plan” because the Trust makes payments to the Distributor for services rendered regardless of the actual level of expenditures by the Distributor. Amounts incurred by the Portfolio for the year ended December 31, 2023 are shown as Distribution and service fees in the Statement of Operations.
Deferred Trustee Compensation - Each Trustee who is not currently an employee of the Adviser or any of its affiliates receives compensation from the Trust for his or her service to the Trust. A deferred compensation plan (the “Plan”) is available to the Trustees on a voluntary basis. Deferred amounts remain in the Trust until distributed in accordance with the provisions of the Plan. The value of a participating Trustee’s deferral account is based on theoretical investments of deferred amounts on the normal payment dates in certain portfolios of the Trust or Brighthouse Funds Trust I, an affiliate of the Trust, as designated by the participating Trustee. Changes in the value of participants’ deferral accounts are reflected as a component of Trustees’ fees and expenses in the Statement of Operations. The portion of the accrued obligations allocated to the Portfolio under the Plan is reflected as Deferred trustees’ fees in the Statement of Assets and Liabilities.
6. Contractual Obligations
Under the Trust’s organizational documents, its officers and Trustees may be indemnified against certain liabilities and expenses arising out of the performance of their duties to the Trust. Additionally, the Trust has a variety of indemnification obligations under contracts with its service providers. The Trust’s maximum exposure under these arrangements is unknown, as this would involve future claims that may be made against the Trust that have not yet occurred.
7. Income Tax Information
The cost basis of investments for federal income tax purposes at December 31, 2023 was as follows:
| Cost basis of investments | $ | 644,174,995 | ||
|
|
|
|||
| Gross unrealized appreciation | 252,374,536 | |||
| Gross unrealized (depreciation) | (26,010,501 | ) | ||
|
|
|
|||
| Net unrealized appreciation (depreciation) | $ | 226,364,035 | ||
|
|
|
BHFTII-16
Brighthouse Funds Trust II
Brighthouse/Artisan Mid Cap Value Portfolio
Notes to Financial Statements—December 31, 2023—(Continued)
The tax character of distributions paid for the years ended December 31, 2023 and 2022 were as follows:
| Ordinary Income |
Long-Term Capital Gain | Total | ||||||||||||||||||
| 2023 |
2022 | 2023 | 2022 | 2023 | 2022 | |||||||||||||||
| $5,815,567 | $ | 14,116,238 | $ | 100,429,847 | $ | 117,263,042 | $ | 106,245,414 | $ | 131,379,280 | ||||||||||
As of December 31, 2023, the components of distributable earnings (accumulated losses) on a federal income tax basis were as follows:
| Undistributed |
Undistributed Long-Term Capital Gain |
Net Unrealized Appreciation (Depreciation) |
Accumulated Capital Losses |
Total | ||||||
| $8,739,135 | $68,108,234 | $226,364,037 | $— | $303,211,406 | ||||||
The Portfolio utilizes the provisions of the federal income tax laws that provide for the carryforward of capital losses for prior years, offsetting such losses against any future realized capital gains. Net capital losses may be carried forward indefinitely and their character is retained as short-term and/or long-term losses.
As of December 31, 2023, the Portfolio had no accumulated capital losses.
8. Recent Accounting Pronouncement & Regulatory Updates
In June 2022, FASB issued Accounting Standards Update 2022-03—Fair Value Measurement (Topic 820)—Fair Value Measurement of Equity Securities Subject to Contractual Sale Restrictions (“ASU 2022-03”). ASU 2022-03 clarifies the guidance in Topic 820 to indicate that a contractual sale restriction should not be considered in the fair value of an equity security subject to such a restriction, and requires entities with investments in equity securities subject to contractual sale restrictions to disclose certain qualitative and quantitative information about such securities. ASU 2022-03 is effective for fiscal years, and interim periods within those fiscal years, beginning after December 15, 2023. ASU 2022-03 is only applicable to an equity security in which the contractual arrangement that restricts its sale is executed or modified on or after the adoption date.
Effective January 24, 2023, the Securities and Exchange Commission adopted rule and form amendments that require open-end management investment companies to transmit concise and visually engaging annual and semiannual reports to shareholders that highlight certain information deemed by the SEC to be particularly important for investors. Certain other information, including financial statements, will no longer appear in shareholder reports but will, as required, be available online, delivered free of charge upon request, and filed on a semiannual basis on Form N-CSR. The rule and form amendments have a compliance date of July 24, 2024. Accordingly, the rule and form amendments will not impact the Portfolio until its 2024 semiannual shareholder report.
BHFTII-17
Brighthouse Funds Trust II
Brighthouse/Artisan Mid Cap Value Portfolio
Report of Independent Registered Public Accounting Firm
To the Board of Trustees of Brighthouse Funds Trust II and Shareholders of the Brighthouse/Artisan Mid Cap Value Portfolio:
Opinion on the Financial Statements and Financial Highlights
We have audited the accompanying statement of assets and liabilities, including the schedule of investments, of the Brighthouse/Artisan Mid Cap Value Portfolio (the “Fund”) (one of the funds constituting the Brighthouse Funds Trust II), as of December 31, 2023, the related statement of operations for the year then ended, the statements of changes in net assets for each of the two years in the period then ended, the financial highlights for each of the five years in the period then ended, and the related notes. In our opinion, the financial statements and financial highlights present fairly, in all material respects, the financial position of the Fund as of December 31, 2023, and the results of its operations for the year then ended, the changes in its net assets for each of the two years in the period then ended, and the financial highlights for each of the five years in the period then ended in conformity with accounting principles generally accepted in the United States of America.
Basis for Opinion
These financial statements and financial highlights are the responsibility of the Fund’s management. Our responsibility is to express an opinion on the Fund’s financial statements and financial highlights based on our audits. We are a public accounting firm registered with the Public Company Accounting Oversight Board (United States) (PCAOB) and are required to be independent with respect to the Fund in accordance with the U.S. federal securities laws and the applicable rules and regulations of the Securities and Exchange Commission and the PCAOB.
We conducted our audits in accordance with the standards of the PCAOB. Those standards require that we plan and perform the audit to obtain reasonable assurance about whether the financial statements and financial highlights are free of material misstatement, whether due to error or fraud. The Fund is not required to have, nor were we engaged to perform, an audit of its internal control over financial reporting. As part of our audits we are required to obtain an understanding of internal control over financial reporting but not for the purpose of expressing an opinion on the effectiveness of the Fund’s internal control over financial reporting. Accordingly, we express no such opinion.
Our audits included performing procedures to assess the risks of material misstatement of the financial statements and financial highlights, whether due to error or fraud, and performing procedures that respond to those risks. Such procedures included examining, on a test basis, evidence regarding the amounts and disclosures in the financial statements and financial highlights. Our audits also included evaluating the accounting principles used and significant estimates made by management, as well as evaluating the overall presentation of the financial statements and financial highlights. Our procedures included confirmation of securities owned as of December 31, 2023, by correspondence with the custodian and brokers; when replies were not received from brokers, we performed other auditing procedures. We believe that our audits provide a reasonable basis for our opinion.
/s/ Deloitte & Touche LLP
Boston, Massachusetts
February 23, 2024
We have served as the auditor of one or more Brighthouse investment companies since 1983.
BHFTII-18
Brighthouse Funds Trust II
Trustees and Officers
MANAGEMENT OF THE TRUSTS
The Boards of Trustees (the “Board”) of Brighthouse Funds Trust I and Brighthouse Funds Trust II (“Trust I” and “Trust II”, respectively, and collectively the “Trusts”) supervise the Trusts and are responsible for representing the interests of shareholders. The Trustees, the Chairman of the Board and the Chairmen of each subcommittee are the same for both Trusts. The Trustees of each Trust meet periodically throughout the year to oversee the Portfolios’ activities, reviewing, among other things, each Portfolio’s performance and its contractual arrangements with various service providers. The Trustees of each Trust elect the officers of the Trust, who are responsible for administering the Trust’s day-to-day operations.
Trustees and Officers
The Trustees and executive officers of the Trusts, as well as their ages and their principal occupations during the past five years, are set forth below. Unless otherwise indicated, the business address of each is c/o Brighthouse Funds Trust I and Brighthouse Funds Trust II, 11225 N. Community House Rd., Charolette, North Carolina 28277. Each Trustee who is deemed an “interested person,” as such term is defined in the 1940 Act, is referred to as an “Interested Trustee.” Those Trustees who are not “interested persons,” as such term is defined in the 1940 Act, are referred to as “Independent Trustees.” There is no limit to the term a Trustee may serve, other than pursuant to the retirement policy adopted by the Independent Trustees. Trustees serve until their death, resignation, retirement or removal in accordance with Trust I’s and Trust II’s respective organizational documents and policies adopted by the Board of the Trust from time to time. Officers hold office at the pleasure of each Board and serve until their removal or resignation in accordance with the Trusts’ respective organizational documents and policies adopted by the Board of each Trust from time to time.
Trustees of the Trusts
| Name and Year of Birth |
Position(s) |
Term of Office |
Principal Occupation(s) During the Past |
Number of |
Other Directorships Held | |||||
| Interested Trustee | ||||||||||
| John Rosenthal* (1960) |
Trustee | Indefinite; From May 2016 (Trust I and Trust II) to present | Chief Investment Officer, Brighthouse Financial, Inc. (2016 to present). | 73 | None | |||||
| Independent Trustees | ||||||||||
| Dawn M. Vroegop (1966) |
Trustee and Chair of the Board | Indefinite; From December 2000 (Trust I)/May 2009 (Trust II) to present as Trustee; From May 2016 (Trust I and Trust II) until present as Chair | Retired; Private Investor. | 73 | Trustee, Driehaus Mutual Funds (8 portfolios).** | |||||
| Stephen M. Alderman (1959) |
Trustee | Indefinite; From December 2000 (Trust I)/April 2012 (Trust II) to present | Vice President and General Counsel, IHR Aerial Solutions, LLC; Until 2022, General Counsel, Illini Hi-Reach, Inc.; Until 2020, Shareholder in the law firm of Garfield & Merel, Ltd. | 73 | None | |||||
| Robert J. Boulware (1956) |
Trustee | Indefinite; From March 2008 (Trust I)/April 2012 (Trust II) to present | Managing Member, Pilgrim Funds, LLC (private equity fund). | 73 | Trustee, Vertical Capital Income Fund (closed-end fund);** Trustee, The Private Shares Fund (closed- end fund);** Until 2021, Director, Mid- Con Energy Partners, LP (energy);** Until 2020, Director, Gainsco, Inc. (auto insurance).** | |||||
BHFTII-19
Brighthouse Funds Trust II
Trustees and Officers—(Continued)
| Name and Year of Birth |
Position(s) |
Term of Office |
Principal Occupation(s) During the Past |
Number of |
Other Directorships Held | |||||
| Susan C. Gause (1952) |
Trustee | Indefinite; From March 2008 (Trust I)/April 2012 (Trust II) to present | Private Investor. | 73 | Trustee, HSBC Funds (4 portfolios).** | |||||
| Nancy Hawthorne (1951) |
Trustee | Indefinite; From May 2003 (Trust II)/April 2012 (Trust I) to present | Private Investor. | 73 | Trustee, First Eagle Credit Opportunities Fund;** Trustee and Chair of the Board of Trustees, First Eagle Global Opportunities Fund;** Director, Avid Technology, Inc;** Director, CRA International, Inc.** | |||||
Executive Officers of the Trusts
| Name and Year of Birth |
Position(s) |
Term of Office |
Principal Occupation(s) | |||
| Kristi Slavin (1973) | President and Chief Executive Officer, of Trust I and Trust II | From May 2016 (Trust I and Trust II) to present |
President, Brighthouse Investment Advisers, LLC (2016-present). | |||
| Alan R. Otis (1971) | Chief Financial Officer and Treasurer, of Trust I and Trust II | From November 2017 (Trust I and Trust II) to present |
Executive Vice President, Brighthouse Investment Advisers, LLC (2017-present); formerly, Vice President, Brighthouse Investment Advisers, LLC (2012-2017); Assistant Treasurer, Trust I and Trust II (2012-2017). | |||
| Thomas Watterson (1985) | Secretary, of Trust I and Trust II | From November 2023 (Trust I and Trust II) to present |
Executive Vice President, Chief Legal Officer and Secretary, Brighthouse Investment Advisers, LLC (2023-Present); Managing Corporate Counsel, Brighthouse Financial Inc. (2023-present); Managing Counsel and Director, The Bank of New York Mellon Corporation (2019-2023); Counsel and Vice President, The Bank of New York Mellon Corporation (2016-2019). | |||
| Katie Hellmann (1980) | Chief Compliance Officer (“CCO”), of Trust I and Trust II | From May 2023 (Trust I and Trust II) to present |
Chief Compliance Officer, Brighthouse Investment Advisers, LLC (2023-present) and Head of Funds and Investments Compliance (2023-present). Deputy Chief Compliance Officer, Transamerica Asset Management (2022-2023). Leader and Senior Compliance Counsel – Funds Compliance, Edward Jones (2017-2022). | |||
| Rosemary Morgan (1983) | Anti-Money Laundering Officer, of Trust I and Trust II | From May 2023 (Trust I and Trust II) to present |
Chief Privacy Officer, Leader of Compliance Programs and Assistant General Counsel, Brighthouse Financial, Inc. (2019-2022); Chief Privacy Officer, Head of Compliance Programs & Contracts Law, Brighthouse Financial, Inc. (2022-2023), Chief Compliance Officer and Associate General Counsel, Brighthouse Financial, Inc. (2023-present); Vice President and Chief Compliance Officer, Brighthouse Life Insurance Company (2023-present); Vice President and Chief Compliance Officer (2023-present), Brighthouse Life Insurance Company of NY; Vice President and Chief Compliance Officer (2023-present), New England Life Insurance Company. | |||
| Anna Koska (1981) | Vice President, of Trust I and Trust II | From June 2022 (Trust I and Trust II) to present |
Vice President, Investment and Advisory Services, Brighthouse Investment Advisers, LLC (2022-present); Director of Investment and Advisory Services, Brighthouse Investment Advisers, LLC (2019-2022); Senior Portfolio Analyst, Brighthouse Investment Advisers, LLC (2017-2019). | |||
| * | Mr. Rosenthal is an “interested person” of the Trusts because of his position with Brighthouse Financial, Inc. (“Brighthouse Financial”), an affiliate of BIA. |
| ** | Indicates a directorship with a registered investment company or a company subject to the reporting requirements of the Securities Exchange Act of 1934, as amended. |
| (1) | Previous positions during the past five years with the Trusts, MetLife, Inc. or the Adviser are omitted if not materially different. |
| (2) | The Fund Complex includes 44 Trust I Portfolios and 29 Trust II Portfolios. |
BHFTII-20
Brighthouse Funds Trust II
Brighthouse/Artisan Mid Cap Value Portfolio
Board of Trustees’ Consideration of Advisory and Sub-Advisory Agreements
At a meeting held on November 13-14, 2023 (the “November Meeting”), the Boards of Trustees (the “Board”) of Brighthouse Funds Trust I and Brighthouse Funds Trust II (“BFT I” and “BFT II,” respectively, and collectively, the “Trusts”), including a majority of the Trustees who are not “interested persons” of the Trusts (the “Independent Trustees”) under the Investment Company Act of 1940 (the “1940 Act”), approved the continuation of the Trusts’ advisory agreements (each an “Advisory Agreement”) with Brighthouse Investment Advisers, LLC (the “Adviser”) and the applicable sub-advisory and sub-sub-advisory agreements (each a “Sub-Advisory Agreement” and collectively with the Advisory Agreement, the “Agreements”) between the Adviser and the investment sub-advisers and sub-sub-adviser (each a “Sub-Adviser,” and collectively, the “Sub-Advisers”) for the series of the Trusts (each a “Portfolio,” and collectively, the “Portfolios”) for the annual contract renewal period from January 1, 2024 through December 31, 2024.
The Board met with personnel of the Adviser on September 28-29, 2023 (the “September Meeting”) for the specific purpose of giving preliminary consideration to the proposed continuation of the Agreements, including consideration to information that the Adviser and Sub-Advisers had provided for the Board’s review at the request of the Independent Trustees. At the September Meeting, the Adviser reviewed with the Board the performance and fees experienced by each Portfolio, as well as other information. During and after the September Meeting, the Independent Trustees requested additional information and clarifications that the Adviser addressed at the November Meeting (the September Meeting and the November Meeting are referred to collectively as, the “Meetings”). During the contract renewal process, and throughout the year, the Independent Trustees were advised by independent legal counsel, and they met with independent legal counsel in executive sessions outside of the presence of management on a number of occasions to discuss, among other things, the renewal of the Agreements.
In considering the continuation of the Agreements, the Board reviewed a variety of materials that were provided for the specific purpose of assisting the Board in the renewal process, along with various information and materials that were provided to and discussed with the Board throughout the year, at regularly scheduled meetings of the Board and its committees. In particular, information for each Portfolio included, but was not limited to, reports on investment performance, expenses, legal and compliance matters, and asset pricing. Information about the Adviser and each Sub-Adviser included, but was not limited to, reports on the business, operations, and performance of the Adviser and the Sub-Advisers and reports that the Adviser and Sub-Advisers had prepared specifically for the renewal process.
In considering the continuation of the Agreements, the Board also reviewed, among other things, a report for each Portfolio that was prepared by Broadridge (“Broadridge”), an independent organization, which set forth comparative performance and expense information for each Portfolio. In addition, the Independent Trustees reviewed a report that was prepared by JDL Consultants, LLC (“JDL”), an independent consultant to the Independent Trustees, which examined the Broadridge reports for each Portfolio (“JDL Report”). The Independent Trustees met in executive session with representatives of JDL during the September Meeting to review the JDL Report.
At the November Meeting, the Board, including a majority of the Independent Trustees, concluded that the nature, extent, and quality of services provided by the Adviser and each Sub-Adviser supported the renewal of the Agreements. The Board also concluded that the investment services provided to and the performance of each Portfolio was such that each Agreement should continue, and that the fees paid by each Portfolio to the Adviser appeared to be reasonable in light of the nature, extent, and quality of the services provided by the Adviser and each Sub-Adviser. Further, the Board concluded that the Adviser’s profitability in providing services under the Advisory Agreements did not appear unreasonable in light of the nature, extent, and quality of the services provided by the Adviser. The Board reviewed the extent to which the investment advisory fees paid by the Portfolios shared economies of scale with investors or entailed the potential to share economies of scale with investors and concluded that those considerations generally supported the renewal of each Agreement. Finally, the Board considered the Adviser’s recommendation that it approve the renewal of each Sub-Advisory Agreement.
In approving the continuation of each Agreement, the Board, including the Independent Trustees, gave attention to all of the information that was furnished, and each Trustee placed varying degrees of importance on the various pieces of information that were provided to them. The Board evaluated the information provided to it on a Portfolio-by-Portfolio basis, and its decision was made separately with respect to each Portfolio. The following paragraphs provide more information about some of the primary factors that were relevant to the Board’s decisions. The Board did not identify any single factor as determinative, and the Trustees generally attributed different weights to various factors for the various Portfolios.
Nature, extent and quality of services. The Board evaluated the nature, extent, and quality of the services that the Adviser and the Sub-Advisers, as relevant, provided to the Portfolios. The Board considered the Adviser’s services as investment manager to the Portfolios, including its services relating to the hiring and oversight of the Sub-Advisers and, in particular, their investment programs
BHFTII-21
Brighthouse Funds Trust II
Brighthouse/Artisan Mid Cap Value Portfolio
Board of Trustees’ Consideration of Advisory and Sub-Advisory Agreements—(Continued)
and personnel, succession management of key personnel, trading practices, compliance programs and personnel, and risk management programs, among other things. The Adviser’s services in coordinating and overseeing the activities of the Trusts’ other service providers were also considered. The Board also considered the systems and processes required by the Adviser to meet additional regulatory and compliance requirements resulting from U.S. Securities and Exchange Commission and other regulatory initiatives, including related to liquidity, valuation, and derivatives risk management. The Board considered information received from the Trusts’ Chief Compliance Officer regarding the Portfolios’ compliance policies and procedures that were established pursuant to Rule 38a-l under the 1940 Act, and relevant aspects of the Adviser’s and Sub-Advisers’ compliance policies and procedures. The Board also noted that it was the practice of the Adviser’s investment, compliance, and legal staff to conduct periodic meetings (through various media) with the Sub-Advisers throughout the year in order to review and assess the services that are provided to the Portfolios, and that personnel of the Adviser routinely prepare and present reports to the Board regarding those meetings. In addition, during the Meetings and throughout the year, the Board considered the expertise, experience, and performance of the personnel of the Adviser who performed the various services that are mentioned above.
With respect to the services provided by each of the Sub-Advisers, the Board considered a variety of information that the Adviser and each Sub-Adviser prepared for the Board’s review. The Board considered each Sub-Adviser’s investment process, each Sub-Adviser’s overall organization and business plans and the investment performance experienced by the Portfolio (as described in more detail below). The Board took into account that each Sub-Adviser’s responsibilities include, among other things, the development and maintenance of an investment program for the applicable Portfolio, the selection of investments and the placement of orders for the purchase and sale of such assets, and the implementation of compliance controls related to the performance of these services. The Board considered, based on the information provided, each Sub-Adviser’s staffing with respect to the management of the Portfolio and other information relating to the Sub-Adviser’s business and operations. The Board also considered the Sub-Adviser’s overall resources and information with respect to any recent turnover of key personnel at the Sub-Adviser. The Board reviewed each Sub-Adviser’s investment experience, as well as information provided regarding the Sub-Adviser’s personnel who provide services to the Portfolios. The Board also considered, among other things, information about each Sub-Adviser’s compliance program, including regarding any compliance matters involving a Sub-Adviser that had been brought to the Board’s attention during the year, as well as the Adviser’s assessment of the financial condition of each Sub-Adviser.
Performance. The Board placed emphasis on the performance of each Portfolio in the context of the performance of the relevant markets in which the Portfolio invests. The Board considered the Adviser’s quarterly presentations to the Board of detailed information about each Portfolio’s investment strategies and performance results and composition, including discussions regarding the relevant effects of market conditions. The Board reviewed and considered the reports prepared by Broadridge, which provided a statistical analysis comparing each Portfolio’s investment performance to that of comparable funds underlying variable insurance products (the “Performance Universe”), and the JDL Report. The Board also compared the performance of each Portfolio to that of comparable funds and other accounts that were managed by the relevant Sub-Adviser, to the extent such information was provided. The Board considered each Portfolio’s performance for periods subsequent to the performance period covered by the Broadridge reports and considered the Adviser’s assessment of the same. The Board also noted that while it found the data provided by Broadridge generally useful, it recognized the limitations of such data, including, in particular, that notable differences may exist between a Portfolio and the other funds in a Broadridge category (for example, with respect to investment strategies) and that the results of the performance comparisons may vary depending on (i) the end dates for the performance periods that were selected and (ii) the selection of the peer groups.
The Board focused particular attention on Portfolios with less favorable performance records. The Board noted the Adviser’s focus on each Sub-Adviser’s performance and that the Adviser had been active in monitoring and responding to any performance issues with respect to the Portfolios.
Fees and Expenses. The Board gave consideration to the level and method of computing the fees payable under the Agreements. The Board reviewed and considered the information in the JDL Report concerning fees and expenses. The Board also reviewed and considered the Broadridge report for each Portfolio, which included various comparisons of the Portfolio’s fees (at December 31, 2022 and various asset levels) and expenses with those of its peers, including, as applicable, a broad group of peer funds (“Expense Universe”), a narrower group of peer funds (“Expense Group”), a broad group of peer sub-advised funds (“Sub-advised Expense Universe”), and a narrower group of peer sub-advised funds (“Sub-advised Expense Group”). In particular, the Board reviewed comparisons of each Portfolio’s contractual management fees with its Expense Group and Sub-advised Expense Universe, contractual sub-adviser fees with its Sub-advised Expense Universe and Sub-advised Expense Group, and total expenses with its Expense Universe, Expense Group and Sub-advised Expense Universe. The Board considered that Broadridge selected the peer funds, which were funds underlying variable insurance products that Broadridge deemed to be comparable to the Portfolios. The Board considered that the fee
BHFTII-22
Brighthouse Funds Trust II
Brighthouse/Artisan Mid Cap Value Portfolio
Board of Trustees’ Consideration of Advisory and Sub-Advisory Agreements—(Continued)
and expense information in the Broadridge report for each Portfolio reflected information as of the Portfolio’s most recent fiscal year end at the time the Broadridge report was issued and that historical asset levels may differ from current asset levels, particularly in a period of market volatility. In addition, the Board compared the fee payable to a Sub-Adviser by the Adviser with respect to the Portfolio to the fee payable to the Sub-Adviser by other comparable funds and other accounts, to the extent such information was provided.
The Board noted that the sub-advisory fees for the Portfolios are negotiated at arm’s length by the Adviser and are paid by the Adviser out of its advisory fees. The Board also considered that the Adviser had entered into expense limitation or management fee waiver agreements with certain of the Portfolios pursuant to which the Adviser had agreed to waive a portion of its advisory fee and/or reimburse certain expenses as a means of limiting a Portfolio’s total annual operating expenses or passing through the benefit of a subadvisory fee concession to a Portfolio, as applicable.
Profitability. The Board examined the profitability to the Adviser of each Advisory Agreement, on a Portfolio-by-Portfolio basis. The Board also considered that an affiliate of the Adviser, Brighthouse Securities, LLC, serves as distributor for the Trusts, and, as such, receives Rule 12b-1 payments to support the distribution of the Portfolios. The Board considered the profitability to the Sub-Advisers and their affiliates of their relationships with the Portfolios, to the extent provided, and the Board considered the ability of the Adviser to negotiate with a Sub-Adviser at arm’s length. In reviewing the profitability information, the Board recognized that expense allocation methodologies are inherently subjective and various methodologies may be reasonable while producing different results.
Economies of scale. The Board considered each Portfolio’s fees in light of its size. The Board noted the fee schedules for the Portfolios that contain breakpoints that reduce the fee rate above specified asset levels, including breakpoints in the Advisory Agreements and any corresponding Sub-Advisory Agreement. The Board noted those Portfolios that did not have breakpoints in their advisory fees and considered management’s explanation of the same.
The Board considered the effective fees under the Advisory Agreement and Sub-Advisory Agreement for each Portfolio as a percentage of assets at different asset levels and possible economies of scale that may be realized if the assets of the Portfolio grow. The Board examined, among other data, the effect of a Portfolio’s growth in size, and reduction in size, on various fee schedules. The Board also generally noted that if a Portfolio’s assets increase over time, the Portfolio may realize economies of scale if assets increase proportionally more than certain other expenses.
Other factors. The Board considered other benefits that may be realized by the Adviser and its affiliates from their relationships with the Trusts. Among the benefits realized by the Adviser, the Board recognized that Brighthouse Securities, LLC, as the distributor for the Trusts, receives payments pursuant to Rule 12b-1 from the Portfolios to help compensate for the provision of shareholder services and distribution activities. The Board considered that a Sub-Adviser may engage in soft dollar transactions in managing a Portfolio. In addition, the Board considered that a Sub-Adviser may be affiliated with registered broker-dealers that may, from time to time, receive brokerage commissions from a Portfolio in connection with the sale of portfolio securities (subject to applicable best execution obligations). The Board also considered that a Sub-Adviser and its affiliates could benefit from the opportunity to provide advisory services to additional portfolios of the Trusts and overall reputational benefits.
The Board considered information from the Adviser and Sub-Advisers pertaining to potential conflicts of interest, and the manner in which any potential conflicts were mitigated. In its review, the Board considered information regarding various business relationships among the Adviser and its affiliates and various Sub-Advisers and their affiliates. The Board also considered information about services and/or payments provided to the Adviser by the Sub-Advisers in connection with marketing activities. The Board considered representations from the Adviser that such business relationships and any payments were not considered in the Adviser’s recommendation to renew any of the Sub-Advisory Agreements.
* * * * *
Brighthouse/Artisan Mid Cap Value Portfolio. The Board also considered the following information in relation to the Agreements with the Adviser and Artisan Partners Limited Partnership regarding the Portfolio:
Among other data relating specifically to the Portfolio’s performance, the Board considered that the Portfolio outperformed the median of its Performance Universe and the average of its Morningstar Category for the one-year period ended June 30, 2023 and underperformed the median of its Performance Universe and the average of its Morningstar Category for the three-and five-year periods ended June 30, 2023. The Board further considered that the Portfolio outperformed its benchmark, the Russell Midcap Value Index, for the one-, three-, and five-year periods ended October 31, 2023. The Board took into account management’s discussion of the Portfolio’s performance, including with respect to prevailing market conditions. The Board also noted the presence of certain management fee waivers in effect for the Portfolio.
BHFTII-23
Brighthouse Funds Trust II
Brighthouse/Artisan Mid Cap Value Portfolio
Board of Trustees’ Consideration of Advisory and Sub-Advisory Agreements—(Continued)
The Board also considered that the Portfolio’s actual management fees were below the Expense Group median and above the Expense Universe median and the Sub-advised Expense Universe median. The Board also considered that the total expenses (exclusive of 12b-1 fees) were below the Expense Group median, the Expense Universe median, and the Sub-advised Expense Universe median. The Board noted that the Portfolio’s contractual management fees were above the asset-weighted average of the Investment Classification/Morningstar Category selected by Broadridge at the Portfolio’s current size. The Board also noted that the Portfolio’s contractual sub-advisory fees were below the averages of the Sub-advised Expense Group and the Sub-advised Expense Universe at the Portfolio’s current size.
BHFTII-24
Brighthouse Funds Trust II
Brighthouse/Dimensional International Small Company Portfolio
Managed By Dimensional Fund Advisors LP
Portfolio Manager Commentary*
PERFORMANCE
For the twelve months ended December 31, 2023, the Class A and B shares of the Brighthouse/Dimensional International Small Company Portfolio returned 13.70% and 13.52%, respectively. The Portfolio’s benchmark, the MSCI World ex-U.S. Small Cap Index¹, returned 12.62%.
MARKET ENVIRONMENT / CONDITIONS
In U.S. dollar terms, developed ex-U.S. markets had positive performance for the one-year period ended December 31, 2023, trailing the U.S. market but outperforming emerging markets. The MSCI World ex-USA Investable Market Index (net dividends) returned +17.2%, as compared to +26.0% for the Russell 3000 Index and +11.7% for the MSCI Emerging Markets Investable Market Index (net dividends).
During the year, some of the major developed ex-U.S. market currencies, such as the Swiss franc, appreciated relative to the U.S. dollar, while others, such as the Japanese yen, depreciated. Overall, currency movements had a positive impact on the U.S. dollar-denominated returns of the developed ex-U.S. market.
Along the market capitalization dimension, small caps (MSCI World ex-U.S. Small Cap Index, net dividends) underperformed large caps (MSCI World ex-U.S. Index, net dividends) by 5.3%. Midcaps (MSCI World ex-U.S. Mid Cap Index, net dividends), a subset of the MSCI World ex-U.S. Index universe, outperformed small caps by 3.9% and underperformed large caps by 1.4%.
Along the relative price dimension, large cap value stocks (MSCI World ex-U.S. Value Index, net dividends) outperformed large cap growth stocks (MSCI World ex-U.S. Growth Index, net dividends) by 1.0%, and small cap value stocks (MSCI World ex-U.S. Small Cap Value Index, net dividends) outperformed small cap growth stocks (MSCI World ex-U.S. Small Cap Growth Index, net dividends) by 4.1%.
Along the profitability dimension, stocks with higher profitability underperformed stocks with lower profitability within both large and small caps.
PORTFOLIO REVIEW / PERIOD END POSITIONING
The Portfolio outperformed its benchmark during the reporting period. The Portfolio’s exclusion of stocks with the lowest profitability and highest relative prices contributed positively to relative performance, as these stocks underperformed over the period. The Portfolio’s exclusion of real estate investment trusts also contributed positively to relative performance, as these stocks underperformed. Conversely, differences in small cap definitions by country resulted in a lower weight to Sweden and detracted from relative performance, as these stocks outperformed.
The Portfolio held more than 3,600 securities as of December 31, 2023, and was diversified across countries and sectors. Dimensional designs the Portfolio to provide broad exposure to small cap securities within non-U.S. developed markets. As a result of the Portfolio’s diversified investment approach, performance is determined principally by broad trends in non-U.S. developed equity markets rather than by the behavior of a limited group of securities in a particular industry, country, or asset class.
Jed Fogdall
Arun Keswani
Joel Schneider
Portfolio Managers
Dimensional Fund Advisors LP
* This commentary may include statements that constitute “forward-looking statements” under the U.S. securities laws. Forward-looking statements include, among other things, projections, estimates, and information about possible or future results related to the Portfolio, market or regulatory developments. The views expressed above are not guarantees of future performance or economic results and involve certain risks, uncertainties and assumptions that could cause actual outcomes and results to differ materially from the views expressed herein. The views expressed above are subject to change at any time based upon economic, market, or other conditions and the subadvisory firm undertakes no obligation to update the views expressed herein. Any discussions of specific securities should not be considered a recommendation to buy or sell those securities. The views expressed above (including any forward-looking statement) may not be relied upon as investment advice or as an indication of the Portfolio’s trading intent. Information about the Portfolio’s holdings, asset allocation or country diversification is historical and is not an indication of future Portfolio composition, which may vary. Direct investment in any index is not possible. The performance of any index mentioned in this commentary has not been adjusted for ongoing management, distribution and operating expenses, and sales charges applicable to mutual fund investments. In addition, the returns do not reflect additional fees charged by separate accounts or variable insurance contracts that an investor in the Portfolio may pay. If these additional fees were reflected, performance would have been lower.
1 The MSCI World ex-U.S. Small Cap Index is an unmanaged index that measures the performance of stocks with market capitalizations between US $200 million and $800 million across 23 developed markets, excluding the United States. The index returns shown above were calculated with net dividends: they reflect the reinvestment of dividends after the deduction of the maximum possible withholding taxes.
BHFTII-1
Brighthouse Funds Trust II
Brighthouse/Dimensional International Small Company Portfolio
A $10,000 INVESTMENT COMPARED TO THE MSCI WORLD EX-U.S. SMALL CAP INDEX
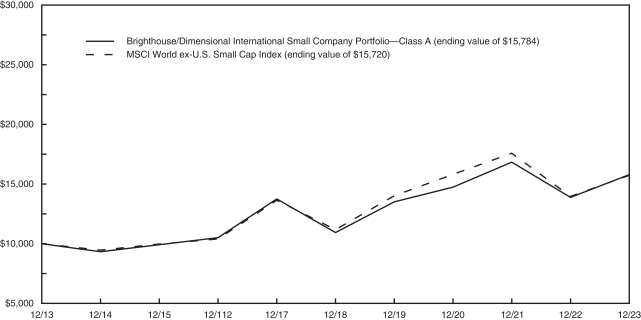
AVERAGE ANNUAL RETURNS (%) FOR THE YEAR ENDED DECEMBER 31, 2023
| 1 Year | 5 Year | 10 Year | ||||||||||
| Brighthouse/Dimensional International Small Company Portfolio | ||||||||||||
| Class A |
13.70 | 7.58 | 4.67 | |||||||||
|
Class B |
13.52 | 7.32 | 4.42 | |||||||||
| MSCI World ex-U.S. Small Cap Index | 12.62 | 7.05 | 4.63 | |||||||||
Portfolio performance is calculated including reinvestment of all income and capital gain distributions. Performance numbers are net of all Portfolio expenses but do not include any insurance, sales, separate account or administrative charges of variable annuity or life insurance contracts or any additional expenses that participants may bear relating to the operations of their plans. If these charges were included, the returns would be lower. The performance of any index referenced above has not been adjusted for ongoing management, distribution and operating expenses, and sales charges applicable to mutual fund investments. Direct investment in any index is not possible. The performance of Class A shares, as set forth in the line graph above, will differ from that of other classes because of the difference in expenses paid by policyholders investing in the different share classes.
This information represents past performance and is not indicative of future results. Investment return and principal value may fluctuate so that shares, upon redemption, may be worth more or less than the original cost.
PORTFOLIO COMPOSITION AS OF DECEMBER 31, 2023
Top Holdings
| % of Net Assets |
||||
| BE Semiconductor Industries NV | 0.4 | |||
| Banco BPM SpA | 0.4 | |||
| Leonardo SpA | 0.3 | |||
| Banco de Sabadell SA | 0.3 | |||
| PSP Swiss Property AG | 0.3 | |||
| Swiss Prime Site AG | 0.3 | |||
| Georg Fischer AG | 0.3 | |||
| Helvetia Holding AG | 0.3 | |||
| Belimo Holding AG | 0.3 | |||
| Temenos AG | 0.3 | |||
Top Countries
| % of Net Assets |
||||
| Japan | 24.4 | |||
| United Kingdom | 12.1 | |||
| Canada | 10.9 | |||
| Switzerland | 8.0 | |||
| Australia | 6.6 | |||
| Germany | 6.4 | |||
| France | 4.8 | |||
| Italy | 4.3 | |||
| Sweden | 2.5 | |||
| Denmark | 2.5 | |||
BHFTII-2
Brighthouse Funds Trust II
Brighthouse/Dimensional International Small Company Portfolio
Understanding Your Portfolio’s Expenses
Shareholder Expense Example
As a shareholder of the Portfolio, you incur ongoing costs, including management fees; distribution and service (12b-1) fees; and other Portfolio expenses. This example is intended to help you understand your ongoing costs (in dollars) (referred to as “expenses”) of investing in the Portfolio and compare these costs with the ongoing costs of investing in other mutual funds. The example is based on an investment of $1,000 invested at the beginning of the period and held for the entire period, July 1, 2023 through December 31, 2023.
Actual Expenses
The first line for each share class of the Portfolio in the table below provides information about actual account values and actual expenses. You may use the information in this line, together with the amount you invested in the particular share class of the Portfolio, to estimate the expenses that you paid over the period. Simply divide your account value by $1,000 (for example, an $8,600 account value divided by $1,000 = 8.6), then multiply the result by the number in the first line under the heading entitled “Expenses Paid During Period” to estimate the expenses you paid on your account during this period.
Hypothetical Example for Comparison Purposes
The second line for each share class of the Portfolio in the table below provides information about hypothetical account values and hypothetical expenses based on the Portfolio’s actual expense ratio and an assumed rate of return of 5% per year before expenses, which is not the Portfolio’s actual return. The hypothetical account values and expenses may not be used to estimate the actual ending account balance or expenses you paid for the period. You may use this information to compare the ongoing costs of investing in the Portfolio and other funds. To do so, compare this 5% hypothetical example with the 5% hypothetical examples that appear in the shareholder reports of the other funds.
Please note that the expenses shown in the table are meant to highlight your ongoing costs only and do not reflect any fees or charges of your variable insurance product or any additional expenses that participants in certain eligible qualified plans may bear relating to the operations of their plan. Therefore, the second line for each share class in the table is useful in comparing ongoing costs only, and will not help you determine the relative total costs of owning different funds. In addition, if these other costs were included, your costs would have been higher.
| Brighthouse/Dimensional International Small Company Portfolio |
Annualized Expense Ratio |
Beginning Account Value July 1, 2023 |
Ending Account Value December 31, 2023 |
Expenses Paid During Period** July 1, 2023 to December 31, 2023 |
||||||||||||||
| Class A (a) |
Actual | 0.81 | % | $ | 1,000.00 | $ | 1,067.90 | $ | 4.22 | |||||||||
| Hypothetical* | 0.81 | % | $ | 1,000.00 | $ | 1,021.12 | $ | 4.13 | ||||||||||
| Class B (a) |
Actual | 1.06 | % | $ | 1,000.00 | $ | 1,066.20 | $ | 5.52 | |||||||||
| Hypothetical* | 1.06 | % | $ | 1,000.00 | $ | 1,019.86 | $ | 5.40 | ||||||||||
| * | Hypothetical assumes a rate of return of 5% per year before expenses. |
| ** | Expenses paid are equal to the Portfolio’s annualized expense ratio for the most recent six month period, as shown above, multiplied by the average account value over the period, multiplied by the number of days (184 days) in the most recent fiscal half-year, divided by 365 (to reflect the one-half year period). |
| (a) | The annualized expense ratio shown reflects the impact of the management fee waiver as described in Note 5 of the Notes to Financial Statements. |
BHFTII-3
Brighthouse Funds Trust II
Brighthouse/Dimensional International Small Company Portfolio
Schedule of Investments as of December 31, 2023
Common Stocks—99.4% of Net Assets
| Security Description | Shares | Value | ||||||
| Australia—6.6% | ||||||||
| A2B Australia Ltd. |
55,813 | $ | 80,935 | |||||
| Accent Group Ltd. |
97,699 | 128,809 | ||||||
| Adairs Ltd. |
41,549 | 51,062 | ||||||
| Adbri Ltd. (a) |
108,171 | 220,911 | ||||||
| Ainsworth Game Technology Ltd. (a) |
51,616 | 46,058 | ||||||
| Alkane Resources Ltd. (a) |
122,642 | 54,846 | ||||||
| Alliance Aviation Services Ltd. (a) |
6,026 | 13,218 | ||||||
| Altium Ltd. |
5,983 | 190,345 | ||||||
| Alumina Ltd. (a) |
273,675 | 167,622 | ||||||
| AMA Group Ltd. (a) |
332,422 | 15,838 | ||||||
| AMP Ltd. |
476,602 | 300,839 | ||||||
| Ansell Ltd. |
22,008 | 376,672 | ||||||
| Appen Ltd. (a) |
21,547 | 9,215 | ||||||
| Arafura Rare Earths Ltd. (a) |
376,915 | 42,248 | ||||||
| ARB Corp. Ltd. |
22,263 | 543,288 | ||||||
| Argosy Minerals Ltd. (a) |
61,527 | 5,637 | ||||||
| ARN Media Ltd. |
82,651 | 56,230 | ||||||
| Articore Group Ltd. (a) |
43,202 | 20,306 | ||||||
| AUB Group Ltd. |
26,288 | 496,077 | ||||||
| Audinate Group Ltd. (a) |
12,334 | 135,762 | ||||||
| Aurelia Metals Ltd. (a) |
407,982 | 30,520 | ||||||
| Aussie Broadband Ltd. (a) |
37,649 | 99,771 | ||||||
| Austal Ltd. |
105,389 | 145,659 | ||||||
| Australian Agricultural Co. Ltd. (a) |
78,371 | 74,495 | ||||||
| Australian Clinical Labs Ltd. |
26,737 | 52,590 | ||||||
| Australian Ethical Investment Ltd. |
7,596 | 27,954 | ||||||
| Australian Finance Group Ltd. |
54,872 | 58,311 | ||||||
| Australian Strategic Materials Ltd. (a) |
36,700 | 31,720 | ||||||
| Auswide Bank Ltd. |
11,499 | 40,254 | ||||||
| AVJennings Ltd. |
14,202 | 3,014 | ||||||
| AVZ Minerals Ltd. (a) (b) (c) |
403,512 | 42,308 | ||||||
| Baby Bunting Group Ltd. |
24,951 | 33,943 | ||||||
| Bank of Queensland Ltd. |
121,805 | 503,669 | ||||||
| Bapcor Ltd. |
85,877 | 322,716 | ||||||
| Beach Energy Ltd. |
317,481 | 345,760 | ||||||
| Bega Cheese Ltd. |
82,207 | 197,964 | ||||||
| Bellevue Gold Ltd. (a) |
246,272 | 282,535 | ||||||
| Black Rock Mining Ltd. (a) |
70,006 | 3,995 | ||||||
| Boral Ltd. (a) |
77,809 | 285,235 | ||||||
| Boss Energy Ltd. (a) |
62,940 | 172,297 | ||||||
| Bravura Solutions Ltd. (a) |
144,124 | 83,753 | ||||||
| Breville Group Ltd. |
25,536 | 472,511 | ||||||
| Brickworks Ltd. |
12,229 | 232,583 | ||||||
| Bubs Australia Ltd. (a) |
46,469 | 4,104 | ||||||
| BWX Ltd. (a) (b) (c) |
32,748 | 1,674 | ||||||
| Calidus Resources Ltd. (a) |
42,447 | 6,224 | ||||||
| Capitol Health Ltd. |
260,324 | 41,528 | ||||||
| Capral Ltd. |
5,292 | 34,465 | ||||||
| Capricorn Metals Ltd. (a) |
63,797 | 205,385 | ||||||
| Carnarvon Energy Ltd. (a) |
136,527 | 21,318 | ||||||
| Cash Converters International Ltd. |
152,939 | 22,406 | ||||||
| Catapult Group International Ltd. (a) |
33,605 | 31,564 | ||||||
| Cedar Woods Properties Ltd. |
19,138 | 65,009 | ||||||
| Centrebet International Ltd. (a) |
9,600 | 0 | ||||||
| Cettire Ltd. (a) |
5,836 | 11,494 | ||||||
| Challenger Ltd. |
61,694 | 272,351 | ||||||
| Champion Iron Ltd. |
70,983 | 403,997 | ||||||
| Australia—(Continued) | ||||||||
| City Chic Collective Ltd. (a) |
43,372 | 15,808 | ||||||
| Clinuvel Pharmaceuticals Ltd. |
9,453 | 102,844 | ||||||
| Clover Corp. Ltd. |
39,945 | 22,477 | ||||||
| Coast Entertainment Holdings Ltd. (a) |
113,950 | 35,602 | ||||||
| Codan Ltd. |
31,190 | 181,463 | ||||||
| Collins Foods Ltd. |
30,579 | 246,041 | ||||||
| Cooper Energy Ltd. (a) |
753,059 | 66,723 | ||||||
| Core Lithium Ltd. (a) |
66,314 | 11,272 | ||||||
| Corporate Travel Management Ltd. |
28,366 | 376,713 | ||||||
| Costa Group Holdings Ltd. |
130,158 | 276,912 | ||||||
| Credit Corp. Group Ltd. |
20,160 | 221,611 | ||||||
| CSR Ltd. |
156,422 | 701,929 | ||||||
| Data#3 Ltd. |
49,016 | 281,286 | ||||||
| De Grey Mining Ltd. (a) |
318,679 | 273,775 | ||||||
| Deep Yellow Ltd. (a) |
17,263 | 12,766 | ||||||
| Deterra Royalties Ltd. |
29,128 | 104,348 | ||||||
| Dicker Data Ltd. |
13,151 | 107,053 | ||||||
| Domain Holdings Australia Ltd. |
72,641 | 170,365 | ||||||
| Domino’s Pizza Enterprises Ltd. |
10,721 | 429,026 | ||||||
| Downer EDI Ltd. |
150,888 | 450,618 | ||||||
| Eagers Automotive Ltd. |
35,943 | 353,466 | ||||||
| Earlypay Ltd. (a) |
54,160 | 9,597 | ||||||
| Elanor Investor Group |
5,934 | 5,484 | ||||||
| Elders Ltd. |
46,965 | 240,632 | ||||||
| Elixir Energy Ltd. (a) |
29,923 | 1,689 | ||||||
| Emeco Holdings Ltd. |
105,907 | 48,350 | ||||||
| Emerald Resources NL (a) |
48,199 | 99,506 | ||||||
| EML Payments Ltd. (a) |
62,760 | 33,654 | ||||||
| Energy Transition Minerals Ltd. (a) |
349,524 | 9,276 | ||||||
| Energy World Corp. Ltd. (a) |
472,609 | 8,657 | ||||||
| EQT Holdings Ltd. |
5,157 | 89,429 | ||||||
| Euroz Hartleys Group Ltd. |
24,476 | 14,673 | ||||||
| EVT Ltd. |
28,526 | 237,028 | ||||||
| Fiducian Group Ltd. |
3,121 | 13,160 | ||||||
| Finbar Group Ltd. (a) |
6,909 | 3,389 | ||||||
| Firefinch Ltd. (a) (b) (c) |
39,761 | 1,016 | ||||||
| FleetPartners Group Ltd. (a) |
82,973 | 171,845 | ||||||
| Fleetwood Ltd. |
35,042 | 42,945 | ||||||
| Flight Centre Travel Group Ltd. |
32,473 | 449,107 | ||||||
| Frontier Digital Ventures Ltd. (a) |
10,683 | 4,003 | ||||||
| G8 Education Ltd. |
241,144 | 193,672 | ||||||
| Galan Lithium Ltd. (a) |
30,176 | 14,081 | ||||||
| Gold Road Resources Ltd. |
245,281 | 329,718 | ||||||
| GR Engineering Services Ltd. |
5,075 | 7,671 | ||||||
| GrainCorp Ltd. - Class A |
58,664 | 290,947 | ||||||
| Grange Resources Ltd. |
120,000 | 37,878 | ||||||
| GUD Holdings Ltd. |
43,884 | 357,780 | ||||||
| GWA Group Ltd. |
64,632 | 98,553 | ||||||
| Hansen Technologies Ltd. |
51,497 | 178,559 | ||||||
| Harvey Norman Holdings Ltd. |
65,742 | 187,824 | ||||||
| Hastings Technology Metals Ltd. (a) |
7,646 | 3,830 | ||||||
| Healius Ltd. (a) |
195,166 | 217,615 | ||||||
| Helia Group Ltd. |
88,585 | 262,113 | ||||||
| HUB24 Ltd. |
19,005 | 464,812 | ||||||
| Humm Group Ltd. |
115,759 | 38,994 | ||||||
| IDM International Ltd. (a) (b) (c) |
1,969 | 0 | ||||||
| Iluka Resources Ltd. |
32,765 | 146,896 | ||||||
See accompanying notes to financial statements.
BHFTII-4
Brighthouse Funds Trust II
Brighthouse/Dimensional International Small Company Portfolio
Schedule of Investments as of December 31, 2023
Common Stocks—(Continued)
| Security Description | Shares | Value | ||||||
| Australia—(Continued) | ||||||||
| Imdex Ltd. |
138,217 | $ | 177,104 | |||||
| Immutep Ltd. (ADR) (a) |
8,886 | 21,326 | ||||||
| Infomedia Ltd. |
109,692 | 107,555 | ||||||
| Inghams Group Ltd. |
86,621 | 233,394 | ||||||
| Insignia Financial Ltd. |
184,126 | 292,242 | ||||||
| Integral Diagnostics Ltd. |
46,301 | 60,258 | ||||||
| Integrated Research Ltd. (a) |
28,972 | 7,100 | ||||||
| ioneer Ltd. (a) |
304,527 | 31,002 | ||||||
| IPH Ltd. |
62,534 | 272,489 | ||||||
| IRESS Ltd. |
52,976 | 293,122 | ||||||
| IVE Group Ltd. |
19,754 | 26,918 | ||||||
| JB Hi-Fi Ltd. |
5,852 | 211,089 | ||||||
| Johns Lyng Group Ltd. |
45,109 | 187,442 | ||||||
| Jumbo Interactive Ltd. |
12,118 | 114,753 | ||||||
| Jupiter Mines Ltd. |
439,415 | 49,279 | ||||||
| Karoon Energy Ltd. (a) |
216,834 | 299,472 | ||||||
| Kelsian Group Ltd. |
24,039 | 114,310 | ||||||
| Kogan.com Ltd. (a) |
16,956 | 60,328 | ||||||
| Lendlease Corp. Ltd. |
2,657 | 13,472 | ||||||
| Leo Lithium Ltd. (a) (b) (c) |
28,400 | 7,335 | ||||||
| Lifestyle Communities Ltd. |
20,891 | 258,340 | ||||||
| Link Administration Holdings Ltd. |
158,207 | 234,075 | ||||||
| Lovisa Holdings Ltd. |
13,735 | 227,816 | ||||||
| Lycopodium Ltd. |
6,179 | 49,279 | ||||||
| MA Financial Group Ltd. |
14,408 | 54,127 | ||||||
| Macmahon Holdings Ltd. |
380,170 | 47,935 | ||||||
| Macquarie Technology Group Ltd. (a) |
972 | 45,333 | ||||||
| Mader Group Ltd. |
3,508 | 16,314 | ||||||
| Magellan Financial Group Ltd. |
22,860 | 144,263 | ||||||
| Mayne Pharma Group Ltd. |
22,607 | 94,511 | ||||||
| McMillan Shakespeare Ltd. |
22,386 | 243,168 | ||||||
| McPherson’s Ltd. |
39,600 | 16,348 | ||||||
| Megaport Ltd. (a) |
15,193 | 94,715 | ||||||
| Mesoblast Ltd. (a) |
66,849 | 14,057 | ||||||
| Metals X Ltd. (a) |
147,577 | 29,132 | ||||||
| Metcash Ltd. |
152,970 | 363,370 | ||||||
| MMA Offshore Ltd. (a) |
78,350 | 99,525 | ||||||
| Monadelphous Group Ltd. |
32,335 | 326,168 | ||||||
| Monash IVF Group Ltd. |
52,109 | 46,182 | ||||||
| Morning Star Gold NL (a) (b) (c) |
33,455 | 0 | ||||||
| Mount Gibson Iron Ltd. (a) |
158,334 | 59,296 | ||||||
| Myer Holdings Ltd. |
234,884 | 95,625 | ||||||
| MyState Ltd. |
25,651 | 54,859 | ||||||
| Nanosonics Ltd. (a) |
62,508 | 186,575 | ||||||
| Navigator Global Investments Ltd. |
52,466 | 45,268 | ||||||
| Netwealth Group Ltd. |
28,212 | 294,919 | ||||||
| New Hope Corp. Ltd. |
120,389 | 423,271 | ||||||
| Newcrest Mining Ltd. (a) |
6,654 | 110,176 | ||||||
| nib holdings Ltd. |
121,489 | 610,464 | ||||||
| Nick Scali Ltd. |
21,771 | 182,441 | ||||||
| Nickel Industries Ltd. |
203,875 | 96,198 | ||||||
| Nine Entertainment Co. Holdings Ltd. |
208,760 | 286,623 | ||||||
| Novonix Ltd. (a) |
53,945 | 26,318 | ||||||
| NRW Holdings Ltd. |
134,771 | 272,572 | ||||||
| Nufarm Ltd. |
95,753 | 339,570 | ||||||
| Nuix Ltd. (a) |
8,673 | 11,176 | ||||||
| Objective Corp. Ltd. |
2,117 | 18,058 | ||||||
| Australia—(Continued) | ||||||||
| OceanaGold Corp. |
194,311 | 372,476 | ||||||
| OFX Group Ltd. (a) |
76,506 | 78,368 | ||||||
| Omni Bridgeway Ltd. (a) |
75,128 | 69,320 | ||||||
| oOh!media Ltd. |
130,777 | 147,209 | ||||||
| Orora Ltd. |
395,438 | 699,624 | ||||||
| Pacific Current Group Ltd. |
12,733 | 76,085 | ||||||
| Pacific Smiles Group Ltd. |
13,431 | 13,379 | ||||||
| Pact Group Holdings Ltd. (a) |
50,886 | 29,666 | ||||||
| Paladin Energy Ltd. (a) |
599,035 | 400,647 | ||||||
| Panoramic Resources Ltd. (a) (b) (c) |
278,314 | 6,638 | ||||||
| Pantoro Ltd. (a) |
210,078 | 8,155 | ||||||
| Peet Ltd. |
88,199 | 76,002 | ||||||
| PeopleIN Ltd. |
9,237 | 7,856 | ||||||
| Perenti Ltd. (a) |
204,417 | 144,677 | ||||||
| Perpetual Ltd. |
29,231 | 505,674 | ||||||
| Perseus Mining Ltd. |
340,886 | 431,598 | ||||||
| PEXA Group Ltd. (a) |
21,038 | 158,329 | ||||||
| Pinnacle Investment Management Group Ltd. |
20,949 | 143,213 | ||||||
| Platinum Asset Management Ltd. |
124,443 | 112,295 | ||||||
| PointsBet Holdings Ltd. |
9,123 | 5,711 | ||||||
| Poseidon Nickel Ltd. (a) |
238,025 | 1,942 | ||||||
| Praemium Ltd. (a) |
98,955 | 26,316 | ||||||
| Premier Investments Ltd. |
17,241 | 323,095 | ||||||
| Propel Funeral Partners Ltd. |
8,061 | 28,319 | ||||||
| PSC Insurance Group Ltd. |
21,994 | 69,938 | ||||||
| PWR Holdings Ltd. |
16,772 | 111,686 | ||||||
| QANTM Intellectual Property Ltd. |
14,173 | 9,147 | ||||||
| Qube Holdings Ltd. |
40,723 | 89,600 | ||||||
| Ramelius Resources Ltd. |
236,020 | 272,171 | ||||||
| Red 5 Ltd. (a) |
667,508 | 140,618 | ||||||
| Regis Healthcare Ltd. |
26,109 | 57,603 | ||||||
| Regis Resources Ltd. (a) |
214,118 | 319,269 | ||||||
| Reject Shop Ltd. |
12,421 | 46,056 | ||||||
| Resolute Mining Ltd. (a) |
677,338 | 205,946 | ||||||
| Retail Food Group Ltd. (a) |
218,228 | 10,426 | ||||||
| Ridley Corp. Ltd. |
96,057 | 179,584 | ||||||
| RPMGlobal Holdings Ltd. (a) |
32,785 | 39,050 | ||||||
| Sandfire Resources Ltd. (a) |
122,571 | 610,085 | ||||||
| Select Harvests Ltd. (a) |
34,996 | 69,033 | ||||||
| Servcorp Ltd. |
21,215 | 48,679 | ||||||
| Service Stream Ltd. |
154,571 | 98,986 | ||||||
| Seven West Media Ltd. (a) |
319,979 | 58,676 | ||||||
| SG Fleet Group Ltd. |
27,529 | 44,053 | ||||||
| Shaver Shop Group Ltd. |
18,090 | 13,468 | ||||||
| Sierra Rutile Holdings Ltd. (a) |
66,772 | 4,370 | ||||||
| Sigma Healthcare Ltd. |
498,984 | 341,579 | ||||||
| Silver Lake Resources Ltd. (a) |
202,549 | 164,861 | ||||||
| Silver Mines Ltd. (a) |
80,623 | 8,767 | ||||||
| SmartGroup Corp. Ltd. |
33,331 | 197,354 | ||||||
| SolGold PLC (a) |
36,239 | 4,390 | ||||||
| Solvar Ltd. |
54,558 | 48,983 | ||||||
| Southern Cross Media Group Ltd. |
76,997 | 51,992 | ||||||
| SRG Global Ltd. |
42,479 | 19,346 | ||||||
| St Barbara Ltd. (a) |
208,312 | 29,877 | ||||||
| Star Entertainment Group Ltd. (a) |
653,049 | 228,010 | ||||||
| Strandline Resources Ltd. (a) (b) (c) |
43,753 | 2,832 | ||||||
| Strike Energy Ltd. (a) |
245,153 | 79,992 | ||||||
See accompanying notes to financial statements.
BHFTII-5
Brighthouse Funds Trust II
Brighthouse/Dimensional International Small Company Portfolio
Schedule of Investments as of December 31, 2023
Common Stocks—(Continued)
| Security Description | Shares | Value | ||||||
| Australia—(Continued) | ||||||||
| Sunland Group Ltd. (a) (b) (c) |
40,150 | $ | 1,997 | |||||
| Super Retail Group Ltd. |
47,270 | 506,576 | ||||||
| Superloop Ltd. (a) |
59,252 | 27,009 | ||||||
| Symbio Holdings Ltd. |
4,332 | 8,766 | ||||||
| Syrah Resources Ltd. (a) |
163,680 | 71,676 | ||||||
| Tabcorp Holdings Ltd. |
406,397 | 230,773 | ||||||
| Technology One Ltd. |
36,580 | 381,947 | ||||||
| Temple & Webster Group Ltd. (a) |
14,313 | 84,593 | ||||||
| Ten Sixty Four Ltd. (a) (b) (c) |
60,972 | 8,725 | ||||||
| Terracom Ltd. |
54,002 | 15,445 | ||||||
| Tribune Resources Ltd. |
2,377 | 4,777 | ||||||
| Tyro Payments Ltd. (a) |
64,496 | 48,338 | ||||||
| Ventia Services Group Pty. Ltd. |
93,490 | 199,942 | ||||||
| Virgin Australia Holdings Pty. Ltd. (a) (b) (c) |
968,773 | 1 | ||||||
| Vista Group International Ltd. (a) |
33,201 | 34,573 | ||||||
| Viva Energy Group Ltd. |
217,302 | 515,206 | ||||||
| Vulcan Energy Resources Ltd. (a) |
9,635 | 18,664 | ||||||
| Webjet Ltd. (a) |
84,765 | 422,778 | ||||||
| West African Resources Ltd. (a) |
238,805 | 154,384 | ||||||
| Westgold Resources Ltd. (a) |
123,130 | 183,427 | ||||||
| Zip Co. Ltd. (a) |
40,088 | 17,209 | ||||||
|
|
|
|||||||
| 34,955,359 | ||||||||
|
|
|
|||||||
| Austria—1.5% | ||||||||
| A-TEC Industries AG (a) (b) (c) |
1 | 0 | ||||||
| Agrana Beteiligungs AG |
4,073 | 63,429 | ||||||
| ams-OSRAM AG (a) |
219,841 | 554,899 | ||||||
| ANDRITZ AG |
17,117 | 1,069,395 | ||||||
| AT&S Austria Technologie & Systemtechnik AG (d) |
5,424 | 157,866 | ||||||
| BAWAG Group AG |
19,071 | 1,012,906 | ||||||
| CA Immobilien Anlagen AG |
8,328 | 298,424 | ||||||
| DO & Co. AG |
2,066 | 306,648 | ||||||
| Eurotelesites AG (a) |
6,880 | 27,554 | ||||||
| EVN AG |
6,679 | 210,098 | ||||||
| FACC AG (a) |
6,291 | 40,494 | ||||||
| Kapsch TrafficCom AG (a) |
1,870 | 18,481 | ||||||
| Kontron AG |
14,178 | 336,543 | ||||||
| Lenzing AG (a) (d) |
4,153 | 162,980 | ||||||
| Mayr Melnhof Karton AG |
2,085 | 291,592 | ||||||
| Oesterreichische Post AG |
4,583 | 165,459 | ||||||
| Palfinger AG |
4,392 | 122,191 | ||||||
| POLYTEC Holding AG (d) |
6,228 | 24,113 | ||||||
| Porr Ag |
2,768 | 38,821 | ||||||
| Raiffeisen Bank International AG (d) |
21,261 | 438,450 | ||||||
| Rosenbauer International AG (a) (d) |
1,414 | 44,905 | ||||||
| Schoeller-Bleckmann Oilfield Equipment AG |
2,803 | 136,825 | ||||||
| Semperit AG Holding |
2,077 | 32,465 | ||||||
| Telekom Austria AG |
27,521 | 232,452 | ||||||
| UBM Development AG |
1,083 | 25,233 | ||||||
| UNIQA Insurance Group AG |
31,178 | 256,795 | ||||||
| Vienna Insurance Group AG Wiener Versicherung Gruppe |
7,619 | 222,669 | ||||||
| voestalpine AG |
25,493 | 804,205 | ||||||
| Wienerberger AG |
26,096 | 870,858 | ||||||
| Zumtobel Group AG (d) |
8,536 | 59,175 | ||||||
|
|
|
|||||||
| 8,025,925 | ||||||||
|
|
|
|||||||
| Belgium—1.7% | ||||||||
| Ackermans & van Haaren NV (d) |
5,779 | 1,014,737 | ||||||
| Ageas SA |
2,951 | 128,305 | ||||||
| AGFA-Gevaert NV (a) |
40,080 | 65,048 | ||||||
| Atenor (d) |
7,906 | 65,190 | ||||||
| Azelis Group NV |
3,464 | 84,922 | ||||||
| Barco NV |
19,609 | 359,031 | ||||||
| Bekaert SA |
9,919 | 509,537 | ||||||
| Biocartis Group NV (a) (b) (c) (d) |
16,240 | 5,199 | ||||||
| bpost SA |
18,928 | 97,518 | ||||||
| Cie d’Entreprises CFE |
2,249 | 18,955 | ||||||
| Colruyt Group NV |
11,650 | 525,590 | ||||||
| Deceuninck NV |
27,313 | 68,681 | ||||||
| Deme Group NV |
2,052 | 252,516 | ||||||
| Econocom Group SA |
24,064 | 68,329 | ||||||
| Euronav NV |
50,769 | 895,339 | ||||||
| EVS Broadcast Equipment SA |
3,873 | 123,340 | ||||||
| Fagron |
14,385 | 263,755 | ||||||
| Galapagos NV (a) |
9,086 | 369,935 | ||||||
| Gimv NV |
5,220 | 255,254 | ||||||
| Greenyard NV |
5,819 | 38,288 | ||||||
| Immobel SA (d) |
1,276 | 41,968 | ||||||
| Ion Beam Applications (d) |
6,507 | 82,926 | ||||||
| Jensen-Group NV |
1,035 | 38,023 | ||||||
| Kinepolis Group NV (d) |
3,776 | 186,965 | ||||||
| Lotus Bakeries NV |
92 | 835,785 | ||||||
| MDxHealth SA (a) (d) |
843 | 3,321 | ||||||
| Melexis NV |
5,164 | 521,985 | ||||||
| Mithra Pharmaceuticals SA (a) (d) |
506 | 701 | ||||||
| Ontex Group NV (a) (d) |
16,729 | 140,434 | ||||||
| Orange Belgium SA (a) |
4,348 | 64,916 | ||||||
| Proximus SADP |
28,286 | 265,865 | ||||||
| Recticel SA |
11,526 | 134,911 | ||||||
| Roularta Media Group NV |
1,629 | 22,834 | ||||||
| Shurgard Self Storage Ltd. |
443 | 21,998 | ||||||
| Sipef NV |
1,593 | 93,204 | ||||||
| Solvay SA |
5,063 | 155,042 | ||||||
| Tessenderlo Group SA |
5,859 | 182,777 | ||||||
| Umicore SA (d) |
13,893 | 381,828 | ||||||
| Van de Velde NV |
1,970 | 73,392 | ||||||
| VGP NV |
1,667 | 192,934 | ||||||
| Viohalco SA |
22,715 | 132,764 | ||||||
| What’s Cooking BV |
153 | 11,215 | ||||||
| X-Fab Silicon Foundries SE (a) |
14,349 | 161,630 | ||||||
|
|
|
|||||||
| 8,956,887 | ||||||||
|
|
|
|||||||
| Cambodia—0.0% | ||||||||
| NagaCorp Ltd. (a) |
254,719 | 100,074 | ||||||
|
|
|
|||||||
| Canada—10.9% | ||||||||
| 5N Plus, Inc. (a) |
33,732 | 96,228 | ||||||
| Acadian Timber Corp. |
3,800 | 49,183 | ||||||
| Advantage Energy Ltd. (a) (d) |
47,525 | 305,942 | ||||||
| Aecon Group, Inc. |
17,346 | 171,097 | ||||||
| Africa Oil Corp. |
57,099 | 107,299 | ||||||
| Ag Growth International, Inc. (d) |
5,820 | 221,898 | ||||||
| AGF Management Ltd. - Class B |
16,613 | 96,665 | ||||||
See accompanying notes to financial statements.
BHFTII-6
Brighthouse Funds Trust II
Brighthouse/Dimensional International Small Company Portfolio
Schedule of Investments as of December 31, 2023
Common Stocks—(Continued)
| Security Description | Shares | Value | ||||||
| Canada—(Continued) | ||||||||
| Aimia, Inc. (a) |
24,635 | $ | 58,192 | |||||
| AirBoss of America Corp. |
3,761 | 13,880 | ||||||
| Alamos Gold, Inc. - Class A |
82,437 | 1,108,658 | ||||||
| Alaris Equity Partners Income |
5,355 | 65,834 | ||||||
| Algoma Central Corp. (d) |
4,710 | 53,141 | ||||||
| Altius Minerals Corp. (d) |
12,660 | 176,182 | ||||||
| Altus Group Ltd. (d) |
11,988 | 381,249 | ||||||
| Americas Gold & Silver Corp. (a) |
4,400 | 1,096 | ||||||
| Amerigo Resources Ltd. |
35,000 | 36,716 | ||||||
| Andlauer Healthcare Group, Inc. |
2,269 | 70,174 | ||||||
| Andrew Peller Ltd. - Class A (d) |
11,417 | 39,721 | ||||||
| Aritzia, Inc. (a) (d) |
24,317 | 504,673 | ||||||
| Ascot Resources Ltd. (a) |
16,500 | 6,102 | ||||||
| Atco Ltd. - Class I (d) |
19,446 | 567,508 | ||||||
| Athabasca Oil Corp. (a) (d) |
144,824 | 455,769 | ||||||
| ATS Corp. (a) (d) |
20,733 | 893,598 | ||||||
| Aurora Cannabis, Inc. (a) |
8,729 | 4,157 | ||||||
| AutoCanada, Inc. (a) |
6,228 | 107,635 | ||||||
| B2Gold Corp. |
292,601 | 924,769 | ||||||
| Badger Infrastructure Solution (d) |
9,962 | 306,066 | ||||||
| Ballard Power Systems, Inc. (a) (d) |
37,678 | 139,409 | ||||||
| Baytex Energy Corp. (d) |
123,447 | 408,058 | ||||||
| Birchcliff Energy Ltd. (d) |
68,088 | 297,007 | ||||||
| Bird Construction, Inc. |
18,612 | 202,266 | ||||||
| Black Diamond Group Ltd. |
19,812 | 122,157 | ||||||
| BlackBerry Ltd. (a) (d) |
74,728 | 264,537 | ||||||
| BMTC Group, Inc. |
5,387 | 50,738 | ||||||
| Bombardier, Inc. - Class A (a) |
584 | 23,549 | ||||||
| Bombardier, Inc. - Class B (a) (d) |
21,454 | 861,528 | ||||||
| Boralex, Inc. - Class A (d) |
25,118 | 638,447 | ||||||
| Boyd Group Services, Inc. (d) |
5,283 | 1,110,345 | ||||||
| Bridgemarq Real Estate Services (d) |
3,500 | 34,787 | ||||||
| Brookfield Infrastructure Corp. - Class A |
3,980 | 140,391 | ||||||
| Calian Group Ltd. |
2,846 | 123,050 | ||||||
| Canaccord Genuity Group, Inc. |
27,412 | 157,225 | ||||||
| Canada Goose Holdings, Inc. (a) (d) |
14,525 | 172,262 | ||||||
| Canadian Western Bank (d) |
24,440 | 569,384 | ||||||
| Canfor Corp. (a) |
15,511 | 208,952 | ||||||
| Canfor Pulp Products, Inc. (a) |
11,097 | 15,075 | ||||||
| Capital Power Corp. (d) |
31,332 | 894,761 | ||||||
| Capstone Copper Corp. (a) |
122,839 | 597,948 | ||||||
| Cardinal Energy Ltd. (d) |
32,459 | 153,838 | ||||||
| Cascades, Inc. |
20,426 | 196,236 | ||||||
| Celestica, Inc. (a) (d) |
29,280 | 857,580 | ||||||
| Centerra Gold, Inc. |
50,985 | 304,359 | ||||||
| CES Energy Solutions Corp. |
73,142 | 190,438 | ||||||
| CI Financial Corp. |
47,012 | 527,224 | ||||||
| Cineplex, Inc. (a) |
6,558 | 41,425 | ||||||
| Clairvest Group, Inc. |
200 | 11,509 | ||||||
| Cogeco Communications, Inc. |
3,980 | 178,267 | ||||||
| Cogeco, Inc. |
1,609 | 69,421 | ||||||
| Colliers International Group, Inc. (d) |
5,004 | 633,066 | ||||||
| Computer Modelling Group Ltd. |
28,920 | 221,093 | ||||||
| Converge Technology Solutions Corp. |
3,570 | 11,154 | ||||||
| Corby Spirit & Wine Ltd. |
3,957 | 39,031 | ||||||
| Corus Entertainment, Inc. - B Shares |
61,870 | 33,152 | ||||||
| Crescent Point Energy Corp. (d) |
149,673 | 1,037,734 | ||||||
| Canada—(Continued) | ||||||||
| Crew Energy, Inc. (a) (d) |
41,970 | 143,801 | ||||||
| Cronos Group, Inc. (a) |
15,221 | 31,812 | ||||||
| Definity Financial Corp. |
8,090 | 229,198 | ||||||
| Denison Mines Corp. (a) |
181,271 | 317,383 | ||||||
| Dexterra Group, Inc. |
11,442 | 49,738 | ||||||
| Doman Building Materials Group Ltd. (d) |
19,304 | 120,773 | ||||||
| Dorel Industries, Inc. - Class B (a) |
8,626 | 40,687 | ||||||
| DREAM Unlimited Corp. - Class A (d) |
6,072 | 103,793 | ||||||
| Dundee Precious Metals, Inc. |
45,872 | 293,570 | ||||||
| Dye & Durham Ltd. |
3,429 | 37,161 | ||||||
| E-L Financial Corp. Ltd. |
677 | 535,561 | ||||||
| ECN Capital Corp. |
39,318 | 89,019 | ||||||
| Eldorado Gold Corp. (a) (d) |
51,016 | 662,220 | ||||||
| Endeavour Silver Corp. (a) |
34,348 | 67,397 | ||||||
| Enerflex Ltd. |
29,289 | 135,498 | ||||||
| Enerplus Corp. (d) |
60,454 | 926,674 | ||||||
| Enghouse Systems Ltd. |
12,678 | 335,835 | ||||||
| Ensign Energy Services, Inc. (a) |
39,626 | 64,894 | ||||||
| EQB, Inc. (d) |
8,098 | 533,103 | ||||||
| Equinox Gold Corp. (a) |
56,499 | 275,427 | ||||||
| ERO Copper Corp. (a) (d) |
13,490 | 213,287 | ||||||
| Evertz Technologies Ltd. (d) |
8,149 | 85,669 | ||||||
| Exchange Income Corp. |
5,351 | 182,129 | ||||||
| Exco Technologies Ltd. |
7,732 | 45,982 | ||||||
| Extendicare, Inc. (d) |
23,362 | 128,354 | ||||||
| Fiera Capital Corp. |
22,157 | 101,835 | ||||||
| Finning International, Inc. |
38,632 | 1,117,224 | ||||||
| Firm Capital Mortgage Investment Corp. (d) |
9,574 | 78,323 | ||||||
| First Majestic Silver Corp. (d) |
54,590 | 335,079 | ||||||
| First Mining Gold Corp. (a) (d) |
50,000 | 5,094 | ||||||
| First National Financial Corp. |
4,907 | 142,131 | ||||||
| Fission Uranium Corp. (a) |
114,725 | 93,508 | ||||||
| Fortuna Silver Mines, Inc. (a) |
79,418 | 305,673 | ||||||
| Freehold Royalties Ltd. (d) |
35,012 | 361,733 | ||||||
| Galiano Gold, Inc. (a) |
23,027 | 21,375 | ||||||
| Gamehost, Inc. |
4,952 | 35,429 | ||||||
| GDI Integrated Facility Services, Inc. (a) |
3,200 | 88,341 | ||||||
| Gibson Energy, Inc. (d) |
40,325 | 612,613 | ||||||
| goeasy Ltd. (d) |
3,895 | 464,619 | ||||||
| GoGold Resources, Inc. (a) |
28,473 | 29,009 | ||||||
| GoldMoney, Inc. (a) (d) |
2,199 | 12,961 | ||||||
| Guardian Capital Group Ltd. - Class A |
5,200 | 173,693 | ||||||
| Hanfeng Evergreen, Inc. (a) (b) (c) |
12,100 | 0 | ||||||
| Headwater Exploration, Inc. (d) |
48,021 | 226,506 | ||||||
| Heroux-Devtek, Inc. (a) |
9,253 | 106,144 | ||||||
| High Liner Foods, Inc. (d) |
6,007 | 53,585 | ||||||
| HudBay Minerals, Inc. (d) |
84,922 | 467,214 | ||||||
| IAMGOLD Corp. (a) |
118,555 | 298,837 | ||||||
| Imperial Metals Corp. (a) (d) |
19,966 | 32,848 | ||||||
| Information Services Corp. |
2,900 | 48,543 | ||||||
| Innergex Renewable Energy, Inc. |
35,108 | 243,495 | ||||||
| InPlay Oil Corp. |
5,900 | 9,840 | ||||||
| Interfor Corp. (a) |
13,232 | 234,472 | ||||||
| International Petroleum Corp. (a) |
17,308 | 207,818 | ||||||
| International Tower Hill Mines Ltd. (a) |
21,604 | 12,554 | ||||||
| Jamieson Wellness, Inc. (d) |
12,357 | 295,904 | ||||||
| Journey Energy, Inc. (a) |
100 | 291 | ||||||
See accompanying notes to financial statements.
BHFTII-7
Brighthouse Funds Trust II
Brighthouse/Dimensional International Small Company Portfolio
Schedule of Investments as of December 31, 2023
Common Stocks—(Continued)
| Security Description | Shares | Value | ||||||
| Canada—(Continued) | ||||||||
| K-Bro Linen, Inc. (d) |
3,219 | $ | 80,168 | |||||
| K92 Mining, Inc. (a) |
27,548 | 135,344 | ||||||
| Karora Resources, Inc. (a) |
28,791 | 105,817 | ||||||
| Kelt Exploration Ltd. (a) |
46,751 | 201,816 | ||||||
| Kinaxis, Inc. (a) |
719 | 80,693 | ||||||
| Knight Therapeutics, Inc. (a) |
23,952 | 93,816 | ||||||
| KP Tissue, Inc. |
1,400 | 9,530 | ||||||
| Labrador Iron Ore Royalty Corp. (d) |
16,600 | 399,638 | ||||||
| Largo, Inc. (a) (d) |
8,317 | 19,144 | ||||||
| Lassonde Industries, Inc. - Class A |
900 | 95,261 | ||||||
| Laurentian Bank of Canada (d) |
11,504 | 241,966 | ||||||
| Leon’s Furniture Ltd. |
7,239 | 99,212 | ||||||
| Lightspeed Commerce, Inc. (a) |
32,213 | 676,151 | ||||||
| Lightstream Resources Ltd. (a) (b) (c) |
108,373 | 0 | ||||||
| Linamar Corp. |
10,944 | 528,761 | ||||||
| Logan Energy Corp. (a) (d) |
8,450 | 5,102 | ||||||
| Logistec Corp. - Class B |
600 | 30,338 | ||||||
| Lucara Diamond Corp. (a) |
110,136 | 32,001 | ||||||
| Lundin Gold, Inc. |
11,400 | 142,301 | ||||||
| MAG Silver Corp. (a) |
7,165 | 74,588 | ||||||
| Magellan Aerospace Corp. |
5,794 | 34,325 | ||||||
| Mainstreet Equity Corp. (a) (d) |
1,561 | 172,022 | ||||||
| Major Drilling Group International, Inc. (a) |
22,977 | 159,706 | ||||||
| Manitok Energy, Inc. (a) (b) (c) |
122 | 0 | ||||||
| Maple Leaf Foods, Inc. |
21,240 | 404,587 | ||||||
| Martinrea International, Inc. |
19,001 | 205,633 | ||||||
| Maxim Power Corp. (a) |
2,800 | 9,467 | ||||||
| MDF Commerce, Inc. (a) (d) |
4,176 | 13,111 | ||||||
| Medical Facilities Corp. |
9,161 | 62,085 | ||||||
| MEG Energy Corp. (a) |
48,740 | 870,666 | ||||||
| Melcor Developments Ltd. |
3,120 | 26,513 | ||||||
| Methanex Corp. |
15,340 | 726,429 | ||||||
| Morguard Corp. |
1,400 | 111,975 | ||||||
| MTY Food Group, Inc. (d) |
5,720 | 243,943 | ||||||
| Mullen Group Ltd. |
23,154 | 245,336 | ||||||
| Neo Performance Materials, Inc. |
4,300 | 24,761 | ||||||
| New Gold, Inc. (a) |
172,247 | 249,586 | ||||||
| NFI Group, Inc. (a) (d) |
13,975 | 144,385 | ||||||
| North American Construction Group Ltd. |
8,546 | 178,331 | ||||||
| North West Co., Inc. (d) |
13,971 | 414,053 | ||||||
| Nuvei Corp. |
5,221 | 137,103 | ||||||
| NuVista Energy Ltd. (a) (d) |
44,817 | 373,405 | ||||||
| Obsidian Energy Ltd. (a) |
5,354 | 36,300 | ||||||
| Onex Corp. (d) |
6,456 | 450,831 | ||||||
| Organigram Holdings, Inc. (a) |
9,249 | 12,116 | ||||||
| Orla Mining Ltd. (a) (d) |
25,466 | 82,764 | ||||||
| Osisko Gold Royalties Ltd. |
42,731 | 609,866 | ||||||
| Osisko Mining, Inc. (a) |
54,809 | 110,441 | ||||||
| Paramount Resources Ltd. - Class A |
20,590 | 402,927 | ||||||
| Parex Resources, Inc. |
28,559 | 537,751 | ||||||
| Park Lawn Corp. |
8,256 | 122,994 | ||||||
| Parkland Corp. |
37,412 | 1,205,891 | ||||||
| Pason Systems, Inc. |
24,116 | 294,295 | ||||||
| Peyto Exploration & Development Corp. (d) |
48,991 | 445,154 | ||||||
| PHX Energy Services Corp. |
12,350 | 75,495 | ||||||
| Pizza Pizza Royalty Corp. (d) |
6,998 | 77,741 | ||||||
| Polaris Renewable Energy, Inc. |
5,300 | 52,918 | ||||||
| Canada—(Continued) | ||||||||
| Pollard Banknote Ltd. (d) |
2,690 | 65,024 | ||||||
| PrairieSky Royalty Ltd. (d) |
56,452 | 988,405 | ||||||
| Precision Drilling Corp. (a) |
3,394 | 184,319 | ||||||
| Premium Brands Holdings Corp. (d) |
11,855 | 841,271 | ||||||
| Primo Water Corp. |
42,105 | 634,252 | ||||||
| Pulse Seismic, Inc. (d) |
13,500 | 18,950 | ||||||
| Quarterhill, Inc. (d) |
37,345 | 54,958 | ||||||
| Questerre Energy Corp. - Class A (a) (d) |
83,569 | 11,352 | ||||||
| Real Matters, Inc. (a) |
16,705 | 79,425 | ||||||
| RF Capital Group, Inc. (a) (d) |
1,730 | 9,818 | ||||||
| Richelieu Hardware Ltd. (d) |
14,790 | 535,545 | ||||||
| Rogers Sugar, Inc. (d) |
32,139 | 130,492 | ||||||
| Russel Metals, Inc. |
18,222 | 619,250 | ||||||
| Savaria Corp. |
10,600 | 121,355 | ||||||
| Seabridge Gold, Inc. (a) |
12,210 | 148,107 | ||||||
| Secure Energy Services, Inc. |
69,364 | 493,644 | ||||||
| Shawcor Ltd. (a) |
21,791 | 249,313 | ||||||
| Sienna Senior Living, Inc. (d) |
22,176 | 192,296 | ||||||
| SilverCrest Metals, Inc. (a) |
11,918 | 78,129 | ||||||
| Sleep Country Canada Holdings, Inc. |
10,704 | 206,882 | ||||||
| SNC-Lavalin Group, Inc. |
41,913 | 1,349,390 | ||||||
| SNDL, Inc. (a) |
11,204 | 18,375 | ||||||
| Spartan Delta Corp. (d) |
16,736 | 37,639 | ||||||
| Spin Master Corp. |
8,748 | 230,146 | ||||||
| Sprott, Inc. (d) |
6,042 | 204,645 | ||||||
| SSR Mining, Inc. |
49,993 | 536,508 | ||||||
| Stelco Holdings, Inc. |
9,844 | 372,869 | ||||||
| Stella-Jones, Inc. |
16,794 | 977,437 | ||||||
| Steppe Gold Ltd. (a) |
6,300 | 3,566 | ||||||
| StorageVault Canada, Inc. |
9,319 | 36,782 | ||||||
| SunOpta, Inc. (a) (d) |
15,592 | 85,076 | ||||||
| Superior Plus Corp. |
46,786 | 340,024 | ||||||
| Surge Energy, Inc. (d) |
12,100 | 59,174 | ||||||
| Tamarack Valley Energy Ltd. (d) |
85,898 | 199,017 | ||||||
| Taseko Mines Ltd. (a) (d) |
93,786 | 131,649 | ||||||
| TECSYS, Inc. |
172 | 4,259 | ||||||
| TerraVest Industries, Inc. (d) |
1,600 | 53,432 | ||||||
| Tidewater Midstream & Infrastructure Ltd. (d) |
79,200 | 63,358 | ||||||
| Timbercreek Financial Corp. (d) |
21,651 | 108,986 | ||||||
| Topaz Energy Corp. |
7,015 | 102,600 | ||||||
| Torex Gold Resources, Inc. (a) |
22,294 | 245,982 | ||||||
| Total Energy Services, Inc. |
11,886 | 67,815 | ||||||
| TransAlta Corp. |
61,878 | 514,619 | ||||||
| Transcontinental, Inc. - Class A |
19,220 | 198,720 | ||||||
| Trevali Mining Corp. (a) (b) (c) |
9,060 | 0 | ||||||
| Trican Well Service Ltd. (d) |
66,213 | 205,877 | ||||||
| Tricon Residential, Inc. (d) |
63,428 | 577,293 | ||||||
| Triple Flag Precious Metals Corp. |
3,866 | 51,459 | ||||||
| Trisura Group Ltd. (a) |
10,823 | 277,712 | ||||||
| Vecima Networks, Inc. |
2,500 | 30,848 | ||||||
| Vermilion Energy, Inc. (d) |
40,554 | 488,827 | ||||||
| VersaBank (d) |
2,000 | 21,946 | ||||||
| Wajax Corp. |
7,185 | 164,137 | ||||||
| Well Health Technologies Corp. (a) (d) |
8,517 | 24,747 | ||||||
| Wesdome Gold Mines Ltd. (a) (d) |
43,307 | 251,988 | ||||||
| Western Forest Products, Inc. |
105,262 | 56,402 | ||||||
| Westshore Terminals Investment Corp. (d) |
13,051 | 270,072 | ||||||
See accompanying notes to financial statements.
BHFTII-8
Brighthouse Funds Trust II
Brighthouse/Dimensional International Small Company Portfolio
Schedule of Investments as of December 31, 2023
Common Stocks—(Continued)
| Security Description | Shares | Value | ||||||
| Canada—(Continued) | ||||||||
| Whitecap Resources, Inc. (d) |
80,158 | $ | 536,585 | |||||
| WildBrain Ltd. (a) (d) |
28,340 | 23,313 | ||||||
| Winpak Ltd. |
8,452 | 260,886 | ||||||
| Yellow Pages Ltd. (d) |
3,727 | 31,699 | ||||||
| Zenith Capital Corp. (a) (b) (c) |
12,830 | 1,540 | ||||||
|
|
|
|||||||
| 57,483,230 | ||||||||
|
|
|
|||||||
| China—0.2% | ||||||||
| AustAsia Group Ltd. (a) |
19,734 | 4,699 | ||||||
| Bund Center Investment Ltd. |
107,700 | 33,459 | ||||||
| China Gold International Resources Corp. Ltd. |
79,013 | 332,736 | ||||||
| China Sunsine Chemical Holdings Ltd. |
70,000 | 20,936 | ||||||
| CITIC Telecom International Holdings Ltd. |
438,000 | 184,362 | ||||||
| First Sponsor Group Ltd. |
9,490 | 8,773 | ||||||
| Fountain SET Holdings Ltd. (a) |
280,000 | 13,969 | ||||||
| Guotai Junan International Holdings Ltd. |
806,600 | 61,870 | ||||||
| KRP Development Holdings Ltd. |
35,000 | 4,030 | ||||||
| Neo-Neon Holdings Ltd. (a) |
322,500 | 17,346 | ||||||
| SITC International Holdings Co. Ltd. |
165,000 | 284,454 | ||||||
| Theme International Holdings Ltd. (a) |
170,000 | 10,518 | ||||||
| TI Fluid Systems PLC |
28,317 | 55,350 | ||||||
|
|
|
|||||||
| 1,032,502 | ||||||||
|
|
|
|||||||
| Colombia—0.0% | ||||||||
| Canacol Energy Ltd. (d) |
7,932 | 41,664 | ||||||
| Frontera Energy Corp. (a) |
10,147 | 61,033 | ||||||
| Gran Tierra Energy, Inc. (a) (d) |
11,221 | 63,004 | ||||||
|
|
|
|||||||
| 165,701 | ||||||||
|
|
|
|||||||
| Denmark—2.5% | ||||||||
| ALK-Abello AS (a) (d) |
35,460 | 531,236 | ||||||
| Alm Brand AS |
214,470 | 379,916 | ||||||
| Ambu AS - Class B (a) (d) |
25,326 | 394,457 | ||||||
| Bang & Olufsen AS (a) |
30,627 | 43,724 | ||||||
| Bavarian Nordic AS (a) |
19,123 | 504,307 | ||||||
| Better Collective AS (a) (d) |
4,469 | 113,695 | ||||||
| cBrain AS |
939 | 37,407 | ||||||
| Chemometec AS (d) |
3,943 | 228,049 | ||||||
| Columbus AS |
20,865 | 21,938 | ||||||
| D/S Norden AS |
5,677 | 269,872 | ||||||
| Dfds AS |
9,415 | 310,873 | ||||||
| FLSmidth & Co. AS |
12,789 | 543,741 | ||||||
| GN Store Nord AS (a) |
19,401 | 493,278 | ||||||
| H Lundbeck AS |
44,313 | 215,277 | ||||||
| H Lundbeck AS - A Shares |
2,530 | 10,756 | ||||||
| H+H International AS - Class B (a) |
4,441 | 58,402 | ||||||
| Harboes Bryggeri AS - Class B (a) |
1,454 | 14,730 | ||||||
| ISS AS |
36,366 | 694,211 | ||||||
| Jeudan AS |
2,360 | 80,007 | ||||||
| Jyske Bank AS |
11,298 | 809,230 | ||||||
| Matas AS |
9,436 | 161,253 | ||||||
| Netcompany Group AS (a) |
7,774 | 259,664 | ||||||
| Nilfisk Holding AS (a) |
3,340 | 58,450 | ||||||
| NKT AS (a) |
13,077 | 897,932 | ||||||
| NNIT AS (a) |
2,656 | 33,073 | ||||||
| Denmark—(Continued) | ||||||||
| North Media AS (d) |
679 | 6,537 | ||||||
| NTG Nordic Transport Group AS - Class A (a) |
2,118 | 92,188 | ||||||
| Parken Sport & Entertainment AS |
2,351 | 46,656 | ||||||
| Per Aarsleff Holding AS |
5,304 | 253,275 | ||||||
| Ringkjoebing Landbobank AS |
6,894 | 1,012,042 | ||||||
| Rockwool AS - A Shares |
216 | 63,223 | ||||||
| Rockwool AS - B Shares |
1,328 | 388,493 | ||||||
| Royal Unibrew AS |
13,170 | 879,432 | ||||||
| RTX AS (a) (d) |
2,486 | 25,402 | ||||||
| Scandinavian Tobacco Group AS - Class A |
14,284 | 248,126 | ||||||
| Schouw & Co. AS |
3,487 | 285,556 | ||||||
| Solar AS - B Shares |
1,534 | 105,611 | ||||||
| SP Group AS |
716 | 23,168 | ||||||
| Spar Nord Bank AS |
20,052 | 316,433 | ||||||
| Sparekassen Sjaelland-Fyn AS |
1,358 | 40,251 | ||||||
| Sydbank AS |
16,079 | 700,723 | ||||||
| TCM Group AS (a) |
502 | 3,382 | ||||||
| Tivoli AS (d) |
844 | 87,975 | ||||||
| Topdanmark AS |
11,821 | 564,344 | ||||||
| UIE PLC |
6,060 | 168,718 | ||||||
| Vestjysk Bank AS (d) |
23,730 | 13,691 | ||||||
| Zealand Pharma AS (a) |
8,958 | 495,100 | ||||||
|
|
|
|||||||
| 12,985,804 | ||||||||
|
|
|
|||||||
| Faeroe Islands—0.0% | ||||||||
| BankNordik P |
1,109 | 27,013 | ||||||
|
|
|
|||||||
| Finland—2.1% | ||||||||
| Aktia Bank OYJ |
11,350 | 118,019 | ||||||
| Alma Media OYJ |
10,487 | 111,412 | ||||||
| Anora Group OYJ |
1,398 | 6,730 | ||||||
| Apetit OYJ |
1,205 | 17,492 | ||||||
| Aspo OYJ |
7,386 | 48,745 | ||||||
| Atria OYJ |
3,290 | 37,988 | ||||||
| Bittium OYJ (d) |
8,034 | 42,685 | ||||||
| Cargotec OYJ - B Shares |
8,074 | 469,913 | ||||||
| Citycon OYJ (d) |
21,486 | 123,408 | ||||||
| Digia OYJ |
6,625 | 39,461 | ||||||
| Enento Group OYJ |
3,892 | 83,725 | ||||||
| eQ OYJ |
382 | 6,595 | ||||||
| F-Secure OYJ |
26,373 | 59,270 | ||||||
| Finnair OYJ (a) |
3,944,116 | 174,047 | ||||||
| Fiskars OYJ Abp |
6,971 | 137,441 | ||||||
| Harvia OYJ (d) |
2,955 | 88,778 | ||||||
| HKScan OYJ - A Shares (a) |
6,704 | 6,164 | ||||||
| Huhtamaki OYJ |
22,314 | 904,929 | ||||||
| Ilkka OYJ |
5,725 | 20,231 | ||||||
| Kamux Corp. |
4,328 | 26,786 | ||||||
| Kemira OYJ |
27,235 | 504,619 | ||||||
| Kesko OYJ - A Shares |
1,003 | 19,954 | ||||||
| Kesko OYJ - B Shares |
19,522 | 386,895 | ||||||
| Kojamo OYJ |
26,601 | 353,209 | ||||||
| Konecranes OYJ |
15,630 | 704,097 | ||||||
| Lassila & Tikanoja OYJ |
8,464 | 91,544 | ||||||
| Marimekko OYJ |
1,890 | 27,766 | ||||||
| Metsa Board OYJ - Class B (d) |
33,424 | 265,375 | ||||||
See accompanying notes to financial statements.
BHFTII-9
Brighthouse Funds Trust II
Brighthouse/Dimensional International Small Company Portfolio
Schedule of Investments as of December 31, 2023
Common Stocks—(Continued)
| Security Description | Shares | Value | ||||||
| Finland—(Continued) | ||||||||
| Musti Group OYJ |
5,196 | $ | 149,939 | |||||
| Nokian Renkaat OYJ |
28,967 | 264,252 | ||||||
| Olvi OYJ - A Shares |
4,019 | 124,452 | ||||||
| Oriola OYJ |
4,196 | 5,192 | ||||||
| Oriola OYJ - B Shares |
32,135 | 38,765 | ||||||
| Orion OYJ - Class A |
7,027 | 304,110 | ||||||
| Orion OYJ - Class B |
14,294 | 619,771 | ||||||
| Outokumpu OYJ |
83,940 | 413,825 | ||||||
| Ponsse OYJ |
3,208 | 80,126 | ||||||
| QT Group OYJ (a) |
2,738 | 195,148 | ||||||
| Raisio OYJ - V Shares |
35,039 | 76,473 | ||||||
| Rapala VMC OYJ |
8,902 | 29,524 | ||||||
| Revenio Group OYJ |
5,309 | 159,212 | ||||||
| Sanoma OYJ |
20,268 | 155,437 | ||||||
| Stockmann OYJ Abp - B Shares (a) |
3,752 | 12,033 | ||||||
| Talenom OYJ (d) |
2,085 | 14,268 | ||||||
| Teleste OYJ (a) |
2,149 | 6,405 | ||||||
| Terveystalo OYJ |
14,772 | 126,252 | ||||||
| TietoEVRY OYJ |
21,451 | 511,056 | ||||||
| Tokmanni Group Corp. |
13,877 | 224,073 | ||||||
| Vaisala OYJ - A Shares |
5,454 | 239,291 | ||||||
| Valmet OYJ (d) |
33,362 | 962,434 | ||||||
| Wartsila OYJ Abp |
93,038 | 1,355,200 | ||||||
| WithSecure OYJ (a) |
26,373 | 30,185 | ||||||
| YIT OYJ |
27,133 | 59,456 | ||||||
|
|
|
|||||||
| 11,034,157 | ||||||||
|
|
|
|||||||
| France—4.8% | ||||||||
| ABC arbitrage |
2,865 | 15,219 | ||||||
| AKWEL SADIR |
2,629 | 46,889 | ||||||
| ALD SA |
29,256 | 208,818 | ||||||
| Altamir (d) |
7,426 | 195,246 | ||||||
| Alten SA |
6,873 | 1,026,943 | ||||||
| Arkema SA |
3,897 | 443,293 | ||||||
| Assystem SA (d) |
1,779 | 97,209 | ||||||
| Atos SE (a) (d) |
18,990 | 148,875 | ||||||
| Aubay |
803 | 36,983 | ||||||
| Axway Software SA |
2,132 | 62,020 | ||||||
| Bastide le Confort Medical (a) |
938 | 27,752 | ||||||
| Beneteau SACA |
11,313 | 156,092 | ||||||
| Bigben Interactive (a) (d) |
4,507 | 17,220 | ||||||
| Boiron SA |
1,382 | 61,386 | ||||||
| Bonduelle SCA |
4,120 | 49,769 | ||||||
| Catana Group |
2,793 | 17,718 | ||||||
| CBo Territoria |
2,864 | 11,573 | ||||||
| Cegedim SA (a) |
2,295 | 45,279 | ||||||
| CGG SA (a) |
189,243 | 125,304 | ||||||
| Chargeurs SA (d) |
5,575 | 71,926 | ||||||
| Cie des Alpes |
6,924 | 108,058 | ||||||
| Cie Plastic Omnium SE |
15,132 | 201,591 | ||||||
| Clariane SE (d) |
19,303 | 51,242 | ||||||
| Coface SA |
31,535 | 412,816 | ||||||
| Derichebourg SA |
22,712 | 128,096 | ||||||
| Ekinops SAS (a) (d) |
1,670 | 10,864 | ||||||
| Electricite de Strasbourg SA |
329 | 36,093 | ||||||
| Elior Group SA (a) (d) |
29,385 | 95,283 | ||||||
| France—(Continued) | ||||||||
| Elis SA |
50,853 | 1,063,964 | ||||||
| Equasens |
582 | 39,410 | ||||||
| Eramet SA |
2,619 | 207,705 | ||||||
| Esso SA Francaise |
753 | 45,656 | ||||||
| Etablissements Maurel et Prom SA |
12,067 | 81,162 | ||||||
| Eurazeo SE |
9,383 | 746,058 | ||||||
| Eutelsat Communications SACA (a) (d) |
47,150 | 221,738 | ||||||
| Exel Industries SA - A Shares |
618 | 36,818 | ||||||
| Fnac Darty SA (d) |
3,765 | 114,518 | ||||||
| Foraco International SA (a) |
17,535 | 27,129 | ||||||
| Forvia SE (a) |
34,097 | 774,685 | ||||||
| Gaztransport Et Technigaz SA |
6,342 | 840,211 | ||||||
| GEA (d) |
165 | 18,211 | ||||||
| GL Events SACA |
3,124 | 67,677 | ||||||
| Groupe Crit SA |
1,062 | 92,150 | ||||||
| Guerbet (d) |
1,201 | 25,865 | ||||||
| Guillemot Corp. |
770 | 5,774 | ||||||
| Haulotte Group SA (a) (d) |
5,337 | 14,902 | ||||||
| ID Logistics Group SACA (a) |
796 | 269,110 | ||||||
| Imerys SA |
7,588 | 238,664 | ||||||
| Infotel SA |
342 | 20,017 | ||||||
| Interparfums SA |
742 | 41,477 | ||||||
| IPSOS SA |
12,147 | 763,595 | ||||||
| Jacquet Metals SACA |
2,954 | 64,048 | ||||||
| JCDecaux SE (a) |
13,978 | 281,444 | ||||||
| Kaufman & Broad SA |
3,970 | 132,451 | ||||||
| La Francaise De L’energie SACA (a) (d) |
252 | 14,248 | ||||||
| La Francaise des Jeux SAEM |
12,793 | 464,390 | ||||||
| Laurent-Perrier |
1,255 | 167,683 | ||||||
| Lectra |
1,731 | 59,873 | ||||||
| LISI SA |
1,686 | 44,025 | ||||||
| LNA Sante SA |
1,534 | 34,044 | ||||||
| Lumibird (a) (d) |
562 | 7,556 | ||||||
| Maisons du Monde SA |
7,475 | 47,015 | ||||||
| Manitou BF SA |
3,242 | 83,074 | ||||||
| Mersen SA |
7,440 | 289,312 | ||||||
| Metropole Television SA |
6,596 | 94,327 | ||||||
| Nacon SA (a) |
2,928 | 5,391 | ||||||
| Neoen SA |
9,011 | 302,836 | ||||||
| Nexans SA |
6,166 | 539,984 | ||||||
| Nexity SA (d) |
9,433 | 176,365 | ||||||
| NRJ Group |
9,690 | 78,532 | ||||||
| Oeneo SA (d) |
2,122 | 30,221 | ||||||
| Plastiques Du Val De Loire (a) |
1,576 | 6,418 | ||||||
| Prodways Group SA (a) |
657 | 696 | ||||||
| Quadient SA |
9,003 | 191,344 | ||||||
| Recylex SA (a) (b) (c) |
3,335 | 0 | ||||||
| Rexel SA |
51,005 | 1,402,000 | ||||||
| Robertet SA (d) |
19 | 17,435 | ||||||
| Rubis SCA |
22,814 | 566,805 | ||||||
| Samse SACA (d) |
107 | 23,883 | ||||||
| Savencia SA |
1,728 | 104,957 | ||||||
| SCOR SE |
40,311 | 1,180,077 | ||||||
| SEB SA |
4,310 | 538,183 | ||||||
| Seche Environnement SACA |
1,198 | 145,488 | ||||||
| SMCP SA (a) |
1,230 | 4,651 | ||||||
| Societe BIC SA |
5,989 | 415,614 | ||||||
See accompanying notes to financial statements.
BHFTII-10
Brighthouse Funds Trust II
Brighthouse/Dimensional International Small Company Portfolio
Schedule of Investments as of December 31, 2023
Common Stocks—(Continued)
| Security Description | Shares | Value | ||||||
| France—(Continued) | ||||||||
| Societe LDC SADIR |
280 | $ | 43,273 | |||||
| Societe pour l’Informatique Industrielle |
1,887 | 145,439 | ||||||
| SOITEC (a) |
5,577 | 1,001,268 | ||||||
| Sopra Steria Group SACA |
4,352 | 952,792 | ||||||
| SPIE SA |
31,212 | 978,923 | ||||||
| Stef SA |
1,051 | 132,500 | ||||||
| Sword Group |
1,364 | 60,145 | ||||||
| Synergie SE |
3,366 | 131,077 | ||||||
| Technip Energies NV |
30,538 | 712,758 | ||||||
| Television Francaise 1 SA |
9,749 | 77,053 | ||||||
| Thermador Groupe (d) |
1,800 | 168,699 | ||||||
| Tikehau Capital SCA (d) |
7,508 | 170,760 | ||||||
| Totalenergies EP Gabon |
324 | 56,160 | ||||||
| Trigano SA |
2,659 | 437,545 | ||||||
| Ubisoft Entertainment SA (a) |
18,776 | 480,548 | ||||||
| Valeo SE |
49,990 | 772,930 | ||||||
| Vallourec SACA (a) |
36,022 | 558,945 | ||||||
| Vantiva SA (a) (d) |
29,526 | 3,806 | ||||||
| Verallia SA |
15,618 | 603,654 | ||||||
| Vetoquinol SA |
376 | 42,504 | ||||||
| Vicat SACA |
4,477 | 162,393 | ||||||
| VIEL & Cie SA |
4,205 | 39,462 | ||||||
| Virbac SACA |
526 | 208,950 | ||||||
| Voltalia SA (a) |
1,924 | 22,190 | ||||||
| Vranken-Pommery Monopole SA |
958 | 16,948 | ||||||
| Wavestone |
1,052 | 68,499 | ||||||
|
|
|
|||||||
| 25,229,644 | ||||||||
|
|
|
|||||||
| Georgia—0.1% | ||||||||
| Bank of Georgia Group PLC |
13,336 | 675,639 | ||||||
|
|
|
|||||||
| Germany—6.0% | ||||||||
| 1&1 AG |
13,083 | 262,412 | ||||||
| 7C Solarparken AG |
12,415 | 49,698 | ||||||
| Adesso SE (d) |
561 | 66,520 | ||||||
| Adtran Networks SE (a) |
908 | 20,049 | ||||||
| All for One Group SE |
498 | 26,009 | ||||||
| Allgeier SE (d) |
2,942 | 69,916 | ||||||
| Amadeus Fire AG |
1,153 | 156,545 | ||||||
| Aroundtown SA (a) (d) |
96,737 | 264,360 | ||||||
| Atoss Software AG |
1,110 | 256,155 | ||||||
| Aurubis AG |
9,219 | 755,875 | ||||||
| Auto1 Group SE (a) |
9,285 | 66,379 | ||||||
| Basler AG |
3,660 | 47,299 | ||||||
| BayWa AG (d) |
4,695 | 165,098 | ||||||
| Bechtle AG |
19,131 | 958,566 | ||||||
| Bertrandt AG |
2,127 | 120,626 | ||||||
| Bijou Brigitte AG |
1,351 | 59,897 | ||||||
| Bilfinger SE |
9,729 | 374,010 | ||||||
| Borussia Dortmund GmbH & Co. KGaA (a) |
26,685 | 106,080 | ||||||
| BRANICKS Group AG (d) |
13,461 | 50,149 | ||||||
| CANCOM SE (d) |
10,426 | 340,320 | ||||||
| Ceconomy AG (a) |
47,148 | 128,792 | ||||||
| CENIT AG |
3,413 | 46,220 | ||||||
| Cewe Stiftung & Co. KGAA |
1,828 | 204,245 | ||||||
| CompuGroup Medical SE & Co. KgaA |
7,186 | 300,649 | ||||||
| Germany—(Continued) | ||||||||
| CropEnergies AG (d) |
9,235 | 117,225 | ||||||
| CTS Eventim AG & Co. KGaA |
13,878 | 958,882 | ||||||
| Data Modul AG Produktion Und Vertrieb Von Elektronischen Systemen |
138 | 6,762 | ||||||
| Dermapharm Holding SE |
3,957 | 184,996 | ||||||
| Deutsche Beteiligungs AG (d) |
4,577 | 148,318 | ||||||
| Deutsche Pfandbriefbank AG (d) |
43,005 | 294,148 | ||||||
| Deutz AG |
26,653 | 141,254 | ||||||
| Dr Hoenle AG (a) (d) |
2,084 | 40,253 | ||||||
| Draegerwerk AG & Co. KGaA |
1,062 | 52,458 | ||||||
| Duerr AG |
15,842 | 374,020 | ||||||
| DWS Group GmbH & Co. KGaA |
5,057 | 194,296 | ||||||
| Eckert & Ziegler Strahlen- und Medizintechnik AG (d) |
3,953 | 180,248 | ||||||
| Elmos Semiconductor SE |
1,709 | 139,635 | ||||||
| ElringKlinger AG (d) |
8,918 | 54,460 | ||||||
| Encavis AG (a) (d) |
28,569 | 491,588 | ||||||
| Energiekontor AG (d) |
1,621 | 147,965 | ||||||
| EuroEyes International Eye Clinic Ltd. - Class C |
10,000 | 6,685 | ||||||
| Evotec SE (a) |
956 | 22,457 | ||||||
| Fielmann Group AG |
6,684 | 358,910 | ||||||
| flatexDEGIRO AG (a) |
11,582 | 142,811 | ||||||
| FORTEC Elektronik AG |
253 | 6,712 | ||||||
| Fraport AG Frankfurt Airport Services Worldwide (a) |
8,815 | 532,962 | ||||||
| Freenet AG |
33,937 | 948,990 | ||||||
| FUCHS SE |
8,457 | 302,919 | ||||||
| GEA Group AG |
25,168 | 1,047,488 | ||||||
| Gerresheimer AG |
9,767 | 1,017,300 | ||||||
| Gesco SE |
2,953 | 60,645 | ||||||
| GFT Technologies SE |
5,130 | 176,847 | ||||||
| Grand City Properties SA (a) |
31,748 | 356,839 | ||||||
| Grenke AG |
1,610 | 44,526 | ||||||
| H&R GmbH & Co. KGaA |
4,195 | 21,670 | ||||||
| Hamburger Hafen und Logistik AG (a) (d) |
8,624 | 159,373 | ||||||
| Hawesko Holding SE |
223 | 7,804 | ||||||
| Heidelberger Druckmaschinen AG (a) |
84,200 | 115,190 | ||||||
| HelloFresh SE (a) (d) |
30,689 | 486,097 | ||||||
| Hensoldt AG |
8,436 | 227,359 | ||||||
| HOCHTIEF AG |
5,762 | 638,055 | ||||||
| Hornbach Holding AG & Co. KGaA |
2,658 | 193,667 | ||||||
| Hugo Boss AG |
18,161 | 1,352,758 | ||||||
| Indus Holding AG |
6,490 | 160,126 | ||||||
| Init Innovation in Traffic Systems SE |
1,794 | 60,351 | ||||||
| Instone Real Estate Group SE |
9,568 | 77,125 | ||||||
| IVU Traffic Technologies AG (d) |
1,432 | 22,035 | ||||||
| Jenoptik AG |
16,935 | 532,051 | ||||||
| JOST Werke SE |
2,840 | 138,576 | ||||||
| K&S AG |
39,216 | 619,429 | ||||||
| KION Group AG |
11,631 | 496,691 | ||||||
| Kloeckner & Co. SE (d) |
21,296 | 225,695 | ||||||
| Knaus Tabbert AG |
160 | 8,300 | ||||||
| Koenig & Bauer AG (a) |
4,373 | 58,442 | ||||||
| Krones AG |
4,577 | 565,015 | ||||||
| KSB SE & Co. KGaA |
82 | 60,290 | ||||||
| KWS Saat SE & Co. KGaA |
3,725 | 221,056 | ||||||
| Lanxess AG |
22,664 | 709,523 | ||||||
| LEG Immobilien SE (a) |
14,068 | 1,231,949 | ||||||
| Leifheit AG |
2,964 | 53,214 | ||||||
See accompanying notes to financial statements.
BHFTII-11
Brighthouse Funds Trust II
Brighthouse/Dimensional International Small Company Portfolio
Schedule of Investments as of December 31, 2023
Common Stocks—(Continued)
| Security Description | Shares | Value | ||||||
| Germany—(Continued) | ||||||||
| Manz AG (a) (d) |
1,272 | $ | 17,332 | |||||
| Medigene AG (a) |
2,446 | 4,123 | ||||||
| METRO AG (a) (d) |
25,342 | 176,541 | ||||||
| MLP SE |
22,156 | 135,497 | ||||||
| Mutares SE & Co. KGaA (d) |
633 | 24,740 | ||||||
| Nagarro SE (a) (d) |
2,942 | 284,073 | ||||||
| New Work SE |
895 | 77,856 | ||||||
| Nexus AG |
254 | 16,320 | ||||||
| Nordex SE (a) (d) |
6,378 | 73,211 | ||||||
| Norma Group SE |
10,153 | 179,675 | ||||||
| OHB SE (a) |
1,607 | 76,224 | ||||||
| Patrizia SE |
15,140 | 137,041 | ||||||
| Pfeiffer Vacuum Technology AG |
337 | 57,374 | ||||||
| PNE AG (d) |
6,909 | 105,728 | ||||||
| ProSiebenSat.1 Media SE (d) |
44,354 | 270,986 | ||||||
| PSI Software SE (d) |
2,032 | 56,754 | ||||||
| PVA TePla AG (a) |
3,712 | 83,613 | ||||||
| PWO AG |
822 | 27,229 | ||||||
| q.beyond AG (a) |
24,973 | 16,459 | ||||||
| R Stahl AG (a) |
1,594 | 36,716 | ||||||
| Rational AG |
143 | 110,480 | ||||||
| SAF-Holland SE |
9,928 | 166,662 | ||||||
| Salzgitter AG |
8,260 | 255,362 | ||||||
| Scout24 SE |
1,244 | 88,014 | ||||||
| Secunet Security Networks AG |
391 | 63,266 | ||||||
| SGL Carbon SE (a) (d) |
8,945 | 64,236 | ||||||
| Siltronic AG (d) |
4,688 | 457,757 | ||||||
| Sirius Real Estate Ltd. |
241,184 | 289,202 | ||||||
| Sixt SE (d) |
4,289 | 479,228 | ||||||
| SMA Solar Technology AG (a) (d) |
2,279 | 152,370 | ||||||
| Softwareone Holding AG |
16,598 | 323,912 | ||||||
| Stabilus SE |
6,982 | 475,698 | ||||||
| STRATEC SE |
1,280 | 64,369 | ||||||
| Stroeer SE & Co. KGaA (d) |
8,363 | 496,222 | ||||||
| Suedzucker AG |
18,380 | 287,993 | ||||||
| SUESS MicroTec SE |
6,216 | 190,126 | ||||||
| Surteco Group SE |
2,209 | 39,539 | ||||||
| Synlab AG (a) (d) |
2,964 | 32,394 | ||||||
| TAG Immobilien AG (a) |
52,366 | 762,819 | ||||||
| Takkt AG (d) |
10,920 | 162,882 | ||||||
| TeamViewer SE (a) |
34,398 | 532,600 | ||||||
| Technotrans SE |
2,191 | 52,742 | ||||||
| thyssenkrupp AG |
116,223 | 810,970 | ||||||
| TUI AG (a) |
4,243 | 32,976 | ||||||
| United Internet AG |
8,616 | 219,055 | ||||||
| Verbio Vereinigte Bioenergie AG (d) |
6,932 | 228,653 | ||||||
| Vitesco Technologies Group AG - Class A (a) |
2,649 | 274,802 | ||||||
| Vossloh AG |
3,146 | 145,686 | ||||||
| Wacker Chemie AG |
2,017 | 254,550 | ||||||
| Wacker Neuson SE (d) |
8,944 | 180,327 | ||||||
| Washtec AG |
3,673 | 129,759 | ||||||
| Westwing Group SE (a) (d) |
1,155 | 11,270 | ||||||
| Wuestenrot & Wuerttembergische AG |
4,932 | 72,765 | ||||||
| Zeal Network SE |
1,619 | 59,518 | ||||||
|
|
|
|||||||
| 31,716,005 | ||||||||
|
|
|
|||||||
| Ghana—0.1% | ||||||||
| Tullow Oil PLC (a) (d) |
415,488 | 205,591 | ||||||
|
|
|
|||||||
| Greece—0.0% | ||||||||
| Okeanis Eco Tankers Corp. (a) |
1,254 | 33,243 | ||||||
|
|
|
|||||||
| Greenland—0.0% | ||||||||
| GronlandsBANKEN AS |
140 | 12,958 | ||||||
|
|
|
|||||||
| Guernsey, Channel Islands—0.0% | ||||||||
| Raven Property Group Ltd. (a) (b) (c) |
112,611 | 0 | ||||||
|
|
|
|||||||
| Hong Kong—1.8% | ||||||||
| Aceso Life Science Group Ltd. (a) |
1,001,000 | 14,453 | ||||||
| Aeon Credit Service Asia Co. Ltd. |
44,000 | 30,692 | ||||||
| Aidigong Maternal & Child Health Ltd. (a) |
180,000 | 6,220 | ||||||
| Allied Group Ltd. |
382,000 | 76,806 | ||||||
| APAC Resources Ltd. |
84,990 | 10,340 | ||||||
| Apollo Future Mobility Group Ltd. (a) |
17,400 | 1,783 | ||||||
| Applied Development Holdings Ltd. (a) |
150,000 | 1,153 | ||||||
| Asia Financial Holdings Ltd. |
88,000 | 39,895 | ||||||
| Asia Standard International Group Ltd. (a) |
296,000 | 16,111 | ||||||
| ASMPT Ltd. |
62,100 | 589,675 | ||||||
| Associated International Hotels Ltd. |
14,000 | 10,399 | ||||||
| Bank of East Asia Ltd. |
103,823 | 127,985 | ||||||
| Bel Global Resources Holdings Ltd. (a) (b) (c) |
520,000 | 0 | ||||||
| BOCOM International Holdings Co. Ltd. (a) |
117,000 | 5,723 | ||||||
| Brightoil Petroleum Holdings Ltd. (a) (b) (c) |
591,000 | 0 | ||||||
| Build King Holdings Ltd. |
160,000 | 23,547 | ||||||
| Burwill Holdings Ltd. (a) (b) (c) |
1,566,000 | 0 | ||||||
| C-Mer Eye Care Holdings Ltd. (a) |
74,000 | 32,717 | ||||||
| Cadeler AS (a) (d) |
3,200 | 14,766 | ||||||
| Cafe de Coral Holdings Ltd. |
94,000 | 108,443 | ||||||
| Century City International Holdings Ltd. (a) |
616,000 | 20,143 | ||||||
| Chen Hsong Holdings |
150,000 | 27,336 | ||||||
| Cheuk Nang Holdings Ltd. |
108,566 | 22,524 | ||||||
| Chevalier International Holdings Ltd. |
75,139 | 49,365 | ||||||
| China Baoli Technologies Holdings Ltd. (a) |
2,850 | 285 | ||||||
| China Best Group Holding Ltd. (a) |
63,000 | 1,683 | ||||||
| China Energy Development Holdings Ltd. (a) |
3,376,000 | 34,050 | ||||||
| China Motor Bus Co. Ltd. |
4,800 | 36,145 | ||||||
| China Solar (a) (b) (c) |
162,000 | 0 | ||||||
| China Star Entertainment Ltd. (a) |
378,000 | 38,670 | ||||||
| Chinese Estates Holdings Ltd. (a) |
151,000 | 23,509 | ||||||
| Chinney Investments Ltd. |
8,000 | 994 | ||||||
| Chow Sang Sang Holdings International Ltd. |
94,000 | 108,085 | ||||||
| Chuang’s China Investments Ltd. (a) |
511,500 | 9,040 | ||||||
| Chuang’s Consortium International Ltd. (a) |
382,357 | 21,790 | ||||||
| CK Life Sciences International Holdings, Inc. |
304,000 | 24,118 | ||||||
| CMBC Capital Holdings Ltd. (a) |
19,000 | 766 | ||||||
| CNT Group Ltd. |
246,000 | 10,239 | ||||||
| Convenience Retail Asia Ltd. |
36,000 | 3,133 | ||||||
| Convoy, Inc. (a) (b) (c) |
1,314,000 | 5,267 | ||||||
| Cowell e Holdings, Inc. (a) |
39,000 | 115,687 | ||||||
| Crystal International Group Ltd. |
29,500 | 10,947 | ||||||
| CSC Holdings Ltd. (a) |
4,927,500 | 18,344 | ||||||
| CSI Properties Ltd. |
2,274,023 | 27,994 | ||||||
| Dah Sing Banking Group Ltd. |
112,271 | 72,385 | ||||||
See accompanying notes to financial statements.
BHFTII-12
Brighthouse Funds Trust II
Brighthouse/Dimensional International Small Company Portfolio
Schedule of Investments as of December 31, 2023
Common Stocks—(Continued)
| Security Description | Shares | Value | ||||||
| Hong Kong—(Continued) | ||||||||
| Dah Sing Financial Holdings Ltd. |
41,460 | $ | 84,847 | |||||
| Dickson Concepts International Ltd. |
87,500 | 52,059 | ||||||
| DMX Technologies Group Ltd. (a) (b) (c) |
186,000 | 0 | ||||||
| Dynamic Holdings Ltd. |
20,000 | 23,362 | ||||||
| Eagle Nice International Holdings Ltd. |
80,000 | 43,313 | ||||||
| EC Healthcare |
59,000 | 13,129 | ||||||
| EcoGreen International Group Ltd. (a) (b) (c) |
118,800 | 5,421 | ||||||
| Emperor International Holdings Ltd. |
529,250 | 26,112 | ||||||
| Emperor Watch & Jewellery Ltd. |
1,520,000 | 32,293 | ||||||
| ENM Holdings Ltd. (a) |
412,000 | 15,018 | ||||||
| Esprit Holdings Ltd. (a) |
504,275 | 26,101 | ||||||
| Fairwood Holdings Ltd. |
26,500 | 31,111 | ||||||
| Far East Consortium International Ltd. |
360,687 | 64,214 | ||||||
| First Pacific Co. Ltd. |
570,000 | 226,866 | ||||||
| Fosun Tourism Group (a) |
14,400 | 10,631 | ||||||
| G-Resources Group Ltd. |
123,180 | 30,742 | ||||||
| Genting Hong Kong, Ltd. (a) (b) (c) |
327,000 | 3,258 | ||||||
| Get Nice Financial Group Ltd. |
104,000 | 8,534 | ||||||
| Giordano International Ltd. |
322,000 | 108,834 | ||||||
| Glorious Sun Enterprises Ltd. |
393,000 | 41,761 | ||||||
| Gold Fin Holdings (a) (b) (c) |
214,000 | 0 | ||||||
| Gold Peak Technology Group Ltd. (a) |
277,714 | 21,033 | ||||||
| Golden Resources Development International Ltd. |
264,000 | 15,923 | ||||||
| Good Resources Holdings Ltd. (a) (b) (c) |
420,000 | 0 | ||||||
| GR Life Style Company Ltd. (a) |
82,000 | 3,365 | ||||||
| Great Eagle Holdings Ltd. |
49,491 | 76,956 | ||||||
| Guoco Group Ltd. |
1,000 | 7,205 | ||||||
| Haitong International Securities Group Ltd. (a) |
680,117 | 131,495 | ||||||
| Hang Lung Group Ltd. |
176,000 | 240,057 | ||||||
| Hanison Construction Holdings Ltd. |
148,009 | 13,079 | ||||||
| Harbour Centre Development Ltd. (a) |
88,000 | 79,790 | ||||||
| HK Electric Investments & HK Electric Investments Ltd. |
167,000 | 100,666 | ||||||
| HKBN Ltd. |
167,500 | 74,726 | ||||||
| HKR International Ltd. |
343,680 | 65,260 | ||||||
| Hon Kwok Land Investment Co. Ltd. |
140,000 | 25,277 | ||||||
| Hong Kong Economic Times Holdings Ltd. |
50,000 | 5,189 | ||||||
| Hong Kong Ferry Holdings Co. Ltd. |
39,000 | 22,890 | ||||||
| Hong Kong Technology Venture Co. Ltd. (a) |
96,000 | 32,465 | ||||||
| Hongkong & Shanghai Hotels Ltd. (a) |
95,902 | 72,098 | ||||||
| Hongkong Chinese Ltd. (a) |
510,000 | 20,941 | ||||||
| Hsin Chong Group Holdings Ltd. (a) (b) (c) |
918,000 | 0 | ||||||
| Hung Hing Printing Group Ltd. |
252,000 | 33,290 | ||||||
| Hutchison Port Holdings Trust |
1,123,200 | 166,955 | ||||||
| Hutchison Telecommunications Hong Kong Holdings Ltd. |
366,000 | 50,112 | ||||||
| Hysan Development Co. Ltd. |
139,000 | 275,692 | ||||||
| Imagi International Holdings Ltd. (a) |
18,112 | 3,416 | ||||||
| International Housewares Retail Co. Ltd. |
105,000 | 21,778 | ||||||
| IPE Group Ltd. (a) |
285,000 | 17,519 | ||||||
| IRC Ltd. (a) |
936,000 | 12,845 | ||||||
| ITC Properties Group Ltd. (a) |
182,746 | 14,510 | ||||||
| Jacobson Pharma Corp. Ltd. |
90,000 | 7,385 | ||||||
| Johnson Electric Holdings Ltd. |
88,873 | 141,591 | ||||||
| K Wah International Holdings Ltd. |
172,000 | 43,095 | ||||||
| Kader Holdings Co. Ltd. (a) |
104,000 | 5,527 | ||||||
| Karrie International Holdings Ltd. |
140,000 | 8,622 | ||||||
| Keck Seng Investments Hong Kong Ltd. |
72,000 | 18,326 | ||||||
| Kerry Logistics Network Ltd. |
88,500 | 93,090 | ||||||
| Hong Kong—(Continued) | ||||||||
| Kerry Properties Ltd. |
127,000 | 231,631 | ||||||
| Kingmaker Footwear Holdings Ltd. |
102,000 | 9,666 | ||||||
| Kowloon Development Co. Ltd. |
124,000 | 93,747 | ||||||
| Lai Sun Development Co. Ltd. (a) |
111,919 | 12,204 | ||||||
| Lai Sun Garment International Ltd. (a) |
194,634 | 23,430 | ||||||
| Lam Soon Hong Kong Ltd. |
15,000 | 14,407 | ||||||
| Langham Hospitality Investments & Langham Hospitality Investments Ltd. |
207,000 | 17,739 | ||||||
| Lerthai Group Ltd. (a) (b) (c) |
18,000 | 0 | ||||||
| Lippo China Resources Ltd. (a) |
210,600 | 22,371 | ||||||
| Lippo Ltd. (a) |
122,000 | 18,124 | ||||||
| Liu Chong Hing Investment Ltd. |
78,000 | 53,941 | ||||||
| Luk Fook Holdings International Ltd. |
81,000 | 217,383 | ||||||
| Lung Kee Bermuda Holdings |
90,000 | 16,713 | ||||||
| Magnificent Hotel Investment Ltd. (a) |
1,310,000 | 14,428 | ||||||
| Man Wah Holdings Ltd. |
240,800 | 164,636 | ||||||
| Mandarin Oriental International Ltd. |
67,000 | 105,048 | ||||||
| Matrix Holdings Ltd. |
36,000 | 4,610 | ||||||
| MH Development NPV (a) (b) (c) |
124,000 | 0 | ||||||
| Midland Holdings Ltd. (a) |
178,010 | 11,171 | ||||||
| Miramar Hotel & Investment |
51,000 | 69,920 | ||||||
| Modern Dental Group Ltd. |
79,000 | 43,433 | ||||||
| Nameson Holdings Ltd. |
130,000 | 8,312 | ||||||
| National Electronics Holdings |
182,600 | 15,200 | ||||||
| New World Development Co. Ltd. (d) |
150,000 | 231,827 | ||||||
| NewOcean Energy Holdings Ltd. (a) (b) (c) |
398,000 | 357 | ||||||
| Nissin Foods Co. Ltd. |
47,000 | 37,580 | ||||||
| NWS Holdings Ltd. |
279,000 | 262,785 | ||||||
| Oriental Watch Holdings |
96,484 | 51,887 | ||||||
| Oshidori International Holdings Ltd. (a) |
1,068,000 | 27,404 | ||||||
| Pacific Andes International Holdings Ltd. (a) (b) (c) |
1,819,984 | 0 | ||||||
| Pacific Basin Shipping Ltd. |
1,125,000 | 371,383 | ||||||
| Pacific Century Premium Developments Ltd. (a) |
49,788 | 1,557 | ||||||
| Pacific Textiles Holdings Ltd. |
266,000 | 45,948 | ||||||
| Paliburg Holdings Ltd. (a) |
208,000 | 20,468 | ||||||
| Paradise Entertainment Ltd. (a) |
168,000 | 19,599 | ||||||
| PC Partner Group Ltd. |
54,000 | 21,655 | ||||||
| PCCW Ltd. |
576,582 | 306,994 | ||||||
| Perfect Medical Health Management Ltd. |
108,000 | 45,746 | ||||||
| Pico Far East Holdings Ltd. |
252,000 | 49,705 | ||||||
| Playmates Holdings Ltd. |
460,000 | 32,990 | ||||||
| PT International Development Co. Ltd. (a) |
279,000 | 2,501 | ||||||
| Public Financial Holdings Ltd. |
166,000 | 34,254 | ||||||
| Realord Group Holdings Ltd. (a) |
20,000 | 14,036 | ||||||
| Regal Hotels International Holdings Ltd. (a) |
126,000 | 46,369 | ||||||
| Regina Miracle International Holdings Ltd. |
71,000 | 19,549 | ||||||
| Samson Holding Ltd. |
146,000 | 4,039 | ||||||
| SAS Dragon Holdings Ltd. |
140,000 | 57,553 | ||||||
| SEA Holdings Ltd. |
63,896 | 14,075 | ||||||
| Shangri-La Asia Ltd. (a) |
234,000 | 160,322 | ||||||
| Shun Ho Property Investments Ltd. (a) |
21,615 | 2,242 | ||||||
| Shun Tak Holdings Ltd. (a) |
379,500 | 48,960 | ||||||
| Singamas Container Holdings Ltd. |
506,000 | 33,653 | ||||||
| SmarTone Telecommunications Holdings Ltd. |
107,888 | 56,054 | ||||||
| Soundwill Holdings Ltd. |
41,500 | 33,484 | ||||||
| South China Holdings Co. Ltd. (a) |
1,240,000 | 6,828 | ||||||
| Stella International Holdings Ltd. |
141,000 | 166,274 | ||||||
See accompanying notes to financial statements.
BHFTII-13
Brighthouse Funds Trust II
Brighthouse/Dimensional International Small Company Portfolio
Schedule of Investments as of December 31, 2023
Common Stocks—(Continued)
| Security Description | Shares | Value | ||||||
| Hong Kong—(Continued) | ||||||||
| Sun Hung Kai & Co. Ltd. |
153,440 | $ | 48,084 | |||||
| SUNeVision Holdings Ltd. |
176,000 | 69,614 | ||||||
| TAI Cheung Holdings Ltd. |
192,000 | 81,138 | ||||||
| Tan Chong International Ltd. |
63,000 | 11,537 | ||||||
| Tao Heung Holdings Ltd. |
204,000 | 19,573 | ||||||
| Television Broadcasts Ltd. (a) |
97,700 | 39,763 | ||||||
| Texwinca Holdings Ltd. |
236,000 | 28,969 | ||||||
| Tradelink Electronic Commerce Ltd. |
256,000 | 29,175 | ||||||
| Transport International Holdings Ltd. |
65,760 | 79,404 | ||||||
| United Laboratories International Holdings Ltd. |
241,000 | 216,245 | ||||||
| Up Energy Development Group Ltd. (a) (b) (c) |
92,000 | 0 | ||||||
| Upbest Group Ltd. |
16,000 | 1,250 | ||||||
| Value Partners Group Ltd. |
215,000 | 58,861 | ||||||
| Valuetronics Holdings Ltd. |
89,790 | 40,429 | ||||||
| Vedan International Holdings Ltd. |
296,000 | 15,353 | ||||||
| Vitasoy International Holdings Ltd. |
162,000 | 162,004 | ||||||
| VPower Group International Holdings Ltd. (a) |
53,251 | 2,289 | ||||||
| VSTECS Holdings Ltd. |
169,200 | 95,242 | ||||||
| VTech Holdings Ltd. |
42,200 | 255,220 | ||||||
| Wai Kee Holdings Ltd. (a) |
54,000 | 6,362 | ||||||
| Wang On Group Ltd. |
2,200,000 | 11,264 | ||||||
| Wealthink AI-Innovation Capital Ltd. (a) |
284,000 | 13,869 | ||||||
| Wing On Co. International Ltd. |
46,000 | 71,163 | ||||||
| Wing Tai Properties Ltd. |
176,000 | 61,758 | ||||||
| Xinyi Glass Holdings Ltd. |
52,000 | 58,238 | ||||||
| Yue Yuen Industrial Holdings Ltd. |
164,000 | 182,062 | ||||||
| Yunfeng Financial Group Ltd. (a) |
34,000 | 4,363 | ||||||
| Zhaobangji Lifestyle Holdings Ltd. (a) |
184,000 | 4,774 | ||||||
|
|
|
|||||||
| 9,627,176 | ||||||||
|
|
|
|||||||
| Ireland—0.5% | ||||||||
| Bank of Ireland Group PLC |
122,388 | 1,109,388 | ||||||
| C&C Group PLC (d) |
120,783 | 234,682 | ||||||
| Cairn Homes PLC |
89,136 | 129,959 | ||||||
| COSMO Pharmaceuticals NV (d) |
1,257 | 76,255 | ||||||
| Dalata Hotel Group PLC |
23,703 | 120,647 | ||||||
| FBD Holdings PLC |
9,980 | 125,165 | ||||||
| Glanbia PLC |
36,185 | 594,755 | ||||||
| Glenveagh Properties PLC (a) |
61,605 | 83,020 | ||||||
| Greencore Group PLC (a) |
159,206 | 195,926 | ||||||
| Hostelworld Group PLC (a) |
8,529 | 14,777 | ||||||
| Irish Continental Group PLC |
22,005 | 105,062 | ||||||
| Permanent TSB Group Holdings PLC (a) |
15,086 | 28,302 | ||||||
|
|
|
|||||||
| 2,817,938 | ||||||||
|
|
|
|||||||
| Isle of Man—0.0% | ||||||||
| Strix Group PLC |
40,073 | 38,051 | ||||||
|
|
|
|||||||
| Israel—1.1% | ||||||||
| Abra Information Technologies Ltd. (a) |
9,179 | 7,807 | ||||||
| Adgar Investment & Development Ltd. |
11,788 | 16,634 | ||||||
| Afcon Holdings Ltd. (a) |
771 | 20,392 | ||||||
| AFI Properties Ltd. (a) |
3,584 | 158,334 | ||||||
| Africa Israel Residences Ltd. |
880 | 45,243 | ||||||
| Airport City Ltd. (a) |
1 | 9 | ||||||
| Allot Ltd. (a) |
10,216 | 16,257 | ||||||
| Israel—(Continued) | ||||||||
| Alrov Properties & Lodgings Ltd. |
1,801 | 61,991 | ||||||
| Arad Ltd. |
2,224 | 33,597 | ||||||
| Ashdod Refinery Ltd. (a) |
2,185 | 48,573 | ||||||
| AudioCodes Ltd. |
8,025 | 96,858 | ||||||
| Aura Investments Ltd. |
3,293 | 9,293 | ||||||
| Avgol Industries 1953 Ltd. (a) |
27,883 | 12,213 | ||||||
| Azorim-Investment Development & Construction Co. Ltd. (a) |
23,193 | 94,143 | ||||||
| Bet Shemesh Engines Holdings 1997 Ltd. |
2,139 | 67,867 | ||||||
| Blue Square Real Estate Ltd. |
1,325 | 87,865 | ||||||
| Carasso Motors Ltd. |
5,984 | 25,698 | ||||||
| Cellcom Israel Ltd. (a) |
24,928 | 101,704 | ||||||
| Ceragon Networks Ltd. (a) |
14,799 | 31,966 | ||||||
| Clal Insurance Enterprises Holdings Ltd. (a) |
10,582 | 168,508 | ||||||
| Compugen Ltd. (a) |
1,588 | 2,851 | ||||||
| Danel Adir Yeoshua Ltd. |
1,759 | 145,207 | ||||||
| Delek Automotive Systems Ltd. |
12,832 | 82,426 | ||||||
| Delta Galil Ltd. |
3,185 | 141,755 | ||||||
| Dor Alon Energy in Israel 1988 Ltd. |
1,540 | 30,412 | ||||||
| Electra Consumer Products 1970 Ltd. |
1,793 | 35,676 | ||||||
| Electra Real Estate Ltd. |
6,750 | 76,063 | ||||||
| Equital Ltd. (a) |
5,416 | 166,000 | ||||||
| FMS Enterprises Migun Ltd. |
1,295 | 43,316 | ||||||
| Formula Systems 1985 Ltd. |
2,715 | 173,822 | ||||||
| Fox Wizel Ltd. |
1,176 | 79,540 | ||||||
| Gav-Yam Lands Corp. Ltd. |
3,128 | 25,397 | ||||||
| Gilat Satellite Networks Ltd. (a) |
9,844 | 60,233 | ||||||
| Globrands Ltd. |
93 | 10,666 | ||||||
| Hilan Ltd. |
3,895 | 204,375 | ||||||
| IDI Insurance Co. Ltd. |
2,662 | 70,941 | ||||||
| IES Holdings Ltd. (a) |
569 | 37,905 | ||||||
| Ilex Medical Ltd. |
959 | 15,341 | ||||||
| Inrom Construction Industries Ltd. |
22,474 | 65,716 | ||||||
| Isracard Ltd. |
22,812 | 80,932 | ||||||
| Israel Canada T.R Ltd. |
30,064 | 89,662 | ||||||
| Israel Land Development Co. Ltd. |
3,950 | 37,985 | ||||||
| Isras Investment Co. Ltd. |
541 | 112,010 | ||||||
| Issta Ltd. (a) |
1,175 | 22,091 | ||||||
| Kamada Ltd. (a) |
7,951 | 48,509 | ||||||
| Kerur Holdings Ltd. |
2,088 | 36,795 | ||||||
| Klil Industries Ltd. (a) |
315 | 17,558 | ||||||
| Lahav L.R. Real Estate Ltd. |
7,734 | 7,690 | ||||||
| Levinstein Properties Ltd. |
1,208 | 24,190 | ||||||
| M Yochananof & Sons Ltd. |
586 | 25,632 | ||||||
| Magic Software Enterprises Ltd. |
5,909 | 56,775 | ||||||
| Malam - Team Ltd. |
2,688 | 36,162 | ||||||
| Matrix IT Ltd. |
6,643 | 124,935 | ||||||
| Maytronics Ltd. |
1 | 6 | ||||||
| Mediterranean Towers Ltd. |
28,011 | 67,571 | ||||||
| Mega Or Holdings Ltd. |
4,941 | 115,090 | ||||||
| Mehadrin Ltd. (a) |
108 | 4,205 | ||||||
| Meitav Investment House Ltd. |
10,041 | 39,798 | ||||||
| Menora Mivtachim Holdings Ltd. |
4,340 | 111,480 | ||||||
| Migdal Insurance & Financial Holdings Ltd. |
56,284 | 63,953 | ||||||
| Mivtach Shamir Holdings Ltd. (a) |
1,966 | 55,440 | ||||||
| Mizrahi Tefahot Bank Ltd. |
1 | 36 | ||||||
| Naphtha Israel Petroleum Corp. Ltd. |
12,347 | 63,044 | ||||||
See accompanying notes to financial statements.
BHFTII-14
Brighthouse Funds Trust II
Brighthouse/Dimensional International Small Company Portfolio
Schedule of Investments as of December 31, 2023
Common Stocks—(Continued)
| Security Description | Shares | Value | ||||||
| Israel—(Continued) | ||||||||
| Nawi Brothers Ltd. |
4,888 | $ | 31,889 | |||||
| Neto Malinda Trading Ltd. (a) |
783 | 10,378 | ||||||
| Neto ME Holdings Ltd. (a) |
788 | 12,320 | ||||||
| Novolog Ltd. |
43,939 | 17,582 | ||||||
| Oil Refineries Ltd. |
418,554 | 141,164 | ||||||
| One Software Technologies Ltd. |
9,000 | 114,874 | ||||||
| Partner Communications Co. Ltd. (a) |
33,663 | 166,158 | ||||||
| Paz Oil Co. Ltd. |
2,185 | 182,903 | ||||||
| Perion Network Ltd. (a) |
4,002 | 125,568 | ||||||
| Plasson Industries Ltd. |
1,078 | 42,076 | ||||||
| Plus500 Ltd. |
25,321 | 536,236 | ||||||
| Prashkovsky Investments & Construction Ltd. |
569 | 13,102 | ||||||
| Priortech Ltd. (a) |
2,244 | 75,935 | ||||||
| Rami Levy Chain Stores Hashikma Marketing 2006 Ltd. |
2,198 | 122,308 | ||||||
| Retailors Ltd. |
504 | 9,964 | ||||||
| Sano-Brunos Enterprises Ltd. |
46 | 3,149 | ||||||
| Scope Metals Group Ltd. (a) |
1,844 | 54,140 | ||||||
| Shufersal Ltd. (a) |
2,836 | 13,470 | ||||||
| Summit Real Estate Holdings Ltd. |
8,001 | 120,137 | ||||||
| Suny Cellular Communication Ltd. |
16,495 | 4,224 | ||||||
| Tadiran Group Ltd. |
855 | 63,264 | ||||||
| Tel Aviv Stock Exchange Ltd. |
12,781 | 67,995 | ||||||
| Telsys Ltd. |
402 | 26,157 | ||||||
| Tremor International Ltd. (ADR) (a) (d) |
7,429 | 37,591 | ||||||
| Victory Supermarket Chain Ltd. |
589 | 5,700 | ||||||
| YH Dimri Construction & Development Ltd. |
1,750 | 125,047 | ||||||
|
|
|
|||||||
| 5,937,474 | ||||||||
|
|
|
|||||||
| Italy—4.3% | ||||||||
| A2A SpA |
383,540 | 787,294 | ||||||
| ACEA SpA |
10,339 | 157,878 | ||||||
| Aeffe SpA (a) |
11,359 | 11,511 | ||||||
| Amplifon SpA |
13,635 | 473,192 | ||||||
| Anima Holding SpA |
57,220 | 253,111 | ||||||
| Aquafil SpA (d) |
3,537 | 13,436 | ||||||
| Ariston Holding NV |
3,301 | 22,919 | ||||||
| Arnoldo Mondadori Editore SpA |
41,344 | 97,909 | ||||||
| Ascopiave SpA |
19,908 | 49,456 | ||||||
| Avio SpA (a) (d) |
6,077 | 56,775 | ||||||
| Azimut Holding SpA |
28,124 | 735,299 | ||||||
| Banca Generali SpA |
15,246 | 566,270 | ||||||
| Banca IFIS SpA |
7,714 | 133,734 | ||||||
| Banca Mediolanum SpA |
17,645 | 166,277 | ||||||
| Banca Monte dei Paschi di Siena SpA (a) |
44,894 | 151,503 | ||||||
| Banca Popolare di Sondrio SPA |
137,290 | 888,364 | ||||||
| Banca Profilo SpA (d) |
117,883 | 26,420 | ||||||
| Banca Sistema SpA |
13,168 | 17,466 | ||||||
| Banco BPM SpA |
384,473 | 2,030,038 | ||||||
| Banco di Desio e della Brianza SpA |
20,306 | 81,674 | ||||||
| BFF Bank SpA |
20,564 | 234,307 | ||||||
| BPER Banca |
260,033 | 868,980 | ||||||
| Brembo SpA |
35,796 | 439,761 | ||||||
| Brunello Cucinelli SpA |
8,919 | 875,111 | ||||||
| Buzzi SpA |
25,101 | 763,333 | ||||||
| Cairo Communication SpA |
19,722 | 39,380 | ||||||
| Italy—(Continued) | ||||||||
| Carel Industries SpA |
7,731 | 212,236 | ||||||
| Cementir Holding NV |
14,671 | 154,629 | ||||||
| CIR SpA-Compagnie Industriali (a) |
191,168 | 90,989 | ||||||
| Credito Emiliano SpA |
23,832 | 211,548 | ||||||
| d’Amico International Shipping SA |
11,515 | 71,904 | ||||||
| Danieli & C Officine Meccaniche SpA (d) |
3,431 | 111,373 | ||||||
| De’ Longhi SpA |
13,473 | 455,071 | ||||||
| doValue SpA |
7,705 | 29,226 | ||||||
| Elica SpA |
11,044 | 27,703 | ||||||
| Emak SpA (d) |
23,063 | 27,960 | ||||||
| Enav SpA |
38,399 | 145,556 | ||||||
| ERG SpA (d) |
7,855 | 250,682 | ||||||
| Esprinet SpA (d) |
9,278 | 56,289 | ||||||
| Eurotech SpA (a) (d) |
10,078 | 27,432 | ||||||
| Fila SpA |
3,057 | 29,625 | ||||||
| Fincantieri SpA (a) (d) |
93,136 | 57,364 | ||||||
| FNM SpA |
55,327 | 27,634 | ||||||
| Geox SpA (a) (d) |
34,378 | 27,738 | ||||||
| Gruppo MutuiOnline SpA |
4,757 | 167,780 | ||||||
| Hera SpA |
200,555 | 658,142 | ||||||
| IMMSI SpA (d) |
51,196 | 32,213 | ||||||
| Intercos SpA |
700 | 11,066 | ||||||
| Interpump Group SpA |
15,233 | 789,096 | ||||||
| Iren SpA |
173,436 | 377,978 | ||||||
| Italgas SpA |
126,621 | 725,398 | ||||||
| Italmobiliare SpA (d) |
4,207 | 128,918 | ||||||
| Iveco Group NV (a) |
40,291 | 362,923 | ||||||
| IVS Group SA (d) |
7,886 | 47,552 | ||||||
| Leonardo SpA |
107,918 | 1,780,447 | ||||||
| LU-VE SpA |
1,991 | 50,764 | ||||||
| Maire Tecnimont SpA |
42,334 | 230,121 | ||||||
| MFE-MediaForEurope NV - Class A |
36,806 | 95,813 | ||||||
| MFE-MediaForEurope NV - Class B (d) |
15,815 | 57,054 | ||||||
| Openjobmetis SpA agenzia per il lavoro |
1,209 | 21,367 | ||||||
| OVS SpA (d) |
54,328 | 136,246 | ||||||
| Pharmanutra SpA |
826 | 51,518 | ||||||
| Piaggio & C SpA |
43,925 | 144,471 | ||||||
| Pirelli & C SpA |
71,853 | 391,407 | ||||||
| RAI Way SpA |
24,727 | 139,521 | ||||||
| Reply SpA |
5,783 | 764,213 | ||||||
| Rizzoli Corriere Della Sera Mediagroup SpA |
39,016 | 31,906 | ||||||
| Sabaf SpA (a) |
3,059 | 58,571 | ||||||
| Safilo Group SpA (a) |
12,212 | 12,320 | ||||||
| Salcef Group SpA |
457 | 12,440 | ||||||
| Salvatore Ferragamo SpA (d) |
10,353 | 139,861 | ||||||
| Sanlorenzo SpA |
813 | 38,013 | ||||||
| Saras SpA (d) |
169,450 | 302,828 | ||||||
| Sesa SpA |
2,065 | 281,111 | ||||||
| Sogefi SpA (a) |
24,822 | 56,113 | ||||||
| SOL SpA |
10,262 | 315,302 | ||||||
| Spaxs SpA (a) (d) |
12,140 | 73,106 | ||||||
| Tamburi Investment Partners SpA |
24,878 | 255,431 | ||||||
| Technogym SpA |
31,905 | 319,787 | ||||||
| Telecom Italia SpA (a) (d) |
1,819,770 | 592,120 | ||||||
| Tinexta Spa |
798 | 17,912 | ||||||
| Tod’s SpA (a) |
574 | 21,683 | ||||||
See accompanying notes to financial statements.
BHFTII-15
Brighthouse Funds Trust II
Brighthouse/Dimensional International Small Company Portfolio
Schedule of Investments as of December 31, 2023
Common Stocks—(Continued)
| Security Description | Shares | Value | ||||||
| Italy—(Continued) | ||||||||
| Uni Land SpA (a) (b) (c) |
4,937 | $ | 0 | |||||
| Unieuro SpA (d) |
3,192 | 36,586 | ||||||
| Unipol Gruppo SpA |
98,029 | 558,687 | ||||||
| UnipolSai Assicurazioni SpA |
48,949 | 122,137 | ||||||
| Webuild SpA (d) |
70,140 | 141,514 | ||||||
| Zignago Vetro SpA |
6,769 | 106,668 | ||||||
|
|
|
|||||||
| 22,614,461 | ||||||||
|
|
|
|||||||
| Japan—24.4% | ||||||||
| &Do Holdings Co. Ltd. |
1,400 | 10,257 | ||||||
| 77 Bank Ltd. |
13,300 | 327,050 | ||||||
| A&D HOLON Holdings Co. Ltd. |
6,000 | 76,298 | ||||||
| Access Co. Ltd. (a) |
2,300 | 13,488 | ||||||
| Achilles Corp. |
3,700 | 40,433 | ||||||
| Ad-sol Nissin Corp. |
1,900 | 20,965 | ||||||
| Adastria Co. Ltd. |
6,340 | 156,298 | ||||||
| ADEKA Corp. |
20,600 | 418,105 | ||||||
| Adtec Plasma Technology Co. Ltd. |
600 | 7,777 | ||||||
| Advan Group Co. Ltd. |
6,700 | 50,850 | ||||||
| Advanced Media, Inc. |
1,200 | 16,069 | ||||||
| Adventure, Inc. |
600 | 23,566 | ||||||
| Aeon Delight Co. Ltd. |
5,100 | 128,586 | ||||||
| Aeon Fantasy Co. Ltd. (d) |
2,400 | 44,478 | ||||||
| AEON Financial Service Co. Ltd. |
12,700 | 113,767 | ||||||
| Aeon Hokkaido Corp. |
4,800 | 31,495 | ||||||
| Aeon Kyushu Co. Ltd. |
600 | 10,170 | ||||||
| Aeria, Inc. (d) |
2,200 | 4,653 | ||||||
| AFC-HD AMS Life Science Co. Ltd. |
1,900 | 10,764 | ||||||
| Agro-Kanesho Co. Ltd. |
1,000 | 10,905 | ||||||
| Ahresty Corp. |
5,200 | 25,865 | ||||||
| Ai Holdings Corp. (d) |
9,200 | 152,238 | ||||||
| Aica Kogyo Co. Ltd. |
13,000 | 314,942 | ||||||
| Aichi Corp. |
9,000 | 69,401 | ||||||
| Aichi Financial Group, Inc. |
7,714 | 125,741 | ||||||
| Aichi Steel Corp. |
2,700 | 60,587 | ||||||
| Aichi Tokei Denki Co. Ltd. |
2,200 | 36,429 | ||||||
| Aida Engineering Ltd. |
13,300 | 77,557 | ||||||
| Aiful Corp. |
51,900 | 139,657 | ||||||
| Ain Holdings, Inc. |
5,700 | 180,647 | ||||||
| Ainavo Holdings Co. Ltd. |
1,100 | 9,393 | ||||||
| Aiphone Co. Ltd. |
3,000 | 57,438 | ||||||
| Airport Facilities Co. Ltd. |
7,500 | 31,326 | ||||||
| Airtrip Corp. (d) |
2,500 | 32,742 | ||||||
| Aisan Industry Co. Ltd. |
8,700 | 72,303 | ||||||
| AIT Corp. |
1,600 | 19,545 | ||||||
| Aizawa Securities Group Co. Ltd. |
6,800 | 56,254 | ||||||
| Ajis Co. Ltd. |
500 | 8,113 | ||||||
| Akatsuki Corp. |
8,100 | 25,393 | ||||||
| Akatsuki, Inc. |
2,100 | 37,597 | ||||||
| Akebono Brake Industry Co. Ltd. (a) |
17,400 | 13,823 | ||||||
| Akita Bank Ltd. |
4,100 | 55,137 | ||||||
| Albis Co. Ltd. |
1,600 | 29,788 | ||||||
| Alconix Corp. |
6,400 | 60,279 | ||||||
| Alinco, Inc. |
4,600 | 32,660 | ||||||
| Alleanza Holdings Co. Ltd. |
1,400 | 10,349 | ||||||
| Alpen Co. Ltd. (d) |
4,800 | 66,041 | ||||||
| Japan—(Continued) | ||||||||
| Alpha Corp. |
2,200 | 21,294 | ||||||
| AlphaPolis Co. Ltd. (a) |
400 | 6,514 | ||||||
| Alps Alpine Co. Ltd. |
39,000 | 338,692 | ||||||
| Alps Logistics Co. Ltd. |
4,800 | 56,462 | ||||||
| Altech Corp. (d) |
4,520 | 85,149 | ||||||
| Amano Corp. |
14,400 | 340,623 | ||||||
| Amiyaki Tei Co. Ltd. |
1,100 | 29,820 | ||||||
| Amuse, Inc. |
2,800 | 29,406 | ||||||
| Amvis Holdings, Inc. |
3,700 | 78,413 | ||||||
| Anabuki Kosan, Inc. |
800 | 11,380 | ||||||
| Anest Iwata Corp. |
10,400 | 81,587 | ||||||
| AnGes, Inc. (a) (d) |
13,200 | 6,736 | ||||||
| Anicom Holdings, Inc. |
15,600 | 59,965 | ||||||
| Anritsu Corp. |
28,100 | 270,403 | ||||||
| AOI Electronics Co. Ltd. |
1,100 | 22,080 | ||||||
| AOKI Holdings, Inc. |
9,300 | 75,117 | ||||||
| Aoyama Trading Co. Ltd. |
10,400 | 108,965 | ||||||
| Aoyama Zaisan Networks Co. Ltd. |
2,800 | 20,558 | ||||||
| Aozora Bank Ltd. (d) |
12,200 | 264,440 | ||||||
| Apaman Co. Ltd. |
2,100 | 6,642 | ||||||
| Arakawa Chemical Industries Ltd. |
4,600 | 33,097 | ||||||
| Arata Corp. |
7,600 | 167,139 | ||||||
| ARCLANDS Corp. (d) |
9,680 | 115,120 | ||||||
| Arcs Co. Ltd. |
10,864 | 214,145 | ||||||
| ARE Holdings, Inc. |
18,800 | 259,786 | ||||||
| Arealink Co. Ltd. (d) |
3,100 | 59,069 | ||||||
| Argo Graphics, Inc. |
4,800 | 124,270 | ||||||
| Arisawa Manufacturing Co. Ltd. |
9,400 | 69,829 | ||||||
| Artience Co. Ltd. |
8,900 | 165,587 | ||||||
| Artiza Networks, Inc. |
1,800 | 8,687 | ||||||
| Artnature, Inc. |
5,000 | 28,378 | ||||||
| Aruhi Corp. |
2,000 | 11,648 | ||||||
| As One Corp. |
6,700 | 265,454 | ||||||
| Asahi Broadcasting Group Holdings Corp. |
2,400 | 11,300 | ||||||
| Asahi Co. Ltd. |
4,500 | 40,406 | ||||||
| Asahi Diamond Industrial Co. Ltd. |
11,800 | 70,395 | ||||||
| Asahi Intelligence Service Co. Ltd. |
100 | 939 | ||||||
| Asahi Kogyosha Co. Ltd. |
2,400 | 51,873 | ||||||
| Asahi Net, Inc. |
5,000 | 21,805 | ||||||
| Asahi Printing Co. Ltd. |
400 | 2,537 | ||||||
| Asahi Yukizai Corp. |
3,900 | 104,349 | ||||||
| Asahipen Corp. |
400 | 5,003 | ||||||
| Asanuma Corp. |
3,900 | 106,615 | ||||||
| Asax Co. Ltd. |
3,200 | 15,995 | ||||||
| Ascentech KK |
1,400 | 4,964 | ||||||
| Ashimori Industry Co. Ltd. |
1,600 | 22,775 | ||||||
| Asia Pile Holdings Corp. |
3,800 | 18,911 | ||||||
| ASKA Pharmaceutical Holdings Co. Ltd. |
6,200 | 78,345 | ||||||
| ASKUL Corp. |
9,200 | 139,918 | ||||||
| Astena Holdings Co. Ltd. |
9,000 | 30,357 | ||||||
| Atsugi Co. Ltd. (a) |
6,100 | 22,188 | ||||||
| Aucnet, Inc. (d) |
2,700 | 34,916 | ||||||
| Autobacs Seven Co. Ltd. |
18,100 | 200,062 | ||||||
| Avant Group Corp. |
5,800 | 58,318 | ||||||
| Avantia Co. Ltd. |
3,000 | 18,707 | ||||||
| Avex, Inc. |
7,600 | 73,598 | ||||||
| Awa Bank Ltd. |
8,800 | 146,867 | ||||||
See accompanying notes to financial statements.
BHFTII-16
Brighthouse Funds Trust II
Brighthouse/Dimensional International Small Company Portfolio
Schedule of Investments as of December 31, 2023
Common Stocks—(Continued)
| Security Description | Shares | Value | ||||||
| Japan—(Continued) | ||||||||
| Axial Retailing, Inc. |
4,400 | $ | 129,475 | |||||
| Axyz Co. Ltd. |
500 | 10,199 | ||||||
| AZ-COM MARUWA Holdings, Inc. |
7,400 | 80,059 | ||||||
| Bando Chemical Industries Ltd. |
9,100 | 99,872 | ||||||
| Bank of Iwate Ltd. |
3,700 | 65,514 | ||||||
| Bank of Kochi Ltd. |
1,600 | 10,587 | ||||||
| Bank of Nagoya Ltd. |
2,500 | 96,437 | ||||||
| Bank of Saga Ltd. |
2,600 | 33,991 | ||||||
| Bank of the Ryukyus Ltd. |
9,200 | 72,127 | ||||||
| Base Co. Ltd. |
600 | 15,659 | ||||||
| Beauty Garage, Inc. |
1,600 | 24,975 | ||||||
| Belc Co. Ltd. |
2,800 | 124,084 | ||||||
| Bell System24 Holdings, Inc. |
8,200 | 101,679 | ||||||
| Belluna Co. Ltd. |
14,700 | 64,745 | ||||||
| Benefit One, Inc. |
3,900 | 58,514 | ||||||
| Benesse Holdings, Inc. |
6,800 | 125,544 | ||||||
| Bengo4.com, Inc. (a) (d) |
1,400 | 42,995 | ||||||
| Bic Camera, Inc. |
18,000 | 171,428 | ||||||
| BML, Inc. |
6,100 | 129,522 | ||||||
| Bookoff Group Holdings Ltd. (d) |
3,500 | 28,240 | ||||||
| Bourbon Corp. |
2,100 | 34,178 | ||||||
| BP Castrol KK |
2,600 | 15,996 | ||||||
| Br Holdings Corp. |
7,400 | 18,615 | ||||||
| BrainPad, Inc. |
3,300 | 25,718 | ||||||
| Bull-Dog Sauce Co. Ltd. |
1,200 | 18,254 | ||||||
| Bunka Shutter Co. Ltd. |
13,200 | 131,307 | ||||||
| Business Brain Showa-Ota, Inc. |
2,600 | 40,157 | ||||||
| Business Engineering Corp. |
800 | 23,330 | ||||||
| BuySell Technologies Co. Ltd. (d) |
400 | 9,096 | ||||||
| C Uyemura & Co. Ltd. |
2,800 | 218,707 | ||||||
| CAC Holdings Corp. |
3,500 | 43,111 | ||||||
| Canare Electric Co. Ltd. |
800 | 8,666 | ||||||
| Canon Electronics, Inc. |
5,000 | 72,486 | ||||||
| Careerlink Co. Ltd. |
1,000 | 16,667 | ||||||
| Carenet, Inc. (d) |
3,600 | 27,921 | ||||||
| Carlit Holdings Co. Ltd. |
5,500 | 36,127 | ||||||
| Carta Holdings, Inc. (d) |
900 | 8,509 | ||||||
| Casa, Inc. |
1,000 | 6,364 | ||||||
| Casio Computer Co. Ltd. |
3,800 | 32,994 | ||||||
| Cawachi Ltd. |
3,300 | 62,053 | ||||||
| CDS Co. Ltd. |
700 | 8,381 | ||||||
| CellSource Co. Ltd. (d) |
600 | 5,432 | ||||||
| Celsys, Inc. |
6,900 | 35,108 | ||||||
| Central Automotive Products Ltd. |
3,000 | 88,459 | ||||||
| Central Glass Co. Ltd. |
5,100 | 96,200 | ||||||
| Central Security Patrols Co. Ltd. |
2,300 | 41,460 | ||||||
| Central Sports Co. Ltd. |
2,400 | 41,685 | ||||||
| Ceres, Inc. (d) |
1,600 | 13,793 | ||||||
| Change Holdings, Inc. |
5,500 | 55,165 | ||||||
| Charm Care Corp. KK |
3,800 | 34,033 | ||||||
| Chiba Kogyo Bank Ltd. |
9,300 | 52,056 | ||||||
| Chilled & Frozen Logistics Holdings Co. Ltd. |
2,800 | 28,638 | ||||||
| Chino Corp. |
2,700 | 41,765 | ||||||
| Chiyoda Co. Ltd. |
5,800 | 35,296 | ||||||
| Chiyoda Corp. (a) |
38,700 | 93,339 | ||||||
| Chiyoda Integre Co. Ltd. |
2,500 | 49,533 | ||||||
| Chofu Seisakusho Co. Ltd. (d) |
5,100 | 73,456 | ||||||
| Japan—(Continued) | ||||||||
| Chori Co. Ltd. |
3,600 | 71,957 | ||||||
| Chubu Shiryo Co. Ltd. |
6,800 | 52,796 | ||||||
| Chudenko Corp. |
6,600 | 120,488 | ||||||
| Chuetsu Pulp & Paper Co. Ltd. |
1,900 | 24,808 | ||||||
| Chugai Ro Co. Ltd. |
1,400 | 23,157 | ||||||
| Chugin Financial Group, Inc. |
32,800 | 232,493 | ||||||
| Chugoku Electric Power Co., Inc. |
34,400 | 246,224 | ||||||
| Chugoku Marine Paints Ltd. |
9,800 | 114,724 | ||||||
| Chuo Gyorui Co. Ltd. |
200 | 4,381 | ||||||
| Chuo Spring Co. Ltd. |
4,300 | 21,093 | ||||||
| CI Takiron Corp. |
11,000 | 51,141 | ||||||
| Citizen Watch Co. Ltd. |
45,800 | 272,258 | ||||||
| CKD Corp. |
9,700 | 174,141 | ||||||
| Cleanup Corp. |
7,300 | 35,406 | ||||||
| CMIC Holdings Co. Ltd. |
3,100 | 58,010 | ||||||
| CMK Corp. |
12,600 | 73,963 | ||||||
| COLOPL, Inc. |
7,200 | 30,135 | ||||||
| Colowide Co. Ltd. |
19,300 | 303,608 | ||||||
| Como Co. Ltd. |
400 | 7,875 | ||||||
| Computer Engineering & Consulting Ltd. |
1,500 | 16,608 | ||||||
| Computer Institute of Japan Ltd. |
8,160 | 37,333 | ||||||
| Comture Corp. |
5,900 | 77,131 | ||||||
| Core Corp. |
2,500 | 31,065 | ||||||
| Corona Corp. |
4,400 | 29,720 | ||||||
| Cosel Co. Ltd. |
8,100 | 78,748 | ||||||
| Cosmos Initia Co. Ltd. |
3,500 | 23,193 | ||||||
| Cota Co. Ltd. |
5,473 | 60,854 | ||||||
| CRE, Inc. |
2,100 | 20,967 | ||||||
| Create Medic Co. Ltd. |
1,800 | 11,382 | ||||||
| Create Restaurants Holdings, Inc. |
29,400 | 227,619 | ||||||
| Create SD Holdings Co. Ltd. |
5,600 | 121,565 | ||||||
| Creek & River Co. Ltd. |
2,700 | 41,957 | ||||||
| Cresco Ltd. |
4,000 | 54,308 | ||||||
| Cross Cat Co. Ltd. |
1,400 | 10,697 | ||||||
| CTI Engineering Co. Ltd. (d) |
2,900 | 107,876 | ||||||
| CTS Co. Ltd. |
7,700 | 35,461 | ||||||
| Cube System, Inc. |
2,500 | 19,475 | ||||||
| Curves Holdings Co. Ltd. |
13,000 | 59,967 | ||||||
| Cybozu, Inc. (d) |
5,300 | 81,645 | ||||||
| Dai Nippon Toryo Co. Ltd. |
6,000 | 43,341 | ||||||
| Dai-Dan Co. Ltd. |
7,800 | 78,756 | ||||||
| Daicel Corp. |
19,000 | 183,580 | ||||||
| Daido Kogyo Co. Ltd. |
2,000 | 10,284 | ||||||
| Daido Metal Co. Ltd. |
13,400 | 52,151 | ||||||
| Daido Steel Co. Ltd. |
31,500 | 334,216 | ||||||
| Daihatsu Diesel Manufacturing Co. Ltd. |
6,700 | 46,689 | ||||||
| Daihen Corp. |
5,200 | 237,191 | ||||||
| Daiho Corp. |
1,900 | 50,006 | ||||||
| Daiichi Jitsugyo Co. Ltd. |
6,000 | 83,496 | ||||||
| Daiichi Kigenso Kagaku-Kogyo Co. Ltd. |
5,000 | 34,968 | ||||||
| Daiichikosho Co. Ltd. |
6,700 | 98,924 | ||||||
| Daiken Medical Co. Ltd. |
4,400 | 15,978 | ||||||
| Daiki Aluminium Industry Co. Ltd. |
7,000 | 58,467 | ||||||
| Daiki Axis Co. Ltd. (d) |
1,300 | 6,614 | ||||||
| Daiko Denshi Tsushin Ltd. |
1,300 | 8,427 | ||||||
| Daikoku Denki Co. Ltd. (d) |
2,700 | 63,872 | ||||||
| Daikokutenbussan Co. Ltd. |
1,300 | 69,318 | ||||||
See accompanying notes to financial statements.
BHFTII-17
Brighthouse Funds Trust II
Brighthouse/Dimensional International Small Company Portfolio
Schedule of Investments as of December 31, 2023
Common Stocks—(Continued)
| Security Description | Shares | Value | ||||||
| Japan—(Continued) | ||||||||
| Daikyonishikawa Corp. |
11,600 | $ | 56,092 | |||||
| Dainichi Co. Ltd. |
4,100 | 20,528 | ||||||
| Dainichiseika Color & Chemicals Manufacturing Co. Ltd. |
4,000 | 71,543 | ||||||
| Daio Paper Corp. |
16,200 | 128,771 | ||||||
| Daiseki Co. Ltd. |
10,939 | 302,936 | ||||||
| Daishi Hokuetsu Financial Group, Inc. |
9,200 | 249,764 | ||||||
| Daishinku Corp. |
7,400 | 44,985 | ||||||
| Daisue Construction Co. Ltd. |
2,300 | 22,043 | ||||||
| Daito Bank Ltd. |
1,400 | 7,340 | ||||||
| Daito Pharmaceutical Co. Ltd. |
4,356 | 58,771 | ||||||
| Daitron Co. Ltd. |
2,400 | 47,625 | ||||||
| Daiwa Industries Ltd. |
7,700 | 82,281 | ||||||
| Daiwabo Holdings Co. Ltd. |
21,400 | 467,263 | ||||||
| DCM Holdings Co. Ltd. |
25,300 | 231,782 | ||||||
| Dear Life Co. Ltd. |
7,500 | 48,520 | ||||||
| Delica Foods Holdings Co. Ltd. |
600 | 2,483 | ||||||
| DeNA Co. Ltd. |
19,200 | 187,147 | ||||||
| Denka Co. Ltd. |
11,800 | 208,550 | ||||||
| Densan System Holdings Co. Ltd. |
1,700 | 33,299 | ||||||
| Dentsu Soken, Inc. |
1,600 | 66,151 | ||||||
| Denyo Co. Ltd. |
4,800 | 78,824 | ||||||
| Dexerials Corp. |
14,500 | 421,752 | ||||||
| DIC Corp. (d) |
14,500 | 284,483 | ||||||
| Digital Arts, Inc. |
2,900 | 105,164 | ||||||
| Digital Hearts Holdings Co. Ltd. |
2,600 | 18,587 | ||||||
| Digital Holdings, Inc. |
2,100 | 18,611 | ||||||
| Digital Information Technologies Corp. |
2,100 | 24,069 | ||||||
| Dip Corp. |
9,500 | 215,676 | ||||||
| Direct Marketing MiX, Inc. |
3,000 | 9,374 | ||||||
| DKK Co. Ltd. |
2,600 | 40,920 | ||||||
| DKS Co. Ltd. |
2,800 | 38,882 | ||||||
| DMG Mori Co. Ltd. (d) |
23,300 | 444,470 | ||||||
| DMW Corp. |
700 | 18,452 | ||||||
| Doshisha Co. Ltd. |
6,600 | 97,391 | ||||||
| Double Standard, Inc. |
1,400 | 15,503 | ||||||
| Doutor Nichires Holdings Co. Ltd. |
7,600 | 117,189 | ||||||
| Dowa Holdings Co. Ltd. |
6,400 | 233,263 | ||||||
| Drecom Co. Ltd. |
2,700 | 16,254 | ||||||
| DTS Corp. |
10,700 | 266,795 | ||||||
| Duskin Co. Ltd. |
10,900 | 258,840 | ||||||
| DyDo Group Holdings, Inc. |
2,700 | 111,901 | ||||||
| E-Guardian, Inc. (d) |
1,000 | 11,409 | ||||||
| Eagle Industry Co. Ltd. |
6,200 | 70,175 | ||||||
| EAT&HOLDINGS Co. Ltd. |
1,400 | 20,860 | ||||||
| Ebara Foods Industry, Inc. |
700 | 14,125 | ||||||
| Ebara Jitsugyo Co. Ltd. |
3,000 | 62,809 | ||||||
| Ebase Co. Ltd. |
4,800 | 26,518 | ||||||
| Eco’s Co. Ltd. |
2,100 | 35,824 | ||||||
| EDION Corp. (d) |
18,800 | 209,445 | ||||||
| EF-ON, Inc. |
6,100 | 19,403 | ||||||
| eGuarantee, Inc. |
8,200 | 118,757 | ||||||
| Ehime Bank Ltd. |
7,600 | 54,241 | ||||||
| Eidai Co. Ltd. |
10,000 | 15,740 | ||||||
| Eiken Chemical Co. Ltd. |
7,500 | 90,973 | ||||||
| Eizo Corp. |
4,400 | 153,564 | ||||||
| Elan Corp. |
8,200 | 64,750 | ||||||
| Elecom Co. Ltd. |
11,700 | 145,417 | ||||||
| Japan—(Continued) | ||||||||
| Elematec Corp. |
4,700 | 58,290 | ||||||
| EM Systems Co. Ltd. |
3,500 | 17,271 | ||||||
| en Japan, Inc. |
8,300 | 159,962 | ||||||
| Endo Lighting Corp. |
2,600 | 22,071 | ||||||
| Enplas Corp. |
1,700 | 143,647 | ||||||
| Entrust, Inc. |
1,500 | 8,400 | ||||||
| eRex Co. Ltd. (d) |
8,000 | 44,379 | ||||||
| ES-Con Japan Ltd. (a) |
6,700 | 44,171 | ||||||
| Eslead Corp. |
2,000 | 48,635 | ||||||
| ESPEC Corp. |
5,700 | 94,999 | ||||||
| Exedy Corp. |
7,700 | 141,248 | ||||||
| EXEO Group, Inc. |
13,700 | 304,087 | ||||||
| Ezaki Glico Co. Ltd. (d) |
12,600 | 372,646 | ||||||
| F&M Co. Ltd. |
1,600 | 22,558 | ||||||
| F-Tech, Inc. |
6,000 | 26,976 | ||||||
| FALCO HOLDINGS Co. Ltd. |
2,300 | 34,064 | ||||||
| Fancl Corp. |
9,900 | 166,306 | ||||||
| FCC Co. Ltd. |
9,200 | 113,185 | ||||||
| FDK Corp. (a) |
3,600 | 17,850 | ||||||
| Feed One Co. Ltd. |
8,276 | 47,754 | ||||||
| Ferrotec Holdings Corp. |
11,700 | 219,748 | ||||||
| Fibergate, Inc. |
1,800 | 11,719 | ||||||
| FIDEA Holdings Co. Ltd. |
5,050 | 54,044 | ||||||
| Financial Partners Group Co. Ltd. |
8,200 | 97,545 | ||||||
| FINDEX, Inc. |
3,900 | 28,393 | ||||||
| First Bank of Toyama Ltd. |
10,700 | 58,282 | ||||||
| First Brothers Co. Ltd. (d) |
900 | 6,477 | ||||||
| First Juken Co. Ltd. |
1,600 | 11,804 | ||||||
| First-Corp., Inc. |
1,600 | 8,253 | ||||||
| Fixstars Corp. |
4,100 | 37,393 | ||||||
| FJ Next Holdings Co. Ltd. |
3,800 | 30,070 | ||||||
| Focus Systems Corp. |
2,900 | 20,438 | ||||||
| Food & Life Cos. Ltd. |
21,600 | 442,684 | ||||||
| Forval Corp. |
1,900 | 19,486 | ||||||
| Foster Electric Co. Ltd. |
5,600 | 41,522 | ||||||
| FP Corp. |
3,600 | 75,729 | ||||||
| France Bed Holdings Co. Ltd. |
7,900 | 74,749 | ||||||
| FreakOut Holdings, Inc. (a) |
800 | 4,911 | ||||||
| Freebit Co. Ltd. |
2,100 | 21,627 | ||||||
| Freund Corp. |
2,400 | 13,806 | ||||||
| FTGroup Co. Ltd. |
1,500 | 12,613 | ||||||
| Fudo Tetra Corp. |
4,130 | 66,137 | ||||||
| Fuji Corp. |
18,800 | 309,895 | ||||||
| Fuji Corp. Ltd. |
8,600 | 43,024 | ||||||
| Fuji Kyuko Co. Ltd. |
5,300 | 158,272 | ||||||
| Fuji Media Holdings, Inc. |
6,000 | 66,596 | ||||||
| Fuji Oil Co. Ltd. |
16,800 | 43,408 | ||||||
| Fuji Oil Holdings, Inc. |
10,600 | 182,403 | ||||||
| Fuji Pharma Co. Ltd. |
4,600 | 56,669 | ||||||
| Fuji Seal International, Inc. |
12,100 | 146,913 | ||||||
| Fuji Soft, Inc. |
2,000 | 83,653 | ||||||
| Fujibo Holdings, Inc. |
2,800 | 74,405 | ||||||
| Fujicco Co. Ltd. |
5,700 | 78,349 | ||||||
| Fujikura Composites, Inc. |
5,800 | 56,568 | ||||||
| Fujikura Kasei Co. Ltd. |
9,500 | 28,790 | ||||||
| Fujikura Ltd. |
36,600 | 280,413 | ||||||
| Fujimi, Inc. |
9,900 | 219,139 | ||||||
See accompanying notes to financial statements.
BHFTII-18
Brighthouse Funds Trust II
Brighthouse/Dimensional International Small Company Portfolio
Schedule of Investments as of December 31, 2023
Common Stocks—(Continued)
| Security Description | Shares | Value | ||||||
| Japan—(Continued) | ||||||||
| Fujimori Kogyo Co. Ltd. |
4,400 | $ | 117,654 | |||||
| Fujisash Co. Ltd. |
24,500 | 12,515 | ||||||
| Fujishoji Co. Ltd. |
1,300 | 10,882 | ||||||
| Fujita Kanko, Inc. (a) (d) |
400 | 16,682 | ||||||
| Fujitsu General Ltd. |
5,000 | 82,070 | ||||||
| Fujiya Co. Ltd. (d) |
3,300 | 56,954 | ||||||
| FuKoKu Co. Ltd. |
4,000 | 38,025 | ||||||
| Fukuda Corp. (d) |
1,700 | 60,553 | ||||||
| Fukuda Denshi Co. Ltd. |
4,200 | 219,169 | ||||||
| Fukui Bank Ltd. |
5,400 | 62,994 | ||||||
| Fukui Computer Holdings, Inc. |
2,700 | 48,106 | ||||||
| Fukushima Bank Ltd. |
11,200 | 18,554 | ||||||
| Fukushima Galilei Co. Ltd. |
3,800 | 131,158 | ||||||
| Fukuyama Transporting Co. Ltd. |
3,200 | 91,801 | ||||||
| FULLCAST Holdings Co. Ltd. |
5,400 | 70,006 | ||||||
| Funai Soken Holdings, Inc. (d) |
10,370 | 188,093 | ||||||
| Furukawa Battery Co. Ltd. |
5,000 | 30,909 | ||||||
| Furukawa Co. Ltd. |
7,700 | 103,924 | ||||||
| Furukawa Electric Co. Ltd. |
16,000 | 250,854 | ||||||
| Furuno Electric Co. Ltd. |
6,900 | 90,753 | ||||||
| Furuya Metal Co. Ltd. |
1,100 | 74,289 | ||||||
| Furyu Corp. |
4,300 | 42,360 | ||||||
| Fuso Chemical Co. Ltd. (d) |
4,600 | 135,828 | ||||||
| Fuso Pharmaceutical Industries Ltd. |
2,600 | 34,834 | ||||||
| Futaba Corp. |
10,200 | 37,840 | ||||||
| Futaba Industrial Co. Ltd. |
13,900 | 79,439 | ||||||
| Future Corp. |
11,200 | 139,954 | ||||||
| Fuyo General Lease Co. Ltd. |
1,500 | 129,920 | ||||||
| G-7 Holdings, Inc. |
5,800 | 49,258 | ||||||
| G-Tekt Corp. |
6,500 | 78,878 | ||||||
| Gakken Holdings Co. Ltd. |
6,400 | 44,709 | ||||||
| Gakkyusha Co. Ltd. |
2,800 | 39,956 | ||||||
| Gecoss Corp. |
4,600 | 34,494 | ||||||
| Genki Sushi Co. Ltd. |
3,200 | 69,913 | ||||||
| Genky DrugStores Co. Ltd. |
2,400 | 92,792 | ||||||
| Geo Holdings Corp. |
6,000 | 90,151 | ||||||
| Gift Holdings, Inc. |
1,600 | 29,185 | ||||||
| GL Sciences, Inc. |
1,300 | 23,281 | ||||||
| GLOBERIDE, Inc. |
5,200 | 73,837 | ||||||
| Glory Ltd. |
11,100 | 211,305 | ||||||
| GMO Financial Gate, Inc. |
400 | 29,537 | ||||||
| GMO Financial Holdings, Inc. (d) |
8,000 | 42,629 | ||||||
| GMO GlobalSign Holdings KK |
1,000 | 19,352 | ||||||
| GMO internet group, Inc. |
4,900 | 88,781 | ||||||
| Godo Steel Ltd. |
2,300 | 74,895 | ||||||
| Goldcrest Co. Ltd. |
3,830 | 59,886 | ||||||
| Golf Digest Online, Inc. (d) |
900 | 4,347 | ||||||
| Good Com Asset Co. Ltd. |
3,200 | 16,415 | ||||||
| Grandy House Corp. |
3,600 | 15,663 | ||||||
| gremz, Inc. |
900 | 13,359 | ||||||
| GS Yuasa Corp. |
15,900 | 223,094 | ||||||
| GSI Creos Corp. |
2,800 | 43,312 | ||||||
| Gun-Ei Chemical Industry Co. Ltd. |
1,800 | 39,537 | ||||||
| GungHo Online Entertainment, Inc. |
10,500 | 174,743 | ||||||
| Gunma Bank Ltd. |
79,600 | 388,822 | ||||||
| Gunze Ltd. |
3,700 | 131,047 | ||||||
| H-One Co. Ltd. |
6,000 | 33,461 | ||||||
| Japan—(Continued) | ||||||||
| H.U. Group Holdings, Inc. |
14,400 | 271,651 | ||||||
| H2O Retailing Corp. |
22,000 | 237,898 | ||||||
| HABA Laboratories, Inc. |
700 | 10,778 | ||||||
| Hagihara Industries, Inc. |
4,000 | 40,898 | ||||||
| Hagiwara Electric Holdings Co. Ltd. - Class C |
2,400 | 82,549 | ||||||
| Hakudo Co. Ltd. |
2,400 | 39,547 | ||||||
| Hakuto Co. Ltd. |
3,100 | 119,047 | ||||||
| Halows Co. Ltd. |
2,100 | 63,780 | ||||||
| Hamakyorex Co. Ltd. |
4,600 | 129,390 | ||||||
| Hamee Corp. (d) |
1,800 | 12,696 | ||||||
| Handsman Co. Ltd. |
800 | 5,343 | ||||||
| Hanwa Co. Ltd. |
8,000 | 282,615 | ||||||
| Happinet Corp. |
4,100 | 80,151 | ||||||
| Hard Off Corp. Co. Ltd. |
3,700 | 43,951 | ||||||
| Harima Chemicals Group, Inc. |
4,300 | 24,804 | ||||||
| Harmonic Drive Systems, Inc. |
1,200 | 35,232 | ||||||
| Hashimoto Sogyo Holdings Co. Ltd. |
1,400 | 12,866 | ||||||
| Hazama Ando Corp. |
42,990 | 339,469 | ||||||
| Heiwa Corp. |
15,000 | 222,931 | ||||||
| Heiwa Real Estate Co. Ltd. |
5,700 | 152,036 | ||||||
| Heiwado Co. Ltd. |
7,500 | 113,301 | ||||||
| Hennge KK (a) |
600 | 5,110 | ||||||
| HI-LEX Corp. |
5,500 | 52,888 | ||||||
| Hibiya Engineering Ltd. (d) |
5,100 | 89,125 | ||||||
| Hiday Hidaka Corp. |
500 | 10,069 | ||||||
| Himaraya Co. Ltd. |
2,600 | 16,924 | ||||||
| Hino Motors Ltd. (a) |
13,800 | 45,168 | ||||||
| Hioki EE Corp. (d) |
2,600 | 116,134 | ||||||
| Hirakawa Hewtech Corp. |
2,000 | 18,769 | ||||||
| Hirano Tecseed Co. Ltd. (d) |
1,300 | 16,555 | ||||||
| Hirata Corp. |
1,000 | 44,445 | ||||||
| Hirogin Holdings, Inc. |
61,700 | 394,168 | ||||||
| Hirose Tusyo, Inc. |
300 | 6,342 | ||||||
| Hiroshima Electric Railway Co. Ltd. |
1,500 | 8,167 | ||||||
| Hiroshima Gas Co. Ltd. |
7,000 | 18,975 | ||||||
| Hisaka Works Ltd. |
5,500 | 35,936 | ||||||
| Hitachi Zosen Corp. |
41,300 | 273,786 | ||||||
| Hito Communications Holdings, Inc. |
1,700 | 14,702 | ||||||
| Hochiki Corp. |
4,600 | 57,020 | ||||||
| Hodogaya Chemical Co. Ltd. |
1,800 | 47,402 | ||||||
| Hogy Medical Co. Ltd. |
3,700 | 94,735 | ||||||
| Hokkaido Electric Power Co., Inc. |
46,200 | 204,193 | ||||||
| Hokkaido Gas Co. Ltd. |
3,900 | 60,815 | ||||||
| Hokkan Holdings Ltd. |
3,300 | 38,012 | ||||||
| Hokko Chemical Industry Co. Ltd. |
4,800 | 36,475 | ||||||
| Hokkoku Financial Holdings, Inc. |
4,400 | 144,046 | ||||||
| Hokuetsu Corp. (d) |
27,800 | 278,924 | ||||||
| Hokuetsu Industries Co. Ltd. (d) |
5,900 | 105,376 | ||||||
| Hokuhoku Financial Group, Inc. |
25,600 | 276,530 | ||||||
| Hokuriku Electric Industry Co. Ltd. |
2,800 | 27,013 | ||||||
| Hokuriku Electric Power Co. (a) |
47,000 | 243,833 | ||||||
| Hokuriku Electrical Construction Co. Ltd. |
3,600 | 26,044 | ||||||
| Hokuriku Gas Co. Ltd. |
1,000 | 24,016 | ||||||
| Hokuto Corp. |
6,300 | 77,538 | ||||||
| Honeys Holdings Co. Ltd. |
4,630 | 57,207 | ||||||
| Honma Golf Ltd. |
27,000 | 11,274 | ||||||
| Hoosiers Holdings Co. Ltd. |
8,000 | 60,260 | ||||||
See accompanying notes to financial statements.
BHFTII-19
Brighthouse Funds Trust II
Brighthouse/Dimensional International Small Company Portfolio
Schedule of Investments as of December 31, 2023
Common Stocks—(Continued)
| Security Description | Shares | Value | ||||||
| Japan—(Continued) | ||||||||
| Horiba Ltd. |
2,200 | $ | 171,416 | |||||
| Hoshi Iryo-Sanki Co. Ltd. |
300 | 8,537 | ||||||
| Hosiden Corp. |
11,800 | 143,483 | ||||||
| Hosokawa Micron Corp. |
3,600 | 100,444 | ||||||
| Hotland Co. Ltd. |
3,200 | 42,967 | ||||||
| House Foods Group, Inc. |
2,400 | 52,951 | ||||||
| Howa Machinery Ltd. |
4,400 | 23,791 | ||||||
| HS Holdings Co. Ltd. |
5,000 | 35,732 | ||||||
| Hyakugo Bank Ltd. |
49,600 | 187,121 | ||||||
| Hyakujushi Bank Ltd. |
5,800 | 98,791 | ||||||
| I’ll, Inc. |
900 | 20,312 | ||||||
| I’rom Group Co. Ltd. |
2,700 | 38,400 | ||||||
| i-mobile Co. Ltd. |
5,400 | 17,434 | ||||||
| I-NE Co. Ltd. |
800 | 13,902 | ||||||
| I-Net Corp. |
3,520 | 46,036 | ||||||
| I-PEX, Inc. (d) |
3,100 | 33,786 | ||||||
| IBJ, Inc. |
4,900 | 24,604 | ||||||
| Ichigo, Inc. |
9,600 | 22,955 | ||||||
| Ichiken Co. Ltd. |
1,800 | 29,174 | ||||||
| Ichikoh Industries Ltd. |
9,000 | 32,215 | ||||||
| Ichimasa Kamaboko Co. Ltd. |
1,100 | 5,801 | ||||||
| Ichinen Holdings Co. Ltd. |
5,200 | 57,563 | ||||||
| Ichiyoshi Securities Co. Ltd. |
10,100 | 50,591 | ||||||
| Icom, Inc. |
2,000 | 50,949 | ||||||
| ID Holdings Corp. |
3,899 | 46,509 | ||||||
| Idec Corp. |
7,500 | 152,349 | ||||||
| IDOM, Inc. |
17,200 | 118,314 | ||||||
| Iino Kaiun Kaisha Ltd. |
18,200 | 152,736 | ||||||
| IJTT Co. Ltd. (d) |
9,000 | 54,769 | ||||||
| Imagica Group, Inc. |
4,500 | 20,297 | ||||||
| Imasen Electric Industrial |
2,000 | 9,431 | ||||||
| Imuraya Group Co. Ltd. |
2,900 | 48,540 | ||||||
| Inaba Denki Sangyo Co. Ltd. |
13,000 | 312,776 | ||||||
| Inaba Seisakusho Co. Ltd. (d) |
3,200 | 33,225 | ||||||
| Inabata & Co. Ltd. |
10,400 | 231,204 | ||||||
| Inageya Co. Ltd. |
800 | 7,197 | ||||||
| Ines Corp. |
5,100 | 58,125 | ||||||
| Infocom Corp. |
4,500 | 78,908 | ||||||
| Innotech Corp. |
3,900 | 46,359 | ||||||
| Insource Co. Ltd. (d) |
11,200 | 69,958 | ||||||
| Intage Holdings, Inc. (d) |
2,600 | 29,897 | ||||||
| Integrated Design & Engineering Holdings Co. Ltd. |
3,400 | 81,498 | ||||||
| Intelligent Wave, Inc. (d) |
3,400 | 25,108 | ||||||
| Inter Action Corp. |
2,700 | 20,689 | ||||||
| Inui Global Logistics Co. Ltd. (d) |
3,000 | 23,015 | ||||||
| IR Japan Holdings Ltd. |
2,000 | 21,575 | ||||||
| Iriso Electronics Co. Ltd. |
5,500 | 143,882 | ||||||
| ISB Corp. |
400 | 4,155 | ||||||
| Ise Chemicals Corp. |
600 | 36,454 | ||||||
| Iseki & Co. Ltd. |
5,700 | 43,633 | ||||||
| Ishihara Chemical Co. Ltd. |
1,200 | 15,621 | ||||||
| Ishihara Sangyo Kaisha Ltd. |
7,600 | 72,368 | ||||||
| Ishii Iron Works Co. Ltd. |
900 | 17,330 | ||||||
| Ishizuka Glass Co. Ltd. |
500 | 11,928 | ||||||
| Itfor, Inc. |
7,800 | 66,023 | ||||||
| ITmedia, Inc. |
1,500 | 10,387 | ||||||
| Itochu Enex Co. Ltd. |
13,300 | 144,798 | ||||||
| Japan—(Continued) | ||||||||
| Itochu-Shokuhin Co. Ltd. |
1,600 | 89,575 | ||||||
| Itoham Yonekyu Holdings, Inc. |
5,900 | 161,339 | ||||||
| Itoki Corp. (d) |
9,900 | 94,165 | ||||||
| IwaiCosmo Holdings, Inc. |
5,100 | 66,319 | ||||||
| Iwaki Co. Ltd. |
1,300 | 19,076 | ||||||
| Iwatsuka Confectionery Co. Ltd. |
1,000 | 35,886 | ||||||
| Iyogin Holdings, Inc. |
35,300 | 236,407 | ||||||
| Izumi Co. Ltd. |
7,400 | 189,588 | ||||||
| J Trust Co. Ltd. (d) |
16,800 | 54,552 | ||||||
| J-Lease Co. Ltd. |
600 | 9,128 | ||||||
| J-Oil Mills, Inc. |
5,700 | 78,083 | ||||||
| J-Stream, Inc. |
1,000 | 2,670 | ||||||
| JAC Recruitment Co. Ltd. |
15,600 | 71,721 | ||||||
| Jaccs Co. Ltd. (d) |
5,700 | 209,302 | ||||||
| JAFCO Group Co. Ltd. |
8,900 | 103,911 | ||||||
| JANOME Corp. |
7,099 | 34,083 | ||||||
| Japan Aviation Electronics Industry Ltd. |
12,300 | 280,355 | ||||||
| Japan Cash Machine Co. Ltd. |
1,200 | 11,197 | ||||||
| Japan Communications, Inc. (a) |
35,600 | 57,434 | ||||||
| Japan Electronic Materials Corp. |
2,400 | 30,661 | ||||||
| Japan Elevator Service Holdings Co. Ltd. |
17,300 | 286,059 | ||||||
| Japan Foundation Engineering Co. Ltd. |
7,900 | 24,414 | ||||||
| Japan Investment Adviser Co. Ltd. (d) |
3,200 | 30,087 | ||||||
| Japan Lifeline Co. Ltd. |
15,500 | 138,503 | ||||||
| Japan Material Co. Ltd. |
15,600 | 276,415 | ||||||
| Japan Medical Dynamic Marketing, Inc. |
4,400 | 23,644 | ||||||
| Japan Oil Transportation Co. Ltd. |
700 | 14,207 | ||||||
| Japan Petroleum Exploration Co. Ltd. |
8,800 | 326,124 | ||||||
| Japan Property Management Center Co. Ltd. |
4,100 | 32,517 | ||||||
| Japan Pulp & Paper Co. Ltd. |
2,700 | 95,022 | ||||||
| Japan Pure Chemical Co. Ltd. |
500 | 8,626 | ||||||
| Japan Securities Finance Co. Ltd. |
20,400 | 223,673 | ||||||
| Japan Steel Works Ltd. |
3,800 | 65,807 | ||||||
| Japan Transcity Corp. |
9,700 | 42,174 | ||||||
| Japan Wool Textile Co. Ltd. |
12,600 | 119,771 | ||||||
| Jastec Co. Ltd. |
4,300 | 43,487 | ||||||
| JBCC Holdings, Inc. |
3,800 | 99,749 | ||||||
| JCU Corp. |
5,700 | 160,512 | ||||||
| Jeol Ltd. |
9,700 | 423,872 | ||||||
| JFE Systems, Inc. |
700 | 18,134 | ||||||
| JIG-SAW, Inc. (a) (d) |
900 | 29,444 | ||||||
| Jimoto Holdings, Inc. |
6,790 | 26,495 | ||||||
| JINS Holdings, Inc. (d) |
3,200 | 106,475 | ||||||
| JINUSHI Co. Ltd. (d) |
3,500 | 54,099 | ||||||
| JK Holdings Co. Ltd. |
2,800 | 20,597 | ||||||
| JM Holdings Co. Ltd. |
3,200 | 50,247 | ||||||
| JMS Co. Ltd. |
6,400 | 22,775 | ||||||
| Joban Kosan Co. Ltd. (a) |
1,700 | 14,778 | ||||||
| Joshin Denki Co. Ltd. |
5,000 | 85,990 | ||||||
| Joyful Honda Co. Ltd. (d) |
11,900 | 155,653 | ||||||
| JP-Holdings, Inc. |
17,900 | 56,962 | ||||||
| JSB Co. Ltd. |
2,000 | 35,476 | ||||||
| JSP Corp. |
3,900 | 50,621 | ||||||
| Juki Corp. (d) |
7,200 | 23,551 | ||||||
| Juroku Financial Group, Inc. |
7,300 | 192,187 | ||||||
| Justsystems Corp. |
8,000 | 185,142 | ||||||
| JVCKenwood Corp. |
44,100 | 230,970 | ||||||
See accompanying notes to financial statements.
BHFTII-20
Brighthouse Funds Trust II
Brighthouse/Dimensional International Small Company Portfolio
Schedule of Investments as of December 31, 2023
Common Stocks—(Continued)
| Security Description | Shares | Value | ||||||
| Japan—(Continued) | ||||||||
| K&O Energy Group, Inc. |
2,800 | $ | 43,967 | |||||
| K’s Holdings Corp. |
30,100 | 281,910 | ||||||
| Kadoya Sesame Mills, Inc. |
800 | 20,619 | ||||||
| Kaga Electronics Co. Ltd. |
4,300 | 186,215 | ||||||
| Kagome Co. Ltd. |
6,400 | 142,324 | ||||||
| Kakaku.com, Inc. |
2,600 | 32,109 | ||||||
| Kaken Pharmaceutical Co. Ltd. |
5,200 | 123,734 | ||||||
| Kakiyasu Honten Co. Ltd. |
2,500 | 43,695 | ||||||
| Kamakura Shinsho Ltd. (d) |
3,700 | 14,479 | ||||||
| Kameda Seika Co. Ltd. |
3,500 | 101,781 | ||||||
| Kamei Corp. |
5,700 | 68,992 | ||||||
| Kanaden Corp. |
3,800 | 41,861 | ||||||
| Kanagawa Chuo Kotsu Co. Ltd. |
2,400 | 50,984 | ||||||
| Kanamic Network Co. Ltd. |
900 | 2,686 | ||||||
| Kanamoto Co. Ltd. |
7,600 | 157,354 | ||||||
| Kandenko Co. Ltd. |
21,900 | 213,686 | ||||||
| Kaneka Corp. |
11,100 | 281,383 | ||||||
| Kaneko Seeds Co. Ltd. |
1,300 | 12,892 | ||||||
| Kanematsu Corp. |
20,400 | 297,919 | ||||||
| Kanemi Co. Ltd. |
100 | 2,208 | ||||||
| Kanto Denka Kogyo Co. Ltd. |
12,100 | 73,418 | ||||||
| Kappa Create Co. Ltd. (a) |
1,000 | 12,077 | ||||||
| Kasai Kogyo Co. Ltd. (a) |
8,600 | 11,720 | ||||||
| Katakura & Co.-op Agri Corp. |
1,600 | 11,953 | ||||||
| Katakura Industries Co. Ltd. |
6,100 | 70,781 | ||||||
| Katitas Co. Ltd. (d) |
11,600 | 179,586 | ||||||
| Kato Sangyo Co. Ltd. |
6,000 | 195,177 | ||||||
| Kato Works Co. Ltd. |
3,800 | 33,941 | ||||||
| Kawada Technologies, Inc. |
900 | 41,609 | ||||||
| Kawai Musical Instruments Manufacturing Co. Ltd. |
1,600 | 40,307 | ||||||
| KeePer Technical Laboratory Co. Ltd. |
3,000 | 147,835 | ||||||
| Keihanshin Building Co. Ltd. |
8,200 | 82,565 | ||||||
| Keihin Co. Ltd. |
2,300 | 28,563 | ||||||
| KEIWA, Inc. (d) |
1,200 | 10,860 | ||||||
| Keiyo Bank Ltd. |
26,900 | 129,628 | ||||||
| Kenko Mayonnaise Co. Ltd. |
4,100 | 49,281 | ||||||
| KFC Holdings Japan Ltd. |
4,000 | 87,063 | ||||||
| KH Neochem Co. Ltd. (d) |
9,400 | 150,920 | ||||||
| Ki-Star Real Estate Co. Ltd. |
2,600 | 57,914 | ||||||
| Kibun Foods, Inc. |
1,500 | 12,943 | ||||||
| Kimoto Co. Ltd. |
14,900 | 20,589 | ||||||
| Kimura Chemical Plants Co. Ltd. |
3,300 | 17,467 | ||||||
| King Jim Co. Ltd. (d) |
1,400 | 8,627 | ||||||
| Kintetsu Department Store Co. Ltd. |
400 | 7,510 | ||||||
| Kissei Pharmaceutical Co. Ltd. |
6,800 | 148,648 | ||||||
| Kita-Nippon Bank Ltd. |
2,200 | 32,961 | ||||||
| Kitagawa Corp. (a) |
3,100 | 30,618 | ||||||
| Kitano Construction Corp. |
1,400 | 31,454 | ||||||
| Kitz Corp. (d) |
19,100 | 162,790 | ||||||
| Kiyo Bank Ltd. |
15,500 | 173,295 | ||||||
| Koa Corp. |
8,400 | 92,020 | ||||||
| Koatsu Gas Kogyo Co. Ltd. |
9,100 | 57,178 | ||||||
| Kobe Electric Railway Co. Ltd. (a) |
1,400 | 29,033 | ||||||
| Kohnan Shoji Co. Ltd. |
5,900 | 163,973 | ||||||
| Kohsoku Corp. |
3,300 | 48,907 | ||||||
| Koike Sanso Kogyo Co. Ltd. |
700 | 20,941 | ||||||
| Kojima Co. Ltd. (d) |
7,800 | 43,229 | ||||||
| Japan—(Continued) | ||||||||
| Kokuyo Co. Ltd. |
20,100 | 326,394 | ||||||
| Komatsu Matere Co. Ltd. |
4,200 | 23,791 | ||||||
| Komatsu Wall Industry Co. Ltd. |
1,800 | 36,633 | ||||||
| KOMEDA Holdings Co. Ltd. |
12,600 | 244,993 | ||||||
| Komehyo Holdings Co. Ltd. |
1,300 | 35,606 | ||||||
| Komeri Co. Ltd. |
7,400 | 162,028 | ||||||
| Komori Corp. |
11,000 | 89,054 | ||||||
| Konaka Co. Ltd. |
7,300 | 20,851 | ||||||
| Kondotec, Inc. |
6,900 | 56,517 | ||||||
| Konica Minolta, Inc. (a) |
93,000 | 271,417 | ||||||
| Konishi Co. Ltd. |
13,000 | 124,377 | ||||||
| Konoike Transport Co. Ltd. |
6,900 | 95,258 | ||||||
| Konoshima Chemical Co. Ltd. |
600 | 5,935 | ||||||
| Kosaido Holdings Co. Ltd. |
18,500 | 99,490 | ||||||
| Koshidaka Holdings Co. Ltd. |
2,400 | 18,475 | ||||||
| Kotobuki Spirits Co. Ltd. |
13,000 | 198,571 | ||||||
| Kotobukiya Co. Ltd. (d) |
1,500 | 17,125 | ||||||
| Kozo Keikaku Engineering, Inc. |
1,200 | 32,312 | ||||||
| KPP Group Holdings Co. Ltd. |
3,700 | 17,871 | ||||||
| Krosaki Harima Corp. |
1,300 | 107,901 | ||||||
| KRS Corp. (d) |
4,400 | 28,124 | ||||||
| KU Holdings Co. Ltd. |
5,500 | 43,135 | ||||||
| Kumagai Gumi Co. Ltd. |
8,000 | 204,337 | ||||||
| Kumiai Chemical Industry Co. Ltd. |
10,995 | 62,832 | ||||||
| Kunimine Industries Co. Ltd. |
1,200 | 8,448 | ||||||
| Kurabo Industries Ltd. |
4,200 | 86,228 | ||||||
| Kureha Corp. |
11,400 | 232,491 | ||||||
| Kurimoto Ltd. |
2,800 | 60,932 | ||||||
| Kuriyama Holdings Corp. |
2,300 | 14,676 | ||||||
| Kusuri No. Aoki Holdings Co. Ltd. |
9,900 | 225,045 | ||||||
| KYB Corp. |
3,800 | 131,847 | ||||||
| Kyodo Printing Co. Ltd. |
2,100 | 48,044 | ||||||
| Kyoei Steel Ltd. |
4,700 | 66,424 | ||||||
| Kyokuto Boeki Kaisha Ltd. |
3,600 | 49,894 | ||||||
| Kyokuto Kaihatsu Kogyo Co. Ltd. |
8,800 | 122,358 | ||||||
| Kyokuto Securities Co. Ltd. |
4,100 | 27,932 | ||||||
| Kyokuyo Co. Ltd. |
2,700 | 72,130 | ||||||
| Kyorin Pharmaceutical Co. Ltd. |
10,200 | 128,613 | ||||||
| KYORITSU Co. Ltd. |
6,800 | 8,721 | ||||||
| Kyoritsu Maintenance Co. Ltd. (d) |
6,600 | 279,841 | ||||||
| Kyosan Electric Manufacturing Co. Ltd. |
12,600 | 42,079 | ||||||
| Kyowa Electronic Instruments Co. Ltd. |
8,000 | 22,843 | ||||||
| Kyowa Leather Cloth Co. Ltd. |
3,300 | 16,832 | ||||||
| Kyudenko Corp. |
8,900 | 320,272 | ||||||
| Kyushu Financial Group, Inc. |
49,100 | 282,989 | ||||||
| LAC Co. Ltd. |
5,900 | 29,466 | ||||||
| Lacto Japan Co. Ltd. |
1,400 | 19,030 | ||||||
| LEC, Inc. |
5,000 | 36,708 | ||||||
| Leopalace21 Corp. (a) |
39,300 | 119,000 | ||||||
| Life Corp. |
4,000 | 93,598 | ||||||
| LIFULL Co. Ltd. |
17,000 | 21,531 | ||||||
| LIKE, Inc. (d) |
2,100 | 21,726 | ||||||
| Linical Co. Ltd. |
2,600 | 9,735 | ||||||
| Link & Motivation, Inc. |
8,900 | 35,041 | ||||||
| Lintec Corp. |
10,500 | 204,395 | ||||||
| LITALICO, Inc. |
4,700 | 68,516 | ||||||
| Look Holdings, Inc. (d) |
2,200 | 36,011 | ||||||
See accompanying notes to financial statements.
BHFTII-21
Brighthouse Funds Trust II
Brighthouse/Dimensional International Small Company Portfolio
Schedule of Investments as of December 31, 2023
Common Stocks—(Continued)
| Security Description | Shares | Value | ||||||
| Japan—(Continued) | ||||||||
| M&A Capital Partners Co. Ltd. |
3,600 | $ | 62,056 | |||||
| m-up Holdings, Inc. |
7,400 | 56,348 | ||||||
| Mabuchi Motor Co. Ltd. (d) |
24,800 | 410,519 | ||||||
| Macromill, Inc. (d) |
12,100 | 67,153 | ||||||
| Maeda Kosen Co. Ltd. |
5,100 | 109,611 | ||||||
| Maezawa Kasei Industries Co. Ltd. (d) |
3,200 | 34,563 | ||||||
| Maezawa Kyuso Industries Co. Ltd. |
5,800 | 54,447 | ||||||
| Makino Milling Machine Co. Ltd. |
5,300 | 220,015 | ||||||
| Management Solutions Co. Ltd. |
1,800 | 43,769 | ||||||
| Mandom Corp. |
8,900 | 80,609 | ||||||
| Mani, Inc. |
18,500 | 279,351 | ||||||
| MarkLines Co. Ltd. |
3,000 | 62,469 | ||||||
| Mars Group Holdings Corp. |
2,200 | 38,395 | ||||||
| Marubun Corp. |
4,200 | 47,916 | ||||||
| Marudai Food Co. Ltd. |
4,700 | 54,166 | ||||||
| Marufuji Sheet Piling Co. Ltd. |
1,300 | 24,067 | ||||||
| Maruha Nichiro Corp. |
9,000 | 176,984 | ||||||
| Maruichi Steel Tube Ltd. |
9,300 | 241,447 | ||||||
| MARUKA FURUSATO Corp. |
993 | 18,499 | ||||||
| Marumae Co. Ltd. |
2,500 | 36,823 | ||||||
| Marusan Securities Co. Ltd. (d) |
16,400 | 97,891 | ||||||
| Maruwa Co. Ltd. |
1,300 | 270,652 | ||||||
| Maruyama Manufacturing Co., Inc. |
1,500 | 27,566 | ||||||
| Maruzen CHI Holdings Co. Ltd. |
11,900 | 27,739 | ||||||
| Maruzen Co. Ltd. |
900 | 17,671 | ||||||
| Maruzen Showa Unyu Co. Ltd. |
2,800 | 77,494 | ||||||
| Marvelous, Inc. |
9,500 | 47,993 | ||||||
| Matching Service Japan Co. Ltd. |
1,200 | 9,630 | ||||||
| Matsuda Sangyo Co. Ltd. |
3,600 | 61,074 | ||||||
| Matsui Construction Co. Ltd. |
6,400 | 37,968 | ||||||
| Matsui Securities Co. Ltd. |
31,000 | 160,965 | ||||||
| Matsuyafoods Holdings Co. Ltd. |
400 | 15,621 | ||||||
| Max Co. Ltd. |
7,700 | 178,992 | ||||||
| Maxell Ltd. |
12,900 | 142,607 | ||||||
| Maxvalu Tokai Co. Ltd. |
3,500 | 73,890 | ||||||
| MCJ Co. Ltd. |
17,300 | 134,399 | ||||||
| MEC Co. Ltd. |
4,200 | 130,319 | ||||||
| Media Do Co. Ltd. (a) |
2,100 | 21,431 | ||||||
| Medical Data Vision Co. Ltd. (d) |
6,800 | 31,451 | ||||||
| Medical System Network Co. Ltd. |
7,000 | 32,186 | ||||||
| Medikit Co. Ltd. |
1,300 | 26,711 | ||||||
| Medius Holdings Co. Ltd. |
1,800 | 9,830 | ||||||
| Medley, Inc. (a) |
1,000 | 31,059 | ||||||
| MedPeer, Inc. |
2,600 | 13,166 | ||||||
| Megachips Corp. |
4,200 | 138,933 | ||||||
| Megmilk Snow Brand Co. Ltd. |
10,800 | 161,762 | ||||||
| Meidensha Corp. |
9,000 | 154,962 | ||||||
| Meiji Electric Industries Co. Ltd. |
1,000 | 9,888 | ||||||
| Meiji Shipping Group Co. Ltd. |
4,300 | 23,172 | ||||||
| Meiko Electronics Co. Ltd. |
5,600 | 164,546 | ||||||
| Meisei Industrial Co. Ltd. |
9,900 | 75,122 | ||||||
| MEITEC Group Holdings, Inc. |
17,800 | 355,773 | ||||||
| Meito Sangyo Co. Ltd. |
3,000 | 36,046 | ||||||
| Meiwa Corp. (d) |
8,100 | 37,246 | ||||||
| Meiwa Estate Co. Ltd. |
5,200 | 44,752 | ||||||
| Melco Holdings, Inc. |
1,500 | 36,618 | ||||||
| Members Co. Ltd. |
1,800 | 12,241 | ||||||
| Japan—(Continued) | ||||||||
| Menicon Co. Ltd. |
16,300 | 270,772 | ||||||
| Mercuria Holdings Co. Ltd. |
2,100 | 10,429 | ||||||
| MetaReal Corp. (a) |
1,400 | 11,531 | ||||||
| METAWATER Co. Ltd. |
3,600 | 55,744 | ||||||
| Micronics Japan Co. Ltd. (d) |
6,300 | 162,914 | ||||||
| Midac Holdings Co. Ltd. |
900 | 13,417 | ||||||
| Mie Kotsu Group Holdings, Inc. |
8,600 | 36,736 | ||||||
| Mikuni Corp. |
7,300 | 22,653 | ||||||
| Milbon Co. Ltd. (d) |
6,720 | 175,714 | ||||||
| MIMAKI ENGINEERING Co. Ltd. |
1,700 | 11,107 | ||||||
| Mimasu Semiconductor Industry Co. Ltd. |
4,400 | 99,457 | ||||||
| Ministop Co. Ltd. |
4,300 | 46,643 | ||||||
| Miraial Co. Ltd. |
2,900 | 29,403 | ||||||
| Mirait One Corp. |
21,880 | 287,949 | ||||||
| Mirarth Holdings, Inc. |
24,900 | 81,747 | ||||||
| Miroku Jyoho Service Co. Ltd. |
5,500 | 68,314 | ||||||
| Mitani Corp. |
22,700 | 313,528 | ||||||
| Mitani Sekisan Co. Ltd. |
2,100 | 70,926 | ||||||
| Mito Securities Co. Ltd. |
10,400 | 30,973 | ||||||
| Mitsuba Corp. |
9,300 | 64,332 | ||||||
| Mitsubishi Kakoki Kaisha Ltd. |
800 | 18,495 | ||||||
| Mitsubishi Logisnext Co. Ltd. |
8,400 | 82,021 | ||||||
| Mitsubishi Logistics Corp. |
7,800 | 234,394 | ||||||
| Mitsubishi Materials Corp. |
16,200 | 280,505 | ||||||
| Mitsubishi Paper Mills Ltd. |
8,800 | 34,438 | ||||||
| Mitsubishi Pencil Co. Ltd. |
8,200 | 121,383 | ||||||
| Mitsubishi Research Institute, Inc. |
2,000 | 65,499 | ||||||
| Mitsubishi Shokuhin Co. Ltd. |
4,300 | 146,114 | ||||||
| Mitsubishi Steel Manufacturing Co. Ltd. |
4,400 | 46,033 | ||||||
| Mitsuboshi Belting Ltd. |
4,400 | 136,465 | ||||||
| Mitsui DM Sugar Holdings Co. Ltd. (d) |
4,800 | 100,996 | ||||||
| Mitsui E&S Co. Ltd. |
24,900 | 124,247 | ||||||
| Mitsui High-Tec, Inc. (d) |
2,800 | 145,339 | ||||||
| Mitsui Matsushima Holdings Co. Ltd. - Class C |
3,100 | 57,904 | ||||||
| Mitsui Mining & Smelting Co. Ltd. |
13,900 | 426,414 | ||||||
| Mitsui-Soko Holdings Co. Ltd. |
5,700 | 189,738 | ||||||
| Mitsuuroko Group Holdings Co. Ltd. |
7,800 | 87,655 | ||||||
| MIXI, Inc. |
9,800 | 163,774 | ||||||
| Miyaji Engineering Group, Inc. |
2,900 | 65,614 | ||||||
| Miyazaki Bank Ltd. |
4,100 | 76,026 | ||||||
| Miyoshi Oil & Fat Co. Ltd. |
2,800 | 25,107 | ||||||
| Mizuho Leasing Co. Ltd. |
6,700 | 229,388 | ||||||
| Mizuho Medy Co. Ltd. (d) |
500 | 11,117 | ||||||
| Mizuno Corp. |
4,700 | 130,585 | ||||||
| Mochida Pharmaceutical Co. Ltd. |
4,700 | 108,792 | ||||||
| Modec, Inc. (a) |
800 | 13,124 | ||||||
| Monex Group, Inc. |
45,500 | 231,228 | ||||||
| Money Partners Group Co. Ltd. |
7,100 | 14,595 | ||||||
| Monogatari Corp. (d) |
7,800 | 242,078 | ||||||
| MORESCO Corp. |
2,500 | 22,886 | ||||||
| Morinaga & Co. Ltd. |
17,600 | 318,742 | ||||||
| Morinaga Milk Industry Co. Ltd. |
17,600 | 340,280 | ||||||
| Moriroku Holdings Co. Ltd. |
800 | 15,770 | ||||||
| Morita Holdings Corp. |
8,800 | 96,770 | ||||||
| Morito Co. Ltd. |
3,400 | 30,922 | ||||||
| Morozoff Ltd. |
1,800 | 48,470 | ||||||
| Mortgage Service Japan Ltd. |
1,200 | 4,387 | ||||||
See accompanying notes to financial statements.
BHFTII-22
Brighthouse Funds Trust II
Brighthouse/Dimensional International Small Company Portfolio
Schedule of Investments as of December 31, 2023
Common Stocks—(Continued)
| Security Description | Shares | Value | ||||||
| Japan—(Continued) | ||||||||
| Mory Industries, Inc. |
1,600 | $ | 47,423 | |||||
| MRK Holdings, Inc. (d) |
15,600 | 11,836 | ||||||
| MrMax Holdings Ltd. |
8,400 | 37,203 | ||||||
| Mugen Estate Co. Ltd. (d) |
3,300 | 25,224 | ||||||
| Murakami Corp. |
2,500 | 72,894 | ||||||
| Musashi Seimitsu Industry Co. Ltd. |
13,400 | 143,000 | ||||||
| Musashino Bank Ltd. |
7,500 | 141,280 | ||||||
| Mutoh Holdings Co. Ltd. |
900 | 12,573 | ||||||
| NAC Co. Ltd. |
3,600 | 25,314 | ||||||
| Nachi-Fujikoshi Corp. |
3,800 | 98,811 | ||||||
| Nafco Co. Ltd. |
2,600 | 34,297 | ||||||
| Nagano Keiki Co. Ltd. |
4,200 | 60,586 | ||||||
| Nagase & Co. Ltd. |
21,400 | 342,530 | ||||||
| Nagatanien Holdings Co. Ltd. |
3,300 | 50,209 | ||||||
| Nagawa Co. Ltd. |
1,500 | 75,716 | ||||||
| Naigai Trans Line Ltd. (d) |
2,100 | 35,257 | ||||||
| Nakabayashi Co. Ltd. |
5,500 | 21,419 | ||||||
| Nakamuraya Co. Ltd. |
1,600 | 34,724 | ||||||
| Nakanishi, Inc. |
13,200 | 221,565 | ||||||
| Nakano Corp. |
4,000 | 13,330 | ||||||
| Nakayama Steel Works Ltd. |
6,300 | 36,360 | ||||||
| Nakayamafuku Co. Ltd. |
2,000 | 5,169 | ||||||
| Namura Shipbuilding Co. Ltd. |
11,256 | 100,734 | ||||||
| Nankai Electric Railway Co. Ltd. |
7,300 | 148,032 | ||||||
| Nanto Bank Ltd. |
6,300 | 108,841 | ||||||
| Narasaki Sangyo Co. Ltd. |
800 | 16,369 | ||||||
| Natori Co. Ltd. |
2,600 | 38,443 | ||||||
| NEC Capital Solutions Ltd. |
2,500 | 59,367 | ||||||
| NEC Networks & System Integration Corp. |
9,400 | 158,107 | ||||||
| NET One Systems Co. Ltd. |
17,100 | 291,526 | ||||||
| Neturen Co. Ltd. |
7,300 | 49,706 | ||||||
| New Art Holdings Co. Ltd. |
1,235 | 16,973 | ||||||
| New Japan Chemical Co. Ltd. (a) |
9,900 | 13,381 | ||||||
| Nextage Co. Ltd. (d) |
12,300 | 225,253 | ||||||
| NexTone, Inc. (a) |
700 | 6,057 | ||||||
| NF Holdings Corp. |
1,600 | 16,816 | ||||||
| NHK Spring Co. Ltd. |
46,900 | 397,001 | ||||||
| Nicca Chemical Co. Ltd. |
1,400 | 9,473 | ||||||
| Nice Corp. |
2,300 | 27,730 | ||||||
| Nichia Steel Works Ltd. |
9,100 | 20,556 | ||||||
| Nichias Corp. |
14,300 | 343,114 | ||||||
| Nichiban Co. Ltd. |
3,200 | 39,286 | ||||||
| Nichicon Corp. |
11,800 | 108,281 | ||||||
| Nichiden Corp. |
3,500 | 71,150 | ||||||
| Nichiha Corp. |
6,800 | 142,638 | ||||||
| Nichimo Co. Ltd. |
2,000 | 28,609 | ||||||
| Nichireki Co. Ltd. |
7,100 | 121,529 | ||||||
| Nichirin Co. Ltd. |
1,400 | 32,400 | ||||||
| Nihon Chouzai Co. Ltd. |
3,320 | 32,935 | ||||||
| Nihon Dempa Kogyo Co. Ltd. |
3,300 | 29,310 | ||||||
| Nihon Dengi Co. Ltd. |
400 | 13,068 | ||||||
| Nihon Flush Co. Ltd. |
6,000 | 38,562 | ||||||
| Nihon House Holdings Co. Ltd. |
10,000 | 20,852 | ||||||
| Nihon Kagaku Sangyo Co. Ltd. |
3,000 | 30,110 | ||||||
| Nihon Kohden Corp. |
5,000 | 157,916 | ||||||
| Nihon M&A Center Holdings, Inc. |
50,200 | 275,967 | ||||||
| Nihon Nohyaku Co. Ltd. |
11,900 | 54,417 | ||||||
| Japan—(Continued) | ||||||||
| Nihon Parkerizing Co. Ltd. |
21,300 | 171,389 | ||||||
| Nihon Plast Co. Ltd. |
4,500 | 16,928 | ||||||
| Nihon Tokushu Toryo Co. Ltd. |
2,900 | 24,610 | ||||||
| Nihon Yamamura Glass Co. Ltd. (a) |
3,800 | 37,565 | ||||||
| Nikkiso Co. Ltd. (d) |
12,400 | 90,431 | ||||||
| Nikko Co. Ltd. |
9,000 | 44,182 | ||||||
| Nikkon Holdings Co. Ltd. |
14,100 | 307,524 | ||||||
| Nippn Corp. |
12,200 | 192,219 | ||||||
| Nippon Air Conditioning Services Co. Ltd. |
9,600 | 55,053 | ||||||
| Nippon Aqua Co. Ltd. |
3,000 | 18,814 | ||||||
| Nippon Beet Sugar Manufacturing Co. Ltd. |
2,900 | 40,093 | ||||||
| Nippon Carbide Industries Co., Inc. |
2,300 | 23,267 | ||||||
| Nippon Carbon Co. Ltd. (d) |
3,000 | 93,165 | ||||||
| Nippon Chemi-Con Corp. (a) |
5,900 | 54,790 | ||||||
| Nippon Chemical Industrial Co. Ltd. |
2,400 | 31,819 | ||||||
| Nippon Coke & Engineering Co. Ltd. (a) |
47,000 | 38,917 | ||||||
| Nippon Computer Dynamics Co. Ltd. |
1,700 | 15,621 | ||||||
| Nippon Concept Corp. |
1,500 | 17,339 | ||||||
| Nippon Concrete Industries Co. Ltd. |
14,000 | 31,796 | ||||||
| Nippon Denko Co. Ltd. |
29,065 | 56,782 | ||||||
| Nippon Densetsu Kogyo Co. Ltd. |
9,500 | 133,876 | ||||||
| Nippon Dry-Chemical Co. Ltd. |
1,000 | 19,796 | ||||||
| Nippon Electric Glass Co. Ltd. (d) |
17,600 | 377,795 | ||||||
| Nippon Felt Co. Ltd. |
8,600 | 25,662 | ||||||
| Nippon Filcon Co. Ltd. |
5,200 | 17,266 | ||||||
| Nippon Fine Chemical Co. Ltd. |
2,000 | 43,586 | ||||||
| Nippon Gas Co. Ltd. |
27,700 | 456,378 | ||||||
| Nippon Hume Corp. |
6,700 | 42,037 | ||||||
| Nippon Kayaku Co. Ltd. |
25,700 | 244,785 | ||||||
| Nippon Kodoshi Corp. |
1,600 | 19,779 | ||||||
| Nippon Light Metal Holdings Co. Ltd. |
15,500 | 192,275 | ||||||
| Nippon Paper Industries Co. Ltd. (a) |
23,800 | 212,881 | ||||||
| Nippon Parking Development Co. Ltd. - Class C |
53,400 | 72,562 | ||||||
| Nippon Pillar Packing Co. Ltd. |
4,700 | 147,954 | ||||||
| Nippon Rietec Co. Ltd. |
3,700 | 31,035 | ||||||
| Nippon Road Co. Ltd. |
4,500 | 65,255 | ||||||
| Nippon Seiki Co. Ltd. |
13,100 | 106,174 | ||||||
| Nippon Seisen Co. Ltd. |
700 | 24,024 | ||||||
| Nippon Sharyo Ltd. |
2,600 | 37,881 | ||||||
| Nippon Sheet Glass Co. Ltd. (a) |
15,100 | 61,190 | ||||||
| Nippon Shokubai Co. Ltd. |
3,100 | 119,445 | ||||||
| Nippon Signal Company Ltd. |
11,900 | 81,745 | ||||||
| Nippon Soda Co. Ltd. |
5,600 | 215,180 | ||||||
| Nippon Thompson Co. Ltd. |
15,700 | 62,628 | ||||||
| Nippon Yakin Kogyo Co. Ltd. |
3,500 | 104,334 | ||||||
| Nipro Corp. |
39,400 | 308,847 | ||||||
| Nishi-Nippon Financial Holdings, Inc. |
28,900 | 333,243 | ||||||
| Nishi-Nippon Railroad Co. Ltd. |
15,900 | 269,113 | ||||||
| Nishikawa Rubber Co. Ltd. |
1,200 | 14,809 | ||||||
| Nishimatsu Construction Co. Ltd. |
8,200 | 228,073 | ||||||
| Nishimatsuya Chain Co. Ltd. |
11,300 | 165,941 | ||||||
| Nishimoto Co. Ltd. (d) |
1,400 | 58,118 | ||||||
| Nishio Holdings Co. Ltd. |
5,200 | 150,954 | ||||||
| Nissan Shatai Co. Ltd. |
12,600 | 82,070 | ||||||
| Nissan Tokyo Sales Holdings Co. Ltd. |
11,000 | 35,894 | ||||||
| Nissei ASB Machine Co. Ltd. |
2,300 | 71,589 | ||||||
| Nissei Plastic Industrial Co. Ltd. |
4,500 | 35,340 | ||||||
See accompanying notes to financial statements.
BHFTII-23
Brighthouse Funds Trust II
Brighthouse/Dimensional International Small Company Portfolio
Schedule of Investments as of December 31, 2023
Common Stocks—(Continued)
| Security Description | Shares | Value | ||||||
| Japan—(Continued) | ||||||||
| Nissha Co. Ltd. (d) |
11,100 | $ | 115,689 | |||||
| Nisshin Group Holdings Co. Ltd. |
12,300 | 43,623 | ||||||
| Nisshin Oillio Group Ltd. |
5,900 | 179,392 | ||||||
| Nisshinbo Holdings, Inc. (d) |
31,620 | 256,245 | ||||||
| Nissin Corp. |
3,700 | 62,856 | ||||||
| Nisso Holdings Co. Ltd. |
1,400 | 7,876 | ||||||
| Nissui Corp. |
75,900 | 408,715 | ||||||
| Nitta Corp. |
5,000 | 130,035 | ||||||
| Nitta Gelatin, Inc. |
4,500 | 24,264 | ||||||
| NITTAN Corp. |
6,300 | 13,601 | ||||||
| Nittetsu Mining Co. Ltd. |
3,400 | 125,196 | ||||||
| Nitto Boseki Co. Ltd. (d) |
4,700 | 152,239 | ||||||
| Nitto Fuji Flour Milling Co. Ltd. |
800 | 27,323 | ||||||
| Nitto Kogyo Corp. |
6,900 | 175,784 | ||||||
| Nitto Kohki Co. Ltd. |
3,200 | 42,300 | ||||||
| Nitto Seiko Co. Ltd. |
8,900 | 33,156 | ||||||
| Nittoc Construction Co. Ltd. |
5,950 | 44,677 | ||||||
| NJS Co. Ltd. (d) |
2,200 | 42,365 | ||||||
| Noevir Holdings Co. Ltd. (d) |
3,200 | 116,556 | ||||||
| Nohmi Bosai Ltd. |
6,100 | 95,035 | ||||||
| Nojima Corp. |
16,800 | 208,332 | ||||||
| NOK Corp. |
4,700 | 62,461 | ||||||
| Nomura Micro Science Co. Ltd. (d) |
1,300 | 136,770 | ||||||
| Noritake Co. Ltd. |
2,500 | 121,055 | ||||||
| Noritsu Koki Co. Ltd. (d) |
4,600 | 97,633 | ||||||
| Noritz Corp. (d) |
7,600 | 81,310 | ||||||
| North Pacific Bank Ltd. |
60,100 | 150,671 | ||||||
| NPR-RIKEN Corp. |
6,864 | 108,056 | ||||||
| NS Tool Co. Ltd. |
4,800 | 33,978 | ||||||
| NS United Kaiun Kaisha Ltd. |
2,500 | 84,885 | ||||||
| NSD Co. Ltd. |
18,540 | 355,889 | ||||||
| NSW, Inc. |
1,900 | 38,246 | ||||||
| NTN Corp. |
92,700 | 170,305 | ||||||
| Oat Agrio Co. Ltd. (d) |
400 | 4,889 | ||||||
| Obara Group, Inc. |
2,700 | 72,166 | ||||||
| Oenon Holdings, Inc. (d) |
12,300 | 30,817 | ||||||
| Ogaki Kyoritsu Bank Ltd. |
9,400 | 125,714 | ||||||
| Ohara, Inc. |
1,600 | 12,290 | ||||||
| Ohashi Technica, Inc. |
3,800 | 49,191 | ||||||
| Ohba Co. Ltd. |
4,600 | 29,855 | ||||||
| Ohsho Food Service Corp. |
3,400 | 194,258 | ||||||
| OIE Sangyo Co. Ltd. |
800 | 9,882 | ||||||
| Oiles Corp. |
6,200 | 86,981 | ||||||
| Oisix ra daichi, Inc. (a) (d) |
5,600 | 53,925 | ||||||
| Oita Bank Ltd. |
3,600 | 64,092 | ||||||
| Okabe Co. Ltd. |
9,400 | 48,716 | ||||||
| Okada Aiyon Corp. |
1,900 | 33,179 | ||||||
| Okamoto Industries, Inc. |
2,800 | 98,605 | ||||||
| Okamoto Machine Tool Works Ltd. |
1,400 | 56,185 | ||||||
| Okamura Corp. |
15,700 | 242,114 | ||||||
| Okasan Securities Group, Inc. |
39,200 | 189,920 | ||||||
| Oki Electric Industry Co. Ltd. |
22,700 | 146,913 | ||||||
| Okinawa Cellular Telephone Co. |
6,400 | 153,451 | ||||||
| Okinawa Electric Power Co., Inc. |
13,527 | 106,843 | ||||||
| Okinawa Financial Group, Inc. |
4,760 | 78,971 | ||||||
| OKUMA Corp. |
6,400 | 274,976 | ||||||
| Okumura Corp. |
7,700 | 255,367 | ||||||
| Japan—(Continued) | ||||||||
| Okura Industrial Co. Ltd. (d) |
2,300 | 41,569 | ||||||
| Okuwa Co. Ltd. |
7,400 | 43,361 | ||||||
| Onoken Co. Ltd. |
4,300 | 52,780 | ||||||
| Onward Holdings Co. Ltd. |
22,500 | 76,550 | ||||||
| Open Up Group, Inc. |
4,700 | 78,063 | ||||||
| Optex Group Co. Ltd. |
6,800 | 85,914 | ||||||
| Optim Corp. (a) |
4,200 | 24,528 | ||||||
| Optorun Co. Ltd. |
5,500 | 63,266 | ||||||
| Organo Corp. |
6,700 | 276,165 | ||||||
| Oricon, Inc. |
1,200 | 6,236 | ||||||
| Orient Corp. |
11,670 | 88,472 | ||||||
| Oriental Shiraishi Corp. |
33,400 | 80,442 | ||||||
| Origin Co. Ltd. |
2,200 | 19,116 | ||||||
| Oro Co. Ltd. (d) |
2,100 | 38,362 | ||||||
| Osaka Organic Chemical Industry Ltd. |
4,100 | 78,542 | ||||||
| Osaka Soda Co. Ltd. |
3,400 | 232,987 | ||||||
| Osaka Steel Co. Ltd. |
3,700 | 64,814 | ||||||
| OSAKA Titanium Technologies Co. Ltd. (d) |
1,400 | 26,931 | ||||||
| Osaki Electric Co. Ltd. |
11,700 | 53,056 | ||||||
| OSG Corp. |
21,400 | 305,917 | ||||||
| OUG Holdings, Inc. |
700 | 12,034 | ||||||
| Outsourcing, Inc. (a) (d) |
30,200 | 371,270 | ||||||
| Oyo Corp. |
4,900 | 71,120 | ||||||
| Ozu Corp. |
600 | 6,780 | ||||||
| Pacific Industrial Co. Ltd. |
10,200 | 92,666 | ||||||
| Pacific Metals Co. Ltd. (a) |
5,100 | 43,818 | ||||||
| Pack Corp. (d) |
3,900 | 93,449 | ||||||
| PAL GROUP Holdings Co. Ltd. |
8,600 | 149,662 | ||||||
| PALTAC Corp. |
2,500 | 79,206 | ||||||
| Paraca, Inc. |
300 | 4,130 | ||||||
| Paramount Bed Holdings Co. Ltd. |
10,700 | 209,747 | ||||||
| Paris Miki Holdings, Inc. |
10,600 | 38,682 | ||||||
| Park24 Co. Ltd. (a) |
15,800 | 201,933 | ||||||
| Pasona Group, Inc. |
6,200 | 115,782 | ||||||
| PCI Holdings, Inc. |
1,800 | 12,895 | ||||||
| Pegasus Co. Ltd. |
5,400 | 17,067 | ||||||
| Penta-Ocean Construction Co. Ltd. |
23,700 | 133,088 | ||||||
| People Dreams & Technologies Group Co. Ltd. |
1,400 | 17,134 | ||||||
| PeptiDream, Inc. (a) |
8,000 | 84,014 | ||||||
| PIA Corp. (a) |
500 | 11,892 | ||||||
| Pickles Holdings Co. Ltd. |
2,600 | 22,351 | ||||||
| Pigeon Corp. (d) |
31,900 | 367,093 | ||||||
| Pilot Corp. (d) |
5,800 | 172,536 | ||||||
| Piolax, Inc. |
7,300 | 120,310 | ||||||
| Pole To Win Holdings, Inc. |
7,900 | 27,022 | ||||||
| PR Times Corp. (a) |
700 | 8,981 | ||||||
| Premium Group Co. Ltd. |
7,800 | 100,418 | ||||||
| Premium Water Holdings, Inc. |
500 | 10,370 | ||||||
| Press Kogyo Co. Ltd. |
22,400 | 90,203 | ||||||
| Pressance Corp. |
4,000 | 45,082 | ||||||
| Prestige International, Inc. |
27,100 | 115,005 | ||||||
| Prima Meat Packers Ltd. |
6,700 | 111,569 | ||||||
| Pro-Ship, Inc. |
2,300 | 22,342 | ||||||
| Procrea Holdings, Inc. |
6,521 | 86,722 | ||||||
| Pronexus, Inc. |
5,100 | 47,570 | ||||||
| Proto Corp. |
7,500 | 71,793 | ||||||
| PS Mitsubishi Construction Co. Ltd. |
2,700 | 16,913 | ||||||
See accompanying notes to financial statements.
BHFTII-24
Brighthouse Funds Trust II
Brighthouse/Dimensional International Small Company Portfolio
Schedule of Investments as of December 31, 2023
Common Stocks—(Continued)
| Security Description | Shares | Value | ||||||
| Japan—(Continued) | ||||||||
| Punch Industry Co. Ltd. |
2,700 | $ | 7,837 | |||||
| QB Net Holdings Co. Ltd. |
1,400 | 14,869 | ||||||
| Qol Holdings Co. Ltd. |
7,400 | 86,959 | ||||||
| Quick Co. Ltd. |
4,000 | 72,918 | ||||||
| Raccoon Holdings, Inc. |
4,100 | 18,815 | ||||||
| Raito Kogyo Co. Ltd. |
10,700 | 143,431 | ||||||
| Raiznext Corp. |
7,700 | 83,180 | ||||||
| Rasa Industries Ltd. |
2,600 | 38,726 | ||||||
| Raysum Co. Ltd. |
1,000 | 22,662 | ||||||
| Relo Group, Inc. |
10,300 | 123,971 | ||||||
| Rengo Co. Ltd. |
46,800 | 311,553 | ||||||
| RENOVA, Inc. (a) |
5,100 | 42,973 | ||||||
| Resorttrust, Inc. |
20,600 | 356,357 | ||||||
| Restar Holdings Corp. |
4,500 | 89,740 | ||||||
| Retail Partners Co. Ltd. |
4,300 | 50,724 | ||||||
| Rheon Automatic Machinery Co. Ltd. |
5,000 | 53,185 | ||||||
| Rhythm Co. Ltd. (d) |
2,500 | 52,437 | ||||||
| Riberesute Corp. |
4,300 | 22,950 | ||||||
| Ricoh Leasing Co. Ltd. |
3,500 | 120,294 | ||||||
| Ride On Express Holdings Co. Ltd. |
1,700 | 12,246 | ||||||
| Right On Co. Ltd. (a) (d) |
5,900 | 18,471 | ||||||
| Riken Keiki Co. Ltd. (d) |
3,700 | 180,216 | ||||||
| Riken Technos Corp. |
9,900 | 59,236 | ||||||
| Riken Vitamin Co. Ltd. |
5,400 | 85,483 | ||||||
| Ringer Hut Co. Ltd. |
600 | 10,012 | ||||||
| Rion Co. Ltd. |
2,200 | 37,968 | ||||||
| Riso Kyoiku Co. Ltd. |
34,770 | 55,897 | ||||||
| Rock Field Co. Ltd. |
6,600 | 75,359 | ||||||
| Rokko Butter Co. Ltd. (d) |
3,600 | 33,818 | ||||||
| Roland Corp. (d) |
2,800 | 87,261 | ||||||
| Roland DG Corp. |
3,000 | 77,400 | ||||||
| Rorze Corp. |
2,500 | 264,295 | ||||||
| Round One Corp. (d) |
37,800 | 149,043 | ||||||
| RS Technologies Co. Ltd. |
2,800 | 59,067 | ||||||
| Ryobi Ltd. (d) |
6,200 | 116,380 | ||||||
| RYODEN Corp. |
4,500 | 82,932 | ||||||
| Ryosan Co. Ltd. |
3,500 | 116,297 | ||||||
| S Foods, Inc. |
4,500 | 105,003 | ||||||
| S&B Foods, Inc. |
1,500 | 44,015 | ||||||
| S-Pool, Inc. |
18,000 | 56,637 | ||||||
| Sac’s Bar Holdings, Inc. |
5,250 | 29,825 | ||||||
| Sagami Rubber Industries Co. Ltd. |
1,800 | 11,474 | ||||||
| Saibu Gas Holdings Co. Ltd. |
6,400 | 88,725 | ||||||
| Saison Information Systems Co. Ltd. |
600 | 8,096 | ||||||
| Saizeriya Co. Ltd. |
1,700 | 60,654 | ||||||
| Sakai Chemical Industry Co. Ltd. |
4,700 | 62,353 | ||||||
| Sakai Heavy Industries Ltd. |
1,000 | 42,385 | ||||||
| Sakai Moving Service Co. Ltd. |
5,600 | 107,921 | ||||||
| Sakata INX Corp. |
10,100 | 96,981 | ||||||
| Sakura Internet, Inc. (d) |
4,400 | 68,617 | ||||||
| Sala Corp. |
13,800 | 71,461 | ||||||
| SAMTY Co. Ltd. |
6,200 | 106,900 | ||||||
| San Holdings, Inc. |
5,600 | 43,944 | ||||||
| San ju San Financial Group, Inc. |
5,770 | 74,125 | ||||||
| San-A Co. Ltd. |
5,700 | 183,904 | ||||||
| San-Ai Obbli Co. Ltd. |
14,400 | 163,604 | ||||||
| San-In Godo Bank Ltd. |
33,700 | 236,943 | ||||||
| Japan—(Continued) | ||||||||
| Sanden Corp. (a) |
4,400 | 6,203 | ||||||
| Sangetsu Corp. |
12,100 | 265,505 | ||||||
| Sanken Electric Co. Ltd. |
4,000 | 218,862 | ||||||
| Sanki Engineering Co. Ltd. |
10,300 | 127,706 | ||||||
| Sanko Metal Industrial Co. Ltd. |
1,000 | 32,056 | ||||||
| Sankyo Frontier Co. Ltd. |
1,000 | 27,496 | ||||||
| Sankyo Seiko Co. Ltd. |
10,800 | 54,991 | ||||||
| Sankyo Tateyama, Inc. |
6,500 | 35,995 | ||||||
| Sankyu, Inc. |
7,500 | 274,890 | ||||||
| Sanoh Industrial Co. Ltd. |
6,300 | 35,007 | ||||||
| Sansei Technologies, Inc. |
800 | 6,518 | ||||||
| Sansha Electric Manufacturing Co. Ltd. |
2,700 | 25,248 | ||||||
| Sanshin Electronics Co. Ltd. |
2,400 | 36,885 | ||||||
| Sanyo Chemical Industries Ltd. |
3,300 | 99,004 | ||||||
| Sanyo Denki Co. Ltd. |
2,500 | 110,886 | ||||||
| Sanyo Electric Railway Co. Ltd. |
4,800 | 74,008 | ||||||
| Sanyo Industries Ltd. |
1,300 | 24,568 | ||||||
| Sanyo Shokai Ltd. |
2,500 | 41,933 | ||||||
| Sanyo Special Steel Co. Ltd. |
5,000 | 93,266 | ||||||
| Sanyo Trading Co. Ltd. |
5,300 | 44,907 | ||||||
| Sata Construction Co. Ltd. |
2,600 | 11,674 | ||||||
| Sato Holdings Corp. |
6,800 | 101,799 | ||||||
| Sato Shoji Corp. |
4,100 | 42,282 | ||||||
| Satori Electric Co. Ltd. |
2,100 | 29,217 | ||||||
| Sawai Group Holdings Co. Ltd. |
7,500 | 276,762 | ||||||
| Saxa Holdings, Inc. |
2,400 | 43,878 | ||||||
| SB Technology Corp. |
3,000 | 50,423 | ||||||
| SBI Insurance Group Co. Ltd. |
1,400 | 10,219 | ||||||
| SBS Holdings, Inc. (d) |
5,200 | 90,470 | ||||||
| Scroll Corp. |
8,000 | 54,305 | ||||||
| SEC Carbon Ltd. |
1,000 | 16,609 | ||||||
| Seed Co. Ltd. |
1,700 | 9,828 | ||||||
| Seika Corp. |
2,600 | 54,195 | ||||||
| Seikagaku Corp. |
9,800 | 52,828 | ||||||
| Seikitokyu Kogyo Co. Ltd. |
2,100 | 24,524 | ||||||
| Seiko Group Corp. |
7,600 | 144,887 | ||||||
| Seikoh Giken Co. Ltd. |
700 | 6,847 | ||||||
| Seino Holdings Co. Ltd. |
3,800 | 57,549 | ||||||
| Seiren Co. Ltd. |
11,600 | 203,566 | ||||||
| Sekisui Jushi Corp. |
6,100 | 107,349 | ||||||
| Sekisui Kasei Co. Ltd. |
8,100 | 27,850 | ||||||
| SEMITEC Corp. |
1,600 | 22,121 | ||||||
| Senko Group Holdings Co. Ltd. |
29,400 | 237,531 | ||||||
| Senshu Electric Co. Ltd. |
3,800 | 87,225 | ||||||
| Senshu Ikeda Holdings, Inc. |
63,200 | 144,745 | ||||||
| Senshukai Co. Ltd. (a) (d) |
11,000 | 29,295 | ||||||
| SERAKU Co. Ltd. |
700 | 6,285 | ||||||
| Seria Co. Ltd. |
11,900 | 221,419 | ||||||
| Seven Bank Ltd. |
33,800 | 71,867 | ||||||
| Shibaura Electronics Co. Ltd. |
1,900 | 74,898 | ||||||
| Shibaura Machine Co. Ltd. |
5,700 | 139,362 | ||||||
| Shibaura Mechatronics Corp. (d) |
2,700 | 112,519 | ||||||
| Shibusawa Warehouse Co. Ltd. |
2,800 | 57,704 | ||||||
| Shibuya Corp. |
4,400 | 76,053 | ||||||
| Shiga Bank Ltd. |
8,700 | 214,987 | ||||||
| Shikibo Ltd. |
4,700 | 36,454 | ||||||
| Shikoku Bank Ltd. |
8,900 | 60,427 | ||||||
See accompanying notes to financial statements.
BHFTII-25
Brighthouse Funds Trust II
Brighthouse/Dimensional International Small Company Portfolio
Schedule of Investments as of December 31, 2023
Common Stocks—(Continued)
| Security Description | Shares | Value | ||||||
| Japan—(Continued) | ||||||||
| Shikoku Electric Power Co., Inc. |
37,900 | $ | 271,622 | |||||
| Shikoku Kasei Holdings Corp. (d) |
8,700 | 110,500 | ||||||
| Shima Seiki Manufacturing Ltd. |
7,000 | 75,528 | ||||||
| Shimizu Bank Ltd. |
3,400 | 37,077 | ||||||
| Shimojima Co. Ltd. |
4,200 | 38,319 | ||||||
| Shin Nippon Air Technologies Co. Ltd. |
2,100 | 35,462 | ||||||
| Shin Nippon Biomedical Laboratories Ltd. (d) |
5,300 | 63,656 | ||||||
| Shin-Etsu Polymer Co. Ltd. |
11,900 | 141,142 | ||||||
| Shinagawa Refractories Co. Ltd. |
6,300 | 76,505 | ||||||
| Shindengen Electric Manufacturing Co. Ltd. |
1,900 | 40,739 | ||||||
| Shinki Bus Co. Ltd. |
900 | 21,889 | ||||||
| Shinko Shoji Co. Ltd. |
8,400 | 69,174 | ||||||
| Shinmaywa Industries Ltd. |
15,000 | 124,765 | ||||||
| Shinnihon Corp. |
6,300 | 50,629 | ||||||
| Shinnihonseiyaku Co. Ltd. |
1,100 | 13,410 | ||||||
| Shinsho Corp. |
1,400 | 56,306 | ||||||
| Shinwa Co. Ltd. |
5,400 | 65,023 | ||||||
| Ship Healthcare Holdings, Inc. |
15,700 | 268,305 | ||||||
| Shizuki Electric Co., Inc. |
8,000 | 25,428 | ||||||
| Shizuoka Gas Co. Ltd. (d) |
8,800 | 63,992 | ||||||
| Shoei Co. Ltd. |
12,600 | 163,831 | ||||||
| Shoei Foods Corp. |
400 | 13,647 | ||||||
| Shofu, Inc. |
3,500 | 68,234 | ||||||
| Showa Sangyo Co. Ltd. |
5,700 | 127,806 | ||||||
| SIGMAXYZ Holdings, Inc. |
7,200 | 73,827 | ||||||
| Siix Corp. |
7,800 | 80,629 | ||||||
| Silver Life Co. Ltd. |
900 | 5,692 | ||||||
| Simplex Holdings, Inc. |
700 | 13,562 | ||||||
| Sinanen Holdings Co. Ltd. |
1,800 | 53,548 | ||||||
| Sinfonia Technology Co. Ltd. |
6,200 | 91,370 | ||||||
| Sinko Industries Ltd. |
5,600 | 105,715 | ||||||
| Sintokogio Ltd. |
10,800 | 81,504 | ||||||
| SK-Electronics Co. Ltd. |
2,700 | 72,877 | ||||||
| SKY Perfect JSAT Holdings, Inc. |
38,600 | 191,323 | ||||||
| Smaregi, Inc. (a) (d) |
1,200 | 22,910 | ||||||
| SMK Corp. |
1,700 | 30,847 | ||||||
| SMS Co. Ltd. |
8,200 | 167,831 | ||||||
| Snow Peak, Inc. (d) |
5,400 | 35,321 | ||||||
| SNT Corp. |
7,300 | 13,599 | ||||||
| Soda Nikka Co. Ltd. |
4,500 | 34,120 | ||||||
| Sodick Co. Ltd. |
11,000 | 56,721 | ||||||
| Soft99 Corp. |
5,100 | 51,223 | ||||||
| Softcreate Holdings Corp. |
4,600 | 56,027 | ||||||
| Software Service, Inc. |
900 | 62,607 | ||||||
| Soken Chemical & Engineering Co. Ltd. |
700 | 12,005 | ||||||
| Solasto Corp. |
12,800 | 55,793 | ||||||
| Soliton Systems KK |
2,500 | 24,615 | ||||||
| Solxyz Co. Ltd. |
1,400 | 3,987 | ||||||
| Sotetsu Holdings, Inc. |
12,100 | 234,335 | ||||||
| Sotoh Co. Ltd. |
3,100 | 15,160 | ||||||
| Space Co. Ltd. |
5,060 | 33,409 | ||||||
| Sparx Group Co. Ltd. |
5,840 | 66,570 | ||||||
| SPK Corp. |
2,600 | 33,967 | ||||||
| Sprix, Inc. |
1,300 | 7,648 | ||||||
| SRA Holdings |
3,100 | 78,130 | ||||||
| SRE Holdings Corp. (a) (d) |
1,900 | 36,897 | ||||||
| ST Corp. |
4,100 | 44,386 | ||||||
| Japan—(Continued) | ||||||||
| St-Care Holding Corp. |
2,300 | 16,237 | ||||||
| St. Marc Holdings Co. Ltd. |
5,100 | 76,651 | ||||||
| Star Mica Holdings Co. Ltd. |
6,000 | 26,963 | ||||||
| Star Micronics Co. Ltd. (d) |
9,200 | 111,878 | ||||||
| Starts Corp., Inc. |
7,900 | 163,783 | ||||||
| Starzen Co. Ltd. |
3,700 | 68,781 | ||||||
| Stella Chemifa Corp. |
3,000 | 68,656 | ||||||
| Step Co. Ltd. |
2,500 | 33,356 | ||||||
| Strike Co. Ltd. |
2,200 | 74,945 | ||||||
| Studio Alice Co. Ltd. (d) |
2,900 | 43,228 | ||||||
| Subaru Enterprise Co. Ltd. |
100 | 10,594 | ||||||
| Sugimoto & Co. Ltd. |
3,000 | 47,471 | ||||||
| Sumida Corp. |
7,500 | 61,200 | ||||||
| Suminoe Textile Co. Ltd. |
1,400 | 22,064 | ||||||
| Sumitomo Bakelite Co. Ltd. |
6,400 | 335,023 | ||||||
| Sumitomo Densetsu Co. Ltd. |
4,900 | 95,115 | ||||||
| Sumitomo Mitsui Construction Co. Ltd. |
40,360 | 113,520 | ||||||
| Sumitomo Osaka Cement Co. Ltd. |
7,100 | 186,410 | ||||||
| Sumitomo Pharma Co. Ltd. |
18,600 | 61,492 | ||||||
| Sumitomo Riko Co. Ltd. |
11,500 | 85,828 | ||||||
| Sumitomo Seika Chemicals Co. Ltd. |
2,200 | 77,723 | ||||||
| Sumitomo Warehouse Co. Ltd. |
13,800 | 239,484 | ||||||
| Sun Frontier Fudousan Co. Ltd. |
8,800 | 101,652 | ||||||
| Sun-Wa Technos Corp. |
3,000 | 46,588 | ||||||
| Suncall Corp. |
8,300 | 26,409 | ||||||
| Suruga Bank Ltd. |
39,500 | 217,537 | ||||||
| Suzuki Co. Ltd. |
3,300 | 25,610 | ||||||
| SWCC Corp. |
7,600 | 153,617 | ||||||
| System Research Co. Ltd. |
1,200 | 24,524 | ||||||
| Systems Engineering Consultants Co. Ltd. |
600 | 21,720 | ||||||
| Systena Corp. |
71,400 | 154,610 | ||||||
| Syuppin Co. Ltd. |
6,100 | 51,121 | ||||||
| T Hasegawa Co. Ltd. |
4,500 | 98,782 | ||||||
| T RAD Co. Ltd. |
1,900 | 41,462 | ||||||
| T&K Toka Co. Ltd. |
5,700 | 57,944 | ||||||
| T-Gaia Corp. |
6,000 | 82,014 | ||||||
| Tachi-S Co. Ltd. |
7,300 | 92,838 | ||||||
| Tachibana Eletech Co. Ltd. |
4,240 | 82,373 | ||||||
| Tachikawa Corp. |
3,100 | 30,565 | ||||||
| Tadano Ltd. (d) |
25,900 | 215,958 | ||||||
| Taihei Dengyo Kaisha Ltd. |
3,300 | 104,439 | ||||||
| Taiheiyo Cement Corp. |
13,700 | 281,727 | ||||||
| Taiheiyo Kouhatsu, Inc. |
2,100 | 11,992 | ||||||
| Taiho Kogyo Co. Ltd. |
6,400 | 35,952 | ||||||
| Taikisha Ltd. |
5,800 | 168,060 | ||||||
| Taiko Bank Ltd. |
3,100 | 28,031 | ||||||
| Taisei Lamick Co. Ltd. |
2,200 | 45,184 | ||||||
| Taiyo Holdings Co. Ltd. |
9,800 | 215,768 | ||||||
| Takamatsu Construction Group Co. Ltd. |
3,700 | 72,533 | ||||||
| Takamiya Co. Ltd. |
5,200 | 18,167 | ||||||
| Takano Co. Ltd. |
4,600 | 30,503 | ||||||
| Takaoka Toko Co. Ltd. |
3,165 | 47,295 | ||||||
| Takara & Co. Ltd. |
1,300 | 25,050 | ||||||
| Takara Bio, Inc. |
11,100 | 98,399 | ||||||
| Takara Holdings, Inc. |
36,400 | 319,001 | ||||||
| Takara Standard Co. Ltd. |
8,300 | 95,895 | ||||||
| Takasago International Corp. |
3,600 | 88,956 | ||||||
See accompanying notes to financial statements.
BHFTII-26
Brighthouse Funds Trust II
Brighthouse/Dimensional International Small Company Portfolio
Schedule of Investments as of December 31, 2023
Common Stocks—(Continued)
| Security Description | Shares | Value | ||||||
| Japan—(Continued) | ||||||||
| Takasago Thermal Engineering Co. Ltd. |
10,200 | $ | 232,687 | |||||
| Takashima & Co. Ltd. |
6,000 | 49,683 | ||||||
| Takashimaya Co. Ltd. |
3,800 | 51,680 | ||||||
| Takemoto Yohki Co. Ltd. |
1,200 | 6,566 | ||||||
| Takeuchi Manufacturing Co. Ltd. |
9,400 | 284,533 | ||||||
| Takuma Co. Ltd. |
12,900 | 163,192 | ||||||
| Tama Home Co. Ltd. (d) |
4,000 | 111,163 | ||||||
| Tamron Co. Ltd. |
5,100 | 192,212 | ||||||
| Tamura Corp. |
22,100 | 86,733 | ||||||
| Tanseisha Co. Ltd. |
11,750 | 72,628 | ||||||
| Tatsuta Electric Wire & Cable Co. Ltd. (a) |
14,200 | 70,599 | ||||||
| Tayca Corp. |
4,000 | 38,861 | ||||||
| Tazmo Co. Ltd. |
2,500 | 48,786 | ||||||
| Tbk Co. Ltd. |
8,000 | 21,039 | ||||||
| TDC Soft, Inc. |
4,900 | 73,765 | ||||||
| TechMatrix Corp. |
9,800 | 121,406 | ||||||
| Techno Medica Co. Ltd. |
2,400 | 37,623 | ||||||
| Techno Ryowa Ltd. |
4,800 | 47,668 | ||||||
| Teijin Ltd. |
31,300 | 295,917 | ||||||
| Teikoku Electric Manufacturing Co. Ltd. |
4,200 | 87,607 | ||||||
| Teikoku Sen-I Co. Ltd. (d) |
4,900 | 70,865 | ||||||
| Teikoku Tsushin Kogyo Co. Ltd. |
3,000 | 43,044 | ||||||
| Tekken Corp. |
2,700 | 38,375 | ||||||
| Temairazu, Inc. |
700 | 14,916 | ||||||
| Tenma Corp. |
3,600 | 56,681 | ||||||
| Tess Holdings Co. Ltd. |
2,600 | 8,025 | ||||||
| Tigers Polymer Corp. |
2,200 | 13,453 | ||||||
| TKC Corp. |
7,400 | 196,967 | ||||||
| TKP Corp. (a) |
2,100 | 26,667 | ||||||
| Toa Corp. |
9,300 | 126,799 | ||||||
| TOA ROAD Corp. |
1,500 | 71,019 | ||||||
| Toagosei Co. Ltd. (d) |
23,300 | 226,244 | ||||||
| Tobishima Corp. |
5,560 | 51,551 | ||||||
| TOC Co. Ltd. |
10,000 | 49,413 | ||||||
| Tocalo Co. Ltd. |
16,400 | 173,380 | ||||||
| Tochigi Bank Ltd. |
27,400 | 60,085 | ||||||
| Toda Corp. |
36,000 | 237,806 | ||||||
| Toda Kogyo Corp. (a) |
600 | 6,653 | ||||||
| Toei Co. Ltd. |
400 | 57,481 | ||||||
| Toell Co. Ltd. |
3,100 | 16,321 | ||||||
| Toenec Corp. |
1,900 | 61,461 | ||||||
| Toho Bank Ltd. |
48,700 | 98,979 | ||||||
| Toho Co. Ltd. (d) |
1,700 | 33,228 | ||||||
| Toho Gas Co. Ltd. |
9,100 | 189,823 | ||||||
| Toho Holdings Co. Ltd. |
13,700 | 312,853 | ||||||
| Toho Titanium Co. Ltd. (d) |
9,800 | 131,861 | ||||||
| Toho Zinc Co. Ltd. |
3,400 | 27,114 | ||||||
| Tohoku Bank Ltd. |
4,700 | 39,043 | ||||||
| Tohokushinsha Film Corp. |
4,800 | 44,882 | ||||||
| Tokai Carbon Co. Ltd. (d) |
42,000 | 304,723 | ||||||
| Tokai Corp. |
5,800 | 85,848 | ||||||
| TOKAI Holdings Corp. |
24,700 | 168,573 | ||||||
| Tokai Lease Co. Ltd. |
1,600 | 14,149 | ||||||
| Tokai Rika Co. Ltd. |
13,200 | 202,822 | ||||||
| Tokai Tokyo Financial Holdings, Inc. |
46,600 | 173,528 | ||||||
| Token Corp. |
1,760 | 114,679 | ||||||
| Tokushu Tokai Paper Co. Ltd. |
2,500 | 69,677 | ||||||
| Japan—(Continued) | ||||||||
| Tokuyama Corp. |
14,400 | 243,639 | ||||||
| Tokyo Base Co. Ltd. (d) |
4,100 | 8,752 | ||||||
| Tokyo Electron Device Ltd. |
5,200 | 186,351 | ||||||
| Tokyo Energy & Systems, Inc. |
6,200 | 45,934 | ||||||
| Tokyo Individualized Educational Institute, Inc. |
2,500 | 7,883 | ||||||
| Tokyo Keiki, Inc. |
4,200 | 52,889 | ||||||
| Tokyo Kiraboshi Financial Group, Inc. |
5,624 | 158,023 | ||||||
| Tokyo Ohka Kogyo Co. Ltd. |
3,600 | 79,048 | ||||||
| Tokyo Rakutenchi Co. Ltd. |
1,000 | 48,459 | ||||||
| Tokyo Rope Manufacturing Co. Ltd. |
2,800 | 26,463 | ||||||
| Tokyo Sangyo Co. Ltd. |
5,500 | 32,586 | ||||||
| Tokyo Seimitsu Co. Ltd. |
5,500 | 336,044 | ||||||
| Tokyo Steel Manufacturing Co. Ltd. |
18,000 | 220,149 | ||||||
| Tokyo Tekko Co. Ltd. |
2,000 | 58,283 | ||||||
| Tokyo Theatres Co., Inc. |
2,900 | 22,655 | ||||||
| Tokyotokeiba Co. Ltd. (d) |
4,200 | 131,781 | ||||||
| Tokyu Construction Co. Ltd. |
21,400 | 120,781 | ||||||
| Toli Corp. |
15,600 | 35,227 | ||||||
| Tomato Bank Ltd. |
4,200 | 34,262 | ||||||
| Tomen Devices Corp. |
800 | 30,365 | ||||||
| Tomoe Corp. |
9,800 | 40,273 | ||||||
| Tomoe Engineering Co. Ltd. |
2,100 | 57,346 | ||||||
| Tomoku Co. Ltd. |
3,000 | 45,592 | ||||||
| TOMONY Holdings, Inc. (d) |
40,500 | 112,324 | ||||||
| Tomy Co. Ltd. |
21,000 | 331,623 | ||||||
| Tonami Holdings Co. Ltd. |
1,300 | 41,499 | ||||||
| Topcon Corp. |
26,400 | 283,061 | ||||||
| Topre Corp. |
9,800 | 129,854 | ||||||
| Topy Industries Ltd. |
4,000 | 72,202 | ||||||
| Torex Semiconductor Ltd. |
500 | 6,249 | ||||||
| Toridoll Holdings Corp. |
6,500 | 186,641 | ||||||
| Torigoe Co. Ltd. (d) |
6,000 | 27,755 | ||||||
| Torii Pharmaceutical Co. Ltd. |
3,500 | 88,140 | ||||||
| Torishima Pump Manufacturing Co. Ltd. |
5,200 | 82,931 | ||||||
| Tosei Corp. |
7,100 | 100,263 | ||||||
| Toshiba TEC Corp. |
6,000 | 124,014 | ||||||
| Totech Corp. |
700 | 23,608 | ||||||
| Totetsu Kogyo Co. Ltd. |
6,500 | 145,891 | ||||||
| Tottori Bank Ltd. |
3,700 | 35,556 | ||||||
| Toukei Computer Co. Ltd. |
600 | 14,695 | ||||||
| Towa Bank Ltd. |
11,500 | 49,338 | ||||||
| Towa Corp. |
5,700 | 285,086 | ||||||
| Towa Pharmaceutical Co. Ltd. |
6,800 | 113,321 | ||||||
| Toyo Construction Co. Ltd. |
25,499 | 215,386 | ||||||
| Toyo Corp. |
7,900 | 79,124 | ||||||
| Toyo Denki Seizo KK |
3,200 | 22,073 | ||||||
| Toyo Engineering Corp. (a) |
8,200 | 45,811 | ||||||
| Toyo Gosei Co. Ltd. (d) |
800 | 47,174 | ||||||
| Toyo Kanetsu KK |
2,400 | 65,728 | ||||||
| Toyo Machinery & Metal Co. Ltd. |
6,000 | 29,113 | ||||||
| Toyo Securities Co. Ltd. |
14,100 | 30,123 | ||||||
| Toyo Tanso Co. Ltd. (d) |
3,600 | 121,720 | ||||||
| Toyo Tire Corp. |
12,100 | 201,499 | ||||||
| Toyo Wharf & Warehouse Co. Ltd. |
2,500 | 24,652 | ||||||
| Toyobo Co. Ltd. |
22,100 | 165,375 | ||||||
| TPR Co. Ltd. |
6,300 | 75,888 | ||||||
| Traders Holdings Co. Ltd. |
2,800 | 10,579 | ||||||
See accompanying notes to financial statements.
BHFTII-27
Brighthouse Funds Trust II
Brighthouse/Dimensional International Small Company Portfolio
Schedule of Investments as of December 31, 2023
Common Stocks—(Continued)
| Security Description | Shares | Value | ||||||
| Japan—(Continued) | ||||||||
| Trancom Co. Ltd. |
2,300 | $ | 117,023 | |||||
| Trans Genic, Inc. |
2,700 | 4,984 | ||||||
| Transaction Co. Ltd. |
1,400 | 21,158 | ||||||
| Transcosmos, Inc. |
4,200 | 89,629 | ||||||
| TRE Holdings Corp. |
5,600 | 43,587 | ||||||
| Tri Chemical Laboratories, Inc. |
6,000 | 152,795 | ||||||
| Trusco Nakayama Corp. |
11,300 | 196,071 | ||||||
| TS Tech Co. Ltd. |
20,700 | 249,802 | ||||||
| TSI Holdings Co. Ltd. |
14,405 | 74,876 | ||||||
| Tsubaki Nakashima Co. Ltd. (d) |
13,000 | 67,321 | ||||||
| Tsubakimoto Chain Co. |
6,300 | 180,352 | ||||||
| Tsubakimoto Kogyo Co. Ltd. |
1,200 | 54,598 | ||||||
| Tsugami Corp. |
10,600 | 91,050 | ||||||
| Tsukishima Holdings Co. Ltd. |
7,200 | 68,386 | ||||||
| Tsukuba Bank Ltd. |
19,200 | 33,641 | ||||||
| Tsumura & Co. |
15,600 | 294,096 | ||||||
| Tsurumi Manufacturing Co. Ltd. |
4,500 | 117,950 | ||||||
| Tsutsumi Jewelry Co. Ltd. |
700 | 11,324 | ||||||
| TV Asahi Holdings Corp. |
6,300 | 71,676 | ||||||
| Tv Tokyo Holdings Corp. |
1,800 | 38,136 | ||||||
| TYK Corp. |
6,000 | 18,125 | ||||||
| UACJ Corp. |
7,985 | 217,625 | ||||||
| UBE Corp. |
21,300 | 346,254 | ||||||
| Ubicom Holdings, Inc. |
500 | 5,903 | ||||||
| Uchida Yoko Co. Ltd. |
2,100 | 102,255 | ||||||
| Ueki Corp. |
2,200 | 22,978 | ||||||
| ULS Group, Inc. |
600 | 18,366 | ||||||
| Ulvac, Inc. |
2,700 | 128,340 | ||||||
| Union Tool Co. (d) |
2,900 | 68,552 | ||||||
| Unipres Corp. |
10,600 | 71,329 | ||||||
| United Arrows Ltd. |
3,100 | 41,430 | ||||||
| United Super Markets Holdings, Inc. (d) |
15,500 | 111,749 | ||||||
| UNITED, Inc. |
6,000 | 38,187 | ||||||
| Unitika Ltd. (a) |
15,600 | 19,212 | ||||||
| Universal Entertainment Corp. (d) |
6,100 | 99,160 | ||||||
| Urbanet Corp. Co. Ltd. |
4,500 | 12,618 | ||||||
| Usen-Next Holdings Co. Ltd. |
2,700 | 76,878 | ||||||
| Ushio, Inc. |
24,600 | 352,498 | ||||||
| UT Group Co. Ltd. (a) |
6,600 | 113,938 | ||||||
| UUUM Co. Ltd. (a) |
1,800 | 5,526 | ||||||
| V Technology Co. Ltd. |
2,700 | 54,208 | ||||||
| V-Cube, Inc. (a) (d) |
2,100 | 4,756 | ||||||
| Valor Holdings Co. Ltd. |
9,000 | 155,525 | ||||||
| Valqua Ltd. |
4,600 | 134,961 | ||||||
| Value HR Co. Ltd. (d) |
2,000 | 21,865 | ||||||
| ValueCommerce Co. Ltd. |
4,300 | 44,631 | ||||||
| Vector, Inc. |
8,200 | 65,709 | ||||||
| Vertex Corp. |
3,000 | 33,903 | ||||||
| Village Vanguard Co. Ltd. (a) |
2,300 | 17,432 | ||||||
| Vision, Inc. (a) |
4,000 | 34,822 | ||||||
| Visional, Inc. (a) |
1,900 | 120,488 | ||||||
| Vital KSK Holdings, Inc. |
9,100 | 67,256 | ||||||
| VT Holdings Co. Ltd. |
19,800 | 72,509 | ||||||
| Wacoal Holdings Corp. |
10,100 | 239,428 | ||||||
| Wacom Co. Ltd. |
14,000 | 65,238 | ||||||
| Wakachiku Construction Co. Ltd. |
1,900 | 39,772 | ||||||
| Wakita & Co. Ltd. |
9,700 | 109,722 | ||||||
| Japan—(Continued) | ||||||||
| Warabeya Nichiyo Holdings Co. Ltd. |
3,700 | 89,600 | ||||||
| Waseda Academy Co. Ltd. |
1,400 | 17,793 | ||||||
| Watahan & Co. Ltd. |
3,200 | 32,206 | ||||||
| Watts Co. Ltd. |
1,900 | 8,419 | ||||||
| WDB Holdings Co. Ltd. |
2,700 | 42,309 | ||||||
| Weathernews, Inc. |
1,500 | 57,451 | ||||||
| Welbe, Inc. |
2,300 | 12,820 | ||||||
| Wellneo Sugar Co. Ltd. |
2,400 | 35,862 | ||||||
| Wellnet Corp. |
4,400 | 17,443 | ||||||
| West Holdings Corp. (d) |
5,629 | 122,871 | ||||||
| Will Group, Inc. |
4,200 | 34,361 | ||||||
| WIN-Partners Co. Ltd. |
1,500 | 12,709 | ||||||
| WingArc1st, Inc. |
1,800 | 39,127 | ||||||
| Wood One Co. Ltd. (d) |
2,600 | 18,381 | ||||||
| World Co. Ltd. |
5,000 | 59,417 | ||||||
| World Holdings Co. Ltd. |
2,500 | 48,225 | ||||||
| Wowow, Inc. |
2,200 | 16,648 | ||||||
| Xebio Holdings Co. Ltd. |
7,300 | 49,426 | ||||||
| YA-MAN Ltd. (d) |
8,800 | 62,748 | ||||||
| Yahagi Construction Co. Ltd. |
9,500 | 90,860 | ||||||
| Yaizu Suisankagaku Industry Co. Ltd. |
4,400 | 37,356 | ||||||
| YAKUODO Holdings Co. Ltd. |
2,900 | 55,916 | ||||||
| YAMABIKO Corp. |
7,900 | 83,609 | ||||||
| YAMADA Consulting Group Co. Ltd. |
3,100 | 37,484 | ||||||
| Yamagata Bank Ltd. |
6,900 | 52,148 | ||||||
| Yamaguchi Financial Group, Inc. |
42,800 | 382,490 | ||||||
| Yamaichi Electronics Co. Ltd. |
6,100 | 83,517 | ||||||
| Yamanashi Chuo Bank Ltd. |
6,300 | 75,047 | ||||||
| Yamatane Corp. |
2,600 | 45,365 | ||||||
| Yamato Corp. |
5,000 | 32,874 | ||||||
| Yamaura Corp. |
2,800 | 27,938 | ||||||
| Yamaya Corp. |
1,150 | 24,811 | ||||||
| Yamazawa Co. Ltd. |
1,000 | 8,860 | ||||||
| Yamazen Corp. |
15,000 | 126,772 | ||||||
| Yaoko Co. Ltd. |
2,600 | 148,593 | ||||||
| Yashima Denki Co. Ltd. |
7,500 | 70,315 | ||||||
| Yasuda Logistics Corp. |
4,900 | 40,691 | ||||||
| Yasunaga Corp. |
1,700 | 7,705 | ||||||
| Yellow Hat Ltd. |
9,200 | 115,106 | ||||||
| Yodogawa Steel Works Ltd. |
5,500 | 148,542 | ||||||
| Yokogawa Bridge Holdings Corp. |
8,600 | 154,305 | ||||||
| Yokorei Co. Ltd. |
14,000 | 103,968 | ||||||
| Yokowo Co. Ltd. |
4,300 | 43,331 | ||||||
| Yomeishu Seizo Co. Ltd. |
2,400 | 31,747 | ||||||
| Yondenko Corp. |
2,400 | 53,542 | ||||||
| Yondoshi Holdings, Inc. |
4,600 | 66,152 | ||||||
| Yonex Co. Ltd. |
9,500 | 89,760 | ||||||
| Yorozu Corp. |
6,500 | 38,106 | ||||||
| Yoshinoya Holdings Co. Ltd. |
16,100 | 365,519 | ||||||
| Yotai Refractories Co. Ltd. |
4,100 | 43,466 | ||||||
| Yuasa Funashoku Co. Ltd. |
1,300 | 29,503 | ||||||
| Yuasa Trading Co. Ltd. |
4,800 | 160,882 | ||||||
| Yuken Kogyo Co. Ltd. |
1,300 | 19,928 | ||||||
| Yukiguni Maitake Co. Ltd. |
2,100 | 13,921 | ||||||
| Yurtec Corp. |
10,300 | 81,915 | ||||||
| Yushin Precision Equipment Co. Ltd. |
2,900 | 13,698 | ||||||
| Yushiro Chemical Industry Co. Ltd. |
3,700 | 42,856 | ||||||
See accompanying notes to financial statements.
BHFTII-28
Brighthouse Funds Trust II
Brighthouse/Dimensional International Small Company Portfolio
Schedule of Investments as of December 31, 2023
Common Stocks—(Continued)
| Security Description | Shares | Value | ||||||
| Japan—(Continued) | ||||||||
| Yutaka Giken Co. Ltd. |
600 | $ | 10,014 | |||||
| Zaoh Co. Ltd. |
800 | 13,795 | ||||||
| Zenrin Co. Ltd. |
9,750 | 60,309 | ||||||
| ZERIA Pharmaceutical Co. Ltd. |
2,800 | 40,048 | ||||||
| ZIGExN Co. Ltd. |
8,400 | 31,520 | ||||||
| Zuiko Corp. (d) |
4,000 | 51,078 | ||||||
|
|
|
|||||||
| 128,459,907 | ||||||||
|
|
|
|||||||
| Jersey, Channel Islands—0.1% | ||||||||
| Centamin PLC |
356,454 | 454,013 | ||||||
|
|
|
|||||||
| Jordan—0.1% | ||||||||
| Hikma Pharmaceuticals PLC |
14,253 | 324,810 | ||||||
|
|
|
|||||||
| Liechtenstein—0.1% | ||||||||
| Liechtensteinische Landesbank AG |
3,366 | 264,759 | ||||||
| VP Bank AG - Class A |
1,049 | 109,298 | ||||||
|
|
|
|||||||
| 374,057 | ||||||||
|
|
|
|||||||
| Luxembourg—0.3% | ||||||||
| ADLER Group SA (a) |
1,495 | 878 | ||||||
| Aperam SA |
10,690 | 389,828 | ||||||
| Befesa SA |
9,306 | 361,716 | ||||||
| L’Occitane International SA |
51,500 | 147,202 | ||||||
| RTL Group SA (d) |
302 | 11,655 | ||||||
| SES SA |
84,181 | 556,326 | ||||||
|
|
|
|||||||
| 1,467,605 | ||||||||
|
|
|
|||||||
| Macau—0.0% | ||||||||
| MECOM Power & Construction Ltd. (a) |
211,500 | 8,167 | ||||||
| SJM Holdings Ltd. (a) |
384,249 | 121,349 | ||||||
|
|
|
|||||||
| 129,516 | ||||||||
|
|
|
|||||||
| Malta—0.0% | ||||||||
| Gaming Innovation Group, Inc. (a) |
5,882 | 17,259 | ||||||
|
|
|
|||||||
| Mongolia—0.0% | ||||||||
| Mongolian Mining Corp. (a) |
33,000 | 31,655 | ||||||
|
|
|
|||||||
| Netherlands—2.0% | ||||||||
| Aalberts NV |
21,747 | 946,412 | ||||||
| Acomo NV |
2,850 | 55,183 | ||||||
| Alfen NV (a) (d) |
4,827 | 321,729 | ||||||
| AMG Critical Materials NV (d) |
6,652 | 167,675 | ||||||
| Arcadis NV |
18,701 | 1,011,083 | ||||||
| Basic-Fit NV (a) (d) |
8,733 | 273,567 | ||||||
| BE Semiconductor Industries NV |
14,828 | 2,234,387 | ||||||
| Brack Capital Properties NV (a) |
856 | 57,429 | ||||||
| Brunel International NV |
6,045 | 74,651 | ||||||
| Corbion NV |
15,863 | 339,596 | ||||||
| CTP NV |
12,784 | 216,034 | ||||||
| Euronext NV |
2,332 | 202,492 | ||||||
| Flow Traders Ltd. |
8,710 | 172,665 | ||||||
| ForFarmers NV |
10,101 | 26,625 | ||||||
| Fugro NV (a) |
24,705 | 472,829 | ||||||
| Netherlands—(Continued) | ||||||||
| Just Eat Takeaway.com NV (a) (d) |
975 | 15,074 | ||||||
| Kendrion NV |
3,766 | 50,289 | ||||||
| Koninklijke BAM Groep NV |
68,574 | 184,166 | ||||||
| Koninklijke Heijmans NV |
6,019 | 80,879 | ||||||
| Koninklijke Vopak NV |
13,444 | 452,896 | ||||||
| Lucas Bols NV (a) (d) |
1,325 | 26,343 | ||||||
| Nedap NV |
1,575 | 111,296 | ||||||
| New World Resources PLC - Class A (a) (b) (c) |
11,898 | 0 | ||||||
| OCI NV |
8,265 | 240,279 | ||||||
| Pharming Group NV (a) (d) |
76,183 | 86,617 | ||||||
| PostNL NV |
85,361 | 133,422 | ||||||
| Redcare Pharmacy NV (a) |
680 | 98,811 | ||||||
| SBM Offshore NV |
29,300 | 403,791 | ||||||
| SIF Holding NV (a) (d) |
1,469 | 16,934 | ||||||
| Signify NV |
28,840 | 966,132 | ||||||
| Sligro Food Group NV |
6,049 | 106,170 | ||||||
| TKH Group NV |
10,606 | 464,789 | ||||||
| TomTom NV (a) (d) |
18,862 | 133,204 | ||||||
| Van Lanschot Kempen NV |
6,057 | 189,041 | ||||||
|
|
|
|||||||
| 10,332,490 | ||||||||
|
|
|
|||||||
| New Zealand—0.4% | ||||||||
| Air New Zealand Ltd. |
216,039 | 86,704 | ||||||
| Arvida Group Ltd. |
96,446 | 67,014 | ||||||
| Briscoe Group Ltd. (d) |
13,123 | 37,032 | ||||||
| Channel Infrastructure NZ Ltd. |
39,302 | 36,027 | ||||||
| Chorus Ltd. |
34,034 | 168,968 | ||||||
| Delegat Group Ltd. |
6,671 | 27,412 | ||||||
| Eroad Ltd. (a) |
7,847 | 5,050 | ||||||
| Freightways Group Ltd. |
26,416 | 141,924 | ||||||
| Gentrack Group Ltd. (a) |
7,810 | 32,658 | ||||||
| Hallenstein Glasson Holdings Ltd. (d) |
13,182 | 43,344 | ||||||
| Heartland Group Holdings Ltd. |
127,413 | 119,090 | ||||||
| Investore Property Ltd. |
47,875 | 36,261 | ||||||
| KMD Brands Ltd. |
106,864 | 50,670 | ||||||
| Manawa Energy Ltd. |
13,980 | 37,897 | ||||||
| Michael Hill International Ltd. |
82,929 | 51,897 | ||||||
| NZME Ltd. |
71,247 | 48,456 | ||||||
| NZX Ltd. |
82,001 | 56,776 | ||||||
| Oceania Healthcare Ltd. |
113,418 | 54,533 | ||||||
| Pacific Edge Ltd. (a) |
89,677 | 6,623 | ||||||
| PGG Wrightson Ltd. |
5,854 | 12,583 | ||||||
| Restaurant Brands New Zealand Ltd. |
7,507 | 18,891 | ||||||
| Sanford Ltd. |
17,782 | 45,466 | ||||||
| Scales Corp. Ltd. |
25,709 | 56,055 | ||||||
| Serko Ltd. (a) |
5,880 | 15,053 | ||||||
| Skellerup Holdings Ltd. |
34,311 | 109,295 | ||||||
| SKY Network Television Ltd. |
38,232 | 66,809 | ||||||
| SKYCITY Entertainment Group Ltd. (d) |
133,795 | 153,936 | ||||||
| Steel & Tube Holdings Ltd. |
51,732 | 35,330 | ||||||
| Summerset Group Holdings Ltd. |
22,779 | 147,583 | ||||||
| Synlait Milk Ltd. (a) |
17,226 | 10,334 | ||||||
| Tourism Holdings Ltd. |
27,545 | 67,007 | ||||||
| TOWER Ltd. |
53,852 | 20,795 | ||||||
| Turners Automotive Group Ltd. |
8,735 | 25,350 | ||||||
See accompanying notes to financial statements.
BHFTII-29
Brighthouse Funds Trust II
Brighthouse/Dimensional International Small Company Portfolio
Schedule of Investments as of December 31, 2023
Common Stocks—(Continued)
| Security Description | Shares | Value | ||||||
| New Zealand—(Continued) | ||||||||
| Warehouse Group Ltd. |
26,369 | $ | 26,841 | |||||
|
|
|
|||||||
| 1,919,664 | ||||||||
|
|
|
|||||||
| Norway—0.7% | ||||||||
| 2020 Bulkers Ltd. (a) |
3,023 | 36,116 | ||||||
| ABG Sundal Collier Holding ASA |
134,443 | 89,933 | ||||||
| AF Gruppen ASA |
720 | 8,793 | ||||||
| Akastor ASA (a) (d) |
47,184 | 54,147 | ||||||
| Aker Carbon Capture ASA (a) |
38,063 | 50,741 | ||||||
| AMSC ASA |
16,816 | 44,433 | ||||||
| ArcticZymes Technologies ASA (a) |
4,578 | 18,889 | ||||||
| Atea ASA |
14,965 | 190,086 | ||||||
| Austevoll Seafood ASA |
3,599 | 26,249 | ||||||
| Axactor ASA (a) |
50,628 | 25,295 | ||||||
| B2 Impact ASA |
54,575 | 39,430 | ||||||
| Belships ASA |
6,016 | 10,881 | ||||||
| Bluenord ASA (a) |
3,930 | 192,564 | ||||||
| Bonheur ASA |
5,418 | 128,860 | ||||||
| Borregaard ASA |
9,707 | 163,783 | ||||||
| Bouvet ASA |
11,240 | 67,395 | ||||||
| BW Energy Ltd. (a) |
23,285 | 61,622 | ||||||
| BW Offshore Ltd. |
24,958 | 55,113 | ||||||
| Cloudberry Clean Energy ASA (a) |
5,774 | 6,568 | ||||||
| Crayon Group Holding ASA (a) |
9,599 | 79,862 | ||||||
| DNO ASA |
94,590 | 93,571 | ||||||
| Europris ASA |
42,752 | 322,754 | ||||||
| Grieg Seafood ASA |
10,403 | 69,957 | ||||||
| Hexagon Composites ASA (a) |
32,350 | 91,846 | ||||||
| Hexagon Purus ASA (a) |
12,472 | 13,632 | ||||||
| IDEX Biometrics ASA (a) |
200,592 | 10,898 | ||||||
| Itera ASA |
17,553 | 20,765 | ||||||
| Kid ASA |
4,010 | 46,189 | ||||||
| Kitron ASA |
28,832 | 94,946 | ||||||
| LINK Mobility Group Holding ASA (a) |
12,521 | 22,296 | ||||||
| Medistim ASA |
1,762 | 37,038 | ||||||
| MPC Container Ships ASA |
39,419 | 51,701 | ||||||
| Multiconsult ASA |
1,528 | 18,643 | ||||||
| Nekkar ASA (a) |
8,927 | 8,138 | ||||||
| Norske Skog ASA |
5,807 | 23,628 | ||||||
| Norwegian Air Shuttle ASA (a) |
68,212 | 71,868 | ||||||
| Odfjell Drilling Ltd. |
25,648 | 99,331 | ||||||
| Odfjell SE - A Shares |
1,949 | 22,324 | ||||||
| OKEA ASA |
884 | 2,312 | ||||||
| Panoro Energy ASA |
4,804 | 12,761 | ||||||
| Pareto Bank ASA |
2,287 | 12,133 | ||||||
| PGS ASA (a) |
142,218 | 120,022 | ||||||
| Protector Forsikring ASA |
15,576 | 275,644 | ||||||
| REC Silicon ASA (a) |
64,361 | 88,464 | ||||||
| Scatec ASA |
10,806 | 87,124 | ||||||
| Selvaag Bolig ASA |
13,262 | 43,224 | ||||||
| Sparebank 1 Oestlandet |
3,002 | 39,155 | ||||||
| SpareBank 1 Sorost-Norge |
3,854 | 24,268 | ||||||
| Sparebanken More |
2,450 | 20,216 | ||||||
| Ultimovacs ASA (a) |
1,682 | 20,275 | ||||||
| Veidekke ASA |
22,122 | 222,597 | ||||||
| Wilh Wilhelmsen Holding ASA - Class A |
2,124 | 76,243 | ||||||
| Norway—(Continued) | ||||||||
| XXL ASA (a) (d) |
193,565 | 17,978 | ||||||
| Zaptec ASA (a) |
7,253 | 15,543 | ||||||
|
|
|
|||||||
| 3,548,244 | ||||||||
|
|
|
|||||||
| Peru—0.0% | ||||||||
| Hochschild Mining PLC (a) |
95,965 | 130,780 | ||||||
|
|
|
|||||||
| Philippines—0.0% | ||||||||
| Del Monte Pacific Ltd. |
77,636 | 7,579 | ||||||
|
|
|
|||||||
| Poland—0.0% | ||||||||
| InPost SA (a) |
14,813 | 204,783 | ||||||
|
|
|
|||||||
| Portugal—0.4% | ||||||||
| Altri SGPS SA |
22,337 | 113,456 | ||||||
| Banco Comercial Portugues SA - Class R (a) |
2,143,248 | 649,300 | ||||||
| Corticeira Amorim SGPS SA |
2,047 | 20,659 | ||||||
| CTT-Correios de Portugal SA |
24,574 | 94,931 | ||||||
| Greenvolt-Energias Renovaveis SA (a) (d) |
9,644 | 87,087 | ||||||
| Mota-Engil SGPS SA |
25,385 | 111,059 | ||||||
| Navigator Co. SA (d) |
64,155 | 251,689 | ||||||
| NOS SGPS SA |
62,205 | 219,812 | ||||||
| REN - Redes Energeticas Nacionais SGPS SA |
112,114 | 287,823 | ||||||
| Sonae SGPS SA |
236,930 | 236,651 | ||||||
|
|
|
|||||||
| 2,072,467 | ||||||||
|
|
|
|||||||
| Singapore—1.1% | ||||||||
| Abterra Ltd. (a) (b) (c) |
51,720 | 0 | ||||||
| AEM Holdings Ltd. |
46,700 | 122,081 | ||||||
| Avarga Ltd. (a) |
46,000 | 6,289 | ||||||
| Banyan Tree Holdings Ltd. (a) |
97,700 | 25,514 | ||||||
| Best World International Ltd. (a) |
17,862 | 23,258 | ||||||
| Bonvests Holdings Ltd. |
18,000 | 13,775 | ||||||
| Boustead Singapore Ltd. |
82,025 | 53,390 | ||||||
| Bukit Sembawang Estates Ltd. |
56,100 | 150,019 | ||||||
| BW LPG Ltd. |
17,672 | 262,398 | ||||||
| Capitaland India Trust |
220,172 | 190,023 | ||||||
| Centurion Corp. Ltd. |
98,400 | 30,252 | ||||||
| China Aviation Oil Singapore Corp. Ltd. |
55,000 | 36,446 | ||||||
| Chuan Hup Holdings Ltd. |
125,000 | 16,371 | ||||||
| ComfortDelGro Corp. Ltd. |
398,200 | 421,961 | ||||||
| COSCO Shipping International Singapore Co. Ltd. (a) |
214,300 | 21,435 | ||||||
| Creative Technology Ltd. (a) |
16,300 | 17,693 | ||||||
| CSE Global Ltd. |
114,300 | 37,343 | ||||||
| CW Group Holdings Ltd. (a) (b) (c) |
106,000 | 0 | ||||||
| Delfi Ltd. |
80,600 | 68,366 | ||||||
| Ezion Holdings Ltd. (a) (b) (c) |
753,729 | 1 | ||||||
| Ezra Holdings Ltd. (a) (b) (c) |
1,000,703 | 1 | ||||||
| Far East Orchard Ltd. |
76,120 | 58,162 | ||||||
| First Resources Ltd. |
97,300 | 105,331 | ||||||
| Food Empire Holdings Ltd. |
54,000 | 46,248 | ||||||
| Fraser & Neave Ltd. |
36,400 | 29,234 | ||||||
| Frencken Group Ltd. |
57,600 | 58,647 | ||||||
| Fu Yu Corp. Ltd. |
98,800 | 11,749 | ||||||
| Gallant Venture Ltd. (a) |
257,900 | 25,404 | ||||||
| Geo Energy Resources Ltd. |
155,000 | 41,166 | ||||||
See accompanying notes to financial statements.
BHFTII-30
Brighthouse Funds Trust II
Brighthouse/Dimensional International Small Company Portfolio
Schedule of Investments as of December 31, 2023
Common Stocks—(Continued)
| Security Description | Shares | Value | ||||||
| Singapore—(Continued) | ||||||||
| Golden Agri-Resources Ltd. |
1,125,500 | $ | 221,873 | |||||
| GuocoLand Ltd. |
68,800 | 77,205 | ||||||
| Haw Par Corp. Ltd. |
18,900 | 139,480 | ||||||
| Hiap Hoe Ltd. |
58,000 | 28,127 | ||||||
| Ho Bee Land Ltd. |
49,800 | 66,704 | ||||||
| Hong Fok Corp. Ltd. |
90,940 | 62,660 | ||||||
| Hong Leong Asia Ltd. |
52,600 | 24,252 | ||||||
| Hong Leong Finance Ltd. |
43,900 | 83,132 | ||||||
| Hotel Grand Central Ltd. |
26,435 | 16,255 | ||||||
| Hour Glass Ltd. |
60,000 | 75,427 | ||||||
| HRnetgroup Ltd. |
67,700 | 36,681 | ||||||
| Hyflux Ltd. (a) (b) (c) |
179,500 | 0 | ||||||
| iFAST Corp. Ltd. |
25,500 | 158,382 | ||||||
| IGG, Inc. (a) |
192,000 | 79,550 | ||||||
| Indofood Agri Resources Ltd. |
152,000 | 34,528 | ||||||
| InnoTek Ltd. |
17,400 | 5,814 | ||||||
| Japfa Ltd. |
98,670 | 16,408 | ||||||
| Kenon Holdings Ltd. |
475 | 11,472 | ||||||
| Keppel Infrastructure Trust |
823,428 | 312,893 | ||||||
| KSH Holdings Ltd. |
25,700 | 4,681 | ||||||
| Low Keng Huat Singapore Ltd. |
122,600 | 30,191 | ||||||
| Metro Holdings Ltd. |
141,600 | 55,794 | ||||||
| Mewah International, Inc. |
110,000 | 24,171 | ||||||
| Midas Holdings Ltd. (a) (b) (c) |
452,000 | 0 | ||||||
| mm2 Asia Ltd. (a) |
299,600 | 7,052 | ||||||
| Nanofilm Technologies International Ltd. |
29,200 | 20,183 | ||||||
| Netlink NBN Trust |
345,500 | 220,122 | ||||||
| NSL Ltd. |
15,000 | 9,031 | ||||||
| OM Holdings Ltd. |
21,506 | 6,527 | ||||||
| OUE Ltd. |
70,300 | 63,846 | ||||||
| Oxley Holdings Ltd. (a) |
268,718 | 20,547 | ||||||
| Pan-United Corp. Ltd. |
53,750 | 15,493 | ||||||
| Propnex Ltd. |
15,400 | 10,843 | ||||||
| PSC Corp. Ltd. |
19,000 | 4,531 | ||||||
| Q&M Dental Group Singapore Ltd. |
50,160 | 9,712 | ||||||
| QAF Ltd. |
74,167 | 45,745 | ||||||
| Raffles Education Ltd. (a) |
335,506 | 13,334 | ||||||
| Raffles Medical Group Ltd. |
178,511 | 145,972 | ||||||
| Rickmers Maritime (a) (b) (c) |
110,000 | 0 | ||||||
| SATS Ltd. (a) |
123,039 | 255,912 | ||||||
| SBS Transit Ltd. |
25,600 | 51,721 | ||||||
| Sheng Siong Group Ltd. |
146,100 | 177,012 | ||||||
| SHS Holdings Ltd. |
47,000 | 4,274 | ||||||
| SIA Engineering Co. Ltd. |
55,200 | 99,017 | ||||||
| SIIC Environment Holdings Ltd. |
220,300 | 31,727 | ||||||
| Sinarmas Land Ltd. |
618,500 | 84,769 | ||||||
| Sing Holdings Ltd. |
82,000 | 19,883 | ||||||
| Singapore Land Group Ltd. |
20,800 | 31,329 | ||||||
| Singapore Post Ltd. |
259,000 | 93,163 | ||||||
| Stamford Land Corp. Ltd. |
220,201 | 65,031 | ||||||
| StarHub Ltd. |
117,100 | 98,441 | ||||||
| Straits Trading Co. Ltd. |
14,224 | 19,479 | ||||||
| Swiber Holdings Ltd. (a) (b) (c) |
235,498 | 0 | ||||||
| Thomson Medical Group Ltd. |
328,600 | 15,171 | ||||||
| Tuan Sing Holdings Ltd. |
189,225 | 40,116 | ||||||
| UMS Holdings Ltd. |
132,112 | 133,804 | ||||||
| United Overseas Insurance Ltd. |
4,000 | 18,003 | ||||||
| Singapore—(Continued) | ||||||||
| UOB-Kay Hian Holdings Ltd. |
135,107 | 137,221 | ||||||
| Venture Corp. Ltd. |
36,900 | 380,060 | ||||||
| Vicom Ltd. |
26,000 | 28,143 | ||||||
| Wee Hur Holdings Ltd. |
85,000 | 12,173 | ||||||
| Wing Tai Holdings Ltd. |
109,921 | 107,403 | ||||||
| Yeo Hiap Seng Ltd. |
20,155 | 9,163 | ||||||
|
|
|
|||||||
| 5,944,190 | ||||||||
|
|
|
|||||||
| Spain—2.4% | ||||||||
| Acerinox SA |
35,335 | 415,763 | ||||||
| Almirall SA |
19,817 | 184,476 | ||||||
| Amper SA (a) (d) |
302,851 | 27,953 | ||||||
| Applus Services SA |
31,502 | 347,829 | ||||||
| Atresmedia Corp. de Medios de Comunicacion SA |
23,928 | 94,921 | ||||||
| Azkoyen SA |
3,142 | 21,852 | ||||||
| Banco de Sabadell SA |
1,352,287 | 1,661,680 | ||||||
| Bankinter SA |
169,125 | 1,082,351 | ||||||
| Caja de Ahorros del Mediterraneo (a) (b) (c) (d) |
14,621 | 0 | ||||||
| Cia de Distribucion Integral Logista Holdings SA |
12,772 | 345,629 | ||||||
| CIE Automotive SA |
9,875 | 280,847 | ||||||
| Construcciones y Auxiliar de Ferrocarriles SA |
4,120 | 148,325 | ||||||
| Distribuidora Internacional de Alimentacion SA (a) |
2,455,491 | 32,003 | ||||||
| Ebro Foods SA |
14,580 | 249,887 | ||||||
| eDreams ODIGEO SA (a) |
17,603 | 149,054 | ||||||
| Elecnor SA |
8,759 | 189,139 | ||||||
| Enagas SA |
52,283 | 882,076 | ||||||
| Ence Energia y Celulosa SA |
32,907 | 102,916 | ||||||
| Ercros SA (d) |
20,859 | 60,823 | ||||||
| Faes Farma SA |
79,672 | 278,380 | ||||||
| Fluidra SA |
14,698 | 306,480 | ||||||
| Gestamp Automocion SA |
22,065 | 85,542 | ||||||
| Global Dominion Access SA |
22,659 | 84,029 | ||||||
| Grenergy Renovables SA (a) (d) |
1,152 | 43,572 | ||||||
| Grifols SA (a) |
10,113 | 173,330 | ||||||
| Grupo Catalana Occidente SA |
8,863 | 302,435 | ||||||
| Grupo Empresarial San Jose SA (d) |
8,320 | 31,784 | ||||||
| Iberpapel Gestion SA |
1,128 | 22,686 | ||||||
| Indra Sistemas SA (d) |
40,952 | 634,241 | ||||||
| Laboratorios Farmaceuticos Rovi SA |
4,330 | 288,384 | ||||||
| Linea Directa Aseguradora SA Cia de Seguros y Reaseguros (d) |
186,237 | 175,168 | ||||||
| Mapfre SA |
182,747 | 392,160 | ||||||
| Melia Hotels International SA (a) (d) |
31,617 | 208,649 | ||||||
| Miquel y Costas & Miquel SA |
8,745 | 114,156 | ||||||
| Neinor Homes SA |
4,237 | 49,386 | ||||||
| Obrascon Huarte Lain SA (a) |
47,913 | 23,847 | ||||||
| Pharma Mar SA |
2,214 | 100,430 | ||||||
| Prim SA |
3,013 | 34,924 | ||||||
| Promotora de Informaciones SA - Class A (a) |
83,921 | 26,844 | ||||||
| Prosegur Cash SA |
28,432 | 16,848 | ||||||
| Prosegur Compania de Seguridad SA |
49,013 | 95,264 | ||||||
| Realia Business SA |
123,493 | 144,532 | ||||||
| Sacyr SA |
99,264 | 342,762 | ||||||
| Solaria Energia y Medio Ambiente SA (a) (d) |
19,439 | 401,007 | ||||||
| Talgo SA (d) |
23,239 | 112,624 | ||||||
| Tecnicas Reunidas SA (a) |
11,864 | 109,335 | ||||||
| Tubacex SA |
28,472 | 110,017 | ||||||
See accompanying notes to financial statements.
BHFTII-31
Brighthouse Funds Trust II
Brighthouse/Dimensional International Small Company Portfolio
Schedule of Investments as of December 31, 2023
Common Stocks—(Continued)
| Security Description | Shares | Value | ||||||
| Spain—(Continued) | ||||||||
| Unicaja Banco SA (d) |
267,421 | $ | 262,843 | |||||
| Vidrala SA |
5,440 | 563,464 | ||||||
| Viscofan SA |
9,786 | 579,178 | ||||||
| Vocento SA (d) |
18,128 | 11,005 | ||||||
|
|
|
|||||||
| 12,402,830 | ||||||||
|
|
|
|||||||
| Sweden—2.5% | ||||||||
| AcadeMedia AB |
21,250 | 109,157 | ||||||
| AddLife AB - Class B |
6,958 | 75,487 | ||||||
| Addnode Group AB |
29,228 | 247,239 | ||||||
| AFRY AB |
16,879 | 233,982 | ||||||
| Alimak Group AB |
20,850 | 170,058 | ||||||
| Alligo AB - Class B |
8,890 | 109,657 | ||||||
| Ambea AB |
4,741 | 24,795 | ||||||
| Annehem Fastigheter AB - Class B (a) |
7,859 | 13,247 | ||||||
| AQ Group AB (d) |
654 | 32,870 | ||||||
| Arjo AB - B Shares |
55,404 | 217,311 | ||||||
| Attendo AB (a) |
28,610 | 102,678 | ||||||
| Beijer Alma AB |
13,962 | 263,119 | ||||||
| Bergman & Beving AB |
9,571 | 174,427 | ||||||
| Besqab AB (a) |
3,183 | 10,046 | ||||||
| Betsson AB - Class B |
38,092 | 409,750 | ||||||
| BHG Group AB (a) |
13,680 | 19,257 | ||||||
| Bilia AB - A Shares |
20,857 | 279,421 | ||||||
| BioGaia AB - B Shares |
3,014 | 30,143 | ||||||
| BioInvent International AB (a) |
2,421 | 4,563 | ||||||
| Biotage AB |
4,286 | 57,062 | ||||||
| Bonava AB - B Shares (a) |
18,068 | 23,585 | ||||||
| Boozt AB (a) |
5,455 | 73,441 | ||||||
| Bravida Holding AB |
5,903 | 47,460 | ||||||
| Bufab AB |
8,362 | 321,051 | ||||||
| Bulten AB |
4,294 | 34,218 | ||||||
| Bure Equity AB |
10,783 | 305,587 | ||||||
| Byggmax Group AB (a) |
18,326 | 68,946 | ||||||
| Catella AB |
2,281 | 7,328 | ||||||
| Catena AB |
6,814 | 320,159 | ||||||
| Cellavision AB |
2,146 | 45,283 | ||||||
| Cibus Nordic Real Estate AB publ |
2,907 | 38,545 | ||||||
| Clas Ohlson AB - B Shares |
12,720 | 199,562 | ||||||
| Cloetta AB - B Shares |
61,762 | 112,196 | ||||||
| Coor Service Management Holding AB |
24,209 | 104,827 | ||||||
| Corem Property Group AB - Class B (d) |
68,633 | 72,553 | ||||||
| Corem Property Group AB - Class D |
1,405 | 25,386 | ||||||
| Dios Fastigheter AB |
26,164 | 224,352 | ||||||
| Dometic Group AB |
8,120 | 72,541 | ||||||
| Dustin Group AB (a) |
75,208 | 73,478 | ||||||
| Eastnine AB |
5,243 | 89,426 | ||||||
| Elanders AB - B Shares |
1,453 | 13,829 | ||||||
| Electrolux Professional AB - Class B |
46,563 | 255,146 | ||||||
| Eltel AB (a) |
18,428 | 12,222 | ||||||
| Enea AB (a) |
4,082 | 22,898 | ||||||
| Eolus Vind AB - B Shares |
935 | 8,225 | ||||||
| Ependion AB |
7,843 | 97,615 | ||||||
| Ework Group AB |
2,864 | 42,076 | ||||||
| Fagerhult Group AB |
15,512 | 101,639 | ||||||
| Fastighets AB Trianon (a) |
3,988 | 6,633 | ||||||
| Sweden—(Continued) | ||||||||
| FastPartner AB - Class A |
10,644 | 66,284 | ||||||
| Ferronordic AB |
275 | 1,942 | ||||||
| Fingerprint Cards AB - Class B (a) (d) |
51,699 | 8,840 | ||||||
| FormPipe Software AB (a) |
2,450 | 6,584 | ||||||
| G5 Entertainment AB |
208 | 3,221 | ||||||
| Granges AB |
31,689 | 364,378 | ||||||
| Heba Fastighets AB - Class B |
19,054 | 67,176 | ||||||
| Hemnet Group AB |
7,877 | 188,597 | ||||||
| HMS Networks AB |
4,108 | 203,381 | ||||||
| Hoist Finance AB (a) |
12,983 | 47,850 | ||||||
| Humana AB (a) |
6,890 | 19,237 | ||||||
| Instalco AB |
38,975 | 158,152 | ||||||
| Inwido AB |
16,291 | 219,143 | ||||||
| ITAB Shop Concept AB |
1,944 | 2,332 | ||||||
| JM AB (d) |
14,820 | 262,668 | ||||||
| Karnov Group AB (a) |
14,120 | 77,847 | ||||||
| KNOW IT AB |
6,672 | 103,995 | ||||||
| Lagercrantz Group AB - B Shares |
6,007 | 80,855 | ||||||
| Lime Technologies AB |
1,294 | 38,090 | ||||||
| Lindab International AB |
21,935 | 432,957 | ||||||
| Loomis AB |
4,615 | 122,957 | ||||||
| Medcap AB (a) |
879 | 29,418 | ||||||
| MEKO AB |
11,543 | 125,612 | ||||||
| MIPS AB |
2,071 | 75,424 | ||||||
| Modern Times Group MTG AB - Class B (a) |
23,462 | 201,130 | ||||||
| Momentum Group AB |
8,890 | 115,076 | ||||||
| Munters Group AB |
20,599 | 334,117 | ||||||
| Mycronic AB |
7,244 | 206,710 | ||||||
| NCAB Group AB (d) |
20,370 | 148,297 | ||||||
| NCC AB - B Shares |
17,089 | 213,151 | ||||||
| Nederman Holding AB |
6,257 | 111,339 | ||||||
| Net Insight AB - Class B (a) (d) |
74,697 | 38,508 | ||||||
| New Wave Group AB - B Shares (d) |
29,604 | 300,701 | ||||||
| Nilorngruppen AB - B Shares (d) |
1,106 | 6,576 | ||||||
| Nobia AB (a) |
40,224 | 43,882 | ||||||
| Nolato AB - B Shares (d) |
47,680 | 250,200 | ||||||
| Nordic Paper Holding AB (d) |
2,747 | 12,213 | ||||||
| Nordic Waterproofing Holding AB |
6,754 | 110,129 | ||||||
| Norion Bank AB (a) |
5,059 | 21,752 | ||||||
| Note AB (a) |
2,362 | 34,959 | ||||||
| NP3 Fastigheter AB |
8,531 | 197,095 | ||||||
| Nyfosa AB |
44,721 | 428,022 | ||||||
| OEM International AB - B Shares |
22,800 | 238,266 | ||||||
| Orron Energy ab (a) |
9,493 | 7,537 | ||||||
| Ovzon AB (a) |
673 | 968 | ||||||
| Peab AB - Class B |
17,159 | 97,221 | ||||||
| Platzer Fastigheter Holding AB - Class B |
15,422 | 129,620 | ||||||
| Pricer AB - B Shares (a) |
45,096 | 34,996 | ||||||
| Proact IT Group AB |
8,496 | 79,370 | ||||||
| Ratos AB - B Shares |
61,820 | 221,675 | ||||||
| RaySearch Laboratories AB (a) |
7,859 | 70,636 | ||||||
| Rejlers AB |
1,659 | 20,148 | ||||||
| Rottneros AB |
26,936 | 32,593 | ||||||
| Scandi Standard AB |
18,069 | 103,006 | ||||||
| Scandic Hotels Group AB (a) |
33,911 | 156,077 | ||||||
| Sdiptech AB - Class B (a) |
4,249 | 114,175 | ||||||
| Sensys Gatso Group AB (a) |
2,792 | 20,101 | ||||||
See accompanying notes to financial statements.
BHFTII-32
Brighthouse Funds Trust II
Brighthouse/Dimensional International Small Company Portfolio
Schedule of Investments as of December 31, 2023
Common Stocks—(Continued)
| Security Description | Shares | Value | ||||||
| Sweden—(Continued) | ||||||||
| SkiStar AB |
13,849 | $ | 164,687 | |||||
| Softronic AB - B Shares (d) |
3,875 | 7,628 | ||||||
| Solid Forsakring AB |
2,708 | 17,106 | ||||||
| Stendorren Fastigheter AB (a) |
1,576 | 28,707 | ||||||
| Stillfront Group AB (a) |
27,529 | 33,328 | ||||||
| Storskogen Group AB - Class B |
38,305 | 35,402 | ||||||
| Systemair AB |
22,572 | 176,182 | ||||||
| Tethys Oil AB |
2,076 | 8,948 | ||||||
| TF Bank AB (a) |
690 | 11,674 | ||||||
| Troax Group AB |
11,680 | 286,833 | ||||||
| Truecaller AB - Class B (a) |
13,719 | 47,672 | ||||||
| VBG Group AB - B Shares |
2,387 | 57,512 | ||||||
| Viaplay Group AB (a) |
3,680 | 1,899 | ||||||
| Vitec Software Group AB - B Shares |
5,020 | 292,735 | ||||||
| Volati AB |
1,043 | 11,474 | ||||||
|
|
|
|||||||
| 13,393,449 | ||||||||
|
|
|
|||||||
| Switzerland—8.0% | ||||||||
| Accelleron Industries AG |
7,236 | 226,337 | ||||||
| Adecco Group AG |
28,183 | 1,386,919 | ||||||
| Allreal Holding AG |
3,829 | 685,714 | ||||||
| ALSO Holding AG |
1,870 | 558,883 | ||||||
| APG SGA SA |
390 | 84,837 | ||||||
| Arbonia AG (d) |
14,726 | 168,951 | ||||||
| Aryzta AG (a) |
240,805 | 445,361 | ||||||
| Ascom Holding AG |
3,201 | 31,326 | ||||||
| Autoneum Holding AG (a) (d) |
1,045 | 169,704 | ||||||
| Avolta AG (a) |
21,834 | 861,259 | ||||||
| Baloise Holding AG |
8,025 | 1,258,116 | ||||||
| Banque Cantonale de Geneve |
750 | 200,540 | ||||||
| Banque Cantonale Vaudoise |
4,600 | 593,455 | ||||||
| Basilea Pharmaceutica AG (a) |
1,225 | 51,421 | ||||||
| Belimo Holding AG |
2,620 | 1,445,252 | ||||||
| Bell Food Group AG |
640 | 193,264 | ||||||
| Bellevue Group AG (d) |
3,322 | 96,781 | ||||||
| Berner Kantonalbank AG |
1,195 | 335,282 | ||||||
| BKW AG |
3,879 | 690,296 | ||||||
| Bossard Holding AG - Class A (d) |
1,729 | 454,369 | ||||||
| Bucher Industries AG |
1,798 | 755,428 | ||||||
| Burckhardt Compression Holding AG |
714 | 431,067 | ||||||
| Burkhalter Holding AG |
555 | 61,163 | ||||||
| Bystronic AG |
398 | 225,624 | ||||||
| Calida Holding AG |
1,703 | 59,541 | ||||||
| Carlo Gavazzi Holding AG |
124 | 47,214 | ||||||
| Cembra Money Bank AG |
7,756 | 605,776 | ||||||
| Cicor Technologies Ltd. (a) |
644 | 38,142 | ||||||
| Cie Financiere Tradition SA |
607 | 85,157 | ||||||
| Clariant AG |
57,069 | 844,762 | ||||||
| Coltene Holding AG |
1,092 | 92,960 | ||||||
| Comet Holding AG |
1,743 | 551,738 | ||||||
| Daetwyler Holding AG |
1,318 | 306,023 | ||||||
| DKSH Holding AG |
9,849 | 684,618 | ||||||
| dormakaba Holding AG |
861 | 465,262 | ||||||
| EDAG Engineering Group AG |
3,171 | 47,992 | ||||||
| EFG International AG (d) |
23,424 | 300,856 | ||||||
| Emmi AG (d) |
591 | 640,945 | ||||||
| Switzerland—(Continued) | ||||||||
| Energiedienst Holding AG |
3,894 | 178,310 | ||||||
| Feintool International Holding AG (d) |
1,764 | 38,065 | ||||||
| Fenix Outdoor International AG (d) |
1,091 | 83,763 | ||||||
| Ferrexpo PLC (a) |
523 | 602 | ||||||
| Flughafen Zurich AG |
5,235 | 1,093,648 | ||||||
| Forbo Holding AG |
276 | 346,116 | ||||||
| Fundamenta Real Estate AG |
4,539 | 90,686 | ||||||
| Galenica AG |
13,170 | 1,139,406 | ||||||
| GAM Holding AG (a) |
62,659 | 29,162 | ||||||
| Georg Fischer AG |
21,135 | 1,538,505 | ||||||
| Gurit Holding AG - Class BR (a) (d) |
1,066 | 103,704 | ||||||
| Helvetia Holding AG |
10,528 | 1,450,942 | ||||||
| Hiag Immobilien Holding AG |
1,482 | 140,684 | ||||||
| Highlight Communications AG (a) |
7,829 | 23,553 | ||||||
| HOCHDORF Holding AG (a) (d) |
174 | 3,206 | ||||||
| Huber & Suhner AG |
4,607 | 372,573 | ||||||
| Hypothekarbank Lenzburg AG |
3 | 14,621 | ||||||
| Implenia AG |
4,062 | 147,325 | ||||||
| Ina Invest Holding AG (a) |
1,388 | 28,810 | ||||||
| Inficon Holding AG |
501 | 719,335 | ||||||
| Interroll Holding AG |
216 | 687,454 | ||||||
| Intershop Holding AG |
353 | 258,156 | ||||||
| Investis Holding SA |
421 | 48,853 | ||||||
| IWG PLC (a) |
194,505 | 467,999 | ||||||
| Jungfraubahn Holding AG |
970 | 184,513 | ||||||
| Kardex Holding AG |
2,082 | 541,050 | ||||||
| Komax Holding AG |
1,115 | 266,187 | ||||||
| Kongsberg Automotive ASA (a) |
156,504 | 31,548 | ||||||
| Kudelski SA (a) |
13,221 | 19,055 | ||||||
| Landis+Gyr Group AG |
4,662 | 421,831 | ||||||
| LEM Holding SA |
150 | 370,484 | ||||||
| Luzerner Kantonalbank AG |
4,993 | 427,610 | ||||||
| Medacta Group SA |
1,064 | 159,320 | ||||||
| Medmix AG |
5,258 | 119,198 | ||||||
| Meier Tobler Group AG |
1,744 | 76,813 | ||||||
| Metall Zug AG - B Shares |
62 | 112,397 | ||||||
| Mikron Holding AG |
2,145 | 39,026 | ||||||
| Mobilezone Holding AG |
12,863 | 210,038 | ||||||
| Mobimo Holding AG |
2,004 | 622,662 | ||||||
| Novavest Real Estate AG |
468 | 20,256 | ||||||
| OC Oerlikon Corp. AG |
53,535 | 241,740 | ||||||
| Orascom Development Holding AG (a) |
4,230 | 24,112 | ||||||
| Orell Fuessli AG |
331 | 29,606 | ||||||
| Orior AG (d) |
1,947 | 166,957 | ||||||
| Phoenix Mecano AG (a) |
244 | 125,880 | ||||||
| Plazza AG - Class A |
222 | 79,199 | ||||||
| PSP Swiss Property AG |
11,769 | 1,647,787 | ||||||
| Resurs Holding AB |
27,086 | 64,132 | ||||||
| Rieter Holding AG (d) |
686 | 73,599 | ||||||
| Romande Energie Holding SA |
2,775 | 181,510 | ||||||
| Schweiter Technologies AG |
286 | 176,492 | ||||||
| Schweizerische Nationalbank (a) |
5 | 25,567 | ||||||
| Sensirion Holding AG (a) (d) |
1,407 | 139,825 | ||||||
| SFS Group AG |
5,084 | 630,976 | ||||||
| Siegfried Holding AG |
1,138 | 1,163,292 | ||||||
| SIG Group AG |
2,682 | 61,730 | ||||||
| SKAN Group AG |
131 | 12,568 | ||||||
See accompanying notes to financial statements.
BHFTII-33
Brighthouse Funds Trust II
Brighthouse/Dimensional International Small Company Portfolio
Schedule of Investments as of December 31, 2023
Common Stocks—(Continued)
| Security Description | Shares | Value | ||||||
| Switzerland—(Continued) | ||||||||
| St Galler Kantonalbank AG |
791 | $ | 462,272 | |||||
| Stadler Rail AG |
4,535 | 163,335 | ||||||
| Sulzer AG |
5,258 | 537,163 | ||||||
| Swiss Prime Site AG |
15,133 | 1,618,935 | ||||||
| Swiss Steel Holding AG (a) |
161,565 | 16,093 | ||||||
| Swissquote Group Holding SA |
3,768 | 918,905 | ||||||
| Temenos AG |
15,465 | 1,443,240 | ||||||
| TX Group AG |
920 | 132,116 | ||||||
| u-blox Holding AG (d) |
2,020 | 240,089 | ||||||
| V-ZUG Holding AG (a) |
780 | 60,069 | ||||||
| Valiant Holding AG |
4,473 | 507,373 | ||||||
| Vaudoise Assurances Holding SA |
192 | 100,501 | ||||||
| Vetropack Holding AG |
3,634 | 169,278 | ||||||
| Vontobel Holding AG (d) |
7,238 | 469,090 | ||||||
| VZ Holding AG |
3,926 | 458,435 | ||||||
| Walliser Kantonalbank |
1,345 | 174,331 | ||||||
| Warteck Invest AG |
53 | 116,419 | ||||||
| Ypsomed Holding AG |
692 | 249,354 | ||||||
| Zehnder Group AG |
2,819 | 179,896 | ||||||
| Zug Estates Holding AG - B Shares |
83 | 158,378 | ||||||
| Zuger Kantonalbank AG |
45 | 404,486 | ||||||
|
|
|
|||||||
| 42,234,531 | ||||||||
|
|
|
|||||||
| Taiwan—0.0% | ||||||||
| FIT Hon Teng Ltd. (a) |
80,000 | 12,054 | ||||||
|
|
|
|||||||
| Tanzania—0.0% | ||||||||
| Helios Towers PLC (a) |
110,176 | 125,192 | ||||||
|
|
|
|||||||
| United Arab Emirates—0.0% | ||||||||
| Network International Holdings PLC (a) |
11,307 | 56,176 | ||||||
| Shelf Drilling Ltd. (a) |
19,770 | 56,461 | ||||||
|
|
|
|||||||
| 112,637 | ||||||||
|
|
|
|||||||
| United Kingdom—12.1% | ||||||||
| 4imprint Group PLC |
7,046 | 409,403 | ||||||
| 888 Holdings PLC (a) |
12,712 | 15,491 | ||||||
| abrdn PLC (d) |
108,666 | 246,919 | ||||||
| Accesso Technology Group PLC (a) |
2,402 | 17,693 | ||||||
| Advanced Medical Solutions Group PLC |
23,347 | 61,747 | ||||||
| AG Barr PLC |
33,154 | 216,694 | ||||||
| AJ Bell PLC |
59,750 | 237,943 | ||||||
| Alfa Financial Software Holdings PLC |
10,992 | 19,605 | ||||||
| Allfunds Group PLC |
2,273 | 16,183 | ||||||
| Alliance Pharma PLC |
95,282 | 49,210 | ||||||
| Anglo-Eastern Plantations PLC |
5,782 | 49,325 | ||||||
| Ascential PLC (a) |
79,762 | 299,562 | ||||||
| Ashmore Group PLC |
97,994 | 277,843 | ||||||
| ASOS PLC (a) (d) |
1,729 | 9,388 | ||||||
| Auction Technology Group PLC (a) |
2,941 | 19,513 | ||||||
| Avon Rubber PLC |
8,677 | 94,006 | ||||||
| Babcock International Group PLC |
152,440 | 765,770 | ||||||
| Bakkavor Group PLC |
37,729 | 38,862 | ||||||
| Balfour Beatty PLC |
173,040 | 729,310 | ||||||
| Beazley PLC |
133,083 | 883,501 | ||||||
| Begbies Traynor Group PLC |
20,686 | 30,867 | ||||||
| United Kingdom—(Continued) | ||||||||
| Bellway PLC |
28,810 | 940,039 | ||||||
| Bloomsbury Publishing PLC |
28,218 | 168,822 | ||||||
| Bodycote PLC |
59,365 | 448,783 | ||||||
| boohoo Group PLC (a) (d) |
68,276 | 35,640 | ||||||
| Braemar PLC (a) |
7,120 | 24,958 | ||||||
| Breedon Group PLC |
7,689 | 35,463 | ||||||
| Bridgepoint Group PLC |
16,451 | 58,280 | ||||||
| Britvic PLC |
74,790 | 801,783 | ||||||
| Brooks Macdonald Group PLC |
486 | 12,113 | ||||||
| Bytes Technology Group PLC |
49,945 | 388,571 | ||||||
| Capita PLC (a) |
344,633 | 96,144 | ||||||
| Capricorn Energy PLC |
44,415 | 95,856 | ||||||
| Card Factory PLC (a) |
103,756 | 142,339 | ||||||
| Carr’s Group PLC (d) |
19,239 | 24,627 | ||||||
| Castings PLC |
2,870 | 13,362 | ||||||
| Centaur Media PLC |
92,526 | 54,755 | ||||||
| Central Asia Metals PLC |
20,359 | 46,778 | ||||||
| Chemring Group PLC |
75,168 | 335,894 | ||||||
| Chesnara PLC |
50,709 | 168,953 | ||||||
| Clarkson PLC |
8,219 | 331,789 | ||||||
| Close Brothers Group PLC |
45,801 | 462,936 | ||||||
| CMC Markets PLC |
42,124 | 56,355 | ||||||
| Coats Group PLC |
319,324 | 314,761 | ||||||
| Computacenter PLC |
22,674 | 804,466 | ||||||
| Concentric AB |
9,871 | 176,728 | ||||||
| Costain Group PLC |
35,950 | 28,958 | ||||||
| Cranswick PLC |
15,838 | 767,721 | ||||||
| Crest Nicholson Holdings PLC |
83,456 | 230,472 | ||||||
| Currys PLC (a) |
250,394 | 160,610 | ||||||
| CVS Group PLC |
15,668 | 335,819 | ||||||
| Darktrace PLC (a) |
5,088 | 23,709 | ||||||
| De La Rue PLC (a) |
5,787 | 6,390 | ||||||
| Deliveroo PLC (a) |
68,684 | 111,670 | ||||||
| DFS Furniture PLC |
51,390 | 79,534 | ||||||
| Dialight PLC (a) (d) |
5,140 | 9,620 | ||||||
| Diploma PLC |
19,434 | 885,297 | ||||||
| Direct Line Insurance Group PLC (a) |
196,487 | 455,370 | ||||||
| DiscoverIE Group PLC |
15,588 | 156,553 | ||||||
| Domino’s Pizza Group PLC |
124,310 | 594,872 | ||||||
| dotdigital group PLC |
41,626 | 52,378 | ||||||
| Dr Martens PLC |
56,127 | 63,280 | ||||||
| Drax Group PLC |
117,307 | 732,620 | ||||||
| DS Smith PLC |
76,102 | 298,349 | ||||||
| Dunelm Group PLC |
27,630 | 385,191 | ||||||
| easyJet PLC (a) |
5,538 | 35,956 | ||||||
| Ecora Resources PLC |
51,447 | 65,613 | ||||||
| EKF Diagnostics Holdings PLC |
38,020 | 15,304 | ||||||
| Elementis PLC (a) |
188,304 | 306,061 | ||||||
| Energean PLC (d) |
27,001 | 359,149 | ||||||
| EnQuest PLC (a) |
515,849 | 99,099 | ||||||
| Epwin Group PLC |
14,369 | 14,931 | ||||||
| Esken Ltd. (a) |
102,535 | 1,563 | ||||||
| Essentra PLC |
94,236 | 203,664 | ||||||
| FDM Group Holdings PLC |
21,321 | 125,329 | ||||||
| Fevertree Drinks PLC |
4,526 | 60,393 | ||||||
| Firstgroup PLC |
145,351 | 323,933 | ||||||
| FLEX LNG Ltd. |
948 | 27,842 | ||||||
See accompanying notes to financial statements.
BHFTII-34
Brighthouse Funds Trust II
Brighthouse/Dimensional International Small Company Portfolio
Schedule of Investments as of December 31, 2023
Common Stocks—(Continued)
| Security Description | Shares | Value | ||||||
| United Kingdom—(Continued) | ||||||||
| Flowtech Fluidpower PLC |
6,703 | $ | 7,095 | |||||
| Forterra PLC |
58,426 | 131,471 | ||||||
| Foxtons Group PLC |
74,860 | 43,835 | ||||||
| Frasers Group PLC (a) |
31,394 | 363,715 | ||||||
| Frontier Developments PLC (a) |
3,312 | 5,549 | ||||||
| Fuller Smith & Turner PLC - Class A |
9,279 | 77,192 | ||||||
| Fund Technologies PLC (a) |
3,285 | 48,185 | ||||||
| Funding Circle Holdings PLC (a) |
10,326 | 5,253 | ||||||
| Galliford Try Holdings PLC |
39,862 | 113,957 | ||||||
| Games Workshop Group PLC |
8,487 | 1,063,617 | ||||||
| Gamma Communications PLC |
15,986 | 228,866 | ||||||
| Gem Diamonds Ltd. (a) |
44,142 | 7,481 | ||||||
| Genel Energy PLC (d) |
14,530 | 14,180 | ||||||
| Genuit Group PLC |
68,299 | 350,475 | ||||||
| Georgia Capital PLC (a) |
7,105 | 92,501 | ||||||
| Gooch & Housego PLC |
2,212 | 16,729 | ||||||
| Goodwin PLC |
121 | 8,880 | ||||||
| Grafton Group PLC |
62,887 | 728,760 | ||||||
| Grainger PLC |
204,518 | 688,187 | ||||||
| Greggs PLC |
29,520 | 975,703 | ||||||
| Gulf Keystone Petroleum Ltd. (d) |
64,377 | 105,736 | ||||||
| Gym Group PLC (a) |
49,004 | 66,310 | ||||||
| H&T Group PLC |
1,027 | 5,652 | ||||||
| Halfords Group PLC |
72,677 | 184,621 | ||||||
| Harbour Energy PLC |
82,060 | 322,296 | ||||||
| Hargreaves Lansdown PLC |
52,847 | 492,428 | ||||||
| Harworth Group PLC |
4,382 | 6,758 | ||||||
| Hays PLC |
457,753 | 637,046 | ||||||
| Headlam Group PLC |
29,149 | 80,211 | ||||||
| Helical PLC |
38,476 | 108,352 | ||||||
| Henry Boot PLC |
14,477 | 38,405 | ||||||
| Hill & Smith PLC |
26,057 | 632,270 | ||||||
| Hilton Food Group PLC |
19,243 | 195,643 | ||||||
| Hiscox Ltd. |
63,107 | 846,456 | ||||||
| Hollywood Bowl Group PLC |
35,798 | 139,512 | ||||||
| Howden Joinery Group PLC |
82,426 | 853,906 | ||||||
| Hunting PLC |
47,371 | 178,711 | ||||||
| Ibstock PLC |
123,730 | 238,368 | ||||||
| IDOX PLC (d) |
75,537 | 66,444 | ||||||
| IG Group Holdings PLC |
57,306 | 558,253 | ||||||
| IMI PLC |
21,068 | 450,984 | ||||||
| Impax Asset Management Group PLC |
14,750 | 103,350 | ||||||
| Inchcape PLC |
94,730 | 860,938 | ||||||
| Indivior PLC (a) |
29,960 | 452,420 | ||||||
| IntegraFin Holdings PLC |
51,584 | 198,951 | ||||||
| Intermediate Capital Group PLC |
11,809 | 252,329 | ||||||
| International Distributions Services PLC (a) |
90,342 | 313,197 | ||||||
| International Personal Finance PLC |
79,366 | 120,536 | ||||||
| iomart Group PLC |
16,833 | 32,576 | ||||||
| IP Group PLC |
225,731 | 166,493 | ||||||
| IQE PLC (a) (d) |
87,265 | 27,073 | ||||||
| ITV PLC |
636,123 | 511,594 | ||||||
| J D Wetherspoon PLC (a) |
21,503 | 221,282 | ||||||
| James Fisher & Sons PLC (a) |
15,436 | 60,577 | ||||||
| James Halstead PLC (d) |
59,490 | 154,235 | ||||||
| JET2 PLC |
34,034 | 539,949 | ||||||
| John Wood Group PLC (a) |
195,202 | 425,852 | ||||||
| United Kingdom—(Continued) | ||||||||
| Johnson Matthey PLC |
12,469 | 269,535 | ||||||
| Johnson Service Group PLC |
61,047 | 110,133 | ||||||
| Jupiter Fund Management PLC |
156,485 | 185,641 | ||||||
| Just Group PLC |
224,609 | 245,655 | ||||||
| Kainos Group PLC |
20,314 | 289,709 | ||||||
| Keller Group PLC |
23,073 | 258,288 | ||||||
| Kier Group PLC (a) |
94,700 | 128,967 | ||||||
| Kin & Carta PLC (a) |
25,591 | 43,298 | ||||||
| Lancashire Holdings Ltd. |
72,054 | 572,828 | ||||||
| Learning Technologies Group PLC |
73,668 | 75,789 | ||||||
| Liontrust Asset Management PLC |
12,072 | 96,729 | ||||||
| LSL Property Services PLC |
25,826 | 84,839 | ||||||
| Luceco PLC |
31,684 | 49,974 | ||||||
| M&C Saatchi PLC |
3,677 | 7,473 | ||||||
| Man Group PLC |
374,661 | 1,107,957 | ||||||
| Marks & Spencer Group PLC |
395,896 | 1,372,503 | ||||||
| Marshalls PLC |
20,097 | 71,492 | ||||||
| Marston’s PLC (a) |
211,171 | 90,769 | ||||||
| McBride PLC (a) (d) |
63,975 | 63,561 | ||||||
| Me Group International PLC |
81,556 | 129,674 | ||||||
| Mears Group PLC |
36,497 | 143,913 | ||||||
| Metro Bank Holdings PLC (a) (d) |
2,816 | 1,325 | ||||||
| Midwich Group PLC |
2,355 | 13,125 | ||||||
| Mitchells & Butlers PLC (a) |
84,608 | 277,140 | ||||||
| Mitie Group PLC |
406,977 | 514,110 | ||||||
| MJ Gleeson PLC |
13,112 | 81,191 | ||||||
| Mobico Group PLC |
165,517 | 178,442 | ||||||
| Moneysupermarket.com Group PLC |
146,027 | 520,251 | ||||||
| Moonpig Group PLC (a) |
5,076 | 10,095 | ||||||
| Morgan Advanced Materials PLC |
95,467 | 344,158 | ||||||
| Morgan Sindall Group PLC |
14,007 | 394,453 | ||||||
| Mortgage Advice Bureau Holdings Ltd. |
6,665 | 69,576 | ||||||
| Motorpoint group PLC (a) |
14,323 | 20,870 | ||||||
| MP Evans Group PLC |
2,300 | 21,678 | ||||||
| N Brown Group PLC (a) (d) |
62,840 | 12,353 | ||||||
| Naked Wines PLC (a) |
1,427 | 1,000 | ||||||
| NCC Group PLC |
88,729 | 145,697 | ||||||
| Next 15 Group PLC (d) |
16,972 | 180,062 | ||||||
| Ninety One PLC (d) |
93,523 | 218,199 | ||||||
| Norcros PLC |
11,343 | 27,662 | ||||||
| Odfjell Technology Ltd. |
4,274 | 23,300 | ||||||
| On the Beach Group PLC (a) |
32,313 | 71,976 | ||||||
| OSB Group PLC |
95,681 | 563,912 | ||||||
| Oxford Instruments PLC |
15,582 | 454,179 | ||||||
| Pagegroup PLC |
102,025 | 633,292 | ||||||
| Pan African Resources PLC |
368,191 | 79,122 | ||||||
| Paragon Banking Group PLC |
63,215 | 560,097 | ||||||
| PayPoint PLC |
21,008 | 139,168 | ||||||
| Pendragon PLC (a) |
345,188 | 141,975 | ||||||
| Pennon Group PLC |
68,031 | 657,131 | ||||||
| Persimmon PLC |
36,818 | 649,378 | ||||||
| Petrofac Ltd. (a) |
29,625 | 14,053 | ||||||
| Pets at Home Group PLC |
145,850 | 591,757 | ||||||
| Pharos Energy PLC |
50,968 | 13,827 | ||||||
| Phoenix Spree Deutschland Ltd. (a) |
665 | 1,441 | ||||||
| Playtech PLC (a) |
73,270 | 418,377 | ||||||
| Polar Capital Holdings PLC |
16,568 | 98,148 | ||||||
See accompanying notes to financial statements.
BHFTII-35
Brighthouse Funds Trust II
Brighthouse/Dimensional International Small Company Portfolio
Schedule of Investments as of December 31, 2023
Common Stocks—(Continued)
| Security Description | Shares | Value | ||||||
| United Kingdom—(Continued) | ||||||||
| Porvair PLC |
8,570 | $ | 67,228 | |||||
| PPHE Hotel Group Ltd. |
3,290 | 50,271 | ||||||
| Premier Foods PLC |
206,665 | 356,609 | ||||||
| PZ Cussons PLC |
74,104 | 144,222 | ||||||
| QinetiQ Group PLC |
161,136 | 633,115 | ||||||
| Quilter PLC |
370,926 | 486,142 | ||||||
| Rank Group PLC (a) |
54,017 | 51,622 | ||||||
| Rathbones Group PLC |
11,633 | 257,212 | ||||||
| Reach PLC |
103,289 | 98,139 | ||||||
| Record PLC |
12,453 | 11,237 | ||||||
| Redde Northgate PLC |
57,053 | 263,958 | ||||||
| Redrow PLC |
80,746 | 633,991 | ||||||
| Renew Holdings PLC |
9,893 | 108,402 | ||||||
| Renewi PLC (a) |
25,541 | 207,241 | ||||||
| Renishaw PLC |
1,176 | 53,779 | ||||||
| Renold PLC (a) |
238 | 106 | ||||||
| Ricardo PLC |
13,452 | 84,010 | ||||||
| Rightmove PLC |
8,484 | 62,001 | ||||||
| RM PLC (a) |
43,283 | 35,787 | ||||||
| Robert Walters PLC |
16,356 | 92,777 | ||||||
| Rotork PLC |
207,102 | 851,779 | ||||||
| RS Group PLC |
43,000 | 447,552 | ||||||
| RWS Holdings PLC |
12,286 | 39,240 | ||||||
| S&U PLC |
1,188 | 33,092 | ||||||
| S4 Capital PLC (a) |
28,030 | 18,996 | ||||||
| Sabre Insurance Group PLC |
49,439 | 95,297 | ||||||
| Saga PLC (a) |
8,514 | 15,793 | ||||||
| Savills PLC |
43,996 | 541,857 | ||||||
| Secure Trust Bank PLC |
458 | 4,024 | ||||||
| Senior PLC |
149,224 | 337,070 | ||||||
| Serco Group PLC |
300,955 | 619,643 | ||||||
| Serica Energy PLC |
47,039 | 137,745 | ||||||
| Severfield PLC |
100,890 | 81,662 | ||||||
| SIG PLC (a) |
255,262 | 108,608 | ||||||
| Smart Metering Systems PLC |
23,321 | 278,710 | ||||||
| Smiths News PLC (d) |
20,535 | 13,968 | ||||||
| Softcat PLC |
30,193 | 522,406 | ||||||
| Spectris PLC |
3,586 | 172,097 | ||||||
| Speedy Hire PLC |
151,595 | 63,528 | ||||||
| Spire Healthcare Group PLC |
62,350 | 179,701 | ||||||
| Spirent Communications PLC |
181,575 | 284,585 | ||||||
| SSP Group PLC (a) |
185,760 | 553,029 | ||||||
| SThree PLC |
41,761 | 221,782 | ||||||
| Studio Retail Group PLC (a) (b) (c) |
17,439 | 0 | ||||||
| STV Group PLC |
7,194 | 18,050 | ||||||
| Superdry PLC (a) |
18,185 | 7,950 | ||||||
| Synthomer PLC (a) |
35,511 | 85,825 | ||||||
| Tate & Lyle PLC |
97,547 | 817,290 | ||||||
| Taylor Wimpey PLC |
138,969 | 259,788 | ||||||
| TBC Bank Group PLC |
6,341 | 228,589 | ||||||
| TClarke PLC |
15,381 | 26,651 | ||||||
| Telecom Plus PLC |
18,238 | 373,709 | ||||||
| THG PLC (a) |
29,472 | 31,864 | ||||||
| Topps Tiles PLC |
61,961 | 39,415 | ||||||
| TORM PLC - Class A |
7,185 | 217,240 | ||||||
| TP ICAP Group PLC |
235,823 | 586,130 | ||||||
| Trainline PLC (a) |
2,985 | 12,196 | ||||||
| United Kingdom—(Continued) | ||||||||
| Travis Perkins PLC |
50,576 | 532,443 | ||||||
| Trifast PLC |
20,432 | 22,940 | ||||||
| TT Electronics PLC |
54,423 | 108,236 | ||||||
| Tyman PLC |
21,078 | 84,307 | ||||||
| Vanquis Banking Group PLC |
52,029 | 85,680 | ||||||
| Verici Dx PLC (a) |
760 | 94 | ||||||
| Vertu Motors PLC |
46,012 | 41,573 | ||||||
| Vesuvius PLC |
68,585 | 419,829 | ||||||
| Victrex PLC |
19,606 | 380,021 | ||||||
| Videndum PLC |
14,491 | 64,108 | ||||||
| Virgin Money U.K. PLC |
239,897 | 500,972 | ||||||
| Vistry Group PLC |
71,357 | 830,574 | ||||||
| Volex PLC |
20,790 | 84,395 | ||||||
| Volution Group PLC |
34,155 | 188,114 | ||||||
| Vp PLC (d) |
4,147 | 33,736 | ||||||
| Watches of Switzerland Group PLC (a) |
47,460 | 426,551 | ||||||
| Watkin Jones PLC |
46,386 | 34,496 | ||||||
| WH Smith PLC |
30,332 | 514,479 | ||||||
| Wickes Group PLC |
76,029 | 137,096 | ||||||
| Wincanton PLC |
40,925 | 162,215 | ||||||
| Xaar PLC (a) |
18,088 | 26,861 | ||||||
| XPS Pensions Group PLC |
7,428 | 22,053 | ||||||
| Young & Co.’s Brewery PLC |
1,744 | 18,119 | ||||||
| Young & Co.’s Brewery PLC - Class A (d) |
4,640 | 64,536 | ||||||
| Zotefoams PLC |
7,268 | 30,939 | ||||||
|
|
|
|||||||
| 63,547,949 | ||||||||
|
|
|
|||||||
| United States—0.6% | ||||||||
| ADTRAN Holdings, Inc. (d) |
10,268 | 77,191 | ||||||
| Argonaut Gold, Inc. (a) (d) |
80,499 | 28,553 | ||||||
| Bausch Health Cos., Inc. (a) |
56,435 | 452,618 | ||||||
| Burford Capital Ltd. |
35,459 | 546,871 | ||||||
| Diversified Energy Co. PLC |
9,570 | 135,743 | ||||||
| Energy Fuels, Inc. (a) (d) |
7,296 | 52,309 | ||||||
| Frontage Holdings Corp. (a) |
58,000 | 17,260 | ||||||
| Noble Corp. PLC |
489 | 23,637 | ||||||
| Ormat Technologies, Inc. |
1 | 43 | ||||||
| Primo Water Corp. |
2,400 | 36,120 | ||||||
| PureTech Health PLC (a) |
49,670 | 122,896 | ||||||
| Reliance Worldwide Corp. Ltd. |
176,413 | 531,216 | ||||||
| Samsonite International SA (a) |
219,000 | 720,718 | ||||||
| Sims Ltd. |
43,872 | 464,373 | ||||||
| Varia U.S. Properties AG |
1,203 | 54,370 | ||||||
| Viemed Healthcare, Inc. (a) |
5,284 | 41,479 | ||||||
|
|
|
|||||||
| 3,305,397 | ||||||||
|
|
|
|||||||
| Total Common Stocks |
524,227,890 | |||||||
|
|
|
|||||||
| Preferred Stocks—0.4% |
| |||||||
| Germany—0.4% | ||||||||
| Draegerwerk AG & Co. KGaA |
3,031 | 173,355 | ||||||
| Einhell Germany AG |
82 | 14,961 | ||||||
| FUCHS SE |
17,122 | 761,755 | ||||||
| Jungheinrich AG |
15,319 | 561,905 | ||||||
See accompanying notes to financial statements.
BHFTII-36
Brighthouse Funds Trust II
Brighthouse/Dimensional International Small Company Portfolio
Schedule of Investments as of December 31, 2023
Preferred Stocks—(Continued)
| Security Description | Shares/ Principal Amount* |
Value | ||||||
| Germany—(Continued) | ||||||||
| Sixt SE |
4,716 | $ | 349,355 | |||||
| STO SE & Co. KGaA |
618 | 95,374 | ||||||
| Villeroy & Boch AG |
505 | 9,972 | ||||||
|
|
|
|||||||
| 1,966,677 | ||||||||
|
|
|
|||||||
| Italy—0.0% | ||||||||
| Danieli & C Officine Meccaniche SpA |
4,725 | 113,242 | ||||||
|
|
|
|||||||
| Total Preferred Stocks |
2,079,919 | |||||||
|
|
|
|||||||
| Warrants—0.0% |
| |||||||
| Australia—0.0% | ||||||||
| Arafura Rare Earths Ltd., Expires 06/20/25 (a) |
12,974 | 407 | ||||||
| Panoramic Resources Ltd., Expires 09/16/24 (a) |
39,049 | 0 | ||||||
|
|
|
|||||||
| 407 | ||||||||
|
|
|
|||||||
| Italy—0.0% | ||||||||
| Webuild SpA, Expires 08/02/30 (a) (d) |
6,346 | 0 | ||||||
|
|
|
|||||||
| Total Warrants |
407 | |||||||
|
|
|
|||||||
| Rights—0.0% |
| |||||||
| Austria—0.0% | ||||||||
| Intercell AG (a) (b) (c) |
24,163 | 0 | ||||||
|
|
|
|||||||
| Securities Lending Reinvestments (e)—3.2% |
| |||||||
| Repurchase Agreements—0.8% | ||||||||
| Bank of Nova Scotia Repurchase Agreement dated 12/29/23 at 5.450%, due on 01/02/24 with a maturity value of $100,061; collateralized by various Common Stock with an aggregate market value of $111,380. |
100,000 | 100,000 | ||||||
| Barclays Bank PLC |
||||||||
| Repurchase Agreement dated 12/29/23 at 5.330%, due on 01/02/24 with a maturity value of $15,006; collateralized by U.S. Treasury Obligations with rates ranging from 0.000% - 5.500%, maturity dates ranging from 01/31/24 - 05/15/48, and an aggregate market value of $15,305. |
14,997 | 14,997 | ||||||
| Repurchase Agreement dated 12/29/23 at 5.450%, due on 01/02/24 with a maturity value of $100,061; collateralized by various Common Stock with an aggregate market value of $111,481. |
100,000 | 100,000 | ||||||
| Deutsche Bank Securities, Inc. |
2,491,731 | 2,491,731 | ||||||
| Repurchase Agreements—(Continued) | ||||||||
| NBC Global Finance Ltd. |
400,000 | 400,000 | ||||||
| Societe Generale |
||||||||
| Repurchase Agreement dated 12/29/23 at 5.330%, due on 01/02/24 with a maturity value of $72,191; collateralized by U.S. Treasury Obligations with rates ranging from 0.625% - 4.750%, maturity dates ranging from 04/15/26 - 08/15/51, and an aggregate market value of $73,754. |
72,148 | 72,148 | ||||||
| Repurchase Agreement dated 12/29/23 at 5.330%, due on 01/02/24 with a maturity value of $33,833; collateralized by U.S. Treasury Obligations with rates ranging from 0.625% - 5.240%, maturity dates ranging from 04/30/24 - 05/15/32, and an aggregate market value of $34,489. |
33,813 | 33,813 | ||||||
| Repurchase Agreement dated 12/29/23 at 5.510%, due on 01/02/24 with a maturity value of $65,809; collateralized by various Common Stock with an aggregate market value of $73,210. |
65,769 | 65,769 | ||||||
| TD Prime Services LLC |
1,000,000 | 1,000,000 | ||||||
|
|
|
|||||||
| 4,278,458 | ||||||||
|
|
|
|||||||
| Mutual Funds—2.4% | ||||||||
| BlackRock Liquidity Funds FedFund, Institutional Shares 5.260% (f) |
1,000,000 | 1,000,000 | ||||||
| Dreyfus Treasury Obligations Cash Management Fund, Institutional Class 5.250% (f) |
2,000,000 | 2,000,000 | ||||||
| Fidelity Investments Money Market Government Portfolio, Class I 5.250% (f) |
2,000,000 | 2,000,000 | ||||||
| Goldman Sachs Financial Square Government Fund, Institutional Shares 5.230% (f) |
2,000,000 | 2,000,000 | ||||||
| HSBC U.S. Government Money Market Fund, Class I 5.300% (f) |
1,000,000 | 1,000,000 | ||||||
| Morgan Stanley Liquidity Funds Government Portfolio, Institutional Shares 5.270% (f) |
1,000,000 | 1,000,000 | ||||||
| RBC U.S. Government Money Market Fund, Institutional Share 5.230% (f) |
2,000,000 | 2,000,000 | ||||||
| STIT-Government & Agency Portfolio, Institutional Class 5.270% (f) |
1,000,000 | 1,000,000 | ||||||
| Western Asset Institutional Government Reserves Fund, Institutional Class 5.270% (f) |
1,000,000 | 1,000,000 | ||||||
|
|
|
|||||||
| 13,000,000 | ||||||||
|
|
|
|||||||
| Total Securities Lending Reinvestments |
17,278,458 | |||||||
|
|
|
|||||||
| Total Investments—103.0% |
543,586,674 | |||||||
| Other assets and liabilities (net)—(3.0)% |
(16,023,249 | ) | ||||||
|
|
|
|||||||
| Net Assets—100.0% | $ | 527,563,425 | ||||||
|
|
|
|||||||
See accompanying notes to financial statements.
BHFTII-37
Brighthouse Funds Trust II
Brighthouse/Dimensional International Small Company Portfolio
Schedule of Investments as of December 31, 2023
| * | Principal amount stated in U.S. dollars unless otherwise noted. | |||
| (a) | Non-income producing security. | |||
| (b) | Security was valued in good faith under procedures subject to oversight by the Board of Trustees. As of December 31, 2023, these securities represent less than 0.05% of net assets. | |||
| (c) | Significant unobservable inputs were used in the valuation of this portfolio security; i.e. Level 3. | |||
| (d) | All or a portion of the security was held on loan. As of December 31, 2023, the market value of securities loaned was $47,984,917 and the collateral received consisted of cash in the amount of $17,278,458 and non-cash collateral with a value of $34,081,722. The cash collateral investments are disclosed in the Schedule of Investments and categorized as Securities Lending Reinvestments. The non-cash collateral received consists of U.S. government securities that are held in safe-keeping by the lending agent, or a third party custodian, and cannot be sold or repledged by the Portfolio. As such, this collateral is excluded from the Statement of Assets and Liabilities. | |||
| (e) | Represents investment of cash collateral received from securities on loan as of December 31, 2023. | |||
| (f) | The rate shown represents the annualized seven-day yield as of December 31, 2023. | |||
| Ten Largest Industries as of |
% of |
|||
| Machinery |
6.7 | |||
| Banks |
5.6 | |||
| Metals & Mining |
5.3 | |||
| Real Estate Management & Development |
4.4 | |||
| Oil, Gas & Consumable Fuels |
4.2 | |||
| Chemicals |
3.7 | |||
| Capital Markets |
3.6 | |||
| Electronic Equipment, Instruments & Components |
3.3 | |||
| Food Products |
3.3 | |||
| Construction & Engineering |
3.2 | |||
Glossary of Abbreviations
Other Abbreviations
| (ADR) — (REIT) — |
American Depositary Receipt Real Estate Investment Trust | |||
Fair Value Hierarchy
Accounting principles generally accepted in the United States of America (“GAAP”) define fair market value as the price that the Portfolio would receive to sell an asset or pay to transfer a liability in an orderly transaction between market participants at the measurement date. It establishes a fair value hierarchy that prioritizes inputs to valuation methods and requires disclosure of the fair value hierarchy, separately for each major category of assets and liabilities, that segregates fair value measurements into three levels. Levels 1, 2 and 3 of the fair value hierarchy are defined as follows:
Level 1 - unadjusted quoted prices in active markets for identical investments
Level 2 - other significant observable inputs (including, but not limited to, quoted prices for similar assets or liabilities in markets that are either active or inactive; inputs other than quoted prices that are observable such as interest rates, yield curves, volatilities, prepayment speeds, loss severities, credit risks, default rates, or other market corroborated inputs)
Level 3 - significant unobservable inputs based on the best information available in the circumstances, to the extent observable inputs are unavailable (including the Portfolio’s own assumptions used in determining the fair value of investments and derivative financial instruments)
The inputs or methodologies used for valuing investments are not necessarily an indication of the risk associated with investing in them. Changes to the inputs or methodologies used may result in transfers between levels. A reconciliation of Level 3 securities, if any, will be disclosed following the fair value hierarchy table. For more information about the Portfolio’s policy regarding the valuation of investments, please refer to the Notes to Financial Statements.
The following table summarizes the fair value hierarchy of the Portfolio’s investments as of December 31, 2023:
| Description | Level 1 | Level 2 | Level 3 | Total | ||||||||||||
| Common Stocks | ||||||||||||||||
| Australia |
$ | 503,978 | $ | 34,378,855 | $ | 72,526 | $ | 34,955,359 | ||||||||
| Austria |
— | 8,025,925 | 0 | 8,025,925 | ||||||||||||
| Belgium |
— | 8,951,688 | 5,199 | 8,956,887 | ||||||||||||
| Cambodia |
— | 100,074 | — | 100,074 | ||||||||||||
| Canada |
57,293,390 | 188,300 | 1,540 | 57,483,230 | ||||||||||||
| China |
392,314 | 640,188 | — | 1,032,502 | ||||||||||||
| Colombia |
165,701 | — | — | 165,701 | ||||||||||||
| Denmark |
— | 12,985,804 | — | 12,985,804 | ||||||||||||
| Faeroe Islands |
— | 27,013 | — | 27,013 | ||||||||||||
| Finland |
— | 11,034,157 | — | 11,034,157 | ||||||||||||
| France |
27,129 | 25,202,515 | 0 | 25,229,644 | ||||||||||||
| Georgia |
— | 675,639 | — | 675,639 | ||||||||||||
| Germany |
479,768 | 31,236,237 | — | 31,716,005 | ||||||||||||
| Ghana |
— | 205,591 | — | 205,591 | ||||||||||||
| Greece |
— | 33,243 | — | 33,243 | ||||||||||||
| Greenland |
— | 12,958 | — | 12,958 | ||||||||||||
| Guernsey, Channel Islands |
— | — | 0 | 0 | ||||||||||||
| Hong Kong |
915,013 | 8,697,860 | 14,303 | 9,627,176 | ||||||||||||
| Ireland |
— | 2,817,938 | — | 2,817,938 | ||||||||||||
| Isle of Man |
— | 38,051 | — | 38,051 | ||||||||||||
See accompanying notes to financial statements.
BHFTII-38
Brighthouse Funds Trust II
Brighthouse/Dimensional International Small Company Portfolio
Schedule of Investments as of December 31, 2023
Fair Value Hierarchy—(Continued)
| Description | Level 1 | Level 2 | Level 3 | Total | ||||||||||||
| Israel |
$ | 166,407 | $ | 5,771,067 | $ | — | $ | 5,937,474 | ||||||||
| Italy |
— | 22,614,461 | 0 | 22,614,461 | ||||||||||||
| Japan |
— | 128,459,907 | — | 128,459,907 | ||||||||||||
| Jersey, Channel Islands |
— | 454,013 | — | 454,013 | ||||||||||||
| Jordan |
— | 324,810 | — | 324,810 | ||||||||||||
| Liechtenstein |
— | 374,057 | — | 374,057 | ||||||||||||
| Luxembourg |
— | 1,467,605 | — | 1,467,605 | ||||||||||||
| Macau |
— | 129,516 | — | 129,516 | ||||||||||||
| Malta |
— | 17,259 | — | 17,259 | ||||||||||||
| Mongolia |
— | 31,655 | — | 31,655 | ||||||||||||
| Netherlands |
57,429 | 10,275,061 | 0 | 10,332,490 | ||||||||||||
| New Zealand |
— | 1,919,664 | — | 1,919,664 | ||||||||||||
| Norway |
— | 3,548,244 | — | 3,548,244 | ||||||||||||
| Peru |
— | 130,780 | — | 130,780 | ||||||||||||
| Philippines |
— | 7,579 | — | 7,579 | ||||||||||||
| Poland |
— | 204,783 | — | 204,783 | ||||||||||||
| Portugal |
— | 2,072,467 | — | 2,072,467 | ||||||||||||
| Singapore |
185,164 | 5,759,024 | 2 | 5,944,190 | ||||||||||||
| Spain |
— | 12,402,830 | 0 | 12,402,830 | ||||||||||||
| Sweden |
— | 13,393,449 | — | 13,393,449 | ||||||||||||
| Switzerland |
17,826 | 42,216,705 | — | 42,234,531 | ||||||||||||
| Taiwan |
— | 12,054 | — | 12,054 | ||||||||||||
| Tanzania |
— | 125,192 | — | 125,192 | ||||||||||||
| United Arab Emirates |
— | 112,637 | — | 112,637 | ||||||||||||
| United Kingdom |
24,958 | 63,522,991 | 0 | 63,547,949 | ||||||||||||
| United States |
611,079 | 2,694,318 | — | 3,305,397 | ||||||||||||
| Total Common Stocks |
60,840,156 | 463,294,164 | 93,570 | 524,227,890 | ||||||||||||
| Total Preferred Stocks* |
— | 2,079,919 | — | 2,079,919 | ||||||||||||
| Warrants | ||||||||||||||||
| Australia |
407 | — | — | 407 | ||||||||||||
| Italy |
— | 0 | — | 0 | ||||||||||||
| Total Warrants |
407 | 0 | — | 407 | ||||||||||||
| Total Rights* |
— | — | 0 | 0 | ||||||||||||
| Securities Lending Reinvestments | ||||||||||||||||
| Repurchase Agreements |
— | 4,278,458 | — | 4,278,458 | ||||||||||||
| Mutual Funds |
13,000,000 | — | — | 13,000,000 | ||||||||||||
| Total Securities Lending Reinvestments |
13,000,000 | 4,278,458 | — | 17,278,458 | ||||||||||||
| Total Investments |
$ | 73,840,563 | $ | 469,652,541 | $ | 93,570 | $ | 543,586,674 | ||||||||
| Collateral for Securities Loaned (Liability) |
$ | — | $ | (17,278,458 | ) | $ | — | $ | (17,278,458 | ) | ||||||
| * | See Schedule of Investments for additional detailed categorizations. | |||
Level 3 investments at the beginning and/or end of the period in relation to net assets were not significant and accordingly, a reconciliation of Level 3 assets for the year ended December 31, 2023 is not presented.
During the year ended December 31, 2023, transfers into of Level 3 in the amount of $82,130 were due to trading halts on the securities’ respective exchanges which resulted in the lack of observable inputs.
See accompanying notes to financial statements.
BHFTII-39
Brighthouse Funds Trust II
Brighthouse/Dimensional International Small Company Portfolio
Statement of Assets and Liabilities
December 31, 2023
| Assets |
| |||
| Investments at value (a) (b) |
$ | 543,586,674 | ||
| Cash denominated in foreign currencies (c) |
231,931 | |||
| Receivable for: |
||||
| Investments sold |
1,594,468 | |||
| Dividends |
1,575,927 | |||
| Prepaid expenses |
1,864 | |||
| Other assets |
51,339 | |||
|
|
|
|||
| Total Assets |
547,042,203 | |||
| Liabilities |
||||
| Due to custodian |
579,202 | |||
| Collateral for securities loaned |
17,278,458 | |||
| Payables for: |
||||
| Fund shares redeemed |
932,343 | |||
| Accrued Expenses: |
||||
| Management fees |
283,343 | |||
| Distribution and service fees |
13,618 | |||
| Deferred trustees’ fees |
169,435 | |||
| Other expenses |
222,379 | |||
|
|
|
|||
| Total Liabilities |
19,478,778 | |||
|
|
|
|||
| Net Assets |
$ | 527,563,425 | ||
|
|
|
|||
| Net Assets Consist of: |
||||
| Paid in surplus |
$ | 487,982,161 | ||
| Distributable earnings (Accumulated losses) |
39,581,264 | |||
|
|
|
|||
| Net Assets |
$ | 527,563,425 | ||
|
|
|
|||
| Net Assets |
||||
| Class A |
$ | 461,552,768 | ||
| Class B |
66,010,657 | |||
| Capital Shares Outstanding* |
||||
| Class A |
45,830,173 | |||
| Class B |
6,616,368 | |||
| Net Asset Value, Offering Price and Redemption Price Per Share |
||||
| Class A |
$ | 10.07 | ||
| Class B |
9.98 | |||
| * | The Portfolio is authorized to issue an unlimited number of shares. | |||
| (a) | Identified cost of investments was $517,744,755. | |||
| (b) | Includes securities loaned at value of $47,984,917. | |||
| (c) | Identified cost of cash denominated in foreign currencies was $232,539. | |||
Statement of Operations
Year Ended December 31, 2023
| Investment Income |
| |||
| Dividends (a) |
$ | 15,933,482 | ||
| Interest |
29,599 | |||
| Securities lending income |
510,237 | |||
|
|
|
|||
| Total investment income |
16,473,318 | |||
| Expenses |
||||
| Management fees |
4,169,437 | |||
| Administration fees |
34,369 | |||
| Custodian and accounting fees |
429,691 | |||
| Distribution and service fees—Class B |
159,714 | |||
| Audit and tax services |
79,831 | |||
| Legal |
46,603 | |||
| Trustees’ fees and expenses |
46,220 | |||
| Shareholder reporting |
26,729 | |||
| Insurance |
4,749 | |||
| Miscellaneous |
115,597 | |||
|
|
|
|||
| Total expenses |
5,112,940 | |||
| Less management fee waiver |
(822,394 | ) | ||
|
|
|
|||
| Net expenses |
4,290,546 | |||
|
|
|
|||
| Net Investment Income |
12,182,772 | |||
|
|
|
|||
| Net Realized and Unrealized Gain (Loss) |
||||
| Net realized gain (loss) on: | ||||
| Investments |
11,890,638 | |||
| Foreign currency transactions |
(47,372 | ) | ||
|
|
|
|||
| Net realized gain (loss) |
11,843,266 | |||
|
|
|
|||
| Net change in unrealized appreciation (depreciation) on: | ||||
| Investments |
43,780,827 | |||
| Foreign currency transactions |
57,054 | |||
|
|
|
|||
| Net change in unrealized appreciation (depreciation) |
43,837,881 | |||
|
|
|
|||
| Net realized and unrealized gain (loss) |
55,681,147 | |||
|
|
|
|||
| Net Increase (Decrease) in Net Assets From Operations |
$ | 67,863,919 | ||
|
|
|
|||
| (a) | Net of foreign withholding taxes of $1,657,506. | |||
See accompanying notes to financial statements.
BHFTII-40
Brighthouse Funds Trust II
Brighthouse/Dimensional International Small Company Portfolio
Statements of Changes in Net Assets
| Year Ended December 31, 2023 |
Year Ended December 31, 2022 |
|||||||
| Increase (Decrease) in Net Assets: |
||||||||
| From Operations |
||||||||
| Net investment income (loss) |
$ | 12,182,772 | $ | 13,418,811 | ||||
| Net realized gain (loss) |
11,843,266 | 17,514,443 | ||||||
| Net change in unrealized appreciation (depreciation) |
43,837,881 | (150,252,325 | ) | |||||
|
|
|
|
|
|||||
| Increase (decrease) in net assets from operations |
67,863,919 | (119,319,071 | ) | |||||
|
|
|
|
|
|||||
| From Distributions to Shareholders |
||||||||
| Class A |
(25,966,317 | ) | (67,111,201 | ) | ||||
| Class B |
(3,539,535 | ) | (9,121,187 | ) | ||||
|
|
|
|
|
|||||
| Total distributions |
(29,505,852 | ) | (76,232,388 | ) | ||||
|
|
|
|
|
|||||
| Increase (decrease) in net assets from capital share transactions |
(39,454,298 | ) | 30,913,982 | |||||
|
|
|
|
|
|||||
| Total increase (decrease) in net assets |
(1,096,231 | ) | (164,637,477 | ) | ||||
| Net Assets |
||||||||
| Beginning of period |
528,659,656 | 693,297,133 | ||||||
|
|
|
|
|
|||||
| End of period |
$ | 527,563,425 | $ | 528,659,656 | ||||
|
|
|
|
|
|||||
Other Information:
Capital Shares
Transactions in capital shares were as follows:
| Year Ended December 31, 2023 |
Year Ended December 31, 2022 |
|||||||||||||||
| Shares | Value | Shares | Value | |||||||||||||
| Class A |
||||||||||||||||
| Sales |
249,291 | $ | 2,356,161 | 6,735 | $ | 60,090 | ||||||||||
| Reinvestments |
2,718,986 | 25,966,317 | 7,286,775 | 67,111,201 | ||||||||||||
| Redemptions |
(6,530,458 | ) | (64,084,142 | ) | (3,905,979 | ) | (41,054,772 | ) | ||||||||
|
|
|
|
|
|
|
|
|
|||||||||
| Net increase (decrease) |
(3,562,181 | ) | $ | (35,761,664 | ) | 3,387,531 | $ | 26,116,519 | ||||||||
|
|
|
|
|
|
|
|
|
|||||||||
| Class B |
||||||||||||||||
| Sales |
240,645 | $ | 2,262,649 | 507,355 | $ | 4,954,004 | ||||||||||
| Reinvestments |
373,763 | 3,539,535 | 997,942 | 9,121,187 | ||||||||||||
| Redemptions |
(984,441 | ) | (9,494,818 | ) | (909,564 | ) | (9,277,728 | ) | ||||||||
|
|
|
|
|
|
|
|
|
|||||||||
| Net increase (decrease) |
(370,033 | ) | $ | (3,692,634 | ) | 595,733 | $ | 4,797,463 | ||||||||
|
|
|
|
|
|
|
|
|
|||||||||
| Increase (decrease) derived from capital shares transactions |
$ | (39,454,298 | ) | $ | 30,913,982 | |||||||||||
|
|
|
|
|
|||||||||||||
See accompanying notes to financial statements.
BHFTII-41
Brighthouse Funds Trust II
Brighthouse/Dimensional International Small Company Portfolio
Financial Highlights
| Selected per share data | ||||||||||||||||||||
| Class A | ||||||||||||||||||||
| Year Ended December 31, | ||||||||||||||||||||
| 2023 | 2022 | 2021 | 2020 | 2019 | ||||||||||||||||
| Net Asset Value, Beginning of Period |
$ | 9.39 | $ | 13.25 | $ | 12.43 | $ | 12.22 | $ | 11.07 | ||||||||||
|
|
|
|
|
|
|
|
|
|
|
|||||||||||
| Income (Loss) from Investment Operations |
||||||||||||||||||||
| Net investment income (loss) (a) |
0.23 | 0.25 | 0.22 | 0.16 | 0.22 | |||||||||||||||
| Net realized and unrealized gain (loss) |
1.03 | (2.59 | ) | 1.54 | 0.75 | 2.20 | ||||||||||||||
|
|
|
|
|
|
|
|
|
|
|
|||||||||||
| Total income (loss) from investment operations |
1.26 | (2.34 | ) | 1.76 | 0.91 | 2.42 | ||||||||||||||
|
|
|
|
|
|
|
|
|
|
|
|||||||||||
| Less Distributions |
||||||||||||||||||||
| Distributions from net investment income |
(0.26 | ) | (0.30 | ) | (0.24 | ) | (0.29 | ) | (0.16 | ) | ||||||||||
| Distributions from net realized capital gains |
(0.32 | ) | (1.22 | ) | (0.70 | ) | (0.41 | ) | (1.11 | ) | ||||||||||
|
|
|
|
|
|
|
|
|
|
|
|||||||||||
| Total distributions |
(0.58 | ) | (1.52 | ) | (0.94 | ) | (0.70 | ) | (1.27 | ) | ||||||||||
|
|
|
|
|
|
|
|
|
|
|
|||||||||||
| Net Asset Value, End of Period |
$ | 10.07 | $ | 9.39 | $ | 13.25 | $ | 12.43 | $ | 12.22 | ||||||||||
|
|
|
|
|
|
|
|
|
|
|
|||||||||||
| Total Return (%) (b) |
13.70 | (17.47 | ) | 14.16 | 9.12 | 23.30 | ||||||||||||||
| Ratios/Supplemental Data |
||||||||||||||||||||
| Gross ratio of expenses to average net assets (%) |
0.96 | 0.96 | 0.93 | 0.94 | 0.95 | |||||||||||||||
| Net ratio of expenses to average net assets (%) (c) |
0.80 | 0.81 | 0.83 | 0.93 | 0.94 | |||||||||||||||
| Ratio of net investment income (loss) to average net assets (%) |
2.40 | 2.40 | 1.69 | 1.47 | 1.95 | |||||||||||||||
| Portfolio turnover rate (%) |
8 | 11 | 10 | 18 | 14 | |||||||||||||||
| Net assets, end of period (in millions) |
$ | 461.6 | $ | 463.7 | $ | 609.4 | $ | 636.0 | $ | 594.9 | ||||||||||
| Class B | ||||||||||||||||||||
| Year Ended December 31, | ||||||||||||||||||||
| 2023 | 2022 | 2021 | 2020 | 2019 | ||||||||||||||||
| Net Asset Value, Beginning of Period |
$ | 9.30 | $ | 13.13 | $ | 12.33 | $ | 12.13 | $ | 10.99 | ||||||||||
|
|
|
|
|
|
|
|
|
|
|
|||||||||||
| Income (Loss) from Investment Operations |
||||||||||||||||||||
| Net investment income (loss) (a) |
0.20 | 0.22 | 0.19 | 0.13 | 0.19 | |||||||||||||||
| Net realized and unrealized gain (loss) |
1.03 | (2.57 | ) | 1.52 | 0.74 | 2.19 | ||||||||||||||
|
|
|
|
|
|
|
|
|
|
|
|||||||||||
| Total income (loss) from investment operations |
1.23 | (2.35 | ) | 1.71 | 0.87 | 2.38 | ||||||||||||||
|
|
|
|
|
|
|
|
|
|
|
|||||||||||
| Less Distributions |
||||||||||||||||||||
| Distributions from net investment income |
(0.23 | ) | (0.26 | ) | (0.21 | ) | (0.26 | ) | (0.13 | ) | ||||||||||
| Distributions from net realized capital gains |
(0.32 | ) | (1.22 | ) | (0.70 | ) | (0.41 | ) | (1.11 | ) | ||||||||||
|
|
|
|
|
|
|
|
|
|
|
|||||||||||
| Total distributions |
(0.55 | ) | (1.48 | ) | (0.91 | ) | (0.67 | ) | (1.24 | ) | ||||||||||
|
|
|
|
|
|
|
|
|
|
|
|||||||||||
| Net Asset Value, End of Period |
$ | 9.98 | $ | 9.30 | $ | 13.13 | $ | 12.33 | $ | 12.13 | ||||||||||
|
|
|
|
|
|
|
|
|
|
|
|||||||||||
| Total Return (%) (b) |
13.52 | (17.70 | ) | 13.85 | 8.79 | 23.03 | ||||||||||||||
| Ratios/Supplemental Data |
||||||||||||||||||||
| Gross ratio of expenses to average net assets (%) |
1.21 | 1.21 | 1.18 | 1.19 | 1.20 | |||||||||||||||
| Net ratio of expenses to average net assets (%) (c) |
1.05 | 1.06 | 1.08 | 1.18 | 1.19 | |||||||||||||||
| Ratio of net investment income (loss) to average net assets (%) |
2.15 | 2.15 | 1.44 | 1.23 | 1.70 | |||||||||||||||
| Portfolio turnover rate (%) |
8 | 11 | 10 | 18 | 14 | |||||||||||||||
| Net assets, end of period (in millions) |
$ | 66.0 | $ | 65.0 | $ | 83.9 | $ | 85.0 | $ | 84.3 | ||||||||||
| (a) | Per share amounts based on average shares outstanding during the period. | |||
| (b) | Total return does not reflect any insurance, sales, separate account or administrative charges of variable annuity or life insurance contracts or any additional expenses that contract owners may bear under their variable contracts. If these charges were included, the returns would be lower. | |||
| (c) | Includes the effects of management fee waivers (see Note 5 of the Notes to Financial Statements). | |||
See accompanying notes to financial statements.
BHFTII-42
Brighthouse Funds Trust II
Brighthouse/Dimensional International Small Company Portfolio
Notes to Financial Statements—December 31, 2023
1. Organization
Brighthouse Funds Trust II (the “Trust”) is organized as a Delaware statutory trust and registered under the Investment Company Act of 1940, as amended (the “1940 Act”), as an open-end management investment company. The Trust, which is managed by Brighthouse Investment Advisers, LLC (“Brighthouse Investment Advisers” or the “Adviser”), currently offers twenty-nine series (the “Portfolios”), each of which operates as a distinct investment vehicle of the Trust. The series included in this report is Brighthouse/Dimensional International Small Company Portfolio (the “Portfolio”), which is diversified. Shares of the Portfolio are not offered directly to the general public and are currently available only to separate accounts of insurance companies, including insurance companies affiliated with the Adviser.
The Portfolio has registered and offers two classes of shares: Class A and B shares. Shares of each class of the Portfolio represent an equal pro rata interest in the Portfolio and generally give the shareholder the same voting, dividend, liquidation, and other rights. Investment income, realized and unrealized capital gains and losses, the common expenses of the Portfolio, and certain Portfolio-level expense reductions, if any, are allocated on a pro rata basis to each class based on the relative net assets of each class to the net assets of the Portfolio. Each class of shares differs in its respective distribution plan and such distribution expenses are allocated to the corresponding class of shares.
2. Significant Accounting Policies
The preparation of financial statements in conformity with accounting principles generally accepted in the United States of America (“GAAP”) requires management to make estimates and assumptions that affect the reported amounts of assets and liabilities and disclosure of contingent assets and liabilities as of the date of the financial statements and the reported amounts of income and expenses during the reporting period. Actual results could differ from those estimates. In the preparation of these financial statements, management has evaluated events and transactions subsequent to December 31, 2023 through the date the financial statements were issued.
The Portfolio is an investment company and follows the accounting and reporting guidance of the Financial Accounting Standards Board (“FASB”) Accounting Standards Codification Topic 946—Financial Services—Investment Companies. The following is a summary of significant accounting policies consistently followed by the Portfolio in the preparation of its financial statements.
Investment Valuation and Fair Value Measurements - The Portfolio values its investments for purposes of calculating its net asset value (“NAV”) using procedures that allow for a variety of methodologies to be used to value the Portfolio’s investments. The specific methodology used for an investment may vary based on the market data available for a specific investment at the time the Portfolio calculates its NAV or based on other considerations. The procedures also permit a level of judgment to be used in the valuation process.
Domestic and foreign equity securities, such as common stock, exchange-traded funds, rights, warrants, and preferred stock, that are traded on a securities exchange on a valuation date are generally valued at their last quoted sale price or official closing price on the primary exchange for such security, or, if no sales occurred on that day, at the last reported bid price. Equity securities traded over-the-counter (“OTC”) are generally valued at the last reported bid price. In the event of a major exchange closing during the trading day, the Adviser may use other market information obtained from quotation reporting systems, established market makers, or pricing services in valuing the securities. Valuation adjustments may be applied to certain foreign equity securities that are traded solely on foreign exchanges that close before the time as of which the Portfolio determines its NAV to account for the market movement between the close of the foreign exchanges and the time as of which the Portfolio determines its NAV. The Portfolio may use a systematic fair valuation model provided by a pricing service to value securities principally traded in these foreign markets to adjust for possible market movements or other changes that may occur between the close of the foreign exchanges and the time as of which the Portfolio determines its NAV. Foreign equity securities valued using these valuation adjustments are generally categorized as Level 2 within the fair value hierarchy. Equity securities that are actively traded, and have no valuation adjustments applied, are categorized as Level 1 within the fair value hierarchy. Other equity securities traded on inactive markets or valued in reference to similar instruments traded on active markets are generally categorized as Level 2 within the fair value hierarchy.
Investments in registered open-end management investment companies are valued at reported NAV per share on the valuation date and are categorized as Level 1 within the fair value hierarchy.
Debt securities, including corporate, convertible and municipal bonds and notes; obligations of the U.S. Treasury and U.S. government agencies; foreign sovereign issues; and non-U.S. bonds, are generally valued based upon evaluated or composite bid quotations obtained from third-party pricing services and/or brokers and dealers selected by the Adviser (each a “pricing service”). Such pricing services may use matrix pricing, which considers observable inputs including, among other things, issuer details, maturity dates, interest rates, yield curves, rates of prepayment, credit risks/spreads, default rates, reported trades, broker-dealer quotes and quoted prices for similar assets. Short-term obligations with a remaining maturity of sixty days or less may be valued at amortized cost in the absence of market quotes, so long as the amortized cost value of such short-term debt instrument is approximately the same as the fair
BHFTII-43
Brighthouse Funds Trust II
Brighthouse/Dimensional International Small Company Portfolio
Notes to Financial Statements—December 31, 2023—(Continued)
value of the instrument as determined without the use of amortized cost valuation. Floating rate loans are generally valued based upon an evaluated or composite average of aggregate bid and ask quotations supplied by brokers or dealers, as obtained from the pricing service. Securities that use similar valuation techniques and inputs as described above are generally categorized as Level 2 within the fair value hierarchy.
Options, whether on securities, indices, futures contracts, or otherwise, traded on exchanges are valued at the last sale price available as of the close of business on a valuation day or, if there is no such price available, at the last reported bid price. These types of options are categorized as Level 1 within the fair value hierarchy. Futures contracts that are traded on commodity exchanges are valued at their settlement prices established by the exchanges on which they are traded as of the close of such exchanges and are categorized as Level 1 within the fair value hierarchy.
If no current market quotation is readily available or market value quotations are deemed to be unreliable for an investment, the fair value of the investment will be determined in accordance with procedures. A market quotation is readily available only when that quotation is a quoted price (unadjusted) in active markets for identical investments that the Portfolio can access at the measurement date, provided that a quotation will not be readily available if it is not reliable.
Pursuant to Rule 2a-5 under the 1940 Act, the Board of Trustees (the “Board” or “Trustees” ) of the Trust has designated Brighthouse Investment Advisers, acting through its Valuation Committee (“Committee”), as the Portfolio’s “valuation designee” to perform the Portfolio’s fair value determinations. The Board oversees Brighthouse Investment Advisers in its role as the Valuation Designee and receives reports from Brighthouse Investment Advisers regarding its process and the valuation of the Portfolio’s investments to assist with such oversight.
No single standard for determining the fair value of an investment can be set forth because fair value depends upon the facts and circumstances with respect to each investment. Information relating to any relevant factors may be obtained by the Committee from any appropriate source, including the subadviser of the Portfolio, the Custodian, a pricing service, market maker and/or broker for such security or the issuer. Appropriate methodologies for determining fair value under particular circumstances may include: matrix pricing, a discounted cash flow analysis, comparisons of securities with comparable characteristics, value based on multiples of earnings, discount from market price of similar marketable securities, or a combination of these and other methods.
Foreign Currency Translation - The books and records of the Portfolio are maintained in U.S. dollars. The values of securities, currencies, and other assets and liabilities denominated in currencies other than the U.S. dollar are translated into U.S. dollars based upon foreign exchange rates prevailing at the end of the period. Purchases and sales of investment securities, income, and expenses are translated on the respective dates of such transactions. Because the values of investment securities are translated at the foreign exchange rates prevailing at the end of the period, that portion of the results of operations arising from changes in exchange rates and that portion of the results of operations reflecting fluctuations arising from changes in market prices of the investment securities are not separated. Such fluctuations are included in the net realized and unrealized gain or loss on investments.
Net realized foreign exchange gains or losses arise from activity in forward foreign currency exchange contracts, sales of foreign currency, currency gains or losses realized between the trade and settlement dates on securities transactions, and the difference between the amounts of dividends, interest, and foreign withholding taxes recorded by the Portfolio and the U.S. dollar-equivalent of the amounts actually received or paid by the Portfolio. Net unrealized foreign exchange gains and losses arise from changes in the value of assets and liabilities, other than investment securities, resulting from changes in foreign exchange rates.
Investment Transactions and Related Investment Income - Portfolio security transactions are recorded on the trade date. Dividend income is recorded on the ex-dividend date or, for certain foreign securities, when notified. Interest income, which includes amortization of premium and accretion of discount on debt securities, is recorded on the accrual basis. Realized gains and losses on investments are determined on the identified cost basis, which is the same basis used for federal income tax purposes. Foreign income and foreign capital gains on some foreign securities may be subject to foreign taxes, which are accrued as applicable. These foreign taxes have been provided for in accordance with the Portfolio’s understanding of the applicable countries’ tax rules and rates.
In consideration of recent decisions rendered by European courts, the Portfolio has filed tax reclaims for previously withheld taxes on dividends earned in certain European Union (“EU”) countries. These filings are subject to various administrative and judicial proceedings within these countries. During the year ended December 31, 2023, the Portfolio received EU tax reclaim payments in the amount of $59,351 that were not previously accrued for due to uncertainty of collectability. Such amount is included in dividends on the Statement of Operations. No other amounts for additional tax reclaims are reflected in the financial statements due to the uncertainty as to the ultimate resolution of proceedings, the likelihood of receipt of these reclaims, and the potential timing of payment.
Dividends and Distributions to Shareholders - The Portfolio records dividends and distributions on the ex-dividend date. Net realized gains from securities transactions (if any) are generally distributed annually to shareholders. The timing and characterization of certain income and capital gains distributions are determined in accordance with federal tax regulations that may differ from GAAP. Permanent book and tax basis differences relating to shareholder distributions will result in reclassification between distributable earnings (accumulated losses) and paid in surplus. These adjustments have no impact on net assets or the results of operations.
BHFTII-44
Brighthouse Funds Trust II
Brighthouse/Dimensional International Small Company Portfolio
Notes to Financial Statements—December 31, 2023—(Continued)
Income Taxes - It is the Portfolio’s policy to comply with the requirements of the Internal Revenue Code of 1986, as amended, and regulations thereunder, applicable to regulated investment companies, and to distribute, with respect to each taxable year, all of its taxable income to shareholders. Therefore, no federal income tax provision is required. The Portfolio files U.S. federal tax returns. No income tax returns are currently under examination. The Portfolio’s federal tax returns remain subject to examination by the Internal Revenue Service for three fiscal years after the returns are filed. As of December 31, 2023, the Portfolio had no uncertain tax positions that would require financial statement recognition, derecognition or disclosure.
Due to Custodian - Pursuant to the custodian agreement, the Custodian may, in its discretion, advance funds to the Portfolio to make properly authorized payments. When such payments result in an overdraft, the Portfolio is obligated to repay the Custodian at the current rate of interest charged by the Custodian for secured loans. This obligation is payable on demand to the Custodian. The Custodian has a lien on the Portfolio’s assets to the extent of any overdraft. At December 31, 2023, the Portfolio had a payment of $579,202 due to the Custodian pursuant to the foregoing arrangement. Based on the short-term nature of these payments and the variable interest rate, the carrying value of the overdraft advances approximated its fair value and such inputs would be considered level 2 in the fair value hierarchy at December 31, 2023. The Portfolio’s average overdraft advances during the year ended December 31, 2023 were not significant.
Repurchase Agreements - The Portfolio may enter into repurchase agreements, under the terms of a Master Repurchase Agreement (“MRA”), or Global Master Repurchase Agreement (“GMRA”), with selected commercial banks and broker-dealers, under which the Portfolio acquires securities as collateral and agrees to resell the securities at an agreed-upon time and at an agreed-upon price. The Portfolio, through the Custodian or a subcustodian, under a tri-party repurchase agreement, receives delivery of the underlying securities collateralizing any repurchase agreements. It is the Portfolio’s policy that the market value of the collateral be equal to at least 100% of the repurchase price in the case of a repurchase agreement of one-day duration and equal to at least 102% of the repurchase price in the case of all other repurchase agreements. In the event of default or failure by a party to perform an obligation in connection with any repurchase transaction, the MRA or GMRA gives the non-defaulting party the right to set-off claims and to apply property held by it in connection with any repurchase transaction against obligations owed to it under the agreement.
At December 31, 2023, the Portfolio invested cash collateral for loans of portfolio securities in repurchase agreements with a gross value of $4,278,458 which is included as part of investments at value on the Statement of Assets and Liabilities. The value of the related collateral exceeded the value of the repurchase agreements at December 31, 2023.
Securities Lending - The Portfolio may lend its portfolio securities to certain qualified brokers who borrow securities in order to complete certain securities transactions. By lending its portfolio securities, the Portfolio attempts to increase its net investment income through the receipt of income on collateral held from securities on loan. Any gain or loss in the market price of the loaned securities that might occur, any interest earned, and any dividends declared during the term of the loan, would accrue to the account of the Portfolio.
The Trust has entered into a Non-Custodial Securities Lending Agreement with JPMorgan Chase Bank, N.A. (the “Lending Agent”). Under the agreement, the Lending Agent is authorized to loan portfolio securities on the Portfolio’s behalf. In exchange, the Portfolio generally receives cash, U.S. Government securities, letters of credit, or other collateral deemed appropriate by the Adviser. The Portfolio receives collateral equal to at least 102% of the market value for loans secured by government securities or cash in the same currency as the loaned shares and 105% for all other loaned securities at each loan’s inception. Collateral representing at least 100% of the market value of the loaned securities is maintained for the duration of the loan. Any cash collateral received by the Portfolio is generally invested by the Lending Agent in short-term investments, which may include certificates of deposit, commercial paper, repurchase agreements, including repurchase agreements with respect to equity securities, time deposits, master demand notes and money market funds. The market value of investments made with cash collateral received are disclosed in the Schedule of Investments and the valuation techniques are described in Note 2. The value of the securities on loan may change each business day. If the market value of the collateral at the close of trading on a business day is less than 100% of the market value of the loaned securities at the close of trading on that day, the borrower is required to deliver, by the close of business on the following business day, an additional amount of collateral, so that the total amount of posted collateral is equal to at least 100% of the market value of all the loaned securities as of such preceding day. A portion of the income earned on the collateral is rebated to the borrower of the securities and the remainder is split between the Lending Agent and the Portfolio. On loans collateralized by U.S. government securities, a fee is received from the borrower and is allocated between the Portfolio and the Lending Agent.
Income received by the Portfolio in securities lending transactions during the year ended December 31, 2023 is reflected as securities lending income on the Statement of Operations. The values of any securities loaned by the Portfolio and the related collateral at December 31, 2023 are disclosed in the footnotes to the Schedule of Investments. The value of the related collateral received by the Portfolio exceeded the value of the securities out on loan at December 31, 2023.
The risks associated with lending portfolio securities include, but are not limited to, possible delays in receiving additional collateral or in the recovery of the loaned securities, possible loss of rights in the collateral should the borrower fail financially, as well as risk of loss in the value of the collateral or the value of the investments made with the collateral. To the extent the Portfolio uses cash
BHFTII-45
Brighthouse Funds Trust II
Brighthouse/Dimensional International Small Company Portfolio
Notes to Financial Statements—December 31, 2023—(Continued)
collateral it receives to invest in repurchase agreements with respect to equity securities, it is subject to the risk of loss if the value of the equity securities declines and the counterparty defaults on its obligation to repurchase such securities. The Lending Agent shall indemnify the Portfolio in the case of default of any securities borrower, subject to the terms of the Non-Custodial Securities Lending Agreement.
The following table provides a breakdown of transactions accounted for as secured borrowings, the gross obligations by the type of collateral pledged, and the remaining contractual maturities of those transactions.
| Remaining Contractual Maturity of the Agreements As of December 31, 2023 |
||||||||||||||||||||
| Overnight and Continuous |
Up to 30 Days |
31 - 90 Days |
Greater than 90 days |
Total | ||||||||||||||||
| Securities Lending Transactions | ||||||||||||||||||||
| Common Stocks |
$ | (17,278,458 | ) | $ | — | $ | — | $ | — | $ | (17,278,458 | ) | ||||||||
| Warrants |
— | — | — | — | — | |||||||||||||||
| Total Borrowings |
$ | (17,278,458 | ) | $ | — | $ | — | $ | — | $ | (17,278,458 | ) | ||||||||
| Gross amount of recognized liabilities for secured borrowing transactions . |
|
$ | (17,278,458 | ) | ||||||||||||||||
|
|
|
|||||||||||||||||||
3. Certain Risks
In the normal course of business, the Portfolio invests in securities and enters into transactions where risks exist. Those risks include:
Market Risk: The value of securities held by the Portfolio may decline in response to certain events, including those directly involving the issuers whose securities are owned by the Portfolio; conditions affecting the general economy; overall market changes; local, regional or global political, social or economic instability; currency, interest rate, and price fluctuations, or other factors including terrorism, war, natural disasters and the spread of infectious illness including epidemics or pandemics such as the COVID-19 pandemic. These events may also adversely affect the liquidity of securities held by the Portfolio.
Credit and Counterparty Risk: The Portfolio may be exposed to counterparty risk, or the risk that an entity with which the Portfolio has unsettled or open transactions may default. The potential loss could exceed the value of the financial assets and liabilities recorded in the financial statements. Financial assets that potentially expose the Portfolio to credit and counterparty risk consist principally of cash due from counterparties and investments. The Portfolio manages counterparty risk by entering into agreements only with counterparties that it believes have the financial resources to honor their obligations and by monitoring the financial stability of those counterparties. The Subadviser may attempt to mitigate counterparty risk by (i) periodically assessing the creditworthiness of its trading partners, (ii) monitoring and/or limiting the amount of its net exposure to each individual counterparty based on its assessment, and (iii) requiring collateral from the counterparty for certain transactions. In order to preserve certain safeguards for non-standard settlement trades, the Portfolio restricts its exposure to credit and counterparty losses by entering into master netting agreements (“Master Agreements”) with counterparties (approved brokers) with whom it undertakes a significant volume of transactions. Master Agreements govern the terms of certain transactions and reduce the counterparty risk associated with relevant transactions by specifying credit protection mechanisms and providing standardization that improves legal certainty. Master Agreements can also help limit counterparty risk by specifying collateral posting arrangements at pre-arranged exposure levels.
Repurchase and reverse repurchase agreements are primarily executed under GMRAs or MRAs, which provide the right to set-off. Each repurchase and reverse repurchase agreement is initially collateralized at the transaction level. In the event of default, the total market value exposure will be offset against collateral exchanged to date, which would result in a net receivable/(payable) that would be due from/to the counterparty.
Foreign Investment Risk: The investments by the Portfolio in foreign securities, whether direct or indirect, involve risks not present in domestic investments. Because securities may be denominated in foreign currencies, may require settlement in foreign currencies and may pay interest or dividends in foreign currencies, changes in the relationship of these foreign currencies to the U.S. dollar can significantly affect the value of the investments and earnings of the Portfolio. Foreign investments may also subject the Portfolio to foreign government exchange restrictions, expropriation, taxation, unexpected market closures or other political, social or economic developments, such as the imposition of economic sanctions against one or more countries, organizations, entities and/or individuals, all of which could affect the market and/or credit risk of the investments. In addition to the risks described above, risks may arise from forward foreign currency contracts with respect to the potential inability of counterparties to meet the terms of their contracts.
Additional risks associated with each type of investment are described above within the respective security type notes. The Portfolio’s prospectus includes a discussion of the principal risks of investing in the Portfolio.
BHFTII-46
Brighthouse Funds Trust II
Brighthouse/Dimensional International Small Company Portfolio
Notes to Financial Statements—December 31, 2023—(Continued)
4. Investment Transactions
Aggregate cost of purchases and proceeds of sales of investment securities, excluding short-term securities, for the year ended December 31, 2023 were as follows:
| Purchases |
Sales | |||||||||||
| U.S. Government |
Non-U.S. Government | U.S. Government | Non-U.S. Government | |||||||||
| $0 | $ | 41,442,188 | $ | 0 | $ | 93,887,289 | ||||||
5. Investment Management Fees and Other Transactions with Affiliates
Investment Management Agreement - Brighthouse Investment Advisers is the investment adviser to the Portfolio. The Trust has entered into an investment management agreement with Brighthouse Investment Advisers with respect to the Portfolio. For providing investment management services to the Portfolio, Brighthouse Investment Advisers receives monthly compensation at the following annual rates:
|
Management |
% per annum | Average Daily Net Assets | ||
| $4,169,437 | 0.850% | Of the first $100 million | ||
| 0.800% | On amounts in excess of $100 million |
Brighthouse Investment Advisers has entered into an investment subadvisory agreement with respect to managing the Portfolio. Dimensional Fund Advisors LP is compensated by Brighthouse Investment Advisers to provide subadvisory services for the Portfolio.
Management Fee Waivers - Pursuant to a management fee waiver agreement, the Adviser has agreed, for the period May 1, 2023 to April 30, 2024, to reduce its advisory fees set out above under “Investment Management Agreement” for each class of the Portfolio as follows:
| % per annum reduction |
Average Daily Net Assets | |
| 0.200% | Of the first $100 million | |
| 0.150% | On amounts in excess of $100 million |
An identical expense agreement was in place for the period April 29, 2022 to April 30, 2023. Amounts waived for the year ended December 31, 2023 are shown as management fee waivers in the Statement of Operations.
Certain officers and trustees of the Trust may also be officers of the Adviser; however, such officers and trustees receive no compensation from the Trust.
Transfer Agency Agreement - Brighthouse Life Insurance Company serves as the transfer agent for the Trust. Brighthouse Life Insurance Company receives no fees for its services to the Trust.
Distribution and Service Fees - The Trust has a distribution agreement with Brighthouse Securities, LLC (the “Distributor”) pursuant to which the Distributor serves as the general distributor of shares of each class (each a “Class”) of each Portfolio. The Distributor is an affiliate of the Trust. The Trust has adopted a Distribution and Services Plan (the “D&S Plan”) relating to Class B, Class D, Class E, Class F and Class G shares of each Portfolio, under Rule 12b-1 under the 1940 Act, pursuant to which the Trust may pay the Distributor a fee (the “Service Fee”) at an annual rate not to exceed 0.25% of each such Portfolio’s average daily net assets attributable to the Class B, Class D, Class E, Class F and Class G shares of the Trust. Each Portfolio may not offer shares of each Class. The D&S Plan also authorizes the Trust, on behalf of each of its Portfolios, to pay to the Distributor a distribution fee (the “Distribution Fee” and together with the Service Fee, the “Fees”) at an annual rate of up to 0.25% of each Portfolio’s average daily net assets attributable to the Class B, Class D, Class E, Class F, and Class G shares in consideration of the services rendered in connection with the sale of such shares by the Distributor. Under the Distribution Agreement with respect to the Trust, Fees are currently paid at an annual rate of 0.25% of average daily net assets in the case of Class B shares, 0.10% of average daily net assets in the case of Class D shares, 0.15% of average daily net assets in the case of Class E shares, 0.20% of average daily net assets in the case of Class F shares and 0.30% of average daily net assets in the case of Class G shares. The D&S Plan is known as a “compensation plan” because the Trust makes payments to the Distributor for services rendered regardless of the actual level of expenditures by the Distributor. Amounts incurred by the Portfolio for the year ended December 31, 2023 are shown as Distribution and service fees in the Statement of Operations.
Deferred Trustee Compensation -Each Trustee who is not currently an employee of the Adviser or any of its affiliates receives compensation from the Trust for his or her service to the Trust. A deferred compensation plan (the “Plan”) is available to the Trustees
BHFTII-47
Brighthouse Funds Trust II
Brighthouse/Dimensional International Small Company Portfolio
Notes to Financial Statements—December 31, 2023—(Continued)
on a voluntary basis. Deferred amounts remain in the Trust until distributed in accordance with the provisions of the Plan. The value of a participating Trustee’s deferral account is based on theoretical investments of deferred amounts on the normal payment dates in certain portfolios of the Trust or Brighthouse Funds Trust I, an affiliate of the Trust, as designated by the participating Trustee. Changes in the value of participants’ deferral accounts are reflected as a component of Trustees’ fees and expenses in the Statement of Operations. The portion of the accrued obligations allocated to the Portfolio under the Plan is reflected as Deferred trustees’ fees in the Statement of Assets and Liabilities.
6. Contractual Obligations
Under the Trust’s organizational documents, its officers and Trustees may be indemnified against certain liabilities and expenses arising out of the performance of their duties to the Trust. Additionally, the Trust has a variety of indemnification obligations under contracts with its service providers. The Trust’s maximum exposure under these arrangements is unknown, as this would involve future claims that may be made against the Trust that have not yet occurred.
7. Income Tax Information
The cost basis of investments for federal income tax purposes at December 31, 2023 was as follows:
| Cost basis of investments |
$ | 527,368,681 | ||
|
|
|
|||
| Gross unrealized appreciation |
136,574,026 | |||
| Gross unrealized (depreciation) |
(120,356,033 | ) | ||
|
|
|
|||
| Net unrealized appreciation (depreciation) |
$ | 16,217,993 | ||
|
|
|
The tax character of distributions paid for the years ended December 31, 2023 and 2022 were as follows:
| Ordinary Income |
Long-Term Capital Gain | Total | ||||||||
| 2023 |
2022 | 2023 | 2022 | 2023 | 2022 | |||||
| $13,039,768 | $22,996,258 | $16,466,084 | $53,236,130 | $29,505,852 | $76,232,388 | |||||
As of December 31, 2023, the components of distributable earnings (accumulated losses) on a federal income tax basis were as follows:
| Undistributed |
Undistributed Long-Term Capital Gain |
Net Unrealized Appreciation (Depreciation) |
Accumulated Capital Losses |
Total | ||||||||||||
| $15,243,722 | $ | 8,244,776 | $ | 16,262,202 | $ | — | $ | 39,750,700 | ||||||||
The Portfolio utilizes the provisions of the federal income tax laws that provide for the carryforward of capital losses for prior years, offsetting such losses against any future realized capital gains. Net capital losses may be carried forward indefinitely and their character is retained as short-term and/or long-term losses.
As of December 31, 2023, the Portfolio had no accumulated capital losses.
8. Recent Accounting Pronouncement & Regulatory Updates
In June 2022, FASB issued Accounting Standards Update 2022-03—Fair Value Measurement (Topic 820)—Fair Value Measurement of Equity Securities Subject to Contractual Sale Restrictions (“ASU 2022-03”). ASU 2022-03 clarifies the guidance in Topic 820 to indicate that a contractual sale restriction should not be considered in the fair value of an equity security subject to such a restriction, and requires entities with investments in equity securities subject to contractual sale restrictions to disclose certain qualitative and quantitative information about such securities. ASU 2022-03 is effective for fiscal years, and interim periods within those fiscal years, beginning after December 15, 2023. ASU 2022-03 is only applicable to an equity security in which the contractual arrangement that restricts its sale is executed or modified on or after the adoption date.
Effective January 24, 2023, the Securities and Exchange Commission adopted rule and form amendments that require open-end management investment companies to transmit concise and visually engaging annual and semiannual reports to shareholders that highlight certain information deemed by the SEC to be particularly important for investors. Certain other information, including financial statements, will no longer appear in shareholder reports but will, as required, be available online, delivered free of charge upon request, and filed on a semiannual basis on Form N-CSR. The rule and form amendments have a compliance date of July 24, 2024. Accordingly, the rule and form amendments will not impact the Portfolio until its 2024 semiannual shareholder report.
BHFTII-48
Brighthouse Funds Trust II
Brighthouse/Dimensional International Small Company Portfolio
Report of Independent Registered Public Accounting Firm
To the Board of Trustees of Brighthouse Funds Trust II and Shareholders of the Brighthouse/Dimensional International Small Company Portfolio:
Opinion on the Financial Statements and Financial Highlights
We have audited the accompanying statement of assets and liabilities, including the schedule of investments, of the Brighthouse/Dimensional International Small Company Portfolio (the “Fund”) (one of the funds constituting the Brighthouse Funds Trust II), as of December 31, 2023, the related statement of operations for the year then ended, the statements of changes in net assets for each of the two years in the period then ended, the financial highlights for each of the five years in the period then ended, and the related notes. In our opinion, the financial statements and financial highlights present fairly, in all material respects, the financial position of the Fund as of December 31, 2023, and the results of its operations for the year then ended, the changes in its net assets for each of the two years in the period then ended, and the financial highlights for each of the five years in the period then ended in conformity with accounting principles generally accepted in the United States of America.
Basis for Opinion
These financial statements and financial highlights are the responsibility of the Fund’s management. Our responsibility is to express an opinion on the Fund’s financial statements and financial highlights based on our audits. We are a public accounting firm registered with the Public Company Accounting Oversight Board (United States) (PCAOB) and are required to be independent with respect to the Fund in accordance with the U.S. federal securities laws and the applicable rules and regulations of the Securities and Exchange Commission and the PCAOB.
We conducted our audits in accordance with the standards of the PCAOB. Those standards require that we plan and perform the audit to obtain reasonable assurance about whether the financial statements and financial highlights are free of material misstatement, whether due to error or fraud. The Fund is not required to have, nor were we engaged to perform, an audit of its internal control over financial reporting. As part of our audits we are required to obtain an understanding of internal control over financial reporting but not for the purpose of expressing an opinion on the effectiveness of the Fund’s internal control over financial reporting. Accordingly, we express no such opinion.
Our audits included performing procedures to assess the risks of material misstatement of the financial statements and financial highlights, whether due to error or fraud, and performing procedures that respond to those risks. Such procedures included examining, on a test basis, evidence regarding the amounts and disclosures in the financial statements and financial highlights. Our audits also included evaluating the accounting principles used and significant estimates made by management, as well as evaluating the overall presentation of the financial statements and financial highlights. Our procedures included confirmation of securities owned as of December 31, 2023, by correspondence with the custodian and brokers; when replies were not received from brokers, we performed other auditing procedures. We believe that our audits provide a reasonable basis for our opinion.
/s/ Deloitte & Touche LLP
Boston, Massachusetts
February 23, 2024
We have served as the auditor of one or more Brighthouse investment companies since 1983.
BHFTII-49
Brighthouse Funds Trust II
Trustees and Officers
MANAGEMENT OF THE TRUSTS
The Boards of Trustees (the “Board”) of Brighthouse Funds Trust I and Brighthouse Funds Trust II (“Trust I” and “Trust II”, respectively, and collectively the “Trusts”) supervise the Trusts and are responsible for representing the interests of shareholders. The Trustees, the Chairman of the Board and the Chairmen of each subcommittee are the same for both Trusts. The Trustees of each Trust meet periodically throughout the year to oversee the Portfolios’ activities, reviewing, among other things, each Portfolio’s performance and its contractual arrangements with various service providers. The Trustees of each Trust elect the officers of the Trust, who are responsible for administering the Trust’s day-to-day operations.
Trustees and Officers
The Trustees and executive officers of the Trusts, as well as their ages and their principal occupations during the past five years, are set forth below. Unless otherwise indicated, the business address of each is c/o Brighthouse Funds Trust I and Brighthouse Funds Trust II, 11225 N. Community House Rd., Charolette, North Carolina 28277. Each Trustee who is deemed an “interested person,” as such term is defined in the 1940 Act, is referred to as an “Interested Trustee.” Those Trustees who are not “interested persons,” as such term is defined in the 1940 Act, are referred to as “Independent Trustees.” There is no limit to the term a Trustee may serve, other than pursuant to the retirement policy adopted by the Independent Trustees. Trustees serve until their death, resignation, retirement or removal in accordance with Trust I’s and Trust II’s respective organizational documents and policies adopted by the Board of the Trust from time to time. Officers hold office at the pleasure of each Board and serve until their removal or resignation in accordance with the Trusts’ respective organizational documents and policies adopted by the Board of each Trust from time to time.
Trustees of the Trusts
| Name and Year of Birth |
Position(s) |
Term of Office |
Principal Occupation(s) During the Past |
Number of |
Other Directorships Held | |||||
| Interested Trustee | ||||||||||
| John Rosenthal* (1960) |
Trustee | Indefinite; From May 2016 (Trust I and Trust II) to present | Chief Investment Officer, Brighthouse Financial, Inc. (2016 to present). | 73 | None | |||||
| Independent Trustees | ||||||||||
| Dawn M. Vroegop (1966) |
Trustee and Chair of the Board | Indefinite; From December 2000 (Trust I)/May 2009 (Trust II) to present as Trustee; From May 2016 (Trust I and Trust II) until present as Chair | Retired; Private Investor. | 73 | Trustee, Driehaus Mutual Funds (8 portfolios).** | |||||
| Stephen M. Alderman (1959) |
Trustee | Indefinite; From December 2000 (Trust I)/April 2012 (Trust II) to present | Vice President and General Counsel, IHR Aerial Solutions, LLC; Until 2022, General Counsel, Illini Hi-Reach, Inc.; Until 2020, Shareholder in the law firm of Garfield & Merel, Ltd. | 73 | None | |||||
| Robert J. Boulware (1956) |
Trustee | Indefinite; From March 2008 (Trust I)/April 2012 (Trust II) to present | Managing Member, Pilgrim Funds, LLC (private equity fund). | 73 | Trustee, Vertical Capital Income Fund (closed-end fund);** Trustee, The Private Shares Fund (closed-end fund);** Until 2021, Director, Mid-Con Energy Partners, LP (energy);** Until 2020, Director, Gainsco, Inc. (auto insurance).** | |||||
BHFTII-50
Brighthouse Funds Trust II
Trustees and Officers—(Continued)
| Name and Year of Birth |
Position(s) |
Term of Office |
Principal Occupation(s) During the Past |
Number of |
Other Directorships Held | |||||
| Susan C. Gause (1952) |
Trustee | Indefinite; From March 2008 (Trust I)/April 2012 (Trust II) to present | Private Investor. | 73 | Trustee, HSBC Funds (4 portfolios).** | |||||
| Nancy Hawthorne (1951) |
Trustee | Indefinite; From May 2003 (Trust II)/April 2012 (Trust I) to present | Private Investor. | 73 | Trustee, First Eagle Credit Opportunities Fund;** Trustee and Chair of the Board of Trustees, First Eagle Global Opportunities Fund;** Director, Avid Technology, Inc;** Director, CRA International, Inc.** | |||||
Executive Officers of the Trusts
| Name and Year of Birth |
Position(s) |
Term of Office |
Principal Occupation(s) | |||
| Kristi Slavin (1973) | President and Chief Executive Officer, of Trust I and Trust II | From May 2016 (Trust I and Trust II) to present |
President, Brighthouse Investment Advisers, LLC (2016-present). | |||
| Alan R. Otis (1971) | Chief Financial Officer and Treasurer, of Trust I and Trust II | From November 2017 (Trust I and Trust II) to present |
Executive Vice President, Brighthouse Investment Advisers, LLC (2017-present); formerly, Vice President, Brighthouse Investment Advisers, LLC (2012-2017); Assistant Treasurer, Trust I and Trust II (2012-2017). | |||
| Thomas Watterson (1985) | Secretary, of Trust I and Trust II | From November 2023 (Trust I and Trust II) to present |
Executive Vice President, Chief Legal Officer and Secretary, Brighthouse Investment Advisers, LLC (2023-Present); Managing Corporate Counsel, Brighthouse Financial Inc. (2023-present); Managing Counsel and Director, The Bank of New York Mellon Corporation (2019-2023); Counsel and Vice President, The Bank of New York Mellon Corporation (2016-2019). | |||
| Katie Hellmann (1980) | Chief Compliance Officer (“CCO”), of Trust I and Trust II | From May 2023 (Trust I and Trust II) to present |
Chief Compliance Officer, Brighthouse Investment Advisers, LLC (2023-present) and Head of Funds and Investments Compliance (2023-present). Deputy Chief Compliance Officer, Transamerica Asset Management (2022-2023). Leader and Senior Compliance Counsel – Funds Compliance, Edward Jones (2017-2022). | |||
| Rosemary Morgan (1983) | Anti-Money Laundering Officer, of Trust I and Trust II | From May 2023 (Trust I and Trust II) to present |
Chief Privacy Officer, Leader of Compliance Programs and Assistant General Counsel, Brighthouse Financial, Inc. (2019-2022); Chief Privacy Officer, Head of Compliance Programs & Contracts Law, Brighthouse Financial, Inc. (2022-2023), Chief Compliance Officer and Associate General Counsel, Brighthouse Financial, Inc. (2023-present); Vice President and Chief Compliance Officer, Brighthouse Life Insurance Company (2023-present); Vice President and Chief Compliance Officer (2023-present), Brighthouse Life Insurance Company of NY; Vice President and Chief Compliance Officer (2023-present), New England Life Insurance Company. | |||
| Anna Koska (1981) | Vice President, of Trust I and Trust II | From June 2022 (Trust I and Trust II) to present |
Vice President, Investment and Advisory Services, Brighthouse Investment Advisers, LLC (2022-present); Director of Investment and Advisory Services, Brighthouse Investment Advisers, LLC (2019-2022); Senior Portfolio Analyst, Brighthouse Investment Advisers, LLC (2017-2019). | |||
| * | Mr. Rosenthal is an “interested person” of the Trusts because of his position with Brighthouse Financial, Inc. (“Brighthouse Financial”), an affiliate of BIA. |
| ** | Indicates a directorship with a registered investment company or a company subject to the reporting requirements of the Securities Exchange Act of 1934, as amended. |
| (1) | Previous positions during the past five years with the Trusts, MetLife, Inc. or the Adviser are omitted if not materially different. |
| (2) | The Fund Complex includes 44 Trust I Portfolios and 29 Trust II Portfolios. |
BHFTII-51
Brighthouse Funds Trust II
Brighthouse/Dimensional International Small Company Portfolio
Board of Trustees’ Consideration of Advisory and Sub-Advisory Agreements
At a meeting held on November 13-14, 2023 (the “November Meeting”), the Boards of Trustees (the “Board”) of Brighthouse Funds Trust I and Brighthouse Funds Trust II (“BFT I” and “BFT II,” respectively, and collectively, the “Trusts”), including a majority of the Trustees who are not “interested persons” of the Trusts (the “Independent Trustees”) under the Investment Company Act of 1940 (the “1940 Act”), approved the continuation of the Trusts’ advisory agreements (each an “Advisory Agreement”) with Brighthouse Investment Advisers, LLC (the “Adviser”) and the applicable sub-advisory and sub-sub-advisory agreements (each a “Sub-Advisory Agreement” and collectively with the Advisory Agreement, the “Agreements”) between the Adviser and the investment sub-advisers and sub-sub-adviser (each a “Sub-Adviser,” and collectively, the “Sub-Advisers”) for the series of the Trusts (each a “Portfolio,” and collectively, the “Portfolios”) for the annual contract renewal period from January 1, 2024 through December 31, 2024.
The Board met with personnel of the Adviser on September 28-29, 2023 (the “September Meeting”) for the specific purpose of giving preliminary consideration to the proposed continuation of the Agreements, including consideration to information that the Adviser and Sub-Advisers had provided for the Board’s review at the request of the Independent Trustees. At the September Meeting, the Adviser reviewed with the Board the performance and fees experienced by each Portfolio, as well as other information. During and after the September Meeting, the Independent Trustees requested additional information and clarifications that the Adviser addressed at the November Meeting (the September Meeting and the November Meeting are referred to collectively as, the “Meetings”). During the contract renewal process, and throughout the year, the Independent Trustees were advised by independent legal counsel, and they met with independent legal counsel in executive sessions outside of the presence of management on a number of occasions to discuss, among other things, the renewal of the Agreements.
In considering the continuation of the Agreements, the Board reviewed a variety of materials that were provided for the specific purpose of assisting the Board in the renewal process, along with various information and materials that were provided to and discussed with the Board throughout the year, at regularly scheduled meetings of the Board and its committees. In particular, information for each Portfolio included, but was not limited to, reports on investment performance, expenses, legal and compliance matters, and asset pricing. Information about the Adviser and each Sub-Adviser included, but was not limited to, reports on the business, operations, and performance of the Adviser and the Sub-Advisers and reports that the Adviser and Sub-Advisers had prepared specifically for the renewal process.
In considering the continuation of the Agreements, the Board also reviewed, among other things, a report for each Portfolio that was prepared by Broadridge (“Broadridge”), an independent organization, which set forth comparative performance and expense information for each Portfolio. In addition, the Independent Trustees reviewed a report that was prepared by JDL Consultants, LLC (“JDL”), an independent consultant to the Independent Trustees, which examined the Broadridge reports for each Portfolio (“JDL Report”). The Independent Trustees met in executive session with representatives of JDL during the September Meeting to review the JDL Report.
At the November Meeting, the Board, including a majority of the Independent Trustees, concluded that the nature, extent, and quality of services provided by the Adviser and each Sub-Adviser supported the renewal of the Agreements. The Board also concluded that the investment services provided to and the performance of each Portfolio was such that each Agreement should continue, and that the fees paid by each Portfolio to the Adviser appeared to be reasonable in light of the nature, extent, and quality of the services provided by the Adviser and each Sub-Adviser. Further, the Board concluded that the Adviser’s profitability in providing services under the Advisory Agreements did not appear unreasonable in light of the nature, extent, and quality of the services provided by the Adviser. The Board reviewed the extent to which the investment advisory fees paid by the Portfolios shared economies of scale with investors or entailed the potential to share economies of scale with investors and concluded that those considerations generally supported the renewal of each Agreement. Finally, the Board considered the Adviser’s recommendation that it approve the renewal of each Sub-Advisory Agreement.
In approving the continuation of each Agreement, the Board, including the Independent Trustees, gave attention to all of the information that was furnished, and each Trustee placed varying degrees of importance on the various pieces of information that were provided to them. The Board evaluated the information provided to it on a Portfolio-by-Portfolio basis, and its decision was made separately with respect to each Portfolio. The following paragraphs provide more information about some of the primary factors that were relevant to the Board’s decisions. The Board did not identify any single factor as determinative, and the Trustees generally attributed different weights to various factors for the various Portfolios.
Nature, extent and quality of services. The Board evaluated the nature, extent, and quality of the services that the Adviser and the Sub-Advisers, as relevant, provided to the Portfolios. The Board considered the Adviser’s services as investment manager to the Portfolios, including its services relating to the hiring and oversight of the Sub-Advisers and, in particular, their investment programs and personnel, succession management of key personnel, trading practices, compliance programs and personnel, and risk management
BHFTII-52
Brighthouse Funds Trust II
Brighthouse/Dimensional International Small Company Portfolio
Board of Trustees’ Consideration of Advisory and Sub-Advisory Agreements—(Continued)
programs, among other things. The Adviser’s services in coordinating and overseeing the activities of the Trusts’ other service providers were also considered. The Board also considered the systems and processes required by the Adviser to meet additional regulatory and compliance requirements resulting from U.S. Securities and Exchange Commission and other regulatory initiatives, including related to liquidity, valuation, and derivatives risk management. The Board considered information received from the Trusts’ Chief Compliance Officer regarding the Portfolios’ compliance policies and procedures that were established pursuant to Rule 38a-l under the 1940 Act, and relevant aspects of the Adviser’s and Sub-Advisers’ compliance policies and procedures. The Board also noted that it was the practice of the Adviser’s investment, compliance, and legal staff to conduct periodic meetings (through various media) with the Sub-Advisers throughout the year in order to review and assess the services that are provided to the Portfolios, and that personnel of the Adviser routinely prepare and present reports to the Board regarding those meetings. In addition, during the Meetings and throughout the year, the Board considered the expertise, experience, and performance of the personnel of the Adviser who performed the various services that are mentioned above.
With respect to the services provided by each of the Sub-Advisers, the Board considered a variety of information that the Adviser and each Sub-Adviser prepared for the Board’s review. The Board considered each Sub-Adviser’s investment process, each Sub-Adviser’s overall organization and business plans and the investment performance experienced by the Portfolio (as described in more detail below). The Board took into account that each Sub-Adviser’s responsibilities include, among other things, the development and maintenance of an investment program for the applicable Portfolio, the selection of investments and the placement of orders for the purchase and sale of such assets, and the implementation of compliance controls related to the performance of these services. The Board considered, based on the information provided, each Sub-Adviser’s staffing with respect to the management of the Portfolio and other information relating to the Sub-Adviser’s business and operations. The Board also considered the Sub-Adviser’s overall resources and information with respect to any recent turnover of key personnel at the Sub-Adviser. The Board reviewed each Sub-Adviser’s investment experience, as well as information provided regarding the Sub-Adviser’s personnel who provide services to the Portfolios. The Board also considered, among other things, information about each Sub-Adviser’s compliance program, including regarding any compliance matters involving a Sub-Adviser that had been brought to the Board’s attention during the year, as well as the Adviser’s assessment of the financial condition of each Sub-Adviser.
Performance. The Board placed emphasis on the performance of each Portfolio in the context of the performance of the relevant markets in which the Portfolio invests. The Board considered the Adviser’s quarterly presentations to the Board of detailed information about each Portfolio’s investment strategies and performance results and composition, including discussions regarding the relevant effects of market conditions. The Board reviewed and considered the reports prepared by Broadridge, which provided a statistical analysis comparing each Portfolio’s investment performance to that of comparable funds underlying variable insurance products (the “Performance Universe”), and the JDL Report. The Board also compared the performance of each Portfolio to that of comparable funds and other accounts that were managed by the relevant Sub-Adviser, to the extent such information was provided. The Board considered each Portfolio’s performance for periods subsequent to the performance period covered by the Broadridge reports and considered the Adviser’s assessment of the same. The Board also noted that while it found the data provided by Broadridge generally useful, it recognized the limitations of such data, including, in particular, that notable differences may exist between a Portfolio and the other funds in a Broadridge category (for example, with respect to investment strategies) and that the results of the performance comparisons may vary depending on (i) the end dates for the performance periods that were selected and (ii) the selection of the peer groups.
The Board focused particular attention on Portfolios with less favorable performance records. The Board noted the Adviser’s focus on each Sub-Adviser’s performance and that the Adviser had been active in monitoring and responding to any performance issues with respect to the Portfolios.
Fees and Expenses. The Board gave consideration to the level and method of computing the fees payable under the Agreements. The Board reviewed and considered the information in the JDL Report concerning fees and expenses. The Board also reviewed and considered the Broadridge report for each Portfolio, which included various comparisons of the Portfolio’s fees (at December 31, 2022 and various asset levels) and expenses with those of its peers, including, as applicable, a broad group of peer funds (“Expense Universe”), a narrower group of peer funds (“Expense Group”), a broad group of peer sub-advised funds (“Sub-advised Expense Universe”), and a narrower group of peer sub-advised funds (“Sub-advised Expense Group”). In particular, the Board reviewed comparisons of each Portfolio’s contractual management fees with its Expense Group and Sub-advised Expense Universe, contractual sub-adviser fees with its Sub-advised Expense Universe and Sub-advised Expense Group, and total expenses with its Expense Universe, Expense Group and Sub-advised Expense Universe. The Board considered that Broadridge selected the peer funds, which were funds underlying variable insurance products that Broadridge deemed to be comparable to the Portfolios. The Board considered that the fee and expense information in the Broadridge report for each Portfolio reflected information as of the Portfolio’s most recent fiscal year
BHFTII-53
Brighthouse Funds Trust II
Brighthouse/Dimensional International Small Company Portfolio
Board of Trustees’ Consideration of Advisory and Sub-Advisory Agreements—(Continued)
end at the time the Broadridge report was issued and that historical asset levels may differ from current asset levels, particularly in a period of market volatility. In addition, the Board compared the fee payable to a Sub-Adviser by the Adviser with respect to the Portfolio to the fee payable to the Sub-Adviser by other comparable funds and other accounts, to the extent such information was provided.
The Board noted that the sub-advisory fees for the Portfolios are negotiated at arm’s length by the Adviser and are paid by the Adviser out of its advisory fees. The Board also considered that the Adviser had entered into expense limitation or management fee waiver agreements with certain of the Portfolios pursuant to which the Adviser had agreed to waive a portion of its advisory fee and/or reimburse certain expenses as a means of limiting a Portfolio’s total annual operating expenses or passing through the benefit of a subadvisory fee concession to a Portfolio, as applicable.
Profitability. The Board examined the profitability to the Adviser of each Advisory Agreement, on a Portfolio-by-Portfolio basis. The Board also considered that an affiliate of the Adviser, Brighthouse Securities, LLC, serves as distributor for the Trusts, and, as such, receives Rule 12b-1 payments to support the distribution of the Portfolios. The Board considered the profitability to the Sub-Advisers and their affiliates of their relationships with the Portfolios, to the extent provided, and the Board considered the ability of the Adviser to negotiate with a Sub-Adviser at arm’s length. In reviewing the profitability information, the Board recognized that expense allocation methodologies are inherently subjective and various methodologies may be reasonable while producing different results.
Economies of scale. The Board considered each Portfolio’s fees in light of its size. The Board noted the fee schedules for the Portfolios that contain breakpoints that reduce the fee rate above specified asset levels, including breakpoints in the Advisory Agreements and any corresponding Sub-Advisory Agreement. The Board noted those Portfolios that did not have breakpoints in their advisory fees and considered management’s explanation of the same.
The Board considered the effective fees under the Advisory Agreement and Sub-Advisory Agreement for each Portfolio as a percentage of assets at different asset levels and possible economies of scale that may be realized if the assets of the Portfolio grow. The Board examined, among other data, the effect of a Portfolio’s growth in size, and reduction in size, on various fee schedules. The Board also generally noted that if a Portfolio’s assets increase over time, the Portfolio may realize economies of scale if assets increase proportionally more than certain other expenses.
Other factors. The Board considered other benefits that may be realized by the Adviser and its affiliates from their relationships with the Trusts. Among the benefits realized by the Adviser, the Board recognized that Brighthouse Securities, LLC, as the distributor for the Trusts, receives payments pursuant to Rule 12b-1 from the Portfolios to help compensate for the provision of shareholder services and distribution activities. The Board considered that a Sub-Adviser may engage in soft dollar transactions in managing a Portfolio. In addition, the Board considered that a Sub-Adviser may be affiliated with registered broker-dealers that may, from time to time, receive brokerage commissions from a Portfolio in connection with the sale of portfolio securities (subject to applicable best execution obligations). The Board also considered that a Sub-Adviser and its affiliates could benefit from the opportunity to provide advisory services to additional portfolios of the Trusts and overall reputational benefits.
The Board considered information from the Adviser and Sub-Advisers pertaining to potential conflicts of interest, and the manner in which any potential conflicts were mitigated. In its review, the Board considered information regarding various business relationships among the Adviser and its affiliates and various Sub-Advisers and their affiliates. The Board also considered information about services and/or payments provided to the Adviser by the Sub-Advisers in connection with marketing activities. The Board considered representations from the Adviser that such business relationships and any payments were not considered in the Adviser’s recommendation to renew any of the Sub-Advisory Agreements.
* * * * *
Brighthouse/Dimensional International Small Company Portfolio. The Board also considered the following information in relation to the Agreements with the Adviser and Dimensional Fund Advisors LP regarding the Portfolio:
Among other data relating specifically to the Portfolio’s performance, the Board considered that the Portfolio outperformed the median of its Performance Universe and the average of its Morningstar Category for the one-, three-, and five-year periods ended June 30, 2023. The Board further considered that the Portfolio outperformed its benchmark, the MSCI World ex-U.S. Small Cap Index, for the one-, three-, and five-year periods ended October 31, 2023. The Board also noted the presence of certain management fee waivers in effect for the Portfolio.
The Board also considered that the Portfolio’s actual management fees and total expenses (exclusive of 12b-1 fees) were below the Expense Group median, the Expense Universe median, and the Sub-advised Expense Universe median. The Board also noted that the Portfolio’s contractual management fees were below the asset-weighted average of the Investment Classification/Morningstar Category selected by Broadridge at the Portfolio’s current size. The Board also noted that the Portfolio’s contractual sub-advisory fees were below the averages of the Sub-advised Expense Group and the Sub-advised Expense Universe at the Portfolio’s current size.
BHFTII-54
Brighthouse Funds Trust II
Brighthouse/Wellington Balanced Portfolio
Managed By Wellington Management Company LLP
Portfolio Manager Commentary*
PERFORMANCE
For the twelve months ended December 31, 2023, the Class A, B and E shares of the Brighthouse/Wellington Balanced Portfolio returned 18.10%, 17.88%, and 17.98%, respectively. The Portfolio’s benchmarks, the Standard & Poor’s (“S&P”) 500 Index¹ and the Bloomberg U.S. Aggregate Bond Index², returned 26.29% and 5.53%, respectively. A blend of the S&P 500 Index (60%) and the Bloomberg U.S. Aggregate Bond Index (40%) returned 17.67%.
MARKET ENVIRONMENT / CONDITIONS
U.S. equities rose over the twelve-month period ending December 31, 2023, amid easing inflation, optimism for lower interest rates, strong performance in select mega-cap technology companies, and steady Gross Domestic Product (“GDP”) growth. U.S. equities advanced during the first quarter. The sudden collapse of two U.S. regional banks prompted swift policy actions by federal regulators, which helped stabilize liquidity and stem the potential for broader contagion. Shares of large technology companies surged, helping growth stocks to significantly outperform their value counterparts. The U.S. Federal Reserve (the “Fed”) slowed its pace of policy tightening, raising interest rates by 25 basis points (“bps”) in February and March, to a range between 4.75% – 5.00%. U.S. equities rose again in the second quarter, largely driven by a potent rally in a narrow group of mega-cap technology companies that benefited from investor optimism about their earnings potential and growth prospects and exuberance surrounding generative artificial intelligence. U.S. equities fell in the third quarter, pressured by rising U.S. Treasury yields amid views that the Fed would keep interest rates elevated for a prolonged period. Even as household budgets were strained by tightening credit conditions and lofty prices, markets dialed back the probability of recession as cooling inflation, a solid job market, and resilient consumer spending increased the potential that the U.S. economy could achieve a “soft landing.” Economic data released during the third quarter indicated healthy momentum in the U.S. economy after GDP in the second quarter grew at a surprisingly strong 2.1% annualized rate. U.S. equities registered their largest quarterly return in three years for the fourth quarter as gains broadened beyond those of the “Magnificent Seven” stocks that dominated the stock market’s performance for most of the year. A rapid descent in inflation prompted the Fed to pivot from its “higher-for-longer” policy stance in December, sending U.S. Treasury yields lower and driving stocks higher. The Fed’s Summary of Economic Projections implied that policymakers anticipate 75 bps of interest rate cuts in 2024.
Equity returns varied by market cap during the reporting period. Large-cap stocks, as measured by the S&P 500 Index, outperformed mid-cap and small-cap stocks, as measured by the S&P MidCap 400 Index and Russell 2000 Index, respectively.
During the last twelve months, global fixed income sectors generated positive total returns despite elevated interest rate volatility over most of the period. The Bloomberg U.S. Aggregate Bond Index returned 5.53% during the period. Higher-yielding sectors generally performed best, benefiting from their coupon advantage and spread tightening. Global sovereign yields ended mixed. Yields rose earlier in the period amid multiple rate hikes from the Fed and other major central banks across Europe, while Asian central banks pursued more dovish approaches. Yields plunged by the end of the period in response to accommodative central bank policy expectations amid weaker economic data, including moderating inflation.
Despite concerns about tighter lending standards following turmoil in the banking sector earlier in the period, credit sectors produced positive excess returns over duration-equivalent government bonds as spreads narrowed, particularly High Yield (“HY”) and Emerging Markets Debt (“EMD”). Most securitized sectors’ performance rebounded by the end of the period as markets absorbed the Federal Deposit Insurance Corporation (“FDIC”) asset sales of Mortgage-Backed Securities (“MBS”) and sentiment improved. Over the period, U.S. investment-grade corporate spreads compressed by 31 bps and U.S. high-yield corporate spreads tightened by 146 bps, according to Bloomberg Index data.
The U.S. dollar ended mixed versus most currencies over the period after the Fed adopted a more dovish tone later in the year, and central banks increasingly charted different policy courses. European currencies generally ended higher versus the U.S. dollar, particularly the Swiss franc which was a notable outperformer. The Japanese yen depreciated versus the U.S. dollar as the Bank of Japan remained the outlier among major G10 central banks in maintaining its ultra-loose monetary policy. Emerging Market (“EM”) currencies broadly gained versus the U.S. dollar.
PORTFOLIO REVIEW / PERIOD END POSITIONING
The Portfolio outperformed its blended benchmark during the reporting period ended December 31, 2023.
The equity portion of the Portfolio (the “Equity Portfolio”) outperformed its benchmark, the S&P 500 Index, for the twelve-month period ended December 31, 2023. Strong stock selection within Health Care, Energy and Communication Services contributed most to relative performance. This was partially offset by more challenging stock selection within the Information Technology (“IT”) and Consumer Staples sectors.
The Equity Portfolio’s largest individual relative contributors during the period included overweight positions in Meta Platforms, Amazon.com and an out-of-benchmark position in Ares Management. Shares of Meta Platforms rose over the period. The company reported better-than-forecast revenue for the fourth quarter and boosted its stock buyback authorization by $40 billion. The company also reported solid second and third quarter results, buoyed by a rebound in online advertising and cost cutting. Shares of Amazon ended the period higher. Ongoing demand for artificial intelligence (“AI”) was expected to benefit Amazon Web Services (“AWS”) and increase demand for its
BHFTII-1
Brighthouse Funds Trust II
Brighthouse/Wellington Balanced Portfolio
Managed By Wellington Management Company LLP
Portfolio Manager Commentary*—(Continued)
cloud computing platforms. The e-commerce giant reported third quarter results that beat consensus estimates as revenue rose 13% compared to the prior quarter. The company saw sales growth within its AWS business as well as its third-party seller services and advertising units. Amazon also issued promising sales guidance for the fourth quarter, which included the holiday period. Shares of Ares Management, the alternative investment manager, rose early in the period along with the broader market. The company reported second-quarter realized income that beat consensus estimates on the back of fundraising momentum and new commitments. Earlier this year, the FDIC announced that the marketing process for the commercial real estate loan portfolio of Signature Bank will begin, and Ares is a potential bidder. In addition, the company announced the final closing of its infrastructure debt.
Underweight positions in NVIDIA, Apple and Tesla were the top detractors to relative performance during the period. NVIDIA’s shares surged over the period due to strong data center demand and the growing need for chips in AI and language learning models. However, in our assessment, NVIDIA’s valuations were stretched considerably. Instead, we held an overweight position in Advanced Micro Devices (“AMD”) where we see more upside potential. The positive contribution from AMD served to partially offset the negative impact from our underweight position in NVIDIA. Shares of Apple climbed higher over the period. Despite the iPhone maker reporting a miss on consensus expectations for the first quarter, its install base grew to 2 billion devices. The iPhone install base in particular was at an all-time high and saw double-digit growth in emerging markets. Apple later reported second-quarter earnings ahead of consensus estimates led by strong iPhone sales and healthy operating margins. We remained underweight Apple and instead owned overweight positions in other internet related stocks such as Meta and Alphabet. Shares of Tesla rose over the period after reporting strong financial results in 2022. Elon Musk’s outlook gave investors optimism that demand remained strong and outpaced production capacity following last year’s vehicle price cuts. The company’s Model Y was the number one selling vehicle globally in the first quarter becoming the first electric vehicle to claim that title.
As a reminder, the Equity Portfolio is managed in an industry-neutral structure relative to the S&P 500 Index, which promotes stock selection as the primary driver of performance. On an absolute basis, the Portfolio ended the period with the most exposure to the IT, Health Care and Financials sectors.
The fixed income portion of the Portfolio (“Fixed Income Portfolio”) outperformed its benchmark, the Bloomberg U.S. Aggregate Bond Index, for the twelve-month period ended December 31, 2023. The Portfolio’s out-of-benchmark exposure to HY and positioning within Investment Grade (“IG”) Credit were the primary drivers of relative outperformance. An allocation to Structured Finance sectors contributed to relative performance, particularly exposure to Non-agency Residential MBS aided performance as housing data improved despite affordability challenges. An overweight to Agency MBS pass-throughs also benefitted performance, following a decline in interest rate volatility. Exposure to Asset-Backed Securities (“ABS”) and an allocation to Collateralized Loan Obligations helped relative returns amid generally resilient economic data. The Portfolio implemented tactical duration positions throughout the period which had a positive impact on relative performance. Select exposure within EMD modestly detracted from performance overall, with select positioning within EM corporate issuers outperforming.
During the period, the Fixed Income Portfolio used U.S. Treasury futures, swaps, and options to manage duration and yield curve positioning. The Portfolio also used currency forwards, futures, and options to implement non-U.S. rate and currency positions. Credit default swaps (“CDS”) were used to manage credit exposure, and IG, HY, and EM CDS index positions were used as a source of liquidity and to manage overall portfolio risk. EM CDS positions had a negative impact on performance during the period, while IG and HY CDS had a slight positive impact.
At the end of the period, the Fixed Income Portfolio had a longer duration posture relative to the Bloomberg U.S. Aggregate Bond Index. The Portfolio was underweight to IG Credit by the end of the period, as we observed better opportunities in HY and select EM
BHFTII-2
Brighthouse Funds Trust II
Brighthouse/Wellington Balanced Portfolio
Managed By Wellington Management Company LLP
Portfolio Manager Commentary*—(Continued)
corporate exposures. The Portfolio continued to be overweight to securitized sectors (Agency MBS, ABS, and Commercial MBS).
Mary Pryshlak
Jonathan White
Joseph F. Marvan
Robert D. Burn
Campe Goodman
Portfolio Managers
Wellington Management Company LLP
* This commentary may include statements that constitute “forward-looking statements” under the U.S. securities laws. Forward-looking statements include, among other things, projections, estimates, and information about possible or future results related to the Portfolio, market or regulatory developments. The views expressed above are not guarantees of future performance or economic results and involve certain risks, uncertainties and assumptions that could cause actual outcomes and results to differ materially from the views expressed herein. The views expressed above are subject to change at any time based upon economic, market, or other conditions and the subadvisory firm undertakes no obligation to update the views expressed herein. Any discussions of specific securities should not be considered a recommendation to buy or sell those securities. The views expressed above (including any forward-looking statement) may not be relied upon as investment advice or as an indication of the Portfolio’s trading intent. Information about the Portfolio’s holdings, asset allocation or country diversification is historical and is not an indication of future Portfolio composition, which may vary. Direct investment in any index is not possible. The performance of any index mentioned in this commentary has not been adjusted for ongoing management, distribution and operating expenses, and sales charges applicable to mutual fund investments. In addition, the returns do not reflect additional fees charged by separate accounts or variable insurance contracts that an investor in the Portfolio may pay. If these additional fees were reflected, performance would have been lower.
1 The S&P 500 Index is an unmanaged index consisting of 500 stocks chosen for market size, liquidity, and industry group representation. It is a market-weighted index (stock price times number of shares outstanding) with each stock’s weight in the Index proportionate to its market value.
2 The Bloomberg U.S. Aggregate Bond Index is a broad-based benchmark that measures the investment grade, U.S. dollar-denominated, fixed-rate taxable bond market, including Treasuries, government-related and corporate securities, mortgage-backed securities, asset-backed securities, and commercial mortgage-backed securities.
BHFTII-3
Brighthouse Funds Trust II
Brighthouse/Wellington Balanced Portfolio
A $10,000 INVESTMENT COMPARED TO THE S&P 500 INDEX, THE BLOOMBERG U.S. AGGREGATE BOND INDEX AND THE BLENDED INDEX
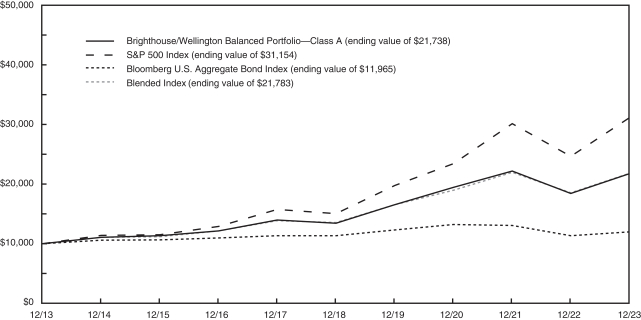
AVERAGE ANNUAL RETURNS (%) FOR THE YEAR ENDED DECEMBER 31, 2023
| 1 Year | 5 Year | 10 Year | ||||||||||
| Brighthouse/Wellington Balanced Portfolio | ||||||||||||
| Class A |
18.10 | 10.09 | 8.07 | |||||||||
| Class B |
17.88 | 9.82 | 7.81 | |||||||||
|
Class E |
17.98 | 9.92 | 7.91 | |||||||||
| S&P 500 Index | 26.29 | 15.69 | 12.03 | |||||||||
| Bloomberg U.S. Aggregate Bond Index | 5.53 | 1.10 | 1.81 | |||||||||
| Blended Index | 17.67 | 9.98 | 8.09 | |||||||||
Portfolio performance is calculated including reinvestment of all income and capital gain distributions. Performance numbers are net of all Portfolio expenses but do not include any insurance, sales, separate account or administrative charges of variable annuity or life insurance contracts or any additional expenses that participants may bear relating to the operations of their plans. If these charges were included, the returns would be lower. The performance of any index referenced above has not been adjusted for ongoing management, distribution and operating expenses, and sales charges applicable to mutual fund investments. Direct investment in any index is not possible. The performance of Class A shares, as set forth in the line graph above, will differ from that of other classes because of the difference in expenses paid by policyholders investing in the different share classes.
This information represents past performance and is not indicative of future results. Investment return and principal value may fluctuate so that shares, upon redemption, may be worth more or less than the original cost.
PORTFOLIO COMPOSITION AS OF DECEMBER 31, 2023
Top Equity Sectors
| % of Net Assets |
||||
| Information Technology | 16.3 | |||
| Health Care | 8.8 | |||
| Financials | 8.6 | |||
| Consumer Discretionary | 6.4 | |||
| Industrials | 5.3 | |||
Top Equity Holdings
| % of Net Assets |
||||
| Microsoft Corp. | 5.3 | |||
| Amazon.com, Inc. | 3.3 | |||
| Apple, Inc. | 3.1 | |||
| Alphabet, Inc. - Class A | 2.0 | |||
| Meta Platforms, Inc. | 1.5 | |||
Top Fixed Income Sectors
| % of Net Assets |
||||
| Agency Mortgage-Backed Securities | 18.6 | |||
| Corporate Bonds & Notes | 11.7 | |||
| U.S. Treasury | 5.6 | |||
| Asset-Backed Securities | 3.9 | |||
| Non-Agency Mortgage-Backed Securities | 3.8 | |||
| Foreign Government | 1.2 | |||
Top Fixed Income Issuers
| % of Net Assets |
||||
| Uniform Mortgage-Backed Security, TBA | 5.9 | |||
| Federal National Mortgage Association | 5.6 | |||
| U.S. Treasury Bonds | 4.2 | |||
| Federal Home Loan Mortgage Corp. | 2.5 | |||
| Government National Mortgage Association | 1.9 | |||
BHFTII-4
Brighthouse Funds Trust II
Brighthouse/Wellington Balanced Portfolio
Understanding Your Portfolio’s Expenses
Shareholder Expense Example
As a shareholder of the Portfolio, you incur ongoing costs, including management fees; distribution and service (12b-1) fees; and other Portfolio expenses. This example is intended to help you understand your ongoing costs (in dollars) (referred to as “expenses”) of investing in the Portfolio and compare these costs with the ongoing costs of investing in other mutual funds. The example is based on an investment of $1,000 invested at the beginning of the period and held for the entire period, July 1, 2023 through December 31, 2023.
Actual Expenses
The first line for each share class of the Portfolio in the table below provides information about actual account values and actual expenses. You may use the information in this line, together with the amount you invested in the particular share class of the Portfolio, to estimate the expenses that you paid over the period. Simply divide your account value by $1,000 (for example, an $8,600 account value divided by $1,000 = 8.6), then multiply the result by the number in the first line under the heading entitled “Expenses Paid During Period” to estimate the expenses you paid on your account during this period.
Hypothetical Example for Comparison Purposes
The second line for each share class of the Portfolio in the table below provides information about hypothetical account values and hypothetical expenses based on the Portfolio’s actual expense ratio and an assumed rate of return of 5% per year before expenses, which is not the Portfolio’s actual return. The hypothetical account values and expenses may not be used to estimate the actual ending account balance or expenses you paid for the period. You may use this information to compare the ongoing costs of investing in the Portfolio and other funds. To do so, compare this 5% hypothetical example with the 5% hypothetical examples that appear in the shareholder reports of the other funds.
Please note that the expenses shown in the table are meant to highlight your ongoing costs only and do not reflect any fees or charges of your variable insurance product or any additional expenses that participants in certain eligible qualified plans may bear relating to the operations of their plan. Therefore, the second line for each share class in the table is useful in comparing ongoing costs only, and will not help you determine the relative total costs of owning different funds. In addition, if these other costs were included, your costs would have been higher.
| Brighthouse/Wellington Balanced Portfolio |
Annualized Expense Ratio |
Beginning Account Value July 1, 2023 |
Ending Account Value December 31, 2023 |
Expenses Paid During Period** July 1, 2023 to December 31, 2023 |
||||||||||||||
| Class A (a) |
Actual | 0.50 | % | $ | 1,000.00 | $ | 1,070.70 | $ | 2.61 | |||||||||
| Hypothetical* | 0.50 | % | $ | 1,000.00 | $ | 1,022.69 | $ | 2.55 | ||||||||||
| Class B (a) |
Actual | 0.75 | % | $ | 1,000.00 | $ | 1,070.10 | $ | 3.91 | |||||||||
| Hypothetical* | 0.75 | % | $ | 1,000.00 | $ | 1,021.43 | $ | 3.82 | ||||||||||
| Class E (a) |
Actual | 0.65 | % | $ | 1,000.00 | $ | 1,069.70 | $ | 3.39 | |||||||||
| Hypothetical* | 0.65 | % | $ | 1,000.00 | $ | 1,021.93 | $ | 3.31 | ||||||||||
| * | Hypothetical assumes a rate of return of 5% per year before expenses. |
| ** | Expenses paid are equal to the Portfolio’s annualized expense ratio for the most recent six month period, as shown above, multiplied by the average account value over the period, multiplied by the number of days (184 days) in the most recent fiscal half-year, divided by 365 (to reflect the one-half year period). |
| (a) | The annualized expense ratio shown reflects the impact of the management fee waiver as described in Note 6 of the Notes to Financial Statements. |
BHFTII-5
Brighthouse Funds Trust II
Brighthouse/Wellington Balanced Portfolio
Schedule of Investments as of December 31, 2023
Common Stocks—60.7% of Net Assets
| Security Description | Shares | Value | ||||||
| Aerospace & Defense—1.1% | ||||||||
| Boeing Co. (a) |
11,624 | $ | 3,029,912 | |||||
| General Dynamics Corp. |
27,983 | 7,266,346 | ||||||
| RTX Corp. |
34,681 | 2,918,059 | ||||||
|
|
|
|||||||
| 13,214,317 | ||||||||
|
|
|
|||||||
| Air Freight & Logistics—0.2% | ||||||||
| C.H. Robinson Worldwide, Inc. |
25,089 | 2,167,439 | ||||||
|
|
|
|||||||
| Automobile Components—0.1% | ||||||||
| Goodyear Tire & Rubber Co. (a) |
100,231 | 1,435,308 | ||||||
|
|
|
|||||||
| Automobiles—0.3% | ||||||||
| Tesla, Inc. (a) |
13,721 | 3,409,394 | ||||||
|
|
|
|||||||
| Banks—1.2% | ||||||||
| JPMorgan Chase & Co. |
56,680 | 9,641,268 | ||||||
| Wells Fargo & Co. |
93,579 | 4,605,958 | ||||||
|
|
|
|||||||
| 14,247,226 | ||||||||
|
|
|
|||||||
| Beverages—1.2% | ||||||||
| Constellation Brands, Inc. - Class A |
23,431 | 5,664,444 | ||||||
| Monster Beverage Corp. (a) |
149,906 | 8,636,085 | ||||||
|
|
|
|||||||
| 14,300,529 | ||||||||
|
|
|
|||||||
| Biotechnology—1.3% | ||||||||
| AbbVie, Inc. |
11,845 | 1,835,620 | ||||||
| Alnylam Pharmaceuticals, Inc. (a) |
2,201 | 421,294 | ||||||
| Apellis Pharmaceuticals, Inc. (a) |
4,734 | 283,377 | ||||||
| Ascendis Pharma AS (ADR) (a) (b) |
2,495 | 314,245 | ||||||
| Biogen, Inc. (a) |
4,476 | 1,158,255 | ||||||
| Bridgebio Pharma, Inc. (a) (b) |
4,793 | 193,493 | ||||||
| Celldex Therapeutics, Inc. (a) (b) |
6,996 | 277,461 | ||||||
| Crinetics Pharmaceuticals, Inc. (a) |
6,768 | 240,806 | ||||||
| Cytokinetics, Inc. (a) (b) |
18,583 | 1,551,495 | ||||||
| Gilead Sciences, Inc. |
11,361 | 920,355 | ||||||
| Immunocore Holdings PLC (ADR) (a) (b) |
4,163 | 284,416 | ||||||
| Karuna Therapeutics, Inc. (a) |
3,134 | 991,942 | ||||||
| Moderna, Inc. (a) (b) |
3,262 | 324,406 | ||||||
| Regeneron Pharmaceuticals, Inc. (a) |
1,942 | 1,705,639 | ||||||
| Revolution Medicines, Inc. (a) |
8,831 | 253,273 | ||||||
| Rocket Pharmaceuticals, Inc. (a) |
8,171 | 244,885 | ||||||
| Sage Therapeutics, Inc. (a) (b) |
13,423 | 290,876 | ||||||
| Sarepta Therapeutics, Inc. (a) (b) |
2,298 | 221,596 | ||||||
| Syndax Pharmaceuticals, Inc. (a) |
9,528 | 205,900 | ||||||
| United Therapeutics Corp. (a) |
1,385 | 304,548 | ||||||
| Vaxcyte, Inc. (a) |
3,454 | 216,911 | ||||||
| Vertex Pharmaceuticals, Inc. (a) |
6,451 | 2,624,847 | ||||||
|
|
|
|||||||
| 14,865,640 | ||||||||
|
|
|
|||||||
| Broadline Retail—3.3% | ||||||||
| Amazon.com, Inc. (a) |
249,885 | 37,967,527 | ||||||
|
|
|
|||||||
| Building Products—0.7% | ||||||||
| Azek Co., Inc. (a) |
43,716 | 1,672,137 | ||||||
| Builders FirstSource, Inc. (a) |
21,766 | 3,633,616 | ||||||
| Building Products—(Continued) | ||||||||
| Johnson Controls International PLC |
17,803 | 1,026,165 | ||||||
| Trane Technologies PLC |
5,775 | 1,408,523 | ||||||
|
|
|
|||||||
| 7,740,441 | ||||||||
|
|
|
|||||||
| Capital Markets—2.6% | ||||||||
| Ares Management Corp. - Class A |
66,022 | 7,851,336 | ||||||
| Intercontinental Exchange, Inc. |
17,688 | 2,271,670 | ||||||
| KKR & Co., Inc. |
33,118 | 2,743,826 | ||||||
| Northern Trust Corp. |
52,748 | 4,450,876 | ||||||
| S&P Global, Inc. |
18,140 | 7,991,033 | ||||||
| Tradeweb Markets, Inc. - Class A |
50,417 | 4,581,897 | ||||||
|
|
|
|||||||
| 29,890,638 | ||||||||
|
|
|
|||||||
| Chemicals—1.5% | ||||||||
| Cabot Corp. |
37,486 | 3,130,081 | ||||||
| Celanese Corp. (b) |
15,611 | 2,425,481 | ||||||
| FMC Corp. |
32,495 | 2,048,810 | ||||||
| Ingevity Corp. (a) (b) |
16,872 | 796,696 | ||||||
| Linde PLC |
14,608 | 5,999,651 | ||||||
| Livent Corp. (a) (b) |
31,612 | 568,384 | ||||||
| PPG Industries, Inc. |
20,186 | 3,018,816 | ||||||
|
|
|
|||||||
| 17,987,919 | ||||||||
|
|
|
|||||||
| Commercial Services & Supplies—0.6% | ||||||||
| Clean Harbors, Inc. (a) |
21,230 | 3,704,847 | ||||||
| Veralto Corp. |
8,221 | 676,259 | ||||||
| Waste Connections, Inc. |
18,632 | 2,781,199 | ||||||
|
|
|
|||||||
| 7,162,305 | ||||||||
|
|
|
|||||||
| Construction & Engineering—0.1% | ||||||||
| Fluor Corp. (a) |
30,367 | 1,189,475 | ||||||
|
|
|
|||||||
| Consumer Staples Distribution & Retail—0.6% | ||||||||
| Performance Food Group Co. (a) |
98,655 | 6,821,993 | ||||||
|
|
|
|||||||
| Containers & Packaging—0.1% | ||||||||
| Ball Corp. (b) |
14,880 | 855,898 | ||||||
|
|
|
|||||||
| Electric Utilities—1.3% | ||||||||
| Edison International |
54,155 | 3,871,541 | ||||||
| Exelon Corp. |
72,812 | 2,613,951 | ||||||
| NextEra Energy, Inc. |
59,093 | 3,589,309 | ||||||
| PG&E Corp. (b) |
264,263 | 4,764,662 | ||||||
|
|
|
|||||||
| 14,839,463 | ||||||||
|
|
|
|||||||
| Energy Equipment & Services—0.3% | ||||||||
| Schlumberger NV (b) |
56,671 | 2,949,159 | ||||||
|
|
|
|||||||
| Entertainment—0.7% | ||||||||
| Netflix, Inc. (a) |
9,809 | 4,775,806 | ||||||
| Spotify Technology SA (a) |
18,068 | 3,395,158 | ||||||
|
|
|
|||||||
| 8,170,964 | ||||||||
|
|
|
|||||||
See accompanying notes to financial statements.
BHFTII-6
Brighthouse Funds Trust II
Brighthouse/Wellington Balanced Portfolio
Schedule of Investments as of December 31, 2023
Common Stocks—(Continued)
| Security Description | Shares | Value | ||||||
| Financial Services—3.1% | ||||||||
| Berkshire Hathaway, Inc. - Class B (a) |
42,078 | $ | 15,007,539 | |||||
| Block, Inc. (a) |
65,351 | 5,054,900 | ||||||
| FleetCor Technologies, Inc. (a) |
8,269 | 2,336,902 | ||||||
| Global Payments, Inc. |
32,487 | 4,125,849 | ||||||
| PayPal Holdings, Inc. (a) |
21,821 | 1,340,028 | ||||||
| Visa, Inc. - Class A (b) |
17,647 | 4,594,396 | ||||||
| WEX, Inc. (a) |
21,343 | 4,152,281 | ||||||
|
|
|
|||||||
| 36,611,895 | ||||||||
|
|
|
|||||||
| Gas Utilities—0.2% | ||||||||
| Atmos Energy Corp. (b) |
25,209 | 2,921,723 | ||||||
|
|
|
|||||||
| Ground Transportation—1.0% | ||||||||
| Knight-Swift Transportation Holdings, Inc. |
74,256 | 4,280,858 | ||||||
| Uber Technologies, Inc. (a) |
121,399 | 7,474,537 | ||||||
|
|
|
|||||||
| 11,755,395 | ||||||||
|
|
|
|||||||
| Health Care Equipment & Supplies—1.5% | ||||||||
| Abbott Laboratories |
34,886 | 3,839,902 | ||||||
| Boston Scientific Corp. (a) |
70,942 | 4,101,157 | ||||||
| DexCom, Inc. (a) |
23,339 | 2,896,137 | ||||||
| Edwards Lifesciences Corp. (a) |
38,112 | 2,906,040 | ||||||
| Insulet Corp. (a) (b) |
9,375 | 2,034,187 | ||||||
| Stryker Corp. |
5,240 | 1,569,170 | ||||||
|
|
|
|||||||
| 17,346,593 | ||||||||
|
|
|
|||||||
| Health Care Providers & Services—2.1% | ||||||||
| Agilon Health, Inc (a) (b) |
180,543 | 2,265,815 | ||||||
| Cencora, Inc. (b) |
21,288 | 4,372,129 | ||||||
| Centene Corp. (a) |
31,465 | 2,335,018 | ||||||
| Elevance Health, Inc. |
5,895 | 2,779,846 | ||||||
| HCA Healthcare, Inc. |
12,098 | 3,274,686 | ||||||
| Humana, Inc. |
6,728 | 3,080,146 | ||||||
| Molina Healthcare, Inc. (a) |
8,849 | 3,197,232 | ||||||
| UnitedHealth Group, Inc. |
6,308 | 3,320,973 | ||||||
|
|
|
|||||||
| 24,625,845 | ||||||||
|
|
|
|||||||
| Health Care REITs—0.2% | ||||||||
| Welltower, Inc. |
32,071 | 2,891,842 | ||||||
|
|
|
|||||||
| Hotel & Resort REITs—0.2% | ||||||||
| Ryman Hospitality Properties, Inc. (b) |
24,476 | 2,693,829 | ||||||
|
|
|
|||||||
| Hotels, Restaurants & Leisure—0.9% | ||||||||
| Chipotle Mexican Grill, Inc. (a) |
2,938 | 6,719,089 | ||||||
| Hyatt Hotels Corp. - Class A (b) |
25,405 | 3,313,066 | ||||||
|
|
|
|||||||
| 10,032,155 | ||||||||
|
|
|
|||||||
| Household Durables—0.4% | ||||||||
| Lennar Corp. - Class A |
23,304 | 3,473,228 | ||||||
| Skyline Champion Corp. (a) |
24,182 | 1,795,756 | ||||||
|
|
|
|||||||
| 5,268,984 | ||||||||
|
|
|
|||||||
| Industrial REITs—0.3% | ||||||||
| EastGroup Properties, Inc. |
20,294 | $ | 3,724,761 | |||||
|
|
|
|||||||
| Insurance—1.7% | ||||||||
| Arch Capital Group Ltd. (a) |
31,078 | 2,308,163 | ||||||
| Assured Guaranty Ltd. |
22,911 | 1,714,430 | ||||||
| Chubb Ltd. |
16,909 | 3,821,434 | ||||||
| Everest Group Ltd. |
8,467 | 2,993,762 | ||||||
| Marsh & McLennan Cos., Inc. |
11,072 | 2,097,812 | ||||||
| Progressive Corp. |
27,660 | 4,405,685 | ||||||
| Trupanion, Inc. (a) (b) |
71,619 | 2,185,095 | ||||||
|
|
|
|||||||
| 19,526,381 | ||||||||
|
|
|
|||||||
| Interactive Media & Services—3.5% | ||||||||
| Alphabet, Inc. - Class A (a) |
166,372 | 23,240,504 | ||||||
| Meta Platforms, Inc. - Class A (a) |
48,431 | 17,142,637 | ||||||
|
|
|
|||||||
| 40,383,141 | ||||||||
|
|
|
|||||||
| IT Services—0.2% | ||||||||
| Squarespace, Inc. - Class A (a) |
84,937 | 2,803,770 | ||||||
|
|
|
|||||||
| Life Sciences Tools & Services—1.2% | ||||||||
| Agilent Technologies, Inc. |
20,566 | 2,859,291 | ||||||
| Danaher Corp. |
23,500 | 5,436,490 | ||||||
| ICON PLC (a) |
12,851 | 3,637,732 | ||||||
| Illumina, Inc. (a) |
10,912 | 1,519,387 | ||||||
|
|
|
|||||||
| 13,452,900 | ||||||||
|
|
|
|||||||
| Machinery—0.7% | ||||||||
| Flowserve Corp. |
36,344 | 1,498,100 | ||||||
| Fortive Corp. |
38,538 | 2,837,553 | ||||||
| Ingersoll Rand, Inc. |
23,822 | 1,842,394 | ||||||
| Middleby Corp. (a) |
14,838 | 2,183,708 | ||||||
|
|
|
|||||||
| 8,361,755 | ||||||||
|
|
|
|||||||
| Media—0.4% | ||||||||
| New York Times Co. - Class A (b) |
39,088 | 1,914,921 | ||||||
| Omnicom Group, Inc. |
32,424 | 2,805,000 | ||||||
|
|
|
|||||||
| 4,719,921 | ||||||||
|
|
|
|||||||
| Oil, Gas & Consumable Fuels—2.6% | ||||||||
| BP PLC (ADR) |
220,117 | 7,792,142 | ||||||
| ConocoPhillips |
42,042 | 4,879,815 | ||||||
| EOG Resources, Inc. |
15,999 | 1,935,079 | ||||||
| EQT Corp. |
38,063 | 1,471,516 | ||||||
| Marathon Petroleum Corp. |
24,407 | 3,621,022 | ||||||
| Shell PLC (ADR) |
125,464 | 8,255,531 | ||||||
| Targa Resources Corp. |
24,600 | 2,137,002 | ||||||
|
|
|
|||||||
| 30,092,107 | ||||||||
|
|
|
|||||||
| Passenger Airlines—0.3% | ||||||||
| Delta Air Lines, Inc. |
76,423 | 3,074,497 | ||||||
|
|
|
|||||||
| Personal Care Products—0.5% | ||||||||
| Haleon PLC (ADR) (b) |
705,353 | 5,805,055 | ||||||
|
|
|
|||||||
See accompanying notes to financial statements.
BHFTII-7
Brighthouse Funds Trust II
Brighthouse/Wellington Balanced Portfolio
Schedule of Investments as of December 31, 2023
Common Stocks—(Continued)
| Security Description |
Shares | Value | ||||||
| Pharmaceuticals—2.8% | ||||||||
| AstraZeneca PLC (ADR) |
65,748 | $ | 4,428,128 | |||||
| Elanco Animal Health, Inc. (a) |
52,901 | 788,225 | ||||||
| Eli Lilly & Co. |
19,978 | 11,645,576 | ||||||
| GSK PLC (ADR) (b) |
48,658 | 1,803,265 | ||||||
| Merck & Co., Inc. |
65,575 | 7,148,986 | ||||||
| Novartis AG (ADR) |
21,678 | 2,188,828 | ||||||
| Pfizer, Inc. |
54,434 | 1,567,155 | ||||||
| Structure Therapeutics, Inc. (ADR) (a) (b) |
6,564 | 267,549 | ||||||
| Zoetis, Inc. |
11,538 | 2,277,255 | ||||||
|
|
|
|||||||
| 32,114,967 | ||||||||
|
|
|
|||||||
| Professional Services—0.5% | ||||||||
| Ceridian HCM Holding, Inc. (a) (b) |
41,135 | 2,760,981 | ||||||
| Science Applications International Corp. |
22,761 | 2,829,648 | ||||||
|
|
|
|||||||
| 5,590,629 | ||||||||
|
|
|
|||||||
| Real Estate Management & Development—0.1% | ||||||||
| CoStar Group, Inc. (a) (b) |
10,614 | 927,558 | ||||||
|
|
|
|||||||
| Semiconductors & Semiconductor Equipment—4.0% | ||||||||
| Advanced Micro Devices, Inc. (a) |
79,470 | 11,714,673 | ||||||
| First Solar, Inc. (a) |
7,590 | 1,307,605 | ||||||
| KLA Corp. |
8,299 | 4,824,209 | ||||||
| Marvell Technology, Inc. |
48,491 | 2,924,492 | ||||||
| Micron Technology, Inc. |
69,585 | 5,938,384 | ||||||
| NVIDIA Corp. |
17,635 | 8,733,205 | ||||||
| ON Semiconductor Corp. (a) |
35,000 | 2,923,550 | ||||||
| Texas Instruments, Inc. |
45,288 | 7,719,792 | ||||||
|
|
|
|||||||
| 46,085,910 | ||||||||
|
|
|
|||||||
| Software—9.0% | ||||||||
| Adobe, Inc. (a) |
20,179 | 12,038,791 | ||||||
| HubSpot, Inc. (a) |
9,204 | 5,343,290 | ||||||
| Intuit, Inc. |
17,000 | 10,625,510 | ||||||
| Microsoft Corp. |
164,687 | 61,928,900 | ||||||
| ServiceNow, Inc. (a) |
13,370 | 9,445,771 | ||||||
| Synopsys, Inc. (a) |
10,466 | 5,389,048 | ||||||
|
|
|
|||||||
| 104,771,310 | ||||||||
|
|
|
|||||||
| Specialized REITs—0.2% | ||||||||
| Extra Space Storage, Inc. |
15,618 | 2,504,034 | ||||||
|
|
|
|||||||
| Specialty Retail—1.3% | ||||||||
| AutoZone, Inc. (a) |
2,091 | 5,406,511 | ||||||
| TJX Cos., Inc. |
107,040 | 10,041,422 | ||||||
|
|
|
|||||||
| 15,447,933 | ||||||||
|
|
|
|||||||
| Technology Hardware, Storage & Peripherals—3.1% | ||||||||
| Apple, Inc. |
187,359 | 36,072,228 | ||||||
|
|
|
|||||||
| Tobacco—0.9% | ||||||||
| Philip Morris International, Inc. |
105,508 | 9,926,193 | ||||||
|
|
|
|||||||
| Trading Companies & Distributors—0.1% | ||||||||
| AerCap Holdings NV (a) |
18,046 | 1,341,179 | ||||||
|
|
|
|||||||
| Wireless Telecommunication Services—0.5% | ||||||||
| T-Mobile U.S., Inc. |
37,715 | 6,046,846 | ||||||
|
|
|
|||||||
| Total Common Stocks |
706,136,971 | |||||||
|
|
|
|||||||
| U.S. Treasury & Government Agencies—24.2% |
| |||||||
| Agency Sponsored Mortgage - Backed—18.6% | ||||||||
| Federal Home Loan Mortgage Corp. | ||||||||
| 2.000%, 05/01/36 |
363,521 | 327,937 | ||||||
| 2.000%, 06/01/36 |
127,505 | 115,022 | ||||||
| 2.000%, 12/01/40 |
72,365 | 62,285 | ||||||
| 2.000%, 05/01/41 |
473,726 | 405,972 | ||||||
| 2.000%, 12/01/41 |
508,554 | 434,547 | ||||||
| 2.000%, 09/01/50 |
220,233 | 182,206 | ||||||
| 2.000%, 10/01/50 |
424,997 | 349,398 | ||||||
| 2.000%, 02/01/51 |
644,617 | 532,740 | ||||||
| 2.000%, 03/01/51 |
2,044,333 | 1,681,700 | ||||||
| 2.000%, 04/01/51 |
736,532 | 604,322 | ||||||
| 2.000%, 05/01/51 |
405,082 | 336,810 | ||||||
| 2.000%, 08/01/51 |
167,823 | 137,438 | ||||||
| 2.000%, 11/01/51 |
169,626 | 139,922 | ||||||
| 2.000%, 04/01/52 |
664,564 | 551,059 | ||||||
| 2.500%, 05/01/50 |
221,438 | 191,522 | ||||||
| 2.500%, 06/01/50 |
279,607 | 240,485 | ||||||
| 2.500%, 07/01/50 |
1,589,481 | 1,364,715 | ||||||
| 2.500%, 09/01/50 |
436,610 | 375,699 | ||||||
| 2.500%, 11/01/50 |
492,430 | 421,540 | ||||||
| 2.500%, 02/01/51 |
149,485 | 129,351 | ||||||
| 2.500%, 03/01/51 |
373,490 | 319,741 | ||||||
| 2.500%, 05/01/51 |
186,984 | 159,849 | ||||||
| 2.500%, 07/01/51 |
192,574 | 164,986 | ||||||
| 2.500%, 08/01/51 |
153,525 | 131,243 | ||||||
| 2.500%, 10/01/51 |
290,237 | 248,148 | ||||||
| 2.500%, 04/01/52 |
926,044 | 788,342 | ||||||
| 3.000%, 07/01/28 |
141,954 | 137,414 | ||||||
| 3.000%, 08/01/29 |
87,486 | 84,516 | ||||||
| 3.000%, 10/01/32 |
189,433 | 180,974 | ||||||
| 3.000%, 04/01/33 |
192,470 | 182,747 | ||||||
| 3.000%, 11/01/36 |
378,078 | 352,357 | ||||||
| 3.000%, 01/01/37 |
244,571 | 227,943 | ||||||
| 3.000%, 12/01/44 |
4,712 | 4,313 | ||||||
| 3.000%, 08/01/46 |
414,907 | 378,248 | ||||||
| 3.000%, 10/01/46 |
422,773 | 384,474 | ||||||
| 3.000%, 11/01/46 |
941,210 | 856,440 | ||||||
| 3.000%, 12/01/46 |
272,793 | 248,109 | ||||||
| 3.000%, 01/01/47 |
260,307 | 236,180 | ||||||
| 3.000%, 07/01/50 |
194,398 | 173,276 | ||||||
| 3.000%, 08/01/51 |
73,842 | 65,920 | ||||||
| 3.000%, 05/01/52 |
279,799 | 249,481 | ||||||
| 3.500%, 08/01/34 |
202,985 | 195,043 | ||||||
| 3.500%, 08/01/42 |
52,137 | 49,396 | ||||||
See accompanying notes to financial statements.
BHFTII-8
Brighthouse Funds Trust II
Brighthouse/Wellington Balanced Portfolio
Schedule of Investments as of December 31, 2023
U.S. Treasury & Government Agencies—(Continued)
| Security Description | Principal Amount* |
Value | ||||||
| Agency Sponsored Mortgage - Backed—(Continued) | ||||||||
| Federal Home Loan Mortgage Corp. | ||||||||
| 3.500%, 11/01/42 |
66,263 | $ | 62,707 | |||||
| 3.500%, 06/01/46 |
68,373 | 63,898 | ||||||
| 3.500%, 10/01/47 |
256,541 | 239,743 | ||||||
| 3.500%, 12/01/47 |
101,034 | 94,285 | ||||||
| 3.500%, 03/01/48 |
239,338 | 224,823 | ||||||
| 3.500%, 12/01/48 |
155,675 | 145,277 | ||||||
| 4.000%, 05/01/42 |
216,971 | 211,797 | ||||||
| 4.000%, 08/01/42 |
64,090 | 62,429 | ||||||
| 4.000%, 09/01/42 |
96,401 | 93,903 | ||||||
| 4.000%, 07/01/44 |
4,533 | 4,437 | ||||||
| 4.000%, 02/01/46 |
77,103 | 74,436 | ||||||
| 4.000%, 04/01/47 |
35,475 | 34,405 | ||||||
| 4.000%, 09/01/48 |
33,507 | 32,319 | ||||||
| 4.000%, 04/01/49 |
644,798 | 619,066 | ||||||
| 4.000%, 05/01/49 |
128,822 | 124,191 | ||||||
| 4.000%, 07/01/49 |
483,450 | 467,233 | ||||||
| 4.400%, 1Y RFUCCT + 1.900%, 02/01/41 (c) |
4,002 | 3,987 | ||||||
| 4.500%, 09/01/43 |
35,382 | 35,112 | ||||||
| 4.500%, 11/01/43 |
310,413 | 308,537 | ||||||
| 5.000%, 05/01/39 |
2,625 | 2,657 | ||||||
| 5.000%, 06/01/41 |
187,419 | 190,501 | ||||||
| 5.000%, 09/01/52 |
5,054,021 | 5,004,356 | ||||||
| 5.000%, 11/01/52 |
323,998 | 321,261 | ||||||
| 5.000%, 12/01/52 |
351,187 | 347,562 | ||||||
| 5.000%, 01/01/53 |
3,370,129 | 3,335,344 | ||||||
| 5.000%, 04/01/53 |
1,433,826 | 1,420,225 | ||||||
| 5.500%, 07/01/33 |
37,854 | 38,957 | ||||||
| 5.500%, 04/01/39 |
16,966 | 17,496 | ||||||
| 5.500%, 06/01/41 |
61,921 | 63,857 | ||||||
| 5.500%, 02/01/53 |
559,807 | 564,318 | ||||||
| 6.000%, 12/01/52 |
358,343 | 368,613 | ||||||
| 6.000%, 03/01/53 |
190,923 | 196,288 | ||||||
| 6.500%, 11/01/53 |
404,262 | 416,162 | ||||||
| Federal Home Loan Mortgage Corp. Multifamily Structured Pass-Through
Certificates |
3,967,562 | 63,712 | ||||||
| 0.631%, 10/25/26 (c) (d) |
1,121,606 | 15,152 | ||||||
| 0.745%, 06/25/27 (c) (d) |
2,369,491 | 49,821 | ||||||
| 0.879%, 11/25/30 (c) (d) |
957,130 | 45,186 | ||||||
| 1.022%, 10/25/30 (c) (d) |
1,648,362 | 87,926 | ||||||
| 1.115%, 06/25/30 (c) (d) |
3,030,480 | 174,770 | ||||||
| 1.124%, 01/25/30 (c) (d) |
2,467,287 | 131,542 | ||||||
| 1.433%, 05/25/30 (c) (d) |
2,350,653 | 171,778 | ||||||
| 1.570%, 05/25/30 (c) (d) |
1,479,343 | 115,320 | ||||||
| Federal Home Loan Mortgage Corp. REMICS | ||||||||
| Zero Coupon, 11/15/36 (e) |
8,669 | 7,062 | ||||||
| 1.000%, 02/25/51 |
530,803 | 444,799 | ||||||
| 1.750%, 10/15/42 |
134,170 | 115,235 | ||||||
| 2.000%, 07/25/50 |
143,226 | 122,200 | ||||||
| 2.500%, 05/15/28 (d) |
40,834 | 1,500 | ||||||
| 2.500%, 06/25/50 (d) |
728,708 | 104,424 | ||||||
| 2.500%, 03/25/52 |
466,327 | 413,432 | ||||||
| 3.000%, 03/15/28 (d) |
80,833 | 3,356 | ||||||
| 3.000%, 05/15/32 (d) |
30,900 | 602 | ||||||
| 3.000%, 03/15/33 (d) |
61,731 | 5,102 | ||||||
| Agency Sponsored Mortgage - Backed—(Continued) | ||||||||
| Federal Home Loan Mortgage Corp. REMICS | ||||||||
| 3.000%, 03/25/40 |
500,000 | 435,238 | ||||||
| 3.000%, 05/15/46 |
239,685 | 221,354 | ||||||
| 3.000%, 09/25/51 (d) |
702,987 | 113,213 | ||||||
| 3.250%, 11/15/41 |
81,549 | 75,388 | ||||||
| 3.500%, 09/15/26 (d) |
15,051 | 446 | ||||||
| 3.500%, 03/15/27 (d) |
13,822 | 312 | ||||||
| 3.500%, 03/15/41 (d) |
43,869 | 1,345 | ||||||
| 3.500%, 10/15/45 |
99,774 | 90,964 | ||||||
| 3.500%, 12/15/46 |
265,410 | 239,524 | ||||||
| 4.000%, 07/15/27 (d) |
39,189 | 775 | ||||||
| 4.000%, 03/15/28 (d) |
29,667 | 773 | ||||||
| 4.000%, 06/15/28 (d) |
18,215 | 537 | ||||||
| 4.000%, 07/15/30 (d) |
65,708 | 4,484 | ||||||
| 4.000%, 05/25/40 (d) |
302,191 | 45,226 | ||||||
| 4.000%, 09/15/41 |
321,500 | 307,966 | ||||||
| 4.750%, 07/15/39 |
186,590 | 182,922 | ||||||
| 5.000%, 09/15/33 (d) |
78,877 | 11,230 | ||||||
| 5.000%, 02/15/48 (d) |
115,844 | 22,869 | ||||||
| 5.500%, 08/15/33 |
19,771 | 20,033 | ||||||
| 5.500%, 07/15/36 |
44,257 | 45,173 | ||||||
| 5.500%, 06/15/46 |
63,879 | 65,227 | ||||||
| 6.500%, 07/15/36 |
50,218 | 51,225 | ||||||
| 6.500%, 04/15/39 (d) |
269,887 | 50,774 | ||||||
| Federal Home Loan Mortgage Corp. STACR REMICS Trust |
359,000 | 368,614 | ||||||
| 8.587%, SOFR30A + 3.250%, 04/25/43 (144A) (c) |
325,000 | 338,271 | ||||||
| 8.687%, SOFR30A + 3.350%, 05/25/42 (144A) (c) |
495,000 | 514,720 | ||||||
| 8.687%, SOFR30A + 3.350%, 06/25/43 (144A) (c) |
1,105,000 | 1,166,213 | ||||||
| 8.837%, SOFR30A + 3.500%, 03/25/42 (144A) (c) |
115,000 | 119,073 | ||||||
| 8.837%, SOFR30A + 3.500%, 05/25/43 (144A) (c) |
945,000 | 998,669 | ||||||
| 8.887%, SOFR30A + 3.550%, 08/25/42 (144A) (c) |
155,000 | 160,252 | ||||||
| 9.037%, SOFR30A + 3.700%, 09/25/42 (144A) (c) |
425,000 | 447,067 | ||||||
| 9.337%, SOFR30A + 4.000%, 07/25/42 (144A) (c) |
380,000 | 398,352 | ||||||
| 9.837%, SOFR30A + 4.500%, 06/25/42 (144A) (c) |
600,000 | 646,038 | ||||||
| Federal Home Loan Mortgage Corp. STRIPS |
2,301,126 | 133,658 | ||||||
| 2.000%, 06/15/52 (d) |
963,136 | 118,404 | ||||||
| 2.500%, 03/15/52 (d) |
743,418 | 104,767 | ||||||
| Federal National Mortgage Association | ||||||||
| 1.500%, 09/01/51 |
1,951,174 | 1,520,848 | ||||||
| 2.000%, 05/01/36 |
413,291 | 372,832 | ||||||
| 2.000%, 06/01/36 |
587,320 | 529,828 | ||||||
| 2.000%, 08/01/36 |
478,067 | 431,261 | ||||||
| 2.000%, 09/01/36 |
279,116 | 251,787 | ||||||
| 2.000%, 12/01/36 |
221,434 | 199,750 | ||||||
| 2.000%, 09/01/40 |
286,756 | 246,861 | ||||||
| 2.000%, 12/01/40 |
1,036,096 | 891,924 | ||||||
| 2.000%, 04/01/41 |
311,081 | 266,930 | ||||||
| 2.000%, 05/01/41 |
99,936 | 85,654 | ||||||
| 2.000%, 10/01/41 |
377,542 | 322,880 | ||||||
| 2.000%, 02/01/42 |
238,146 | 205,008 | ||||||
| 2.000%, 08/01/50 |
217,264 | 178,772 | ||||||
| 2.000%, 12/01/50 |
592,798 | 487,783 | ||||||
See accompanying notes to financial statements.
BHFTII-9
Brighthouse Funds Trust II
Brighthouse/Wellington Balanced Portfolio
Schedule of Investments as of December 31, 2023
U.S. Treasury & Government Agencies—(Continued)
| Security Description | Principal Amount* |
Value | ||||||
| Agency Sponsored Mortgage - Backed—(Continued) | ||||||||
| Federal National Mortgage Association | ||||||||
| 2.000%, 01/01/51 |
338,066 | $ | 284,559 | |||||
| 2.000%, 02/01/51 |
1,983,025 | 1,627,430 | ||||||
| 2.000%, 03/01/51 |
3,314,051 | 2,720,513 | ||||||
| 2.000%, 04/01/51 |
3,523,838 | 2,892,670 | ||||||
| 2.000%, 05/01/51 |
1,226,065 | 1,005,442 | ||||||
| 2.000%, 07/01/51 |
548,296 | 449,298 | ||||||
| 2.250%, 04/01/33 |
200,057 | 167,350 | ||||||
| 2.500%, 06/01/40 |
649,483 | 578,849 | ||||||
| 2.500%, 04/01/50 |
245,846 | 210,871 | ||||||
| 2.500%, 06/01/50 |
275,857 | 236,700 | ||||||
| 2.500%, 07/01/50 |
48,080 | 41,180 | ||||||
| 2.500%, 09/01/50 |
436,203 | 373,744 | ||||||
| 2.500%, 10/01/50 |
736,485 | 636,396 | ||||||
| 2.500%, 01/01/51 |
313,215 | 269,886 | ||||||
| 2.500%, 05/01/51 |
5,270,279 | 4,519,695 | ||||||
| 2.500%, 06/01/51 |
618,700 | 526,751 | ||||||
| 2.500%, 07/01/51 |
362,544 | 310,401 | ||||||
| 2.500%, 08/01/51 |
196,860 | 170,502 | ||||||
| 2.500%, 09/01/51 |
238,180 | 203,659 | ||||||
| 2.500%, 10/01/51 |
1,685,378 | 1,439,872 | ||||||
| 2.500%, 11/01/51 |
3,372,394 | 2,903,631 | ||||||
| 2.500%, 12/01/51 |
420,720 | 361,741 | ||||||
| 2.500%, 01/01/52 |
414,868 | 356,992 | ||||||
| 2.500%, 03/01/52 |
618,649 | 528,285 | ||||||
| 2.500%, 04/01/52 |
420,236 | 359,256 | ||||||
| 2.500%, 01/01/57 |
537,143 | 456,789 | ||||||
| 3.000%, 07/01/28 |
312,030 | 301,956 | ||||||
| 3.000%, 02/01/31 |
47,696 | 45,851 | ||||||
| 3.000%, 08/01/33 |
133,477 | 127,469 | ||||||
| 3.000%, 03/01/37 |
288,982 | 268,928 | ||||||
| 3.000%, 02/01/43 |
326,613 | 300,183 | ||||||
| 3.000%, 03/01/43 |
413,040 | 379,684 | ||||||
| 3.000%, 04/01/43 |
398,452 | 366,296 | ||||||
| 3.000%, 05/01/43 |
1,043,838 | 959,362 | ||||||
| 3.000%, 06/01/43 |
134,025 | 123,168 | ||||||
| 3.000%, 12/01/49 |
45,090 | 40,395 | ||||||
| 3.000%, 02/01/50 |
191,245 | 172,200 | ||||||
| 3.000%, 08/01/50 |
677,569 | 606,200 | ||||||
| 3.000%, 10/01/50 |
276,758 | 247,079 | ||||||
| 3.000%, 12/01/50 |
377,503 | 337,022 | ||||||
| 3.000%, 04/01/51 |
143,178 | 127,736 | ||||||
| 3.000%, 05/01/51 |
361,273 | 325,523 | ||||||
| 3.000%, 06/01/51 |
77,090 | 68,323 | ||||||
| 3.000%, 07/01/51 |
94,718 | 84,059 | ||||||
| 3.000%, 08/01/51 |
180,906 | 161,407 | ||||||
| 3.000%, 10/01/51 |
217,253 | 192,988 | ||||||
| 3.000%, 11/01/51 |
952,833 | 843,742 | ||||||
| 3.000%, 12/01/51 |
530,412 | 473,192 | ||||||
| 3.000%, 01/01/52 |
246,873 | 219,338 | ||||||
| 3.000%, 04/01/52 |
251,326 | 224,801 | ||||||
| 3.000%, 05/01/52 |
370,039 | 330,164 | ||||||
| 3.500%, 03/01/43 |
13,725 | 12,973 | ||||||
| 3.500%, 05/01/43 |
31,521 | 29,651 | ||||||
| 3.500%, 07/01/43 |
74,200 | 69,926 | ||||||
| 3.500%, 08/01/43 |
105,613 | 99,694 | ||||||
| Agency Sponsored Mortgage - Backed—(Continued) | ||||||||
| Federal National Mortgage Association | ||||||||
| 3.500%, 10/01/44 |
121,743 | 113,867 | ||||||
| 3.500%, 02/01/45 |
126,718 | 118,265 | ||||||
| 3.500%, 01/01/46 |
141,257 | 131,849 | ||||||
| 3.500%, 03/01/46 |
105,766 | 98,711 | ||||||
| 3.500%, 09/01/46 |
199,071 | 185,935 | ||||||
| 3.500%, 10/01/46 |
85,899 | 80,167 | ||||||
| 3.500%, 11/01/46 |
92,745 | 87,037 | ||||||
| 3.500%, 12/01/46 |
518,344 | 489,546 | ||||||
| 3.500%, 05/01/47 |
179,336 | 167,371 | ||||||
| 3.500%, 09/01/47 |
389,209 | 363,661 | ||||||
| 3.500%, 12/01/47 |
53,393 | 50,139 | ||||||
| 3.500%, 01/01/48 |
220,085 | 205,395 | ||||||
| 3.500%, 02/01/48 |
254,369 | 237,947 | ||||||
| 3.500%, 07/01/48 |
279,919 | 261,241 | ||||||
| 3.500%, 11/01/48 |
59,068 | 55,125 | ||||||
| 3.500%, 04/01/52 |
604,215 | 557,521 | ||||||
| 3.500%, 09/01/57 |
935,328 | 848,467 | ||||||
| 3.500%, 05/01/58 |
542,154 | 491,806 | ||||||
| 3.520%, 11/01/32 |
380,000 | 353,325 | ||||||
| 4.000%, 04/01/26 |
4,088 | 4,013 | ||||||
| 4.000%, 02/01/29 |
67,784 | 66,896 | ||||||
| 4.000%, 10/01/40 |
262,747 | 256,181 | ||||||
| 4.000%, 11/01/40 |
99,292 | 96,796 | ||||||
| 4.000%, 12/01/40 |
72,796 | 70,991 | ||||||
| 4.000%, 02/01/41 |
35,523 | 34,629 | ||||||
| 4.000%, 03/01/41 |
97,594 | 95,053 | ||||||
| 4.000%, 06/01/41 |
305,531 | 300,979 | ||||||
| 4.000%, 08/01/42 |
51,474 | 50,070 | ||||||
| 4.000%, 09/01/42 |
97,847 | 95,178 | ||||||
| 4.000%, 03/01/45 |
10,764 | 10,377 | ||||||
| 4.000%, 07/01/45 |
80,284 | 77,426 | ||||||
| 4.000%, 03/01/46 |
73,800 | 71,307 | ||||||
| 4.000%, 05/01/46 |
22,472 | 21,664 | ||||||
| 4.000%, 06/01/46 |
98,282 | 94,718 | ||||||
| 4.000%, 04/01/47 |
107,614 | 103,783 | ||||||
| 4.000%, 10/01/47 |
386,800 | 372,899 | ||||||
| 4.000%, 06/01/48 |
755,584 | 728,471 | ||||||
| 4.000%, 09/01/48 |
130,168 | 125,193 | ||||||
| 4.000%, 01/01/49 |
434,847 | 419,131 | ||||||
| 4.000%, 04/01/49 |
857,697 | 819,033 | ||||||
| 4.000%, 08/01/49 |
32,795 | 31,711 | ||||||
| 4.000%, 04/01/50 |
589,411 | 566,764 | ||||||
| 4.000%, 08/01/51 |
95,793 | 93,179 | ||||||
| 4.000%, 06/01/52 |
367,404 | 348,958 | ||||||
| 4.030%, 06/01/28 |
290,823 | 286,769 | ||||||
| 4.190%, 04/01/28 |
375,000 | 371,792 | ||||||
| 4.250%, 1Y RFUCCT + 1.750%, 03/01/41 (c) |
3,751 | 3,745 | ||||||
| 4.370%, 05/01/28 |
142,918 | 143,247 | ||||||
| 4.410%, 04/01/30 |
290,000 | 288,985 | ||||||
| 4.460%, 05/01/28 |
333,325 | 333,977 | ||||||
| 4.500%, 06/01/24 |
1,392 | 1,385 | ||||||
| 4.500%, 02/01/25 |
1,274 | 1,267 | ||||||
| 4.500%, 04/01/25 |
459 | 456 | ||||||
| 4.500%, 07/01/25 |
957 | 951 | ||||||
| 4.500%, 06/01/26 |
42,351 | 42,116 | ||||||
See accompanying notes to financial statements.
BHFTII-10
Brighthouse Funds Trust II
Brighthouse/Wellington Balanced Portfolio
Schedule of Investments as of December 31, 2023
U.S. Treasury & Government Agencies—(Continued)
| Security Description | Principal Amount* |
Value | ||||||
| Agency Sponsored Mortgage - Backed—(Continued) | ||||||||
| Federal National Mortgage Association | ||||||||
| 4.500%, 12/01/37 |
270,356 | $ | 270,765 | |||||
| 4.500%, 10/01/40 |
202,929 | 202,667 | ||||||
| 4.500%, 09/01/41 |
22,240 | 22,211 | ||||||
| 4.500%, 10/01/41 |
98,570 | 98,443 | ||||||
| 4.500%, 08/01/42 |
32,226 | 32,184 | ||||||
| 4.500%, 09/01/43 |
452,737 | 448,750 | ||||||
| 4.500%, 10/01/43 |
81,337 | 80,355 | ||||||
| 4.500%, 12/01/43 |
62,482 | 62,016 | ||||||
| 4.500%, 01/01/44 |
159,793 | 158,529 | ||||||
| 4.500%, 04/01/49 |
128,226 | 126,318 | ||||||
| 4.500%, 01/01/51 |
578,118 | 570,230 | ||||||
| 4.510%, 05/01/33 |
189,536 | 189,255 | ||||||
| 4.640%, 10/01/33 |
180,937 | 182,596 | ||||||
| 4.750%, 04/01/28 |
95,000 | 96,347 | ||||||
| 5.000%, 07/01/41 |
16,190 | 16,433 | ||||||
| 5.000%, 08/01/41 |
7,385 | 7,505 | ||||||
| 5.000%, 09/01/52 |
4,712,067 | 4,663,460 | ||||||
| 5.000%, 10/01/52 |
2,189,550 | 2,170,336 | ||||||
| 5.000%, 11/01/52 |
1,398,581 | 1,385,403 | ||||||
| 5.000%, 04/01/53 |
1,072,139 | 1,060,811 | ||||||
| 5.065%, 12/01/28 |
490,000 | 505,679 | ||||||
| 5.078%, 1Y RFUCCT + 1.775%, 06/01/41 (c) |
18,751 | 18,812 | ||||||
| 5.500%, 08/01/28 |
12,371 | 12,605 | ||||||
| 5.500%, 04/01/33 |
15,826 | 16,297 | ||||||
| 5.500%, 08/01/37 |
92,081 | 94,823 | ||||||
| 5.500%, 04/01/41 |
7,439 | 7,661 | ||||||
| 5.500%, 10/01/52 |
354,383 | 357,236 | ||||||
| 5.500%, 11/01/52 |
645,032 | 649,428 | ||||||
| 5.500%, 12/01/52 |
1,128,324 | 1,136,072 | ||||||
| 5.500%, 06/01/53 |
572,634 | 575,701 | ||||||
| 5.831%, 1Y RFUCCT + 1.822%, 09/01/41 (c) |
21,852 | 22,496 | ||||||
| 6.000%, 03/01/28 |
356 | 366 | ||||||
| 6.000%, 02/01/34 |
63,965 | 66,461 | ||||||
| 6.000%, 08/01/34 |
33,398 | 34,788 | ||||||
| 6.000%, 04/01/35 |
283,385 | 294,131 | ||||||
| 6.000%, 02/01/38 |
17,456 | 18,226 | ||||||
| 6.000%, 03/01/38 |
8,365 | 8,737 | ||||||
| 6.000%, 05/01/38 |
22,639 | 23,643 | ||||||
| 6.000%, 10/01/38 |
6,259 | 6,536 | ||||||
| 6.000%, 12/01/38 |
9,544 | 9,970 | ||||||
| 6.000%, 05/01/53 |
380,860 | 392,432 | ||||||
| 6.005%, 1Y RFUCCT + 1.755%, 12/01/40 (c) |
1,141 | 1,140 | ||||||
| 6.500%, 05/01/40 |
160,535 | 167,751 | ||||||
| 6.500%, 11/01/53 |
691,722 | 712,083 | ||||||
| Federal National Mortgage Association Connecticut Avenue Securities |
90,386 | 91,169 | ||||||
| 7.887%, SOFR30A + 2.550%, 07/25/42 (144A) (c) |
147,062 | 150,825 | ||||||
| 8.037%, SOFR30A + 2.700%, 07/25/43 (144A) (c) |
595,000 | 606,306 | ||||||
| 8.437%, SOFR30A + 3.100%, 06/25/43 (144A) (c) |
310,000 | 323,723 | ||||||
| 9.002%, SOFR30A + 3.664%, 07/25/29 (c) |
138,912 | 143,810 | ||||||
| 9.802%, SOFR30A + 4.464%, 05/25/29 (c) |
239,309 | 252,423 | ||||||
| Federal National Mortgage Association Interest STRIPS | ||||||||
| 2.000%, 09/25/39 |
130,620 | 114,654 | ||||||
| 2.000%, 03/25/52 (d) |
897,444 | 112,710 | ||||||
| Agency Sponsored Mortgage - Backed—(Continued) | ||||||||
| Federal National Mortgage Association Interest STRIPS | ||||||||
| 2.500%, 06/25/52 (d) |
783,824 | 117,238 | ||||||
| 2.500%, 09/25/52 (d) |
574,030 | 87,728 | ||||||
| 4.000%, 05/25/27 (d) |
31,317 | 840 | ||||||
| Federal National Mortgage Association REMICS |
||||||||
| Zero Coupon, 03/25/36 (e) |
9,686 | 8,342 | ||||||
| Zero Coupon, 06/25/36 (e) |
83,682 | 72,954 | ||||||
| Zero Coupon, 06/25/41 (e) |
83,113 | 63,125 | ||||||
| 1.477%, 05/25/46 (c) (d) |
195,842 | 10,889 | ||||||
| 1.700%, 04/25/55 (c) (d) |
209,375 | 10,501 | ||||||
| 1.750%, 12/25/42 |
223,631 | 195,773 | ||||||
| 2.007%, 06/25/55 (c) (d) |
150,564 | 8,867 | ||||||
| 2.029%, 08/25/44 (c) (d) |
153,504 | 6,699 | ||||||
| 2.500%, 06/25/28 (d) |
34,903 | 1,257 | ||||||
| 2.500%, 02/25/51 (d) |
749,414 | 120,449 | ||||||
| 3.000%, 02/25/27 (d) |
28,611 | 336 | ||||||
| 3.000%, 09/25/27 (d) |
28,130 | 963 | ||||||
| 3.000%, 01/25/28 (d) |
160,490 | 5,225 | ||||||
| 3.000%, 03/25/43 |
418,358 | 371,882 | ||||||
| 3.000%, 04/25/43 |
446,190 | 403,838 | ||||||
| 3.000%, 08/25/49 |
275,210 | 249,027 | ||||||
| 3.500%, 05/25/27 (d) |
73,331 | 2,571 | ||||||
| 3.500%, 10/25/27 (d) |
49,955 | 2,057 | ||||||
| 3.500%, 05/25/30 (d) |
72,575 | 4,456 | ||||||
| 3.500%, 08/25/30 (d) |
20,712 | 1,022 | ||||||
| 3.500%, 02/25/31 (d) |
24,849 | 652 | ||||||
| 3.500%, 03/25/34 (d) |
778,311 | 37,390 | ||||||
| 3.500%, 09/25/35 (d) |
62,598 | 5,923 | ||||||
| 3.500%, 11/25/39 (d) |
459,119 | 40,786 | ||||||
| 3.500%, 01/25/42 |
416,000 | 382,937 | ||||||
| 3.500%, 11/25/42 |
539,241 | 499,208 | ||||||
| 3.500%, 04/25/46 |
171,930 | 144,684 | ||||||
| 3.500%, 10/25/46 (d) |
71,197 | 12,413 | ||||||
| 3.500%, 12/25/58 |
530,916 | 483,079 | ||||||
| 4.000%, 03/25/42 (d) |
36,585 | 4,350 | ||||||
| 4.000%, 11/25/42 (d) |
22,374 | 2,191 | ||||||
| 4.500%, 07/25/27 (d) |
7,572 | 101 | ||||||
| 5.000%, 12/25/43 (d) |
279,796 | 55,650 | ||||||
| 5.000%, 06/25/48 (d) |
313,335 | 50,936 | ||||||
| 5.500%, 04/25/35 |
162,049 | 167,489 | ||||||
| 5.500%, 04/25/37 |
45,106 | 46,160 | ||||||
| 5.500%, 11/25/40 (d) |
292,091 | 36,458 | ||||||
| 5.500%, 09/25/44 (d) |
206,691 | 40,514 | ||||||
| 5.500%, 06/25/48 (d) |
225,990 | 42,232 | ||||||
| 5.540%, 05/25/42 (c) (d) |
5,543 | 395 | ||||||
| 6.000%, 01/25/42 (d) |
162,144 | 13,344 | ||||||
| Federal National Mortgage Association-Aces |
1,780,890 | 21,013 | ||||||
| 1.162%, 06/25/34 (c) (d) |
3,813,301 | 210,261 | ||||||
| 1.410%, 05/25/29 (c) (d) |
1,827,747 | 85,843 | ||||||
| Government National Mortgage Association | ||||||||
| 0.641%, 02/16/53 (c) (d) |
748,435 | 11,750 | ||||||
| 2.000%, 10/20/50 |
658,002 | 557,164 | ||||||
| 2.000%, 12/20/50 |
1,093,640 | 926,034 | ||||||
| 2.500%, 11/20/49 |
502,890 | 441,799 | ||||||
| 2.500%, 03/20/51 |
397,643 | 347,743 | ||||||
See accompanying notes to financial statements.
BHFTII-11
Brighthouse Funds Trust II
Brighthouse/Wellington Balanced Portfolio
Schedule of Investments as of December 31, 2023
U.S. Treasury & Government Agencies—(Continued)
| Security Description | Principal Amount* |
Value | ||||||
| Agency Sponsored Mortgage - Backed—(Continued) | ||||||||
| Government National Mortgage Association | ||||||||
| 2.500%, 09/20/51 |
532,901 | $ | 466,030 | |||||
| 2.500%, 10/20/51 |
1,778,859 | 1,555,559 | ||||||
| 3.000%, 12/15/44 |
17,686 | 15,873 | ||||||
| 3.000%, 02/15/45 |
21,840 | 19,602 | ||||||
| 3.000%, 04/15/45 |
168,792 | 151,499 | ||||||
| 3.000%, 05/15/45 |
773,669 | 694,381 | ||||||
| 3.000%, 07/15/45 |
7,128 | 6,398 | ||||||
| 3.000%, 04/20/51 |
1,879,299 | 1,706,864 | ||||||
| 3.000%, 08/20/51 |
421,463 | 382,323 | ||||||
| 3.000%, 09/20/51 |
684,412 | 619,875 | ||||||
| 3.000%, 12/20/51 |
1,734,353 | 1,569,840 | ||||||
| 3.000%, 07/20/52 |
425,130 | 384,774 | ||||||
| 3.500%, 03/20/44 |
270,790 | 256,808 | ||||||
| 3.500%, 06/20/46 |
309,076 | 291,363 | ||||||
| 3.500%, 07/20/46 |
73,649 | 69,424 | ||||||
| 3.500%, 10/20/46 |
78,323 | 73,817 | ||||||
| 3.500%, 02/20/47 |
356,924 | 336,336 | ||||||
| 3.500%, 08/20/47 |
64,064 | 60,335 | ||||||
| 3.500%, 11/20/47 |
72,337 | 68,110 | ||||||
| 3.500%, 03/20/48 |
92,748 | 87,312 | ||||||
| 3.500%, 02/20/49 |
277,386 | 260,409 | ||||||
| 3.500%, 07/20/49 |
265,339 | 249,586 | ||||||
| 3.500%, 01/20/51 |
75,347 | 70,750 | ||||||
| 3.500%, 04/20/52 |
212,562 | 197,825 | ||||||
| 3.500%, 06/20/52 |
618,644 | 575,757 | ||||||
| 3.500%, 12/20/52 |
4,046,385 | 3,765,852 | ||||||
| 3.500%, 01/20/53 |
949,351 | 883,531 | ||||||
| 3.875%, 08/15/42 |
203,930 | 197,366 | ||||||
| 4.000%, 09/15/42 |
272,339 | 265,807 | ||||||
| 4.000%, 08/20/45 |
266,955 | 260,238 | ||||||
| 4.000%, 11/20/47 |
98,996 | 94,984 | ||||||
| 4.000%, 03/20/48 |
224,459 | 215,435 | ||||||
| 4.000%, 07/20/48 |
716,388 | 688,563 | ||||||
| 4.500%, 04/15/41 |
180,057 | 179,012 | ||||||
| 4.500%, 02/15/42 |
358,386 | 355,952 | ||||||
| 4.500%, 01/20/46 |
34,302 | 34,287 | ||||||
| 4.500%, 05/20/52 |
57,191 | 55,873 | ||||||
| 4.500%, 08/20/52 |
256,094 | 250,031 | ||||||
| 4.500%, 09/20/52 |
234,761 | 229,155 | ||||||
| 4.500%, 10/20/52 |
1,040,016 | 1,015,129 | ||||||
| 5.000%, 12/15/38 |
14,559 | 14,706 | ||||||
| 5.000%, 04/15/39 |
275,947 | 278,747 | ||||||
| 5.000%, 07/15/39 |
18,367 | 18,530 | ||||||
| 5.000%, 10/20/39 |
6,097 | 6,196 | ||||||
| 5.000%, 05/20/40 |
233,241 | 237,427 | ||||||
| 5.000%, 06/20/40 |
185,171 | 188,493 | ||||||
| 5.000%, 07/20/40 |
72,683 | 73,987 | ||||||
| 5.000%, 12/15/40 |
40,483 | 40,865 | ||||||
| 5.000%, 11/20/49 |
266,308 | 267,166 | ||||||
| 5.500%, 12/15/40 |
152,395 | 154,043 | ||||||
| Government National Mortgage Association REMICS | ||||||||
| 2.500%, 12/16/39 |
89,230 | 82,260 | ||||||
| 2.500%, 07/20/41 |
188,886 | 168,042 | ||||||
| 2.500%, 10/20/49 |
673,384 | 593,386 | ||||||
| 3.000%, 09/20/28 (d) |
32,936 | 1,151 | ||||||
| Agency Sponsored Mortgage - Backed—(Continued) | ||||||||
| Government National Mortgage Association REMICS | ||||||||
| 3.000%, 05/20/35 (d) |
538,154 | 30,870 | ||||||
| 3.000%, 02/16/43 (d) |
54,655 | 6,721 | ||||||
| 3.000%, 02/20/52 |
376,967 | 340,295 | ||||||
| 3.500%, 02/16/27 (d) |
11,169 | 281 | ||||||
| 3.500%, 03/20/27 (d) |
34,014 | 1,078 | ||||||
| 3.500%, 10/20/29 (d) |
261,146 | 18,196 | ||||||
| 3.500%, 07/20/40 (d) |
26,236 | 624 | ||||||
| 3.500%, 02/20/41 (d) |
27,785 | 512 | ||||||
| 3.500%, 04/20/42 (d) |
103,834 | 4,218 | ||||||
| 3.500%, 10/20/42 (d) |
307,649 | 47,539 | ||||||
| 3.500%, 05/20/43 (d) |
37,078 | 5,799 | ||||||
| 3.500%, 07/20/43 (d) |
101,186 | 15,850 | ||||||
| 4.000%, 12/16/26 (d) |
5,926 | 71 | ||||||
| 4.000%, 05/20/29 (d) |
101,380 | 2,484 | ||||||
| 4.000%, 05/16/42 (d) |
29,743 | 3,048 | ||||||
| 4.000%, 09/16/42 (d) |
533,965 | 105,716 | ||||||
| 4.000%, 03/20/43 (d) |
57,531 | 10,198 | ||||||
| 4.000%, 01/20/44 (d) |
26,262 | 4,170 | ||||||
| 4.000%, 11/20/44 (d) |
393,291 | 54,446 | ||||||
| 4.000%, 03/20/47 (d) |
174,029 | 25,410 | ||||||
| 4.500%, 04/20/45 (d) |
86,221 | 17,535 | ||||||
| 4.500%, 08/20/45 (d) |
340,783 | 59,367 | ||||||
| 4.500%, 05/20/48 (d) |
282,846 | 40,607 | ||||||
| 5.000%, 02/16/40 (d) |
216,021 | 43,635 | ||||||
| 5.000%, 10/16/41 (d) |
101,719 | 15,810 | ||||||
| 5.000%, 12/20/43 (d) |
247,448 | 47,291 | ||||||
| 5.000%, 01/16/47 (d) |
47,047 | 10,342 | ||||||
| 5.500%, 03/20/39 (d) |
127,999 | 19,786 | ||||||
| 5.500%, 02/16/47 (d) |
141,681 | 22,497 | ||||||
| 5.500%, 02/20/47 (d) |
92,282 | 15,574 | ||||||
| 6.000%, 09/20/40 (d) |
177,907 | 31,709 | ||||||
| 6.000%, 02/20/46 (d) |
151,085 | 26,314 | ||||||
| Government National Mortgage Association, TBA |
2,970,000 | 2,514,407 | ||||||
| 2.500%, TBA (f) |
1,495,000 | 1,307,662 | ||||||
| 4.000%, TBA (f) |
3,055,000 | 2,916,578 | ||||||
| 5.500%, TBA (f) |
3,500,000 | 3,525,164 | ||||||
| Seasoned Credit Risk Transfer Trust |
462,143 | 381,826 | ||||||
| 3.500%, 11/25/57 |
392,264 | 361,171 | ||||||
| 3.500%, 03/25/58 |
755,282 | 672,553 | ||||||
| 3.500%, 07/25/58 |
1,081,166 | 985,226 | ||||||
| 3.500%, 08/25/58 |
212,054 | 192,101 | ||||||
| 3.500%, 10/25/58 |
819,498 | 735,591 | ||||||
| Uniform Mortgage-Backed Security, TBA |
7,536,000 | 6,158,325 | ||||||
| 2.500%, TBA (f) |
2,551,000 | 2,247,546 | ||||||
| 3.500%, TBA (f) |
1,145,000 | 1,073,222 | ||||||
| 4.500%, TBA (f) |
13,526,000 | 13,086,600 | ||||||
| 5.500%, TBA (f) |
12,039,000 | 12,089,790 | ||||||
| 6.000%, TBA (f) |
24,180,000 | 24,550,256 | ||||||
| 6.500%, TBA (f) |
2,780,000 | 2,848,740 | ||||||
| 7.000%, TBA (f) |
5,950,000 | 6,137,100 | ||||||
|
|
|
|||||||
| 216,446,123 | ||||||||
|
|
|
|||||||
See accompanying notes to financial statements.
BHFTII-12
Brighthouse Funds Trust II
Brighthouse/Wellington Balanced Portfolio
Schedule of Investments as of December 31, 2023
U.S. Treasury & Government Agencies—(Continued)
| Security Description | Principal Amount* |
Value | ||||||
| U.S. Treasury—5.6% | ||||||||
| U.S. Treasury Bonds | ||||||||
| 1.250%, 05/15/50 |
11,030,000 | $ | 5,943,705 | |||||
| 1.625%, 11/15/50 |
3,460,000 | 2,061,403 | ||||||
| 2.250%, 08/15/46 |
910,000 | 646,989 | ||||||
| 2.375%, 11/15/49 |
1,385,000 | 993,737 | ||||||
| 2.500%, 02/15/45 |
2,555,000 | 1,934,714 | ||||||
| 2.875%, 08/15/45 (g) |
19,040,000 | 15,352,487 | ||||||
| 2.875%, 11/15/46 |
1,200,000 | 960,891 | ||||||
| 3.000%, 02/15/47 |
6,040,000 | 4,937,936 | ||||||
| 3.000%, 08/15/52 |
2,540,000 | 2,077,145 | ||||||
| 3.125%, 08/15/44 (h) |
2,010,000 | 1,701,983 | ||||||
| 3.125%, 05/15/48 |
6,365,000 | 5,302,841 | ||||||
| 3.375%, 08/15/42 |
2,385,000 | 2,126,656 | ||||||
| 3.625%, 08/15/43 |
3,785,000 | 3,479,687 | ||||||
| 4.125%, 08/15/53 |
1,595,000 | 1,612,196 | ||||||
| U.S. Treasury Inflation-Indexed Bond |
5,810,173 | 3,783,596 | ||||||
| U.S. Treasury Inflation-Indexed Notes |
3,025,092 | 2,795,409 | ||||||
| 0.750%, 07/15/28 (i) |
3,260,415 | 3,119,971 | ||||||
| 1.375%, 07/15/33 (i) |
2,147,687 | 2,082,006 | ||||||
| U.S. Treasury Notes |
3,825,000 | 4,015,653 | ||||||
|
|
|
|||||||
| 64,929,005 | ||||||||
|
|
|
|||||||
| Total U.S. Treasury & Government Agencies |
281,375,128 | |||||||
|
|
|
|||||||
| Corporate Bonds & Notes—11.7% |
| |||||||
| Advertising—0.1% | ||||||||
| Lamar Media Corp. |
665,000 | 590,853 | ||||||
|
|
|
|||||||
| Aerospace/Defense—0.1% | ||||||||
| Boeing Co. |
245,000 | 247,138 | ||||||
| 5.150%, 05/01/30 |
300,000 | 305,403 | ||||||
| Northrop Grumman Corp. |
175,000 | 177,302 | ||||||
|
|
|
|||||||
| 729,843 | ||||||||
|
|
|
|||||||
| Agriculture—0.2% | ||||||||
| Philip Morris International, Inc. |
385,000 | 389,113 | ||||||
| 5.125%, 11/17/27 |
145,000 | 147,583 | ||||||
| 5.125%, 02/15/30 |
550,000 | 558,976 | ||||||
| 5.375%, 02/15/33 |
285,000 | 292,326 | ||||||
| 5.625%, 11/17/29 |
205,000 | 214,964 | ||||||
| 5.625%, 09/07/33 (b) |
295,000 | 308,106 | ||||||
|
|
|
|||||||
| 1,911,068 | ||||||||
|
|
|
|||||||
| Apparel—0.1% | ||||||||
| Hanesbrands, Inc. |
140,000 | 135,046 | ||||||
| Apparel—(Continued) | ||||||||
| Tapestry, Inc. |
145,000 | 148,191 | ||||||
| William Carter Co. |
765,000 | 755,437 | ||||||
|
|
|
|||||||
| 1,038,674 | ||||||||
|
|
|
|||||||
| Banks—3.0% | ||||||||
| ABN AMRO Bank NV |
300,000 | 306,546 | ||||||
| ANZ New Zealand International Ltd. |
650,000 | 664,546 | ||||||
| Banca Comerciala Romana SA |
200,000 | 232,507 | ||||||
| Banca Transilvania SA |
305,000 | 353,984 | ||||||
| Bank of America Corp. |
350,000 | 286,322 | ||||||
| 1.922%, SOFR + 1.370%, 10/24/31 (c) |
215,000 | 174,548 | ||||||
| 2.572%, SOFR + 1.210%, 10/20/32 (c) |
230,000 | 190,686 | ||||||
| 2.592%, SOFR + 2.150%, 04/29/31 (c) |
620,000 | 534,310 | ||||||
| 2.687%, SOFR + 1.320%, 04/22/32 (c) |
1,265,000 | 1,068,205 | ||||||
| 2.972%, SOFR + 1.330%, 02/04/33 (c) |
270,000 | 229,721 | ||||||
| 3.194%, 3M TSFR + 1.442%, 07/23/30 (b) (c) |
195,000 | 176,808 | ||||||
| 3.419%, 3M TSFR + 1.302%, 12/20/28 (c) |
25,000 | 23,548 | ||||||
| 4.376%, SOFR + 1.580%, 04/27/28 (c) |
890,000 | 869,796 | ||||||
| 5.202%, SOFR + 1.630%, 04/25/29 (c) |
480,000 | 482,969 | ||||||
| 5.933%, SOFR + 1.340%, 09/15/27 (c) |
550,000 | 561,179 | ||||||
| Bank of Ireland Group PLC |
925,000 | 934,759 | ||||||
| Bank of New York Mellon Corp. |
525,000 | 557,650 | ||||||
| Barclays PLC |
485,000 | 503,794 | ||||||
| BNP Paribas SA |
200,000 | 201,402 | ||||||
| 5.335%, 1Y H15 + 1.500%, 06/12/29 (144A) (c) |
255,000 | 258,655 | ||||||
| 5.894%, SOFR + 1.866%, 12/05/34 (144A) (c) |
540,000 | 564,628 | ||||||
| BPCE SA |
895,000 | 942,349 | ||||||
| 7.003%, SOFR + 2.590%, 10/19/34 (144A) (c) |
740,000 | 804,236 | ||||||
| Credit Agricole SA |
250,000 | 261,840 | ||||||
| Danske Bank AS |
200,000 | 186,692 | ||||||
| 5.375%, 01/12/24 (144A) |
450,000 | 449,897 | ||||||
| Deutsche Bank AG |
150,000 | 140,598 | ||||||
| 2.311%, SOFR + 1.219%, 11/16/27 (c) |
285,000 | 260,601 | ||||||
| 7.079%, SOFR + 3.650%, 02/10/34 (c) |
200,000 | 205,669 | ||||||
| Goldman Sachs Group, Inc. |
660,000 | 542,273 | ||||||
| 2.615%, SOFR + 1.281%, 04/22/32 (c) |
910,000 | 763,862 | ||||||
| 4.223%, 3M TSFR + 1.563%, 05/01/29 (c) |
485,000 | 469,154 | ||||||
| HSBC Holdings PLC | ||||||||
| 2.206%, SOFR + 1.285%, 08/17/29 (c) |
400,000 | 349,170 | ||||||
See accompanying notes to financial statements.
BHFTII-13
Brighthouse Funds Trust II
Brighthouse/Wellington Balanced Portfolio
Schedule of Investments as of December 31, 2023
Corporate Bonds & Notes—(Continued)
| Security Description | Principal Amount* |
Value | ||||||
| Banks—(Continued) | ||||||||
| HSBC Holdings PLC | ||||||||
| 4.583%, 3M TSFR + 1.796%, 06/19/29 (c) |
420,000 | $ | 407,235 | |||||
| 5.402%, SOFR + 2.870%, 08/11/33 (b) (c) |
1,190,000 | 1,195,157 | ||||||
| 5.887%, SOFR + 1.570%, 08/14/27 (c) |
565,000 | 572,822 | ||||||
| 6.161%, SOFR + 1.970%, 03/09/29 (c) |
200,000 | 206,518 | ||||||
| 6.547%, SOFR + 2.980%, 06/20/34 (c) |
360,000 | 376,250 | ||||||
| 7.399%, SOFR + 3.020%, 11/13/34 (c) |
385,000 | 422,333 | ||||||
| Huntington Bancshares, Inc. |
75,000 | 77,335 | ||||||
| Huntington National Bank |
250,000 | 252,105 | ||||||
| Intesa Sanpaolo SpA |
400,000 | 409,894 | ||||||
| 7.800%, 11/28/53 (144A) † |
390,000 | 428,209 | ||||||
| JPMorgan Chase & Co. |
300,000 | 250,313 | ||||||
| 3.509%, 3M TSFR + 1.207%, 01/23/29 (c) |
525,000 | 497,475 | ||||||
| 3.960%, 3M TSFR + 1.507%, 01/29/27 (c) |
215,000 | 210,017 | ||||||
| 4.005%, 3M TSFR + 1.382%, 04/23/29 (c) |
410,000 | 394,479 | ||||||
| 4.323%, SOFR + 1.560%, 04/26/28 (c) |
80,000 | 78,811 | ||||||
| 4.851%, SOFR + 1.990%, 07/25/28 (c) |
40,000 | 40,012 | ||||||
| 5.299%, SOFR + 1.450%, 07/24/29 (c) |
375,000 | 380,517 | ||||||
| 6.070%, SOFR + 1.330%, 10/22/27 (c) |
240,000 | 246,891 | ||||||
| 6.087%, SOFR + 1.570%, 10/23/29 (c) |
95,000 | 99,884 | ||||||
| M&T Bank Corp. |
675,000 | 639,564 | ||||||
| 7.413%, SOFR + 2.800%, 10/30/29 (c) |
480,000 | 516,301 | ||||||
| Manufacturers & Traders Trust Co. |
250,000 | 242,871 | ||||||
| MBank SA |
400,000 | 381,520 | ||||||
| Morgan Stanley |
880,000 | 702,700 | ||||||
| 1.928%, SOFR + 1.020%, 04/28/32 (c) |
635,000 | 510,619 | ||||||
| 2.239%, SOFR + 1.178%, 07/21/32 (c) |
45,000 | 36,731 | ||||||
| 2.475%, SOFR + 1.000%, 01/21/28 (c) |
155,000 | 143,868 | ||||||
| 4.431%, 3M TSFR + 1.890%, 01/23/30 (c) |
130,000 | 126,617 | ||||||
| 5.123%, SOFR + 1.730%, 02/01/29 (c) |
55,000 | 55,250 | ||||||
| 5.164%, SOFR + 1.590%, 04/20/29 (c) |
540,000 | 543,087 | ||||||
| 5.449%, SOFR + 1.630%, 07/20/29 (c) |
115,000 | 117,179 | ||||||
| 6.407%, SOFR + 1.830%, 11/01/29 (c) |
1,100,000 | 1,165,763 | ||||||
| OTP Bank Nyrt |
390,000 | 441,907 | ||||||
| 7.500%, 1Y H15 + 3.711%, 05/25/27 (c) |
205,000 | 211,302 | ||||||
| PNC Financial Services Group, Inc. |
145,000 | 141,877 | ||||||
| 6.875%, SOFR + 2.284%, 10/20/34 (b) (c) |
120,000 | 133,217 | ||||||
| Societe Generale SA |
1,190,000 | 1,187,799 | ||||||
| Standard Chartered PLC |
475,000 | 501,275 | ||||||
| 7.767%, 1Y H15 + 3.450%, 11/16/28 (144A) (c) |
215,000 | 232,064 | ||||||
| UBS Group AG | ||||||||
| 2.095%, 1Y H15 + 1.000%, 02/11/32 (144A) (c) |
200,000 | 159,524 | ||||||
| 3.091%, SOFR + 1.730%, 05/14/32 (144A) (c) |
250,000 | 212,917 | ||||||
| 4.751%, 1Y H15 + 1.750%, 05/12/28 (144A) (b) (c) |
285,000 | 280,665 | ||||||
| Banks—(Continued) | ||||||||
| UBS Group AG | ||||||||
| 6.246%, 1Y H15 + 1.800%, 09/22/29 (144A) (c) |
475,000 | 495,496 | ||||||
| 6.442%, SOFR + 3.700%, 08/11/28 (144A) (c) |
250,000 | 259,625 | ||||||
| 6.537%, SOFR + 3.920%, 08/12/33 (144A) (c) |
970,000 | 1,035,142 | ||||||
| Wells Fargo & Co. |
535,000 | 462,304 | ||||||
| 2.879%, 3M TSFR + 1.432%, 10/30/30 (b) (c) |
240,000 | 213,351 | ||||||
| 3.000%, 10/23/26 |
180,000 | 170,887 | ||||||
| 3.350%, SOFR + 1.500%, 03/02/33 (c) |
435,000 | 379,936 | ||||||
| 4.808%, SOFR + 1.980%, 07/25/28 (c) |
185,000 | 183,644 | ||||||
| 4.897%, SOFR + 2.100%, 07/25/33 (c) |
580,000 | 565,021 | ||||||
| 5.389%, SOFR + 2.020%, 04/24/34 (c) |
75,000 | 75,326 | ||||||
| 5.574%, SOFR + 1.740%, 07/25/29 (c) |
905,000 | 924,067 | ||||||
| 6.303%, SOFR + 1.790%, 10/23/29 (c) |
45,000 | 47,426 | ||||||
| 6.491%, SOFR + 2.060%, 10/23/34 (c) |
145,000 | 157,744 | ||||||
|
|
|
|||||||
| 34,753,747 | ||||||||
|
|
|
|||||||
| Beverages—0.0% | ||||||||
| Bacardi Ltd./Bacardi-Martini BV |
220,000 | 221,100 | ||||||
|
|
|
|||||||
| Biotechnology—0.1% | ||||||||
| Amgen, Inc. |
110,000 | 113,080 | ||||||
| 5.250%, 03/02/33 (b) |
700,000 | 717,663 | ||||||
| Royalty Pharma PLC |
540,000 | 441,077 | ||||||
| 2.200%, 09/02/30 |
395,000 | 331,992 | ||||||
|
|
|
|||||||
| 1,603,812 | ||||||||
|
|
|
|||||||
| Building Materials—0.1% | ||||||||
| Builders FirstSource, Inc. |
785,000 | 758,035 | ||||||
| Standard Industries, Inc. |
125,000 | 107,534 | ||||||
| 4.375%, 07/15/30 (144A) (b) |
720,000 | 661,239 | ||||||
|
|
|
|||||||
| 1,526,808 | ||||||||
|
|
|
|||||||
| Chemicals—0.1% | ||||||||
| Celanese U.S. Holdings LLC |
395,000 | 405,016 | ||||||
| 6.330%, 07/15/29 |
413,000 | 432,936 | ||||||
| 6.550%, 11/15/30 |
245,000 | 258,996 | ||||||
|
|
|
|||||||
| 1,096,948 | ||||||||
|
|
|
|||||||
| Commercial Services—0.4% | ||||||||
| Ashtead Capital, Inc. |
1,000,000 | 960,114 | ||||||
| 5.500%, 08/11/32 (144A) |
420,000 | 414,886 | ||||||
| Gartner, Inc. |
386,000 | 366,054 | ||||||
| Howard University | ||||||||
| 2.291%, 10/01/26 |
100,000 | 92,706 | ||||||
| 2.701%, 10/01/29 |
260,000 | 230,831 | ||||||
See accompanying notes to financial statements.
BHFTII-14
Brighthouse Funds Trust II
Brighthouse/Wellington Balanced Portfolio
Schedule of Investments as of December 31, 2023
Corporate Bonds & Notes—(Continued)
| Security Description | Principal Amount* |
Value | ||||||
| Commercial Services—(Continued) | ||||||||
| Howard University | ||||||||
| 2.801%, 10/01/30 |
100,000 | $ | 87,722 | |||||
| 2.901%, 10/01/31 |
100,000 | 86,288 | ||||||
| 3.476%, 10/01/41 |
115,000 | 85,372 | ||||||
| Service Corp. International |
785,000 | 684,595 | ||||||
| 5.125%, 06/01/29 (b) |
858,000 | 840,840 | ||||||
| United Rentals North America, Inc. |
||||||||
| 4.000%, 07/15/30 (b) |
85,000 | 78,293 | ||||||
| 4.875%, 01/15/28 |
65,000 | 63,456 | ||||||
|
|
|
|||||||
| 3,991,157 | ||||||||
|
|
|
|||||||
| Computers—0.1% | ||||||||
| Booz Allen Hamilton, Inc. |
1,256,000 | 1,183,148 | ||||||
|
|
|
|||||||
| Cosmetics/Personal Care—0.0% | ||||||||
| Kenvue, Inc. |
210,000 | 217,264 | ||||||
|
|
|
|||||||
| Distribution/Wholesale—0.0% | ||||||||
| LKQ Corp. |
170,000 | 173,990 | ||||||
|
|
|
|||||||
| Diversified Financial Services—0.4% | ||||||||
| American Express Co. |
505,000 | 514,875 | ||||||
| Capital One Financial Corp. |
390,000 | 350,793 | ||||||
| 3.273%, SOFR + 1.790%, 03/01/30 (c) |
520,000 | 464,413 | ||||||
| 5.247%, SOFR + 2.600%, 07/26/30 (c) |
310,000 | 304,585 | ||||||
| 5.468%, SOFR + 2.080%, 02/01/29 (c) |
155,000 | 154,542 | ||||||
| 5.817%, SOFR + 2.600%, 02/01/34 (c) |
150,000 | 149,269 | ||||||
| 6.312%, SOFR + 2.640%, 06/08/29 (c) |
260,000 | 266,737 | ||||||
| 6.377%, SOFR + 2.860%, 06/08/34 (c) |
255,000 | 262,445 | ||||||
| 7.624%, SOFR + 3.070%, 10/30/31 (c) |
285,000 | 313,183 | ||||||
| Discover Financial Services |
555,000 | 617,428 | ||||||
| GTP Acquisition Partners I LLC |
1,355,000 | 1,317,318 | ||||||
| Intercontinental Exchange, Inc. |
110,000 | 109,644 | ||||||
| Nasdaq, Inc. |
225,000 | 233,741 | ||||||
|
|
|
|||||||
| 5,058,973 | ||||||||
|
|
|
|||||||
| Electric—1.6% | ||||||||
| Alabama Power Co. |
245,000 | 184,068 | ||||||
| 4.150%, 08/15/44 |
225,000 | 192,680 | ||||||
| Ameren Corp. |
695,000 | 698,114 | ||||||
| Arizona Public Service Co. |
120,000 | 123,991 | ||||||
| 6.350%, 12/15/32 |
245,000 | 265,928 | ||||||
| Electric—(Continued) | ||||||||
| Berkshire Hathaway Energy Co. |
165,000 | 132,323 | ||||||
| 4.600%, 05/01/53 |
220,000 | 195,839 | ||||||
| Cleco Corporate Holdings LLC |
275,000 | 240,970 | ||||||
| 4.973%, 05/01/46 |
20,000 | 16,766 | ||||||
| Consolidated Edison Co. of New York, Inc. |
250,000 | 176,748 | ||||||
| 5.500%, 03/15/34 (b) |
115,000 | 120,608 | ||||||
| Dominion Energy, Inc. |
||||||||
| 3.375%, 04/01/30 (b) |
268,000 | 246,726 | ||||||
| 5.375%, 11/15/32 (b) |
1,022,000 | 1,049,466 | ||||||
| 6.300%, 03/15/33 |
15,000 | 16,092 | ||||||
| Duke Energy Carolinas LLC |
205,000 | 181,085 | ||||||
| Duke Energy Corp. |
820,000 | 699,660 | ||||||
| 4.500%, 08/15/32 |
285,000 | 275,866 | ||||||
| 5.000%, 08/15/52 |
85,000 | 79,345 | ||||||
| Duke Energy Indiana LLC |
145,000 | 93,742 | ||||||
| Duke Energy Progress LLC |
130,000 | 106,824 | ||||||
| 4.375%, 03/30/44 |
320,000 | 282,204 | ||||||
| Edison International |
85,000 | 82,080 | ||||||
| 5.250%, 11/15/28 |
95,000 | 95,584 | ||||||
| 6.950%, 11/15/29 |
700,000 | 759,655 | ||||||
| Emera, Inc. |
190,000 | 186,052 | ||||||
| Enel Finance International NV |
235,000 | 229,209 | ||||||
| Evergy Metro, Inc. |
10,000 | 8,522 | ||||||
| Evergy, Inc. |
85,000 | 83,068 | ||||||
| 2.900%, 09/15/29 |
345,000 | 312,069 | ||||||
| Eversource Energy |
560,000 | 562,828 | ||||||
| 5.450%, 03/01/28 (b) |
95,000 | 97,642 | ||||||
| 5.950%, 02/01/29 |
330,000 | 345,594 | ||||||
| Georgia Power Co. |
140,000 | 123,773 | ||||||
| 4.700%, 05/15/32 |
170,000 | 169,298 | ||||||
| 4.950%, 05/17/33 |
25,000 | 25,202 | ||||||
| Investment Energy Resources Ltd. |
200,000 | 188,934 | ||||||
| IPALCO Enterprises, Inc. |
335,000 | 329,687 | ||||||
| Kentucky Power Co. |
520,000 | 559,042 | ||||||
| Monongahela Power Co. |
160,000 | 167,883 | ||||||
| National Grid PLC |
75,000 | 77,270 | ||||||
See accompanying notes to financial statements.
BHFTII-15
Brighthouse Funds Trust II
Brighthouse/Wellington Balanced Portfolio
Schedule of Investments as of December 31, 2023
Corporate Bonds & Notes—(Continued)
| Security Description | Principal Amount* |
Value | ||||||
| Electric—(Continued) | ||||||||
| National Rural Utilities Cooperative Finance Corp. |
210,000 | $ | 222,387 | |||||
| NextEra Energy Capital Holdings, Inc. |
245,000 | 225,316 | ||||||
| 2.250%, 06/01/30 |
340,000 | 290,846 | ||||||
| 4.625%, 07/15/27 |
430,000 | 429,222 | ||||||
| 5.000%, 02/28/30 |
110,000 | 111,165 | ||||||
| 5.000%, 07/15/32 |
260,000 | 261,283 | ||||||
| NRG Energy, Inc. |
360,000 | 324,571 | ||||||
| Oglethorpe Power Corp. |
130,000 | 110,124 | ||||||
| 5.050%, 10/01/48 |
35,000 | 32,165 | ||||||
| Ohio Edison Co. |
185,000 | 187,234 | ||||||
| Oncor Electric Delivery Co. LLC |
250,000 | 266,330 | ||||||
| Pacific Gas & Electric Co. |
840,000 | 692,908 | ||||||
| 3.500%, 08/01/50 |
45,000 | 31,067 | ||||||
| 4.400%, 03/01/32 |
70,000 | 64,749 | ||||||
| 4.550%, 07/01/30 |
570,000 | 542,856 | ||||||
| 5.250%, 03/01/52 |
128,000 | 113,731 | ||||||
| 5.900%, 06/15/32 |
225,000 | 228,781 | ||||||
| 6.100%, 01/15/29 |
855,000 | 884,752 | ||||||
| 6.150%, 01/15/33 |
410,000 | 424,951 | ||||||
| 6.400%, 06/15/33 |
405,000 | 426,148 | ||||||
| PPL Capital Funding, Inc. |
85,000 | 80,913 | ||||||
| Public Service Enterprise Group, Inc. |
120,000 | 128,970 | ||||||
| Puget Energy, Inc. |
270,000 | 241,331 | ||||||
| 3.650%, 05/15/25 |
270,000 | 263,051 | ||||||
| 4.100%, 06/15/30 |
258,000 | 236,386 | ||||||
| 4.224%, 03/15/32 |
42,000 | 37,993 | ||||||
| Sempra |
270,000 | 273,535 | ||||||
| Southern California Edison Co. |
150,000 | 128,726 | ||||||
| 2.850%, 08/01/29 |
315,000 | 287,058 | ||||||
| 5.300%, 03/01/28 |
140,000 | 143,687 | ||||||
| Southern Co. |
375,000 | 382,522 | ||||||
| Southwestern Electric Power Co. |
315,000 | 315,006 | ||||||
| Virginia Electric & Power Co. |
91,000 | 55,837 | ||||||
| 5.000%, 04/01/33 (b) |
285,000 | 288,241 | ||||||
| Xcel Energy, Inc. |
185,000 | 180,350 | ||||||
|
|
|
|||||||
| 18,696,629 | ||||||||
|
|
|
|||||||
| Energy-Alternate Sources—0.1% | ||||||||
| Energo-Pro AS |
645,000 | 631,822 | ||||||
| Energy-Alternate Sources—(Continued) | ||||||||
| FS Luxembourg SARL |
245,000 | 251,254 | ||||||
| Greenko Power II Ltd. |
351,000 | 315,988 | ||||||
|
|
|
|||||||
| 1,199,064 | ||||||||
|
|
|
|||||||
| Engineering & Construction—0.1% | ||||||||
| IHS Holding Ltd. |
390,000 | 315,315 | ||||||
| International Airport Finance SA |
904,595 | 924,948 | ||||||
|
|
|
|||||||
| 1,240,263 | ||||||||
|
|
|
|||||||
| Entertainment—0.1% | ||||||||
| Warnermedia Holdings, Inc. |
225,000 | 205,921 | ||||||
| 5.141%, 03/15/52 (b) |
25,000 | 21,459 | ||||||
| WMG Acquisition Corp. |
160,000 | 137,139 | ||||||
| 3.750%, 12/01/29 (144A) |
285,000 | 259,342 | ||||||
| 3.875%, 07/15/30 (144A) |
855,000 | 773,558 | ||||||
|
|
|
|||||||
| 1,397,419 | ||||||||
|
|
|
|||||||
| Environmental Control—0.1% | ||||||||
| Clean Harbors, Inc. |
1,195,000 | 1,170,971 | ||||||
| Veralto Corp. |
285,000 | 291,612 | ||||||
|
|
|
|||||||
| 1,462,583 | ||||||||
|
|
|
|||||||
| Food—0.1% | ||||||||
| Conagra Brands, Inc. |
255,000 | 223,785 | ||||||
| General Mills, Inc. |
85,000 | 86,173 | ||||||
| Minerva Luxembourg SA |
300,000 | 317,188 | ||||||
| NBM U.S. Holdings, Inc. |
635,000 | 642,270 | ||||||
| Sysco Corp. |
175,000 | 182,294 | ||||||
|
|
|
|||||||
| 1,451,710 | ||||||||
|
|
|
|||||||
| Gas—0.2% | ||||||||
| Atmos Energy Corp. |
95,000 | 103,069 | ||||||
| Brooklyn Union Gas Co. |
365,000 | 381,032 | ||||||
| East Ohio Gas Co. |
30,000 | 19,436 | ||||||
| KeySpan Gas East Corp. |
275,000 | 279,647 | ||||||
| NiSource, Inc. | ||||||||
| 3.490%, 05/15/27 |
95,000 | 91,461 | ||||||
See accompanying notes to financial statements.
BHFTII-16
Brighthouse Funds Trust II
Brighthouse/Wellington Balanced Portfolio
Schedule of Investments as of December 31, 2023
Corporate Bonds & Notes—(Continued)
| Security Description | Principal Amount* |
Value | ||||||
| Gas—(Continued) | ||||||||
| NiSource, Inc. | ||||||||
| 3.600%, 05/01/30 |
265,000 | $ | 246,566 | |||||
| 5.250%, 03/30/28 |
315,000 | 321,179 | ||||||
| 5.400%, 06/30/33 |
290,000 | 299,012 | ||||||
| Southern California Gas Co. |
250,000 | 257,067 | ||||||
| Southern Co. Gas Capital Corp. |
70,000 | 73,500 | ||||||
| Southwest Gas Corp. |
195,000 | 165,955 | ||||||
|
|
|
|||||||
| 2,237,924 | ||||||||
|
|
|
|||||||
| Hand/Machine Tools—0.1% | ||||||||
| Regal Rexnord Corp. |
775,000 | 784,514 | ||||||
| 6.300%, 02/15/30 (144A) |
185,000 | 189,794 | ||||||
|
|
|
|||||||
| 974,308 | ||||||||
|
|
|
|||||||
| Healthcare-Products—0.2% | ||||||||
| Alcon Finance Corp. |
275,000 | 238,378 | ||||||
| 2.750%, 09/23/26 (144A) |
200,000 | 187,906 | ||||||
| 3.000%, 09/23/29 (144A) |
265,000 | 241,177 | ||||||
| Avantor Funding, Inc. |
780,000 | 753,855 | ||||||
| GE HealthCare Technologies, Inc. |
200,000 | 210,080 | ||||||
| Hologic, Inc. |
658,000 | 631,622 | ||||||
|
|
|
|||||||
| 2,263,018 | ||||||||
|
|
|
|||||||
| Healthcare-Services—0.3% | ||||||||
| Centene Corp. |
215,000 | 191,479 | ||||||
| 3.375%, 02/15/30 |
20,000 | 17,945 | ||||||
| 4.250%, 12/15/27 |
110,000 | 105,991 | ||||||
| 4.625%, 12/15/29 |
1,185,000 | 1,136,092 | ||||||
| CommonSpirit Health |
105,000 | 95,871 | ||||||
| HCA, Inc. |
445,000 | 410,587 | ||||||
| Humana, Inc. |
290,000 | 278,576 | ||||||
| 5.750%, 12/01/28 |
60,000 | 62,716 | ||||||
| Kaiser Foundation Hospitals |
110,000 | 82,400 | ||||||
| 3.002%, 06/01/51 |
205,000 | 146,006 | ||||||
| Sutter Health |
55,000 | 40,691 | ||||||
| UnitedHealth Group, Inc. |
315,000 | 238,500 | ||||||
| 3.500%, 08/15/39 |
60,000 | 50,985 | ||||||
| 4.950%, 05/15/62 |
60,000 | 59,182 | ||||||
| 6.050%, 02/15/63 |
65,000 | 74,954 | ||||||
|
|
|
|||||||
| 2,991,975 | ||||||||
|
|
|
|||||||
| Home Builders—0.1% | ||||||||
| Taylor Morrison Communities, Inc. |
120,000 | 116,085 | ||||||
| 5.750%, 01/15/28 (144A) |
623,000 | 625,858 | ||||||
| Toll Brothers Finance Corp. |
130,000 | 129,041 | ||||||
|
|
|
|||||||
| 870,984 | ||||||||
|
|
|
|||||||
| Insurance—0.3% | ||||||||
| Aon Corp./Aon Global Holdings PLC |
150,000 | 153,833 | ||||||
| Athene Global Funding |
55,000 | 48,810 | ||||||
| 2.646%, 10/04/31 (144A) |
510,000 | 414,349 | ||||||
| 2.717%, 01/07/29 (144A) |
735,000 | 639,005 | ||||||
| Athene Holding Ltd. |
250,000 | 252,286 | ||||||
| Corebridge Financial, Inc. |
160,000 | 150,768 | ||||||
| 6.050%, 09/15/33 (144A) |
70,000 | 72,901 | ||||||
| Equitable Financial Life Global Funding |
755,000 | 661,318 | ||||||
| Equitable Holdings, Inc. |
190,000 | 183,447 | ||||||
| Marsh & McLennan Cos., Inc. |
245,000 | 238,153 | ||||||
| Protective Life Global Funding |
150,000 | 154,007 | ||||||
| Willis North America, Inc. |
130,000 | 128,808 | ||||||
|
|
|
|||||||
| 3,097,685 | ||||||||
|
|
|
|||||||
| Internet—0.2% | ||||||||
| Gen Digital, Inc. |
615,000 | 608,850 | ||||||
| 6.750%, 09/30/27 (144A) (b) |
540,000 | 549,358 | ||||||
| Go Daddy Operating Co. LLC/GD Finance Co., Inc. |
170,000 | 153,968 | ||||||
| 5.250%, 12/01/27 (144A) |
983,000 | 963,250 | ||||||
|
|
|
|||||||
| 2,275,426 | ||||||||
|
|
|
|||||||
| Iron/Steel—0.0% | ||||||||
| Vale Overseas Ltd. |
145,000 | 150,498 | ||||||
|
|
|
|||||||
| Machinery-Diversified—0.0% | ||||||||
| Ingersoll Rand, Inc. |
110,000 | 116,380 | ||||||
| Otis Worldwide Corp. |
300,000 | 266,764 | ||||||
|
|
|
|||||||
| 383,144 | ||||||||
|
|
|
|||||||
| Media—0.4% | ||||||||
| Charter Communications Operating LLC/Charter Communications Operating Capital |
||||||||
| 2.250%, 01/15/29 |
165,000 | 143,165 | ||||||
See accompanying notes to financial statements.
BHFTII-17
Brighthouse Funds Trust II
Brighthouse/Wellington Balanced Portfolio
Schedule of Investments as of December 31, 2023
Corporate Bonds & Notes—(Continued)
| Security Description | Principal Amount* |
Value | ||||||
| Media—(Continued) | ||||||||
| Charter Communications Operating LLC/Charter Communications Operating Capital |
||||||||
| 5.750%, 04/01/48 |
35,000 | $ | 31,062 | |||||
| 6.484%, 10/23/45 |
1,060,000 | 1,041,570 | ||||||
| 6.834%, 10/23/55 (b) |
90,000 | 89,848 | ||||||
| Comcast Corp. |
54,000 | 35,517 | ||||||
| 2.987%, 11/01/63 |
157,000 | 101,196 | ||||||
| 3.750%, 04/01/40 |
220,000 | 189,240 | ||||||
| Cox Communications, Inc. |
270,000 | 228,752 | ||||||
| Discovery Communications LLC |
180,000 | 163,151 | ||||||
| 4.000%, 09/15/55 |
516,000 | 367,155 | ||||||
| 5.200%, 09/20/47 |
190,000 | 163,686 | ||||||
| 5.300%, 05/15/49 |
517,000 | 443,879 | ||||||
| Paramount Global |
150,000 | 110,821 | ||||||
| 4.950%, 01/15/31 (b) |
315,000 | 298,722 | ||||||
| 5.250%, 04/01/44 |
250,000 | 200,226 | ||||||
| 5.850%, 09/01/43 |
40,000 | 36,002 | ||||||
| Sirius XM Radio, Inc. |
380,000 | 351,440 | ||||||
| 4.125%, 07/01/30 (144A) |
100,000 | 89,108 | ||||||
| Time Warner Cable LLC |
200,000 | 156,947 | ||||||
|
|
|
|||||||
| 4,241,487 | ||||||||
|
|
|
|||||||
| Mining—0.1% | ||||||||
| Anglo American Capital PLC |
640,000 | 544,435 | ||||||
| Glencore Funding LLC |
155,000 | 131,520 | ||||||
| 2.850%, 04/27/31 (144A) |
110,000 | 94,853 | ||||||
| 6.375%, 10/06/30 (144A) |
540,000 | 579,746 | ||||||
| Southern Copper Corp. |
35,000 | 39,190 | ||||||
|
|
|
|||||||
| 1,389,744 | ||||||||
|
|
|
|||||||
| Office/Business Equipment—0.1% | ||||||||
| CDW LLC/CDW Finance Corp. |
120,000 | 112,286 | ||||||
| 3.250%, 02/15/29 |
1,304,000 | 1,192,371 | ||||||
|
|
|
|||||||
| 1,304,657 | ||||||||
|
|
|
|||||||
| Oil & Gas—0.6% | ||||||||
| Aker BP ASA |
200,000 | 184,324 | ||||||
| 5.600%, 06/13/28 (144A) |
255,000 | 259,934 | ||||||
| 6.000%, 06/13/33 (144A) |
340,000 | 353,160 | ||||||
| BP Capital Markets America, Inc. |
60,000 | 41,561 | ||||||
| 4.812%, 02/13/33 |
435,000 | 438,573 | ||||||
| 4.893%, 09/11/33 (b) |
270,000 | 274,720 | ||||||
| Oil & Gas—(Continued) | ||||||||
| ConocoPhillips Co. |
90,000 | 72,989 | ||||||
| 5.050%, 09/15/33 |
145,000 | 148,971 | ||||||
| 5.700%, 09/15/63 |
265,000 | 286,782 | ||||||
| Diamondback Energy, Inc. |
155,000 | 165,621 | ||||||
| Ecopetrol SA |
200,000 | 169,658 | ||||||
| 8.625%, 01/19/29 |
755,000 | 804,610 | ||||||
| Energian Israel Finance Ltd. |
155,000 | 142,600 | ||||||
| 5.875%, 03/30/31 (144A) |
155,000 | 130,618 | ||||||
| 8.500%, 09/30/33 |
210,000 | 200,288 | ||||||
| Equinor ASA |
170,000 | 146,759 | ||||||
| 3.700%, 04/06/50 |
110,000 | 90,789 | ||||||
| Hess Corp. |
37,000 | 42,765 | ||||||
| 7.300%, 08/15/31 |
210,000 | 242,028 | ||||||
| Leviathan Bond Ltd. |
480,000 | 450,415 | ||||||
| Marathon Oil Corp. |
165,000 | 174,324 | ||||||
| Occidental Petroleum Corp. |
45,000 | 46,718 | ||||||
| 6.625%, 09/01/30 (b) |
455,000 | 483,897 | ||||||
| 7.500%, 05/01/31 (b) |
20,000 | 22,427 | ||||||
| Ovintiv, Inc. |
190,000 | 196,710 | ||||||
| Patterson-UTI Energy, Inc. |
325,000 | 310,016 | ||||||
| 7.150%, 10/01/33 |
150,000 | 158,910 | ||||||
| Shell International Finance BV |
120,000 | 90,895 | ||||||
| 3.000%, 11/26/51 |
155,000 | 110,395 | ||||||
| 3.250%, 04/06/50 |
125,000 | 93,905 | ||||||
| Viper Energy, Inc. |
535,000 | 525,272 | ||||||
|
|
|
|||||||
| 6,860,634 | ||||||||
|
|
|
|||||||
| Packaging & Containers—0.1% | ||||||||
| Ball Corp. |
1,550,000 | 1,582,818 | ||||||
|
|
|
|||||||
| Pharmaceuticals—0.1% | ||||||||
| Bayer U.S. Finance LLC |
310,000 | 318,946 | ||||||
| CVS Health Corp. |
230,000 | 163,973 | ||||||
| 4.125%, 04/01/40 |
155,000 | 133,095 | ||||||
| 5.125%, 02/21/30 |
205,000 | 208,180 | ||||||
| 5.250%, 01/30/31 |
120,000 | 123,095 | ||||||
|
|
|
|||||||
| 947,289 | ||||||||
|
|
|
|||||||
See accompanying notes to financial statements.
BHFTII-18
Brighthouse Funds Trust II
Brighthouse/Wellington Balanced Portfolio
Schedule of Investments as of December 31, 2023
Corporate Bonds & Notes—(Continued)
| Security Description | Principal Amount* |
Value | ||||||
| Pipelines—0.6% | ||||||||
| Cheniere Energy Partners LP |
155,000 | $ | 148,252 | |||||
| Columbia Pipelines Holding Co. LLC |
350,000 | 361,236 | ||||||
| Columbia Pipelines Operating Co. LLC |
225,000 | 232,653 | ||||||
| 6.036%, 11/15/33 (144A) |
310,000 | 324,654 | ||||||
| 6.544%, 11/15/53 (144A) |
195,000 | 214,697 | ||||||
| EIG Pearl Holdings SARL |
400,000 | 348,000 | ||||||
| Enbridge, Inc. |
625,000 | 649,623 | ||||||
| 6.000%, 11/15/28 |
165,000 | 173,227 | ||||||
| 8.500%, 5Y H15 + 4.431%, 01/15/84 (c) |
385,000 | 409,504 | ||||||
| Energy Transfer LP |
115,000 | 115,860 | ||||||
| 6.050%, 12/01/26 |
235,000 | 241,600 | ||||||
| 6.400%, 12/01/30 |
630,000 | 673,596 | ||||||
| EQM Midstream Partners LP |
30,000 | 30,547 | ||||||
| Greensaif Pipelines Bidco SARL |
505,000 | 526,501 | ||||||
| 6.510%, 02/23/42 (144A) |
365,000 | 385,851 | ||||||
| MPLX LP |
100,000 | 93,543 | ||||||
| ONEOK, Inc. |
30,000 | 26,919 | ||||||
| 3.400%, 09/01/29 |
210,000 | 193,534 | ||||||
| 4.350%, 03/15/29 |
85,000 | 82,604 | ||||||
| 6.100%, 11/15/32 |
200,000 | 212,518 | ||||||
| Targa Resources Corp. |
||||||||
| 4.200%, 02/01/33 |
40,000 | 36,777 | ||||||
| 6.125%, 03/15/33 |
130,000 | 136,869 | ||||||
| 6.150%, 03/01/29 |
200,000 | 209,140 | ||||||
| 6.250%, 07/01/52 |
80,000 | 82,557 | ||||||
| Targa Resources Partners LP/Targa Resources Partners Finance Corp. |
185,000 | 168,929 | ||||||
| 4.875%, 02/01/31 |
65,000 | 63,142 | ||||||
| Transcontinental Gas Pipe Line Co. LLC |
125,000 | 113,304 | ||||||
| Western Midstream Operating LP |
145,000 | 141,542 | ||||||
| 6.150%, 04/01/33 |
240,000 | 249,328 | ||||||
| Williams Cos., Inc. |
380,000 | 370,426 | ||||||
| 5.650%, 03/15/33 |
180,000 | 188,031 | ||||||
|
|
|
|||||||
| 7,204,964 | ||||||||
|
|
|
|||||||
| Real Estate Investment Trusts—0.3% | ||||||||
| American Tower Corp. |
80,000 | 68,697 | ||||||
| 3.800%, 08/15/29 (b) |
275,000 | 261,068 | ||||||
| 5.800%, 11/15/28 (b) |
220,000 | 228,540 | ||||||
| Real Estate Investment Trusts—(Continued) | ||||||||
| Crown Castle, Inc. |
240,000 | 224,436 | ||||||
| 3.800%, 02/15/28 |
20,000 | 18,998 | ||||||
| 4.800%, 09/01/28 |
695,000 | 685,753 | ||||||
| 5.000%, 01/11/28 |
210,000 | 209,176 | ||||||
| 5.600%, 06/01/29 |
180,000 | 184,051 | ||||||
| Equinix, Inc. |
285,000 | 261,753 | ||||||
| GLP Capital LP/GLP Financing II, Inc. |
195,000 | 175,624 | ||||||
| 5.300%, 01/15/29 (b) |
235,000 | 233,641 | ||||||
| 5.750%, 06/01/28 |
270,000 | 272,425 | ||||||
| SBA Tower Trust |
545,000 | 526,290 | ||||||
| VICI Properties LP |
561,000 | 544,349 | ||||||
|
|
|
|||||||
| 3,894,801 | ||||||||
|
|
|
|||||||
| Retail—0.2% | ||||||||
| AutoZone, Inc. |
190,000 | 188,096 | ||||||
| 4.750%, 02/01/33 (b) |
60,000 | 59,056 | ||||||
| 6.550%, 11/01/33 |
170,000 | 188,867 | ||||||
| FirstCash, Inc. |
758,000 | 707,550 | ||||||
| 5.625%, 01/01/30 (144A) |
585,000 | 560,237 | ||||||
| O’Reilly Automotive, Inc. |
440,000 | 435,253 | ||||||
|
|
|
|||||||
| 2,139,059 | ||||||||
|
|
|
|||||||
| Semiconductors—0.1% | ||||||||
| Intel Corp. |
95,000 | 65,471 | ||||||
| 5.700%, 02/10/53 |
10,000 | 10,811 | ||||||
| 5.900%, 02/10/63 |
110,000 | 122,607 | ||||||
| Marvell Technology, Inc. |
||||||||
| 2.450%, 04/15/28 |
420,000 | 379,006 | ||||||
| 2.950%, 04/15/31 |
85,000 | 74,279 | ||||||
| 5.950%, 09/15/33 |
90,000 | 95,435 | ||||||
| NXP BV/NXP Funding LLC |
165,000 | 169,787 | ||||||
| NXP BV/NXP Funding LLC/NXP USA, Inc. |
50,000 | 48,576 | ||||||
| Qorvo, Inc. |
260,000 | 222,447 | ||||||
|
|
|
|||||||
| 1,188,419 | ||||||||
|
|
|
|||||||
| Software—0.5% | ||||||||
| Black Knight InfoServ LLC |
1,053,000 | 1,001,119 | ||||||
| Fair Isaac Corp. |
853,000 | 807,245 | ||||||
| MSCI, Inc. |
||||||||
| 3.625%, 11/01/31 (144A) |
355,000 | 312,449 | ||||||
| 3.875%, 02/15/31 (144A) |
115,000 | 105,073 | ||||||
See accompanying notes to financial statements.
BHFTII-19
Brighthouse Funds Trust II
Brighthouse/Wellington Balanced Portfolio
Schedule of Investments as of December 31, 2023
Corporate Bonds & Notes—(Continued)
| Security Description | Principal Amount* |
Value | ||||||
| Software—(Continued) | ||||||||
| MSCI, Inc. |
||||||||
| 4.000%, 11/15/29 (144A) |
190,000 | $ | 178,577 | |||||
| Open Text Corp. |
740,000 | 663,657 | ||||||
| 6.900%, 12/01/27 (144A) (b) |
680,000 | 706,963 | ||||||
| Open Text Holdings, Inc. |
130,000 | 114,903 | ||||||
| Oracle Corp. |
100,000 | 90,255 | ||||||
| 3.850%, 04/01/60 |
830,000 | 601,452 | ||||||
| 4.000%, 07/15/46 |
5,000 | 4,008 | ||||||
| 4.100%, 03/25/61 |
130,000 | 99,046 | ||||||
| 4.125%, 05/15/45 |
15,000 | 12,236 | ||||||
| 6.150%, 11/09/29 |
330,000 | 354,998 | ||||||
| SS&C Technologies, Inc. |
735,000 | 724,513 | ||||||
|
|
|
|||||||
| 5,776,494 | ||||||||
|
|
|
|||||||
| Telecommunications—0.2% | ||||||||
| AT&T, Inc. |
539,000 | 387,529 | ||||||
| 3.650%, 09/15/59 |
31,000 | 22,217 | ||||||
| 3.800%, 12/01/57 |
251,000 | 186,579 | ||||||
| 5.400%, 02/15/34 |
15,000 | 15,470 | ||||||
| Nokia OYJ |
720,000 | 697,143 | ||||||
| Rogers Communications, Inc. |
215,000 | 197,848 | ||||||
| T-Mobile USA, Inc. |
315,000 | 284,221 | ||||||
| 3.875%, 04/15/30 |
160,000 | 151,728 | ||||||
| 5.050%, 07/15/33 |
305,000 | 307,372 | ||||||
| 5.750%, 01/15/34 |
205,000 | 217,432 | ||||||
|
|
|
|||||||
| 2,467,539 | ||||||||
|
|
|
|||||||
| Trucking & Leasing—0.2% | ||||||||
| DAE Funding LLC |
885,000 | 862,035 | ||||||
| Penske Truck Leasing Co. LP/PTL Finance Corp. |
320,000 | 311,212 | ||||||
| 4.000%, 07/15/25 (144A) |
365,000 | 356,972 | ||||||
| 4.400%, 07/01/27 (144A) |
285,000 | 277,881 | ||||||
| 6.050%, 08/01/28 (144A) |
105,000 | 108,831 | ||||||
|
|
|
|||||||
| 1,916,931 | ||||||||
|
|
|
|||||||
| Total Corporate Bonds & Notes |
135,704,851 | |||||||
|
|
|
|||||||
| Asset-Backed Securities—3.9% |
| |||||||
| Asset-Backed - Automobile—1.0% | ||||||||
| American Credit Acceptance Receivables Trust |
32,123 | 32,087 | ||||||
| 6.090%, 11/12/27 (144A) |
325,000 | 326,880 | ||||||
| AmeriCredit Automobile Receivables Trust |
535,000 | 530,192 | ||||||
| Asset-Backed - Automobile—(Continued) | ||||||||
| ARI Fleet Lease Trust |
746,871 | 745,444 | ||||||
| Avis Budget Rental Car Funding AESOP LLC |
375,000 | 382,603 | ||||||
| Carvana Auto Receivables Trust |
969,743 | 954,608 | ||||||
| Chesapeake Funding II LLC |
562,828 | 564,309 | ||||||
| CPS Auto Receivables Trust |
703,893 | 704,318 | ||||||
| DT Auto Owner Trust |
250,000 | 247,823 | ||||||
| 5.410%, 02/15/29 (144A) |
280,000 | 278,574 | ||||||
| Enterprise Fleet Financing LLC |
390,000 | 393,719 | ||||||
| Exeter Automobile Receivables Trust |
121,122 | 120,730 | ||||||
| 2.580%, 09/15/25 (144A) |
280,810 | 277,973 | ||||||
| 2.730%, 12/15/25 (144A) |
123,165 | 121,538 | ||||||
| 4.570%, 01/15/27 |
370,000 | 368,068 | ||||||
| 6.030%, 08/16/27 |
162,000 | 162,279 | ||||||
| 6.110%, 09/15/27 |
158,000 | 158,542 | ||||||
| Flagship Credit Auto Trust |
503,000 | 492,774 | ||||||
| 5.050%, 01/18/28 (144A) |
140,000 | 138,553 | ||||||
| GLS Auto Receivables Issuer Trust |
90,000 | 89,279 | ||||||
| Hertz Vehicle Financing III LLC |
990,000 | 1,008,144 | ||||||
| Santander Drive Auto Receivables Trust |
735,000 | 726,062 | ||||||
| 4.430%, 03/15/27 |
235,000 | 232,214 | ||||||
| 4.720%, 06/15/27 |
165,000 | 163,480 | ||||||
| 4.980%, 02/15/28 |
295,000 | 292,811 | ||||||
| 5.610%, 07/17/28 |
495,000 | 497,309 | ||||||
| 5.950%, 01/17/28 |
650,000 | 653,062 | ||||||
| SFS Auto Receivables Securitization Trust |
245,000 | 246,762 | ||||||
| Tricolor Auto Securitization Trust |
140,767 | 140,663 | ||||||
| Westlake Automobile Receivables Trust |
415,000 | 408,394 | ||||||
| 4.310%, 09/15/27 (144A) |
560,000 | 553,397 | ||||||
| 5.410%, 01/18/28 (144A) |
160,000 | 159,237 | ||||||
| World Omni Auto Receivables Trust |
270,000 | 269,621 | ||||||
|
|
|
|||||||
| 12,441,449 | ||||||||
|
|
|
|||||||
| Asset-Backed - Home Equity—0.1% | ||||||||
| GSAA Home Equity Trust |
44,471 | 21,185 | ||||||
| 5.985%, 06/25/36 (c) |
422,911 | 110,039 | ||||||
| 6.070%, 1M TSFR + 0.714%, 03/25/36 (c) |
511,411 | 270,958 | ||||||
| Renaissance Home Equity Loan Trust |
239,171 | 89,483 | ||||||
| Soundview Home Loan Trust |
363,132 | 340,908 | ||||||
|
|
|
|||||||
| 832,573 | ||||||||
|
|
|
|||||||
See accompanying notes to financial statements.
BHFTII-20
Brighthouse Funds Trust II
Brighthouse/Wellington Balanced Portfolio
Schedule of Investments as of December 31, 2023
Asset-Backed Securities—(Continued)
| Security Description | Principal Amount* |
Value | ||||||
| Asset-Backed - Other—2.7% | ||||||||
| 510 Asset-Backed Trust |
541,270 | $ | 525,068 | |||||
| AASET Trust |
106,731 | 94,234 | ||||||
| Affirm Asset Securitization Trust |
385,000 | 387,214 | ||||||
| Aligned Data Centers Issuer LLC |
745,000 | 737,484 | ||||||
| Amur Equipment Finance Receivables XI LLC |
190,196 | 189,653 | ||||||
| Arbor Realty Commercial Real Estate Notes Ltd. |
210,000 | 207,719 | ||||||
| Avant Loans Funding Trust |
138,232 | 137,248 | ||||||
| Benefit Street Partners CLO XXXI Ltd. |
575,000 | 576,051 | ||||||
| CF Hippolyta Issuer LLC |
94,245 | 84,237 | ||||||
| 1.690%, 07/15/60 (144A) |
224,107 | 207,113 | ||||||
| 1.990%, 07/15/60 (144A) |
242,469 | 206,609 | ||||||
| 5.970%, 08/15/62 (144A) |
142,661 | 140,301 | ||||||
| Cirrus Funding Ltd. |
940,000 | 921,960 | ||||||
| CNH Equipment Trust |
170,000 | 168,863 | ||||||
| DLLAA LLC |
285,000 | 289,498 | ||||||
| Domino’s Pizza Master Issuer LLC |
507,000 | 448,185 | ||||||
| 3.668%, 10/25/49 (144A) |
317,625 | 289,781 | ||||||
| 4.116%, 07/25/48 (144A) |
665,000 | 646,074 | ||||||
| Elmwood CLO Ltd. |
530,000 | 529,314 | ||||||
| 7.797%, 3M TSFR + 2.400%, 10/17/36 (144A) (c) |
760,000 | 759,987 | ||||||
| Finance America Mortgage Loan Trust |
39,551 | 38,515 | ||||||
| FirstKey Homes Trust |
288,066 | 276,492 | ||||||
| 4.250%, 07/17/39 (144A) |
1,183,308 | 1,135,637 | ||||||
| GMACM Home Equity Loan Trust |
8,947 | 8,902 | ||||||
| Golub Capital Partners CLO 68B Ltd. |
460,000 | 461,963 | ||||||
| Invesco U.S. CLO Ltd. |
345,000 | 345,105 | ||||||
| JFIN CLO Ltd. |
321,248 | 321,000 | ||||||
| KKR CLO 21 Ltd. |
1,169,646 | 1,167,911 | ||||||
| Knollwood CDO Ltd. |
863,096 | 86 | ||||||
| MF1 Ltd. |
685,000 | 664,438 | ||||||
| MFA LLC |
439,632 | 433,484 | ||||||
| Morgan Stanley ABS Capital I, Inc. Trust |
7,557 | 6,205 | ||||||
| Asset-Backed - Other—(Continued) | ||||||||
| New Economy Assets Phase 1 Sponsor LLC |
865,000 | 756,952 | ||||||
| NRZ Excess Spread-Collateralized Notes |
75,177 | 71,653 | ||||||
| Octagon 61 Ltd. |
745,000 | 744,950 | ||||||
| OZLM VII Ltd. |
105,238 | 105,161 | ||||||
| OZLM XVIII Ltd. |
830,596 | 829,628 | ||||||
| PRET LLC |
258,137 | 254,555 | ||||||
| Pretium Mortgage Credit Partners I LLC |
423,122 | 409,274 | ||||||
| Pretium Mortgage Credit Partners LLC |
696,767 | 679,961 | ||||||
| 2.981%, 01/25/52 (144A) (j) |
822,599 | 815,034 | ||||||
| Progress Residential Trust |
803,934 | 721,200 | ||||||
| 3.200%, 04/17/39 (144A) |
276,910 | 258,741 | ||||||
| 4.438%, 05/17/41 (144A) |
762,535 | 727,685 | ||||||
| 4.451%, 06/17/39 (144A) |
214,123 | 207,225 | ||||||
| 4.750%, 10/27/39 (144A) |
347,556 | 338,595 | ||||||
| Retained Vantage Data Centers Issuer LLC |
1,100,000 | 1,033,020 | ||||||
| RR 23 Ltd. |
1,110,000 | 1,108,761 | ||||||
| RR 26 Ltd. |
520,000 | 519,610 | ||||||
| Sapphire Aviation Finance II Ltd. |
166,346 | 141,911 | ||||||
| Sound Point CLO XXIX Ltd. |
1,300,000 | 1,287,967 | ||||||
| Stack Infrastructure Issuer LLC |
720,000 | 708,448 | ||||||
| Summit Issuer LLC |
320,000 | 296,042 | ||||||
| Taco Bell Funding LLC |
1,889,348 | 1,621,259 | ||||||
| Texas Debt Capital CLO Ltd. |
635,000 | 634,403 | ||||||
| Tricon Residential Trust |
770,763 | 754,738 | ||||||
| VCAT LLC |
369,809 | 356,830 | ||||||
| 2.115%, 03/27/51 (144A) (j) |
104,854 | 103,858 | ||||||
| Venture 42 CLO Ltd. |
1,300,000 | 1,287,437 | ||||||
| VOLT XCIV LLC |
384,928 | 375,113 | ||||||
| Voya CLO Ltd. |
372,643 | 372,354 | ||||||
| Wellfleet CLO X Ltd. |
1,063,640 | 1,059,909 | ||||||
| Wendy’s Funding LLC |
408,887 | 379,817 | ||||||
See accompanying notes to financial statements.
BHFTII-21
Brighthouse Funds Trust II
Brighthouse/Wellington Balanced Portfolio
Schedule of Investments as of December 31, 2023
Asset-Backed Securities—(Continued)
| Security Description | Principal Amount* |
Value | ||||||
| Asset-Backed - Other—(Continued) | ||||||||
| Wingstop Funding LLC |
315,200 | $ | 283,453 | |||||
|
|
|
|||||||
| 31,651,875 | ||||||||
|
|
|
|||||||
| Asset-Backed - Student Loan—0.1% | ||||||||
| Navient Private Education Refi Loan Trust | ||||||||
| 1.110%, 02/18/70 (144A) |
454,606 | 387,129 | ||||||
| 5.510%, 10/15/71 (144A) |
569,320 | 568,911 | ||||||
|
|
|
|||||||
| 956,040 | ||||||||
|
|
|
|||||||
| Total Asset-Backed Securities |
45,881,937 | |||||||
|
|
|
|||||||
| Mortgage-Backed Securities—3.8% |
| |||||||
| Collateralized Mortgage Obligations—2.3% | ||||||||
| Adjustable Rate Mortgage Trust |
64,850 | 58,950 | ||||||
| 6.010%, 1M TSFR + 0.654%, 11/25/35 (c) |
20,908 | 20,622 | ||||||
| Angel Oak Mortgage Trust |
630,686 | 530,357 | ||||||
| 0.985%, 04/25/66 (144A) (c) |
260,959 | 220,231 | ||||||
| 0.990%, 04/25/53 (144A) (c) |
201,911 | 184,389 | ||||||
| 1.068%, 05/25/66 (144A) (c) |
493,034 | 410,188 | ||||||
| 1.820%, 11/25/66 (144A) (c) |
457,238 | 386,800 | ||||||
| Arroyo Mortgage Trust |
292,220 | 274,913 | ||||||
| Bear Stearns ALT-A Trust |
208,427 | 183,445 | ||||||
| Bear Stearns ARM Trust |
127,688 | 108,247 | ||||||
| Bear Stearns Mortgage Funding Trust |
69,385 | 57,813 | ||||||
| 5.870%, 1M TSFR + 0.514%, 02/25/37 (c) |
281,148 | 255,849 | ||||||
| BINOM Securitization Trust |
306,939 | 263,330 | ||||||
| BRAVO Residential Funding Trust |
168,277 | 148,417 | ||||||
| 0.970%, 03/25/60 (144A) (c) |
136,607 | 126,961 | ||||||
| CHL Mortgage Pass-Through Trust |
166,711 | 145,769 | ||||||
| 4.448%, 06/20/35 (c) |
4,261 | 3,936 | ||||||
| 5.870%, 1M TSFR + 0.514%, 04/25/46 (c) |
162,362 | 134,533 | ||||||
| 6.150%, 1M TSFR + 0.794%, 02/25/35 (c) |
62,914 | 52,577 | ||||||
| COLT Mortgage Loan Trust |
430,765 | 348,462 | ||||||
| 0.956%, 09/27/66 (144A) (c) |
758,198 | 601,726 | ||||||
| 4.301%, 03/25/67 (144A) (c) |
169,144 | 163,432 | ||||||
| Countrywide Alternative Loan Trust |
318,528 | 180,941 | ||||||
| 5.500%, 1M TSFR + 0.914%, 12/25/35 (c) |
65,583 | 55,087 | ||||||
| 5.500%, 1M TSFR + 0.564%, 03/01/38 (c) |
122,144 | 89,894 | ||||||
| 6.010%, 1M TSFR + 0.654%, 01/25/36 (c) |
62,592 | 55,212 | ||||||
| 6.362%, 12M MTA + 1.350%, 08/25/35 (c) |
147,304 | 117,410 | ||||||
| Collateralized Mortgage Obligations—(Continued) | ||||||||
| CSMC Trust |
377,638 | 298,950 | ||||||
| 1.179%, 02/25/66 (144A) (c) |
528,091 | 449,371 | ||||||
| 1.796%, 12/27/60 (144A) (c) |
274,301 | 266,604 | ||||||
| 1.841%, 10/25/66 (144A) (c) |
482,861 | 406,047 | ||||||
| 2.265%, 11/25/66 (144A) (c) |
1,169,203 | 998,530 | ||||||
| 3.250%, 04/25/47 (144A) (c) |
275,129 | 247,602 | ||||||
| Deephaven Residential Mortgage Trust |
177,646 | 151,681 | ||||||
| Deutsche Alt-A Securities, Inc. Mortgage Loan Trust |
132,496 | 119,896 | ||||||
| Ellington Financial Mortgage Trust |
179,132 | 142,712 | ||||||
| 2.206%, 01/25/67 (144A) (c) |
543,733 | 456,257 | ||||||
| GCAT Trust |
368,095 | 301,295 | ||||||
| 1.091%, 05/25/66 (144A) (c) |
477,082 | 392,045 | ||||||
| 1.262%, 07/25/66 (144A) (c) |
946,820 | 754,041 | ||||||
| 1.915%, 08/25/66 (144A) (c) |
340,187 | 296,160 | ||||||
| GreenPoint Mortgage Funding Trust |
129,786 | 98,692 | ||||||
| GSR Mortgage Loan Trust |
144,943 | 131,372 | ||||||
| 5.770%, 1M TSFR + 0.414%, 01/25/37 (c) |
429,953 | 102,760 | ||||||
| 6.000%, 07/25/37 |
134,949 | 86,565 | ||||||
| Imperial Fund Mortgage Trust |
1,154,901 | 1,060,567 | ||||||
| IndyMac INDX Mortgage Loan Trust |
8,452 | 8,028 | ||||||
| JP Morgan Mortgage Trust |
10,305 | 8,358 | ||||||
| Legacy Mortgage Asset Trust |
180,260 | 171,438 | ||||||
| 1.750%, 04/25/61 (144A) (j) |
269,798 | 260,465 | ||||||
| 1.750%, 07/25/61 (144A) (j) |
353,790 | 340,243 | ||||||
| 7.250%, 11/25/59 (144A) (j) |
653,181 | 652,995 | ||||||
| LSTAR Securities Investment Ltd. |
449,229 | 440,453 | ||||||
| MASTR Adjustable Rate Mortgages Trust |
43,374 | 39,813 | ||||||
| 5.386%, 11/21/34 (c) |
30,850 | 28,871 | ||||||
| MetLife Securitization Trust |
279,648 | 266,044 | ||||||
| MFA Trust |
271,418 | 229,031 | ||||||
| 1.153%, 04/25/65 (144A) (c) |
186,244 | 169,074 | ||||||
| Morgan Stanley Mortgage Loan Trust |
124,784 | 54,096 | ||||||
| New Residential Mortgage Loan Trust |
155,579 | 141,508 | ||||||
| 2.492%, 09/25/59 (144A) (c) |
71,732 | 65,976 | ||||||
| 3.500%, 08/25/59 (144A) (c) |
273,063 | 255,313 | ||||||
| 3.750%, 11/26/35 (144A) (c) |
254,214 | 240,119 | ||||||
| 3.864%, 09/25/57 (144A) (c) |
383,055 | 359,176 | ||||||
| 4.000%, 03/25/57 (144A) (c) |
492,755 | 466,107 | ||||||
| 4.000%, 05/25/57 (144A) (c) |
271,546 | 256,272 | ||||||
See accompanying notes to financial statements.
BHFTII-22
Brighthouse Funds Trust II
Brighthouse/Wellington Balanced Portfolio
Schedule of Investments as of December 31, 2023
Mortgage-Backed Securities—(Continued)
| Security Description | Principal Amount* |
Value | ||||||
| Collateralized Mortgage Obligations—(Continued) | ||||||||
| New Residential Mortgage Loan Trust |
318,496 | $ | 306,782 | |||||
| NMLT Trust |
774,135 | 633,572 | ||||||
| OBX Trust |
477,633 | 364,981 | ||||||
| 1.072%, 02/25/66 (144A) (c) |
493,562 | 406,964 | ||||||
| 2.305%, 11/25/61 (144A) (c) |
944,784 | 810,006 | ||||||
| Preston Ridge Partners Mortgage LLC |
487,762 | 475,104 | ||||||
| 1.793%, 07/25/26 (144A) (j) |
410,368 | 398,463 | ||||||
| 1.867%, 04/25/26 (144A) (j) |
778,075 | 759,424 | ||||||
| 2.363%, 10/25/26 (144A) (j) |
857,223 | 830,583 | ||||||
| 2.487%, 10/25/26 (144A) (j) |
377,482 | 363,374 | ||||||
| 5.363%, 11/25/25 (144A) (j) |
115,633 | 115,725 | ||||||
| Residential Accredit Loans, Inc. Trust |
108,783 | 94,116 | ||||||
| 6.070%, 1M TSFR + 0.714%, 04/25/36 (c) |
426,695 | 365,442 | ||||||
| RFMSI Trust |
43,813 | 19,165 | ||||||
| STAR Trust |
367,430 | 324,799 | ||||||
| Starwood Mortgage Residential Trust |
131,503 | 118,633 | ||||||
| 1.920%, 11/25/66 (144A) (c) |
743,884 | 611,377 | ||||||
| Structured Adjustable Rate Mortgage Loan Trust |
32,346 | 28,014 | ||||||
| Toorak Mortgage Corp. Ltd. |
369,868 | 362,272 | ||||||
| Towd Point Mortgage Trust |
1,190,262 | 1,023,871 | ||||||
| Verus Securitization Trust |
233,584 | 205,541 | ||||||
| 0.938%, 07/25/66 (144A) (c) |
331,872 | 263,455 | ||||||
| 1.031%, 02/25/66 (144A) (c) |
201,000 | 173,464 | ||||||
| 1.824%, 11/25/66 (144A) (c) |
516,806 | 446,819 | ||||||
| 1.829%, 10/25/66 (144A) (c) |
1,188,800 | 1,032,038 | ||||||
| 4.130%, 02/25/67 (144A) (j) |
171,224 | 159,341 | ||||||
| WaMu Mortgage Pass-Through Certificates Trust |
62,876 | 53,537 | ||||||
| 5.892%, 12M MTA + 0.880%, 10/25/46 (c) |
114,489 | 94,897 | ||||||
| Washington Mutual Mortgage Pass-Through Certificates WMALT Trust |
51,118 | 33,843 | ||||||
| Wells Fargo Mortgage-Backed Securities Trust |
34,020 | 31,994 | ||||||
| 6.240%, 10/25/36 (c) |
39,303 | 35,868 | ||||||
|
|
|
|||||||
| 27,337,482 | ||||||||
|
|
|
|||||||
| Commercial Mortgage-Backed Securities—1.5% | ||||||||
| BANK |
4,530,778 | 127,366 | ||||||
| 0.635%, 11/15/62 (c) (d) |
2,232,456 | 69,251 | ||||||
| 0.686%, 12/15/52 (c) (d) |
3,616,761 | 117,327 | ||||||
| 0.710%, 11/15/50 (c) (d) |
6,765,960 | 149,184 | ||||||
| 0.755%, 11/15/54 (c) (d) |
777,903 | 17,217 | ||||||
| 0.811%, 09/15/62 (c) (d) |
4,022,002 | 146,420 | ||||||
| Commercial Mortgage-Backed Securities—(Continued) | ||||||||
| BANK |
2,857,809 | 106,402 | ||||||
| 0.995%, 02/15/56 (c) (d) |
1,365,327 | 87,105 | ||||||
| 1.197%, 12/15/56 (c) (d) |
1,000,000 | 40,531 | ||||||
| 1.760%, 03/15/63 (c) (d) |
4,880,031 | 434,057 | ||||||
| 2.036%, 02/15/54 |
565,000 | 463,243 | ||||||
| 3.688%, 02/15/61 |
1,700,000 | 1,609,577 | ||||||
| BBCMS Mortgage Trust | ||||||||
| 0.986%, 04/15/53 (c) (d) |
1,280,000 | 69,356 | ||||||
| 1.455%, 02/15/50 (c) (d) |
4,735,175 | 169,689 | ||||||
| 3.662%, 04/15/55 (c) |
230,000 | 208,166 | ||||||
| 4.600%, 06/15/55 (c) |
245,000 | 238,131 | ||||||
| 4.967%, 12/15/51 (c) |
475,000 | 385,719 | ||||||
| 5.439%, 12/15/55 (c) |
325,000 | 335,053 | ||||||
| 5.710%, 12/15/55 (c) |
105,000 | 110,280 | ||||||
| Benchmark Mortgage Trust |
3,944,362 | 58,615 | ||||||
| 0.519%, 01/15/51 (c) (d) |
1,702,560 | 28,102 | ||||||
| 1.024%, 08/15/52 (c) (d) |
1,960,353 | 68,041 | ||||||
| 1.194%, 03/15/62 (c) (d) |
5,761,210 | 286,389 | ||||||
| 1.512%, 01/15/54 (c) (d) |
2,353,792 | 186,762 | ||||||
| 1.780%, 07/15/53 (c) (d) |
1,294,916 | 84,230 | ||||||
| 3.882%, 02/15/51 (c) |
795,000 | 745,856 | ||||||
| 4.016%, 03/15/52 |
630,000 | 588,116 | ||||||
| BPR Trust |
575,000 | 572,474 | ||||||
| BX Trust |
522,603 | 523,985 | ||||||
| CAMB Commercial Mortgage Trust |
665,000 | 637,879 | ||||||
| Citigroup Commercial Mortgage Trust |
2,984,374 | 6,818 | ||||||
| 1.012%, 04/10/48 (c) (d) |
3,661,350 | 33,929 | ||||||
| COMM Mortgage Trust |
634,556 | 2 | ||||||
| 1.144%, 10/15/45 (c) (d) |
68,890 | 5 | ||||||
| 2.819%, 01/10/39 (144A) |
205,000 | 179,669 | ||||||
| 2.853%, 10/15/45 |
5,934 | 5,410 | ||||||
| 3.796%, 08/10/47 |
225,000 | 221,724 | ||||||
| 3.896%, 01/10/39 (144A) (c) |
210,000 | 164,020 | ||||||
| 3.961%, 03/10/47 |
93,673 | 93,509 | ||||||
| 4.074%, 02/10/47 (c) |
72,047 | 71,911 | ||||||
| 4.236%, 02/10/47 (c) |
26,326 | 26,275 | ||||||
| Credit Suisse First Boston Mortgage Securities Corp. |
442 | 436 | ||||||
| CSAIL Commercial Mortgage Trust |
10,610,660 | 60,522 | ||||||
| 0.891%, 11/15/48 (c) (d) |
660,183 | 8,453 | ||||||
| 1.857%, 01/15/49 (c) (d) |
1,448,126 | 44,914 | ||||||
| DBJPM Mortgage Trust |
1,005,900 | 56,750 | ||||||
| GS Mortgage Securities Corp. Trust |
1,200,000 | 858,888 | ||||||
| GS Mortgage Securities Trust |
704,285 | 7 | ||||||
| 1.704%, 08/10/44 (144A) (c) (d) |
109,156 | 1 | ||||||
| 4.993%, 04/10/47 (144A) (c) |
465,000 | 374,065 | ||||||
See accompanying notes to financial statements.
BHFTII-23
Brighthouse Funds Trust II
Brighthouse/Wellington Balanced Portfolio
Schedule of Investments as of December 31, 2023
Mortgage-Backed Securities—(Continued)
| Security Description | Principal Amount* |
Value | ||||||
| Commercial Mortgage-Backed Securities—(Continued) | ||||||||
| JP Morgan Chase Commercial Mortgage Securities Trust |
259,258 | $ | 228,960 | |||||
| 2.812%, 01/16/37 (144A) |
305,000 | 255,723 | ||||||
| 3.784%, 12/15/47 (144A) (c) |
130,000 | 83,275 | ||||||
| JPMBB Commercial Mortgage Securities Trust |
2,502,875 | 5,834 | ||||||
| Morgan Stanley Bank of America Merrill Lynch Trust |
1,677,065 | 6,054 | ||||||
| 0.963%, 10/15/48 (c) (d) |
715,224 | 6,283 | ||||||
| Morgan Stanley Capital I Trust | ||||||||
| 1.321%, 06/15/50 (c) (d) |
1,467,779 | 40,804 | ||||||
| 3.912%, 09/09/32 (144A) |
1,140,000 | 936,440 | ||||||
| 4.944%, 07/15/49 (144A) (c) |
265,000 | 188,490 | ||||||
| 5.257%, 10/12/52 (144A) (c) |
12,137 | 4,472 | ||||||
| NJ Trust |
480,000 | 500,425 | ||||||
| SFAVE Commercial Mortgage Securities Trust |
150,000 | 110,112 | ||||||
| SG Commercial Mortgage Securities Trust |
1,230,000 | 1,103,275 | ||||||
| TYSN Mortgage Trust |
895,000 | 931,521 | ||||||
| UBS Commercial Mortgage Trust |
690,011 | 20,677 | ||||||
| Wells Fargo Commercial Mortgage Trust |
4,474,863 | 52,915 | ||||||
| 1.058%, 05/15/48 (c) (d) |
2,531,695 | 19,163 | ||||||
| 2.942%, 10/15/49 |
890,000 | 836,406 | ||||||
| 4.140%, 05/15/48 (c) |
80,000 | 68,589 | ||||||
| WFRBS Commercial Mortgage Trust |
289,534 | 17 | ||||||
| 3.016%, 11/15/47 (144A) |
88,049 | 4,819 | ||||||
| 3.723%, 05/15/47 |
35,470 | 35,282 | ||||||
| 3.995%, 05/15/47 |
160,281 | 158,329 | ||||||
| 4.045%, 03/15/47 |
2,462 | 2,455 | ||||||
| 4.101%, 03/15/47 |
260,199 | 259,081 | ||||||
| 5.000%, 06/15/44 (144A) (c) |
105,000 | 53,430 | ||||||
|
|
|
|||||||
| 16,784,662 | ||||||||
|
|
|
|||||||
| Total Mortgage-Backed Securities |
44,122,144 | |||||||
|
|
|
|||||||
| Foreign Government—1.2% |
| |||||||
| Banks—0.0% | ||||||||
| Bank Gospodarstwa Krajowego |
200,000 | 202,622 | ||||||
|
|
|
|||||||
| Sovereign—1.2% | ||||||||
| Angola Government International Bond |
400,000 | 354,760 | ||||||
| Benin Government International Bond |
620,000 | 537,703 | ||||||
| Bermuda Government International Bonds |
200,000 | 171,178 | ||||||
| 5.000%, 07/15/32 (144A) |
405,000 | 401,760 | ||||||
| Sovereign—(Continued) | ||||||||
| Brazil Notas do Tesouro Nacional |
11,104,000 | 2,256,971 | ||||||
| Chile Government International Bond |
250,000 | 154,159 | ||||||
| Colombia Government International Bonds |
800,000 | 619,992 | ||||||
| 5.200%, 05/15/49 |
200,000 | 156,143 | ||||||
| 5.625%, 02/26/44 |
225,000 | 188,891 | ||||||
| Costa Rica Government International Bond |
280,000 | 289,800 | ||||||
| Hungary Government International Bonds |
1,320,000 | 1,181,919 | ||||||
| 6.125%, 05/22/28 (144A) |
510,000 | 529,731 | ||||||
| Indonesia Government International Bonds |
1,170,000 | 1,018,785 | ||||||
| 2.150%, 07/18/24 (EUR) |
100,000 | 108,954 | ||||||
| Ivory Coast Government International Bond |
460,000 | 426,912 | ||||||
| North Macedonia Government International Bonds |
425,000 | 457,424 | ||||||
| 3.675%, 06/03/26 (144A) (EUR) |
515,000 | 550,557 | ||||||
| Panama Government International Bond |
200,000 | 199,428 | ||||||
| Philippines Government International Bonds |
775,000 | 684,783 | ||||||
| 1.750%, 04/28/41 (EUR) |
300,000 | 230,853 | ||||||
| Romania Government International Bonds |
635,000 | 469,663 | ||||||
| 2.750%, 04/14/41 (EUR) |
1,810,000 | 1,338,760 | ||||||
| 3.375%, 02/08/38 (EUR) |
310,000 | 267,332 | ||||||
| Saudi Government International Bonds |
285,000 | 242,806 | ||||||
| 5.000%, 01/18/53 (144A) |
600,000 | 564,791 | ||||||
|
|
|
|||||||
| 13,404,055 | ||||||||
|
|
|
|||||||
| Total Foreign Government |
13,606,677 | |||||||
|
|
|
|||||||
| Municipals—0.6% |
| |||||||
| Chicago Board of Education, General Obligation Unlimited |
325,000 | 307,499 | ||||||
| 6.319%, 11/01/29 |
470,000 | 470,580 | ||||||
| Chicago Transit Authority Sales Tax Receipts Fund |
170,000 | 147,140 | ||||||
| Metropolitan Transportation Authority |
505,000 | 520,062 | ||||||
| 5.175%, 11/15/49 |
1,120,000 | 1,091,958 | ||||||
| Municipal Electric Authority of Georgia |
189,000 | 215,665 | ||||||
| New York Transportation Development Corp. |
1,015,000 | 989,197 | ||||||
| Philadelphia Authority for Industrial Development |
1,235,000 | 1,315,778 | ||||||
See accompanying notes to financial statements.
BHFTII-24
Brighthouse Funds Trust II
Brighthouse/Wellington Balanced Portfolio
Schedule of Investments as of December 31, 2023
Municipals—(Continued)
| Security Description | Principal |
Value | ||||||
| State Board of Administration Finance Corp. |
975,000 | $ | 925,109 | |||||
| State of California, General Obligation Unlimited |
180,000 | 217,619 | ||||||
| Texas Natural Gas Securitization Finance Corp. |
595,000 | 606,387 | ||||||
|
|
|
|||||||
| Total Municipals |
6,806,994 | |||||||
|
|
|
|||||||
| Floating Rate Loan (k)—0.0% |
| |||||||
| Oil & Gas—0.0% | ||||||||
| Paragon Offshore Finance Co. |
587 | 0 | ||||||
|
|
|
|||||||
| Short-Term Investment—0.8% |
| |||||||
| Repurchase Agreement—0.8% | ||||||||
| Fixed Income Clearing Corp. |
9,028,713 | 9,028,713 | ||||||
|
|
|
|||||||
| Total Short-Term Investments |
9,028,713 | |||||||
|
|
|
|||||||
| Securities Lending Reinvestments (o)—2.0% |
| |||||||
| Repurchase Agreements—1.0% | ||||||||
| Bank of Nova Scotia |
3,400,000 | 3,400,000 | ||||||
| Barclays Bank PLC |
500,000 | 500,000 | ||||||
| Citigroup Global Markets, Inc. |
1,000,000 | 1,000,000 | ||||||
| Deutsche Bank Securities, Inc. |
453,314 | 453,314 | ||||||
| Repurchase Agreements—(Continued) | ||||||||
| NBC Global Finance Ltd. |
4,400,000 | 4,400,000 | ||||||
| Societe Generale |
||||||||
| Repurchase Agreement dated 12/29/23 at 5.330%, due on 01/02/24 with a maturity value of $200,118; collateralized by U.S. Treasury Obligations with rates ranging from 0.625% - 4.750%, maturity dates ranging from 04/15/26 - 08/15/51, and an aggregate market value of $204,453. |
200,000 | 200,000 | ||||||
| Repurchase Agreement dated 12/29/23 at 5.510%, due on 01/02/24 with a maturity value of $100,061; collateralized by various Common Stock with an aggregate market value of $111,313. |
100,000 | 100,000 | ||||||
| TD Prime Services LLC |
2,000,000 | 2,000,000 | ||||||
|
|
|
|||||||
| 12,053,314 | ||||||||
|
|
|
|||||||
| Mutual Funds—1.0% | ||||||||
| BlackRock Liquidity Funds FedFund, Institutional Shares 5.260% (p) |
2,000,000 | 2,000,000 | ||||||
| Fidelity Investments Money Market Government Portfolio, Class I 5.250% (p) |
1,000,000 | 1,000,000 | ||||||
| Goldman Sachs Financial Square Government Fund, Institutional Shares 5.230% (p) |
1,000,000 | 1,000,000 | ||||||
| HSBC U.S. Government Money Market Fund, Class I |
1,000,000 | 1,000,000 | ||||||
| RBC U.S. Government Money Market Fund, Institutional Share 5.230% (p) |
3,500,000 | 3,500,000 | ||||||
| State Street Institutional U.S. Government Money Market Fund, Premier Class 5.320% (p) |
2,000,000 | 2,000,000 | ||||||
| Western Asset Institutional Government Reserves Fund, Institutional Class 5.270% (p) |
1,000,000 | 1,000,000 | ||||||
|
|
|
|||||||
| 11,500,000 | ||||||||
|
|
|
|||||||
| Total Securities Lending Reinvestments |
23,553,314 | |||||||
|
|
|
|||||||
| Total Investments—108.9% |
1,266,216,729 | |||||||
| Other assets and liabilities (net)—(8.9)% |
(103,113,964 | ) | ||||||
|
|
|
|||||||
| Net Assets—100.0% | $ | 1,163,102,765 | ||||||
|
|
|
|||||||
See accompanying notes to financial statements.
BHFTII-25
Brighthouse Funds Trust II
Brighthouse/Wellington Balanced Portfolio
Schedule of Investments as of December 31, 2023
| * | Principal amount stated in U.S. dollars unless otherwise noted. | |||
| † | Restricted securities are not registered under the Securities Act of 1933 and are subject to legal restrictions on resale. These securities generally may be resold in transactions exempt from registration or to the public if the securities are subsequently registered. Disposal of these securities may involve time-consuming negotiations and prompt sale at an acceptable price may be difficult. As of December 31, 2023, the market value of restricted securities was $428,209, which is less than 0.05% of net assets. See details shown in the Restricted Securities table that follows. | |||
| (a) | Non-income producing security. | |||
| (b) | All or a portion of the security was held on loan. As of December 31, 2023, the market value of securities loaned was $38,226,422 and the collateral received consisted of cash in the amount of $23,553,314 and non-cash collateral with a value of $15,751,936. The cash collateral investments are disclosed in the Schedule of Investments and categorized as Securities Lending Reinvestments. The non-cash collateral received consists of U.S. government securities that are held in safe-keeping by the lending agent, or a third-party custodian, and cannot be sold or repledged by the Portfolio. As such, this collateral is excluded from the Statement of Assets and Liabilities. | |||
| (c) | Variable or floating rate security. The stated rate represents the rate at December 31, 2023. Maturity date shown for callable securities reflects the earliest possible call date. For securities based on a published reference index and spread, the index and spread are indicated in the description above. For certain variable rate securities, the coupon rate is determined by the issuer/agent based on current market conditions. For certain asset- and mortgage-backed securities, the coupon rate may fluctuate based on changes of the underlying collateral or prepayments of principal. These securities do not indicate a reference index and spread in their description above. | |||
| (d) | Interest only security. | |||
| (e) | Principal only security. | |||
| (f) | TBA (To Be Announced) Securities are purchased on a forward commitment basis with an approximate principal amount and no defined maturity date. The actual principal and maturity date will be determined upon settlement date. | |||
| (g) | All or a portion of the security was pledged as collateral against open futures contracts. As of December 31, 2023, the market value of securities pledged was $2,054,524. | |||
| (h) | All or a portion of the security was pledged as collateral against open centrally cleared swap contracts. As of December 31, 2023, the market value of securities pledged was $1,616,461. | |||
| (i) | Principal amount of security is adjusted for inflation. | |||
| (j) | Security is a “step-up” bond where coupon increases or steps up at a predetermined date. Rate shown is current coupon rate. | |||
| (k) | Floating rate loans (“Senior Loans”) often require prepayments from excess cash flows or permit the borrowers to repay at their election. The degree to which borrowers repay, whether as a contractual requirement or at their election, cannot be predicted with accuracy. As a result, the actual remaining maturity may be substantially less than the stated maturities shown. However, Senior Loans will generally have an expected average life of approximately two to four years. Senior Loans typically have rates of interest which are determined periodically by reference to a base lending rate, plus a spread. These base rates are primarily the Secured Overnight Financing Rate and secondarily, the prime rate offered by one or more major United States banks. Base lending rates may be subject to a floor, or a minimum rate. | |||
| (l) | Security was valued in good faith under procedures subject to oversight by the Board of Trustees. As of December 31, 2023, these securities represent less than 0.05% of net assets. | |||
| (m) | Significant unobservable inputs were used in the valuation of this portfolio security; i.e. Level 3. | |||
| (n) | Non-income producing; security is in default and/or issuer is in bankruptcy. | |||
| (o) | Represents investment of cash collateral received from securities on loan as of December 31, 2023. | |||
| (p) | The rate shown represents the annualized seven-day yield as of December 31, 2023. | |||
| (144A) | Securities exempt from registration under Rule 144A of the Securities Act of 1933. These securities may be resold in transactions exempt from registration, normally to qualified institutional buyers. As of December 31, 2023, the market value of 144A securities was $130,096,635, which is 11.2% of net assets. | |||
| Restricted Securities |
Acquisition Date |
Principal Amount |
Cost | Value | ||||||||||||
| Intesa Sanpaolo SpA, 7.800%, 11/28/53 |
11/20/23 | $ | 390,000 | $ | 389,104 | $ | 428,209 | |||||||||
|
|
|
|||||||||||||||
TBA Forward Sale Commitments
| Security Description |
Interest Rate | Maturity | Face Amount |
Cost | Value | |||||||||||||||
| Government National Mortgage Association, TBA |
3.000 | % | TBA | $ | (1,375,000 | ) | $ | (1,213,169 | ) | $ | (1,244,801 | ) | ||||||||
| Government National Mortgage Association, TBA |
3.500 | % | TBA | (2,424,000 | ) | (2,246,315 | ) | (2,257,350 | ) | |||||||||||
| Government National Mortgage Association, TBA |
4.500 | % | TBA | (245,000 | ) | (239,277 | ) | (239,105 | ) | |||||||||||
| Government National Mortgage Association, TBA |
5.000 | % | TBA | (2,150,000 | ) | (2,133,539 | ) | (2,134,886 | ) | |||||||||||
| Uniform Mortgage-Backed Security, TBA |
1.500 | % | TBA | (75,000 | ) | (55,957 | ) | (58,406 | ) | |||||||||||
| Uniform Mortgage-Backed Security, TBA |
3.000 | % | TBA | (2,764,000 | ) | (2,343,571 | ) | (2,418,218 | ) | |||||||||||
| Uniform Mortgage-Backed Security, TBA |
4.000 | % | TBA | (2,395,000 | ) | (2,256,107 | ) | (2,265,052 | ) | |||||||||||
| Uniform Mortgage-Backed Security, TBA |
5.000 | % | TBA | (6,650,000 | ) | (6,481,684 | ) | (6,578,824 | ) | |||||||||||
|
|
|
|
|
|||||||||||||||||
| Totals |
|
$ | (16,969,619 | ) | $ | (17,196,642 | ) | |||||||||||||
|
|
|
|
|
|||||||||||||||||
Forward Foreign Currency Exchange Contracts
| Contracts to Deliver |
Counterparty |
Settlement Date |
In Exchange for |
Unrealized Depreciation |
||||||||||||||||||
| BRL | 10,580,000 | DBAG |
03/20/24 | USD | 2,114,625 | $ | (47,637 | ) | ||||||||||||||
| EUR | 456,000 | CBNA |
03/20/24 | USD | 501,848 | (3,102 | ) | |||||||||||||||
| EUR | 7,843,000 | DBAG |
03/20/24 | USD | 8,631,990 | (52,911 | ) | |||||||||||||||
|
|
|
|||||||||||||||||||||
| Net Unrealized Depreciation |
|
$ | (103,650 | ) | ||||||||||||||||||
|
|
|
|||||||||||||||||||||
See accompanying notes to financial statements.
BHFTII-26
Brighthouse Funds Trust II
Brighthouse/Wellington Balanced Portfolio
Schedule of Investments as of December 31, 2023
Futures Contracts
| Futures Contracts—Long |
Expiration Date |
Number of Contracts |
Notional Value |
Value/ Unrealized Appreciation/ (Depreciation) |
||||||||||||||||
| U.S. Treasury Note 10 Year Futures |
03/19/24 | 61 | USD | 6,886,328 | $ | 257 | ||||||||||||||
| U.S. Treasury Note 2 Year Futures |
03/28/24 | 119 | USD | 24,503,773 | 259,167 | |||||||||||||||
| U.S. Treasury Note 5 Year Futures |
03/28/24 | 554 | USD | 60,260,485 | 1,496,106 | |||||||||||||||
| U.S. Treasury Note Ultra 10 Year Futures |
03/19/24 | 29 | USD | 3,422,453 | 152,889 | |||||||||||||||
| Futures Contracts—Short |
||||||||||||||||||||
| Canada Government Bond 10 Year Futures |
03/19/24 | (134 | ) | CAD | (16,640,120 | ) | (537,303 | ) | ||||||||||||
| Euro-BTP Futures |
03/07/24 | (23 | ) | EUR | (2,740,450 | ) | (89,905 | ) | ||||||||||||
| Euro-Bund Futures |
03/07/24 | (39 | ) | EUR | (5,351,580 | ) | (149,865 | ) | ||||||||||||
| Euro-Buxl 30 Year Bond Futures |
03/07/24 | (18 | ) | EUR | (2,550,960 | ) | (180,123 | ) | ||||||||||||
| U.S. Treasury Long Bond Futures |
03/19/24 | (46 | ) | USD | (5,747,125 | ) | (441,787 | ) | ||||||||||||
| U.S. Treasury Ultra Long Bond Futures |
03/19/24 | (15 | ) | USD | (2,003,906 | ) | (193,852 | ) | ||||||||||||
|
|
|
|||||||||||||||||||
| Net Unrealized Appreciation |
|
$ | 315,584 | |||||||||||||||||
|
|
|
|||||||||||||||||||
Swap Agreements
Centrally Cleared Interest Rate Swaps
| Pay/Receive |
Floating Rate Index |
Payment Frequency |
Fixed Rate |
Payment |
Maturity Date |
Notional Amount |
Market Value |
Upfront Premiums Paid/(Received) |
Unrealized Appreciation/ (Depreciation) |
|||||||||||||||||||||||||
| Receive |
12M SOFR | Annually | 2.880% | Annually | 03/15/53 | USD | 1,610,000 | $ | 131,631 | $ | 18,244 | $ | 113,387 | |||||||||||||||||||||
| Receive |
12M SOFR | Annually | 2.970% | Annually | 03/15/53 | USD | 2,325,000 | 151,581 | 4,658 | 146,923 | ||||||||||||||||||||||||
| Receive |
12M SOFR | Annually | 3.250% | Annually | 06/21/53 | USD | 860,000 | 11,114 | (8,700 | ) | 19,814 | |||||||||||||||||||||||
| Receive |
12M SOFR | Annually | 3.590% | Annually | 09/20/53 | USD | 2,955,000 | (151,190 | ) | 13,083 | (164,273 | ) | ||||||||||||||||||||||
|
|
|
|
|
|
|
|||||||||||||||||||||||||||||
| Totals |
|
$ | 143,136 | $ | 27,285 | $ | 115,851 | |||||||||||||||||||||||||||
|
|
|
|
|
|
|
|||||||||||||||||||||||||||||
Centrally Cleared Credit Default Swaps on Credit Indices and Sovereign Issues—Buy Protection (a)
| Reference Obligation |
Fixed Deal (Pay) Rate |
Payment Frequency |
Maturity Date |
Implied Credit Spread at December 31, 2023(b) |
Notional Amount(c) |
Market Value |
Upfront Premiums Paid/(Received) |
Unrealized Appreciation/ (Depreciation) |
||||||||||||||||||||||||||||
| Brazilian Government International Bond 4.250%, due 01/07/25 |
(1.000 | %) | Quarterly | 06/20/28 | 1.140 | % | USD | 2,335,000 | $ | 13,149 | $ | 106,168 | $ | (93,019 | ) | |||||||||||||||||||||
| CDX.EM.40.V1 |
(1.000 | %) | Quarterly | 12/20/28 | 1.667 | % | USD | 3,350,000 | 97,046 | 159,237 | (62,191 | ) | ||||||||||||||||||||||||
|
|
|
|
|
|
|
|||||||||||||||||||||||||||||||
| Totals |
|
$ | 110,195 | $ | 265,405 | $ | (155,210 | ) | ||||||||||||||||||||||||||||
|
|
|
|
|
|
|
|||||||||||||||||||||||||||||||
| (a) | If the Portfolio is a buyer of protection and a credit event occurs, as defined under the terms of that particular swap agreement, the Portfolio will either (i) receive from the seller of protection an amount equal to the notional amount of the swap and deliver the referenced obligation or underlying securities comprising the referenced index or (ii) receive a net settlement amount in the form of cash or securities equal to the notional amount of the swap less the recovery value of the referenced obligation or underlying securities comprising the referenced index. |
| (b) | Implied credit spreads, represented in absolute terms, utilized in determining the market value of credit default swap agreements on corporate issues or indices as of period end serve as an indicator of the current status of the payment/performance risk and represent the likelihood or risk of default for the credit derivative. The implied credit spread of a particular referenced entity reflects the cost of buying/selling protection and may include upfront payments required to be made to enter into the agreement. Wider credit spreads represent a deterioration of the referenced entity’s credit soundness and a greater likelihood or risk of default or other credit event occurring as defined under the terms of the agreement. A credit spread identified as “Defaulted” indicates a credit event has occurred for the referenced entity or obligation. |
| (c) | The maximum potential amount of future undiscounted payments that the Portfolio could be required to make under a credit default swap contract would be the notional amount of the contract. These potential amounts would be partially offset by any recovery values of the referenced debt obligation or net amounts received from the settlement of purchased protection credit default swap contracts entered into by the Portfolio for the same referenced debt obligation. |
See accompanying notes to financial statements.
BHFTII-27
Brighthouse Funds Trust II
Brighthouse/Wellington Balanced Portfolio
Schedule of Investments as of December 31, 2023
Glossary of Abbreviations
Counterparties
| (CBNA)— | Citibank NA | |||
| (DBAG)— | Deutsche Bank AG | |||
Currencies
| (BRL)— | Brazilian Real | |||
| (CAD)— | Canadian Dollar | |||
| (EUR)— | Euro | |||
| (USD)— | United States Dollar | |||
Index Abbreviations
| (CDX.EM)— | Markit Emerging Market CDS Index | |||
| (EURIBOR)— | Euro InterBank Offered Rate | |||
| (H15)— | U.S. Treasury Yield Curve Rate T-Note Constant Maturity Index | |||
| (MTA)— | Monthly Treasury Average Index | |||
| (SOFR)— | Secured Overnight Financing Rate | |||
| (SOFR30A)— | Secured Overnight Financing Rate 30-Day Average | |||
| (RFUCCT)— | Refinitiv USD IBOR Consumer Cash Fallbacks Term | |||
| (TSFR)— | Term Secured Financing Rate | |||
Other Abbreviations
| (ACES)— | Alternative Credit Enhancement Securities | |||
| (ARM)— | Adjustable-Rate Mortgage | |||
| (ADR)— | American Depositary Receipt | |||
| (CDO)— | Collateralized Debt Obligation | |||
| (CLO)— | Collateralized Loan Obligation | |||
| (ICE)— | Intercontinental Exchange, Inc. | |||
| (REIT)— | Real Estate Investment Trust | |||
| (REMIC)— | Real Estate Mortgage Investment Conduit | |||
| (STACR)— | Structured Agency Credit Risk | |||
Fair Value Hierarchy
Accounting principles generally accepted in the United States of America (“GAAP”) define fair market value as the price that the Portfolio would receive to sell an asset or pay to transfer a liability in an orderly transaction between market participants at the measurement date. It establishes a fair value hierarchy that prioritizes inputs to valuation methods and requires disclosure of the fair value hierarchy, separately for each major category of assets and liabilities, that segregates fair value measurements into three levels. Levels 1, 2 and 3 of the fair value hierarchy are defined as follows:
Level 1 - unadjusted quoted prices in active markets for identical investments
Level 2 - other significant observable inputs (including, but not limited to, quoted prices for similar assets or liabilities in markets that are either active or inactive; inputs other than quoted prices that are observable such as interest rates, yield curves, volatilities, prepayment speeds, loss severities, credit risks, default rates, or other market corroborated inputs)
Level 3 - significant unobservable inputs based on the best information available in the circumstances, to the extent observable inputs are unavailable (including the Portfolio’s own assumptions used in determining the fair value of investments and derivative financial instruments)
The inputs or methodologies used for valuing investments are not necessarily an indication of the risk associated with investing in them. Changes to the inputs or methodologies used may result in transfers between levels. A reconciliation of Level 3 securities, if any, will be disclosed following the fair value hierarchy table. For more information about the Portfolio’s policy regarding the valuation of investments, please refer to the Notes to Financial Statements.
The following table summarizes the fair value hierarchy of the Portfolio’s investments as of December 31, 2023:
| Description | Level 1 | Level 2 | Level 3 | Total | ||||||||||||
| Total Common Stocks* |
$ | 706,136,971 | $ | — | $ | — | $ | 706,136,971 | ||||||||
| Total U.S. Treasury & Government Agencies* |
— | 281,375,128 | — | 281,375,128 | ||||||||||||
| Total Corporate Bonds & Notes* |
— | 135,704,851 | — | 135,704,851 | ||||||||||||
| Total Asset-Backed Securities* |
— | 45,881,937 | — | 45,881,937 | ||||||||||||
| Total Mortgage-Backed Securities* |
— | 44,122,144 | — | |
44,122,144 |
| ||||||||||
| Total Foreign Government* |
— | 13,606,677 | — | 13,606,677 | ||||||||||||
| Total Municipals* |
— | 6,806,994 | — | 6,806,994 | ||||||||||||
| Total Floating Rate Loan* |
— | — | 0 | 0 | ||||||||||||
| Total Short-Term Investment* |
— | 9,028,713 | — | 9,028,713 | ||||||||||||
| Securities Lending Reinvestments |
| |||||||||||||||
| Repurchase Agreements |
— | 12,053,314 | — | 12,053,314 | ||||||||||||
| Mutual Funds |
11,500,000 | — | — | 11,500,000 | ||||||||||||
| Total Securities Lending Reinvestments |
11,500,000 | 12,053,314 | — | 23,553,314 | ||||||||||||
| Total Investments |
$ | 717,636,971 | $ | 548,579,758 | $ | — | $ | 1,266,216,729 | ||||||||
| Collateral for Securities Loaned (Liability) |
$ | — | $ | (23,553,314 | ) | $ | — | $ | (23,553,314 | ) | ||||||
| TBA Forward Sales Commitments (Liability) |
$ | — | $ | (17,196,642 | ) | $ | — | $ | (17,196,642 | ) | ||||||
See accompanying notes to financial statements.
BHFTII-28
Brighthouse Funds Trust II
Brighthouse/Wellington Balanced Portfolio
Schedule of Investments as of December 31, 2023
Fair Value Hierarchy—(Continued)
| Description | Level 1 | Level 2 | Level 3 | Total | ||||||||||||
| Forward Contracts |
| |||||||||||||||
| Forward Foreign Currency Exchange Contracts (Unrealized Depreciation) |
$ | — | $ | (103,650 | ) | $ | — | $ | (103,650 | ) | ||||||
| Futures Contracts |
| |||||||||||||||
| Futures Contracts (Unrealized Appreciation) |
$ | 1,908,419 | $ | — | $ | — | $ | 1,908,419 | ||||||||
| Futures Contracts (Unrealized Depreciation) |
(1,592,835 | ) | — | — | (1,592,835 | ) | ||||||||||
| Total Futures Contracts |
$ | 315,584 | $ | — | $ | — | $ | 315,584 | ||||||||
| Centrally Cleared Swap Contracts |
| |||||||||||||||
| Centrally Cleared Swap Contracts (Unrealized Appreciation) |
$ | — | $ | 280,124 | $ | — | $ | 280,124 | ||||||||
| Centrally Cleared Swap Contracts (Unrealized Depreciation) |
— | (319,483 | ) | — | (319,483 | ) | ||||||||||
| Total Centrally Cleared Swap Contracts |
$ | — | $ | (39,359 | ) | $ | — | $ | (39,359 | ) | ||||||
| * | See Schedule of Investments for additional detailed categorizations. | |||
Level 3 investments at the beginning and/or end of the period in relation to net assets were not significant and accordingly, a reconciliation of Level 3 assets for the year ended December 31, 2023 is not presented.
See accompanying notes to financial statements.
BHFTII-29
Brighthouse Funds Trust II
Brighthouse/Wellington Balanced Portfolio
Statement of Assets and Liabilities
December 31, 2023
| Assets |
||||
| Investments at value (a) (b) |
$ | 1,266,216,729 | ||
| Cash |
6,396 | |||
| Cash denominated in foreign currencies (c) |
180,649 | |||
| Cash collateral for forward foreign currency exchange contracts |
60,000 | |||
| Receivable for: |
||||
| Investments sold |
1,816,217 | |||
| TBA securities sold (d) |
28,002,844 | |||
| Fund shares sold |
72,612 | |||
| Principal paydowns |
663 | |||
| Dividends and interest |
4,357,755 | |||
| Variation margin on futures contracts |
208,692 | |||
| Variation margin on centrally cleared swap contracts |
27,390 | |||
| Prepaid expenses |
4,209 | |||
|
|
|
|||
| Total Assets |
1,300,954,156 | |||
| Liabilities |
||||
| TBA Forward sales commitments, at value |
17,196,642 | |||
| Cash collateral for TBAs |
260,000 | |||
| Unrealized depreciation on forward foreign currency exchange contracts |
103,650 | |||
| Collateral for securities loaned |
23,553,314 | |||
| Payables for: |
||||
| Investments purchased (d) |
5,767,271 | |||
| TBA securities purchased |
88,483,768 | |||
| Fund shares redeemed |
1,634,346 | |||
| Accrued Expenses: |
||||
| Management fees |
427,044 | |||
| Distribution and service fees |
13,066 | |||
| Deferred trustees’ fees |
170,491 | |||
| Other expenses |
241,799 | |||
|
|
|
|||
| Total Liabilities |
137,851,391 | |||
|
|
|
|||
| Net Assets |
$ | 1,163,102,765 | ||
|
|
|
|||
| Net Assets Consist of: |
||||
| Paid in surplus |
$ | 1,020,561,132 | ||
| Distributable earnings (Accumulated losses) |
142,541,633 | |||
|
|
|
|||
| Net Assets |
$ | 1,163,102,765 | ||
|
|
|
|||
| Net Assets |
||||
| Class A |
$ | 1,091,448,245 | ||
| Class B |
48,979,916 | |||
| Class E |
22,674,604 | |||
| Capital Shares Outstanding* |
||||
| Class A |
60,590,074 | |||
| Class B |
2,744,594 | |||
| Class E |
1,262,874 | |||
| Net Asset Value, Offering Price and Redemption Price Per Share |
||||
| Class A |
$ | 18.01 | ||
| Class B |
17.85 | |||
| Class E |
17.95 |
| * | The Portfolio is authorized to issue an unlimited number of shares. | |||
| (a) | Identified cost of investments was $1,176,987,933. | |||
| (b) | Includes securities loaned at value of $38,226,422. | |||
| (c) | Identified cost of cash denominated in foreign currencies was $179,569. | |||
| (d) | Included within TBA securities sold is $17,490,841 related to TBA forward sale commitments and included within TBA securities purchased is $521,222 related to TBA forward sale commitments. | |||
Statement of Operations
Year Ended December 31, 2023
| Investment Income |
||||
| Dividends (a) |
$ | 8,098,868 | ||
| Interest (b) |
19,138,316 | |||
| Securities lending income |
84,820 | |||
|
|
|
|||
| Total investment income |
27,322,004 | |||
| Expenses |
||||
| Management fees |
5,232,014 | |||
| Administration fees |
68,380 | |||
| Custodian and accounting fees |
280,796 | |||
| Distribution and service fees—Class B |
119,145 | |||
| Distribution and service fees—Class E |
33,657 | |||
| Audit and tax services |
110,918 | |||
| Legal |
46,604 | |||
| Trustees’ fees and expenses |
46,220 | |||
| Shareholder reporting |
72,161 | |||
| Insurance |
10,412 | |||
| Miscellaneous |
28,438 | |||
|
|
|
|||
| Total expenses |
6,048,745 | |||
| Less management fee waiver |
(301,138 | ) | ||
| Less broker commission recapture |
(11,983 | ) | ||
|
|
|
|||
| Net expenses |
5,735,624 | |||
|
|
|
|||
| Net Investment Income |
21,586,380 | |||
|
|
|
|||
| Net Realized and Unrealized Gain (Loss) |
||||
| Net realized gain (loss) on: | ||||
| Investments |
47,261,743 | |||
| Purchased options |
3,466 | |||
| Futures contracts |
(412,722 | ) | ||
| Written options |
196,728 | |||
| Swap contracts |
(448,825 | ) | ||
| Foreign currency transactions |
27,123 | |||
| Forward foreign currency transactions |
(464,634 | ) | ||
|
|
|
|||
| Net realized gain (loss) |
46,162,879 | |||
|
|
|
|||
| Net change in unrealized appreciation (depreciation) on: | ||||
| Investments |
119,434,936 | |||
| Futures contracts |
(400,687 | ) | ||
| Swap contracts |
45,567 | |||
| Foreign currency transactions |
(509 | ) | ||
| Forward foreign currency transactions |
77,892 | |||
|
|
|
|||
| Net change in unrealized appreciation (depreciation) |
119,157,199 | |||
|
|
|
|||
| Net realized and unrealized gain (loss) |
165,320,078 | |||
|
|
|
|||
| Net Increase (Decrease) in Net Assets From Operations |
$ | 186,906,458 | ||
|
|
|
| (a) | Net of foreign withholding taxes of $16,242. | |||
| (b) | Net of foreign withholding taxes of $11,177. | |||
See accompanying notes to financial statements.
BHFTII-30
Brighthouse Funds Trust II
Brighthouse/Wellington Balanced Portfolio
Statements of Changes in Net Assets
| Year Ended December 31, 2023 |
Year Ended December 31, 2022 |
|||||||
| Increase (Decrease) in Net Assets: |
||||||||
| From Operations |
||||||||
| Net investment income (loss) |
$ | 21,586,380 | $ | 19,908,741 | ||||
| Net realized gain (loss) |
46,162,879 | 3,076,761 | ||||||
| Net change in unrealized appreciation (depreciation) |
119,157,199 | (263,893,255 | ) | |||||
|
|
|
|
|
|||||
| Increase (decrease) in net assets from operations |
186,906,458 | (240,907,753 | ) | |||||
|
|
|
|
|
|||||
| From Distributions to Shareholders |
||||||||
| Class A |
(30,612,057 | ) | (170,597,556 | ) | ||||
| Class B |
(1,269,142 | ) | (8,145,507 | ) | ||||
| Class E |
(628,425 | ) | (3,761,228 | ) | ||||
|
|
|
|
|
|||||
| Total distributions |
(32,509,624 | ) | (182,504,291 | ) | ||||
|
|
|
|
|
|||||
| Increase (decrease) in net assets from capital share transactions |
(78,870,938 | ) | 68,943,431 | |||||
|
|
|
|
|
|||||
| Total increase (decrease) in net assets |
75,525,896 | (354,468,613 | ) | |||||
| Net Assets |
||||||||
| Beginning of period |
1,087,576,869 | 1,442,045,482 | ||||||
|
|
|
|
|
|||||
| End of period |
$ | 1,163,102,765 | $ | 1,087,576,869 | ||||
|
|
|
|
|
|||||
Other Information:
Capital Shares
Transactions in capital shares were as follows:
| Year Ended December 31, 2023 |
Year Ended December 31, 2022 |
|||||||||||||||
| Shares | Value | Shares | Value | |||||||||||||
| Class A |
||||||||||||||||
| Sales |
435,190 | $ | 7,319,959 | 618,714 | $ | 11,293,388 | ||||||||||
| Reinvestments |
1,838,562 | 30,612,057 | 10,985,033 | 170,597,556 | ||||||||||||
| Redemptions |
(6,583,236 | ) | (110,059,334 | ) | (6,264,482 | ) | (112,205,209 | ) | ||||||||
|
|
|
|
|
|
|
|
|
|||||||||
| Net increase (decrease) |
(4,309,484 | ) | $ | (72,127,318 | ) | 5,339,265 | $ | 69,685,735 | ||||||||
|
|
|
|
|
|
|
|
|
|||||||||
| Class B |
||||||||||||||||
| Sales |
59,338 | $ | 1,001,624 | 244,529 | $ | 4,103,463 | ||||||||||
| Reinvestments |
76,825 | 1,269,142 | 528,586 | 8,145,507 | ||||||||||||
| Redemptions |
(389,599 | ) | (6,448,657 | ) | (788,172 | ) | (13,793,307 | ) | ||||||||
|
|
|
|
|
|
|
|
|
|||||||||
| Net increase (decrease) |
(253,436 | ) | $ | (4,177,891 | ) | (15,057 | ) | $ | (1,544,337 | ) | ||||||
|
|
|
|
|
|
|
|
|
|||||||||
| Class E |
||||||||||||||||
| Sales |
25,869 | $ | 435,118 | 23,311 | $ | 406,499 | ||||||||||
| Reinvestments |
37,834 | 628,425 | 242,817 | 3,761,228 | ||||||||||||
| Redemptions |
(219,167 | ) | (3,629,272 | ) | (189,557 | ) | (3,365,694 | ) | ||||||||
|
|
|
|
|
|
|
|
|
|||||||||
| Net increase (decrease) |
(155,464 | ) | $ | (2,565,729 | ) | 76,571 | $ | 802,033 | ||||||||
|
|
|
|
|
|
|
|
|
|||||||||
| Increase (decrease) derived from capital shares transactions |
$ | (78,870,938 | ) | $ | 68,943,431 | |||||||||||
|
|
|
|
|
|||||||||||||
See accompanying notes to financial statements.
BHFTII-31
Brighthouse Funds Trust II
Brighthouse/Wellington Balanced Portfolio
Financial Highlights
| Selected per share data | ||||||||||||||||||||
| Class A | ||||||||||||||||||||
| Year Ended December 31, | ||||||||||||||||||||
| 2023 | 2022 | 2021 | 2020 | 2019 | ||||||||||||||||
| Net Asset Value, Beginning of Period |
$ | 15.70 | $ | 22.57 | $ | 22.09 | $ | 20.12 | $ | 17.82 | ||||||||||
|
|
|
|
|
|
|
|
|
|
|
|||||||||||
| Income (Loss) from Investment Operations |
||||||||||||||||||||
| Net investment income (loss) (a) |
0.32 | 0.30 | 0.27 | 0.31 | 0.36 | |||||||||||||||
| Net realized and unrealized gain (loss) |
2.48 | (4.19 | ) | 2.66 | 3.02 | 3.58 | ||||||||||||||
|
|
|
|
|
|
|
|
|
|
|
|||||||||||
| Total income (loss) from investment operations |
2.80 | (3.89 | ) | 2.93 | 3.33 | 3.94 | ||||||||||||||
|
|
|
|
|
|
|
|
|
|
|
|||||||||||
| Less Distributions |
||||||||||||||||||||
| Distributions from net investment income |
(0.36 | ) | (0.34 | ) | (0.43 | ) | (0.46 | ) | (0.44 | ) | ||||||||||
| Distributions from net realized capital gains |
(0.13 | ) | (2.64 | ) | (2.02 | ) | (0.90 | ) | (1.20 | ) | ||||||||||
|
|
|
|
|
|
|
|
|
|
|
|||||||||||
| Total distributions |
(0.49 | ) | (2.98 | ) | (2.45 | ) | (1.36 | ) | (1.64 | ) | ||||||||||
|
|
|
|
|
|
|
|
|
|
|
|||||||||||
| Net Asset Value, End of Period |
$ | 18.01 | $ | 15.70 | $ | 22.57 | $ | 22.09 | $ | 20.12 | ||||||||||
|
|
|
|
|
|
|
|
|
|
|
|||||||||||
| Total Return (%) (b) |
18.10 | (17.08 | ) | 14.02 | 17.72 | 22.99 | ||||||||||||||
| Ratios/Supplemental Data |
||||||||||||||||||||
| Gross ratio of expenses to average net assets (%) |
0.53 | 0.52 | 0.51 | 0.53 | 0.53 | |||||||||||||||
| Net ratio of expenses to average net assets (%) (c) (d) |
0.50 | 0.49 | 0.48 | 0.50 | 0.50 | |||||||||||||||
| Ratio of net investment income (loss) to average net assets (%) |
1.94 | 1.67 | 1.21 | 1.57 | 1.88 | |||||||||||||||
| Portfolio turnover rate (%) |
211 | (e) | 214 | (e) | 250 | (e) | 298 | (e) | 322 | (e) | ||||||||||
| Net assets, end of period (in millions) |
$ | 1,091.4 | $ | 1,018.8 | $ | 1,344.5 | $ | 1,280.5 | $ | 1,179.3 | ||||||||||
| Class B | ||||||||||||||||||||
| Year Ended December 31, | ||||||||||||||||||||
| 2023 | 2022 | 2021 | 2020 | 2019 | ||||||||||||||||
| Net Asset Value, Beginning of Period |
$ | 15.55 | $ | 22.37 | $ | 21.92 | $ | 19.97 | $ | 17.69 | ||||||||||
|
|
|
|
|
|
|
|
|
|
|
|||||||||||
| Income (Loss) from Investment Operations |
||||||||||||||||||||
| Net investment income (loss) (a) |
0.28 | 0.25 | 0.21 | 0.26 | 0.31 | |||||||||||||||
| Net realized and unrealized gain (loss) |
2.47 | (4.15 | ) | 2.64 | 3.00 | 3.56 | ||||||||||||||
|
|
|
|
|
|
|
|
|
|
|
|||||||||||
| Total income (loss) from investment operations |
2.75 | (3.90 | ) | 2.85 | 3.26 | 3.87 | ||||||||||||||
|
|
|
|
|
|
|
|
|
|
|
|||||||||||
| Less Distributions |
||||||||||||||||||||
| Distributions from net investment income |
(0.32 | ) | (0.28 | ) | (0.38 | ) | (0.41 | ) | (0.39 | ) | ||||||||||
| Distributions from net realized capital gains |
(0.13 | ) | (2.64 | ) | (2.02 | ) | (0.90 | ) | (1.20 | ) | ||||||||||
|
|
|
|
|
|
|
|
|
|
|
|||||||||||
| Total distributions |
(0.45 | ) | (2.92 | ) | (2.40 | ) | (1.31 | ) | (1.59 | ) | ||||||||||
|
|
|
|
|
|
|
|
|
|
|
|||||||||||
| Net Asset Value, End of Period |
$ | 17.85 | $ | 15.55 | $ | 22.37 | $ | 21.92 | $ | 19.97 | ||||||||||
|
|
|
|
|
|
|
|
|
|
|
|||||||||||
| Total Return (%) (b) |
17.88 | (17.31 | ) | 13.73 | 17.45 | 22.72 | ||||||||||||||
| Ratios/Supplemental Data |
||||||||||||||||||||
| Gross ratio of expenses to average net assets (%) |
0.78 | 0.77 | 0.76 | 0.78 | 0.78 | |||||||||||||||
| Net ratio of expenses to average net assets (%) (c) (d) |
0.75 | 0.74 | 0.73 | 0.75 | 0.75 | |||||||||||||||
| Ratio of net investment income (loss) to average net assets (%) |
1.69 | 1.41 | 0.96 | 1.32 | 1.63 | |||||||||||||||
| Portfolio turnover rate (%) |
211 | (e) | 214 | (e) | 250 | (e) | 298 | (e) | 322 | (e) | ||||||||||
| Net assets, end of period (in millions) |
$ | 49.0 | $ | 46.6 | $ | 67.4 | $ | 67.3 | $ | 63.9 | ||||||||||
Please see following page for Financial Highlights footnote legend.
See accompanying notes to financial statements.
BHFTII-32
Brighthouse Funds Trust II
Brighthouse/Wellington Balanced Portfolio
Financial Highlights
| Selected per share data | ||||||||||||||||||||
| Class E | ||||||||||||||||||||
| Year Ended December 31, | ||||||||||||||||||||
| 2023 | 2022 | 2021 | 2020 | 2019 | ||||||||||||||||
| Net Asset Value, Beginning of Period |
$ | 15.65 | $ | 22.50 | $ | 22.03 | $ | 20.07 | $ | 17.77 | ||||||||||
|
|
|
|
|
|
|
|
|
|
|
|||||||||||
| Income (Loss) from Investment Operations |
||||||||||||||||||||
| Net investment income (loss) (a) |
0.30 | 0.27 | 0.24 | 0.28 | 0.33 | |||||||||||||||
| Net realized and unrealized gain (loss) |
2.47 | (4.18 | ) | 2.65 | 3.01 | 3.58 | ||||||||||||||
|
|
|
|
|
|
|
|
|
|
|
|||||||||||
| Total income (loss) from investment operations |
2.77 | (3.91 | ) | 2.89 | 3.29 | 3.91 | ||||||||||||||
|
|
|
|
|
|
|
|
|
|
|
|||||||||||
| Less Distributions |
||||||||||||||||||||
| Distributions from net investment income |
(0.34 | ) | (0.30 | ) | (0.40 | ) | (0.43 | ) | (0.41 | ) | ||||||||||
| Distributions from net realized capital gains |
(0.13 | ) | (2.64 | ) | (2.02 | ) | (0.90 | ) | (1.20 | ) | ||||||||||
|
|
|
|
|
|
|
|
|
|
|
|||||||||||
| Total distributions |
(0.47 | ) | (2.94 | ) | (2.42 | ) | (1.33 | ) | (1.61 | ) | ||||||||||
|
|
|
|
|
|
|
|
|
|
|
|||||||||||
| Net Asset Value, End of Period |
$ | 17.95 | $ | 15.65 | $ | 22.50 | $ | 22.03 | $ | 20.07 | ||||||||||
|
|
|
|
|
|
|
|
|
|
|
|||||||||||
| Total Return (%) (b) |
17.98 | (17.26 | ) | 13.86 | 17.53 | 22.85 | ||||||||||||||
| Ratios/Supplemental Data |
||||||||||||||||||||
| Gross ratio of expenses to average net assets (%) |
0.68 | 0.67 | 0.66 | 0.68 | 0.68 | |||||||||||||||
| Net ratio of expenses to average net assets (%) (c) (d) |
0.65 | 0.64 | 0.63 | 0.65 | 0.65 | |||||||||||||||
| Ratio of net investment income (loss) to average net assets (%) |
1.79 | 1.52 | 1.06 | 1.42 | 1.73 | |||||||||||||||
| Portfolio turnover rate (%) |
211 | (e) | 214 | (e) | 250 | (e) | 298 | (e) | 322 | (e) | ||||||||||
| Net assets, end of period (in millions) |
$ | 22.7 | $ | 22.2 | $ | 30.2 | $ | 30.0 | $ | 29.0 | ||||||||||
| (a) | Per share amounts based on average shares outstanding during the period. | |||
| (b) | Total return does not reflect any insurance, sales, separate account or administrative charges of variable annuity or life insurance contracts or any additional expenses that contract owners may bear under their variable contracts. If these charges were included, the returns would be lower. | |||
| (c) | Includes the effects of management fee waivers (see Note 6 of the Notes to Financial Statements). | |||
| (d) | The effect of the voluntary portion of the waivers on the net ratio of expenses to average net assets was 0.03% for each of the years ended December 31, 2023 through 2019 (see Note 6 of the Notes to Financial Statements). | |||
| (e) | Includes mortgage dollar roll and TBA transactions; excluding these transactions the portfolio turnover rates would have been 60%, 57%, 62%, 77%, and 60% for the years ended December 31, 2023, 2022, 2021, 2020, and 2019, respectively. | |||
See accompanying notes to financial statements.
BHFTII-33
Brighthouse Funds Trust II
Brighthouse/Wellington Balanced Portfolio
Notes to Financial Statements—December 31, 2023
1. Organization
Brighthouse Funds Trust II (the “Trust”) is organized as a Delaware statutory trust and registered under the Investment Company Act of 1940, as amended (the “1940 Act”), as an open-end management investment company. The Trust, which is managed by Brighthouse Investment Advisers, LLC (“Brighthouse Investment Advisers” or the “Adviser”), currently offers twenty-nine series (the “Portfolios”), each of which operates as a distinct investment vehicle of the Trust. The series included in this report is Brighthouse/Wellington Balanced Portfolio (the “Portfolio”), which is diversified. Shares of the Portfolio are not offered directly to the general public and are currently available only to separate accounts of insurance companies, including insurance companies affiliated with the Adviser.
The Portfolio has registered and offers three classes of shares: Class A, B and E shares. Shares of each class of the Portfolio represent an equal pro rata interest in the Portfolio and generally give the shareholder the same voting, dividend, liquidation, and other rights. Investment income, realized and unrealized capital gains and losses, the common expenses of the Portfolio, and certain Portfolio-level expense reductions, if any, are allocated on a pro rata basis to each class based on the relative net assets of each class to the net assets of the Portfolio. Each class of shares differs in its respective distribution plan and such distribution expenses are allocated to the corresponding class of shares.
2. Significant Accounting Policies
The preparation of financial statements in conformity with accounting principles generally accepted in the United States of America (“GAAP”) requires management to make estimates and assumptions that affect the reported amounts of assets and liabilities and disclosure of contingent assets and liabilities as of the date of the financial statements and the reported amounts of income and expenses during the reporting period. Actual results could differ from those estimates. In the preparation of these financial statements, management has evaluated events and transactions subsequent to December 31, 2023 through the date the financial statements were issued.
The Portfolio is an investment company and follows the accounting and reporting guidance of the Financial Accounting Standards Board (“FASB”) Accounting Standards Codification Topic 946—Financial Services—Investment Companies. The following is a summary of significant accounting policies consistently followed by the Portfolio in the preparation of its financial statements.
Investment Valuation and Fair Value Measurements - The Portfolio values its investments for purposes of calculating its net asset value (“NAV”) using procedures that allow for a variety of methodologies to be used to value the Portfolio’s investments. The specific methodology used for an investment may vary based on the market data available for a specific investment at the time the Portfolio calculates its NAV or based on other considerations. The procedures also permit a level of judgment to be used in the valuation process.
Debt securities, including corporate, convertible and municipal bonds and notes; obligations of the U.S. Treasury and U.S. government agencies; foreign sovereign issues; and non-U.S. bonds, are generally valued based upon evaluated or composite bid quotations obtained from third-party pricing services and/or brokers and dealers selected by the Adviser (each a “pricing service”). Such pricing services may use matrix pricing, which considers observable inputs including, among other things, issuer details, maturity dates, interest rates, yield curves, rates of prepayment, credit risks/spreads, default rates, reported trades, broker-dealer quotes and quoted prices for similar assets. Short-term obligations with a remaining maturity of sixty days or less may be valued at amortized cost in the absence of market quotes, so long as the amortized cost value of such short-term debt instrument is approximately the same as the fair value of the instrument as determined without the use of amortized cost valuation. Floating rate loans are generally valued based upon an evaluated or composite average of aggregate bid and ask quotations supplied by brokers or dealers, as obtained from the pricing service. Securities that use similar valuation techniques and inputs as described above are generally categorized as Level 2 within the fair value hierarchy.
Mortgage-and asset-backed securities are generally valued based upon evaluated or composite bid quotations obtained from pricing services selected by the Adviser. These securities are usually issued as separate tranches, or classes, of securities within each deal. The pricing models for these securities usually consider tranche-level attributes, current market data, estimated cash flows and market-based yield spreads for each tranche and incorporate deal collateral performance, as available. Mortgage-and asset-backed securities that use similar valuation techniques and inputs as described above are generally categorized as Level 2 within the fair value hierarchy.
Domestic and foreign equity securities, such as common stock, exchange-traded funds, rights, warrants, and preferred stock, that are traded on a securities exchange on a valuation date are generally valued at their last quoted sale price or official closing price on the primary exchange for such security, or, if no sales occurred on that day, at the last reported bid price. Equity securities traded over-the-counter (“OTC”) are generally valued at the last reported bid price. In the event of a major exchange closing during the trading day, the Adviser may use other market information obtained from quotation reporting systems, established market makers, or pricing services in valuing the securities. Valuation adjustments may be applied to certain foreign equity securities that are traded solely on foreign exchanges that close before the time as of which the Portfolio determines its NAV to account for the market
BHFTII-34
Brighthouse Funds Trust II
Brighthouse/Wellington Balanced Portfolio
Notes to Financial Statements—December 31, 2023—(Continued)
movement between the close of the foreign exchanges and the time as of which the Portfolio determines its NAV. The Portfolio may use a systematic fair valuation model provided by a pricing service to value securities principally traded in these foreign markets to adjust for possible market movements or other changes that may occur between the close of the foreign exchanges and the time as of which the Portfolio determines its NAV. Foreign equity securities valued using these valuation adjustments are generally categorized as Level 2 within the fair value hierarchy. Equity securities that are actively traded, and have no valuation adjustments applied, are categorized as Level 1 within the fair value hierarchy. Other equity securities traded on inactive markets or valued in reference to similar instruments traded on active markets are generally categorized as Level 2 within the fair value hierarchy.
Investments in registered open-end management investment companies are valued at reported NAV per share on the valuation date and are categorized as Level 1 within the fair value hierarchy.
Foreign currency forward contracts are valued through a third-party pricing service by interpolating between forward and spot currency rates in the London foreign exchange markets as of a designated hour on a valuation day. These contracts are generally categorized as Level 2 within the fair value hierarchy.
Options, whether on securities, indices, futures contracts, or otherwise, traded on exchanges are valued at the last sale price available as of the close of business on a valuation day or, if there is no such price available, at the last reported bid price. These types of options are categorized as Level 1 within the fair value hierarchy. Futures contracts that are traded on commodity exchanges are valued at their settlement prices established by the exchanges on which they are traded as of the close of such exchanges and are categorized as Level 1 within the fair value hierarchy.
Options, including options on swaps (“swaptions”) and currencies, and synthetic futures contracts that are traded OTC are generally valued based upon interdealer bid and ask prices or prices provided by pricing service providers who use a series of techniques, including simulation pricing models, to determine the value of the contracts. The pricing models use inputs that are observed from actively quoted markets such as issuer details, indices, spreads, interest rates, yield curves, credit curves, measures of volatility and exchange rates. These contracts are generally categorized as Level 2 within the fair value hierarchy.
Swap contracts (other than centrally cleared swaps listed or traded on a multilateral or trade facility platform) are marked-to-market daily based on quotations and prices supplied by market makers, broker-dealers and other pricing services. Such quotations and prices are derived utilizing observable data, including the underlying reference securities or indices, credit spread quotations and expected default recovery rates determined by the pricing service. These contracts are generally categorized as Level 2 within the fair value hierarchy.
Centrally cleared swaps listed or traded on a multilateral or trade facility platform, such as a registered exchange, are valued at the daily settlement price determined by the respective exchange or a pricing service when the exchange price is not available. For centrally cleared credit default swaps, the clearing facility requires its members to provide actionable price levels across complete term structures. These levels along with external third-party prices are used to produce daily settlement prices. These securities are categorized as Level 2 within the fair value hierarchy. Centrally cleared interest rate swaps are valued using a pricing model that references the underlying rates, including, but not limited to, the overnight index swap rate, the respective interbank offered forward rate or other interest rates, yield curves or credit spreads to produce the daily settlement price. These securities are categorized as Level 2 within the fair value hierarchy.
If no current market quotation is readily available or market value quotations are deemed to be unreliable for an investment, the fair value of the investment will be determined in accordance with procedures. A market quotation is readily available only when that quotation is a quoted price (unadjusted) in active markets for identical investments that the Portfolio can access at the measurement date, provided that a quotation will not be readily available if it is not reliable.
Pursuant to Rule 2a-5 under the 1940 Act, the Board of Trustees (the “Board” or “Trustees” ) of the Trust has designated Brighthouse Investment Advisers, acting through its Valuation Committee (“Committee”), as the Portfolio’s “valuation designee” to perform the Portfolio’s fair value determinations. The Board oversees Brighthouse Investment Advisers in its role as the Valuation Designee and receives reports from Brighthouse Investment Advisers regarding its process and the valuation of the Portfolio’s investments to assist with such oversight.
No single standard for determining the fair value of an investment can be set forth because fair value depends upon the facts and circumstances with respect to each investment. Information relating to any relevant factors may be obtained by the Committee from any appropriate source, including the subadviser of the Portfolio, the Custodian, a pricing service, market maker and/or broker for such security or the issuer. Appropriate methodologies for determining fair value under particular circumstances may include: matrix pricing, a discounted cash flow analysis, comparisons of securities with comparable characteristics, value based on multiples of earnings, discount from market price of similar marketable securities, or a combination of these and other methods.
Foreign Currency Translation - The books and records of the Portfolio are maintained in U.S. dollars. The values of securities, currencies, and other assets and liabilities denominated in currencies other than the U.S. dollar are translated into U.S. dollars based
BHFTII-35
Brighthouse Funds Trust II
Brighthouse/Wellington Balanced Portfolio
Notes to Financial Statements—December 31, 2023—(Continued)
upon foreign exchange rates prevailing at the end of the period. Purchases and sales of investment securities, income, and expenses are translated on the respective dates of such transactions. Because the values of investment securities are translated at the foreign exchange rates prevailing at the end of the period, that portion of the results of operations arising from changes in exchange rates and that portion of the results of operations reflecting fluctuations arising from changes in market prices of the investment securities are not separated. Such fluctuations are included in the net realized and unrealized gain or loss on investments.
Net realized foreign exchange gains or losses arise from activity in forward foreign currency exchange contracts, sales of foreign currency, currency gains or losses realized between the trade and settlement dates on securities transactions, and the difference between the amounts of dividends, interest, and foreign withholding taxes recorded by the Portfolio and the U.S. dollar-equivalent of the amounts actually received or paid by the Portfolio. Net unrealized foreign exchange gains and losses arise from changes in the value of assets and liabilities, other than investment securities, resulting from changes in foreign exchange rates.
Investment Transactions and Related Investment Income - Portfolio security transactions are recorded on the trade date. Dividend income is recorded on the ex-dividend date or, for certain foreign securities, when notified. Interest income, which includes amortization of premium and accretion of discount on debt securities, is recorded on the accrual basis. Realized gains and losses on investments are determined on the identified cost basis, which is the same basis used for federal income tax purposes. Foreign income and foreign capital gains on some foreign securities may be subject to foreign taxes, which are accrued as applicable. These foreign taxes have been provided for in accordance with the Portfolio’s understanding of the applicable countries’ tax rules and rates.
Dividends and Distributions to Shareholders - The Portfolio records dividends and distributions on the ex-dividend date. Net realized gains from securities transactions (if any) are generally distributed annually to shareholders. The timing and characterization of certain income and capital gains distributions are determined in accordance with federal tax regulations that may differ from GAAP. Permanent book and tax basis differences relating to shareholder distributions will result in reclassification between distributable earnings (accumulated losses) and paid in surplus. These adjustments have no impact on net assets or the results of operations.
Income Taxes - It is the Portfolio’s policy to comply with the requirements of the Internal Revenue Code of 1986, as amended, and regulations thereunder, applicable to regulated investment companies, and to distribute, with respect to each taxable year, all of its taxable income to shareholders. Therefore, no federal income tax provision is required. The Portfolio files U.S. federal tax returns. No income tax returns are currently under examination. The Portfolio’s federal tax returns remain subject to examination by the Internal Revenue Service for three fiscal years after the returns are filed. As of December 31, 2023, the Portfolio had no uncertain tax positions that would require financial statement recognition, derecognition or disclosure.
High-Yield Debt Securities - The Portfolio may invest in high-yield debt securities, or “junk bonds,” which are securities that are rated below “investment grade” or, if not rated, are of equivalent quality. A portfolio with high-yield debt securities generally will be exposed to greater market risk and credit risk than a portfolio that invests only in investment grade debt securities because issuers of high-yield debt securities are generally less secure financially, are more likely to default on their obligations, and their securities are more sensitive to interest rate changes and downturns in the economy. In addition, the secondary market for lower-rated debt securities may not be as liquid as that for more highly rated debt securities. As a result, the Portfolio’s subadviser may find it more difficult to value or sell lower-rated debt securities and may have to sell them at prices significantly lower than the values assigned to them by the Portfolio.
Floating Rate Loans - The Portfolio may invest in loans arranged through private negotiation between one or more financial institutions. The Portfolio’s investment in any such loan may be in the form of a participation in or an assignment of the loan. In connection with purchasing participations, the Portfolio generally will have no right to enforce compliance by the borrower with the terms of the loan agreement relating to the loan, nor any rights of set-off against the borrower. The purchase of assignments will typically result in the Portfolio having a direct contractual relationship with the borrower, and the Portfolio may enforce compliance by the borrower with the terms of the loan agreement. The Portfolio may not benefit directly from any collateral supporting the loan in which it has purchased the participation or assignment.
The Portfolio may invest in multiple series or tranches of a loan, which may have varying terms and carry different associated risks. When the Portfolio purchases assignments, it acquires direct rights against the borrower of the loan. These loans may include participations in bridge loans, which are loans taken out by borrowers for a short period (typically less than one year) pending arrangement of more permanent financing.
The Portfolio will assume the credit risk of both the borrower and the lender that is selling the participation. In the event of the insolvency of the lender selling the participation, the Portfolio may be treated as a general creditor of the lender and may not benefit from any set-off between the lender and the borrower.
Unfunded Loan Commitments - The Portfolio may enter into certain credit agreements, all or a portion of which may be unfunded. The Portfolio is obligated to fund these commitments at the borrower’s discretion. These commitments, if any, are disclosed in the Schedule of Investments. As of December 31, 2023, the Portfolio did not have any unfunded loan commitments.
BHFTII-36
Brighthouse Funds Trust II
Brighthouse/Wellington Balanced Portfolio
Notes to Financial Statements—December 31, 2023—(Continued)
Inflation-Indexed Bonds - The Portfolio may invest in inflation-indexed bonds. Inflation-indexed bonds are fixed income securities whose principal value is periodically adjusted according to the rate of inflation. The interest rate on these bonds is generally fixed at issuance at a rate lower than typical bonds. Over the life of an inflation-indexed bond, however, interest will be paid based on a principal value that is adjusted for inflation. Any increase or decrease in the principal amount of an inflation-indexed bond will be included as interest income on the Statement of Operations, even though investors do not receive their principal until maturity. Repayment of the original bond principal upon maturity (as adjusted for inflation) is guaranteed in the case of U.S. Treasury Inflation-Protected Securities (“TIPS”). For bonds that do not provide a similar guarantee, the adjusted principal value of the bond repaid at maturity may be less than the original principal.
Collateralized Obligations - The Portfolio may invest in collateralized bond obligations (“CBOs”), collateralized loan obligations (“CLOs”), other collateralized debt obligations (“CDOs”), and other similarly structured securities. CDOs, CBOs and CLOs are types of asset-backed securities. A CBO is a trust that is backed by a diversified pool of high risk, below investment grade fixed-income securities. The collateral can be from many types of fixed-income securities such as high yield debt, residential privately issued mortgage-related securities, commercial privately issued mortgage-related securities, trust preferred securities and emerging market debt. A CLO is a trust typically collateralized by a pool of loans that may include, among others, domestic and foreign senior secured loans, senior unsecured loans, and subordinate corporate loans, including loans that may be rated below investment grade or equivalent unrated loans. Other CDOs are trusts backed by other types of assets representing obligations of various parties.
For CDOs, CBOs and CLOs, the cash flow from the trust is split into two or more portions, called tranches, varying in risk and yield. The riskiest portion is typically the “equity” or “first loss” tranche, which bears the bulk of defaults from the bonds or loans in the trust and serves to protect the other, more senior tranches from default in all but the most severe circumstances. Senior tranches are paid from the cash flows from the underlying assets before the junior tranches and equity tranches. Losses are first borne by the equity tranches, next by the junior tranches, and finally by the senior tranches. The risks of an investment in a CBO, CLO or other CDO depend largely on the quality and type of the collateral securities and the class of the instrument in which a Portfolio invests. If some debt instruments go into default and the cash collected by the CBO, CLO or CDO is insufficient to pay all of its investors, those in the lowest, most junior tranches suffer losses first. Since they are partially protected from defaults, senior tranches typically have higher ratings and lower potential yields than their underlying securities, and can be rated investment grade. Despite the protection from the equity tranche, more senior tranches can experience substantial losses due to actual defaults, increased sensitivity to defaults due to collateral default and disappearance of protecting tranches, market anticipation of defaults, as well as aversion to CBO, CLO or other CDO securities as a class.
Mortgage-Related and Other Asset-Backed Securities - The Portfolio may invest in mortgage-related or other asset-backed securities. These securities may include mortgage pass-through securities, collateralized mortgage obligations (“CMOs”), commercial mortgage-backed securities, CMO residuals, stripped mortgage-backed securities (“SMBS”), and other securities that directly or indirectly represent a participation in, or are secured by or payable from, mortgage loans on real property or other receivables. The value of some mortgage- or asset-backed securities may be particularly sensitive to changes in prevailing interest rates. Early repayment of principal on some mortgage-related securities may expose the Portfolio to a lower rate of return upon reinvestment of principal. The value of these securities may fluctuate in response to the market’s perception of the creditworthiness of the issuers. Additionally, although mortgages and mortgage-related securities are generally supported by some form of government or private guarantee and/or insurance, there is no assurance that private guarantors or insurers will meet their obligations.
In one type of SMBS, one class receives all of the interest from the mortgage assets (the interest-only or “IO” class), while the other class will receive all of the principal (the principal-only or “PO” class). Because principal will not be received at the maturity of an IO, adjustments are made to the book value of the security until maturity. These adjustments are netted against payments received for the IOs and the net amount is included in interest income on the Statement of Operations of the Portfolio. Payments received for POs are treated as reductions to the cost and par value of the securities. Details of mortgage-related and other asset-backed securities held by the Portfolio are included in the Portfolio’s Schedule of Investments.
The Portfolio may invest a significant portion of its assets in securities of issuers that hold mortgage- and asset-backed securities and direct investments in securities backed by commercial and residential mortgage loans and other financial assets. The value and related income of these securities are sensitive to changes in economic conditions, including delinquencies and/or defaults, and may be negatively impacted by increased volatility of market prices and periods of illiquidity.
Mortgage Dollar Rolls - The Portfolio may enter into mortgage “dollar rolls” in which a Portfolio sells to-be-announced (“TBA”) mortgage-backed securities for delivery in the current month and simultaneously contracts to repurchase substantially similar (same type, coupon, and maturity) securities on a specified future date. For the duration of the transaction, or roll period, the Portfolio foregoes principal (including prepayments of principal) and interest paid on the securities sold. Dollar rolls are accounted for as purchase and sale transactions; gain or loss is recognized at the commencement of the term of the dollar roll and each time the mortgage-backed security is rolled.
BHFTII-37
Brighthouse Funds Trust II
Brighthouse/Wellington Balanced Portfolio
Notes to Financial Statements—December 31, 2023—(Continued)
Mortgage dollar roll transactions involve the risk that the market value of the securities that the Portfolio is required to repurchase or reacquire may be less than the agreed-upon repurchase price of those securities and that the investment performance of securities purchased with proceeds from these transactions does not exceed the income, capital appreciation, and gain or loss that would have been realized on the securities transferred or sold, as applicable, as part of the treasury or mortgage dollar roll.
TBA Purchase and Forward Sale Commitments - The Portfolio may enter into TBA commitments to purchase or sell securities for a fixed price at a future date. TBA commitments are considered securities in themselves, and involve a risk of loss if the value of the security to be purchased or sold declines or increases prior to the settlement date, which is in addition to the risk of decline in the value of the Portfolio’s other assets. TBA forward sale commitments are valued at the current market value of the underlying securities, according to the procedures described under “Investment Valuation and Fair Value Measurements”.
When-Issued and Delayed-Delivery Securities - The Portfolio may purchase securities on a when-issued or delayed-delivery basis. Settlement of such transactions will occur beyond the customary settlement period. The Portfolio may purchase securities under such conditions only with the intention of actually acquiring them, but may enter into a separate agreement to sell the securities before the settlement date. Since the value of securities purchased may fluctuate prior to settlement, the Portfolio may be required to pay more at settlement than the security is worth. In addition, the Portfolio is not entitled to any of the interest earned prior to settlement.
Repurchase Agreements - The Portfolio may enter into repurchase agreements, under the terms of a Master Repurchase Agreement (“MRA”), or Global Master Repurchase Agreement (“GMRA”), with selected commercial banks and broker-dealers, under which the Portfolio acquires securities as collateral and agrees to resell the securities at an agreed-upon time and at an agreed-upon price. The Portfolio, through the Custodian or a subcustodian, under a tri-party repurchase agreement, receives delivery of the underlying securities collateralizing any repurchase agreements. It is the Portfolio’s policy that the market value of the collateral be equal to at least 100% of the repurchase price in the case of a repurchase agreement of one-day duration and equal to at least 102% of the repurchase price in the case of all other repurchase agreements. In the event of default or failure by a party to perform an obligation in connection with any repurchase transaction, the MRA or GMRA gives the non-defaulting party the right to set-off claims and to apply property held by it in connection with any repurchase transaction against obligations owed to it under the agreement.
At December 31, 2023, the Portfolio had direct investments in repurchase agreements with a gross value of $9,028,713. Additionally, the Portfolio invested cash collateral for loans of portfolio securities in repurchase agreements with a gross value of $12,053,314. The combined value of all repurchase agreements is included as part of investments at value on the Statement of Assets and Liabilities. The value of the related collateral exceeded the value of the repurchase agreements at December 31, 2023.
Securities Lending - The Portfolio may lend its portfolio securities to certain qualified brokers who borrow securities in order to complete certain securities transactions. By lending its portfolio securities, the Portfolio attempts to increase its net investment income through the receipt of income on collateral held from securities on loan. Any gain or loss in the market price of the loaned securities that might occur, any interest earned, and any dividends declared during the term of the loan, would accrue to the account of the Portfolio.
The Trust has entered into a Non-Custodial Securities Lending Agreement with JPMorgan Chase Bank, N.A. (the “Lending Agent”). Under the agreement, the Lending Agent is authorized to loan portfolio securities on the Portfolio’s behalf. In exchange, the Portfolio generally receives cash, U.S. Government securities, letters of credit, or other collateral deemed appropriate by the Adviser. The Portfolio receives collateral equal to at least 102% of the market value for loans secured by government securities or cash in the same currency as the loaned shares and 105% for all other loaned securities at each loan’s inception. Collateral representing at least 100% of the market value of the loaned securities is maintained for the duration of the loan. Any cash collateral received by the Portfolio is generally invested by the Lending Agent in short-term investments, which may include certificates of deposit, commercial paper, repurchase agreements, including repurchase agreements with respect to equity securities, time deposits, master demand notes and money market funds. The market value of investments made with cash collateral received are disclosed in the Schedule of Investments and the valuation techniques are described in Note 2. The value of the securities on loan may change each business day. If the market value of the collateral at the close of trading on a business day is less than 100% of the market value of the loaned securities at the close of trading on that day, the borrower is required to deliver, by the close of business on the following business day, an additional amount of collateral, so that the total amount of posted collateral is equal to at least 100% of the market value of all the loaned securities as of such preceding day. A portion of the income earned on the collateral is rebated to the borrower of the securities and the remainder is split between the Lending Agent and the Portfolio. On loans collateralized by U.S. government securities, a fee is received from the borrower and is allocated between the Portfolio and the Lending Agent.
Income received by the Portfolio in securities lending transactions during the year ended December 31, 2023 is reflected as securities lending income on the Statement of Operations. The values of any securities loaned by the Portfolio and the related collateral at December 31, 2023 are disclosed in the footnotes to the Schedule of Investments. The value of the related collateral received by the Portfolio exceeded the value of the securities out on loan at December 31, 2023.
BHFTII-38
Brighthouse Funds Trust II
Brighthouse/Wellington Balanced Portfolio
Notes to Financial Statements—December 31, 2023—(Continued)
The risks associated with lending portfolio securities include, but are not limited to, possible delays in receiving additional collateral or in the recovery of the loaned securities, possible loss of rights in the collateral should the borrower fail financially, as well as risk of loss in the value of the collateral or the value of the investments made with the collateral. To the extent the Portfolio uses cash collateral it receives to invest in repurchase agreements with respect to equity securities, it is subject to the risk of loss if the value of the equity securities declines and the counterparty defaults on its obligation to repurchase such securities. The Lending Agent shall indemnify the Portfolio in the case of default of any securities borrower, subject to the terms of the Non-Custodial Securities Lending Agreement.
The following table provides a breakdown of transactions accounted for as secured borrowings, the gross obligations by the type of collateral pledged, and the remaining contractual maturities of those transactions.
| Remaining Contractual Maturity of the Agreements As of December 31, 2023 |
||||||||||||||||||||
| Overnight and Continuous |
Up to 30 Days |
31 - 90 Days |
Greater than 90 days |
Total | ||||||||||||||||
| Securities Lending Transactions | ||||||||||||||||||||
| Common Stocks |
$ | (18,598,924 | ) | $ | — | $ | — | $ | — | $ | (18,598,924 | ) | ||||||||
| Corporate Bonds & Notes |
(4,954,390 | ) | — | — | — | (4,954,390 | ) | |||||||||||||
| Total Borrowings |
$ | (23,553,314 | ) | $ | — | $ | — | $ | — | $ | (23,553,314 | ) | ||||||||
| Gross amount of recognized liabilities for securities lending transactions |
|
$ | (23,553,314 | ) | ||||||||||||||||
|
|
|
|||||||||||||||||||
Directed Brokerage Agreement - The Trust has entered into a directed brokerage arrangement with Capital Institutional Services, Inc. (“CAPIS”). Under this arrangement, the Portfolio directs certain trades to CAPIS in return for a recapture credit. CAPIS issues a cash rebate to the Portfolio. Amounts paid to the Portfolio are shown separately as broker commission recapture on the Statement of Operations of the Portfolio. Additionally, these amounts have been excluded from the calculation of the net ratio of expenses to average net assets presented in the Financial Highlights for each share class.
3. Investments in Derivative Instruments
Forward Foreign Currency Exchange Contracts - The Portfolio may enter into forward foreign currency exchange contracts to obtain investment exposure, enhance return or hedge or protect its portfolio holdings against the risk of future movements in certain foreign currency exchange rates. When entering into these contracts, the Portfolio agrees to buy or sell a fixed quantity of foreign currency for an agreed-upon price on an agreed-upon future date. These contracts are valued daily and the Portfolio’s net equity therein, representing unrealized gain or loss on the contracts as measured by the difference between the forward foreign exchange rates at the dates of entry into the contracts and the forward foreign exchange rates at the valuation date, is included in the Statement of Assets and Liabilities. When a contract is closed, the Portfolio recognizes a realized gain or loss equal to the difference between the value of the contract at the time it was opened and the value at the time it was closed.
Realized and unrealized gains and losses on forward foreign currency exchange contracts are included in the Statement of Operations. These contracts involve market and/or credit risk in excess of the amount recognized in the Statement of Assets and Liabilities. The use of forward foreign currency exchange contracts does not eliminate fluctuations in the underlying prices of the securities of the Portfolio, but it does establish a rate of exchange that can be achieved in the future. Although forward foreign currency exchange contracts may limit the risk of loss due to a decline in the value of the currency holdings, they also limit any potential gain that might result should the value of the currency increase. In addition, the Portfolio could be exposed to losses if the counterparties to the contracts are unable or unwilling to meet the terms of the contracts. The Portfolio may also experience losses even when such contracts are used for hedging purposes. The Portfolio’s maximum potential loss from such contracts is the aggregate face value in U.S. dollars at the time the contract was opened.
Futures Contracts - The Portfolio may buy and sell futures contracts as a hedge, to maintain investment exposure to a target asset class or to enhance return. The Portfolio may be subject to fluctuations in equity prices, interest rates, commodity prices, and foreign currency exchange rates in the normal course of pursuing its investment objective. Futures contracts are standardized agreements to buy or sell a security, or deliver a final cash settlement price in connection with an index, interest rate, currency, or other asset. The Portfolio must deposit an amount (“initial margin”) equal to a certain percentage of the face value of the futures contract. The initial margin may be in the form of cash or securities, which is returned when the Portfolio’s obligations under the contract have been satisfied. If cash is deposited as the initial margin, it is shown as cash collateral on the Statement of Assets and Liabilities. Futures contracts are marked-to-market daily and subsequent payments (“variation margin”) are made or received by the Portfolio depending on whether unrealized gains or losses are incurred. These amounts are reflected as receivables or payables on the Statement of Assets and Liabilities and as a component of net change in unrealized appreciation/depreciation on the Statement of Operations. When the contract is closed or expires, the Portfolio records a realized gain or loss equal to the difference between the value of the contract at the time it was opened and the value at the time it was closed. Risks of entering into futures contracts (and related options) include
BHFTII-39
Brighthouse Funds Trust II
Brighthouse/Wellington Balanced Portfolio
Notes to Financial Statements—December 31, 2023—(Continued)
the possibility that the market for these instruments may be illiquid and that a change in the value of the futures contract or option may not correlate perfectly with changes in the value of the underlying asset. The exchange’s clearinghouse, as counterparty to all futures, guarantees the futures contracts against default.
Options Contracts - An option contract purchased by the Portfolio gives the Portfolio the right, but not the obligation, to buy (call) or sell (put) an underlying instrument at a fixed exercise price during a specified period or on a specified date. Call options written by the Portfolio give the holder the right to buy the underlying instrument from the Portfolio at a fixed exercise price; put options written by the Portfolio give the holder the right to sell the underlying instrument to the Portfolio at a fixed exercise price.
The Portfolio may use options to hedge against changes in values of securities the Portfolio owns or expects to purchase, to maintain investment exposure to a target asset class or to enhance return. When the Portfolio owns the underlying instrument, writing puts or buying calls tend to increase the Portfolio’s exposure to the underlying instrument and writing calls or buying puts tends to decrease the Portfolio’s exposure to the underlying instrument. Options can also be used to hedge other Portfolio investments. For options used to hedge the Portfolio’s investments, the potential risk to the Portfolio is that the change in value of options contracts may not correspond perfectly to the change in value of the hedged instruments. The Portfolio also bears the risk of an unfavorable change in the value of the underlying instrument or the risk that the Portfolio may not be able to enter into a closing transaction due to an illiquid market. The Portfolio’s maximum risk of loss from counterparty credit risk, as opposed to investment and other types of risk, in respect of purchased options is typically the premium initially paid for the option plus any unrealized gains.
The main risk associated with purchasing an option is that the option expires without being exercised. In this case, the option is worthless when it expires and the premium paid for the option is considered a realized loss. The risk associated with writing a call option on an underlying instrument that the Portfolio owns is that the Portfolio may forgo the opportunity for a profit if the market value of the underlying instrument increases and the option is exercised, requiring the Portfolio to sell the underlying instrument at a price below its market value. When the Portfolio writes a call option on a security it does not own, its exposure on such an option is theoretically unlimited. The risk in writing a put option is that the Portfolio may incur a loss if the market value of the underlying instrument decreases and the option is exercised, requiring the Portfolio to purchase the underlying instrument at a price above its market value. In addition, the Portfolio risks not being able to enter into a closing transaction for the written option as the result of an illiquid market for the option.
Purchases of put and call options are recorded as investments, the value of which are marked-to-market daily. When the Portfolio enters into a closing sale transaction, the Portfolio will realize a gain or loss depending on whether the sales proceeds from the closing sale transaction are greater or less than the premium initially paid for the option. When the Portfolio exercises a put option, it will realize a gain or loss from the sale of the underlying instrument and the proceeds from such sale will be decreased by the premium originally paid for the put option. When the Portfolio exercises a call option, the cost of the security which the Portfolio purchases upon exercise will be increased by the premium originally paid for the call option.
The premium received by the Portfolio for a written option is recorded as an asset and an equivalent liability. The liability is subsequently marked-to-market to reflect the current value of the option written. When a written option expires without being exercised or the Portfolio enters into a closing purchase transaction, the Portfolio realizes a gain (or loss if the cost of the closing purchase transaction exceeds the premium received when the option was sold) without regard to any unrealized gain or loss on the underlying instrument and the liability related to such option is eliminated. When a written call option is exercised, the Portfolio realizes a gain or loss, as adjusted for the premium received, from the sale of the underlying instrument. When a written put option is exercised, the premium received by the Portfolio is offset against the amount paid for the purchase of the underlying instrument.
An Option on Exchange-Traded Futures Contract (“Futures Option”) is an option contract in which the underlying instrument is a single futures contract.
Swaptions are similar to options on securities except that instead of selling or purchasing the right to buy or sell a security, the writer or purchaser of the swaptions is granting or buying the right to enter into a previously agreed upon interest rate or credit default swap agreement at any time before the expiration of the option.
Swap Agreements - The Portfolio may enter into swap agreements in which the Portfolio and a counterparty agree to either make periodic net payments on a specified notional amount or a net payment upon termination. Swap agreements are either privately negotiated in the OTC market (“OTC swaps”) or executed in a multilateral or other trade facility platform, such as a registered swap execution facility (“centrally cleared swaps”). The Portfolio may enter into swap agreements for the purposes of managing exposure to interest rate, credit or market risk, or for other purposes. In connection with these agreements, securities or cash may be paid or received, as applicable, by the Portfolio as collateral or margin in accordance with the terms of the respective swap agreements to provide assets of value and recourse in the event of default or bankruptcy/insolvency. Securities posted by the Portfolio as collateral for swap contracts are identified in the Schedule of Investments and restricted cash, if any, is reflected on the Statement of Assets and Liabilities.
BHFTII-40
Brighthouse Funds Trust II
Brighthouse/Wellington Balanced Portfolio
Notes to Financial Statements—December 31, 2023—(Continued)
Swap agreements are marked-to-market daily. The fair value of an OTC swap is reflected on the Statement of Assets and Liabilities. The changes in value, if any, are reflected as a component of net change in unrealized appreciation/depreciation on the Statement of Operations. Daily changes in valuation of centrally cleared swaps, if any, are recorded as a receivable or payable for variation margin on the Statement of Assets and Liabilities and as a component of unrealized appreciation/depreciation on the Statement of Operations. The Portfolio may pay or receive an upfront payment upon entering into a swap agreement. Upon termination or maturity of the swap, upfront premiums are recorded as realized gains or losses on the Statement of Operations. A liquidation payment received or made at the termination of the swap is recorded as realized gain or loss on the Statement of Operations. Net periodic payments received or paid by the Portfolio are included as part of realized gains or losses on the Statement of Operations.
Swap transactions involve, to varying degrees, elements of interest rate, credit, and market risk in excess of the amounts recognized in the Statement of Assets and Liabilities. Such risks include the possibility that there will be no liquid market for these agreements, that the counterparty to the agreements may default on its obligation to perform, or that there may be unfavorable changes in market conditions or interest rates. In addition, entering into swap agreements involves documentation risk resulting from the possibility that the parties to a swap agreement may disagree as to the meaning of contractual terms in the agreement. The Portfolio may enter into swap transactions with counterparties in accordance with guidelines established by the Board. These guidelines provide for a minimum credit rating for each counterparty and various credit enhancement techniques (for example, collateralization of amounts due from counterparties) to limit exposure to counterparties that have lower credit ratings. The Portfolio’s maximum risk of loss from counterparty credit risk is the discounted value of the net cash flows to be received from the counterparty over the contract’s remaining life, to the extent that amount is positive, or the fair value of the contract. The risk may be mitigated by having a master netting arrangement between the Portfolio and the counterparty and by the posting of collateral by the counterparty to cover the Portfolio’s exposure to the counterparty. Counterparty risk related to centrally cleared swaps is mitigated due to the protection against defaults provided by the clearinghouse. A party to a cleared swap is subject to the credit risk of the clearinghouse and the clearing member through which it holds its cleared position.
Centrally Cleared Swaps: Certain swaps are required to be (or are capable of being) cleared through a regulated clearinghouse. Since the Portfolio is not a member of a clearinghouse and only members of a clearinghouse (“clearing members” or “clearing brokers”) can participate directly in the clearinghouse, the Portfolio holds cleared swaps through accounts at a clearing member. The Portfolio typically will be required to post margin required by the clearinghouse and/or its clearing member; the margin required by a clearinghouse and/or clearing member may be greater than the margin the Portfolio would be required to post in an uncleared derivative transaction.
Credit Default Swaps: The Portfolio is subject to credit risk in the normal course of pursuing its investment objectives. The Portfolio may enter into credit default swaps to manage its exposure to the market or certain sectors of the market, to reduce its risk exposure to defaults of corporate and/or sovereign issuers, or to create exposure to corporate and/or sovereign issuers to which it is not otherwise exposed. Credit default swaps involve one party making a stream of payments (referred to as the buyer of protection) to another party (referred to as the seller of protection) in exchange for the right to receive a specified return if a credit event occurs for the referenced entity, obligation or index. A credit event is defined under the terms of each swap agreement and may include, but is not limited to, underlying entity default, bankruptcy, write-down, principal shortfall or interest shortfall. As the seller of protection, if an underlying credit event occurs, the Portfolio will either pay the buyer an amount equal to the notional amount of the swap and take delivery of the referenced obligation (or underlying security comprising the relevant component of the referenced index), or pay a net settlement amount in the form of cash or securities equal to the notional amount of the swap less the recovery value of the referenced obligation (or underlying security comprising the relevant component of the referenced index). In return, the Portfolio would receive from the counterparty an upfront or periodic stream of payments throughout the life of the credit default swap agreement provided that no credit event has occurred. As the seller of protection, the Portfolio will effectively add leverage to its portfolio because, in addition to its total net assets, the Portfolio would be subject to investment exposure on the notional amount of the credit default swap.
The Portfolio may also purchase credit default swap contracts in order to hedge against the risk of default of debt securities held in its portfolio. This would involve the risk that the investment may be worthless when it expires and would only generate income in the event of an actual default by the issuer of the underlying obligation (as opposed to a credit downgrade or other indication of financial instability). It would also involve credit risk, whereby the seller may fail to satisfy its payment obligations to the Portfolio in the event of a default. As the buyer of protection, if an underlying credit event occurs, the Portfolio will either receive from the seller of protection an amount equal to the notional amount of the swap and deliver the referenced obligation (or underlying security comprising the relevant component of the referenced index), or receive a net settlement amount in the form of cash or securities equal to the notional amount of the swap less the recovery value of the referenced obligation (or underlying security comprising the relevant component of the referenced index). If no credit event occurs and the Portfolio is a buyer of protection, the Portfolio will typically recover nothing under the credit default swap agreement, but it will have had to pay the required upfront payment or stream of continuing payments under the credit default swap agreement. Recovery values are at times established through the credit event auction process in which market participants are ensured that a transparent price has been set for the defaulted obligation.
BHFTII-41
Brighthouse Funds Trust II
Brighthouse/Wellington Balanced Portfolio
Notes to Financial Statements—December 31, 2023—(Continued)
Credit default swap agreements on credit indices involve one party making a stream of payments to another party in exchange for the right to receive a specified return in the event of a write-down, principal shortfall, interest shortfall or default of all or part of the referenced entities comprising the credit index. A credit index is a basket of credit instruments or exposures designed to be representative of some part of the credit market as a whole. An index credit default swap references all the names in the index, and if there is a credit event involving an entity in the index, the credit event is settled based on that entity’s weight in the index. A Portfolio may use credit default swaps on credit indices as a hedge for credit default swaps or bonds held in the portfolio, which is less expensive than it would be to buy many individual credit default swaps to achieve similar effect. Credit default swaps on indices are benchmarks for protecting investors owning bonds against default, and may be used to speculate on changes in credit quality.
Implied credit spreads, represented in absolute terms, utilized in determining the market value of credit default swap agreements on a credit index or corporate or sovereign issuer, serve as some indication of the status of the payment/performance risk and the likelihood or risk of default for the credit derivative. The implied credit spread of a particular referenced entity or index also reflects the cost of buying/selling protection and may reflect upfront payments required to be made to enter into the agreement. Wider credit spreads generally represent a deterioration of the referenced entity’s credit soundness and a greater likelihood or risk of default or other credit event occurring as defined under the terms of the particular swap agreement. When no implied credit spread is available for a credit default swap, the current unrealized appreciation/depreciation on the position may be used as an indicator of the current status of the payment/performance risk.
The maximum potential amount of future payments (undiscounted) that the Portfolio as a seller of protection could be required to make under a credit default swap agreement equals the notional amount of the agreement. Notional amounts of all credit default swap agreements outstanding as of December 31, 2023, for which the Portfolio is the seller of protection, are disclosed in the Schedule of Investments. These potential amounts would be partially offset by any recovery values of the respective referenced obligations, upfront payments received upon entering into the agreement or net amounts received from the settlement of buy protection credit default swap agreements entered into by the Portfolio for the same referenced entity or entities.
Interest Rate Swaps: The Portfolio may enter into interest rate swaps to manage its exposure to interest rates, to adjust its interest rate sensitivity (duration), to preserve a return or spread on a particular investment, or otherwise as a substitute for a direct investment in debt securities. The Portfolio is subject to interest rate risk exposure in the normal course of pursuing its investment objectives. Because the Portfolio holds fixed rate bonds, the value of these bonds may decrease if interest rates rise. To help hedge against this risk and to maintain its ability to generate income at prevailing market rates, the Portfolio may enter into interest rate swap agreements. Interest rate swaps are agreements in which one party pays a stream of interest payments, either fixed or floating rate, for another party’s stream of interest payments, either fixed or floating, on the same notional amount for a specified period of time. Other forms of interest rate swap agreements may include: (1) interest rate caps, under which, in return for a premium, one party agrees to make payments to the other to the extent that interest rates exceed a specified rate, or “cap”; (2) interest rate floors, under which, in return for a premium, one party agrees to make payments to the other to the extent that interest rates fall below a specified rate, or “floor”; (3) interest rate collars, under which a party sells a cap and purchases a floor or vice versa in an attempt to protect itself against interest rate movements exceeding given minimum or maximum levels; and (4) basis swaps, under which two parties can exchange variable interest rates based on different segments of money market reference rates. The Portfolio’s maximum risk of loss from counterparty credit risk, as opposed to investment and other types of risk, in respect of interest rate swaps is typically the discounted net value of the cash flows to be received from the counterparty over the contract’s remaining life, to the extent that amount is positive.
Total Return Swaps: The Portfolio may enter into total return swap agreements to obtain exposure to a security or market without owning such security or investing directly in that market or to transfer the risk/return of one market (e.g., fixed income) to another market (e.g., equity) (equity risk and/or interest rate risk). Total return swaps are agreements in which one party agrees to make periodic payments to another party based on the change in market value of the assets underlying the contract, which may include a specified security, basket of securities or securities indices during the specific period, in return for periodic payments based on a fixed or floating rate or the total return from other underlying assets. When the Portfolio pays interest in exchange for the total return of an underlying asset and the value of the underlying asset decreases, the Portfolio may be required to pay the change in value to the counterparty in addition to the interest payment; conversely, when the Portfolio receives interest in exchange for the total return of an underlying asset and the value of the underlying asset decreases, the Portfolio may receive the change in value in addition to the interest payment. To the extent the total return of the instrument or index underlying the transaction exceeds or falls short of the offsetting interest rate obligation, the Portfolio will receive a payment from or make a payment to the counterparty. Total return swaps can also be structured without an interest payment, so that one party pays the other party if the value of the underlying asset increases and receives payment from the other party if the value of the underlying asset decreases.
BHFTII-42
Brighthouse Funds Trust II
Brighthouse/Wellington Balanced Portfolio
Notes to Financial Statements—December 31, 2023—(Continued)
The following table summarizes the fair value of derivatives held by the Portfolio at December 31, 2023 by category of risk exposure:
| Asset Derivatives |
Liability Derivatives |
|||||||||||
| Risk Exposure |
Statement of Assets & |
Fair Value | Statement of Assets & |
Fair Value | ||||||||
| Interest Rate |
Unrealized appreciation on centrally cleared swap contracts (a) (b) | $ | 280,124 | Unrealized depreciation on centrally cleared swap contracts (a) (b) | $ | 164,273 | ||||||
| Unrealized appreciation on futures contracts (b) (c) | 1,908,419 | Unrealized depreciation on futures contracts (b) (c) | 1,592,835 | |||||||||
| Credit | Unrealized depreciation on centrally cleared swaps (a)(b) | 155,210 | ||||||||||
| Foreign Exchange | Unrealized depreciation on forward foreign currency exchange contracts | 103,650 | ||||||||||
|
|
|
|
|
|||||||||
| Total | $ | 2,188,543 | $ | 2,015,968 | ||||||||
|
|
|
|
|
|||||||||
| (a) | Represents the unrealized appreciation/depreciation of centrally cleared swaps as reported in the Schedule of Investments. Only the variation margin is reported within the Statement of Assets and Liabilities. | |||
| (b) | Financial instrument not subject to a master netting agreement. | |||
| (c) | Includes cumulative appreciation/depreciation of futures contracts as reported in the Schedule of Investments. Only the current day’s variation margin is reported within the Statement of Assets and Liabilities. | |||
The Portfolio is required to disclose the impact of offsetting assets and liabilities represented in the Statement of Assets and Liabilities to enable users of the financial statements to evaluate the effect or potential effect of netting arrangements on its financial position for recognized assets and liabilities.
The following table presents the Portfolio’s derivative liabilities by counterparty net of amounts available for offset under a master netting agreement (“MNA”)(see Note 4), or similar agreement, and net of the related collateral pledged by the Portfolio as of December 31, 2023.
| Counterparty |
Derivative Liabilities subject to an MNA by Counterparty |
Financial Instruments available for offset |
Collateral Pledged† |
Net Amount** |
||||||||||||
| Citibank NA |
$ | 3,102 | $ | — | $ | — | $ | 3,102 | ||||||||
| Deutsche Bank AG |
100,548 | — | (60,000 | ) | 40,548 | |||||||||||
|
|
|
|
|
|
|
|
|
|||||||||
| $ | 103,650 | $ | — | $ | (60,000 | ) | $ | 43,650 | ||||||||
|
|
|
|
|
|
|
|
|
|||||||||
| ** | Net amount represents the net amount payable due to the counterparty in the event of default. | |||
| † | In some instances, the actual collateral received and/or pledged may be more than the amount shown here due to overcollateralization. | |||
The following tables summarize the effect of derivative instruments on the Statement of Operations, classified by derivative type and category of risk exposure, for the year ended December 31, 2023:
| Statement of Operations Location—Net |
Interest Rate | Credit | Equity | Foreign Exchange |
Total | |||||||||||||||
| Purchased options |
$ | 3,466 | $ | — | $ | — | $ | — | $ | 3,466 | ||||||||||
| Forward foreign currency transactions |
— | — | — | (464,634 | ) | (464,634 | ) | |||||||||||||
| Futures contracts |
(639,802 | ) | — | 227,080 | — | (412,722 | ) | |||||||||||||
| Swap contracts |
59,196 | (508,021 | ) | — | — | (448,825 | ) | |||||||||||||
| Written options |
— | 196,728 | — | — | 196,728 | |||||||||||||||
|
|
|
|
|
|
|
|
|
|
|
|||||||||||
| $ | (577,140 | ) | $ | (311,293 | ) | $ | 227,080 | $ | (464,634 | ) | $ | (1,125,987 | ) | |||||||
|
|
|
|
|
|
|
|
|
|
|
|||||||||||
| Statement of Operations Location—Net |
Interest Rate | Credit | Equity | Foreign Exchange |
Total | |||||||||||||||
| Forward foreign currency transactions |
$ | — | $ | — | $ | — | $ | 77,892 | $ | 77,892 | ||||||||||
| Futures contracts |
(581,638 | ) | — | 180,951 | — | (400,687 | ) | |||||||||||||
| Swap contracts |
115,851 | (70,284 | ) | — | — | 45,567 | ||||||||||||||
|
|
|
|
|
|
|
|
|
|
|
|||||||||||
| $ | (465,787 | ) | $ | (70,284 | ) | $ | 180,951 | $ | 77,892 | $ | (277,228 | ) | ||||||||
|
|
|
|
|
|
|
|
|
|
|
|||||||||||
BHFTII-43
Brighthouse Funds Trust II
Brighthouse/Wellington Balanced Portfolio
Notes to Financial Statements—December 31, 2023—(Continued)
For the year ended December 31, 2023, the average notional par or face amount outstanding for each derivative type was as follows:
| Derivative Description |
Average Notional Par or Face Amount‡ |
|||
| Purchased options |
$ | 1,240,000 | ||
| Forward foreign currency transactions |
11,184,243 | |||
| Futures contracts long |
98,360,947 | |||
| Futures contracts short |
(43,363,395 | ) | ||
| Swap contracts |
16,235,347 | |||
| Written options |
(66,350,000 | ) | ||
| ‡ | Averages are based on activity levels during the period for which the amounts are outstanding. | |||
4. Certain Risks
In the normal course of business, the Portfolio invests in securities and enters into transactions where risks exist. Those risks include:
Market Risk: The value of securities held by the Portfolio may decline in response to certain events, including those directly involving the issuers whose securities are owned by the Portfolio; conditions affecting the general economy; overall market changes; local, regional or global political, social or economic instability; currency, interest rate, and price fluctuations, or other factors including terrorism, war, natural disasters and the spread of infectious illness including epidemics or pandemics such as the COVID-19 pandemic. These events may also adversely affect the liquidity of securities held by the Portfolio.
Credit and Counterparty Risk: The Portfolio may be exposed to counterparty risk, or the risk that an entity with which the Portfolio has unsettled or open transactions may default. The potential loss could exceed the value of the financial assets and liabilities recorded in the financial statements. Financial assets that potentially expose the Portfolio to credit and counterparty risk consist principally of cash due from counterparties and investments. The Portfolio manages counterparty risk by entering into agreements only with counterparties that it believes have the financial resources to honor their obligations and by monitoring the financial stability of those counterparties. The Subadviser may attempt to mitigate counterparty risk by (i) periodically assessing the creditworthiness of its trading partners, (ii) monitoring and/or limiting the amount of its net exposure to each individual counterparty based on its assessment, and (iii) requiring collateral from the counterparty for certain transactions. In order to preserve certain safeguards for non-standard settlement trades, the Portfolio restricts its exposure to credit and counterparty losses by entering into master netting agreements (“Master Agreements”) with counterparties (approved brokers) with whom it undertakes a significant volume of transactions. Master Agreements govern the terms of certain transactions and reduce the counterparty risk associated with relevant transactions by specifying credit protection mechanisms and providing standardization that improves legal certainty. Master Agreements can also help limit counterparty risk by specifying collateral posting arrangements at pre-arranged exposure levels. Collateral requirements may differ by type of derivative or investment, as applicable. Collateral or margin requirements are set by the broker or exchange clearinghouse for exchange-traded derivatives (e.g., futures contracts and exchange-traded options), while collateral terms are contract specific for OTC traded derivatives (e.g., forward foreign currency exchange contracts, swap agreements and OTC options).
For derivatives traded under an International Swaps and Derivatives Association, Inc. Master Agreement (“ISDA Master Agreement”) or similar master agreement, the collateral requirements are netted across all transactions traded under such agreement and one amount is posted from one party to the other to collateralize such obligations. The ISDA Master Agreement gives each party to the agreement the right to terminate all transactions traded under such agreement if there is a certain deterioration in the credit quality of the other party. The ISDA Master Agreement gives the Portfolio the right, upon an event of default by the applicable counterparty or a termination of the agreement, to close out all transactions traded under such agreement and to net amounts owed under each transaction to one net amount payable by one party to the other. This right to close out and net payments across all transactions traded under the ISDA Master Agreement could result in a reduction of the Portfolio’s credit risk to such counterparty equal to any amounts payable by the Portfolio under the applicable transactions, if any. However, absent an event of default by the counterparty or a termination of the agreement, the ISDA Master Agreement does not result in an offset of reported amounts of assets and liabilities in the Statement of Assets and Liabilities across transactions between the Portfolio and the applicable counterparty. The enforceability of the right to offset may vary by jurisdiction. Cash collateral that has been pledged to cover obligations of the Portfolio under derivative contracts, if any, will be reported separately in the Statement of Assets and Liabilities. Securities pledged as collateral, if any, for the same purpose are noted in the Schedule of Investments.
Repurchase and reverse repurchase agreements are primarily executed under GMRAs or MRAs, which provide the right to set-off. Each repurchase and reverse repurchase agreement is initially collateralized at the transaction level. In the event of default, the total market value exposure will be offset against collateral exchanged to date, which would result in a net receivable/(payable) that would be due from/to the counterparty.
BHFTII-44
Brighthouse Funds Trust II
Brighthouse/Wellington Balanced Portfolio
Notes to Financial Statements—December 31, 2023—(Continued)
Master Securities Forward Transaction Agreements (“MSFTA”) govern the considerations and factors surrounding the settlement of certain forward settling transactions, such as TBA securities and delayed-delivery or secured borrowings transactions by and between the Portfolio and select counterparties. The MSFTA maintains provisions for, among other things, initiation and confirmation, payment and transfer, events of default, termination, and maintenance of collateral.
Customer Account Agreements and related addenda govern cleared derivatives transactions such as futures, options on futures, and cleared OTC derivatives. Cleared derivative transactions require posting of initial margin as determined by each relevant clearinghouse. The Portfolio’s clearing broker may also require additional initial margin. Clearinghouse-related initial margin is held by the clearinghouse and additional initial margin is held by the Portfolio’s clearing broker. In a cleared derivative transaction, the Portfolio’s counterparty is a clearinghouse rather than a bank or broker. The clearinghouse stands between the buyer and the seller of the contract; therefore, credit risk is limited to failure of or default by the clearinghouse. While offset rights may exist under applicable law, the Portfolio does not have a contractual right of offset against a clearing broker or clearinghouse in the event of a default (including the bankruptcy or insolvency). Additionally, credit risk exists in cleared derivative transactions with respect to initial and variation margin that is held in a clearing broker’s customer accounts. While clearing brokers are required to segregate, by account class, customer margin from their own assets, in the event that a clearing broker becomes insolvent or goes into bankruptcy and at that time there is a shortfall in the aggregate amount of margin held by the clearing broker for all its clients, typically the shortfall would be allocated on a pro-rata basis across all the clearing broker’s customers, for the relevant account class, potentially resulting in losses to the Portfolio. Variation margin, which accounts for changes in market value, is exchanged daily, but may not be netted between futures and cleared OTC derivatives.
Foreign Investment Risk: The investments by the Portfolio in foreign securities, whether direct or indirect, involve risks not present in domestic investments. Because securities may be denominated in foreign currencies, may require settlement in foreign currencies and may pay interest or dividends in foreign currencies, changes in the relationship of these foreign currencies to the U.S. dollar can significantly affect the value of the investments and earnings of the Portfolio. Foreign investments may also subject the Portfolio to foreign government exchange restrictions, expropriation, taxation, unexpected market closures or other political, social or economic developments, such as the imposition of economic sanctions against one or more countries, organizations, entities and/or individuals, all of which could affect the market and/or credit risk of the investments. In addition to the risks described above, risks may arise from forward foreign currency contracts with respect to the potential inability of counterparties to meet the terms of their contracts.
LIBOR Replacement Risk: LIBOR was the offered rate at which major international banks could obtain wholesale, unsecured funding. The terms of investments, financings or other transactions (including certain derivatives transactions) to which the Portfolio may be a party have historically been tied to LIBOR. In connection with the global transition away from LIBOR led by regulators and market participants, LIBOR was last published on a representative basis at the end of June 2023. The United Kingdom’s Financial Conduct Authority, which regulates LIBOR, has ceased publishing all LIBOR settings, but some USD LIBOR settings will continue to be published under a synthetic methodology until September 30, 2024 for certain legacy contracts. Alternative reference rates to LIBOR have been established in most major currencies (e.g., the Secured Overnight Financing Rate for U.S. dollar LIBOR and the Sterling Overnight Index Average for GBP LIBOR) and the transition to new reference rates continues. The full impact of the transition on the Portfolio, the financial instruments in which the Portfolio invests and financial markets more generally cannot yet be fully determined.
Additional risks associated with each type of investment are described above within the respective security type notes. The Portfolio’s prospectus includes a discussion of the principal risks of investing in the Portfolio.
5. Investment Transactions
Aggregate cost of purchases and proceeds of sales of investment securities, including mortgage dollar roll and TBA transactions but excluding short-term securities, for the year ended December 31, 2023 were as follows:
| Purchases |
Sales | |||||||||||
| U.S. Government |
Non-U.S. Government | U.S. Government | Non-U.S. Government | |||||||||
| $1,930,414,711 | $ | 551,115,197 | $ | 1,939,499,199 | $ | 630,730,119 | ||||||
Purchases and sales of mortgage dollar rolls and TBA transactions for the year ended December 31, 2023 were as follows:
| Purchases |
Sales | |||
| $1,817,342,856 | $ | 1,833,232,964 | ||
BHFTII-45
Brighthouse Funds Trust II
Brighthouse/Wellington Balanced Portfolio
Notes to Financial Statements—December 31, 2023—(Continued)
6. Investment Management Fees and Other Transactions with Affiliates
Investment Management Agreement - Brighthouse Investment Advisers is the investment adviser to the Portfolio. The Trust has entered into an investment management agreement with Brighthouse Investment Advisers with respect to the Portfolio. For providing investment management services to the Portfolio, Brighthouse Investment Advisers receives monthly compensation at the following annual rates:
|
Management |
% per annum | Average Daily Net Assets | ||||
| $5,232,014 | 0.500 | % | Of the first $500 million | |||
| 0.450 | % | Of the next $500 million | ||||
| 0.400 | % | On amounts in excess of $1 billion | ||||
Brighthouse Investment Advisers has entered into an investment subadvisory agreement with respect to managing the Portfolio. Wellington Management Company LLP (the “Subadviser”) is compensated by Brighthouse Investment Advisers to provide subadvisory services for the Portfolio.
Management Fee Waiver - Pursuant to a management fee waiver agreement, the Adviser has agreed, for the period May 1, 2023 to April 30, 2024, to reduce its advisory fees set out above under “Investment Management Agreement” for each class of the Portfolio as follows:
| % per annum reduction |
Average Daily Net Assets | |||
| 0.020% | On the first $ | 500 million | ||
Any reductions in total advisory fees paid by the Portfolio due to these waivers may be reduced or eliminated by changes in the advisory fee structure at higher asset levels. Brighthouse Investment Advisers will receive advisory fees equal to 0.480% of the Portfolio’s average daily net assets for amounts over $500 million but less than $750 million (0.030% over the contractual advisory fee rate) and 0.460% for amounts over $750 million but less than $1 billion (0.010% over the contractual advisory fee rate). As a result, the dollar amount of the waiver will be reduced as assets grow beyond $500 million up to $1 billion, but the advisory fee net of waivers will never exceed the contractual dollar amount that would otherwise be payable under the advisory fee. An identical agreement was in place for the period April 29, 2022 to April 30, 2023. There were no fees waived during the year ended December 31, 2023.
The Subadviser has voluntarily agreed to waive a portion of its subadvisory fees payable by the Adviser to the Subadviser for managing the Portfolio. In addition to the above advisory fee agreement, the Adviser has agreed to reduce its advisory fee reflecting a portion of the amount waived by the Subadviser for managing the Portfolio pursuant to the voluntary subadvisory fee waiver. $301,138 was waived in the aggregate for the year ended December 31, 2023 and is reflected in the total amount shown as a management fee waiver in the Statement of Operations.
Certain officers and trustees of the Trust may also be officers of the Adviser; however, such officers and trustees receive no compensation from the Trust.
Transfer Agency Agreement - Brighthouse Life Insurance Company serves as the transfer agent for the Trust. Brighthouse Life Insurance Company receives no fees for its services to the Trust.
Distribution and Service Fees - The Trust has a distribution agreement with Brighthouse Securities, LLC (the “Distributor”) pursuant to which the Distributor serves as the general distributor of shares of each class (each a “Class”) of each Portfolio. The Distributor is an affiliate of the Trust. The Trust has adopted a Distribution and Services Plan (the “D&S Plan”) relating to Class B, Class D, Class E, Class F and Class G shares of each Portfolio, under Rule 12b-1 under the 1940 Act, pursuant to which the Trust may pay the Distributor a fee (the “Service Fee”) at an annual rate not to exceed 0.25% of each such Portfolio’s average daily net assets attributable to the Class B, Class D, Class E, Class F and Class G shares of the Trust. Each Portfolio may not offer shares of each Class. The D&S Plan also authorizes the Trust, on behalf of each of its Portfolios, to pay to the Distributor a distribution fee (the “Distribution Fee” and together with the Service Fee, the “Fees”) at an annual rate of up to 0.25% of each Portfolio’s average daily net assets attributable to the Class B, Class D, Class E, Class F, and Class G shares in consideration of the services rendered in connection with the sale of such shares by the Distributor. Under the Distribution Agreement with respect to the Trust, Fees are currently paid at an annual rate of 0.25% of average daily net assets in the case of Class B shares, 0.10% of average daily net assets in the case of Class D shares, 0.15% of average daily net assets in the case of Class E shares, 0.20% of average daily net assets in the case of Class F shares and 0.30% of average daily net assets in the case of Class G shares. The D&S Plan is known as a “compensation plan” because the Trust makes payments to the Distributor for services rendered regardless of the actual level of expenditures by the Distributor. Amounts incurred by the Portfolio for the year ended December 31, 2023 are shown as Distribution and service fees in the Statement of Operations.
BHFTII-46
Brighthouse Funds Trust II
Brighthouse/Wellington Balanced Portfolio
Notes to Financial Statements—December 31, 2023—(Continued)
Deferred Trustee Compensation - Each Trustee who is not currently an employee of the Adviser or any of its affiliates receives compensation from the Trust for his or her service to the Trust. A deferred compensation plan (the “Plan”) is available to the Trustees on a voluntary basis. Deferred amounts remain in the Trust until distributed in accordance with the provisions of the Plan. The value of a participating Trustee’s deferral account is based on theoretical investments of deferred amounts on the normal payment dates in certain portfolios of the Trust or Brighthouse Funds Trust I, an affiliate of the Trust, as designated by the participating Trustee. Changes in the value of participants’ deferral accounts are reflected as a component of Trustees’ fees and expenses in the Statement of Operations. The portion of the accrued obligations allocated to the Portfolio under the Plan is reflected as Deferred trustees’ fees in the Statement of Assets and Liabilities.
7. Contractual Obligations
Under the Trust’s organizational documents, its officers and Trustees may be indemnified against certain liabilities and expenses arising out of the performance of their duties to the Trust. Additionally, the Trust has a variety of indemnification obligations under contracts with its service providers. The Trust’s maximum exposure under these arrangements is unknown, as this would involve future claims that may be made against the Trust that have not yet occurred.
8. Income Tax Information
The cost basis of investments for federal income tax purposes at December 31, 2023 was as follows:
| Cost basis of investments |
$ | 1,182,662,116 | ||
|
|
|
|||
| Gross unrealized appreciation |
150,978,747 | |||
| Gross unrealized (depreciation) |
(67,845,586 | ) | ||
|
|
|
|||
| Net unrealized appreciation (depreciation) |
$ | 83,133,161 | ||
|
|
|
The tax character of distributions paid for the years ended December 31, 2023 and 2022 were as follows:
| Ordinary Income |
Long-Term Capital Gain | Total | ||||||||||||||||||
| 2023 |
2022 | 2023 | 2022 | 2023 | 2022 | |||||||||||||||
| $24,006,274 | $ | 62,446,712 | $ | 8,503,350 | $ | 120,057,579 | $ | 32,509,624 | $ | 182,504,291 | ||||||||||
As of December 31, 2023, the components of distributable earnings (accumulated losses) on a federal income tax basis were as follows:
| Undistributed |
Undistributed Long-Term Capital Gain |
Net Unrealized Appreciation (Depreciation) |
Accumulated Capital Losses |
Total | ||||||||||||
| $22,438,232 | $ | 37,348,318 | $ | 82,925,575 | $ | — | $ | 142,712,125 | ||||||||
The Portfolio utilizes the provisions of the federal income tax laws that provide for the carryforward of capital losses for prior years, offsetting such losses against any future realized capital gains. Net capital losses may be carried forward indefinitely and their character is retained as short-term and/or long-term losses.
As of December 31, 2023, the Portfolio had no accumulated capital losses.
9. Recent Accounting Pronouncement & Regulatory Updates
In June 2022, FASB issued Accounting Standards Update 2022-03—Fair Value Measurement (Topic 820)—Fair Value Measurement of Equity Securities Subject to Contractual Sale Restrictions (“ASU 2022-03”). ASU 2022-03 clarifies the guidance in Topic 820 to indicate that a contractual sale restriction should not be considered in the fair value of an equity security subject to such a restriction, and requires entities with investments in equity securities subject to contractual sale restrictions to disclose certain qualitative and quantitative information about such securities. ASU 2022-03 is effective for fiscal years, and interim periods within those fiscal years, beginning after December 15, 2023. ASU 2022-03 is only applicable to an equity security in which the contractual arrangement that restricts its sale is executed or modified on or after the adoption date.
Effective January 24, 2023, the Securities and Exchange Commission adopted rule and form amendments that require open-end management investment companies to transmit concise and visually engaging annual and semiannual reports to shareholders that highlight certain information deemed by the SEC to be particularly important for investors. Certain other information, including financial statements, will no longer appear in shareholder reports but will, as required, be available online, delivered free of charge upon request, and filed on a semiannual basis on Form N-CSR. The rule and form amendments have a compliance date of July 24, 2024. Accordingly, the rule and form amendments will not impact the Portfolio until its 2024 semiannual shareholder report.
BHFTII-47
Brighthouse Funds Trust II
Brighthouse/Wellington Balanced Portfolio
Report of Independent Registered Public Accounting Firm
To the Board of Trustees of Brighthouse Funds Trust II and Shareholders of the Brighthouse/Wellington Balanced Portfolio:
Opinion on the Financial Statements and Financial Highlights
We have audited the accompanying statement of assets and liabilities, including the schedule of investments, of the Brighthouse/Wellington Balanced Portfolio (the “Fund”) (one of the funds constituting the Brighthouse Funds Trust II), as of December 31, 2023, the related statement of operations for the year then ended, the statements of changes in net assets for each of the two years in the period then ended, the financial highlights for each of the five years in the period then ended, and the related notes. In our opinion, the financial statements and financial highlights present fairly, in all material respects, the financial position of the Fund as of December 31, 2023, and the results of its operations for the year then ended, the changes in its net assets for each of the two years in the period then ended, and the financial highlights for each of the five years in the period then ended in conformity with accounting principles generally accepted in the United States of America.
Basis for Opinion
These financial statements and financial highlights are the responsibility of the Fund’s management. Our responsibility is to express an opinion on the Fund’s financial statements and financial highlights based on our audits. We are a public accounting firm registered with the Public Company Accounting Oversight Board (United States) (PCAOB) and are required to be independent with respect to the Fund in accordance with the U.S. federal securities laws and the applicable rules and regulations of the Securities and Exchange Commission and the PCAOB.
We conducted our audits in accordance with the standards of the PCAOB. Those standards require that we plan and perform the audit to obtain reasonable assurance about whether the financial statements and financial highlights are free of material misstatement, whether due to error or fraud. The Fund is not required to have, nor were we engaged to perform, an audit of its internal control over financial reporting. As part of our audits we are required to obtain an understanding of internal control over financial reporting but not for the purpose of expressing an opinion on the effectiveness of the Fund’s internal control over financial reporting. Accordingly, we express no such opinion.
Our audits included performing procedures to assess the risks of material misstatement of the financial statements and financial highlights, whether due to error or fraud, and performing procedures that respond to those risks. Such procedures included examining, on a test basis, evidence regarding the amounts and disclosures in the financial statements and financial highlights. Our audits also included evaluating the accounting principles used and significant estimates made by management, as well as evaluating the overall presentation of the financial statements and financial highlights. Our procedures included confirmation of securities owned as of December 31, 2023, by correspondence with the custodian, brokers, and agent banks; when replies were not received from brokers or agent banks, we performed other auditing procedures. We believe that our audits provide a reasonable basis for our opinion.
/s/ Deloitte & Touche LLP
Boston, Massachusetts
February 23, 2024
We have served as the auditor of one or more Brighthouse investment companies since 1983.
BHFTII-48
Brighthouse Funds Trust II
Trustees and Officers
MANAGEMENT OF THE TRUSTS
The Boards of Trustees (the “Board”) of Brighthouse Funds Trust I and Brighthouse Funds Trust II (“Trust I” and “Trust II”, respectively, and collectively the “Trusts”) supervise the Trusts and are responsible for representing the interests of shareholders. The Trustees, the Chairman of the Board and the Chairmen of each subcommittee are the same for both Trusts. The Trustees of each Trust meet periodically throughout the year to oversee the Portfolios’ activities, reviewing, among other things, each Portfolio’s performance and its contractual arrangements with various service providers. The Trustees of each Trust elect the officers of the Trust, who are responsible for administering the Trust’s day-to-day operations.
Trustees and Officers
The Trustees and executive officers of the Trusts, as well as their ages and their principal occupations during the past five years, are set forth below. Unless otherwise indicated, the business address of each is c/o Brighthouse Funds Trust I and Brighthouse Funds Trust II, 11225 N. Community House Rd., Charolette, North Carolina 28277. Each Trustee who is deemed an “interested person,” as such term is defined in the 1940 Act, is referred to as an “Interested Trustee.” Those Trustees who are not “interested persons,” as such term is defined in the 1940 Act, are referred to as “Independent Trustees.” There is no limit to the term a Trustee may serve, other than pursuant to the retirement policy adopted by the Independent Trustees. Trustees serve until their death, resignation, retirement or removal in accordance with Trust I’s and Trust II’s respective organizational documents and policies adopted by the Board of the Trust from time to time. Officers hold office at the pleasure of each Board and serve until their removal or resignation in accordance with the Trusts’ respective organizational documents and policies adopted by the Board of each Trust from time to time.
Trustees of the Trusts
| Name and Year of Birth |
Position(s) |
Term of Office |
Principal Occupation(s) During the Past |
Number of |
Other Directorships Held | |||||
| Interested Trustee | ||||||||||
| John Rosenthal* (1960) |
Trustee | Indefinite; From May 2016 (Trust I and Trust II) to present | Chief Investment Officer, Brighthouse Financial, Inc. (2016 to present). | 73 | None | |||||
| Independent Trustees | ||||||||||
| Dawn M. Vroegop (1966) |
Trustee and Chair of the Board | Indefinite; From December 2000 (Trust I)/May 2009 (Trust II) to present as Trustee; From May 2016 (Trust I and Trust II) until present as Chair |
Retired; Private Investor. | 73 | Trustee, Driehaus Mutual Funds (8 portfolios).** | |||||
| Stephen M. Alderman (1959) |
Trustee | Indefinite; From December 2000 (Trust I)/April 2012 (Trust II) to present | Vice President and General Counsel, IHR Aerial Solutions, LLC; Until 2022, General Counsel, Illini Hi-Reach, Inc.; Until 2020, Shareholder in the law firm of Garfield & Merel, Ltd. | 73 | None | |||||
| Robert J. Boulware (1956) |
Trustee | Indefinite; From March 2008 (Trust I)/April 2012 (Trust II) to present | Managing Member, Pilgrim Funds, LLC (private equity fund). | 73 | Trustee, Vertical Capital Income Fund (closed-end fund);** Trustee, The Private Shares Fund (closed-end fund);** Until 2021, Director, Mid-Con Energy Partners, LP (energy);** Until 2020, Director, Gainsco, Inc. (auto insurance).** | |||||
BHFTII-49
Brighthouse Funds Trust II
Trustees and Officers—(Continued)
| Name and Year of Birth |
Position(s) |
Term of Office |
Principal Occupation(s) During the Past |
Number of |
Other Directorships Held | |||||
| Susan C. Gause (1952) |
Trustee | Indefinite; From March 2008 (Trust I)/April 2012 (Trust II) to present | Private Investor. | 73 | Trustee, HSBC Funds (4 portfolios).** | |||||
| Nancy Hawthorne (1951) |
Trustee | Indefinite; From May 2003 (Trust II)/April 2012 (Trust I) to present | Private Investor. | 73 | Trustee, First Eagle Credit Opportunities Fund;** Trustee and Chair of the Board of Trustees, First Eagle Global Opportunities Fund;** Director, Avid Technology, Inc;** Director, CRA International, Inc.** | |||||
Executive Officers of the Trusts
| Name and Year of Birth |
Position(s) |
Term of Office |
Principal Occupation(s) | |||
| Kristi Slavin (1973) | President and Chief Executive Officer, of Trust I and Trust II | From May 2016 (Trust I and Trust II) to present |
President, Brighthouse Investment Advisers, LLC (2016-present). | |||
| Alan R. Otis (1971) | Chief Financial Officer and Treasurer, of Trust I and Trust II | From November 2017 (Trust I and Trust II) to present |
Executive Vice President, Brighthouse Investment Advisers, LLC (2017-present); formerly, Vice President, Brighthouse Investment Advisers, LLC (2012-2017); Assistant Treasurer, Trust I and Trust II (2012-2017). | |||
| Thomas Watterson (1985) | Secretary, of Trust I and Trust II | From November 2023 (Trust I and Trust II) to present |
Executive Vice President, Chief Legal Officer and Secretary, Brighthouse Investment Advisers, LLC (2023-Present); Managing Corporate Counsel, Brighthouse Financial Inc. (2023-present); Managing Counsel and Director, The Bank of New York Mellon Corporation (2019-2023); Counsel and Vice President, The Bank of New York Mellon Corporation (2016-2019). | |||
| Katie Hellmann (1980) | Chief Compliance Officer (“CCO”), of Trust I and Trust II | From May 2023 (Trust I and Trust II) to present |
Chief Compliance Officer, Brighthouse Investment Advisers, LLC (2023-present) and Head of Funds and Investments Compliance (2023-present). Deputy Chief Compliance Officer, Transamerica Asset Management (2022-2023). Leader and Senior Compliance Counsel – Funds Compliance, Edward Jones (2017-2022). | |||
| Rosemary Morgan (1983) | Anti-Money Laundering Officer, of Trust I and Trust II | From May 2023 (Trust I and Trust II) to present |
Chief Privacy Officer, Leader of Compliance Programs and Assistant General Counsel, Brighthouse Financial, Inc. (2019-2022); Chief Privacy Officer, Head of Compliance Programs & Contracts Law, Brighthouse Financial, Inc. (2022-2023), Chief Compliance Officer and Associate General Counsel, Brighthouse Financial, Inc. (2023-present); Vice President and Chief Compliance Officer, Brighthouse Life Insurance Company (2023-present); Vice President and Chief Compliance Officer (2023-present), Brighthouse Life Insurance Company of NY; Vice President and Chief Compliance Officer (2023-present), New England Life Insurance Company. | |||
| Anna Koska (1981) | Vice President, of Trust I and Trust II | From June 2022 (Trust I and Trust II) to present |
Vice President, Investment and Advisory Services, Brighthouse Investment Advisers, LLC (2022-present); Director of Investment and Advisory Services, Brighthouse Investment Advisers, LLC (2019-2022); Senior Portfolio Analyst, Brighthouse Investment Advisers, LLC (2017-2019). | |||
| * | Mr. Rosenthal is an “interested person” of the Trusts because of his position with Brighthouse Financial, Inc. (“Brighthouse Financial”), an affiliate of BIA. |
| ** | Indicates a directorship with a registered investment company or a company subject to the reporting requirements of the Securities Exchange Act of 1934, as amended. |
| (1) | Previous positions during the past five years with the Trusts, MetLife, Inc. or the Adviser are omitted if not materially different. |
| (2) | The Fund Complex includes 44 Trust I Portfolios and 29 Trust II Portfolios. |
BHFTII-50
Brighthouse Funds Trust II
Brighthouse/Wellington Balanced Portfolio
Board of Trustees’ Consideration of Advisory and Sub-Advisory Agreements
At a meeting held on November 13-14, 2023 (the “November Meeting”), the Boards of Trustees (the “Board”) of Brighthouse Funds Trust I and Brighthouse Funds Trust II (“BFT I” and “BFT II,” respectively, and collectively, the “Trusts”), including a majority of the Trustees who are not “interested persons” of the Trusts (the “Independent Trustees”) under the Investment Company Act of 1940 (the “1940 Act”), approved the continuation of the Trusts’ advisory agreements (each an “Advisory Agreement”) with Brighthouse Investment Advisers, LLC (the “Adviser”) and the applicable sub-advisory and sub-sub-advisory agreements (each a “Sub-Advisory Agreement” and collectively with the Advisory Agreement, the “Agreements”) between the Adviser and the investment sub-advisers and sub-sub-adviser (each a “Sub-Adviser,” and collectively, the “Sub-Advisers”) for the series of the Trusts (each a “Portfolio,” and collectively, the “Portfolios”) for the annual contract renewal period from January 1, 2024 through December 31, 2024.
The Board met with personnel of the Adviser on September 28-29, 2023 (the “September Meeting”) for the specific purpose of giving preliminary consideration to the proposed continuation of the Agreements, including consideration to information that the Adviser and Sub-Advisers had provided for the Board’s review at the request of the Independent Trustees. At the September Meeting, the Adviser reviewed with the Board the performance and fees experienced by each Portfolio, as well as other information. During and after the September Meeting, the Independent Trustees requested additional information and clarifications that the Adviser addressed at the November Meeting (the September Meeting and the November Meeting are referred to collectively as, the “Meetings”). During the contract renewal process, and throughout the year, the Independent Trustees were advised by independent legal counsel, and they met with independent legal counsel in executive sessions outside of the presence of management on a number of occasions to discuss, among other things, the renewal of the Agreements.
In considering the continuation of the Agreements, the Board reviewed a variety of materials that were provided for the specific purpose of assisting the Board in the renewal process, along with various information and materials that were provided to and discussed with the Board throughout the year, at regularly scheduled meetings of the Board and its committees. In particular, information for each Portfolio included, but was not limited to, reports on investment performance, expenses, legal and compliance matters, and asset pricing. Information about the Adviser and each Sub-Adviser included, but was not limited to, reports on the business, operations, and performance of the Adviser and the Sub-Advisers and reports that the Adviser and Sub-Advisers had prepared specifically for the renewal process.
In considering the continuation of the Agreements, the Board also reviewed, among other things, a report for each Portfolio that was prepared by Broadridge (“Broadridge”), an independent organization, which set forth comparative performance and expense information for each Portfolio. In addition, the Independent Trustees reviewed a report that was prepared by JDL Consultants, LLC (“JDL”), an independent consultant to the Independent Trustees, which examined the Broadridge reports for each Portfolio (“JDL Report”). The Independent Trustees met in executive session with representatives of JDL during the September Meeting to review the JDL Report.
At the November Meeting, the Board, including a majority of the Independent Trustees, concluded that the nature, extent, and quality of services provided by the Adviser and each Sub-Adviser supported the renewal of the Agreements. The Board also concluded that the investment services provided to and the performance of each Portfolio was such that each Agreement should continue, and that the fees paid by each Portfolio to the Adviser appeared to be reasonable in light of the nature, extent, and quality of the services provided by the Adviser and each Sub-Adviser. Further, the Board concluded that the Adviser’s profitability in providing services under the Advisory Agreements did not appear unreasonable in light of the nature, extent, and quality of the services provided by the Adviser. The Board reviewed the extent to which the investment advisory fees paid by the Portfolios shared economies of scale with investors or entailed the potential to share economies of scale with investors and concluded that those considerations generally supported the renewal of each Agreement. Finally, the Board considered the Adviser’s recommendation that it approve the renewal of each Sub-Advisory Agreement.
In approving the continuation of each Agreement, the Board, including the Independent Trustees, gave attention to all of the information that was furnished, and each Trustee placed varying degrees of importance on the various pieces of information that were provided to them. The Board evaluated the information provided to it on a Portfolio-by-Portfolio basis, and its decision was made separately with respect to each Portfolio. The following paragraphs provide more information about some of the primary factors that were relevant to the Board’s decisions. The Board did not identify any single factor as determinative, and the Trustees generally attributed different weights to various factors for the various Portfolios.
Nature, extent and quality of services. The Board evaluated the nature, extent, and quality of the services that the Adviser and the Sub-Advisers, as relevant, provided to the Portfolios. The Board considered the Adviser’s services as investment manager to the Portfolios, including its services relating to the hiring and oversight of the Sub-Advisers and, in particular, their investment programs and personnel, succession management of key personnel, trading practices, compliance programs and personnel, and risk management
BHFTII-51
Brighthouse Funds Trust II
Brighthouse/Wellington Balanced Portfolio
Board of Trustees’ Consideration of Advisory and Sub-Advisory Agreements—(Continued)
programs, among other things. The Adviser’s services in coordinating and overseeing the activities of the Trusts’ other service providers were also considered. The Board also considered the systems and processes required by the Adviser to meet additional regulatory and compliance requirements resulting from U.S. Securities and Exchange Commission and other regulatory initiatives, including related to liquidity, valuation, and derivatives risk management. The Board considered information received from the Trusts’ Chief Compliance Officer regarding the Portfolios’ compliance policies and procedures that were established pursuant to Rule 38a-l under the 1940 Act, and relevant aspects of the Adviser’s and Sub-Advisers’ compliance policies and procedures. The Board also noted that it was the practice of the Adviser’s investment, compliance, and legal staff to conduct periodic meetings (through various media) with the Sub-Advisers throughout the year in order to review and assess the services that are provided to the Portfolios, and that personnel of the Adviser routinely prepare and present reports to the Board regarding those meetings. In addition, during the Meetings and throughout the year, the Board considered the expertise, experience, and performance of the personnel of the Adviser who performed the various services that are mentioned above.
With respect to the services provided by each of the Sub-Advisers, the Board considered a variety of information that the Adviser and each Sub-Adviser prepared for the Board’s review. The Board considered each Sub-Adviser’s investment process, each Sub-Adviser’s overall organization and business plans and the investment performance experienced by the Portfolio (as described in more detail below). The Board took into account that each Sub-Adviser’s responsibilities include, among other things, the development and maintenance of an investment program for the applicable Portfolio, the selection of investments and the placement of orders for the purchase and sale of such assets, and the implementation of compliance controls related to the performance of these services. The Board considered, based on the information provided, each Sub-Adviser’s staffing with respect to the management of the Portfolio and other information relating to the Sub-Adviser’s business and operations. The Board also considered the Sub-Adviser’s overall resources and information with respect to any recent turnover of key personnel at the Sub-Adviser. The Board reviewed each Sub-Adviser’s investment experience, as well as information provided regarding the Sub-Adviser’s personnel who provide services to the Portfolios. The Board also considered, among other things, information about each Sub-Adviser’s compliance program, including regarding any compliance matters involving a Sub-Adviser that had been brought to the Board’s attention during the year, as well as the Adviser’s assessment of the financial condition of each Sub-Adviser.
Performance. The Board placed emphasis on the performance of each Portfolio in the context of the performance of the relevant markets in which the Portfolio invests. The Board considered the Adviser’s quarterly presentations to the Board of detailed information about each Portfolio’s investment strategies and performance results and composition, including discussions regarding the relevant effects of market conditions. The Board reviewed and considered the reports prepared by Broadridge, which provided a statistical analysis comparing each Portfolio’s investment performance to that of comparable funds underlying variable insurance products (the “Performance Universe”), and the JDL Report. The Board also compared the performance of each Portfolio to that of comparable funds and other accounts that were managed by the relevant Sub-Adviser, to the extent such information was provided. The Board considered each Portfolio’s performance for periods subsequent to the performance period covered by the Broadridge reports and considered the Adviser’s assessment of the same. The Board also noted that while it found the data provided by Broadridge generally useful, it recognized the limitations of such data, including, in particular, that notable differences may exist between a Portfolio and the other funds in a Broadridge category (for example, with respect to investment strategies) and that the results of the performance comparisons may vary depending on (i) the end dates for the performance periods that were selected and (ii) the selection of the peer groups.
The Board focused particular attention on Portfolios with less favorable performance records. The Board noted the Adviser’s focus on each Sub-Adviser’s performance and that the Adviser had been active in monitoring and responding to any performance issues with respect to the Portfolios.
Fees and Expenses. The Board gave consideration to the level and method of computing the fees payable under the Agreements. The Board reviewed and considered the information in the JDL Report concerning fees and expenses. The Board also reviewed and considered the Broadridge report for each Portfolio, which included various comparisons of the Portfolio’s fees (at December 31, 2022 and various asset levels) and expenses with those of its peers, including, as applicable, a broad group of peer funds (“Expense Universe”), a narrower group of peer funds (“Expense Group”), a broad group of peer sub-advised funds (“Sub-advised Expense Universe”), and a narrower group of peer sub-advised funds (“Sub-advised Expense Group”). In particular, the Board reviewed comparisons of each Portfolio’s contractual management fees with its Expense Group and Sub-advised Expense Universe, contractual sub-adviser fees with its Sub-advised Expense Universe and Sub-advised Expense Group, and total expenses with its Expense Universe, Expense Group and Sub-advised Expense Universe. The Board considered that Broadridge selected the peer funds, which were funds underlying variable insurance products that Broadridge deemed to be comparable to the Portfolios. The Board considered that the fee and expense information in the Broadridge report for each Portfolio reflected information as of the Portfolio’s most recent fiscal year
BHFTII-52
Brighthouse Funds Trust II
Brighthouse/Wellington Balanced Portfolio
Board of Trustees’ Consideration of Advisory and Sub-Advisory Agreements—(Continued)
end at the time the Broadridge report was issued and that historical asset levels may differ from current asset levels, particularly in a period of market volatility. In addition, the Board compared the fee payable to a Sub-Adviser by the Adviser with respect to the Portfolio to the fee payable to the Sub-Adviser by other comparable funds and other accounts, to the extent such information was provided.
The Board noted that the sub-advisory fees for the Portfolios are negotiated at arm’s length by the Adviser and are paid by the Adviser out of its advisory fees. The Board also considered that the Adviser had entered into expense limitation or management fee waiver agreements with certain of the Portfolios pursuant to which the Adviser had agreed to waive a portion of its advisory fee and/or reimburse certain expenses as a means of limiting a Portfolio’s total annual operating expenses or passing through the benefit of a subadvisory fee concession to a Portfolio, as applicable.
Profitability. The Board examined the profitability to the Adviser of each Advisory Agreement, on a Portfolio-by-Portfolio basis. The Board also considered that an affiliate of the Adviser, Brighthouse Securities, LLC, serves as distributor for the Trusts, and, as such, receives Rule 12b-1 payments to support the distribution of the Portfolios. The Board considered the profitability to the Sub-Advisers and their affiliates of their relationships with the Portfolios, to the extent provided, and the Board considered the ability of the Adviser to negotiate with a Sub-Adviser at arm’s length. In reviewing the profitability information, the Board recognized that expense allocation methodologies are inherently subjective and various methodologies may be reasonable while producing different results.
Economies of scale. The Board considered each Portfolio’s fees in light of its size. The Board noted the fee schedules for the Portfolios that contain breakpoints that reduce the fee rate above specified asset levels, including breakpoints in the Advisory Agreements and any corresponding Sub-Advisory Agreement. The Board noted those Portfolios that did not have breakpoints in their advisory fees and considered management’s explanation of the same.
The Board considered the effective fees under the Advisory Agreement and Sub-Advisory Agreement for each Portfolio as a percentage of assets at different asset levels and possible economies of scale that may be realized if the assets of the Portfolio grow. The Board examined, among other data, the effect of a Portfolio’s growth in size, and reduction in size, on various fee schedules. The Board also generally noted that if a Portfolio’s assets increase over time, the Portfolio may realize economies of scale if assets increase proportionally more than certain other expenses.
Other factors. The Board considered other benefits that may be realized by the Adviser and its affiliates from their relationships with the Trusts. Among the benefits realized by the Adviser, the Board recognized that Brighthouse Securities, LLC, as the distributor for the Trusts, receives payments pursuant to Rule 12b-1 from the Portfolios to help compensate for the provision of shareholder services and distribution activities. The Board considered that a Sub-Adviser may engage in soft dollar transactions in managing a Portfolio. In addition, the Board considered that a Sub-Adviser may be affiliated with registered broker-dealers that may, from time to time, receive brokerage commissions from a Portfolio in connection with the sale of portfolio securities (subject to applicable best execution obligations). The Board also considered that a Sub-Adviser and its affiliates could benefit from the opportunity to provide advisory services to additional portfolios of the Trusts and overall reputational benefits.
The Board considered information from the Adviser and Sub-Advisers pertaining to potential conflicts of interest, and the manner in which any potential conflicts were mitigated. In its review, the Board considered information regarding various business relationships among the Adviser and its affiliates and various Sub-Advisers and their affiliates. The Board also considered information about services and/or payments provided to the Adviser by the Sub-Advisers in connection with marketing activities. The Board considered representations from the Adviser that such business relationships and any payments were not considered in the Adviser’s recommendation to renew any of the Sub-Advisory Agreements.
* * * * *
Brighthouse/Wellington Balanced Portfolio. The Board also considered the following information in relation to the Agreements with the Adviser and Wellington Management Company LLP regarding the Portfolio:
Among other data relating specifically to the Portfolio’s performance, the Board considered that the Portfolio outperformed the median of its Performance Universe and the average of its Morningstar Category for the one-, three-, and five-year periods ended June 30, 2023. The Board further considered that the Portfolio outperformed its blended benchmark, the S&P 500 Index (60%) & Bloomberg U.S. Aggregate Bond Index (40%), for the one-year period ended October 31, 2023 and underperformed its benchmark for the three- and five-year periods ended October 31, 2023. The Board also noted the presence of certain management fee waivers in effect for the Portfolio.
BHFTII-53
Brighthouse Funds Trust II
Brighthouse/Wellington Balanced Portfolio
Board of Trustees’ Consideration of Advisory and Sub-Advisory Agreements—(Continued)
The Board also considered that the Portfolio’s actual management fee and total expenses (exclusive of 12b-l fees) were below the Expense Group median, the Expense Universe median, and the Sub-advised Expense Universe median. The Board noted that the Portfolio’s contractual management fees were below the asset-weighted average of the Investment Classification/Morningstar Category selected by Broadridge at the Portfolio’s current size. The Board also noted that the Portfolio’s contractual sub-advisory fees were below the averages of the Sub-advised Expense Universe and the Sub-advised Expense Group at the Portfolio’s current size.
BHFTII-54
Brighthouse Funds Trust II
Brighthouse/Wellington Core Equity Opportunities Portfolio
Managed By Wellington Management Company LLP
Portfolio Manager Commentary*
PERFORMANCE
For the twelve months ended December 31, 2023, the Class A, B and E shares of the Brighthouse/Wellington Core Equity Opportunities Portfolio returned 7.66%, 7.38%, and 7.49%, respectively. The Portfolio’s benchmark, the Russell 1000 Index¹, returned 26.53%.
MARKET ENVIRONMENT / CONDITIONS
Global equities rose in 2023 amid easing inflation, optimism for lower interest rates, and resilient economic performance. Global equities rose in the first quarter. Economic growth, consumer spending, and labor markets were surprisingly resilient against a backdrop of seismic changes in the global economy, including sweeping sanctions against Russia, a reshaping of global energy flows, and a banking crisis that rekindled fears of a global recession. Major central banks continued to raise interest rates, but financial stresses and persistent inflation muddied the outlook for central bank policy. Global equities also rose in the second quarter as declining energy prices helped reduce headline inflation in most countries, easing the strains on households and businesses. However, persistently high core consumer prices kept pressure on central banks to keep interest rates higher for longer. Global equities fell in the third quarter as market sentiment was dented by concerns about the health of China’s economy, increasing energy prices, and rising government bond yields amid the prospect of an extended period of high interest rates. In a potential step toward phasing out Japan’s ultra-easy monetary policy, the Bank of Japan allowed greater flexibility for government bond yields to fluctuate but ultimately held rates stable. Global equities ended the fourth quarter higher. The Federal Reserve surprised markets by signaling lower interest rates in 2024, sparking a stock rally that rippled across the globe and increasing speculation for sharp reductions in policy rates across developed markets in 2024. China’s economy rebounded, with third-quarter Gross Domestic Product expanding by 4.9% from a year ago. Nonetheless, a deepening slump in the property sector burdened the country’s recovery and investor sentiment. The Brent crude oil price dropped below $80 per barrel amid higher U.S. output and Organization of the Petroleum Exporting Countries+ struggling to agree on production cuts.
Within the S&P 500 Index, 9 of the 11 sectors rose for the twelve months ended December 31, 2023. Information Technology (57.6%) and Communication Services (55.8%) were the best performing sectors.
PORTFOLIO REVIEW / PERIOD END POSITIONING
The Portfolio underperformed its benchmark, the Russell 1000 Index, for the twelve-month period ended December 31, 2023. Stock selection drove relative underperformance. Weak selection in Industrials, Consumer Discretionary, and Information Technology (“IT”) was partially offset by strong selection in Materials and Consumer Staples. Sector allocation, a result of our bottom-up stock selection process, also detracted from relative performance due to an underweight allocation to IT, an overweight allocation to Consumer Staples, and a lack of exposure to Communication Services. This was partially offset by a lack of exposure to Energy, an underweight allocation to Utilities and an overweight allocation to Financials.
The Portfolio’s overweight positions in Northrop Grumman and Nike, as well as its lack of exposure to benchmark constituents NVIDIA, Meta Platforms, Apple and Amazon, were among the top relative detractors during the period. Shares of U.S.-based aerospace and defense company Northrop Grumman were down after a strong year in 2022 on jitters around the upcoming U.S. election in the second half of 2024. Shares of Nike, a U.S.-based manufacturer of athletic apparel, fell over the period due to a sluggish recovery in China, inventory headwinds, and an uncertain macro outlook. At the end of the period, the Portfolio held positions in Northrop Grumman and Nike.
The Portfolio’s overweight exposure to Costco Wholesale and Ecolab, as well as its lack of exposure to benchmark constituents Exxon Mobil, Chevron, Bristol-Myers Squibb and Abbvie were among the top relative contributors during the period. The share price of Costco, a U.S.-based retailer which operates membership warehouse clubs, rose during the period. The company continued to execute, growing both top and bottom lines by increasing volumes and continuously improving customer experience. Shares of Ecolab, a U.S.-based chemical company providing water, hygiene, and infection prevention solutions, ended the period higher on strong pricing momentum and accelerating volumes, as well as continued margin expansion from productivity enhancements. At the end of the period, the Portfolio continued to hold positions in Costco Wholesale and Ecolab.
BHFTII-1
Brighthouse Funds Trust II
Brighthouse/Wellington Core Equity Opportunities Portfolio
Managed By Wellington Management Company LLP
Portfolio Manager Commentary*—(Continued)
As of the end of the period, the Portfolio was most overweight the Industrials and Consumer Staples sectors and most underweight the IT and Communication Services sectors.
Donald J. Kilbride
Peter Fisher
Portfolio Managers
Wellington Management Company LLP
* This commentary may include statements that constitute “forward-looking statements” under the U.S. securities laws. Forward-looking statements include, among other things, projections, estimates, and information about possible or future results related to the Portfolio, market or regulatory developments. The views expressed above are not guarantees of future performance or economic results and involve certain risks, uncertainties and assumptions that could cause actual outcomes and results to differ materially from the views expressed herein. The views expressed above are subject to change at any time based upon economic, market, or other conditions and the subadvisory firm undertakes no obligation to update the views expressed herein. Any discussions of specific securities should not be considered a recommendation to buy or sell those securities. The views expressed above (including any forward-looking statement) may not be relied upon as investment advice or as an indication of the Portfolio’s trading intent. Information about the Portfolio’s holdings, asset allocation or country diversification is historical and is not an indication of future Portfolio composition, which may vary. Direct investment in any index is not possible. The performance of any index mentioned in this commentary has not been adjusted for ongoing management, distribution and operating expenses, and sales charges applicable to mutual fund investments. In addition, the returns do not reflect additional fees charged by separate accounts or variable insurance contracts that an investor in the Portfolio may pay. If these additional fees were reflected, performance would have been lower.
1 The Russell 1000 Index is an unmanaged measure of the 1,000 largest companies in the Russell 3000 Index, which represents approximately 90% of the investable U.S. equity market.
BHFTII-2
Brighthouse Funds Trust II
Brighthouse/Wellington Core Equity Opportunities Portfolio
A $10,000 INVESTMENT COMPARED TO THE RUSSELL 1000 INDEX
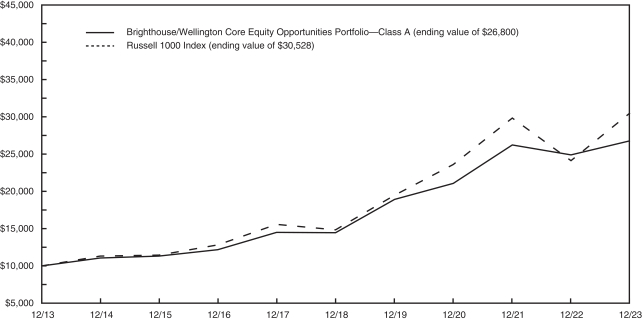
AVERAGE ANNUAL RETURNS (%) FOR THE YEAR ENDED DECEMBER 31, 2023
| 1 Year | 5 Year | 10 Year | ||||||||||
| Brighthouse/Wellington Core Equity Opportunities Portfolio | ||||||||||||
| Class A |
7.66 | 13.12 | 10.36 | |||||||||
| Class B |
7.38 | 12.84 | 10.08 | |||||||||
| Class E |
7.49 | 12.95 | 10.19 | |||||||||
| Russell 1000 Index | 26.53 | 15.52 | 11.81 | |||||||||
Portfolio performance is calculated including reinvestment of all income and capital gain distributions. Performance numbers are net of all Portfolio expenses but do not include any insurance, sales, separate account or administrative charges of variable annuity or life insurance contracts or any additional expenses that participants may bear relating to the operations of their plans. If these charges were included, the returns would be lower. The performance of any index referenced above has not been adjusted for ongoing management, distribution and operating expenses, and sales charges applicable to mutual fund investments. Direct investment in any index is not possible. The performance of Class A shares, as set forth in the line graph above, will differ from that of other classes because of the difference in expenses paid by policyholders investing in the different share classes.
This information represents past performance and is not indicative of future results. Investment return and principal value may fluctuate so that shares, upon redemption, may be worth more or less than the original cost.
PORTFOLIO COMPOSITION AS OF DECEMBER 31, 2023
Top Holdings
| % of Net Assets |
||||
| Microsoft Corp. | 4.3 | |||
| UnitedHealth Group, Inc. | 3.7 | |||
| Stryker Corp. | 3.5 | |||
| Honeywell International, Inc. | 3.2 | |||
| Danaher Corp. | 3.1 | |||
| Visa, Inc.- Class A | 3.1 | |||
| Accenture PLC- Class A | 3.1 | |||
| Linde PLC | 3.0 | |||
| Northrop Grumman Corp. | 2.9 | |||
| TJX Cos., Inc. | 2.9 | |||
Top Sectors
| % of Net Assets |
||||
| Industrials | 21.0 | |||
| Health Care | 18.8 | |||
| Consumer Staples | 14.7 | |||
| Financials | 14.5 | |||
| Information Technology | 10.8 | |||
| Consumer Discretionary | 10.5 | |||
| Materials | 5.2 | |||
| Real Estate | 3.3 | |||
BHFTII-3
Brighthouse Funds Trust II
Brighthouse/Wellington Core Equity Opportunities Portfolio
Understanding Your Portfolio’s Expenses
Shareholder Expense Example
As a shareholder of the Portfolio, you incur ongoing costs, including management fees; distribution and service (12b-1) fees; and other Portfolio expenses. This example is intended to help you understand your ongoing costs (in dollars) (referred to as “expenses”) of investing in the Portfolio and compare these costs with the ongoing costs of investing in other mutual funds. The example is based on an investment of $1,000 invested at the beginning of the period and held for the entire period, July 1, 2023 through December 31, 2023.
Actual Expenses
The first line for each share class of the Portfolio in the table below provides information about actual account values and actual expenses. You may use the information in this line, together with the amount you invested in the particular share class of the Portfolio, to estimate the expenses that you paid over the period. Simply divide your account value by $1,000 (for example, an $8,600 account value divided by $1,000 = 8.6), then multiply the result by the number in the first line under the heading entitled “Expenses Paid During Period” to estimate the expenses you paid on your account during this period.
Hypothetical Example for Comparison Purposes
The second line for each share class of the Portfolio in the table below provides information about hypothetical account values and hypothetical expenses based on the Portfolio’s actual expense ratio and an assumed rate of return of 5% per year before expenses, which is not the Portfolio’s actual return. The hypothetical account values and expenses may not be used to estimate the actual ending account balance or expenses you paid for the period. You may use this information to compare the ongoing costs of investing in the Portfolio and other funds. To do so, compare this 5% hypothetical example with the 5% hypothetical examples that appear in the shareholder reports of the other funds.
Please note that the expenses shown in the table are meant to highlight your ongoing costs only and do not reflect any fees or charges of your variable insurance product or any additional expenses that participants in certain eligible qualified plans may bear relating to the operations of their plan. Therefore, the second line for each share class in the table is useful in comparing ongoing costs only, and will not help you determine the relative total costs of owning different funds. In addition, if these other costs were included, your costs would have been higher.
| Brighthouse/Wellington Core Equity Opportunities Portfolio |
|
Annualized Expense Ratio |
Beginning Account Value July 1, 2023 |
Ending Account Value December 31, 2023 |
Expenses Paid During Period** July 1, 2023 to December 31, 2023 |
|||||||||||||
| Class A (a) |
Actual | 0.58 | % | $ | 1,000.00 | $ | 1,041.30 | $ | 2.98 | |||||||||
| Hypothetical* | 0.58 | % | $ | 1,000.00 | $ | 1,022.28 | $ | 2.96 | ||||||||||
| Class B (a) |
Actual | 0.83 | % | $ | 1,000.00 | $ | 1,040.00 | $ | 4.27 | |||||||||
| Hypothetical* | 0.83 | % | $ | 1,000.00 | $ | 1,021.02 | $ | 4.23 | ||||||||||
| Class E (a) |
Actual | 0.73 | % | $ | 1,000.00 | $ | 1,040.90 | $ | 3.76 | |||||||||
| Hypothetical* | 0.73 | % | $ | 1,000.00 | $ | 1,021.53 | $ | 3.72 | ||||||||||
| * | Hypothetical assumes a rate of return of 5% per year before expenses. |
| ** | Expenses paid are equal to the Portfolio’s annualized expense ratio for the most recent six month period, as shown above, multiplied by the average account value over the period, multiplied by the number of days (184 days) in the most recent fiscal half-year, divided by 365 (to reflect the one-half year period). |
| (a) | The annualized expense ratio shown reflects the impact of the management fee waiver as described in Note 5 of the Notes to Financial Statements. |
BHFTII-4
Brighthouse Funds Trust II
Brighthouse/Wellington Core Equity Opportunities Portfolio
Schedule of Investments as of December 31, 2023
Common Stocks—98.8% of Net Assets
| Security Description | Shares | Value | ||||||
| Aerospace & Defense—8.3% | ||||||||
| General Dynamics Corp. |
302,138 | $ | 78,456,174 | |||||
| Lockheed Martin Corp. |
98,924 | 44,836,314 | ||||||
| Northrop Grumman Corp. |
193,159 | 90,425,454 | ||||||
| RTX Corp. |
518,286 | 43,608,584 | ||||||
|
|
|
|||||||
| 257,326,526 | ||||||||
|
|
|
|||||||
| Air Freight & Logistics—1.8% | ||||||||
| United Parcel Service, Inc. - Class B |
359,214 | 56,479,217 | ||||||
|
|
|
|||||||
| Banks—1.1% | ||||||||
| PNC Financial Services Group, Inc. |
217,035 | 33,607,870 | ||||||
|
|
|
|||||||
| Beverages—6.8% | ||||||||
| Coca-Cola Co. |
1,120,037 | 66,003,781 | ||||||
| Diageo PLC |
1,840,661 | 66,842,129 | ||||||
| PepsiCo, Inc. |
463,142 | 78,660,037 | ||||||
|
|
|
|||||||
| 211,505,947 | ||||||||
|
|
|
|||||||
| Chemicals—5.2% | ||||||||
| Ecolab, Inc. |
343,046 | 68,043,174 | ||||||
| Linde PLC |
225,096 | 92,449,178 | ||||||
|
|
|
|||||||
| 160,492,352 | ||||||||
|
|
|
|||||||
| Consumer Finance—2.6% | ||||||||
| American Express Co. |
440,345 | 82,494,232 | ||||||
|
|
|
|||||||
| Consumer Staples Distribution & Retail—2.4% | ||||||||
| Costco Wholesale Corp. (a) |
113,769 | 75,096,642 | ||||||
|
|
|
|||||||
| Financial Services—5.9% | ||||||||
| Mastercard, Inc. - Class A |
202,434 | 86,340,126 | ||||||
| Visa, Inc. - Class A (a) |
373,618 | 97,271,446 | ||||||
|
|
|
|||||||
| 183,611,572 | ||||||||
|
|
|
|||||||
| Ground Transportation—5.0% | ||||||||
| Canadian National Railway Co. (a) |
619,380 | 77,851,960 | ||||||
| Union Pacific Corp. |
310,333 | 76,223,991 | ||||||
|
|
|
|||||||
| 154,075,951 | ||||||||
|
|
|
|||||||
| Health Care Equipment & Supplies—7.8% | ||||||||
| Abbott Laboratories |
692,928 | 76,270,585 | ||||||
| Medtronic PLC |
687,961 | 56,674,227 | ||||||
| Stryker Corp. |
359,802 | 107,746,307 | ||||||
|
|
|
|||||||
| 240,691,119 | ||||||||
|
|
|
|||||||
| Health Care Providers & Services—3.7% | ||||||||
| UnitedHealth Group, Inc. |
215,840 | 113,633,285 | ||||||
|
|
|
|||||||
| Hotels, Restaurants & Leisure—2.9% | ||||||||
| McDonald’s Corp. |
304,740 | 90,358,457 | ||||||
|
|
|
|||||||
| Security Description | Shares | Value | ||||||
| Household Products—5.5% | ||||||||
| Colgate-Palmolive Co. |
1,114,467 | $ | 88,834,165 | |||||
| Procter & Gamble Co. |
549,901 | 80,582,492 | ||||||
|
|
|
|||||||
| 169,416,657 | ||||||||
|
|
|
|||||||
| Industrial Conglomerates—3.2% | ||||||||
| Honeywell International, Inc. |
471,739 | 98,928,386 | ||||||
|
|
|
|||||||
| Insurance—4.8% | ||||||||
| Chubb Ltd. |
284,810 | 64,367,060 | ||||||
| Marsh & McLennan Cos., Inc. |
445,818 | 84,469,136 | ||||||
|
|
|
|||||||
| 148,836,196 | ||||||||
|
|
|
|||||||
| IT Services—3.1% | ||||||||
| Accenture PLC - Class A |
270,583 | 94,950,281 | ||||||
|
|
|
|||||||
| Life Sciences Tools & Services—3.1% | ||||||||
| Danaher Corp. |
420,528 | 97,284,947 | ||||||
|
|
|
|||||||
| Machinery—1.0% | ||||||||
| Deere & Co. (a) |
76,903 | 30,751,203 | ||||||
|
|
|
|||||||
| Pharmaceuticals—4.2% | ||||||||
| Johnson & Johnson |
449,178 | 70,404,160 | ||||||
| Merck & Co., Inc. |
388,639 | 42,369,424 | ||||||
| Pfizer, Inc. |
599,314 | 17,254,250 | ||||||
|
|
|
|||||||
| 130,027,834 | ||||||||
|
|
|
|||||||
| Professional Services—1.7% | ||||||||
| Automatic Data Processing, Inc. |
233,508 | 54,400,359 | ||||||
|
|
|
|||||||
| Semiconductors & Semiconductor Equipment—2.4% | ||||||||
| Texas Instruments, Inc. |
432,316 | 73,692,585 | ||||||
|
|
|
|||||||
| Software—5.4% | ||||||||
| Intuit, Inc. |
55,185 | 34,492,280 | ||||||
| Microsoft Corp. |
353,618 | 132,974,513 | ||||||
|
|
|
|||||||
| 167,466,793 | ||||||||
|
|
|
|||||||
| Specialized REITs—3.3% | ||||||||
| American Tower Corp. (a) |
258,626 | 55,832,181 | ||||||
| Public Storage |
148,610 | 45,326,050 | ||||||
|
|
|
|||||||
| 101,158,231 | ||||||||
|
|
|
|||||||
| Specialty Retail—4.8% | ||||||||
| Home Depot, Inc. |
171,041 | 59,274,259 | ||||||
| TJX Cos., Inc. |
963,278 | 90,365,109 | ||||||
|
|
|
|||||||
| 149,639,368 | ||||||||
|
|
|
|||||||
| Textiles, Apparel & Luxury Goods—2.8% | ||||||||
| NIKE, Inc. - Class B (a) |
796,635 | 86,490,662 | ||||||
|
|
|
|||||||
| Total Common Stocks |
3,062,416,672 | |||||||
|
|
|
|||||||
See accompanying notes to financial statements.
BHFTII-5
Brighthouse Funds Trust II
Brighthouse/Wellington Core Equity Opportunities Portfolio
Schedule of Investments as of December 31, 2023
Escrow Shares—0.0%
| Security Description | Shares/ Principal Amount* |
Value | ||||||
| Forest Products & Paper—0.0% | ||||||||
| Sino Forest Corp. (b) (c) (d) |
5,844,000 | $ | 0 | |||||
|
|
|
|||||||
| Short-Term Investments—1.2% |
| |||||||
| Repurchase Agreement—0.9% | ||||||||
| Fixed Income Clearing Corp. |
$ | 27,314,197 | 27,314,197 | |||||
|
|
|
|||||||
| U.S. Treasury—0.3% | ||||||||
| U.S. Treasury Bills |
455,000 | 453,467 | ||||||
| 5.310%, 02/29/24 (e) |
7,910,000 | 7,842,913 | ||||||
|
|
|
|||||||
| 8,296,380 | ||||||||
|
|
|
|||||||
| Total Short-Term Investments |
35,610,577 | |||||||
|
|
|
|||||||
| Securities Lending Reinvestments (f)—2.0% |
| |||||||
| Repurchase Agreement—0.0% | ||||||||
| Deutsche Bank Securities, Inc. |
1,108,120 | 1,108,120 | ||||||
|
|
|
|||||||
| Time Deposit—0.1% | ||||||||
| First Abu Dhabi Bank USA NV |
2,000,000 | 2,000,000 | ||||||
|
|
|
|||||||
| Mutual Funds—1.9% | ||||||||
| BlackRock Liquidity Funds FedFund, Institutional Shares |
12,175,675 | 12,175,675 | ||||||
| Fidelity Investments Money Market Government Portfolio, Class I |
12,000,000 | 12,000,000 | ||||||
| RBC U.S. Government Money Market Fund, Institutional Share |
12,000,000 | 12,000,000 | ||||||
| State Street Institutional U.S. Government Money Market Fund, Premier Class |
12,000,000 | 12,000,000 | ||||||
| STIT-Government & Agency Portfolio, Institutional Class |
11,824,325 | 11,824,325 | ||||||
|
|
|
|||||||
| 60,000,000 | ||||||||
|
|
|
|||||||
| Total Securities Lending Reinvestments |
63,108,120 | |||||||
|
|
|
|||||||
| Total Investments—102.0% |
3,161,135,369 | |||||||
| Other assets and liabilities (net)—(2.0)% |
(61,349,858 | ) | ||||||
|
|
|
|||||||
| Net Assets—100.0% |
$ | 3,099,785,511 | ||||||
|
|
|
|||||||
| * | Principal amount stated in U.S. dollars unless otherwise noted. | |
| (a) | All or a portion of the security was held on loan. As of December 31, 2023, the market value of securities loaned was $210,980,597 and the collateral received consisted of cash in the amount of $63,108,120 and non-cash collateral with a value of $152,817,116. The cash collateral investments are disclosed in the Schedule of Investments and categorized as Securities Lending Reinvestments. The non-cash collateral received consists of U.S. government securities that are held in safe-keeping by the lending agent, or a third-party custodian, and cannot be sold or repledged by the Portfolio. As such, this collateral is excluded from the Statement of Assets and Liabilities. | |
| (b) | Non-income producing security. | |
| (c) | Security was valued in good faith under procedures subject to oversight by the Board of Trustees. As of December 31, 2023, these securities represent less than 0.05% of net assets. | |
| (d) | Significant unobservable inputs were used in the valuation of this portfolio security; i.e. Level 3. | |
| (e) | The rate shown represents current yield to maturity. | |
| (f) | Represents investment of cash collateral received from securities on loan as of December 31, 2023. | |
| (g) | The rate shown represents the annualized seven-day yield as of December 31, 2023. |
Glossary of Abbreviations
Other Abbreviations
(REIT)— Real Estate Investment Trust
See accompanying notes to financial statements.
BHFTII-6
Brighthouse Funds Trust II
Brighthouse/Wellington Core Equity Opportunities Portfolio
Schedule of Investments as of December 31, 2023
Fair Value Hierarchy
Accounting principles generally accepted in the United States of America (“GAAP”) define fair market value as the price that the Portfolio would receive to sell an asset or pay to transfer a liability in an orderly transaction between market participants at the measurement date. It establishes a fair value hierarchy that prioritizes inputs to valuation methods and requires disclosure of the fair value hierarchy, separately for each major category of assets and liabilities, that segregates fair value measurements into three levels. Levels 1, 2 and 3 of the fair value hierarchy are defined as follows:
Level 1—unadjusted quoted prices in active markets for identical investments
Level 2—other significant observable inputs (including, but not limited to, quoted prices for similar assets or liabilities in markets that are either active or inactive; inputs other than quoted prices that are observable such as interest rates, yield curves, volatilities, prepayment speeds, loss severities, credit risks, default rates, or other market corroborated inputs)
Level 3—significant unobservable inputs based on the best information available in the circumstances, to the extent observable inputs are unavailable (including the Portfolio’s own assumptions used in determining the fair value of investments and derivative financial instruments)
The inputs or methodologies used for valuing investments are not necessarily an indication of the risk associated with investing in them. Changes to the inputs or methodologies used may result in transfers between levels. A reconciliation of Level 3 securities, if any, will be disclosed following the fair value hierarchy table. For more information about the Portfolio’s policy regarding the valuation of investments, please refer to the Notes to Financial Statements.
The following table summarizes the fair value hierarchy of the Portfolio’s investments as of December 31, 2023:
| Description | Level 1 | Level 2 | Level 3 | Total | ||||||||||||
| Common Stocks |
| |||||||||||||||
| Aerospace & Defense |
$ | 257,326,526 | $ | — | $ | — | $ | 257,326,526 | ||||||||
| Air Freight & Logistics |
56,479,217 | — | — | 56,479,217 | ||||||||||||
| Banks |
33,607,870 | — | — | 33,607,870 | ||||||||||||
| Beverages |
144,663,818 | 66,842,129 | — | 211,505,947 | ||||||||||||
| Chemicals |
160,492,352 | — | — | 160,492,352 | ||||||||||||
| Consumer Finance |
82,494,232 | — | — | 82,494,232 | ||||||||||||
| Consumer Staples Distribution & Retail |
75,096,642 | — | — | 75,096,642 | ||||||||||||
| Financial Services |
183,611,572 | — | — | 183,611,572 | ||||||||||||
| Ground Transportation |
154,075,951 | — | — | 154,075,951 | ||||||||||||
| Health Care Equipment & Supplies |
240,691,119 | — | — | 240,691,119 | ||||||||||||
| Health Care Providers & Services |
113,633,285 | — | — | 113,633,285 | ||||||||||||
| Hotels, Restaurants & Leisure |
90,358,457 | — | — | 90,358,457 | ||||||||||||
| Household Products |
169,416,657 | — | — | 169,416,657 | ||||||||||||
| Industrial Conglomerates |
98,928,386 | — | — | 98,928,386 | ||||||||||||
| Insurance |
148,836,196 | — | — | 148,836,196 | ||||||||||||
| IT Services |
94,950,281 | — | — | 94,950,281 | ||||||||||||
| Life Sciences Tools & Services |
97,284,947 | — | — | 97,284,947 | ||||||||||||
| Machinery |
30,751,203 | — | — | 30,751,203 | ||||||||||||
| Pharmaceuticals |
130,027,834 | — | — | 130,027,834 | ||||||||||||
| Professional Services |
54,400,359 | — | — | 54,400,359 | ||||||||||||
| Semiconductors & Semiconductor Equipment |
73,692,585 | — | — | 73,692,585 | ||||||||||||
| Software |
167,466,793 | — | — | 167,466,793 | ||||||||||||
| Specialized REITs |
101,158,231 | — | — | 101,158,231 | ||||||||||||
| Specialty Retail |
149,639,368 | — | — | 149,639,368 | ||||||||||||
| Textiles, Apparel & Luxury Goods |
86,490,662 | — | — | 86,490,662 | ||||||||||||
| Total Common Stocks |
2,995,574,543 | 66,842,129 | — | 3,062,416,672 | ||||||||||||
| Total Escrow Shares* |
— | — | 0 | 0 | ||||||||||||
| Total Short-Term Investments* |
— | 35,610,577 | — | 35,610,577 | ||||||||||||
| Securities Lending Reinvestments |
| |||||||||||||||
| Repurchase Agreement |
— | 1,108,120 | — | 1,108,120 | ||||||||||||
| Time Deposit |
— | 2,000,000 | — | 2,000,000 | ||||||||||||
| Mutual Funds |
60,000,000 | — | — | 60,000,000 | ||||||||||||
| Total Securities Lending Reinvestments |
60,000,000 | 3,108,120 | — | 63,108,120 | ||||||||||||
| Total Investments |
$ | 3,055,574,543 | $ | 105,560,826 | $ | 0 | $ | 3,161,135,369 | ||||||||
| Collateral for Securities Loaned (Liability)
|
$ | — | $ | (63,108,120 | ) | $ | — | $ | (63,108,120 | ) | ||||||
| * | See Schedule of Investments for additional detailed categorizations. |
Level 3 investments at the beginning and/or end of the period in relation to net assets were not significant and accordingly, a reconciliation of Level 3 assets for the year ended December 31, 2023 is not presented.
See accompanying notes to financial statements.
BHFTII-7
Brighthouse Funds Trust II
Brighthouse/Wellington Core Equity Opportunities Portfolio
Statement of Assets and Liabilities
December 31, 2023
| Assets |
||||
| Investments at value (a)(b) |
$ | 3,161,135,369 | ||
| Receivable for: |
||||
| Fund shares sold |
136,491 | |||
| Dividends and interest |
5,079,634 | |||
| Prepaid expenses |
11,206 | |||
|
|
|
|||
| Total Assets |
3,166,362,700 | |||
|
|
|
|||
| Liabilities |
||||
| Due to custodian denominated in foreign currencies (c) |
3 | |||
| Collateral for securities loaned |
63,108,120 | |||
| Payables for: |
||||
| Fund shares redeemed |
1,357,057 | |||
| Accrued Expenses: |
||||
| Management fees |
1,463,352 | |||
| Distribution and service fees |
194,716 | |||
| Deferred trustees’ fees |
238,055 | |||
| Other expenses |
215,886 | |||
|
|
|
|||
| Total Liabilities |
66,577,189 | |||
|
|
|
|||
| Net Assets |
$ | 3,099,785,511 | ||
|
|
|
|||
| Net Assets Consist of: |
||||
| Paid in surplus |
$ | 2,060,430,479 | ||
| Distributable earnings (Accumulated losses) |
1,039,355,032 | |||
|
|
|
|||
| Net Assets |
$ | 3,099,785,511 | ||
|
|
|
|||
| Net Assets |
||||
| Class A |
$ | 1,938,473,932 | ||
| Class B |
577,471,223 | |||
| Class E |
583,840,356 | |||
| Capital Shares Outstanding* |
||||
| Class A |
67,977,896 | |||
| Class B |
20,751,869 | |||
| Class E |
20,847,343 | |||
| Net Asset Value, Offering Price and Redemption Price Per Share |
||||
| Class A |
$ | 28.52 | ||
| Class B |
27.83 | |||
| Class E |
28.01 |
| * | The Portfolio is authorized to issue an unlimited number of shares. | |||
| (a) | Identified cost of investments was $2,269,824,348. | |||
| (b) | Includes securities loaned at value of $210,980,597. | |||
| (c) | Identified cost of cash due to bank denominated in foreign currencies was $3. | |||
Statement of Operations
Year Ended December 31, 2023
| Investment Income |
| |||
| Dividends (a) |
$ | 60,802,200 | ||
| Interest |
2,072,005 | |||
| Securities lending income |
147,530 | |||
|
|
|
|||
| Total investment income |
63,021,735 | |||
|
|
|
|||
| Expenses |
| |||
| Management fees |
21,899,704 | |||
| Administration fees |
127,736 | |||
| Custodian and accounting fees |
153,518 | |||
| Distribution and service fees—Class B |
1,434,562 | |||
| Distribution and service fees—Class E |
869,563 | |||
| Audit and tax services |
49,026 | |||
| Legal |
46,604 | |||
| Trustees’ fees and expenses |
46,220 | |||
| Shareholder reporting |
122,905 | |||
| Insurance |
28,676 | |||
| Miscellaneous |
33,852 | |||
|
|
|
|||
| Total expenses |
24,812,366 | |||
| Less management fee waiver |
(4,647,248 | ) | ||
| Less broker commission recapture |
(2,182 | ) | ||
|
|
|
|||
| Net expenses |
20,162,936 | |||
|
|
|
|||
| Net Investment Income |
42,858,799 | |||
|
|
|
|||
| Net Realized and Unrealized Gain (Loss) |
| |||
| Net realized gain (loss) on: |
| |||
| Investments |
107,841,708 | |||
| Foreign currency transactions |
3,776 | |||
|
|
|
|||
| Net realized gain (loss) |
107,845,484 | |||
|
|
|
|||
| Net change in unrealized appreciation (depreciation) on: |
| |||
| Investments |
69,766,777 | |||
| Foreign currency transactions |
1,178 | |||
|
|
|
|||
| Net change in unrealized appreciation (depreciation) |
69,767,955 | |||
|
|
|
|||
| Net realized and unrealized gain (loss) |
177,613,439 | |||
|
|
|
|||
| Net Increase (Decrease) in Net Assets From Operations |
$ | 220,472,238 | ||
|
|
|
|||
| (a) | Net of foreign withholding taxes of $191,312. | |||
See accompanying notes to financial statements.
BHFTII-8
Brighthouse Funds Trust II
Brighthouse/Wellington Core Equity Opportunities Portfolio
Statements of Changes in Net Assets
| Year Ended December 31, 2023 |
Year Ended December 31, 2022 |
|||||||||||
| Increase (Decrease) in Net Assets: |
||||||||||||
| From Operations |
||||||||||||
| Net investment income (loss) |
$ | 42,858,799 | $ | 44,010,405 | ||||||||
| Net realized gain (loss) |
107,845,484 | 326,195,573 | ||||||||||
| Net change in unrealized appreciation (depreciation) |
69,767,955 | (582,155,279 | ) | |||||||||
|
|
|
|
|
|||||||||
| Increase (decrease) in net assets from operations |
220,472,238 | (211,949,301 | ) | |||||||||
|
|
|
|
|
|||||||||
| From Distributions to Shareholders |
| |||||||||||
| Class A |
(230,770,352 | ) | (412,092,119 | ) | ||||||||
| Class B |
(69,543,920 | ) | (121,585,608 | ) | ||||||||
| Class E |
(70,035,182 | ) | (126,579,004 | ) | ||||||||
|
|
|
|
|
|||||||||
| Total distributions |
(370,349,454 | ) | (660,256,731 | ) | ||||||||
|
|
|
|
|
|||||||||
| Increase (decrease) in net assets from capital share transactions |
89,219,065 | 48,739,274 | ||||||||||
|
|
|
|
|
|||||||||
| Total increase (decrease) in net assets |
(60,658,151 | ) | (823,466,758 | ) | ||||||||
| Net Assets |
| |||||||||||
| Beginning of period |
3,160,443,662 | 3,983,910,420 | ||||||||||
|
|
|
|
|
|||||||||
| End of period |
$ | 3,099,785,511 | $ | 3,160,443,662 | ||||||||
|
|
|
|
|
|||||||||
Other Information:
Capital Shares
Transactions in capital shares were as follows:
| Year Ended December 31, 2023 |
Year Ended December 31, 2022 |
|||||||||||||||
| Shares | Value | Shares | Value | |||||||||||||
| Class A |
| |||||||||||||||
| Sales |
1,016,680 | $ | 29,426,364 | 854,954 | $ | 27,994,700 | ||||||||||
| Reinvestments |
8,617,265 | 230,770,352 | 14,850,166 | 412,092,119 | ||||||||||||
| Redemptions |
(6,836,882 | ) | (191,438,320 | ) | (12,870,892 | ) | (427,755,158 | ) | ||||||||
|
|
|
|
|
|
|
|
|
|||||||||
| Net increase (decrease) |
2,797,063 | $ | 68,758,396 | 2,834,228 | $ | 12,331,661 | ||||||||||
|
|
|
|
|
|
|
|
|
|||||||||
| Class B |
| |||||||||||||||
| Sales |
894,002 | $ | 25,148,132 | 1,081,109 | $ | 34,540,702 | ||||||||||
| Reinvestments |
2,657,391 | 69,543,920 | 4,471,703 | 121,585,608 | ||||||||||||
| Redemptions |
(2,925,607 | ) | (80,340,878 | ) | (3,922,671 | ) | (128,404,388 | ) | ||||||||
|
|
|
|
|
|
|
|
|
|||||||||
| Net increase (decrease) |
625,786 | $ | 14,351,174 | 1,630,141 | $ | 27,721,922 | ||||||||||
|
|
|
|
|
|
|
|
|
|||||||||
| Class E |
| |||||||||||||||
| Sales |
348,068 | $ | 9,820,607 | 307,168 | $ | 9,997,053 | ||||||||||
| Reinvestments |
2,660,911 | 70,035,182 | 4,631,504 | 126,579,004 | ||||||||||||
| Redemptions |
(2,650,464 | ) | (73,746,294 | ) | (3,866,190 | ) | (127,890,366 | ) | ||||||||
|
|
|
|
|
|
|
|
|
|||||||||
| Net increase (decrease) |
358,515 | $ | 6,109,495 | 1,072,482 | $ | 8,685,691 | ||||||||||
|
|
|
|
|
|
|
|
|
|||||||||
| Increase (decrease) derived from capital shares transactions |
$ | 89,219,065 | $ | 48,739,274 | ||||||||||||
|
|
|
|
|
|||||||||||||
See accompanying notes to financial statements.
BHFTII-9
Brighthouse Funds Trust II
Brighthouse/Wellington Core Equity Opportunities Portfolio
Financial Highlights
| Selected per share data | ||||||||||||||||||||
| Class A | ||||||||||||||||||||
| Year Ended December 31, | ||||||||||||||||||||
| 2023 | 2022 | 2021 | 2020 | 2019 | ||||||||||||||||
| Net Asset Value, Beginning of Period |
$ | 30.09 | $ | 39.97 | $ | 34.36 | $ | 35.51 | $ | 30.01 | ||||||||||
|
|
|
|
|
|
|
|
|
|
|
|||||||||||
| Income (Loss) from Investment Operations |
||||||||||||||||||||
| Net investment income (loss) (a) |
0.42 | 0.45 | 0.47 | 0.49 | 0.52 | |||||||||||||||
| Net realized and unrealized gain (loss) |
1.64 | (3.09 | ) | 7.60 | 2.66 | 8.43 | ||||||||||||||
|
|
|
|
|
|
|
|
|
|
|
|||||||||||
| Total income (loss) from investment operations |
2.06 | (2.64 | ) | 8.07 | 3.15 | 8.95 | ||||||||||||||
|
|
|
|
|
|
|
|
|
|
|
|||||||||||
| Less Distributions |
||||||||||||||||||||
| Distributions from net investment income |
(0.43 | ) | (0.54 | ) | (0.53 | ) | (0.56 | ) | (0.57 | ) | ||||||||||
| Distributions from net realized capital gains |
(3.20 | ) | (6.70 | ) | (1.93 | ) | (3.74 | ) | (2.88 | ) | ||||||||||
|
|
|
|
|
|
|
|
|
|
|
|||||||||||
| Total distributions |
(3.63 | ) | (7.24 | ) | (2.46 | ) | (4.30 | ) | (3.45 | ) | ||||||||||
|
|
|
|
|
|
|
|
|
|
|
|||||||||||
| Net Asset Value, End of Period |
$ | 28.52 | $ | 30.09 | $ | 39.97 | $ | 34.36 | $ | 35.51 | ||||||||||
|
|
|
|
|
|
|
|
|
|
|
|||||||||||
| Total Return (%) (b) |
7.66 | (5.08 | ) | 24.43 | 11.27 | 30.94 | ||||||||||||||
| Ratios/Supplemental Data |
||||||||||||||||||||
| Gross ratio of expenses to average net assets (%) |
0.73 | 0.73 | 0.72 | 0.73 | 0.72 | |||||||||||||||
| Net ratio of expenses to average net assets (%) (c) (d) |
0.58 | 0.58 | 0.57 | 0.58 | 0.58 | |||||||||||||||
| Ratio of net investment income (loss) to average net assets (%) |
1.47 | 1.37 | 1.27 | 1.53 | 1.54 | |||||||||||||||
| Portfolio turnover rate (%) |
9 | 10 | 15 | 15 | 16 | |||||||||||||||
| Net assets, end of period (in millions) |
$ | 1,938.5 | $ | 1,961.3 | $ | 2,492.0 | $ | 2,492.1 | $ | 2,457.8 | ||||||||||
| Class B | ||||||||||||||||||||
| Year Ended December 31, | ||||||||||||||||||||
| 2023 | 2022 | 2021 | 2020 | 2019 | ||||||||||||||||
| Net Asset Value, Beginning of Period |
$ | 29.44 | $ | 39.25 | $ | 33.79 | $ | 34.99 | $ | 29.60 | ||||||||||
|
|
|
|
|
|
|
|
|
|
|
|||||||||||
| Income (Loss) from Investment Operations |
||||||||||||||||||||
| Net investment income (loss) (a) |
0.34 | 0.36 | 0.37 | 0.41 | 0.43 | |||||||||||||||
| Net realized and unrealized gain (loss) |
1.60 | (3.03 | ) | 7.47 | 2.60 | 8.32 | ||||||||||||||
|
|
|
|
|
|
|
|
|
|
|
|||||||||||
| Total income (loss) from investment operations |
1.94 | (2.67 | ) | 7.84 | 3.01 | 8.75 | ||||||||||||||
|
|
|
|
|
|
|
|
|
|
|
|||||||||||
| Less Distributions |
||||||||||||||||||||
| Distributions from net investment income |
(0.35 | ) | (0.44 | ) | (0.45 | ) | (0.47 | ) | (0.48 | ) | ||||||||||
| Distributions from net realized capital gains |
(3.20 | ) | (6.70 | ) | (1.93 | ) | (3.74 | ) | (2.88 | ) | ||||||||||
|
|
|
|
|
|
|
|
|
|
|
|||||||||||
| Total distributions |
(3.55 | ) | (7.14 | ) | (2.38 | ) | (4.21 | ) | (3.36 | ) | ||||||||||
|
|
|
|
|
|
|
|
|
|
|
|||||||||||
| Net Asset Value, End of Period |
$ | 27.83 | $ | 29.44 | $ | 39.25 | $ | 33.79 | $ | 34.99 | ||||||||||
|
|
|
|
|
|
|
|
|
|
|
|||||||||||
| Total Return (%) (b) |
7.38 | (5.31 | ) | 24.11 | 10.97 | 30.64 | ||||||||||||||
| Ratios/Supplemental Data |
||||||||||||||||||||
| Gross ratio of expenses to average net assets (%) |
0.98 | 0.98 | 0.97 | 0.98 | 0.97 | |||||||||||||||
| Net ratio of expenses to average net assets (%) (c) (d) |
0.83 | 0.83 | 0.82 | 0.83 | 0.83 | |||||||||||||||
| Ratio of net investment income (loss) to average net assets (%) |
1.22 | 1.12 | 1.02 | 1.28 | 1.29 | |||||||||||||||
| Portfolio turnover rate (%) |
9 | 10 | 15 | 15 | 16 | |||||||||||||||
| Net assets, end of period (in millions) |
$ | 577.5 | $ | 592.5 | $ | 726.0 | $ | 679.8 | $ | 681.3 | ||||||||||
Please see following page for Financial Highlights footnote legend.
See accompanying notes to financial statements.
BHFTII-10
Brighthouse Funds Trust II
Brighthouse/Wellington Core Equity Opportunities Portfolio
Financial Highlights
| Class E | ||||||||||||||||||||
| Year Ended December 31, | ||||||||||||||||||||
| 2023 | 2022 | 2021 | 2020 | 2019 | ||||||||||||||||
| Net Asset Value, Beginning of Period |
$ | 29.61 | $ | 39.44 | $ | 33.94 | $ | 35.13 | $ | 29.71 | ||||||||||
|
|
|
|
|
|
|
|
|
|
|
|||||||||||
| Income (Loss) from Investment Operations |
||||||||||||||||||||
| Net investment income (loss) (a) |
0.37 | 0.40 | 0.41 | 0.44 | 0.46 | |||||||||||||||
| Net realized and unrealized gain (loss) |
1.61 | (3.05 | ) | 7.50 | 2.62 | 8.36 | ||||||||||||||
|
|
|
|
|
|
|
|
|
|
|
|||||||||||
| Total income (loss) from investment operations |
1.98 | (2.65 | ) | 7.91 | 3.06 | 8.82 | ||||||||||||||
|
|
|
|
|
|
|
|
|
|
|
|||||||||||
| Less Distributions |
||||||||||||||||||||
| Distributions from net investment income |
(0.38 | ) | (0.48 | ) | (0.48 | ) | (0.51 | ) | (0.52 | ) | ||||||||||
| Distributions from net realized capital gains |
(3.20 | ) | (6.70 | ) | (1.93 | ) | (3.74 | ) | (2.88 | ) | ||||||||||
|
|
|
|
|
|
|
|
|
|
|
|||||||||||
| Total distributions |
(3.58 | ) | (7.18 | ) | (2.41 | ) | (4.25 | ) | (3.40 | ) | ||||||||||
|
|
|
|
|
|
|
|
|
|
|
|||||||||||
| Net Asset Value, End of Period |
$ | 28.01 | $ | 29.61 | $ | 39.44 | $ | 33.94 | $ | 35.13 | ||||||||||
|
|
|
|
|
|
|
|
|
|
|
|||||||||||
| Total Return (%) (b) |
7.49 | (5.21 | ) | 24.23 | 11.08 | 30.77 | ||||||||||||||
| Ratios/Supplemental Data |
||||||||||||||||||||
| Gross ratio of expenses to average net assets (%) |
0.88 | 0.88 | 0.87 | 0.88 | 0.87 | |||||||||||||||
| Net ratio of expenses to average net assets (%) (c) (d) |
0.73 | 0.73 | 0.72 | 0.73 | 0.73 | |||||||||||||||
| Ratio of net investment income (loss) to average net assets (%) |
1.32 | 1.22 | 1.12 | 1.38 | 1.39 | |||||||||||||||
| Portfolio turnover rate (%) |
9 | 10 | 15 | 15 | 16 | |||||||||||||||
| Net assets, end of period (in millions) |
$ | 583.8 | $ | 606.6 | $ | 765.8 | $ | 712.8 | $ | 717.9 | ||||||||||
| (a) | Per share amounts based on average shares outstanding during the period. | |||||||||
| (b) | Total return does not reflect any insurance, sales, separate account or administrative charges of variable annuity or life insurance contracts or any additional expenses that contract owners may bear under their variable contracts. If these charges were included, the returns would be lower. | |||||||||
| (c) | The effect of the voluntary portion of the waivers on the net ratio of expenses to average net assets was 0.03% for each of the years ended December 31, 2023 through 2019. (see Note 5 of the Notes to Financial Statements). | |||||||||
| (d) | Includes the effects of management fee waivers (see Note 5 of the Notes to Financial Statements). | |||||||||
See accompanying notes to financial statements.
BHFTII-11
Brighthouse Funds Trust II
Brighthouse/Wellington Core Equity Opportunities Portfolio
Notes to Financial Statements—December 31, 2023
1. Organization
Brighthouse Funds Trust II (the “Trust”) is organized as a Delaware statutory trust and registered under the Investment Company Act of 1940, as amended (the “1940 Act”), as an open-end management investment company. The Trust, which is managed by Brighthouse Investment Advisers, LLC (“Brighthouse Investment Advisers” or the “Adviser”), currently offers twenty-nine series (the “Portfolios”), each of which operates as a distinct investment vehicle of the Trust. The series included in this report is Brighthouse/Wellington Core Equity Opportunities Portfolio (the “Portfolio”), which is diversified. Shares of the Portfolio are not offered directly to the general public and are currently available only to separate accounts of insurance companies, including insurance companies affiliated with the Adviser.
The Portfolio has registered and offers three classes of shares: Class A, B and E shares. Shares of each class of the Portfolio represent an equal pro rata interest in the Portfolio and generally give the shareholder the same voting, dividend, liquidation, and other rights. Investment income, realized and unrealized capital gains and losses, the common expenses of the Portfolio, and certain Portfolio-level expense reductions, if any, are allocated on a pro rata basis to each class based on the relative net assets of each class to the net assets of the Portfolio. Each class of shares differs in its respective distribution plan and such distribution expenses are allocated to the corresponding class of shares.
2. Significant Accounting Policies
The preparation of financial statements in conformity with accounting principles generally accepted in the United States of America (“GAAP”) requires management to make estimates and assumptions that affect the reported amounts of assets and liabilities and disclosure of contingent assets and liabilities as of the date of the financial statements and the reported amounts of income and expenses during the reporting period. Actual results could differ from those estimates. In the preparation of these financial statements, management has evaluated events and transactions subsequent to December 31, 2023 through the date the financial statements were issued.
The Portfolio is an investment company and follows the accounting and reporting guidance of the Financial Accounting Standards Board (“FASB”) Accounting Standards Codification Topic 946- Financial Services- Investment Companies. The following is a summary of significant accounting policies consistently followed by the Portfolio in the preparation of its financial statements.
Investment Valuation and Fair Value Measurements - The Portfolio values its investments for purposes of calculating its net asset value (“NAV”) using procedures that allow for a variety of methodologies to be used to value the Portfolio’s investments. The specific methodology used for an investment may vary based on the market data available for a specific investment at the time the Portfolio calculates its NAV or based on other considerations. The procedures also permit a level of judgment to be used in the valuation process.
Domestic and foreign equity securities, such as common stock, exchange-traded funds, rights, warrants, and preferred stock, that are traded on a securities exchange on a valuation date are generally valued at their last quoted sale price or official closing price on the primary exchange for such security, or, if no sales occurred on that day, at the last reported bid price. Equity securities traded over-the-counter (“OTC”) are generally valued at the last reported bid price. In the event of a major exchange closing during the trading day, the Adviser may use other market information obtained from quotation reporting systems, established market makers, or pricing services in valuing the securities. Valuation adjustments may be applied to certain foreign equity securities that are traded solely on foreign exchanges that close before the time as of which the Portfolio determines its NAV to account for the market movement between the close of the foreign exchanges and the time as of which the Portfolio determines its NAV. The Portfolio may use a systematic fair valuation model provided by a pricing service to value securities principally traded in these foreign markets to adjust for possible market movements or other changes that may occur between the close of the foreign exchanges and the time as of which the Portfolio determines its NAV. Foreign equity securities valued using these valuation adjustments are generally categorized as Level 2 within the fair value hierarchy. Equity securities that are actively traded, and have no valuation adjustments applied, are categorized as Level 1 within the fair value hierarchy. Other equity securities traded on inactive markets or valued in reference to similar instruments traded on active markets are generally categorized as Level 2 within the fair value hierarchy.
Investments in registered open-end management investment companies are valued at reported NAV per share on the valuation date and are categorized as Level 1 within the fair value hierarchy.
Debt securities, including corporate, convertible and municipal bonds and notes; obligations of the U.S. Treasury and U.S. government agencies; foreign sovereign issues; and non-U.S. bonds, are generally valued based upon evaluated or composite bid quotations obtained from third-party pricing services and/or brokers and dealers selected by the Adviser (each a “pricing service”). Such pricing services may use matrix pricing, which considers observable inputs including, among other things, issuer details, maturity dates, interest rates, yield curves, rates of prepayment, credit risks/spreads, default rates, reported trades, broker-dealer quotes and quoted prices for similar assets. Short-term obligations with a remaining maturity of sixty days or less may be valued at amortized cost in the
BHFTII-12
Brighthouse Funds Trust II
Brighthouse/Wellington Core Equity Opportunities Portfolio
Notes to Financial Statements—December 31, 2023—(Continued)
absence of market quotes, so long as the amortized cost value of such short-term debt instrument is approximately the same as the fair value of the instrument as determined without the use of amortized cost valuation. Floating rate loans are generally valued based upon an evaluated or composite average of aggregate bid and ask quotations supplied by brokers or dealers, as obtained from the pricing service. Securities that use similar valuation techniques and inputs as described above are generally categorized as Level 2 within the fair value hierarchy.
Options, whether on securities, indices, futures contracts, or otherwise, traded on exchanges are valued at the last sale price available as of the close of business on a valuation day or, if there is no such price available, at the last reported bid price. These types of options are categorized as Level 1 within the fair value hierarchy. Futures contracts that are traded on commodity exchanges are valued at their settlement prices established by the exchanges on which they are traded as of the close of such exchanges and are categorized as Level 1 within the fair value hierarchy.
If no current market quotation is readily available or market value quotations are deemed to be unreliable for an investment, the fair value of the investment will be determined in accordance with procedures. A market quotation is readily available only when that quotation is a quoted price (unadjusted) in active markets for identical investments that the Portfolio can access at the measurement date, provided that a quotation will not be readily available if it is not reliable.
Pursuant to Rule 2a-5 under the 1940 Act, the Board of Trustees (the “Board” or “Trustees”) of the Trust has designated Brighthouse Investment Advisers, acting through its Valuation Committee (“Committee”), as the Portfolio’s “valuation designee” to perform the Portfolio’s fair value determinations. The Board oversees Brighthouse Investment Advisers in its role as the Valuation Designee and receives reports from Brighthouse Investment Advisers regarding its process and the valuation of the Portfolio’s investments to assist with such oversight.
No single standard for determining the fair value of an investment can be set forth because fair value depends upon the facts and circumstances with respect to each investment. Information relating to any relevant factors may be obtained by the Committee from any appropriate source, including the subadviser of the Portfolio, the Custodian, a pricing service, market maker and/or broker for such security or the issuer. Appropriate methodologies for determining fair value under particular circumstances may include: matrix pricing, a discounted cash flow analysis, comparisons of securities with comparable characteristics, value based on multiples of earnings, discount from market price of similar marketable securities, or a combination of these and other methods.
Foreign Currency Translation — The books and records of the Portfolio are maintained in U.S. dollars. The values of securities, currencies, and other assets and liabilities denominated in currencies other than the U.S. dollar are translated into U.S. dollars based upon foreign exchange rates prevailing at the end of the period. Purchases and sales of investment securities, income, and expenses are translated on the respective dates of such transactions. Because the values of investment securities are translated at the foreign exchange rates prevailing at the end of the period, that portion of the results of operations arising from changes in exchange rates and that portion of the results of operations reflecting fluctuations arising from changes in market prices of the investment securities are not separated. Such fluctuations are included in the net realized and unrealized gain or loss on investments.
Net realized foreign exchange gains or losses arise from activity in forward foreign currency exchange contracts, sales of foreign currency, currency gains or losses realized between the trade and settlement dates on securities transactions, and the difference between the amounts of dividends, interest, and foreign withholding taxes recorded by the Portfolio and the U.S. dollar-equivalent of the amounts actually received or paid by the Portfolio. Net unrealized foreign exchange gains and losses arise from changes in the value of assets and liabilities, other than investment securities, resulting from changes in foreign exchange rates.
Investment Transactions and Related Investment Income — Portfolio security transactions are recorded on the trade date. Dividend income is recorded on the ex-dividend date or, for certain foreign securities, when notified. Interest income, which includes amortization of premium and accretion of discount on debt securities, is recorded on the accrual basis. Realized gains and losses on investments are determined on the identified cost basis, which is the same basis used for federal income tax purposes. Foreign income and foreign capital gains on some foreign securities may be subject to foreign taxes, which are accrued as applicable. These foreign taxes have been provided for in accordance with the Portfolio’s understanding of the applicable countries’ tax rules and rates.
Dividends and Distributions to Shareholders — The Portfolio records dividends and distributions on the ex-dividend date. Net realized gains from securities transactions (if any) are generally distributed annually to shareholders. The timing and characterization of certain income and capital gains distributions are determined in accordance with federal tax regulations that may differ from GAAP. Permanent book and tax basis differences relating to shareholder distributions will result in reclassification between distributable earnings (accumulated losses) and paid in surplus. These adjustments have no impact on net assets or the results of operations.
Due to Custodian — Pursuant to the custodian agreement, the Custodian may, in its discretion, advance funds to the Portfolio to make properly authorized payments. When such payments result in an overdraft, the Portfolio is obligated to repay the Custodian at the current rate of interest charged by the Custodian for secured loans. This obligation is payable on demand to the Custodian. The Custodian has a lien on the Portfolio’s assets to the extent of any overdraft. At December 31, 2023, the Portfolio had a payment of $3 due to the Custodian pursuant to the foregoing arrangement. Based on the short-term nature of these payments and the variable
BHFTII-13
Brighthouse Funds Trust II
Brighthouse/Wellington Core Equity Opportunities Portfolio
Notes to Financial Statements—December 31, 2023—(Continued)
interest rate, the carrying value of the overdraft advances approximated its fair value and such inputs would be considered Level 2 in the fair value hierarchy at December 31, 2023. The Portfolio’s average overdraft advances during the year ended December 31, 2023 were not significant.
Income Taxes - It is the Portfolio’s policy to comply with the requirements of the Internal Revenue Code of 1986, as amended, and regulations thereunder applicable to regulated investment companies, and to distribute, with respect to each taxable year, all of its taxable income to shareholders. Therefore, no federal income tax provision is required. The Portfolio files U.S. federal tax returns. No income tax returns are currently under examination. The Portfolio’s federal tax returns remain subject to examination by the Internal Revenue Service for three fiscal years after the returns are filed. As of December 31, 2023, the Portfolio had no uncertain tax positions that would require financial statement recognition, derecognition or disclosure.
Repurchase Agreements - The Portfolio may enter into repurchase agreements, under the terms of a Master Repurchase Agreement (“MRA”), or Global Master Repurchase Agreement (“GMRA”), with selected commercial banks and broker-dealers, under which the Portfolio acquires securities as collateral and agrees to resell the securities at an agreed-upon time and at an agreed-upon price. The Portfolio, through the Custodian or a subcustodian, under a tri-party repurchase agreement, receives delivery of the underlying securities collateralizing any repurchase agreements. It is the Portfolio’s policy that the market value of the collateral be equal to at least 100% of the repurchase price in the case of a repurchase agreement of one-day duration and equal to at least 102% of the repurchase price in the case of all other repurchase agreements. In the event of default or failure by a party to perform an obligation in connection with any repurchase transaction, the MRA or GMRA gives the non-defaulting party the right to set-off claims and to apply property held by it in connection with any repurchase transaction against obligations owed to it under the agreement.
At December 31, 2023, the Portfolio had direct investments in repurchase agreements with a gross value of $27,314,197. Additionally, the Portfolio invested cash collateral for loans of portfolio securities in repurchase agreements with a gross value of $1,108,120. The combined value of all repurchase agreements is included as part of investments at value on the Statement of Assets and Liabilities. The value of the related collateral exceeded the value of the repurchase agreements at December 31, 2023.
Securities Lending - The Portfolio may lend its portfolio securities to certain qualified brokers who borrow securities in order to complete certain securities transactions. By lending its portfolio securities, the Portfolio attempts to increase its net investment income through the receipt of income on collateral held from securities on loan. Any gain or loss in the market price of the loaned securities that might occur, any interest earned, and any dividends declared during the term of the loan, would accrue to the account of the Portfolio.
The Trust has entered into a Non-Custodial Securities Lending Agreement with JPMorgan Chase Bank, N.A. (the “Lending Agent”). Under the agreement, the Lending Agent is authorized to loan portfolio securities on the Portfolio’s behalf. In exchange, the Portfolio generally receives cash, U.S. Government securities, letters of credit, or other collateral deemed appropriate by the Adviser. The Portfolio receives collateral equal to at least 102% of the market value for loans secured by government securities or cash in the same currency as the loaned shares and 105% for all other loaned securities at each loan’s inception. Collateral representing at least 100% of the market value of the loaned securities is maintained for the duration of the loan. Any cash collateral received by the Portfolio is generally invested by the Lending Agent in short-term investments, which may include certificates of deposit, commercial paper, repurchase agreements, including repurchase agreements with respect to equity securities, time deposits, master demand notes and money market funds. The market value of investments made with cash collateral received are disclosed in the Schedule of Investments and the valuation techniques are described in Note 2. The value of the securities on loan may change each business day. If the market value of the collateral at the close of trading on a business day is less than 100% of the market value of the loaned securities at the close of trading on that day, the borrower is required to deliver, by the close of business on the following business day, an additional amount of collateral, so that the total amount of posted collateral is equal to at least 100% of the market value of all the loaned securities as of such preceding day. A portion of the income earned on the collateral is rebated to the borrower of the securities and the remainder is split between the Lending Agent and the Portfolio. On loans collateralized by U.S. government securities, a fee is received from the borrower and is allocated between the Portfolio and the Lending Agent.
Income received by the Portfolio in securities lending transactions during the year ended December 31, 2023 is reflected as securities lending income on the Statement of Operations.
The risks associated with lending portfolio securities include, but are not limited to, possible delays in receiving additional collateral or in the recovery of the loaned securities, possible loss of rights in the collateral should the borrower fail financially, as well as risk of loss in the value of the collateral or the value of the investments made with the collateral. To the extent the Portfolio uses cash collateral it receives to invest in repurchase agreements with respect to equity securities, it is subject to the risk of loss if the value of the equity securities declines and the counterparty defaults on its obligation to repurchase such securities. The Lending Agent shall indemnify the Portfolio in the case of default of any securities borrower, subject to the terms of the Non-Custodial Securities Lending Agreement.
All securities on loan are classified as Common Stocks in the Portfolio’s Schedule of Investments as of December 31, 2023. For all securities on loan, the remaining contractual maturity of the agreements is overnight and continuous.
BHFTII-14
Brighthouse Funds Trust II
Brighthouse/Wellington Core Equity Opportunities Portfolio
Notes to Financial Statements—December 31, 2023—(Continued)
Directed Brokerage Agreement - The Trust has entered into a directed brokerage arrangement with Capital Institutional Services, Inc. (“CAPIS”). Under this arrangement, the Portfolio directs certain trades to CAPIS in return for a recapture credit. CAPIS issues a cash rebate to the Portfolio. Amounts paid to the Portfolio are shown separately as broker commission recapture on the Statement of Operations of the Portfolio. Additionally, these amounts have been excluded from the calculation of the net ratio of expenses to average net assets presented in the Financial Highlights for each share class.
3. Certain Risks
In the normal course of business, the Portfolio invests in securities and enters into transactions where risks exist. Those risks include:
Market Risk: The value of securities held by the Portfolio may decline in response to certain events, including those directly involving the issuers whose securities are owned by the Portfolio; conditions affecting the general economy; overall market changes; local, regional or global political, social or economic instability; currency, interest rate, and price fluctuations, or other factors including terrorism, war, natural disasters and the spread of infectious illness including epidemics or pandemics such as the COVID-19 pandemic. These events may also adversely affect the liquidity of securities held by the Portfolio.
Credit and Counterparty Risk: The Portfolio may be exposed to counterparty risk, or the risk that an entity with which the Portfolio has unsettled or open transactions may default. The potential loss could exceed the value of the financial assets and liabilities recorded in the financial statements. Financial assets that potentially expose the Portfolio to credit and counterparty risk consist principally of cash due from counterparties and investments. The Portfolio manages counterparty risk by entering into agreements only with counterparties that it believes have the financial resources to honor their obligations and by monitoring the financial stability of those counterparties. The Subadviser may attempt to mitigate counterparty risk by (i) periodically assessing the creditworthiness of its trading partners, (ii) monitoring and/or limiting the amount of its net exposure to each individual counterparty based on its assessment, and (iii) requiring collateral from the counterparty for certain transactions. In order to preserve certain safeguards for non-standard settlement trades, the Portfolio restricts its exposure to credit and counterparty losses by entering into master netting agreements (“Master Agreements”) with counterparties (approved brokers) with whom it undertakes a significant volume of transactions. Master Agreements govern the terms of certain transactions and reduce the counterparty risk associated with relevant transactions by specifying credit protection mechanisms and providing standardization that improves legal certainty. Master Agreements can also help limit counterparty risk by specifying collateral posting arrangements at pre-arranged exposure levels.
Repurchase and reverse repurchase agreements are primarily executed under GMRAs or MRAs, which provide the right to set-off. Each repurchase and reverse repurchase agreement is initially collateralized at the transaction level. In the event of default, the total market value exposure will be offset against collateral exchanged to date, which would result in a net receivable/(payable) that would be due from/to the counterparty.
Additional risks associated with each type of investment are described above within the respective security type notes. The Portfolio’s prospectus includes a discussion of the principal risks of investing in the Portfolio.
4. Investment Transactions
Aggregate cost of purchases and proceeds of sales of investment securities, excluding short-term securities, for the year ended December 31, 2023 were as follows:
| Purchases |
Sales | |||||
| U.S. Government |
Non-U.S. Government | U.S. Government | Non-U.S. Government | |||
| $0 | $259,589,801 | $0 | $470,045,590 | |||
5. Investment Management Fees and Other Transactions with Affiliates
Investment Management Agreement - Brighthouse Investment Advisers is the investment adviser to the Portfolio. The Trust has entered into an investment management agreement with Brighthouse Investment Advisers with respect to the Portfolio. For providing investment management services to the Portfolio, Brighthouse Investment Advisers receives monthly compensation at the following annual rates:
| Management Fees earned by |
% per annum |
Average Daily Net Assets | ||||
| $21,899,704 | 0.750 | % | Of the first $1 billion | |||
| 0.700 | % | On the next $2 billion | ||||
| 0.650 | % | On amounts in excess of $3 billion | ||||
BHFTII-15
Brighthouse Funds Trust II
Brighthouse/Wellington Core Equity Opportunities Portfolio
Notes to Financial Statements—December 31, 2023—(Continued)
Brighthouse Investment Advisers has entered into an investment subadvisory agreement with respect to managing the Portfolio. Wellington Management Company LLP (the “Subadviser”) is compensated by Brighthouse Investment Advisers to provide subadvisory services for the Portfolio.
Management Fee Waivers - Pursuant to a management fee waiver agreement, the Adviser has agreed, for the period May 1, 2023 to April 30, 2024, to reduce its advisory fees set out above under “Investment Management Agreement” for each class of the Portfolio as follows:
| % per annum reduction |
Average Daily Net Assets | |
| 0.120% | First $500 million | |
| 0.145% | $500 million to $1 billion | |
| 0.120% | $1 billion to $3 billion | |
| 0.080% | $3 billion to $4.5 billion | |
| 0.105% | Over $4.5 billion |
An identical agreement was in place for the period April 29, 2022 to April 30, 2023. Amounts waived for the year ended December 31, 2023 were $3,768,659 and are included in the total amount shown as a management fee waiver in the Statement of Operations.
The Subadviser has voluntarily agreed to waive a portion of its subadvisory fees payable by the Adviser to the Subadviser for managing the Portfolio. In addition to the above advisory fee waiver, the Adviser has agreed to reduce its advisory fee reflecting a portion of the amount waived by the Subadviser for managing the Portfolio pursuant to the voluntary subadvisory fee waiver. $878,589 was waived in the aggregate for the year ended December 31, 2023 and is reflected in the total amount shown as a management fee waiver in the Statement of Operations.
Certain officers and trustees of the Trust may also be officers of Brighthouse Investment Advisers; however, such officers and trustees receive no compensation from the Trust.
Transfer Agency Agreement - Brighthouse Life Insurance Company serves as the transfer agent for the Trust. Brighthouse Life Insurance Company receives no fees for its services to the Trust.
Distribution and Service Fees - The Trust has a distribution agreement with Brighthouse Securities, LLC (the “Distributor”) pursuant to which the Distributor serves as the general distributor of shares of each class (each a “Class”) of each Portfolio. The Distributor is an affiliate of the Trust. The Trust has adopted a Distribution and Services Plan (the “D&S Plan”) relating to Class B, Class D, Class E, Class F and Class G shares of each Portfolio, under Rule 12b-1 under the 1940 Act, pursuant to which the Trust may pay the Distributor a fee (the “Service Fee”) at an annual rate not to exceed 0.25% of each such Portfolio’s average daily net assets attributable to the Class B, Class D, Class E, Class F and Class G shares of the Trust. Each Portfolio may not offer shares of each Class. The D&S Plan also authorizes the Trust, on behalf of each of its Portfolios, to pay to the Distributor a distribution fee (the “Distribution Fee” and together with the Service Fee, the “Fees”) at an annual rate of up to 0.25% of each Portfolio’s average daily net assets attributable to the Class B, Class D, Class E, Class F, and Class G shares in consideration of the services rendered in connection with the sale of such shares by the Distributor. Under the Distribution Agreement with respect to the Trust, Fees are currently paid at an annual rate of 0.25% of average daily net assets in the case of Class B shares, 0.10% of average daily net assets in the case of Class D shares, 0.15% of average daily net assets in the case of Class E shares, 0.20% of average daily net assets in the case of Class F shares and 0.30% of average daily net assets in the case of Class G shares. The D&S Plan is known as a “compensation plan” because the Trust makes payments to the Distributor for services rendered regardless of the actual level of expenditures by the Distributor. Amounts incurred by the Portfolio for the year ended December 31, 2023 are shown as Distribution and service fees in the Statement of Operations.
Deferred Trustee Compensation - Each Trustee who is not currently an employee of the Adviser or any of its affiliates receives compensation from the Trust for his or her service to the Trust. A deferred compensation plan (the “Plan”) is available to the Trustees on a voluntary basis. Deferred amounts remain in the Trust until distributed in accordance with the provisions of the Plan. The value of a participating Trustee’s deferral account is based on theoretical investments of deferred amounts on the normal payment dates in certain portfolios of the Trust or Brighthouse Funds Trust I, an affiliate of the Trust, as designated by the participating Trustee. Changes in the value of participants’ deferral accounts are reflected as a component of Trustees’ fees and expenses in the Statement of Operations. The portion of the accrued obligations allocated to the Portfolio under the Plan is reflected as Deferred trustees’ fees in the Statement of Assets and Liabilities.
BHFTII-16
Brighthouse Funds Trust II
Brighthouse/Wellington Core Equity Opportunities Portfolio
Notes to Financial Statements—December 31, 2023—(Continued)
6. Contractual Obligations
Under the Trust’s organizational documents, its officers and Trustees may be indemnified against certain liabilities and expenses arising out of the performance of their duties to the Trust. Additionally, the Trust has a variety of indemnification obligations under contracts with its service providers. The Trust’s maximum exposure under these arrangements is unknown, as this would involve future claims that may be made against the Trust that have not yet occurred.
7. Income Tax Information
The cost basis of investments for federal income tax purposes at December 31, 2023 was as follows:
| Cost basis of investments |
$ | 2,271,975,347 | ||
|
|
|
|||
| Gross unrealized appreciation |
908,597,255 | |||
| Gross unrealized (depreciation) |
(19,437,233 | ) | ||
|
|
|
|||
| Net unrealized appreciation (depreciation) |
$ | 889,160,022 | ||
|
|
|
The tax character of distributions paid for the years ended December 31, 2023 and 2022 were as follows:
| Ordinary Income |
Long-Term Capital Gain | Total | ||||||||
| 2023 |
2022 | 2023 | 2022 | 2023 | 2022 | |||||
| $42,047,165 | $53,836,793 | $328,302,289 | $606,419,938 | $370,349,454 | $660,256,731 | |||||
As of December 31, 2023, the components of distributable earnings (accumulated losses) on a federal income tax basis were as follows:
| Undistributed |
Undistributed Long-Term Capital Gain |
Net Unrealized Appreciation (Depreciation) |
Accumulated Capital Losses |
Total | ||||||
| $41,611,732 | $108,819,562 | $889,161,793 | $— | $1,039,593,087 | ||||||
The Portfolio utilizes the provisions of the federal income tax laws that provide for the carryforward of capital losses for prior years, offsetting such losses against any future realized capital gains. Net capital losses may be carried forward indefinitely and their character is retained as short-term and/or long-term losses.
As of December 31, 2023, the Portfolio had no accumulated capital losses.
8. Recent Accounting Pronouncement & Regulatory Updates
In June 2022, FASB issued Accounting Standards Update 2022-03 — Fair Value Measurement (Topic 820) — Fair Value Measurement of Equity Securities Subject to Contractual Sale Restrictions (“ASU 2022-03”). ASU 2022-03 clarifies the guidance in Topic 820 to indicate that a contractual sale restriction should not be considered in the fair value of an equity security subject to such a restriction, and requires entities with investments in equity securities subject to contractual sale restrictions to disclose certain qualitative and quantitative information about such securities. ASU 2022-03 is effective for fiscal years, and interim periods within those fiscal years, beginning after December 15, 2023. ASU 2022-03 is only applicable to an equity security in which the contractual arrangement that restricts its sale is executed or modified on or after the adoption date.
Effective January 24, 2023, the Securities and Exchange Commission adopted rule and form amendments that require open-end management investment companies to transmit concise and visually engaging annual and semiannual reports to shareholders that highlight certain information deemed by the SEC to be particularly important for investors. Certain other information, including financial statements, will no longer appear in shareholder reports but will, as required, be available online, delivered free of charge upon request, and filed on a semiannual basis on Form N-CSR. The rule and form amendments have a compliance date of July 24, 2024. Accordingly, the rule and form amendments will not impact the Portfolio until its 2024 semiannual shareholder report.
BHFTII-17
Brighthouse Funds Trust II
Brighthouse/Wellington Core Equity Opportunities Portfolio
Report of Independent Registered Public Accounting Firm
To the Board of Trustees of Brighthouse Funds Trust II and Shareholders of the Brighthouse/Wellington Core Equity Opportunities Portfolio:
Opinion on the Financial Statements and Financial Highlights
We have audited the accompanying statement of assets and liabilities, including the schedule of investments, of the Brighthouse/Wellington Core Equity Opportunities Portfolio (the “Fund”) (one of the funds constituting the Brighthouse Funds Trust II), as of December 31, 2023, the related statement of operations for the year then ended, the statements of changes in net assets for each of the two years in the period then ended, the financial highlights for each of the five years in the period then ended, and the related notes. In our opinion, the financial statements and financial highlights present fairly, in all material respects, the financial position of the Fund as of December 31, 2023, and the results of its operations for the year then ended, the changes in its net assets for each of the two years in the period then ended, and the financial highlights for each of the five years in the period then ended in conformity with accounting principles generally accepted in the United States of America.
Basis for Opinion
These financial statements and financial highlights are the responsibility of the Fund’s management. Our responsibility is to express an opinion on the Fund’s financial statements and financial highlights based on our audits. We are a public accounting firm registered with the Public Company Accounting Oversight Board (United States) (PCAOB) and are required to be independent with respect to the Fund in accordance with the U.S. federal securities laws and the applicable rules and regulations of the Securities and Exchange Commission and the PCAOB.
We conducted our audits in accordance with the standards of the PCAOB. Those standards require that we plan and perform the audit to obtain reasonable assurance about whether the financial statements and financial highlights are free of material misstatement, whether due to error or fraud. The Fund is not required to have, nor were we engaged to perform, an audit of its internal control over financial reporting. As part of our audits we are required to obtain an understanding of internal control over financial reporting but not for the purpose of expressing an opinion on the effectiveness of the Fund’s internal control over financial reporting. Accordingly, we express no such opinion.
Our audits included performing procedures to assess the risks of material misstatement of the financial statements and financial highlights, whether due to error or fraud, and performing procedures that respond to those risks. Such procedures included examining, on a test basis, evidence regarding the amounts and disclosures in the financial statements and financial highlights. Our audits also included evaluating the accounting principles used and significant estimates made by management, as well as evaluating the overall presentation of the financial statements and financial highlights. Our procedures included confirmation of securities owned as of December 31, 2023, by correspondence with the custodian and brokers; when replies were not received from brokers, we performed other auditing procedures. We believe that our audits provide a reasonable basis for our opinion.
/s/ Deloitte & Touche LLP
Boston, Massachusetts
February 23, 2024
We have served as the auditor of one or more Brighthouse investment companies since 1983.
BHFTII-18
Brighthouse Funds Trust II
Trustees and Officers
MANAGEMENT OF THE TRUSTS
The Boards of Trustees (the “Board”) of Brighthouse Funds Trust I and Brighthouse Funds Trust II (“Trust I” and “Trust II”, respectively, and collectively the “Trusts”) supervise the Trusts and are responsible for representing the interests of shareholders. The Trustees, the Chairman of the Board and the Chairmen of each subcommittee are the same for both Trusts. The Trustees of each Trust meet periodically throughout the year to oversee the Portfolios’ activities, reviewing, among other things, each Portfolio’s performance and its contractual arrangements with various service providers. The Trustees of each Trust elect the officers of the Trust, who are responsible for administering the Trust’s day-to-day operations.
Trustees and Officers
The Trustees and executive officers of the Trusts, as well as their ages and their principal occupations during the past five years, are set forth below. Unless otherwise indicated, the business address of each is c/o Brighthouse Funds Trust I and Brighthouse Funds Trust II, 11225 N. Community House Rd., Charolette, North Carolina 28277. Each Trustee who is deemed an “interested person,” as such term is defined in the 1940 Act, is referred to as an “Interested Trustee.” Those Trustees who are not “interested persons,” as such term is defined in the 1940 Act, are referred to as “Independent Trustees.” There is no limit to the term a Trustee may serve, other than pursuant to the retirement policy adopted by the Independent Trustees. Trustees serve until their death, resignation, retirement or removal in accordance with Trust I’s and Trust II’s respective organizational documents and policies adopted by the Board of the Trust from time to time. Officers hold office at the pleasure of each Board and serve until their removal or resignation in accordance with the Trusts’ respective organizational documents and policies adopted by the Board of each Trust from time to time.
Trustees of the Trusts
| Name and Year of Birth |
Position(s) |
Term of Office |
Principal Occupation(s) During the Past |
Number of |
Other Directorships Held | |||||
| Interested Trustee | ||||||||||
| John Rosenthal* (1960) |
Trustee | Indefinite; From May 2016 (Trust I and Trust II) to present | Chief Investment Officer, Brighthouse Financial, Inc. (2016 to present). | 73 | None | |||||
| Independent Trustees | ||||||||||
| Dawn M. Vroegop (1966) |
Trustee and Chair of the Board | Indefinite; From December 2000 (Trust I)/May 2009 (Trust II) to present as Trustee; From May 2016 (Trust I and Trust II) until present as Chair | Retired; Private Investor. | 73 | Trustee, Driehaus Mutual Funds (8 portfolios).** | |||||
| Stephen M. Alderman (1959) |
Trustee | Indefinite; From December 2000 (Trust I)/April 2012 (Trust II) to present | Vice President and General Counsel, IHR Aerial Solutions, LLC; Until 2022, General Counsel, Illini Hi-Reach, Inc.; Until 2020, Shareholder in the law firm of Garfield & Merel, Ltd. | 73 | None | |||||
| Robert J. Boulware (1956) |
Trustee | Indefinite; From March 2008 (Trust I)/April 2012 (Trust II) to present | Managing Member, Pilgrim Funds, LLC (private equity fund). | 73 | Trustee, Vertical Capital Income Fund (closed-end fund);** Trustee, The Private Shares Fund (closed- end fund);** Until 2021, Director, Mid- Con Energy Partners, LP (energy);** Until 2020, Director, Gainsco, Inc. (auto insurance).** | |||||
BHFTII-19
Brighthouse Funds Trust II
Trustees and Officers—(Continued)
| Name and Year of Birth |
Position(s) |
Term of Office |
Principal Occupation(s) During the Past |
Number of |
Other Directorships Held | |||||
| Susan C. Gause (1952) |
Trustee | Indefinite; From March 2008 (Trust I)/April 2012 (Trust II) to present | Private Investor. | 73 | Trustee, HSBC Funds (4 portfolios).** | |||||
| Nancy Hawthorne (1951) |
Trustee | Indefinite; From May 2003 (Trust II)/April 2012 (Trust I) to present | Private Investor. | 73 | Trustee, First Eagle Credit Opportunities Fund;** Trustee and Chair of the Board of Trustees, First Eagle Global Opportunities Fund;** Director, Avid Technology, Inc;** Director, CRA International, Inc.** | |||||
Executive Officers of the Trusts
| Name and Year of Birth |
Position(s) |
Term of Office |
Principal Occupation(s) | |||
| Kristi Slavin (1973) | President and Chief Executive Officer, of Trust I and Trust II | From May 2016 (Trust I and Trust II) to present |
President, Brighthouse Investment Advisers, LLC (2016-present). | |||
| Alan R. Otis (1971) | Chief Financial Officer and Treasurer, of Trust I and Trust II | From November 2017 (Trust I and Trust II) to present |
Executive Vice President, Brighthouse Investment Advisers, LLC (2017-present); formerly, Vice President, Brighthouse Investment Advisers, LLC (2012-2017); Assistant Treasurer, Trust I and Trust II (2012-2017). | |||
| Thomas Watterson (1985) | Secretary, of Trust I and Trust II | From November 2023 (Trust I and Trust II) to present |
Executive Vice President, Chief Legal Officer and Secretary, Brighthouse Investment Advisers, LLC (2023-Present); Managing Corporate Counsel, Brighthouse Financial Inc. (2023-present); Managing Counsel and Director, The Bank of New York Mellon Corporation (2019-2023); Counsel and Vice President, The Bank of New York Mellon Corporation (2016-2019). | |||
| Katie Hellmann (1980) | Chief Compliance Officer (“CCO”), of Trust I and Trust II | From May 2023 (Trust I and Trust II) to present |
Chief Compliance Officer, Brighthouse Investment Advisers, LLC (2023-present) and Head of Funds and Investments Compliance (2023-present). Deputy Chief Compliance Officer, Transamerica Asset Management (2022-2023). Leader and Senior Compliance Counsel – Funds Compliance, Edward Jones (2017-2022). | |||
| Rosemary Morgan (1983) | Anti-Money Laundering Officer, of Trust I and Trust II | From May 2023 (Trust I and Trust II) to present |
Chief Privacy Officer, Leader of Compliance Programs and Assistant General Counsel, Brighthouse Financial, Inc. (2019-2022); Chief Privacy Officer, Head of Compliance Programs & Contracts Law, Brighthouse Financial, Inc. (2022-2023), Chief Compliance Officer and Associate General Counsel, Brighthouse Financial, Inc. (2023-present); Vice President and Chief Compliance Officer, Brighthouse Life Insurance Company (2023-present); Vice President and Chief Compliance Officer (2023-present), Brighthouse Life Insurance Company of NY; Vice President and Chief Compliance Officer (2023-present), New England Life Insurance Company. | |||
| Anna Koska (1981) | Vice President, of Trust I and Trust II | From June 2022 (Trust I and Trust II) to present |
Vice President, Investment and Advisory Services, Brighthouse Investment Advisers, LLC (2022-present); Director of Investment and Advisory Services, Brighthouse Investment Advisers, LLC (2019-2022); Senior Portfolio Analyst, Brighthouse Investment Advisers, LLC (2017-2019). | |||
| * | Mr. Rosenthal is an “interested person” of the Trusts because of his position with Brighthouse Financial, Inc. (“Brighthouse Financial”), an affiliate of BIA. |
| ** | Indicates a directorship with a registered investment company or a company subject to the reporting requirements of the Securities Exchange Act of 1934, as amended. |
| (1) | Previous positions during the past five years with the Trusts, MetLife, Inc. or the Adviser are omitted if not materially different. |
| (2) | The Fund Complex includes 44 Trust I Portfolios and 29 Trust II Portfolios. |
BHFTII-20
Brighthouse Funds Trust II
Brighthouse/Wellington Core Equity Opportunities Portfolio
Board of Trustees’ Consideration of Advisory and Sub-Advisory Agreements
At a meeting held on November 13-14, 2023 (the “November Meeting”), the Boards of Trustees (the “Board”) of Brighthouse Funds Trust I and Brighthouse Funds Trust II (“BFT I” and “BFT II,” respectively, and collectively, the “Trusts”), including a majority of the Trustees who are not “interested persons” of the Trusts (the “Independent Trustees”) under the Investment Company Act of 1940 (the “1940 Act”), approved the continuation of the Trusts’ advisory agreements (each an “Advisory Agreement”) with Brighthouse Investment Advisers, LLC (the “Adviser”) and the applicable sub-advisory and sub-sub-advisory agreements (each a “Sub-Advisory Agreement” and collectively with the Advisory Agreement, the “Agreements”) between the Adviser and the investment sub-advisers and sub-sub-adviser (each a “Sub-Adviser,” and collectively, the “Sub-Advisers”) for the series of the Trusts (each a “Portfolio,” and collectively, the “Portfolios”) for the annual contract renewal period from January 1, 2024 through December 31, 2024.
The Board met with personnel of the Adviser on September 28-29, 2023 (the “September Meeting”) for the specific purpose of giving preliminary consideration to the proposed continuation of the Agreements, including consideration to information that the Adviser and Sub-Advisers had provided for the Board’s review at the request of the Independent Trustees. At the September Meeting, the Adviser reviewed with the Board the performance and fees experienced by each Portfolio, as well as other information. During and after the September Meeting, the Independent Trustees requested additional information and clarifications that the Adviser addressed at the November Meeting (the September Meeting and the November Meeting are referred to collectively as, the “Meetings”). During the contract renewal process, and throughout the year, the Independent Trustees were advised by independent legal counsel, and they met with independent legal counsel in executive sessions outside of the presence of management on a number of occasions to discuss, among other things, the renewal of the Agreements.
In considering the continuation of the Agreements, the Board reviewed a variety of materials that were provided for the specific purpose of assisting the Board in the renewal process, along with various information and materials that were provided to and discussed with the Board throughout the year, at regularly scheduled meetings of the Board and its committees. In particular, information for each Portfolio included, but was not limited to, reports on investment performance, expenses, legal and compliance matters, and asset pricing. Information about the Adviser and each Sub-Adviser included, but was not limited to, reports on the business, operations, and performance of the Adviser and the Sub-Advisers and reports that the Adviser and Sub-Advisers had prepared specifically for the renewal process.
In considering the continuation of the Agreements, the Board also reviewed, among other things, a report for each Portfolio that was prepared by Broadridge (“Broadridge”), an independent organization, which set forth comparative performance and expense information for each Portfolio. In addition, the Independent Trustees reviewed a report that was prepared by JDL Consultants, LLC (“JDL”), an independent consultant to the Independent Trustees, which examined the Broadridge reports for each Portfolio (“JDL Report”). The Independent Trustees met in executive session with representatives of JDL during the September Meeting to review the JDL Report.
At the November Meeting, the Board, including a majority of the Independent Trustees, concluded that the nature, extent, and quality of services provided by the Adviser and each Sub-Adviser supported the renewal of the Agreements. The Board also concluded that the investment services provided to and the performance of each Portfolio was such that each Agreement should continue, and that the fees paid by each Portfolio to the Adviser appeared to be reasonable in light of the nature, extent, and quality of the services provided by the Adviser and each Sub-Adviser. Further, the Board concluded that the Adviser’s profitability in providing services under the Advisory Agreements did not appear unreasonable in light of the nature, extent, and quality of the services provided by the Adviser. The Board reviewed the extent to which the investment advisory fees paid by the Portfolios shared economies of scale with investors or entailed the potential to share economies of scale with investors and concluded that those considerations generally supported the renewal of each Agreement. Finally, the Board considered the Adviser’s recommendation that it approve the renewal of each Sub-Advisory Agreement.
In approving the continuation of each Agreement, the Board, including the Independent Trustees, gave attention to all of the information that was furnished, and each Trustee placed varying degrees of importance on the various pieces of information that were provided to them. The Board evaluated the information provided to it on a Portfolio-by-Portfolio basis, and its decision was made separately with respect to each Portfolio. The following paragraphs provide more information about some of the primary factors that were relevant to the Board’s decisions. The Board did not identify any single factor as determinative, and the Trustees generally attributed different weights to various factors for the various Portfolios.
Nature, extent and quality of services. The Board evaluated the nature, extent, and quality of the services that the Adviser and the Sub-Advisers, as relevant, provided to the Portfolios. The Board considered the Adviser’s services as investment manager to the Portfolios, including its services relating to the hiring and oversight of the Sub-Advisers and, in particular, their investment programs
BHFTII-21
Brighthouse Funds Trust II
Brighthouse/Wellington Core Equity Opportunities Portfolio
Board of Trustees’ Consideration of Advisory and Sub-Advisory Agreements—(Continued)
and personnel, succession management of key personnel, trading practices, compliance programs and personnel, and risk management programs, among other things. The Adviser’s services in coordinating and overseeing the activities of the Trusts’ other service providers were also considered. The Board also considered the systems and processes required by the Adviser to meet additional regulatory and compliance requirements resulting from U.S. Securities and Exchange Commission and other regulatory initiatives, including related to liquidity, valuation, and derivatives risk management. The Board considered information received from the Trusts’ Chief Compliance Officer regarding the Portfolios’ compliance policies and procedures that were established pursuant to Rule 38a-l under the 1940 Act, and relevant aspects of the Adviser’s and Sub-Advisers’ compliance policies and procedures. The Board also noted that it was the practice of the Adviser’s investment, compliance, and legal staff to conduct periodic meetings (through various media) with the Sub-Advisers throughout the year in order to review and assess the services that are provided to the Portfolios, and that personnel of the Adviser routinely prepare and present reports to the Board regarding those meetings. In addition, during the Meetings and throughout the year, the Board considered the expertise, experience, and performance of the personnel of the Adviser who performed the various services that are mentioned above.
With respect to the services provided by each of the Sub-Advisers, the Board considered a variety of information that the Adviser and each Sub-Adviser prepared for the Board’s review. The Board considered each Sub-Adviser’s investment process, each Sub-Adviser’s overall organization and business plans and the investment performance experienced by the Portfolio (as described in more detail below). The Board took into account that each Sub-Adviser’s responsibilities include, among other things, the development and maintenance of an investment program for the applicable Portfolio, the selection of investments and the placement of orders for the purchase and sale of such assets, and the implementation of compliance controls related to the performance of these services. The Board considered, based on the information provided, each Sub-Adviser’s staffing with respect to the management of the Portfolio and other information relating to the Sub-Adviser’s business and operations. The Board also considered the Sub-Adviser’s overall resources and information with respect to any recent turnover of key personnel at the Sub-Adviser. The Board reviewed each Sub-Adviser’s investment experience, as well as information provided regarding the Sub-Adviser’s personnel who provide services to the Portfolios. The Board also considered, among other things, information about each Sub-Adviser’s compliance program, including regarding any compliance matters involving a Sub-Adviser that had been brought to the Board’s attention during the year, as well as the Adviser’s assessment of the financial condition of each Sub-Adviser.
Performance. The Board placed emphasis on the performance of each Portfolio in the context of the performance of the relevant markets in which the Portfolio invests. The Board considered the Adviser’s quarterly presentations to the Board of detailed information about each Portfolio’s investment strategies and performance results and composition, including discussions regarding the relevant effects of market conditions. The Board reviewed and considered the reports prepared by Broadridge, which provided a statistical analysis comparing each Portfolio’s investment performance to that of comparable funds underlying variable insurance products (the “Performance Universe”), and the JDL Report. The Board also compared the performance of each Portfolio to that of comparable funds and other accounts that were managed by the relevant Sub-Adviser, to the extent such information was provided. The Board considered each Portfolio’s performance for periods subsequent to the performance period covered by the Broadridge reports and considered the Adviser’s assessment of the same. The Board also noted that while it found the data provided by Broadridge generally useful, it recognized the limitations of such data, including, in particular, that notable differences may exist between a Portfolio and the other funds in a Broadridge category (for example, with respect to investment strategies) and that the results of the performance comparisons may vary depending on (i) the end dates for the performance periods that were selected and (ii) the selection of the peer groups.
The Board focused particular attention on Portfolios with less favorable performance records. The Board noted the Adviser’s focus on each Sub-Adviser’s performance and that the Adviser had been active in monitoring and responding to any performance issues with respect to the Portfolios.
Fees and Expenses. The Board gave consideration to the level and method of computing the fees payable under the Agreements. The Board reviewed and considered the information in the JDL Report concerning fees and expenses. The Board also reviewed and considered the Broadridge report for each Portfolio, which included various comparisons of the Portfolio’s fees (at December 31, 2022 and various asset levels) and expenses with those of its peers, including, as applicable, a broad group of peer funds (“Expense Universe”), a narrower group of peer funds (“Expense Group”), a broad group of peer sub-advised funds (“Sub-advised Expense Universe”), and a narrower group of peer sub-advised funds (“Sub-advised Expense Group”). In particular, the Board reviewed comparisons of each Portfolio’s contractual management fees with its Expense Group and Sub-advised Expense Universe, contractual sub-adviser fees with its Sub-advised Expense Universe and Sub-advised Expense Group, and total expenses with its Expense Universe, Expense Group and Sub-advised Expense Universe. The Board considered that Broadridge selected the peer funds, which were funds underlying variable insurance products that Broadridge deemed to be comparable to the Portfolios. The Board considered that the fee
BHFTII-22
Brighthouse Funds Trust II
Brighthouse/Wellington Core Equity Opportunities Portfolio
Board of Trustees’ Consideration of Advisory and Sub-Advisory Agreements—(Continued)
and expense information in the Broadridge report for each Portfolio reflected information as of the Portfolio’s most recent fiscal year end at the time the Broadridge report was issued and that historical asset levels may differ from current asset levels, particularly in a period of market volatility. In addition, the Board compared the fee payable to a Sub-Adviser by the Adviser with respect to the Portfolio to the fee payable to the Sub-Adviser by other comparable funds and other accounts, to the extent such information was provided.
The Board noted that the sub-advisory fees for the Portfolios are negotiated at arm’s length by the Adviser and are paid by the Adviser out of its advisory fees. The Board also considered that the Adviser had entered into expense limitation or management fee waiver agreements with certain of the Portfolios pursuant to which the Adviser had agreed to waive a portion of its advisory fee and/or reimburse certain expenses as a means of limiting a Portfolio’s total annual operating expenses or passing through the benefit of a subadvisory fee concession to a Portfolio, as applicable.
Profitability. The Board examined the profitability to the Adviser of each Advisory Agreement, on a Portfolio-by-Portfolio basis. The Board also considered that an affiliate of the Adviser, Brighthouse Securities, LLC, serves as distributor for the Trusts, and, as such, receives Rule 12b-1 payments to support the distribution of the Portfolios. The Board considered the profitability to the Sub-Advisers and their affiliates of their relationships with the Portfolios, to the extent provided, and the Board considered the ability of the Adviser to negotiate with a Sub-Adviser at arm’s length. In reviewing the profitability information, the Board recognized that expense allocation methodologies are inherently subjective and various methodologies may be reasonable while producing different results.
Economies of scale. The Board considered each Portfolio’s fees in light of its size. The Board noted the fee schedules for the Portfolios that contain breakpoints that reduce the fee rate above specified asset levels, including breakpoints in the Advisory Agreements and any corresponding Sub-Advisory Agreement. The Board noted those Portfolios that did not have breakpoints in their advisory fees and considered management’s explanation of the same.
The Board considered the effective fees under the Advisory Agreement and Sub-Advisory Agreement for each Portfolio as a percentage of assets at different asset levels and possible economies of scale that may be realized if the assets of the Portfolio grow. The Board examined, among other data, the effect of a Portfolio’s growth in size, and reduction in size, on various fee schedules. The Board also generally noted that if a Portfolio’s assets increase over time, the Portfolio may realize economies of scale if assets increase proportionally more than certain other expenses.
Other factors. The Board considered other benefits that may be realized by the Adviser and its affiliates from their relationships with the Trusts. Among the benefits realized by the Adviser, the Board recognized that Brighthouse Securities, LLC, as the distributor for the Trusts, receives payments pursuant to Rule 12b-1 from the Portfolios to help compensate for the provision of shareholder services and distribution activities. The Board considered that a Sub-Adviser may engage in soft dollar transactions in managing a Portfolio. In addition, the Board considered that a Sub-Adviser may be affiliated with registered broker-dealers that may, from time to time, receive brokerage commissions from a Portfolio in connection with the sale of portfolio securities (subject to applicable best execution obligations). The Board also considered that a Sub-Adviser and its affiliates could benefit from the opportunity to provide advisory services to additional portfolios of the Trusts and overall reputational benefits.
The Board considered information from the Adviser and Sub-Advisers pertaining to potential conflicts of interest, and the manner in which any potential conflicts were mitigated. In its review, the Board considered information regarding various business relationships among the Adviser and its affiliates and various Sub-Advisers and their affiliates. The Board also considered information about services and/or payments provided to the Adviser by the Sub-Advisers in connection with marketing activities. The Board considered representations from the Adviser that such business relationships and any payments were not considered in the Adviser’s recommendation to renew any of the Sub-Advisory Agreements.
* * * * *
Brighthouse/Wellington Core Equity Opportunities Portfolio. The Board also considered the following information in relation to the Agreements with the Adviser and Wellington Management Company LLP regarding the Portfolio:
Among other data relating specifically to the Portfolio’s performance, the Board considered that the Portfolio underperformed the median of its Performance Universe and the average of its Morningstar Category for the one-and three-year periods ended June 30, 2023 and outperformed the median of its Performance Universe and the average of its Morningstar Category for the five-year period ended June 30, 2023. The Board further considered that the Portfolio underperformed its benchmark, the Russell 1000 Index, for the one-, three-, and five-year periods ended October 31, 2023. The Board took into account management’s discussion of the Portfolio’s performance, including with respect to prevailing market conditions. The Board also noted the presence of certain management fee waivers in effect for the Portfolio.
BHFTII-23
Brighthouse Funds Trust II
Brighthouse/Wellington Core Equity Opportunities Portfolio
Board of Trustees’ Consideration of Advisory and Sub-Advisory Agreements—(Continued)
The Board also considered that the Portfolio’s actual management fees and total expenses (exclusive of 12b-1 fees) were below the Expense Universe median, the Expense Group median, and the Sub-advised Expense Universe median. The Board noted that the Portfolio’s contractual management fees were above the asset-weighted average of the Investment Classification/Morningstar Category selected by Broadridge at the Portfolio’s current size. The Board also noted that the Portfolio’s contractual sub-advisory fees were above the averages of the Sub-advised Expense Universe and the Sub-advised Expense Group at the Portfolio’s current size.
BHFTII-24
Brighthouse Funds Trust II
Frontier Mid Cap Growth Portfolio
Managed by Frontier Capital Management Company, LLC
Portfolio Manager Commentary*
PERFORMANCE
For the twelve months ended December 31, 2023, the Class A, B, D and E shares of the Frontier Mid Cap Growth Portfolio returned 18.00%, 17.73%, 17.88%, and 17.84%, respectively. The Portfolio’s benchmark, the Russell Midcap Growth Index¹, returned 25.87%.
MARKET ENVIRONMENT / CONDITIONS
U.S. equities rose sharply, scaling a wall of worry on better-than-expected growth and inflation data. The Gross Domestic Product (“GDP”) growth was revised higher through the year on robust consumer spending, while multiple inflation indicators posted their lowest annual increase in over two years.
The year began on an upbeat note – inflation appeared to be subsiding, and many wagered that the U.S. Federal Reserve (the “Fed”) would transition from monetary tightening to cutting rates by year-end. Growth stocks rallied, with the Nasdaq® composite posting its best start since 2001. Midway through the period, the markets got a boost from a surge in Artificial Intelligence (“AI”) spending and positive GDP revisions that helped overcome a regional banking crisis and a downward trend in leading economic indicators. Beginning in September, a sudden spike in interest rates that drove the 10-year bond yield from approximately 4% to almost 5% in four weeks rattled the markets, bringing the rally to a screeching halt. Then, interest rate expectations fell in the final two months of the year as the Fed confirmed its pivot toward rate cuts and the U.S. deficit concerns eased on a smaller-than-expected U.S. Treasury debt issuance, leading to a brisk market rally that powered the Russell Midcap Growth Index (the “Index”) to a 25.87% annual gain.
PORTFOLIO REVIEW / PERIOD END POSITIONING
The Portfolio underperformed the Index during the 12-month period ending December 31, 2023. At the end of August, the Portfolio trailed the Index by approximately 57 basis points and was within striking distance of catching up. Then, the steep rise in interest rates beginning in September and the ensuing volatility impacted the Portfolio’s holdings in multiple sectors, leading to its underperformance. The headwinds broadly fell into three categories: (1) holdings sensitive to high-interest rates, including companies with high debt, companies leveraged to consumer lending such as credit bureaus, and those exposed to capital-intensive projects such as solar equipment suppliers and developers; (2) holdings exposed to glucagon-like peptide 1 (“GLP-1”) weight loss drugs, such as medical equipment suppliers serving diabetes and sleep apnea markets, which were deemed adversely impacted by the GLP-1 drugs, and (3) holdings exposed to labor disruptions, including auto suppliers and media companies that saw work stoppages due to worker strikes.
Sector allocation was modestly negative due to the Portfolio’s underweight position on an intra-period basis in the top two performing sectors, Information Technology (“IT”) and Communication Services. An overweight position in Financials was another detractor, offset partially by the collective underweight position in Energy and Consumer Staples.
Stock selection was most challenging in Consumer Discretionary, followed by IT and Health Care, while Energy and Materials were the primary contributors. Several themes drove the Portfolio’s underperformance during the period. First, the renewable energy exposure detracted approximately 350 basis points. Our solar companies, such as SolarEdge Technologies, Array Technologies, and MasTec, underperformed due to the rising cost of capital and policy delays that led to project pushouts. Similarly, our electric vehicle (“EV”) components and materials suppliers, such as Wolfspeed and Albemarle, were affected by slowing EV adoption and falling material prices, partly due to adverse policy changes in China. Second, the Portfolio’s Consumer Discretionary and Staples key holdings detracted approximately 280 basis points. Increasing economic pressure on low-income consumers impacted the profitability of Dollar General, while higher interest rates slowed store growth at Planet Fitness. Media conglomerate Warner Bros. Discovery suffered from low advertising spend and workers’ strikes, and after-market auto parts supplier Advance Auto Parts fell due to intensifying competitive pressure. Third, despite favorable stock selection, the Portfolio’s underweight position in the top-performing software industry subtracted 180 basis points from our relative performance.
Other major detractors included SVB Financial Group and BILL Holdings. The regulators shut down SVB as the company’s efforts to strengthen its balance sheet triggered a run on its bank. We sold our stake in the Portfolio at an average price of $162 per share before the bank ceased operations. BILL, a payment software provider to small businesses, slashed its growth outlook as customers cut spending and suppliers shunned virtual card acceptance to save transaction costs.
Energy was the largest contributor to stock selection as Permian Resources and SM Energy exceeded production targets while controlling capital expenditure due to improved efficiency. Both companies increased the capital returns to shareholders. ATI, a manufacturer of specialty alloys, was the largest contributor in Materials on strong earnings rebound as the company benefited from an upswing in the aerospace cycle. ATI signed favorable long-term supply contracts with customers because it can reliably supply high-grade titanium and other critical elements in light of a structural shortage due to the Russia-Ukraine war. Cement and wallboard manufacturer Eagle Materials substantially increased its earnings per share despite a slowdown in single-family residential construction. The company raised prices in a supply-constrained environment due to robust demand from infrastructure projects and multi-family residential buildouts.
BHFTII-1
Brighthouse Funds Trust II
Frontier Mid Cap Growth Portfolio
Managed by Frontier Capital Management Company, LLC
Portfolio Manager Commentary*—(Continued)
Notable contributors in Industrials included XPO and Builders FirstSource. XPO focuses on the less-than-truckload market and is on a multi-year mission to narrow the profitability gap versus market-leading operators. Its strategy was boosted when it hired away the chief operating officer from the best-in-class competitor to strengthen its management team further. Subsequently, XPO’s quarterly earnings outpaced investors’ expectations as the company displayed impressive pricing discipline in a challenging demand environment. Builders FirstSource, a building materials supplier, exceeded earnings forecast on higher-than-anticipated profitability due to an improving product mix and an aggressive share repurchase program. The company bought back a fourth of its outstanding shares over the past year without sacrificing its ability to grow organically and make strategic acquisitions. Six out of the top ten contributors came from IT. Security software providers Palo Alto Networks and CrowdStrike Holdings continued to gain share amid resilient security demand and customers’ push toward vendor consolidation. Semiconductor suppliers Monolithic Power Systems and Lam Research benefited from the emerging AI buildout and strong competitive positioning. Consumer credit analytics provider Fair Issac exceeded investors’ expectations on strong pricing power in its FICO scores business and robust demand for its fraud detection software. Marketing and sales software provider HubSpot accelerated customer acquisition on new product introductions and pricing investments.
During the period, we reduced exposure to Consumer Discretionary and Financials due to the cumulative effect of monetary tightening, dwindling savings, and high-interest rates, while valuation concerns led to reductions in IT. Conversely, we added Industrials and Materials holdings that benefit from improved pricing power. Our recent Real Estate purchases aim to exploit the depressed investor sentiment in the sector and the potential future disruptions in the U.S. housing market. In Health Care, we consolidated our positions and added to our medical equipment companies serving diabetes and sleep apnea following the dramatic selloff on the potential impact of GLP-1 weight loss drugs. At period-end, the Portfolio had underweight positions relative to the benchmark in the consumer-related sectors and Communication Services while remaining overweight in Health Care and Materials.
Christopher J. Scarpa
Ravi Dabas
Portfolio Managers
Frontier Capital Management Company, LLC
* This commentary may include statements that constitute “forward-looking statements” under the U.S. securities laws. Forward-looking statements include, among other things, projections, estimates, and information about possible or future results related to the Portfolio, market or regulatory developments. The views expressed above are not guarantees of future performance or economic results and involve certain risks, uncertainties and assumptions that could cause actual outcomes and results to differ materially from the views expressed herein. The views expressed above are subject to change at any time based upon economic, market, or other conditions and the subadvisory firm undertakes no obligation to update the views expressed herein. Any discussions of specific securities should not be considered a recommendation to buy or sell those securities. The views expressed above (including any forward-looking statement) may not be relied upon as investment advice or as an indication of the Portfolio’s trading intent. Information about the Portfolio’s holdings, asset allocation or country diversification is historical and is not an indication of future Portfolio composition, which may vary. Direct investment in any index is not possible. The performance of any index mentioned in this commentary has not been adjusted for ongoing management, distribution and operating expenses, and sales charges applicable to mutual fund investments. In addition, the returns do not reflect additional fees charged by separate accounts or variable insurance contracts that an investor in the Portfolio may pay. If these additional fees were reflected, performance would have been lower.
1 The Russell Midcap Growth Index is an unmanaged measure of performance of those Russell Midcap companies (the 800 smallest companies in the Russell 1000 Index) with higher price-to-book ratios and higher forecasted growth values.
BHFTII-2
Brighthouse Funds Trust II
Frontier Mid Cap Growth Portfolio
A $10,000 INVESTMENT COMPARED TO THE RUSSELL MIDCAP GROWTH INDEX
AVERAGE ANNUAL RETURNS (%) FOR THE YEAR ENDED DECEMBER 31, 2023
| 1 Year | 5 Year | 10 Year | ||||||||||
| Frontier Mid Cap Growth Portfolio | ||||||||||||
| Class A |
18.00 | 11.26 | 9.28 | |||||||||
| Class B |
17.73 | 10.99 | 9.01 | |||||||||
| Class D |
17.88 | 11.15 | 9.17 | |||||||||
| Class E |
17.84 | 11.09 | 9.11 | |||||||||
| Russell Midcap Growth Index | 25.87 | 13.82 | 10.57 | |||||||||
Portfolio performance is calculated including reinvestment of all income and capital gain distributions. Performance numbers are net of all Portfolio expenses but do not include any insurance, sales, separate account or administrative charges of variable annuity or life insurance contracts or any additional expenses that participants may bear relating to the operations of their plans. If these charges were included, the returns would be lower. The performance of any index referenced above has not been adjusted for ongoing management, distribution and operating expenses, and sales charges applicable to mutual fund investments. Direct investment in any index is not possible. The performance of Class A shares, as set forth in the line graph above, will differ from that of other classes because of the difference in expenses paid by policyholders investing in the different share classes.
This information represents past performance and is not indicative of future results. Investment return and principal value may fluctuate so that shares, upon redemption, may be worth more or less than the original cost.
PORTFOLIO COMPOSITION AS OF DECEMBER 31, 2023
Top Sectors
| % of Net Assets |
||||
| Information Technology | 23.8 | |||
| Health Care | 21.3 | |||
| Industrials | 20.3 | |||
| Consumer Discretionary | 12.2 | |||
| Financials | 9.8 | |||
| Energy | 3.7 | |||
| Materials | 3.4 | |||
| Communication Services | 2.7 | |||
| Real Estate | 1.2 | |||
| Consumer Staples | 1.1 | |||
Top Holdings
| % of Net Assets |
||||
| Apollo Global Management, Inc. | 2.7 | |||
| XPO, Inc. | 2.6 | |||
| Veeva Systems, Inc.- Class A | 2.6 | |||
| KBR, Inc. | 2.5 | |||
| Crowdstrike Holdings, Inc.- Class A | 2.4 | |||
| Monolithic Power Systems, Inc. | 2.2 | |||
| Builders FirstSource, Inc. | 2.2 | |||
| DexCom, Inc. | 2.2 | |||
| Inspire Medical Systems, Inc. | 2.2 | |||
| KKR & Co., Inc. | 2.1 | |||
BHFTII-3
Brighthouse Funds Trust II
Frontier Mid Cap Growth Portfolio
Understanding Your Portfolio’s Expenses
Shareholder Expense Example
As a shareholder of the Portfolio, you incur ongoing costs, including management fees; distribution and service (12b-1) fees; and other Portfolio expenses. This example is intended to help you understand your ongoing costs (in dollars) (referred to as “expenses”) of investing in the Portfolio and compare these costs with the ongoing costs of investing in other mutual funds. The example is based on an investment of $1,000 invested at the beginning of the period and held for the entire period, July 1, 2023 through December 31, 2023.
Actual Expenses
The first line for each share class of the Portfolio in the table below provides information about actual account values and actual expenses. You may use the information in this line, together with the amount you invested in the particular share class of the Portfolio, to estimate the expenses that you paid over the period. Simply divide your account value by $1,000 (for example, an $8,600 account value divided by $1,000 = 8.6), then multiply the result by the number in the first line under the heading entitled “Expenses Paid During Period” to estimate the expenses you paid on your account during this period.
Hypothetical Example for Comparison Purposes
The second line for each share class of the Portfolio in the table below provides information about hypothetical account values and hypothetical expenses based on the Portfolio’s actual expense ratio and an assumed rate of return of 5% per year before expenses, which is not the Portfolio’s actual return. The hypothetical account values and expenses may not be used to estimate the actual ending account balance or expenses you paid for the period. You may use this information to compare the ongoing costs of investing in the Portfolio and other funds. To do so, compare this 5% hypothetical example with the 5% hypothetical examples that appear in the shareholder reports of the other funds.
Please note that the expenses shown in the table are meant to highlight your ongoing costs only and do not reflect any fees or charges of your variable insurance product or any additional expenses that participants in certain eligible qualified plans may bear relating to the operations of their plan. Therefore, the second line for each share class in the table is useful in comparing ongoing costs only, and will not help you determine the relative total costs of owning different funds. In addition, if these other costs were included, your costs would have been higher.
|
|
Annualized Expense Ratio |
Beginning Account Value July 1, 2023 |
Ending Account Value December 31, 2023 |
Expenses Paid During Period** July 1, 2023 to December 31, 2023 |
||||||||||||||
| Class A (a) |
Actual | 0.71 | % | $ | 1,000.00 | $ | 1,031.60 | $ | 3.64 | |||||||||
| Hypothetical* | 0.71 | % | $ | 1,000.00 | $ | 1,021.63 | $ | 3.62 | ||||||||||
| Class B (a) |
Actual | 0.96 | % | $ | 1,000.00 | $ | 1,030.20 | $ | 4.91 | |||||||||
| Hypothetical* | 0.96 | % | $ | 1,000.00 | $ | 1,020.37 | $ | 4.89 | ||||||||||
| Class D (a) |
Actual | 0.81 | % | $ | 1,000.00 | $ | 1,030.90 | $ | 4.15 | |||||||||
| Hypothetical* | 0.81 | % | $ | 1,000.00 | $ | 1,021.12 | $ | 4.13 | ||||||||||
| Class E (a) |
Actual | 0.86 | % | $ | 1,000.00 | $ | 1,031.00 | $ | 4.40 | |||||||||
| Hypothetical* | 0.86 | % | $ | 1,000.00 | $ | 1,020.87 | $ | 4.38 | ||||||||||
| * | Hypothetical assumes a rate of return of 5% per year before expenses. |
| ** | Expenses paid are equal to the Portfolio’s annualized expense ratio for the most recent six month period, as shown above, multiplied by the average account value over the period, multiplied by the number of days (184 days) in the most recent fiscal half-year, divided by 365 (to reflect the one-half year period). |
| (a) | The annualized expense ratio shown reflects the impact of the management fee waiver as described in Note 5 of the Notes to Financial Statements. |
BHFTII-4
Brighthouse Funds Trust II
Frontier Mid Cap Growth Portfolio
Schedule of Investments as of December 31, 2023
Common Stocks—99.6% of Net Assets
| Security Description | Shares | Value | ||||||
| Aerospace & Defense—2.4% | ||||||||
| BWX Technologies, Inc. |
190,578 | $ | 14,623,050 | |||||
| L3Harris Technologies, Inc. |
49,731 | 10,474,343 | ||||||
|
|
|
|||||||
| 25,097,393 | ||||||||
|
|
|
|||||||
| Automobile Components—0.6% | ||||||||
| BorgWarner, Inc. |
174,083 | 6,240,876 | ||||||
|
|
|
|||||||
| Biotechnology—2.4% | ||||||||
| BioMarin Pharmaceutical, Inc. (a) |
58,615 | 5,651,658 | ||||||
| Exact Sciences Corp. (a) |
96,605 | 7,146,838 | ||||||
| Natera, Inc. (a) |
191,379 | 11,987,981 | ||||||
|
|
|
|||||||
| 24,786,477 | ||||||||
|
|
|
|||||||
| Building Products—2.2% | ||||||||
| Builders FirstSource, Inc. (a) |
138,329 | 23,092,643 | ||||||
|
|
|
|||||||
| Capital Markets—4.9% | ||||||||
| Carlyle Group, Inc. (b) |
141,466 | 5,756,251 | ||||||
| KKR & Co., Inc. |
266,468 | 22,076,874 | ||||||
| Moody’s Corp. (b) |
15,802 | 6,171,629 | ||||||
| MSCI, Inc. |
23,121 | 13,078,394 | ||||||
| Nasdaq, Inc. |
77,390 | 4,499,455 | ||||||
|
|
|
|||||||
| 51,582,603 | ||||||||
|
|
|
|||||||
| Chemicals—0.2% | ||||||||
| Albemarle Corp. (b) |
15,938 | 2,302,722 | ||||||
|
|
|
|||||||
| Commercial Services & Supplies—1.2% | ||||||||
| Cintas Corp. |
14,045 | 8,464,360 | ||||||
| Waste Connections, Inc. |
28,358 | 4,232,998 | ||||||
|
|
|
|||||||
| 12,697,358 | ||||||||
|
|
|
|||||||
| Communications Equipment—1.4% | ||||||||
| Arista Networks, Inc. (a) |
64,247 | 15,130,811 | ||||||
|
|
|
|||||||
| Construction & Engineering—1.7% | ||||||||
| MasTec, Inc. (a) (b) |
58,629 | 4,439,388 | ||||||
| Quanta Services, Inc. (b) |
60,339 | 13,021,156 | ||||||
|
|
|
|||||||
| 17,460,544 | ||||||||
|
|
|
|||||||
| Construction Materials—1.5% | ||||||||
| Eagle Materials, Inc. (b) |
78,313 | 15,885,009 | ||||||
|
|
|
|||||||
| Consumer Staples Distribution & Retail—1.1% | ||||||||
| Dollar General Corp. |
85,345 | 11,602,653 | ||||||
|
|
|
|||||||
| Diversified Consumer Services—1.1% | ||||||||
| Bright Horizons Family Solutions, Inc. (a) (b) |
118,407 | 11,158,676 | ||||||
|
|
|
|||||||
| Electrical Equipment—1.1% | ||||||||
| Array Technologies, Inc. (a) (b) |
666,036 | 11,189,405 | ||||||
|
|
|
|||||||
| Electronic Equipment, Instruments & Components—0.8% | ||||||||
| Amphenol Corp. - Class A |
89,395 | 8,861,726 | ||||||
|
|
|
|||||||
| Financial Services—4.0% | ||||||||
| Apollo Global Management, Inc. |
303,756 | 28,307,022 | ||||||
| Global Payments, Inc. |
106,376 | 13,509,752 | ||||||
|
|
|
|||||||
| 41,816,774 | ||||||||
|
|
|
|||||||
| Ground Transportation—4.1% | ||||||||
| J.B. Hunt Transport Services, Inc. |
43,887 | 8,765,989 | ||||||
| Knight-Swift Transportation Holdings, Inc. |
128,426 | 7,403,759 | ||||||
| XPO, Inc. (a) (b) |
308,912 | 27,057,602 | ||||||
|
|
|
|||||||
| 43,227,350 | ||||||||
|
|
|
|||||||
| Health Care Equipment & Supplies—11.7% | ||||||||
| Alcon, Inc. |
145,356 | 11,355,211 | ||||||
| Align Technology, Inc. (a) (b) |
25,728 | 7,049,472 | ||||||
| DexCom, Inc. (a) (b) |
185,500 | 23,018,695 | ||||||
| GE HealthCare Technologies, Inc. (a) (b) |
50,557 | 3,909,067 | ||||||
| Hologic, Inc. (a) |
184,560 | 13,186,812 | ||||||
| IDEXX Laboratories, Inc. (a) |
38,265 | 21,238,988 | ||||||
| Inspire Medical Systems, Inc. (a) (b) |
112,350 | 22,855,360 | ||||||
| STERIS PLC (b) |
64,934 | 14,275,740 | ||||||
| Teleflex, Inc. (b) |
21,537 | 5,370,036 | ||||||
|
|
|
|||||||
| 122,259,381 | ||||||||
|
|
|
|||||||
| Health Care Providers & Services—1.1% | ||||||||
| Humana, Inc. |
25,402 | 11,629,290 | ||||||
|
|
|
|||||||
| Health Care Technology — 2.6% | ||||||||
| Veeva Systems, Inc. - Class A (a) |
139,297 | 26,817,458 | ||||||
|
|
|
|||||||
| Hotels, Restaurants & Leisure — 4.8% | ||||||||
| Boyd Gaming Corp. |
153,111 | 9,586,280 | ||||||
| Caesars Entertainment, Inc. (a) |
190,857 | 8,947,376 | ||||||
| Chipotle Mexican Grill, Inc. (a) |
6,202 | 14,183,726 | ||||||
| Domino’s Pizza, Inc. |
32,108 | 13,235,881 | ||||||
| Planet Fitness, Inc. - Class A (a) (b) |
64,378 | 4,699,594 | ||||||
|
|
|
|||||||
| 50,652,857 | ||||||||
|
|
|
|||||||
| Industrial REITs—0.7% | ||||||||
| First Industrial Realty Trust, Inc. (b) |
128,884 | 6,788,320 | ||||||
|
|
|
|||||||
| Insurance—0.9% | ||||||||
| Aon PLC - Class A |
33,574 | 9,770,706 | ||||||
|
|
|
|||||||
| Interactive Media & Services—1.3% | ||||||||
| Pinterest, Inc. - Class A (a) |
374,958 | 13,888,444 | ||||||
|
|
|
|||||||
| IT Services—6.4% | ||||||||
| Cognizant Technology Solutions Corp. - Class A |
229,319 | 17,320,464 | ||||||
| EPAM Systems, Inc. (a) |
69,022 | 20,523,001 | ||||||
| Gartner, Inc. (a) |
14,496 | 6,539,291 | ||||||
| MongoDB, Inc. (a) (b) |
40,589 | 16,594,813 | ||||||
| Twilio, Inc. - Class A (a) |
75,158 | 5,702,237 | ||||||
|
|
|
|||||||
| 66,679,806 | ||||||||
|
|
|
|||||||
| Leisure Products — 1.5% | ||||||||
| Mattel, Inc. (a) (b) |
839,237 | 15,844,795 | ||||||
|
|
|
|||||||
See accompanying notes to financial statements.
BHFTII-5
Brighthouse Funds Trust II
Frontier Mid Cap Growth Portfolio
Schedule of Investments as of December 31, 2023
Common Stocks—(Continued)
| Security Description | Shares |
Value | ||||||
| Life Sciences Tools & Services — 3.6% | ||||||||
| Agilent Technologies, Inc. |
132,868 | $ | 18,472,638 | |||||
| IQVIA Holdings, Inc. (a)(b) |
42,923 | 9,931,524 | ||||||
| Mettler-Toledo International, Inc. (a) |
7,985 | 9,685,485 | ||||||
|
|
|
|||||||
| 38,089,647 | ||||||||
|
|
|
|||||||
| Machinery — 0.5% | ||||||||
| Stanley Black & Decker, Inc. |
53,402 | 5,238,736 | ||||||
|
|
|
|||||||
| Media — 1.4% | ||||||||
| Trade Desk, Inc. - Class A (a) (b) |
199,360 | 14,345,946 | ||||||
|
|
|
|||||||
| Metals & Mining — 1.6% | ||||||||
| ATI, Inc. (a) (b) |
374,949 | 17,048,931 | ||||||
|
|
|
|||||||
| Oil, Gas & Consumable Fuels — 3.7% | ||||||||
| Coterra Energy, Inc. |
439,523 | 11,216,627 | ||||||
| Permian Resources Corp. (b) |
999,317 | 13,590,711 | ||||||
| SM Energy Co. (b) |
356,463 | 13,802,248 | ||||||
|
|
|
|||||||
| 38,609,586 | ||||||||
|
|
|
|||||||
| Professional Services — 4.3% | ||||||||
| Equifax, Inc. |
45,114 | 11,156,241 | ||||||
| KBR, Inc. (b) |
467,828 | 25,922,349 | ||||||
| TransUnion |
108,066 | 7,425,215 | ||||||
|
|
|
|||||||
| 44,503,805 | ||||||||
|
|
|
|||||||
| Real Estate Management & Development — 0.6% | ||||||||
| CoStar Group, Inc. (a) |
71,608 | 6,257,823 | ||||||
|
|
|
|||||||
| Semiconductors & Semiconductor Equipment — 6.0% | ||||||||
| KLA Corp. |
15,411 | 8,958,414 | ||||||
| Lam Research Corp. |
9,239 | 7,236,539 | ||||||
| Marvell Technology, Inc. |
275,319 | 16,604,489 | ||||||
| Microchip Technology, Inc. |
73,767 | 6,652,308 | ||||||
| Monolithic Power Systems, Inc. (b) |
37,305 | 23,531,248 | ||||||
|
|
|
|||||||
| 62,982,998 | ||||||||
|
|
|
|||||||
| Software — 9.1% | ||||||||
| BILL Holdings, Inc. (a) (b) |
35,121 | 2,865,522 | ||||||
| CrowdStrike Holdings, Inc. - Class A (a) |
96,482 | 24,633,784 | ||||||
| Fair Isaac Corp. (a) |
17,292 | 20,128,061 | ||||||
| Guidewire Software, Inc. (a) (b) |
156,097 | 17,020,817 | ||||||
| HubSpot, Inc. (a) |
25,156 | 14,604,064 | ||||||
| Palantir Technologies, Inc. - Class A (a) (b) |
218,170 | 3,745,979 | ||||||
| Palo Alto Networks, Inc. (a) |
42,326 | 12,481,091 | ||||||
|
|
|
|||||||
| 95,479,318 | ||||||||
|
|
|
|||||||
| Specialty Retail — 4.2% | ||||||||
| Burlington Stores, Inc. (a) (b) |
73,222 | 14,240,215 | ||||||
| Lithia Motors, Inc. (b) |
26,743 | 8,805,935 | ||||||
| Ross Stores, Inc. |
115,629 | 16,001,897 | ||||||
| Tractor Supply Co. (b) |
24,557 | 5,280,492 | ||||||
|
|
|
|||||||
| 44,328,539 | ||||||||
|
|
|
|||||||
| Trading Companies & Distributors—2.9% | ||||||||
| Beacon Roofing Supply, Inc. (a) |
180,682 | 15,722,948 | ||||||
| FTAI Aviation Ltd. |
323,676 | 15,018,566 | ||||||
|
|
|
|||||||
| 30,741,514 | ||||||||
|
|
|
|||||||
| Total Common Stocks |
1,044,090,920 | |||||||
|
|
|
|||||||
| Short-Term Investment—0.7% | ||||||||
| Repurchase Agreement—0.7% | ||||||||
| Fixed Income Clearing Corp.
|
6,921,298 | 6,921,298 | ||||||
|
|
|
|||||||
| Total Short-Term Investments |
6,921,298 | |||||||
|
|
|
|||||||
| Securities Lending Reinvestments (c) — 14.7% |
|
|||||||
| Certificates of Deposit — 1.5% | ||||||||
| Mitsubishi UFJ Trust & Banking Corp. |
||||||||
| Zero Coupon, 03/13/24 |
3,000,000 | 2,966,460 | ||||||
| Mizuho Bank Ltd. |
||||||||
| 5.790%, SOFR + 0.400%, 04/18/24 (d) |
2,000,000 | 2,000,906 | ||||||
| MUFG Bank Ltd. (London) |
||||||||
| Zero Coupon, 06/04/24 |
1,000,000 | 976,630 | ||||||
| Royal Bank of Canada |
||||||||
| 5.880%, FEDEFF PRV + 0.550%, 09/20/24 (d) |
3,000,000 | 3,001,860 | ||||||
| Standard Chartered Bank |
||||||||
| 5.790%, SOFR + 0.390%, 04/19/24 (d) |
1,000,000 | 1,000,000 | ||||||
| Sumitomo Mitsui Banking Corp. |
||||||||
| 5.860%, SOFR + 0.460%, 01/11/24 (d) |
2,000,000 | 2,000,246 | ||||||
| Sumitomo Mitsui Trust Bank Ltd. |
||||||||
| 5.800%, SOFR + 0.400%, 04/24/24 (d) |
2,000,000 | 2,001,190 | ||||||
| Westpac Banking Corp. |
||||||||
| 5.950%, SOFR + 0.550%, 10/11/24 (d) |
2,000,000 | 2,002,478 | ||||||
|
|
|
|||||||
| 15,949,770 | ||||||||
|
|
|
|||||||
| Commercial Paper — 0.4% | ||||||||
| Australia & New Zealand Banking Group Ltd. |
||||||||
| 5.640%, 04/18/24 |
1,000,000 | 983,338 | ||||||
| 5.730%, SOFR + 0.330%, 04/18/24 (d) |
1,000,000 | 1,000,224 | ||||||
| Old Line Funding LLC |
2,000,000 | 1,987,044 | ||||||
|
|
|
|||||||
| 3,970,606 | ||||||||
|
|
|
|||||||
| Repurchase Agreements — 8.3% | ||||||||
| Bank of Nova Scotia |
||||||||
| Repurchase Agreement dated 12/29/23 at 5.450%, due on 01/02/24 with a maturity value of $17,010,294; collateralized by various Common Stock with an aggregate market value of $18,934,528 |
17,000,000 | 17,000,000 | ||||||
See accompanying notes to financial statements.
BHFTII-6
Brighthouse Funds Trust II
Frontier Mid Cap Growth Portfolio
Schedule of Investments as of December 31, 2023
Securities Lending Reinvestments (c)—(Continued)
| Security Description | Principal |
Value | ||||||
| Repurchase Agreements—(Continued) | ||||||||
| Barclays Bank PLC |
||||||||
| Repurchase Agreement dated 12/29/23 at 5.330%, due on 01/02/24 with a maturity value of $3,001,777; collateralized by U.S. Treasury Obligations with rates ranging from 0.000% - 5.500%, maturity dates ranging from 01/31/24 - 05/15/48, and an aggregate market value of $3,061,678. |
3,000,000 | $ | 3,000,000 | |||||
| Repurchase Agreement dated 12/29/23 at 5.450%, due on 01/02/24 with a maturity value of $2,341,337; collateralized by various Common Stock with an aggregate market value of $2,608,571. |
2,339,920 | 2,339,920 | ||||||
| Cantor Fitzgerald & Co. |
4,999,992 | 4,999,992 | ||||||
| Citigroup Global Markets, Inc. |
7,000,000 | 7,000,000 | ||||||
| Deutsche Bank Securities, Inc. |
11,603,453 | 11,603,453 | ||||||
| National Bank of Canada |
18,000,000 | 18,000,000 | ||||||
| NBC Global Finance Ltd. |
18,700,000 | 18,700,000 | ||||||
| Societe Generale |
||||||||
| Repurchase Agreement dated 12/29/23 at 5.330%, due on 01/02/24 with a maturity value of $2,601,540; collateralized by U.S. Treasury Obligations with rates ranging from 0.625% - 4.750%, maturity dates ranging from 04/15/26 - 08/15/51, and an aggregate market value of $2,657,890. |
2,600,000 | 2,600,000 | ||||||
| Repurchase Agreement dated 12/29/23 at 5.330%, due on 01/02/24 with a maturity value of $1,300,770; collateralized by U.S. Treasury Obligations with rates ranging from 0.625% - 5.240%, maturity dates ranging from 04/30/24 - 05/15/32, and an aggregate market value of $1,326,000. |
1,300,000 | 1,300,000 | ||||||
| Repurchase Agreement dated 12/29/23 at 5.510%, due on 01/02/24 with a maturity value of $700,429; collateralized by various Common Stock with an aggregate market value of $779,193. |
700,000 | 700,000 | ||||||
|
|
|
|||||||
| 87,243,365 | ||||||||
|
|
|
|||||||
| Time Deposits—1.0% | ||||||||
| First Abu Dhabi Bank USA NV |
4,000,000 | 4,000,000 | ||||||
| National Bank of Canada |
1,000,000 | 1,000,000 | ||||||
| Nordea Bank Abp |
5,000,000 | 5,000,000 | ||||||
|
|
|
|||||||
| 10,000,000 | ||||||||
|
|
|
|||||||
| Mutual Funds—3.5% | ||||||||
| BlackRock Liquidity Funds FedFund, Institutional Shares |
2,000,000 | 2,000,000 | ||||||
| Dreyfus Treasury Obligations Cash Management Fund, Institutional Class 5.250% (e) |
5,000,000 | 5,000,000 | ||||||
| Fidelity Investments Money Market Government Portfolio, Class I 5.250% (e) |
5,000,000 | 5,000,000 | ||||||
| Fidelity Investments Money Market Government Portfolio, Institutional Class 5.290% (e) |
1,000,000 | 1,000,000 | ||||||
| Goldman Sachs Financial Square Government Fund, Institutional Shares 5.230% (e) |
5,000,000 | 5,000,000 | ||||||
| Morgan Stanley Liquidity Funds Government Portfolio, Institutional Shares 5.270% (e) |
5,000,000 | 5,000,000 | ||||||
| RBC U.S. Government Money Market Fund, Institutional Share 5.230% (e) |
5,000,000 | 5,000,000 | ||||||
| State Street Institutional U.S. Government Money Market Fund, Premier Class 5.320% (e) |
5,000,000 | 5,000,000 | ||||||
| Western Asset Institutional Government Reserves Fund, Institutional Class 5.270% (e) |
4,000,000 | 4,000,000 | ||||||
|
|
|
|||||||
| 37,000,000 | ||||||||
|
|
|
|||||||
| Total Securities Lending Reinvestments |
154,163,741 | |||||||
|
|
|
|||||||
| Total Investments—115.0% |
1,205,175,959 | |||||||
| Other assets and liabilities (net)—(15.0)% |
(157,149,501 | ) | ||||||
|
|
|
|||||||
| Net Assets—100.0% | $ | 1,048,026,458 | ||||||
|
|
|
|||||||
| * | Principal amount stated in U.S. dollars unless otherwise noted. | |||
| (a) | Non-income producing security. | |||
| (b) | All or a portion of the security was held on loan. As of December 31, 2023, the market value of securities loaned was $182,700,989 and the collateral received consisted of cash in the amount of $154,072,749 and non-cash collateral with a value of $36,036,267. The cash collateral investments are disclosed in the Schedule of Investments and categorized as Securities Lending Reinvestments. The non-cash collateral received consists of U.S. government securities that are held in safe-keeping by the lending agent, or a third-party custodian, and cannot be sold or repledged by the Portfolio. As such, this collateral is excluded from the Statement of Assets and Liabilities. | |||
| (c) | Represents investment of cash collateral received from securities on loan as of December 31, 2023. | |||
| (d) | Variable or floating rate security. The stated rate represents the rate at December 31, 2023. Maturity date shown for callable securities reflects the earliest possible call date. For securities based on a published reference index and spread, the index and spread are indicated in the description above. For certain variable rate securities, the coupon rate is determined by the issuer/agent based on current market conditions. For certain asset-and mortgage-backed | |||
See accompanying notes to financial statements.
BHFTII-7
Brighthouse Funds Trust II
Frontier Mid Cap Growth Portfolio
Schedule of Investments as of December 31, 2023
| securities, the coupon rate may fluctuate based on changes of the underlying collateral or prepayments of principal. These securities do not indicate a reference index and spread in their description above. | ||||
| (e) | The rate shown represents the annualized seven-day yield as of December 31, 2023. | |||
| Glossary of Abbreviations | ||||
| Index Abbreviations | ||
| (FEDEFF PRV)— | Effective Federal Funds Rate | |
| (OBFR)— | U.S. Overnight Bank Funding Rate | |
| (SOFR)— | Secured Overnight Financing Rate | |
| Other Abbreviations | ||
| (REIT)— | Real Estate Investment Trust | |
Fair Value Hierarchy
Accounting principles generally accepted in the United States of America (“GAAP”) define fair market value as the price that the Portfolio would receive to sell an asset or pay to transfer a liability in an orderly transaction between market participants at the measurement date. It establishes a fair value hierarchy that prioritizes inputs to valuation methods and requires disclosure of the fair value hierarchy, separately for each major category of assets and liabilities, that segregates fair value measurements into three levels. Levels 1, 2 and 3 of the fair value hierarchy are defined as follows:
Level 1 - unadjusted quoted prices in active markets for identical investments
Level 2 - other significant observable inputs (including, but not limited to, quoted prices for similar assets or liabilities in markets that are either active or inactive; inputs other than quoted prices that are observable such as interest rates, yield curves, volatilities, prepayment speeds, loss severities, credit risks, default rates, or other market corroborated inputs)
Level 3 - significant unobservable inputs based on the best information available in the circumstances, to the extent observable inputs are unavailable (including the Portfolio’s own assumptions used in determining the fair value of investments and derivative financial instruments)
The inputs or methodologies used for valuing investments are not necessarily an indication of the risk associated with investing in them. Changes to the inputs or methodologies used may result in transfers between levels. A reconciliation of Level 3 securities, if any, will be disclosed following the fair value hierarchy table. For more information about the Portfolio’s policy regarding the valuation of investments, please refer to the Notes to Financial Statements.
The following table summarizes the fair value hierarchy of the Portfolio’s investments as of December 31, 2023:
| Description | Level 1 | Level 2 | Level 3 | Total | ||||||||||||
| Total Common Stocks* |
$ | 1,044,090,920 | $ | — | $ | — | $ | 1,044,090,920 | ||||||||
| Total Short-Term Investment* |
— | 6,921,298 | — | 6,921,298 | ||||||||||||
| Securities Lending Reinvestments | ||||||||||||||||
| Certificates of Deposit |
— | 15,949,770 | — | 15,949,770 | ||||||||||||
| Commercial Paper |
— | 3,970,606 | — | 3,970,606 | ||||||||||||
| Repurchase Agreements |
— | 87,243,365 | — | 87,243,365 | ||||||||||||
| Time Deposits |
— | 10,000,000 | — | 10,000,000 | ||||||||||||
| Mutual Funds |
37,000,000 | — | — | 37,000,000 | ||||||||||||
| Total Securities Lending Reinvestments |
37,000,000 | 117,163,741 | — | 154,163,741 | ||||||||||||
| Total Investments |
$ | 1,081,090,920 | $ | 124,085,039 | $ | — | $ | 1,205,175,959 | ||||||||
| Collateral for Securities Loaned (Liability) |
$ | — | $ | (154,072,749 | ) | $ | — | $ | (154,072,749 | ) | ||||||
| * | See Schedule of Investments for additional detailed categorizations. | |||
See accompanying notes to financial statements.
BHFTII-8
Brighthouse Funds Trust II
Frontier Mid Cap Growth Portfolio
Statement of Assets and Liabilities
December 31, 2023
| Assets |
| |||
| Investments at value (a) (b) |
$ | 1,205,175,959 | ||
| Receivable for: |
| |||
| Investments sold |
1,866,372 | |||
| Fund shares sold |
119,852 | |||
| Dividends and interest |
214,583 | |||
| Prepaid expenses |
3,775 | |||
|
|
|
|||
| Total Assets |
1,207,380,541 | |||
|
|
|
|||
| Liabilities |
| |||
| Collateral for securities loaned |
154,072,749 | |||
| Payables for: |
| |||
| Investments purchased |
1,773,740 | |||
| Fund shares redeemed |
2,574,148 | |||
| Accrued Expenses: |
| |||
| Management fees |
583,901 | |||
| Distribution and service fees |
36,114 | |||
| Deferred trustees’ fees |
192,719 | |||
| Other expenses |
120,712 | |||
|
|
|
|||
| Total Liabilities |
159,354,083 | |||
|
|
|
|||
| Net Assets |
$ | 1,048,026,458 | ||
|
|
|
|||
| Net Assets Consist of: |
| |||
| Paid in surplus |
$ | 966,261,536 | ||
| Distributable earnings (Accumulated losses) |
81,764,922 | |||
|
|
|
|||
| Net Assets |
$ | 1,048,026,458 | ||
|
|
|
|||
| Net Assets |
| |||
| Class A |
$ | 825,558,549 | ||
| Class B |
140,634,709 | |||
| Class D |
74,581,042 | |||
| Class E |
7,252,158 | |||
| Capital Shares Outstanding* |
| |||
| Class A |
32,874,678 | |||
| Class B |
7,485,478 | |||
| Class D |
3,150,529 | |||
| Class E |
311,933 | |||
| Net Asset Value, Offering Price and Redemption Price Per Share |
| |||
| Class A |
$ | 25.11 | ||
| Class B |
18.79 | |||
| Class D |
23.67 | |||
| Class E |
23.25 | |||
| * | The Portfolio is authorized to issue an unlimited number of shares. | |||
| (a) | Includes securities loaned at value of $182,700,989. | |||
| (b) | Identified cost of investments was $1,054,510,656. | |||
Statement of Operations
Year Ended December 31, 2023
| Investment Income |
| |||
| Dividends (a) |
$ | 6,055,702 | ||
| Interest |
249,183 | |||
| Securities lending income |
334,773 | |||
|
|
|
|||
| Total investment income |
6,639,658 | |||
|
|
|
|||
| Expenses |
||||
| Management fees |
7,313,988 | |||
| Administration fees |
52,542 | |||
| Custodian and accounting fees |
69,196 | |||
| Distribution and service fees—Class B |
333,554 | |||
| Distribution and service fees—Class D |
70,154 | |||
| Distribution and service fees—Class E |
10,578 | |||
| Audit and tax services |
49,026 | |||
| Legal |
46,603 | |||
| Trustees’ fees and expenses |
46,220 | |||
| Shareholder reporting |
72,054 | |||
| Insurance |
8,937 | |||
| Miscellaneous |
19,823 | |||
|
|
|
|||
| Total expenses |
8,092,675 | |||
| Less management fee waiver |
(528,072 | ) | ||
| Less broker commission recapture |
(55,701 | ) | ||
|
|
|
|||
| Net expenses |
7,508,902 | |||
|
|
|
|||
| Net Investment Loss |
(869,244 | ) | ||
|
|
|
|||
| Net Realized and Unrealized Gain (Loss) |
| |||
| Net realized gain (loss) on : |
| |||
| Investments |
(19,236,234 | ) | ||
| Foreign currency transactions |
(3,698 | ) | ||
|
|
|
|||
| Net realized gain (loss) |
(19,239,932 | ) | ||
|
|
|
|||
| Net change in unrealized appreciation on investments |
188,253,888 | |||
|
|
|
|||
| Net realized and unrealized gain (loss) |
169,013,956 | |||
|
|
|
|||
| Net Increase (Decrease) in Net Assets From Operations |
$ | 168,144,712 | ||
|
|
|
|||
| (a) | Net of foreign withholding taxes of $19,294. | |||
See accompanying notes to financial statements.
BHFTII-9
Brighthouse Funds Trust II
Frontier Mid Cap Growth Portfolio
Statements of Changes in Net Assets
| Year Ended December 31, 2023 |
Year Ended December 31, 2022 |
|||||||||||
| Increase (Decrease) in Net Assets: |
| |||||||||||
| From Operations |
| |||||||||||
| Net investment income (loss) |
$ | (869,244 | ) | $ | (1,331,954 | ) | ||||||
| Net realized gain (loss) |
(19,239,932 | ) | (45,211,240 | ) | ||||||||
| Net change in unrealized appreciation (depreciation) |
188,253,888 | (355,531,666 | ) | |||||||||
|
|
|
|
|
|||||||||
| Increase (decrease) in net assets from operations |
168,144,712 | (402,074,860 | ) | |||||||||
|
|
|
|
|
|||||||||
| From Distributions to Shareholders |
| |||||||||||
| Class A |
0 | (248,481,947 | ) | |||||||||
| Class B |
0 | (50,426,272 | ) | |||||||||
| Class D |
0 | (22,792,054 | ) | |||||||||
| Class E |
0 | (2,460,063 | ) | |||||||||
| From return of capital |
| |||||||||||
| Class A |
0 | (266,232 | ) | |||||||||
| Class B |
0 | (54,029 | ) | |||||||||
| Class D |
0 | (24,420 | ) | |||||||||
| Class E |
0 | (2,636 | ) | |||||||||
|
|
|
|
|
|||||||||
| Total distributions |
0 | (324,507,653 | ) | |||||||||
|
|
|
|
|
|||||||||
| Increase (decrease) in net assets from capital share transactions |
(97,833,269 | ) | 258,788,226 | |||||||||
|
|
|
|
|
|||||||||
| Total increase (decrease) in net assets |
70,311,443 | (467,794,287 | ) | |||||||||
| Net Assets |
| |||||||||||
| Beginning of period |
977,715,015 | 1,445,509,302 | ||||||||||
|
|
|
|
|
|||||||||
| End of period |
$ | 1,048,026,458 | $ | 977,715,015 | ||||||||
|
|
|
|
|
|||||||||
Other Information:
Capital Shares
Transactions in capital shares were as follows:
| Year Ended December 31, 2023 |
Year Ended December 31, 2022 |
|||||||||||||||
| Shares | Value | Shares | Value | |||||||||||||
| Class A |
| |||||||||||||||
| Sales |
216,794 | $ | 4,963,276 | 500,507 | $ | 15,557,949 | ||||||||||
| Reinvestments |
0 | 0 | 12,187,564 | 248,748,179 | ||||||||||||
| Redemptions |
(3,741,680 | ) | (87,300,033 | ) | (2,400,743 | ) | (65,773,641 | ) | ||||||||
|
|
|
|
|
|
|
|
|
|||||||||
| Net increase (decrease) |
(3,524,886 | ) | $ | (82,336,757 | ) | 10,287,328 | $ | 198,532,487 | ||||||||
|
|
|
|
|
|
|
|
|
|||||||||
| Class B |
| |||||||||||||||
| Sales |
456,919 | $ | 7,865,688 | 590,406 | $ | 14,106,289 | ||||||||||
| Reinvestments |
0 | 0 | 3,292,909 | 50,480,301 | ||||||||||||
| Redemptions |
(1,006,423 | ) | (17,534,244 | ) | (1,031,407 | ) | (21,285,257 | ) | ||||||||
|
|
|
|
|
|
|
|
|
|||||||||
| Net increase (decrease) |
(549,504 | ) | $ | (9,668,556 | ) | 2,851,908 | $ | 43,301,333 | ||||||||
|
|
|
|
|
|
|
|
|
|||||||||
| Class D |
| |||||||||||||||
| Sales |
164,038 | $ | 3,619,059 | 78,349 | $ | 2,061,273 | ||||||||||
| Reinvestments |
0 | 0 | 1,184,041 | 22,816,474 | ||||||||||||
| Redemptions |
(393,342 | ) | (8,576,555 | ) | (345,862 | ) | (9,369,681 | ) | ||||||||
|
|
|
|
|
|
|
|
|
|||||||||
| Net increase (decrease) |
(229,304 | ) | $ | (4,957,496 | ) | 916,528 | $ | 15,508,066 | ||||||||
|
|
|
|
|
|
|
|
|
|||||||||
| Class E |
| |||||||||||||||
| Sales |
13,965 | $ | 311,837 | 16,491 | $ | 411,030 | ||||||||||
| Reinvestments |
0 | 0 | 130,026 | 2,462,699 | ||||||||||||
| Redemptions |
(55,161 | ) | (1,182,297 | ) | (58,293 | ) | (1,427,389 | ) | ||||||||
|
|
|
|
|
|
|
|
|
|||||||||
| Net increase (decrease) |
(41,196 | ) | $ | (870,460 | ) | 88,224 | $ | 1,446,340 | ||||||||
|
|
|
|
|
|
|
|
|
|||||||||
| Increase (decrease) derived from capital shares transactions |
$ | (97,833,269 | ) | $ | 258,788,226 | |||||||||||
|
|
|
|
|
|||||||||||||
See accompanying notes to financial statements.
BHFTII-10
Brighthouse Funds Trust II
Frontier Mid Cap Growth Portfolio
Financial Highlights
| Selected per share data | ||||||||||||||||||||
| Class A | ||||||||||||||||||||
| Year Ended December 31, | ||||||||||||||||||||
| 2023 | 2022 | 2021 | 2020 | 2019 | ||||||||||||||||
| Net Asset Value, Beginning of Period |
$ | 21.28 | $ | 43.74 | $ | 44.02 | $ | 37.70 | $ | 32.45 | ||||||||||
|
|
|
|
|
|
|
|
|
|
|
|||||||||||
| Income (Loss) from Investment Operations |
||||||||||||||||||||
| Net investment income (loss) (a) |
(0.01 | ) | (0.02 | ) | (0.18 | ) | (0.04 | ) | (0.01 | ) | ||||||||||
| Net realized and unrealized gain (loss) |
3.84 | (12.71 | ) | 6.16 | 10.57 | 10.30 | ||||||||||||||
|
|
|
|
|
|
|
|
|
|
|
|||||||||||
| Total income (loss) from investment operations |
3.83 | (12.73 | ) | 5.98 | 10.53 | 10.29 | ||||||||||||||
|
|
|
|
|
|
|
|
|
|
|
|||||||||||
| Less Distributions |
||||||||||||||||||||
| Distributions from net realized capital gains |
0.00 | (9.72 | ) | (6.26 | ) | (4.21 | ) | (5.04 | ) | |||||||||||
| Distributions from return of capital |
0.00 | (0.01 | ) | 0.00 | 0.00 | 0.00 | ||||||||||||||
|
|
|
|
|
|
|
|
|
|
|
|||||||||||
| Total distributions |
0.00 | (9.73 | ) | (6.26 | ) | (4.21 | ) | (5.04 | ) | |||||||||||
|
|
|
|
|
|
|
|
|
|
|
|||||||||||
| Net Asset Value, End of Period |
$ | 25.11 | $ | 21.28 | $ | 43.74 | $ | 44.02 | $ | 37.70 | ||||||||||
|
|
|
|
|
|
|
|
|
|
|
|||||||||||
| Total Return (%) (b) |
18.00 | (28.15 | ) | 14.68 | 31.70 | 33.13 | ||||||||||||||
| Ratios/Supplemental Data |
||||||||||||||||||||
| Gross ratio of expenses to average net assets (%) |
0.76 | 0.75 | 0.73 | 0.75 | 0.75 | |||||||||||||||
| Net ratio of expenses to average net assets (%) (c) |
0.71 | 0.70 | 0.71 | 0.73 | 0.73 | |||||||||||||||
| Ratio of net investment income (loss) to average net assets (%) |
(0.05 | ) | (0.08 | ) | (0.40 | ) | (0.10 | ) | (0.02 | ) | ||||||||||
| Portfolio turnover rate (%) |
71 | 47 | 55 | 64 | 60 | |||||||||||||||
| Net assets, end of period (in millions) |
$ | 825.6 | $ | 774.6 | $ | 1,142.1 | $ | 1,114.0 | $ | 955.7 | ||||||||||
| Class B | ||||||||||||||||||||
| Year Ended December 31, | ||||||||||||||||||||
| 2023 | 2022 | 2021 | 2020 | 2019 | ||||||||||||||||
| Net Asset Value, Beginning of Period |
$ | 15.96 | $ | 36.41 | $ | 37.72 | $ | 32.99 | $ | 28.97 | ||||||||||
|
|
|
|
|
|
|
|
|
|
|
|||||||||||
| Income (Loss) from Investment Operations |
||||||||||||||||||||
| Net investment income (loss) (a) |
(0.05 | ) | (0.07 | ) | (0.24 | ) | (0.11 | ) | (0.09 | ) | ||||||||||
| Net realized and unrealized gain (loss) |
2.88 | (10.65 | ) | 5.19 | 9.05 | 9.15 | ||||||||||||||
|
|
|
|
|
|
|
|
|
|
|
|||||||||||
| Total income (loss) from investment operations |
2.83 | (10.72 | ) | 4.95 | 8.94 | 9.06 | ||||||||||||||
|
|
|
|
|
|
|
|
|
|
|
|||||||||||
| Less Distributions |
||||||||||||||||||||
| Distributions from net realized capital gains |
0.00 | (9.72 | ) | (6.26 | ) | (4.21 | ) | (5.04 | ) | |||||||||||
| Distributions from return of capital |
0.00 | (0.01 | ) | 0.00 | 0.00 | 0.00 | ||||||||||||||
|
|
|
|
|
|
|
|
|
|
|
|||||||||||
| Total distributions |
0.00 | (9.73 | ) | (6.26 | ) | (4.21 | ) | (5.04 | ) | |||||||||||
|
|
|
|
|
|
|
|
|
|
|
|||||||||||
| Net Asset Value, End of Period |
$ | 18.79 | $ | 15.96 | $ | 36.41 | $ | 37.72 | $ | 32.99 | ||||||||||
|
|
|
|
|
|
|
|
|
|
|
|||||||||||
| Total Return (%) (b) |
17.73 | (28.33 | ) | 14.38 | 31.38 | 32.84 | ||||||||||||||
| Ratios/Supplemental Data |
||||||||||||||||||||
| Gross ratio of expenses to average net assets (%) |
1.01 | 1.00 | 0.98 | 1.00 | 1.00 | |||||||||||||||
| Net ratio of expenses to average net assets (%) (c) |
0.96 | 0.95 | 0.96 | 0.98 | 0.98 | |||||||||||||||
| Ratio of net investment income (loss) to average net assets (%) |
(0.30 | ) | (0.33 | ) | (0.65 | ) | (0.35 | ) | (0.27 | ) | ||||||||||
| Portfolio turnover rate (%) |
71 | 47 | 55 | 64 | 60 | |||||||||||||||
| Net assets, end of period (in millions) |
$ | 140.6 | $ | 128.2 | $ | 188.7 | $ | 188.5 | $ | 164.6 | ||||||||||
Please see following page for Financial Highlights footnote legend.
See accompanying notes to financial statements.
BHFTII-11
Brighthouse Funds Trust II
Frontier Mid Cap Growth Portfolio
Financial Highlights
| Selected per share data | ||||||||||||||||||||
| Class D | ||||||||||||||||||||
| Year Ended December 31, | ||||||||||||||||||||
| 2023 | 2022 | 2021 | 2020 | 2019 | ||||||||||||||||
| Net Asset Value, Beginning of Period |
$ | 20.08 | $ | 42.10 | $ | 42.64 | $ | 36.68 | $ | 31.71 | ||||||||||
|
|
|
|
|
|
|
|
|
|
|
|||||||||||
| Income (Loss) from Investment Operations |
| |||||||||||||||||||
| Net investment income (loss) (a) |
(0.03 | ) | (0.05 | ) | (0.21 | ) | (0.07 | ) | (0.04 | ) | ||||||||||
| Net realized and unrealized gain (loss) |
3.62 | (12.24 | ) | 5.93 | 10.24 | 10.05 | ||||||||||||||
|
|
|
|
|
|
|
|
|
|
|
|||||||||||
| Total income (loss) from investment operations |
3.59 | (12.29 | ) | 5.72 | 10.17 | 10.01 | ||||||||||||||
|
|
|
|
|
|
|
|
|
|
|
|||||||||||
| Less Distributions |
| |||||||||||||||||||
| Distributions from net realized capital gains |
0.00 | (9.72 | ) | (6.26 | ) | (4.21 | ) | (5.04 | ) | |||||||||||
| Distributions from return of capital |
0.00 | (0.01 | ) | 0.00 | 0.00 | 0.00 | ||||||||||||||
|
|
|
|
|
|
|
|
|
|
|
|||||||||||
| Total distributions |
0.00 | (9.73 | ) | (6.26 | ) | (4.21 | ) | (5.04 | ) | |||||||||||
|
|
|
|
|
|
|
|
|
|
|
|||||||||||
| Net Asset Value, End of Period |
$ | 23.67 | $ | 20.08 | $ | 42.10 | $ | 42.64 | $ | 36.68 | ||||||||||
|
|
|
|
|
|
|
|
|
|
|
|||||||||||
| Total Return (%) (b) |
17.88 | (28.21 | ) | 14.54 | 31.59 | 33.01 | ||||||||||||||
| Ratios/Supplemental Data |
| |||||||||||||||||||
| Gross ratio of expenses to average net assets (%) |
0.86 | 0.85 | 0.83 | 0.85 | 0.85 | |||||||||||||||
| Net ratio of expenses to average net assets (%) (c) |
0.81 | 0.80 | 0.81 | 0.83 | 0.83 | |||||||||||||||
| Ratio of net investment income (loss) to average net assets (%) |
(0.14 | ) | (0.18 | ) | (0.50 | ) | (0.20 | ) | (0.12 | ) | ||||||||||
| Portfolio turnover rate (%) |
71 | 47 | 55 | 64 | 60 | |||||||||||||||
| Net assets, end of period (in millions) |
$ | 74.6 | $ | 67.9 | $ | 103.7 | $ | 99.8 | $ | 85.6 | ||||||||||
| Class E | ||||||||||||||||||||
| Year Ended December 31, | ||||||||||||||||||||
| 2023 | 2022 | 2021 | 2020 | 2019 | ||||||||||||||||
| Net Asset Value, Beginning of Period |
$ | 19.73 | $ | 41.63 | $ | 42.25 | $ | 36.40 | $ | 31.52 | ||||||||||
|
|
|
|
|
|
|
|
|
|
|
|||||||||||
| Income (Loss) from Investment Operations |
| |||||||||||||||||||
| Net investment income (loss) (a) |
(0.04 | ) | (0.06 | ) | (0.23 | ) | (0.09 | ) | (0.06 | ) | ||||||||||
| Net realized and unrealized gain (loss) |
3.56 | (12.11 | ) | 5.87 | 10.15 | 9.98 | ||||||||||||||
|
|
|
|
|
|
|
|
|
|
|
|||||||||||
| Total income (loss) from investment operations |
3.52 | (12.17 | ) | 5.64 | 10.06 | 9.92 | ||||||||||||||
|
|
|
|
|
|
|
|
|
|
|
|||||||||||
| Less Distributions |
| |||||||||||||||||||
| Distributions from net realized capital gains |
0.00 | (9.72 | ) | (6.26 | ) | (4.21 | ) | (5.04 | ) | |||||||||||
| Distributions from return of capital |
0.00 | (0.01 | ) | 0.00 | 0.00 | 0.00 | ||||||||||||||
|
|
|
|
|
|
|
|
|
|
|
|||||||||||
| Total distributions |
0.00 | (9.73 | ) | (6.26 | ) | (4.21 | ) | (5.04 | ) | |||||||||||
|
|
|
|
|
|
|
|
|
|
|
|||||||||||
| Net Asset Value, End of Period |
$ | 23.25 | $ | 19.73 | $ | 41.63 | $ | 42.25 | $ | 36.40 | ||||||||||
|
|
|
|
|
|
|
|
|
|
|
|||||||||||
| Total Return (%) (b) |
17.84 | (28.25 | ) | 14.48 | 31.53 | 32.92 | ||||||||||||||
| Ratios/Supplemental Data |
| |||||||||||||||||||
| Gross ratio of expenses to average net assets (%) |
0.91 | 0.90 | 0.88 | 0.90 | 0.90 | |||||||||||||||
| Net ratio of expenses to average net assets (%) (c) |
0.86 | 0.85 | 0.86 | 0.88 | 0.88 | |||||||||||||||
| Ratio of net investment income (loss) to average net assets (%) |
(0.19 | ) | (0.23 | ) | (0.55 | ) | (0.25 | ) | (0.17 | ) | ||||||||||
| Portfolio turnover rate (%) |
71 | 47 | 55 | 64 | 60 | |||||||||||||||
| Net assets, end of period (in millions) |
$ | 7.3 | $ | 7.0 | $ | 11.0 | $ | 11.4 | $ | 10.0 | ||||||||||
| (a) | Per share amounts based on average shares outstanding during the period. | |||
| (b) | Total return does not reflect any insurance, sales, separate account or administrative charges of variable annuity or life insurance contracts or any additional expenses that contract owners may bear under their variable contracts. If these charges were included, the returns would be lower. | |||
| (c) | Includes the effects of management fee waivers (see Note 5 of the Notes to Financial Statements). | |||
See accompanying notes to financial statements.
BHFTII-12
Brighthouse Funds Trust II
Frontier Mid Cap Growth Portfolio
Notes to Financial Statements—December 31, 2023
1. Organization
Brighthouse Funds Trust II (the “Trust”) is organized as a Delaware statutory trust and registered under the Investment Company Act of 1940, as amended (the “1940 Act”), as an open-end management investment company. The Trust, which is managed by Brighthouse Investment Advisers, LLC (“Brighthouse Investment Advisers” or the “Adviser”), currently offers twenty-nine series (the “Portfolios”), each of which operates as a distinct investment vehicle of the Trust. The series included in this report is Frontier Mid Cap Growth Portfolio (the “Portfolio”), which is diversified. Shares of the Portfolio are not offered directly to the general public and are currently available only to separate accounts of insurance companies, including insurance companies affiliated with the Adviser.
The Portfolio has registered and offers four classes of shares: Class A, B, D and E shares. Shares of each class of the Portfolio represent an equal pro rata interest in the Portfolio and generally give the shareholder the same voting, dividend, liquidation, and other rights. Investment income, realized and unrealized capital gains and losses, the common expenses of the Portfolio, and certain Portfolio-level expense reductions, if any, are allocated on a pro rata basis to each class based on the relative net assets of each class to the net assets of the Portfolio. Each class of shares differs in its respective distribution plan and such distribution expenses are allocated to the corresponding class of shares.
2. Significant Accounting Policies
The preparation of financial statements in conformity with accounting principles generally accepted in the United States of America (“GAAP”) requires management to make estimates and assumptions that affect the reported amounts of assets and liabilities and disclosure of contingent assets and liabilities as of the date of the financial statements and the reported amounts of income and expenses during the reporting period. Actual results could differ from those estimates. In the preparation of these financial statements, management has evaluated events and transactions subsequent to December 31, 2023 through the date the financial statements were issued.
The Portfolio is an investment company and follows the accounting and reporting guidance of the Financial Accounting Standards Board (“FASB”) Accounting Standards Codification Topic 946- Financial Services- Investment Companies. The following is a summary of significant accounting policies consistently followed by the Portfolio in the preparation of its financial statements.
Investment Valuation and Fair Value Measurements - The Portfolio values its investments for purposes of calculating its net asset value (“NAV”) using procedures that allow for a variety of methodologies to be used to value the Portfolio’s investments. The specific methodology used for an investment may vary based on the market data available for a specific investment at the time the Portfolio calculates its NAV or based on other considerations. The procedures also permit a level of judgment to be used in the valuation process.
Domestic and foreign equity securities, such as common stock, exchange-traded funds, rights, warrants, and preferred stock, that are traded on a securities exchange on a valuation date are generally valued at their last quoted sale price or official closing price on the primary exchange for such security, or, if no sales occurred on that day, at the last reported bid price. Equity securities traded over-the-counter (“OTC”) are generally valued at the last reported bid price. In the event of a major exchange closing during the trading day, the Adviser may use other market information obtained from quotation reporting systems, established market makers, or pricing services in valuing the securities. Valuation adjustments may be applied to certain foreign equity securities that are traded solely on foreign exchanges that close before the time as of which the Portfolio determines its NAV to account for the market movement between the close of the foreign exchanges and the time as of which the Portfolio determines its NAV. The Portfolio may use a systematic fair valuation model provided by a pricing service to value securities principally traded in these foreign markets to adjust for possible market movements or other changes that may occur between the close of the foreign exchanges and the time as of which the Portfolio determines its NAV. Foreign equity securities valued using these valuation adjustments are generally categorized as Level 2 within the fair value hierarchy. Equity securities that are actively traded, and have no valuation adjustments applied, are categorized as Level 1 within the fair value hierarchy. Other equity securities traded on inactive markets or valued in reference to similar instruments traded on active markets are generally categorized as Level 2 within the fair value hierarchy.
Investments in registered open-end management investment companies are valued at reported NAV per share on the valuation date and are categorized as Level 1 within the fair value hierarchy.
Debt securities, including corporate, convertible and municipal bonds and notes; obligations of the U.S. Treasury and U.S. government agencies; foreign sovereign issues; and non-U.S. bonds, are generally valued based upon evaluated or composite bid quotations obtained from third-party pricing services and/or brokers and dealers selected by the Adviser (each a “pricing service”). Such pricing services may use matrix pricing, which considers observable inputs including, among other things, issuer details, maturity dates, interest rates, yield curves, rates of prepayment, credit risks/spreads, default rates, reported trades, broker-dealer quotes and quoted prices for similar assets. Short-term obligations with a remaining maturity of sixty days or less may be valued at amortized cost in the absence of market quotes, so long as the amortized cost value of such short-term debt instrument is approximately the same as the fair
value of the instrument as determined without the use of amortized cost valuation. Floating rate loans are generally valued based upon
BHFTII-13
Brighthouse Funds Trust II
Frontier Mid Cap Growth Portfolio
Notes to Financial Statements—December 31, 2023—(Continued)
an evaluated or composite average of aggregate bid and ask quotations supplied by brokers or dealers, as obtained from the pricing service. Securities that use similar valuation techniques and inputs as described above are generally categorized as Level 2 within the fair value hierarchy.
Options, whether on securities, indices, futures contracts, or otherwise, traded on exchanges are valued at the last sale price available as of the close of business on a valuation day or, if there is no such price available, at the last reported bid price. These types of options are categorized as Level 1 within the fair value hierarchy. Futures contracts that are traded on commodity exchanges are valued at their settlement prices established by the exchanges on which they are traded as of the close of such exchanges and are categorized as Level 1 within the fair value hierarchy.
If no current market quotation is readily available or market value quotations are deemed to be unreliable for an investment, the fair value of the investment will be determined in accordance with procedures. A market quotation is readily available only when that quotation is a quoted price (unadjusted) in active markets for identical investments that the Portfolio can access at the measurement date, provided that a quotation will not be readily available if it is not reliable.
Pursuant to Rule 2a-5 under the 1940 Act, the Board of Trustees (the “Board” or “Trustees”) of the Trust has designated Brighthouse Investment Advisers, acting through its Valuation Committee (“Committee”), as the Portfolio’s “valuation designee” to perform the Portfolio’s fair value determinations. The Board oversees Brighthouse Investment Advisers in its role as the Valuation Designee and receives reports from Brighthouse Investment Advisers regarding its process and the valuation of the Portfolio’s investments to assist with such oversight.
No single standard for determining the fair value of an investment can be set forth because fair value depends upon the facts and circumstances with respect to each investment. Information relating to any relevant factors may be obtained by the Committee from any appropriate source, including the subadviser of the Portfolio, the Custodian, a pricing service, market maker and/or broker for such security or the issuer. Appropriate methodologies for determining fair value under particular circumstances may include: matrix pricing, a discounted cash flow analysis, comparisons of securities with comparable characteristics, value based on multiples of earnings, discount from market price of similar marketable securities, or a combination of these and other methods.
Foreign Currency Translation - The books and records of the Portfolio are maintained in U.S. dollars. The values of securities, currencies, and other assets and liabilities denominated in currencies other than the U.S. dollar are translated into U.S. dollars based upon foreign exchange rates prevailing at the end of the period. Purchases and sales of investment securities, income, and expenses are translated on the respective dates of such transactions. Because the values of investment securities are translated at the foreign exchange rates prevailing at the end of the period, that portion of the results of operations arising from changes in exchange rates and that portion of the results of operations reflecting fluctuations arising from changes in market prices of the investment securities are not separated. Such fluctuations are included in the net realized and unrealized gain or loss on investments.
Net realized foreign exchange gains or losses arise from activity in forward foreign currency exchange contracts, sales of foreign currency, currency gains or losses realized between the trade and settlement dates on securities transactions, and the difference between the amounts of dividends, interest, and foreign withholding taxes recorded by the Portfolio and the U.S. dollar-equivalent of the amounts actually received or paid by the Portfolio. Net unrealized foreign exchange gains and losses arise from changes in the value of assets and liabilities, other than investment securities, resulting from changes in foreign exchange rates.
Investment Transactions and Related Investment Income - Portfolio security transactions are recorded on the trade date. Dividend income is recorded on the ex-dividend date or, for certain foreign securities, when notified. Interest income, which includes amortization of premium and accretion of discount on debt securities, is recorded on the accrual basis. Realized gains and losses on investments are determined on the identified cost basis, which is the same basis used for federal income tax purposes. Foreign income and foreign capital gains on some foreign securities may be subject to foreign taxes, which are accrued as applicable. These foreign taxes have been provided for in accordance with the Portfolio’s understanding of the applicable countries’ tax rules and rates.
Dividends and Distributions to Shareholders - The Portfolio records dividends and distributions on the ex-dividend date. Net realized gains from securities transactions (if any) are generally distributed annually to shareholders. The timing and characterization of certain income and capital gains distributions are determined in accordance with federal tax regulations that may differ from GAAP. Permanent book and tax basis differences relating to shareholder distributions will result in reclassification between distributable earnings (accumulated losses) and paid in surplus. These adjustments have no impact on net assets or the results of operations.
Income Taxes - It is the Portfolio’s policy to comply with the requirements of the Internal Revenue Code of 1986, as amended, and regulations thereunder, applicable to regulated investment companies, and to distribute, with respect to each taxable year, all of its taxable income to shareholders. Therefore, no federal income tax provision is required. The Portfolio files U.S. federal tax returns. No income tax returns are currently under examination. The Portfolio’s federal tax returns remain subject to examination by the Internal Revenue Service for three fiscal years after the returns are filed. As of December 31, 2023, the Portfolio had no uncertain tax positions that would require financial statement recognition, derecognition or disclosure.
BHFTII-14
Brighthouse Funds Trust II
Frontier Mid Cap Growth Portfolio
Notes to Financial Statements—December 31, 2023—(Continued)
Repurchase Agreements - The Portfolio may enter into repurchase agreements, under the terms of a Master Repurchase Agreement (“MRA”), or Global Master Repurchase Agreement (“GMRA”), with selected commercial banks and broker-dealers, under which the Portfolio acquires securities as collateral and agrees to resell the securities at an agreed-upon time and at an agreed-upon price. The Portfolio, through the Custodian or a subcustodian, under a tri-party repurchase agreement, receives delivery of the underlying securities collateralizing any repurchase agreements. It is the Portfolio’s policy that the market value of the collateral be equal to at least 100% of the repurchase price in the case of a repurchase agreement of one-day duration and equal to at least 102% of the repurchase price in the case of all other repurchase agreements. In the event of default or failure by a party to perform an obligation in connection with any repurchase transaction, the MRA or GMRA gives the non-defaulting party the right to set-off claims and to apply property held by it in connection with any repurchase transaction against obligations owed to it under the agreement.
At December 31, 2023, the Portfolio had direct investments in repurchase agreements with a gross value of $6,921,298. Additionally, the Portfolio invested cash collateral for loans of portfolio securities in repurchase agreements with a gross value of $87,243,365. The combined value of all repurchase agreements is included as part of investments at value on the Statement of Assets and Liabilities. The value of the related collateral exceeded the value of the repurchase agreements at December 31, 2023.
Securities Lending - The Portfolio may lend its portfolio securities to certain qualified brokers who borrow securities in order to complete certain securities transactions. By lending its portfolio securities, the Portfolio attempts to increase its net investment income through the receipt of income on collateral held from securities on loan. Any gain or loss in the market price of the loaned securities that might occur, any interest earned, and any dividends declared during the term of the loan, would accrue to the account of the Portfolio.
The Trust has entered into a Non-Custodial Securities Lending Agreement with JPMorgan Chase Bank, N.A. (the “Lending Agent”). Under the agreement, the Lending Agent is authorized to loan portfolio securities on the Portfolio’s behalf. In exchange, the Portfolio generally receives cash, U.S. Government securities, letters of credit, or other collateral deemed appropriate by the Adviser. The Portfolio receives collateral equal to at least 102% of the market value for loans secured by government securities or cash in the same currency as the loaned shares and 105% for all other loaned securities at each loan’s inception. Collateral representing at least 100% of the market value of the loaned securities is maintained for the duration of the loan. Any cash collateral received by the Portfolio is generally invested by the Lending Agent in short-term investments, which may include certificates of deposit, commercial paper, repurchase agreements, including repurchase agreements with respect to equity securities, time deposits, master demand notes and money market funds. The market value of investments made with cash collateral received are disclosed in the Schedule of Investments and the valuation techniques are described in Note 2. The value of the securities on loan may change each business day. If the market value of the collateral at the close of trading on a business day is less than 100% of the market value of the loaned securities at the close of trading on that day, the borrower is required to deliver, by the close of business on the following business day, an additional amount of collateral, so that the total amount of posted collateral is equal to at least 100% of the market value of all the loaned securities as of such preceding day. A portion of the income earned on the collateral is rebated to the borrower of the securities and the remainder is split between the Lending Agent and the Portfolio. On loans collateralized by U.S. government securities, a fee is received from the borrower and is allocated between the Portfolio and the Lending Agent.
Income received by the Portfolio in securities lending transactions during the year ended December 31, 2023 is reflected as securities lending income on the Statement of Operations. The values of any securities loaned by the Portfolio and the related collateral at December 31, 2023 are disclosed in the footnotes to the Schedule of Investments. The value of the related collateral received by the Portfolio exceeded the value of the securities out on loan at December 31, 2023.
The risks associated with lending portfolio securities include, but are not limited to, possible delays in receiving additional collateral or in the recovery of the loaned securities, possible loss of rights in the collateral should the borrower fail financially, as well as risk of loss in the value of the collateral or the value of the investments made with the collateral. To the extent the Portfolio uses cash collateral it receives to invest in repurchase agreements with respect to equity securities, it is subject to the risk of loss if the value of the equity securities declines and the counterparty defaults on its obligation to repurchase such securities. The Lending Agent shall indemnify the Portfolio in the case of default of any securities borrower, subject to the terms of the Non-Custodial Securities Lending Agreement.
All securities on loan are classified as Common Stocks in the Portfolio’s Schedule of Investments as of December 31, 2023. For all securities on loan, the remaining contractual maturity of the agreements is overnight and continuous.
Directed Brokerage Agreement - The Trust has entered into a directed brokerage arrangement with Capital Institutional Services, Inc. (“CAPIS”). Under this arrangement, the Portfolio directs certain trades to CAPIS in return for a recapture credit. CAPIS issues a cash rebate to the Portfolio. Amounts paid to the Portfolio are shown separately as broker commission recapture on the Statement of Operations of the Portfolio. Additionally, these amounts have been excluded from the calculation of the net ratio of expenses to average net assets presented in the Financial Highlights for each share class.
BHFTII-15
Brighthouse Funds Trust II
Frontier Mid Cap Growth Portfolio
Notes to Financial Statements—December 31, 2023—(Continued)
3. Certain Risks
In the normal course of business, the Portfolio invests in securities and enters into transactions where risks exist. Those risks include:
Market Risk: The value of securities held by the Portfolio may decline in response to certain events, including those directly involving the issuers whose securities are owned by the Portfolio; conditions affecting the general economy; overall market changes; local, regional or global political, social or economic instability; currency, interest rate, and price fluctuations, or other factors including terrorism, war, natural disasters and the spread of infectious illness including epidemics or pandemics such as the COVID-19 pandemic. These events may also adversely affect the liquidity of securities held by the Portfolio.
Credit and Counterparty Risk: The Portfolio may be exposed to counterparty risk, or the risk that an entity with which the Portfolio has unsettled or open transactions may default. The potential loss could exceed the value of the financial assets and liabilities recorded in the financial statements. Financial assets that potentially expose the Portfolio to credit and counterparty risk consist principally of cash due from counterparties and investments. The Portfolio manages counterparty risk by entering into agreements only with counterparties that it believes have the financial resources to honor their obligations and by monitoring the financial stability of those counterparties. The Subadviser may attempt to mitigate counterparty risk by (i) periodically assessing the creditworthiness of its trading partners, (ii) monitoring and/or limiting the amount of its net exposure to each individual counterparty based on its assessment, and (iii) requiring collateral from the counterparty for certain transactions. In order to preserve certain safeguards for non-standard settlement trades, the Portfolio restricts its exposure to credit and counterparty losses by entering into master netting agreements (“Master Agreements”) with counterparties (approved brokers) with whom it undertakes a significant volume of transactions. Master Agreements govern the terms of certain transactions and reduce the counterparty risk associated with relevant transactions by specifying credit protection mechanisms and providing standardization that improves legal certainty. Master Agreements can also help limit counterparty risk by specifying collateral posting arrangements at pre-arranged exposure levels.
Repurchase and reverse repurchase agreements are primarily executed under GMRAs or MRAs, which provide the right to set-off. Each repurchase and reverse repurchase agreement is initially collateralized at the transaction level. In the event of default, the total market value exposure will be offset against collateral exchanged to date, which would result in a net receivable/(payable) that would be due from/to the counterparty.
Additional risks associated with each type of investment are described above within the respective security type notes. The Portfolio’s prospectus includes a discussion of the principal risks of investing in the Portfolio.
4. Investment Transactions
Aggregate cost of purchases and proceeds of sales of investment securities, excluding short-term securities, for the year ended December 31, 2023 were as follows:
| Purchases |
Sales | |||||||||||
| U.S. Government |
Non-U.S. Government | U.S. Government | Non-U.S. Government | |||||||||
| $ 0 | $ | 712,018,281 | $ | 0 | $ | 809,291,904 | ||||||
5. Investment Management Fees and Other Transactions with Affiliates
Investment Management Agreement - Brighthouse Investment Advisers is the investment adviser to the Portfolio. The Trust has entered into an investment management agreement with Brighthouse Investment Advisers with respect to the Portfolio. For providing investment management services to the Portfolio, Brighthouse Investment Advisers receives monthly compensation at the following annual rates:
|
Management |
% per annum | Average Daily Net Assets | ||||
| $7,313,988 | 0.750 | % | Of the first $500 million | |||
| 0.700 | % | Of the next $500 million | ||||
| 0.650 | % | On amounts in excess of $1 billion | ||||
BHFTII-16
Brighthouse Funds Trust II
Frontier Mid Cap Growth Portfolio
Notes to Financial Statements—December 31, 2023—(Continued)
Brighthouse Investment Advisers has entered into an investment subadvisory agreement with respect to managing the Portfolio. Frontier Capital Management Company, LLC is compensated by Brighthouse Investment Advisers to provide subadvisory services for the Portfolio.
Management Fee Waiver - Pursuant to a management fee waiver agreement, the Adviser has agreed, for the period May 1, 2023 to April 30, 2024, to reduce its advisory fees set out above under “Investment Management Agreement” for each class of the Portfolio as follows:
| % per annum reduction |
Average Daily Net Assets | |
| 0.100% | On the first $500 million | |
| 0.025% | Over $850 million and less than $1 billion | |
| (0.025)% | Over $1 billion and less than $1.15 billion |
An identical agreement was in place for the period April 29, 2022 to April 30, 2023. Amounts waived for the year ended December 31, 2023 are shown as a management fee waiver in the Statement of Operations.
Certain officers and trustees of the Trust may also be officers of the Adviser; however, such officers and trustees receive no compensation from the Trust.
Transfer Agency Agreement - Brighthouse Life Insurance Company serves as the transfer agent for the Trust. Brighthouse Life Insurance Company receives no fees for its services to the Trust.
Distribution and Service Fees - The Trust has a distribution agreement with Brighthouse Securities, LLC (the “Distributor”) pursuant to which the Distributor serves as the general distributor of shares of each class (each a “Class”) of each Portfolio. The Distributor is an affiliate of the Trust. The Trust has adopted a Distribution and Services Plan (the “D&S Plan”) relating to Class B, Class D, Class E, Class F and Class G shares of each Portfolio, under Rule 12b-1 under the 1940 Act, pursuant to which the Trust may pay the Distributor a fee (the “Service Fee”) at an annual rate not to exceed 0.25% of each such Portfolio’s average daily net assets attributable to the Class B, Class D, Class E, Class F and Class G shares of the Trust. Each Portfolio may not offer shares of each Class. The D&S Plan also authorizes the Trust, on behalf of each of its Portfolios, to pay to the Distributor a distribution fee (the “Distribution Fee” and together with the Service Fee, the “Fees”) at an annual rate of up to 0.25% of each Portfolio’s average daily net assets attributable to the Class B, Class D, Class E, Class F, and Class G shares in consideration of the services rendered in connection with the sale of such shares by the Distributor. Under the Distribution Agreement with respect to the Trust, Fees are currently paid at an annual rate of 0.25% of average daily net assets in the case of Class B shares, 0.10% of average daily net assets in the case of Class D shares, 0.15% of average daily net assets in the case of Class E shares, 0.20% of average daily net assets in the case of Class F shares and 0.30% of average daily net assets in the case of Class G shares. The D&S Plan is known as a “compensation plan” because the Trust makes payments to the Distributor for services rendered regardless of the actual level of expenditures by the Distributor. Amounts incurred by the Portfolio for the year ended December 31, 2023 are shown as Distribution and service fees in the Statement of Operations.
Deferred Trustee Compensation - Each Trustee who is not currently an employee of the Adviser or any of its affiliates receives compensation from the Trust for his or her service to the Trust. A deferred compensation plan (the “Plan”) is available to the Trustees on a voluntary basis. Deferred amounts remain in the Trust until distributed in accordance with the provisions of the Plan. The value of a participating Trustee’s deferral account is based on theoretical investments of deferred amounts on the normal payment dates in certain portfolios of the Trust or Brighthouse Funds Trust I, an affiliate of the Trust, as designated by the participating Trustee. Changes in the value of participants’ deferral accounts are reflected as a component of Trustees’ fees and expenses in the Statement of Operations. The portion of the accrued obligations allocated to the Portfolio under the Plan is reflected as Deferred trustees’ fees in the Statement of Assets and Liabilities.
6. Contractual Obligations
Under the Trust’s organizational documents, its officers and Trustees may be indemnified against certain liabilities and expenses arising out of the performance of their duties to the Trust. Additionally, the Trust has a variety of indemnification obligations under contracts with its service providers. The Trust’s maximum exposure under these arrangements is unknown, as this would involve future claims that may be made against the Trust that have not yet occurred.
BHFTII-17
Brighthouse Funds Trust II
Frontier Mid Cap Growth Portfolio
Notes to Financial Statements—December 31, 2023—(Continued)
7. Income Tax Information
The cost basis of investments for federal income tax purposes at December 31, 2023 was as follows:
| Cost basis of investments |
$ | 1,068,159,641 | ||
|
|
|
|||
| Gross unrealized appreciation |
172,394,233 | |||
| Gross unrealized (depreciation) |
(35,377,915 | ) | ||
|
|
|
|||
| Net unrealized appreciation (depreciation) |
$ | 137,016,318 | ||
|
|
|
The tax character of distributions paid for the years ended December 31, 2023 and 2022 were as follows:
| Ordinary Income |
Long-Term Capital Gain | Return of Capital | Total | |||||||||||||||||||||||||
| 2023 |
2022 | 2023 | 2022 | 2023 | 2022 | 2023 | 2022 | |||||||||||||||||||||
| $— | $ | 54,868,580 | $ | — | $ | 269,291,756 | $ | — | $ | 347,317 | $ | — | $ | 324,507,653 | ||||||||||||||
As of December 31, 2023, the components of distributable earnings (accumulated losses) on a federal income tax basis were as follows:
| Undistributed |
Undistributed Long-Term Capital Gain |
Net Unrealized Appreciation (Depreciation) |
Accumulated Capital Losses |
Total | ||||||||||||
| $2,213,750 | $ | — | $ | 137,016,318 | $ | (57,272,427 | ) | $ | 81,957,641 | |||||||
The Portfolio utilizes the provisions of the federal income tax laws that provide for the carryforward of capital losses for prior years, offsetting such losses against any future realized capital gains. Net capital losses may be carried forward indefinitely and their character is retained as short-term and/or long-term losses.
As of December 31, 2023, the Portfolio had accumulated short-term capital losses of $57,272,427.
8. Recent Accounting Pronouncement & Regulatory Updates
In June 2022, FASB issued Accounting Standards Update 2022-03—Fair Value Measurement (Topic 820)—Fair Value Measurement of Equity Securities Subject to Contractual Sale Restrictions (“ASU 2022-03”). ASU 2022-03 clarifies the guidance in Topic 820 to indicate that a contractual sale restriction should not be considered in the fair value of an equity security subject to such a restriction, and requires entities with investments in equity securities subject to contractual sale restrictions to disclose certain qualitative and quantitative information about such securities. ASU 2022-03 is effective for fiscal years, and interim periods within those fiscal years, beginning after December 15, 2023. ASU 2022-03 is only applicable to an equity security in which the contractual arrangement that restricts its sale is executed or modified on or after the adoption date.
Effective January 24, 2023, the Securities and Exchange Commission adopted rule and form amendments that require open-end management investment companies to transmit concise and visually engaging annual and semiannual reports to shareholders that highlight certain information deemed by the SEC to be particularly important for investors. Certain other information, including financial statements, will no longer appear in shareholder reports but will, as required, be available online, delivered free of charge upon request, and filed on a semiannual basis on Form N-CSR. The rule and form amendments have a compliance date of July 24, 2024. Accordingly, the rule and form amendments will not impact the Portfolio until its 2024 semiannual shareholder report.
BHFTII-18
Brighthouse Funds Trust II
Frontier Mid Cap Growth Portfolio
Report of Independent Registered Public Accounting Firm
To the Board of Trustees of Brighthouse Funds Trust II and Shareholders of the Frontier Mid Cap Growth Portfolio:
Opinion on the Financial Statements and Financial Highlights
We have audited the accompanying statement of assets and liabilities, including the schedule of investments, of the Frontier Mid Cap Growth Portfolio (the “Fund”) (one of the funds constituting the Brighthouse Funds Trust II), as of December 31, 2023, the related statement of operations for the year then ended, the statements of changes in net assets for each of the two years in the period then ended, the financial highlights for each of the five years in the period then ended, and the related notes. In our opinion, the financial statements and financial highlights present fairly, in all material respects, the financial position of the Fund as of December 31, 2023, and the results of its operations for the year then ended, the changes in its net assets for each of the two years in the period then ended, and the financial highlights for each of the five years in the period then ended in conformity with accounting principles generally accepted in the United States of America.
Basis for Opinion
These financial statements and financial highlights are the responsibility of the Fund’s management. Our responsibility is to express an opinion on the Fund’s financial statements and financial highlights based on our audits. We are a public accounting firm registered with the Public Company Accounting Oversight Board (United States) (PCAOB) and are required to be independent with respect to the Fund in accordance with the U.S. federal securities laws and the applicable rules and regulations of the Securities and Exchange Commission and the PCAOB.
We conducted our audits in accordance with the standards of the PCAOB. Those standards require that we plan and perform the audit to obtain reasonable assurance about whether the financial statements and financial highlights are free of material misstatement, whether due to error or fraud. The Fund is not required to have, nor were we engaged to perform, an audit of its internal control over financial reporting. As part of our audits we are required to obtain an understanding of internal control over financial reporting but not for the purpose of expressing an opinion on the effectiveness of the Fund’s internal control over financial reporting. Accordingly, we express no such opinion.
Our audits included performing procedures to assess the risks of material misstatement of the financial statements and financial highlights, whether due to error or fraud, and performing procedures that respond to those risks. Such procedures included examining, on a test basis, evidence regarding the amounts and disclosures in the financial statements and financial highlights. Our audits also included evaluating the accounting principles used and significant estimates made by management, as well as evaluating the overall presentation of the financial statements and financial highlights. Our procedures included confirmation of securities owned as of December 31, 2023, by correspondence with the custodian and brokers; when replies were not received from brokers, we performed other auditing procedures. We believe that our audits provide a reasonable basis for our opinion.
/s/ Deloitte & Touche LLP
Boston, Massachusetts
February 23, 2024
We have served as the auditor of one or more Brighthouse investment companies since 1983.
BHFTII-19
Brighthouse Funds Trust II
Trustees and Officers
MANAGEMENT OF THE TRUSTS
The Boards of Trustees (the “Board”) of Brighthouse Funds Trust I and Brighthouse Funds Trust II (“Trust I” and “Trust II”, respectively, and collectively the “Trusts”) supervise the Trusts and are responsible for representing the interests of shareholders. The Trustees, the Chairman of the Board and the Chairmen of each subcommittee are the same for both Trusts. The Trustees of each Trust meet periodically throughout the year to oversee the Portfolios’ activities, reviewing, among other things, each Portfolio’s performance and its contractual arrangements with various service providers. The Trustees of each Trust elect the officers of the Trust, who are responsible for administering the Trust’s day-to-day operations.
Trustees and Officers
The Trustees and executive officers of the Trusts, as well as their ages and their principal occupations during the past five years, are set forth below. Unless otherwise indicated, the business address of each is c/o Brighthouse Funds Trust I and Brighthouse Funds Trust II, 11225 N. Community House Rd., Charolette, North Carolina 28277. Each Trustee who is deemed an “interested person,” as such term is defined in the 1940 Act, is referred to as an “Interested Trustee.” Those Trustees who are not “interested persons,” as such term is defined in the 1940 Act, are referred to as “Independent Trustees.” There is no limit to the term a Trustee may serve, other than pursuant to the retirement policy adopted by the Independent Trustees. Trustees serve until their death, resignation, retirement or removal in accordance with Trust I’s and Trust II’s respective organizational documents and policies adopted by the Board of the Trust from time to time. Officers hold office at the pleasure of each Board and serve until their removal or resignation in accordance with the Trusts’ respective organizational documents and policies adopted by the Board of each Trust from time to time.
Trustees of the Trusts
| Name and Year of Birth |
Position(s) |
Term of Office |
Principal Occupation(s) During the Past |
Number of |
Other Directorships Held | |||||
| Interested Trustee | ||||||||||
| John Rosenthal* (1960) |
Trustee | Indefinite; From May 2016 (Trust I and Trust II) to present | Chief Investment Officer, Brighthouse Financial, Inc. (2016 to present). | 73 | None | |||||
| Independent Trustees | ||||||||||
| Dawn M. Vroegop (1966) |
Trustee and Chair of the Board | Indefinite; From December 2000 (Trust I)/May 2009 (Trust II) to present as Trustee; From May 2016 (Trust I and Trust II) until present as Chair | Retired; Private Investor. | 73 | Trustee, Driehaus Mutual Funds (8 portfolios).** | |||||
| Stephen M. Alderman (1959) |
Trustee | Indefinite; From December 2000 (Trust I)/April 2012 (Trust II) to present | Vice President and General Counsel, IHR Aerial Solutions, LLC; Until 2022, General Counsel, Illini Hi-Reach, Inc.; Until 2020, Shareholder in the law firm of Garfield & Merel, Ltd. | 73 | None | |||||
| Robert J. Boulware (1956) |
Trustee | Indefinite; From March 2008 (Trust I)/April 2012 (Trust II) to present | Managing Member, Pilgrim Funds, LLC (private equity fund). | 73 | Trustee, Vertical Capital Income Fund (closed-end fund);** Trustee, The Private Shares Fund (closed- end fund);** Until 2021, Director, Mid- Con Energy Partners, LP (energy);** Until 2020, Director, Gainsco, Inc. (auto insurance).** | |||||
BHFTII-20
Brighthouse Funds Trust II
Trustees and Officers—(Continued)
| Name and Year of Birth |
Position(s) |
Term of Office |
Principal Occupation(s) During the Past |
Number of |
Other Directorships Held | |||||
| Susan C. Gause (1952) |
Trustee | Indefinite; From March 2008 (Trust I)/April 2012 (Trust II) to present | Private Investor. | 73 | Trustee, HSBC Funds (4 portfolios).** | |||||
| Nancy Hawthorne (1951) |
Trustee | Indefinite; From May 2003 (Trust II)/April 2012 (Trust I) to present | Private Investor. | 73 | Trustee, First Eagle Credit Opportunities Fund;** Trustee and Chair of the Board of Trustees, First Eagle Global Opportunities Fund;** Director, Avid Technology, Inc;** Director, CRA International, Inc.** | |||||
Executive Officers of the Trusts
| Name and Year of Birth |
Position(s) |
Term of Office |
Principal Occupation(s) | |||
| Kristi Slavin (1973) | President and Chief Executive Officer, of Trust I and Trust II | From May 2016 (Trust I and Trust II) to present |
President, Brighthouse Investment Advisers, LLC (2016-present). | |||
| Alan R. Otis (1971) | Chief Financial Officer and Treasurer, of Trust I and Trust II | From November 2017 (Trust I and Trust II) to present |
Executive Vice President, Brighthouse Investment Advisers, LLC (2017-present); formerly, Vice President, Brighthouse Investment Advisers, LLC (2012-2017); Assistant Treasurer, Trust I and Trust II (2012-2017). | |||
| Thomas Watterson (1985) | Secretary, of Trust I and Trust II | From November 2023 (Trust I and Trust II) to present |
Executive Vice President, Chief Legal Officer and Secretary, Brighthouse Investment Advisers, LLC (2023-Present); Managing Corporate Counsel, Brighthouse Financial Inc. (2023-present); Managing Counsel and Director, The Bank of New York Mellon Corporation (2019-2023); Counsel and Vice President, The Bank of New York Mellon Corporation (2016-2019). | |||
| Katie Hellmann (1980) | Chief Compliance Officer (“CCO”), of Trust I and Trust II | From May 2023 (Trust I and Trust II) to present |
Chief Compliance Officer, Brighthouse Investment Advisers, LLC (2023-present) and Head of Funds and Investments Compliance (2023-present). Deputy Chief Compliance Officer, Transamerica Asset Management (2022-2023). Leader and Senior Compliance Counsel – Funds Compliance, Edward Jones (2017-2022). | |||
| Rosemary Morgan (1983) | Anti-Money Laundering Officer, of Trust I and Trust II | From May 2023 (Trust I and Trust II) to present |
Chief Privacy Officer, Leader of Compliance Programs and Assistant General Counsel, Brighthouse Financial, Inc. (2019-2022); Chief Privacy Officer, Head of Compliance Programs & Contracts Law, Brighthouse Financial, Inc. (2022-2023), Chief Compliance Officer and Associate General Counsel, Brighthouse Financial, Inc. (2023-present); Vice President and Chief Compliance Officer, Brighthouse Life Insurance Company (2023-present); Vice President and Chief Compliance Officer (2023-present), Brighthouse Life Insurance Company of NY; Vice President and Chief Compliance Officer (2023-present), New England Life Insurance Company. | |||
| Anna Koska (1981) | Vice President, of Trust I and Trust II | From June 2022 (Trust I and Trust II) to present |
Vice President, Investment and Advisory Services, Brighthouse Investment Advisers, LLC (2022-present); Director of Investment and Advisory Services, Brighthouse Investment Advisers, LLC (2019-2022); Senior Portfolio Analyst, Brighthouse Investment Advisers, LLC (2017-2019). | |||
| * | Mr. Rosenthal is an “interested person” of the Trusts because of his position with Brighthouse Financial, Inc. (“Brighthouse Financial”), an affiliate of BIA. |
| ** | Indicates a directorship with a registered investment company or a company subject to the reporting requirements of the Securities Exchange Act of 1934, as amended. |
| (1) | Previous positions during the past five years with the Trusts, MetLife, Inc. or the Adviser are omitted if not materially different. |
| (2) | The Fund Complex includes 44 Trust I Portfolios and 29 Trust II Portfolios. |
BHFTII-21
Brighthouse Funds Trust II
Frontier Mid Cap Growth Portfolio
Board of Trustees’ Consideration of Advisory and Sub-Advisory Agreements
At a meeting held on November 13-14, 2023 (the “November Meeting”), the Boards of Trustees (the “Board”) of Brighthouse Funds Trust I and Brighthouse Funds Trust II (“BFT I” and “BFT II,” respectively, and collectively, the “Trusts”), including a majority of the Trustees who are not “interested persons” of the Trusts (the “Independent Trustees”) under the Investment Company Act of 1940 (the “1940 Act”), approved the continuation of the Trusts’ advisory agreements (each an “Advisory Agreement”) with Brighthouse Investment Advisers, LLC (the “Adviser”) and the applicable sub-advisory and sub-sub-advisory agreements (each a “Sub-Advisory Agreement” and collectively with the Advisory Agreement, the “Agreements”) between the Adviser and the investment sub-advisers and sub-sub-adviser (each a “Sub-Adviser,” and collectively, the “Sub-Advisers”) for the series of the Trusts (each a “Portfolio,” and collectively, the “Portfolios”) for the annual contract renewal period from January 1, 2024 through December 31, 2024.
The Board met with personnel of the Adviser on September 28-29, 2023 (the “September Meeting”) for the specific purpose of giving preliminary consideration to the proposed continuation of the Agreements, including consideration to information that the Adviser and Sub-Advisers had provided for the Board’s review at the request of the Independent Trustees. At the September Meeting, the Adviser reviewed with the Board the performance and fees experienced by each Portfolio, as well as other information. During and after the September Meeting, the Independent Trustees requested additional information and clarifications that the Adviser addressed at the November Meeting (the September Meeting and the November Meeting are referred to collectively as, the “Meetings”). During the contract renewal process, and throughout the year, the Independent Trustees were advised by independent legal counsel, and they met with independent legal counsel in executive sessions outside of the presence of management on a number of occasions to discuss, among other things, the renewal of the Agreements.
In considering the continuation of the Agreements, the Board reviewed a variety of materials that were provided for the specific purpose of assisting the Board in the renewal process, along with various information and materials that were provided to and discussed with the Board throughout the year, at regularly scheduled meetings of the Board and its committees. In particular, information for each Portfolio included, but was not limited to, reports on investment performance, expenses, legal and compliance matters, and asset pricing. Information about the Adviser and each Sub-Adviser included, but was not limited to, reports on the business, operations, and performance of the Adviser and the Sub-Advisers and reports that the Adviser and Sub-Advisers had prepared specifically for the renewal process.
In considering the continuation of the Agreements, the Board also reviewed, among other things, a report for each Portfolio that was prepared by Broadridge (“Broadridge”), an independent organization, which set forth comparative performance and expense information for each Portfolio. In addition, the Independent Trustees reviewed a report that was prepared by JDL Consultants, LLC (“JDL”), an independent consultant to the Independent Trustees, which examined the Broadridge reports for each Portfolio (“JDL Report”). The Independent Trustees met in executive session with representatives of JDL during the September Meeting to review the JDL Report.
At the November Meeting, the Board, including a majority of the Independent Trustees, concluded that the nature, extent, and quality of services provided by the Adviser and each Sub-Adviser supported the renewal of the Agreements. The Board also concluded that the investment services provided to and the performance of each Portfolio was such that each Agreement should continue, and that the fees paid by each Portfolio to the Adviser appeared to be reasonable in light of the nature, extent, and quality of the services provided by the Adviser and each Sub-Adviser. Further, the Board concluded that the Adviser’s profitability in providing services under the Advisory Agreements did not appear unreasonable in light of the nature, extent, and quality of the services provided by the Adviser. The Board reviewed the extent to which the investment advisory fees paid by the Portfolios shared economies of scale with investors or entailed the potential to share economies of scale with investors and concluded that those considerations generally supported the renewal of each Agreement. Finally, the Board considered the Adviser’s recommendation that it approve the renewal of each Sub-Advisory Agreement.
In approving the continuation of each Agreement, the Board, including the Independent Trustees, gave attention to all of the information that was furnished, and each Trustee placed varying degrees of importance on the various pieces of information that were provided to them. The Board evaluated the information provided to it on a Portfolio-by-Portfolio basis, and its decision was made separately with respect to each Portfolio. The following paragraphs provide more information about some of the primary factors that were relevant to the Board’s decisions. The Board did not identify any single factor as determinative, and the Trustees generally attributed different weights to various factors for the various Portfolios.
Nature, extent and quality of services. The Board evaluated the nature, extent, and quality of the services that the Adviser and the Sub-Advisers, as relevant, provided to the Portfolios. The Board considered the Adviser’s services as investment manager to the Portfolios, including its services relating to the hiring and oversight of the Sub-Advisers and, in particular, their investment programs
BHFTII-22
Brighthouse Funds Trust II
Frontier Mid Cap Growth Portfolio
Board of Trustees’ Consideration of Advisory and Sub-Advisory Agreements—(Continued)
and personnel, succession management of key personnel, trading practices, compliance programs and personnel, and risk management programs, among other things. The Adviser’s services in coordinating and overseeing the activities of the Trusts’ other service providers were also considered. The Board also considered the systems and processes required by the Adviser to meet additional regulatory and compliance requirements resulting from U.S. Securities and Exchange Commission and other regulatory initiatives, including related to liquidity, valuation, and derivatives risk management. The Board considered information received from the Trusts’ Chief Compliance Officer regarding the Portfolios’ compliance policies and procedures that were established pursuant to Rule 38a-l under the 1940 Act, and relevant aspects of the Adviser’s and Sub-Advisers’ compliance policies and procedures. The Board also noted that it was the practice of the Adviser’s investment, compliance, and legal staff to conduct periodic meetings (through various media) with the Sub-Advisers throughout the year in order to review and assess the services that are provided to the Portfolios, and that personnel of the Adviser routinely prepare and present reports to the Board regarding those meetings. In addition, during the Meetings and throughout the year, the Board considered the expertise, experience, and performance of the personnel of the Adviser who performed the various services that are mentioned above.
With respect to the services provided by each of the Sub-Advisers, the Board considered a variety of information that the Adviser and each Sub-Adviser prepared for the Board’s review. The Board considered each Sub-Adviser’s investment process, each Sub-Adviser’s overall organization and business plans and the investment performance experienced by the Portfolio (as described in more detail below). The Board took into account that each Sub-Adviser’s responsibilities include, among other things, the development and maintenance of an investment program for the applicable Portfolio, the selection of investments and the placement of orders for the purchase and sale of such assets, and the implementation of compliance controls related to the performance of these services. The Board considered, based on the information provided, each Sub-Adviser’s staffing with respect to the management of the Portfolio and other information relating to the Sub-Adviser’s business and operations. The Board also considered the Sub-Adviser’s overall resources and information with respect to any recent turnover of key personnel at the Sub-Adviser. The Board reviewed each Sub-Adviser’s investment experience, as well as information provided regarding the Sub-Adviser’s personnel who provide services to the Portfolios. The Board also considered, among other things, information about each Sub-Adviser’s compliance program, including regarding any compliance matters involving a Sub-Adviser that had been brought to the Board’s attention during the year, as well as the Adviser’s assessment of the financial condition of each Sub-Adviser.
Performance. The Board placed emphasis on the performance of each Portfolio in the context of the performance of the relevant markets in which the Portfolio invests. The Board considered the Adviser’s quarterly presentations to the Board of detailed information about each Portfolio’s investment strategies and performance results and composition, including discussions regarding the relevant effects of market conditions. The Board reviewed and considered the reports prepared by Broadridge, which provided a statistical analysis comparing each Portfolio’s investment performance to that of comparable funds underlying variable insurance products (the “Performance Universe”), and the JDL Report. The Board also compared the performance of each Portfolio to that of comparable funds and other accounts that were managed by the relevant Sub-Adviser, to the extent such information was provided. The Board considered each Portfolio’s performance for periods subsequent to the performance period covered by the Broadridge reports and considered the Adviser’s assessment of the same. The Board also noted that while it found the data provided by Broadridge generally useful, it recognized the limitations of such data, including, in particular, that notable differences may exist between a Portfolio and the other funds in a Broadridge category (for example, with respect to investment strategies) and that the results of the performance comparisons may vary depending on (i) the end dates for the performance periods that were selected and (ii) the selection of the peer groups.
The Board focused particular attention on Portfolios with less favorable performance records. The Board noted the Adviser’s focus on each Sub-Adviser’s performance and that the Adviser had been active in monitoring and responding to any performance issues with respect to the Portfolios.
Fees and Expenses. The Board gave consideration to the level and method of computing the fees payable under the Agreements. The Board reviewed and considered the information in the JDL Report concerning fees and expenses. The Board also reviewed and considered the Broadridge report for each Portfolio, which included various comparisons of the Portfolio’s fees (at December 31, 2022 and various asset levels) and expenses with those of its peers, including, as applicable, a broad group of peer funds (“Expense Universe”), a narrower group of peer funds (“Expense Group”), a broad group of peer sub-advised funds (“Sub-advised Expense Universe”), and a narrower group of peer sub-advised funds (“Sub-advised Expense Group”). In particular, the Board reviewed comparisons of each Portfolio’s contractual management fees with its Expense Group and Sub-advised Expense Universe, contractual sub-adviser fees with its Sub-advised Expense Universe and Sub-advised Expense Group, and total expenses with its Expense Universe, Expense Group and Sub-advised Expense Universe. The Board considered that Broadridge selected the peer funds, which were funds underlying variable insurance products that Broadridge deemed to be comparable to the Portfolios. The Board considered that the fee
BHFTII-23
Brighthouse Funds Trust II
Frontier Mid Cap Growth Portfolio
Board of Trustees’ Consideration of Advisory and Sub-Advisory Agreements—(Continued)
and expense information in the Broadridge report for each Portfolio reflected information as of the Portfolio’s most recent fiscal year end at the time the Broadridge report was issued and that historical asset levels may differ from current asset levels, particularly in a period of market volatility. In addition, the Board compared the fee payable to a Sub-Adviser by the Adviser with respect to the Portfolio to the fee payable to the Sub-Adviser by other comparable funds and other accounts, to the extent such information was provided.
The Board noted that the sub-advisory fees for the Portfolios are negotiated at arm’s length by the Adviser and are paid by the Adviser out of its advisory fees. The Board also considered that the Adviser had entered into expense limitation or management fee waiver agreements with certain of the Portfolios pursuant to which the Adviser had agreed to waive a portion of its advisory fee and/or reimburse certain expenses as a means of limiting a Portfolio’s total annual operating expenses or passing through the benefit of a subadvisory fee concession to a Portfolio, as applicable.
Profitability. The Board examined the profitability to the Adviser of each Advisory Agreement, on a Portfolio-by-Portfolio basis. The Board also considered that an affiliate of the Adviser, Brighthouse Securities, LLC, serves as distributor for the Trusts, and, as such, receives Rule 12b-1 payments to support the distribution of the Portfolios. The Board considered the profitability to the Sub-Advisers and their affiliates of their relationships with the Portfolios, to the extent provided, and the Board considered the ability of the Adviser to negotiate with a Sub-Adviser at arm’s length. In reviewing the profitability information, the Board recognized that expense allocation methodologies are inherently subjective and various methodologies may be reasonable while producing different results.
Economies of scale. The Board considered each Portfolio’s fees in light of its size. The Board noted the fee schedules for the Portfolios that contain breakpoints that reduce the fee rate above specified asset levels, including breakpoints in the Advisory Agreements and any corresponding Sub-Advisory Agreement. The Board noted those Portfolios that did not have breakpoints in their advisory fees and considered management’s explanation of the same.
The Board considered the effective fees under the Advisory Agreement and Sub-Advisory Agreement for each Portfolio as a percentage of assets at different asset levels and possible economies of scale that may be realized if the assets of the Portfolio grow. The Board examined, among other data, the effect of a Portfolio’s growth in size, and reduction in size, on various fee schedules. The Board also generally noted that if a Portfolio’s assets increase over time, the Portfolio may realize economies of scale if assets increase proportionally more than certain other expenses.
Other factors. The Board considered other benefits that may be realized by the Adviser and its affiliates from their relationships with the Trusts. Among the benefits realized by the Adviser, the Board recognized that Brighthouse Securities, LLC, as the distributor for the Trusts, receives payments pursuant to Rule 12b-1 from the Portfolios to help compensate for the provision of shareholder services and distribution activities. The Board considered that a Sub-Adviser may engage in soft dollar transactions in managing a Portfolio. In addition, the Board considered that a Sub-Adviser may be affiliated with registered broker-dealers that may, from time to time, receive brokerage commissions from a Portfolio in connection with the sale of portfolio securities (subject to applicable best execution obligations). The Board also considered that a Sub-Adviser and its affiliates could benefit from the opportunity to provide advisory services to additional portfolios of the Trusts and overall reputational benefits.
The Board considered information from the Adviser and Sub-Advisers pertaining to potential conflicts of interest, and the manner in which any potential conflicts were mitigated. In its review, the Board considered information regarding various business relationships among the Adviser and its affiliates and various Sub-Advisers and their affiliates. The Board also considered information about services and/or payments provided to the Adviser by the Sub-Advisers in connection with marketing activities. The Board considered representations from the Adviser that such business relationships and any payments were not considered in the Adviser’s recommendation to renew any of the Sub-Advisory Agreements.
* * * * *
Frontier Mid Cap Growth Portfolio. The Board also considered the following information in relation to the Agreements with the Adviser and Frontier Capital Management Company, LLC regarding the Portfolio:
Among other data relating specifically to the Portfolio’s performance, the Board considered that the Portfolio performed equal to the median of its Performance Universe for the one-year period ended June 30, 2023 and underperformed the median of its Performance Universe for the three-and five-year periods ended June 30, 2023. The Board also considered that the Portfolio outperformed the average of its Morningstar Category for the one-and three-year periods ended June 30, 2023 and underperformed the average of its Morningstar Category for the five-year period ended June 30, 2023. The Board further considered that the Portfolio underperformed its benchmark, the Russell Midcap Growth Index, for the one-, three-, and five-year periods ended October 31, 2023. The Board took into
BHFTII-24
Brighthouse Funds Trust II
Frontier Mid Cap Growth Portfolio
Board of Trustees’ Consideration of Advisory and Sub-Advisory Agreements—(Continued)
account management’s discussion of the Portfolio’s performance, including with respect to prevailing market conditions. The Board also noted the presence of certain management fee waivers in effect for the Portfolio.
The Board also considered that the Portfolio’s actual management fees and total expenses (exclusive of 12b-1 fees) were below the Expense Group median, the Expense Universe median, and the Sub-advised Expense Universe median. The Board noted that the Portfolio’s contractual management fees were below the asset-weighted average of the Investment Classification/Morningstar Category selected by Broadridge at the Portfolio’s current size. The Board also noted that the Portfolio’s contractual sub-advisory fees were below the averages of the Sub-advised Expense Universe and the Sub-advised Expense Group at the Portfolio’s current size.
BHFTII-25
Brighthouse Funds Trust II
Jennison Growth Portfolio
Managed by Jennison Associates LLC
Portfolio Manager Commentary*
PERFORMANCE
For the twelve months ended December 31, 2023, the Class A, B and E shares of the Jennison Growth Portfolio returned 53.26%, 52.86%, and 53.11%, respectively. The Portfolio’s benchmark, the Russell 1000 Growth Index¹, returned 42.68%.
MARKET ENVIRONMENT / CONDITIONS
Equities rose strongly in 2023, led by gains in growth stocks, especially technology companies. The past year was dominated by the U.S. Federal Reserve’s (the “Fed”) historic campaign of interest rate hikes. The success of this effort to lower inflation, along with clearing of the supply chain, resilient consumer spending, and most importantly healthy earnings, helped drive market performance.
Throughout 2023, many investors anticipated a significantly greater economic slowdown and possible recession that, ultimately, failed to transpire. The Fed’s expeditious steps following the failure of three major U.S. banks in March provided stability and calm, resulting in a remarkably short-lived period of unease. The ongoing war in Ukraine and the tragedy in Israel and resulting conflict in Gaza have not led to the typical reaction in energy markets. Indeed, the price of energy has declined since October, in-line with reduced demand trends and abundant supply.
Volatility in capital markets reflected economic and geopolitical realities in different ways throughout the year. The federal funds target rate, which started the year at a range of 4.25% to 4.50%, reached a peak of 5.25% to 5.50% in July and remained at that level through year-end. Meanwhile, the 10-year U.S. Treasury yield peaked at just under 5.00% in late October before declining back to where it began the year, at roughly 3.80%, to close out 2023. Markets rallied in December after the Fed stated inflation had cooled and additional rate increases appeared unnecessary.
The grudging pace of the U.S. economic slowdown might be the biggest surprise of the year. Consumer resiliency in the face of geopolitical and macroeconomic turbulence was the primary reason, reflecting low unemployment, balance sheet strength, and rising financial asset prices. Uncertainty about the economy’s ability to avoid a recession remains a focus entering 2024. As of year-end, the easing pace of inflation, along with lower borrowing costs, are new tailwinds to activity. Wage rates, one of the last contrary indicators, are no longer rising and, in some cases, entry level pay is now below the pandemic peak. Finally, corporate profits broadly have favorably weathered the post pandemic period despite the demand pull forward and supply chain disruptions.
PORTFOLIO REVIEW / PERIOD END POSITIONING
The Portfolio outperformed its benchmark, the Russell 1000 Growth Index (the “Index”), during the reporting period, driven by stock selection in the Information Technology (“IT”), Consumer Staples, and Industrials sectors.
In 2022, recognizing a rise in inflation and discount rates, and a commensurate decline in risk tolerance, we reduced or eliminated positions in companies with minimal free cash flows and very high valuations, as well as in companies that benefited disproportionately from pandemic demand. At the same time, we maintained investments in companies that we believed had strong fundamentals. In 2023, many of these stocks posted strong returns for the Portfolio. This price appreciation benefited from the depressed nature of valuations at the start of the year as well as from early indications that near- and medium-term revenue and profit expectations for numerous companies were beginning to improve.
Early in the year, we added to our already significant position in Nvidia. Key to our thesis has been that the data center was still very early in the adoption of accelerated compute, a market that Nvidia dominates. This thesis was borne out in the past year as a broadening set of consumer internet customers adopted Nvidia platforms for large language models (“LLMs”), recommendation systems, and generative artificial intelligence (“AI”). Nvidia’s graphics processing units have become essential for the training of LLMs as well as for the inferencing abilities that the models, once trained, can deliver.
Several other technology and internet holdings contributed to the Portfolio’s strong relative performance. Many of these companies were boosted by prospects from generative AI, such as Adobe, which launched four new generative AI products, and Meta Platforms, which outlined its broader generative AI strategy that should in our view help sustain engagement growth and new monetization opportunities. Other technology companies benefited from the rising demand for cybersecurity, such as CrowdStrike. Broadcom was another strong contributor as demand for their connectivity products covers multiple facets of technology, including data centers, mobile, AI, cybersecurity, and gaming.
Positions outside of technology also added to relative returns. Uber continued to enjoy accelerating bookings as well as growth in both mobility and delivery. Salesforce demonstrated strength across Mulesoft, Sales Cloud, Service Cloud, and multi-cloud deals, despite a murky economic backdrop. MercadoLibre (Uruguay) reported strong quarterly results that exceeded expectations, with all key geographies demonstrating stronger growth.
Relative performance was negatively impacted by Adyen (Netherlands), which was sold on a significant slowdown in growth in the increasingly competitive U.S. market for omnichannel payments solutions. Another detractor was Danaher, due to higher-than-normal customer inventory levels, lower levels of demand post COVID-19, and the resulting lower expected revenue and profit growth rates. The position was eliminated from the Portfolio. LVMH’s (France) results were somewhat disappointing, driven by foreign exchange factors and weak performance in wine and spirits, especially in the U.S.
BHFTII-1
Brighthouse Funds Trust II
Jennison Growth Portfolio
Managed by Jennison Associates LLC
Portfolio Manager Commentary*—(Continued)
Additionally, Microsoft outperformed the Index during the period, gaining market share across multiple product categories and benefiting from its AI positioning. The stock represented more than 10% of the Index at year-end. While it remains a top position in the Portfolio, reflecting our high conviction, we were underweight for diversification purposes. This position was a drag on relative performance during the period.
The Portfolio was built to seek to incorporate secular growth opportunities that drive earnings and revenue increases ahead of the Index over a long-term investment time horizon. At the same time, a greater portion of this potential is now reflected in higher levels of valuation following 2023. Recognizing this, we made modest adjustments to the size of some of our larger holdings following strong gains in November and December. At year-end, the Portfolio was overweight Consumer Discretionary and underweight IT relative to the Index.
Kathleen A. McCarragher
Michael A. Del Balso
Blair A. Boyer
Natasha Kuhlkin
Portfolio Managers
Jennison Associates LLC
* This commentary may include statements that constitute “forward-looking statements” under the U.S. securities laws. Forward-looking statements include, among other things, projections, estimates, and information about possible or future results related to the Portfolio, market or regulatory developments. The views expressed above are not guarantees of future performance or economic results and involve certain risks, uncertainties and assumptions that could cause actual outcomes and results to differ materially from the views expressed herein. The views expressed above are subject to change at any time based upon economic, market, or other conditions and the subadvisory firm undertakes no obligation to update the views expressed herein. Any discussions of specific securities should not be considered a recommendation to buy or sell those securities. The views expressed above (including any forward-looking statement) may not be relied upon as investment advice or as an indication of the Portfolio’s trading intent. Information about the Portfolio’s holdings, asset allocation or country diversification is historical and is not an indication of future Portfolio composition, which may vary. Direct investment in any index is not possible. The performance of any index mentioned in this commentary has not been adjusted for ongoing management, distribution and operating expenses, and sales charges applicable to mutual fund investments. In addition, the returns do not reflect additional fees charged by separate accounts or variable insurance contracts that an investor in the Portfolio may pay. If these additional fees were reflected, performance would have been lower.
¹ The Russell 1000 Growth Index is an unmanaged measure of performance of the largest capitalized U.S. companies, within the Russell 1000 companies, that have higher price-to-book ratios and forecasted growth values.
BHFTII-2
Brighthouse Funds Trust II
Jennison Growth Portfolio
A $10,000 INVESTMENT COMPARED TO THE RUSSELL 1000 GROWTH INDEX
AVERAGE ANNUAL RETURNS (%) FOR THE YEAR ENDED DECEMBER 31, 2023
| 1 Year | 5 Year | 10 Year | ||||||||||
| Jennison Growth Portfolio | ||||||||||||
| Class A |
53.26 | 17.98 | 14.32 | |||||||||
| Class B |
52.86 | 17.69 | 14.03 | |||||||||
| Class E |
53.11 | 17.81 | 14.15 | |||||||||
| Russell 1000 Growth Index | 42.68 | 19.50 | 14.86 | |||||||||
Portfolio performance is calculated including reinvestment of all income and capital gain distributions. Performance numbers are net of all Portfolio expenses but do not include any insurance, sales, separate account or administrative charges of variable annuity or life insurance contracts or any additional expenses that participants may bear relating to the operations of their plans. If these charges were included, the returns would be lower. The performance of any index referenced above has not been adjusted for ongoing management, distribution and operating expenses, and sales charges applicable to mutual fund investments. Direct investment in any index is not possible. The performance of Class A shares, as set forth in the line graph above, will differ from that of other classes because of the difference in expenses paid by policyholders investing in the different share classes.
This information represents past performance and is not indicative of future results. Investment return and principal value may fluctuate so that shares, upon redemption, may be worth more or less than the original cost.
PORTFOLIO COMPOSITION AS OF DECEMBER 31, 2023
|
Top Holdings
|
||||
| % of Net Assets |
||||
| Microsoft Corp. | 8.3 | |||
| Amazon.com, Inc. | 7.8 | |||
| NVIDIA Corp. | 6.1 | |||
| Apple, Inc. | 4.8 | |||
| Tesla, Inc. | 3.9 | |||
| Advanced Micro Devices, Inc. | 3.8 | |||
| Meta Platforms, Inc. - Class A | 3.6 | |||
| Eli Lilly & Co. | 3.4 | |||
| Visa, Inc. - Class A | 3.0 | |||
| Broadcom, Inc. | 2.9 | |||
|
Top Sectors
|
||||
| % of Net Assets |
||||
| Information Technology | 39.8 | |||
| Consumer Discretionary | 23.8 | |||
| Communication Services | 11.3 | |||
| Health Care | 10.9 | |||
| Financials | 6.7 | |||
| Consumer Staples | 3.2 | |||
| Industrials | 2.8 | |||
| Real Estate | 1.1 | |||
BHFTII-3
Brighthouse Funds Trust II
Jennison Growth Portfolio
Understanding Your Portfolio’s Expenses
Shareholder Expense Example
As a shareholder of the Portfolio, you incur ongoing costs, including management fees; distribution and service (12b-1) fees; and other Portfolio expenses. This example is intended to help you understand your ongoing costs (in dollars) (referred to as “expenses”) of investing in the Portfolio and compare these costs with the ongoing costs of investing in other mutual funds. The example is based on an investment of $1,000 invested at the beginning of the period and held for the entire period, July 1, 2023 through December 31, 2023.
Actual Expenses
The first line for each share class of the Portfolio in the table below provides information about actual account values and actual expenses. You may use the information in this line, together with the amount you invested in the particular share class of the Portfolio, to estimate the expenses that you paid over the period. Simply divide your account value by $1,000 (for example, an $8,600 account value divided by $1,000 = 8.6), then multiply the result by the number in the first line under the heading entitled “Expenses Paid During Period” to estimate the expenses you paid on your account during this period.
Hypothetical Example for Comparison Purposes
The second line for each share class of the Portfolio in the table below provides information about hypothetical account values and hypothetical expenses based on the Portfolio’s actual expense ratio and an assumed rate of return of 5% per year before expenses, which is not the Portfolio’s actual return. The hypothetical account values and expenses may not be used to estimate the actual ending account balance or expenses you paid for the period. You may use this information to compare the ongoing costs of investing in the Portfolio and other funds. To do so, compare this 5% hypothetical example with the 5% hypothetical examples that appear in the shareholder reports of the other funds.
Please note that the expenses shown in the table are meant to highlight your ongoing costs only and do not reflect any fees or charges of your variable insurance product or any additional expenses that participants in certain eligible qualified plans may bear relating to the operations of their plan. Therefore, the second line for each share class in the table is useful in comparing ongoing costs only, and will not help you determine the relative total costs of owning different funds. In addition, if these other costs were included, your costs would have been higher.
|
|
Annualized Expense Ratio |
Beginning Account Value July 1, 2023 |
Ending Account Value December 31, 2023 |
Expenses Paid During Period** July 1, 2023 to December 31, 2023 |
||||||||||||||
| Class A (a) |
Actual | 0.55 | % | $ | 1,000.00 | $ | 1,123.00 | $ | 2.94 | |||||||||
| Hypothetical* | 0.55 | % | $ | 1,000.00 | $ | 1,022.43 | $ | 2.80 | ||||||||||
| Class B (a) |
Actual | 0.80 | % | $ | 1,000.00 | $ | 1,121.00 | $ | 4.28 | |||||||||
| Hypothetical* | 0.80 | % | $ | 1,000.00 | $ | 1,021.17 | $ | 4.08 | ||||||||||
| Class E (a) |
Actual | 0.70 | % | $ | 1,000.00 | $ | 1,121.70 | $ | 3.74 | |||||||||
| Hypothetical* | 0.70 | % | $ | 1,000.00 | $ | 1,021.68 | $ | 3.57 | ||||||||||
| * | Hypothetical assumes a rate of return of 5% per year before expenses. |
| ** | Expenses paid are equal to the Portfolio’s annualized expense ratio for the most recent six month period, as shown above, multiplied by the average account value over the period, multiplied by the number of days (184 days) in the most recent fiscal half-year, divided by 365 (to reflect the one-half year period). |
| (a) | The annualized expense ratio shown reflects the impact of the management fee waiver as described in Note 5 of the Notes to Financial Statements. |
BHFTII-4
Brighthouse Funds Trust II
Jennison Growth Portfolio
Schedule of Investments as of December 31, 2023
Common Stocks—99.2% of Net Assets
| Security Description | Shares | Value | ||||||
| Aerospace & Defense—1.0% | ||||||||
| Boeing Co. (a) |
102,856 | $ | 26,810,445 | |||||
|
|
|
|||||||
| Automobile Components—0.3% | ||||||||
| Mobileye Global, Inc. - Class A (a) (b) |
175,568 | 7,605,606 | ||||||
|
|
|
|||||||
| Automobiles—3.9% | ||||||||
| Tesla, Inc. (a) |
414,350 | 102,957,688 | ||||||
|
|
|
|||||||
| Biotechnology—1.3% | ||||||||
| Vertex Pharmaceuticals, Inc. (a) |
88,122 | 35,855,961 | ||||||
|
|
|
|||||||
| Broadline Retail—10.0% | ||||||||
| Amazon.com, Inc. (a) |
1,375,125 | 208,936,493 | ||||||
| MercadoLibre, Inc. (a) |
36,110 | 56,748,309 | ||||||
|
|
|
|||||||
| 265,684,802 | ||||||||
|
|
|
|||||||
| Capital Markets—1.0% | ||||||||
| Goldman Sachs Group, Inc. |
37,398 | 14,427,027 | ||||||
| Moody’s Corp. (b) |
30,340 | 11,849,590 | ||||||
|
|
|
|||||||
| 26,276,617 | ||||||||
|
|
|
|||||||
| Consumer Staples Distribution & Retail—2.2% | ||||||||
| Costco Wholesale Corp. (b) |
87,077 | 57,477,786 | ||||||
|
|
|
|||||||
| Electronic Equipment, Instruments & Components—0.5% | ||||||||
| Keysight Technologies, Inc. (a) |
84,327 | 13,415,582 | ||||||
|
|
|
|||||||
| Entertainment—2.2% | ||||||||
| Netflix, Inc. (a) |
118,088 | 57,494,686 | ||||||
|
|
|
|||||||
| Financial Services—5.7% | ||||||||
| Mastercard, Inc. - Class A |
172,995 | 73,784,098 | ||||||
| Visa, Inc. - Class A (b) |
305,024 | 79,412,998 | ||||||
|
|
|
|||||||
| 153,197,096 | ||||||||
|
|
|
|||||||
| Ground Transportation—1.8% | ||||||||
| Uber Technologies, Inc. (a) |
785,304 | 48,351,167 | ||||||
|
|
|
|||||||
| Health Care Equipment & Supplies—1.3% | ||||||||
| Intuitive Surgical, Inc. (a) |
103,639 | 34,963,653 | ||||||
|
|
|
|||||||
| Health Care Providers & Services—1.7% | ||||||||
| UnitedHealth Group, Inc. |
86,516 | 45,548,079 | ||||||
|
|
|
|||||||
| Hotels, Restaurants & Leisure—2.3% | ||||||||
| Airbnb, Inc. - Class A (a) |
127,036 | 17,294,681 | ||||||
| Chipotle Mexican Grill, Inc. (a) |
7,093 | 16,221,407 | ||||||
| Marriott International, Inc. - Class A |
120,911 | 27,266,640 | ||||||
|
|
|
|||||||
| 60,782,728 | ||||||||
|
|
|
|||||||
| Interactive Media & Services—8.4% | ||||||||
| Alphabet, Inc. - Class A (a) |
457,539 | 63,913,623 | ||||||
| Alphabet, Inc. - Class C (a) |
455,085 | 64,135,129 | ||||||
| Interactive Media & Services—(Continued) | ||||||||
| Meta Platforms, Inc. - Class A (a) |
272,105 | $ | 96,314,286 | |||||
|
|
|
|||||||
| 224,363,038 | ||||||||
|
|
|
|||||||
| IT Services—2.3% | ||||||||
| MongoDB, Inc. (a) (b) |
75,586 | 30,903,336 | ||||||
| Snowflake, Inc. - Class A (a) |
153,579 | 30,562,221 | ||||||
|
|
|
|||||||
| 61,465,557 | ||||||||
|
|
|
|||||||
| Media—0.7% | ||||||||
| Trade Desk, Inc. - Class A (a) (b) |
276,497 | 19,896,724 | ||||||
|
|
|
|||||||
| Personal Care Products—1.1% | ||||||||
| L’Oreal SA |
58,606 | 29,139,231 | ||||||
|
|
|
|||||||
| Pharmaceuticals—6.5% | ||||||||
| AstraZeneca PLC (ADR) |
438,720 | 29,547,792 | ||||||
| Eli Lilly & Co. |
157,056 | 91,551,083 | ||||||
| Novo Nordisk AS (ADR) |
518,164 | 53,604,066 | ||||||
|
|
|
|||||||
| 174,702,941 | ||||||||
|
|
|
|||||||
| Semiconductors & Semiconductor Equipment—14.9% | ||||||||
| Advanced Micro Devices, Inc. (a) |
693,803 | 102,273,500 | ||||||
| ARM Holdings PLC (ADR) (a) (b) |
197,219 | 14,820,022 | ||||||
| ASML Holding NV |
35,436 | 26,822,217 | ||||||
| Broadcom, Inc. |
68,436 | 76,391,685 | ||||||
| Micron Technology, Inc. |
167,152 | 14,264,752 | ||||||
| NVIDIA Corp. |
328,242 | 162,552,003 | ||||||
|
|
|
|||||||
| 397,124,179 | ||||||||
|
|
|
|||||||
| Software—17.3% | ||||||||
| Adobe, Inc. (a) |
89,325 | 53,291,295 | ||||||
| Cadence Design Systems, Inc. (a) |
121,157 | 32,999,532 | ||||||
| CrowdStrike Holdings, Inc. - Class A (a) (b) |
132,819 | 33,911,347 | ||||||
| HubSpot, Inc. (a) (b) |
25,137 | 14,593,034 | ||||||
| Microsoft Corp. |
590,403 | 222,015,144 | ||||||
| Palo Alto Networks, Inc. (a) |
26,256 | 7,742,369 | ||||||
| Salesforce, Inc. (a) |
225,056 | 59,221,236 | ||||||
| ServiceNow, Inc. (a) |
52,509 | 37,097,084 | ||||||
|
|
|
|||||||
| 460,871,041 | ||||||||
|
|
|
|||||||
| Specialized REITs—1.1% | ||||||||
| American Tower Corp. |
141,981 | 30,650,858 | ||||||
|
|
|
|||||||
| Specialty Retail—3.1% | ||||||||
| Home Depot, Inc. |
92,702 | 32,125,878 | ||||||
| O’Reilly Automotive, Inc. (a) |
25,596 | 24,318,248 | ||||||
| TJX Cos., Inc. |
289,513 | 27,159,214 | ||||||
|
|
|
|||||||
| 83,603,340 | ||||||||
|
|
|
|||||||
| Technology Hardware, Storage & Peripherals—4.8% | ||||||||
| Apple, Inc. |
670,885 | 129,165,489 | ||||||
|
|
|
|||||||
See accompanying notes to financial statements.
BHFTII-5
Brighthouse Funds Trust II
Jennison Growth Portfolio
Schedule of Investments as of December 31, 2023
Common Stocks—(Continued)
| Security Description | Shares/ Principal Amount* |
Value | ||||||
| Textiles, Apparel & Luxury Goods—3.8% | ||||||||
| Lululemon Athletica, Inc. (a) |
86,344 | $ | 44,146,824 | |||||
| LVMH Moet Hennessy Louis Vuitton SE |
48,653 | 39,463,676 | ||||||
| NIKE, Inc. - Class B |
155,063 | 16,835,190 | ||||||
|
|
|
|||||||
| 100,445,690 | ||||||||
|
|
|
|||||||
| Total Common Stocks |
2,647,849,984 | |||||||
|
|
|
|||||||
| Preferred Stock—0.5% |
| |||||||
| Automobiles—0.5% | ||||||||
| Dr. Ing HC F Porsche AG |
157,971 | 13,930,850 | ||||||
|
|
|
|||||||
| Securities Lending Reinvestments (c)—3.7% |
| |||||||
| Certificates of Deposit—0.3% | ||||||||
| Mizuho Bank Ltd. |
||||||||
| 5.790%, SOFR + 0.400%, 04/18/24 (d) |
1,000,000 | 1,000,453 | ||||||
| MUFG Bank Ltd. (London) |
| |||||||
| Zero Coupon, 02/20/24 |
1,500,000 | 1,488,165 | ||||||
| Royal Bank of Canada |
||||||||
| 5.880%, FEDEFF PRV + 0.550%, 09/20/24 (d) |
1,000,000 | 1,000,620 | ||||||
| Standard Chartered Bank |
||||||||
| 5.770%, SOFR + 0.370%, 03/12/24 (d) |
2,000,000 | 2,000,828 | ||||||
| Sumitomo Mitsui Trust Bank Ltd. |
||||||||
| 5.800%, SOFR + 0.400%, 04/24/24 (d) |
1,000,000 | 1,000,595 | ||||||
| Westpac Banking Corp. |
||||||||
| 5.950%, SOFR + 0.550%, 10/11/24 (d) |
1,000,000 | 1,001,239 | ||||||
|
|
|
|||||||
| 7,491,900 | ||||||||
|
|
|
|||||||
| Repurchase Agreements—2.4% | ||||||||
| Bank of Nova Scotia |
||||||||
| Repurchase Agreement dated 12/29/23 at 5.450%, due on 01/02/24 with a maturity value of $12,007,267; collateralized by various Common Stock with an aggregate market value of $13,365,550. |
12,000,000 | 12,000,000 | ||||||
| Barclays Bank PLC |
| |||||||
| Repurchase Agreement dated 12/29/23 at 5.330%, due on 01/02/24 with a maturity value of $500,296; collateralized by U.S. Treasury Obligations with rates ranging from 0.000% - 5.500%, maturity dates ranging from 01/31/24 - 05/15/48, and an aggregate market value of $510,280. |
500,000 | 500,000 | ||||||
| Repurchase Agreement dated 12/29/23 at 5.450%, due on 01/02/24 with a maturity value of $1,030,624; collateralized by various Common Stock with an aggregate market value of $1,148,256. |
1,030,000 | 1,030,000 | ||||||
| Citigroup Global Markets, Inc. |
||||||||
| Repurchase Agreement dated 12/29/23 at 5.870%, due on 07/01/24 with a maturity value of $6,180,992; collateralized by U.S. Treasury Obligations with rates ranging from 0.875% - 3.750%, maturity dates ranging from 05/15/28 - 02/15/32, and various Common Stock with an aggregate market value of $6,120,028. |
6,000,000 | 6,000,000 | ||||||
| Repurchase Agreements—(Continued) | ||||||||
| ING Financial Markets LLC |
||||||||
| Repurchase Agreement dated 12/29/23 at 5.320%, due on 01/02/24 with a maturity value of $14,255,940; collateralized by U.S. Treasury Obligations with rates ranging from 0.000% - 5.352%, maturity dates ranging from 01/15/24 - 11/15/53, and an aggregate market value of $14,532,471. |
14,247,519 | 14,247,519 | ||||||
| National Bank of Canada |
||||||||
| Repurchase Agreement dated 12/29/23 at 5.450%, due on 01/05/24 with a maturity value of $10,010,597; collateralized by various Common Stock with an aggregate market value of $11,159,892. |
10,000,000 | 10,000,000 | ||||||
| NBC Global Finance Ltd. |
||||||||
| Repurchase Agreement dated 12/29/23 at 5.550%, due on 01/02/24 with a maturity value of $4,502,775; collateralized by various Common Stock with an aggregate market value of $5,022,063. |
4,500,000 | 4,500,000 | ||||||
| Royal Bank of Canada Toronto |
||||||||
| Repurchase Agreement dated 12/29/23 at 5.590%, due on 02/02/24 with a maturity value of $5,027,174; collateralized by various Common Stock with an aggregate market value of $5,556,418. |
5,000,000 | 5,000,000 | ||||||
| Societe Generale |
| |||||||
| Repurchase Agreement dated 12/29/23 at 5.330%, due on 01/02/24 with a maturity value of $5,002,961; collateralized by U.S. Treasury Obligations with rates ranging from 0.625% - 4.750%, maturity dates ranging from 04/15/26 - 08/15/51, and an aggregate market value of $5,111,326. |
5,000,000 | 5,000,000 | ||||||
| Repurchase Agreement dated 12/29/23 at 5.330%, due on 01/02/24 with a maturity value of $400,237; collateralized by U.S. Treasury Obligations with rates ranging from 0.625% - 5.240%, maturity dates ranging from 04/30/24 - 05/15/32, and an aggregate market value of $408,000. |
400,000 | 400,000 | ||||||
| TD Prime Services LLC |
||||||||
| Repurchase Agreement dated 12/29/23 at 5.420%, due on 01/02/24 with a maturity value of $5,003,011; collateralized by various Common Stock with an aggregate market value of $5,514,305. |
5,000,000 | 5,000,000 | ||||||
|
|
|
|||||||
| 63,677,519 | ||||||||
|
|
|
|||||||
| Time Deposit—0.1% | ||||||||
| First Abu Dhabi Bank USA NV |
4,000,000 | 4,000,000 | ||||||
|
|
|
|||||||
| Mutual Funds — 0.9% | ||||||||
| Allspring Government Money Market Fund, Select Class |
2,000,000 | 2,000,000 | ||||||
| BlackRock Liquidity Funds FedFund, Institutional Shares 5.260% (e) |
4,327,682 | 4,327,682 | ||||||
| Dreyfus Treasury Obligations Cash Management Fund, Institutional Class 5.250% (e) |
2,000,000 | 2,000,000 | ||||||
| RBC U.S. Government Money Market Fund, Institutional Share 5.230% (e) |
5,000,000 | 5,000,000 | ||||||
See accompanying notes to financial statements.
BHFTII-6
Brighthouse Funds Trust II
Jennison Growth Portfolio
Schedule of Investments as of December 31, 2023
Securities Lending Reinvestments (c)—(Continued)
| Security Description | Shares | Value | ||||||
| Mutual Funds —(Continued) | ||||||||
| State Street Institutional U.S. Government Money Market Fund, Premier Class 5.320% (e) |
10,000,000 | $ | 10,000,000 | |||||
|
|
|
|||||||
| 23,327,682 | ||||||||
|
|
|
|||||||
| Total Securities Lending Reinvestments |
98,497,101 | |||||||
|
|
|
|||||||
| Total Investments — 103.4% |
2,760,277,935 | |||||||
| Other assets and liabilities (net)—(3.4)% |
(91,965,911 | ) | ||||||
|
|
|
|||||||
| Net Assets—100.0% |
$ | 2,668,312,024 | ||||||
|
|
|
|||||||
| * | Principal amount stated in U.S. dollars unless otherwise noted. | |||
| (a) | Non-income producing security. | |||
| (b) | All or a portion of the security was held on loan. As of December 31, 2023, the market value of securities loaned was $139,113,029 and the collateral received consisted of cash in the amount of $98,483,776 and non-cash collateral with a value of $44,628,607. The cash collateral investments are disclosed in the Schedule of Investments and categorized as Securities Lending Reinvestments. The non-cash collateral received consists of U.S. government securities that are held in safe-keeping by the lending agent, or a third-party custodian, and cannot be sold or repledged by the Portfolio. As such, this collateral is excluded from the Statement of Assets and Liabilities. | |||
| (c) | Represents investment of cash collateral received from securities on loan as of December 31, 2023. | |||
| (d) | Variable or floating rate security. The stated rate represents the rate at December 31, 2023. Maturity date shown for callable securities reflects the earliest possible call date. For securities based on a published reference index and spread, the index and spread are indicated in the description above. For certain variable rate securities, the coupon rate is determined by the issuer/agent based on current market conditions. For certain asset- and mortgage-backed securities, the coupon rate may fluctuate based on changes of the underlying collateral or prepayments of principal. These securities do not indicate a reference index and spread in their description above. | |||
| (e) | The rate shown represents the annualized seven-day yield as of December 31, 2023. | |||
Glossary of Abbreviations
Index Abbreviations
| (FEDEFF PRV)— | Effective Federal Funds Rate | |||
| (SOFR)— | Secured Overnight Financing Rate | |||
Other Abbreviations
| (ADR)— | American Depositary Receipt | |||
| (REIT)— | Real Estate Investment Trust | |||
See accompanying notes to financial statements.
BHFTII-7
Brighthouse Funds Trust II
Jennison Growth Portfolio
Schedule of Investments as of December 31, 2023
Fair Value Hierarchy
Accounting principles generally accepted in the United States of America (“GAAP”) define fair market value as the price that the Portfolio would receive to sell an asset or pay to transfer a liability in an orderly transaction between market participants at the measurement date. It establishes a fair value hierarchy that prioritizes inputs to valuation methods and requires disclosure of the fair value hierarchy, separately for each major category of assets and liabilities, that segregates fair value measurements into three levels. Levels 1, 2 and 3 of the fair value hierarchy are defined as follows:
Level 1 - unadjusted quoted prices in active markets for identical investments
Level 2 - other significant observable inputs (including, but not limited to, quoted prices for similar assets or liabilities in markets that are either active or inactive; inputs other than quoted prices that are observable such as interest rates, yield curves, volatilities, prepayment speeds, loss severities, credit risks, default rates, or other market corroborated inputs)
Level 3 - significant unobservable inputs based on the best information available in the circumstances, to the extent observable inputs are unavailable (including the Portfolio’s own assumptions used in determining the fair value of investments and derivative financial instruments)
The inputs or methodologies used for valuing investments are not necessarily an indication of the risk associated with investing in them. Changes to the inputs or methodologies used may result in transfers between levels. A reconciliation of Level 3 securities, if any, will be disclosed following the fair value hierarchy table. For more information about the Portfolio’s policy regarding the valuation of investments, please refer to the Notes to Financial Statements.
The following table summarizes the fair value hierarchy of the Portfolio’s investments as of December 31, 2023:
| Description | Level 1 | Level 2 | Level 3 | Total | ||||||||||||
| Common Stocks | ||||||||||||||||
| Aerospace & Defense |
$ | 26,810,445 | $ | — | $ | — | $ | 26,810,445 | ||||||||
| Automobile Components |
7,605,606 | — | — | 7,605,606 | ||||||||||||
| Automobiles |
102,957,688 | — | — | 102,957,688 | ||||||||||||
| Biotechnology |
35,855,961 | — | — | 35,855,961 | ||||||||||||
| Broadline Retail |
265,684,802 | — | — | 265,684,802 | ||||||||||||
| Capital Markets |
26,276,617 | — | — | 26,276,617 | ||||||||||||
| Consumer Staples Distribution & Retail |
57,477,786 | — | — | 57,477,786 | ||||||||||||
| Electronic Equipment, Instruments & Components |
13,415,582 | — | — | 13,415,582 | ||||||||||||
| Entertainment |
57,494,686 | — | — | 57,494,686 | ||||||||||||
| Financial Services |
153,197,096 | — | — | 153,197,096 | ||||||||||||
| Ground Transportation |
48,351,167 | — | — | 48,351,167 | ||||||||||||
| Health Care Equipment & Supplies |
34,963,653 | — | — | 34,963,653 | ||||||||||||
| Health Care Providers & Services |
45,548,079 | — | — | 45,548,079 | ||||||||||||
| Hotels, Restaurants & Leisure |
60,782,728 | — | — | 60,782,728 | ||||||||||||
| Interactive Media & Services |
224,363,038 | — | — | 224,363,038 | ||||||||||||
| IT Services |
61,465,557 | — | — | 61,465,557 | ||||||||||||
| Media |
19,896,724 | — | — | 19,896,724 | ||||||||||||
| Personal Care Products |
— | 29,139,231 | — | 29,139,231 | ||||||||||||
| Pharmaceuticals |
174,702,941 | — | — | 174,702,941 | ||||||||||||
| Semiconductors & Semiconductor Equipment |
397,124,179 | — | — | 397,124,179 | ||||||||||||
| Software |
460,871,041 | — | — | 460,871,041 | ||||||||||||
| Specialized REITs |
30,650,858 | — | — | 30,650,858 | ||||||||||||
| Specialty Retail |
83,603,340 | — | — | 83,603,340 | ||||||||||||
| Technology Hardware, Storage & Peripherals |
129,165,489 | — | — | 129,165,489 | ||||||||||||
| Textiles, Apparel & Luxury Goods |
60,982,014 | 39,463,676 | — | 100,445,690 | ||||||||||||
| Total Common Stocks |
2,579,247,077 | 68,602,907 | — | 2,647,849,984 | ||||||||||||
| Total Preferred Stock* |
— | 13,930,850 | — | 13,930,850 | ||||||||||||
| Securities Lending Reinvestments | ||||||||||||||||
| Certificates of Deposit |
— | 7,491,900 | — | 7,491,900 | ||||||||||||
| Repurchase Agreements |
— | 63,677,519 | — | 63,677,519 | ||||||||||||
| Time Deposit |
— | 4,000,000 | — | 4,000,000 | ||||||||||||
| Mutual Funds |
23,327,682 | — | — | 23,327,682 | ||||||||||||
| Total Securities Lending Reinvestments |
23,327,682 | 75,169,419 | — | 98,497,101 | ||||||||||||
| Total Investments |
$ | 2,602,574,759 | $ | 157,703,176 | $ | — | $ | 2,760,277,935 | ||||||||
| Collateral for Securities Loaned (Liability) |
$ | — | $ | (98,483,776 | ) | $ | — | $ | (98,483,776 | ) | ||||||
| * | See Schedule of Investments for additional detailed categorizations. | |||||||
See accompanying notes to financial statements.
BHFTII-8
Brighthouse Funds Trust II
Jennison Growth Portfolio
Statement of Assets and Liabilities
December 31, 2023
| Assets |
| |||
| Investments at value (a) (b) |
$ | 2,760,277,935 | ||
| Cash denominated in foreign currencies (c) |
3 | |||
| Receivable for: |
| |||
| Investments sold |
11,748,493 | |||
| Fund shares sold |
333,003 | |||
| Dividends |
1,823,944 | |||
| Prepaid expenses |
9,766 | |||
|
|
|
|||
| Total Assets |
2,774,193,144 | |||
|
|
|
|||
| Liabilities |
| |||
| Due to custodian |
3,590,543 | |||
| Collateral for securities loaned |
98,483,776 | |||
| Payables for: |
| |||
| Fund shares redeemed |
2,051,189 | |||
| Accrued Expenses: |
| |||
| Management fees |
1,165,947 | |||
| Distribution and service fees |
209,668 | |||
| Deferred trustees’ fees |
212,333 | |||
| Other expenses |
167,664 | |||
|
|
|
|||
| Total Liabilities |
105,881,120 | |||
|
|
|
|||
| Net Assets |
$ | 2,668,312,024 | ||
|
|
|
|||
| Net Assets Consist of: |
| |||
| Paid in surplus |
$ | 1,158,424,945 | ||
| Distributable earnings (Accumulated losses) |
1,509,887,079 | |||
|
|
|
|||
| Net Assets |
$ | 2,668,312,024 | ||
|
|
|
|||
| Net Assets |
| |||
| Class A |
$ | 1,664,369,793 | ||
| Class B |
990,096,447 | |||
| Class E |
13,845,784 | |||
| Capital Shares Outstanding* |
| |||
| Class A |
116,171,258 | |||
| Class B |
72,701,643 | |||
| Class E |
988,494 | |||
| Net Asset Value, Offering Price and Redemption Price Per Share |
| |||
| Class A |
$ | 14.33 | ||
| Class B |
13.62 | |||
| Class E |
14.01 | |||
| * | The Portfolio is authorized to issue an unlimited number of shares. | |
| (a) | Identified cost of investments was $1,581,100,028. | |
| (b) | Includes securities loaned at value of $139,113,029. | |
| (c) | Identified cost of cash denominated in foreign currencies was $3. |
Statement of Operations
Year Ended December 31, 2023
| Investment Income |
| |||
| Dividends (a) |
$ | 14,510,544 | ||
| Interest |
176,853 | |||
| Securities lending income |
325,853 | |||
|
|
|
|||
| Total investment income |
15,013,250 | |||
|
|
|
|||
| Expenses |
| |||
| Management fees |
14,883,718 | |||
| Administration fees |
105,771 | |||
| Custodian and accounting fees |
158,949 | |||
| Distribution and service fees—Class B |
2,268,394 | |||
| Distribution and service fees—Class E |
18,025 | |||
| Audit and tax services |
49,026 | |||
| Legal |
46,603 | |||
| Trustees’ fees and expenses |
46,220 | |||
| Shareholder reporting |
74,535 | |||
| Insurance |
21,133 | |||
| Miscellaneous |
29,002 | |||
|
|
|
|||
| Total expenses |
17,701,376 | |||
| Less management fee waiver |
(1,968,541 | ) | ||
| Less broker commission recapture |
(39,667 | ) | ||
|
|
|
|||
| Net expenses |
15,693,168 | |||
|
|
|
|||
| Net Investment Loss |
(679,918 | ) | ||
|
|
|
|||
| Net Realized and Unrealized Gain (Loss) |
| |||
| Net realized gain (loss) on: |
| |||
| Investments |
398,321,227 | |||
| Foreign currency transactions |
(55,832 | ) | ||
|
|
|
|||
| Net realized gain (loss) |
398,265,395 | |||
|
|
|
|||
| Net change in unrealized appreciation (depreciation) on: |
| |||
| Investments |
638,146,646 | |||
| Foreign currency transactions |
9,359 | |||
|
|
|
|||
| Net change in unrealized appreciation (depreciation) |
638,156,005 | |||
|
|
|
|||
| Net realized and unrealized gain (loss) |
1,036,421,400 | |||
|
|
|
|||
| Net Increase (Decrease) in Net Assets From Operations |
$ | 1,035,741,482 | ||
|
|
|
|||
| (a) | Net of foreign withholding taxes of $322,680. |
See accompanying notes to financial statements.
BHFTII-9
Brighthouse Funds Trust II
Jennison Growth Portfolio
Statements of Changes in Net Assets
| Year Ended December 31, 2023 |
Year Ended December 31, 2022 |
|||||||||||
| Increase (Decrease) in Net Assets: |
||||||||||||
| From Operations |
||||||||||||
| Net investment income (loss) |
$ | (679,918 | ) | $ | (2,772,308 | ) | ||||||
| Net realized gain (loss) |
398,265,395 | (66,509,597 | ) | |||||||||
| Net change in unrealized appreciation (depreciation) |
638,156,005 | (1,252,250,509 | ) | |||||||||
|
|
|
|
|
|||||||||
| Increase (decrease) in net assets from operations |
1,035,741,482 | (1,321,532,414 | ) | |||||||||
|
|
|
|
|
|||||||||
| From Distributions to Shareholders |
| |||||||||||
| Class A |
0 | (366,175,729 | ) | |||||||||
| Class B |
0 | (224,849,934 | ) | |||||||||
| Class E |
0 | (2,956,177 | ) | |||||||||
| From return of capital |
| |||||||||||
| Class A |
0 | (260,512 | ) | |||||||||
| Class B |
0 | (159,967 | ) | |||||||||
| Class E |
0 | (2,103 | ) | |||||||||
|
|
|
|
|
|||||||||
| Total distributions |
0 | (594,404,422 | ) | |||||||||
|
|
|
|
|
|||||||||
| Increase (decrease) in net assets from capital share transactions |
(449,203,735 | ) | 622,794,342 | |||||||||
|
|
|
|
|
|||||||||
| Total increase (decrease) in net assets |
586,537,747 | (1,293,142,494 | ) | |||||||||
| Net Assets |
| |||||||||||
| Beginning of period |
2,081,774,277 | 3,374,916,771 | ||||||||||
|
|
|
|
|
|||||||||
| End of period |
$ | 2,668,312,024 | $ | 2,081,774,277 | ||||||||
|
|
|
|
|
|||||||||
Other Information:
Capital Shares
Transactions in capital shares were as follows:
| Year Ended December 31, 2023 |
Year Ended December 31, 2022 |
|||||||||||||||
| Shares | Value | Shares | Value | |||||||||||||
| Class A |
| |||||||||||||||
| Sales |
6,683,648 | $ | 73,943,852 | 9,227,530 | $ | 135,251,837 | ||||||||||
| Reinvestments |
0 | 0 | 37,699,202 | 366,436,241 | ||||||||||||
| Redemptions |
(29,608,636 | ) | (360,757,627 | ) | (7,888,307 | ) | (101,656,550 | ) | ||||||||
|
|
|
|
|
|
|
|
|
|||||||||
| Net increase (decrease) |
(22,924,988 | ) | $ | (286,813,775 | ) | 39,038,425 | $ | 400,031,528 | ||||||||
|
|
|
|
|
|
|
|
|
|||||||||
| Class B |
| |||||||||||||||
| Sales |
2,877,581 | $ | 31,937,812 | 8,202,850 | $ | 103,968,558 | ||||||||||
| Reinvestments |
0 | 0 | 24,246,757 | 225,009,901 | ||||||||||||
| Redemptions |
(16,799,459 | ) | (193,273,688 | ) | (8,805,623 | ) | (107,294,154 | ) | ||||||||
|
|
|
|
|
|
|
|
|
|||||||||
| Net increase (decrease) |
(13,921,878 | ) | $ | (161,335,876 | ) | 23,643,984 | $ | 221,684,305 | ||||||||
|
|
|
|
|
|
|
|
|
|||||||||
| Class E |
| |||||||||||||||
| Sales |
136,504 | $ | 1,634,504 | 77,917 | $ | 949,398 | ||||||||||
| Reinvestments |
0 | 0 | 310,418 | 2,958,280 | ||||||||||||
| Redemptions |
(230,227 | ) | (2,688,588 | ) | (219,981 | ) | (2,829,169 | ) | ||||||||
|
|
|
|
|
|
|
|
|
|||||||||
| Net increase (decrease) |
(93,723 | ) | $ | (1,054,084 | ) | 168,354 | $ | 1,078,509 | ||||||||
|
|
|
|
|
|
|
|
|
|||||||||
| Increase (decrease) derived from capital shares transactions |
$ | (449,203,735 | ) | $ | 622,794,342 | |||||||||||
|
|
|
|
|
|||||||||||||
See accompanying notes to financial statements.
BHFTII-10
Brighthouse Funds Trust II
Jennison Growth Portfolio
Financial Highlights
| Selected per share data | ||||||||||||||||||||
| Class A | ||||||||||||||||||||
| Year Ended December 31, | ||||||||||||||||||||
| 2023 | 2022 | 2021 | 2020 | 2019 | ||||||||||||||||
| Net Asset Value, Beginning of Period |
$ | 9.35 | $ | 20.85 | $ | 22.63 | $ | 16.32 | $ | 14.50 | ||||||||||
|
|
|
|
|
|
|
|
|
|
|
|||||||||||
| Income (Loss) from Investment Operations |
| |||||||||||||||||||
| Net investment income (loss) (a) |
0.01 | (0.00 | )(b) | (0.06 | ) | (0.01 | ) | 0.04 | ||||||||||||
| Net realized and unrealized gain (loss) |
4.97 | (7.97 | ) | 3.29 | 8.49 | 4.38 | ||||||||||||||
|
|
|
|
|
|
|
|
|
|
|
|||||||||||
| Total income (loss) from investment operations |
4.98 | (7.97 | ) | 3.23 | 8.48 | 4.42 | ||||||||||||||
|
|
|
|
|
|
|
|
|
|
|
|||||||||||
| Less Distributions |
| |||||||||||||||||||
| Distributions from net investment income |
0.00 | 0.00 | 0.00 | (0.04 | ) | (0.08 | ) | |||||||||||||
| Distributions from net realized capital gains |
0.00 | (3.53 | ) | (5.01 | ) | (2.13 | ) | (2.52 | ) | |||||||||||
| Distributions from return of capital |
0.00 | (0.00 | )(c) | 0.00 | 0.00 | 0.00 | ||||||||||||||
|
|
|
|
|
|
|
|
|
|
|
|||||||||||
| Total distributions |
0.00 | (3.53 | ) | (5.01 | ) | (2.17 | ) | (2.60 | ) | |||||||||||
|
|
|
|
|
|
|
|
|
|
|
|||||||||||
| Net Asset Value, End of Period |
$ | 14.33 | $ | 9.35 | $ | 20.85 | $ | 22.63 | $ | 16.32 | ||||||||||
|
|
|
|
|
|
|
|
|
|
|
|||||||||||
| Total Return (%) (d) |
53.26 | (38.87 | ) | 17.17 | 56.80 | 32.83 | ||||||||||||||
| Ratios/Supplemental Data |
||||||||||||||||||||
| Gross ratio of expenses to average net assets (%) |
0.63 | 0.62 | 0.61 | 0.62 | 0.62 | |||||||||||||||
| Net ratio of expenses to average net assets (%) (e) |
0.55 | 0.54 | 0.53 | 0.54 | 0.54 | |||||||||||||||
| Ratio of net investment income (loss) to average net assets (%) |
0.07 | (0.02 | ) | (0.26 | ) | (0.04 | ) | 0.25 | ||||||||||||
| Portfolio turnover rate (%) |
30 | 19 | 23 | 34 | 25 | |||||||||||||||
| Net assets, end of period (in millions) |
$ | 1,664.4 | $ | 1,300.2 | $ | 2,086.0 | $ | 2,134.3 | $ | 1,864.7 | ||||||||||
| Class B | ||||||||||||||||||||
| Year Ended December 31, | ||||||||||||||||||||
| 2023 | 2022 | 2021 | 2020 | 2019 | ||||||||||||||||
| Net Asset Value, Beginning of Period |
$ | 8.91 | $ | 20.17 | $ | 22.09 | $ | 15.98 | $ | 14.24 | ||||||||||
|
|
|
|
|
|
|
|
|
|
|
|||||||||||
| Income (Loss) from Investment Operations |
| |||||||||||||||||||
| Net investment income (loss) (a) |
(0.02 | ) | (0.03 | ) | (0.11 | ) | (0.05 | ) | 0.00 | (b) | ||||||||||
| Net realized and unrealized gain (loss) |
4.73 | (7.70 | ) | 3.20 | 8.29 | 4.29 | ||||||||||||||
|
|
|
|
|
|
|
|
|
|
|
|||||||||||
| Total income (loss) from investment operations |
4.71 | (7.73 | ) | 3.09 | 8.24 | 4.29 | ||||||||||||||
|
|
|
|
|
|
|
|
|
|
|
|||||||||||
| Less Distributions |
| |||||||||||||||||||
| Distributions from net investment income |
0.00 | 0.00 | 0.00 | (0.00 | )(f) | (0.03 | ) | |||||||||||||
| Distributions from net realized capital gains |
0.00 | (3.53 | ) | (5.01 | ) | (2.13 | ) | (2.52 | ) | |||||||||||
| Distributions from return of capital |
0.00 | (0.00 | )(c) | 0.00 | 0.00 | 0.00 | ||||||||||||||
|
|
|
|
|
|
|
|
|
|
|
|||||||||||
| Total distributions |
0.00 | (3.53 | ) | (5.01 | ) | (2.13 | ) | (2.55 | ) | |||||||||||
|
|
|
|
|
|
|
|
|
|
|
|||||||||||
| Net Asset Value, End of Period |
$ | 13.62 | $ | 8.91 | $ | 20.17 | $ | 22.09 | $ | 15.98 | ||||||||||
|
|
|
|
|
|
|
|
|
|
|
|||||||||||
| Total Return (%) (d) |
52.86 | (39.02 | ) | 16.91 | 56.37 | 32.49 | ||||||||||||||
| Ratios/Supplemental Data |
| |||||||||||||||||||
| Gross ratio of expenses to average net assets (%) |
0.88 | 0.87 | 0.86 | 0.87 | 0.87 | |||||||||||||||
| Net ratio of expenses to average net assets (%) (e) |
0.80 | 0.79 | 0.78 | 0.79 | 0.79 | |||||||||||||||
| Ratio of net investment income (loss) to average net assets (%) |
(0.19 | ) | (0.27 | ) | (0.51 | ) | (0.29 | ) | 0.00 | (g) | ||||||||||
| Portfolio turnover rate (%) |
30 | 19 | 23 | 34 | 25 | |||||||||||||||
| Net assets, end of period (in millions) |
$ | 990.1 | $ | 771.6 | $ | 1,270.2 | $ | 1,226.6 | $ | 921.5 | ||||||||||
Please see following page for Financial Highlights footnote legend.
See accompanying notes to financial statements.
BHFTII-11
Brighthouse Funds Trust II
Jennison Growth Portfolio
Financial Highlights
| Selected per share data | ||||||||||||||||||||
| Class E | ||||||||||||||||||||
| Year Ended December 31, | ||||||||||||||||||||
| 2023 | 2022 | 2021 | 2020 | 2019 | ||||||||||||||||
| Net Asset Value, Beginning of Period |
$ | 9.15 | $ | 20.55 | $ | 22.40 | $ | 16.17 | $ | 14.39 | ||||||||||
|
|
|
|
|
|
|
|
|
|
|
|||||||||||
| Income (Loss) from Investment Operations |
| |||||||||||||||||||
| Net investment income (loss) (a) |
(0.01 | ) | (0.02 | ) | (0.09 | ) | (0.04 | ) | 0.02 | |||||||||||
| Net realized and unrealized gain (loss) |
4.87 | (7.85 | ) | 3.25 | 8.42 | 4.33 | ||||||||||||||
|
|
|
|
|
|
|
|
|
|
|
|||||||||||
| Total income (loss) from investment operations |
4.86 | (7.87 | ) | 3.16 | 8.38 | 4.35 | ||||||||||||||
|
|
|
|
|
|
|
|
|
|
|
|||||||||||
| Less Distributions |
| |||||||||||||||||||
| Distributions from net investment income |
0.00 | 0.00 | 0.00 | (0.02 | ) | (0.05 | ) | |||||||||||||
| Distributions from net realized capital gains |
0.00 | (3.53 | ) | (5.01 | ) | (2.13 | ) | (2.52 | ) | |||||||||||
| Distributions from return of capital |
0.00 | (0.00 | )(c) | 0.00 | 0.00 | 0.00 | ||||||||||||||
|
|
|
|
|
|
|
|
|
|
|
|||||||||||
| Total distributions |
0.00 | (3.53 | ) | (5.01 | ) | (2.15 | ) | (2.57 | ) | |||||||||||
|
|
|
|
|
|
|
|
|
|
|
|||||||||||
| Net Asset Value, End of Period |
$ | 14.01 | $ | 9.15 | $ | 20.55 | $ | 22.40 | $ | 16.17 | ||||||||||
|
|
|
|
|
|
|
|
|
|
|
|||||||||||
| Total Return (%) (d) |
53.11 | (38.98 | ) | 17.00 | 56.60 | 32.56 | ||||||||||||||
| Ratios/Supplemental Data |
| |||||||||||||||||||
| Gross ratio of expenses to average net assets (%) |
0.78 | 0.77 | 0.76 | 0.77 | 0.77 | |||||||||||||||
| Net ratio of expenses to average net assets (%) (e) |
0.70 | 0.69 | 0.68 | 0.69 | 0.69 | |||||||||||||||
| Ratio of net investment income (loss) to average net assets (%) |
(0.08 | ) | (0.17 | ) | (0.41 | ) | (0.19 | ) | 0.10 | |||||||||||
| Portfolio turnover rate (%) |
30 | 19 | 23 | 34 | 25 | |||||||||||||||
| Net assets, end of period (in millions) |
$ | 13.8 | $ | 9.9 | $ | 18.8 | $ | 20.6 | $ | 14.4 | ||||||||||
| (a) | Per share amounts based on average shares outstanding during the period. | |||||||||
| (b) | Net investment income (loss) was less than $0.01. | |||||||||
| (c) | Distributions from return of capital were less than $0.01. | |||||||||
| (d) | Total return does not reflect any insurance, sales, separate account or administrative charges of variable annuity or life insurance contracts or any additional expenses that contract owners may bear under their variable contracts. If these charges were included, the returns would be lower. | |||||||||
| (e) | Includes the effects of management fee waivers (see Note 5 of the Notes to Financial Statements). | |||||||||
| (f) | Distributions from net investment income were less than $0.01. | |||||||||
| (g) | Ratio of net investment income (loss) to average net assets was less than 0.01%. | |||||||||
See accompanying notes to financial statements.
BHFTII-12
Brighthouse Funds Trust II
Jennison Growth Portfolio
Notes to Financial Statements—December 31, 2023
1. Organization
Brighthouse Funds Trust II (the “Trust”) is organized as a Delaware statutory trust and registered under the Investment Company Act of 1940, as amended (the “1940 Act”), as an open-end management investment company. The Trust, which is managed by Brighthouse Investment Advisers, LLC (“Brighthouse Investment Advisers” or the “Adviser”), currently offers twenty-nine series (the “Portfolios”), each of which operates as a distinct investment vehicle of the Trust. The series included in this report is Jennison Growth Portfolio (the “Portfolio”), which is diversified. Shares of the Portfolio are not offered directly to the general public and are currently available only to separate accounts of insurance companies, including insurance companies affiliated with the Adviser.
The Portfolio has registered and offers three classes of shares: Class A, B and E shares. Shares of each class of the Portfolio represent an equal pro rata interest in the Portfolio and generally give the shareholder the same voting, dividend, liquidation, and other rights. Investment income, realized and unrealized capital gains and losses, the common expenses of the Portfolio, and certain Portfolio-level expense reductions, if any, are allocated on a pro rata basis to each class based on the relative net assets of each class to the net assets of the Portfolio. Each class of shares differs in its respective distribution plan and such distribution expenses are allocated to the corresponding class of shares.
2. Significant Accounting Policies
The preparation of financial statements in conformity with accounting principles generally accepted in the United States of America (“GAAP”) requires management to make estimates and assumptions that affect the reported amounts of assets and liabilities and disclosure of contingent assets and liabilities as of the date of the financial statements and the reported amounts of income and expenses during the reporting period. Actual results could differ from those estimates. In the preparation of these financial statements, management has evaluated events and transactions subsequent to December 31, 2023 through the date the financial statements were issued.
The Portfolio is an investment company and follows the accounting and reporting guidance of the Financial Accounting Standards Board (“FASB”) Accounting Standards Codification Topic 946- Financial Services- Investment Companies. The following is a summary of significant accounting policies consistently followed by the Portfolio in the preparation of its financial statements.
Investment Valuation and Fair Value Measurements - The Portfolio values its investments for purposes of calculating its net asset value (“NAV”) using procedures that allow for a variety of methodologies to be used to value the Portfolio’s investments. The specific methodology used for an investment may vary based on the market data available for a specific investment at the time the Portfolio calculates its NAV or based on other considerations. The procedures also permit a level of judgment to be used in the valuation process.
Domestic and foreign equity securities, such as common stock, exchange-traded funds, rights, warrants, and preferred stock, that are traded on a securities exchange on a valuation date are generally valued at their last quoted sale price or official closing price on the primary exchange for such security, or, if no sales occurred on that day, at the last reported bid price. Equity securities traded over-the-counter (“OTC”) are generally valued at the last reported bid price. In the event of a major exchange closing during the trading day, the Adviser may use other market information obtained from quotation reporting systems, established market makers, or pricing services in valuing the securities. Valuation adjustments may be applied to certain foreign equity securities that are traded solely on foreign exchanges that close before the time as of which the Portfolio determines its NAV to account for the market movement between the close of the foreign exchanges and the time as of which the Portfolio determines its NAV. The Portfolio may use a systematic fair valuation model provided by a pricing service to value securities principally traded in these foreign markets to adjust for possible market movements or other changes that may occur between the close of the foreign exchanges and the time as of which the Portfolio determines its NAV. Foreign equity securities valued using these valuation adjustments are generally categorized as Level 2 within the fair value hierarchy. Equity securities that are actively traded, and have no valuation adjustments applied, are categorized as Level 1 within the fair value hierarchy. Other equity securities traded on inactive markets or valued in reference to similar instruments traded on active markets are generally categorized as Level 2 within the fair value hierarchy.
Investments in registered open-end management investment companies are valued at reported NAV per share on the valuation date and are categorized as Level 1 within the fair value hierarchy.
Debt securities, including corporate, convertible and municipal bonds and notes; obligations of the U.S. Treasury and U.S. government agencies; foreign sovereign issues; and non-U.S. bonds, are generally valued based upon evaluated or composite bid quotations obtained from third-party pricing services and/or brokers and dealers selected by the Adviser (each a “pricing service”). Such pricing services may use matrix pricing, which considers observable inputs including, among other things, issuer details, maturity dates, interest rates, yield curves, rates of prepayment, credit risks/spreads, default rates, reported trades, broker-dealer quotes and quoted prices for similar assets. Short-term obligations with a remaining maturity of sixty days or less may be valued at amortized cost in the absence of market quotes, so long as the amortized cost value of such short-term debt instrument is approximately the same as the fair
BHFTII-13
Brighthouse Funds Trust II
Jennison Growth Portfolio
Notes to Financial Statements—December 31, 2023—(Continued)
value of the instrument as determined without the use of amortized cost valuation. Floating rate loans are generally valued based upon an evaluated or composite average of aggregate bid and ask quotations supplied by brokers or dealers, as obtained from the pricing service. Securities that use similar valuation techniques and inputs as described above are generally categorized as Level 2 within the fair value hierarchy.
Options, whether on securities, indices, futures contracts, or otherwise, traded on exchanges are valued at the last sale price available as of the close of business on a valuation day or, if there is no such price available, at the last reported bid price. These types of options are categorized as Level 1 within the fair value hierarchy. Futures contracts that are traded on commodity exchanges are valued at their settlement prices established by the exchanges on which they are traded as of the close of such exchanges and are categorized as Level 1 within the fair value hierarchy.
If no current market quotation is readily available or market value quotations are deemed to be unreliable for an investment, the fair value of the investment will be determined in accordance with procedures. A market quotation is readily available only when that quotation is a quoted price (unadjusted) in active markets for identical investments that the Portfolio can access at the measurement date, provided that a quotation will not be readily available if it is not reliable.
Pursuant to Rule 2a-5 under the 1940 Act, the Board of Trustees (the “Board” or “Trustees”) of the Trust has designated Brighthouse Investment Advisers, acting through its Valuation Committee (“Committee”), as the Portfolio’s “valuation designee” to perform the Portfolio’s fair value determinations. The Board oversees Brighthouse Investment Advisers in its role as the Valuation Designee and receives reports from Brighthouse Investment Advisers regarding its process and the valuation of the Portfolio’s investments to assist with such oversight.
No single standard for determining the fair value of an investment can be set forth because fair value depends upon the facts and circumstances with respect to each investment. Information relating to any relevant factors may be obtained by the Committee from any appropriate source, including the subadviser of the Portfolio, the Custodian, a pricing service, market maker and/or broker for such security or the issuer. Appropriate methodologies for determining fair value under particular circumstances may include: matrix pricing, a discounted cash flow analysis, comparisons of securities with comparable characteristics, value based on multiples of earnings, discount from market price of similar marketable securities, or a combination of these and other methods.
Foreign Currency Translation - The books and records of the Portfolio are maintained in U.S. dollars. The values of securities, currencies, and other assets and liabilities denominated in currencies other than the U.S. dollar are translated into U.S. dollars based upon foreign exchange rates prevailing at the end of the period. Purchases and sales of investment securities, income, and expenses are translated on the respective dates of such transactions. Because the values of investment securities are translated at the foreign exchange rates prevailing at the end of the period, that portion of the results of operations arising from changes in exchange rates and that portion of the results of operations reflecting fluctuations arising from changes in market prices of the investment securities are not separated. Such fluctuations are included in the net realized and unrealized gain or loss on investments.
Net realized foreign exchange gains or losses arise from activity in forward foreign currency exchange contracts, sales of foreign currency, currency gains or losses realized between the trade and settlement dates on securities transactions, and the difference between the amounts of dividends, interest, and foreign withholding taxes recorded by the Portfolio and the U.S. dollar-equivalent of the amounts actually received or paid by the Portfolio. Net unrealized foreign exchange gains and losses arise from changes in the value of assets and liabilities, other than investment securities, resulting from changes in foreign exchange rates.
Investment Transactions and Related Investment Income - Portfolio security transactions are recorded on the trade date. Dividend income is recorded on the ex-dividend date or, for certain foreign securities, when notified. Interest income, which includes amortization of premium and accretion of discount on debt securities, is recorded on the accrual basis. Realized gains and losses on investments are determined on the identified cost basis, which is the same basis used for federal income tax purposes. Foreign income and foreign capital gains on some foreign securities may be subject to foreign taxes, which are accrued as applicable. These foreign taxes have been provided for in accordance with the Portfolio’s understanding of the applicable countries’ tax rules and rates.
Dividends and Distributions to Shareholders - The Portfolio records dividends and distributions on the ex-dividend date. Net realized gains from securities transactions (if any) are generally distributed annually to shareholders. The timing and characterization of certain income and capital gains distributions are determined in accordance with federal tax regulations that may differ from GAAP. Permanent book and tax basis differences relating to shareholder distributions will result in reclassification between distributable earnings (accumulated losses) and paid in surplus. Book-tax differences are primarily due to net operating losses. These adjustments have no impact on net assets or the results of operations.
Income Taxes - It is the Portfolio’s policy to comply with the requirements of the Internal Revenue Code of 1986, as amended, and regulations thereunder, applicable to regulated investment companies, and to distribute, with respect to each taxable year, all of its taxable income to shareholders. Therefore, no federal income tax provision is required. The Portfolio files U.S. federal tax returns. No income tax returns are currently under examination. The Portfolio’s federal tax returns remain subject to examination by the Internal
BHFTII-14
Brighthouse Funds Trust II
Jennison Growth Portfolio
Notes to Financial Statements—December 31, 2023—(Continued)
Revenue Service for three fiscal years after the returns are filed. As of December 31, 2023, the Portfolio had no uncertain tax positions that would require financial statement recognition, derecognition or disclosure.
Due to Custodian - Pursuant to the custodian agreement, the Custodian may, in its discretion, advance funds to the Portfolio to make properly authorized payments. When such payments result in an overdraft, the Portfolio is obligated to repay the Custodian at the current rate of interest charged by the Custodian for secured loans. This obligation is payable on demand to the Custodian. The Custodian has a lien on the Portfolio’s assets to the extent of any overdraft. At December 31, 2023, the Portfolio had a payment of $3,590,543 due to the Custodian pursuant to the foregoing arrangement. Based on the short-term nature of these payments and the variable interest rate, the carrying value of the overdraft advances approximated its fair value and such inputs would be considered Level 2 in the fair value hierarchy at December 31, 2023. The Portfolio’s average overdraft advances during the year ended December 31, 2023 were not significant.
Repurchase Agreements - The Portfolio may enter into repurchase agreements, under the terms of a Master Repurchase Agreement (“MRA”), or Global Master Repurchase Agreement (“GMRA”), with selected commercial banks and broker-dealers, under which the Portfolio acquires securities as collateral and agrees to resell the securities at an agreed-upon time and at an agreed-upon price. The Portfolio, through the Custodian or a subcustodian, under a tri-party repurchase agreement, receives delivery of the underlying securities collateralizing any repurchase agreements. It is the Portfolio’s policy that the market value of the collateral be equal to at least 100% of the repurchase price in the case of a repurchase agreement of one-day duration and equal to at least 102% of the repurchase price in the case of all other repurchase agreements. In the event of default or failure by a party to perform an obligation in connection with any repurchase transaction, the MRA or GMRA gives the non-defaulting party the right to set-off claims and to apply property held by it in connection with any repurchase transaction against obligations owed to it under the agreement.
At December 31, 2023, the Portfolio invested cash collateral for loans of portfolio securities in repurchase agreements with a gross value of $63,677,519, which is included as part of investments at value on the Statement of Assets and Liabilities. The value of the related collateral exceeded the value of the repurchase agreements at December 31, 2023.
Securities Lending - The Portfolio may lend its portfolio securities to certain qualified brokers who borrow securities in order to complete certain securities transactions. By lending its portfolio securities, the Portfolio attempts to increase its net investment income through the receipt of income on collateral held from securities on loan. Any gain or loss in the market price of the loaned securities that might occur, any interest earned, and any dividends declared during the term of the loan, would accrue to the account of the Portfolio.
The Trust has entered into a Non-Custodial Securities Lending Agreement with JPMorgan Chase Bank, N.A. (the “Lending Agent”). Under the agreement, the Lending Agent is authorized to loan portfolio securities on the Portfolio’s behalf. In exchange, the Portfolio generally receives cash, U.S. Government securities, letters of credit, or other collateral deemed appropriate by the Adviser. The Portfolio receives collateral equal to at least 102% of the market value for loans secured by government securities or cash in the same currency as the loaned shares and 105% for all other loaned securities at each loan’s inception. Collateral representing at least 100% of the market value of the loaned securities is maintained for the duration of the loan. Any cash collateral received by the Portfolio is generally invested by the Lending Agent in short-term investments, which may include certificates of deposit, commercial paper, repurchase agreements, including repurchase agreements with respect to equity securities, time deposits, master demand notes and money market funds. The market value of investments made with cash collateral received are disclosed in the Schedule of Investments and the valuation techniques are described in Note 2. The value of the securities on loan may change each business day. If the market value of the collateral at the close of trading on a business day is less than 100% of the market value of the loaned securities at the close of trading on that day, the borrower is required to deliver, by the close of business on the following business day, an additional amount of collateral, so that the total amount of posted collateral is equal to at least 100% of the market value of all the loaned securities as of such preceding day. A portion of the income earned on the collateral is rebated to the borrower of the securities and the remainder is split between the Lending Agent and the Portfolio. On loans collateralized by U.S. government securities, a fee is received from the borrower and is allocated between the Portfolio and the Lending Agent.
Income received by the Portfolio in securities lending transactions during the year ended December 31, 2023 is reflected as securities lending income on the Statement of Operations. The values of any securities loaned by the Portfolio and the related collateral at December 31, 2023 are disclosed in the footnotes to the Schedule of Investments. The value of the related collateral received by the Portfolio exceeded the value of the securities out on loan at December 31, 2023.
The risks associated with lending portfolio securities include, but are not limited to, possible delays in receiving additional collateral or in the recovery of the loaned securities, possible loss of rights in the collateral should the borrower fail financially, as well as risk of loss in the value of the collateral or the value of the investments made with the collateral. To the extent the Portfolio uses cash collateral it receives to invest in repurchase agreements with respect to equity securities, it is subject to the risk of loss if the value of the equity securities declines and the counterparty defaults on its obligation to repurchase such securities. The Lending Agent shall indemnify the Portfolio in the case of default of any securities borrower, subject to the terms of the Non-Custodial Securities Lending Agreement.
BHFTII-15
Brighthouse Funds Trust II
Jennison Growth Portfolio
Notes to Financial Statements—December 31, 2023—(Continued)
All securities on loan are classified as Common Stocks in the Portfolio’s Schedule of Investments as of December 31, 2023. For all securities on loan, the remaining contractual maturity of the agreements is overnight and continuous.
Directed Brokerage Agreement - The Trust has entered into a directed brokerage arrangement with Capital Institutional Services, Inc. (“CAPIS”). Under this arrangement, the Portfolio directs certain trades to CAPIS in return for a recapture credit. CAPIS issues a cash rebate to the Portfolio. Amounts paid to the Portfolio are shown separately as broker commission recapture on the Statement of Operations of the Portfolio. Additionally, these amounts have been excluded from the calculation of the net ratio of expenses to average net assets presented in the Financial Highlights for each share class.
3. Certain Risks
In the normal course of business, the Portfolio invests in securities and enters into transactions where risks exist. Those risks include:
Market Risk: The value of securities held by the Portfolio may decline in response to certain events, including those directly involving the issuers whose securities are owned by the Portfolio; conditions affecting the general economy; overall market changes; local, regional or global political, social or economic instability; currency, interest rate, and price fluctuations, or other factors including terrorism, war, natural disasters and the spread of infectious illness including epidemics or pandemics such as the COVID-19 pandemic. These events may also adversely affect the liquidity of securities held by the Portfolio.
Credit and Counterparty Risk: The Portfolio may be exposed to counterparty risk, or the risk that an entity with which the Portfolio has unsettled or open transactions may default. The potential loss could exceed the value of the financial assets and liabilities recorded in the financial statements. Financial assets that potentially expose the Portfolio to credit and counterparty risk consist principally of cash due from counterparties and investments. The Portfolio manages counterparty risk by entering into agreements only with counterparties that it believes have the financial resources to honor their obligations and by monitoring the financial stability of those counterparties. The Subadviser may attempt to mitigate counterparty risk by (i) periodically assessing the creditworthiness of its trading partners, (ii) monitoring and/or limiting the amount of its net exposure to each individual counterparty based on its assessment, and (iii) requiring collateral from the counterparty for certain transactions. In order to preserve certain safeguards for non-standard settlement trades, the Portfolio restricts its exposure to credit and counterparty losses by entering into master netting agreements (“Master Agreements”) with counterparties (approved brokers) with whom it undertakes a significant volume of transactions. Master Agreements govern the terms of certain transactions and reduce the counterparty risk associated with relevant transactions by specifying credit protection mechanisms and providing standardization that improves legal certainty. Master Agreements can also help limit counterparty risk by specifying collateral posting arrangements at pre-arranged exposure levels.
Repurchase and reverse repurchase agreements are primarily executed under GMRAs or MRAs, which provide the right to set-off. Each repurchase and reverse repurchase agreement is initially collateralized at the transaction level. In the event of default, the total market value exposure will be offset against collateral exchanged to date, which would result in a net receivable/(payable) that would be due from/to the counterparty.
Additional risks associated with each type of investment are described above within the respective security type notes. The Portfolio’s prospectus includes a discussion of the principal risks of investing in the Portfolio.
4. Investment Transactions
Aggregate cost of purchases and proceeds of sales of investment securities, excluding short-term securities, for the year ended December 31, 2023 were as follows:
| Purchases |
Sales | |||||||||||
| U.S. Government |
Non-U.S. Government | U.S. Government | Non-U.S. Government | |||||||||
| $0 | $ | 740,984,049 | $ | 0 | $ | 1,129,069,381 | ||||||
BHFTII-16
Brighthouse Funds Trust II
Jennison Growth Portfolio
Notes to Financial Statements—December 31, 2023—(Continued)
5. Investment Management Fees and Other Transactions with Affiliates
Investment Management Agreement - Brighthouse Investment Advisers is the investment adviser to the Portfolio. The Trust has entered into an investment management agreement with Brighthouse Investment Advisers with respect to the Portfolio. For providing investment management services to the Portfolio, Brighthouse Investment Advisers receives monthly compensation at the following annual rates:
| Management Fees earned by |
% per annum | Average daily net assets | ||
| $14,883,718 | 0.700% | Of the first $200 million | ||
| 0.650% | Of the next $300 million | |||
| 0.600% | Of the next $1.5 billion | |||
| 0.550% | On amounts in excess of $2 billion |
Brighthouse Investment Advisers has entered into an investment subadvisory agreement with respect to managing the Portfolio. Jennison Associates LLC is compensated by Brighthouse Investment Advisers to provide subadvisory services for the Portfolio.
Management Fee Waivers - Pursuant to a management fee waiver agreement, the Adviser has agreed, for the period May 1, 2023 to April 30, 2024, to reduce its advisory fees set out above under “Investment Management Agreement” for each class of the Portfolio as follows:
| % per annum reduction |
Average daily net assets | |
| 0.100% | Of the first $200 million | |
| 0.050% | On the next $800 million | |
| 0.100% | On the next $1 billion | |
| 0.080% | On amounts in excess of $2 billion |
An identical expense agreement was in place for the period April 29, 2022 to April 30, 2023. Amounts waived for the year ended December 31, 2023 are shown as a management fee waiver in the Statement of Operations.
Certain officers and trustees of the Trust may also be officers of the Adviser; however, such officers and trustees receive no compensation from the Trust.
Transfer Agency Agreement - Brighthouse Life Insurance Company serves as the transfer agent for the Trust. Brighthouse Life Insurance Company receives no fees for its services to the Trust.
Distribution and Service Fees - The Trust has a distribution agreement with Brighthouse Securities, LLC (the “Distributor”) pursuant to which the Distributor serves as the general distributor of shares of each class (each a “Class”) of each Portfolio. The Distributor is an affiliate of the Trust. The Trust has adopted a Distribution and Services Plan (the “D&S Plan”) relating to Class B, Class D, Class E, Class F and Class G shares of each Portfolio, under Rule 12b-1 under the 1940 Act, pursuant to which the Trust may pay the Distributor a fee (the “Service Fee”) at an annual rate not to exceed 0.25% of each such Portfolio’s average daily net assets attributable to the Class B, Class D, Class E, Class F and Class G shares of the Trust. Each Portfolio may not offer shares of each Class. The D&S Plan also authorizes the Trust, on behalf of each of its Portfolios, to pay to the Distributor a distribution fee (the “Distribution Fee” and together with the Service Fee, the “Fees”) at an annual rate of up to 0.25% of each Portfolio’s average daily net assets attributable to the Class B, Class D, Class E, Class F, and Class G shares in consideration of the services rendered in connection with the sale of such shares by the Distributor. Under the Distribution Agreement with respect to the Trust, Fees are currently paid at an annual rate of 0.25% of average daily net assets in the case of Class B shares, 0.10% of average daily net assets in the case of Class D shares, 0.15% of average daily net assets in the case of Class E shares, 0.20% of average daily net assets in the case of Class F shares and 0.30% of average daily net assets in the case of Class G shares. The D&S Plan is known as a “compensation plan” because the Trust makes payments to the Distributor for services rendered regardless of the actual level of expenditures by the Distributor. Amounts incurred by the Portfolio for the year ended December 31, 2023 are shown as Distribution and service fees in the Statement of Operations.
Deferred Trustee Compensation - Each Trustee who is not currently an employee of the Adviser or any of its affiliates receives compensation from the Trust for his or her service to the Trust. A deferred compensation plan (the “Plan”) is available to the Trustees on a voluntary basis. Deferred amounts remain in the Trust until distributed in accordance with the provisions of the Plan. The value of a participating Trustee’s deferral account is based on theoretical investments of deferred amounts on the normal payment dates in certain portfolios of the Trust or Brighthouse Funds Trust I, an affiliate of the Trust, as designated by the participating Trustee. Changes in the value of participants’ deferral accounts are reflected as a component of Trustees’ fees and expenses in the Statement of Operations. The portion of the accrued obligations allocated to the Portfolio under the Plan is reflected as Deferred trustees’ fees in the Statement of Assets and Liabilities.
BHFTII-17
Brighthouse Funds Trust II
Jennison Growth Portfolio
Notes to Financial Statements—December 31, 2023—(Continued)
6. Contractual Obligations
Under the Trust’s organizational documents, its officers and Trustees may be indemnified against certain liabilities and expenses arising out of the performance of their duties to the Trust. Additionally, the Trust has a variety of indemnification obligations under contracts with its service providers. The Trust’s maximum exposure under these arrangements is unknown, as this would involve future claims that may be made against the Trust that have not yet occurred.
7. Income Tax Information
The cost basis of investments for federal income tax purposes at December 31, 2023 was as follows:
| Cost basis of investments |
$ | 1,581,939,775 | ||
|
|
|
|||
| Gross unrealized appreciation |
1,196,295,117 | |||
| Gross unrealized (depreciation) |
(17,956,957 | ) | ||
|
|
|
|||
| Net unrealized appreciation (depreciation) |
$ | 1,178,338,160 | ||
|
|
|
The tax character of distributions paid for the years ended December 31, 2023 and 2022 were as follows:
| Ordinary Income |
Long-Term Capital Gain | Return of Capital | Total | |||||||||||||||||||||||||
| 2023 |
2022 | 2023 | 2022 | 2023 | 2022 | 2023 | 2022 | |||||||||||||||||||||
| $— | $ | — | $ | — | $ | 593,981,840 | $ | — | $ | 422,582 | $ | — | $ | 594,404,422 | ||||||||||||||
As of December 31, 2023, the components of distributable earnings (accumulated losses) on a federal income tax basis were as follows:
| Undistributed |
Undistributed Long-Term Capital Gain |
Net Unrealized Appreciation (Depreciation) |
Accumulated Capital Losses |
Total | ||||||||||||||
| $— | $ | 331,763,343 | $ | 1,178,336,071 | $ | — | $ | 1,510,099,414 | ||||||||||
The Portfolio utilizes the provisions of the federal income tax laws that provide for the carryforward of capital losses for prior years, offsetting such losses against any future realized capital gains. Net capital losses may be carried forward indefinitely and their character is retained as short-term and/or long-term losses.
As of December 31, 2023, the Portfolio had no accumulated capital losses.
During the year ended December 31, 2023, the Portfolio utilized accumulated short-term capital losses of $63,015,896 and accumulated long-term capital losses of $3,053,270.
8. Recent Accounting Pronouncement & Regulatory Updates
In June 2022, FASB issued Accounting Standards Update 2022-03—Fair Value Measurement (Topic 820)—Fair Value Measurement of Equity Securities Subject to Contractual Sale Restrictions (“ASU 2022-03”). ASU 2022-03 clarifies the guidance in Topic 820 to indicate that a contractual sale restriction should not be considered in the fair value of an equity security subject to such a restriction, and requires entities with investments in equity securities subject to contractual sale restrictions to disclose certain qualitative and quantitative information about such securities. ASU 2022-03 is effective for fiscal years, and interim periods within those fiscal years, beginning after December 15, 2023. ASU 2022-03 is only applicable to an equity security in which the contractual arrangement that restricts its sale is executed or modified on or after the adoption date.
Effective January 24, 2023, the Securities and Exchange Commission adopted rule and form amendments that require open-end management investment companies to transmit concise and visually engaging annual and semiannual reports to shareholders that highlight certain information deemed by the SEC to be particularly important for investors. Certain other information, including financial statements, will no longer appear in shareholder reports but will, as required, be available online, delivered free of charge upon request, and filed on a semiannual basis on Form N-CSR. The rule and form amendments have a compliance date of July 24, 2024. Accordingly, the rule and form amendments will not impact the Portfolio until its 2024 semiannual shareholder report.
BHFTII-18
Brighthouse Funds Trust II
Jennison Growth Portfolio
Report of Independent Registered Public Accounting Firm
To the Board of Trustees of Brighthouse Funds Trust II and Shareholders of the Jennison Growth Portfolio:
Opinion on the Financial Statements and Financial Highlights
We have audited the accompanying statement of assets and liabilities, including the schedule of investments, of the Jennison Growth Portfolio (the “Fund”) (one of the funds constituting the Brighthouse Funds Trust II), as of December 31, 2023, the related statement of operations for the year then ended, the statements of changes in net assets for each of the two years in the period then ended, the financial highlights for each of the five years in the period then ended, and the related notes. In our opinion, the financial statements and financial highlights present fairly, in all material respects, the financial position of the Fund as of December 31, 2023, and the results of its operations for the year then ended, the changes in its net assets for each of the two years in the period then ended, and the financial highlights for each of the five years in the period then ended in conformity with accounting principles generally accepted in the United States of America.
Basis for Opinion
These financial statements and financial highlights are the responsibility of the Fund’s management. Our responsibility is to express an opinion on the Fund’s financial statements and financial highlights based on our audits. We are a public accounting firm registered with the Public Company Accounting Oversight Board (United States) (PCAOB) and are required to be independent with respect to the Fund in accordance with the U.S. federal securities laws and the applicable rules and regulations of the Securities and Exchange Commission and the PCAOB.
We conducted our audits in accordance with the standards of the PCAOB. Those standards require that we plan and perform the audit to obtain reasonable assurance about whether the financial statements and financial highlights are free of material misstatement, whether due to error or fraud. The Fund is not required to have, nor were we engaged to perform, an audit of its internal control over financial reporting. As part of our audits we are required to obtain an understanding of internal control over financial reporting but not for the purpose of expressing an opinion on the effectiveness of the Fund’s internal control over financial reporting. Accordingly, we express no such opinion.
Our audits included performing procedures to assess the risks of material misstatement of the financial statements and financial highlights, whether due to error or fraud, and performing procedures that respond to those risks. Such procedures included examining, on a test basis, evidence regarding the amounts and disclosures in the financial statements and financial highlights. Our audits also included evaluating the accounting principles used and significant estimates made by management, as well as evaluating the overall presentation of the financial statements and financial highlights. Our procedures included confirmation of securities owned as of December 31, 2023, by correspondence with the custodian and brokers; when replies were not received from brokers, we performed other auditing procedures. We believe that our audits provide a reasonable basis for our opinion.
/s/ Deloitte & Touche LLP
Boston, Massachusetts
February 23, 2024
We have served as the auditor of one or more Brighthouse investment companies since 1983.
BHFTII-19
Brighthouse Funds Trust II
Trustees and Officers
MANAGEMENT OF THE TRUSTS
The Boards of Trustees (the “Board”) of Brighthouse Funds Trust I and Brighthouse Funds Trust II (“Trust I” and “Trust II”, respectively, and collectively the “Trusts”) supervise the Trusts and are responsible for representing the interests of shareholders. The Trustees, the Chairman of the Board and the Chairmen of each subcommittee are the same for both Trusts. The Trustees of each Trust meet periodically throughout the year to oversee the Portfolios’ activities, reviewing, among other things, each Portfolio’s performance and its contractual arrangements with various service providers. The Trustees of each Trust elect the officers of the Trust, who are responsible for administering the Trust’s day-to-day operations.
Trustees and Officers
The Trustees and executive officers of the Trusts, as well as their ages and their principal occupations during the past five years, are set forth below. Unless otherwise indicated, the business address of each is c/o Brighthouse Funds Trust I and Brighthouse Funds Trust II, 11225 N. Community House Rd., Charolette, North Carolina 28277. Each Trustee who is deemed an “interested person,” as such term is defined in the 1940 Act, is referred to as an “Interested Trustee.” Those Trustees who are not “interested persons,” as such term is defined in the 1940 Act, are referred to as “Independent Trustees.” There is no limit to the term a Trustee may serve, other than pursuant to the retirement policy adopted by the Independent Trustees. Trustees serve until their death, resignation, retirement or removal in accordance with Trust I’s and Trust II’s respective organizational documents and policies adopted by the Board of the Trust from time to time. Officers hold office at the pleasure of each Board and serve until their removal or resignation in accordance with the Trusts’ respective organizational documents and policies adopted by the Board of each Trust from time to time.
Trustees of the Trusts
| Name and Year of Birth |
Position(s) |
Term of Office |
Principal Occupation(s) During the Past |
Number of |
Other Directorships Held | |||||
| Interested Trustee | ||||||||||
| John Rosenthal* (1960) |
Trustee | Indefinite; From May 2016 (Trust I and Trust II) to present | Chief Investment Officer, Brighthouse Financial, Inc. (2016 to present). | 73 | None | |||||
| Independent Trustees | ||||||||||
| Dawn M. Vroegop (1966) |
Trustee and Chair of the Board | Indefinite; From December 2000 (Trust I)/May 2009 (Trust II) to present as Trustee; From May 2016 (Trust I and Trust II) until present as Chair | Retired; Private Investor. | 73 | Trustee, Driehaus Mutual Funds (8 portfolios).** | |||||
| Stephen M. Alderman (1959) |
Trustee | Indefinite; From December 2000 (Trust I)/April 2012 (Trust II) to present | Vice President and General Counsel, IHR Aerial Solutions, LLC; Until 2022, General Counsel, Illini Hi-Reach, Inc.; Until 2020, Shareholder in the law firm of Garfield & Merel, Ltd. | 73 | None | |||||
| Robert J. Boulware (1956) |
Trustee | Indefinite; From March 2008 (Trust I)/April 2012 (Trust II) to present | Managing Member, Pilgrim Funds, LLC (private equity fund). | 73 | Trustee, Vertical Capital Income Fund (closed-end fund);** Trustee, The Private Shares Fund (closed- end fund);** Until 2021, Director, Mid- Con Energy Partners, LP (energy);** Until 2020, Director, Gainsco, Inc. (auto insurance).** | |||||
BHFTII-20
Brighthouse Funds Trust II
Trustees and Officers—(Continued)
| Name and Year of Birth |
Position(s) |
Term of Office |
Principal Occupation(s) During the Past |
Number of |
Other Directorships Held | |||||
| Susan C. Gause (1952) |
Trustee | Indefinite; From March 2008 (Trust I)/April 2012 (Trust II) to present | Private Investor. | 73 | Trustee, HSBC Funds (4 portfolios).** | |||||
| Nancy Hawthorne (1951) |
Trustee | Indefinite; From May 2003 (Trust II)/April 2012 (Trust I) to present | Private Investor. | 73 | Trustee, First Eagle Credit Opportunities Fund;** Trustee and Chair of the Board of Trustees, First Eagle Global Opportunities Fund;** Director, Avid Technology, Inc;** Director, CRA International, Inc.** | |||||
Executive Officers of the Trusts
| Name and Year of Birth |
Position(s) |
Term of Office |
Principal Occupation(s) | |||
| Kristi Slavin (1973) | President and Chief Executive Officer, of Trust I and Trust II | From May 2016 (Trust I and Trust II) to present |
President, Brighthouse Investment Advisers, LLC (2016-present). | |||
| Alan R. Otis (1971) | Chief Financial Officer and Treasurer, of Trust I and Trust II | From November 2017 (Trust I and Trust II) to present |
Executive Vice President, Brighthouse Investment Advisers, LLC (2017-present); formerly, Vice President, Brighthouse Investment Advisers, LLC (2012-2017); Assistant Treasurer, Trust I and Trust II (2012-2017). | |||
| Thomas Watterson (1985) | Secretary, of Trust I and Trust II | From November 2023 (Trust I and Trust II) to present |
Executive Vice President, Chief Legal Officer and Secretary, Brighthouse Investment Advisers, LLC (2023-Present); Managing Corporate Counsel, Brighthouse Financial Inc. (2023-present); Managing Counsel and Director, The Bank of New York Mellon Corporation (2019-2023); Counsel and Vice President, The Bank of New York Mellon Corporation (2016-2019). | |||
| Katie Hellmann (1980) | Chief Compliance Officer (“CCO”), of Trust I and Trust II | From May 2023 (Trust I and Trust II) to present |
Chief Compliance Officer, Brighthouse Investment Advisers, LLC (2023-present) and Head of Funds and Investments Compliance (2023-present). Deputy Chief Compliance Officer, Transamerica Asset Management (2022-2023). Leader and Senior Compliance Counsel – Funds Compliance, Edward Jones (2017-2022). | |||
| Rosemary Morgan (1983) | Anti-Money Laundering Officer, of Trust I and Trust II | From May 2023 (Trust I and Trust II) to present |
Chief Privacy Officer, Leader of Compliance Programs and Assistant General Counsel, Brighthouse Financial, Inc. (2019-2022); Chief Privacy Officer, Head of Compliance Programs & Contracts Law, Brighthouse Financial, Inc. (2022-2023), Chief Compliance Officer and Associate General Counsel, Brighthouse Financial, Inc. (2023-present); Vice President and Chief Compliance Officer, Brighthouse Life Insurance Company (2023-present); Vice President and Chief Compliance Officer (2023-present), Brighthouse Life Insurance Company of NY; Vice President and Chief Compliance Officer (2023-present), New England Life Insurance Company. | |||
| Anna Koska (1981) | Vice President, of Trust I and Trust II | From June 2022 (Trust I and Trust II) to present |
Vice President, Investment and Advisory Services, Brighthouse Investment Advisers, LLC (2022-present); Director of Investment and Advisory Services, Brighthouse Investment Advisers, LLC (2019-2022); Senior Portfolio Analyst, Brighthouse Investment Advisers, LLC (2017-2019). | |||
| * | Mr. Rosenthal is an “interested person” of the Trusts because of his position with Brighthouse Financial, Inc. (“Brighthouse Financial”), an affiliate of BIA. |
| ** | Indicates a directorship with a registered investment company or a company subject to the reporting requirements of the Securities Exchange Act of 1934, as amended. |
| (1) | Previous positions during the past five years with the Trusts, MetLife, Inc. or the Adviser are omitted if not materially different. |
| (2) | The Fund Complex includes 44 Trust I Portfolios and 29 Trust II Portfolios. |
BHFTII-21
Brighthouse Funds Trust II
Jennison Growth Portfolio
Board of Trustees’ Consideration of Advisory and Sub-Advisory Agreements
At a meeting held on November 13-14, 2023 (the “November Meeting”), the Boards of Trustees (the “Board”) of Brighthouse Funds Trust I and Brighthouse Funds Trust II (“BFT I” and “BFT II,” respectively, and collectively, the “Trusts”), including a majority of the Trustees who are not “interested persons” of the Trusts (the “Independent Trustees”) under the Investment Company Act of 1940 (the “1940 Act”), approved the continuation of the Trusts’ advisory agreements (each an “Advisory Agreement”) with Brighthouse Investment Advisers, LLC (the “Adviser”) and the applicable sub-advisory and sub-sub-advisory agreements (each a “Sub-Advisory Agreement” and collectively with the Advisory Agreement, the “Agreements”) between the Adviser and the investment sub-advisers and sub-sub-adviser (each a “Sub-Adviser,” and collectively, the “Sub-Advisers”) for the series of the Trusts (each a “Portfolio,” and collectively, the “Portfolios”) for the annual contract renewal period from January 1, 2024 through December 31, 2024.
The Board met with personnel of the Adviser on September 28-29, 2023 (the “September Meeting”) for the specific purpose of giving preliminary consideration to the proposed continuation of the Agreements, including consideration to information that the Adviser and Sub-Advisers had provided for the Board’s review at the request of the Independent Trustees. At the September Meeting, the Adviser reviewed with the Board the performance and fees experienced by each Portfolio, as well as other information. During and after the September Meeting, the Independent Trustees requested additional information and clarifications that the Adviser addressed at the November Meeting (the September Meeting and the November Meeting are referred to collectively as, the “Meetings”). During the contract renewal process, and throughout the year, the Independent Trustees were advised by independent legal counsel, and they met with independent legal counsel in executive sessions outside of the presence of management on a number of occasions to discuss, among other things, the renewal of the Agreements.
In considering the continuation of the Agreements, the Board reviewed a variety of materials that were provided for the specific purpose of assisting the Board in the renewal process, along with various information and materials that were provided to and discussed with the Board throughout the year, at regularly scheduled meetings of the Board and its committees. In particular, information for each Portfolio included, but was not limited to, reports on investment performance, expenses, legal and compliance matters, and asset pricing. Information about the Adviser and each Sub-Adviser included, but was not limited to, reports on the business, operations, and performance of the Adviser and the Sub-Advisers and reports that the Adviser and Sub-Advisers had prepared specifically for the renewal process.
In considering the continuation of the Agreements, the Board also reviewed, among other things, a report for each Portfolio that was prepared by Broadridge (“Broadridge”), an independent organization, which set forth comparative performance and expense information for each Portfolio. In addition, the Independent Trustees reviewed a report that was prepared by JDL Consultants, LLC (“JDL”), an independent consultant to the Independent Trustees, which examined the Broadridge reports for each Portfolio (“JDL Report”). The Independent Trustees met in executive session with representatives of JDL during the September Meeting to review the JDL Report.
At the November Meeting, the Board, including a majority of the Independent Trustees, concluded that the nature, extent, and quality of services provided by the Adviser and each Sub-Adviser supported the renewal of the Agreements. The Board also concluded that the investment services provided to and the performance of each Portfolio was such that each Agreement should continue, and that the fees paid by each Portfolio to the Adviser appeared to be reasonable in light of the nature, extent, and quality of the services provided by the Adviser and each Sub-Adviser. Further, the Board concluded that the Adviser’s profitability in providing services under the Advisory Agreements did not appear unreasonable in light of the nature, extent, and quality of the services provided by the Adviser. The Board reviewed the extent to which the investment advisory fees paid by the Portfolios shared economies of scale with investors or entailed the potential to share economies of scale with investors and concluded that those considerations generally supported the renewal of each Agreement. Finally, the Board considered the Adviser’s recommendation that it approve the renewal of each Sub-Advisory Agreement.
In approving the continuation of each Agreement, the Board, including the Independent Trustees, gave attention to all of the information that was furnished, and each Trustee placed varying degrees of importance on the various pieces of information that were provided to them. The Board evaluated the information provided to it on a Portfolio-by-Portfolio basis, and its decision was made separately with respect to each Portfolio. The following paragraphs provide more information about some of the primary factors that were relevant to the Board’s decisions. The Board did not identify any single factor as determinative, and the Trustees generally attributed different weights to various factors for the various Portfolios.
Nature, extent and quality of services. The Board evaluated the nature, extent, and quality of the services that the Adviser and the Sub-Advisers, as relevant, provided to the Portfolios. The Board considered the Adviser’s services as investment manager to the Portfolios, including its services relating to the hiring and oversight of the Sub-Advisers and, in particular, their investment programs and personnel, succession management of key personnel, trading practices, compliance programs and personnel, and risk management
BHFTII-22
Brighthouse Funds Trust II
Jennison Growth Portfolio
Board of Trustees’ Consideration of Advisory and Sub-Advisory Agreements—(Continued)
programs, among other things. The Adviser’s services in coordinating and overseeing the activities of the Trusts’ other service providers were also considered. The Board also considered the systems and processes required by the Adviser to meet additional regulatory and compliance requirements resulting from U.S. Securities and Exchange Commission and other regulatory initiatives, including related to liquidity, valuation, and derivatives risk management. The Board considered information received from the Trusts’ Chief Compliance Officer regarding the Portfolios’ compliance policies and procedures that were established pursuant to Rule 38a-l under the 1940 Act, and relevant aspects of the Adviser’s and Sub-Advisers’ compliance policies and procedures. The Board also noted that it was the practice of the Adviser’s investment, compliance, and legal staff to conduct periodic meetings (through various media) with the Sub-Advisers throughout the year in order to review and assess the services that are provided to the Portfolios, and that personnel of the Adviser routinely prepare and present reports to the Board regarding those meetings. In addition, during the Meetings and throughout the year, the Board considered the expertise, experience, and performance of the personnel of the Adviser who performed the various services that are mentioned above.
With respect to the services provided by each of the Sub-Advisers, the Board considered a variety of information that the Adviser and each Sub-Adviser prepared for the Board’s review. The Board considered each Sub-Adviser’s investment process, each Sub-Adviser’s overall organization and business plans and the investment performance experienced by the Portfolio (as described in more detail below). The Board took into account that each Sub-Adviser’s responsibilities include, among other things, the development and maintenance of an investment program for the applicable Portfolio, the selection of investments and the placement of orders for the purchase and sale of such assets, and the implementation of compliance controls related to the performance of these services. The Board considered, based on the information provided, each Sub-Adviser’s staffing with respect to the management of the Portfolio and other information relating to the Sub-Adviser’s business and operations. The Board also considered the Sub-Adviser’s overall resources and information with respect to any recent turnover of key personnel at the Sub-Adviser. The Board reviewed each Sub-Adviser’s investment experience, as well as information provided regarding the Sub-Adviser’s personnel who provide services to the Portfolios. The Board also considered, among other things, information about each Sub-Adviser’s compliance program, including regarding any compliance matters involving a Sub-Adviser that had been brought to the Board’s attention during the year, as well as the Adviser’s assessment of the financial condition of each Sub-Adviser.
Performance. The Board placed emphasis on the performance of each Portfolio in the context of the performance of the relevant markets in which the Portfolio invests. The Board considered the Adviser’s quarterly presentations to the Board of detailed information about each Portfolio’s investment strategies and performance results and composition, including discussions regarding the relevant effects of market conditions. The Board reviewed and considered the reports prepared by Broadridge, which provided a statistical analysis comparing each Portfolio’s investment performance to that of comparable funds underlying variable insurance products (the “Performance Universe”), and the JDL Report. The Board also compared the performance of each Portfolio to that of comparable funds and other accounts that were managed by the relevant Sub-Adviser, to the extent such information was provided. The Board considered each Portfolio’s performance for periods subsequent to the performance period covered by the Broadridge reports and considered the Adviser’s assessment of the same. The Board also noted that while it found the data provided by Broadridge generally useful, it recognized the limitations of such data, including, in particular, that notable differences may exist between a Portfolio and the other funds in a Broadridge category (for example, with respect to investment strategies) and that the results of the performance comparisons may vary depending on (i) the end dates for the performance periods that were selected and (ii) the selection of the peer groups.
The Board focused particular attention on Portfolios with less favorable performance records. The Board noted the Adviser’s focus on each Sub-Adviser’s performance and that the Adviser had been active in monitoring and responding to any performance issues with respect to the Portfolios.
Fees and Expenses. The Board gave consideration to the level and method of computing the fees payable under the Agreements. The Board reviewed and considered the information in the JDL Report concerning fees and expenses. The Board also reviewed and considered the Broadridge report for each Portfolio, which included various comparisons of the Portfolio’s fees (at December 31, 2022 and various asset levels) and expenses with those of its peers, including, as applicable, a broad group of peer funds (“Expense Universe”), a narrower group of peer funds (“Expense Group”), a broad group of peer sub-advised funds (“Sub-advised Expense Universe”), and a narrower group of peer sub-advised funds (“Sub-advised Expense Group”). In particular, the Board reviewed comparisons of each Portfolio’s contractual management fees with its Expense Group and Sub-advised Expense Universe, contractual sub-adviser fees with its Sub-advised Expense Universe and Sub-advised Expense Group, and total expenses with its Expense Universe, Expense Group and Sub-advised Expense Universe. The Board considered that Broadridge selected the peer funds, which were funds underlying variable insurance products that Broadridge deemed to be comparable to the Portfolios. The Board considered that the fee and expense information in the Broadridge report for each Portfolio reflected information as of the Portfolio’s most recent fiscal year
BHFTII-23
Brighthouse Funds Trust II
Jennison Growth Portfolio
Board of Trustees’ Consideration of Advisory and Sub-Advisory Agreements—(Continued)
end at the time the Broadridge report was issued and that historical asset levels may differ from current asset levels, particularly in a period of market volatility. In addition, the Board compared the fee payable to a Sub-Adviser by the Adviser with respect to the Portfolio to the fee payable to the Sub-Adviser by other comparable funds and other accounts, to the extent such information was provided.
The Board noted that the sub-advisory fees for the Portfolios are negotiated at arm’s length by the Adviser and are paid by the Adviser out of its advisory fees. The Board also considered that the Adviser had entered into expense limitation or management fee waiver agreements with certain of the Portfolios pursuant to which the Adviser had agreed to waive a portion of its advisory fee and/or reimburse certain expenses as a means of limiting a Portfolio’s total annual operating expenses or passing through the benefit of a subadvisory fee concession to a Portfolio, as applicable.
Profitability. The Board examined the profitability to the Adviser of each Advisory Agreement, on a Portfolio-by-Portfolio basis. The Board also considered that an affiliate of the Adviser, Brighthouse Securities, LLC, serves as distributor for the Trusts, and, as such, receives Rule 12b-1 payments to support the distribution of the Portfolios. The Board considered the profitability to the Sub-Advisers and their affiliates of their relationships with the Portfolios, to the extent provided, and the Board considered the ability of the Adviser to negotiate with a Sub-Adviser at arm’s length. In reviewing the profitability information, the Board recognized that expense allocation methodologies are inherently subjective and various methodologies may be reasonable while producing different results.
Economies of scale. The Board considered each Portfolio’s fees in light of its size. The Board noted the fee schedules for the Portfolios that contain breakpoints that reduce the fee rate above specified asset levels, including breakpoints in the Advisory Agreements and any corresponding Sub-Advisory Agreement. The Board noted those Portfolios that did not have breakpoints in their advisory fees and considered management’s explanation of the same.
The Board considered the effective fees under the Advisory Agreement and Sub-Advisory Agreement for each Portfolio as a percentage of assets at different asset levels and possible economies of scale that may be realized if the assets of the Portfolio grow. The Board examined, among other data, the effect of a Portfolio’s growth in size, and reduction in size, on various fee schedules. The Board also generally noted that if a Portfolio’s assets increase over time, the Portfolio may realize economies of scale if assets increase proportionally more than certain other expenses.
Other factors. The Board considered other benefits that may be realized by the Adviser and its affiliates from their relationships with the Trusts. Among the benefits realized by the Adviser, the Board recognized that Brighthouse Securities, LLC, as the distributor for the Trusts, receives payments pursuant to Rule 12b-1 from the Portfolios to help compensate for the provision of shareholder services and distribution activities. The Board considered that a Sub-Adviser may engage in soft dollar transactions in managing a Portfolio. In addition, the Board considered that a Sub-Adviser may be affiliated with registered broker-dealers that may, from time to time, receive brokerage commissions from a Portfolio in connection with the sale of portfolio securities (subject to applicable best execution obligations). The Board also considered that a Sub-Adviser and its affiliates could benefit from the opportunity to provide advisory services to additional portfolios of the Trusts and overall reputational benefits.
The Board considered information from the Adviser and Sub-Advisers pertaining to potential conflicts of interest, and the manner in which any potential conflicts were mitigated. In its review, the Board considered information regarding various business relationships among the Adviser and its affiliates and various Sub-Advisers and their affiliates. The Board also considered information about services and/or payments provided to the Adviser by the Sub-Advisers in connection with marketing activities. The Board considered representations from the Adviser that such business relationships and any payments were not considered in the Adviser’s recommendation to renew any of the Sub-Advisory Agreements.
* * * * *
Jennison Growth Portfolio. The Board also considered the following information in relation to the Agreements with the Adviser and Jennison Associates LLC regarding the Portfolio:
Among other data relating specifically to the Portfolio’s performance, the Board considered that the Portfolio outperformed the median of its Performance Universe and the average of its Morningstar Category for the one- and five-year periods ended June 30, 2023 and underperformed the median of its Performance Universe and the average of its Morningstar Category for the three-year period ended June 30, 2023. The Board further considered that the Portfolio outperformed its benchmark, the Russell 1000 Growth Index, for the one-year period ended October 31, 2023 and underperformed its benchmark for the three-and five-year periods ended October 31, 2023. The Board also noted the presence of certain management fee waivers in effect for the Portfolio.
BHFTII-24
Brighthouse Funds Trust II
Jennison Growth Portfolio
Board of Trustees’ Consideration of Advisory and Sub-Advisory Agreements—(Continued)
The Board also considered that the Portfolio’s actual management fees and total expenses (exclusive of 12b-l fees) were below the Expense Group median, the Expense Universe median, and the Sub-advised Expense Universe median. The Board noted that the Portfolio’s contractual management fees were above the asset-weighted average of the Investment Classification/Morningstar Category selected by Broadridge at the Portfolio’s current size. The Board also noted that the Portfolio’s contractual sub-advisory fees were below the averages of the Sub-advised Expense Universe and the Sub-advised Expense Group at the Portfolio’s current size.
BHFTII-25
Brighthouse Funds Trust II
Loomis Sayles Small Cap Core Portfolio
Managed By Loomis, Sayles & Company, L.P.
Portfolio Manager Commentary*
PERFORMANCE
For the twelve months ended December 31, 2023, the Class A, B and E shares of the Loomis Sayles Small Cap Core Portfolio returned 17.46%, 17.18%, and 17.29%, respectively. The Portfolio’s benchmark, the Russell 2000 Index¹, returned 16.93%.
MARKET ENVIRONMENT / CONDITIONS
The U.S. equity market overcame several potential headwinds to post a robust total return in 2023. The interest-rate outlook was a key driver of volatility throughout the year, as the U.S. Federal Reserve (the “Fed”) continued to raise rates—albeit at a slower pace than in 2022—to combat inflation. This issue became more prominent in late summer and early autumn, when rising energy prices fueled concerns that persistent inflation could compel the Fed to keep rates “higher for longer”. The backdrop changed considerably in the fourth quarter after a series of cooler-than-expected inflation reports. In addition, Fed Chairman Jerome Powell surprised the markets in December by indicating that the central bank was likely finished raising rates and possibly on track to begin enacting rate cuts in 2024. Not least, it appeared that gross domestic product growth would remain in positive territory and allow the Fed to achieve the ideal outcome of a “soft landing” for the economy. Stocks surged in response, bringing most major large-cap indexes to near all-time highs by year-end. The late year rally was broad-based, with strong participation from market segments—including the value style, small caps, and mid caps—that had underperformed for most of 2023. Despite this shift, larger cap and growth stocks were the key source of market leadership over the full year. Mega-cap technology-related companies produced particularly impressive gains that were fueled, in part, by excitement about the long-term prospects for artificial intelligence.
Within the small cap market segment, overall returns for the year were strong but were not without volatility. The Russell 2000 Index began the year with a strong “January effect,” returning almost 10% for the month with the rally led by the lowest quality stocks and those segments that underperformed in 2022. For the balance of the year, and particularly within the third quarter, investors took a more defensive posture and “risk-off” leadership drove returns in the small cap market. To close the year, the market had a strong reversal in leadership and reflected a pivot to a “risk-on” market led by lower quality stocks.
PORTFOLIO REVIEW / PERIOD END POSITIONING
The Loomis Sayles Small Cap Core Portfolio outperformed the Russell 2000 Index (the “Index”) during the twelve months ended December 31, 2023, as both sector allocation and stock selection metrics aided relative return. Despite a reversal in performance versus the benchmark during the fourth quarter, two key factors accounted for the outperformance. First, higher quality stocks generally outperformed lower quality stocks within the Index for the year. The Portfolio features an orientation toward fundamentally sound businesses, and for most of 2023, high quality stocks outperformed weaker businesses and poorly financed enterprises with the exception of the two market periods noted above in which the Portfolio lagged the benchmark. The second component of the outperformance can be attributed to successful portfolio changes over recent quarters as multiple top contributors to portfolio return were purchased over the past 18 months. An overweight to the Industrials sector and underweight to Utilities were beneficial as was strong stock selection within the Energy, Consumer Staples, and Information Technology (“IT”) sectors. Offsetting these positives was an underweight to the Consumer Discretionary sector and trailing stock selection in the Industrials and Financials sectors. The largest detractor to performance, however, was within the Health Care sector where stock selection lagged the Index significantly as several companies experienced fundamental decline, resulting in a negative return for the Portfolio in the sector.
The two largest contributors to performance at the individual security level were Rambus, Inc., and energy company Weatherford International. Rambus develops and designs semiconductors and maintains intellectual property for high-speed component-to-component interface technology, with data centers as an example of a large end market. Our investment thesis from the time of our initial investment in April 2021 is unfolding as expected, with the latest generation of dynamic random-access memory reaching market adoption and potentially increasing the total addressable market for Rambus interface technology by a significant amount. Weatherford, a provider of equipment and services to the oil and natural gas industry, was added to the Portfolio in July 2022. The company has a long history, but the current business emerged from bankruptcy in late 2019 with a streamlined business, new management, and a dramatically improved financial footing. Since emergence, the company has demonstrated solid progress in improving business practices, increasing margins, and paying down high-cost debt with ample free cash flow. Analyst coverage was low and investor sentiment was weak at the time of our initial purchase, but the stock has steadily gained attention with meaningful improvement in the earnings and cash flow of the business.
The Portfolio’s largest detractors included Veradigm Inc. and OceanFirst Financial Corp. Health Care technology company Veradigm (formerly known as Allscripts) is an electronic medical records provider. In the first quarter of 2023, the company announced an internal control failure would result in a restatement of earnings. We reduced the Portfolio’s position on the news but delayed selling the Portfolio’s remaining position until later in the year after the company failed to resolve certain accounting deficiencies within the time frame we had expected. At the time of the final sale of the shares, the weight of the holding was a small weight in the Portfolio. OceanFirst Financial is a regional bank focused on small and mid-sized customers in New York and New Jersey. We believe that the bank’s above average lending exposure to office buildings are at risk of increased credit losses due to a decline in the market value of these properties, evidenced by a large write-down on one Manhattan property during the third quarter. We sold the position and deployed much of the proceeds into other bank stock holdings in the Portfolio.
BHFTII-1
Brighthouse Funds Trust II
Loomis Sayles Small Cap Core Portfolio
Managed By Loomis, Sayles & Company, L.P.
Portfolio Manager Commentary*—(Continued)
During the period, we added new stocks with attractive investment potential and eliminated holdings where the valuation had exceeded our target levels or where fundamentals no longer fit our investment thesis. New positions included Moog Inc., a manufacturer of highly engineered and critical components and subsystems for commercial and defense aircraft; Tidewater Inc., a provider of equipment and services to the oil and natural gas industry; and Knife River Corporation, a provider of construction materials and services to municipalities for transportation infrastructure. Knife was a spin-off from an existing utility holding, and we added to the original position post-spin. In addition to Veradigm and OceanFirst, the largest positions eliminated included engineering and construction firm AECOM; instant automobile oil change provider Valvoline Inc.; and CVB Financial Corp., a bank holding company offering community banking services in California.
Sector weight changes during the period ending December 31, 2023 reflected both our repositioning within the Portfolio as well as market impacts. As a result of individual stock selection, our weights in the Health Care and IT sectors were reduced while weights to the Industrials and Energy sectors increased.
At the end of 2023, the Portfolio continued to be positioned in the larger capitalization range of the small cap universe and focused on those companies featuring higher quality business models and balance sheets, with good earnings visibility and continued growth potential. Through the stock selection process, the Portfolio was broadly diversified across all economic sectors, with a relative overweight to the Industrials and Energy sectors while underweight to the Consumer Discretionary, Health Care and Real Estate sectors versus the Index.
Mark Burns
John Slavik
Joe Gatz
Jeff Schwatz
Portfolio Managers
Loomis, Sayles & Company, L.P.
* This commentary may include statements that constitute “forward-looking statements” under the U.S. securities laws. Forward-looking statements include, among other things, projections, estimates, and information about possible or future results related to the Portfolio, market or regulatory developments. The views expressed above are not guarantees of future performance or economic results and involve certain risks, uncertainties and assumptions that could cause actual outcomes and results to differ materially from the views expressed herein. The views expressed above are subject to change at any time based upon economic, market, or other conditions and the subadvisory firm undertakes no obligation to update the views expressed herein. Any discussions of specific securities should not be considered a recommendation to buy or sell those securities. The views expressed above (including any forward-looking statement) may not be relied upon as investment advice or as an indication of the Portfolio’s trading intent. Information about the Portfolio’s holdings, asset allocation or country diversification is historical and is not an indication of future Portfolio composition, which may vary. Direct investment in any index is not possible. The performance of any index mentioned in this commentary has not been adjusted for ongoing management, distribution and operating expenses, and sales charges applicable to mutual fund investments. In addition, the returns do not reflect additional fees charged by separate accounts or variable insurance contracts that an investor in the Portfolio may pay. If these additional fees were reflected, performance would have been lower.
1 The Russell 2000 Index is an unmanaged measure of performance of the 2,000 smallest companies in the Russell 3000 Index.
BHFTII-2
Brighthouse Funds Trust II
Loomis Sayles Small Cap Core Portfolio
A $10,000 INVESTMENT COMPARED TO THE RUSSELL 2000 INDEX
AVERAGE ANNUAL RETURNS (%) FOR THE YEAR ENDED DECEMBER 31, 2023
| 1 Year | 5 Year | 10 Year | ||||||||||
| Loomis Sayles Small Cap Core Portfolio | ||||||||||||
| Class A |
17.46 | 11.35 | 7.90 | |||||||||
| Class B |
17.18 | 11.07 | 7.63 | |||||||||
| Class E |
17.29 | 11.18 | 7.74 | |||||||||
| Russell 2000 Index | 16.93 | 9.97 | 7.16 | |||||||||
Portfolio performance is calculated including reinvestment of all income and capital gain distributions. Performance numbers are net of all Portfolio expenses but do not include any insurance, sales, separate account or administrative charges of variable annuity or life insurance contracts or any additional expenses that participants may bear relating to the operations of their plans. If these charges were included, the returns would be lower. The performance of any index referenced above has not been adjusted for ongoing management, distribution and operating expenses, and sales charges applicable to mutual fund investments. Direct investment in any index is not possible. The performance of Class A shares, as set forth in the line graph above, will differ from that of other classes because of the difference in expenses paid by policyholders investing in the different share classes.
This information represents past performance and is not indicative of future results. Investment return and principal value may fluctuate so that shares, upon redemption, may be worth more or less than the original cost.
PORTFOLIO COMPOSITION AS OF DECEMBER 31, 2023
Top Holdings
| % of Net Assets |
||||
| Weatherford International PLC | 2.4 | |||
| Noble Corp. PLC | 1.4 | |||
| Moog, Inc. - Class A | 1.3 | |||
| Vontier Corp. | 1.3 | |||
| McGrath RentCorp | 1.2 | |||
| Northern Oil & Gas, Inc. | 1.2 | |||
| Clean Harbors, Inc. | 1.2 | |||
| Rambus, Inc. | 1.2 | |||
| Kadant, Inc. | 1.2 | |||
| Federal Agricultural Mortgage Corp.- Class C | 1.2 | |||
Top Sectors
| % of Net Assets |
||||
| Industrials | 25.2 | |||
| Financials | 15.5 | |||
| Information Technology | 12.6 | |||
| Health Care | 11.9 | |||
| Energy | 10.4 | |||
| Consumer Discretionary | 7.3 | |||
| Consumer Staples | 4.4 | |||
| Materials | 3.6 | |||
| Real Estate | 3.0 | |||
| Communication Services | 1.9 | |||
BHFTII-3
Brighthouse Funds Trust II
Loomis Sayles Small Cap Core Portfolio
Understanding Your Portfolio’s Expenses
Shareholder Expense Example
As a shareholder of the Portfolio, you incur ongoing costs, including management fees; distribution and service (12b-1) fees; and other Portfolio expenses. This example is intended to help you understand your ongoing costs (in dollars) (referred to as “expenses”) of investing in the Portfolio and compare these costs with the ongoing costs of investing in other mutual funds. The example is based on an investment of $1,000 invested at the beginning of the period and held for the entire period, July 1, 2023 through December 31, 2023.
Actual Expenses
The first line for each share class of the Portfolio in the table below provides information about actual account values and actual expenses. You may use the information in this line, together with the amount you invested in the particular share class of the Portfolio, to estimate the expenses that you paid over the period. Simply divide your account value by $1,000 (for example, an $8,600 account value divided by $1,000 = 8.6), then multiply the result by the number in the first line under the heading entitled “Expenses Paid During Period” to estimate the expenses you paid on your account during this period.
Hypothetical Example for Comparison Purposes
The second line for each share class of the Portfolio in the table below provides information about hypothetical account values and hypothetical expenses based on the Portfolio’s actual expense ratio and an assumed rate of return of 5% per year before expenses, which is not the Portfolio’s actual return. The hypothetical account values and expenses may not be used to estimate the actual ending account balance or expenses you paid for the period. You may use this information to compare the ongoing costs of investing in the Portfolio and other funds. To do so, compare this 5% hypothetical example with the 5% hypothetical examples that appear in the shareholder reports of the other funds.
Please note that the expenses shown in the table are meant to highlight your ongoing costs only and do not reflect any fees or charges of your variable insurance product or any additional expenses that participants in certain eligible qualified plans may bear relating to the operations of their plan. Therefore, the second line for each share class in the table is useful in comparing ongoing costs only, and will not help you determine the relative total costs of owning different funds. In addition, if these other costs were included, your costs would have been higher.
| Loomis Sayles Small Cap Core Portfolio |
Annualized Expense Ratio |
Beginning Account Value July 1, 2023 |
Ending Account Value December 31, 2023 |
Expenses Paid During Period** July 1, 2023 to December 31, 2023 |
||||||||||||||
| Class A (a) |
Actual | 0.90 | % | $ | 1,000.00 | $ | 1,072.60 | $ | 4.70 | |||||||||
| Hypothetical* | 0.90 | % | $ | 1,000.00 | $ | 1,020.67 | $ | 4.58 | ||||||||||
| Class B (a) |
Actual | 1.15 | % | $ | 1,000.00 | $ | 1,071.30 | $ | 6.00 | |||||||||
| Hypothetical* | 1.15 | % | $ | 1,000.00 | $ | 1,019.41 | $ | 5.85 | ||||||||||
| Class E (a) |
Actual | 1.05 | % | $ | 1,000.00 | $ | 1,071.90 | $ | 5.48 | |||||||||
| Hypothetical* | 1.05 | % | $ | 1,000.00 | $ | 1,019.91 | $ | 5.35 | ||||||||||
| * | Hypothetical assumes a rate of return of 5% per year before expenses. |
| ** | Expenses paid are equal to the Portfolio’s annualized expense ratio for the most recent six month period, as shown above, multiplied by the average account value over the period, multiplied by the number of days (184 days) in the most recent fiscal half-year, divided by 365 (to reflect the one-half year period). |
| (a) | The annualized expense ratio shown reflects the impact of the management fee waiver as described in Note 5 of the Notes to Financial Statements. |
BHFTII-4
Brighthouse Funds Trust II
Loomis Sayles Small Cap Core Portfolio
Schedule of Investments as of December 31, 2023
Common Stocks—97.1% of Net Assets
| Security Description | Shares | Value | ||||||
| Aerospace & Defense—4.0% | ||||||||
| AAR Corp. (a) |
15,338 | $ | 957,091 | |||||
| Hexcel Corp. |
15,144 | 1,116,870 | ||||||
| Kratos Defense & Security Solutions, Inc. (a) |
61,279 | 1,243,351 | ||||||
| Leonardo DRS, Inc. (a) |
131,211 | 2,629,469 | ||||||
| Mercury Systems, Inc. (a) |
52,734 | 1,928,482 | ||||||
| Moog, Inc. - Class A |
34,935 | 5,057,889 | ||||||
| V2X, Inc. (a) |
49,236 | 2,286,520 | ||||||
|
|
|
|||||||
| 15,219,672 | ||||||||
|
|
|
|||||||
| Automobile Components—0.7% | ||||||||
| Dorman Products, Inc. (a) |
6,362 | 530,654 | ||||||
| Gentherm, Inc. (a) (b) |
13,406 | 701,938 | ||||||
| Modine Manufacturing Co. (a) |
7,630 | 455,511 | ||||||
| Patrick Industries, Inc. (b) |
9,993 | 1,002,798 | ||||||
|
|
|
|||||||
| 2,690,901 | ||||||||
|
|
|
|||||||
| Banks—8.7% | ||||||||
| Ameris Bancorp (b) |
66,238 | 3,513,926 | ||||||
| Bancorp, Inc. (a) |
26,085 | 1,005,838 | ||||||
| Cadence Bank |
102,092 | 3,020,902 | ||||||
| Home BancShares, Inc. |
140,402 | 3,556,383 | ||||||
| Hope Bancorp, Inc. |
133,280 | 1,610,022 | ||||||
| Pinnacle Financial Partners, Inc. |
38,411 | 3,350,207 | ||||||
| Popular, Inc. |
43,944 | 3,606,484 | ||||||
| Prosperity Bancshares, Inc. |
50,858 | 3,444,612 | ||||||
| SouthState Corp. |
40,268 | 3,400,633 | ||||||
| Wintrust Financial Corp. |
41,429 | 3,842,540 | ||||||
| WSFS Financial Corp. |
53,803 | 2,471,172 | ||||||
|
|
|
|||||||
| 32,822,719 | ||||||||
|
|
|
|||||||
| Beverages—0.2% | ||||||||
| Vita Coco Co., Inc. (a) |
26,276 | 673,979 | ||||||
|
|
|
|||||||
| Biotechnology—2.3% | ||||||||
| Alkermes PLC (a) |
76,666 | 2,126,715 | ||||||
| Inhibrx, Inc. (a) |
23,579 | 896,002 | ||||||
| Insmed, Inc. (a) |
33,052 | 1,024,282 | ||||||
| United Therapeutics Corp. (a) |
11,589 | 2,548,305 | ||||||
| Vericel Corp. (a) |
24,871 | 885,656 | ||||||
| Xencor, Inc. (a) |
21,536 | 457,209 | ||||||
| Xenon Pharmaceuticals, Inc. (a) |
15,436 | 710,982 | ||||||
|
|
|
|||||||
| 8,649,151 | ||||||||
|
|
|
|||||||
| Building Products—3.6% | ||||||||
| AZEK Co., Inc. (a) |
33,861 | 1,295,183 | ||||||
| CSW Industrials, Inc. |
5,935 | 1,230,978 | ||||||
| Griffon Corp. |
47,172 | 2,875,134 | ||||||
| Janus International Group, Inc. (a) (b) |
172,577 | 2,252,130 | ||||||
| Quanex Building Products Corp. |
70,929 | 2,168,300 | ||||||
| UFP Industries, Inc. |
30,102 | 3,779,306 | ||||||
|
|
|
|||||||
| 13,601,031 | ||||||||
|
|
|
|||||||
| Capital Markets—1.8% | ||||||||
| Hamilton Lane, Inc. - Class A |
11,438 | 1,297,527 | ||||||
| P10, Inc. - Class A |
104,688 | 1,069,911 | ||||||
| Capital Markets—(Continued) | ||||||||
| Piper Sandler Cos. |
2,434 | 425,634 | ||||||
| PJT Partners, Inc. - Class A |
11,788 | 1,200,844 | ||||||
| Stifel Financial Corp. |
37,903 | 2,620,992 | ||||||
|
|
|
|||||||
| 6,614,908 | ||||||||
|
|
|
|||||||
| Chemicals—2.2% | ||||||||
| Ashland, Inc. |
20,758 | 1,750,107 | ||||||
| Cabot Corp. (b) |
34,908 | 2,914,818 | ||||||
| Ecovyst, Inc. (a) |
216,145 | 2,111,736 | ||||||
| LSB Industries, Inc. (a) |
177,057 | 1,648,401 | ||||||
|
|
|
|||||||
| 8,425,062 | ||||||||
|
|
|
|||||||
| Commercial Services & Supplies—3.2% | ||||||||
| ACV Auctions, Inc. - Class A (a) |
53,360 | 808,404 | ||||||
| Casella Waste Systems, Inc. - Class A (a) |
16,300 | 1,392,998 | ||||||
| CECO Environmental Corp. (a) |
78,993 | 1,601,978 | ||||||
| Clean Harbors, Inc. (a) |
25,906 | 4,520,856 | ||||||
| Vestis Corp. |
83,038 | 1,755,423 | ||||||
| VSE Corp. |
31,096 | 2,009,113 | ||||||
|
|
|
|||||||
| 12,088,772 | ||||||||
|
|
|
|||||||
| Communications Equipment—0.7% | ||||||||
| Calix, Inc. (a) |
16,687 | 729,055 | ||||||
| Viavi Solutions, Inc. (a) (b) |
192,881 | 1,942,312 | ||||||
|
|
|
|||||||
| 2,671,367 | ||||||||
|
|
|
|||||||
| Construction & Engineering—2.2% | ||||||||
| Arcosa, Inc. |
52,134 | 4,308,354 | ||||||
| Construction Partners, Inc. - Class A (a) |
12,332 | 536,689 | ||||||
| MDU Resources Group, Inc. |
111,863 | 2,214,887 | ||||||
| Sterling Infrastructure, Inc. (a) |
5,120 | 450,201 | ||||||
| WillScot Mobile Mini Holdings Corp. (a) |
17,860 | 794,770 | ||||||
|
|
|
|||||||
| 8,304,901 | ||||||||
|
|
|
|||||||
| Construction Materials—0.9% | ||||||||
| Knife River Corp. (a) |
49,611 | 3,283,256 | ||||||
|
|
|
|||||||
| Consumer Staples Distribution & Retail—0.9% | ||||||||
| Andersons, Inc. |
55,634 | 3,201,180 | ||||||
|
|
|
|||||||
| Diversified Consumer Services—0.2% | ||||||||
| Grand Canyon Education, Inc. (a) |
5,610 | 740,744 | ||||||
|
|
|
|||||||
| Electric Utilities—0.5% | ||||||||
| ALLETE, Inc. |
33,428 | 2,044,457 | ||||||
|
|
|
|||||||
| Electrical Equipment—0.6% | ||||||||
| Atkore, Inc. (a) (b) |
14,808 | 2,369,280 | ||||||
|
|
|
|||||||
| Electronic Equipment, Instruments & Components—5.9% | ||||||||
| Advanced Energy Industries, Inc. (b) |
9,306 | 1,013,609 | ||||||
| Bel Fuse, Inc. - Class B |
35,200 | 2,350,304 | ||||||
| Crane NXT Co. |
43,725 | 2,486,641 | ||||||
| Itron, Inc. (a) (b) |
11,326 | 855,226 | ||||||
| Littelfuse, Inc. |
9,348 | 2,501,151 | ||||||
See accompanying notes to financial statements.
BHFTII-5
Brighthouse Funds Trust II
Loomis Sayles Small Cap Core Portfolio
Schedule of Investments as of December 31, 2023
Common Stocks—(Continued)
| Security Description | Shares | Value | ||||||
| Electronic Equipment, Instruments & Components—(Continued) | ||||||||
| Novanta, Inc. (a) |
6,229 | $ | 1,049,026 | |||||
| Rogers Corp. (a) |
9,332 | 1,232,477 | ||||||
| TD SYNNEX Corp. |
29,803 | 3,207,101 | ||||||
| TTM Technologies, Inc. (a) |
177,138 | 2,800,552 | ||||||
| Vontier Corp. |
137,600 | 4,754,080 | ||||||
|
|
|
|||||||
| 22,250,167 | ||||||||
|
|
|
|||||||
| Energy Equipment & Services—6.2% | ||||||||
| Cactus, Inc. - Class A (b) |
23,260 | 1,056,004 | ||||||
| ChampionX Corp. |
82,665 | 2,414,645 | ||||||
| Newpark Resources, Inc. (a) |
163,790 | 1,087,566 | ||||||
| Noble Corp. PLC |
107,320 | 5,168,531 | ||||||
| Oceaneering International, Inc. (a) |
32,018 | 681,343 | ||||||
| Tidewater, Inc. (a) |
54,156 | 3,905,189 | ||||||
| Weatherford International PLC (a) |
93,812 | 9,177,628 | ||||||
|
|
|
|||||||
| 23,490,906 | ||||||||
|
|
|
|||||||
| Entertainment—0.6% | ||||||||
| Atlanta Braves Holdings, Inc. - Class C (a) |
57,922 | 2,292,553 | ||||||
|
|
|
|||||||
| Financial Services—3.3% | ||||||||
| Euronet Worldwide, Inc. (a) |
25,039 | 2,541,208 | ||||||
| EVERTEC, Inc. |
30,672 | 1,255,712 | ||||||
| Federal Agricultural Mortgage Corp. - Class C |
22,831 | 4,365,744 | ||||||
| International Money Express, Inc. (a) |
97,840 | 2,161,286 | ||||||
| WEX, Inc. (a) |
11,361 | 2,210,282 | ||||||
|
|
|
|||||||
| 12,534,232 | ||||||||
|
|
|
|||||||
| Food Products—1.3% | ||||||||
| J & J Snack Foods Corp. |
7,774 | 1,299,346 | ||||||
| Nomad Foods Ltd. (a) |
122,895 | 2,083,070 | ||||||
| Simply Good Foods Co. (a) |
25,086 | 993,406 | ||||||
| Sovos Brands, Inc. (a) |
18,989 | 418,328 | ||||||
|
|
|
|||||||
| 4,794,150 | ||||||||
|
|
|
|||||||
| Ground Transportation—0.2% | ||||||||
| Marten Transport Ltd. (b) |
33,151 | 695,508 | ||||||
|
|
|
|||||||
| Health Care Equipment & Supplies—4.2% | ||||||||
| AtriCure, Inc. (a) |
18,177 | 648,737 | ||||||
| Axonics, Inc. (a) |
17,758 | 1,105,080 | ||||||
| CONMED Corp. |
24,054 | 2,634,154 | ||||||
| Embecta Corp. |
37,405 | 708,077 | ||||||
| Glaukos Corp. (a) |
9,551 | 759,209 | ||||||
| Inmode Ltd. (a) (b) |
65,641 | 1,459,856 | ||||||
| Lantheus Holdings, Inc. (a) |
48,565 | 3,011,030 | ||||||
| LivaNova PLC (a) |
12,577 | 650,734 | ||||||
| Merit Medical Systems, Inc. (a) (b) |
16,772 | 1,274,001 | ||||||
| PROCEPT BioRobotics Corp. (a) (b) |
18,102 | 758,655 | ||||||
| UFP Technologies, Inc. (a) |
15,885 | 2,732,855 | ||||||
|
|
|
|||||||
| 15,742,388 | ||||||||
|
|
|
|||||||
| Health Care Providers & Services—3.0% | ||||||||
| Acadia Healthcare Co., Inc. (a) |
10,207 | 793,696 | ||||||
| Ensign Group, Inc. |
8,857 | 993,844 | ||||||
| HealthEquity, Inc. (a) |
10,533 | 698,338 | ||||||
| Health Care Providers & Services—(Continued) | ||||||||
| Option Care Health, Inc. (a) |
115,610 | 3,894,901 | ||||||
| Progyny, Inc. (a) |
23,851 | 886,780 | ||||||
| RadNet, Inc. (a) |
15,385 | 534,936 | ||||||
| Tenet Healthcare Corp. (a) |
46,510 | 3,514,761 | ||||||
|
|
|
|||||||
| 11,317,256 | ||||||||
|
|
|
|||||||
| Health Care Technology—0.3% | ||||||||
| Evolent Health, Inc. - Class A (a) |
28,635 | 945,814 | ||||||
|
|
|
|||||||
| Hotels, Restaurants & Leisure—1.5% | ||||||||
| Churchill Downs, Inc. |
21,806 | 2,942,283 | ||||||
| Life Time Group Holdings, Inc. (a) |
50,345 | 759,203 | ||||||
| Papa John’s International, Inc. (b) |
9,286 | 707,872 | ||||||
| Texas Roadhouse, Inc. |
10,632 | 1,299,549 | ||||||
|
|
|
|||||||
| 5,708,907 | ||||||||
|
|
|
|||||||
| Household Durables—1.7% | ||||||||
| Installed Building Products, Inc. |
7,586 | 1,386,873 | ||||||
| KB Home |
40,896 | 2,554,364 | ||||||
| Skyline Champion Corp. (a) |
33,628 | 2,497,215 | ||||||
|
|
|
|||||||
| 6,438,452 | ||||||||
|
|
|
|||||||
| Household Products—0.6% | ||||||||
| Spectrum Brands Holdings, Inc. (b) |
27,956 | 2,230,050 | ||||||
|
|
|
|||||||
| Independent Power and Renewable Electricity Producers—0.4% | ||||||||
| Talen Energy Corp. (a) |
23,219 | 1,486,016 | ||||||
|
|
|
|||||||
| Industrial REITs—0.8% | ||||||||
| STAG Industrial, Inc. |
79,648 | 3,126,981 | ||||||
|
|
|
|||||||
| Insurance—1.8% | ||||||||
| BRP Group, Inc. - Class A (a) (b) |
33,385 | 801,908 | ||||||
| Employers Holdings, Inc. |
58,245 | 2,294,853 | ||||||
| Goosehead Insurance, Inc. - Class A (a) |
13,073 | 990,933 | ||||||
| Kemper Corp. |
39,719 | 1,933,124 | ||||||
| Kinsale Capital Group, Inc. (b) |
1,850 | 619,583 | ||||||
|
|
|
|||||||
| 6,640,401 | ||||||||
|
|
|
|||||||
| Leisure Products—0.9% | ||||||||
| Brunswick Corp. |
29,472 | 2,851,416 | ||||||
| Malibu Boats, Inc. - Class A (a) (b) |
11,669 | 639,695 | ||||||
|
|
|
|||||||
| 3,491,111 | ||||||||
|
|
|
|||||||
| Life Sciences Tools & Services—0.3% | ||||||||
| Medpace Holdings, Inc. (a) |
3,570 | 1,094,312 | ||||||
|
|
|
|||||||
| Machinery—3.6% | ||||||||
| Albany International Corp. - Class A |
38,878 | 3,818,597 | ||||||
| Columbus McKinnon Corp. |
45,830 | 1,788,287 | ||||||
| ESCO Technologies, Inc. |
8,969 | 1,049,642 | ||||||
| Kadant, Inc. |
15,680 | 4,395,261 | ||||||
| RBC Bearings, Inc. (a) (b) |
3,995 | 1,138,135 | ||||||
| Wabash National Corp. (b) |
52,848 | 1,353,966 | ||||||
|
|
|
|||||||
| 13,543,888 | ||||||||
|
|
|
|||||||
See accompanying notes to financial statements.
BHFTII-6
Brighthouse Funds Trust II
Loomis Sayles Small Cap Core Portfolio
Schedule of Investments as of December 31, 2023
Common Stocks—(Continued)
| Security Description | Shares | Value | ||||||
| Marine Transportation—0.6% | ||||||||
| Genco Shipping & Trading Ltd. |
146,709 | $ | 2,433,902 | |||||
|
|
|
|||||||
| Media—0.4% | ||||||||
| John Wiley & Sons, Inc. - Class A |
43,703 | 1,387,133 | ||||||
|
|
|
|||||||
| Metals & Mining—0.5% | ||||||||
| ATI, Inc. (a) (b) |
19,044 | 865,931 | ||||||
| Worthington Steel, Inc. (a) (b) |
36,316 | 1,020,479 | ||||||
|
|
|
|||||||
| 1,886,410 | ||||||||
|
|
|
|||||||
| Office REITs—0.8% | ||||||||
| Equity Commonwealth |
110,536 | 2,122,291 | ||||||
| Postal Realty Trust, Inc. - Class A |
66,005 | 961,033 | ||||||
|
|
|
|||||||
| 3,083,324 | ||||||||
|
|
|
|||||||
| Oil, Gas & Consumable Fuels—4.1% | ||||||||
| Antero Resources Corp. (a) |
72,826 | 1,651,694 | ||||||
| California Resources Corp. (b) |
50,895 | 2,782,938 | ||||||
| Delek U.S. Holdings, Inc. |
74,012 | 1,909,510 | ||||||
| International Seaways, Inc. |
48,478 | 2,204,779 | ||||||
| Kosmos Energy Ltd. (a) |
264,510 | 1,774,862 | ||||||
| Magnolia Oil & Gas Corp. - Class A (b) |
34,130 | 726,628 | ||||||
| Northern Oil & Gas, Inc. (b) |
123,161 | 4,565,578 | ||||||
|
|
|
|||||||
| 15,615,989 | ||||||||
|
|
|
|||||||
| Personal Care Products—1.5% | ||||||||
| BellRing Brands, Inc. (a) |
71,702 | 3,974,442 | ||||||
| elf Beauty, Inc. (a) (b) |
5,559 | 802,386 | ||||||
| Inter Parfums, Inc. |
6,804 | 979,844 | ||||||
|
|
|
|||||||
| 5,756,672 | ||||||||
|
|
|
|||||||
| Pharmaceuticals—1.9% | ||||||||
| ANI Pharmaceuticals, Inc. (a) |
36,524 | 2,013,933 | ||||||
| Pacira BioSciences, Inc. (a) |
66,138 | 2,231,496 | ||||||
| Supernus Pharmaceuticals, Inc. (a) |
106,821 | 3,091,400 | ||||||
|
|
|
|||||||
| 7,336,829 | ||||||||
|
|
|
|||||||
| Professional Services—3.5% | ||||||||
| Alight, Inc. - Class A (a) |
309,037 | 2,636,086 | ||||||
| Concentrix Corp. |
22,364 | 2,196,369 | ||||||
| CSG Systems International, Inc. (b) |
30,391 | 1,617,105 | ||||||
| FTI Consulting, Inc. (a) |
3,709 | 738,647 | ||||||
| Huron Consulting Group, Inc. (a) |
7,790 | 800,812 | ||||||
| ICF International, Inc. |
5,862 | 786,036 | ||||||
| KBR, Inc. |
15,154 | 839,683 | ||||||
| Korn Ferry |
38,035 | 2,257,377 | ||||||
| Science Applications International Corp. |
10,370 | 1,289,198 | ||||||
|
|
|
|||||||
| 13,161,313 | ||||||||
|
|
|
|||||||
| Real Estate Management & Development—0.8% | ||||||||
| Colliers International Group, Inc. (b) |
23,447 | 2,966,515 | ||||||
|
|
|
|||||||
| Retail REITs—0.6% | ||||||||
| Agree Realty Corp. |
34,862 | 2,194,563 | ||||||
|
|
|
|||||||
| Semiconductors & Semiconductor Equipment—3.3% | ||||||||
| MACOM Technology Solutions Holdings, Inc. (a) (b) |
18,204 | 1,692,062 | ||||||
| MKS Instruments, Inc. |
24,906 | 2,562,080 | ||||||
| Onto Innovation, Inc. (a) |
7,732 | 1,182,223 | ||||||
| Rambus, Inc. (a) |
64,550 | 4,405,538 | ||||||
| Semtech Corp. (a) (b) |
82,240 | 1,801,878 | ||||||
| Silicon Laboratories, Inc. (a) |
7,263 | 960,677 | ||||||
|
|
|
|||||||
| 12,604,458 | ||||||||
|
|
|
|||||||
| Software—2.0% | ||||||||
| Agilysys, Inc. (a) |
6,538 | 554,553 | ||||||
| Clearwater Analytics Holdings, Inc. - Class A (a) |
34,772 | 696,483 | ||||||
| HashiCorp, Inc. - Class A (a) |
55,138 | 1,303,462 | ||||||
| Intapp, Inc. (a) |
21,845 | 830,547 | ||||||
| Tenable Holdings, Inc. (a) |
20,530 | 945,612 | ||||||
| Varonis Systems, Inc. (a) |
30,080 | 1,362,022 | ||||||
| Vertex, Inc. - Class A (a) |
30,155 | 812,376 | ||||||
| Workiva, Inc. (a) (b) |
9,156 | 929,609 | ||||||
|
|
|
|||||||
| 7,434,664 | ||||||||
|
|
|
|||||||
| Specialty Retail—1.2% | ||||||||
| Academy Sports & Outdoors, Inc. |
34,779 | 2,295,414 | ||||||
| Boot Barn Holdings, Inc. (a) (b) |
28,649 | 2,199,097 | ||||||
|
|
|
|||||||
| 4,494,511 | ||||||||
|
|
|
|||||||
| Technology Hardware, Storage & Peripherals—0.7% | ||||||||
| Pure Storage, Inc. - Class A (a) |
31,825 | 1,134,880 | ||||||
| Super Micro Computer, Inc. (a) |
5,271 | 1,498,334 | ||||||
|
|
|
|||||||
| 2,633,214 | ||||||||
|
|
|
|||||||
| Textiles, Apparel & Luxury Goods—1.0% | ||||||||
| Columbia Sportswear Co. |
7,776 | 618,503 | ||||||
| Crocs, Inc. (a) |
27,688 | 2,586,336 | ||||||
| Oxford Industries, Inc. |
7,439 | 743,900 | ||||||
|
|
|
|||||||
| 3,948,739 | ||||||||
|
|
|
|||||||
| Trading Companies & Distributors—3.7% | ||||||||
| Alta Equipment Group, Inc. |
105,054 | 1,299,518 | ||||||
| Applied Industrial Technologies, Inc. |
7,358 | 1,270,653 | ||||||
| Custom Truck One Source, Inc. (a) |
148,425 | 917,266 | ||||||
| Herc Holdings, Inc. |
19,159 | 2,852,584 | ||||||
| McGrath RentCorp |
39,393 | 4,712,191 | ||||||
| MRC Global, Inc. (a) |
171,565 | 1,888,931 | ||||||
| SiteOne Landscape Supply, Inc. (a) (b) |
6,069 | 986,212 | ||||||
|
|
|
|||||||
| 13,927,355 | ||||||||
|
|
|
|||||||
| Water Utilities—0.3% | ||||||||
| Pure Cycle Corp. (a) |
101,388 | 1,061,532 | ||||||
|
|
|
|||||||
| Wireless Telecommunication Services—0.9% | ||||||||
| U.S. Cellular Corp. (a) (b) |
82,146 | 3,412,345 | ||||||
|
|
|
|||||||
| Total Common Stocks |
366,563,940 | |||||||
|
|
|
|||||||
See accompanying notes to financial statements.
BHFTII-7
Brighthouse Funds Trust II
Loomis Sayles Small Cap Core Portfolio
Schedule of Investments as of December 31, 2023
Escrow Shares—0.0%
| Security Description | Shares/ Principal Amount* |
Value | ||||||
| Wireless Telecommunication Services—0.0% | ||||||||
| GCI Liberty, Inc. (a) (c) (d) |
39,365 | $ | 0 | |||||
|
|
|
|||||||
| Short-Term Investment—3.2% |
| |||||||
| Repurchase Agreement—3.2% | ||||||||
| Fixed Income Clearing Corp. |
12,043,970 | 12,043,970 | ||||||
|
|
|
|||||||
| Total Short-Term Investments |
12,043,970 | |||||||
|
|
|
|||||||
| Securities Lending Reinvestments (e)—0.8% |
| |||||||
| Repurchase Agreements—0.0% | ||||||||
| Barclays Bank PLC |
16,621 | 16,621 | ||||||
| Deutsche Bank Securities, Inc. |
141,543 | 141,543 | ||||||
| Societe Generale |
23,042 | 23,042 | ||||||
|
|
|
|||||||
| 181,206 | ||||||||
|
|
|
|||||||
| Mutual Funds—0.8% | ||||||||
| Dreyfus Treasury Obligations Cash Management Fund, Institutional Class 5.250% (f) |
600,000 | 600,000 | ||||||
| Fidelity Investments Money Market Government Portfolio, Class I 5.250% (f) |
600,000 | 600,000 | ||||||
| Goldman Sachs Financial Square Government Fund, Institutional Shares 5.230% (f) |
600,000 | 600,000 | ||||||
| RBC U.S. Government Money Market Fund, Institutional Share 5.230% (f) |
600,000 | 600,000 | ||||||
| State Street Institutional U.S. Government Money Market Fund, Premier Class 5.320% (f) |
200,000 | 200,000 | ||||||
| STIT-Government & Agency Portfolio, Institutional Class |
400,000 | 400,000 | ||||||
|
|
|
|||||||
| 3,000,000 | ||||||||
|
|
|
|||||||
| Total Securities Lending Reinvestments |
3,181,206 | |||||||
|
|
|
|||||||
| Total Investments—101.1% |
381,789,116 | |||||||
| Other assets and liabilities (net)—(1.1)% |
(4,138,493 | ) | ||||||
|
|
|
|||||||
| Net Assets—100.0% |
$ | 377,650,623 | ||||||
|
|
|
|||||||
| * | Principal amount stated in U.S. dollars unless otherwise noted. |
| (a) | Non-income producing security. |
| (b) | All or a portion of the security was held on loan. As of December 31, 2023, the market value of securities loaned was $34,041,675 and the collateral received consisted of cash in the amount of $3,181,206 and non-cash collateral with a value of $31,902,656. The cash collateral investments are disclosed in the Schedule of Investments and categorized as Securities Lending Reinvestments. The non-cash collateral received consists of U.S. government securities that are held in safe-keeping by the lending agent, or a third-party custodian, and cannot be sold or repledged by the Portfolio. As such, this collateral is excluded from the Statement of Assets and Liabilities. |
| (c) | Security was valued in good faith under procedures subject to oversight by the Board of Trustees. As of December 31, 2023, these securities represent less than 0.05% of net assets. |
| (d) | Significant unobservable inputs were used in the valuation of this portfolio security; i.e. Level 3. |
| (e) | Represents investment of cash collateral received from securities on loan as of December 31, 2023. |
| (f) | The rate shown represents the annualized seven-day yield as of December 31, 2023. |
Glossary of Abbreviations
Other Abbreviations
| (REIT)— | Real Estate Investment Trust | |||
See accompanying notes to financial statements.
BHFTII-8
Brighthouse Funds Trust II
Loomis Sayles Small Cap Core Portfolio
Schedule of Investments as of December 31, 2023
Fair Value Hierarchy
Accounting principles generally accepted in the United States of America (“GAAP”) define fair market value as the price that the Portfolio would receive to sell an asset or pay to transfer a liability in an orderly transaction between market participants at the measurement date. It establishes a fair value hierarchy that prioritizes inputs to valuation methods and requires disclosure of the fair value hierarchy, separately for each major category of assets and liabilities, that segregates fair value measurements into three levels. Levels 1, 2 and 3 of the fair value hierarchy are defined as follows:
Level 1 - unadjusted quoted prices in active markets for identical investments
Level 2 - other significant observable inputs (including, but not limited to, quoted prices for similar assets or liabilities in markets that are either active or inactive; inputs other than quoted prices that are observable such as interest rates, yield curves, volatilities, prepayment speeds, loss severities, credit risks, default rates, or other market corroborated inputs)
Level 3 - significant unobservable inputs based on the best information available in the circumstances, to the extent observable inputs are unavailable (including the Portfolio’s own assumptions used in determining the fair value of investments and derivative financial instruments)
The inputs or methodologies used for valuing investments are not necessarily an indication of the risk associated with investing in them. Changes to the inputs or methodologies used may result in transfers between levels. A reconciliation of Level 3 securities, if any, will be disclosed following the fair value hierarchy table. For more information about the Portfolio’s policy regarding the valuation of investments, please refer to the Notes to Financial Statements.
The following table summarizes the fair value hierarchy of the Portfolio’s investments as of December 31, 2023:
| Description | Level 1 | Level 2 | Level 3 | Total | ||||||||||||
| Total Common Stocks* |
$ | 366,563,940 | $ | — | $ | — | $ | 366,563,940 | ||||||||
| Total Escrow Shares* |
— | — | 0 | 0 | ||||||||||||
| Total Short-Term Investment* |
— | 12,043,970 | — | 12,043,970 | ||||||||||||
| Securities Lending Reinvestments | ||||||||||||||||
| Repurchase Agreements |
— | 181,206 | — | 181,206 | ||||||||||||
| Mutual Funds |
3,000,000 | — | — | 3,000,000 | ||||||||||||
| Total Securities Lending Reinvestments |
3,000,000 | 181,206 | — | 3,181,206 | ||||||||||||
| Total Investments |
$ | 369,563,940 | $ | 12,225,176 | $ | 0 | $ | 381,789,116 | ||||||||
| Collateral for Securities Loaned (Liability) |
$ | — | $ | (3,181,206 | ) | $ | — | $ | (3,181,206 | ) | ||||||
| * | See Schedule of Investments for additional detailed categorizations. | |||
Level 3 investments at the beginning and/or end of the period in relation to net assets were not significant and accordingly, a reconciliation of Level 3 assets for the year ended December 31, 2023 is not presented.
See accompanying notes to financial statements.
BHFTII-9
Brighthouse Funds Trust II
Loomis Sayles Small Cap Core Portfolio
Statement of Assets and Liabilities
December 31, 2023
| Assets |
||||
| Investments at value (a) (b) |
$ | 381,789,116 | ||
| Receivable for: |
||||
| Investments sold |
46,442 | |||
| Fund shares sold |
58,054 | |||
| Dividends and interest |
263,748 | |||
| Prepaid expenses |
1,303 | |||
|
|
|
|||
| Total Assets |
382,158,663 | |||
|
|
|
|||
| Liabilities |
||||
| Collateral for securities loaned |
3,181,206 | |||
| Payables for: |
||||
| Investments purchased |
121,314 | |||
| Fund shares redeemed |
671,257 | |||
| Accrued Expenses: |
||||
| Management fees |
254,826 | |||
| Distribution and service fees |
24,848 | |||
| Deferred trustees’ fees |
169,186 | |||
| Other expenses |
85,403 | |||
|
|
|
|||
| Total Liabilities |
4,508,040 | |||
|
|
|
|||
| Net Assets |
$ | 377,650,623 | ||
|
|
|
|||
| Net Assets Consist of: |
||||
| Paid in surplus |
$ | 246,698,346 | ||
| Distributable earnings (Accumulated losses) |
130,952,277 | |||
|
|
|
|||
| Net Assets |
$ | 377,650,623 | ||
|
|
|
|||
| Net Assets |
||||
| Class A |
$ | 249,593,925 | ||
| Class B |
108,885,099 | |||
| Class E |
19,171,599 | |||
| Capital Shares Outstanding* |
||||
| Class A |
1,075,248 | |||
| Class B |
523,441 | |||
| Class E |
87,774 | |||
| Net Asset Value, Offering Price and Redemption Price Per Share |
||||
| Class A |
$ | 232.13 | ||
| Class B |
208.02 | |||
| Class E |
218.42 |
| * | The Portfolio is authorized to issue an unlimited number of shares. | |||
| (a) | Identified cost of investments was $276,783,733. | |||
| (b) | Includes securities loaned at value of $34,041,675. | |||
Statement of Operations
Year Ended December 31, 2023
| Investment Income |
| |||
| Dividends (a) |
$ | 3,801,799 | ||
| Interest |
231,392 | |||
| Securities lending income |
19,208 | |||
|
|
|
|||
| Total investment income |
4,052,399 | |||
|
|
|
|||
| Expenses |
| |||
| Management fees |
3,249,565 | |||
| Administration fees |
28,734 | |||
| Custodian and accounting fees |
49,097 | |||
| Distribution and service fees—Class B |
264,041 | |||
| Distribution and service fees—Class E |
28,016 | |||
| Audit and tax services |
49,026 | |||
| Legal |
46,603 | |||
| Trustees’ fees and expenses |
46,220 | |||
| Shareholder reporting |
41,869 | |||
| Insurance |
3,142 | |||
| Miscellaneous |
14,092 | |||
|
|
|
|||
| Total expenses |
3,820,405 | |||
| Less management fee waiver |
(303,563 | ) | ||
| Less broker commission recapture |
(12,547 | ) | ||
|
|
|
|||
| Net expenses |
3,504,295 | |||
|
|
|
|||
| Net Investment Income |
548,104 | |||
|
|
|
|||
| Net Realized and Unrealized Gain (Loss) |
| |||
| Net realized gain on investments |
25,834,560 | |||
| Net change in unrealized appreciation on investments |
31,936,592 | |||
|
|
|
|||
| Net realized and unrealized gain (loss) |
57,771,152 | |||
|
|
|
|||
| Net Increase (Decrease) in Net Assets From Operations |
$ | 58,319,256 | ||
|
|
|
|||
| (a) | Net of foreign withholding taxes of $9,768. | |||
See accompanying notes to financial statements.
BHFTII-10
Brighthouse Funds Trust II
Loomis Sayles Small Cap Core Portfolio
Statements of Changes in Net Assets
| Year Ended December 31, 2023 |
Year Ended December 31, 2022 |
|||||||
| Increase (Decrease) in Net Assets: |
||||||||
| From Operations |
||||||||
| Net investment income (loss) |
$ | 548,104 | $ | 862,030 | ||||
| Net realized gain (loss) |
25,834,560 | 17,484,843 | ||||||
| Net change in unrealized appreciation (depreciation) |
31,936,592 | (87,385,843 | ) | |||||
|
|
|
|
|
|||||
| Increase (decrease) in net assets from operations |
58,319,256 | (69,038,970 | ) | |||||
|
|
|
|
|
|||||
| From Distributions to Shareholders |
||||||||
| Class A |
(11,629,512 | ) | (45,698,470 | ) | ||||
| Class B |
(5,612,287 | ) | (23,625,478 | ) | ||||
| Class E |
(950,468 | ) | (3,933,608 | ) | ||||
|
|
|
|
|
|||||
| Total distributions |
(18,192,267 | ) | (73,257,556 | ) | ||||
|
|
|
|
|
|||||
| Increase (decrease) in net assets from capital share transactions |
(16,504,796 | ) | 37,150,364 | |||||
|
|
|
|
|
|||||
| Total increase (decrease) in net assets |
23,622,193 | (105,146,162 | ) | |||||
| Net Assets |
||||||||
| Beginning of period |
354,028,430 | 459,174,592 | ||||||
|
|
|
|
|
|||||
| End of period |
$ | 377,650,623 | $ | 354,028,430 | ||||
|
|
|
|
|
|||||
Other Information:
Capital Shares
Transactions in capital shares were as follows:
| Year Ended December 31, 2023 |
Year Ended December 31, 2022 |
|||||||||||||||
| Shares | Value | Shares | Value | |||||||||||||
| Class A |
||||||||||||||||
| Sales |
17,888 | $ | 3,845,856 | 15,899 | $ | 3,692,921 | ||||||||||
| Reinvestments |
54,730 | 11,629,512 | 235,583 | 45,698,470 | ||||||||||||
| Redemptions |
(107,998 | ) | (23,283,766 | ) | (90,476 | ) | (20,948,391 | ) | ||||||||
|
|
|
|
|
|
|
|
|
|||||||||
| Net increase (decrease) |
(35,380 | ) | $ | (7,808,398 | ) | 161,006 | $ | 28,443,000 | ||||||||
|
|
|
|
|
|
|
|
|
|||||||||
| Class B |
||||||||||||||||
| Sales |
18,386 | $ | 3,566,377 | 13,851 | $ | 3,071,966 | ||||||||||
| Reinvestments |
29,433 | 5,612,287 | 134,926 | 23,625,478 | ||||||||||||
| Redemptions |
(84,249 | ) | (16,416,445 | ) | (92,258 | ) | (19,440,894 | ) | ||||||||
|
|
|
|
|
|
|
|
|
|||||||||
| Net increase (decrease) |
(36,430 | ) | $ | (7,237,781 | ) | 56,519 | $ | 7,256,550 | ||||||||
|
|
|
|
|
|
|
|
|
|||||||||
| Class E |
||||||||||||||||
| Sales |
1,488 | $ | 304,337 | 1,620 | $ | 360,610 | ||||||||||
| Reinvestments |
4,750 | 950,468 | 21,470 | 3,933,608 | ||||||||||||
| Redemptions |
(13,356 | ) | (2,713,422 | ) | (12,566 | ) | (2,843,404 | ) | ||||||||
|
|
|
|
|
|
|
|
|
|||||||||
| Net increase (decrease) |
(7,118 | ) | $ | (1,458,617 | ) | 10,524 | $ | 1,450,814 | ||||||||
|
|
|
|
|
|
|
|
|
|||||||||
| Increase (decrease) derived from capital shares transactions |
$ | (16,504,796 | ) | $ | 37,150,364 | |||||||||||
|
|
|
|
|
|||||||||||||
See accompanying notes to financial statements.
BHFTII-11
Brighthouse Funds Trust II
Loomis Sayles Small Cap Core Portfolio
Financial Highlights
| Selected per share data | ||||||||||||||||||||
| Class A | ||||||||||||||||||||
| Year Ended December 31, | ||||||||||||||||||||
| 2023 | 2022 | 2021 | 2020 | 2019 | ||||||||||||||||
| Net Asset Value, Beginning of Period |
$ | 207.66 | $ | 307.10 | $ | 267.73 | $ | 262.79 | $ | 233.39 | ||||||||||
|
|
|
|
|
|
|
|
|
|
|
|||||||||||
| Income (Loss) from Investment Operations |
||||||||||||||||||||
| Net investment income (loss) (a) |
0.50 | 0.73 | 0.04 | 0.54 | 0.60 | |||||||||||||||
| Net realized and unrealized gain (loss) |
34.78 | (50.49 | ) | 57.96 | 24.46 | 56.79 | ||||||||||||||
|
|
|
|
|
|
|
|
|
|
|
|||||||||||
| Total income (loss) from investment operations |
35.28 | (49.76 | ) | 58.00 | 25.00 | 57.39 | ||||||||||||||
|
|
|
|
|
|
|
|
|
|
|
|||||||||||
| Less Distributions |
||||||||||||||||||||
| Distributions from net investment income |
(0.43 | ) | 0.00 | (0.25 | ) | (0.32 | ) | (0.08 | ) | |||||||||||
| Distributions from net realized capital gains |
(10.38 | ) | (49.68 | ) | (18.38 | ) | (19.74 | ) | (27.91 | ) | ||||||||||
|
|
|
|
|
|
|
|
|
|
|
|||||||||||
| Total distributions |
(10.81 | ) | (49.68 | ) | (18.63 | ) | (20.06 | ) | (27.99 | ) | ||||||||||
|
|
|
|
|
|
|
|
|
|
|
|||||||||||
| Net Asset Value, End of Period |
$ | 232.13 | $ | 207.66 | $ | 307.10 | $ | 267.73 | $ | 262.79 | ||||||||||
|
|
|
|
|
|
|
|
|
|
|
|||||||||||
| Total Return (%) (b) |
17.46 | (15.06 | ) | 21.95 | 12.07 | 25.54 | ||||||||||||||
| Ratios/Supplemental Data |
||||||||||||||||||||
| Gross ratio of expenses to average net assets (%) |
0.98 | 0.96 | 0.96 | 0.98 | 0.97 | |||||||||||||||
| Net ratio of expenses to average net assets (%) (c) |
0.89 | 0.88 | 0.87 | 0.90 | 0.90 | |||||||||||||||
| Ratio of net investment income (loss) to average net assets (%) |
0.23 | 0.31 | 0.01 | 0.24 | 0.23 | |||||||||||||||
| Portfolio turnover rate (%) |
28 | 31 | 29 | 35 | 31 | |||||||||||||||
| Net assets, end of period (in millions) |
$ | 249.6 | $ | 230.6 | $ | 291.6 | $ | 262.1 | $ | 254.6 | ||||||||||
| Class B | ||||||||||||||||||||
| Year Ended December 31, | ||||||||||||||||||||
| 2023 | 2022 | 2021 | 2020 | 2019 | ||||||||||||||||
| Net Asset Value, Beginning of Period |
$ | 187.19 | $ | 283.63 | $ | 248.88 | $ | 246.17 | $ | 220.60 | ||||||||||
|
|
|
|
|
|
|
|
|
|
|
|||||||||||
| Income (Loss) from Investment Operations |
||||||||||||||||||||
| Net investment income (loss) (a) |
(0.03 | ) | 0.13 | (0.64 | ) | (0.02 | ) | (0.04 | ) | |||||||||||
| Net realized and unrealized gain (loss) |
31.24 | (46.89 | ) | 53.77 | 22.47 | 53.52 | ||||||||||||||
|
|
|
|
|
|
|
|
|
|
|
|||||||||||
| Total income (loss) from investment operations |
31.21 | (46.76 | ) | 53.13 | 22.45 | 53.48 | ||||||||||||||
|
|
|
|
|
|
|
|
|
|
|
|||||||||||
| Less Distributions |
||||||||||||||||||||
| Distributions from net realized capital gains |
(10.38 | ) | (49.68 | ) | (18.38 | ) | (19.74 | ) | (27.91 | ) | ||||||||||
|
|
|
|
|
|
|
|
|
|
|
|||||||||||
| Total distributions |
(10.38 | ) | (49.68 | ) | (18.38 | ) | (19.74 | ) | (27.91 | ) | ||||||||||
|
|
|
|
|
|
|
|
|
|
|
|||||||||||
| Net Asset Value, End of Period |
$ | 208.02 | $ | 187.19 | $ | 283.63 | $ | 248.88 | $ | 246.17 | ||||||||||
|
|
|
|
|
|
|
|
|
|
|
|||||||||||
| Total Return (%) (b) |
17.18 | (15.28 | ) | 21.64 | 11.79 | 25.23 | ||||||||||||||
| Ratios/Supplemental Data |
||||||||||||||||||||
| Gross ratio of expenses to average net assets (%) |
1.23 | 1.21 | 1.21 | 1.23 | 1.22 | |||||||||||||||
| Net ratio of expenses to average net assets (%) (c) |
1.14 | 1.13 | 1.12 | 1.15 | 1.15 | |||||||||||||||
| Ratio of net investment income (loss) to average net assets (%) |
(0.02 | ) | 0.06 | (0.23 | ) | (0.01 | ) | (0.02 | ) | |||||||||||
| Portfolio turnover rate (%) |
28 | 31 | 29 | 35 | 31 | |||||||||||||||
| Net assets, end of period (in millions) |
$ | 108.9 | $ | 104.8 | $ | 142.8 | $ | 143.4 | $ | 141.8 | ||||||||||
Please see following page for Financial Highlights footnote legend.
See accompanying notes to financial statements.
BHFTII-12
Brighthouse Funds Trust II
Loomis Sayles Small Cap Core Portfolio
Financial Highlights
| Selected per share data | ||||||||||||||||||||
| Class E | ||||||||||||||||||||
| Year Ended December 31, | ||||||||||||||||||||
| 2023 | 2022 | 2021 | 2020 | 2019 | ||||||||||||||||
| Net Asset Value, Beginning of Period |
$ | 195.97 | $ | 293.73 | $ | 256.93 | $ | 253.13 | $ | 225.95 | ||||||||||
|
|
|
|
|
|
|
|
|
|
|
|||||||||||
| Income (Loss) from Investment Operations |
||||||||||||||||||||
| Net investment income (loss) (a) |
0.17 | 0.35 | (0.38 | ) | 0.19 | 0.21 | ||||||||||||||
| Net realized and unrealized gain (loss) |
32.76 | (48.43 | ) | 55.56 | 23.35 | 54.88 | ||||||||||||||
|
|
|
|
|
|
|
|
|
|
|
|||||||||||
| Total income (loss) from investment operations |
32.93 | (48.08 | ) | 55.18 | 23.54 | 55.09 | ||||||||||||||
|
|
|
|
|
|
|
|
|
|
|
|||||||||||
| Less Distributions |
||||||||||||||||||||
| Distributions from net investment income |
(0.10 | ) | 0.00 | 0.00 | 0.00 | 0.00 | ||||||||||||||
| Distributions from net realized capital gains |
(10.38 | ) | (49.68 | ) | (18.38 | ) | (19.74 | ) | (27.91 | ) | ||||||||||
|
|
|
|
|
|
|
|
|
|
|
|||||||||||
| Total distributions |
(10.48 | ) | (49.68 | ) | (18.38 | ) | (19.74 | ) | (27.91 | ) | ||||||||||
|
|
|
|
|
|
|
|
|
|
|
|||||||||||
| Net Asset Value, End of Period |
$ | 218.42 | $ | 195.97 | $ | 293.73 | $ | 256.93 | $ | 253.13 | ||||||||||
|
|
|
|
|
|
|
|
|
|
|
|||||||||||
| Total Return (%) (b) |
17.29 | (15.19 | ) | 21.77 | 11.90 | 25.35 | ||||||||||||||
| Ratios/Supplemental Data |
||||||||||||||||||||
| Gross ratio of expenses to average net assets (%) |
1.13 | 1.11 | 1.11 | 1.13 | 1.12 | |||||||||||||||
| Net ratio of expenses to average net assets (%) (c) |
1.04 | 1.03 | 1.02 | 1.05 | 1.05 | |||||||||||||||
| Ratio of net investment income (loss) to average net assets (%) |
0.08 | 0.16 | (0.13 | ) | 0.09 | 0.08 | ||||||||||||||
| Portfolio turnover rate (%) |
28 | 31 | 29 | 35 | 31 | |||||||||||||||
| Net assets, end of period (in millions) |
$ | 19.2 | $ | 18.6 | $ | 24.8 | $ | 25.2 | $ | 24.8 | ||||||||||
| (a) | Per share amounts based on average shares outstanding during the period. | |||
| (b) | Total return does not reflect any insurance, sales, separate account or administrative charges of variable annuity or life insurance contracts or any additional expenses that contract owners may bear under their variable contracts. If these charges were included, the returns would be lower. | |||
| (c) | Includes the effects of management fee waivers (see Note 5 of the Notes to Financial Statements). | |||
See accompanying notes to financial statements.
BHFTII-13
Brighthouse Funds Trust II
Loomis Sayles Small Cap Core Portfolio
Notes to Financial Statements—December 31, 2023
1. Organization
Brighthouse Funds Trust II (the “Trust”) is organized as a Delaware statutory trust and registered under the Investment Company Act of 1940, as amended (the “1940 Act”), as an open-end management investment company. The Trust, which is managed by Brighthouse Investment Advisers, LLC (“Brighthouse Investment Advisers” or the “Adviser”), currently offers twenty-nine series (the “Portfolios”), each of which operates as a distinct investment vehicle of the Trust. The series included in this report is Loomis Sayles Small Cap Core Portfolio (the “Portfolio”), which is diversified. Shares of the Portfolio are not offered directly to the general public and are currently available only to separate accounts of insurance companies, including insurance companies affiliated with the Adviser.
The Portfolio has registered and offers three classes of shares: Class A, B and E shares. Shares of each class of the Portfolio represent an equal pro rata interest in the Portfolio and generally give the shareholder the same voting, dividend, liquidation, and other rights. Investment income, realized and unrealized capital gains and losses, the common expenses of the Portfolio, and certain Portfolio-level expense reductions, if any, are allocated on a pro rata basis to each class based on the relative net assets of each class to the net assets of the Portfolio. Each class of shares differs in its respective distribution plan and such distribution expenses are allocated to the corresponding class of shares.
2. Significant Accounting Policies
The preparation of financial statements in conformity with accounting principles generally accepted in the United States of America (“GAAP”) requires management to make estimates and assumptions that affect the reported amounts of assets and liabilities and disclosure of contingent assets and liabilities as of the date of the financial statements and the reported amounts of income and expenses during the reporting period. Actual results could differ from those estimates. In the preparation of these financial statements, management has evaluated events and transactions subsequent to December 31, 2023 through the date the financial statements were issued.
The Portfolio is an investment company and follows the accounting and reporting guidance of the Financial Accounting Standards Board (“FASB”) Accounting Standards Codification Topic 946- Financial Services- Investment Companies. The following is a summary of significant accounting policies consistently followed by the Portfolio in the preparation of its financial statements.
Investment Valuation and Fair Value Measurements - The Portfolio values its investments for purposes of calculating its net asset value (“NAV”) using procedures that allow for a variety of methodologies to be used to value the Portfolio’s investments. The specific methodology used for an investment may vary based on the market data available for a specific investment at the time the Portfolio calculates its NAV or based on other considerations. The procedures also permit a level of judgment to be used in the valuation process.
Domestic and foreign equity securities, such as common stock, exchange-traded funds, rights, warrants, and preferred stock, that are traded on a securities exchange on a valuation date are generally valued at their last quoted sale price or official closing price on the primary exchange for such security, or, if no sales occurred on that day, at the last reported bid price. Equity securities traded over-the-counter (“OTC”) are generally valued at the last reported bid price. In the event of a major exchange closing during the trading day, the Adviser may use other market information obtained from quotation reporting systems, established market makers, or pricing services in valuing the securities. Valuation adjustments may be applied to certain foreign equity securities that are traded solely on foreign exchanges that close before the time as of which the Portfolio determines its NAV to account for the market movement between the close of the foreign exchanges and the time as of which the Portfolio determines its NAV. The Portfolio may use a systematic fair valuation model provided by a pricing service to value securities principally traded in these foreign markets to adjust for possible market movements or other changes that may occur between the close of the foreign exchanges and the time as of which the Portfolio determines its NAV. Foreign equity securities valued using these valuation adjustments are generally categorized as Level 2 within the fair value hierarchy. Equity securities that are actively traded, and have no valuation adjustments applied, are categorized as Level 1 within the fair value hierarchy. Other equity securities traded on inactive markets or valued in reference to similar instruments traded on active markets are generally categorized as Level 2 within the fair value hierarchy.
Investments in registered open-end management investment companies are valued at reported NAV per share on the valuation date and are categorized as Level 1 within the fair value hierarchy.
Debt securities, including corporate, convertible and municipal bonds and notes; obligations of the U.S. Treasury and U.S. government agencies; foreign sovereign issues; and non-U.S. bonds, are generally valued based upon evaluated or composite bid quotations obtained from third-party pricing services and/or brokers and dealers selected by the Adviser (each a “pricing service”). Such pricing services may use matrix pricing, which considers observable inputs including, among other things, issuer details, maturity dates, interest rates, yield curves, rates of prepayment, credit risks/spreads, default rates, reported trades, broker-dealer quotes and quoted prices for similar assets. Short-term obligations with a remaining maturity of sixty days or less may be valued at amortized cost in the absence of market quotes, so long as the amortized cost value of such short-term debt instrument is approximately the same as the fair value of the instrument as determined without the use of amortized cost valuation. Floating rate loans are generally valued based upon
BHFTII-14
Brighthouse Funds Trust II
Loomis Sayles Small Cap Core Portfolio
Notes to Financial Statements—December 31, 2023—(Continued)
an evaluated or composite average of aggregate bid and ask quotations supplied by brokers or dealers, as obtained from the pricing service. Securities that use similar valuation techniques and inputs as described above are generally categorized as Level 2 within the fair value hierarchy.
Options, whether on securities, indices, futures contracts, or otherwise, traded on exchanges are valued at the last sale price available as of the close of business on a valuation day or, if there is no such price available, at the last reported bid price. These types of options are categorized as Level 1 within the fair value hierarchy. Futures contracts that are traded on commodity exchanges are valued at their settlement prices established by the exchanges on which they are traded as of the close of such exchanges and are categorized as Level 1 within the fair value hierarchy.
If no current market quotation is readily available or market value quotations are deemed to be unreliable for an investment, the fair value of the investment will be determined in accordance with procedures. A market quotation is readily available only when that quotation is a quoted price (unadjusted) in active markets for identical investments that the Portfolio can access at the measurement date, provided that a quotation will not be readily available if it is not reliable.
Pursuant to Rule 2a-5 under the 1940 Act, the Board of Trustees (the “Board” or “Trustees”) of the Trust has designated Brighthouse Investment Advisers, acting through its Valuation Committee (“Committee”), as the Portfolio’s “valuation designee” to perform the Portfolio’s fair value determinations. The Board oversees Brighthouse Investment Advisers in its role as the Valuation Designee and receives reports from Brighthouse Investment Advisers regarding its process and the valuation of the Portfolio’s investments to assist with such oversight.
No single standard for determining the fair value of an investment can be set forth because fair value depends upon the facts and circumstances with respect to each investment. Information relating to any relevant factors may be obtained by the Committee from any appropriate source, including the subadviser of the Portfolio, the Custodian, a pricing service, market maker and/or broker for such security or the issuer. Appropriate methodologies for determining fair value under particular circumstances may include: matrix pricing, a discounted cash flow analysis, comparisons of securities with comparable characteristics, value based on multiples of earnings, discount from market price of similar marketable securities, or a combination of these and other methods.
Investment Transactions and Related Investment Income - Portfolio security transactions are recorded on the trade date. Dividend income is recorded on the ex-dividend date or, for certain foreign securities, when notified. Interest income, which includes amortization of premium and accretion of discount on debt securities, is recorded on the accrual basis. Realized gains and losses on investments are determined on the identified cost basis, which is the same basis used for federal income tax purposes. Foreign income and foreign capital gains on some foreign securities may be subject to foreign taxes, which are accrued as applicable. These foreign taxes have been provided for in accordance with the Portfolio’s understanding of the applicable countries’ tax rules and rates.
Dividends and Distributions to Shareholders - The Portfolio records dividends and distributions on the ex-dividend date. Net realized gains from securities transactions (if any) are generally distributed annually to shareholders. The timing and characterization of certain income and capital gains distributions are determined in accordance with federal tax regulations that may differ from GAAP. Permanent book and tax basis differences relating to shareholder distributions will result in reclassification between distributable earnings (accumulated losses) and paid in surplus. These adjustments have no impact on net assets or the results of operations.
Income Taxes - It is the Portfolio’s policy to comply with the requirements of the Internal Revenue Code of 1986, as amended, and regulations thereunder, applicable to regulated investment companies, and to distribute, with respect to each taxable year, all of its taxable income to shareholders. Therefore, no federal income tax provision is required. The Portfolio files U.S. federal tax returns. No income tax returns are currently under examination. The Portfolio’s federal tax returns remain subject to examination by the Internal Revenue Service for three fiscal years after the returns are filed. As of December 31, 2023, the Portfolio had no uncertain tax positions that would require financial statement recognition, derecognition or disclosure.
Repurchase Agreements - The Portfolio may enter into repurchase agreements, under the terms of a Master Repurchase Agreement (“MRA”), or Global Master Repurchase Agreement (“GMRA”), with selected commercial banks and broker-dealers, under which the Portfolio acquires securities as collateral and agrees to resell the securities at an agreed-upon time and at an agreed-upon price. The Portfolio, through the Custodian or a subcustodian, under a tri-party repurchase agreement, receives delivery of the underlying securities collateralizing any repurchase agreements. It is the Portfolio’s policy that the market value of the collateral be equal to at least 100% of the repurchase price in the case of a repurchase agreement of one-day duration and equal to at least 102% of the repurchase price in the case of all other repurchase agreements. In the event of default or failure by a party to perform an obligation in connection with any repurchase transaction, the MRA or GMRA gives the non-defaulting party the right to set-off claims and to apply property held by it in connection with any repurchase transaction against obligations owed to it under the agreement.
At December 31, 2023, the Portfolio had direct investments in repurchase agreements with a gross value of $12,043,970. Additionally, the Portfolio invested cash collateral for loans of portfolio securities in repurchase agreements with a gross value of $181,206. The combined value of all repurchase agreements is included as part of investments at value on the Statement of Assets and Liabilities. The value of the related collateral exceeded the value of the repurchase agreements at December 31, 2023.
BHFTII-15
Brighthouse Funds Trust II
Loomis Sayles Small Cap Core Portfolio
Notes to Financial Statements—December 31, 2023—(Continued)
Securities Lending - The Portfolio may lend its portfolio securities to certain qualified brokers who borrow securities in order to complete certain securities transactions. By lending its portfolio securities, the Portfolio attempts to increase its net investment income through the receipt of income on collateral held from securities on loan. Any gain or loss in the market price of the loaned securities that might occur, any interest earned, and any dividends declared during the term of the loan, would accrue to the account of the Portfolio.
The Trust has entered into a Non-Custodial Securities Lending Agreement with JPMorgan Chase Bank, N.A. (the “Lending Agent”). Under the agreement, the Lending Agent is authorized to loan portfolio securities on the Portfolio’s behalf. In exchange, the Portfolio generally receives cash, U.S. Government securities, letters of credit, or other collateral deemed appropriate by the Adviser. The Portfolio receives collateral equal to at least 102% of the market value for loans secured by government securities or cash in the same currency as the loaned shares and 105% for all other loaned securities at each loan’s inception. Collateral representing at least 100% of the market value of the loaned securities is maintained for the duration of the loan. Any cash collateral received by the Portfolio is generally invested by the Lending Agent in short-term investments, which may include certificates of deposit, commercial paper, repurchase agreements, including repurchase agreements with respect to equity securities, time deposits, master demand notes and money market funds. The market value of investments made with cash collateral received are disclosed in the Schedule of Investments and the valuation techniques are described in Note 2. The value of the securities on loan may change each business day. If the market value of the collateral at the close of trading on a business day is less than 100% of the market value of the loaned securities at the close of trading on that day, the borrower is required to deliver, by the close of business on the following business day, an additional amount of collateral, so that the total amount of posted collateral is equal to at least 100% of the market value of all the loaned securities as of such preceding day. A portion of the income earned on the collateral is rebated to the borrower of the securities and the remainder is split between the Lending Agent and the Portfolio. On loans collateralized by U.S. government securities, a fee is received from the borrower and is allocated between the Portfolio and the Lending Agent.
Income received by the Portfolio in securities lending transactions during the year ended December 31, 2023 is reflected as securities lending income on the Statement of Operations. The values of any securities loaned by the Portfolio and the related collateral at December 31, 2023 are disclosed in the footnotes to the Schedule of Investments. The value of the related collateral received by the Portfolio exceeded the value of the securities out on loan at December 31, 2023.
The risks associated with lending portfolio securities include, but are not limited to, possible delays in receiving additional collateral or in the recovery of the loaned securities, possible loss of rights in the collateral should the borrower fail financially, as well as risk of loss in the value of the collateral or the value of the investments made with the collateral. To the extent the Portfolio uses cash collateral it receives to invest in repurchase agreements with respect to equity securities, it is subject to the risk of loss if the value of the equity securities declines and the counterparty defaults on its obligation to repurchase such securities. The Lending Agent shall indemnify the Portfolio in the case of default of any securities borrower, subject to the terms of the Non-Custodial Securities Lending Agreement.
All securities on loan are classified as Common Stocks in the Portfolio’s Schedule of Investments as of December 31, 2023. For all securities on loan, the remaining contractual maturity of the agreements is overnight and continuous.
Directed Brokerage Agreement - The Trust has entered into a directed brokerage arrangement with Capital Institutional Services, Inc. (“CAPIS”). Under this arrangement, the Portfolio directs certain trades to CAPIS in return for a recapture credit. CAPIS issues a cash rebate to the Portfolio. Amounts paid to the Portfolio are shown separately as broker commission recapture on the Statement of Operations of the Portfolio. Additionally, these amounts have been excluded from the calculation of the net ratio of expenses to average net assets presented in the Financial Highlights for each share class.
3. Certain Risks
In the normal course of business, the Portfolio invests in securities and enters into transactions where risks exist. Those risks include:
Market Risk: The value of securities held by the Portfolio may decline in response to certain events, including those directly involving the issuers whose securities are owned by the Portfolio; conditions affecting the general economy; overall market changes; local, regional or global political, social or economic instability; currency, interest rate, and price fluctuations, or other factors including terrorism, war, natural disasters and the spread of infectious illness including epidemics or pandemics such as the COVID-19 pandemic. These events may also adversely affect the liquidity of securities held by the Portfolio.
Credit and Counterparty Risk: The Portfolio may be exposed to counterparty risk, or the risk that an entity with which the Portfolio has unsettled or open transactions may default. The potential loss could exceed the value of the financial assets and liabilities recorded in the financial statements. Financial assets that potentially expose the Portfolio to credit and counterparty risk consist principally of cash due from counterparties and investments. The Portfolio manages counterparty risk by entering into agreements only with counterparties that it believes have the financial resources to honor their obligations and by monitoring the financial stability of those counterparties. The Subadviser may attempt to mitigate counterparty risk by (i) periodically assessing the
BHFTII-16
Brighthouse Funds Trust II
Loomis Sayles Small Cap Core Portfolio
Notes to Financial Statements—December 31, 2023—(Continued)
creditworthiness of its trading partners, (ii) monitoring and/or limiting the amount of its net exposure to each individual counterparty based on its assessment, and (iii) requiring collateral from the counterparty for certain transactions. In order to preserve certain safeguards for non-standard settlement trades, the Portfolio restricts its exposure to credit and counterparty losses by entering into master netting agreements (“Master Agreements”) with counterparties (approved brokers) with whom it undertakes a significant volume of transactions. Master Agreements govern the terms of certain transactions and reduce the counterparty risk associated with relevant transactions by specifying credit protection mechanisms and providing standardization that improves legal certainty. Master Agreements can also help limit counterparty risk by specifying collateral posting arrangements at pre-arranged exposure levels.
Repurchase and reverse repurchase agreements are primarily executed under GMRAs or MRAs, which provide the right to set-off. Each repurchase and reverse repurchase agreement is initially collateralized at the transaction level. In the event of default, the total market value exposure will be offset against collateral exchanged to date, which would result in a net receivable/(payable) that would be due from/to the counterparty.
Additional risks associated with each type of investment are described above within the respective security type notes. The Portfolio’s prospectus includes a discussion of the principal risks of investing in the Portfolio.
4. Investment Transactions
Aggregate cost of purchases and proceeds of sales of investment securities, excluding short-term securities, for the year ended December 31, 2023 were as follows:
| Purchases |
Sales | |||||||||||
| U.S. Government |
Non-U.S. Government | U.S. Government | Non-U.S. Government | |||||||||
| $0 | $ | 99,728,676 | $ | 0 | $ | 135,961,671 | ||||||
5. Investment Management Fees and Other Transactions with Affiliates
Investment Management Agreement - Brighthouse Investment Advisers is the investment adviser to the Portfolio. The Trust has entered into an investment management agreement with Brighthouse Investment Advisers with respect to the Portfolio. For providing investment management services to the Portfolio, Brighthouse Investment Advisers receives monthly compensation at the following annual rates:
|
Management |
% per annum | Average Daily Net Assets | ||||
| $3,249,565 | 0.900 | % | Of the first $500 million | |||
| 0.850 | % | On amounts in excess of $500 million | ||||
Brighthouse Investment Advisers has entered into an investment subadvisory agreement with respect to managing the Portfolio. Loomis, Sayles & Company, L.P. is compensated by Brighthouse Investment Advisers to provide subadvisory services for the Portfolio.
Management Fee Waivers - Pursuant to a management fee waiver agreement, the Adviser has agreed, for the period May 1, 2023 to April 30, 2024, to reduce its advisory fees set out above under “Investment Management Agreement” for each class of the Portfolio as follows:
| % per annum reduction |
Average Daily Net Assets | |
| 0.130% | Of the first $25 million | |
| 0.080% | On the next $75 million | |
| 0.050% | On the next $100 million | |
| 0.100% | On the next $300 million | |
| 0.050% | On amounts in excess of $500 million |
An identical expense agreement was in place for the period April 29, 2022 to April 30, 2023. Amounts waived for the year ended December 31, 2023 are shown as management fee waivers in the Statement of Operations.
Certain officers and trustees of the Trust may also be officers of the Adviser; however, such officers and trustees receive no compensation from the Trust.
Transfer Agency Agreement - Brighthouse Life Insurance Company serves as the transfer agent for the Trust. Brighthouse Life Insurance Company receives no fees for its services to the Trust.
BHFTII-17
Brighthouse Funds Trust II
Loomis Sayles Small Cap Core Portfolio
Notes to Financial Statements—December 31, 2023—(Continued)
Distribution and Service Fees -The Trust has a distribution agreement with Brighthouse Securities, LLC (the “Distributor”) pursuant to which the Distributor serves as the general distributor of shares of each class (each a “Class”) of each Portfolio. The Distributor is an affiliate of the Trust. The Trust has adopted a Distribution and Services Plan (the “D&S Plan”) relating to Class B, Class D, Class E, Class F and Class G shares of each Portfolio, under Rule 12b-1 under the 1940 Act, pursuant to which the Trust may pay the Distributor a fee (the “Service Fee”) at an annual rate not to exceed 0.25% of each such Portfolio’s average daily net assets attributable to the Class B, Class D, Class E, Class F and Class G shares of the Trust. Each Portfolio may not offer shares of each Class. The D&S Plan also authorizes the Trust, on behalf of each of its Portfolios, to pay to the Distributor a distribution fee (the “Distribution Fee” and together with the Service Fee, the “Fees”) at an annual rate of up to 0.25% of each Portfolio’s average daily net assets attributable to the Class B, Class D, Class E, Class F, and Class G shares in consideration of the services rendered in connection with the sale of such shares by the Distributor. Under the Distribution Agreement with respect to the Trust, Fees are currently paid at an annual rate of 0.25% of average daily net assets in the case of Class B shares, 0.10% of average daily net assets in the case of Class D shares, 0.15% of average daily net assets in the case of Class E shares, 0.20% of average daily net assets in the case of Class F shares and 0.30% of average daily net assets in the case of Class G shares. The D&S Plan is known as a “compensation plan” because the Trust makes payments to the Distributor for services rendered regardless of the actual level of expenditures by the Distributor. Amounts incurred by the Portfolio for the year ended December 31, 2023 are shown as Distribution and service fees in the Statement of Operations.
Deferred Trustee Compensation - Each Trustee who is not currently an employee of the Adviser or any of its affiliates receives compensation from the Trust for his or her service to the Trust. A deferred compensation plan (the “Plan”) is available to the Trustees on a voluntary basis. Deferred amounts remain in the Trust until distributed in accordance with the provisions of the Plan. The value of a participating Trustee’s deferral account is based on theoretical investments of deferred amounts on the normal payment dates in certain portfolios of the Trust or Brighthouse Funds Trust I, an affiliate of the Trust, as designated by the participating Trustee. Changes in the value of participants’ deferral accounts are reflected as a component of Trustees’ fees and expenses in the Statement of Operations. The portion of the accrued obligations allocated to the Portfolio under the Plan is reflected as Deferred trustees’ fees in the Statement of Assets and Liabilities.
6. Contractual Obligations
Under the Trust’s organizational documents, its officers and Trustees may be indemnified against certain liabilities and expenses arising out of the performance of their duties to the Trust. Additionally, the Trust has a variety of indemnification obligations under contracts with its service providers. The Trust’s maximum exposure under these arrangements is unknown, as this would involve future claims that may be made against the Trust that have not yet occurred.
7. Income Tax Information
The cost basis of investments for federal income tax purposes at December 31, 2023 was as follows:
| Cost basis of investments |
$ | 276,979,638 | ||
|
|
|
|||
| Gross unrealized appreciation |
111,725,734 | |||
| Gross unrealized (depreciation) |
(6,916,256 | ) | ||
|
|
|
|||
| Net unrealized appreciation (depreciation) |
$ | 104,809,478 | ||
|
|
|
The tax character of distributions paid for the years ended December 31, 2023 and 2022 were as follows:
| Ordinary Income |
Long-Term Capital Gain | Total | ||||||||||||||||||
| 2023 |
2022 | 2023 | 2022 | 2023 | 2022 | |||||||||||||||
| $466,955 | $ | 2,325,566 | $ | 17,725,312 | $ | 70,931,990 | $ | 18,192,267 | $ | 73,257,556 | ||||||||||
As of December 31, 2023, the components of distributable earnings (accumulated losses) on a federal income tax basis were as follows:
| Undistributed |
Undistributed Long-Term Capital Gain |
Net Unrealized Appreciation (Depreciation) |
Accumulated Capital Losses |
Total | ||||||||||||||
| $420,775 | $ | 25,891,210 | $ | 104,809,478 | $ | — | $ | 131,121,463 | ||||||||||
The Portfolio utilizes the provisions of the federal income tax laws that provide for the carryforward of capital losses for prior years, offsetting such losses against any future realized capital gains. Net capital losses may be carried forward indefinitely and their character is retained as short-term and/or long-term losses.
As of December 31, 2023, the Portfolio had no accumulated capital losses.
BHFTII-18
Brighthouse Funds Trust II
Loomis Sayles Small Cap Core Portfolio
Notes to Financial Statements—December 31, 2023—(Continued)
8. Recent Accounting Pronouncement & Regulatory Updates
In June 2022, FASB issued Accounting Standards Update 2022-03—Fair Value Measurement (Topic 820)—Fair Value Measurement of Equity Securities Subject to Contractual Sale Restrictions (“ASU 2022-03”). ASU 2022-03 clarifies the guidance in Topic 820 to indicate that a contractual sale restriction should not be considered in the fair value of an equity security subject to such a restriction, and requires entities with investments in equity securities subject to contractual sale restrictions to disclose certain qualitative and quantitative information about such securities. ASU 2022-03 is effective for fiscal years, and interim periods within those fiscal years, beginning after December 15, 2023. ASU 2022-03 is only applicable to an equity security in which the contractual arrangement that restricts its sale is executed or modified on or after the adoption date.
Effective January 24, 2023, the Securities and Exchange Commission adopted rule and form amendments that require open-end management investment companies to transmit concise and visually engaging annual and semiannual reports to shareholders that highlight certain information deemed by the SEC to be particularly important for investors. Certain other information, including financial statements, will no longer appear in shareholder reports but will, as required, be available online, delivered free of charge upon request, and filed on a semiannual basis on Form N-CSR. The rule and form amendments have a compliance date of July 24, 2024. Accordingly, the rule and form amendments will not impact the Portfolio until its 2024 semiannual shareholder report.
BHFTII-19
Brighthouse Funds Trust II
Loomis Sayles Small Cap Core Portfolio
Report of Independent Registered Public Accounting Firm
To the Board of Trustees of Brighthouse Funds Trust II and Shareholders of the Loomis Sayles Small Cap Core Portfolio:
Opinion on the Financial Statements and Financial Highlights
We have audited the accompanying statement of assets and liabilities, including the schedule of investments, of the Loomis Sayles Small Cap Core Portfolio (the “Fund”) (one of the funds constituting the Brighthouse Funds Trust II), as of December 31, 2023, the related statement of operations for the year then ended, the statements of changes in net assets for each of the two years in the period then ended, the financial highlights for each of the five years in the period then ended, and the related notes. In our opinion, the financial statements and financial highlights present fairly, in all material respects, the financial position of the Fund as of December 31, 2023, and the results of its operations for the year then ended, the changes in its net assets for each of the two years in the period then ended, and the financial highlights for each of the five years in the period then ended in conformity with accounting principles generally accepted in the United States of America.
Basis for Opinion
These financial statements and financial highlights are the responsibility of the Fund’s management. Our responsibility is to express an opinion on the Fund’s financial statements and financial highlights based on our audits. We are a public accounting firm registered with the Public Company Accounting Oversight Board (United States) (PCAOB) and are required to be independent with respect to the Fund in accordance with the U.S. federal securities laws and the applicable rules and regulations of the Securities and Exchange Commission and the PCAOB.
We conducted our audits in accordance with the standards of the PCAOB. Those standards require that we plan and perform the audit to obtain reasonable assurance about whether the financial statements and financial highlights are free of material misstatement, whether due to error or fraud. The Fund is not required to have, nor were we engaged to perform, an audit of its internal control over financial reporting. As part of our audits we are required to obtain an understanding of internal control over financial reporting but not for the purpose of expressing an opinion on the effectiveness of the Fund’s internal control over financial reporting. Accordingly, we express no such opinion.
Our audits included performing procedures to assess the risks of material misstatement of the financial statements and financial highlights, whether due to error or fraud, and performing procedures that respond to those risks. Such procedures included examining, on a test basis, evidence regarding the amounts and disclosures in the financial statements and financial highlights. Our audits also included evaluating the accounting principles used and significant estimates made by management, as well as evaluating the overall presentation of the financial statements and financial highlights. Our procedures included confirmation of securities owned as of December 31, 2023, by correspondence with the custodian and brokers; when replies were not received from brokers, we performed other auditing procedures. We believe that our audits provide a reasonable basis for our opinion.
/s/ Deloitte & Touche LLP
Boston, Massachusetts
February 23, 2024
We have served as the auditor of one or more Brighthouse investment companies since 1983.
BHFTII-20
Brighthouse Funds Trust II
Trustees and Officers
MANAGEMENT OF THE TRUSTS
The Boards of Trustees (the “Board”) of Brighthouse Funds Trust I and Brighthouse Funds Trust II (“Trust I” and “Trust II”, respectively, and collectively the “Trusts”) supervise the Trusts and are responsible for representing the interests of shareholders. The Trustees, the Chairman of the Board and the Chairmen of each subcommittee are the same for both Trusts. The Trustees of each Trust meet periodically throughout the year to oversee the Portfolios’ activities, reviewing, among other things, each Portfolio’s performance and its contractual arrangements with various service providers. The Trustees of each Trust elect the officers of the Trust, who are responsible for administering the Trust’s day-to-day operations.
Trustees and Officers
The Trustees and executive officers of the Trusts, as well as their ages and their principal occupations during the past five years, are set forth below. Unless otherwise indicated, the business address of each is c/o Brighthouse Funds Trust I and Brighthouse Funds Trust II, 11225 N. Community House Rd., Charolette, North Carolina 28277. Each Trustee who is deemed an “interested person,” as such term is defined in the 1940 Act, is referred to as an “Interested Trustee.” Those Trustees who are not “interested persons,” as such term is defined in the 1940 Act, are referred to as “Independent Trustees.” There is no limit to the term a Trustee may serve, other than pursuant to the retirement policy adopted by the Independent Trustees. Trustees serve until their death, resignation, retirement or removal in accordance with Trust I’s and Trust II’s respective organizational documents and policies adopted by the Board of the Trust from time to time. Officers hold office at the pleasure of each Board and serve until their removal or resignation in accordance with the Trusts’ respective organizational documents and policies adopted by the Board of each Trust from time to time.
Trustees of the Trusts
| Name and Year of Birth |
Position(s) |
Term of Office |
Principal Occupation(s) During the Past |
Number of |
Other Directorships Held | |||||
| Interested Trustee | ||||||||||
| John Rosenthal* (1960) |
Trustee | Indefinite; From May 2016 (Trust I and Trust II) to present | Chief Investment Officer, Brighthouse Financial, Inc. (2016 to present). | 73 | None | |||||
| Independent Trustees | ||||||||||
| Dawn M. Vroegop (1966) |
Trustee and Chair of the Board | Indefinite; From December 2000 (Trust I)/May 2009 (Trust II) to present as Trustee; From May 2016 (Trust I and Trust II) until present as Chair | Retired; Private Investor. | 73 | Trustee, Driehaus Mutual Funds (8 portfolios).** | |||||
| Stephen M. Alderman (1959) |
Trustee | Indefinite; From December 2000 (Trust I)/April 2012 (Trust II) to present | Vice President and General Counsel, IHR Aerial Solutions, LLC; Until 2022, General Counsel, Illini Hi-Reach, Inc.; Until 2020, Shareholder in the law firm of Garfield & Merel, Ltd. | 73 | None | |||||
| Robert J. Boulware (1956) |
Trustee | Indefinite; From March 2008 (Trust I)/April 2012 (Trust II) to present | Managing Member, Pilgrim Funds, LLC (private equity fund). | 73 | Trustee, Vertical Capital Income Fund (closed-end fund);** Trustee, The Private Shares Fund (closed- end fund);** Until 2021, Director, Mid- Con Energy Partners, LP (energy);** Until 2020, Director, Gainsco, Inc. (auto insurance).** | |||||
BHFTII-21
Brighthouse Funds Trust II
Trustees and Officers—(Continued)
| Name and Year of Birth |
Position(s) |
Term of Office |
Principal Occupation(s) During the Past |
Number of |
Other Directorships Held | |||||
| Susan C. Gause (1952) |
Trustee | Indefinite; From March 2008 (Trust I)/April 2012 (Trust II) to present | Private Investor. | 73 | Trustee, HSBC Funds (4 portfolios).** | |||||
| Nancy Hawthorne (1951) |
Trustee | Indefinite; From May 2003 (Trust II)/April 2012 (Trust I) to present | Private Investor. | 73 | Trustee, First Eagle Credit Opportunities Fund;** Trustee and Chair of the Board of Trustees, First Eagle Global Opportunities Fund;** Director, Avid Technology, Inc;** Director, CRA International, Inc.** | |||||
Executive Officers of the Trusts
| Name and Year of Birth |
Position(s) |
Term of Office |
Principal Occupation(s) | |||
| Kristi Slavin (1973) | President and Chief Executive Officer, of Trust I and Trust II | From May 2016 (Trust I and Trust II) to present |
President, Brighthouse Investment Advisers, LLC (2016-present). | |||
| Alan R. Otis (1971) | Chief Financial Officer and Treasurer, of Trust I and Trust II | From November 2017 (Trust I and Trust II) to present |
Executive Vice President, Brighthouse Investment Advisers, LLC (2017-present); formerly, Vice President, Brighthouse Investment Advisers, LLC (2012-2017); Assistant Treasurer, Trust I and Trust II (2012-2017). | |||
| Thomas Watterson (1985) | Secretary, of Trust I and Trust II | From November 2023 (Trust I and Trust II) to present |
Executive Vice President, Chief Legal Officer and Secretary, Brighthouse Investment Advisers, LLC (2023-Present); Managing Corporate Counsel, Brighthouse Financial Inc. (2023-present); Managing Counsel and Director, The Bank of New York Mellon Corporation (2019-2023); Counsel and Vice President, The Bank of New York Mellon Corporation (2016-2019). | |||
| Katie Hellmann (1980) | Chief Compliance Officer (“CCO”), of Trust I and Trust II | From May 2023 (Trust I and Trust II) to present |
Chief Compliance Officer, Brighthouse Investment Advisers, LLC (2023-present) and Head of Funds and Investments Compliance (2023-present). Deputy Chief Compliance Officer, Transamerica Asset Management (2022-2023). Leader and Senior Compliance Counsel – Funds Compliance, Edward Jones (2017-2022). | |||
| Rosemary Morgan (1983) | Anti-Money Laundering Officer, of Trust I and Trust II | From May 2023 (Trust I and Trust II) to present |
Chief Privacy Officer, Leader of Compliance Programs and Assistant General Counsel, Brighthouse Financial, Inc. (2019-2022); Chief Privacy Officer, Head of Compliance Programs & Contracts Law, Brighthouse Financial, Inc. (2022-2023), Chief Compliance Officer and Associate General Counsel, Brighthouse Financial, Inc. (2023-present); Vice President and Chief Compliance Officer, Brighthouse Life Insurance Company (2023-present); Vice President and Chief Compliance Officer (2023-present), Brighthouse Life Insurance Company of NY; Vice President and Chief Compliance Officer (2023-present), New England Life Insurance Company. | |||
| Anna Koska (1981) | Vice President, of Trust I and Trust II | From June 2022 (Trust I and Trust II) to present |
Vice President, Investment and Advisory Services, Brighthouse Investment Advisers, LLC (2022-present); Director of Investment and Advisory Services, Brighthouse Investment Advisers, LLC (2019-2022); Senior Portfolio Analyst, Brighthouse Investment Advisers, LLC (2017-2019). | |||
| * | Mr. Rosenthal is an “interested person” of the Trusts because of his position with Brighthouse Financial, Inc. (“Brighthouse Financial”), an affiliate of BIA. |
| ** | Indicates a directorship with a registered investment company or a company subject to the reporting requirements of the Securities Exchange Act of 1934, as amended. |
| (1) | Previous positions during the past five years with the Trusts, MetLife, Inc. or the Adviser are omitted if not materially different. |
| (2) | The Fund Complex includes 44 Trust I Portfolios and 29 Trust II Portfolios. |
BHFTII-22
Brighthouse Funds Trust II
Loomis Sayles Small Cap Core Portfolio
Board of Trustees’ Consideration of Advisory and Sub-Advisory Agreements
At a meeting held on November 13-14, 2023 (the “November Meeting”), the Boards of Trustees (the “Board”) of Brighthouse Funds Trust I and Brighthouse Funds Trust II (“BFT I” and “BFT II,” respectively, and collectively, the “Trusts”), including a majority of the Trustees who are not “interested persons” of the Trusts (the “Independent Trustees”) under the Investment Company Act of 1940 (the “1940 Act”), approved the continuation of the Trusts’ advisory agreements (each an “Advisory Agreement”) with Brighthouse Investment Advisers, LLC (the “Adviser”) and the applicable sub-advisory and sub-sub-advisory agreements (each a “Sub-Advisory Agreement” and collectively with the Advisory Agreement, the “Agreements”) between the Adviser and the investment sub-advisers and sub-sub-adviser (each a “Sub-Adviser,” and collectively, the “Sub-Advisers”) for the series of the Trusts (each a “Portfolio,” and collectively, the “Portfolios”) for the annual contract renewal period from January 1, 2024 through December 31, 2024.
The Board met with personnel of the Adviser on September 28-29, 2023 (the “September Meeting”) for the specific purpose of giving preliminary consideration to the proposed continuation of the Agreements, including consideration to information that the Adviser and Sub-Advisers had provided for the Board’s review at the request of the Independent Trustees. At the September Meeting, the Adviser reviewed with the Board the performance and fees experienced by each Portfolio, as well as other information. During and after the September Meeting, the Independent Trustees requested additional information and clarifications that the Adviser addressed at the November Meeting (the September Meeting and the November Meeting are referred to collectively as, the “Meetings”). During the contract renewal process, and throughout the year, the Independent Trustees were advised by independent legal counsel, and they met with independent legal counsel in executive sessions outside of the presence of management on a number of occasions to discuss, among other things, the renewal of the Agreements.
In considering the continuation of the Agreements, the Board reviewed a variety of materials that were provided for the specific purpose of assisting the Board in the renewal process, along with various information and materials that were provided to and discussed with the Board throughout the year, at regularly scheduled meetings of the Board and its committees. In particular, information for each Portfolio included, but was not limited to, reports on investment performance, expenses, legal and compliance matters, and asset pricing. Information about the Adviser and each Sub-Adviser included, but was not limited to, reports on the business, operations, and performance of the Adviser and the Sub-Advisers and reports that the Adviser and Sub-Advisers had prepared specifically for the renewal process.
In considering the continuation of the Agreements, the Board also reviewed, among other things, a report for each Portfolio that was prepared by Broadridge (“Broadridge”), an independent organization, which set forth comparative performance and expense information for each Portfolio. In addition, the Independent Trustees reviewed a report that was prepared by JDL Consultants, LLC (“JDL”), an independent consultant to the Independent Trustees, which examined the Broadridge reports for each Portfolio (“JDL Report”). The Independent Trustees met in executive session with representatives of JDL during the September Meeting to review the JDL Report.
At the November Meeting, the Board, including a majority of the Independent Trustees, concluded that the nature, extent, and quality of services provided by the Adviser and each Sub-Adviser supported the renewal of the Agreements. The Board also concluded that the investment services provided to and the performance of each Portfolio was such that each Agreement should continue, and that the fees paid by each Portfolio to the Adviser appeared to be reasonable in light of the nature, extent, and quality of the services provided by the Adviser and each Sub-Adviser. Further, the Board concluded that the Adviser’s profitability in providing services under the Advisory Agreements did not appear unreasonable in light of the nature, extent, and quality of the services provided by the Adviser. The Board reviewed the extent to which the investment advisory fees paid by the Portfolios shared economies of scale with investors or entailed the potential to share economies of scale with investors and concluded that those considerations generally supported the renewal of each Agreement. Finally, the Board considered the Adviser’s recommendation that it approve the renewal of each Sub-Advisory Agreement.
In approving the continuation of each Agreement, the Board, including the Independent Trustees, gave attention to all of the information that was furnished, and each Trustee placed varying degrees of importance on the various pieces of information that were provided to them. The Board evaluated the information provided to it on a Portfolio-by-Portfolio basis, and its decision was made separately with respect to each Portfolio. The following paragraphs provide more information about some of the primary factors that were relevant to the Board’s decisions. The Board did not identify any single factor as determinative, and the Trustees generally attributed different weights to various factors for the various Portfolios.
Nature, extent and quality of services. The Board evaluated the nature, extent, and quality of the services that the Adviser and the Sub-Advisers, as relevant, provided to the Portfolios. The Board considered the Adviser’s services as investment manager to the Portfolios, including its services relating to the hiring and oversight of the Sub-Advisers and, in particular, their investment programs and personnel, succession management of key personnel, trading practices, compliance programs and personnel, and risk management
BHFTII-23
Brighthouse Funds Trust II
Loomis Sayles Small Cap Core Portfolio
Board of Trustees’ Consideration of Advisory and Sub-Advisory Agreements—(Continued)
programs, among other things. The Adviser’s services in coordinating and overseeing the activities of the Trusts’ other service providers were also considered. The Board also considered the systems and processes required by the Adviser to meet additional regulatory and compliance requirements resulting from U.S. Securities and Exchange Commission and other regulatory initiatives, including related to liquidity, valuation, and derivatives risk management. The Board considered information received from the Trusts’ Chief Compliance Officer regarding the Portfolios’ compliance policies and procedures that were established pursuant to Rule 38a-l under the 1940 Act, and relevant aspects of the Adviser’s and Sub-Advisers’ compliance policies and procedures. The Board also noted that it was the practice of the Adviser’s investment, compliance, and legal staff to conduct periodic meetings (through various media) with the Sub-Advisers throughout the year in order to review and assess the services that are provided to the Portfolios, and that personnel of the Adviser routinely prepare and present reports to the Board regarding those meetings. In addition, during the Meetings and throughout the year, the Board considered the expertise, experience, and performance of the personnel of the Adviser who performed the various services that are mentioned above.
With respect to the services provided by each of the Sub-Advisers, the Board considered a variety of information that the Adviser and each Sub-Adviser prepared for the Board’s review. The Board considered each Sub-Adviser’s investment process, each Sub-Adviser’s overall organization and business plans and the investment performance experienced by the Portfolio (as described in more detail below). The Board took into account that each Sub-Adviser’s responsibilities include, among other things, the development and maintenance of an investment program for the applicable Portfolio, the selection of investments and the placement of orders for the purchase and sale of such assets, and the implementation of compliance controls related to the performance of these services. The Board considered, based on the information provided, each Sub-Adviser’s staffing with respect to the management of the Portfolio and other information relating to the Sub-Adviser’s business and operations. The Board also considered the Sub-Adviser’s overall resources and information with respect to any recent turnover of key personnel at the Sub-Adviser. The Board reviewed each Sub-Adviser’s investment experience, as well as information provided regarding the Sub-Adviser’s personnel who provide services to the Portfolios. The Board also considered, among other things, information about each Sub-Adviser’s compliance program, including regarding any compliance matters involving a Sub-Adviser that had been brought to the Board’s attention during the year, as well as the Adviser’s assessment of the financial condition of each Sub-Adviser.
Performance. The Board placed emphasis on the performance of each Portfolio in the context of the performance of the relevant markets in which the Portfolio invests. The Board considered the Adviser’s quarterly presentations to the Board of detailed information about each Portfolio’s investment strategies and performance results and composition, including discussions regarding the relevant effects of market conditions. The Board reviewed and considered the reports prepared by Broadridge, which provided a statistical analysis comparing each Portfolio’s investment performance to that of comparable funds underlying variable insurance products (the “Performance Universe”), and the JDL Report. The Board also compared the performance of each Portfolio to that of comparable funds and other accounts that were managed by the relevant Sub-Adviser, to the extent such information was provided. The Board considered each Portfolio’s performance for periods subsequent to the performance period covered by the Broadridge reports and considered the Adviser’s assessment of the same. The Board also noted that while it found the data provided by Broadridge generally useful, it recognized the limitations of such data, including, in particular, that notable differences may exist between a Portfolio and the other funds in a Broadridge category (for example, with respect to investment strategies) and that the results of the performance comparisons may vary depending on (i) the end dates for the performance periods that were selected and (ii) the selection of the peer groups.
The Board focused particular attention on Portfolios with less favorable performance records. The Board noted the Adviser’s focus on each Sub-Adviser’s performance and that the Adviser had been active in monitoring and responding to any performance issues with respect to the Portfolios.
Fees and Expenses. The Board gave consideration to the level and method of computing the fees payable under the Agreements. The Board reviewed and considered the information in the JDL Report concerning fees and expenses. The Board also reviewed and considered the Broadridge report for each Portfolio, which included various comparisons of the Portfolio’s fees (at December 31, 2022 and various asset levels) and expenses with those of its peers, including, as applicable, a broad group of peer funds (“Expense Universe”), a narrower group of peer funds (“Expense Group”), a broad group of peer sub-advised funds (“Sub-advised Expense Universe”), and a narrower group of peer sub-advised funds (“Sub-advised Expense Group”). In particular, the Board reviewed comparisons of each Portfolio’s contractual management fees with its Expense Group and Sub-advised Expense Universe, contractual sub-adviser fees with its Sub-advised Expense Universe and Sub-advised Expense Group, and total expenses with its Expense Universe, Expense Group and Sub-advised Expense Universe. The Board considered that Broadridge selected the peer funds, which were funds underlying variable insurance products that Broadridge deemed to be comparable to the Portfolios. The Board considered that the fee and expense information in the Broadridge report for each Portfolio reflected information as of the Portfolio’s most recent fiscal year
BHFTII-24
Brighthouse Funds Trust II
Loomis Sayles Small Cap Core Portfolio
Board of Trustees’ Consideration of Advisory and Sub-Advisory Agreements—(Continued)
end at the time the Broadridge report was issued and that historical asset levels may differ from current asset levels, particularly in a period of market volatility. In addition, the Board compared the fee payable to a Sub-Adviser by the Adviser with respect to the Portfolio to the fee payable to the Sub-Adviser by other comparable funds and other accounts, to the extent such information was provided.
The Board noted that the sub-advisory fees for the Portfolios are negotiated at arm’s length by the Adviser and are paid by the Adviser out of its advisory fees. The Board also considered that the Adviser had entered into expense limitation or management fee waiver agreements with certain of the Portfolios pursuant to which the Adviser had agreed to waive a portion of its advisory fee and/or reimburse certain expenses as a means of limiting a Portfolio’s total annual operating expenses or passing through the benefit of a subadvisory fee concession to a Portfolio, as applicable.
Profitability. The Board examined the profitability to the Adviser of each Advisory Agreement, on a Portfolio-by-Portfolio basis. The Board also considered that an affiliate of the Adviser, Brighthouse Securities, LLC, serves as distributor for the Trusts, and, as such, receives Rule 12b-1 payments to support the distribution of the Portfolios. The Board considered the profitability to the Sub-Advisers and their affiliates of their relationships with the Portfolios, to the extent provided, and the Board considered the ability of the Adviser to negotiate with a Sub-Adviser at arm’s length. In reviewing the profitability information, the Board recognized that expense allocation methodologies are inherently subjective and various methodologies may be reasonable while producing different results.
Economies of scale. The Board considered each Portfolio’s fees in light of its size. The Board noted the fee schedules for the Portfolios that contain breakpoints that reduce the fee rate above specified asset levels, including breakpoints in the Advisory Agreements and any corresponding Sub-Advisory Agreement. The Board noted those Portfolios that did not have breakpoints in their advisory fees and considered management’s explanation of the same.
The Board considered the effective fees under the Advisory Agreement and Sub-Advisory Agreement for each Portfolio as a percentage of assets at different asset levels and possible economies of scale that may be realized if the assets of the Portfolio grow. The Board examined, among other data, the effect of a Portfolio’s growth in size, and reduction in size, on various fee schedules. The Board also generally noted that if a Portfolio’s assets increase over time, the Portfolio may realize economies of scale if assets increase proportionally more than certain other expenses.
Other factors. The Board considered other benefits that may be realized by the Adviser and its affiliates from their relationships with the Trusts. Among the benefits realized by the Adviser, the Board recognized that Brighthouse Securities, LLC, as the distributor for the Trusts, receives payments pursuant to Rule 12b-1 from the Portfolios to help compensate for the provision of shareholder services and distribution activities. The Board considered that a Sub-Adviser may engage in soft dollar transactions in managing a Portfolio. In addition, the Board considered that a Sub-Adviser may be affiliated with registered broker-dealers that may, from time to time, receive brokerage commissions from a Portfolio in connection with the sale of portfolio securities (subject to applicable best execution obligations). The Board also considered that a Sub-Adviser and its affiliates could benefit from the opportunity to provide advisory services to additional portfolios of the Trusts and overall reputational benefits.
The Board considered information from the Adviser and Sub-Advisers pertaining to potential conflicts of interest, and the manner in which any potential conflicts were mitigated. In its review, the Board considered information regarding various business relationships among the Adviser and its affiliates and various Sub-Advisers and their affiliates. The Board also considered information about services and/or payments provided to the Adviser by the Sub-Advisers in connection with marketing activities. The Board considered representations from the Adviser that such business relationships and any payments were not considered in the Adviser’s recommendation to renew any of the Sub-Advisory Agreements.
* * * * *
Loomis Sayles Small Cap Core Portfolio. The Board also considered the following information in relation to the Agreements with the Adviser and Loomis, Sayles & Company, L.P. regarding the Portfolio:
Among other data relating specifically to the Portfolio’s performance, the Board considered that the Portfolio outperformed the median of one of its Performance Universes for the one-and three-year periods ended June 30, 2023 and underperformed the median of that Performance Universe for the five-year period ended June 30, 2023. The Board also considered that the Portfolio outperformed the median of its other Performance Universe for the one-, three-, and five-year periods ended June 30, 2023. The Board further considered that the Portfolio outperformed the average of its Morningstar Category for the one-, three-, and five-year periods ended June 30, 2023. The Board further considered that the Portfolio outperformed the average of a different, but still comparable, Morningstar Category for the one-, three-, and five-year periods ended June 30, 2023. The Board further considered that the Portfolio outperformed its
BHFTII-25
Brighthouse Funds Trust II
Loomis Sayles Small Cap Core Portfolio
Board of Trustees’ Consideration of Advisory and Sub-Advisory Agreements—(Continued)
benchmark, the Russell 2000 Index, for the one-, three-, and five-year periods ended October 31, 2023. The Board also noted the presence of certain management fee waivers in effect for the Portfolio.
The Board also considered that the Portfolio’s actual management fees and total expenses (exclusive of 12b-1 fees) were below the Expense Group median and above the Expense Universe median and the Sub-advised Expense Universe median. The Board noted that the Portfolio’s contractual management fees were above the asset-weighted average of the Investment Classification/Morningstar Category selected by Broadridge at the Portfolio’s current size. The Board also noted that the Portfolio’s contractual sub-advisory fees were above the averages of the Sub-advised Expense Group and the Sub-advised Expense Universe at the Portfolio’s current size.
BHFTII-26
Brighthouse Funds Trust II
Loomis Sayles Small Cap Growth Portfolio
Managed By Loomis, Sayles & Company, L.P.
Portfolio Manager Commentary*
PERFORMANCE
For the twelve months ended December 31, 2023, the Class A, B and E shares of the Loomis Sayles Small Cap Growth Portfolio returned 11.91%, 11.54%, and 11.72%, respectively. The Portfolio’s benchmark, the Russell 2000 Growth Index¹, returned 18.66%.
MARKET ENVIRONMENT / CONDITIONS
The U.S. equity market overcame several potential headwinds to post a robust total return in 2023. The interest-rate outlook was a key driver of volatility throughout the year, as the U.S. Federal Reserve (the “Fed”) continued to raise rates—albeit at a slower pace than in 2022—to combat inflation. This issue became more prominent in late summer and early autumn, when rising energy prices fueled concerns that persistent inflation could compel the Fed to keep rates “higher for longer”. The backdrop changed considerably in the fourth quarter after a series of cooler-than-expected inflation reports. In addition, Fed Chairman Jerome Powell surprised the markets in December by indicating that the central bank was likely finished raising rates and possibly on track to begin enacting rate cuts in 2024. Not least, it appeared that gross domestic product growth would remain in positive territory and allow the Fed to achieve the ideal outcome of a “soft landing” for the economy. Stocks surged in response, bringing most major large-cap indexes to near all-time highs by year-end. The late year rally was broad-based, with strong participation from market segments—including the value style, small caps, and mid caps—that had underperformed for most of 2023. Despite this shift, larger cap and growth stocks were the key source of market leadership over the full year. Mega-cap technology-related companies produced particularly impressive gains that were fueled, in part, by excitement about the long-term prospects for artificial intelligence.
Within the small cap market segment, overall returns for the year were strong but were not without volatility. The Russell 2000 Index began the year with a strong “January effect” returning almost 10% for the month with the rally led by the lowest quality stocks and those segments that underperformed in 2022. For the balance of the year, and particularly within the third quarter, investors took a more defensive posture and “risk-off” leadership drove returns in the small cap market. To close the year, the market had a strong reversal in leadership and reflected a pivot to a “risk-on” market led by lower quality stocks.
PORTFOLIO REVIEW / PERIOD END POSITIONING
The Loomis Sayles Small Cap Growth Portfolio underperformed the Russell 2000 Growth Index (the “Index”) during the twelve months ended December 31, 2023. Stock selection in the Health Care, Information Technology (“IT”) and Industrials sectors were the largest detractors from relative performance. Selection in the Consumer Staples and Energy sectors were the largest contributors to relative performance.
The Portfolio’s largest detractors from performance on the individual security level included Halozyme Therapeutics, Ventyx Bioscienes, and Calix. Halozyme Therapeutics is a biotech company focused on developing and commercializing oncology therapeutics. The company underperformed due to increased uncertainty around their royalty streams from biopharma partners later in the decade. This uncertainty stems from language around drug price negotiations built into the Inflation Reduction Act that was passed in August 2022. The stock triggered our stop loss and we have exited the position. Ventyx Biosciences is a biotechnology company focused on developing drugs for autoimmune driven conditions. The company had two data readouts in the fourth quarter of 2023 that failed to meet consensus expectations. As a result, the shares underperformed the market and traded down to minimal value for the assets. Calix is a provider of technology solutions to telecom service providers and represents a model transitioning from hardware to software. While company financials held up much better than the stock, Calix’s management did lower their revenue growth outlook for 2024 based on customer hesitation and confusion around various government funding programs.
The largest contributors to performance on the individual security level were Rambus, Weatherford International and BellRing Brands. Rambus is a provider of memory-related chips and intellectual property. We believe the company is well positioned to benefit from a technology shift to a new generation of dynamic random-access memory, which is partly driven by artificial intelligence servers. Weatherford International is a diversified services provider to oil and gas companies on a global basis. Weatherford’s management has refocused the business such that they have products/services with a competitive advantage. The company also has significant international exposure, which we believe represents the growth driver for the remainder of this cycle. BellRing Brands is a leader in the convenient nutrition category and produces nutritional items such as protein shakes, powders and bars. We believe that, after spending two years on re-building manufacturing capacity, the company is now able to service growing demand and support it with a marketing boost.
During the reporting period, we added new stocks with attractive investment potential and eliminated holdings where fundamentals no longer fit our investment thesis, market cap grew beyond our ceiling, or our stop loss was triggered. New positions included: Glaukos, Construction Partners and Vertex. Glaukos is a medical device company focused on the treatment of glaucoma. We initiated a position in the stock as we believe the company’s newest device, an implant that slowly releases glaucoma drug therapy within the eye, has the potential to durably drive growth and profitability. Construction Partners represents a vertically integrated model that provides road paving services in the southeast, along with owning their own hot asphalt plants. The company is actively consolidating this fragmented market in their current footprint, which we believe is an accelerator of growth and scale. Vertex is a leader in the indirect tax management market. As its multi-year growth investment comes to an end, we believe the company is poised to accelerate its revenue growth. In addition, we believe that the newly acquired Edge Product represents meaningful cross-sell potential for Vertex with the help of a newly built customer success team.
BHFTII-1
Brighthouse Funds Trust II
Loomis Sayles Small Cap Growth Portfolio
Managed By Loomis, Sayles & Company, L.P.
Portfolio Manager Commentary*—(Continued)
Positions eliminated included: Box, Inspire Medical Systems and Ventyx Biosciences. Box is a provider of cloud-based productivity related software. We sold the position as growth slowed due to the macro environment and our belief that there are superior growth stories we’d rather own. Inspire Medical Systems traded down later in the year as a result of concerns around the glucagon-like peptide 1 class of drugs impacting the addressable treatment-resistant sleep apnea population. The company also ran into some insurance approval delays, which drove short term impacts to revenue. Due to all of these factors, the stock triggered our stop-loss, and we exited the position. Ventyx Biosciences is a biotechnology company focused on developing drugs for autoimmune driven conditions. The company had two data readouts in the fourth quarter that failed to meet expectations. As a result, the shares underperformed the market and traded down to minimal value for the assets. The stock triggered our stop-loss during the fourth quarter and was sold.
Sector weight changes during the period ending December 31, 2023, reflected both our repositioning within the Portfolio as well as market impacts. As a result of individual stock selection, our weights in the Healthcare and Communication Services sectors were reduced while weights in the Industrials and Consumer Discretionary sectors increased. At period-end, the Portfolio was overweight the Industrials and Financials sectors and underweight the IT, Communication Services and Materials sectors.
Mark Burns
John Slavik
Portfolio Managers
Loomis, Sayles & Company, L.P.
* This commentary may include statements that constitute “forward-looking statements” under the U.S. securities laws. Forward-looking statements include, among other things, projections, estimates, and information about possible or future results related to the Portfolio, market or regulatory developments. The views expressed above are not guarantees of future performance or economic results and involve certain risks, uncertainties and assumptions that could cause actual outcomes and results to differ materially from the views expressed herein. The views expressed above are subject to change at any time based upon economic, market, or other conditions and the subadvisory firm undertakes no obligation to update the views expressed herein. Any discussions of specific securities should not be considered a recommendation to buy or sell those securities. The views expressed above (including any forward-looking statement) may not be relied upon as investment advice or as an indication of the Portfolio’s trading intent. Information about the Portfolio’s holdings, asset allocation or country diversification is historical and is not an indication of future Portfolio composition, which may vary. Direct investment in any index is not possible. The performance of any index mentioned in this commentary has not been adjusted for ongoing management, distribution and operating expenses, and sales charges applicable to mutual fund investments. In addition, the returns do not reflect additional fees charged by separate accounts or variable insurance contracts that an investor in the Portfolio may pay. If these additional fees were reflected, performance would have been lower.
1 The Russell 2000 Growth Index is an unmanaged measure of performance of those Russell 2000 companies (small capitalization companies) that have higher price-to book ratios and higher forecasted growth values.
BHFTII-2
Brighthouse Funds Trust II
Loomis Sayles Small Cap Growth Portfolio
A $10,000 INVESTMENT COMPARED TO THE RUSSELL 2000 GROWTH INDEX
AVERAGE ANNUAL RETURNS (%) FOR THE YEAR ENDED DECEMBER 31, 2023
| 1 Year | 5 Year | 10 Year | ||||||||||
| Loomis Sayles Small Cap Growth Portfolio | ||||||||||||
| Class A |
11.91 | 10.08 | 8.49 | |||||||||
| Class B |
11.54 | 9.80 | 8.21 | |||||||||
|
Class E |
11.72 | 9.92 | 8.32 | |||||||||
| Russell 2000 Growth Index | 18.66 | 9.22 | 7.16 | |||||||||
Portfolio performance is calculated including reinvestment of all income and capital gain distributions. Performance numbers are net of all Portfolio expenses but do not include any insurance, sales, separate account or administrative charges of variable annuity or life insurance contracts or any additional expenses that participants may bear relating to the operations of their plans. If these charges were included, the returns would be lower. The performance of any index referenced above has not been adjusted for ongoing management, distribution and operating expenses, and sales charges applicable to mutual fund investments. Direct investment in any index is not possible. The performance of Class A shares, as set forth in the line graph above, will differ from that of other classes because of the difference in expenses paid by policyholders investing in the different share classes.
This information represents past performance and is not indicative of future results. Investment return and principal value may fluctuate so that shares, upon redemption, may be worth more or less than the original cost.
PORTFOLIO COMPOSITION AS OF DECEMBER 31, 2023
Top Holdings
| % of Net Assets |
||||
| MACOM Technology Solutions Holdings, Inc. | 2.0 | |||
| Weatherford International PLC | 1.9 | |||
| Rambus, Inc. | 1.9 | |||
| Casella Waste Systems, Inc. - Class A | 1.7 | |||
| Installed Building Products, Inc. | 1.6 | |||
| Varonis Systems, Inc. | 1.6 | |||
| Option Care Health, Inc. | 1.5 | |||
| Texas Roadhouse, Inc. | 1.5 | |||
| Hamilton Lane, Inc. - Class A | 1.5 | |||
| Azek Co., Inc. | 1.5 | |||
Top Sectors
| % of Net Assets |
||||
| Industrials | 23.7 | |||
| Health Care | 21.6 | |||
| Information Technology | 19.4 | |||
| Consumer Discretionary | 12.2 | |||
| Financials | 9.0 | |||
| Consumer Staples | 6.0 | |||
| Energy | 5.9 | |||
| Materials | 1.0 | |||
BHFTII-3
Brighthouse Funds Trust II
Loomis Sayles Small Cap Growth Portfolio
Understanding Your Portfolio’s Expenses
Shareholder Expense Example
As a shareholder of the Portfolio, you incur ongoing costs, including management fees; distribution and service (12b-1) fees; and other Portfolio expenses. This example is intended to help you understand your ongoing costs (in dollars) (referred to as “expenses”) of investing in the Portfolio and compare these costs with the ongoing costs of investing in other mutual funds. The example is based on an investment of $1,000 invested at the beginning of the period and held for the entire period, July 1, 2023 through December 31, 2023.
Actual Expenses
The first line for each share class of the Portfolio in the table below provides information about actual account values and actual expenses. You may use the information in this line, together with the amount you invested in the particular share class of the Portfolio, to estimate the expenses that you paid over the period. Simply divide your account value by $1,000 (for example, an $8,600 account value divided by $1,000 = 8.6), then multiply the result by the number in the first line under the heading entitled “Expenses Paid During Period” to estimate the expenses you paid on your account during this period.
Hypothetical Example for Comparison Purposes
The second line for each share class of the Portfolio in the table below provides information about hypothetical account values and hypothetical expenses based on the Portfolio’s actual expense ratio and an assumed rate of return of 5% per year before expenses, which is not the Portfolio’s actual return. The hypothetical account values and expenses may not be used to estimate the actual ending account balance or expenses you paid for the period. You may use this information to compare the ongoing costs of investing in the Portfolio and other funds. To do so, compare this 5% hypothetical example with the 5% hypothetical examples that appear in the shareholder reports of the other funds.
Please note that the expenses shown in the table are meant to highlight your ongoing costs only and do not reflect any fees or charges of your variable insurance product or any additional expenses that participants in certain eligible qualified plans may bear relating to the operations of their plan. Therefore, the second line for each share class in the table is useful in comparing ongoing costs only, and will not help you determine the relative total costs of owning different funds. In addition, if these other costs were included, your costs would have been higher.
| Loomis Sayles Small Cap Growth Portfolio |
Annualized Expense Ratio |
Beginning Account Value July 1, 2023 |
Ending Account Value December 31, 2023 |
Expenses Paid During Period** July 1, 2023 to December 31, 2023 |
||||||||||||||
| Class A (a) |
Actual | 0.88 | % | $ | 1,000.00 | $ | 1,024.10 | $ | 4.49 | |||||||||
| Hypothetical* | 0.88 | % | $ | 1,000.00 | $ | 1,020.77 | $ | 4.48 | ||||||||||
| Class B (a) |
Actual | 1.13 | % | $ | 1,000.00 | $ | 1,023.00 | $ | 5.76 | |||||||||
| Hypothetical* | 1.13 | % | $ | 1,000.00 | $ | 1,019.51 | $ | 5.75 | ||||||||||
| Class E (a) |
Actual | 1.03 | % | $ | 1,000.00 | $ | 1,023.40 | $ | 5.25 | |||||||||
| Hypothetical* | 1.03 | % | $ | 1,000.00 | $ | 1,020.01 | $ | 5.24 | ||||||||||
| * | Hypothetical assumes a rate of return of 5% per year before expenses. |
| ** | Expenses paid are equal to the Portfolio’s annualized expense ratio for the most recent six month period, as shown above, multiplied by the average account value over the period, multiplied by the number of days (184 days) in the most recent fiscal half-year, divided by 365 (to reflect the one-half year period). |
| (a) | The annualized expense ratio shown reflects the impact of the management fee waiver as described in Note 5 of the Notes to Financial Statements. |
BHFTII-4
Brighthouse Funds Trust II
Loomis Sayles Small Cap Growth Portfolio
Schedule of Investments as of December 31, 2023
Common Stocks—98.8% of Net Assets
| Security Description | Shares | Value | ||||||
| Aerospace & Defense—3.9% | ||||||||
| AAR Corp. (a) |
68,610 | $ | 4,281,264 | |||||
| Hexcel Corp. |
67,738 | 4,995,678 | ||||||
| Kratos Defense & Security Solutions, Inc. (a) (b) |
274,111 | 5,561,712 | ||||||
|
|
|
|||||||
| 14,838,654 | ||||||||
|
|
|
|||||||
| Automobile Components—3.2% | ||||||||
| Dorman Products, Inc. (a) |
28,458 | 2,373,682 | ||||||
| Gentherm, Inc. (a) (b) |
59,965 | 3,139,767 | ||||||
| Modine Manufacturing Co. (a) |
34,202 | 2,041,859 | ||||||
| Patrick Industries, Inc. (b) |
44,704 | 4,486,047 | ||||||
|
|
|
|||||||
| 12,041,355 | ||||||||
|
|
|
|||||||
| Banks—1.2% | ||||||||
| Bancorp, Inc. (a) (b) |
116,684 | 4,499,335 | ||||||
|
|
|
|||||||
| Beverages—0.8% | ||||||||
| Vita Coco Co., Inc. (a) (b) |
117,548 | 3,015,106 | ||||||
|
|
|
|||||||
| Biotechnology—4.7% | ||||||||
| Inhibrx, Inc. (a) |
105,478 | 4,008,164 | ||||||
| Insmed, Inc. (a) |
147,834 | 4,581,376 | ||||||
| Vericel Corp. (a) |
111,252 | 3,961,684 | ||||||
| Xencor, Inc. (a) |
96,324 | 2,044,958 | ||||||
| Xenon Pharmaceuticals, Inc. (a) |
69,039 | 3,179,936 | ||||||
|
|
|
|||||||
| 17,776,118 | ||||||||
|
|
|
|||||||
| Building Products—1.5% | ||||||||
| Azek Co., Inc. (a) |
151,466 | 5,793,575 | ||||||
|
|
|
|||||||
| Capital Markets—3.5% | ||||||||
| Hamilton Lane, Inc. - Class A |
51,153 | 5,802,796 | ||||||
| Piper Sandler Cos. |
10,911 | 1,908,007 | ||||||
| PJT Partners, Inc. - Class A (b) |
52,731 | 5,371,707 | ||||||
|
|
|
|||||||
| 13,082,510 | ||||||||
|
|
|
|||||||
| Commercial Services & Supplies—2.6% | ||||||||
| ACV Auctions, Inc. - Class A (a) |
238,687 | 3,616,108 | ||||||
| Casella Waste Systems, Inc. - Class A (a) |
72,909 | 6,230,803 | ||||||
|
|
|
|||||||
| 9,846,911 | ||||||||
|
|
|
|||||||
| Communications Equipment—0.9% | ||||||||
| Calix, Inc. (a) (b) |
74,639 | 3,260,978 | ||||||
|
|
|
|||||||
| Construction & Engineering—3.3% | ||||||||
| Arcosa, Inc. |
53,540 | 4,424,546 | ||||||
| Construction Partners, Inc. - Class A (a) |
55,088 | 2,397,430 | ||||||
| Sterling Infrastructure, Inc. (a) |
22,907 | 2,014,212 | ||||||
| WillScot Mobile Mini Holdings Corp. (a) |
79,889 | 3,555,060 | ||||||
|
|
|
|||||||
| 12,391,248 | ||||||||
|
|
|
|||||||
| Diversified Consumer Services—0.9% | ||||||||
| Grand Canyon Education, Inc. (a) |
25,096 | 3,313,676 | ||||||
|
|
|
|||||||
| Electronic Equipment, Instruments & Components—3.5% | ||||||||
| Advanced Energy Industries, Inc. |
41,626 | $ | 4,533,904 | |||||
| Itron, Inc. (a) (b) |
50,677 | 3,826,620 | ||||||
| Novanta, Inc. (a) |
27,857 | 4,691,398 | ||||||
|
|
|
|||||||
| 13,051,922 | ||||||||
|
|
|
|||||||
| Energy Equipment & Services—5.0% | ||||||||
| Cactus, Inc. - Class A (b) |
104,034 | 4,723,143 | ||||||
| Noble Corp. PLC (b) |
77,960 | 3,754,554 | ||||||
| Oceaneering International, Inc. (a) (b) |
143,224 | 3,047,807 | ||||||
| Weatherford International PLC (a) |
74,956 | 7,332,945 | ||||||
|
|
|
|||||||
| 18,858,449 | ||||||||
|
|
|
|||||||
| Financial Services—1.5% | ||||||||
| EVERTEC, Inc. |
137,189 | 5,616,518 | ||||||
|
|
|
|||||||
| Food Products—1.7% | ||||||||
| Simply Good Foods Co. (a) |
112,217 | 4,443,793 | ||||||
| Sovos Brands, Inc. (a) |
84,934 | 1,871,096 | ||||||
|
|
|
|||||||
| 6,314,889 | ||||||||
|
|
|
|||||||
| Ground Transportation—0.8% | ||||||||
| Marten Transport Ltd. (b) |
148,278 | 3,110,872 | ||||||
|
|
|
|||||||
| Health Care Equipment & Supplies—7.3% | ||||||||
| AtriCure, Inc. (a) |
81,301 | 2,901,633 | ||||||
| Axonics, Inc. (a) |
79,445 | 4,943,862 | ||||||
| CONMED Corp. (b) |
40,896 | 4,478,521 | ||||||
| Glaukos Corp. (a) |
42,584 | 3,385,002 | ||||||
| LivaNova PLC (a) |
56,253 | 2,910,530 | ||||||
| Merit Medical Systems, Inc. (a) (b) |
75,019 | 5,698,443 | ||||||
| PROCEPT BioRobotics Corp. (a) (b) |
80,968 | 3,393,369 | ||||||
|
|
|
|||||||
| 27,711,360 | ||||||||
|
|
|
|||||||
| Health Care Providers & Services—6.2% | ||||||||
| Acadia Healthcare Co., Inc. (a) |
45,656 | 3,550,211 | ||||||
| Ensign Group, Inc. |
39,616 | 4,445,311 | ||||||
| HealthEquity, Inc. (a) |
47,071 | 3,120,807 | ||||||
| Option Care Health, Inc. (a) |
173,119 | 5,832,379 | ||||||
| Progyny, Inc. (a) |
106,688 | 3,966,660 | ||||||
| RadNet, Inc. (a) |
68,821 | 2,392,906 | ||||||
|
|
|
|||||||
| 23,308,274 | ||||||||
|
|
|
|||||||
| Health Care Technology—1.1% | ||||||||
| Evolent Health, Inc. - Class A (a) |
128,086 | 4,230,681 | ||||||
|
|
|
|||||||
| Hotels, Restaurants & Leisure—3.3% | ||||||||
| Life Time Group Holdings, Inc. (a) (b) |
225,185 | 3,395,790 | ||||||
| Papa John’s International, Inc. (b) |
41,531 | 3,165,908 | ||||||
| Texas Roadhouse, Inc. |
47,559 | 5,813,136 | ||||||
|
|
|
|||||||
| 12,374,834 | ||||||||
|
|
|
|||||||
| Household Durables—1.6% | ||||||||
| Installed Building Products, Inc. (b) |
33,932 | 6,203,448 | ||||||
|
|
|
|||||||
See accompanying notes to financial statements.
BHFTII-5
Brighthouse Funds Trust II
Loomis Sayles Small Cap Growth Portfolio
Schedule of Investments as of December 31, 2023
Common Stocks—(Continued)
| Security Description | Shares |
Value | ||||||
| Insurance—2.9% | ||||||||
| BRP Group, Inc. - Class A (a) (b) |
149,325 | $ | 3,586,787 | |||||
| Goosehead Insurance, Inc. - Class A (a) |
58,479 | 4,432,708 | ||||||
| Kinsale Capital Group, Inc. (b) |
8,278 | 2,772,385 | ||||||
|
|
|
|||||||
| 10,791,880 | ||||||||
|
|
|
|||||||
| Leisure Products—0.8% | ||||||||
| Malibu Boats, Inc. - Class A (a) |
52,191 | 2,861,111 | ||||||
|
|
|
|||||||
| Life Sciences Tools & Services—1.3% | ||||||||
| Medpace Holdings, Inc. (a) (b) |
15,969 | 4,894,978 | ||||||
|
|
|
|||||||
| Machinery—4.0% | ||||||||
| Albany International Corp. - Class A |
53,873 | 5,291,406 | ||||||
| ESCO Technologies, Inc. |
40,118 | 4,695,010 | ||||||
| RBC Bearings, Inc. (a) (b) |
17,868 | 5,090,414 | ||||||
|
|
|
|||||||
| 15,076,830 | ||||||||
|
|
|
|||||||
| Metals & Mining—1.0% | ||||||||
| ATI, Inc. (a)(b) |
85,106 | 3,869,770 | ||||||
|
|
|
|||||||
| Oil, Gas & Consumable Fuels—0.9% | ||||||||
| Magnolia Oil & Gas Corp. - Class A (b) |
152,656 | 3,250,046 | ||||||
|
|
|
|||||||
| Personal Care Products—3.5% | ||||||||
| BellRing Brands, Inc. (a) |
97,099 | 5,382,198 | ||||||
| elf Beauty, Inc. (a) |
24,858 | 3,588,004 | ||||||
| Inter Parfums, Inc. |
30,429 | 4,382,080 | ||||||
|
|
|
|||||||
| 13,352,282 | ||||||||
|
|
|
|||||||
| Pharmaceuticals—0.9% | ||||||||
| Supernus Pharmaceuticals, Inc. (a) (b) |
122,626 | 3,548,796 | ||||||
|
|
|
|||||||
| Professional Services—3.7% | ||||||||
| FTI Consulting, Inc. (a) |
16,586 | 3,303,102 | ||||||
| Huron Consulting Group, Inc. (a) |
34,837 | 3,581,244 | ||||||
| ICF International, Inc. |
26,223 | 3,516,242 | ||||||
| KBR, Inc. |
67,786 | 3,756,022 | ||||||
|
|
|
|||||||
| 14,156,610 | ||||||||
|
|
|
|||||||
| Semiconductors & Semiconductor Equipment—6.4% | ||||||||
| MACOM Technology Solutions Holdings, Inc. (a) (b) |
81,428 | 7,568,732 | ||||||
| Onto Innovation, Inc. (a) |
34,584 | 5,287,894 | ||||||
| Rambus, Inc. (a) (b) |
104,145 | 7,107,896 | ||||||
| Silicon Laboratories, Inc. (a) |
32,489 | 4,297,320 | ||||||
|
|
|
|||||||
| 24,261,842 | ||||||||
|
|
|
|||||||
| Software—7.3% | ||||||||
| Agilysys, Inc. (a) |
29,225 | 2,478,865 | ||||||
| Clearwater Analytics Holdings, Inc. - Class A (a) |
155,549 | 3,115,646 | ||||||
| Intapp, Inc. (a) |
97,708 | 3,714,858 | ||||||
| Tenable Holdings, Inc. (a) |
91,835 | 4,229,920 | ||||||
| Varonis Systems, Inc. (a) (b) |
134,556 | 6,092,696 | ||||||
| Vertex, Inc. - Class A (a) |
134,887 | 3,633,856 | ||||||
| Workiva, Inc. (a) (b) |
40,949 | 4,157,552 | ||||||
|
|
|
|||||||
| 27,423,393 | ||||||||
|
|
|
|||||||
| Specialty Retail—0.9% | ||||||||
| Boot Barn Holdings, Inc. (a) (b) |
42,610 | 3,270,744 | ||||||
|
|
|
|||||||
| Technology Hardware, Storage & Peripherals—1.3% | ||||||||
| Pure Storage, Inc. - Class A (a) |
142,345 | 5,076,023 | ||||||
|
|
|
|||||||
| Textiles, Apparel & Luxury Goods—1.6% | ||||||||
| Columbia Sportswear Co. (b) |
34,789 | 2,767,117 | ||||||
| Oxford Industries, Inc. |
33,283 | 3,328,300 | ||||||
|
|
|
|||||||
| 6,095,417 | ||||||||
|
|
|
|||||||
| Trading Companies & Distributors—3.8% | ||||||||
| Applied Industrial Technologies, Inc. |
32,917 | 5,684,437 | ||||||
| McGrath RentCorp |
35,060 | 4,193,877 | ||||||
| SiteOne Landscape Supply, Inc. (a) |
27,143 | 4,410,737 | ||||||
|
|
|
|||||||
| 14,289,051 | ||||||||
|
|
|
|||||||
| Total Common Stocks |
372,859,486 | |||||||
|
|
|
|||||||
| Short-Term Investment—1.5% |
| |||||||
| Repurchase Agreement—1.5% | ||||||||
| Fixed Income Clearing Corp. |
5,469,593 | 5,469,593 | ||||||
|
|
|
|||||||
| Total Short-Term Investments |
5,469,593 | |||||||
|
|
|
|||||||
| Securities Lending Reinvestments (c)—2.5% |
| |||||||
| Repurchase Agreements—0.1% | ||||||||
| Barclays Bank PLC |
45,629 | 45,629 | ||||||
| Deutsche Bank Securities, Inc. |
222,368 | 222,368 | ||||||
| Societe Generale |
36,199 | 36,199 | ||||||
|
|
|
|||||||
| 304,196 | ||||||||
|
|
|
|||||||
See accompanying notes to financial statements.
BHFTII-6
Brighthouse Funds Trust II
Loomis Sayles Small Cap Growth Portfolio
Schedule of Investments as of December 31, 2023
Securities Lending Reinvestments (c)—(Continued)
| Security Description | Shares |
Value | ||||||
| Mutual Funds—2.4% | ||||||||
| BlackRock Liquidity Funds FedFund, Institutional Shares |
2,000,000 | $ | 2,000,000 | |||||
| Dreyfus Treasury Obligations Cash Management Fund, Institutional Class 5.250% (d) |
1,945,375 | 1,945,375 | ||||||
| Fidelity Investments Money Market Government Portfolio, Class I 5.250% (d) |
2,000,000 | 2,000,000 | ||||||
| Morgan Stanley Liquidity Funds Government Portfolio, Institutional Shares 5.270% (d) |
700,000 | 700,000 | ||||||
| RBC U.S. Government Money Market Fund, Institutional Share 5.230% (d) |
500,000 | 500,000 | ||||||
| SSGA Institutional U.S. Government Money Market Fund, Premier Class 5.320% (d) |
2,000,000 | 2,000,000 | ||||||
|
|
|
|||||||
| 9,145,375 | ||||||||
|
|
|
|||||||
| Total Securities Lending Reinvestments |
9,449,571 | |||||||
|
|
|
|||||||
| Total Investments— 102.8% |
387,778,650 | |||||||
| Other assets and liabilities (net)—(2.8)% |
(10,574,974 | ) | ||||||
|
|
|
|||||||
| Net Assets—100.0% |
$ | 377,203,676 | ||||||
|
|
|
|||||||
| * | Principal amount stated in U.S. dollars unless otherwise noted. |
| (a) | Non-income producing security. |
| (b) | All or a portion of the security was held on loan. As of December 31, 2023, the market value of securities loaned was $56,764,908 and the collateral received consisted of cash in the amount of $9,449,571 and non-cash collateral with a value of $49,297,706. The cash collateral investments are disclosed in the Schedule of Investments and categorized as Securities Lending Reinvestments. The non-cash collateral received consists of U.S. government securities that are held in safe-keeping by the lending agent, or a third-party custodian, and cannot be sold or repledged by the Portfolio. As such, this collateral is excluded from the Statement of Assets and Liabilities. |
| (c) | Represents investment of cash collateral received from securities on loan as of December 31, 2023. |
| (d) | The rate shown represents the annualized seven-day yield as of December 31, 2023. |
See accompanying notes to financial statements.
BHFTII-7
Brighthouse Funds Trust II
Loomis Sayles Small Cap Growth Portfolio
Schedule of Investments as of December 31, 2023
Fair Value Hierarchy
Accounting principles generally accepted in the United States of America (“GAAP”) define fair market value as the price that the Portfolio would receive to sell an asset or pay to transfer a liability in an orderly transaction between market participants at the measurement date. It establishes a fair value hierarchy that prioritizes inputs to valuation methods and requires disclosure of the fair value hierarchy, separately for each major category of assets and liabilities, that segregates fair value measurements into three levels. Levels 1, 2 and 3 of the fair value hierarchy are defined as follows:
Level 1 - unadjusted quoted prices in active markets for identical investments
Level 2 - other significant observable inputs (including, but not limited to, quoted prices for similar assets or liabilities in markets that are either active or inactive; inputs other than quoted prices that are observable such as interest rates, yield curves, volatilities, prepayment speeds, loss severities, credit risks, default rates, or other market corroborated inputs)
Level 3 - significant unobservable inputs based on the best information available in the circumstances, to the extent observable inputs are unavailable (including the Portfolio’s own assumptions used in determining the fair value of investments and derivative financial instruments)
The inputs or methodologies used for valuing investments are not necessarily an indication of the risk associated with investing in them. Changes to the inputs or methodologies used may result in transfers between levels. A reconciliation of Level 3 securities, if any, will be disclosed following the fair value hierarchy table. For more information about the Portfolio’s policy regarding the valuation of investments, please refer to the Notes to Financial Statements.
The following table summarizes the fair value hierarchy of the Portfolio’s investments as of December 31, 2023:
| Description | Level 1 | Level 2 | Level 3 | Total | ||||||||||||
| Total Common Stocks* |
$ | 372,859,486 | $ | — | $ | — | $ | 372,859,486 | ||||||||
| Total Short-Term Investment* |
— | 5,469,593 | — | 5,469,593 | ||||||||||||
| Securities Lending Reinvestments | ||||||||||||||||
| Repurchase Agreements |
— | 304,196 | — | 304,196 | ||||||||||||
| Mutual Funds |
9,145,375 | — | — | 9,145,375 | ||||||||||||
| Total Securities Lending Reinvestments |
9,145,375 | 304,196 | — | 9,449,571 | ||||||||||||
| Total Investments |
$ | 382,004,861 | $ | 5,773,789 | $ | — | $ | 387,778,650 | ||||||||
| Collateral for Securities Loaned (Liability) |
$ | — | $ | (9,449,571 | ) | $ | — | $ | (9,449,571 | ) | ||||||
| * | See Schedule of Investments for additional detailed categorizations. | |||
See accompanying notes to financial statements.
BHFTII-8
Brighthouse Funds Trust II
Loomis Sayles Small Cap Growth Portfolio
Statement of Assets and Liabilities
December 31, 2023
| Assets |
||||
| Investments at value (a) (b) |
$ | 387,778,650 | ||
| Receivable for: |
||||
| Fund shares sold |
108,075 | |||
| Dividends and interest |
95,077 | |||
| Prepaid expenses |
1,342 | |||
|
|
|
|||
| Total Assets |
387,983,144 | |||
|
|
|
|||
| Liabilities |
||||
| Collateral for securities loaned |
9,449,571 | |||
| Payables for: |
||||
| Investments purchased |
544,665 | |||
| Fund shares redeemed |
287,155 | |||
| Accrued Expenses: |
||||
| Management fees |
252,167 | |||
| Distribution and service fees |
10,801 | |||
| Deferred trustees’ fees |
169,435 | |||
| Other expenses |
65,674 | |||
|
|
|
|||
| Total Liabilities |
10,779,468 | |||
|
|
|
|||
| Net Assets |
$ | 377,203,676 | ||
|
|
|
|||
| Net Assets Consist of: |
||||
| Paid in surplus |
$ | 296,397,961 | ||
| Distributable earnings (Accumulated losses) |
80,805,715 | |||
|
|
|
|||
| Net Assets |
$ | 377,203,676 | ||
|
|
|
|||
| Net Assets |
||||
| Class A |
$ | 322,766,395 | ||
| Class B |
48,871,483 | |||
| Class E |
5,565,798 | |||
| Capital Shares Outstanding* |
||||
| Class A |
30,386,098 | |||
| Class B |
5,495,413 | |||
| Class E |
577,868 | |||
| Net Asset Value, Offering Price and Redemption Price Per Share |
||||
| Class A |
$ | 10.62 | ||
| Class B |
8.89 | |||
| Class E |
9.63 |
| * | The Portfolio is authorized to issue an unlimited number of shares. | |||
| (a) | Identified cost of investments was $309,430,350. | |||
| (b) | Includes securities loaned at value of $56,764,908. | |||
Statement of Operations
Year Ended December 31, 2023
| Investment Income |
||||
| Dividends (a) |
$ | 1,406,995 | ||
| Interest |
238,782 | |||
| Securities lending income |
22,608 | |||
|
|
|
|||
| Total investment income |
1,668,385 | |||
|
|
|
|||
| Expenses |
||||
| Management fees |
3,299,920 | |||
| Administration fees |
28,935 | |||
| Custodian and accounting fees |
38,417 | |||
| Distribution and service fees—Class B |
121,152 | |||
| Distribution and service fees—Class E |
8,223 | |||
| Audit and tax services |
49,026 | |||
| Legal |
46,604 | |||
| Trustees’ fees and expenses |
46,220 | |||
| Shareholder reporting |
27,149 | |||
| Insurance |
3,201 | |||
| Miscellaneous |
13,933 | |||
|
|
|
|||
| Total expenses |
3,682,780 | |||
| Less management fee waiver |
(346,658 | ) | ||
| Less broker commission recapture |
(15,390 | ) | ||
|
|
|
|||
| Net expenses |
3,320,732 | |||
|
|
|
|||
| Net Investment Loss |
(1,652,347 | ) | ||
|
|
|
|||
| Net Realized and Unrealized Gain (Loss) |
| |||
| Net realized gain on investments |
3,808,749 | |||
| Net change in unrealized appreciation on investments |
40,238,157 | |||
|
|
|
|||
| Net realized and unrealized gain (loss) |
44,046,906 | |||
|
|
|
|||
| Net Increase (Decrease) in Net Assets From Operations |
$ | 42,394,559 | ||
|
|
|
|||
| (a) | Net of foreign withholding taxes of $3,513. | |||
See accompanying notes to financial statements.
BHFTII-9
Brighthouse Funds Trust II
Loomis Sayles Small Cap Growth Portfolio
Statements of Changes in Net Assets
| Year Ended December 31, 2023 |
Year Ended December 31, 2022 |
|||||||
| Increase (Decrease) in Net Assets: |
||||||||
| From Operations |
||||||||
| Net investment income (loss) |
$ | (1,652,347 | ) | $ | (1,833,453 | ) | ||
| Net realized gain (loss) |
3,808,749 | (1,101,671 | ) | |||||
| Net change in unrealized appreciation (depreciation) |
40,238,157 | (111,073,732 | ) | |||||
|
|
|
|
|
|||||
| Increase (decrease) in net assets from operations |
42,394,559 | (114,008,856 | ) | |||||
|
|
|
|
|
|||||
| From Distributions to Shareholders |
||||||||
| Class A |
0 | (74,072,817 | ) | |||||
| Class B |
0 | (13,229,310 | ) | |||||
| Class E |
0 | (1,375,802 | ) | |||||
| From Return of Capital |
||||||||
| Class A |
0 | (149,537 | ) | |||||
| Class B |
0 | (26,707 | ) | |||||
| Class E |
0 | (2,777 | ) | |||||
|
|
|
|
|
|||||
| Total distributions |
0 | (88,856,950 | ) | |||||
|
|
|
|
|
|||||
| Increase (decrease) in net assets from capital share transactions |
(30,684,639 | ) | 74,461,907 | |||||
|
|
|
|
|
|||||
| Total increase (decrease) in net assets |
11,709,920 | (128,403,899 | ) | |||||
| Net Assets |
||||||||
| Beginning of period |
365,493,756 | 493,897,655 | ||||||
|
|
|
|
|
|||||
| End of period |
$ | 377,203,676 | $ | 365,493,756 | ||||
|
|
|
|
|
|||||
Other Information:
Capital Shares
Transactions in capital shares were as follows:
| Year Ended December 31, 2023 |
Year Ended December 31, 2022 |
|||||||||||||||
| Shares | Value | Shares | Value | |||||||||||||
| Class A |
||||||||||||||||
| Sales |
450,943 | $ | 4,516,592 | 1,414,103 | $ | 18,099,302 | ||||||||||
| Reinvestments |
0 | 0 | 8,580,619 | 74,222,354 | ||||||||||||
| Redemptions |
(2,868,964 | ) | (29,515,537 | ) | (2,731,996 | ) | (26,967,419 | ) | ||||||||
|
|
|
|
|
|
|
|
|
|||||||||
| Net increase (decrease) |
(2,418,021 | ) | $ | (24,998,945 | ) | 7,262,726 | $ | 65,354,237 | ||||||||
|
|
|
|
|
|
|
|
|
|||||||||
| Class B |
||||||||||||||||
| Sales |
224,310 | $ | 1,873,361 | 292,625 | $ | 2,945,876 | ||||||||||
| Reinvestments |
0 | 0 | 1,823,386 | 13,256,017 | ||||||||||||
| Redemptions |
(841,749 | ) | (7,058,831 | ) | (856,180 | ) | (7,817,104 | ) | ||||||||
|
|
|
|
|
|
|
|
|
|||||||||
| Net increase (decrease) |
(617,439 | ) | $ | (5,185,470 | ) | 1,259,831 | $ | 8,384,789 | ||||||||
|
|
|
|
|
|
|
|
|
|||||||||
| Class E |
||||||||||||||||
| Sales |
8,725 | $ | 78,288 | 22,367 | $ | 221,029 | ||||||||||
| Reinvestments |
0 | 0 | 175,392 | 1,378,579 | ||||||||||||
| Redemptions |
(64,791 | ) | (578,512 | ) | (85,815 | ) | (876,727 | ) | ||||||||
|
|
|
|
|
|
|
|
|
|||||||||
| Net increase (decrease) |
(56,066 | ) | $ | (500,224 | ) | 111,944 | $ | 722,881 | ||||||||
|
|
|
|
|
|
|
|
|
|||||||||
| Increase (decrease) derived from capital shares transactions |
$ | (30,684,639 | ) | $ | 74,461,907 | |||||||||||
|
|
|
|
|
|||||||||||||
See accompanying notes to financial statements.
BHFTII-10
Brighthouse Funds Trust II
Loomis Sayles Small Cap Growth Portfolio
Financial Highlights
| Selected per share data | ||||||||||||||||||||
| Class A | ||||||||||||||||||||
| Year Ended December 31, | ||||||||||||||||||||
| 2023 | 2022 | 2021 | 2020 | 2019 | ||||||||||||||||
| Net Asset Value, Beginning of Period |
$ | 9.49 | $ | 16.30 | $ | 16.31 | $ | 14.03 | $ | 13.19 | ||||||||||
|
|
|
|
|
|
|
|
|
|
|
|||||||||||
| Income (Loss) from Investment Operations |
||||||||||||||||||||
| Net investment income (loss) (a) |
(0.04 | ) | (0.05 | ) | (0.09 | ) | (0.07 | ) | (0.06 | ) | ||||||||||
| Net realized and unrealized gain (loss) |
1.17 | (3.96 | ) | 1.65 | 4.16 | 3.41 | ||||||||||||||
|
|
|
|
|
|
|
|
|
|
|
|||||||||||
| Total income (loss) from investment operations |
1.13 | (4.01 | ) | 1.56 | 4.09 | 3.35 | ||||||||||||||
|
|
|
|
|
|
|
|
|
|
|
|||||||||||
| Less Distributions |
||||||||||||||||||||
| Distributions from net realized capital gains |
0.00 | (2.80 | ) | (1.57 | ) | (1.81 | ) | (2.51 | ) | |||||||||||
| Distributions from return of capital |
0.00 | (0.00 | )(b) | 0.00 | 0.00 | 0.00 | ||||||||||||||
|
|
|
|
|
|
|
|
|
|
|
|||||||||||
| Total distributions |
0.00 | (2.80 | ) | (1.57 | ) | (1.81 | ) | (2.51 | ) | |||||||||||
|
|
|
|
|
|
|
|
|
|
|
|||||||||||
| Net Asset Value, End of Period |
$ | 10.62 | $ | 9.49 | $ | 16.30 | $ | 16.31 | $ | 14.03 | ||||||||||
|
|
|
|
|
|
|
|
|
|
|
|||||||||||
| Total Return (%) (c) |
11.91 | (22.96 | ) | 10.00 | 34.34 | 26.88 | ||||||||||||||
| Ratios/Supplemental Data |
||||||||||||||||||||
| Gross ratio of expenses to average net assets (%) |
0.97 | 0.95 | 0.95 | 0.97 | 0.98 | |||||||||||||||
| Net ratio of expenses to average net assets (%) (d) |
0.87 | 0.86 | 0.86 | 0.88 | 0.89 | |||||||||||||||
| Ratio of net investment income (loss) to average net assets (%) |
(0.42 | ) | (0.43 | ) | (0.57 | ) | (0.52 | ) | (0.45 | ) | ||||||||||
| Portfolio turnover rate (%) |
36 | 33 | 44 | 57 | 47 | |||||||||||||||
| Net assets, end of period (in millions) |
$ | 322.8 | $ | 311.3 | $ | 416.3 | $ | 428.9 | $ | 283.4 | ||||||||||
| Class B | ||||||||||||||||||||
| Year Ended December 31, | ||||||||||||||||||||
| 2023 | 2022 | 2021 | 2020 | 2019 | ||||||||||||||||
| Net Asset Value, Beginning of Period |
$ | 7.97 | $ | 14.35 | $ | 14.57 | $ | 12.76 | $ | 12.22 | ||||||||||
|
|
|
|
|
|
|
|
|
|
|
|||||||||||
| Income (Loss) from Investment Operations |
||||||||||||||||||||
| Net investment income (loss) (a) |
(0.06 | ) | (0.06 | ) | (0.12 | ) | (0.09 | ) | (0.09 | ) | ||||||||||
| Net realized and unrealized gain (loss) |
0.98 | (3.52 | ) | 1.47 | 3.71 | 3.14 | ||||||||||||||
|
|
|
|
|
|
|
|
|
|
|
|||||||||||
| Total income (loss) from investment operations |
0.92 | (3.58 | ) | 1.35 | 3.62 | 3.05 | ||||||||||||||
|
|
|
|
|
|
|
|
|
|
|
|||||||||||
| Less Distributions |
||||||||||||||||||||
| Distributions from net realized capital gains |
0.00 | (2.80 | ) | (1.57 | ) | (1.81 | ) | (2.51 | ) | |||||||||||
| Distributions from return of capital |
0.00 | (0.00 | )(b) | 0.00 | 0.00 | 0.00 | ||||||||||||||
|
|
|
|
|
|
|
|
|
|
|
|||||||||||
| Total distributions |
0.00 | (2.80 | ) | (1.57 | ) | (1.81 | ) | (2.51 | ) | |||||||||||
|
|
|
|
|
|
|
|
|
|
|
|||||||||||
| Net Asset Value, End of Period |
$ | 8.89 | $ | 7.97 | $ | 14.35 | $ | 14.57 | $ | 12.76 | ||||||||||
|
|
|
|
|
|
|
|
|
|
|
|||||||||||
| Total Return (%) (c) |
11.54 | (23.10 | ) | 9.74 | 34.04 | 26.51 | ||||||||||||||
| Ratios/Supplemental Data |
||||||||||||||||||||
| Gross ratio of expenses to average net assets (%) |
1.22 | 1.20 | 1.20 | 1.22 | 1.23 | |||||||||||||||
| Net ratio of expenses to average net assets (%) (d) |
1.12 | 1.11 | 1.11 | 1.13 | 1.14 | |||||||||||||||
| Ratio of net investment income (loss) to average net assets (%) |
(0.67 | ) | (0.68 | ) | (0.81 | ) | (0.78 | ) | (0.70 | ) | ||||||||||
| Portfolio turnover rate (%) |
36 | 33 | 44 | 57 | 47 | |||||||||||||||
| Net assets, end of period (in millions) |
$ | 48.9 | $ | 48.7 | $ | 69.6 | $ | 73.3 | $ | 63.8 | ||||||||||
Please see following page for Financial Highlights footnote legend.
See accompanying notes to financial statements.
BHFTII-11
Brighthouse Funds Trust II
Loomis Sayles Small Cap Growth Portfolio
Financial Highlights
| Selected per share data | ||||||||||||||||||||
| Class E | ||||||||||||||||||||
| Year Ended December 31, | ||||||||||||||||||||
| 2023 | 2022 | 2021 | 2020 | 2019 | ||||||||||||||||
| Net Asset Value, Beginning of Period |
$ | 8.62 | $ | 15.19 | $ | 15.32 | $ | 13.31 | $ | 12.64 | ||||||||||
|
|
|
|
|
|
|
|
|
|
|
|||||||||||
| Income (Loss) from Investment Operations |
||||||||||||||||||||
| Net investment income (loss) (a) |
(0.05 | ) | (0.06 | ) | (0.11 | ) | (0.08 | ) | (0.08 | ) | ||||||||||
| Net realized and unrealized gain (loss) |
1.06 | (3.71 | ) | 1.55 | 3.90 | 3.26 | ||||||||||||||
|
|
|
|
|
|
|
|
|
|
|
|||||||||||
| Total income (loss) from investment operations |
1.01 | (3.77 | ) | 1.44 | 3.82 | 3.18 | ||||||||||||||
|
|
|
|
|
|
|
|
|
|
|
|||||||||||
| Less Distributions |
||||||||||||||||||||
| Distributions from net realized capital gains |
0.00 | (2.80 | ) | (1.57 | ) | (1.81 | ) | (2.51 | ) | |||||||||||
| Distributions from return of capital |
0.00 | (0.00 | )(b) | 0.00 | 0.00 | 0.00 | ||||||||||||||
|
|
|
|
|
|
|
|
|
|
|
|||||||||||
| Total distributions |
0.00 | (2.80 | ) | (1.57 | ) | (1.81 | ) | (2.51 | ) | |||||||||||
|
|
|
|
|
|
|
|
|
|
|
|||||||||||
| Net Asset Value, End of Period |
$ | 9.63 | $ | 8.62 | $ | 15.19 | $ | 15.32 | $ | 13.31 | ||||||||||
|
|
|
|
|
|
|
|
|
|
|
|||||||||||
| Total Return (%) (c) |
11.72 | (23.07 | ) | 9.86 | 34.15 | 26.68 | ||||||||||||||
| Ratios/Supplemental Data |
||||||||||||||||||||
| Gross ratio of expenses to average net assets (%) |
1.12 | 1.10 | 1.10 | 1.12 | 1.13 | |||||||||||||||
| Net ratio of expenses to average net assets (%) (d) |
1.02 | 1.01 | 1.01 | 1.03 | 1.04 | |||||||||||||||
| Ratio of net investment income (loss) to average net assets (%) |
(0.56 | ) | (0.58 | ) | (0.70 | ) | (0.68 | ) | (0.60 | ) | ||||||||||
| Portfolio turnover rate (%) |
36 | 33 | 44 | 57 | 47 | |||||||||||||||
| Net assets, end of period (in millions) |
$ | 5.6 | $ | 5.5 | $ | 7.9 | $ | 8.4 | $ | 7.4 | ||||||||||
| (a) | Per share amounts based on average shares outstanding during the period. | |||
| (b) | Distributions from return of capital were less than $0.01. | |||
| (c) | Total return does not reflect any insurance, sales, separate account or administrative charges of variable annuity or life insurance contracts or any additional expenses that contract owners may bear under their variable contracts. If these charges were included, the returns would be lower. | |||
| (d) | Includes the effects of management fee waivers (see Note 5 of the Notes to Financial Statements). | |||
See accompanying notes to financial statements.
BHFTII-12
Brighthouse Funds Trust II
Loomis Sayles Small Cap Growth Portfolio
Notes to Financial Statements—December 31, 2023
1. Organization
Brighthouse Funds Trust II (the “Trust”) is organized as a Delaware statutory trust and registered under the Investment Company Act of 1940, as amended (the “1940 Act”), as an open-end management investment company. The Trust, which is managed by Brighthouse Investment Advisers, LLC (“Brighthouse Investment Advisers” or the “Adviser”), currently offers twenty-nine series (the “Portfolios”), each of which operates as a distinct investment vehicle of the Trust. The series included in this report is Loomis Sayles Small Cap Growth Portfolio (the “Portfolio”), which is diversified. Shares of the Portfolio are not offered directly to the general public and are currently available only to separate accounts of insurance companies, including insurance companies affiliated with the Adviser.
The Portfolio has registered and offers three classes of shares: Class A, B and E shares. Shares of each class of the Portfolio represent an equal pro rata interest in the Portfolio and generally give the shareholder the same voting, dividend, liquidation, and other rights. Investment income, realized and unrealized capital gains and losses, the common expenses of the Portfolio, and certain Portfolio-level expense reductions, if any, are allocated on a pro rata basis to each class based on the relative net assets of each class to the net assets of the Portfolio. Each class of shares differs in its respective distribution plan and such distribution expenses are allocated to the corresponding class of shares.
2. Significant Accounting Policies
The preparation of financial statements in conformity with accounting principles generally accepted in the United States of America (“GAAP”) requires management to make estimates and assumptions that affect the reported amounts of assets and liabilities and disclosure of contingent assets and liabilities as of the date of the financial statements and the reported amounts of income and expenses during the reporting period. Actual results could differ from those estimates. In the preparation of these financial statements, management has evaluated events and transactions subsequent to December 31, 2023 through the date the financial statements were issued.
The Portfolio is an investment company and follows the accounting and reporting guidance of the Financial Accounting Standards Board (“FASB”) Accounting Standards Codification Topic 946- Financial Services- Investment Companies. The following is a summary of significant accounting policies consistently followed by the Portfolio in the preparation of its financial statements.
Investment Valuation and Fair Value Measurements - The Portfolio values its investments for purposes of calculating its net asset value (“NAV”) using procedures that allow for a variety of methodologies to be used to value the Portfolio’s investments. The specific methodology used for an investment may vary based on the market data available for a specific investment at the time the Portfolio calculates its NAV or based on other considerations. The procedures also permit a level of judgment to be used in the valuation process.
Domestic and foreign equity securities, such as common stock, exchange-traded funds, rights, warrants, and preferred stock, that are traded on a securities exchange on a valuation date are generally valued at their last quoted sale price or official closing price on the primary exchange for such security, or, if no sales occurred on that day, at the last reported bid price. Equity securities traded over-the-counter (“OTC”) are generally valued at the last reported bid price. In the event of a major exchange closing during the trading day, the Adviser may use other market information obtained from quotation reporting systems, established market makers, or pricing services in valuing the securities. Valuation adjustments may be applied to certain foreign equity securities that are traded solely on foreign exchanges that close before the time as of which the Portfolio determines its NAV to account for the market movement between the close of the foreign exchanges and the time as of which the Portfolio determines its NAV. The Portfolio may use a systematic fair valuation model provided by a pricing service to value securities principally traded in these foreign markets to adjust for possible market movements or other changes that may occur between the close of the foreign exchanges and the time as of which the Portfolio determines its NAV. Foreign equity securities valued using these valuation adjustments are generally categorized as Level 2 within the fair value hierarchy. Equity securities that are actively traded, and have no valuation adjustments applied, are categorized as Level 1 within the fair value hierarchy. Other equity securities traded on inactive markets or valued in reference to similar instruments traded on active markets are generally categorized as Level 2 within the fair value hierarchy.
Investments in registered open-end management investment companies are valued at reported NAV per share on the valuation date and are categorized as Level 1 within the fair value hierarchy.
Debt securities, including corporate, convertible and municipal bonds and notes; obligations of the U.S. Treasury and U.S. government agencies; foreign sovereign issues; and non-U.S. bonds, are generally valued based upon evaluated or composite bid quotations obtained from third-party pricing services and/or brokers and dealers selected by the Adviser (each a “pricing service”). Such pricing services may use matrix pricing, which considers observable inputs including, among other things, issuer details, maturity dates, interest rates, yield curves, rates of prepayment, credit risks/spreads, default rates, reported trades, broker-dealer quotes and quoted prices for similar assets. Short-term obligations with a remaining maturity of sixty days or less may be valued at amortized cost in the absence of market quotes, so long as the amortized cost value of such short-term debt instrument is approximately the same as the fair value of the instrument as determined without the use of amortized cost valuation. Floating rate loans are generally valued based upon
BHFTII-13
Brighthouse Funds Trust II
Loomis Sayles Small Cap Growth Portfolio
Notes to Financial Statements—December 31, 2023—(Continued)
an evaluated or composite average of aggregate bid and ask quotations supplied by brokers or dealers, as obtained from the pricing service. Securities that use similar valuation techniques and inputs as described above are generally categorized as Level 2 within the fair value hierarchy.
Options, whether on securities, indices, futures contracts, or otherwise, traded on exchanges are valued at the last sale price available as of the close of business on a valuation day or, if there is no such price available, at the last reported bid price. These types of options are categorized as Level 1 within the fair value hierarchy. Futures contracts that are traded on commodity exchanges are valued at their settlement prices established by the exchanges on which they are traded as of the close of such exchanges and are categorized as Level 1 within the fair value hierarchy.
If no current market quotation is readily available or market value quotations are deemed to be unreliable for an investment, the fair value of the investment will be determined in accordance with procedures. A market quotation is readily available only when that quotation is a quoted price (unadjusted) in active markets for identical investments that the Portfolio can access at the measurement date, provided that a quotation will not be readily available if it is not reliable.
Pursuant to Rule 2a-5 under the 1940 Act, the Board of Trustees (the “Board” or “Trustees”) of the Trust has designated Brighthouse Investment Advisers, acting through its Valuation Committee (“Committee”), as the Portfolio’s “valuation designee” to perform the Portfolio’s fair value determinations. The Board oversees Brighthouse Investment Advisers in its role as the Valuation Designee and receives reports from Brighthouse Investment Advisers regarding its process and the valuation of the Portfolio’s investments to assist with such oversight.
No single standard for determining the fair value of an investment can be set forth because fair value depends upon the facts and circumstances with respect to each investment. Information relating to any relevant factors may be obtained by the Committee from any appropriate source, including the subadviser of the Portfolio, the Custodian, a pricing service, market maker and/or broker for such security or the issuer. Appropriate methodologies for determining fair value under particular circumstances may include: matrix pricing, a discounted cash flow analysis, comparisons of securities with comparable characteristics, value based on multiples of earnings, discount from market price of similar marketable securities, or a combination of these and other methods.
Investment Transactions and Related Investment Income - Portfolio security transactions are recorded on the trade date. Dividend income is recorded on the ex-dividend date or, for certain foreign securities, when notified. Interest income, which includes amortization of premium and accretion of discount on debt securities, is recorded on the accrual basis. Realized gains and losses on investments are determined on the identified cost basis, which is the same basis used for federal income tax purposes. Foreign income and foreign capital gains on some foreign securities may be subject to foreign taxes, which are accrued as applicable. These foreign taxes have been provided for in accordance with the Portfolio’s understanding of the applicable countries’ tax rules and rates.
Dividends and Distributions to Shareholders - The Portfolio records dividends and distributions on the ex-dividend date. Net realized gains from securities transactions (if any) are generally distributed annually to shareholders. The timing and characterization of certain income and capital gains distributions are determined in accordance with federal tax regulations that may differ from GAAP. Permanent book and tax basis differences relating to shareholder distributions will result in reclassification between distributable earnings (accumulated losses) and paid in surplus. Book-tax differences are primarily due to net operating losses and adjustments to prior period accumulated balances. These adjustments have no impact on net assets or the results of operations.
Income Taxes - It is the Portfolio’s policy to comply with the requirements of the Internal Revenue Code of 1986, as amended, and regulations thereunder, applicable to regulated investment companies, and to distribute, with respect to each taxable year, all of its taxable income to shareholders. Therefore, no federal income tax provision is required. The Portfolio files U.S. federal tax returns. No income tax returns are currently under examination. The Portfolio’s federal tax returns remain subject to examination by the Internal Revenue Service for three fiscal years after the returns are filed. As of December 31, 2023, the Portfolio had no uncertain tax positions that would require financial statement recognition, derecognition or disclosure.
Repurchase Agreements - The Portfolio may enter into repurchase agreements, under the terms of a Master Repurchase Agreement (“MRA”), or Global Master Repurchase Agreement (“GMRA”), with selected commercial banks and broker-dealers, under which the Portfolio acquires securities as collateral and agrees to resell the securities at an agreed-upon time and at an agreed-upon price. The Portfolio, through the Custodian or a subcustodian, under a tri-party repurchase agreement, receives delivery of the underlying securities collateralizing any repurchase agreements. It is the Portfolio’s policy that the market value of the collateral be equal to at least 100% of the repurchase price in the case of a repurchase agreement of one-day duration and equal to at least 102% of the repurchase price in the case of all other repurchase agreements. In the event of default or failure by a party to perform an obligation in connection with any repurchase transaction, the MRA or GMRA gives the non-defaulting party the right to set-off claims and to apply property held by it in connection with any repurchase transaction against obligations owed to it under the agreement.
At December 31, 2023, the Portfolio had direct investments in repurchase agreements with a gross value of $5,469,593. Additionally, the Portfolio invested cash collateral for loans of portfolio securities in repurchase agreements with a gross value of $304,196. The combined value of all repurchase agreements is included as part of investments at value on the Statement of Assets and Liabilities. The value of the related collateral exceeded the value of the repurchase agreements at December 31, 2023.
BHFTII-14
Brighthouse Funds Trust II
Loomis Sayles Small Cap Growth Portfolio
Notes to Financial Statements—December 31, 2023—(Continued)
Securities Lending - The Portfolio may lend its portfolio securities to certain qualified brokers who borrow securities in order to complete certain securities transactions. By lending its portfolio securities, the Portfolio attempts to increase its net investment income through the receipt of income on collateral held from securities on loan. Any gain or loss in the market price of the loaned securities that might occur, any interest earned, and any dividends declared during the term of the loan, would accrue to the account of the Portfolio.
The Trust has entered into a Non-Custodial Securities Lending Agreement with JPMorgan Chase Bank, N.A. (the “Lending Agent”). Under the agreement, the Lending Agent is authorized to loan portfolio securities on the Portfolio’s behalf. In exchange, the Portfolio generally receives cash, U.S. Government securities, letters of credit, or other collateral deemed appropriate by the Adviser. The Portfolio receives collateral equal to at least 102% of the market value for loans secured by government securities or cash in the same currency as the loaned shares and 105% for all other loaned securities at each loan’s inception. Collateral representing at least 100% of the market value of the loaned securities is maintained for the duration of the loan. Any cash collateral received by the Portfolio is generally invested by the Lending Agent in short-term investments, which may include certificates of deposit, commercial paper, repurchase agreements, including repurchase agreements with respect to equity securities, time deposits, master demand notes and money market funds. The market value of investments made with cash collateral received are disclosed in the Schedule of Investments and the valuation techniques are described in Note 2. The value of the securities on loan may change each business day. If the market value of the collateral at the close of trading on a business day is less than 100% of the market value of the loaned securities at the close of trading on that day, the borrower is required to deliver, by the close of business on the following business day, an additional amount of collateral, so that the total amount of posted collateral is equal to at least 100% of the market value of all the loaned securities as of such preceding day. A portion of the income earned on the collateral is rebated to the borrower of the securities and the remainder is split between the Lending Agent and the Portfolio. On loans collateralized by U.S. government securities, a fee is received from the borrower and is allocated between the Portfolio and the Lending Agent.
Income received by the Portfolio in securities lending transactions during the year ended December 31, 2023 is reflected as securities lending income on the Statement of Operations. The values of any securities loaned by the Portfolio and the related collateral at December 31, 2023 are disclosed in the footnotes to the Schedule of Investments. The value of the related collateral received by the Portfolio exceeded the value of the securities out on loan at December 31, 2023.
The risks associated with lending portfolio securities include, but are not limited to, possible delays in receiving additional collateral or in the recovery of the loaned securities, possible loss of rights in the collateral should the borrower fail financially, as well as risk of loss in the value of the collateral or the value of the investments made with the collateral. To the extent the Portfolio uses cash collateral it receives to invest in repurchase agreements with respect to equity securities, it is subject to the risk of loss if the value of the equity securities declines and the counterparty defaults on its obligation to repurchase such securities. The Lending Agent shall indemnify the Portfolio in the case of default of any securities borrower, subject to the terms of the Non-Custodial Securities Lending Agreement.
All securities on loan are classified as Common Stocks in the Portfolio’s Schedule of Investments as of December 31, 2023. For all securities on loan, the remaining contractual maturity of the agreements is overnight and continuous.
Directed Brokerage Agreement - The Trust has entered into a directed brokerage arrangement with Capital Institutional Services, Inc. (“CAPIS”). Under this arrangement, the Portfolio directs certain trades to CAPIS in return for a recapture credit. CAPIS issues a cash rebate to the Portfolio. Amounts paid to the Portfolio are shown separately as broker commission recapture on the Statement of Operations of the Portfolio. Additionally, these amounts have been excluded from the calculation of the net ratio of expenses to average net assets presented in the Financial Highlights for each share class.
3. Certain Risks
In the normal course of business, the Portfolio invests in securities and enters into transactions where risks exist. Those risks include:
Market Risk: The value of securities held by the Portfolio may decline in response to certain events, including those directly involving the issuers whose securities are owned by the Portfolio; conditions affecting the general economy; overall market changes; local, regional or global political, social or economic instability; currency, interest rate, and price fluctuations, or other factors including terrorism, war, natural disasters and the spread of infectious illness including epidemics or pandemics such as the COVID-19 pandemic. These events may also adversely affect the liquidity of securities held by the Portfolio.
Credit and Counterparty Risk: The Portfolio may be exposed to counterparty risk, or the risk that an entity with which the Portfolio has unsettled or open transactions may default. The potential loss could exceed the value of the financial assets and liabilities recorded in the financial statements. Financial assets that potentially expose the Portfolio to credit and counterparty risk consist principally of cash due from counterparties and investments. The Portfolio manages counterparty risk by entering into agreements only with counterparties that it believes have the financial resources to honor their obligations and by monitoring the financial stability of those counterparties. The Subadviser may attempt to mitigate counterparty risk by (i) periodically assessing the
BHFTII-15
Brighthouse Funds Trust II
Loomis Sayles Small Cap Growth Portfolio
Notes to Financial Statements—December 31, 2023—(Continued)
creditworthiness of its trading partners, (ii) monitoring and/or limiting the amount of its net exposure to each individual counterparty based on its assessment, and (iii) requiring collateral from the counterparty for certain transactions. In order to preserve certain safeguards for non-standard settlement trades, the Portfolio restricts its exposure to credit and counterparty losses by entering into master netting agreements (“Master Agreements”) with counterparties (approved brokers) with whom it undertakes a significant volume of transactions. Master Agreements govern the terms of certain transactions and reduce the counterparty risk associated with relevant transactions by specifying credit protection mechanisms and providing standardization that improves legal certainty. Master Agreements can also help limit counterparty risk by specifying collateral posting arrangements at pre-arranged exposure levels.
Repurchase and reverse repurchase agreements are primarily executed under GMRAs or MRAs, which provide the right to set-off. Each repurchase and reverse repurchase agreement is initially collateralized at the transaction level. In the event of default, the total market value exposure will be offset against collateral exchanged to date, which would result in a net receivable/(payable) that would be due from/to the counterparty.
Additional risks associated with each type of investment are described above within the respective security type notes. The Portfolio’s prospectus includes a discussion of the principal risks of investing in the Portfolio.
4. Investment Transactions
Aggregate cost of purchases and proceeds of sales of investment securities, excluding short-term securities, for the year ended December 31, 2023 were as follows:
| Purchases |
Sales | |||||||||||
| U.S. Government |
Non-U.S. Government | U.S. Government | Non-U.S. Government | |||||||||
| $0 | $ | 129,473,119 | $ | 0 | $ | 157,572,444 | ||||||
5. Investment Management Fees and Other Transactions with Affiliates
Investment Management Agreement - Brighthouse Investment Advisers is the investment adviser to the Portfolio. The Trust has entered into an investment management agreement with Brighthouse Investment Advisers with respect to the Portfolio. For providing investment management services to the Portfolio, Brighthouse Investment Advisers receives monthly compensation at the following annual rates:
|
Management |
% per annum | Average Daily Net Assets | ||||
| $3,299,920 | 0.900 | % | Of the first $500 million | |||
| 0.850 | % | On amounts in excess of $500 million | ||||
Brighthouse Investment Advisers has entered into an investment subadvisory agreement with respect to managing the Portfolio. Loomis, Sayles & Company, L.P. is compensated by Brighthouse Investment Advisers to provide subadvisory services for the Portfolio.
Management Fee Waivers - Pursuant to a management fee waiver agreement, the Adviser has agreed, for the period May 1, 2023 to April 30, 2024, to reduce its advisory fees set out above under “Investment Management Agreement” for each class of the Portfolio as follows:
| % per annum reduction |
Average Daily Net Assets | |
| 0.080% | On the first $100 million | |
| 0.100% | On the next $400 million | |
| 0.050% | On amounts in excess of $500 million |
An identical expense agreement was in place for the period April 29, 2022 to April 30, 2023. Amounts waived for the year ended December 31, 2023 are shown as management fee waivers in the Statement of Operations.
Certain officers and trustees of the Trust may also be officers of the Adviser; however, such officers and trustees receive no compensation from the Trust.
Transfer Agency Agreement - Brighthouse Life Insurance Company serves as the transfer agent for the Trust. Brighthouse Life Insurance Company receives no fees for its services to the Trust.
BHFTII-16
Brighthouse Funds Trust II
Loomis Sayles Small Cap Growth Portfolio
Notes to Financial Statements—December 31, 2023—(Continued)
Distribution and Service Fees - The Trust has a distribution agreement with Brighthouse Securities, LLC (the “Distributor”) pursuant to which the Distributor serves as the general distributor of shares of each class (each a “Class”) of each Portfolio. The Distributor is an affiliate of the Trust. The Trust has adopted a Distribution and Services Plan (the “D&S Plan”) relating to Class B, Class D, Class E, Class F and Class G shares of each Portfolio, under Rule 12b-1 under the 1940 Act, pursuant to which the Trust may pay the Distributor a fee (the “Service Fee”) at an annual rate not to exceed 0.25% of each such Portfolio’s average daily net assets attributable to the Class B, Class D, Class E, Class F and Class G shares of the Trust. Each Portfolio may not offer shares of each Class. The D&S Plan also authorizes the Trust, on behalf of each of its Portfolios, to pay to the Distributor a distribution fee (the “Distribution Fee” and together with the Service Fee, the “Fees”) at an annual rate of up to 0.25% of each Portfolio’s average daily net assets attributable to the Class B, Class D, Class E, Class F, and Class G shares in consideration of the services rendered in connection with the sale of such shares by the Distributor. Under the Distribution Agreement with respect to the Trust, Fees are currently paid at an annual rate of 0.25% of average daily net assets in the case of Class B shares, 0.10% of average daily net assets in the case of Class D shares, 0.15% of average daily net assets in the case of Class E shares, 0.20% of average daily net assets in the case of Class F shares and 0.30% of average daily net assets in the case of Class G shares. The D&S Plan is known as a “compensation plan” because the Trust makes payments to the Distributor for services rendered regardless of the actual level of expenditures by the Distributor. Amounts incurred by the Portfolio for the year ended December 31, 2023 are shown as Distribution and service fees in the Statement of Operations.
Deferred Trustee Compensation - Each Trustee who is not currently an employee of the Adviser or any of its affiliates receives compensation from the Trust for his or her service to the Trust. A deferred compensation plan (the “Plan”) is available to the Trustees on a voluntary basis. Deferred amounts remain in the Trust until distributed in accordance with the provisions of the Plan. The value of a participating Trustee’s deferral account is based on theoretical investments of deferred amounts on the normal payment dates in certain portfolios of the Trust or Brighthouse Funds Trust I, an affiliate of the Trust, as designated by the participating Trustee. Changes in the value of participants’ deferral accounts are reflected as a component of Trustees’ fees and expenses in the Statement of Operations. The portion of the accrued obligations allocated to the Portfolio under the Plan is reflected as Deferred trustees’ fees in the Statement of Assets and Liabilities.
6. Contractual Obligations
Under the Trust’s organizational documents, its officers and Trustees may be indemnified against certain liabilities and expenses arising out of the performance of their duties to the Trust. Additionally, the Trust has a variety of indemnification obligations under contracts with its service providers. The Trust’s maximum exposure under these arrangements is unknown, as this would involve future claims that may be made against the Trust that have not yet occurred.
7. Income Tax Information
The cost basis of investments for federal income tax purposes at December 31, 2023 was as follows:
| Cost basis of investments |
$ | 310,000,566 | ||
|
|
|
|||
| Gross unrealized appreciation |
87,390,616 | |||
| Gross unrealized (depreciation) |
(9,612,532 | ) | ||
|
|
|
|||
| Net unrealized appreciation (depreciation) |
$ | 77,778,084 | ||
|
|
|
The tax character of distributions paid for the years ended December 31, 2023 and 2022 were as follows:
| Ordinary Income |
Long-Term Capital Gain | Return of Capital | Total | |||||||||||||||||||||||||
| 2023 |
2022 | 2023 | 2022 | 2023 | 2022 | 2023 | 2022 | |||||||||||||||||||||
| $— | $ | — | $ | — | $ | 88,677,929 | $ | — | $ | 179,021 | $ | — | $ | 88,856,950 | ||||||||||||||
As of December 31, 2023, the components of distributable earnings (accumulated losses) on a federal income tax basis were as follows:
| Undistributed |
Undistributed Long-Term Capital Gain |
Net Unrealized Appreciation (Depreciation) |
Accumulated Capital Losses |
Total | ||||||||||||
| $— | $ | 3,197,067 | $ | 77,778,084 | $ | — | $ | 80,975,151 | ||||||||
The Portfolio utilizes the provisions of the federal income tax laws that provide for the carryforward of capital losses for prior years, offsetting such losses against any future realized capital gains. Net capital losses may be carried forward indefinitely and their character is retained as short-term and/or long-term losses.
As of December 31, 2023, the Portfolio had no accumulated capital losses.
During the year ended December 31, 2023, the Portfolio utilized accumulated short-term capital losses of $807,674.
BHFTII-17
Brighthouse Funds Trust II
Loomis Sayles Small Cap Growth Portfolio
Notes to Financial Statements—December 31, 2023—(Continued)
8. Recent Accounting Pronouncement & Regulatory Updates
In June 2022, FASB issued Accounting Standards Update 2022-03—Fair Value Measurement (Topic 820)—Fair Value Measurement of Equity Securities Subject to Contractual Sale Restrictions (“ASU 2022-03”). ASU 2022-03 clarifies the guidance in Topic 820 to indicate that a contractual sale restriction should not be considered in the fair value of an equity security subject to such a restriction, and requires entities with investments in equity securities subject to contractual sale restrictions to disclose certain qualitative and quantitative information about such securities. ASU 2022-03 is effective for fiscal years, and interim periods within those fiscal years, beginning after December 15, 2023. ASU 2022-03 is only applicable to an equity security in which the contractual arrangement that restricts its sale is executed or modified on or after the adoption date.
Effective January 24, 2023, the Securities and Exchange Commission adopted rule and form amendments that require open-end management investment companies to transmit concise and visually engaging annual and semiannual reports to shareholders that highlight certain information deemed by the SEC to be particularly important for investors. Certain other information, including financial statements, will no longer appear in shareholder reports but will, as required, be available online, delivered free of charge upon request, and filed on a semiannual basis on Form N-CSR. The rule and form amendments have a compliance date of July 24, 2024. Accordingly, the rule and form amendments will not impact the Portfolio until its 2024 semiannual shareholder report.
BHFTII-18
Brighthouse Funds Trust II
Loomis Sayles Small Cap Growth Portfolio
Report of Independent Registered Public Accounting Firm
To the Board of Trustees of Brighthouse Funds Trust II and Shareholders of the Loomis Sayles Small Cap Growth Portfolio:
Opinion on the Financial Statements and Financial Highlights
We have audited the accompanying statement of assets and liabilities, including the schedule of investments, of the Loomis Sayles Small Cap Growth Portfolio (the “Fund”) (one of the funds constituting the Brighthouse Funds Trust II), as of December 31, 2023, the related statement of operations for the year then ended, the statements of changes in net assets for each of the two years in the period then ended, the financial highlights for each of the five years in the period then ended, and the related notes. In our opinion, the financial statements and financial highlights present fairly, in all material respects, the financial position of the Fund as of December 31, 2023, and the results of its operations for the year then ended, the changes in its net assets for each of the two years in the period then ended, and the financial highlights for each of the five years in the period then ended in conformity with accounting principles generally accepted in the United States of America.
Basis for Opinion
These financial statements and financial highlights are the responsibility of the Fund’s management. Our responsibility is to express an opinion on the Fund’s financial statements and financial highlights based on our audits. We are a public accounting firm registered with the Public Company Accounting Oversight Board (United States) (PCAOB) and are required to be independent with respect to the Fund in accordance with the U.S. federal securities laws and the applicable rules and regulations of the Securities and Exchange Commission and the PCAOB.
We conducted our audits in accordance with the standards of the PCAOB. Those standards require that we plan and perform the audit to obtain reasonable assurance about whether the financial statements and financial highlights are free of material misstatement, whether due to error or fraud. The Fund is not required to have, nor were we engaged to perform, an audit of its internal control over financial reporting. As part of our audits we are required to obtain an understanding of internal control over financial reporting but not for the purpose of expressing an opinion on the effectiveness of the Fund’s internal control over financial reporting. Accordingly, we express no such opinion.
Our audits included performing procedures to assess the risks of material misstatement of the financial statements and financial highlights, whether due to error or fraud, and performing procedures that respond to those risks. Such procedures included examining, on a test basis, evidence regarding the amounts and disclosures in the financial statements and financial highlights. Our audits also included evaluating the accounting principles used and significant estimates made by management, as well as evaluating the overall presentation of the financial statements and financial highlights. Our procedures included confirmation of securities owned as of December 31, 2023, by correspondence with the custodian and brokers; when replies were not received from brokers, we performed other auditing procedures. We believe that our audits provide a reasonable basis for our opinion.
/s/ Deloitte & Touche LLP
Boston, Massachusetts
February 23, 2024
We have served as the auditor of one or more Brighthouse investment companies since 1983.
BHFTII-19
Brighthouse Funds Trust II
Trustees and Officers
MANAGEMENT OF THE TRUSTS
The Boards of Trustees (the “Board”) of Brighthouse Funds Trust I and Brighthouse Funds Trust II (“Trust I” and “Trust II”, respectively, and collectively the “Trusts”) supervise the Trusts and are responsible for representing the interests of shareholders. The Trustees, the Chairman of the Board and the Chairmen of each subcommittee are the same for both Trusts. The Trustees of each Trust meet periodically throughout the year to oversee the Portfolios’ activities, reviewing, among other things, each Portfolio’s performance and its contractual arrangements with various service providers. The Trustees of each Trust elect the officers of the Trust, who are responsible for administering the Trust’s day-to-day operations.
Trustees and Officers
The Trustees and executive officers of the Trusts, as well as their ages and their principal occupations during the past five years, are set forth below. Unless otherwise indicated, the business address of each is c/o Brighthouse Funds Trust I and Brighthouse Funds Trust II, 11225 N. Community House Rd., Charolette, North Carolina 28277. Each Trustee who is deemed an “interested person,” as such term is defined in the 1940 Act, is referred to as an “Interested Trustee.” Those Trustees who are not “interested persons,” as such term is defined in the 1940 Act, are referred to as “Independent Trustees.” There is no limit to the term a Trustee may serve, other than pursuant to the retirement policy adopted by the Independent Trustees. Trustees serve until their death, resignation, retirement or removal in accordance with Trust I’s and Trust II’s respective organizational documents and policies adopted by the Board of the Trust from time to time. Officers hold office at the pleasure of each Board and serve until their removal or resignation in accordance with the Trusts’ respective organizational documents and policies adopted by the Board of each Trust from time to time.
Trustees of the Trusts
| Name and Year of Birth |
Position(s) |
Term of Office |
Principal Occupation(s) During the Past |
Number of |
Other Directorships Held | |||||
| Interested Trustee | ||||||||||
| John Rosenthal* (1960) |
Trustee | Indefinite; From May 2016 (Trust I and Trust II) to present | Chief Investment Officer, Brighthouse Financial, Inc. (2016 to present). | 73 | None | |||||
| Independent Trustees | ||||||||||
| Dawn M. Vroegop (1966) |
Trustee and Chair of the Board | Indefinite; From December 2000 (Trust I)/May 2009 (Trust II) to present as Trustee; From May 2016 (Trust I and Trust II) until present as Chair | Retired; Private Investor. | 73 | Trustee, Driehaus Mutual Funds (8 portfolios).** | |||||
| Stephen M. Alderman (1959) |
Trustee | Indefinite; From December 2000 (Trust I)/April 2012 (Trust II) to present | Vice President and General Counsel, IHR Aerial Solutions, LLC; Until 2022, General Counsel, Illini Hi-Reach, Inc.; Until 2020, Shareholder in the law firm of Garfield & Merel, Ltd. | 73 | None | |||||
| Robert J. Boulware (1956) |
Trustee | Indefinite; From March 2008 (Trust I)/April 2012 (Trust II) to present | Managing Member, Pilgrim Funds, LLC (private equity fund). | 73 | Trustee, Vertical Capital Income Fund (closed-end fund);** Trustee, The Private Shares Fund (closed- end fund);** Until 2021, Director, Mid- Con Energy Partners, LP (energy);** Until 2020, Director, Gainsco, Inc. (auto insurance).** | |||||
BHFTII-20
Brighthouse Funds Trust II
Trustees and Officers—(Continued)
| Name and Year of Birth |
Position(s) |
Term of Office |
Principal Occupation(s) During the Past |
Number of |
Other Directorships Held | |||||
| Susan C. Gause (1952) |
Trustee | Indefinite; From March 2008 (Trust I)/April 2012 (Trust II) to present | Private Investor. | 73 | Trustee, HSBC Funds (4 portfolios).** | |||||
| Nancy Hawthorne (1951) |
Trustee | Indefinite; From May 2003 (Trust II)/April 2012 (Trust I) to present | Private Investor. | 73 | Trustee, First Eagle Credit Opportunities Fund;** Trustee and Chair of the Board of Trustees, First Eagle Global Opportunities Fund;** Director, Avid Technology, Inc;** Director, CRA International, Inc.** | |||||
Executive Officers of the Trusts
| Name and Year of Birth |
Position(s) Held with |
Term of Office |
Principal Occupation(s) | |||
| Kristi Slavin (1973) | President and Chief Executive Officer, of Trust I and Trust II | From May 2016 (Trust I and Trust II) to present |
President, Brighthouse Investment Advisers, LLC (2016-present). | |||
| Alan R. Otis (1971) | Chief Financial Officer and Treasurer, of Trust I and Trust II | From November 2017 (Trust I and Trust II) to present |
Executive Vice President, Brighthouse Investment Advisers, LLC (2017-present); formerly, Vice President, Brighthouse Investment Advisers, LLC (2012-2017); Assistant Treasurer, Trust I and Trust II (2012-2017). | |||
| Thomas Watterson (1985) | Secretary, of Trust I and Trust II | From November 2023 (Trust I and Trust II) to present |
Executive Vice President, Chief Legal Officer and Secretary, Brighthouse Investment Advisers, LLC (2023-Present); Managing Corporate Counsel, Brighthouse Financial Inc. (2023-present); Managing Counsel and Director, The Bank of New York Mellon Corporation (2019-2023); Counsel and Vice President, The Bank of New York Mellon Corporation (2016-2019). | |||
| Katie Hellmann (1980) | Chief Compliance Officer (“CCO”), of Trust I and Trust II | From May 2023 (Trust I and Trust II) to present |
Chief Compliance Officer, Brighthouse Investment Advisers, LLC (2023-present) and Head of Funds and Investments Compliance (2023-present). Deputy Chief Compliance Officer, Transamerica Asset Management (2022-2023). Leader and Senior Compliance Counsel-Funds Compliance, Edward Jones (2017-2022). | |||
| Rosemary Morgan (1983) | Anti-Money Laundering Officer, of Trust I and Trust II | From May 2023 (Trust I and Trust II) to present |
Chief Privacy Officer, Leader of Compliance Programs and Assistant General Counsel, Brighthouse Financial, Inc. (2019-2022); Chief Privacy Officer, Head of Compliance Programs & Contracts Law, Brighthouse Financial, Inc. (2022-2023), Chief Compliance Officer and Associate General Counsel, Brighthouse Financial, Inc. (2023-present); Vice President and Chief Compliance Officer, Brighthouse Life Insurance Company (2023-present); Vice President and Chief Compliance Officer (2023-present), Brighthouse Life Insurance Company of NY; Vice President and Chief Compliance Officer (2023-present), New England Life Insurance Company. | |||
| Anna Koska (1981) | Vice President, of Trust I and Trust II | From June 2022 (Trust I and Trust II) to present |
Vice President, Investment and Advisory Services, Brighthouse Investment Advisers, LLC (2022-present); Director of Investment and Advisory Services, Brighthouse Investment Advisers, LLC (2019-2022); Senior Portfolio Analyst, Brighthouse Investment Advisers, LLC (2017-2019). | |||
| * | Mr. Rosenthal is an “interested person” of the Trusts because of his position with Brighthouse Financial, Inc. (“Brighthouse Financial”), an affiliate of BIA. |
| ** | Indicates a directorship with a registered investment company or a company subject to the reporting requirements of the Securities Exchange Act of 1934, as amended. |
| (1) | Previous positions during the past five years with the Trusts, MetLife, Inc. or the Adviser are omitted if not materially different. |
| (2) | The Fund Complex includes 44 Trust I Portfolios and 29 Trust II Portfolios. |
BHFTII-21
Brighthouse Funds Trust II
Loomis Sayles Small Cap Growth Portfolio
Board of Trustees’ Consideration of Advisory and Sub-Advisory Agreements
At a meeting held on November 13-14, 2023 (the “November Meeting”), the Boards of Trustees (the “Board”) of Brighthouse Funds Trust I and Brighthouse Funds Trust II (“BFT I” and “BFT II,” respectively, and collectively, the “Trusts”), including a majority of the Trustees who are not “interested persons” of the Trusts (the “Independent Trustees”) under the Investment Company Act of 1940 (the “1940 Act”), approved the continuation of the Trusts’ advisory agreements (each an “Advisory Agreement”) with Brighthouse Investment Advisers, LLC (the “Adviser”) and the applicable sub-advisory and sub-sub-advisory agreements (each a “Sub-Advisory Agreement” and collectively with the Advisory Agreement, the “Agreements”) between the Adviser and the investment sub-advisers and sub-sub-adviser (each a “Sub-Adviser,” and collectively, the “Sub-Advisers”) for the series of the Trusts (each a “Portfolio,” and collectively, the “Portfolios”) for the annual contract renewal period from January 1, 2024 through December 31, 2024.
The Board met with personnel of the Adviser on September 28-29, 2023 (the “September Meeting”) for the specific purpose of giving preliminary consideration to the proposed continuation of the Agreements, including consideration to information that the Adviser and Sub-Advisers had provided for the Board’s review at the request of the Independent Trustees. At the September Meeting, the Adviser reviewed with the Board the performance and fees experienced by each Portfolio, as well as other information. During and after the September Meeting, the Independent Trustees requested additional information and clarifications that the Adviser addressed at the November Meeting (the September Meeting and the November Meeting are referred to collectively as, the “Meetings”). During the contract renewal process, and throughout the year, the Independent Trustees were advised by independent legal counsel, and they met with independent legal counsel in executive sessions outside of the presence of management on a number of occasions to discuss, among other things, the renewal of the Agreements.
In considering the continuation of the Agreements, the Board reviewed a variety of materials that were provided for the specific purpose of assisting the Board in the renewal process, along with various information and materials that were provided to and discussed with the Board throughout the year, at regularly scheduled meetings of the Board and its committees. In particular, information for each Portfolio included, but was not limited to, reports on investment performance, expenses, legal and compliance matters, and asset pricing. Information about the Adviser and each Sub-Adviser included, but was not limited to, reports on the business, operations, and performance of the Adviser and the Sub-Advisers and reports that the Adviser and Sub-Advisers had prepared specifically for the renewal process.
In considering the continuation of the Agreements, the Board also reviewed, among other things, a report for each Portfolio that was prepared by Broadridge (“Broadridge”), an independent organization, which set forth comparative performance and expense information for each Portfolio. In addition, the Independent Trustees reviewed a report that was prepared by JDL Consultants, LLC (“JDL”), an independent consultant to the Independent Trustees, which examined the Broadridge reports for each Portfolio (“JDL Report”). The Independent Trustees met in executive session with representatives of JDL during the September Meeting to review the JDL Report.
At the November Meeting, the Board, including a majority of the Independent Trustees, concluded that the nature, extent, and quality of services provided by the Adviser and each Sub-Adviser supported the renewal of the Agreements. The Board also concluded that the investment services provided to and the performance of each Portfolio was such that each Agreement should continue, and that the fees paid by each Portfolio to the Adviser appeared to be reasonable in light of the nature, extent, and quality of the services provided by the Adviser and each Sub-Adviser. Further, the Board concluded that the Adviser’s profitability in providing services under the Advisory Agreements did not appear unreasonable in light of the nature, extent, and quality of the services provided by the Adviser. The Board reviewed the extent to which the investment advisory fees paid by the Portfolios shared economies of scale with investors or entailed the potential to share economies of scale with investors and concluded that those considerations generally supported the renewal of each Agreement. Finally, the Board considered the Adviser’s recommendation that it approve the renewal of each Sub-Advisory Agreement.
In approving the continuation of each Agreement, the Board, including the Independent Trustees, gave attention to all of the information that was furnished, and each Trustee placed varying degrees of importance on the various pieces of information that were provided to them. The Board evaluated the information provided to it on a Portfolio-by-Portfolio basis, and its decision was made separately with respect to each Portfolio. The following paragraphs provide more information about some of the primary factors that were relevant to the Board’s decisions. The Board did not identify any single factor as determinative, and the Trustees generally attributed different weights to various factors for the various Portfolios.
Nature, extent and quality of services. The Board evaluated the nature, extent, and quality of the services that the Adviser and the Sub-Advisers, as relevant, provided to the Portfolios. The Board considered the Adviser’s services as investment manager to the Portfolios, including its services relating to the hiring and oversight of the Sub-Advisers and, in particular, their investment programs and personnel, succession management of key personnel, trading practices, compliance programs and personnel, and risk management
BHFTII-22
Brighthouse Funds Trust II
Loomis Sayles Small Cap Growth Portfolio
Board of Trustees’ Consideration of Advisory and Sub-Advisory Agreements—(Continued)
programs, among other things. The Adviser’s services in coordinating and overseeing the activities of the Trusts’ other service providers were also considered. The Board also considered the systems and processes required by the Adviser to meet additional regulatory and compliance requirements resulting from U.S. Securities and Exchange Commission and other regulatory initiatives, including related to liquidity, valuation, and derivatives risk management. The Board considered information received from the Trusts’ Chief Compliance Officer regarding the Portfolios’ compliance policies and procedures that were established pursuant to Rule 38a-l under the 1940 Act, and relevant aspects of the Adviser’s and Sub-Advisers’ compliance policies and procedures. The Board also noted that it was the practice of the Adviser’s investment, compliance, and legal staff to conduct periodic meetings (through various media) with the Sub-Advisers throughout the year in order to review and assess the services that are provided to the Portfolios, and that personnel of the Adviser routinely prepare and present reports to the Board regarding those meetings. In addition, during the Meetings and throughout the year, the Board considered the expertise, experience, and performance of the personnel of the Adviser who performed the various services that are mentioned above.
With respect to the services provided by each of the Sub-Advisers, the Board considered a variety of information that the Adviser and each Sub-Adviser prepared for the Board’s review. The Board considered each Sub-Adviser’s investment process, each Sub-Adviser’s overall organization and business plans and the investment performance experienced by the Portfolio (as described in more detail below). The Board took into account that each Sub-Adviser’s responsibilities include, among other things, the development and maintenance of an investment program for the applicable Portfolio, the selection of investments and the placement of orders for the purchase and sale of such assets, and the implementation of compliance controls related to the performance of these services. The Board considered, based on the information provided, each Sub-Adviser’s staffing with respect to the management of the Portfolio and other information relating to the Sub-Adviser’s business and operations. The Board also considered the Sub-Adviser’s overall resources and information with respect to any recent turnover of key personnel at the Sub-Adviser. The Board reviewed each Sub-Adviser’s investment experience, as well as information provided regarding the Sub-Adviser’s personnel who provide services to the Portfolios. The Board also considered, among other things, information about each Sub-Adviser’s compliance program, including regarding any compliance matters involving a Sub-Adviser that had been brought to the Board’s attention during the year, as well as the Adviser’s assessment of the financial condition of each Sub-Adviser.
Performance. The Board placed emphasis on the performance of each Portfolio in the context of the performance of the relevant markets in which the Portfolio invests. The Board considered the Adviser’s quarterly presentations to the Board of detailed information about each Portfolio’s investment strategies and performance results and composition, including discussions regarding the relevant effects of market conditions. The Board reviewed and considered the reports prepared by Broadridge, which provided a statistical analysis comparing each Portfolio’s investment performance to that of comparable funds underlying variable insurance products (the “Performance Universe”), and the JDL Report. The Board also compared the performance of each Portfolio to that of comparable funds and other accounts that were managed by the relevant Sub-Adviser, to the extent such information was provided. The Board considered each Portfolio’s performance for periods subsequent to the performance period covered by the Broadridge reports and considered the Adviser’s assessment of the same. The Board also noted that while it found the data provided by Broadridge generally useful, it recognized the limitations of such data, including, in particular, that notable differences may exist between a Portfolio and the other funds in a Broadridge category (for example, with respect to investment strategies) and that the results of the performance comparisons may vary depending on (i) the end dates for the performance periods that were selected and (ii) the selection of the peer groups.
The Board focused particular attention on Portfolios with less favorable performance records. The Board noted the Adviser’s focus on each Sub-Adviser’s performance and that the Adviser had been active in monitoring and responding to any performance issues with respect to the Portfolios.
Fees and Expenses. The Board gave consideration to the level and method of computing the fees payable under the Agreements. The Board reviewed and considered the information in the JDL Report concerning fees and expenses. The Board also reviewed and considered the Broadridge report for each Portfolio, which included various comparisons of the Portfolio’s fees (at December 31, 2022 and various asset levels) and expenses with those of its peers, including, as applicable, a broad group of peer funds (“Expense Universe”), a narrower group of peer funds (“Expense Group”), a broad group of peer sub-advised funds (“Sub-advised Expense Universe”), and a narrower group of peer sub-advised funds (“Sub-advised Expense Group”). In particular, the Board reviewed comparisons of each Portfolio’s contractual management fees with its Expense Group and Sub-advised Expense Universe, contractual sub-adviser fees with its Sub-advised Expense Universe and Sub-advised Expense Group, and total expenses with its Expense Universe, Expense Group and Sub-advised Expense Universe. The Board considered that Broadridge selected the peer funds, which were funds underlying variable insurance products that Broadridge deemed to be comparable to the Portfolios. The Board considered that the fee and expense information in the Broadridge report for each Portfolio reflected information as of the Portfolio’s most recent fiscal year
BHFTII-23
Brighthouse Funds Trust II
Loomis Sayles Small Cap Growth Portfolio
Board of Trustees’ Consideration of Advisory and Sub-Advisory Agreements—(Continued)
end at the time the Broadridge report was issued and that historical asset levels may differ from current asset levels, particularly in a period of market volatility. In addition, the Board compared the fee payable to a Sub-Adviser by the Adviser with respect to the Portfolio to the fee payable to the Sub-Adviser by other comparable funds and other accounts, to the extent such information was provided.
The Board noted that the sub-advisory fees for the Portfolios are negotiated at arm’s length by the Adviser and are paid by the Adviser out of its advisory fees. The Board also considered that the Adviser had entered into expense limitation or management fee waiver agreements with certain of the Portfolios pursuant to which the Adviser had agreed to waive a portion of its advisory fee and/or reimburse certain expenses as a means of limiting a Portfolio’s total annual operating expenses or passing through the benefit of a subadvisory fee concession to a Portfolio, as applicable.
Profitability. The Board examined the profitability to the Adviser of each Advisory Agreement, on a Portfolio-by-Portfolio basis. The Board also considered that an affiliate of the Adviser, Brighthouse Securities, LLC, serves as distributor for the Trusts, and, as such, receives Rule 12b-1 payments to support the distribution of the Portfolios. The Board considered the profitability to the Sub-Advisers and their affiliates of their relationships with the Portfolios, to the extent provided, and the Board considered the ability of the Adviser to negotiate with a Sub-Adviser at arm’s length. In reviewing the profitability information, the Board recognized that expense allocation methodologies are inherently subjective and various methodologies may be reasonable while producing different results.
Economies of scale. The Board considered each Portfolio’s fees in light of its size. The Board noted the fee schedules for the Portfolios that contain breakpoints that reduce the fee rate above specified asset levels, including breakpoints in the Advisory Agreements and any corresponding Sub-Advisory Agreement. The Board noted those Portfolios that did not have breakpoints in their advisory fees and considered management’s explanation of the same.
The Board considered the effective fees under the Advisory Agreement and Sub-Advisory Agreement for each Portfolio as a percentage of assets at different asset levels and possible economies of scale that may be realized if the assets of the Portfolio grow. The Board examined, among other data, the effect of a Portfolio’s growth in size, and reduction in size, on various fee schedules. The Board also generally noted that if a Portfolio’s assets increase over time, the Portfolio may realize economies of scale if assets increase proportionally more than certain other expenses.
Other factors. The Board considered other benefits that may be realized by the Adviser and its affiliates from their relationships with the Trusts. Among the benefits realized by the Adviser, the Board recognized that Brighthouse Securities, LLC, as the distributor for the Trusts, receives payments pursuant to Rule 12b-1 from the Portfolios to help compensate for the provision of shareholder services and distribution activities. The Board considered that a Sub-Adviser may engage in soft dollar transactions in managing a Portfolio. In addition, the Board considered that a Sub-Adviser may be affiliated with registered broker-dealers that may, from time to time, receive brokerage commissions from a Portfolio in connection with the sale of portfolio securities (subject to applicable best execution obligations). The Board also considered that a Sub-Adviser and its affiliates could benefit from the opportunity to provide advisory services to additional portfolios of the Trusts and overall reputational benefits.
The Board considered information from the Adviser and Sub-Advisers pertaining to potential conflicts of interest, and the manner in which any potential conflicts were mitigated. In its review, the Board considered information regarding various business relationships among the Adviser and its affiliates and various Sub-Advisers and their affiliates. The Board also considered information about services and/or payments provided to the Adviser by the Sub-Advisers in connection with marketing activities. The Board considered representations from the Adviser that such business relationships and any payments were not considered in the Adviser’s recommendation to renew any of the Sub-Advisory Agreements.
* * * * *
Loomis Sayles Small Cap Growth Portfolio. The Board also considered the following information in relation to the Agreements with the Adviser and Loomis, Sayles & Company, L.P. regarding the Portfolio:
Among other data relating specifically to the Portfolio’s performance, the Board considered that the Portfolio outperformed the median of its Performance Universe and the average of its Morningstar Category for the one-, three-, and five-year periods ended June 30, 2023. The Board further considered that the Portfolio outperformed its benchmark, the Russell 2000 Growth Index, for the one-, three-, and five-year periods ended October 31, 2023. The Board also noted the presence of certain management fee waivers in effect for the Portfolio.
The Board also considered that the Portfolio’s actual management fees and total expenses (exclusive of 12b-1 fees) were below the Expense Group median and above the Expense Universe median and the Sub-advised Expense Universe median. The Board noted that
BHFTII-24
Brighthouse Funds Trust II
Loomis Sayles Small Cap Growth Portfolio
Board of Trustees’ Consideration of Advisory and Sub-Advisory Agreements—(Continued)
the Portfolio’s contractual management fees were above the asset-weighted average of the Investment Classification/Morningstar Category selected by Broadridge at the Portfolio’s current size. The Board also noted that the Portfolio’s contractual sub-advisory fees were above the averages of the Sub-advised Expense Group and the Sub-advised Expense Universe at the Portfolio’s current size.
BHFTII-25
Brighthouse Funds Trust II
MetLife Aggregate Bond Index Portfolio
Managed by MetLife Investment Management, LLC
Portfolio Manager Commentary*
PERFORMANCE
For the twelve months ended December 31, 2023, the Class A, B, E and G shares of the MetLife Aggregate Bond Index Portfolio returned 5.20%, 5.03%, 5.05%, and 4.90%, respectively. The Portfolio’s benchmark, the Bloomberg U.S. Aggregate Bond Index¹, returned 5.53%.
MARKET ENVIRONMENT / CONDITIONS
The U.S. fixed income market performance was lackluster for most of 2023 as the U.S. Federal Reserve Bank’s (the “Fed”) monetary tightening policy decreased inflation. The market remained volatile over the year as it was unclear how the economy was affected by the policy. The Fed’s announcement in December that easing may be required in the near term caused the fixed income market to rally and provide positive performance by year-end. Gross domestic product (“GDP”) expanded at a modest pace during the year as the labor market remained strong and the unemployment rate was stable at 3.7%. The U.S. inflation rate decreased from 7.1% to 3.1% over the period but remained above the Fed’s target rate of 2%. In March, the Fed’s most aggressive tightening policy since the 1980’s created volatility in the regional banking sector as consumers withdrew unprecedented amounts of capital from their balance sheets. The sector stabilized in May as deposit outflows from small and mid-sized banks slowed dramatically, reflecting a lower probability of solvency concerns.
The Federal Open Market Committee (the “FOMC”) increased the federal funds target rate by 1.00% during 2023 with 25 basis point (“bp”) hikes in February, March, May, and July to a target range of 5.25%—5.50%. They maintained the current range at the September meeting throughout the remainder of the year. In their December policy statement, the FOMC signaled it may be prepared to pivot from their current policy and may begin easing monetary policy in 2024. Additionally, the Fed continued to unwind its asset purchase program. The FOMC stated it remained committed to restoring inflation to its long-term target and additional policy firming may be appropriate, though the committee noted it will consider the impact of financial conditions on the economy.
U.S. Treasury ultra-short rates increased dramatically over the year driven by monetary tightening, as 1-month T-Bills increased 140 bps. However, the remainder of the curve normalized as 2-year rates decreased 15 bps to 4.25%, the 10-year Treasury increased only 3 bps to 3.86% and the 30-year Treasury increased 8 bps to 4.02%. The overall curve steepened as the difference between the 2-year and 10-year Treasury increased 18 bps to -0.39%, while the 10-year and 30-year yield differential increased only 5 bps to 0.16% at year end.
The Bloomberg U.S. Aggregate Bond Index (the “Index”) returned 5.53% in 2023. The corporate sector was the best performing asset class during the year, returning 8.52%. U.S. Treasuries were the worst performing asset class, returning 4.05%. Option adjusted spreads for the Index decreased 2 bps, ending the year at 0.43%. The worst performing asset classes were commercial mortgage-backed securities and Agency mortgage-backed securities with spreads increasing by 19 and 8 bps, respectively. Corporates were the best performing sector with spreads decreasing 16 bps.
PORTFOLIO REVIEW / PERIOD END POSITIONING
The Portfolio is managed utilizing a stratified sampling approach where the objective is to track the performance of the Index by holding a subset of Index constituents and neutralizing exposures across key characteristics (i.e., duration, term structure, high sector, sub-sector, quality). Factors that impact tracking error include sampling, transaction costs, and contributions and withdrawals.
Jason Chapin
Brian Leonard
Portfolio Managers
MetLife Investment Management, LLC
* This commentary may include statements that constitute “forward-looking statements” under the U.S. securities laws. Forward-looking statements include, among other things, projections, estimates, and information about possible or future results related to the Portfolio, market or regulatory developments. The views expressed above are not guarantees of future performance or economic results and involve certain risks, uncertainties and assumptions that could cause actual outcomes and results to differ materially from the views expressed herein. The views expressed above are subject to change at any time based upon economic, market, or other conditions and the subadvisory firm undertakes no obligation to update the views expressed herein. Any discussions of specific securities should not be considered a recommendation to buy or sell those securities. The views expressed above (including any forward-looking statement) may not be relied upon as investment advice or as an indication of the Portfolio’s trading intent. Information about the Portfolio’s holdings, asset allocation or country diversification is historical and is not an indication of future Portfolio composition, which may vary. Direct investment in any index is not possible. The performance of any index mentioned in this commentary has not been adjusted for ongoing management, distribution and operating expenses, and sales charges applicable to mutual fund investments. In addition, the returns do not reflect additional fees charged by separate accounts or variable insurance contracts that an investor in the Portfolio may pay. If these additional fees were reflected, performance would have been lower.
1 The Bloomberg U.S. Aggregate Bond Index is a broad-based benchmark that measures the investment grade, U.S. dollar-denominated, fixed-rate taxable bond market, including Treasuries, government-related and corporate securities, mortgage-backed securities, asset-backed securities, and commercial mortgage-backed securities.
BHFTII-1
Brighthouse Funds Trust II
MetLife Aggregate Bond Index Portfolio
A $10,000 INVESTMENT COMPARED TO THE BLOOMBERG U.S. AGGREGATE BOND INDEX
AVERAGE ANNUAL RETURNS (%) FOR THE YEAR ENDED DECEMBER 31, 2023
| 1 Year |
5 Year |
10 Year |
||||||||||
| MetLife Aggregate Bond Index Portfolio |
||||||||||||
| Class A |
5.20 | 0.87 | 1.57 | |||||||||
| Class B |
5.03 | 0.63 | 1.33 | |||||||||
| Class E |
5.05 | 0.71 | 1.42 | |||||||||
|
Class G |
4.90 | 0.57 | 1.27 | |||||||||
| Bloomberg U.S. Aggregate Bond Index |
5.53 | 1.10 | 1.81 | |||||||||
Portfolio performance is calculated including reinvestment of all income and capital gain distributions. Performance numbers are net of all Portfolio expenses but do not include any insurance, sales, separate account or administrative charges of variable annuity or life insurance contracts or any additional expenses that participants may bear relating to the operations of their plans. If these charges were included, the returns would be lower. The performance of any index referenced above has not been adjusted for ongoing management, distribution and operating expenses, and sales charges applicable to mutual fund investments. Direct investment in any index is not possible. The performance of Class A shares, as set forth in the line graph above, will differ from that of other classes because of the difference in expenses paid by policyholders investing in the different share classes.
This information represents past performance and is not indicative of future results. Investment return and principal value may fluctuate so that shares, upon redemption, may be worth more or less than the original cost.
PORTFOLIO COMPOSITION AS OF DECEMBER 31, 2023
Top Sectors
| % of Net Assets |
||||
| U.S. Treasury & Government Agencies | 42.2 | |||
| Agency Sponsored Mortgage-Backed | 27.2 | |||
| Corporate Bonds & Notes | 26.2 | |||
| Foreign Government | 1.6 | |||
| Non-Agency Mortgage-Backed Securities | 0.8 | |||
| Municipals | 0.5 | |||
| Asset-Backed Securities | 0.3 | |||
BHFTII-2
Brighthouse Funds Trust II
MetLife Aggregate Bond Index Portfolio
Understanding Your Portfolio’s Expenses
Shareholder Expense Example
As a shareholder of the Portfolio, you incur ongoing costs, including management fees; distribution and service (12b-1) fees; and other Portfolio expenses. This example is intended to help you understand your ongoing costs (in dollars) (referred to as “expenses”) of investing in the Portfolio and compare these costs with the ongoing costs of investing in other mutual funds. The example is based on an investment of $1,000 invested at the beginning of the period and held for the entire period, July 1, 2023 through December 31, 2023.
Actual Expenses
The first line for each share class of the Portfolio in the table below provides information about actual account values and actual expenses. You may use the information in this line, together with the amount you invested in the particular share class of the Portfolio, to estimate the expenses that you paid over the period. Simply divide your account value by $1,000 (for example, an $8,600 account value divided by $1,000 = 8.6), then multiply the result by the number in the first line under the heading entitled “Expenses Paid During Period” to estimate the expenses you paid on your account during this period.
Hypothetical Example for Comparison Purposes
The second line for each share class of the Portfolio in the table below provides information about hypothetical account values and hypothetical expenses based on the Portfolio’s actual expense ratio and an assumed rate of return of 5% per year before expenses, which is not the Portfolio’s actual return. The hypothetical account values and expenses may not be used to estimate the actual ending account balance or expenses you paid for the period. You may use this information to compare the ongoing costs of investing in the Portfolio and other funds. To do so, compare this 5% hypothetical example with the 5% hypothetical examples that appear in the shareholder reports of the other funds.
Please note that the expenses shown in the table are meant to highlight your ongoing costs only and do not reflect any fees or charges of your variable insurance product or any additional expenses that participants in certain eligible qualified plans may bear relating to the operations of their plan. Therefore, the second line for each share class in the table is useful in comparing ongoing costs only, and will not help you determine the relative total costs of owning different funds. In addition, if these other costs were included, your costs would have been higher.
| MetLife Aggregate Bond Index Portfolio |
Annualized Expense Ratio |
Beginning Account Value July 1, 2023 |
Ending Account Value December 31, 2023 |
Expenses Paid During Period** July 1, 2023 to December 31, 2023 |
||||||||||||||
| Class A (a) |
Actual | 0.28 | % | $ | 1,000.00 | $ | 1,031.40 | $ | 1.43 | |||||||||
| Hypothetical* | 0.28 | % | $ | 1,000.00 | $ | 1,023.79 | $ | 1.43 | ||||||||||
| Class B (a) |
Actual | 0.53 | % | $ | 1,000.00 | $ | 1,031.00 | $ | 2.71 | |||||||||
| Hypothetical* | 0.53 | % | $ | 1,000.00 | $ | 1,022.53 | $ | 2.70 | ||||||||||
| Class E (a) |
Actual | 0.43 | % | $ | 1,000.00 | $ | 1,030.50 | $ | 2.20 | |||||||||
| Hypothetical* | 0.43 | % | $ | 1,000.00 | $ | 1,023.04 | $ | 2.19 | ||||||||||
| Class G (a) |
Actual | 0.58 | % | $ | 1,000.00 | $ | 1,030.10 | $ | 2.97 | |||||||||
| Hypothetical* | 0.58 | % | $ | 1,000.00 | $ | 1,022.28 | $ | 2.96 | ||||||||||
| * | Hypothetical assumes a rate of return of 5% per year before expenses. |
| ** | Expenses paid are equal to the Portfolio’s annualized expense ratio for the most recent six month period, as shown above, multiplied by the average account value over the period, multiplied by the number of days (184 days) in the most recent fiscal half-year, divided by 365 (to reflect the one-half year period). |
| (a) | The annualized expense ratio shown reflects the impact of the management fee waiver as described in Note 5 of the Notes to Financial Statements. |
BHFTII-3
Brighthouse Funds Trust II
MetLife Aggregate Bond Index Portfolio
Schedule of Investments as of December 31, 2023
U.S. Treasury & Government Agencies—69.4% of Net Assets
| Security Description | Principal Amount* |
Value | ||||||
| Agency Sponsored Mortgage - Backed—27.2% | ||||||||
| Federal Home Loan Mortgage Corp. | ||||||||
| 1.500%, 03/01/36 |
1,390,399 | $ | 1,213,629 | |||||
| 1.500%, 05/01/36 |
3,643,699 | 3,180,452 | ||||||
| 1.500%, 01/01/42 |
2,643,599 | 2,183,829 | ||||||
| 1.500%, 03/01/51 |
828,014 | 645,891 | ||||||
| 1.500%, 04/01/51 |
4,184,896 | 3,263,964 | ||||||
| 2.000%, 10/01/35 |
2,141,461 | 1,925,480 | ||||||
| 2.000%, 11/01/35 |
1,702,403 | 1,530,244 | ||||||
| 2.000%, 06/01/36 |
716,829 | 644,302 | ||||||
| 2.000%, 03/01/41 |
1,878,881 | 1,616,665 | ||||||
| 2.000%, 12/01/41 |
2,550,940 | 2,188,502 | ||||||
| 2.000%, 10/01/50 |
3,541,642 | 2,913,310 | ||||||
| 2.000%, 11/01/50 |
3,660,057 | 3,009,581 | ||||||
| 2.000%, 12/01/50 |
5,979,763 | 4,915,167 | ||||||
| 2.000%, 01/01/51 |
9,097,543 | 7,475,058 | ||||||
| 2.000%, 02/01/51 |
3,835,930 | 3,150,627 | ||||||
| 2.000%, 05/01/51 |
5,288,484 | 4,333,589 | ||||||
| 2.000%, 06/01/51 |
1,670,289 | 1,368,311 | ||||||
| 2.000%, 07/01/51 |
5,080,387 | 4,160,702 | ||||||
| 2.000%, 08/01/51 |
4,183,694 | 3,425,361 | ||||||
| 2.000%, 12/01/51 |
4,448,250 | 3,637,823 | ||||||
| 2.500%, 12/01/27 |
192,297 | 185,599 | ||||||
| 2.500%, 04/01/28 |
383,838 | 368,574 | ||||||
| 2.500%, 12/01/29 |
555,470 | 529,976 | ||||||
| 2.500%, 01/01/32 |
1,478,930 | 1,393,823 | ||||||
| 2.500%, 08/01/35 |
1,094,059 | 1,010,367 | ||||||
| 2.500%, 02/01/41 |
1,392,384 | 1,243,848 | ||||||
| 2.500%, 03/01/50 |
1,509,959 | 1,297,040 | ||||||
| 2.500%, 07/01/50 |
3,950,594 | 3,389,601 | ||||||
| 2.500%, 09/01/50 |
2,732,158 | 2,342,830 | ||||||
| 2.500%, 10/01/50 |
2,215,230 | 1,899,014 | ||||||
| 2.500%, 12/01/50 |
3,056,716 | 2,618,865 | ||||||
| 2.500%, 04/01/51 |
2,589,677 | 2,216,015 | ||||||
| 2.500%, 07/01/51 |
5,580,175 | 4,770,864 | ||||||
| 2.500%, 08/01/51 |
3,905,964 | 3,338,500 | ||||||
| 2.500%, 12/01/51 |
2,168,798 | 1,851,560 | ||||||
| 3.000%, 03/01/27 |
141,494 | 138,129 | ||||||
| 3.000%, 05/01/27 |
199,387 | 193,950 | ||||||
| 3.000%, 11/01/28 |
317,441 | 307,138 | ||||||
| 3.000%, 10/01/32 |
380,524 | 361,858 | ||||||
| 3.000%, 04/01/33 |
719,301 | 683,922 | ||||||
| 3.000%, 03/01/35 |
633,547 | 600,863 | ||||||
| 3.000%, 02/01/37 |
810,424 | 761,175 | ||||||
| 3.000%, 10/01/42 |
877,217 | 799,897 | ||||||
| 3.000%, 01/01/43 |
617,245 | 563,008 | ||||||
| 3.000%, 03/01/43 |
572,884 | 522,545 | ||||||
| 3.000%, 04/01/43 |
1,319,736 | 1,206,408 | ||||||
| 3.000%, 06/01/43 |
926,025 | 846,530 | ||||||
| 3.000%, 06/01/45 |
933,824 | 846,380 | ||||||
| 3.000%, 06/01/46 |
920,279 | 832,542 | ||||||
| 3.000%, 11/01/46 |
1,035,664 | 936,926 | ||||||
| 3.000%, 01/01/47 |
1,829,637 | 1,655,203 | ||||||
| 3.000%, 01/01/48 |
396,951 | 358,361 | ||||||
| 3.000%, 09/01/49 |
882,371 | 790,374 | ||||||
| 3.000%, 12/01/49 |
1,140,214 | 1,021,333 | ||||||
| Agency Sponsored Mortgage - Backed—(Continued) | ||||||||
| Federal Home Loan Mortgage Corp. | ||||||||
| 3.000%, 02/01/50 |
579,778 | 519,329 | ||||||
| 3.000%, 04/01/50 |
1,034,798 | 925,769 | ||||||
| 3.000%, 05/01/50 |
978,037 | 874,685 | ||||||
| 3.000%, 07/01/50 |
867,301 | 775,114 | ||||||
| 3.000%, 11/01/50 |
928,885 | 829,002 | ||||||
| 3.500%, 12/01/25 |
90,428 | 88,771 | ||||||
| 3.500%, 05/01/26 |
35,780 | 35,171 | ||||||
| 3.500%, 09/01/30 |
575,493 | 558,812 | ||||||
| 3.500%, 04/01/32 |
413,829 | 398,879 | ||||||
| 3.500%, 01/01/42 |
289,065 | 273,162 | ||||||
| 3.500%, 03/01/42 |
265,586 | 250,699 | ||||||
| 3.500%, 02/01/43 |
460,719 | 434,896 | ||||||
| 3.500%, 05/01/43 |
690,250 | 649,899 | ||||||
| 3.500%, 06/01/43 |
387,847 | 365,180 | ||||||
| 3.500%, 06/01/44 |
324,909 | 304,785 | ||||||
| 3.500%, 10/01/44 |
425,318 | 398,975 | ||||||
| 3.500%, 12/01/44 |
502,335 | 471,221 | ||||||
| 3.500%, 05/01/45 |
657,461 | 616,492 | ||||||
| 3.500%, 11/01/45 |
636,797 | 597,115 | ||||||
| 3.500%, 12/01/45 |
391,580 | 367,179 | ||||||
| 3.500%, 03/01/46 |
1,122,827 | 1,052,366 | ||||||
| 3.500%, 06/01/47 |
516,071 | 481,734 | ||||||
| 3.500%, 08/01/47 |
331,617 | 309,553 | ||||||
| 3.500%, 10/01/47 |
460,556 | 429,434 | ||||||
| 3.500%, 11/01/47 |
447,424 | 417,655 | ||||||
| 3.500%, 04/01/49 |
309,056 | 286,858 | ||||||
| 3.500%, 05/01/49 |
198,122 | 183,892 | ||||||
| 3.500%, 10/01/49 |
415,958 | 386,081 | ||||||
| 3.500%, 03/01/50 |
564,884 | 524,311 | ||||||
| 3.500%, 06/01/50 |
1,083,197 | 1,000,510 | ||||||
| 3.500%, 08/01/50 |
1,584,141 | 1,462,908 | ||||||
| 4.000%, 05/01/25 |
33,602 | 33,167 | ||||||
| 4.000%, 08/01/25 |
17,933 | 17,688 | ||||||
| 4.000%, 10/01/25 |
21,646 | 21,326 | ||||||
| 4.000%, 01/01/31 |
163,186 | 159,999 | ||||||
| 4.000%, 08/01/31 |
183,253 | 179,439 | ||||||
| 4.000%, 06/01/39 |
167,735 | 163,395 | ||||||
| 4.000%, 12/01/39 |
327,719 | 319,461 | ||||||
| 4.000%, 11/01/40 |
232,925 | 226,590 | ||||||
| 4.000%, 04/01/41 |
280,448 | 272,502 | ||||||
| 4.000%, 09/01/41 |
242,232 | 235,368 | ||||||
| 4.000%, 10/01/41 |
671,239 | 652,204 | ||||||
| 4.000%, 11/01/41 |
197,589 | 191,991 | ||||||
| 4.000%, 07/01/44 |
537,715 | 520,610 | ||||||
| 4.000%, 10/01/44 |
417,957 | 404,661 | ||||||
| 4.000%, 07/01/45 |
663,850 | 641,785 | ||||||
| 4.000%, 01/01/46 |
606,009 | 585,867 | ||||||
| 4.000%, 02/01/46 |
340,779 | 329,452 | ||||||
| 4.000%, 06/01/47 |
546,619 | 527,394 | ||||||
| 4.000%, 10/01/47 |
291,144 | 280,904 | ||||||
| 4.000%, 11/01/47 |
274,202 | 264,559 | ||||||
| 4.000%, 03/01/48 |
438,304 | 422,889 | ||||||
| 4.000%, 05/01/48 |
201,113 | 193,583 | ||||||
| 4.000%, 10/01/48 |
220,400 | 212,148 | ||||||
| 4.000%, 11/01/48 |
267,064 | 257,064 | ||||||
See accompanying notes to financial statements.
BHFTII-4
Brighthouse Funds Trust II
MetLife Aggregate Bond Index Portfolio
Schedule of Investments as of December 31, 2023
U.S. Treasury & Government Agencies—(Continued)
| Security Description | Principal Amount* |
Value | ||||||
| Agency Sponsored Mortgage - Backed—(Continued) | ||||||||
| Federal Home Loan Mortgage Corp. | ||||||||
| 4.000%, 01/01/49 |
158,940 | $ | 152,989 | |||||
| 4.000%, 02/01/49 |
152,511 | 146,630 | ||||||
| 4.000%, 06/01/49 |
303,035 | 290,899 | ||||||
| 4.500%, 05/01/29 |
35,416 | 35,072 | ||||||
| 4.500%, 10/01/35 |
90,851 | 90,415 | ||||||
| 4.500%, 06/01/38 |
133,116 | 132,476 | ||||||
| 4.500%, 02/01/39 |
76,776 | 76,677 | ||||||
| 4.500%, 03/01/39 |
117,464 | 117,234 | ||||||
| 4.500%, 04/01/39 |
126,216 | 125,968 | ||||||
| 4.500%, 09/01/39 |
149,796 | 149,503 | ||||||
| 4.500%, 10/01/39 |
353,379 | 352,685 | ||||||
| 4.500%, 11/01/39 |
100,180 | 99,984 | ||||||
| 4.500%, 01/01/40 |
115,070 | 114,845 | ||||||
| 4.500%, 05/01/40 |
145,655 | 145,324 | ||||||
| 4.500%, 11/01/40 |
205,618 | 205,150 | ||||||
| 4.500%, 02/01/41 |
46,943 | 46,780 | ||||||
| 4.500%, 05/01/41 |
151,992 | 151,426 | ||||||
| 4.500%, 06/01/41 |
88,419 | 88,090 | ||||||
| 4.500%, 12/01/43 |
179,561 | 179,204 | ||||||
| 4.500%, 12/01/45 |
258,601 | 257,133 | ||||||
| 4.500%, 08/01/47 |
393,191 | 388,698 | ||||||
| 4.500%, 08/01/48 |
157,347 | 155,292 | ||||||
| 4.500%, 10/01/48 |
277,790 | 274,162 | ||||||
| 4.500%, 12/01/48 |
177,266 | 174,951 | ||||||
| 4.500%, 01/01/49 |
152,594 | 150,427 | ||||||
| 5.000%, 03/01/27 |
13,054 | 12,988 | ||||||
| 5.000%, 10/01/33 |
103,386 | 104,391 | ||||||
| 5.000%, 03/01/34 |
20,716 | 20,946 | ||||||
| 5.000%, 08/01/35 |
141,091 | 142,838 | ||||||
| 5.000%, 09/01/35 |
38,865 | 39,346 | ||||||
| 5.000%, 10/01/35 |
6,664 | 6,747 | ||||||
| 5.000%, 01/01/36 |
118,024 | 119,486 | ||||||
| 5.000%, 04/01/38 |
67,633 | 68,797 | ||||||
| 5.000%, 11/01/39 |
312,265 | 318,185 | ||||||
| 5.000%, 05/01/40 |
340,001 | 347,416 | ||||||
| 5.500%, 01/01/24 |
10 | 10 | ||||||
| 5.500%, 06/01/34 |
30,242 | 31,038 | ||||||
| 5.500%, 10/01/35 |
45,146 | 46,558 | ||||||
| 5.500%, 01/01/36 |
72,524 | 74,792 | ||||||
| 5.500%, 12/01/37 |
84,138 | 87,017 | ||||||
| 5.500%, 04/01/38 |
28,276 | 29,316 | ||||||
| 5.500%, 07/01/38 |
47,878 | 49,638 | ||||||
| 6.000%, 11/01/28 |
900 | 923 | ||||||
| 6.000%, 12/01/28 |
936 | 959 | ||||||
| 6.000%, 04/01/29 |
574 | 588 | ||||||
| 6.000%, 06/01/31 |
866 | 895 | ||||||
| 6.000%, 07/01/31 |
169 | 174 | ||||||
| 6.000%, 09/01/31 |
27,880 | 28,837 | ||||||
| 6.000%, 11/01/32 |
5,682 | 5,925 | ||||||
| 6.000%, 11/01/35 |
22,524 | 23,618 | ||||||
| 6.000%, 02/01/36 |
35,709 | 37,446 | ||||||
| 6.000%, 08/01/36 |
15,318 | 16,102 | ||||||
| 6.000%, 01/01/37 |
20,314 | 21,354 | ||||||
| 6.500%, 02/01/30 |
2,828 | 2,954 | ||||||
| 6.500%, 08/01/31 |
2,137 | 2,239 | ||||||
| Agency Sponsored Mortgage - Backed—(Continued) | ||||||||
| Federal Home Loan Mortgage Corp. | ||||||||
| 6.500%, 11/01/31 |
4,422 | 4,635 | ||||||
| 6.500%, 03/01/32 |
85,839 | 90,171 | ||||||
| 6.500%, 04/01/32 |
49,954 | 52,491 | ||||||
| 6.500%, 11/01/37 |
24,658 | 26,279 | ||||||
| 6.500%, 04/01/53 |
913,442 | 935,511 | ||||||
| 7.000%, 12/01/27 |
224 | 229 | ||||||
| 7.000%, 11/01/28 |
333 | 348 | ||||||
| 7.000%, 04/01/29 |
742 | 775 | ||||||
| 7.000%, 05/01/29 |
179 | 187 | ||||||
| 7.000%, 07/01/29 |
99 | 103 | ||||||
| 7.000%, 01/01/31 |
27,518 | 28,841 | ||||||
| 7.500%, 10/01/27 |
1,585 | 1,624 | ||||||
| 7.500%, 10/01/29 |
2,415 | 2,546 | ||||||
| 7.500%, 05/01/30 |
3,781 | 3,937 | ||||||
| 8.000%, 02/01/27 |
495 | 507 | ||||||
| 8.000%, 10/01/28 |
812 | 837 | ||||||
| Federal Home Loan Mortgage Corp. Multifamily Structured Pass-Through Certificates |
||||||||
| 2.519%, 07/25/29 |
2,250,000 | 2,051,306 | ||||||
| 2.785%, 06/25/29 |
1,800,000 | 1,667,115 | ||||||
| 3.194%, 07/25/27 |
685,000 | 658,592 | ||||||
| 3.780%, 10/25/28 (a) |
4,000,000 | 3,898,043 | ||||||
| 3.920%, 09/25/28 (a) |
2,900,000 | 2,846,644 | ||||||
| 3.926%, 07/25/28 (a) |
2,500,000 | 2,455,482 | ||||||
| Federal National Mortgage Association | ||||||||
| 1.500%, 04/01/36 |
1,439,133 | 1,256,167 | ||||||
| 1.500%, 05/01/36 |
3,665,106 | 3,199,138 | ||||||
| 1.500%, 09/01/36 |
1,574,681 | 1,374,482 | ||||||
| 1.500%, 11/01/36 |
2,435,929 | 2,126,234 | ||||||
| 1.500%, 03/01/51 |
3,329,105 | 2,596,861 | ||||||
| 1.500%, 04/01/51 |
4,218,548 | 3,290,210 | ||||||
| 1.500%, 10/01/51 |
892,901 | 694,858 | ||||||
| 2.000%, 11/01/35 |
7,639,417 | 6,866,864 | ||||||
| 2.000%, 12/01/35 |
1,189,564 | 1,068,946 | ||||||
| 2.000%, 09/01/36 |
3,776,935 | 3,391,731 | ||||||
| 2.000%, 12/01/36 |
2,399,281 | 2,152,637 | ||||||
| 2.000%, 02/01/37 |
813,294 | 729,249 | ||||||
| 2.000%, 02/01/41 |
2,197,643 | 1,890,550 | ||||||
| 2.000%, 06/01/41 |
2,001,124 | 1,720,482 | ||||||
| 2.000%, 10/01/50 |
9,236,525 | 7,597,850 | ||||||
| 2.000%, 11/01/50 |
7,275,621 | 5,982,578 | ||||||
| 2.000%, 12/01/50 |
3,704,989 | 3,045,379 | ||||||
| 2.000%, 01/01/51 |
9,109,101 | 7,484,554 | ||||||
| 2.000%, 02/01/51 |
3,850,160 | 3,162,315 | ||||||
| 2.000%, 04/01/51 |
5,647,657 | 4,635,631 | ||||||
| 2.000%, 05/01/51 |
4,116,927 | 3,373,570 | ||||||
| 2.000%, 06/01/51 |
2,511,646 | 2,057,556 | ||||||
| 2.000%, 09/01/51 |
4,323,877 | 3,539,128 | ||||||
| 2.000%, 10/01/51 |
3,492,723 | 2,858,009 | ||||||
| 2.000%, 11/01/51 |
1,764,833 | 1,445,703 | ||||||
| 2.000%, 12/01/51 |
4,453,515 | 3,642,128 | ||||||
| 2.500%, 12/01/27 |
519,341 | 501,003 | ||||||
| 2.500%, 02/01/28 |
489,482 | 471,497 | ||||||
| 2.500%, 07/01/28 |
326,142 | 312,540 | ||||||
| 2.500%, 10/01/28 |
563,725 | 540,698 | ||||||
See accompanying notes to financial statements.
BHFTII-5
Brighthouse Funds Trust II
MetLife Aggregate Bond Index Portfolio
Schedule of Investments as of December 31, 2023
U.S. Treasury & Government Agencies—(Continued)
| Security Description | Principal Amount* |
Value | ||||||
| Agency Sponsored Mortgage - Backed—(Continued) | ||||||||
| Federal National Mortgage Association | ||||||||
| 2.500%, 03/01/30 |
621,634 | $ | 590,827 | |||||
| 2.500%, 09/01/31 |
1,106,709 | 1,043,264 | ||||||
| 2.500%, 01/01/32 |
347,444 | 327,213 | ||||||
| 2.500%, 04/01/32 |
829,906 | 780,194 | ||||||
| 2.500%, 09/01/32 |
196,487 | 184,295 | ||||||
| 2.500%, 12/01/34 |
663,735 | 615,635 | ||||||
| 2.500%, 09/01/35 |
648,019 | 598,447 | ||||||
| 2.500%, 02/01/41 |
1,606,109 | 1,432,870 | ||||||
| 2.500%, 01/01/50 |
918,066 | 791,928 | ||||||
| 2.500%, 03/01/50 |
847,327 | 727,845 | ||||||
| 2.500%, 05/01/50 |
2,043,853 | 1,754,635 | ||||||
| 2.500%, 07/01/50 |
3,314,577 | 2,843,900 | ||||||
| 2.500%, 08/01/50 |
5,955,264 | 5,108,126 | ||||||
| 2.500%, 09/01/50 |
4,821,408 | 4,134,366 | ||||||
| 2.500%, 11/01/50 |
1,181,493 | 1,012,546 | ||||||
| 2.500%, 12/01/50 |
1,837,026 | 1,573,886 | ||||||
| 2.500%, 01/01/51 |
1,902,243 | 1,629,290 | ||||||
| 2.500%, 02/01/51 |
947,504 | 811,312 | ||||||
| 2.500%, 05/01/51 |
2,989,388 | 2,557,311 | ||||||
| 2.500%, 07/01/51 |
3,965,706 | 3,390,547 | ||||||
| 2.500%, 08/01/51 |
2,012,475 | 1,720,100 | ||||||
| 2.500%, 09/01/51 |
4,926,923 | 4,209,911 | ||||||
| 2.500%, 10/01/51 |
5,019,957 | 4,288,160 | ||||||
| 2.500%, 12/01/51 |
3,460,124 | 2,953,999 | ||||||
| 2.500%, 02/01/52 |
4,004,279 | 3,416,571 | ||||||
| 2.500%, 03/01/52 |
896,113 | 763,054 | ||||||
| 3.000%, 01/01/27 |
136,226 | 132,998 | ||||||
| 3.000%, 02/01/27 |
235,772 | 230,090 | ||||||
| 3.000%, 03/01/27 |
119,145 | 115,871 | ||||||
| 3.000%, 01/01/29 |
903,741 | 873,285 | ||||||
| 3.000%, 10/01/29 |
392,890 | 378,312 | ||||||
| 3.000%, 06/01/30 |
480,990 | 461,724 | ||||||
| 3.000%, 02/01/33 |
453,687 | 429,649 | ||||||
| 3.000%, 08/01/35 |
556,048 | 522,069 | ||||||
| 3.000%, 01/01/36 |
703,750 | 667,047 | ||||||
| 3.000%, 05/01/36 |
640,451 | 600,888 | ||||||
| 3.000%, 08/01/42 |
668,749 | 609,164 | ||||||
| 3.000%, 09/01/42 |
560,641 | 510,764 | ||||||
| 3.000%, 11/01/42 |
851,392 | 775,688 | ||||||
| 3.000%, 12/01/42 |
560,165 | 510,379 | ||||||
| 3.000%, 01/01/43 |
414,834 | 377,926 | ||||||
| 3.000%, 03/01/43 |
841,504 | 768,488 | ||||||
| 3.000%, 07/01/43 |
845,988 | 772,400 | ||||||
| 3.000%, 09/01/43 |
491,391 | 448,647 | ||||||
| 3.000%, 05/01/45 |
1,184,410 | 1,072,428 | ||||||
| 3.000%, 05/01/46 |
660,918 | 597,200 | ||||||
| 3.000%, 06/01/46 |
911,326 | 823,465 | ||||||
| 3.000%, 08/01/46 |
973,516 | 879,660 | ||||||
| 3.000%, 02/01/47 |
1,366,615 | 1,234,860 | ||||||
| 3.000%, 11/01/49 |
610,602 | 546,940 | ||||||
| 3.000%, 12/01/49 |
1,100,080 | 985,384 | ||||||
| 3.000%, 01/01/50 |
1,149,171 | 1,029,357 | ||||||
| 3.000%, 02/01/50 |
558,667 | 500,419 | ||||||
| 3.000%, 05/01/50 |
2,287,240 | 2,045,542 | ||||||
| 3.000%, 07/01/50 |
852,026 | 761,462 | ||||||
| Agency Sponsored Mortgage - Backed—(Continued) | ||||||||
| Federal National Mortgage Association | ||||||||
| 3.000%, 08/01/50 |
2,304,081 | 2,058,463 | ||||||
| 3.000%, 11/01/51 |
2,397,064 | 2,124,111 | ||||||
| 3.000%, 04/01/52 |
2,713,373 | 2,403,302 | ||||||
| 3.000%, 05/01/52 |
2,302,490 | 2,037,088 | ||||||
| 3.000%, 06/01/52 |
3,248,810 | 2,874,075 | ||||||
| 3.500%, 02/01/26 |
141,011 | 138,203 | ||||||
| 3.500%, 03/01/26 |
86,906 | 85,337 | ||||||
| 3.500%, 05/01/29 |
400,086 | 389,093 | ||||||
| 3.500%, 04/01/32 |
347,930 | 335,242 | ||||||
| 3.500%, 08/01/32 |
143,300 | 138,376 | ||||||
| 3.500%, 03/01/34 |
215,551 | 208,934 | ||||||
| 3.500%, 09/01/35 |
499,868 | 478,591 | ||||||
| 3.500%, 07/01/38 |
365,192 | 349,786 | ||||||
| 3.500%, 12/01/40 |
396,977 | 374,520 | ||||||
| 3.500%, 03/01/42 |
373,619 | 354,484 | ||||||
| 3.500%, 05/01/42 |
683,251 | 644,218 | ||||||
| 3.500%, 06/01/42 |
476,547 | 449,322 | ||||||
| 3.500%, 08/01/42 |
294,022 | 277,225 | ||||||
| 3.500%, 09/01/42 |
1,272,803 | 1,200,139 | ||||||
| 3.500%, 01/01/43 |
484,783 | 457,088 | ||||||
| 3.500%, 06/01/43 |
577,576 | 549,061 | ||||||
| 3.500%, 08/01/44 |
607,421 | 569,135 | ||||||
| 3.500%, 02/01/45 |
695,160 | 651,345 | ||||||
| 3.500%, 03/01/45 |
765,444 | 716,904 | ||||||
| 3.500%, 04/01/45 |
431,178 | 403,836 | ||||||
| 3.500%, 09/01/45 |
587,578 | 550,317 | ||||||
| 3.500%, 11/01/45 |
600,268 | 562,202 | ||||||
| 3.500%, 01/01/46 |
732,834 | 686,362 | ||||||
| 3.500%, 03/01/46 |
677,404 | 633,794 | ||||||
| 3.500%, 05/01/46 |
483,706 | 452,566 | ||||||
| 3.500%, 11/01/47 |
1,127,050 | 1,050,890 | ||||||
| 3.500%, 02/01/49 |
222,187 | 207,047 | ||||||
| 3.500%, 08/01/49 |
259,134 | 240,521 | ||||||
| 3.500%, 10/01/49 |
542,337 | 503,383 | ||||||
| 3.500%, 01/01/50 |
354,111 | 328,677 | ||||||
| 3.500%, 02/01/50 |
175,984 | 163,344 | ||||||
| 3.500%, 05/01/50 |
815,738 | 753,784 | ||||||
| 3.500%, 04/01/52 |
2,726,142 | 2,505,386 | ||||||
| 3.500%, 06/01/52 |
919,299 | 844,714 | ||||||
| 3.500%, 08/01/52 |
1,886,141 | 1,732,820 | ||||||
| 3.500%, 09/01/53 |
1,768,414 | 1,622,042 | ||||||
| 4.000%, 06/01/24 |
3,528 | 3,500 | ||||||
| 4.000%, 11/01/24 |
35,305 | 34,911 | ||||||
| 4.000%, 02/01/31 |
148,416 | 145,353 | ||||||
| 4.000%, 03/01/38 |
337,471 | 329,948 | ||||||
| 4.000%, 08/01/39 |
244,617 | 238,201 | ||||||
| 4.000%, 09/01/39 |
217,497 | 211,617 | ||||||
| 4.000%, 12/01/39 |
263,429 | 256,307 | ||||||
| 4.000%, 06/01/40 |
275,807 | 268,002 | ||||||
| 4.000%, 09/01/40 |
173,149 | 168,249 | ||||||
| 4.000%, 12/01/40 |
1,374,540 | 1,337,388 | ||||||
| 4.000%, 01/01/41 |
621,815 | 604,218 | ||||||
| 4.000%, 12/01/41 |
263,738 | 255,979 | ||||||
| 4.000%, 02/01/42 |
361,244 | 350,617 | ||||||
| 4.000%, 09/01/43 |
482,603 | 468,151 | ||||||
See accompanying notes to financial statements.
BHFTII-6
Brighthouse Funds Trust II
MetLife Aggregate Bond Index Portfolio
Schedule of Investments as of December 31, 2023
U.S. Treasury & Government Agencies—(Continued)
| Security Description | Principal Amount* |
Value | ||||||
| Agency Sponsored Mortgage - Backed—(Continued) | ||||||||
| Federal National Mortgage Association | ||||||||
| 4.000%, 05/01/44 |
499,648 | $ | 483,205 | |||||
| 4.000%, 10/01/44 |
273,458 | 264,459 | ||||||
| 4.000%, 11/01/44 |
715,665 | 693,794 | ||||||
| 4.000%, 01/01/45 |
605,327 | 585,394 | ||||||
| 4.000%, 03/01/45 |
398,306 | 384,646 | ||||||
| 4.000%, 10/01/45 |
562,214 | 542,933 | ||||||
| 4.000%, 03/01/47 |
168,135 | 162,038 | ||||||
| 4.000%, 05/01/47 |
180,090 | 173,559 | ||||||
| 4.000%, 06/01/47 |
270,163 | 260,365 | ||||||
| 4.000%, 07/01/47 |
293,752 | 283,099 | ||||||
| 4.000%, 10/01/47 |
436,074 | 420,260 | ||||||
| 4.000%, 05/01/48 |
490,680 | 471,756 | ||||||
| 4.000%, 06/01/48 |
418,537 | 402,396 | ||||||
| 4.000%, 07/01/48 |
312,522 | 300,470 | ||||||
| 4.000%, 09/01/48 |
149,993 | 144,208 | ||||||
| 4.000%, 10/01/48 |
233,967 | 224,944 | ||||||
| 4.000%, 11/01/48 |
290,219 | 279,027 | ||||||
| 4.000%, 04/01/49 |
487,371 | 467,853 | ||||||
| 4.000%, 02/01/50 |
503,272 | 483,117 | ||||||
| 4.000%, 03/01/50 |
557,601 | 535,271 | ||||||
| 4.000%, 09/01/50 |
410,511 | 391,352 | ||||||
| 4.000%, 09/01/52 |
3,726,350 | 3,528,187 | ||||||
| 4.000%, 11/01/52 |
1,425,459 | 1,349,213 | ||||||
| 4.500%, 08/01/24 |
9,058 | 8,984 | ||||||
| 4.500%, 06/01/25 |
35,747 | 35,345 | ||||||
| 4.500%, 08/01/30 |
84,275 | 83,489 | ||||||
| 4.500%, 08/01/33 |
43,164 | 42,844 | ||||||
| 4.500%, 10/01/33 |
52,316 | 51,926 | ||||||
| 4.500%, 04/01/34 |
46,210 | 45,905 | ||||||
| 4.500%, 01/01/39 |
8,031 | 8,079 | ||||||
| 4.500%, 07/01/39 |
393,481 | 393,730 | ||||||
| 4.500%, 09/01/39 |
477,175 | 475,696 | ||||||
| 4.500%, 10/01/39 |
272,292 | 271,448 | ||||||
| 4.500%, 05/01/40 |
388,245 | 389,983 | ||||||
| 4.500%, 08/01/40 |
427,467 | 426,009 | ||||||
| 4.500%, 11/01/40 |
243,567 | 242,736 | ||||||
| 4.500%, 12/01/40 |
544,046 | 543,348 | ||||||
| 4.500%, 04/01/41 |
1,432,996 | 1,426,798 | ||||||
| 4.500%, 05/01/41 |
283,328 | 281,952 | ||||||
| 4.500%, 03/01/44 |
205,570 | 204,168 | ||||||
| 4.500%, 08/01/47 |
420,494 | 415,209 | ||||||
| 4.500%, 10/01/48 |
206,681 | 203,746 | ||||||
| 4.500%, 12/01/48 |
274,139 | 270,245 | ||||||
| 4.500%, 09/01/52 |
2,768,009 | 2,686,149 | ||||||
| 4.500%, 10/01/52 |
1,855,706 | 1,800,826 | ||||||
| 4.500%, 11/01/52 |
3,279,076 | 3,182,102 | ||||||
| 4.500%, 10/01/53 |
1,482,513 | 1,437,601 | ||||||
| 5.000%, 02/01/24 |
461 | 459 | ||||||
| 5.000%, 09/01/25 |
10,458 | 10,366 | ||||||
| 5.000%, 07/01/33 |
33,851 | 34,141 | ||||||
| 5.000%, 08/01/33 |
146,031 | 147,279 | ||||||
| 5.000%, 09/01/33 |
46,438 | 46,836 | ||||||
| 5.000%, 10/01/33 |
455,827 | 459,725 | ||||||
| 5.000%, 03/01/34 |
58,286 | 58,786 | ||||||
| Agency Sponsored Mortgage - Backed—(Continued) | ||||||||
| Federal National Mortgage Association | ||||||||
| 5.000%, 04/01/34 |
111,875 | 112,907 | ||||||
| 5.000%, 05/01/34 |
22,586 | 22,810 | ||||||
| 5.000%, 09/01/34 |
93,045 | 93,969 | ||||||
| 5.000%, 02/01/35 |
38,232 | 38,611 | ||||||
| 5.000%, 04/01/35 |
11,682 | 11,813 | ||||||
| 5.000%, 05/01/35 |
13,337 | 13,486 | ||||||
| 5.000%, 11/01/35 |
39,038 | 39,475 | ||||||
| 5.000%, 03/01/36 |
132,451 | 133,935 | ||||||
| 5.000%, 07/01/37 |
105,728 | 107,325 | ||||||
| 5.000%, 01/01/39 |
102,827 | 104,381 | ||||||
| 5.000%, 04/01/40 |
311,388 | 317,802 | ||||||
| 5.000%, 07/01/41 |
196,441 | 200,055 | ||||||
| 5.000%, 04/01/49 |
336,156 | 338,233 | ||||||
| 5.000%, 10/01/52 |
1,818,529 | 1,800,157 | ||||||
| 5.000%, 11/01/52 |
1,389,972 | 1,375,930 | ||||||
| 5.000%, 12/01/52 |
3,726,395 | 3,688,749 | ||||||
| 5.000%, 07/01/53 |
3,402,420 | 3,367,836 | ||||||
| 5.000%, 08/01/53 |
1,947,628 | 1,927,832 | ||||||
| 5.000%, 10/01/53 |
1,480,447 | 1,465,399 | ||||||
| 5.500%, 01/01/24 |
17 | 17 | ||||||
| 5.500%, 07/01/24 |
3,224 | 3,205 | ||||||
| 5.500%, 07/01/25 |
11,519 | 11,450 | ||||||
| 5.500%, 10/01/32 |
9,299 | 9,500 | ||||||
| 5.500%, 02/01/33 |
22,918 | 23,414 | ||||||
| 5.500%, 08/01/33 |
62,795 | 64,196 | ||||||
| 5.500%, 10/01/33 |
32,062 | 32,776 | ||||||
| 5.500%, 12/01/33 |
163,092 | 166,721 | ||||||
| 5.500%, 02/01/34 |
27,782 | 28,484 | ||||||
| 5.500%, 03/01/34 |
14,551 | 14,916 | ||||||
| 5.500%, 04/01/34 |
11,592 | 11,883 | ||||||
| 5.500%, 09/01/34 |
49,725 | 50,975 | ||||||
| 5.500%, 12/01/34 |
33,929 | 34,781 | ||||||
| 5.500%, 01/01/35 |
33,809 | 34,659 | ||||||
| 5.500%, 04/01/35 |
7,209 | 7,426 | ||||||
| 5.500%, 06/01/35 |
38,315 | 39,469 | ||||||
| 5.500%, 01/01/37 |
43,476 | 44,912 | ||||||
| 5.500%, 05/01/37 |
33,592 | 34,710 | ||||||
| 5.500%, 05/01/38 |
25,971 | 26,895 | ||||||
| 5.500%, 06/01/38 |
23,216 | 24,041 | ||||||
| 5.500%, 12/01/52 |
1,840,391 | 1,851,039 | ||||||
| 5.500%, 01/01/53 |
1,839,508 | 1,849,808 | ||||||
| 5.500%, 03/01/53 |
926,459 | 930,791 | ||||||
| 5.500%, 04/01/53 |
934,246 | 938,614 | ||||||
| 5.500%, 05/01/53 |
1,898,507 | 1,907,384 | ||||||
| 5.500%, 07/01/53 |
3,837,345 | 3,855,287 | ||||||
| 5.500%, 10/01/53 |
1,766,053 | 1,774,311 | ||||||
| 5.500%, 01/01/54 |
2,000,000 | 2,008,086 | ||||||
| 6.000%, 11/01/28 |
126 | 129 | ||||||
| 6.000%, 12/01/28 |
171 | 176 | ||||||
| 6.000%, 06/01/31 |
20,694 | 21,380 | ||||||
| 6.000%, 09/01/32 |
21,573 | 22,476 | ||||||
| 6.000%, 01/01/33 |
4,273 | 4,452 | ||||||
| 6.000%, 02/01/33 |
28,470 | 29,664 | ||||||
| 6.000%, 03/01/33 |
12,351 | 12,877 | ||||||
| 6.000%, 04/01/33 |
58,162 | 60,636 | ||||||
See accompanying notes to financial statements.
BHFTII-7
Brighthouse Funds Trust II
MetLife Aggregate Bond Index Portfolio
Schedule of Investments as of December 31, 2023
U.S. Treasury & Government Agencies—(Continued)
| Security Description | Principal Amount* |
Value | ||||||
| Agency Sponsored Mortgage - Backed—(Continued) | ||||||||
| Federal National Mortgage Association | ||||||||
| 6.000%, 05/01/33 |
60,083 | $ | 62,646 | |||||
| 6.000%, 05/01/34 |
51,997 | 54,323 | ||||||
| 6.000%, 09/01/34 |
50,634 | 52,903 | ||||||
| 6.000%, 01/01/35 |
27,688 | 28,927 | ||||||
| 6.000%, 07/01/36 |
8,958 | 9,407 | ||||||
| 6.000%, 09/01/36 |
34,015 | 35,720 | ||||||
| 6.000%, 07/01/37 |
28,781 | 30,292 | ||||||
| 6.000%, 08/01/37 |
57,718 | 60,748 | ||||||
| 6.000%, 10/01/37 |
38,090 | 40,090 | ||||||
| 6.000%, 12/01/38 |
36,233 | 38,149 | ||||||
| 6.000%, 04/01/53 |
2,755,665 | 2,798,588 | ||||||
| 6.000%, 05/01/53 |
935,188 | 949,754 | ||||||
| 6.000%, 07/01/53 |
1,900,461 | 1,930,063 | ||||||
| 6.000%, 09/01/53 |
1,743,993 | 1,771,157 | ||||||
| 6.000%, 12/01/53 |
1,985,673 | 2,016,691 | ||||||
| 6.500%, 05/01/28 |
6,487 | 6,754 | ||||||
| 6.500%, 12/01/28 |
32,863 | 34,213 | ||||||
| 6.500%, 03/01/29 |
897 | 936 | ||||||
| 6.500%, 04/01/29 |
5,773 | 6,026 | ||||||
| 6.500%, 05/01/29 |
193 | 201 | ||||||
| 6.500%, 08/01/29 |
303 | 317 | ||||||
| 6.500%, 05/01/30 |
7,876 | 8,218 | ||||||
| 6.500%, 09/01/31 |
2,607 | 2,729 | ||||||
| 6.500%, 06/01/32 |
5,371 | 5,637 | ||||||
| 6.500%, 10/01/33 |
10,295 | 10,841 | ||||||
| 6.500%, 10/01/34 |
75,159 | 79,164 | ||||||
| 6.500%, 10/01/37 |
11,985 | 12,764 | ||||||
| 6.500%, 09/01/53 |
1,436,387 | 1,471,090 | ||||||
| 6.500%, 01/01/54 |
2,900,000 | 2,971,679 | ||||||
| 7.000%, 06/01/26 |
87 | 87 | ||||||
| 7.000%, 06/01/28 |
3,371 | 3,514 | ||||||
| 7.000%, 10/01/29 |
1,528 | 1,593 | ||||||
| 7.000%, 06/01/32 |
18,458 | 19,523 | ||||||
| 7.000%, 10/01/37 |
48,940 | 53,350 | ||||||
| 7.000%, 12/01/53 |
993,969 | 1,025,093 | ||||||
| 7.500%, 09/01/25 |
377 | 379 | ||||||
| 7.500%, 06/01/26 |
470 | 475 | ||||||
| 7.500%, 07/01/29 |
1,702 | 1,769 | ||||||
| 7.500%, 10/01/29 |
1,095 | 1,119 | ||||||
| 8.000%, 11/01/29 |
24 | 26 | ||||||
| 8.000%, 05/01/30 |
10,222 | 10,608 | ||||||
| 8.000%, 11/01/30 |
304 | 316 | ||||||
| 8.000%, 01/01/31 |
449 | 463 | ||||||
| 8.000%, 02/01/31 |
1,126 | 1,199 | ||||||
| Federal National Mortgage Association-Aces | ||||||||
| 1.610%, 03/25/31 |
720,249 | 676,652 | ||||||
| 2.190%, 01/25/30 |
1,435,000 | 1,268,889 | ||||||
| Government National Mortgage Association | ||||||||
| 2.000%, 11/20/50 |
4,031,623 | 3,421,982 | ||||||
| 2.000%, 01/20/51 |
2,098,945 | 1,780,515 | ||||||
| 2.000%, 03/20/51 |
1,450,947 | 1,229,653 | ||||||
| 2.000%, 04/20/51 |
3,711,108 | 3,144,528 | ||||||
| 2.000%, 05/20/51 |
6,068,822 | 5,141,347 | ||||||
| 2.000%, 06/20/51 |
1,922,290 | 1,628,216 | ||||||
| 2.000%, 10/20/51 |
2,524,006 | 2,136,318 | ||||||
| Agency Sponsored Mortgage - Backed—(Continued) | ||||||||
| Government National Mortgage Association | ||||||||
| 2.000%, 12/20/51 |
2,159,278 | 1,826,945 | ||||||
| 2.500%, 02/20/50 |
838,754 | 739,429 | ||||||
| 2.500%, 06/20/50 |
3,041,388 | 2,678,593 | ||||||
| 2.500%, 07/20/50 |
2,188,643 | 1,927,095 | ||||||
| 2.500%, 09/20/50 |
3,631,249 | 3,195,734 | ||||||
| 2.500%, 10/20/50 |
1,071,152 | 942,451 | ||||||
| 2.500%, 11/20/50 |
1,633,351 | 1,436,747 | ||||||
| 2.500%, 12/20/50 |
1,703,197 | 1,497,817 | ||||||
| 2.500%, 04/20/51 |
2,092,904 | 1,836,640 | ||||||
| 2.500%, 08/20/51 |
2,392,456 | 2,095,999 | ||||||
| 2.500%, 09/20/51 |
4,062,137 | 3,556,876 | ||||||
| 2.500%, 12/20/51 |
4,251,824 | 3,726,609 | ||||||
| 3.000%, 08/15/28 |
319,826 | 310,936 | ||||||
| 3.000%, 11/15/42 |
588,795 | 542,252 | ||||||
| 3.000%, 12/15/42 |
604,281 | 556,502 | ||||||
| 3.000%, 12/20/42 |
606,412 | 559,456 | ||||||
| 3.000%, 02/15/43 |
455,975 | 419,923 | ||||||
| 3.000%, 03/15/43 |
498,565 | 459,215 | ||||||
| 3.000%, 03/20/43 |
549,025 | 506,585 | ||||||
| 3.000%, 07/15/43 |
439,956 | 405,232 | ||||||
| 3.000%, 12/20/44 |
511,876 | 472,448 | ||||||
| 3.000%, 04/20/45 |
462,025 | 424,979 | ||||||
| 3.000%, 08/20/45 |
836,584 | 769,505 | ||||||
| 3.000%, 11/20/45 |
449,140 | 413,127 | ||||||
| 3.000%, 01/20/46 |
732,630 | 673,886 | ||||||
| 3.000%, 09/20/46 |
798,255 | 734,006 | ||||||
| 3.000%, 10/20/46 |
818,023 | 752,183 | ||||||
| 3.000%, 11/20/46 |
861,778 | 791,122 | ||||||
| 3.000%, 01/20/47 |
890,523 | 818,848 | ||||||
| 3.000%, 04/20/47 |
393,192 | 361,099 | ||||||
| 3.000%, 02/20/48 |
565,197 | 519,064 | ||||||
| 3.000%, 10/20/49 |
618,052 | 563,732 | ||||||
| 3.000%, 05/20/50 |
1,287,940 | 1,175,008 | ||||||
| 3.000%, 07/20/50 |
828,388 | 755,239 | ||||||
| 3.000%, 11/20/50 |
1,804,976 | 1,644,479 | ||||||
| 3.000%, 05/20/52 |
4,060,922 | 3,674,357 | ||||||
| 3.500%, 12/20/41 |
352,578 | 335,046 | ||||||
| 3.500%, 02/15/42 |
137,402 | 130,493 | ||||||
| 3.500%, 08/20/42 |
325,597 | 309,316 | ||||||
| 3.500%, 01/20/43 |
460,498 | 437,472 | ||||||
| 3.500%, 05/20/43 |
709,435 | 673,923 | ||||||
| 3.500%, 07/20/44 |
673,395 | 639,037 | ||||||
| 3.500%, 02/20/45 |
693,971 | 658,563 | ||||||
| 3.500%, 06/20/45 |
431,587 | 407,879 | ||||||
| 3.500%, 08/20/45 |
1,021,494 | 965,381 | ||||||
| 3.500%, 10/20/45 |
676,274 | 639,125 | ||||||
| 3.500%, 12/20/45 |
627,473 | 593,005 | ||||||
| 3.500%, 01/20/46 |
594,471 | 561,816 | ||||||
| 3.500%, 02/20/46 |
483,044 | 456,510 | ||||||
| 3.500%, 06/20/46 |
531,483 | 501,645 | ||||||
| 3.500%, 02/20/47 |
844,235 | 796,838 | ||||||
| 3.500%, 03/20/47 |
710,816 | 670,362 | ||||||
| 3.500%, 09/20/47 |
293,437 | 276,737 | ||||||
| 3.500%, 10/20/48 |
139,206 | 131,168 | ||||||
| 3.500%, 05/20/49 |
253,491 | 238,428 | ||||||
See accompanying notes to financial statements.
BHFTII-8
Brighthouse Funds Trust II
MetLife Aggregate Bond Index Portfolio
Schedule of Investments as of December 31, 2023
U.S. Treasury & Government Agencies—(Continued)
| Security Description | Principal Amount* |
Value | ||||||
| Agency Sponsored Mortgage - Backed—(Continued) | ||||||||
| Government National Mortgage Association | ||||||||
| 3.500%, 07/20/49 |
279,304 | $ | 262,643 | |||||
| 3.500%, 09/20/49 |
747,131 | 702,305 | ||||||
| 3.500%, 10/20/49 |
465,385 | 437,463 | ||||||
| 3.500%, 11/20/49 |
648,664 | 609,670 | ||||||
| 3.500%, 12/20/49 |
421,687 | 396,289 | ||||||
| 3.500%, 06/20/50 |
609,237 | 571,055 | ||||||
| 3.500%, 02/20/51 |
1,000,139 | 939,670 | ||||||
| 4.000%, 07/15/39 |
367,513 | 358,216 | ||||||
| 4.000%, 07/15/40 |
204,885 | 199,795 | ||||||
| 4.000%, 11/20/40 |
303,510 | 296,456 | ||||||
| 4.000%, 12/20/40 |
410,232 | 400,698 | ||||||
| 4.000%, 11/20/43 |
202,529 | 197,571 | ||||||
| 4.000%, 04/20/44 |
286,338 | 279,138 | ||||||
| 4.000%, 05/20/44 |
342,638 | 334,023 | ||||||
| 4.000%, 09/20/44 |
567,562 | 553,292 | ||||||
| 4.000%, 11/20/44 |
149,259 | 145,506 | ||||||
| 4.000%, 10/20/45 |
520,753 | 506,739 | ||||||
| 4.000%, 11/20/45 |
281,524 | 273,948 | ||||||
| 4.000%, 03/20/47 |
107,733 | 104,330 | ||||||
| 4.000%, 04/20/47 |
429,114 | 414,745 | ||||||
| 4.000%, 09/20/47 |
391,335 | 378,231 | ||||||
| 4.000%, 07/20/48 |
272,910 | 263,489 | ||||||
| 4.000%, 08/20/48 |
196,403 | 189,624 | ||||||
| 4.000%, 09/20/48 |
354,690 | 342,447 | ||||||
| 4.000%, 07/20/49 |
361,328 | 348,479 | ||||||
| 4.000%, 05/20/50 |
521,449 | 503,244 | ||||||
| 4.000%, 07/20/52 |
2,322,261 | 2,217,112 | ||||||
| 4.000%, 10/20/52 |
1,423,417 | 1,357,821 | ||||||
| 4.500%, 01/15/39 |
76,992 | 77,037 | ||||||
| 4.500%, 04/15/39 |
189,772 | 189,887 | ||||||
| 4.500%, 05/15/39 |
409,711 | 409,960 | ||||||
| 4.500%, 08/15/39 |
149,780 | 149,871 | ||||||
| 4.500%, 01/15/40 |
165,464 | 165,564 | ||||||
| 4.500%, 04/15/40 |
71,021 | 71,053 | ||||||
| 4.500%, 08/20/40 |
244,867 | 245,040 | ||||||
| 4.500%, 12/20/40 |
188,302 | 188,436 | ||||||
| 4.500%, 02/15/41 |
49,765 | 49,787 | ||||||
| 4.500%, 04/15/41 |
57,251 | 57,250 | ||||||
| 4.500%, 04/20/41 |
139,488 | 139,380 | ||||||
| 4.500%, 03/20/42 |
148,762 | 148,647 | ||||||
| 4.500%, 10/20/43 |
176,783 | 175,990 | ||||||
| 4.500%, 03/20/47 |
270,591 | 268,950 | ||||||
| 4.500%, 03/20/49 |
184,650 | 182,594 | ||||||
| 4.500%, 08/20/52 |
2,328,126 | 2,276,555 | ||||||
| 4.500%, 10/20/52 |
2,836,408 | 2,769,549 | ||||||
| 5.000%, 12/15/35 |
72,041 | 73,339 | ||||||
| 5.000%, 12/15/36 |
16,812 | 16,897 | ||||||
| 5.000%, 01/15/39 |
201,607 | 205,294 | ||||||
| 5.000%, 02/15/39 |
34,556 | 35,217 | ||||||
| 5.000%, 08/15/39 |
227,862 | 232,295 | ||||||
| 5.000%, 09/15/39 |
36,237 | 36,943 | ||||||
| 5.000%, 12/15/39 |
166,121 | 169,467 | ||||||
| 5.000%, 05/15/40 |
131,085 | 133,554 | ||||||
| 5.000%, 08/20/40 |
129,866 | 132,142 | ||||||
| 5.000%, 10/20/40 |
139,352 | 141,793 | ||||||
| Agency Sponsored Mortgage - Backed—(Continued) | ||||||||
| Government National Mortgage Association | ||||||||
| 5.000%, 06/20/44 |
298,548 | 303,779 | ||||||
| 5.000%, 10/20/48 |
207,725 | 209,395 | ||||||
| 5.000%, 01/20/49 |
143,355 | 144,507 | ||||||
| 5.000%, 04/20/53 |
1,953,434 | 1,939,865 | ||||||
| 5.000%, 07/20/53 |
3,066,981 | 3,045,677 | ||||||
| 5.500%, 03/15/36 |
43,499 | 44,436 | ||||||
| 5.500%, 09/15/38 |
17,307 | 17,664 | ||||||
| 5.500%, 08/15/39 |
54,590 | 56,920 | ||||||
| 5.500%, 04/20/53 |
2,917,088 | 2,933,951 | ||||||
| 5.500%, 08/20/53 |
2,477,676 | 2,491,999 | ||||||
| 6.000%, 01/15/29 |
747 | 755 | ||||||
| 6.000%, 01/15/33 |
56,110 | 58,387 | ||||||
| 6.000%, 03/15/35 |
40,765 | 42,854 | ||||||
| 6.000%, 12/15/35 |
27,518 | 28,646 | ||||||
| 6.000%, 09/15/36 |
35,434 | 37,050 | ||||||
| 6.000%, 07/15/38 |
91,501 | 96,687 | ||||||
| 6.000%, 01/20/53 |
938,662 | 953,470 | ||||||
| 6.000%, 12/20/53 |
3,900,000 | 3,960,438 | ||||||
| 6.500%, 02/15/27 |
2,561 | 2,574 | ||||||
| 6.500%, 07/15/28 |
1,002 | 1,009 | ||||||
| 6.500%, 08/15/28 |
2,440 | 2,478 | ||||||
| 6.500%, 11/15/28 |
1,092 | 1,120 | ||||||
| 6.500%, 12/15/28 |
3,274 | 3,322 | ||||||
| 6.500%, 07/15/29 |
1,112 | 1,126 | ||||||
| 6.500%, 06/20/31 |
5,884 | 6,179 | ||||||
| 6.500%, 05/15/36 |
75,011 | 79,590 | ||||||
| 6.500%, 11/20/53 |
1,996,324 | 2,043,294 | ||||||
| 7.000%, 01/15/28 |
448 | 460 | ||||||
| 7.000%, 05/15/28 |
2,335 | 2,361 | ||||||
| 7.000%, 06/15/28 |
2,080 | 2,126 | ||||||
| 7.000%, 10/15/28 |
2,486 | 2,541 | ||||||
| 7.000%, 03/15/31 |
183 | 185 | ||||||
| 7.000%, 08/15/31 |
21,533 | 22,794 | ||||||
| 7.000%, 07/15/32 |
8,974 | 9,521 | ||||||
| 7.500%, 02/20/28 |
418 | 429 | ||||||
| 8.000%, 08/15/26 |
327 | 332 | ||||||
| 8.000%, 09/15/26 |
443 | 443 | ||||||
|
|
|
|||||||
| 521,937,840 | ||||||||
|
|
|
|||||||
| Federal Agencies—1.0% | ||||||||
| Federal Farm Credit Banks Funding Corp. | ||||||||
| 4.750%, 03/09/26 |
2,000,000 | 2,017,600 | ||||||
| 5.490%, 11/06/25 |
1,600,000 | 1,601,152 | ||||||
| Federal Home Loan Banks | ||||||||
| 3.000%, 09/10/27 |
2,000,000 | 1,926,800 | ||||||
| 3.250%, 11/16/28 (b) |
2,700,000 | 2,624,670 | ||||||
| Federal Home Loan Mortgage Corp. | ||||||||
| 1.500%, 02/12/25 |
1,500,000 | 1,448,310 | ||||||
| 6.250%, 07/15/32 (b) |
1,600,000 | 1,857,984 | ||||||
| 6.750%, 03/15/31 |
900,000 | 1,049,499 | ||||||
| Federal National Mortgage Association | ||||||||
| 0.750%, 10/08/27 (b) |
750,000 | 666,323 | ||||||
| 2.125%, 04/24/26 (b) |
2,500,000 | 2,387,325 | ||||||
| 6.625%, 11/15/30 (b) |
1,450,000 | 1,669,762 | ||||||
See accompanying notes to financial statements.
BHFTII-9
Brighthouse Funds Trust II
MetLife Aggregate Bond Index Portfolio
Schedule of Investments as of December 31, 2023
U.S. Treasury & Government Agencies—(Continued)
| Security Description | Principal Amount* |
Value | ||||||
| Federal Agencies—(Continued) | ||||||||
| Tennessee Valley Authority | ||||||||
| 3.500%, 12/15/42 |
1,600,000 | $ | 1,352,240 | |||||
|
|
|
|||||||
| 18,601,665 | ||||||||
|
|
|
|||||||
| U.S. Treasury—41.2% | ||||||||
| U.S. Treasury Bonds | ||||||||
| 1.125%, 05/15/40 (b) |
4,100,000 | 2,652,188 | ||||||
| 1.125%, 08/15/40 (b) |
3,200,000 | 2,050,000 | ||||||
| 1.250%, 05/15/50 |
3,200,000 | 1,734,000 | ||||||
| 1.375%, 11/15/40 (b) |
5,500,000 | 3,662,656 | ||||||
| 1.375%, 08/15/50 |
5,100,000 | 2,856,000 | ||||||
| 1.625%, 11/15/50 |
5,200,000 | 3,112,688 | ||||||
| 1.750%, 08/15/41 |
4,300,000 | 3,001,266 | ||||||
| 1.875%, 02/15/41 |
5,200,000 | 3,752,937 | ||||||
| 1.875%, 02/15/51 (b) |
5,800,000 | 3,697,500 | ||||||
| 1.875%, 11/15/51 |
6,500,000 | 4,128,516 | ||||||
| 2.000%, 02/15/50 |
4,000,000 | 2,644,375 | ||||||
| 2.000%, 08/15/51 (b) |
6,500,000 | 4,264,609 | ||||||
| 2.250%, 05/15/41 |
3,700,000 | 2,828,188 | ||||||
| 2.250%, 08/15/46 |
3,000,000 | 2,141,719 | ||||||
| 2.250%, 08/15/49 |
6,000,000 | 4,208,437 | ||||||
| 2.250%, 02/15/52 (b) |
2,100,000 | 1,462,781 | ||||||
| 2.375%, 02/15/42 |
1,300,000 | 1,001,203 | ||||||
| 2.375%, 05/15/51 |
5,100,000 | 3,656,859 | ||||||
| 2.500%, 05/15/46 |
4,800,000 | 3,606,750 | ||||||
| 2.750%, 08/15/42 |
4,820,000 | 3,921,522 | ||||||
| 2.750%, 11/15/42 |
1,200,000 | 973,313 | ||||||
| 2.750%, 08/15/47 (b) |
3,000,000 | 2,346,563 | ||||||
| 2.750%, 11/15/47 |
800,000 | 625,500 | ||||||
| 2.875%, 05/15/43 |
3,260,000 | 2,685,934 | ||||||
| 2.875%, 08/15/45 (b) |
2,200,000 | 1,779,938 | ||||||
| 2.875%, 11/15/46 (b) |
4,600,000 | 3,697,250 | ||||||
| 2.875%, 05/15/49 |
2,300,000 | 1,836,047 | ||||||
| 2.875%, 05/15/52 |
3,900,000 | 3,119,391 | ||||||
| 3.000%, 11/15/44 (b) |
2,600,000 | 2,158,813 | ||||||
| 3.000%, 05/15/45 |
3,100,000 | 2,565,734 | ||||||
| 3.000%, 02/15/47 (b) |
3,000,000 | 2,461,875 | ||||||
| 3.000%, 05/15/47 (b) |
2,800,000 | 2,296,438 | ||||||
| 3.000%, 08/15/48 |
7,700,000 | 6,294,750 | ||||||
| 3.000%, 02/15/49 |
6,300,000 | 5,149,266 | ||||||
| 3.000%, 08/15/52 |
4,700,000 | 3,861,344 | ||||||
| 3.125%, 11/15/41 |
3,000,000 | 2,617,031 | ||||||
| 3.125%, 02/15/43 |
3,270,000 | 2,805,558 | ||||||
| 3.125%, 08/15/44 |
2,700,000 | 2,292,891 | ||||||
| 3.125%, 05/15/48 |
2,500,000 | 2,091,406 | ||||||
| 3.250%, 05/15/42 |
3,100,000 | 2,730,422 | ||||||
| 3.375%, 08/15/42 |
2,200,000 | 1,969,000 | ||||||
| 3.375%, 05/15/44 |
3,000,000 | 2,653,594 | ||||||
| 3.375%, 11/15/48 |
5,000,000 | 4,375,000 | ||||||
| 3.500%, 02/15/39 |
1,872,000 | 1,777,815 | ||||||
| 3.625%, 08/15/43 |
2,600,000 | 2,398,906 | ||||||
| 3.625%, 02/15/44 |
2,420,000 | 2,224,131 | ||||||
| 3.625%, 02/15/53 |
4,300,000 | 3,988,922 | ||||||
| 3.625%, 05/15/53 |
3,200,000 | 2,972,500 | ||||||
| 3.750%, 08/15/41 |
1,300,000 | 1,241,297 | ||||||
| U.S. Treasury—(Continued) | ||||||||
| U.S. Treasury Bonds | ||||||||
| 3.875%, 02/15/43 |
2,000,000 | 1,914,063 | ||||||
| 3.875%, 05/15/43 |
2,000,000 | 1,914,063 | ||||||
| 4.000%, 11/15/42 (b) |
3,100,000 | 3,023,953 | ||||||
| 4.000%, 11/15/52 |
500,000 | 495,469 | ||||||
| 4.125%, 08/15/53 |
3,300,000 | 3,351,562 | ||||||
| 4.250%, 11/15/40 |
1,780,000 | 1,819,772 | ||||||
| 4.375%, 11/15/39 |
1,900,000 | 1,985,203 | ||||||
| 4.375%, 05/15/40 |
1,220,000 | 1,270,897 | ||||||
| 4.375%, 05/15/41 |
1,350,000 | 1,395,984 | ||||||
| 4.375%, 08/15/43 |
2,200,000 | 2,253,969 | ||||||
| 4.500%, 02/15/36 |
600,000 | 641,344 | ||||||
| 4.500%, 05/15/38 |
1,500,000 | 1,598,438 | ||||||
| 4.625%, 02/15/40 |
1,300,000 | 1,396,078 | ||||||
| 5.250%, 02/15/29 |
750,000 | 795,293 | ||||||
| 6.250%, 05/15/30 |
2,500,000 | 2,826,563 | ||||||
| U.S. Treasury Notes | ||||||||
| 0.250%, 07/31/25 |
7,000,000 | 6,555,391 | ||||||
| 0.250%, 08/31/25 |
5,100,000 | 4,761,926 | ||||||
| 0.250%, 09/30/25 (b) |
9,000,000 | 8,381,953 | ||||||
| 0.375%, 04/30/25 |
7,200,000 | 6,813,844 | ||||||
| 0.375%, 11/30/25 |
6,100,000 | 5,665,613 | ||||||
| 0.375%, 12/31/25 (b) |
7,200,000 | 6,673,781 | ||||||
| 0.375%, 01/31/26 |
11,200,000 | 10,346,875 | ||||||
| 0.375%, 07/31/27 |
3,100,000 | 2,735,992 | ||||||
| 0.375%, 09/30/27 |
6,300,000 | 5,529,727 | ||||||
| 0.500%, 03/31/25 (b) |
4,000,000 | 3,803,281 | ||||||
| 0.500%, 02/28/26 |
6,100,000 | 5,637,258 | ||||||
| 0.500%, 04/30/27 |
4,000,000 | 3,572,500 | ||||||
| 0.500%, 10/31/27 |
3,800,000 | 3,343,703 | ||||||
| 0.625%, 07/31/26 |
6,100,000 | 5,588,648 | ||||||
| 0.625%, 11/30/27 (b) |
7,000,000 | 6,173,672 | ||||||
| 0.625%, 12/31/27 |
7,200,000 | 6,334,313 | ||||||
| 0.625%, 05/15/30 |
8,000,000 | 6,548,750 | ||||||
| 0.625%, 08/15/30 |
6,600,000 | 5,363,531 | ||||||
| 0.750%, 03/31/26 |
6,700,000 | 6,218,437 | ||||||
| 0.750%, 01/31/28 |
6,100,000 | 5,381,820 | ||||||
| 0.875%, 06/30/26 |
6,000,000 | 5,549,531 | ||||||
| 0.875%, 11/15/30 |
7,700,000 | 6,336,859 | ||||||
| 1.000%, 07/31/28 |
4,000,000 | 3,520,625 | ||||||
| 1.125%, 02/28/25 |
3,800,000 | 3,649,336 | ||||||
| 1.125%, 10/31/26 |
6,700,000 | 6,184,414 | ||||||
| 1.125%, 02/29/28 |
1,200,000 | 1,073,625 | ||||||
| 1.125%, 08/31/28 |
6,000,000 | 5,302,031 | ||||||
| 1.125%, 02/15/31 (b) |
7,500,000 | 6,271,875 | ||||||
| 1.250%, 11/30/26 |
2,100,000 | 1,942,336 | ||||||
| 1.250%, 12/31/26 |
3,800,000 | 3,508,766 | ||||||
| 1.250%, 03/31/28 |
5,100,000 | 4,577,648 | ||||||
| 1.250%, 04/30/28 |
6,000,000 | 5,376,094 | ||||||
| 1.250%, 05/31/28 |
3,400,000 | 3,040,078 | ||||||
| 1.250%, 06/30/28 |
5,900,000 | 5,265,750 | ||||||
| 1.250%, 09/30/28 |
6,000,000 | 5,321,719 | ||||||
| 1.250%, 08/15/31 |
16,400,000 | 13,601,750 | ||||||
| 1.375%, 10/31/28 |
3,300,000 | 2,940,352 | ||||||
| 1.375%, 11/15/31 |
10,200,000 | 8,485,125 | ||||||
| 1.500%, 02/15/25 |
2,100,000 | 2,026,746 | ||||||
See accompanying notes to financial statements.
BHFTII-10
Brighthouse Funds Trust II
MetLife Aggregate Bond Index Portfolio
Schedule of Investments as of December 31, 2023
U.S. Treasury & Government Agencies—(Continued)
| Security Description | Principal Amount* |
Value | ||||||
| U.S. Treasury—(Continued) | ||||||||
| U.S. Treasury Notes | ||||||||
| 1.500%, 08/15/26 |
5,600,000 | $ | 5,242,125 | |||||
| 1.500%, 01/31/27 (b) |
4,000,000 | 3,715,000 | ||||||
| 1.500%, 11/30/28 (b) |
8,500,000 | 7,607,500 | ||||||
| 1.500%, 02/15/30 (b) |
8,300,000 | 7,241,750 | ||||||
| 1.625%, 02/15/26 |
6,400,000 | 6,066,000 | ||||||
| 1.625%, 05/15/26 |
4,900,000 | 4,624,375 | ||||||
| 1.625%, 09/30/26 (b) |
6,000,000 | 5,627,344 | ||||||
| 1.625%, 08/15/29 |
4,500,000 | 4,010,273 | ||||||
| 1.625%, 05/15/31 |
9,800,000 | 8,420,344 | ||||||
| 1.750%, 01/31/29 |
5,000,000 | 4,516,016 | ||||||
| 1.875%, 06/30/26 |
6,900,000 | 6,544,758 | ||||||
| 1.875%, 02/28/27 |
8,700,000 | 8,159,648 | ||||||
| 1.875%, 02/28/29 |
2,100,000 | 1,906,406 | ||||||
| 1.875%, 02/15/32 (b) |
11,200,000 | 9,647,750 | ||||||
| 2.000%, 02/15/25 |
7,600,000 | 7,375,562 | ||||||
| 2.000%, 08/15/25 |
5,100,000 | 4,907,953 | ||||||
| 2.000%, 11/15/26 |
7,300,000 | 6,904,773 | ||||||
| 2.125%, 05/15/25 (b) |
5,500,000 | 5,324,473 | ||||||
| 2.125%, 05/31/26 (b) |
6,800,000 | 6,494,000 | ||||||
| 2.250%, 11/15/25 (b) |
5,400,000 | 5,201,297 | ||||||
| 2.250%, 02/15/27 |
4,300,000 | 4,083,320 | ||||||
| 2.250%, 08/15/27 |
6,100,000 | 5,754,969 | ||||||
| 2.250%, 11/15/27 (b) |
2,600,000 | 2,446,031 | ||||||
| 2.375%, 05/15/27 |
8,000,000 | 7,602,500 | ||||||
| 2.375%, 05/15/29 |
6,800,000 | 6,312,844 | ||||||
| 2.500%, 01/31/25 |
2,100,000 | 2,050,781 | ||||||
| 2.500%, 02/28/26 |
6,700,000 | 6,467,070 | ||||||
| 2.500%, 03/31/27 |
5,100,000 | 4,876,477 | ||||||
| 2.625%, 04/15/25 |
8,000,000 | 7,802,812 | ||||||
| 2.625%, 05/31/27 (b) |
4,000,000 | 3,830,938 | ||||||
| 2.625%, 02/15/29 (b) |
8,300,000 | 7,824,695 | ||||||
| 2.750%, 02/28/25 |
6,900,000 | 6,751,219 | ||||||
| 2.750%, 04/30/27 |
7,200,000 | 6,929,438 | ||||||
| 2.750%, 02/15/28 |
6,000,000 | 5,737,969 | ||||||
| 2.750%, 05/31/29 |
9,500,000 | 8,982,695 | ||||||
| 2.750%, 08/15/32 (b) |
8,700,000 | 7,983,609 | ||||||
| 2.875%, 04/30/25 |
8,400,000 | 8,216,578 | ||||||
| 2.875%, 07/31/25 (b) |
6,600,000 | 6,442,477 | ||||||
| 2.875%, 05/15/28 |
5,900,000 | 5,662,617 | ||||||
| 2.875%, 08/15/28 |
6,000,000 | 5,746,875 | ||||||
| 2.875%, 05/15/32 |
10,500,000 | 9,748,594 | ||||||
| 3.125%, 08/15/25 |
6,100,000 | 5,978,238 | ||||||
| 3.125%, 11/15/28 |
8,000,000 | 7,737,500 | ||||||
| 3.125%, 08/31/29 |
5,300,000 | 5,097,937 | ||||||
| 3.375%, 05/15/33 |
7,300,000 | 7,021,687 | ||||||
| 3.500%, 01/31/28 |
4,000,000 | 3,939,688 | ||||||
| 3.500%, 01/31/30 |
8,200,000 | 8,032,156 | ||||||
| 3.500%, 02/15/33 (b) |
6,500,000 | 6,316,172 | ||||||
| 3.625%, 03/31/30 |
5,200,000 | 5,127,281 | ||||||
| 3.875%, 04/30/25 |
9,200,000 | 9,117,344 | ||||||
| 3.875%, 01/15/26 (b) |
5,000,000 | 4,962,891 | ||||||
| 3.875%, 11/30/27 |
4,000,000 | 3,993,750 | ||||||
| 3.875%, 12/31/27 |
500,000 | 499,570 | ||||||
| 3.875%, 09/30/29 |
4,900,000 | 4,897,703 | ||||||
| 3.875%, 08/15/33 (b) |
5,100,000 | 5,103,984 | ||||||
| U.S. Treasury—(Continued) | ||||||||
| U.S. Treasury Notes | ||||||||
| 4.000%, 12/15/25 |
6,000,000 | 5,969,062 | ||||||
| 4.000%, 06/30/28 (b) |
3,000,000 | 3,016,875 | ||||||
| 4.000%, 10/31/29 (b) |
5,000,000 | 5,031,250 | ||||||
| 4.000%, 07/31/30 |
7,300,000 | 7,352,469 | ||||||
| 4.125%, 09/30/27 |
4,000,000 | 4,027,188 | ||||||
| 4.125%, 10/31/27 (b) |
5,900,000 | 5,940,562 | ||||||
| 4.375%, 08/31/28 (b) |
7,100,000 | 7,258,641 | ||||||
| 4.500%, 11/15/25 |
4,900,000 | 4,917,035 | ||||||
| 4.625%, 02/28/25 |
3,000,000 | 2,997,656 | ||||||
| 4.625%, 09/15/26 (b) |
6,000,000 | 6,084,375 | ||||||
| 4.625%, 11/15/26 (b) |
8,000,000 | 8,129,375 | ||||||
| 4.625%, 09/30/28 |
5,800,000 | 5,986,687 | ||||||
| 4.875%, 10/31/30 |
4,800,000 | 5,085,750 | ||||||
| 5.000%, 08/31/25 |
9,000,000 | 9,084,023 | ||||||
| 5.000%, 09/30/25 (b) |
6,000,000 | 6,061,875 | ||||||
|
|
|
|||||||
| 790,023,728 | ||||||||
|
|
|
|||||||
| Total U.S. Treasury & Government Agencies |
1,330,563,233 | |||||||
|
|
|
|||||||
| Corporate Bonds & Notes—26.2% |
| |||||||
| Aerospace/Defense—0.5% | ||||||||
| Boeing Co. | ||||||||
| 5.150%, 05/01/30 (b) |
2,300,000 | 2,344,137 | ||||||
| 5.930%, 05/01/60 |
1,100,000 | 1,143,604 | ||||||
| 7.250%, 06/15/25 |
460,000 | 474,913 | ||||||
| Lockheed Martin Corp. | ||||||||
| 3.550%, 01/15/26 (b) |
523,000 | 513,847 | ||||||
| 4.090%, 09/15/52 (b) |
954,000 | 850,997 | ||||||
| Northrop Grumman Corp. |
||||||||
| 3.250%, 01/15/28 (b) |
1,100,000 | 1,052,480 | ||||||
| Northrop Grumman Systems Corp. |
||||||||
| 7.750%, 02/15/31 (b) |
515,000 | 606,139 | ||||||
| RTX Corp. | ||||||||
| 3.125%, 05/04/27 (b) |
1,000,000 | 951,670 | ||||||
| 4.500%, 06/01/42 |
1,645,000 | 1,501,359 | ||||||
| 7.500%, 09/15/29 |
200,000 | 225,950 | ||||||
|
|
|
|||||||
| 9,665,096 | ||||||||
|
|
|
|||||||
| Agriculture—0.3% | ||||||||
| Altria Group, Inc. |
||||||||
| 5.950%, 02/14/49 (b) |
1,200,000 | 1,225,224 | ||||||
| BAT Capital Corp. |
||||||||
| 4.390%, 08/15/37 |
1,300,000 | 1,091,454 | ||||||
| Philip Morris International, Inc. | ||||||||
| 3.250%, 11/10/24 |
1,000,000 | 982,700 | ||||||
| 4.875%, 11/15/43 |
1,100,000 | 1,037,333 | ||||||
| Reynolds American, Inc. |
||||||||
| 4.450%, 06/12/25 (b) |
1,736,000 | 1,716,175 | ||||||
|
|
|
|||||||
| 6,052,886 | ||||||||
|
|
|
|||||||
See accompanying notes to financial statements.
BHFTII-11
Brighthouse Funds Trust II
MetLife Aggregate Bond Index Portfolio
Schedule of Investments as of December 31, 2023
Corporate Bonds & Notes—(Continued)
| Security Description | Principal Amount* |
Value | ||||||
| Airlines—0.1% | ||||||||
| Southwest Airlines Co. |
||||||||
| 5.125%, 06/15/27 (b) |
1,000,000 | $ | 1,005,120 | |||||
|
|
|
|||||||
| Apparel—0.1% | ||||||||
| NIKE, Inc. |
||||||||
| 2.750%, 03/27/27 (b) |
1,000,000 | 953,990 | ||||||
|
|
|
|||||||
| Auto Manufacturers—0.6% | ||||||||
| American Honda Finance Corp. | ||||||||
| 2.250%, 01/12/29 (b) |
1,000,000 | 904,140 | ||||||
| 2.300%, 09/09/26 (b) |
300,000 | 283,755 | ||||||
| Ford Motor Credit Co. LLC |
||||||||
| 6.800%, 05/12/28 (b) |
2,500,000 | 2,612,750 | ||||||
| General Motors Financial Co., Inc. | ||||||||
| 1.250%, 01/08/26 (b) |
1,200,000 | 1,110,660 | ||||||
| 4.350%, 01/17/27 (b) |
3,200,000 | 3,139,552 | ||||||
| Mercedes-Benz Finance North America LLC |
||||||||
| 8.500%, 01/18/31 (b) |
550,000 | 690,343 | ||||||
| Toyota Motor Credit Corp. |
||||||||
| 3.375%, 04/01/30 |
2,600,000 | 2,447,380 | ||||||
|
|
|
|||||||
| 11,188,580 | ||||||||
|
|
|
|||||||
| Banks—5.7% | ||||||||
| Banco Santander SA |
||||||||
| 4.379%, 04/12/28 (b) |
2,200,000 | 2,137,124 | ||||||
| Bank of America Corp. | ||||||||
| 2.687%, SOFR + 1.320%, 04/22/32 (a) |
2,000,000 | 1,690,160 | ||||||
| 3.593%, 3M TSFR + 1.632%, 07/21/28 (a) |
3,200,000 | 3,038,464 | ||||||
| 5.015%, SOFR + 2.160%, 07/22/33 (a) (b) |
3,100,000 | 3,073,650 | ||||||
| 5.288%, SOFR + 1.910%, 04/25/34 (a) |
4,400,000 | 4,413,332 | ||||||
| 5.875%, 02/07/42 (b) |
1,500,000 | 1,621,950 | ||||||
| Bank of Montreal |
||||||||
| 0.949%, SOFR + 0.603%, 01/22/27 (a) (b) |
2,300,000 | 2,122,256 | ||||||
| Bank of New York Mellon Corp. |
||||||||
| 3.442%, 3M TSFR + 1.331%, 02/07/28 (a) (b) |
1,800,000 | 1,733,418 | ||||||
| Bank of Nova Scotia |
||||||||
| 4.850%, 02/01/30 (b) |
1,000,000 | 999,750 | ||||||
| Barclays PLC |
||||||||
| 4.375%, 01/12/26 (b) |
3,500,000 | 3,449,180 | ||||||
| Canadian Imperial Bank of Commerce |
||||||||
| 2.250%, 01/28/25 |
1,000,000 | 968,690 | ||||||
| Citigroup, Inc. | ||||||||
| 2.572%, SOFR + 2.107%, 06/03/31 (a) |
2,500,000 | 2,138,675 | ||||||
| 3.200%, 10/21/26 |
1,700,000 | 1,621,851 | ||||||
| 4.412%, SOFR + 3.914%, 03/31/31 (a) |
2,900,000 | 2,778,693 | ||||||
| 4.650%, 07/23/48 (b) |
1,300,000 | 1,202,227 | ||||||
| Cooperatieve Rabobank UA |
||||||||
| 5.750%, 12/01/43 (b) |
1,200,000 | 1,240,932 | ||||||
| Deutsche Bank AG |
||||||||
| 2.129%, SOFR + 1.870%, 11/24/26 (a) (b) |
2,000,000 | 1,874,740 | ||||||
| Discover Bank |
||||||||
| 2.450%, 09/12/24 (b) |
1,400,000 | 1,365,070 | ||||||
| Fifth Third Bancorp |
||||||||
| 8.250%, 03/01/38 |
1,175,000 | 1,393,550 | ||||||
| Goldman Sachs Group, Inc. |
||||||||
| 3.210%, SOFR + 1.513%, 04/22/42 (a) |
1,600,000 | 1,228,016 | ||||||
| Banks—(Continued) | ||||||||
| Goldman Sachs Group, Inc. | ||||||||
| 3.850%, 01/26/27 |
1,900,000 | 1,848,947 | ||||||
| 4.223%, 3M TSFR + 1.563%, 05/01/29 (a) |
1,900,000 | 1,837,262 | ||||||
| 6.125%, 02/15/33 (b) |
2,075,000 | 2,283,952 | ||||||
| HSBC Holdings PLC | ||||||||
| 3.973%, 3M TSFR + 1.872%, 05/22/30 (a) (b) |
3,500,000 | 3,272,220 | ||||||
| 6.500%, 09/15/37 (b) |
1,205,000 | 1,303,533 | ||||||
| JPMorgan Chase & Co. | ||||||||
| 1.953%, SOFR + 1.065%, 02/04/32 (a) |
2,100,000 | 1,710,639 | ||||||
| 2.522%, SOFR + 2.040%, 04/22/31 (a) |
2,000,000 | 1,732,480 | ||||||
| 2.950%, 10/01/26 |
2,000,000 | 1,907,760 | ||||||
| 3.882%, 3M TSFR + 1.622%, 07/24/38 (a) (b) |
1,000,000 | 888,830 | ||||||
| 3.900%, 07/15/25 (b) |
4,700,000 | 4,631,756 | ||||||
| 3.964%, 3M TSFR + 1.642%, 11/15/48 (a) |
2,400,000 | 2,021,520 | ||||||
| KeyBank NA |
||||||||
| 3.300%, 06/01/25 (b) |
800,000 | 769,880 | ||||||
| Kreditanstalt fuer Wiederaufbau | ||||||||
| 0.625%, 01/22/26 (b) |
1,100,000 | 1,021,669 | ||||||
| 1.750%, 09/14/29 (b) |
2,000,000 | 1,779,100 | ||||||
| 3.750%, 02/15/28 |
2,000,000 | 1,981,460 | ||||||
| Landwirtschaftliche Rentenbank |
||||||||
| 3.875%, 09/28/27 |
1,000,000 | 994,360 | ||||||
| Lloyds Banking Group PLC | ||||||||
| 3.574%, 11/07/28 (b) |
1,800,000 | 1,694,754 | ||||||
| 4.650%, 03/24/26 |
1,700,000 | 1,671,661 | ||||||
| Mitsubishi UFJ Financial Group, Inc. |
||||||||
| 3.850%, 03/01/26 |
1,000,000 | 976,740 | ||||||
| Mizuho Financial Group, Inc. |
||||||||
| 4.018%, 03/05/28 (b) |
1,800,000 | 1,748,628 | ||||||
| Morgan Stanley | ||||||||
| 4.300%, 01/27/45 (b) |
1,900,000 | 1,721,590 | ||||||
| 4.350%, 09/08/26 |
3,800,000 | 3,732,588 | ||||||
| 7.250%, 04/01/32 (b) |
1,850,000 | 2,184,018 | ||||||
| PNC Bank NA |
||||||||
| 2.950%, 02/23/25 (b) |
2,100,000 | 2,043,468 | ||||||
| Royal Bank of Canada |
||||||||
| 1.600%, 01/21/25 (b) |
2,100,000 | 2,023,980 | ||||||
| Sumitomo Mitsui Financial Group, Inc. |
||||||||
| 2.632%, 07/14/26 (b) |
4,700,000 | 4,454,472 | ||||||
| Toronto-Dominion Bank |
||||||||
| 3.766%, 06/06/25 (b) |
1,000,000 | 983,910 | ||||||
| Truist Financial Corp. |
||||||||
| 1.267%, SOFR + 0.609%, 03/02/27 (a) (b) |
2,000,000 | 1,833,140 | ||||||
| U.S. Bancorp |
||||||||
| 5.775%, SOFR + 2.020%, 06/12/29 (a) (b) |
2,000,000 | 2,054,520 | ||||||
| UBS Group AG |
||||||||
| 4.550%, 04/17/26 |
2,700,000 | 2,663,334 | ||||||
| Wells Fargo & Co. | ||||||||
| 2.879%, 3M TSFR + 1.432%, 10/30/30 (a) |
2,400,000 | 2,134,776 | ||||||
| 3.000%, 10/23/26 (b) |
2,000,000 | 1,899,540 | ||||||
| 5.013%, 3M TSFR + 4.502%, 04/04/51 (a) |
1,000,000 | 951,320 | ||||||
| 5.557%, SOFR + 1.990%, 07/25/34 (a) |
1,500,000 | 1,530,435 | ||||||
| 5.606%, 01/15/44 |
2,200,000 | 2,201,870 | ||||||
| Westpac Banking Corp. |
||||||||
| 2.668%, 5Y H15 + 1.750%, 11/15/35 (a) |
1,700,000 | 1,383,681 | ||||||
|
|
|
|||||||
| 109,965,521 | ||||||||
|
|
|
|||||||
See accompanying notes to financial statements.
BHFTII-12
Brighthouse Funds Trust II
MetLife Aggregate Bond Index Portfolio
Schedule of Investments as of December 31, 2023
Corporate Bonds & Notes—(Continued)
| Security Description | Principal Amount* |
Value | ||||||
| Beverages—0.5% | ||||||||
| Anheuser-Busch InBev Worldwide, Inc. | ||||||||
| 4.439%, 10/06/48 |
1,165,000 | $ | 1,076,681 | |||||
| 5.550%, 01/23/49 |
1,900,000 | 2,048,751 | ||||||
| Coca-Cola Co. |
||||||||
| 1.650%, 06/01/30 (b) |
2,400,000 | 2,057,592 | ||||||
| Diageo Capital PLC |
||||||||
| 2.375%, 10/24/29 (b) |
1,400,000 | 1,261,302 | ||||||
| Keurig Dr Pepper, Inc. |
||||||||
| 4.597%, 05/25/28 (b) |
1,200,000 | 1,202,556 | ||||||
| PepsiCo, Inc. | ||||||||
| 2.750%, 03/19/30 (b) |
800,000 | 735,440 | ||||||
| 4.450%, 04/14/46 (b) |
1,300,000 | 1,254,591 | ||||||
|
|
|
|||||||
| 9,636,913 | ||||||||
|
|
|
|||||||
| Biotechnology—0.3% | ||||||||
| Amgen, Inc. | ||||||||
| 2.000%, 01/15/32 (b) |
1,600,000 | 1,313,152 | ||||||
| 4.663%, 06/15/51 |
1,000,000 | 913,350 | ||||||
| 5.650%, 03/02/53 |
2,000,000 | 2,112,560 | ||||||
| Biogen, Inc. |
||||||||
| 4.050%, 09/15/25 (b) |
300,000 | 295,185 | ||||||
| Gilead Sciences, Inc. |
||||||||
| 3.650%, 03/01/26 (b) |
2,000,000 | 1,957,740 | ||||||
|
|
|
|||||||
| 6,591,987 | ||||||||
|
|
|
|||||||
| Building Materials—0.2% | ||||||||
| Carrier Global Corp. |
||||||||
| 2.493%, 02/15/27 (b) |
2,000,000 | 1,883,460 | ||||||
| Trane Technologies Financing Ltd. |
||||||||
| 3.800%, 03/21/29 (b) |
1,000,000 | 969,140 | ||||||
|
|
|
|||||||
| 2,852,600 | ||||||||
|
|
|
|||||||
| Chemicals—0.4% | ||||||||
| Dow Chemical Co. | ||||||||
| 4.375%, 11/15/42 |
1,000,000 | 886,480 | ||||||
| 9.400%, 05/15/39 |
650,000 | 908,173 | ||||||
| DuPont de Nemours, Inc. |
||||||||
| 5.419%, 11/15/48 (b) |
1,000,000 | 1,046,420 | ||||||
| LyondellBasell Industries NV |
||||||||
| 4.625%, 02/26/55 (b) |
1,400,000 | 1,221,584 | ||||||
| Nutrien Ltd. |
||||||||
| 4.200%, 04/01/29 (b) |
1,000,000 | 984,350 | ||||||
| Sherwin-Williams Co. |
||||||||
| 3.450%, 06/01/27 (b) |
1,800,000 | 1,739,736 | ||||||
| Westlake Corp. |
||||||||
| 3.125%, 08/15/51 |
500,000 | 332,320 | ||||||
|
|
|
|||||||
| 7,119,063 | ||||||||
|
|
|
|||||||
| Commercial Services—0.3% | ||||||||
| Global Payments, Inc. |
||||||||
| 2.900%, 05/15/30 (b) |
900,000 | 792,999 | ||||||
| Massachusetts Institute of Technology |
||||||||
| 2.294%, 07/01/51 |
1,200,000 | 765,012 | ||||||
| Commercial Services—(Continued) | ||||||||
| PayPal Holdings, Inc. |
||||||||
| 2.850%, 10/01/29 (b) |
2,000,000 | 1,833,100 | ||||||
| S&P Global, Inc. |
||||||||
| 2.300%, 08/15/60 |
800,000 | 482,592 | ||||||
| Yale University |
||||||||
| 2.402%, 04/15/50 |
2,000,000 | 1,321,700 | ||||||
|
|
|
|||||||
| 5,195,403 | ||||||||
|
|
|
|||||||
| Computers—0.6% | ||||||||
| Apple, Inc. | ||||||||
| 2.550%, 08/20/60 |
1,000,000 | 662,160 | ||||||
| 2.650%, 02/08/51 |
1,500,000 | 1,029,825 | ||||||
| 3.350%, 08/08/32 (b) |
2,300,000 | 2,158,251 | ||||||
| Dell International LLC/EMC Corp. |
||||||||
| 5.300%, 10/01/29 |
1,800,000 | 1,856,160 | ||||||
| Hewlett Packard Enterprise Co. |
||||||||
| 4.900%, 10/15/25 |
1,400,000 | 1,394,736 | ||||||
| HP, Inc. |
||||||||
| 4.000%, 04/15/29 (b) |
1,000,000 | 971,890 | ||||||
| International Business Machines Corp. | ||||||||
| 3.300%, 05/15/26 (b) |
1,900,000 | 1,843,703 | ||||||
| 4.000%, 06/20/42 (b) |
1,200,000 | 1,049,616 | ||||||
|
|
|
|||||||
| 10,966,341 | ||||||||
|
|
|
|||||||
| Cosmetics/Personal Care—0.2% | ||||||||
| Estee Lauder Cos., Inc. |
||||||||
| 1.950%, 03/15/31 (b) |
1,100,000 | 922,174 | ||||||
| Kenvue, Inc. |
||||||||
| 5.050%, 03/22/53 (b) |
1,000,000 | 1,037,360 | ||||||
| Procter & Gamble Co. |
||||||||
| 3.550%, 03/25/40 |
900,000 | 806,562 | ||||||
| Unilever Capital Corp. |
||||||||
| 2.900%, 05/05/27 (b) |
1,500,000 | 1,433,010 | ||||||
|
|
|
|||||||
| 4,199,106 | ||||||||
|
|
|
|||||||
| Diversified Financial Services—1.0% | ||||||||
| AerCap Ireland Capital DAC/AerCap Global Aviation Trust | ||||||||
| 3.300%, 01/30/32 (b) |
1,000,000 | 871,750 | ||||||
| 3.650%, 07/21/27 |
1,900,000 | 1,806,843 | ||||||
| Air Lease Corp. |
||||||||
| 2.875%, 01/15/26 (b) |
900,000 | 858,042 | ||||||
| American Express Co. |
||||||||
| 3.300%, 05/03/27 |
3,000,000 | 2,869,590 | ||||||
| BlackRock, Inc. |
||||||||
| 4.750%, 05/25/33 |
1,000,000 | 1,010,370 | ||||||
| Brookfield Capital Finance LLC | ||||||||
| 6.087%, 06/14/33 (b) |
500,000 | 522,415 | ||||||
| Capital One Financial Corp. |
||||||||
| 3.800%, 01/31/28 (b) |
1,800,000 | 1,711,404 | ||||||
| Charles Schwab Corp. | ||||||||
| 4.625%, 03/22/30 |
900,000 | 904,203 | ||||||
| 5.643%, SOFR + 2.210%, 05/19/29 (a) (b) |
500,000 | 513,830 | ||||||
| Intercontinental Exchange, Inc. | ||||||||
| 3.000%, 06/15/50 |
1,000,000 | 718,240 | ||||||
| 3.750%, 12/01/25 (b) |
1,000,000 | 982,780 | ||||||
See accompanying notes to financial statements.
BHFTII-13
Brighthouse Funds Trust II
MetLife Aggregate Bond Index Portfolio
Schedule of Investments as of December 31, 2023
Corporate Bonds & Notes—(Continued)
| Security Description | Principal Amount* |
Value | ||||||
| Diversified Financial Services—(Continued) | ||||||||
| Mastercard, Inc. |
||||||||
| 3.350%, 03/26/30 (b) |
1,700,000 | $ | 1,622,548 | |||||
| Nasdaq, Inc. |
||||||||
| 3.950%, 03/07/52 |
700,000 | 557,445 | ||||||
| Nomura Holdings, Inc. | ||||||||
| 2.679%, 07/16/30 (b) |
1,000,000 | 853,040 | ||||||
| 6.070%, 07/12/28 (b) |
1,000,000 | 1,034,120 | ||||||
| Visa, Inc. |
||||||||
| 1.100%, 02/15/31 (b) |
3,100,000 | 2,518,099 | ||||||
|
|
|
|||||||
| 19,354,719 | ||||||||
|
|
|
|||||||
| Electric—2.1% | ||||||||
| Appalachian Power Co. |
||||||||
| 3.700%, 05/01/50 (b) |
900,000 | 676,881 | ||||||
| CenterPoint Energy Houston Electric LLC |
||||||||
| 4.500%, 04/01/44 |
1,300,000 | 1,198,847 | ||||||
| CMS Energy Corp. |
||||||||
| 4.750%, 5Y H15 + 4.116%, 06/01/50 (a) (b) |
1,500,000 | 1,358,520 | ||||||
| Commonwealth Edison Co. |
||||||||
| 3.000%, 03/01/50 |
900,000 | 630,153 | ||||||
| Connecticut Light & Power Co. |
||||||||
| 4.000%, 04/01/48 (b) |
1,000,000 | 855,120 | ||||||
| Consolidated Edison Co. of New York, Inc. |
||||||||
| 3.950%, 03/01/43 |
2,070,000 | 1,767,180 | ||||||
| Constellation Energy Generation LLC |
||||||||
| 5.600%, 03/01/28 (b) |
1,000,000 | 1,030,910 | ||||||
| Dominion Energy, Inc. | ||||||||
| 3.900%, 10/01/25 (b) |
1,900,000 | 1,865,135 | ||||||
| 4.600%, 03/15/49 (b) |
800,000 | 707,096 | ||||||
| DTE Electric Co. |
||||||||
| 3.700%, 03/15/45 (b) |
1,000,000 | 815,120 | ||||||
| Duke Energy Carolinas LLC | ||||||||
| 3.550%, 03/15/52 (b) |
1,000,000 | 769,180 | ||||||
| 5.300%, 02/15/40 (b) |
2,000,000 | 2,026,780 | ||||||
| Duke Energy Corp. |
||||||||
| 2.650%, 09/01/26 (b) |
1,000,000 | 949,000 | ||||||
| Entergy Louisiana LLC |
||||||||
| 4.000%, 03/15/33 (b) |
1,000,000 | 934,570 | ||||||
| Evergy, Inc. |
||||||||
| 2.900%, 09/15/29 |
500,000 | 452,830 | ||||||
| Exelon Corp. | ||||||||
| 3.400%, 04/15/26 (b) |
1,000,000 | 968,740 | ||||||
| 5.625%, 06/15/35 |
500,000 | 516,385 | ||||||
| Florida Power & Light Co. |
||||||||
| 5.950%, 02/01/38 |
1,700,000 | 1,863,098 | ||||||
| Georgia Power Co. |
||||||||
| 4.300%, 03/15/42 |
2,000,000 | 1,779,280 | ||||||
| Louisville Gas & Electric Co. |
||||||||
| 4.250%, 04/01/49 |
800,000 | 682,032 | ||||||
| MidAmerican Energy Co. | ||||||||
| 3.650%, 04/15/29 (b) |
1,700,000 | 1,626,543 | ||||||
| 4.250%, 07/15/49 |
1,500,000 | 1,315,770 | ||||||
| National Rural Utilities Cooperative Finance Corp. |
||||||||
| 2.400%, 03/15/30 |
1,800,000 | 1,562,940 | ||||||
| Northern States Power Co. |
||||||||
| 6.250%, 06/01/36 (b) |
1,200,000 | 1,330,236 | ||||||
| Electric—(Continued) | ||||||||
| Oncor Electric Delivery Co. LLC |
||||||||
| 3.100%, 09/15/49 |
900,000 | 648,288 | ||||||
| Pacific Gas & Electric Co. |
||||||||
| 2.500%, 02/01/31 |
3,000,000 | 2,481,720 | ||||||
| PG&E Wildfire Recovery Funding LLC | ||||||||
| 4.722%, 06/01/39 |
160,000 | 158,264 | ||||||
| 5.212%, 12/01/49 |
1,100,000 | 1,112,760 | ||||||
| Public Service Electric & Gas Co. |
||||||||
| 1.900%, 08/15/31 (b) |
1,600,000 | 1,314,352 | ||||||
| Sempra |
||||||||
| 3.400%, 02/01/28 (b) |
1,100,000 | 1,050,005 | ||||||
| Southern California Edison Co. | ||||||||
| 3.650%, 03/01/28 (b) |
900,000 | 863,451 | ||||||
| 4.000%, 04/01/47 |
1,000,000 | 822,710 | ||||||
| Southwestern Electric Power Co. |
||||||||
| 4.100%, 09/15/28 (b) |
1,800,000 | 1,742,022 | ||||||
| Union Electric Co. |
||||||||
| 3.500%, 03/15/29 (b) |
1,800,000 | 1,706,058 | ||||||
|
|
|
|||||||
| 39,581,976 | ||||||||
|
|
|
|||||||
| Electrical Components & Equipment—0.0% | ||||||||
| Emerson Electric Co. |
||||||||
| 2.200%, 12/21/31 |
500,000 | 428,060 | ||||||
|
|
|
|||||||
| Electronics—0.1% | ||||||||
| Honeywell International, Inc. |
||||||||
| 2.500%, 11/01/26 (b) |
1,800,000 | 1,715,220 | ||||||
|
|
|
|||||||
| Entertainment—0.0% | ||||||||
| Warnermedia Holdings, Inc. |
||||||||
| 5.141%, 03/15/52 (b) |
600,000 | 517,308 | ||||||
|
|
|
|||||||
| Environmental Control—0.1% | ||||||||
| Waste Connections, Inc. |
||||||||
| 2.200%, 01/15/32 (b) |
500,000 | 418,230 | ||||||
| Waste Management, Inc. |
||||||||
| 3.150%, 11/15/27 (b) |
1,800,000 | 1,726,272 | ||||||
|
|
|
|||||||
| 2,144,502 | ||||||||
|
|
|
|||||||
| Food—0.4% | ||||||||
| Conagra Brands, Inc. |
||||||||
| 4.850%, 11/01/28 (b) |
1,300,000 | 1,300,949 | ||||||
| General Mills, Inc. |
||||||||
| 4.200%, 04/17/28 (b) |
1,500,000 | 1,478,925 | ||||||
| Kraft Heinz Foods Co. |
||||||||
| 5.000%, 07/15/35 (b) |
1,600,000 | 1,612,736 | ||||||
| Kroger Co. |
||||||||
| 2.200%, 05/01/30 (b) |
1,000,000 | 856,970 | ||||||
| Sysco Corp. |
||||||||
| 6.600%, 04/01/50 (b) |
900,000 | 1,057,257 | ||||||
| Tyson Foods, Inc. |
||||||||
| 3.550%, 06/02/27 |
1,200,000 | 1,146,108 | ||||||
|
|
|
|||||||
| 7,452,945 | ||||||||
|
|
|
|||||||
See accompanying notes to financial statements.
BHFTII-14
Brighthouse Funds Trust II
MetLife Aggregate Bond Index Portfolio
Schedule of Investments as of December 31, 2023
Corporate Bonds & Notes—(Continued)
| Security Description | Principal Amount* |
Value | ||||||
| Forest Products & Paper—0.0% | ||||||||
| International Paper Co. | ||||||||
| 4.400%, 08/15/47 (b) |
800,000 | $ | 694,704 | |||||
|
|
|
|||||||
| Gas—0.1% | ||||||||
| Atmos Energy Corp. |
||||||||
| 1.500%, 01/15/31 (b) |
1,100,000 | 896,984 | ||||||
| NiSource, Inc. |
||||||||
| 4.800%, 02/15/44 |
1,500,000 | 1,380,975 | ||||||
|
|
|
|||||||
| 2,277,959 | ||||||||
|
|
|
|||||||
| Hand/Machine Tools—0.1% | ||||||||
| Stanley Black & Decker, Inc. |
||||||||
| 3.000%, 05/15/32 |
1,800,000 | 1,557,882 | ||||||
|
|
|
|||||||
| Healthcare-Products—0.3% | ||||||||
| Abbott Laboratories |
||||||||
| 4.750%, 11/30/36 (b) |
1,300,000 | 1,332,942 | ||||||
| Boston Scientific Corp. |
||||||||
| 1.900%, 06/01/25 (b) |
1,900,000 | 1,819,820 | ||||||
| DH Europe Finance II SARL |
||||||||
| 3.250%, 11/15/39 (b) |
900,000 | 748,062 | ||||||
| Medtronic, Inc. |
||||||||
| 4.625%, 03/15/45 (b) |
933,000 | 911,896 | ||||||
| Stryker Corp. |
||||||||
| 1.150%, 06/15/25 (b) |
1,000,000 | 946,140 | ||||||
|
|
|
|||||||
| 5,758,860 | ||||||||
|
|
|
|||||||
| Healthcare-Services—0.6% | ||||||||
| Centene Corp. |
||||||||
| 2.500%, 03/01/31 (b) |
300,000 | 250,254 | ||||||
| CommonSpirit Health |
||||||||
| 3.910%, 10/01/50 |
500,000 | 395,530 | ||||||
| Elevance Health, Inc. |
||||||||
| 5.850%, 01/15/36 |
1,800,000 | 1,921,284 | ||||||
| HCA, Inc. | ||||||||
| 4.125%, 06/15/29 |
1,800,000 | 1,723,770 | ||||||
| 5.900%, 06/01/53 (b) |
1,000,000 | 1,026,770 | ||||||
| Humana, Inc. |
||||||||
| 4.875%, 04/01/30 (b) |
800,000 | 808,584 | ||||||
| Kaiser Foundation Hospitals |
||||||||
| 3.002%, 06/01/51 (b) |
1,000,000 | 716,320 | ||||||
| Laboratory Corp. of America Holdings |
||||||||
| 3.600%, 02/01/25 (b) |
500,000 | 491,535 | ||||||
| UnitedHealth Group, Inc. | ||||||||
| 3.500%, 08/15/39 |
900,000 | 766,998 | ||||||
| 3.750%, 07/15/25 (b) |
1,600,000 | 1,577,632 | ||||||
| 4.250%, 06/15/48 |
1,000,000 | 896,810 | ||||||
| 4.950%, 05/15/62 |
1,300,000 | 1,281,566 | ||||||
|
|
|
|||||||
| 11,857,053 | ||||||||
|
|
|
|||||||
| Home Builders—0.1% | ||||||||
| Lennar Corp. |
||||||||
| 4.750%, 11/29/27 (b) |
1,300,000 | 1,300,780 | ||||||
|
|
|
|||||||
| Household Products/Wares—0.1% | ||||||||
| Kimberly-Clark Corp. |
||||||||
| 3.100%, 03/26/30 (b) |
1,100,000 | 1,026,762 | ||||||
|
|
|
|||||||
| Insurance—0.7% | ||||||||
| Allstate Corp. |
||||||||
| 1.450%, 12/15/30 (b) |
1,100,000 | 890,945 | ||||||
| American International Group, Inc. |
||||||||
| 3.400%, 06/30/30 (b) |
800,000 | 737,040 | ||||||
| Aon Corp./Aon Global Holdings PLC |
||||||||
| 5.350%, 02/28/33 |
1,000,000 | 1,026,950 | ||||||
| AXA SA |
||||||||
| 8.600%, 12/15/30 (b) |
365,000 | 439,358 | ||||||
| Berkshire Hathaway Finance Corp. |
||||||||
| 4.200%, 08/15/48 (b) |
1,700,000 | 1,572,177 | ||||||
| Berkshire Hathaway, Inc. |
||||||||
| 3.125%, 03/15/26 (b) |
750,000 | 729,247 | ||||||
| Chubb Corp. |
||||||||
| 6.000%, 05/11/37 |
865,000 | 958,645 | ||||||
| Hartford Financial Services Group, Inc. |
||||||||
| 6.100%, 10/01/41 |
780,000 | 837,346 | ||||||
| Lincoln National Corp. |
||||||||
| 4.350%, 03/01/48 |
600,000 | 479,358 | ||||||
| Marsh & McLennan Cos., Inc. |
||||||||
| 3.750%, 03/14/26 (b) |
1,000,000 | 982,090 | ||||||
| Principal Financial Group, Inc. |
||||||||
| 3.100%, 11/15/26 (b) |
1,000,000 | 953,620 | ||||||
| Prudential Financial, Inc. | ||||||||
| 2.100%, 03/10/30 (b) |
2,000,000 | 1,753,780 | ||||||
| 5.700%, 12/14/36 (b) |
1,525,000 | 1,653,054 | ||||||
| Travelers Cos., Inc. |
||||||||
| 3.050%, 06/08/51 (b) |
800,000 | 591,240 | ||||||
|
|
|
|||||||
| 13,604,850 | ||||||||
|
|
|
|||||||
| Internet—0.5% | ||||||||
| Alibaba Group Holding Ltd. |
||||||||
| 4.200%, 12/06/47 (b) |
1,400,000 | 1,145,130 | ||||||
| Alphabet, Inc. |
||||||||
| 2.050%, 08/15/50 |
1,100,000 | 690,503 | ||||||
| Amazon.com, Inc. | ||||||||
| 3.150%, 08/22/27 (b) |
1,000,000 | 962,190 | ||||||
| 3.800%, 12/05/24 (b) |
1,800,000 | 1,781,442 | ||||||
| 3.875%, 08/22/37 |
1,900,000 | 1,767,190 | ||||||
| eBay, Inc. |
||||||||
| 3.600%, 06/05/27 (b) |
1,500,000 | 1,452,465 | ||||||
| Meta Platforms, Inc. |
||||||||
| 4.950%, 05/15/33 (b) |
1,500,000 | 1,550,370 | ||||||
|
|
|
|||||||
| 9,349,290 | ||||||||
|
|
|
|||||||
| Investment Companies—0.1% | ||||||||
| ARES Capital Corp. |
||||||||
| 4.250%, 03/01/25 (b) |
900,000 | 878,994 | ||||||
| Blue Owl Capital Corp. |
||||||||
| 3.400%, 07/15/26 |
400,000 | 372,212 | ||||||
|
|
|
|||||||
| 1,251,206 | ||||||||
|
|
|
|||||||
See accompanying notes to financial statements.
BHFTII-15
Brighthouse Funds Trust II
MetLife Aggregate Bond Index Portfolio
Schedule of Investments as of December 31, 2023
Corporate Bonds & Notes—(Continued)
| Security Description | Principal Amount* |
Value | ||||||
| Iron/Steel—0.0% | ||||||||
| Vale Overseas Ltd. | ||||||||
| 6.875%, 11/21/36 |
528,000 | $ | 573,873 | |||||
|
|
|
|||||||
| Lodging—0.1% | ||||||||
| Marriott International, Inc. |
||||||||
| 2.850%, 04/15/31 |
1,100,000 | 955,405 | ||||||
| Sands China Ltd. |
||||||||
| 5.650%, 08/08/28 |
1,000,000 | 991,649 | ||||||
|
|
|
|||||||
| 1,947,054 | ||||||||
|
|
|
|||||||
| Machinery-Construction & Mining—0.1% | ||||||||
| Caterpillar, Inc. |
||||||||
| 3.803%, 08/15/42 |
1,500,000 | 1,321,500 | ||||||
|
|
|
|||||||
| Machinery-Diversified—0.1% | ||||||||
| John Deere Capital Corp. | ||||||||
| 2.000%, 06/17/31 (b) |
1,000,000 | 849,210 | ||||||
| 4.050%, 09/08/25 (b) |
2,000,000 | 1,982,620 | ||||||
|
|
|
|||||||
| 2,831,830 | ||||||||
|
|
|
|||||||
| Media—0.8% | ||||||||
| Charter Communications Operating LLC/Charter Communications Operating Capital |
||||||||
| 3.850%, 04/01/61 |
3,300,000 | 2,075,469 | ||||||
| 6.484%, 10/23/45 |
900,000 | 888,678 | ||||||
| Comcast Corp. | ||||||||
| 3.150%, 03/01/26 (b) |
2,000,000 | 1,942,220 | ||||||
| 3.969%, 11/01/47 |
900,000 | 758,088 | ||||||
| 4.650%, 07/15/42 (b) |
1,670,000 | 1,575,645 | ||||||
| 5.650%, 06/15/35 |
1,500,000 | 1,615,140 | ||||||
| Discovery Communications LLC | ||||||||
| 3.950%, 03/20/28 (b) |
1,100,000 | 1,048,454 | ||||||
| 4.000%, 09/15/55 |
1,481,000 | 1,055,864 | ||||||
| Fox Corp. |
||||||||
| 5.576%, 01/25/49 (b) |
1,000,000 | 961,630 | ||||||
| Paramount Global | ||||||||
| 4.375%, 03/15/43 (b) |
1,500,000 | 1,116,600 | ||||||
| Time Warner Cable LLC |
||||||||
| 6.550%, 05/01/37 |
100,000 | 98,569 | ||||||
| TWDC Enterprises 18 Corp. |
||||||||
| 2.950%, 06/15/27 |
1,000,000 | 960,030 | ||||||
| Walt Disney Co. | ||||||||
| 3.600%, 01/13/51 (b) |
1,000,000 | 806,450 | ||||||
| 6.550%, 03/15/33 (b) |
950,000 | 1,101,174 | ||||||
|
|
|
|||||||
| 16,004,011 | ||||||||
|
|
|
|||||||
| Mining—0.1% | ||||||||
| Newmont Corp. |
||||||||
| 6.250%, 10/01/39 (b) |
1,800,000 | 2,000,142 | ||||||
| Rio Tinto Alcan, Inc. |
||||||||
| 6.125%, 12/15/33 |
751,000 | 822,886 | ||||||
|
|
|
|||||||
| 2,823,028 | ||||||||
|
|
|
|||||||
| Miscellaneous Manufacturing—0.2% | ||||||||
| 3M Co. |
||||||||
| 4.000%, 09/14/48 |
900,000 | 771,354 | ||||||
| GE Capital International Funding Co. Unlimited Co. |
||||||||
| 4.418%, 11/15/35 (b) |
1,459,000 | 1,418,250 | ||||||
| General Electric Co. |
||||||||
| 7.500%, 08/21/35 |
100,000 | 119,204 | ||||||
| Parker-Hannifin Corp. |
||||||||
| 3.250%, 06/14/29 (b) |
900,000 | 847,989 | ||||||
|
|
|
|||||||
| 3,156,797 | ||||||||
|
|
|
|||||||
| Multi-National—1.2% | ||||||||
| Asian Development Bank | ||||||||
| 1.500%, 03/04/31 (b) |
2,000,000 | 1,691,300 | ||||||
| 1.750%, 09/19/29 |
900,000 | 798,642 | ||||||
| 2.625%, 01/30/24 |
2,200,000 | 2,195,292 | ||||||
| Asian Infrastructure Investment Bank | ||||||||
| 0.500%, 05/28/25 (b) |
1,000,000 | 943,870 | ||||||
| 0.500%, 01/27/26 |
50,000 | 46,208 | ||||||
| European Bank for Reconstruction & Development |
||||||||
| 0.500%, 05/19/25 |
1,300,000 | 1,228,448 | ||||||
| European Investment Bank | ||||||||
| 0.375%, 03/26/26 (b) |
2,000,000 | 1,838,620 | ||||||
| 1.875%, 02/10/25 |
1,000,000 | 969,960 | ||||||
| 3.625%, 07/15/30 |
1,000,000 | 979,980 | ||||||
| 4.875%, 02/15/36 (b) |
1,100,000 | 1,179,618 | ||||||
| Inter-American Development Bank | ||||||||
| 2.125%, 01/15/25 |
2,000,000 | 1,946,760 | ||||||
| 2.250%, 06/18/29 |
1,400,000 | 1,281,028 | ||||||
| 2.375%, 07/07/27 |
1,500,000 | 1,418,610 | ||||||
| 7.000%, 06/15/25 |
200,000 | 206,150 | ||||||
| International Bank for Reconstruction & Development | ||||||||
| 0.500%, 10/28/25 |
2,000,000 | 1,864,440 | ||||||
| 1.625%, 11/03/31 |
2,600,000 | 2,194,088 | ||||||
| 2.500%, 07/29/25 |
2,000,000 | 1,939,800 | ||||||
| 3.125%, 06/15/27 |
1,100,000 | 1,066,934 | ||||||
| International Finance Corp. | ||||||||
| 0.375%, 07/16/25 |
25,000 | 23,477 | ||||||
|
|
|
|||||||
| 23,813,225 | ||||||||
|
|
|
|||||||
| Office/Business Equipment—0.1% | ||||||||
| CDW LLC/CDW Finance Corp. | ||||||||
| 4.250%, 04/01/28 (b) |
1,100,000 | 1,054,834 | ||||||
|
|
|
|||||||
| Oil & Gas—0.8% | ||||||||
| BP Capital Markets America, Inc. | ||||||||
| 2.721%, 01/12/32 (b) |
1,000,000 | 873,640 | ||||||
| 3.000%, 02/24/50 |
1,000,000 | 712,280 | ||||||
| Canadian Natural Resources Ltd. |
||||||||
| 6.250%, 03/15/38 (b) |
800,000 | 840,312 | ||||||
| Chevron Corp. |
||||||||
| 2.954%, 05/16/26 (b) |
1,500,000 | 1,451,190 | ||||||
| ConocoPhillips Co. | ||||||||
| 5.300%, 05/15/53 |
1,000,000 | 1,031,650 | ||||||
| 6.950%, 04/15/29 |
700,000 | 780,808 | ||||||
See accompanying notes to financial statements.
BHFTII-16
Brighthouse Funds Trust II
MetLife Aggregate Bond Index Portfolio
Schedule of Investments as of December 31, 2023
Corporate Bonds & Notes—(Continued)
| Security Description | Principal Amount* |
Value | ||||||
| Oil & Gas—(Continued) | ||||||||
| Equinor ASA |
||||||||
| 3.250%, 11/10/24 (b) |
1,100,000 | $ | 1,081,839 | |||||
| Exxon Mobil Corp. |
||||||||
| 4.114%, 03/01/46 (b) |
1,600,000 | 1,430,608 | ||||||
| Marathon Oil Corp. |
||||||||
| 6.600%, 10/01/37 (b) |
1,000,000 | 1,060,760 | ||||||
| Marathon Petroleum Corp. |
||||||||
| 4.700%, 05/01/25 (b) |
600,000 | 596,004 | ||||||
| Occidental Petroleum Corp. |
||||||||
| 6.450%, 09/15/36 (b) |
1,000,000 | 1,060,940 | ||||||
| Phillips 66 |
||||||||
| 4.875%, 11/15/44 (b) |
1,000,000 | 960,780 | ||||||
| Shell International Finance BV | ||||||||
| 2.375%, 11/07/29 (b) |
2,000,000 | 1,802,580 | ||||||
| 3.250%, 04/06/50 (b) |
900,000 | 679,257 | ||||||
| TotalEnergies Capital International SA |
||||||||
| 3.127%, 05/29/50 (b) |
900,000 | 665,136 | ||||||
| Valero Energy Corp. |
||||||||
| 3.400%, 09/15/26 |
200,000 | 192,078 | ||||||
|
|
|
|||||||
| 15,219,862 | ||||||||
|
|
|
|||||||
| Oil & Gas Services—0.1% | ||||||||
| Halliburton Co. |
||||||||
| 5.000%, 11/15/45 (b) |
1,200,000 | 1,164,732 | ||||||
|
|
|
|||||||
| Packaging & Containers—0.0% | ||||||||
| WRKCo, Inc. |
||||||||
| 3.000%, 06/15/33 (b) |
600,000 | 518,064 | ||||||
|
|
|
|||||||
| Pharmaceuticals—1.4% | ||||||||
| AbbVie, Inc. | ||||||||
| 3.800%, 03/15/25 (b) |
400,000 | 394,996 | ||||||
| 4.050%, 11/21/39 |
1,300,000 | 1,177,657 | ||||||
| 4.400%, 11/06/42 (b) |
1,100,000 | 1,023,264 | ||||||
| AstraZeneca PLC |
||||||||
| 4.000%, 09/18/42 (b) |
1,200,000 | 1,093,380 | ||||||
| Becton Dickinson & Co. |
||||||||
| 4.669%, 06/06/47 |
2,000,000 | 1,870,400 | ||||||
| Bristol-Myers Squibb Co. | ||||||||
| 3.400%, 07/26/29 (b) |
1,000,000 | 949,250 | ||||||
| 3.700%, 03/15/52 (b) |
1,300,000 | 1,022,723 | ||||||
| Cardinal Health, Inc. |
||||||||
| 3.410%, 06/15/27 (b) |
800,000 | 768,536 | ||||||
| Cigna Group | ||||||||
| 2.375%, 03/15/31 |
1,500,000 | 1,282,140 | ||||||
| 4.500%, 02/25/26 |
1,200,000 | 1,191,456 | ||||||
| 6.125%, 11/15/41 |
313,000 | 343,821 | ||||||
| CVS Health Corp. | ||||||||
| 4.300%, 03/25/28 (b) |
544,000 | 535,350 | ||||||
| 4.780%, 03/25/38 |
1,500,000 | 1,422,270 | ||||||
| 5.050%, 03/25/48 (b) |
1,500,000 | 1,409,040 | ||||||
| 5.125%, 07/20/45 |
900,000 | 854,631 | ||||||
| GlaxoSmithKline Capital, Inc. |
||||||||
| 3.875%, 05/15/28 (b) |
1,000,000 | 987,290 | ||||||
| Pharmaceuticals —(Continued) | ||||||||
| Johnson & Johnson | ||||||||
| 3.700%, 03/01/46 |
1,000,000 | 876,050 | ||||||
| 5.950%, 08/15/37 |
910,000 | 1,051,906 | ||||||
| Merck & Co., Inc. |
||||||||
| 6.550%, 09/15/37 |
1,000,000 | 1,171,540 | ||||||
| Merck Sharp & Dohme Corp. |
||||||||
| 5.950%, 12/01/28 |
300,000 | 321,468 | ||||||
| Novartis Capital Corp. |
||||||||
| 2.200%, 08/14/30 (b) |
1,900,000 | 1,675,420 | ||||||
| Pfizer Investment Enterprises Pte. Ltd. |
||||||||
| 5.340%, 05/19/63 (b) |
2,000,000 | 2,025,740 | ||||||
| Pfizer, Inc. |
||||||||
| 3.600%, 09/15/28 (b) |
2,100,000 | 2,046,555 | ||||||
| Shire Acquisitions Investments Ireland DAC |
||||||||
| 3.200%, 09/23/26 |
2,000,000 | 1,925,080 | ||||||
|
|
|
|||||||
| 27,419,963 | ||||||||
|
|
|
|||||||
| Pipelines—0.9% | ||||||||
| El Paso Natural Gas Co. LLC |
||||||||
| 8.375%, 06/15/32 (b) |
220,000 | 256,645 | ||||||
| Enbridge Energy Partners LP |
||||||||
| 5.875%, 10/15/25 (b) |
2,000,000 | 2,021,960 | ||||||
| Energy Transfer LP |
||||||||
| 5.150%, 03/15/45 (b) |
2,600,000 | 2,388,776 | ||||||
| Enterprise Products Operating LLC | ||||||||
| 3.200%, 02/15/52 |
1,100,000 | 805,244 | ||||||
| 3.950%, 02/15/27 (b) |
1,300,000 | 1,280,500 | ||||||
| Kinder Morgan Energy Partners LP |
||||||||
| 6.500%, 02/01/37 |
2,000,000 | 2,111,040 | ||||||
| MPLX LP |
||||||||
| 5.200%, 03/01/47 (b) |
1,000,000 | 930,410 | ||||||
| ONEOK, Inc. |
||||||||
| 3.100%, 03/15/30 (b) |
1,100,000 | 989,175 | ||||||
| Sabine Pass Liquefaction LLC |
||||||||
| 5.875%, 06/30/26 |
1,600,000 | 1,628,288 | ||||||
| TransCanada PipeLines Ltd. |
||||||||
| 6.200%, 10/15/37 |
1,800,000 | 1,921,986 | ||||||
| Western Midstream Operating LP |
||||||||
| 4.050%, 02/01/30 (b) |
1,100,000 | 1,030,579 | ||||||
| Williams Cos., Inc. |
||||||||
| 3.750%, 06/15/27 |
1,500,000 | 1,446,435 | ||||||
|
|
|
|||||||
| 16,811,038 | ||||||||
|
|
|
|||||||
| Real Estate Investment Trusts—0.8% | ||||||||
| Alexandria Real Estate Equities, Inc. |
||||||||
| 3.550%, 03/15/52 |
1,100,000 | 804,353 | ||||||
| American Tower Corp. |
||||||||
| 5.900%, 11/15/33 |
900,000 | 955,377 | ||||||
| AvalonBay Communities, Inc. |
||||||||
| 2.300%, 03/01/30 (b) |
200,000 | 174,578 | ||||||
| Boston Properties LP |
||||||||
| 3.200%, 01/15/25 (b) |
1,400,000 | 1,361,150 | ||||||
| Brixmor Operating Partnership LP |
||||||||
| 4.050%, 07/01/30 (b) |
900,000 | 845,640 | ||||||
See accompanying notes to financial statements.
BHFTII-17
Brighthouse Funds Trust II
MetLife Aggregate Bond Index Portfolio
Schedule of Investments as of December 31, 2023
Corporate Bonds & Notes—(Continued)
| Security Description | Principal Amount* |
Value | ||||||
| Real Estate Investment Trusts —(Continued) | ||||||||
| Crown Castle, Inc. |
||||||||
| 3.800%, 02/15/28 |
1,500,000 | $ | 1,426,455 | |||||
| Digital Realty Trust LP |
||||||||
| 3.700%, 08/15/27 (b) |
1,500,000 | 1,449,540 | ||||||
| Equinix, Inc. |
||||||||
| 3.200%, 11/18/29 (b) |
700,000 | 644,378 | ||||||
| ERP Operating LP |
||||||||
| 3.000%, 07/01/29 |
1,000,000 | 924,090 | ||||||
| Essex Portfolio LP |
||||||||
| 3.000%, 01/15/30 (b) |
1,000,000 | 892,420 | ||||||
| Healthpeak OP LLC |
||||||||
| 3.500%, 07/15/29 |
900,000 | 840,015 | ||||||
| NNN REIT, Inc. |
||||||||
| 2.500%, 04/15/30 (b) |
1,000,000 | 860,820 | ||||||
| Prologis LP |
||||||||
| 3.375%, 12/15/27 (b) |
500,000 | 477,595 | ||||||
| Public Storage Operating Co. |
||||||||
| 3.094%, 09/15/27 |
500,000 | 476,715 | ||||||
| Simon Property Group LP |
||||||||
| 3.300%, 01/15/26 (b) |
1,800,000 | 1,745,910 | ||||||
| Sun Communities Operating LP |
||||||||
| 5.700%, 01/15/33 |
700,000 | 712,012 | ||||||
| Welltower OP LLC |
||||||||
| 4.000%, 06/01/25 (b) |
750,000 | 736,657 | ||||||
|
|
|
|||||||
| 15,327,705 | ||||||||
|
|
|
|||||||
| Retail—0.6% | ||||||||
| Home Depot, Inc. | ||||||||
| 3.000%, 04/01/26 (b) |
1,800,000 | 1,745,784 | ||||||
| 4.250%, 04/01/46 |
2,000,000 | 1,815,020 | ||||||
| Lowe’s Cos., Inc. | ||||||||
| 4.250%, 04/01/52 |
1,100,000 | 932,393 | ||||||
| 5.625%, 04/15/53 (b) |
1,000,000 | 1,050,410 | ||||||
| McDonald’s Corp. |
||||||||
| 4.875%, 12/09/45 |
1,500,000 | 1,475,475 | ||||||
| Starbucks Corp. | ||||||||
| 3.550%, 08/15/29 (b) |
1,000,000 | 965,060 | ||||||
| Target Corp. | ||||||||
| 2.650%, 09/15/30 |
1,400,000 | 1,256,808 | ||||||
| Walmart, Inc. | ||||||||
| 3.900%, 09/09/25 (b) |
1,000,000 | 991,080 | ||||||
| 4.050%, 06/29/48 (b) |
900,000 | 824,967 | ||||||
| 5.250%, 09/01/35 |
935,000 | 1,022,600 | ||||||
|
|
|
|||||||
| 12,079,597 | ||||||||
|
|
|
|||||||
| Semiconductors—0.5% | ||||||||
| Broadcom, Inc. | ||||||||
| 3.137%, 11/15/35 (144A) |
1,600,000 | 1,315,568 | ||||||
| 4.300%, 11/15/32 (b) |
1,700,000 | 1,633,207 | ||||||
| Intel Corp. | ||||||||
| 4.750%, 03/25/50 (b) |
1,800,000 | 1,710,828 | ||||||
| 4.900%, 08/05/52 (b) |
1,000,000 | 980,960 | ||||||
| NVIDIA Corp. | ||||||||
| 2.850%, 04/01/30 (b) |
1,100,000 | 1,018,787 | ||||||
| Semiconductors—(Continued) | ||||||||
| QUALCOMM, Inc. |
||||||||
| 1.650%, 05/20/32 (b) |
2,333,000 | 1,904,755 | ||||||
| Texas Instruments, Inc. |
||||||||
| 2.250%, 09/04/29 (b) |
1,000,000 | 903,010 | ||||||
|
|
|
|||||||
| 9,467,115 | ||||||||
|
|
|
|||||||
| Software—0.7% | ||||||||
| Fidelity National Information Services, Inc. |
||||||||
| 1.150%, 03/01/26 (b) |
1,000,000 | 924,510 | ||||||
| Microsoft Corp. | ||||||||
| 3.125%, 11/03/25 (b) |
2,600,000 | 2,540,434 | ||||||
| 4.250%, 02/06/47 (b) |
2,000,000 | 1,940,180 | ||||||
| Oracle Corp. | ||||||||
| 2.875%, 03/25/31 (b) |
3,000,000 | 2,659,650 | ||||||
| 2.950%, 11/15/24 |
1,300,000 | 1,271,101 | ||||||
| 2.950%, 04/01/30 (b) |
1,200,000 | 1,084,044 | ||||||
| 3.850%, 04/01/60 |
2,100,000 | 1,532,433 | ||||||
| Salesforce, Inc. |
||||||||
| 2.900%, 07/15/51 (b) |
1,000,000 | 718,040 | ||||||
|
|
|
|||||||
| 12,670,392 | ||||||||
|
|
|
|||||||
| Telecommunications—1.1% | ||||||||
| America Movil SAB de CV |
||||||||
| 2.875%, 05/07/30 (b) |
1,000,000 | 890,870 | ||||||
| AT&T, Inc. | ||||||||
| 3.500%, 09/15/53 |
1,221,000 | 889,987 | ||||||
| 3.650%, 09/15/59 |
2,686,000 | 1,932,228 | ||||||
| 4.100%, 02/15/28 (b) |
1,687,000 | 1,650,443 | ||||||
| 5.150%, 11/15/46 (b) |
1,308,000 | 1,262,652 | ||||||
| 7.125%, 12/15/31 |
100,000 | 111,746 | ||||||
| Cisco Systems, Inc. |
||||||||
| 5.500%, 01/15/40 |
1,000,000 | 1,067,660 | ||||||
| Deutsche Telekom International Finance BV |
||||||||
| 8.750%, 06/15/30 |
300,000 | 361,761 | ||||||
| Orange SA |
||||||||
| 5.500%, 02/06/44 (b) |
500,000 | 520,995 | ||||||
| Rogers Communications, Inc. |
||||||||
| 2.900%, 11/15/26 (b) |
1,100,000 | 1,044,934 | ||||||
| Sprint LLC |
||||||||
| 7.625%, 03/01/26 (b) |
900,000 | 939,960 | ||||||
| T-Mobile USA, Inc. | ||||||||
| 2.550%, 02/15/31 |
2,200,000 | 1,896,334 | ||||||
| 3.300%, 02/15/51 |
1,500,000 | 1,089,240 | ||||||
| 4.750%, 02/01/28 (b) |
1,000,000 | 996,510 | ||||||
| Telefonica Emisiones SA |
||||||||
| 4.103%, 03/08/27 |
900,000 | 882,279 | ||||||
| Verizon Communications, Inc. | ||||||||
| 2.875%, 11/20/50 |
1,900,000 | 1,292,741 | ||||||
| 3.376%, 02/15/25 (b) |
1,078,000 | 1,058,175 | ||||||
| 3.550%, 03/22/51 (b) |
1,000,000 | 770,970 | ||||||
| 4.812%, 03/15/39 (b) |
1,927,000 | 1,866,338 | ||||||
| Vodafone Group PLC |
||||||||
| 6.150%, 02/27/37 (b) |
1,000,000 | 1,084,630 | ||||||
|
|
|
|||||||
| 21,610,453 | ||||||||
|
|
|
|||||||
See accompanying notes to financial statements.
BHFTII-18
Brighthouse Funds Trust II
MetLife Aggregate Bond Index Portfolio
Schedule of Investments as of December 31, 2023
Corporate Bonds & Notes—(Continued)
| Security Description | Principal Amount* |
Value | ||||||
| Transportation—0.5% | ||||||||
| Burlington Northern Santa Fe LLC |
||||||||
| 4.150%, 04/01/45 |
1,900,000 | $ | 1,693,736 | |||||
| Canadian National Railway Co. |
||||||||
| 4.450%, 01/20/49 (b) |
400,000 | 372,096 | ||||||
| Canadian Pacific Railway Co. |
||||||||
| 2.450%, 12/02/31 (b) |
1,100,000 | 1,021,284 | ||||||
| CSX Corp. |
||||||||
| 6.150%, 05/01/37 |
800,000 | 895,096 | ||||||
| FedEx Corp. |
||||||||
| 4.550%, 04/01/46 (b) |
1,000,000 | 897,590 | ||||||
| Norfolk Southern Corp. | ||||||||
| 2.550%, 11/01/29 (b) |
1,000,000 | 899,470 | ||||||
| 5.590%, 05/17/25 |
28,000 | 28,192 | ||||||
| Union Pacific Corp. | ||||||||
| 2.891%, 04/06/36 (b) |
1,200,000 | 1,010,520 | ||||||
| 3.250%, 02/05/50 (b) |
1,300,000 | 996,424 | ||||||
| United Parcel Service, Inc. |
||||||||
| 4.450%, 04/01/30 (b) |
1,600,000 | 1,618,176 | ||||||
|
|
|
|||||||
| 9,432,584 | ||||||||
|
|
|
|||||||
| Water—0.0% | ||||||||
| American Water Capital Corp. |
||||||||
| 3.750%, 09/01/28 (b) |
900,000 | 867,321 | ||||||
|
|
|
|||||||
| Total Corporate Bonds & Notes |
501,381,660 | |||||||
|
|
|
|||||||
| Foreign Government—1.6% |
| |||||||
| Provincial—0.3% | ||||||||
| Province of Alberta |
||||||||
| 1.000%, 05/20/25 (b) |
1,500,000 | 1,425,180 | ||||||
| Province of British Columbia |
||||||||
| 1.300%, 01/29/31 (b) |
1,000,000 | 828,250 | ||||||
| Province of Ontario |
||||||||
| 3.050%, 01/29/24 |
1,000,000 | 998,180 | ||||||
| Province of Quebec |
||||||||
| 2.500%, 04/20/26 (b) |
2,000,000 | 1,919,980 | ||||||
|
|
|
|||||||
| 5,171,590 | ||||||||
|
|
|
|||||||
| Sovereign—1.3% | ||||||||
| Canada Government International Bond |
||||||||
| 1.625%, 01/22/25 (b) |
1,000,000 | 969,000 | ||||||
| Chile Government International Bonds | ||||||||
| 3.100%, 01/22/61 |
1,200,000 | 802,716 | ||||||
| 3.500%, 01/25/50 (b) |
1,000,000 | 759,710 | ||||||
| Export-Import Bank of Korea |
||||||||
| 2.875%, 01/21/25 |
1,400,000 | 1,372,070 | ||||||
| Indonesia Government International Bonds | ||||||||
| 3.050%, 03/12/51 |
1,100,000 | 839,674 | ||||||
| 3.850%, 10/15/30 (b) |
700,000 | 667,744 | ||||||
| Israel Government AID Bond |
||||||||
| 5.500%, 09/18/33 |
200,000 | 219,860 | ||||||
| Israel Government International Bond |
||||||||
| 4.125%, 01/17/48 |
1,000,000 | 807,680 | ||||||
| Sovereign—(Continued) | ||||||||
| Japan Bank for International Cooperation | ||||||||
| 2.500%, 05/23/24 (b) |
1,900,000 | 1,878,378 | ||||||
| 4.625%, 07/19/28 (b) |
1,600,000 | 1,622,320 | ||||||
| Mexico Government International Bonds | ||||||||
| 4.600%, 01/23/46 |
1,100,000 | 917,565 | ||||||
| 4.750%, 03/08/44 |
900,000 | 772,578 | ||||||
| 5.750%, 10/12/10 |
1,000,000 | 894,330 | ||||||
| 6.750%, 09/27/34 |
1,050,000 | 1,135,816 | ||||||
| Panama Government International Bonds | ||||||||
| 3.875%, 03/17/28 |
900,000 | 830,637 | ||||||
| 4.500%, 05/15/47 |
1,400,000 | 993,314 | ||||||
| Peru Government International Bond |
||||||||
| 8.750%, 11/21/33 |
1,450,000 | 1,821,838 | ||||||
| Philippines Government International Bonds | ||||||||
| 3.950%, 01/20/40 (b) |
1,100,000 | 995,071 | ||||||
| 5.000%, 01/13/37 |
1,740,000 | 1,781,064 | ||||||
| Republic of Italy Government International Bond |
||||||||
| 2.875%, 10/17/29 (b) |
2,000,000 | 1,793,520 | ||||||
| Republic of Poland Government International Bond |
||||||||
| 3.250%, 04/06/26 (b) |
1,000,000 | 968,780 | ||||||
| Svensk Exportkredit AB |
||||||||
| 0.625%, 05/14/25 |
1,000,000 | 945,580 | ||||||
| Uruguay Government International Bond |
||||||||
| 4.375%, 10/27/27 |
900,000 | 906,219 | ||||||
|
|
|
|||||||
| 24,695,464 | ||||||||
|
|
|
|||||||
| Total Foreign Government |
29,867,054 | |||||||
|
|
|
|||||||
| Mortgage-Backed Securities—0.8% |
| |||||||
| Commercial Mortgage-Backed Securities—0.8% | ||||||||
| BANK |
||||||||
| 2.556%, 05/15/64 |
2,000,000 | 1,693,881 | ||||||
| 2.758%, 09/15/62 |
375,944 | 324,678 | ||||||
| 4.407%, 11/15/61 (a) |
881,000 | 856,760 | ||||||
| BANK5 |
||||||||
| 6.260%, 04/15/56 (a) |
1,000,000 | 1,037,743 | ||||||
| BBCMS Mortgage Trust |
||||||||
| 3.662%, 04/15/55 (a) |
2,230,000 | 2,022,268 | ||||||
| Benchmark Mortgage Trust |
915,000 | 860,001 | ||||||
| CD Mortgage Trust |
||||||||
| 3.631%, 02/10/50 |
950,000 | 882,741 | ||||||
| CFCRE Commercial Mortgage Trust |
||||||||
| 3.585%, 12/10/54 |
787,393 | 746,736 | ||||||
| COMM Mortgage Trust |
||||||||
| 3.765%, 02/10/49 |
1,539,000 | 1,482,802 | ||||||
| JPMBB Commercial Mortgage Securities Trust |
||||||||
| 3.598%, 11/15/48 |
400,000 | 381,447 | ||||||
| 3.801%, 08/15/48 |
445,564 | 428,039 | ||||||
| Morgan Stanley Bank of America Merrill Lynch Trust |
||||||||
| 3.544%, 01/15/49 |
1,350,000 | 1,283,932 | ||||||
| 3.635%, 10/15/48 |
1,547,000 | 1,491,714 | ||||||
| 3.732%, 05/15/48 |
750,000 | 725,988 | ||||||
See accompanying notes to financial statements.
BHFTII-19
Brighthouse Funds Trust II
MetLife Aggregate Bond Index Portfolio
Schedule of Investments as of December 31, 2023
Mortgage-Backed Securities—(Continued)
| Security Description | Principal Amount* |
Value | ||||||
| Commercial Mortgage-Backed Securities—(Continued) | ||||||||
| UBS Commercial Mortgage Trust |
||||||||
| 3.035%, 12/15/52 |
2,250,000 | $ | 2,002,691 | |||||
|
|
|
|||||||
| Total Mortgage-Backed Securities |
16,221,421 | |||||||
|
|
|
|||||||
| Municipals—0.5% |
| |||||||
| Chicago O’Hare International Airport |
| |||||||
| 4.572%, 01/01/54 |
395,000 | 377,512 | ||||||
| Los Angeles Unified School District, General Obligation Unlimited |
||||||||
| 6.758%, 07/01/34 |
660,000 | 745,495 | ||||||
| Municipal Electric Authority of Georgia |
||||||||
| 6.637%, 04/01/57 |
1,902,000 | 2,170,343 | ||||||
| New Jersey Turnpike Authority |
||||||||
| 7.414%, 01/01/40 |
1,000,000 | 1,245,974 | ||||||
| New York City Municipal Water Finance Authority |
||||||||
| 5.440%, 06/15/43 |
300,000 | 317,344 | ||||||
| Port Authority of New York & New Jersey |
||||||||
| 4.458%, 10/01/62 |
1,500,000 | 1,368,697 | ||||||
| Regents of the University of California Medical Center Pooled Revenue |
||||||||
| 3.006%, 05/15/50 |
1,000,000 | 707,895 | ||||||
| State of California, General Obligation Unlimited |
||||||||
| 7.300%, 10/01/39 |
1,200,000 | 1,450,793 | ||||||
| State of Illinois, General Obligation Unlimited |
||||||||
| 5.100%, 06/01/33 |
1,230,000 | 1,217,011 | ||||||
| Texas Natural Gas Securitization Finance Corp. |
||||||||
| 5.169%, 04/01/41 |
450,000 | 465,025 | ||||||
|
|
|
|||||||
| Total Municipals |
10,066,089 | |||||||
|
|
|
|||||||
| Asset-Backed Securities—0.3% |
| |||||||
| Asset-Backed - Automobile—0.1% | ||||||||
| CarMax Auto Owner Trust | ||||||||
| 0.740%, 01/15/27 |
1,085,000 | 1,011,432 | ||||||
| 2.030%, 06/16/25 |
621,808 | 618,107 | ||||||
|
|
|
|||||||
| 1,629,539 | ||||||||
|
|
|
|||||||
| Asset-Backed - Credit Card—0.1% | ||||||||
| Capital One Multi-Asset Execution Trust | ||||||||
| 2.060%, 08/15/28 |
1,865,000 | 1,746,798 | ||||||
| 4.420%, 05/15/28 |
2,000,000 | 1,990,766 | ||||||
|
|
|
|||||||
| 3,737,564 | ||||||||
|
|
|
|||||||
| Asset-Backed - Other—0.1% | ||||||||
| Verizon Master Trust |
||||||||
| 0.990%, 04/20/28 |
1,000,000 | 965,879 | ||||||
|
|
|
|||||||
| Total Asset-Backed Securities |
6,332,982 | |||||||
|
|
|
|||||||
| Short-Term Investments—0.6% |
| |||||||
| Security Description | Principal Amount* |
Value | ||||||
| U.S. Treasury—0.6% | ||||||||
| U.S. Treasury Bills | ||||||||
| 4.666%, 01/09/24 (c) |
400,000 | 399,595 | ||||||
| 5.194%, 02/06/24 (c) |
11,000,000 | 10,943,642 | ||||||
|
|
|
|||||||
| Total Short-Term Investments |
11,343,237 | |||||||
|
|
|
|||||||
| Securities Lending Reinvestments (d)—13.2% |
| |||||||
| Certificates of Deposit—2.2% | ||||||||
| Bank of America NA |
||||||||
| 5.730%, SOFR + 0.340%, 03/08/24 (a) |
2,000,000 | 2,000,458 | ||||||
| Barclays Bank PLC | ||||||||
| 5.710%, SOFR + 0.320%, 06/20/24 (a) |
3,000,000 | 2,999,991 | ||||||
| 5.790%, SOFR + 0.400%, 02/14/24 (a) |
5,000,000 | 5,001,410 | ||||||
| Citibank NA |
||||||||
| 5.740%, SOFR + 0.350%, 02/20/24 (a) |
3,000,000 | 3,000,738 | ||||||
| MUFG Bank Ltd. (London) | ||||||||
| Zero Coupon, 06/04/24 |
1,000,000 | 976,630 | ||||||
| Zero Coupon, 06/10/24 |
1,000,000 | 975,750 | ||||||
| National Westminster Bank PLC |
||||||||
| 5.880%, 05/02/24 |
3,000,000 | 3,004,860 | ||||||
| Oversea-Chinese Banking Corp. Ltd. |
||||||||
| 5.630%, SOFR + 0.240%, 02/09/24 (a) |
5,000,000 | 5,000,520 | ||||||
| Royal Bank of Canada |
||||||||
| 5.880%, FEDEFF PRV + 0.550%, 09/20/24 (a) |
5,000,000 | 5,003,100 | ||||||
| Standard Chartered Bank |
||||||||
| 5.770%, SOFR + 0.370%, 03/12/24 (a) |
3,000,000 | 3,001,243 | ||||||
| Sumitomo Mitsui Trust Bank Ltd. |
||||||||
| Zero Coupon, 02/27/24 |
1,500,000 | 1,486,575 | ||||||
| Svenska Handelsbanken AB |
||||||||
| 5.910%, SOFR + 0.520%, 04/19/24 (a) |
6,000,000 | 6,004,962 | ||||||
| Westpac Banking Corp. |
||||||||
| 5.950%, SOFR + 0.550%, 10/11/24 (a) |
3,000,000 | 3,003,717 | ||||||
|
|
|
|||||||
| 41,459,954 | ||||||||
|
|
|
|||||||
| Commercial Paper—0.4% | ||||||||
| ING U.S. Funding LLC |
||||||||
| 5.870%, SOFR + 0.480%, 06/13/24 (a) |
3,000,000 | 3,001,632 | ||||||
| Old Line Funding LLC | ||||||||
| 5.560%, 02/09/24 |
2,000,000 | 1,987,044 | ||||||
| 5.620%, SOFR + 0.230%, 03/11/24 (a) |
2,000,000 | 2,000,000 | ||||||
|
|
|
|||||||
| 6,988,676 | ||||||||
|
|
|
|||||||
| Repurchase Agreements—8.0% | ||||||||
| Bank of Nova Scotia |
14,332,000 | 14,332,000 | ||||||
See accompanying notes to financial statements.
BHFTII-20
Brighthouse Funds Trust II
MetLife Aggregate Bond Index Portfolio
Schedule of Investments as of December 31, 2023
Securities Lending Reinvestments (d)—(Continued)
| Security Description | Principal Amount* |
Value | ||||||
| Repurchase Agreements—(Continued) | ||||||||
| Barclays Bank PLC | ||||||||
| Repurchase Agreement dated 12/29/23 at 5.330%, due on 01/02/24 with a maturity value of $3,001,777; collateralized by U.S. Treasury Obligations with rates ranging from 0.000% - 5.500%, maturity dates ranging from 01/31/24 - 05/15/48, and an aggregate market value of $3,061,678. |
3,000,000 | $ | 3,000,000 | |||||
| Repurchase Agreement dated 12/29/23 at 5.450%, due on 01/02/24 with a maturity value of $2,785,863; collateralized by various Common Stock with an aggregate market value of $3,103,833. |
2,784,177 | 2,784,177 | ||||||
| Repurchase Agreement dated 12/29/23 at 5.670%, due on 04/02/24 with a maturity value of $10,149,625; collateralized by various Common Stock with an aggregate market value of $11,143,970. |
10,000,000 | 10,000,000 | ||||||
| Citigroup Global Markets, Inc. |
6,000,000 | 6,000,000 | ||||||
| Deutsche Bank Securities, Inc. |
583,133 | 583,133 | ||||||
| National Bank of Canada |
50,000,000 | 50,000,000 | ||||||
| NBC Global Finance Ltd. |
33,600,000 | 33,600,000 | ||||||
| Royal Bank of Canada Toronto |
8,000,000 | 8,000,000 | ||||||
| Societe Generale | ||||||||
| Repurchase Agreement dated 12/29/23 at 5.330%, due on 01/02/24 with a maturity value of $10,005,922; collateralized by U.S. Treasury Obligations with rates ranging from 0.625% - 4.750%, maturity dates ranging from 04/15/26 - 08/15/51, and an aggregate market value of $10,222,653. |
10,000,000 | 10,000,000 | ||||||
| Repurchase Agreement dated 12/29/23 at 5.330%, due on 01/02/24 with a maturity value of $200,118; collateralized by U.S. Treasury Obligations with rates ranging from 0.625% - 5.240%, maturity dates ranging from 04/30/24 - 05/15/32, and an aggregate market value of $204,000. |
200,000 | 200,000 | ||||||
| Repurchase Agreements—(Continued) | ||||||||
| Societe Generale | ||||||||
| Repurchase Agreement dated 12/29/23 at 5.510%, due on 01/02/24 with a maturity value of $600,367; collateralized by various Common Stock with an aggregate market value of $667,880. |
600,000 | 600,000 | ||||||
| TD Prime Services LLC |
13,660,000 | 13,660,000 | ||||||
|
|
|
|||||||
| 152,759,310 | ||||||||
|
|
|
|||||||
| Time Deposits—0.8% | ||||||||
| DZ Bank AG (NY) |
||||||||
| 5.300%, 01/02/24 |
2,000,000 | 2,000,000 | ||||||
| First Abu Dhabi Bank USA NV |
||||||||
| 5.320%, 01/02/24 |
7,000,000 | 7,000,000 | ||||||
| National Bank of Canada |
||||||||
| 5.370%, OBFR + 0.050%, 01/05/24 (a) |
5,000,000 | 5,000,000 | ||||||
| 5.390%, OBFR + 0.070%, 01/05/24 (a) |
2,000,000 | 2,000,000 | ||||||
|
|
|
|||||||
| 16,000,000 | ||||||||
|
|
|
|||||||
| Mutual Funds—1.8% | ||||||||
| BlackRock Liquidity Funds FedFund, Institutional Shares |
5,000,000 | 5,000,000 | ||||||
| Dreyfus Treasury Obligations Cash Management Fund, Institutional Class 5.250% (e) |
5,000,000 | 5,000,000 | ||||||
| Fidelity Investments Money Market Government Portfolio, Class I 5.250% (e) |
3,000,000 | 3,000,000 | ||||||
| Fidelity Investments Money Market Government Portfolio, Institutional Class 5.290% (e) |
1,000,000 | 1,000,000 | ||||||
| Goldman Sachs Financial Square Government Fund, Institutional Shares 5.230% (e) |
5,000,000 | 5,000,000 | ||||||
| HSBC U.S. Government Money Market Fund, Class I 5.300% (e) |
1,010,185 | 1,010,185 | ||||||
| Morgan Stanley Liquidity Funds Government Portfolio, Institutional Shares 5.270% (e) |
2,000,000 | 2,000,000 | ||||||
| RBC U.S. Government Money Market Fund, Institutional Share |
5,000,000 | 5,000,000 | ||||||
| STIT-Government & Agency Portfolio, Institutional Class |
5,000,000 | 5,000,000 | ||||||
| Western Asset Institutional Government Reserves Fund, Institutional Class 5.270% (e) |
2,950,000 | 2,950,000 | ||||||
|
|
|
|||||||
| 34,960,185 | ||||||||
|
|
|
|||||||
| Total Securities Lending Reinvestments |
252,168,125 | |||||||
|
|
|
|||||||
| Total Investments— 112.6% |
2,157,943,801 | |||||||
| Other assets and liabilities (net)—(12.6)% |
(242,308,432 | ) | ||||||
|
|
|
|||||||
| Net Assets—100.0% | $ | 1,915,635,369 | ||||||
|
|
|
|||||||
| * | Principal amount stated in U.S. dollars unless otherwise noted. | |||
| (a) | Variable or floating rate security. The stated rate represents the rate at December 31, 2023. Maturity date shown for callable securities reflects the earliest possible call date. For securities based on a published reference index and spread, the index and spread are indicated in the description above. For certain variable rate securities, the coupon | |||
See accompanying notes to financial statements.
BHFTII-21
Brighthouse Funds Trust II
MetLife Aggregate Bond Index Portfolio
Schedule of Investments as of December 31, 2023
| rate is determined by the issuer/agent based on current market conditions. For certain asset-and mortgage-backed securities, the coupon rate may fluctuate based on changes of the underlying collateral or prepayments of principal. These securities do not indicate a reference index and spread in their description above. | ||||
| (b) | All or a portion of the security was held on loan. As of December 31, 2023, the market value of securities loaned was $291,326,237 and the collateral received consisted of cash in the amount of $252,114,807 and non-cash collateral with a value of $49,235,202. The cash collateral investments are disclosed in the Schedule of Investments and categorized as Securities Lending Reinvestments. The non-cash collateral received consists of U.S. government securities that are held in safe-keeping by the lending agent, or a third-party custodian, and cannot be sold or repledged by the Portfolio. As such, this collateral is excluded from the Statement of Assets and Liabilities. | |||
| (c) | The rate shown represents current yield to maturity. | |||
| (d) | Represents investment of cash collateral received from securities on loan as of December 31, 2023. | |||
| (e) | The rate shown represents the annualized seven-day yield as of December 31, 2023. | |||
| (144A) | Securities exempt from registration under Rule 144A of the Securities Act of 1933. These securities may be resold in transactions exempt from registration, normally to qualified institutional buyers. As of December 31, 2023, the market value of 144A securities was $1,315,568, which is 0.1% of net assets. | |||
Glossary of Abbreviations
Index Abbreviations
| (FEDEFF PRV)— | Effective Federal Funds Rate | |||
| (H15)— | U.S. Treasury Yield Curve Rate T-Note Constant Maturity Index | |||
| (OBFR)— | U.S. Overnight Bank Funding Rate | |||
| (SOFR)— | Secured Overnight Financing Rate | |||
| (TSFR)— | Term Secured Financing Rate | |||
Other Abbreviations
| (ACES)— | Alternative Credit Enhancement Securities | |||
| (DAC)— | Designated Activity Company | |||
| (REIT)— | Real Estate Investment Trust | |||
See accompanying notes to financial statements.
BHFTII-22
Brighthouse Funds Trust II
MetLife Aggregate Bond Index Portfolio
Schedule of Investments as of December 31, 2023
Fair Value Hierarchy
Accounting principles generally accepted in the United States of America (“GAAP”) define fair market value as the price that the Portfolio would receive to sell an asset or pay to transfer a liability in an orderly transaction between market participants at the measurement date. It establishes a fair value hierarchy that prioritizes inputs to valuation methods and requires disclosure of the fair value hierarchy, separately for each major category of assets and liabilities, that segregates fair value measurements into three levels. Levels 1, 2 and 3 of the fair value hierarchy are defined as follows:
Level 1 - unadjusted quoted prices in active markets for identical investments
Level 2 - other significant observable inputs (including, but not limited to, quoted prices for similar assets or liabilities in markets that are either active or inactive; inputs other than quoted prices that are observable such as interest rates, yield curves, volatilities, prepayment speeds, loss severities, credit risks, default rates, or other market corroborated inputs)
Level 3 - significant unobservable inputs based on the best information available in the circumstances, to the extent observable inputs are unavailable (including the Portfolio’s own assumptions used in determining the fair value of investments and derivative financial instruments)
The inputs or methodologies used for valuing investments are not necessarily an indication of the risk associated with investing in them. Changes to the inputs or methodologies used may result in transfers between levels. A reconciliation of Level 3 securities, if any, will be disclosed following the fair value hierarchy table. For more information about the Portfolio’s policy regarding the valuation of investments, please refer to the Notes to Financial Statements.
The following table summarizes the fair value hierarchy of the Portfolio’s investments as of December 31, 2023:
| Description | Level 1 | Level 2 | Level 3 | Total | ||||||||||||
| Total U.S. Treasury & Government Agencies* |
$ | — | $ | 1,330,563,233 | $ | — | $ | 1,330,563,233 | ||||||||
| Total Corporate Bonds & Notes* |
— | 501,381,660 | — | 501,381,660 | ||||||||||||
| Total Foreign Government* |
— | 29,867,054 | — | 29,867,054 | ||||||||||||
| Total Mortgage-Backed Securities* |
— | 16,221,421 | — | 16,221,421 | ||||||||||||
| Total Municipals* |
— | 10,066,089 | — | 10,066,089 | ||||||||||||
| Total Asset-Backed Securities* |
— | 6,332,982 | — | 6,332,982 | ||||||||||||
| Total Short-Term Investments* |
— | 11,343,237 | — | 11,343,237 | ||||||||||||
| Securities Lending Reinvestments | ||||||||||||||||
| Certificates of Deposit |
— | 41,459,954 | — | 41,459,954 | ||||||||||||
| Commercial Paper |
— | 6,988,676 | — | 6,988,676 | ||||||||||||
| Repurchase Agreements |
— | 152,759,310 | — | 152,759,310 | ||||||||||||
| Time Deposits |
— | 16,000,000 | — | 16,000,000 | ||||||||||||
| Mutual Funds |
34,960,185 | — | — | 34,960,185 | ||||||||||||
| Total Securities Lending Reinvestments |
34,960,185 | 217,207,940 | — | 252,168,125 | ||||||||||||
| Total Investments |
$ | 34,960,185 | $ | 2,122,983,616 | $ | — | $ | 2,157,943,801 | ||||||||
| Collateral for Securities Loaned (Liability) |
$ | — | $ | (252,114,807 | ) | $ | — | $ | (252,114,807 | ) | ||||||
| * | See Schedule of Investments for additional detailed categorizations. | |||
See accompanying notes to financial statements.
BHFTII-23
Brighthouse Funds Trust II
MetLife Aggregate Bond Index Portfolio
Statement of Assets and Liabilities
December 31, 2023
| Assets |
| |||
| Investments at value (a) (b) |
$ | 2,157,943,801 | ||
| Cash |
89,864 | |||
| Receivable for: |
||||
| Investments sold |
15,824,367 | |||
| Fund shares sold |
3,745,372 | |||
| Interest |
13,021,694 | |||
| Prepaid expenses |
7,391 | |||
|
|
|
|||
| Total Assets |
2,190,632,489 | |||
| Liabilities |
| |||
| Collateral for securities loaned |
252,114,807 | |||
| Payables for: |
| |||
| Investments purchased |
21,583,491 | |||
| Fund shares redeemed |
310,940 | |||
| Accrued Expenses: |
| |||
| Management fees |
391,460 | |||
| Distribution and service fees |
200,692 | |||
| Deferred trustees’ fees |
168,914 | |||
| Other expenses |
226,816 | |||
|
|
|
|||
| Total Liabilities |
274,997,120 | |||
|
|
|
|||
| Net Assets |
$ | 1,915,635,369 | ||
|
|
|
|||
| Net Assets Consist of: |
| |||
| Paid in surplus |
$ | 2,208,975,360 | ||
| Distributable earnings (Accumulated losses) |
(293,339,991 | ) | ||
|
|
|
|||
| Net Assets |
$ | 1,915,635,369 | ||
|
|
|
|||
| Net Assets |
| |||
| Class A |
$ | 1,006,138,531 | ||
| Class B |
554,799,747 | |||
| Class E |
36,500,131 | |||
| Class G |
318,196,960 | |||
| Capital Shares Outstanding* |
| |||
| Class A |
105,658,373 | |||
| Class B |
59,680,256 | |||
| Class E |
3,856,330 | |||
| Class G |
34,396,560 | |||
| Net Asset Value, Offering Price and Redemption Price Per Share |
| |||
| Class A |
$ | 9.52 | ||
| Class B |
9.30 | |||
| Class E |
9.46 | |||
| Class G |
9.25 | |||
| * | The Portfolio is authorized to issue an unlimited number of shares. | |||
| (a) | Identified cost of investments was $2,363,704,036. | |||
| (b) | Includes securities loaned at value of $291,326,237. | |||
Statement of Operations
| Year Ended December 31, 2023 |
| Investment Income |
| |||
| Interest |
$ | 56,501,167 | ||
| Securities lending income |
653,205 | |||
|
|
|
|||
| Total investment income |
57,154,372 | |||
| Expenses |
| |||
| Management fees |
4,844,931 | |||
| Administration fees |
88,794 | |||
| Custodian and accounting fees |
240,656 | |||
| Distribution and service fees—Class B |
1,391,161 | |||
| Distribution and service fees—Class E |
55,011 | |||
| Distribution and service fees—Class G |
934,121 | |||
| Audit and tax services |
72,848 | |||
| Legal |
46,603 | |||
| Trustees’ fees and expenses |
46,220 | |||
| Shareholder reporting |
108,170 | |||
| Insurance |
18,892 | |||
| Miscellaneous |
27,588 | |||
|
|
|
|||
| Total expenses |
7,874,995 | |||
| Less management fee waiver |
(119,096 | ) | ||
|
|
|
|||
| Net expenses |
7,755,899 | |||
|
|
|
|||
| Net Investment Income |
49,398,473 | |||
|
|
|
|||
| Net Realized and Unrealized Gain (Loss) |
||||
| Net realized loss on investments |
(40,274,594 | ) | ||
| Net change in unrealized appreciation on investments |
85,471,839 | |||
|
|
|
|||
| Net realized and unrealized gain (loss) |
45,197,245 | |||
|
|
|
|||
| Net Increase (Decrease) in Net Assets From Operations |
$ | 94,595,718 | ||
|
|
|
|||
See accompanying notes to financial statements.
BHFTII-24
Brighthouse Funds Trust II
MetLife Aggregate Bond Index Portfolio
Statements of Changes in Net Assets
| Year Ended December 31, 2023 |
Year Ended December 31, 2022 |
|||||||
| Increase (Decrease) in Net Assets: |
||||||||
| From Operations |
||||||||
| Net investment income (loss) |
$ | 49,398,473 | $ | 45,196,416 | ||||
| Net realized gain (loss) |
(40,274,594 | ) | (27,037,461 | ) | ||||
| Net change in unrealized appreciation (depreciation) |
85,471,839 | (356,020,064 | ) | |||||
|
|
|
|
|
|||||
| Increase (decrease) in net assets from operations |
94,595,718 | (337,861,109 | ) | |||||
|
|
|
|
|
|||||
| From Distributions to Shareholders |
||||||||
| Class A |
(30,657,427 | ) | (34,952,394 | ) | ||||
| Class B |
(14,954,075 | ) | (16,379,847 | ) | ||||
| Class E |
(1,016,630 | ) | (1,094,280 | ) | ||||
| Class G |
(8,357,490 | ) | (8,214,915 | ) | ||||
|
|
|
|
|
|||||
| Total distributions |
(54,985,622 | ) | (60,641,436 | ) | ||||
|
|
|
|
|
|||||
| Increase (decrease) in net assets from capital share transactions |
(130,112,805 | ) | (251,501,385 | ) | ||||
|
|
|
|
|
|||||
| Total increase (decrease) in net assets |
(90,502,709 | ) | (650,003,930 | ) | ||||
| Net Assets |
||||||||
| Beginning of period |
2,006,138,078 | 2,656,142,008 | ||||||
|
|
|
|
|
|||||
| End of period |
$ | 1,915,635,369 | $ | 2,006,138,078 | ||||
|
|
|
|
|
|||||
Other Information:
Capital Shares
Transactions in capital shares were as follows:
| Year Ended December 31, 2023 |
Year Ended December 31, 2022 |
|||||||||||||||
| Shares | Value | Shares | Value | |||||||||||||
| Class A |
||||||||||||||||
| Sales |
4,721,634 | $ | 43,799,697 | 2,918,996 | $ | 28,524,797 | ||||||||||
| Reinvestments |
3,328,711 | 30,657,427 | 3,690,855 | 34,952,394 | ||||||||||||
| Redemptions |
(19,544,626 | ) | (180,944,991 | ) | (22,551,286 | ) | (219,682,691 | ) | ||||||||
|
|
|
|
|
|
|
|
|
|||||||||
| Net increase (decrease) |
(11,494,281 | ) | $ | (106,487,867 | ) | (15,941,435 | ) | $ | (156,205,500 | ) | ||||||
|
|
|
|
|
|
|
|
|
|||||||||
| Class B |
||||||||||||||||
| Sales |
2,686,265 | $ | 24,464,391 | 1,679,657 | $ | 16,058,791 | ||||||||||
| Reinvestments |
1,661,564 | 14,954,075 | 1,768,882 | 16,379,847 | ||||||||||||
| Redemptions |
(6,960,851 | ) | (63,034,199 | ) | (11,222,408 | ) | (108,158,305 | ) | ||||||||
|
|
|
|
|
|
|
|
|
|||||||||
| Net increase (decrease) |
(2,613,022 | ) | $ | (23,615,733 | ) | (7,773,869 | ) | $ | (75,719,667 | ) | ||||||
|
|
|
|
|
|
|
|
|
|||||||||
| Class E |
||||||||||||||||
| Sales |
224,758 | $ | 2,079,861 | 153,247 | $ | 1,523,933 | ||||||||||
| Reinvestments |
110,986 | 1,016,630 | 116,166 | 1,094,280 | ||||||||||||
| Redemptions |
(536,571 | ) | (4,946,627 | ) | (609,103 | ) | (5,976,760 | ) | ||||||||
|
|
|
|
|
|
|
|
|
|||||||||
| Net increase (decrease) |
(200,827 | ) | $ | (1,850,136 | ) | (339,690 | ) | $ | (3,358,547 | ) | ||||||
|
|
|
|
|
|
|
|
|
|||||||||
| Class G |
||||||||||||||||
| Sales |
2,987,202 | $ | 27,014,122 | 3,292,560 | $ | 30,939,202 | ||||||||||
| Reinvestments |
932,756 | 8,357,490 | 890,989 | 8,214,915 | ||||||||||||
| Redemptions |
(3,730,199 | ) | (33,530,681 | ) | (5,716,471 | ) | (55,371,788 | ) | ||||||||
|
|
|
|
|
|
|
|
|
|||||||||
| Net increase (decrease) |
189,759 | $ | 1,840,931 | (1,532,922 | ) | $ | (16,217,671 | ) | ||||||||
|
|
|
|
|
|
|
|
|
|||||||||
| Increase (decrease) derived from capital shares transactions |
$ | (130,112,805 | ) | $ | (251,501,385 | ) | ||||||||||
|
|
|
|
|
|||||||||||||
See accompanying notes to financial statements.
BHFTII-25
Brighthouse Funds Trust II
MetLife Aggregate Bond Index Portfolio
Financial Highlights
| Selected per share data | ||||||||||||||||||||
| Class A | ||||||||||||||||||||
| Year Ended December 31, | ||||||||||||||||||||
| 2023 | 2022 | 2021 | 2020 | 2019 | ||||||||||||||||
| Net Asset Value, Beginning of Period |
$ | 9.32 | $ | 11.04 | $ | 11.55 | $ | 11.10 | $ | 10.55 | ||||||||||
|
|
|
|
|
|
|
|
|
|
|
|||||||||||
| Income (Loss) from Investment Operations |
||||||||||||||||||||
| Net investment income (loss) (a) |
0.25 | 0.21 | 0.19 | 0.24 | 0.28 | |||||||||||||||
| Net realized and unrealized gain (loss) |
0.23 | (1.65 | ) | (0.41 | ) | 0.56 | 0.62 | |||||||||||||
|
|
|
|
|
|
|
|
|
|
|
|||||||||||
| Total income (loss) from investment operations |
0.48 | (1.44 | ) | (0.22 | ) | 0.80 | 0.90 | |||||||||||||
|
|
|
|
|
|
|
|
|
|
|
|||||||||||
| Less Distributions |
||||||||||||||||||||
| Distributions from net investment income |
(0.28 | ) | (0.28 | ) | (0.29 | ) | (0.35 | ) | (0.35 | ) | ||||||||||
|
|
|
|
|
|
|
|
|
|
|
|||||||||||
| Total distributions |
(0.28 | ) | (0.28 | ) | (0.29 | ) | (0.35 | ) | (0.35 | ) | ||||||||||
|
|
|
|
|
|
|
|
|
|
|
|||||||||||
| Net Asset Value, End of Period |
$ | 9.52 | $ | 9.32 | $ | 11.04 | $ | 11.55 | $ | 11.10 | ||||||||||
|
|
|
|
|
|
|
|
|
|
|
|||||||||||
| Total Return (%) (b) |
5.20 | (13.09 | ) | (1.93 | ) | 7.21 | 8.64 | |||||||||||||
| Ratios/Supplemental Data |
||||||||||||||||||||
| Gross ratio of expenses to average net assets (%) |
0.28 | 0.28 | 0.28 | 0.28 | 0.28 | |||||||||||||||
| Net ratio of expenses to average net assets (%) (c) |
0.28 | 0.27 | 0.27 | 0.27 | 0.27 | |||||||||||||||
| Ratio of net investment income (loss) to average net assets (%) |
2.67 | 2.13 | 1.69 | 2.12 | 2.60 | |||||||||||||||
| Portfolio turnover rate (%) |
17 | 15 | 28 | 34 | 20 | |||||||||||||||
| Net assets, end of period (in millions) |
$ | 1,006.1 | $ | 1,091.7 | $ | 1,469.1 | $ | 1,613.2 | $ | 1,355.4 | ||||||||||
| Class B | ||||||||||||||||||||
| Year Ended December 31, | ||||||||||||||||||||
| 2023 | 2022 | 2021 | 2020 | 2019 | ||||||||||||||||
| Net Asset Value, Beginning of Period |
$ | 9.10 | $ | 10.78 | $ | 11.29 | $ | 10.85 | $ | 10.32 | ||||||||||
|
|
|
|
|
|
|
|
|
|
|
|||||||||||
| Income (Loss) from Investment Operations |
||||||||||||||||||||
| Net investment income (loss) (a) |
0.22 | 0.18 | 0.16 | 0.21 | 0.25 | |||||||||||||||
| Net realized and unrealized gain (loss) |
0.23 | (1.61 | ) | (0.41 | ) | 0.55 | 0.60 | |||||||||||||
|
|
|
|
|
|
|
|
|
|
|
|||||||||||
| Total income (loss) from investment operations |
0.45 | (1.43 | ) | (0.25 | ) | 0.76 | 0.85 | |||||||||||||
|
|
|
|
|
|
|
|
|
|
|
|||||||||||
| Less Distributions |
||||||||||||||||||||
| Distributions from net investment income |
(0.25 | ) | (0.25 | ) | (0.26 | ) | (0.32 | ) | (0.32 | ) | ||||||||||
|
|
|
|
|
|
|
|
|
|
|
|||||||||||
| Total distributions |
(0.25 | ) | (0.25 | ) | (0.26 | ) | (0.32 | ) | (0.32 | ) | ||||||||||
|
|
|
|
|
|
|
|
|
|
|
|||||||||||
| Net Asset Value, End of Period |
$ | 9.30 | $ | 9.10 | $ | 10.78 | $ | 11.29 | $ | 10.85 | ||||||||||
|
|
|
|
|
|
|
|
|
|
|
|||||||||||
| Total Return (%) (b) |
5.03 | (13.31 | ) | (2.22 | ) | 7.01 | 8.34 | |||||||||||||
| Ratios/Supplemental Data |
||||||||||||||||||||
| Gross ratio of expenses to average net assets (%) |
0.53 | 0.53 | 0.53 | 0.53 | 0.53 | |||||||||||||||
| Net ratio of expenses to average net assets (%) (c) |
0.53 | 0.52 | 0.52 | 0.52 | 0.52 | |||||||||||||||
| Ratio of net investment income (loss) to average net assets (%) |
2.42 | 1.87 | 1.44 | 1.88 | 2.35 | |||||||||||||||
| Portfolio turnover rate (%) |
17 | 15 | 28 | 34 | 20 | |||||||||||||||
| Net assets, end of period (in millions) |
$ | 554.8 | $ | 566.9 | $ | 755.3 | $ | 793.0 | $ | 796.6 | ||||||||||
Please see following page for Financial Highlights footnote legend.
See accompanying notes to financial statements.
BHFTII-26
Brighthouse Funds Trust II
MetLife Aggregate Bond Index Portfolio
Financial Highlights
| Selected per share data | ||||||||||||||||||||
| Class E | ||||||||||||||||||||
| Year Ended December 31, | ||||||||||||||||||||
| 2023 | 2022 | 2021 | 2020 | 2019 | ||||||||||||||||
| Net Asset Value, Beginning of Period |
$ | 9.26 | $ | 10.97 | $ | 11.48 | $ | 11.03 | $ | 10.49 | ||||||||||
|
|
|
|
|
|
|
|
|
|
|
|||||||||||
| Income (Loss) from Investment Operations |
||||||||||||||||||||
| Net investment income (loss) (a) |
0.23 | 0.19 | 0.17 | 0.23 | 0.27 | |||||||||||||||
| Net realized and unrealized gain (loss) |
0.23 | (1.64 | ) | (0.41 | ) | 0.55 | 0.60 | |||||||||||||
|
|
|
|
|
|
|
|
|
|
|
|||||||||||
| Total income (loss) from investment operations |
0.46 | (1.45 | ) | (0.24 | ) | 0.78 | 0.87 | |||||||||||||
|
|
|
|
|
|
|
|
|
|
|
|||||||||||
| Less Distributions |
||||||||||||||||||||
| Distributions from net investment income |
(0.26 | ) | (0.26 | ) | (0.27 | ) | (0.33 | ) | (0.33 | ) | ||||||||||
|
|
|
|
|
|
|
|
|
|
|
|||||||||||
| Total distributions |
(0.26 | ) | (0.26 | ) | (0.27 | ) | (0.33 | ) | (0.33 | ) | ||||||||||
|
|
|
|
|
|
|
|
|
|
|
|||||||||||
| Net Asset Value, End of Period |
$ | 9.46 | $ | 9.26 | $ | 10.97 | $ | 11.48 | $ | 11.03 | ||||||||||
|
|
|
|
|
|
|
|
|
|
|
|||||||||||
| Total Return (%) (b) |
5.05 | (13.25 | ) | (2.08 | ) | 7.10 | 8.41 | |||||||||||||
| Ratios/Supplemental Data |
||||||||||||||||||||
| Gross ratio of expenses to average net assets (%) |
0.43 | 0.43 | 0.43 | 0.43 | 0.43 | |||||||||||||||
| Net ratio of expenses to average net assets (%) (c) |
0.43 | 0.42 | 0.42 | 0.42 | 0.42 | |||||||||||||||
| Ratio of net investment income (loss) to average net assets (%) |
2.52 | 1.98 | 1.54 | 1.98 | 2.45 | |||||||||||||||
| Portfolio turnover rate (%) |
17 | 15 | 28 | 34 | 20 | |||||||||||||||
| Net assets, end of period (in millions) |
$ | 36.5 | $ | 37.6 | $ | 48.2 | $ | 49.7 | $ | 49.1 | ||||||||||
| Class G | ||||||||||||||||||||
| Year Ended December 31, | ||||||||||||||||||||
| 2023 | 2022 | 2021 | 2020 | 2019 | ||||||||||||||||
| Net Asset Value, Beginning of Period |
$ | 9.06 | $ | 10.73 | $ | 11.24 | $ | 10.81 | $ | 10.28 | ||||||||||
|
|
|
|
|
|
|
|
|
|
|
|||||||||||
| Income (Loss) from Investment Operations |
||||||||||||||||||||
| Net investment income (loss) (a) |
0.21 | 0.18 | 0.15 | 0.20 | 0.24 | |||||||||||||||
| Net realized and unrealized gain (loss) |
0.23 | (1.61 | ) | (0.40 | ) | 0.54 | 0.61 | |||||||||||||
|
|
|
|
|
|
|
|
|
|
|
|||||||||||
| Total income (loss) from investment operations |
0.44 | (1.43 | ) | (0.25 | ) | 0.74 | 0.85 | |||||||||||||
|
|
|
|
|
|
|
|
|
|
|
|||||||||||
| Less Distributions |
||||||||||||||||||||
| Distributions from net investment income |
(0.25 | ) | (0.24 | ) | (0.26 | ) | (0.31 | ) | (0.32 | ) | ||||||||||
|
|
|
|
|
|
|
|
|
|
|
|||||||||||
| Total distributions |
(0.25 | ) | (0.24 | ) | (0.26 | ) | (0.31 | ) | (0.32 | ) | ||||||||||
|
|
|
|
|
|
|
|
|
|
|
|||||||||||
| Net Asset Value, End of Period |
$ | 9.25 | $ | 9.06 | $ | 10.73 | $ | 11.24 | $ | 10.81 | ||||||||||
|
|
|
|
|
|
|
|
|
|
|
|||||||||||
| Total Return (%) (b) |
4.90 | (13.33 | ) | (2.26 | ) | 6.89 | 8.34 | |||||||||||||
| Ratios/Supplemental Data |
||||||||||||||||||||
| Gross ratio of expenses to average net assets (%) |
0.58 | 0.58 | 0.58 | 0.58 | 0.58 | |||||||||||||||
| Net ratio of expenses to average net assets (%) (c) |
0.58 | 0.57 | 0.57 | 0.57 | 0.57 | |||||||||||||||
| Ratio of net investment income (loss) to average net assets (%) |
2.38 | 1.83 | 1.39 | 1.82 | 2.30 | |||||||||||||||
| Portfolio turnover rate (%) |
17 | 15 | 28 | 34 | 20 | |||||||||||||||
| Net assets, end of period (in millions) |
$ | 318.2 | $ | 309.9 | $ | 383.5 | $ | 390.4 | $ | 333.9 | ||||||||||
| (a) | Per share amounts based on average shares outstanding during the period. | |||
| (b) | Total return does not reflect any insurance, sales, separate account or administrative charges of variable annuity or life insurance contracts or any additional expenses that contract owners may bear under their variable contracts. If these charges were included, the returns would be lower. | |||
| (c) | Includes the effects of management fee waivers (see Note 5 of the Notes to Financial Statements). | |||
See accompanying notes to financial statements.
BHFTII-27
Brighthouse Funds Trust II
MetLife Aggregate Bond Index Portfolio
Notes to Financial Statements—December 31, 2023
1. Organization
Brighthouse Funds Trust II (the “Trust”) is organized as a Delaware statutory trust and registered under the Investment Company Act of 1940, as amended (the “1940 Act”), as an open-end management investment company. The Trust, which is managed by Brighthouse Investment Advisers, LLC (“Brighthouse Investment Advisers” or the “Adviser”), currently offers twenty-nine series (the “Portfolios”), each of which operates as a distinct investment vehicle of the Trust. The series included in this report is MetLife Aggregate Bond Index Portfolio (the “Portfolio”), which is diversified. Shares of the Portfolio are not offered directly to the general public and are currently available only to separate accounts of insurance companies, including insurance companies affiliated with the Adviser.
The Portfolio has registered and offers four classes of shares: Class A, B, E and G shares. Shares of each class of the Portfolio represent an equal pro rata interest in the Portfolio and generally give the shareholder the same voting, dividend, liquidation, and other rights. Investment income, realized and unrealized capital gains and losses, the common expenses of the Portfolio, and certain Portfolio-level expense reductions, if any, are allocated on a pro rata basis to each class based on the relative net assets of each class to the net assets of the Portfolio. Each class of shares differs in its respective distribution plan and such distribution expenses are allocated to the corresponding class of shares.
2. Significant Accounting Policies
The preparation of financial statements in conformity with accounting principles generally accepted in the United States of America (“GAAP”) requires management to make estimates and assumptions that affect the reported amounts of assets and liabilities and disclosure of contingent assets and liabilities as of the date of the financial statements and the reported amounts of income and expenses during the reporting period. Actual results could differ from those estimates. In the preparation of these financial statements, management has evaluated events and transactions subsequent to December 31, 2023 through the date the financial statements were issued.
The Portfolio is an investment company and follows the accounting and reporting guidance of the Financial Accounting Standards Board (“FASB”) Accounting Standards Codification Topic 946—Financial Services—Investment Companies. The following is a summary of significant accounting policies consistently followed by the Portfolio in the preparation of its financial statements.
Investment Valuation and Fair Value Measurements - The Portfolio values its investments for purposes of calculating its net asset value (“NAV”) using procedures that allow for a variety of methodologies to be used to value the Portfolio’s investments. The specific methodology used for an investment may vary based on the market data available for a specific investment at the time the Portfolio calculates its NAV or based on other considerations. The procedures also permit a level of judgment to be used in the valuation process.
Debt securities, including corporate, convertible and municipal bonds and notes; obligations of the U.S. Treasury and U.S. government agencies; foreign sovereign issues; and non-U.S. bonds, are generally valued based upon evaluated or composite bid quotations obtained from third-party pricing services and/or brokers and dealers selected by the Adviser (each a “pricing service”). Such pricing services may use matrix pricing, which considers observable inputs including, among other things, issuer details, maturity dates, interest rates, yield curves, rates of prepayment, credit risks/spreads, default rates, reported trades, broker-dealer quotes and quoted prices for similar assets. Short-term obligations with a remaining maturity of sixty days or less may be valued at amortized cost in the absence of market quotes, so long as the amortized cost value of such short-term debt instrument is approximately the same as the fair value of the instrument as determined without the use of amortized cost valuation. Floating rate loans are generally valued based upon an evaluated or composite average of aggregate bid and ask quotations supplied by brokers or dealers, as obtained from the pricing service. Securities that use similar valuation techniques and inputs as described above are generally categorized as Level 2 within the fair value hierarchy.
Mortgage-and asset-backed securities are generally valued based upon evaluated or composite bid quotations obtained from pricing services selected by the Adviser. These securities are usually issued as separate tranches, or classes, of securities within each deal. The pricing models for these securities usually consider tranche-level attributes, current market data, estimated cash flows and market-based yield spreads for each tranche and incorporate deal collateral performance, as available. Mortgage-and asset-backed securities that use similar valuation techniques and inputs as described above are generally categorized as Level 2 within the fair value hierarchy.
Domestic and foreign equity securities, such as common stock, exchange-traded funds, rights, warrants, and preferred stock, that are traded on a securities exchange on a valuation date are generally valued at their last quoted sale price or official closing price on the primary exchange for such security, or, if no sales occurred on that day, at the last reported bid price. Equity securities traded over-the-counter (“OTC”) are generally valued at the last reported bid price. In the event of a major exchange closing during the trading day, the Adviser may use other market information obtained from quotation reporting systems, established market makers, or pricing services in valuing the securities. Valuation adjustments may be applied to certain foreign equity securities that are traded solely on foreign exchanges that close before the time as of which the Portfolio determines its NAV to account for the market movement
BHFTII-28
Brighthouse Funds Trust II
MetLife Aggregate Bond Index Portfolio
Notes to Financial Statements—December 31, 2023—(Continued)
between the close of the foreign exchanges and the time as of which the Portfolio determines its NAV. The Portfolio may use a systematic fair valuation model provided by a pricing service to value securities principally traded in these foreign markets to adjust for possible market movements or other changes that may occur between the close of the foreign exchanges and the time as of which the Portfolio determines its NAV. Foreign equity securities valued using these valuation adjustments are generally categorized as Level 2 within the fair value hierarchy. Equity securities that are actively traded, and have no valuation adjustments applied, are categorized as Level 1 within the fair value hierarchy. Other equity securities traded on inactive markets or valued in reference to similar instruments traded on active markets are generally categorized as Level 2 within the fair value hierarchy.
Investments in registered open-end management investment companies are valued at reported NAV per share on the valuation date and are categorized as Level 1 within the fair value hierarchy.
If no current market quotation is readily available or market value quotations are deemed to be unreliable for an investment, the fair value of the investment will be determined in accordance with procedures. A market quotation is readily available only when that quotation is a quoted price (unadjusted) in active markets for identical investments that the Portfolio can access at the measurement date, provided that a quotation will not be readily available if it is not reliable.
Pursuant to Rule 2a-5 under the 1940 Act, the Board of Trustees (the “Board” or “Trustees” ) of the Trust has designated Brighthouse Investment Advisers, acting through its Valuation Committee (“Committee”), as the Portfolio’s “valuation designee” to perform the Portfolio’s fair value determinations. The Board oversees Brighthouse Investment Advisers in its role as the Valuation Designee and receives reports from Brighthouse Investment Advisers regarding its process and the valuation of the Portfolio’s investments to assist with such oversight.
No single standard for determining the fair value of an investment can be set forth because fair value depends upon the facts and circumstances with respect to each investment. Information relating to any relevant factors may be obtained by the Committee from any appropriate source, including the subadviser of the Portfolio, the Custodian, a pricing service, market maker and/or broker for such security or the issuer. Appropriate methodologies for determining fair value under particular circumstances may include: matrix pricing, a discounted cash flow analysis, comparisons of securities with comparable characteristics, value based on multiples of earnings, discount from market price of similar marketable securities, or a combination of these and other methods.
Investment Transactions and Related Investment Income - Portfolio security transactions are recorded on the trade date. Dividend income is recorded on the ex-dividend date or, for certain foreign securities, when notified. Interest income, which includes amortization of premium and accretion of discount on debt securities, is recorded on the accrual basis. Realized gains and losses on investments are determined on the identified cost basis, which is the same basis used for federal income tax purposes. Foreign income and foreign capital gains on some foreign securities may be subject to foreign taxes, which are accrued as applicable. These foreign taxes have been provided for in accordance with the Portfolio’s understanding of the applicable countries’ tax rules and rates.
Dividends and Distributions to Shareholders - The Portfolio records dividends and distributions on the ex-dividend date. Net realized gains from securities transactions (if any) are generally distributed annually to shareholders. The timing and characterization of certain income and capital gains distributions are determined in accordance with federal tax regulations that may differ from GAAP. Permanent book and tax basis differences relating to shareholder distributions will result in reclassification between distributable earnings (accumulated losses) and paid in surplus. These adjustments have no impact on net assets or the results of operations.
Income Taxes - It is the Portfolio’s policy to comply with the requirements of the Internal Revenue Code of 1986, as amended, and regulations thereunder, applicable to regulated investment companies, and to distribute, with respect to each taxable year, all of its taxable income to shareholders. Therefore, no federal income tax provision is required. The Portfolio files U.S. federal tax returns. No income tax returns are currently under examination. The Portfolio’s federal tax returns remain subject to examination by the Internal Revenue Service for three fiscal years after the returns are filed. As of December 31, 2023, the Portfolio had no uncertain tax positions that would require financial statement recognition, derecognition or disclosure.
Mortgage-Related and Other Asset-Backed Securities - The Portfolio may invest in mortgage-related or other asset-backed securities. These securities may include mortgage pass-through securities, collateralized mortgage obligations (“CMOs”), commercial mortgage-backed securities, CMO residuals, stripped mortgage-backed securities (“SMBS”), and other securities that directly or indirectly represent a participation in, or are secured by or payable from, mortgage loans on real property or other receivables. The value of some mortgage- or asset-backed securities may be particularly sensitive to changes in prevailing interest rates. Early repayment of principal on some mortgage-related securities may expose the Portfolio to a lower rate of return upon reinvestment of principal. The value of these securities may fluctuate in response to the market’s perception of the creditworthiness of the issuers. Additionally, although mortgages and mortgage-related securities are generally supported by some form of government or private guarantee and/or insurance, there is no assurance that private guarantors or insurers will meet their obligations.
In one type of SMBS, one class receives all of the interest from the mortgage assets (the interest-only or “IO” class), while the other class will receive all of the principal (the principal-only or “PO” class). Because principal will not be received at the maturity of an IO, adjustments are made to the book value of the security until maturity. These adjustments are netted against payments received for the
BHFTII-29
Brighthouse Funds Trust II
MetLife Aggregate Bond Index Portfolio
Notes to Financial Statements—December 31, 2023—(Continued)
IOs and the net amount is included in interest income on the Statement of Operations of the Portfolio. Payments received for POs are treated as reductions to the cost and par value of the securities. Details of mortgage-related and other asset-backed securities held by the Portfolio are included in the Portfolio’s Schedule of Investments.
The Portfolio may invest a significant portion of its assets in securities of issuers that hold mortgage- and asset-backed securities and direct investments in securities backed by commercial and residential mortgage loans and other financial assets. The value and related income of these securities are sensitive to changes in economic conditions, including delinquencies and/or defaults, and may be negatively impacted by increased volatility of market prices and periods of illiquidity.
When-Issued and Delayed-Delivery Securities - The Portfolio may purchase securities on a when-issued or delayed-delivery basis. Settlement of such transactions will occur beyond the customary settlement period. The Portfolio may purchase securities under such conditions only with the intention of actually acquiring them, but may enter into a separate agreement to sell the securities before the settlement date. Since the value of securities purchased may fluctuate prior to settlement, the Portfolio may be required to pay more at settlement than the security is worth. In addition, the Portfolio is not entitled to any of the interest earned prior to settlement.
Repurchase Agreements - The Portfolio may enter into repurchase agreements, under the terms of a Master Repurchase Agreement (“MRA”), or Global Master Repurchase Agreement (“GMRA”), with selected commercial banks and broker-dealers, under which the Portfolio acquires securities as collateral and agrees to resell the securities at an agreed-upon time and at an agreed-upon price. The Portfolio, through the Custodian or a subcustodian, under a tri-party repurchase agreement, receives delivery of the underlying securities collateralizing any repurchase agreements. It is the Portfolio’s policy that the market value of the collateral be equal to at least 100% of the repurchase price in the case of a repurchase agreement of one-day duration and equal to at least 102% of the repurchase price in the case of all other repurchase agreements. In the event of default or failure by a party to perform an obligation in connection with any repurchase transaction, the MRA or GMRA gives the non-defaulting party the right to set-off claims and to apply property held by it in connection with any repurchase transaction against obligations owed to it under the agreement.
At December 31, 2023, the Portfolio invested cash collateral for loans of portfolio securities in repurchase agreements with a gross value of $152,759,310, which is included as part of investments at value on the Statement of Assets and Liabilities. The value of the related collateral exceeded the value of the repurchase agreements at December 31, 2023.
Securities Lending - The Portfolio may lend its portfolio securities to certain qualified brokers who borrow securities in order to complete certain securities transactions. By lending its portfolio securities, the Portfolio attempts to increase its net investment income through the receipt of income on collateral held from securities on loan. Any gain or loss in the market price of the loaned securities that might occur, any interest earned, and any dividends declared during the term of the loan, would accrue to the account of the Portfolio.
The Trust has entered into a Non-Custodial Securities Lending Agreement with JPMorgan Chase Bank, N.A. (the “Lending Agent”). Under the agreement, the Lending Agent is authorized to loan portfolio securities on the Portfolio’s behalf. In exchange, the Portfolio generally receives cash, U.S. Government securities, letters of credit, or other collateral deemed appropriate by the Adviser. The Portfolio receives collateral equal to at least 102% of the market value for loans secured by government securities or cash in the same currency as the loaned shares and 105% for all other loaned securities at each loan’s inception. Collateral representing at least 100% of the market value of the loaned securities is maintained for the duration of the loan. Any cash collateral received by the Portfolio is generally invested by the Lending Agent in short-term investments, which may include certificates of deposit, commercial paper, repurchase agreements, including repurchase agreements with respect to equity securities, time deposits, master demand notes and money market funds. The market value of investments made with cash collateral received are disclosed in the Schedule of Investments and the valuation techniques are described in Note 2. The value of the securities on loan may change each business day. If the market value of the collateral at the close of trading on a business day is less than 100% of the market value of the loaned securities at the close of trading on that day, the borrower is required to deliver, by the close of business on the following business day, an additional amount of collateral, so that the total amount of posted collateral is equal to at least 100% of the market value of all the loaned securities as of such preceding day. A portion of the income earned on the collateral is rebated to the borrower of the securities and the remainder is split between the Lending Agent and the Portfolio. On loans collateralized by U.S. government securities, a fee is received from the borrower and is allocated between the Portfolio and the Lending Agent.
Income received by the Portfolio in securities lending transactions during the year ended December 31, 2023 is reflected as securities lending income on the Statement of Operations. The values of any securities loaned by the Portfolio and the related collateral at December 31, 2023 are disclosed in the footnotes to the Schedule of Investments. The value of the related collateral received by the Portfolio exceeded the value of the securities out on loan at December 31, 2023.
The risks associated with lending portfolio securities include, but are not limited to, possible delays in receiving additional collateral or in the recovery of the loaned securities, possible loss of rights in the collateral should the borrower fail financially, as well as risk of loss in the value of the collateral or the value of the investments made with the collateral. To the extent the Portfolio uses cash collateral it receives to invest in repurchase agreements with respect to equity securities, it is subject to the risk of loss if the value of
BHFTII-30
Brighthouse Funds Trust II
MetLife Aggregate Bond Index Portfolio
Notes to Financial Statements—December 31, 2023—(Continued)
the equity securities declines and the counterparty defaults on its obligation to repurchase such securities. The Lending Agent shall indemnify the Portfolio in the case of default of any securities borrower, subject to the terms of the Non-Custodial Securities Lending Agreement.
The following table provides a breakdown of transactions accounted for as secured borrowings, the gross obligations by the type of collateral pledged, and the remaining contractual maturities of those transactions.
| Remaining Contractual Maturity of the Agreements As of December 31, 2023 |
||||||||||||||||||||
| Overnight and Continuous |
Up to 30 Days |
31 - 90 Days |
Greater than 90 days |
Total | ||||||||||||||||
| Securities Lending Transactions |
| |||||||||||||||||||
| Corporate Bonds & Notes |
$ | (126,849,621 | ) | $ | — | $ | — | $ | — | $ | (126,849,621 | ) | ||||||||
| Foreign Government |
(3,028,282 | ) | — | — | — | (3,028,282 | ) | |||||||||||||
| U.S. Treasury & Government Agencies |
(122,236,904 | ) | — | — | — | (122,236,904 | ) | |||||||||||||
| Total Borrowings |
$ | (252,114,807 | ) | $ | — | $ | — | $ | — | $ | (252,114,807 | ) | ||||||||
| Gross amount of recognized liabilities for securities lending transactions |
|
$ | (252,114,807 | ) | ||||||||||||||||
|
|
|
|||||||||||||||||||
3. Certain Risks
In the normal course of business, the Portfolio invests in securities and enters into transactions where risks exist. Those risks include:
Market Risk: The value of securities held by the Portfolio may decline in response to certain events, including those directly involving the issuers whose securities are owned by the Portfolio; conditions affecting the general economy; overall market changes; local, regional or global political, social or economic instability; currency, interest rate, and price fluctuations, or other factors including terrorism, war, natural disasters and the spread of infectious illness including epidemics or pandemics such as the COVID-19 pandemic. These events may also adversely affect the liquidity of securities held by the Portfolio.
Credit and Counterparty Risk: The Portfolio may be exposed to counterparty risk, or the risk that an entity with which the Portfolio has unsettled or open transactions may default. The potential loss could exceed the value of the financial assets and liabilities recorded in the financial statements. Financial assets that potentially expose the Portfolio to credit and counterparty risk consist principally of cash due from counterparties and investments. The Portfolio manages counterparty risk by entering into agreements only with counterparties that it believes have the financial resources to honor their obligations and by monitoring the financial stability of those counterparties. The Subadviser may attempt to mitigate counterparty risk by (i) periodically assessing the creditworthiness of its trading partners, (ii) monitoring and/or limiting the amount of its net exposure to each individual counterparty based on its assessment, and (iii) requiring collateral from the counterparty for certain transactions. In order to preserve certain safeguards for non-standard settlement trades, the Portfolio restricts its exposure to credit and counterparty losses by entering into master netting agreements (“Master Agreements”) with counterparties (approved brokers) with whom it undertakes a significant volume of transactions. Master Agreements govern the terms of certain transactions and reduce the counterparty risk associated with relevant transactions by specifying credit protection mechanisms and providing standardization that improves legal certainty. Master Agreements can also help limit counterparty risk by specifying collateral posting arrangements at pre-arranged exposure levels.
LIBOR Replacement Risk: LIBOR was the offered rate at which major international banks could obtain wholesale, unsecured funding. The terms of investments, financings or other transactions (including certain derivatives transactions) to which the Portfolio may be a party have historically been tied to LIBOR. In connection with the global transition away from LIBOR led by regulators and market participants, LIBOR was last published on a representative basis at the end of June 2023. The United Kingdom’s Financial Conduct Authority, which regulates LIBOR, has ceased publishing all LIBOR settings, but some USD LIBOR settings will continue to be published under a synthetic methodology until September 30, 2024 for certain legacy contracts. Alternative reference rates to LIBOR have been established in most major currencies (e.g., the Secured Overnight Financing Rate for U.S. dollar LIBOR and the Sterling Overnight Index Average for GBP LIBOR) and the transition to new reference rates continues. The full impact of the transition on the Portfolio, the financial instruments in which the Portfolio invests and financial markets more generally cannot yet be fully determined.
Additional risks associated with each type of investment are described above within the respective security type notes. The Portfolio’s prospectus includes a discussion of the principal risks of investing in the Portfolio.
4. Investment Transactions
Aggregate cost of purchases and proceeds of sales of investment securities, excluding short-term securities, for the year ended December 31, 2023 were as follows:
| Purchases |
Sales | |||||||||||
| U.S. Government |
Non-U.S. Government | U.S. Government | Non-U.S. Government | |||||||||
| $265,348,474 | $ | 66,906,314 | $ | 367,222,048 | $ | 109,161,186 | ||||||
BHFTII-31
Brighthouse Funds Trust II
MetLife Aggregate Bond Index Portfolio
Notes to Financial Statements—December 31, 2023—(Continued)
5. Investment Management Fees and Other Transactions with Affiliates
Investment Management Agreement - Brighthouse Investment Advisers is the investment adviser to the Portfolio. The Trust has entered into an investment management agreement with Brighthouse Investment Advisers with respect to the Portfolio. For providing investment management services to the Portfolio, Brighthouse Investment Advisers receives monthly compensation at the annual rate of 0.250% of average daily net assets. Fees earned by Brighthouse Investment Advisers with respect to the Portfolio for the year ended December 31, 2023 were $ 4,844,931.
Brighthouse Investment Advisers has entered into an investment subadvisory agreement with MetLife Investment Management, LLC (“MIM”) with respect to managing the Portfolio. For providing subadvisory services to the Portfolio, Brighthouse Investment Advisers has agreed to pay MIM an investment subadvisory fee for each class of the Portfolio as follows:
| % per annum reduction |
Average daily net assets | |
| 0.040% | On the first $500 million | |
| 0.030% | Of the next $500 million | |
| 0.015% | On amounts over $1 billion |
Fees earned by MIM with respect to the Portfolio for the year ended December 31, 2023 were $490,696.
Management Fee Waivers - Pursuant to a management fee waiver agreement, the Adviser has agreed, for the period May 1, 2023 to April 30, 2024, to reduce its advisory fees set out above under “Investment Management Agreement” for each class of the Portfolio as follows:
| % per annum |
Average daily net assets | |
| 0.005% | Over $500 million and under $1 billion | |
| 0.010% | Of the next $1 billion | |
| 0.015% | On amounts over $2 billion |
An identical expense agreement was in place for the period April 29, 2022 to April 30, 2023. Amounts waived for the year ended December 31, 2023 are shown as management fee waivers in the Statement of Operations.
Certain officers and trustees of the Trust may also be officers of the Adviser; however, such officers and trustees receive no compensation from the Trust.
Transfer Agency Agreement - Brighthouse Life Insurance Company serves as the transfer agent for the Trust. Brighthouse Life Insurance Company receives no fees for its services to the Trust.
Distribution and Service Fees - The Trust has a distribution agreement with Brighthouse Securities, LLC (the “Distributor”) pursuant to which the Distributor serves as the general distributor of shares of each class (each a “Class”) of each Portfolio. The Distributor is an affiliate of the Trust. The Trust has adopted a Distribution and Services Plan (the “D&S Plan”) relating to Class B, Class D, Class E, Class F and Class G shares of each Portfolio, under Rule 12b-1 under the 1940 Act, pursuant to which the Trust may pay the Distributor a fee (the “Service Fee”) at an annual rate not to exceed 0.25% of each such Portfolio’s average daily net assets attributable to the Class B, Class D, Class E, Class F and Class G shares of the Trust. Each Portfolio may not offer shares of each Class. The D&S Plan also authorizes the Trust, on behalf of each of its Portfolios, to pay to the Distributor a distribution fee (the “Distribution Fee” and together with the Service Fee, the “Fees”) at an annual rate of up to 0.25% of each Portfolio’s average daily net assets attributable to the Class B, Class D, Class E, Class F, and Class G shares in consideration of the services rendered in connection with the sale of such shares by the Distributor. Under the Distribution Agreement with respect to the Trust, Fees are currently paid at an annual rate of 0.25% of average daily net assets in the case of Class B shares, 0.10% of average daily net assets in the case of Class D shares, 0.15% of average daily net assets in the case of Class E shares, 0.20% of average daily net assets in the case of Class F shares and 0.30% of average daily net assets in the case of Class G shares. The D&S Plan is known as a “compensation plan” because the Trust makes payments to the Distributor for services rendered regardless of the actual level of expenditures by the Distributor. Amounts incurred by the Portfolio for the year ended December 31, 2023 are shown as Distribution and service fees in the Statement of Operations.
Deferred Trustee Compensation - Each Trustee who is not currently an employee of the Adviser or any of its affiliates receives compensation from the Trust for his or her service to the Trust. A deferred compensation plan (the “Plan”) is available to the Trustees on a voluntary basis. Deferred amounts remain in the Trust until distributed in accordance with the provisions of the Plan. The value of a participating Trustee’s deferral account is based on theoretical investments of deferred amounts on the normal payment dates in certain portfolios of the Trust or Brighthouse Funds Trust I, an affiliate of the Trust, as designated by the participating Trustee. Changes in the value of participants’ deferral accounts are reflected as a component of Trustees’ fees and expenses in the Statement of Operations. The portion of the accrued obligations allocated to the Portfolio under the Plan is reflected as Deferred trustees’ fees in the Statement of Assets and Liabilities.
BHFTII-32
Brighthouse Funds Trust II
MetLife Aggregate Bond Index Portfolio
Notes to Financial Statements—December 31, 2023—(Continued)
6. Contractual Obligations
Under the Trust’s organizational documents, its officers and Trustees may be indemnified against certain liabilities and expenses arising out of the performance of their duties to the Trust. Additionally, the Trust has a variety of indemnification obligations under contracts with its service providers. The Trust’s maximum exposure under these arrangements is unknown, as this would involve future claims that may be made against the Trust that have not yet occurred.
7. Income Tax Information
The cost basis of investments for federal income tax purposes at December 31, 2023 was as follows:
| Cost basis of investments |
$ | 2,381,216,615 | ||
|
|
|
|||
| Gross unrealized appreciation |
25,773,410 | |||
| Gross unrealized (depreciation) |
(249,046,223 | ) | ||
|
|
|
|||
| Net unrealized appreciation (depreciation) |
$ | (223,272,813 | ) | |
|
|
|
The tax character of distributions paid for the years ended December 31, 2023 and 2022 were as follows:
| Ordinary Income |
Long-Term Capital Gain | Total | ||||||||||||||||||
| 2023 |
2022 | 2023 | 2022 | 2023 | 2022 | |||||||||||||||
| $54,985,622 | $ | 60,641,436 | $ | — | $ | — | $ | 54,985,622 | $ | 60,641,436 | ||||||||||
As of December 31, 2023, the components of distributable earnings (accumulated losses) on a federal income tax basis were as follows:
| Undistributed |
Undistributed Long-Term Capital Gain |
Net Unrealized Appreciation (Depreciation) |
Accumulated Capital Losses |
Total | ||||||||||||
| $56,240,466 | $ | — | $ | (223,272,814 | ) | $ | (126,138,727 | ) | $ | (293,171,075 | ) | |||||
The Portfolio utilizes the provisions of the federal income tax laws that provide for the carryforward of capital losses for prior years, offsetting such losses against any future realized capital gains. Net capital losses may be carried forward indefinitely and their character is retained as short-term and/or long-term losses.
As of December 31, 2023, the Portfolio had accumulated short-term capital losses of $21,627,798 and accumulated long-term capital losses of $104,510,929.
8. Recent Accounting Pronouncement & Regulatory Updates
In June 2022, FASB issued Accounting Standards Update 2022-03—Fair Value Measurement (Topic 820)—Fair Value Measurement of Equity Securities Subject to Contractual Sale Restrictions (“ASU 2022-03”). ASU 2022-03 clarifies the guidance in Topic 820 to indicate that a contractual sale restriction should not be considered in the fair value of an equity security subject to such a restriction, and requires entities with investments in equity securities subject to contractual sale restrictions to disclose certain qualitative and quantitative information about such securities. ASU 2022-03 is effective for fiscal years, and interim periods within those fiscal years, beginning after December 15, 2023. ASU 2022-03 is only applicable to an equity security in which the contractual arrangement that restricts its sale is executed or modified on or after the adoption date.
Effective January 24, 2023, the Securities and Exchange Commission adopted rule and form amendments that require open-end management investment companies to transmit concise and visually engaging annual and semiannual reports to shareholders that highlight certain information deemed by the SEC to be particularly important for investors. Certain other information, including financial statements, will no longer appear in shareholder reports but will, as required, be available online, delivered free of charge upon request, and filed on a semiannual basis on Form N-CSR. The rule and form amendments have a compliance date of July 24, 2024. Accordingly, the rule and form amendments will not impact the Portfolio until its 2024 semiannual shareholder report.
BHFTII-33
Brighthouse Funds Trust II
MetLife Aggregate Bond Index Portfolio
Report of Independent Registered Public Accounting Firm
To the Board of Trustees of Brighthouse Funds Trust II and Shareholders of the MetLife Aggregate Bond Index Portfolio:
Opinion on the Financial Statements and Financial Highlights
We have audited the accompanying statement of assets and liabilities, including the schedule of investments, of the MetLife Aggregate Bond Index Portfolio (the “Fund”) (one of the funds constituting the Brighthouse Funds Trust II), as of December 31, 2023, the related statement of operations for the year then ended, the statements of changes in net assets for each of the two years in the period then ended, the financial highlights for each of the five years in the period then ended, and the related notes. In our opinion, the financial statements and financial highlights present fairly, in all material respects, the financial position of the Fund as of December 31, 2023, and the results of its operations for the year then ended, the changes in its net assets for each of the two years in the period then ended, and the financial highlights for each of the five years in the period then ended in conformity with accounting principles generally accepted in the United States of America.
Basis for Opinion
These financial statements and financial highlights are the responsibility of the Fund’s management. Our responsibility is to express an opinion on the Fund’s financial statements and financial highlights based on our audits. We are a public accounting firm registered with the Public Company Accounting Oversight Board (United States) (PCAOB) and are required to be independent with respect to the Fund in accordance with the U.S. federal securities laws and the applicable rules and regulations of the Securities and Exchange Commission and the PCAOB.
We conducted our audits in accordance with the standards of the PCAOB. Those standards require that we plan and perform the audit to obtain reasonable assurance about whether the financial statements and financial highlights are free of material misstatement, whether due to error or fraud. The Fund is not required to have, nor were we engaged to perform, an audit of its internal control over financial reporting. As part of our audits we are required to obtain an understanding of internal control over financial reporting but not for the purpose of expressing an opinion on the effectiveness of the Fund’s internal control over financial reporting. Accordingly, we express no such opinion.
Our audits included performing procedures to assess the risks of material misstatement of the financial statements and financial highlights, whether due to error or fraud, and performing procedures that respond to those risks. Such procedures included examining, on a test basis, evidence regarding the amounts and disclosures in the financial statements and financial highlights. Our audits also included evaluating the accounting principles used and significant estimates made by management, as well as evaluating the overall presentation of the financial statements and financial highlights. Our procedures included confirmation of securities owned as of December 31, 2023, by correspondence with the custodian and brokers; when replies were not received from brokers, we performed other auditing procedures. We believe that our audits provide a reasonable basis for our opinion.
/s/ Deloitte & Touche LLP
Boston, Massachusetts
February 23, 2024
We have served as the auditor of one or more Brighthouse investment companies since 1983.
BHFTII-34
Brighthouse Funds Trust II
Trustees and Officers
MANAGEMENT OF THE TRUSTS
The Boards of Trustees (the “Board”) of Brighthouse Funds Trust I and Brighthouse Funds Trust II (“Trust I” and “Trust II”, respectively, and collectively the “Trusts”) supervise the Trusts and are responsible for representing the interests of shareholders. The Trustees, the Chairman of the Board and the Chairmen of each subcommittee are the same for both Trusts. The Trustees of each Trust meet periodically throughout the year to oversee the Portfolios’ activities, reviewing, among other things, each Portfolio’s performance and its contractual arrangements with various service providers. The Trustees of each Trust elect the officers of the Trust, who are responsible for administering the Trust’s day-to-day operations.
Trustees and Officers
The Trustees and executive officers of the Trusts, as well as their ages and their principal occupations during the past five years, are set forth below. Unless otherwise indicated, the business address of each is c/o Brighthouse Funds Trust I and Brighthouse Funds Trust II, 11225 N. Community House Rd., Charolette, North Carolina 28277. Each Trustee who is deemed an “interested person,” as such term is defined in the 1940 Act, is referred to as an “Interested Trustee.” Those Trustees who are not “interested persons,” as such term is defined in the 1940 Act, are referred to as “Independent Trustees.” There is no limit to the term a Trustee may serve, other than pursuant to the retirement policy adopted by the Independent Trustees. Trustees serve until their death, resignation, retirement or removal in accordance with Trust I’s and Trust II’s respective organizational documents and policies adopted by the Board of the Trust from time to time. Officers hold office at the pleasure of each Board and serve until their removal or resignation in accordance with the Trusts’ respective organizational documents and policies adopted by the Board of each Trust from time to time.
Trustees of the Trusts
| Name and Year of Birth |
Position(s) |
Term of Office |
Principal Occupation(s) During the Past |
Number of |
Other Directorships Held | |||||
| Interested Trustee | ||||||||||
| John Rosenthal* (1960) |
Trustee | Indefinite; From May 2016 (Trust I and Trust II) to present | Chief Investment Officer, Brighthouse Financial, Inc. (2016 to present). | 73 | None | |||||
| Independent Trustees | ||||||||||
| Dawn M. Vroegop (1966) |
Trustee and Chair of the Board | Indefinite; From December 2000 (Trust I)/May 2009 (Trust II) to present as Trustee; From May 2016 (Trust I and Trust II) until present as Chair |
Retired; Private Investor. | 73 | Trustee, Driehaus Mutual Funds (8 portfolios).** | |||||
| Stephen M. Alderman (1959) |
Trustee | Indefinite; From December 2000 (Trust I)/April 2012 (Trust II) to present | Vice President and General Counsel, IHR Aerial Solutions, LLC; Until 2022, General Counsel, Illini Hi-Reach, Inc.; Until 2020, Shareholder in the law firm of Garfield & Merel, Ltd. | 73 | None | |||||
| Robert J. Boulware (1956) |
Trustee | Indefinite; From March 2008 (Trust I)/April 2012 (Trust II) to present | Managing Member, Pilgrim Funds, LLC (private equity fund). | 73 | Trustee, Vertical Capital Income Fund (closed-end fund);** Trustee, The Private Shares Fund (closed-end fund);** Until 2021, Director, Mid-Con Energy Partners, LP (energy);** Until 2020, Director, Gainsco, Inc. (auto insurance).** | |||||
BHFTII-35
Brighthouse Funds Trust II
Trustees and Officers—(Continued)
| Name and Year of Birth |
Position(s) |
Term of Office |
Principal Occupation(s) During the Past |
Number of |
Other Directorships Held | |||||
| Susan C. Gause (1952) |
Trustee | Indefinite; From March 2008 (Trust I)/April 2012 (Trust II) to present | Private Investor. | 73 | Trustee, HSBC Funds (4 portfolios).** | |||||
| Nancy Hawthorne (1951) |
Trustee | Indefinite; From May 2003 (Trust II)/April 2012 (Trust I) to present | Private Investor. | 73 | Trustee, First Eagle Credit Opportunities Fund;** Trustee and Chair of the Board of Trustees, First Eagle Global Opportunities Fund;** Director, Avid Technology, Inc;** Director, CRA International, Inc.** | |||||
Executive Officers of the Trusts
| Name and Year of Birth |
Position(s) |
Term of Office |
Principal Occupation(s) | |||
| Kristi Slavin (1973) | President and Chief Executive Officer, of Trust I and Trust II | From May 2016 (Trust I and Trust II) to present |
President, Brighthouse Investment Advisers, LLC (2016-present). | |||
| Alan R. Otis (1971) | Chief Financial Officer and Treasurer, of Trust I and Trust II | From November 2017 (Trust I and Trust II) to present |
Executive Vice President, Brighthouse Investment Advisers, LLC (2017-present); formerly, Vice President, Brighthouse Investment Advisers, LLC (2012-2017); Assistant Treasurer, Trust I and Trust II (2012-2017). | |||
| Thomas Watterson (1985) | Secretary, of Trust I and Trust II | From November 2023 (Trust I and Trust II) to present |
Executive Vice President, Chief Legal Officer and Secretary, Brighthouse Investment Advisers, LLC (2023-Present); Managing Corporate Counsel, Brighthouse Financial Inc. (2023-present); Managing Counsel and Director, The Bank of New York Mellon Corporation (2019-2023); Counsel and Vice President, The Bank of New York Mellon Corporation (2016-2019). | |||
| Katie Hellmann (1980) | Chief Compliance Officer (“CCO”), of Trust I and Trust II | From May 2023 (Trust I and Trust II) to present |
Chief Compliance Officer, Brighthouse Investment Advisers, LLC (2023-present) and Head of Funds and Investments Compliance (2023-present). Deputy Chief Compliance Officer, Transamerica Asset Management (2022-2023). Leader and Senior Compliance Counsel – Funds Compliance, Edward Jones (2017-2022). | |||
| Rosemary Morgan (1983) | Anti-Money Laundering Officer, of Trust I and Trust II | From May 2023 (Trust I and Trust II) to present |
Chief Privacy Officer, Leader of Compliance Programs and Assistant General Counsel, Brighthouse Financial, Inc. (2019-2022); Chief Privacy Officer, Head of Compliance Programs & Contracts Law, Brighthouse Financial, Inc. (2022-2023), Chief Compliance Officer and Associate General Counsel, Brighthouse Financial, Inc. (2023-present); Vice President and Chief Compliance Officer, Brighthouse Life Insurance Company (2023-present); Vice President and Chief Compliance Officer (2023-present), Brighthouse Life Insurance Company of NY; Vice President and Chief Compliance Officer (2023-present), New England Life Insurance Company. | |||
| Anna Koska (1981) | Vice President, of Trust I and Trust II | From June 2022 (Trust I and Trust II) to present |
Vice President, Investment and Advisory Services, Brighthouse Investment Advisers, LLC (2022-present); Director of Investment and Advisory Services, Brighthouse Investment Advisers, LLC (2019-2022); Senior Portfolio Analyst, Brighthouse Investment Advisers, LLC (2017-2019). | |||
| * | Mr. Rosenthal is an “interested person” of the Trusts because of his position with Brighthouse Financial, Inc. (“Brighthouse Financial”), an affiliate of BIA. |
| ** | Indicates a directorship with a registered investment company or a company subject to the reporting requirements of the Securities Exchange Act of 1934, as amended. |
| (1) | Previous positions during the past five years with the Trusts, MetLife, Inc. or the Adviser are omitted if not materially different. |
| (2) | The Fund Complex includes 44 Trust I Portfolios and 29 Trust II Portfolios. |
BHFTII-36
Brighthouse Funds Trust II
MetLife Aggregate Bond Index Portfolio
Board of Trustees’ Consideration of Advisory and Sub-Advisory Agreements
At a meeting held on November 13-14, 2023 (the “November Meeting”), the Boards of Trustees (the “Board”) of Brighthouse Funds Trust I and Brighthouse Funds Trust II (“BFT I” and “BFT II,” respectively, and collectively, the “Trusts”), including a majority of the Trustees who are not “interested persons” of the Trusts (the “Independent Trustees”) under the Investment Company Act of 1940 (the “1940 Act”), approved the continuation of the Trusts’ advisory agreements (each an “Advisory Agreement”) with Brighthouse Investment Advisers, LLC (the “Adviser”) and the applicable sub-advisory and sub-sub-advisory agreements (each a “Sub-Advisory Agreement” and collectively with the Advisory Agreement, the “Agreements”) between the Adviser and the investment sub-advisers and sub-sub-adviser (each a “Sub-Adviser,” and collectively, the “Sub-Advisers”) for the series of the Trusts (each a “Portfolio,” and collectively, the “Portfolios”) for the annual contract renewal period from January 1, 2024 through December 31, 2024.
The Board met with personnel of the Adviser on September 28-29, 2023 (the “September Meeting”) for the specific purpose of giving preliminary consideration to the proposed continuation of the Agreements, including consideration to information that the Adviser and Sub-Advisers had provided for the Board’s review at the request of the Independent Trustees. At the September Meeting, the Adviser reviewed with the Board the performance and fees experienced by each Portfolio, as well as other information. During and after the September Meeting, the Independent Trustees requested additional information and clarifications that the Adviser addressed at the November Meeting (the September Meeting and the November Meeting are referred to collectively as, the “Meetings”). During the contract renewal process, and throughout the year, the Independent Trustees were advised by independent legal counsel, and they met with independent legal counsel in executive sessions outside of the presence of management on a number of occasions to discuss, among other things, the renewal of the Agreements.
In considering the continuation of the Agreements, the Board reviewed a variety of materials that were provided for the specific purpose of assisting the Board in the renewal process, along with various information and materials that were provided to and discussed with the Board throughout the year, at regularly scheduled meetings of the Board and its committees. In particular, information for each Portfolio included, but was not limited to, reports on investment performance, expenses, legal and compliance matters, and asset pricing. Information about the Adviser and each Sub-Adviser included, but was not limited to, reports on the business, operations, and performance of the Adviser and the Sub-Advisers and reports that the Adviser and Sub-Advisers had prepared specifically for the renewal process.
In considering the continuation of the Agreements, the Board also reviewed, among other things, a report for each Portfolio that was prepared by Broadridge (“Broadridge”), an independent organization, which set forth comparative performance and expense information for each Portfolio. In addition, the Independent Trustees reviewed a report that was prepared by JDL Consultants, LLC (“JDL”), an independent consultant to the Independent Trustees, which examined the Broadridge reports for each Portfolio (“JDL Report”). The Independent Trustees met in executive session with representatives of JDL during the September Meeting to review the JDL Report.
At the November Meeting, the Board, including a majority of the Independent Trustees, concluded that the nature, extent, and quality of services provided by the Adviser and each Sub-Adviser supported the renewal of the Agreements. The Board also concluded that the investment services provided to and the performance of each Portfolio was such that each Agreement should continue, and that the fees paid by each Portfolio to the Adviser appeared to be reasonable in light of the nature, extent, and quality of the services provided by the Adviser and each Sub-Adviser. Further, the Board concluded that the Adviser’s profitability in providing services under the Advisory Agreements did not appear unreasonable in light of the nature, extent, and quality of the services provided by the Adviser. The Board reviewed the extent to which the investment advisory fees paid by the Portfolios shared economies of scale with investors or entailed the potential to share economies of scale with investors and concluded that those considerations generally supported the renewal of each Agreement. Finally, the Board considered the Adviser’s recommendation that it approve the renewal of each Sub-Advisory Agreement.
In approving the continuation of each Agreement, the Board, including the Independent Trustees, gave attention to all of the information that was furnished, and each Trustee placed varying degrees of importance on the various pieces of information that were provided to them. The Board evaluated the information provided to it on a Portfolio-by-Portfolio basis, and its decision was made separately with respect to each Portfolio. The following paragraphs provide more information about some of the primary factors that were relevant to the Board’s decisions. The Board did not identify any single factor as determinative, and the Trustees generally attributed different weights to various factors for the various Portfolios.
Nature, extent and quality of services. The Board evaluated the nature, extent, and quality of the services that the Adviser and the Sub-Advisers, as relevant, provided to the Portfolios. The Board considered the Adviser’s services as investment manager to the Portfolios, including its services relating to the hiring and oversight of the Sub-Advisers and, in particular, their investment programs and personnel, succession management of key personnel, trading practices, compliance programs and personnel, and risk management
BHFTII-37
Brighthouse Funds Trust II
MetLife Aggregate Bond Index Portfolio
Board of Trustees’ Consideration of Advisory and Sub-Advisory Agreements—(Continued)
programs, among other things. The Adviser’s services in coordinating and overseeing the activities of the Trusts’ other service providers were also considered. The Board also considered the systems and processes required by the Adviser to meet additional regulatory and compliance requirements resulting from U.S. Securities and Exchange Commission and other regulatory initiatives, including related to liquidity, valuation, and derivatives risk management. The Board considered information received from the Trusts’ Chief Compliance Officer regarding the Portfolios’ compliance policies and procedures that were established pursuant to Rule 38a-l under the 1940 Act, and relevant aspects of the Adviser’s and Sub-Advisers’ compliance policies and procedures. The Board also noted that it was the practice of the Adviser’s investment, compliance, and legal staff to conduct periodic meetings (through various media) with the Sub-Advisers throughout the year in order to review and assess the services that are provided to the Portfolios, and that personnel of the Adviser routinely prepare and present reports to the Board regarding those meetings. In addition, during the Meetings and throughout the year, the Board considered the expertise, experience, and performance of the personnel of the Adviser who performed the various services that are mentioned above.
With respect to the services provided by each of the Sub-Advisers, the Board considered a variety of information that the Adviser and each Sub-Adviser prepared for the Board’s review. The Board considered each Sub-Adviser’s investment process, each Sub-Adviser’s overall organization and business plans and the investment performance experienced by the Portfolio (as described in more detail below). The Board took into account that each Sub-Adviser’s responsibilities include, among other things, the development and maintenance of an investment program for the applicable Portfolio, the selection of investments and the placement of orders for the purchase and sale of such assets, and the implementation of compliance controls related to the performance of these services. The Board considered, based on the information provided, each Sub-Adviser’s staffing with respect to the management of the Portfolio and other information relating to the Sub-Adviser’s business and operations. The Board also considered the Sub-Adviser’s overall resources and information with respect to any recent turnover of key personnel at the Sub-Adviser. The Board reviewed each Sub-Adviser’s investment experience, as well as information provided regarding the Sub-Adviser’s personnel who provide services to the Portfolios. The Board also considered, among other things, information about each Sub-Adviser’s compliance program, including regarding any compliance matters involving a Sub-Adviser that had been brought to the Board’s attention during the year, as well as the Adviser’s assessment of the financial condition of each Sub-Adviser.
Performance. The Board placed emphasis on the performance of each Portfolio in the context of the performance of the relevant markets in which the Portfolio invests. The Board considered the Adviser’s quarterly presentations to the Board of detailed information about each Portfolio’s investment strategies and performance results and composition, including discussions regarding the relevant effects of market conditions. The Board reviewed and considered the reports prepared by Broadridge, which provided a statistical analysis comparing each Portfolio’s investment performance to that of comparable funds underlying variable insurance products (the “Performance Universe”), and the JDL Report. The Board also compared the performance of each Portfolio to that of comparable funds and other accounts that were managed by the relevant Sub-Adviser, to the extent such information was provided. The Board considered each Portfolio’s performance for periods subsequent to the performance period covered by the Broadridge reports and considered the Adviser’s assessment of the same. The Board also noted that while it found the data provided by Broadridge generally useful, it recognized the limitations of such data, including, in particular, that notable differences may exist between a Portfolio and the other funds in a Broadridge category (for example, with respect to investment strategies) and that the results of the performance comparisons may vary depending on (i) the end dates for the performance periods that were selected and (ii) the selection of the peer groups.
The Board focused particular attention on Portfolios with less favorable performance records. The Board noted the Adviser’s focus on each Sub-Adviser’s performance and that the Adviser had been active in monitoring and responding to any performance issues with respect to the Portfolios.
Fees and Expenses. The Board gave consideration to the level and method of computing the fees payable under the Agreements. The Board reviewed and considered the information in the JDL Report concerning fees and expenses. The Board also reviewed and considered the Broadridge report for each Portfolio, which included various comparisons of the Portfolio’s fees (at December 31, 2022 and various asset levels) and expenses with those of its peers, including, as applicable, a broad group of peer funds (“Expense Universe”), a narrower group of peer funds (“Expense Group”), a broad group of peer sub-advised funds (“Sub-advised Expense Universe”), and a narrower group of peer sub-advised funds (“Sub-advised Expense Group”). In particular, the Board reviewed comparisons of each Portfolio’s contractual management fees with its Expense Group and Sub-advised Expense Universe, contractual sub-adviser fees with its Sub-advised Expense Universe and Sub-advised Expense Group, and total expenses with its Expense Universe, Expense Group and Sub-advised Expense Universe. The Board considered that Broadridge selected the peer funds, which were funds underlying variable insurance products that Broadridge deemed to be comparable to the Portfolios. The Board considered that the fee and expense information in the Broadridge report for each Portfolio reflected information as of the Portfolio’s most recent fiscal year
BHFTII-38
Brighthouse Funds Trust II
MetLife Aggregate Bond Index Portfolio
Board of Trustees’ Consideration of Advisory and Sub-Advisory Agreements—(Continued)
end at the time the Broadridge report was issued and that historical asset levels may differ from current asset levels, particularly in a period of market volatility. In addition, the Board compared the fee payable to a Sub-Adviser by the Adviser with respect to the Portfolio to the fee payable to the Sub-Adviser by other comparable funds and other accounts, to the extent such information was provided.
The Board noted that the sub-advisory fees for the Portfolios are negotiated at arm’s length by the Adviser and are paid by the Adviser out of its advisory fees. The Board also considered that the Adviser had entered into expense limitation or management fee waiver agreements with certain of the Portfolios pursuant to which the Adviser had agreed to waive a portion of its advisory fee and/or reimburse certain expenses as a means of limiting a Portfolio’s total annual operating expenses or passing through the benefit of a subadvisory fee concession to a Portfolio, as applicable.
Profitability. The Board examined the profitability to the Adviser of each Advisory Agreement, on a Portfolio-by-Portfolio basis. The Board also considered that an affiliate of the Adviser, Brighthouse Securities, LLC, serves as distributor for the Trusts, and, as such, receives Rule 12b-1 payments to support the distribution of the Portfolios. The Board considered the profitability to the Sub-Advisers and their affiliates of their relationships with the Portfolios, to the extent provided, and the Board considered the ability of the Adviser to negotiate with a Sub-Adviser at arm’s length. In reviewing the profitability information, the Board recognized that expense allocation methodologies are inherently subjective and various methodologies may be reasonable while producing different results.
Economies of scale. The Board considered each Portfolio’s fees in light of its size. The Board noted the fee schedules for the Portfolios that contain breakpoints that reduce the fee rate above specified asset levels, including breakpoints in the Advisory Agreements and any corresponding Sub-Advisory Agreement. The Board noted those Portfolios that did not have breakpoints in their advisory fees and considered management’s explanation of the same.
The Board considered the effective fees under the Advisory Agreement and Sub-Advisory Agreement for each Portfolio as a percentage of assets at different asset levels and possible economies of scale that may be realized if the assets of the Portfolio grow. The Board examined, among other data, the effect of a Portfolio’s growth in size, and reduction in size, on various fee schedules. The Board also generally noted that if a Portfolio’s assets increase over time, the Portfolio may realize economies of scale if assets increase proportionally more than certain other expenses.
Other factors. The Board considered other benefits that may be realized by the Adviser and its affiliates from their relationships with the Trusts. Among the benefits realized by the Adviser, the Board recognized that Brighthouse Securities, LLC, as the distributor for the Trusts, receives payments pursuant to Rule 12b-1 from the Portfolios to help compensate for the provision of shareholder services and distribution activities. The Board considered that a Sub-Adviser may engage in soft dollar transactions in managing a Portfolio. In addition, the Board considered that a Sub-Adviser may be affiliated with registered broker-dealers that may, from time to time, receive brokerage commissions from a Portfolio in connection with the sale of portfolio securities (subject to applicable best execution obligations). The Board also considered that a Sub-Adviser and its affiliates could benefit from the opportunity to provide advisory services to additional portfolios of the Trusts and overall reputational benefits.
The Board considered information from the Adviser and Sub-Advisers pertaining to potential conflicts of interest, and the manner in which any potential conflicts were mitigated. In its review, the Board considered information regarding various business relationships among the Adviser and its affiliates and various Sub-Advisers and their affiliates. The Board also considered information about services and/or payments provided to the Adviser by the Sub-Advisers in connection with marketing activities. The Board considered representations from the Adviser that such business relationships and any payments were not considered in the Adviser’s recommendation to renew any of the Sub-Advisory Agreements.
* * * * *
MetLife Aggregate Bond Index Portfolio. The Board also considered the following information in relation to the Agreements with the Adviser and MetLife Investment Management, LLC regarding the Portfolio:
Among other data relating specifically to the Portfolio’s performance, the Board considered that the Portfolio outperformed the median of its Performance Universe and the average of its Morningstar Category for the one-year period ended June 30, 2023 and underperformed the median of its Performance Universe and the average of its Morningstar Category for the three- and five-year periods ended June 30, 2023. The Board further considered that the Portfolio underperformed its benchmark, the Bloomberg U.S. Aggregate Bond Index, for the one-, three-, and five-year periods ended October 31, 2023, and the Board noted management’s explanation of the tracking error between the Portfolio and the Index. The Board also noted the presence of certain management fee waivers in effect for the Portfolio.
BHFTII-39
Brighthouse Funds Trust II
MetLife Aggregate Bond Index Portfolio
Board of Trustees’ Consideration of Advisory and Sub-Advisory Agreements—(Continued)
The Board also considered that the Portfolio’s actual management fees were below the Expense Group median and above the Expense Universe median and the Sub-advised Expense Universe median. The Board further considered that the Portfolio’s total expenses (exclusive of 12b-1 fees) were below the Expense Group median and the Sub-advised Expense Universe median and above the Expense Universe median. The Board noted that the Portfolio’s contractual management fees were below the asset-weighted average of the Investment Classification/Morningstar Category selected by Broadridge at the Portfolio’s current size. The Board also noted that the Portfolio’s contractual sub-advisory fees were below the averages of the Sub-advised Expense Group and the Sub-advised Expense Universe at the Portfolio’s current size.
BHFTII-40
Brighthouse Funds Trust II
MetLife Mid Cap Stock Index Portfolio
Managed By MetLife Investment Management, LLC
Portfolio Manager Commentary*
PERFORMANCE
For the twelve months ended December 31, 2023, the Class A, B, E and G shares of the MetLife Mid Cap Stock Index Portfolio returned 16.08%, 15.76%, 15.91%, and 15.76%, respectively. The Portfolio’s benchmark, the Standard & Poor’s (“S&P”) MidCap 400 Index¹, returned 16.44%.
MARKET ENVIRONMENT / CONDITIONS
Equity markets climbed in 2023 on signals that the U.S. Federal Reserve (the “Fed”) would begin cutting interest rates in 2024. Equity investors remained hopeful that the Fed would be able to navigate a soft landing as they slowed the pace of quantitative tightening. Other factors that supported the equity markets included a healthy job market, better than expected macroeconomic data, and strong corporate earnings. Some of the fears that concerned equity investors included rising risks of recession and the effect that high bond yields would have on the economy. In addition, continued high inflation and rising geopolitical risk from the wars in Ukraine and Israel weighed on the equity markets.
During the year, the Federal Open Market Committee (the “FOMC”) met eight times. In December, the FOMC decided to maintain the target range for the Federal Funds Rate at 5.25%-5.50%. The FOMC stated that the growth of economic activity had slowed from its strong pace in the third quarter, and inflation had eased over the past year but remained elevated. The FOMC seeks to achieve maximum employment and inflation at the rate of 2 percent over the long run.
Nine of the eleven sectors comprising the S&P MidCap 400 Index experienced positive returns for the year. Industrials (19.8% beginning weight in the benchmark), up 31.3%, was the best-performing sector and had the largest positive impact on the benchmark return. Information Technology (12.1% beginning weight), up 28.7%, and Consumer Discretionary (14.0% beginning weight), up 24.2%, were the next best-performing sectors. Utilities (4.1% beginning weight), down 13.2%, and Communication Services (2.1% beginning weight), down 7.5%, were the worst-performing sectors.
The stocks with the largest positive impact on the benchmark return for the year were Super Micro Computer, up 246.2%; Builders FirstSource, up 150.5%; and Jabil, up 95.5%. The stocks with the largest negative impact were Medical Properties Trust, down 50.2%; First Horizon, down 39.5%; and Wolfspeed, down 37.0%.
PORTFOLIO REVIEW / PERIOD END POSITIONING
The Portfolio is managed utilizing a full replication strategy versus the S&P MidCap 400 Index (the “Index”). This strategy seeks to replicate the performance of the Index by owning all of the components of the Index at their respective Index capitalization weights. The Portfolio is periodically rebalanced for compositional changes in the S&P MidCap 400 Index. Factors that impact tracking error include transaction costs, cash drag, securities lending, net asset value (“NAV”) rounding, and contributions and withdrawals.
Norman Hu
Mirsad Usejnoski
Portfolio Managers
MetLife Investment Management, LLC
* This commentary may include statements that constitute “forward-looking statements” under the U.S. securities laws. Forward-looking statements include, among other things, projections, estimates, and information about possible or future results related to the Portfolio, market or regulatory developments. The views expressed above are not guarantees of future performance or economic results and involve certain risks, uncertainties and assumptions that could cause actual outcomes and results to differ materially from the views expressed herein. The views expressed above are subject to change at any time based upon economic, market, or other conditions and the subadvisory firm undertakes no obligation to update the views expressed herein. Any discussions of specific securities should not be considered a recommendation to buy or sell those securities. The views expressed above (including any forward-looking statement) may not be relied upon as investment advice or as an indication of the Portfolio’s trading intent. Information about the Portfolio’s holdings, asset allocation or country diversification is historical and is not an indication of future Portfolio composition, which may vary. Direct investment in any index is not possible. The performance of any index mentioned in this commentary has not been adjusted for ongoing management, distribution and operating expenses, and sales charges applicable to mutual fund investments. In addition, the returns do not reflect additional fees charged by separate accounts or variable insurance contracts that an investor in the Portfolio may pay. If these additional fees were reflected, performance would have been lower.
1 The S&P MidCap 400 Index is an unmanaged index designed to measure the performance of 400 mid-sized U.S. companies, reflecting the distinctive risk and return characteristics of this market segment.
BHFTII-1
Brighthouse Funds Trust II
MetLife Mid Cap Stock Index Portfolio
A $10,000 INVESTMENT COMPARED TO THE S&P MIDCAP 400 INDEX
AVERAGE ANNUAL RETURNS (%) FOR THE YEAR ENDED DECEMBER 31, 2023
| 1 Year | 5 Year | 10 Year | ||||||||||
| MetLife Mid Cap Stock Index Portfolio | ||||||||||||
| Class A |
16.08 | 12.34 | 9.01 | |||||||||
| Class B |
15.76 | 12.05 | 8.73 | |||||||||
| Class E |
15.91 | 12.17 | 8.84 | |||||||||
|
Class G |
15.76 | 12.00 | 8.68 | |||||||||
| S&P MidCap 400 Index | 16.44 | 12.62 | 9.28 | |||||||||
Portfolio performance is calculated including reinvestment of all income and capital gain distributions. Performance numbers are net of all Portfolio expenses but do not include any insurance, sales, separate account or administrative charges of variable annuity or life insurance contracts or any additional expenses that participants may bear relating to the operations of their plans. If these charges were included, the returns would be lower. The performance of any index referenced above has not been adjusted for ongoing management, distribution and operating expenses, and sales charges applicable to mutual fund investments. Direct investment in any index is not possible. The performance of Class A shares, as set forth in the line graph above, will differ from that of other classes because of the difference in expenses paid by policyholders investing in the different share classes.
This information represents past performance and is not indicative of future results. Investment return and principal value may fluctuate so that shares, upon redemption, may be worth more or less than the original cost.
PORTFOLIO COMPOSITION AS OF DECEMBER 31, 2023
Top Holdings
| % of Net Assets |
||||
| SPDR S&P MidCap 400 ETF Trust | 1.8 | |||
| Deckers Outdoor Corp. | 0.7 | |||
| Reliance Steel & Aluminum Co. | 0.6 | |||
| Carlisle Cos., Inc. | 0.6 | |||
| GoDaddy, Inc.- Class A | 0.6 | |||
| Graco, Inc. | 0.6 | |||
| Watsco, Inc. | 0.6 | |||
| RPM International, Inc. | 0.6 | |||
| Lennox International, Inc. | 0.6 | |||
| WP Carey, Inc. | 0.5 | |||
Top Sectors
| % of Net Assets |
||||
| Industrials | 20.6 | |||
| Financials | 17.4 | |||
| Consumer Discretionary | 15.3 | |||
| Information Technology | 9.3 | |||
| Real Estate | 7.8 | |||
| Health Care | 7.5 | |||
| Materials | 7.0 | |||
| Energy | 4.9 | |||
| Consumer Staples | 4.0 | |||
| Utilities | 3.1 | |||
BHFTII-2
Brighthouse Funds Trust II
MetLife Mid Cap Stock Index Portfolio
Understanding Your Portfolio’s Expenses
Shareholder Expense Example
As a shareholder of the Portfolio, you incur ongoing costs, including management fees; distribution and service (12b-1) fees; and other Portfolio expenses. This example is intended to help you understand your ongoing costs (in dollars) (referred to as “expenses”) of investing in the Portfolio and compare these costs with the ongoing costs of investing in other mutual funds. The example is based on an investment of $1,000 invested at the beginning of the period and held for the entire period, July 1, 2023 through December 31, 2023.
Actual Expenses
The first line for each share class of the Portfolio in the table below provides information about actual account values and actual expenses. You may use the information in this line, together with the amount you invested in the particular share class of the Portfolio, to estimate the expenses that you paid over the period. Simply divide your account value by $1,000 (for example, an $8,600 account value divided by $1,000 = 8.6), then multiply the result by the number in the first line under the heading entitled “Expenses Paid During Period” to estimate the expenses you paid on your account during this period.
Hypothetical Example for Comparison Purposes
The second line for each share class of the Portfolio in the table below provides information about hypothetical account values and hypothetical expenses based on the Portfolio’s actual expense ratio and an assumed rate of return of 5% per year before expenses, which is not the Portfolio’s actual return. The hypothetical account values and expenses may not be used to estimate the actual ending account balance or expenses you paid for the period. You may use this information to compare the ongoing costs of investing in the Portfolio and other funds. To do so, compare this 5% hypothetical example with the 5% hypothetical examples that appear in the shareholder reports of the other funds.
Please note that the expenses shown in the table are meant to highlight your ongoing costs only and do not reflect any fees or charges of your variable insurance product or any additional expenses that participants in certain eligible qualified plans may bear relating to the operations of their plan. Therefore, the second line for each share class in the table is useful in comparing ongoing costs only, and will not help you determine the relative total costs of owning different funds. In addition, if these other costs were included, your costs would have been higher.
| MetLife Mid Cap Stock Index Portfolio |
Annualized Expense Ratio |
Beginning Account Value July 1, 2023 |
Ending Account Value December 31, 2023 |
Expenses Paid During Period** July 1, 2023 to December 31, 2023 |
||||||||||||||
| Class A (a) |
Actual | 0.30 | % | $ | 1,000.00 | $ | 1,068.40 | $ | 1.56 | |||||||||
| Hypothetical* | 0.30 | % | $ | 1,000.00 | $ | 1,023.69 | $ | 1.53 | ||||||||||
| Class B (a) |
Actual | 0.55 | % | $ | 1,000.00 | $ | 1,066.80 | $ | 2.87 | |||||||||
| Hypothetical* | 0.55 | % | $ | 1,000.00 | $ | 1,022.43 | $ | 2.80 | ||||||||||
| Class E (a) |
Actual | 0.45 | % | $ | 1,000.00 | $ | 1,067.40 | $ | 2.34 | |||||||||
| Hypothetical* | 0.45 | % | $ | 1,000.00 | $ | 1,022.94 | $ | 2.29 | ||||||||||
| Class G (a) |
Actual | 0.60 | % | $ | 1,000.00 | $ | 1,066.50 | $ | 3.13 | |||||||||
| Hypothetical* | 0.60 | % | $ | 1,000.00 | $ | 1,022.18 | $ | 3.06 | ||||||||||
| * | Hypothetical assumes a rate of return of 5% per year before expenses. |
| ** | Expenses paid are equal to the Portfolio’s annualized expense ratio for the most recent six month period, as shown above, multiplied by the average account value over the period, multiplied by the number of days (184 days) in the most recent fiscal half-year, divided by 365 (to reflect the one-half year period). |
| (a) | The annualized expense ratio shown reflects the impact of the management fee waiver as described in Note 6 of the Notes to Financial Statements. |
BHFTII-3
Brighthouse Funds Trust II
MetLife Mid Cap Stock Index Portfolio
Schedule of Investments as of December 31, 2023
Common Stocks—96.7% of Net Assets
| Security Description | Shares | Value | ||||||
| Aerospace & Defense—1.2% | ||||||||
| BWX Technologies, Inc. |
36,394 | $ | 2,792,511 | |||||
| Curtiss-Wright Corp. |
15,216 | 3,389,973 | ||||||
| Hexcel Corp. (a) |
33,467 | 2,468,191 | ||||||
| Woodward, Inc. |
24,040 | 3,272,565 | ||||||
|
|
|
|||||||
| 11,923,240 | ||||||||
|
|
|
|||||||
| Air Freight & Logistics—0.3% | ||||||||
| GXO Logistics, Inc. (b) |
47,332 | 2,894,825 | ||||||
|
|
|
|||||||
| Automobile Components—1.5% | ||||||||
| Adient PLC (b) |
37,266 | 1,354,992 | ||||||
| Autoliv, Inc. |
29,799 | 3,283,552 | ||||||
| Fox Factory Holding Corp. (b) |
16,863 | 1,137,915 | ||||||
| Gentex Corp. |
92,811 | 3,031,207 | ||||||
| Goodyear Tire & Rubber Co. (b) |
112,823 | 1,615,625 | ||||||
| Lear Corp. (a) |
23,182 | 3,273,530 | ||||||
| Visteon Corp. (b) |
11,066 | 1,382,144 | ||||||
|
|
|
|||||||
| 15,078,965 | ||||||||
|
|
|
|||||||
| Automobiles—0.4% | ||||||||
| Harley-Davidson, Inc. |
50,428 | 1,857,767 | ||||||
| Thor Industries, Inc. (a) |
21,199 | 2,506,782 | ||||||
|
|
|
|||||||
| 4,364,549 | ||||||||
|
|
|
|||||||
| Banks—5.5% | ||||||||
| Associated Banc-Corp. |
59,133 | 1,264,855 | ||||||
| Bank OZK |
41,865 | 2,086,133 | ||||||
| Cadence Bank |
72,682 | 2,150,660 | ||||||
| Columbia Banking System, Inc. |
82,992 | 2,214,227 | ||||||
| Commerce Bancshares, Inc. (a) |
47,253 | 2,523,783 | ||||||
| Cullen/Frost Bankers, Inc. |
25,484 | 2,764,759 | ||||||
| East West Bancorp, Inc. |
56,076 | 4,034,668 | ||||||
| First Financial Bankshares, Inc. (a) |
51,105 | 1,548,482 | ||||||
| First Horizon Corp. |
222,334 | 3,148,249 | ||||||
| FNB Corp. (a) |
142,778 | 1,966,053 | ||||||
| Glacier Bancorp, Inc. (a) |
44,118 | 1,822,956 | ||||||
| Hancock Whitney Corp. |
34,279 | 1,665,617 | ||||||
| Home BancShares, Inc. (a) |
74,664 | 1,891,239 | ||||||
| International Bancshares Corp. |
21,235 | 1,153,485 | ||||||
| New York Community Bancorp, Inc. (a) |
287,478 | 2,940,900 | ||||||
| Old National Bancorp |
116,434 | 1,966,570 | ||||||
| Pinnacle Financial Partners, Inc. |
30,548 | 2,664,397 | ||||||
| Prosperity Bancshares, Inc. |
37,289 | 2,525,584 | ||||||
| SouthState Corp. (a) |
30,266 | 2,555,964 | ||||||
| Synovus Financial Corp. |
58,189 | 2,190,816 | ||||||
| Texas Capital Bancshares, Inc. (b) |
19,107 | 1,234,885 | ||||||
| UMB Financial Corp. |
17,379 | 1,452,015 | ||||||
| United Bankshares, Inc. (a) |
53,689 | 2,016,022 | ||||||
| Valley National Bancorp (a) |
169,686 | 1,842,790 | ||||||
| Webster Financial Corp. |
68,452 | 3,474,624 | ||||||
| Wintrust Financial Corp. |
24,366 | 2,259,946 | ||||||
|
|
|
|||||||
| 57,359,679 | ||||||||
|
|
|
|||||||
| Beverages—0.6% | ||||||||
| Boston Beer Co., Inc. - Class A (b) |
3,745 | 1,294,235 | ||||||
| Celsius Holdings, Inc. (a) (b) |
58,997 | 3,216,516 | ||||||
| Coca-Cola Consolidated, Inc. |
1,865 | 1,731,466 | ||||||
|
|
|
|||||||
| 6,242,217 | ||||||||
|
|
|
|||||||
| Biotechnology—1.5% | ||||||||
| Arrowhead Pharmaceuticals, Inc. (b) |
42,652 | 1,305,151 | ||||||
| Exelixis, Inc. (b) |
123,736 | 2,968,427 | ||||||
| Halozyme Therapeutics, Inc. (b) |
52,561 | 1,942,655 | ||||||
| Neurocrine Biosciences, Inc. (b) |
39,094 | 5,151,025 | ||||||
| United Therapeutics Corp. (b) |
18,675 | 4,106,446 | ||||||
|
|
|
|||||||
| 15,473,704 | ||||||||
|
|
|
|||||||
| Broadline Retail—0.5% | ||||||||
| Macy’s, Inc. (a) |
108,878 | 2,190,625 | ||||||
| Nordstrom, Inc. (a) |
38,599 | 712,152 | ||||||
| Ollie’s Bargain Outlet Holdings, Inc. (a) (b) |
24,552 | 1,863,251 | ||||||
|
|
|
|||||||
| 4,766,028 | ||||||||
|
|
|
|||||||
| Building Products—3.3% | ||||||||
| Advanced Drainage Systems, Inc. |
27,280 | 3,836,659 | ||||||
| Carlisle Cos., Inc. |
19,371 | 6,052,082 | ||||||
| Fortune Brands Innovations, Inc. (a) |
50,173 | 3,820,172 | ||||||
| Lennox International, Inc. (a) |
12,728 | 5,696,035 | ||||||
| Owens Corning |
35,363 | 5,241,858 | ||||||
| Simpson Manufacturing Co., Inc. |
16,980 | 3,361,700 | ||||||
| Trex Co., Inc. (a) (b) |
43,210 | 3,577,356 | ||||||
| UFP Industries, Inc. |
24,595 | 3,087,902 | ||||||
|
|
|
|||||||
| 34,673,764 | ||||||||
|
|
|
|||||||
| Capital Markets—2.7% | ||||||||
| Affiliated Managers Group, Inc. (a) |
13,453 | 2,037,053 | ||||||
| Carlyle Group, Inc. (a) |
86,136 | 3,504,874 | ||||||
| Evercore, Inc. - Class A |
13,791 | 2,358,950 | ||||||
| Federated Hermes, Inc. |
34,317 | 1,161,974 | ||||||
| Houlihan Lokey, Inc. |
20,537 | 2,462,592 | ||||||
| Interactive Brokers Group, Inc. - Class A |
42,581 | 3,529,965 | ||||||
| Janus Henderson Group PLC |
52,732 | 1,589,870 | ||||||
| Jefferies Financial Group, Inc. |
66,983 | 2,706,783 | ||||||
| Morningstar, Inc. |
10,364 | 2,966,591 | ||||||
| SEI Investments Co. |
39,792 | 2,528,782 | ||||||
| Stifel Financial Corp. |
40,584 | 2,806,383 | ||||||
|
|
|
|||||||
| 27,653,817 | ||||||||
|
|
|
|||||||
| Chemicals—2.3% | ||||||||
| Ashland, Inc. |
20,389 | 1,718,997 | ||||||
| Avient Corp. |
36,272 | 1,507,827 | ||||||
| Axalta Coating Systems Ltd. (b) |
87,571 | 2,974,787 | ||||||
| Cabot Corp. (a) |
21,981 | 1,835,413 | ||||||
| Chemours Co. |
59,063 | 1,862,847 | ||||||
| Livent Corp. (b) |
71,514 | 1,285,822 | ||||||
| NewMarket Corp. |
2,748 | 1,499,941 | ||||||
| Olin Corp. |
48,762 | 2,630,710 | ||||||
| RPM International, Inc. (a) |
51,261 | 5,722,265 | ||||||
| Scotts Miracle-Gro Co. (a) |
16,534 | 1,054,043 | ||||||
See accompanying notes to financial statements.
BHFTII-4
Brighthouse Funds Trust II
MetLife Mid Cap Stock Index Portfolio
Schedule of Investments as of December 31, 2023
Common Stocks—(Continued)
| Security Description | Shares | Value | ||||||
| Chemicals—(Continued) | ||||||||
| Westlake Corp. (a) |
12,747 | $ | 1,784,070 | |||||
|
|
|
|||||||
| 23,876,722 | ||||||||
|
|
|
|||||||
| Commercial Services & Supplies—1.2% | ||||||||
| Brink’s Co. |
17,926 | 1,576,592 | ||||||
| Clean Harbors, Inc. (b) |
20,039 | 3,497,006 | ||||||
| MSA Safety, Inc. |
14,703 | 2,482,307 | ||||||
| Stericycle, Inc. (b) |
36,814 | 1,824,502 | ||||||
| Tetra Tech, Inc. |
21,187 | 3,536,746 | ||||||
|
|
|
|||||||
| 12,917,153 | ||||||||
|
|
|
|||||||
| Communications Equipment—0.5% | ||||||||
| Calix, Inc. (b) |
23,325 | 1,019,069 | ||||||
| Ciena Corp. (b) |
58,826 | 2,647,758 | ||||||
| Lumentum Holdings, Inc. (a) (b) |
26,659 | 1,397,465 | ||||||
|
|
|
|||||||
| 5,064,292 | ||||||||
|
|
|
|||||||
| Construction & Engineering—1.9% | ||||||||
| AECOM |
55,199 | 5,102,043 | ||||||
| Comfort Systems USA, Inc. |
14,211 | 2,922,776 | ||||||
| EMCOR Group, Inc. |
18,719 | 4,032,634 | ||||||
| Fluor Corp. (b) |
67,792 | 2,655,413 | ||||||
| MasTec, Inc. (a) (b) |
24,051 | 1,821,142 | ||||||
| MDU Resources Group, Inc. |
81,027 | 1,604,335 | ||||||
| Valmont Industries, Inc. (a) |
8,313 | 1,941,169 | ||||||
|
|
|
|||||||
| 20,079,512 | ||||||||
|
|
|
|||||||
| Construction Materials—0.4% | ||||||||
| Eagle Materials, Inc. |
13,882 | 2,815,825 | ||||||
| Knife River Corp. (b) |
22,507 | 1,489,513 | ||||||
|
|
|
|||||||
| 4,305,338 | ||||||||
|
|
|
|||||||
| Consumer Finance—0.7% | ||||||||
| Ally Financial, Inc. |
108,016 | 3,771,919 | ||||||
| FirstCash Holdings, Inc. |
14,718 | 1,595,284 | ||||||
| SLM Corp. |
90,033 | 1,721,431 | ||||||
|
|
|
|||||||
| 7,088,634 | ||||||||
|
|
|
|||||||
| Consumer Staples Distribution & Retail—1.8% | ||||||||
| BJ’s Wholesale Club Holdings, Inc. (b) |
53,212 | 3,547,112 | ||||||
| Casey’s General Stores, Inc. |
14,829 | 4,074,120 | ||||||
| Grocery Outlet Holding Corp. (b) |
39,499 | 1,064,893 | ||||||
| Performance Food Group Co. (b) |
61,913 | 4,281,284 | ||||||
| Sprouts Farmers Market, Inc. (b) |
40,411 | 1,944,173 | ||||||
| U.S. Foods Holding Corp. (b) |
89,998 | 4,086,809 | ||||||
|
|
|
|||||||
| 18,998,391 | ||||||||
|
|
|
|||||||
| Containers & Packaging—1.8% | ||||||||
| AptarGroup, Inc. |
26,174 | 3,235,630 | ||||||
| Berry Global Group, Inc. |
46,992 | 3,166,791 | ||||||
| Crown Holdings, Inc. (a) |
48,005 | 4,420,780 | ||||||
| Graphic Packaging Holding Co. |
121,778 | 3,001,828 | ||||||
| Greif, Inc. - Class A |
10,136 | 664,820 | ||||||
| Silgan Holdings, Inc. (a) |
32,205 | 1,457,276 | ||||||
| Containers & Packaging—(Continued) | ||||||||
| Sonoco Products Co. |
38,976 | 2,177,589 | ||||||
|
|
|
|||||||
| 18,124,714 | ||||||||
|
|
|
|||||||
| Diversified Consumer Services—0.9% | ||||||||
| Graham Holdings Co. - Class B |
1,425 | 992,541 | ||||||
| Grand Canyon Education, Inc. (b) |
11,761 | 1,552,922 | ||||||
| H&R Block, Inc. |
57,270 | 2,770,150 | ||||||
| Service Corp. International (a) |
58,787 | 4,023,970 | ||||||
|
|
|
|||||||
| 9,339,583 | ||||||||
|
|
|
|||||||
| Diversified REITs—0.5% | ||||||||
| WP Carey, Inc. (a) |
87,009 | 5,639,053 | ||||||
|
|
|
|||||||
| Diversified Telecommunication Services—0.4% | ||||||||
| Frontier Communications Parent, Inc. (a) (b) |
88,008 | 2,230,122 | ||||||
| Iridium Communications, Inc. |
49,280 | 2,028,365 | ||||||
|
|
|
|||||||
| 4,258,487 | ||||||||
|
|
|
|||||||
| Electric Utilities—0.9% | ||||||||
| ALLETE, Inc. |
22,870 | 1,398,729 | ||||||
| IDACORP, Inc. (a) |
20,140 | 1,980,165 | ||||||
| OGE Energy Corp. |
79,694 | 2,783,711 | ||||||
| PNM Resources, Inc. |
34,153 | 1,420,765 | ||||||
| Portland General Electric Co. |
40,237 | 1,743,872 | ||||||
|
|
|
|||||||
| 9,327,242 | ||||||||
|
|
|
|||||||
| Electrical Equipment—1.5% | ||||||||
| Acuity Brands, Inc. |
12,314 | 2,522,276 | ||||||
| EnerSys |
16,075 | 1,622,932 | ||||||
| nVent Electric PLC |
66,016 | 3,900,885 | ||||||
| Regal Rexnord Corp. |
26,400 | 3,907,728 | ||||||
| Sensata Technologies Holding PLC |
60,224 | 2,262,616 | ||||||
| Sunrun, Inc. (a) (b) |
86,417 | 1,696,366 | ||||||
|
|
|
|||||||
| 15,912,803 | ||||||||
|
|
|
|||||||
| Electronic Equipment, Instruments & Components—2.3% | ||||||||
| Arrow Electronics, Inc. (b) |
21,550 | 2,634,488 | ||||||
| Avnet, Inc. |
36,003 | 1,814,551 | ||||||
| Belden, Inc. |
16,585 | 1,281,191 | ||||||
| Cognex Corp. (a) |
68,495 | 2,858,981 | ||||||
| Coherent Corp. (b) |
52,438 | 2,282,626 | ||||||
| Crane NXT Co. |
19,209 | 1,092,416 | ||||||
| IPG Photonics Corp. (a) (b) |
11,762 | 1,276,647 | ||||||
| Littelfuse, Inc. |
9,905 | 2,650,182 | ||||||
| Novanta, Inc. (b) |
14,249 | 2,399,674 | ||||||
| TD SYNNEX Corp. |
20,409 | 2,196,213 | ||||||
| Vishay Intertechnology, Inc. (a) |
50,230 | 1,204,013 | ||||||
| Vontier Corp. |
61,407 | 2,121,612 | ||||||
|
|
|
|||||||
| 23,812,594 | ||||||||
|
|
|
|||||||
| Energy Equipment & Services—1.0% | ||||||||
| ChampionX Corp. |
77,510 | 2,264,067 | ||||||
| NOV, Inc. (a) |
156,743 | 3,178,748 | ||||||
| Valaris Ltd. (b) |
24,944 | 1,710,410 | ||||||
See accompanying notes to financial statements.
BHFTII-5
Brighthouse Funds Trust II
MetLife Mid Cap Stock Index Portfolio
Schedule of Investments as of December 31, 2023
Common Stocks—(Continued)
| Security Description | Shares | Value | ||||||
| Energy Equipment & Services—(Continued) | ||||||||
| Weatherford International PLC (b) |
28,696 | $ | 2,807,330 | |||||
|
|
|
|||||||
| 9,960,555 | ||||||||
|
|
|
|||||||
| Entertainment—0.2% | ||||||||
| TKO Group Holdings, Inc. |
23,873 | 1,947,559 | ||||||
|
|
|
|||||||
| Financial Services—1.8% | ||||||||
| Equitable Holdings, Inc. |
126,602 | 4,215,847 | ||||||
| Essent Group Ltd. |
42,479 | 2,240,342 | ||||||
| Euronet Worldwide, Inc. (b) |
17,434 | 1,769,377 | ||||||
| MGIC Investment Corp. (a) |
110,342 | 2,128,497 | ||||||
| Voya Financial, Inc. (a) |
41,567 | 3,032,728 | ||||||
| Western Union Co. |
144,978 | 1,728,138 | ||||||
| WEX, Inc. (b) |
17,005 | 3,308,323 | ||||||
|
|
|
|||||||
| 18,423,252 | ||||||||
|
|
|
|||||||
| Food Products—1.1% | ||||||||
| Darling Ingredients, Inc. (b) |
63,477 | 3,163,694 | ||||||
| Flowers Foods, Inc. |
76,444 | 1,720,754 | ||||||
| Ingredion, Inc. |
25,940 | 2,815,268 | ||||||
| Lancaster Colony Corp. (a) |
8,102 | 1,348,092 | ||||||
| Pilgrim’s Pride Corp. (b) |
16,017 | 443,030 | ||||||
| Post Holdings, Inc. (a) (b) |
20,218 | 1,780,397 | ||||||
|
|
|
|||||||
| 11,271,235 | ||||||||
|
|
|
|||||||
| Gas Utilities—1.0% | ||||||||
| National Fuel Gas Co. |
36,534 | 1,832,911 | ||||||
| New Jersey Resources Corp. |
38,819 | 1,730,551 | ||||||
| ONE Gas, Inc. (a) |
22,065 | 1,405,982 | ||||||
| Southwest Gas Holdings, Inc. |
23,904 | 1,514,318 | ||||||
| Spire, Inc. (a) |
20,930 | 1,304,776 | ||||||
| UGI Corp. (a) |
83,351 | 2,050,435 | ||||||
|
|
|
|||||||
| 9,838,973 | ||||||||
|
|
|
|||||||
| Ground Transportation—1.9% | ||||||||
| Avis Budget Group, Inc. (a) |
7,350 | 1,302,861 | ||||||
| Hertz Global Holdings, Inc. (a) (b) |
52,665 | 547,189 | ||||||
| Knight-Swift Transportation Holdings, Inc. |
64,178 | 3,699,862 | ||||||
| Landstar System, Inc. |
14,303 | 2,769,776 | ||||||
| Ryder System, Inc. (a) |
17,636 | 2,029,198 | ||||||
| Saia, Inc. (b) |
10,564 | 4,629,356 | ||||||
| Werner Enterprises, Inc. |
25,224 | 1,068,741 | ||||||
| XPO, Inc. (b) |
46,145 | 4,041,841 | ||||||
|
|
|
|||||||
| 20,088,824 | ||||||||
|
|
|
|||||||
| Health Care Equipment & Supplies—2.3% | ||||||||
| Enovis Corp. (a) (b) |
19,767 | 1,107,347 | ||||||
| Envista Holdings Corp. (b) |
68,200 | 1,640,892 | ||||||
| Globus Medical, Inc. - Class A (b) |
45,902 | 2,446,118 | ||||||
| Haemonetics Corp. (b) |
20,190 | 1,726,447 | ||||||
| Inari Medical, Inc. (a) (b) |
20,364 | 1,322,031 | ||||||
| Integra LifeSciences Holdings Corp. (b) |
27,062 | 1,178,550 | ||||||
| Lantheus Holdings, Inc. (a) (b) |
27,251 | 1,689,562 | ||||||
| LivaNova PLC (b) |
21,440 | 1,109,306 | ||||||
| Masimo Corp. (a) (b) |
17,661 | 2,070,046 | ||||||
| Health Care Equipment & Supplies—(Continued) | ||||||||
| Neogen Corp. (a) (b) |
78,323 | 1,575,075 | ||||||
| Penumbra, Inc. (b) |
15,358 | 3,863,151 | ||||||
| QuidelOrtho Corp. (b) |
19,674 | 1,449,974 | ||||||
| Shockwave Medical, Inc. (b) |
14,681 | 2,797,611 | ||||||
|
|
|
|||||||
| 23,976,110 | ||||||||
|
|
|
|||||||
| Health Care Providers & Services—2.0% | ||||||||
| Acadia Healthcare Co., Inc. (b) |
36,692 | 2,853,170 | ||||||
| Amedisys, Inc. (b) |
12,985 | 1,234,354 | ||||||
| Chemed Corp. |
5,994 | 3,504,991 | ||||||
| Encompass Health Corp. |
39,882 | 2,660,927 | ||||||
| HealthEquity, Inc. (b) |
34,071 | 2,258,907 | ||||||
| Option Care Health, Inc. (b) |
70,480 | 2,374,471 | ||||||
| Patterson Cos., Inc. |
33,859 | 963,289 | ||||||
| Progyny, Inc. (b) |
33,175 | 1,233,447 | ||||||
| R1 RCM, Inc. (a) (b) |
78,350 | 828,160 | ||||||
| Tenet Healthcare Corp. (b) |
40,407 | 3,053,557 | ||||||
|
|
|
|||||||
| 20,965,273 | ||||||||
|
|
|
|||||||
| Health Care REITs—0.9% | ||||||||
| Healthcare Realty Trust, Inc. (a) |
151,549 | 2,611,189 | ||||||
| Medical Properties Trust, Inc. (a) |
238,342 | 1,170,259 | ||||||
| Omega Healthcare Investors, Inc. |
97,483 | 2,988,829 | ||||||
| Physicians Realty Trust |
94,894 | 1,263,039 | ||||||
| Sabra Health Care REIT, Inc. (a) |
92,002 | 1,312,869 | ||||||
|
|
|
|||||||
| 9,346,185 | ||||||||
|
|
|
|||||||
| Health Care Technology—0.1% | ||||||||
| Doximity, Inc. - Class A (b) |
47,015 | 1,318,301 | ||||||
|
|
|
|||||||
| Hotel & Resort REITs—0.1% | ||||||||
| Park Hotels & Resorts, Inc. |
83,552 | 1,278,346 | ||||||
|
|
|
|||||||
| Hotels, Restaurants & Leisure—3.4% | ||||||||
| Aramark |
103,871 | 2,918,775 | ||||||
| Boyd Gaming Corp. |
27,646 | 1,730,916 | ||||||
| Choice Hotels International, Inc. (a) |
9,907 | 1,122,463 | ||||||
| Churchill Downs, Inc. (a) |
27,010 | 3,644,459 | ||||||
| Hilton Grand Vacations, Inc. (b) |
28,358 | 1,139,425 | ||||||
| Hyatt Hotels Corp. - Class A (a) |
17,596 | 2,294,695 | ||||||
| Light & Wonder, Inc. (b) |
35,829 | 2,941,919 | ||||||
| Marriott Vacations Worldwide Corp. |
13,143 | 1,115,709 | ||||||
| Penn Entertainment, Inc. (a) (b) |
60,384 | 1,571,192 | ||||||
| Planet Fitness, Inc. - Class A (a) (b) |
33,996 | 2,481,708 | ||||||
| Texas Roadhouse, Inc. |
26,573 | 3,248,018 | ||||||
| Travel & Leisure Co. (a) |
28,815 | 1,126,378 | ||||||
| Vail Resorts, Inc. |
15,156 | 3,235,351 | ||||||
| Wendy’s Co. |
66,477 | 1,294,972 | ||||||
| Wingstop, Inc. |
11,704 | 3,003,012 | ||||||
| Wyndham Hotels & Resorts, Inc. |
33,010 | 2,654,334 | ||||||
|
|
|
|||||||
| 35,523,326 | ||||||||
|
|
|
|||||||
| Household Durables—1.9% | ||||||||
| Helen of Troy Ltd. (a) (b) |
9,447 | 1,141,292 | ||||||
| KB Home |
30,463 | 1,902,719 | ||||||
See accompanying notes to financial statements.
BHFTII-6
Brighthouse Funds Trust II
MetLife Mid Cap Stock Index Portfolio
Schedule of Investments as of December 31, 2023
Common Stocks—(Continued)
| Security Description | Shares | Value | ||||||
| Household Durables—(Continued) | ||||||||
| Leggett & Platt, Inc. |
53,047 | $ | 1,388,240 | |||||
| Taylor Morrison Home Corp. (b) |
42,753 | 2,280,872 | ||||||
| Tempur Sealy International, Inc. |
68,547 | 3,493,841 | ||||||
| Toll Brothers, Inc. |
42,766 | 4,395,917 | ||||||
| TopBuild Corp. (b) |
12,643 | 4,731,769 | ||||||
|
|
|
|||||||
| 19,334,650 | ||||||||
|
|
|
|||||||
| Independent Power and Renewable Electricity Producers—0.7% | ||||||||
| Ormat Technologies, Inc. (a) |
21,373 | 1,619,860 | ||||||
| Vistra Corp. |
133,733 | 5,151,395 | ||||||
|
|
|
|||||||
| 6,771,255 | ||||||||
|
|
|
|||||||
| Industrial REITs—1.3% | ||||||||
| EastGroup Properties, Inc. |
18,435 | 3,383,560 | ||||||
| First Industrial Realty Trust, Inc. |
52,632 | 2,772,127 | ||||||
| Rexford Industrial Realty, Inc. (a) |
83,995 | 4,712,120 | ||||||
| STAG Industrial, Inc. (a) |
72,247 | 2,836,417 | ||||||
|
|
|
|||||||
| 13,704,224 | ||||||||
|
|
|
|||||||
| Insurance—4.3% | ||||||||
| American Financial Group, Inc. |
26,002 | 3,091,378 | ||||||
| Brighthouse Financial, Inc. (a) (b) (c) |
25,547 | 1,351,947 | ||||||
| CNO Financial Group, Inc. (a) |
44,632 | 1,245,233 | ||||||
| Erie Indemnity Co. - Class A |
9,925 | 3,324,081 | ||||||
| Fidelity National Financial, Inc. |
102,877 | 5,248,784 | ||||||
| First American Financial Corp. (a) |
41,055 | 2,645,584 | ||||||
| Hanover Insurance Group, Inc. |
14,230 | 1,727,807 | ||||||
| Kemper Corp. |
23,970 | 1,166,620 | ||||||
| Kinsale Capital Group, Inc. (a) |
8,760 | 2,933,812 | ||||||
| Old Republic International Corp. |
103,753 | 3,050,338 | ||||||
| Primerica, Inc. |
13,940 | 2,868,294 | ||||||
| Reinsurance Group of America, Inc. |
26,224 | 4,242,519 | ||||||
| RenaissanceRe Holdings Ltd. |
20,888 | 4,094,048 | ||||||
| RLI Corp. |
15,976 | 2,126,725 | ||||||
| Selective Insurance Group, Inc. |
24,108 | 2,398,264 | ||||||
| Unum Group |
72,952 | 3,298,889 | ||||||
|
|
|
|||||||
| 44,814,323 | ||||||||
|
|
|
|||||||
| Interactive Media & Services—0.3% | ||||||||
| Ziff Davis, Inc. (b) |
18,297 | 1,229,375 | ||||||
| ZoomInfo Technologies, Inc. (b) |
117,871 | 2,179,435 | ||||||
|
|
|
|||||||
| 3,408,810 | ||||||||
|
|
|
|||||||
| IT Services—0.8% | ||||||||
| GoDaddy, Inc. - Class A (b) |
56,034 | 5,948,570 | ||||||
| Kyndryl Holdings, Inc. (b) |
91,303 | 1,897,276 | ||||||
|
|
|
|||||||
| 7,845,846 | ||||||||
|
|
|
|||||||
| Leisure Products—0.9% | ||||||||
| Brunswick Corp. |
27,381 | 2,649,112 | ||||||
| Mattel, Inc. (b) |
140,551 | 2,653,603 | ||||||
| Polaris, Inc. |
21,122 | 2,001,732 | ||||||
| YETI Holdings, Inc. (a) (b) |
34,558 | 1,789,413 | ||||||
|
|
|
|||||||
| 9,093,860 | ||||||||
|
|
|
|||||||
| Life Sciences Tools & Services—1.1% | ||||||||
| Azenta, Inc. (a) (b) |
23,935 | 1,559,126 | ||||||
| Bruker Corp. |
36,899 | 2,711,338 | ||||||
| Medpace Holdings, Inc. (b) |
9,279 | 2,844,292 | ||||||
| Repligen Corp. (a) (b) |
20,661 | 3,714,848 | ||||||
| Sotera Health Co. (b) |
39,358 | 663,182 | ||||||
|
|
|
|||||||
| 11,492,786 | ||||||||
|
|
|
|||||||
| Machinery—4.7% | ||||||||
| AGCO Corp. |
24,730 | 3,002,469 | ||||||
| Chart Industries, Inc. (a) (b) |
16,707 | 2,277,665 | ||||||
| Crane Co. (a) |
19,436 | 2,296,169 | ||||||
| Donaldson Co., Inc. |
48,021 | 3,138,172 | ||||||
| Esab Corp. |
22,543 | 1,952,675 | ||||||
| Flowserve Corp. |
52,208 | 2,152,014 | ||||||
| Graco, Inc. |
67,161 | 5,826,888 | ||||||
| ITT, Inc. |
32,668 | 3,897,946 | ||||||
| Lincoln Electric Holdings, Inc. (a) |
22,760 | 4,949,390 | ||||||
| Middleby Corp. (a) (b) |
21,329 | 3,138,989 | ||||||
| Oshkosh Corp. |
26,028 | 2,821,695 | ||||||
| RBC Bearings, Inc. (a) (b) |
11,573 | 3,297,032 | ||||||
| Terex Corp. |
26,778 | 1,538,664 | ||||||
| Timken Co. |
25,826 | 2,069,954 | ||||||
| Toro Co. (a) |
41,319 | 3,966,211 | ||||||
| Watts Water Technologies, Inc. - Class A |
10,890 | 2,268,823 | ||||||
|
|
|
|||||||
| 48,594,756 | ||||||||
|
|
|
|||||||
| Marine Transportation—0.2% | ||||||||
| Kirby Corp. (b) |
23,516 | 1,845,536 | ||||||
|
|
|
|||||||
| Media—0.7% | ||||||||
| Cable One, Inc. (a) |
1,811 | 1,007,984 | ||||||
| New York Times Co. - Class A |
65,106 | 3,189,543 | ||||||
| Nexstar Media Group, Inc. (a) |
12,826 | 2,010,476 | ||||||
| TEGNA, Inc. |
78,373 | 1,199,107 | ||||||
|
|
|
|||||||
| 7,407,110 | ||||||||
|
|
|
|||||||
| Metals & Mining—2.3% | ||||||||
| Alcoa Corp. |
71,014 | 2,414,476 | ||||||
| Cleveland-Cliffs, Inc. (a) (b) |
200,884 | 4,102,051 | ||||||
| Commercial Metals Co. |
46,516 | 2,327,661 | ||||||
| MP Materials Corp. (a) (b) |
57,309 | 1,137,584 | ||||||
| Reliance Steel & Aluminum Co. |
22,868 | 6,395,722 | ||||||
| Royal Gold, Inc. (a) |
26,139 | 3,161,773 | ||||||
| U.S. Steel Corp. (a) |
88,747 | 4,317,542 | ||||||
|
|
|
|||||||
| 23,856,809 | ||||||||
|
|
|
|||||||
| Mortgage Real Estate Investment Trusts—0.6% | ||||||||
| Annaly Capital Management, Inc. (a) |
198,985 | 3,854,339 | ||||||
| Starwood Property Trust, Inc. (a) |
118,401 | 2,488,789 | ||||||
|
|
|
|||||||
| 6,343,128 | ||||||||
|
|
|
|||||||
| Multi-Utilities—0.3% | ||||||||
| Black Hills Corp. |
27,054 | 1,459,563 | ||||||
| Northwestern Energy Group, Inc. |
24,368 | 1,240,088 | ||||||
|
|
|
|||||||
| 2,699,651 | ||||||||
|
|
|
|||||||
See accompanying notes to financial statements.
BHFTII-7
Brighthouse Funds Trust II
MetLife Mid Cap Stock Index Portfolio
Schedule of Investments as of December 31, 2023
Common Stocks—(Continued)
| Security Description | Shares | Value | ||||||
| Office REITs—0.6% | ||||||||
| COPT Defense Properties |
44,782 | $ | 1,147,763 | |||||
| Cousins Properties, Inc. |
60,390 | 1,470,496 | ||||||
| Kilroy Realty Corp. |
42,451 | 1,691,248 | ||||||
| Vornado Realty Trust (a) |
63,612 | 1,797,039 | ||||||
|
|
|
|||||||
| 6,106,546 | ||||||||
|
|
|
|||||||
| Oil, Gas & Consumable Fuels—3.9% | ||||||||
| Antero Midstream Corp. (a) |
135,523 | 1,698,103 | ||||||
| Antero Resources Corp. (b) |
112,411 | 2,549,481 | ||||||
| Chesapeake Energy Corp. (a) |
44,330 | 3,410,750 | ||||||
| Chord Energy Corp. |
16,425 | 2,730,328 | ||||||
| Civitas Resources, Inc. (a) |
33,954 | 2,321,774 | ||||||
| CNX Resources Corp. (a) (b) |
63,207 | 1,264,140 | ||||||
| DT Midstream, Inc. (a) |
38,557 | 2,112,924 | ||||||
| Equitrans Midstream Corp. (a) |
172,394 | 1,754,971 | ||||||
| HF Sinclair Corp. |
62,293 | 3,461,622 | ||||||
| Matador Resources Co. (a) |
44,085 | 2,506,673 | ||||||
| Murphy Oil Corp. |
58,391 | 2,490,960 | ||||||
| Ovintiv, Inc. |
100,986 | 4,435,305 | ||||||
| PBF Energy, Inc. - Class A |
43,275 | 1,902,369 | ||||||
| Permian Resources Corp. (a) |
165,401 | 2,249,454 | ||||||
| Range Resources Corp. (a) |
96,015 | 2,922,697 | ||||||
| Southwestern Energy Co. (a) (b) |
438,272 | 2,870,682 | ||||||
|
|
|
|||||||
| 40,682,233 | ||||||||
|
|
|
|||||||
| Paper & Forest Products—0.2% | ||||||||
| Louisiana-Pacific Corp. |
25,535 | 1,808,644 | ||||||
|
|
|
|||||||
| Personal Care Products—0.5% | ||||||||
| BellRing Brands, Inc. (b) |
52,302 | 2,899,100 | ||||||
| Coty, Inc. - Class A (a) (b) |
149,014 | 1,850,754 | ||||||
|
|
|
|||||||
| 4,749,854 | ||||||||
|
|
|
|||||||
| Pharmaceuticals—0.5% | ||||||||
| Jazz Pharmaceuticals PLC (b) |
25,051 | 3,081,273 | ||||||
| Perrigo Co. PLC |
53,917 | 1,735,049 | ||||||
|
|
|
|||||||
| 4,816,322 | ||||||||
|
|
|
|||||||
| Professional Services—2.8% | ||||||||
| ASGN, Inc. (b) |
18,781 | 1,806,169 | ||||||
| CACI International, Inc. - Class A (b) |
8,865 | 2,871,019 | ||||||
| Concentrix Corp. |
18,815 | 1,847,821 | ||||||
| ExlService Holdings, Inc. (a) (b) |
65,622 | 2,024,439 | ||||||
| Exponent, Inc. |
20,142 | 1,773,302 | ||||||
| FTI Consulting, Inc. (b) |
14,130 | 2,813,990 | ||||||
| Genpact Ltd. |
66,409 | 2,305,056 | ||||||
| Insperity, Inc. |
14,092 | 1,651,864 | ||||||
| KBR, Inc. (a) |
53,718 | 2,976,514 | ||||||
| ManpowerGroup, Inc. |
19,421 | 1,543,387 | ||||||
| Maximus, Inc. |
24,186 | 2,028,238 | ||||||
| Paylocity Holding Corp. (b) |
17,212 | 2,837,398 | ||||||
| Science Applications International Corp. |
21,063 | 2,618,552 | ||||||
|
|
|
|||||||
| 29,097,749 | ||||||||
|
|
|
|||||||
| Real Estate Management & Development—0.3% | ||||||||
| Jones Lang LaSalle, Inc. (a) (b) |
18,929 | 3,575,120 | ||||||
|
|
|
|||||||
| Residential REITs—0.8% | ||||||||
| Apartment Income REIT Corp. |
58,488 | 2,031,288 | ||||||
| Equity LifeStyle Properties, Inc. (a) |
74,165 | 5,231,599 | ||||||
| Independence Realty Trust, Inc. |
89,412 | 1,368,004 | ||||||
|
|
|
|||||||
| 8,630,891 | ||||||||
|
|
|
|||||||
| Retail REITs—1.2% | ||||||||
| Agree Realty Corp. |
39,996 | 2,517,748 | ||||||
| Brixmor Property Group, Inc. |
119,607 | 2,783,255 | ||||||
| Kite Realty Group Trust |
87,294 | 1,995,541 | ||||||
| NNN REIT, Inc. |
72,592 | 3,128,715 | ||||||
| Spirit Realty Capital, Inc. |
56,235 | 2,456,907 | ||||||
|
|
|
|||||||
| 12,882,166 | ||||||||
|
|
|
|||||||
| Semiconductors & Semiconductor Equipment—2.8% | ||||||||
| Allegro MicroSystems, Inc. (b) |
28,336 | 857,731 | ||||||
| Amkor Technology, Inc. |
41,071 | 1,366,432 | ||||||
| Cirrus Logic, Inc. (b) |
21,446 | 1,784,093 | ||||||
| Lattice Semiconductor Corp. (b) |
54,921 | 3,789,000 | ||||||
| MACOM Technology Solutions Holdings, Inc. (b) |
21,533 | 2,001,492 | ||||||
| MKS Instruments, Inc. |
25,014 | 2,573,190 | ||||||
| Onto Innovation, Inc. (b) |
19,529 | 2,985,984 | ||||||
| Power Integrations, Inc. |
22,624 | 1,857,657 | ||||||
| Rambus, Inc. (b) |
42,777 | 2,919,530 | ||||||
| Silicon Laboratories, Inc. (b) |
12,645 | 1,672,554 | ||||||
| Synaptics, Inc. (b) |
15,598 | 1,779,420 | ||||||
| Universal Display Corp. |
17,336 | 3,315,683 | ||||||
| Wolfspeed, Inc. (a) (b) |
49,866 | 2,169,670 | ||||||
|
|
|
|||||||
| 29,072,436 | ||||||||
|
|
|
|||||||
| Software—2.5% | ||||||||
| Aspen Technology, Inc. (a) (b) |
11,152 | 2,455,113 | ||||||
| Blackbaud, Inc. (b) |
17,142 | 1,486,211 | ||||||
| CommVault Systems, Inc. (b) |
17,425 | 1,391,386 | ||||||
| Dolby Laboratories, Inc. - Class A |
23,697 | 2,042,208 | ||||||
| Dropbox, Inc. - Class A (a) (b) |
101,934 | 3,005,014 | ||||||
| Dynatrace, Inc. (b) |
94,882 | 5,189,097 | ||||||
| Manhattan Associates, Inc. (b) |
24,497 | 5,274,694 | ||||||
| Qualys, Inc. (a) (b) |
14,637 | 2,872,950 | ||||||
| Teradata Corp. (b) |
38,914 | 1,693,148 | ||||||
|
|
|
|||||||
| 25,409,821 | ||||||||
|
|
|
|||||||
| Specialized REITs—1.9% | ||||||||
| CubeSmart |
89,472 | 4,147,027 | ||||||
| EPR Properties (a) |
29,973 | 1,452,192 | ||||||
| Gaming & Leisure Properties, Inc. |
106,245 | 5,243,191 | ||||||
| Lamar Advertising Co. - Class A (a) |
34,847 | 3,703,539 | ||||||
| National Storage Affiliates Trust (a) |
30,743 | 1,274,912 | ||||||
| PotlatchDeltic Corp. |
31,578 | 1,550,480 | ||||||
| Rayonier, Inc. (a) |
54,285 | 1,813,662 | ||||||
|
|
|
|||||||
| 19,185,003 | ||||||||
|
|
|
|||||||
See accompanying notes to financial statements.
BHFTII-8
Brighthouse Funds Trust II
MetLife Mid Cap Stock Index Portfolio
Schedule of Investments as of December 31, 2023
Common Stocks—(Continued)
| Security Description | Shares/ Principal Amount* |
Value | ||||||
| Specialty Retail—3.9% | ||||||||
| AutoNation, Inc. (b) |
10,320 | $ | 1,549,858 | |||||
| Burlington Stores, Inc. (b) |
25,818 | 5,021,085 | ||||||
| Dick’s Sporting Goods, Inc. (a) |
24,452 | 3,593,221 | ||||||
| Five Below, Inc. (a) (b) |
22,158 | 4,723,199 | ||||||
| Floor & Decor Holdings, Inc. - Class A (a) (b) |
42,404 | 4,730,590 | ||||||
| GameStop Corp. - Class A (a) (b) |
106,880 | 1,873,606 | ||||||
| Gap, Inc. (a) |
85,361 | 1,784,899 | ||||||
| Lithia Motors, Inc. (a) |
10,951 | 3,605,945 | ||||||
| Murphy USA, Inc. |
7,704 | 2,746,938 | ||||||
| Penske Automotive Group, Inc. (a) |
7,756 | 1,244,916 | ||||||
| Restoration Hardware, Inc. (a) (b) |
6,150 | 1,792,602 | ||||||
| Valvoline, Inc. (a) (b) |
55,174 | 2,073,439 | ||||||
| Williams-Sonoma, Inc. (a) |
25,524 | 5,150,233 | ||||||
|
|
|
|||||||
| 39,890,531 | ||||||||
|
|
|
|||||||
| Technology Hardware, Storage & Peripherals—0.5% | ||||||||
| Super Micro Computer, Inc. (a) (b) |
18,456 | 5,246,303 | ||||||
|
|
|
|||||||
| Textiles, Apparel & Luxury Goods—2.0% | ||||||||
| Capri Holdings Ltd. (b) |
46,244 | 2,323,299 | ||||||
| Carter’s, Inc. (a) |
14,652 | 1,097,288 | ||||||
| Columbia Sportswear Co. (a) |
13,723 | 1,091,527 | ||||||
| Crocs, Inc. (a) (b) |
24,100 | 2,251,181 | ||||||
| Deckers Outdoor Corp. (b) (d) |
10,239 | 6,844,055 | ||||||
| PVH Corp. |
24,043 | 2,936,131 | ||||||
| Skechers USA, Inc. - Class A (a) (b) |
53,157 | 3,313,807 | ||||||
| Under Armour, Inc. - Class A (b) |
75,117 | 660,279 | ||||||
| Under Armour, Inc. - Class C (b) |
76,963 | 642,641 | ||||||
|
|
|
|||||||
| 21,160,208 | ||||||||
|
|
|
|||||||
| Trading Companies & Distributors—1.4% | ||||||||
| Core & Main, Inc. - Class A (a) (b) |
54,382 | 2,197,576 | ||||||
| GATX Corp. (a) |
14,125 | 1,698,107 | ||||||
| MSC Industrial Direct Co., Inc. - Class A |
18,449 | 1,868,146 | ||||||
| Watsco, Inc. (a) |
13,476 | 5,774,062 | ||||||
| WESCO International, Inc. (a) |
17,478 | 3,039,075 | ||||||
|
|
|
|||||||
| 14,576,966 | ||||||||
|
|
|
|||||||
| Water Utilities—0.4% | ||||||||
| Essential Utilities, Inc. |
99,997 | 3,734,888 | ||||||
|
|
|
|||||||
| Total Common Stocks |
1,000,951,670 | |||||||
|
|
|
|||||||
| Mutual Funds—1.8% |
| |||||||
| Investment Company Securities—1.8% | ||||||||
| SPDR S&P MidCap 400 ETF Trust (a) |
37,000 | 18,773,060 | ||||||
|
|
|
|||||||
| Short-Term Investments—1.6% |
| |||||||
| U.S. Treasury—1.6% | ||||||||
| U.S. Treasury Bills | ||||||||
| 2.611%, 01/02/24 (e) |
425,000 | 425,000 | ||||||
| 5.215%, 02/06/24 (e) |
15,925,000 | 15,843,259 | ||||||
|
|
|
|||||||
| Total Short-Term Investments |
16,268,259 | |||||||
|
|
|
|||||||
| Securities Lending Reinvestments (f)—13.1% |
| |||||||
| Security Description | Principal Amount* |
Value | ||||||
| Certificates of Deposit—1.0% | ||||||||
| Barclays Bank PLC |
2,000,000 | 2,000,564 | ||||||
| Mizuho Bank Ltd. |
2,000,000 | 2,000,906 | ||||||
| Royal Bank of Canada |
1,000,000 | 1,000,620 | ||||||
| Standard Chartered Bank |
1,000,000 | 1,000,000 | ||||||
| Sumitomo Mitsui Trust Bank Ltd. |
2,000,000 | 2,001,190 | ||||||
| Westpac Banking Corp. |
2,000,000 | 2,002,478 | ||||||
|
|
|
|||||||
| 10,005,758 | ||||||||
|
|
|
|||||||
| Commercial Paper—0.2% | ||||||||
| Australia & New Zealand Banking Group Ltd. |
1,000,000 | 983,338 | ||||||
| 5.730%, SOFR + 0.330%, 04/18/24 (g) |
1,000,000 | 1,000,224 | ||||||
|
|
|
|||||||
| 1,983,562 | ||||||||
|
|
|
|||||||
| Repurchase Agreements—7.5% | ||||||||
| Bank of Nova Scotia |
10,300,000 | 10,300,000 | ||||||
| Barclays Bank PLC | ||||||||
| Repurchase Agreement dated 12/29/23 at 5.330%, due on 01/02/24 with a maturity value of $3,001,777; collateralized by U.S. Treasury Obligations with rates ranging from 0.000% - 5.500%, maturity dates ranging from 01/31/24 - 05/15/48, and an aggregate market value of $3,061,678. |
3,000,000 | 3,000,000 | ||||||
| Repurchase Agreement dated 12/29/23 at 5.450%, due on 01/02/24 with a maturity value of $3,147,341; collateralized by various Common Stock with an aggregate market value of $3,506,570. |
3,145,437 | 3,145,437 | ||||||
| Cantor Fitzgerald & Co. |
2,000,000 | 2,000,000 | ||||||
| Citigroup Global Markets, Inc. |
3,000,000 | 3,000,000 | ||||||
| Deutsche Bank Securities, Inc. |
15,299,700 | 15,299,700 | ||||||
See accompanying notes to financial statements.
BHFTII-9
Brighthouse Funds Trust II
MetLife Mid Cap Stock Index Portfolio
Schedule of Investments as of December 31, 2023
Securities Lending Reinvestments (f)—(Continued)
| Security Description | Principal Amount* |
Value | ||||||
| Repurchase Agreements—(Continued) | ||||||||
| National Bank Financial, Inc. |
2,000,000 | $ | 2,000,000 | |||||
| National Bank of Canada |
12,000,000 | 12,000,000 | ||||||
| NBC Global Finance Ltd. |
2,400,000 | 2,400,000 | ||||||
| Royal Bank of Canada Toronto |
3,000,000 | 3,000,000 | ||||||
| Societe Generale | ||||||||
| Repurchase Agreement dated 12/29/23 at 5.330%, due on 01/02/24 with a maturity value of $10,005,922; collateralized by U.S. Treasury Obligations with rates ranging from 0.625% - 4.750%, maturity dates ranging from 04/15/26 - 08/15/51, and an aggregate market value of $10,222,653. |
10,000,000 | 10,000,000 | ||||||
| Repurchase Agreement dated 12/29/23 at 5.330%, due on 01/02/24 with a maturity value of $1,000,592; collateralized by U.S. Treasury Obligations with rates ranging from 0.625% - 5.240%, maturity dates ranging from 04/30/24 - 05/15/32, and an aggregate market value of $1,020,000. |
1,000,000 | 1,000,000 | ||||||
| Repurchase Agreement dated 12/29/23 at 5.510%, due on 01/02/24 with a maturity value of $720,441; collateralized by various Common Stock with an aggregate market value of $801,456. |
720,000 | 720,000 | ||||||
| TD Prime Services LLC |
10,000,000 | 10,000,000 | ||||||
|
|
|
|||||||
| 77,865,137 | ||||||||
|
|
|
|||||||
| Time Deposits—0.9% | ||||||||
| First Abu Dhabi Bank USA NV |
4,000,000 | 4,000,000 | ||||||
| Nordea Bank Abp |
5,000,000 | 5,000,000 | ||||||
|
|
|
|||||||
| 9,000,000 | ||||||||
|
|
|
|||||||
| Mutual Funds—3.5% | ||||||||
| BlackRock Liquidity Funds FedFund, Institutional Shares |
7,000,000 | 7,000,000 | ||||||
| Dreyfus Treasury Obligations Cash Management Fund, Institutional Class 5.250% (h) |
7,000,000 | 7,000,000 | ||||||
| Fidelity Investments Money Market Government Portfolio, Class I |
4,000,000 | 4,000,000 | ||||||
| Goldman Sachs Financial Square Government Fund, Institutional Shares 5.230% (h) |
7,000,000 | 7,000,000 | ||||||
| Morgan Stanley Liquidity Funds Government Portfolio, Institutional Shares 5.270% (h) |
5,000,000 | 5,000,000 | ||||||
| RBC U.S. Government Money Market Fund, Institutional Share |
5,000,000 | 5,000,000 | ||||||
| STIT-Government & Agency Portfolio, Institutional Class |
1,501,271 | 1,501,271 | ||||||
|
|
|
|||||||
| 36,501,271 | ||||||||
|
|
|
|||||||
| Total Securities Lending Reinvestments |
135,355,728 | |||||||
|
|
|
|||||||
| Total Investments—113.2% |
1,171,348,717 | |||||||
| Other assets and liabilities (net)—(13.2)% |
(136,247,625 | ) | ||||||
|
|
|
|||||||
| Net Assets—100.0% | $ | 1,035,101,092 | ||||||
|
|
|
|||||||
| * | Principal amount stated in U.S. dollars unless otherwise noted. | |||
| (a) | All or a portion of the security was held on loan. As of December 31, 2023, the market value of securities loaned was $179,939,747 and the collateral received consisted of cash in the amount of $135,337,738 and non-cash collateral with a value of $50,764,971. The cash collateral investments are disclosed in the Schedule of Investments and categorized as Securities Lending Reinvestments. The non-cash collateral received consists of U.S. government securities that are held in safe-keeping by the lending agent, or a third-party custodian, and cannot be sold or repledged by the Portfolio. As such, this collateral is excluded from the Statement of Assets and Liabilities. | |||
| (b) | Non-income producing security. | |||
| (c) | Affiliated Issuer. (See Note 8 of the Notes to Financial Statements for a summary of transactions in securities of affiliated issuers.) | |||
| (d) | All or a portion of the security was pledged as collateral against open futures contracts. As of December 31, 2023, the market value of securities pledged was $4,679,010. | |||
| (e) | The rate shown represents current yield to maturity. | |||
| (f) | Represents investment of cash collateral received from securities on loan as of December 31, 2023. | |||
| (g) | Variable or floating rate security. The stated rate represents the rate at December 31, 2023. Maturity date shown for callable securities reflects the earliest possible call date. For securities based on a published reference index and spread, the index and spread are indicated in the description above. For certain variable rate securities, the coupon rate is determined by the issuer/agent based on current market conditions. For certain asset- and mortgage-backed securities, the coupon rate may fluctuate based on changes of the underlying collateral or prepayments of principal. These securities do not indicate a reference index and spread in their description above. | |||
| (h) | The rate shown represents the annualized seven-day yield as of December 31, 2023. | |||
See accompanying notes to financial statements.
BHFTII-10
Brighthouse Funds Trust II
MetLife Mid Cap Stock Index Portfolio
Schedule of Investments as of December 31, 2023
Futures Contracts
| Futures Contracts—Long |
Expiration Date |
Number of Contracts |
Notional Amount |
Value/ Unrealized Appreciation/ (Depreciation) |
||||||||||||||||
| S&P Midcap 400 Index E-Mini Futures |
03/15/24 | 57 | USD | 16,014,150 | $ | 989,698 | ||||||||||||||
|
|
|
|||||||||||||||||||
Glossary of Abbreviations
Currencies
| (USD)— | United States Dollar | |||
Index Abbreviations
| (FEDEFF PRV)— | Effective Federal Funds Rate | |||
| (SOFR)— | Secured Overnight Financing Rate | |||
Other Abbreviations
| (ETF)— | Exchange-Traded Fund | |||
| (REIT)— | Real Estate Investment Trust | |||
Fair Value Hierarchy
Accounting principles generally accepted in the United States of America (“GAAP”) define fair market value as the price that the Portfolio would receive to sell an asset or pay to transfer a liability in an orderly transaction between market participants at the measurement date. It establishes a fair value hierarchy that prioritizes inputs to valuation methods and requires disclosure of the fair value hierarchy, separately for each major category of assets and liabilities, that segregates fair value measurements into three levels. Levels 1, 2 and 3 of the fair value hierarchy are defined as follows:
Level 1 - unadjusted quoted prices in active markets for identical investments
Level 2 - other significant observable inputs (including, but not limited to, quoted prices for similar assets or liabilities in markets that are either active or inactive; inputs other than quoted prices that are observable such as interest rates, yield curves, volatilities, prepayment speeds, loss severities, credit risks, default rates, or other market corroborated inputs)
Level 3 - significant unobservable inputs based on the best information available in the circumstances, to the extent observable inputs are unavailable (including the Portfolio’s own assumptions used in determining the fair value of investments and derivative financial instruments)
The inputs or methodologies used for valuing investments are not necessarily an indication of the risk associated with investing in them. Changes to the inputs or methodologies used may result in transfers between levels. A reconciliation of Level 3 securities, if any, will be disclosed following the fair value hierarchy table. For more information about the Portfolio’s policy regarding the valuation of investments, please refer to the Notes to Financial Statements.
The following table summarizes the fair value hierarchy of the Portfolio’s investments as of December 31, 2023:
| Description | Level 1 | Level 2 | Level 3 | Total | ||||||||||||
| Total Common Stocks* |
$ | 1,000,951,670 | $ | — | $ | — | $ | 1,000,951,670 | ||||||||
| Total Mutual Funds* |
18,773,060 | — | — | 18,773,060 | ||||||||||||
| Total Short-Term Investments* |
— | 16,268,259 | — | 16,268,259 | ||||||||||||
| Securities Lending Reinvestments | ||||||||||||||||
| Certificates of Deposit |
— | 10,005,758 | — | 10,005,758 | ||||||||||||
| Commercial Paper |
— | 1,983,562 | — | 1,983,562 | ||||||||||||
| Repurchase Agreements |
— | 77,865,137 | — | 77,865,137 | ||||||||||||
| Time Deposits |
— | 9,000,000 | — | 9,000,000 | ||||||||||||
| Mutual Funds |
36,501,271 | — | — | 36,501,271 | ||||||||||||
| Total Securities Lending Reinvestments |
36,501,271 | 98,854,457 | — | 135,355,728 | ||||||||||||
| Total Investments |
$ | 1,056,226,001 | $ | 115,122,716 | $ | — | $ | 1,171,348,717 | ||||||||
| Collateral for Securities Loaned (Liability) |
$ | — | $ | (135,337,738 | ) | $ | — | $ | (135,337,738 | ) | ||||||
| Futures Contracts |
$ | 989,698 | $ | — | $ | — | $ | 989,698 | ||||||||
| * | See Schedule of Investments for additional detailed categorizations. | |||
See accompanying notes to financial statements.
BHFTII-11
Brighthouse Funds Trust II
MetLife Mid Cap Stock Index Portfolio
Statement of Assets and Liabilities
December 31, 2023
| Assets |
| |||
| Investments at value (a) (b) |
$ | 1,169,996,770 | ||
| Affiliated investments at value (c) |
1,351,947 | |||
| Cash |
9,493 | |||
| Receivable for: |
||||
| Investments sold |
1,207,020 | |||
| Fund shares sold |
301,982 | |||
| Dividends |
1,400,848 | |||
| Prepaid expenses |
3,533 | |||
|
|
|
|||
| Total Assets |
1,174,271,593 | |||
| Liabilities |
| |||
| Collateral for securities loaned |
135,337,738 | |||
| Payables for: |
| |||
| Investments purchased |
1,285,822 | |||
| Fund shares redeemed |
1,742,661 | |||
| Variation margin on futures contracts |
149,366 | |||
| Accrued Expenses: |
| |||
| Management fees |
214,367 | |||
| Distribution and service fees |
108,564 | |||
| Deferred trustees’ fees |
169,435 | |||
| Other expenses |
162,548 | |||
|
|
|
|||
| Total Liabilities |
139,170,501 | |||
|
|
|
|||
| Net Assets |
$ | 1,035,101,092 | ||
|
|
|
|||
| Net Assets Consist of: |
| |||
| Paid in surplus |
$ | 701,647,052 | ||
| Distributable earnings (Accumulated losses) |
333,454,040 | |||
|
|
|
|||
| Net Assets |
$ | 1,035,101,092 | ||
|
|
|
|||
| Net Assets |
| |||
| Class A |
$ | 536,528,622 | ||
| Class B |
299,312,594 | |||
| Class E |
27,254,167 | |||
| Class G |
172,005,709 | |||
| Capital Shares Outstanding* |
| |||
| Class A |
31,779,858 | |||
| Class B |
18,202,314 | |||
| Class E |
1,637,387 | |||
| Class G |
10,618,505 | |||
| Net Asset Value, Offering Price and Redemption Price Per Share |
| |||
| Class A |
$ | 16.88 | ||
| Class B |
16.44 | |||
| Class E |
16.64 | |||
| Class G |
16.20 | |||
| * | The Portfolio is authorized to issue an unlimited number of shares. | |||
| (a) | Identified cost of investments, excluding affiliated investments, was $900,380,298. | |||
| (b) | Includes securities loaned at value of $179,939,747. | |||
| (c) | Identified cost of affiliated investments was $924,381. | |||
Statement of Operations
Year Ended December 31, 2023
| Investment Income |
| |||
| Dividends |
$ | 15,301,735 | ||
| Interest |
711,984 | |||
| Securities lending income |
453,088 | |||
|
|
|
|||
| Total investment income |
16,466,807 | |||
| Expenses |
| |||
| Management fees |
2,471,966 | |||
| Administration fees |
53,388 | |||
| Custodian and accounting fees |
80,564 | |||
| Distribution and service fees—Class B |
721,011 | |||
| Distribution and service fees—Class E |
39,705 | |||
| Distribution and service fees—Class G |
482,498 | |||
| Audit and tax services |
49,026 | |||
| Legal |
46,604 | |||
| Trustees’ fees and expenses |
46,220 | |||
| Shareholder reporting |
83,418 | |||
| Insurance |
8,882 | |||
| Miscellaneous |
125,703 | |||
|
|
|
|||
| Total expenses |
4,208,985 | |||
| Less management fee waiver |
(25,075 | ) | ||
|
|
|
|||
| Net expenses |
4,183,910 | |||
|
|
|
|||
| Net Investment Income |
12,282,897 | |||
|
|
|
|||
| Net Realized and Unrealized Gain (Loss) |
| |||
| Net realized gain (loss) on: | ||||
| Investments |
51,404,956 | |||
| Affiliated investments |
62,095 | |||
| Futures contracts |
226,159 | |||
|
|
|
|||
| Net realized gain (loss) |
51,693,210 | |||
|
|
|
|||
| Net change in unrealized appreciation (depreciation) on: | ||||
| Investments |
84,645,066 | |||
| Affiliated investments |
(39,726 | ) | ||
| Futures contracts |
1,295,328 | |||
|
|
|
|||
| Net change in unrealized appreciation (depreciation) |
85,900,668 | |||
|
|
|
|||
| Net realized and unrealized gain (loss) |
137,593,878 | |||
|
|
|
|||
| Net Increase (Decrease) in Net Assets From Operations |
$ | 149,876,775 | ||
|
|
|
|||
See accompanying notes to financial statements.
BHFTII-12
Brighthouse Funds Trust II
MetLife Mid Cap Stock Index Portfolio
Statements of Changes in Net Assets
| Year Ended December 31, 2023 |
Year Ended December 31, 2022 |
|||||||
| Increase (Decrease) in Net Assets: |
||||||||
| From Operations |
||||||||
| Net investment income (loss) |
$ | 12,282,897 | $ | 12,315,580 | ||||
| Net realized gain (loss) |
51,693,210 | 64,477,353 | ||||||
| Net change in unrealized appreciation (depreciation) |
85,900,668 | (238,751,221 | ) | |||||
|
|
|
|
|
|||||
| Increase (decrease) in net assets from operations |
149,876,775 | (161,958,288 | ) | |||||
|
|
|
|
|
|||||
| From Distributions to Shareholders |
||||||||
| Class A |
(39,084,764 | ) | (91,716,740 | ) | ||||
| Class B |
(22,061,311 | ) | (54,536,369 | ) | ||||
| Class E |
(2,015,323 | ) | (5,150,333 | ) | ||||
| Class G |
(12,509,646 | ) | (28,926,185 | ) | ||||
|
|
|
|
|
|||||
| Total distributions |
(75,671,044 | ) | (180,329,627 | ) | ||||
|
|
|
|
|
|||||
| Increase (decrease) in net assets from capital share transactions |
(9,864,256 | ) | 82,626,892 | |||||
|
|
|
|
|
|||||
| Total increase (decrease) in net assets |
64,341,475 | (259,661,023 | ) | |||||
| Net Assets |
||||||||
| Beginning of period |
970,759,617 | 1,230,420,640 | ||||||
|
|
|
|
|
|||||
| End of period |
$ | 1,035,101,092 | $ | 970,759,617 | ||||
|
|
|
|
|
|||||
Other Information:
Capital Shares
Transactions in capital shares were as follows:
| Year Ended December 31, 2023 |
Year Ended December 31, 2022 |
|||||||||||||||
| Shares | Value | Shares | Value | |||||||||||||
| Class A |
||||||||||||||||
| Sales |
2,856,418 | $ | 44,987,208 | 1,908,949 | $ | 33,557,319 | ||||||||||
| Reinvestments |
2,529,758 | 39,084,764 | 6,184,541 | 91,716,740 | ||||||||||||
| Redemptions |
(5,568,828 | ) | (89,726,826 | ) | (4,138,209 | ) | (73,349,023 | ) | ||||||||
|
|
|
|
|
|
|
|
|
|||||||||
| Net increase (decrease) |
(182,652 | ) | $ | (5,654,854 | ) | 3,955,281 | $ | 51,925,036 | ||||||||
|
|
|
|
|
|
|
|
|
|||||||||
| Class B |
||||||||||||||||
| Sales |
456,656 | $ | 7,012,104 | 492,986 | $ | 8,133,268 | ||||||||||
| Reinvestments |
1,463,922 | 22,061,311 | 3,763,725 | 54,536,369 | ||||||||||||
| Redemptions |
(2,439,985 | ) | (38,158,219 | ) | (2,871,257 | ) | (49,320,878 | ) | ||||||||
|
|
|
|
|
|
|
|
|
|||||||||
| Net increase (decrease) |
(519,407 | ) | $ | (9,084,804 | ) | 1,385,454 | $ | 13,348,759 | ||||||||
|
|
|
|
|
|
|
|
|
|||||||||
| Class E |
||||||||||||||||
| Sales |
71,036 | $ | 1,126,337 | 67,288 | $ | 1,151,989 | ||||||||||
| Reinvestments |
132,152 | 2,015,323 | 351,799 | 5,150,333 | ||||||||||||
| Redemptions |
(295,276 | ) | (4,681,088 | ) | (297,090 | ) | (5,099,648 | ) | ||||||||
|
|
|
|
|
|
|
|
|
|||||||||
| Net increase (decrease) |
(92,088 | ) | $ | (1,539,428 | ) | 121,997 | $ | 1,202,674 | ||||||||
|
|
|
|
|
|
|
|
|
|||||||||
| Class G |
||||||||||||||||
| Sales |
826,442 | $ | 12,621,279 | 669,357 | $ | 11,771,934 | ||||||||||
| Reinvestments |
842,400 | 12,509,646 | 2,024,226 | 28,926,185 | ||||||||||||
| Redemptions |
(1,217,775 | ) | (18,716,095 | ) | (1,440,086 | ) | (24,547,696 | ) | ||||||||
|
|
|
|
|
|
|
|
|
|||||||||
| Net increase (decrease) |
451,067 | $ | 6,414,830 | 1,253,497 | $ | 16,150,423 | ||||||||||
|
|
|
|
|
|
|
|
|
|||||||||
| Increase (decrease) derived from capital shares transactions |
$ | (9,864,256 | ) | $ | 82,626,892 | |||||||||||
|
|
|
|
|
|||||||||||||
See accompanying notes to financial statements.
BHFTII-13
Brighthouse Funds Trust II
MetLife Mid Cap Stock Index Portfolio
Financial Highlights
| Selected per share data | ||||||||||||||||||||
| Class A | ||||||||||||||||||||
| Year Ended December 31, | ||||||||||||||||||||
| 2023 | 2022 | 2021 | 2020 | 2019 | ||||||||||||||||
| Net Asset Value, Beginning of Period |
$ | 15.73 | $ | 22.29 | $ | 19.01 | $ | 18.27 | $ | 16.32 | ||||||||||
|
|
|
|
|
|
|
|
|
|
|
|||||||||||
| Income (Loss) from Investment Operations |
| |||||||||||||||||||
| Net investment income (loss) (a) |
0.22 | 0.23 | 0.21 | 0.21 | 0.26 | |||||||||||||||
| Net realized and unrealized gain (loss) |
2.20 | (3.39 | ) | 4.36 | 1.85 | 3.78 | ||||||||||||||
|
|
|
|
|
|
|
|
|
|
|
|||||||||||
| Total income (loss) from investment operations |
2.42 | (3.16 | ) | 4.57 | 2.06 | 4.04 | ||||||||||||||
|
|
|
|
|
|
|
|
|
|
|
|||||||||||
| Less Distributions |
| |||||||||||||||||||
| Distributions from net investment income |
(0.22 | ) | (0.22 | ) | (0.24 | ) | (0.24 | ) | (0.26 | ) | ||||||||||
| Distributions from net realized capital gains |
(1.05 | ) | (3.18 | ) | (1.05 | ) | (1.08 | ) | (1.83 | ) | ||||||||||
|
|
|
|
|
|
|
|
|
|
|
|||||||||||
| Total distributions |
(1.27 | ) | (3.40 | ) | (1.29 | ) | (1.32 | ) | (2.09 | ) | ||||||||||
|
|
|
|
|
|
|
|
|
|
|
|||||||||||
| Net Asset Value, End of Period |
$ | 16.88 | $ | 15.73 | $ | 22.29 | $ | 19.01 | $ | 18.27 | ||||||||||
|
|
|
|
|
|
|
|
|
|
|
|||||||||||
| Total Return (%) (b) |
16.08 | (13.26 | ) | 24.40 | 13.39 | 25.95 | ||||||||||||||
| Ratios/Supplemental Data |
||||||||||||||||||||
| Gross ratio of expenses to average net assets (%) |
0.30 | 0.29 | 0.30 | 0.31 | 0.30 | |||||||||||||||
| Net ratio of expenses to average net assets (%) (c) |
0.30 | 0.29 | 0.29 | 0.31 | 0.30 | |||||||||||||||
| Ratio of net investment income (loss) to average net assets (%) |
1.37 | 1.31 | 1.00 | 1.33 | 1.44 | |||||||||||||||
| Portfolio turnover rate (%) |
26 | 22 | 33 | 31 | 24 | |||||||||||||||
| Net assets, end of period (in millions) |
$ | 536.5 | $ | 502.7 | $ | 624.2 | $ | 553.3 | $ | 528.6 | ||||||||||
| Class B | ||||||||||||||||||||
| Year Ended December 31, | ||||||||||||||||||||
| 2023 | 2022 | 2021 | 2020 | 2019 | ||||||||||||||||
| Net Asset Value, Beginning of Period |
$ | 15.35 | $ | 21.82 | $ | 18.64 | $ | 17.93 | $ | 16.05 | ||||||||||
|
|
|
|
|
|
|
|
|
|
|
|||||||||||
| Income (Loss) from Investment Operations |
| |||||||||||||||||||
| Net investment income (loss) (a) |
0.17 | 0.18 | 0.16 | 0.17 | 0.21 | |||||||||||||||
| Net realized and unrealized gain (loss) |
2.14 | (3.31 | ) | 4.26 | 1.82 | 3.71 | ||||||||||||||
|
|
|
|
|
|
|
|
|
|
|
|||||||||||
| Total income (loss) from investment operations |
2.31 | (3.13 | ) | 4.42 | 1.99 | 3.92 | ||||||||||||||
|
|
|
|
|
|
|
|
|
|
|
|||||||||||
| Less Distributions |
| |||||||||||||||||||
| Distributions from net investment income |
(0.17 | ) | (0.16 | ) | (0.19 | ) | (0.20 | ) | (0.21 | ) | ||||||||||
| Distributions from net realized capital gains |
(1.05 | ) | (3.18 | ) | (1.05 | ) | (1.08 | ) | (1.83 | ) | ||||||||||
|
|
|
|
|
|
|
|
|
|
|
|||||||||||
| Total distributions |
(1.22 | ) | (3.34 | ) | (1.24 | ) | (1.28 | ) | (2.04 | ) | ||||||||||
|
|
|
|
|
|
|
|
|
|
|
|||||||||||
| Net Asset Value, End of Period |
$ | 16.44 | $ | 15.35 | $ | 21.82 | $ | 18.64 | $ | 17.93 | ||||||||||
|
|
|
|
|
|
|
|
|
|
|
|||||||||||
| Total Return (%) (b) |
15.76 | (13.44 | ) | 24.07 | 13.15 | 25.57 | ||||||||||||||
| Ratios/Supplemental Data |
||||||||||||||||||||
| Gross ratio of expenses to average net assets (%) |
0.55 | 0.54 | 0.55 | 0.56 | 0.55 | |||||||||||||||
| Net ratio of expenses to average net assets (%) (c) |
0.55 | 0.54 | 0.54 | 0.56 | 0.55 | |||||||||||||||
| Ratio of net investment income (loss) to average net assets (%) |
1.12 | 1.06 | 0.75 | 1.08 | 1.19 | |||||||||||||||
| Portfolio turnover rate (%) |
26 | 22 | 33 | 31 | 24 | |||||||||||||||
| Net assets, end of period (in millions) |
$ | 299.3 | $ | 287.3 | $ | 378.3 | $ | 370.5 | $ | 364.5 | ||||||||||
Please see following page for Financial Highlights footnote legend.
See accompanying notes to financial statements.
BHFTII-14
Brighthouse Funds Trust II
MetLife Mid Cap Stock Index Portfolio
Financial Highlights
| Selected per share data | ||||||||||||||||||||
| Class E | ||||||||||||||||||||
| Year Ended December 31, | ||||||||||||||||||||
| 2023 | 2022 | 2021 | 2020 | 2019 | ||||||||||||||||
| Net Asset Value, Beginning of Period |
$ | 15.52 | $ | 22.04 | $ | 18.81 | $ | 18.09 | $ | 16.17 | ||||||||||
|
|
|
|
|
|
|
|
|
|
|
|||||||||||
| Income (Loss) from Investment Operations |
| |||||||||||||||||||
| Net investment income (loss) (a) |
0.19 | 0.20 | 0.18 | 0.19 | 0.23 | |||||||||||||||
| Net realized and unrealized gain (loss) |
2.17 | (3.35 | ) | 4.31 | 1.82 | 3.75 | ||||||||||||||
|
|
|
|
|
|
|
|
|
|
|
|||||||||||
| Total income (loss) from investment operations |
2.36 | (3.15 | ) | 4.49 | 2.01 | 3.98 | ||||||||||||||
|
|
|
|
|
|
|
|
|
|
|
|||||||||||
| Less Distributions |
| |||||||||||||||||||
| Distributions from net investment income |
(0.19 | ) | (0.19 | ) | (0.21 | ) | (0.21 | ) | (0.23 | ) | ||||||||||
| Distributions from net realized capital gains |
(1.05 | ) | (3.18 | ) | (1.05 | ) | (1.08 | ) | (1.83 | ) | ||||||||||
|
|
|
|
|
|
|
|
|
|
|
|||||||||||
| Total distributions |
(1.24 | ) | (3.37 | ) | (1.26 | ) | (1.29 | ) | (2.06 | ) | ||||||||||
|
|
|
|
|
|
|
|
|
|
|
|||||||||||
| Net Asset Value, End of Period |
$ | 16.64 | $ | 15.52 | $ | 22.04 | $ | 18.81 | $ | 18.09 | ||||||||||
|
|
|
|
|
|
|
|
|
|
|
|||||||||||
| Total Return (%) (b) |
15.91 | (13.40 | ) | 24.23 | 13.21 | 25.77 | ||||||||||||||
| Ratios/Supplemental Data |
||||||||||||||||||||
| Gross ratio of expenses to average net assets (%) |
0.45 | 0.44 | 0.45 | 0.46 | 0.45 | |||||||||||||||
| Net ratio of expenses to average net assets (%) (c) |
0.45 | 0.44 | 0.44 | 0.46 | 0.45 | |||||||||||||||
| Ratio of net investment income (loss) to average net assets (%) |
1.22 | 1.16 | 0.85 | 1.18 | 1.29 | |||||||||||||||
| Portfolio turnover rate (%) |
26 | 22 | 33 | 31 | 24 | |||||||||||||||
| Net assets, end of period (in millions) |
$ | 27.3 | $ | 26.8 | $ | 35.4 | $ | 33.1 | $ | 33.3 | ||||||||||
| Class G | ||||||||||||||||||||
| Year Ended December 31, | ||||||||||||||||||||
| 2023 | 2022 | 2021 | 2020 | 2019 | ||||||||||||||||
| Net Asset Value, Beginning of Period |
$ | 15.14 | $ | 21.59 | $ | 18.46 | $ | 17.78 | $ | 15.93 | ||||||||||
|
|
|
|
|
|
|
|
|
|
|
|||||||||||
| Income (Loss) from Investment Operations |
| |||||||||||||||||||
| Net investment income (loss) (a) |
0.16 | 0.17 | 0.14 | 0.16 | 0.20 | |||||||||||||||
| Net realized and unrealized gain (loss) |
2.12 | (3.28 | ) | 4.23 | 1.79 | 3.69 | ||||||||||||||
|
|
|
|
|
|
|
|
|
|
|
|||||||||||
| Total income (loss) from investment operations |
2.28 | (3.11 | ) | 4.37 | 1.95 | 3.89 | ||||||||||||||
|
|
|
|
|
|
|
|
|
|
|
|||||||||||
| Less Distributions |
| |||||||||||||||||||
| Distributions from net investment income |
(0.17 | ) | (0.16 | ) | (0.19 | ) | (0.19 | ) | (0.21 | ) | ||||||||||
| Distributions from net realized capital gains |
(1.05 | ) | (3.18 | ) | (1.05 | ) | (1.08 | ) | (1.83 | ) | ||||||||||
|
|
|
|
|
|
|
|
|
|
|
|||||||||||
| Total distributions |
(1.22 | ) | (3.34 | ) | (1.24 | ) | (1.27 | ) | (2.04 | ) | ||||||||||
|
|
|
|
|
|
|
|
|
|
|
|||||||||||
| Net Asset Value, End of Period |
$ | 16.20 | $ | 15.14 | $ | 21.59 | $ | 18.46 | $ | 17.78 | ||||||||||
|
|
|
|
|
|
|
|
|
|
|
|||||||||||
| Total Return (%) (b) |
15.76 | (13.50 | ) | 24.01 | 13.07 | 25.54 | ||||||||||||||
| Ratios/Supplemental Data |
||||||||||||||||||||
| Gross ratio of expenses to average net assets (%) |
0.60 | 0.59 | 0.60 | 0.61 | 0.60 | |||||||||||||||
| Net ratio of expenses to average net assets (%) (c) |
0.60 | 0.59 | 0.59 | 0.61 | 0.60 | |||||||||||||||
| Ratio of net investment income (loss) to average net assets (%) |
1.07 | 1.01 | 0.70 | 1.03 | 1.14 | |||||||||||||||
| Portfolio turnover rate (%) |
26 | 22 | 33 | 31 | 24 | |||||||||||||||
| Net assets, end of period (in millions) |
$ | 172.0 | $ | 153.9 | $ | 192.4 | $ | 168.4 | $ | 149.1 | ||||||||||
| (a) | Per share amounts based on average shares outstanding during the period. | |||
| (b) | Total return does not reflect any insurance, sales, separate account or administrative charges of variable annuity or life insurance contracts or any additional expenses that contract owners may bear under their variable contracts. If these charges were included, the returns would be lower. | |||
| (c) | Includes the effects of management fee waivers (see Note 6 of the Notes to Financial Statements). | |||
See accompanying notes to financial statements.
BHFTII-15
Brighthouse Funds Trust II
MetLife Mid Cap Stock Index Portfolio
Notes to Financial Statements—December 31, 2023
1. Organization
Brighthouse Funds Trust II (the “Trust”) is organized as a Delaware statutory trust and registered under the Investment Company Act of 1940, as amended (the “1940 Act”), as an open-end management investment company. The Trust, which is managed by Brighthouse Investment Advisers, LLC (“Brighthouse Investment Advisers” or the “Adviser”), currently offers twenty-nine series (the “Portfolios”), each of which operates as a distinct investment vehicle of the Trust. The series included in this report is MetLife Mid Cap Stock Index Portfolio (the “Portfolio”), which is diversified. Shares of the Portfolio are not offered directly to the general public and are currently available only to separate accounts of insurance companies, including insurance companies affiliated with the Adviser.
The Portfolio has registered and offers four classes of shares: Class A, B, E and G shares. Shares of each class of the Portfolio represent an equal pro rata interest in the Portfolio and generally give the shareholder the same voting, dividend, liquidation, and other rights. Investment income, realized and unrealized capital gains and losses, the common expenses of the Portfolio, and certain Portfolio-level expense reductions, if any, are allocated on a pro rata basis to each class based on the relative net assets of each class to the net assets of the Portfolio. Each class of shares differs in its respective distribution plan and such distribution expenses are allocated to the corresponding class of shares.
2. Significant Accounting Policies
The preparation of financial statements in conformity with accounting principles generally accepted in the United States of America (“GAAP”) requires management to make estimates and assumptions that affect the reported amounts of assets and liabilities and disclosure of contingent assets and liabilities as of the date of the financial statements and the reported amounts of income and expenses during the reporting period. Actual results could differ from those estimates. In the preparation of these financial statements, management has evaluated events and transactions subsequent to December 31, 2023 through the date the financial statements were issued.
The Portfolio is an investment company and follows the accounting and reporting guidance of the Financial Accounting Standards Board (“FASB”) Accounting Standards Codification Topic 946—Financial Services—Investment Companies. The following is a summary of significant accounting policies consistently followed by the Portfolio in the preparation of its financial statements.
Investment Valuation and Fair Value Measurements - The Portfolio values its investments for purposes of calculating its net asset value (“NAV”) using procedures that allow for a variety of methodologies to be used to value the Portfolio’s investments. The specific methodology used for an investment may vary based on the market data available for a specific investment at the time the Portfolio calculates its NAV or based on other considerations. The procedures also permit a level of judgment to be used in the valuation process.
Domestic and foreign equity securities, such as common stock, exchange-traded funds, rights, warrants, and preferred stock, that are traded on a securities exchange on a valuation date are generally valued at their last quoted sale price or official closing price on the primary exchange for such security, or, if no sales occurred on that day, at the last reported bid price. Equity securities traded over-the-counter (“OTC”) are generally valued at the last reported bid price. In the event of a major exchange closing during the trading day, the Adviser may use other market information obtained from quotation reporting systems, established market makers, or pricing services in valuing the securities. Valuation adjustments may be applied to certain foreign equity securities that are traded solely on foreign exchanges that close before the time as of which the Portfolio determines its NAV to account for the market movement between the close of the foreign exchanges and the time as of which the Portfolio determines its NAV. The Portfolio may use a systematic fair valuation model provided by a pricing service to value securities principally traded in these foreign markets to adjust for possible market movements or other changes that may occur between the close of the foreign exchanges and the time as of which the Portfolio determines its NAV. Foreign equity securities valued using these valuation adjustments are generally categorized as Level 2 within the fair value hierarchy. Equity securities that are actively traded, and have no valuation adjustments applied, are categorized as Level 1 within the fair value hierarchy. Other equity securities traded on inactive markets or valued in reference to similar instruments traded on active markets are generally categorized as Level 2 within the fair value hierarchy.
Investments in registered open-end management investment companies are valued at reported NAV per share on the valuation date and are categorized as Level 1 within the fair value hierarchy.
Debt securities, including corporate, convertible and municipal bonds and notes; obligations of the U.S. Treasury and U.S. government agencies; foreign sovereign issues; and non-U.S. bonds, are generally valued based upon evaluated or composite bid quotations obtained from third-party pricing services and/or brokers and dealers selected by the Adviser (each a “pricing service”). Such pricing services may use matrix pricing, which considers observable inputs including, among other things, issuer details, maturity dates, interest rates, yield curves, rates of prepayment, credit risks/spreads, default rates, reported trades, broker-dealer quotes and quoted prices for similar assets. Short-term obligations with a remaining maturity of sixty days or less may be valued at amortized cost in the absence of market quotes, so long as the amortized cost value of such short-term debt instrument is approximately the same as the fair value of the instrument as determined without the use of amortized cost valuation. Floating rate loans are generally valued based upon
BHFTII-16
Brighthouse Funds Trust II
MetLife Mid Cap Stock Index Portfolio
Notes to Financial Statements—December 31, 2023—(Continued)
an evaluated or composite average of aggregate bid and ask quotations supplied by brokers or dealers, as obtained from the pricing service. Securities that use similar valuation techniques and inputs as described above are generally categorized as Level 2 within the fair value hierarchy.
Options, whether on securities, indices, futures contracts, or otherwise, traded on exchanges are valued at the last sale price available as of the close of business on a valuation day or, if there is no such price available, at the last reported bid price. These types of options are categorized as Level 1 within the fair value hierarchy. Futures contracts that are traded on commodity exchanges are valued at their settlement prices established by the exchanges on which they are traded as of the close of such exchanges and are categorized as Level 1 within the fair value hierarchy.
If no current market quotation is readily available or market value quotations are deemed to be unreliable for an investment, the fair value of the investment will be determined in accordance with procedures. A market quotation is readily available only when that quotation is a quoted price (unadjusted) in active markets for identical investments that the Portfolio can access at the measurement date, provided that a quotation will not be readily available if it is not reliable.
Pursuant to Rule 2a-5 under the 1940 Act, the Board of Trustees (the “Board” or “Trustees” ) of the Trust has designated Brighthouse Investment Advisers, acting through its Valuation Committee (“Committee”), as the Portfolio’s “valuation designee” to perform the Portfolio’s fair value determinations. The Board oversees Brighthouse Investment Advisers in its role as the Valuation Designee and receives reports from Brighthouse Investment Advisers regarding its process and the valuation of the Portfolio’s investments to assist with such oversight.
No single standard for determining the fair value of an investment can be set forth because fair value depends upon the facts and circumstances with respect to each investment. Information relating to any relevant factors may be obtained by the Committee from any appropriate source, including the subadviser of the Portfolio, the Custodian, a pricing service, market maker and/or broker for such security or the issuer. Appropriate methodologies for determining fair value under particular circumstances may include: matrix pricing, a discounted cash flow analysis, comparisons of securities with comparable characteristics, value based on multiples of earnings, discount from market price of similar marketable securities, or a combination of these and other methods.
Foreign Currency Translation - The books and records of the Portfolio are maintained in U.S. dollars. The values of securities, currencies, and other assets and liabilities denominated in currencies other than the U.S. dollar are translated into U.S. dollars based upon foreign exchange rates prevailing at the end of the period. Purchases and sales of investment securities, income, and expenses are translated on the respective dates of such transactions. Because the values of investment securities are translated at the foreign exchange rates prevailing at the end of the period, that portion of the results of operations arising from changes in exchange rates and that portion of the results of operations reflecting fluctuations arising from changes in market prices of the investment securities are not separated. Such fluctuations are included in the net realized and unrealized gain or loss on investments.
Net realized foreign exchange gains or losses arise from activity in forward foreign currency exchange contracts, sales of foreign currency, currency gains or losses realized between the trade and settlement dates on securities transactions, and the difference between the amounts of dividends, interest, and foreign withholding taxes recorded by the Portfolio and the U.S. dollar-equivalent of the amounts actually received or paid by the Portfolio. Net unrealized foreign exchange gains and losses arise from changes in the value of assets and liabilities, other than investment securities, resulting from changes in foreign exchange rates.
Investment Transactions and Related Investment Income - Portfolio security transactions are recorded on the trade date. Dividend income is recorded on the ex-dividend date or, for certain foreign securities, when notified. Interest income, which includes amortization of premium and accretion of discount on debt securities, is recorded on the accrual basis. Realized gains and losses on investments are determined on the identified cost basis, which is the same basis used for federal income tax purposes. Foreign income and foreign capital gains on some foreign securities may be subject to foreign taxes, which are accrued as applicable. These foreign taxes have been provided for in accordance with the Portfolio’s understanding of the applicable countries’ tax rules and rates.
Dividends and Distributions to Shareholders - The Portfolio records dividends and distributions on the ex-dividend date. Net realized gains from securities transactions (if any) are generally distributed annually to shareholders. The timing and characterization of certain income and capital gains distributions are determined in accordance with federal tax regulations that may differ from GAAP. Permanent book and tax basis differences relating to shareholder distributions will result in reclassification between distributable earnings (accumulated losses) and paid in surplus. These adjustments have no impact on net assets or the results of operations.
Income Taxes - It is the Portfolio’s policy to comply with the requirements of the Internal Revenue Code of 1986, as amended, and regulations thereunder, applicable to regulated investment companies, and to distribute, with respect to each taxable year, all of its taxable income to shareholders. Therefore, no federal income tax provision is required. The Portfolio files U.S. federal tax returns. No income tax returns are currently under examination. The Portfolio’s federal tax returns remain subject to examination by the Internal Revenue Service for three fiscal years after the returns are filed. As of December 31, 2023, the Portfolio had no uncertain tax positions that would require financial statement recognition, derecognition or disclosure.
BHFTII-17
Brighthouse Funds Trust II
MetLife Mid Cap Stock Index Portfolio
Notes to Financial Statements—December 31, 2023—(Continued)
Repurchase Agreements - The Portfolio may enter into repurchase agreements, under the terms of a Master Repurchase Agreement (“MRA”), or Global Master Repurchase Agreement (“GMRA”), with selected commercial banks and broker-dealers, under which the Portfolio acquires securities as collateral and agrees to resell the securities at an agreed-upon time and at an agreed-upon price. The Portfolio, through the Custodian or a subcustodian, under a tri-party repurchase agreement, receives delivery of the underlying securities collateralizing any repurchase agreements. It is the Portfolio’s policy that the market value of the collateral be equal to at least 100% of the repurchase price in the case of a repurchase agreement of one-day duration and equal to at least 102% of the repurchase price in the case of all other repurchase agreements. In the event of default or failure by a party to perform an obligation in connection with any repurchase transaction, the MRA or GMRA gives the non-defaulting party the right to set-off claims and to apply property held by it in connection with any repurchase transaction against obligations owed to it under the agreement.
At December 31, 2023, the Portfolio invested cash collateral for loans of portfolio securities in repurchase agreements with a gross value of $77,865,137, which is included as part of investments at value on the Statement of Assets and Liabilities. The value of the related collateral exceeded the value of the repurchase agreements at December 31, 2023.
Securities Lending - The Portfolio may lend its portfolio securities to certain qualified brokers who borrow securities in order to complete certain securities transactions. By lending its portfolio securities, the Portfolio attempts to increase its net investment income through the receipt of income on collateral held from securities on loan. Any gain or loss in the market price of the loaned securities that might occur, any interest earned, and any dividends declared during the term of the loan, would accrue to the account of the Portfolio.
The Trust has entered into a Non-Custodial Securities Lending Agreement with JPMorgan Chase Bank, N.A. (the “Lending Agent”). Under the agreement, the Lending Agent is authorized to loan portfolio securities on the Portfolio’s behalf. In exchange, the Portfolio generally receives cash, U.S. Government securities, letters of credit, or other collateral deemed appropriate by the Adviser. The Portfolio receives collateral equal to at least 102% of the market value for loans secured by government securities or cash in the same currency as the loaned shares and 105% for all other loaned securities at each loan’s inception. Collateral representing at least 100% of the market value of the loaned securities is maintained for the duration of the loan. Any cash collateral received by the Portfolio is generally invested by the Lending Agent in short-term investments, which may include certificates of deposit, commercial paper, repurchase agreements, including repurchase agreements with respect to equity securities, time deposits, master demand notes and money market funds. The market value of investments made with cash collateral received are disclosed in the Schedule of Investments and the valuation techniques are described in Note 2. The value of the securities on loan may change each business day. If the market value of the collateral at the close of trading on a business day is less than 100% of the market value of the loaned securities at the close of trading on that day, the borrower is required to deliver, by the close of business on the following business day, an additional amount of collateral, so that the total amount of posted collateral is equal to at least 100% of the market value of all the loaned securities as of such preceding day. A portion of the income earned on the collateral is rebated to the borrower of the securities and the remainder is split between the Lending Agent and the Portfolio. On loans collateralized by U.S. government securities, a fee is received from the borrower and is allocated between the Portfolio and the Lending Agent.
Income received by the Portfolio in securities lending transactions during the year ended December 31, 2023 is reflected as securities lending income on the Statement of Operations. The values of any securities loaned by the Portfolio and the related collateral at December 31, 2023 are disclosed in the footnotes to the Schedule of Investments. The value of the related collateral received by the Portfolio exceeded the value of the securities out on loan at December 31, 2023.
The risks associated with lending portfolio securities include, but are not limited to, possible delays in receiving additional collateral or in the recovery of the loaned securities, possible loss of rights in the collateral should the borrower fail financially, as well as risk of loss in the value of the collateral or the value of the investments made with the collateral. To the extent the Portfolio uses cash collateral it receives to invest in repurchase agreements with respect to equity securities, it is subject to the risk of loss if the value of the equity securities declines and the counterparty defaults on its obligation to repurchase such securities. The Lending Agent shall indemnify the Portfolio in the case of default of any securities borrower, subject to the terms of the Non-Custodial Securities Lending Agreement.
BHFTII-18
Brighthouse Funds Trust II
MetLife Mid Cap Stock Index Portfolio
Notes to Financial Statements—December 31, 2023—(Continued)
The following table provides a breakdown of transactions accounted for as secured borrowings, the gross obligations by the type of collateral pledged, and the remaining contractual maturities of those transactions.
| Remaining Contractual Maturity of the Agreements As of December 31, 2023 |
||||||||||||||||||||
| Overnight and Continuous |
Up to 30 Days |
31 - 90 Days |
Greater than 90 days |
Total | ||||||||||||||||
| Securities Lending Transactions |
| |||||||||||||||||||
| Common Stocks |
$ | (129,462,125 | ) | $ | — | $ | — | $ | — | $ | (129,462,125 | ) | ||||||||
| Mutual Funds |
(5,875,613 | ) | — | — | — | (5,875,613 | ) | |||||||||||||
| Total Borrowings |
$ | (135,337,738 | ) | $ | — | $ | — | $ | — | $ | (135,337,738 | ) | ||||||||
| Gross amount of recognized liabilities for securities lending transactions |
|
$ | (135,337,738 | ) | ||||||||||||||||
|
|
|
|||||||||||||||||||
3. Investments in Derivative Instruments
Futures Contracts - The Portfolio may buy and sell futures contracts as a hedge, to maintain investment exposure to a target asset class or to enhance return. The Portfolio may be subject to fluctuations in equity prices, interest rates, commodity prices, and foreign currency exchange rates in the normal course of pursuing its investment objective. Futures contracts are standardized agreements to buy or sell a security, or deliver a final cash settlement price in connection with an index, interest rate, currency, or other asset. The Portfolio must deposit an amount (“initial margin”) equal to a certain percentage of the face value of the futures contract. The initial margin may be in the form of cash or securities, which is returned when the Portfolio’s obligations under the contract have been satisfied. If cash is deposited as the initial margin, it is shown as cash collateral on the Statement of Assets and Liabilities. Futures contracts are marked-to-market daily and subsequent payments (“variation margin”) are made or received by the Portfolio depending on whether unrealized gains or losses are incurred. These amounts are reflected as receivables or payables on the Statement of Assets and Liabilities and as a component of net change in unrealized appreciation/depreciation on the Statement of Operations. When the contract is closed or expires, the Portfolio records a realized gain or loss equal to the difference between the value of the contract at the time it was opened and the value at the time it was closed. Risks of entering into futures contracts (and related options) include the possibility that the market for these instruments may be illiquid and that a change in the value of the futures contract or option may not correlate perfectly with changes in the value of the underlying asset. The exchange’s clearinghouse, as counterparty to all futures, guarantees the futures contracts against default.
The following table summarizes the fair value of derivatives held by the Portfolio at December 31, 2023 by category of risk exposure:
| Asset Derivatives |
||||||
| Risk Exposure |
Statement of Assets & |
Fair Value | ||||
| Equity | Unrealized appreciation on futures contracts (a) | $ | 989,698 | |||
|
|
|
|||||
| (a) | Includes cumulative appreciation/depreciation of futures contracts as reported in the Schedule of Investments. Only the current day’s variation margin is reported within the Statement of Assets and Liabilities. | |||
The following tables summarize the effect of derivative instruments on the Statement of Operations, classified by derivative type and category of risk exposure, for the year ended December 31, 2023:
| Statement of Operations Location—Net Realized Gain (Loss) |
Equity | |||
| Futures contracts |
$ | 226,159 | ||
|
|
|
|||
| Statement of Operations Location—Net Change in Unrealized Appreciation (Depreciation) |
Equity | |||
| Futures contracts |
$ | 1,295,328 | ||
|
|
|
|||
For the year ended December 31, 2023, the average notional par or face amount outstanding for each derivative type was as follows:
| Derivative Description |
Average Notional Par or Face Amount‡ |
|||
| Futures contracts long |
$ | 14,731,745 | ||
| ‡ | Averages are based on activity levels during the period for which the amounts are outstanding. | |||
BHFTII-19
Brighthouse Funds Trust II
MetLife Mid Cap Stock Index Portfolio
Notes to Financial Statements—December 31, 2023—(Continued)
4. Certain Risks
In the normal course of business, the Portfolio invests in securities and enters into transactions where risks exist. Those risks include:
Market Risk: The value of securities held by the Portfolio may decline in response to certain events, including those directly involving the issuers whose securities are owned by the Portfolio; conditions affecting the general economy; overall market changes; local, regional or global political, social or economic instability; currency, interest rate, and price fluctuations, or other factors including terrorism, war, natural disasters and the spread of infectious illness including epidemics or pandemics such as the COVID-19 pandemic. These events may also adversely affect the liquidity of securities held by the Portfolio.
Credit and Counterparty Risk: The Portfolio may be exposed to counterparty risk, or the risk that an entity with which the Portfolio has unsettled or open transactions may default. The potential loss could exceed the value of the financial assets and liabilities recorded in the financial statements. Financial assets that potentially expose the Portfolio to credit and counterparty risk consist principally of cash due from counterparties and investments. The Portfolio manages counterparty risk by entering into agreements only with counterparties that it believes have the financial resources to honor their obligations and by monitoring the financial stability of those counterparties. The Subadviser may attempt to mitigate counterparty risk by (i) periodically assessing the creditworthiness of its trading partners, (ii) monitoring and/or limiting the amount of its net exposure to each individual counterparty based on its assessment, and (iii) requiring collateral from the counterparty for certain transactions. In order to preserve certain safeguards for non-standard settlement trades, the Portfolio restricts its exposure to credit and counterparty losses by entering into master netting agreements (“Master Agreements”) with counterparties (approved brokers) with whom it undertakes a significant volume of transactions. Master Agreements govern the terms of certain transactions and reduce the counterparty risk associated with relevant transactions by specifying credit protection mechanisms and providing standardization that improves legal certainty. Master Agreements can also help limit counterparty risk by specifying collateral posting arrangements at pre-arranged exposure levels.
Repurchase and reverse repurchase agreements are primarily executed under GMRAs or MRAs, which provide the right to set-off. Each repurchase and reverse repurchase agreement is initially collateralized at the transaction level. In the event of default, the total market value exposure will be offset against collateral exchanged to date, which would result in a net receivable/(payable) that would be due from/to the counterparty.
Customer Account Agreements and related addenda govern cleared derivatives transactions such as futures, options on futures, and cleared OTC derivatives. Cleared derivative transactions require posting of initial margin as determined by each relevant clearinghouse. The Portfolio’s clearing broker may also require additional initial margin. Clearinghouse-related initial margin is held by the clearinghouse and additional initial margin is held by the Portfolio’s clearing broker. In a cleared derivative transaction, the Portfolio’s counterparty is a clearinghouse rather than a bank or broker. The clearinghouse stands between the buyer and the seller of the contract; therefore, credit risk is limited to failure of or default by the clearinghouse. While offset rights may exist under applicable law, the Portfolio does not have a contractual right of offset against a clearing broker or clearinghouse in the event of a default (including the bankruptcy or insolvency). Additionally, credit risk exists in cleared derivative transactions with respect to initial and variation margin that is held in a clearing broker’s customer accounts. While clearing brokers are required to segregate, by account class, customer margin from their own assets, in the event that a clearing broker becomes insolvent or goes into bankruptcy and at that time there is a shortfall in the aggregate amount of margin held by the clearing broker for all its clients, typically the shortfall would be allocated on a pro-rata basis across all the clearing broker’s customers, for the relevant account class, potentially resulting in losses to the Portfolio. Variation margin, which accounts for changes in market value, is exchanged daily, but may not be netted between futures and cleared OTC derivatives.
Additional risks associated with each type of investment are described above within the respective security type notes. The Portfolio’s prospectus includes a discussion of the principal risks of investing in the Portfolio.
5. Investment Transactions
Aggregate cost of purchases and proceeds of sales of investment securities, excluding short-term securities, for the year ended December 31, 2023 were as follows:
| Purchases | Sales | |||||||||||||
| U.S. Government | Non-U.S. Government | U.S. Government | Non-U.S. Government | |||||||||||
| $ | 0 | $ | 256,371,196 | $ | 0 | $ | 327,290,278 | |||||||
6. Investment Management Fees and Other Transactions with Affiliates
Investment Management Agreement - Brighthouse Investment Advisers is the investment adviser to the Portfolio. The Trust has entered into an investment management agreement with Brighthouse Investment Advisers with respect to the Portfolio. For providing investment management services to the Portfolio, Brighthouse Investment Advisers receives monthly compensation at the annual rate
BHFTII-20
Brighthouse Funds Trust II
MetLife Mid Cap Stock Index Portfolio
Notes to Financial Statements—December 31, 2023—(Continued)
of 0.250% of average daily net assets. Fees earned by Brighthouse Investment Advisers with respect to the Portfolio for the year ended December 31, 2023 were $2,471,966.
Brighthouse Investment Advisers has entered into an investment subadvisory agreement with MetLife Investment Management, LLC (“MIM”) with respect to managing the Portfolio. For providing subadvisory services to the Portfolio, Brighthouse Investment Advisers has agreed to pay MIM an investment subadvisory fee for each class of the Portfolio as follows:
| % per annum |
Average Daily Net Assets | |
| 0.030% | On the first $500 million | |
| 0.020% | On the next $500 million | |
| 0.010% | On amounts over $1 billion |
Fees earned by MIM with respect to the Portfolio for the year ended December 31, 2023 were $246,486.
Management Fee Waivers - Pursuant to a management fee waiver agreement, the Adviser has agreed, for the period May 1, 2023 to April 30, 2024, to reduce its advisory fees set out above under “Investment Management Agreement” for each class of the Portfolio as follows:
| % per annum reduction |
Average Daily Net Assets | |
| 0.005% | Over $500 million and under $1 billion | |
| 0.010% | Of the next $1 billion | |
| 0.015% | On amounts over $2 billion |
An identical expense agreement was in place for the period April 29, 2022 to April 30, 2023. Amounts waived for the year ended December 31, 2023 are shown as management fee waivers in the Statement of Operations.
Certain officers and trustees of the Trust may also be officers of the Adviser; however, such officers and trustees receive no compensation from the Trust.
Transfer Agency Agreement - Brighthouse Life Insurance Company serves as the transfer agent for the Trust. Brighthouse Life Insurance Company receives no fees for its services to the Trust.
Distribution and Service Fees - The Trust has a distribution agreement with Brighthouse Securities, LLC (the “Distributor”) pursuant to which the Distributor serves as the general distributor of shares of each class (each a “Class”) of each Portfolio. The Distributor is an affiliate of the Trust. The Trust has adopted a Distribution and Services Plan (the “D&S Plan”) relating to Class B, Class D, Class E, Class F and Class G shares of each Portfolio, under Rule 12b-1 under the 1940 Act, pursuant to which the Trust may pay the Distributor a fee (the “Service Fee”) at an annual rate not to exceed 0.25% of each such Portfolio’s average daily net assets attributable to the Class B, Class D, Class E, Class F and Class G shares of the Trust. Each Portfolio may not offer shares of each Class. The D&S Plan also authorizes the Trust, on behalf of each of its Portfolios, to pay to the Distributor a distribution fee (the “Distribution Fee” and together with the Service Fee, the “Fees”) at an annual rate of up to 0.25% of each Portfolio’s average daily net assets attributable to the Class B, Class D, Class E, Class F, and Class G shares in consideration of the services rendered in connection with the sale of such shares by the Distributor. Under the Distribution Agreement with respect to the Trust, Fees are currently paid at an annual rate of 0.25% of average daily net assets in the case of Class B shares, 0.10% of average daily net assets in the case of Class D shares, 0.15% of average daily net assets in the case of Class E shares, 0.20% of average daily net assets in the case of Class F shares and 0.30% of average daily net assets in the case of Class G shares. The D&S Plan is known as a “compensation plan” because the Trust makes payments to the Distributor for services rendered regardless of the actual level of expenditures by the Distributor. Amounts incurred by the Portfolio for the year ended December 31, 2023 are shown as Distribution and service fees in the Statement of Operations.
Deferred Trustee Compensation - Each Trustee who is not currently an employee of the Adviser or any of its affiliates receives compensation from the Trust for his or her service to the Trust. A deferred compensation plan (the “Plan”) is available to the Trustees on a voluntary basis. Deferred amounts remain in the Trust until distributed in accordance with the provisions of the Plan. The value of a participating Trustee’s deferral account is based on theoretical investments of deferred amounts on the normal payment dates in certain portfolios of the Trust or Brighthouse Funds Trust I, an affiliate of the Trust, as designated by the participating Trustee. Changes in the value of participants’ deferral accounts are reflected as a component of Trustees’ fees and expenses in the Statement of Operations. The portion of the accrued obligations allocated to the Portfolio under the Plan is reflected as Deferred trustees’ fees in the Statement of Assets and Liabilities.
7. Contractual Obligations
Under the Trust’s organizational documents, its officers and Trustees may be indemnified against certain liabilities and expenses arising out of the performance of their duties to the Trust. Additionally, the Trust has a variety of indemnification obligations under contracts with its service providers. The Trust’s maximum exposure under these arrangements is unknown, as this would involve future claims that may be made against the Trust that have not yet occurred.
BHFTII-21
Brighthouse Funds Trust II
MetLife Mid Cap Stock Index Portfolio
Notes to Financial Statements—December 31, 2023—(Continued)
8. Transactions in Securities of Affiliated Issuers
A summary of the Portfolio’s transactions in the securities of affiliated issuers during the year ended December 31, 2023 is as follows:
| Security Description |
Market Value December 31, 2022 |
Purchases | Sales | Realized Gain/(Loss) |
Change in Unrealized Appreciation/ (Depreciation) |
Ending Value as of December 31, 2023 |
Number of shares held at December 31, 2023 |
|||||||||||||||||||||
| Brighthouse Financial, Inc. |
$ | 1,605,418 | $ | — | $ | (275,840 | ) | $ | 62,095 | $ | (39,726 | ) | $ | 1,351,947 | 25,547 | |||||||||||||
9. Income Tax Information
The cost basis of investments for federal income tax purposes at December 31, 2023 was as follows:
| Cost basis of investments |
$ | 903,397,511 | ||
|
|
|
|||
| Gross unrealized appreciation |
317,653,502 | |||
| Gross unrealized (depreciation) |
(49,702,296 | ) | ||
|
|
|
|||
| Net unrealized appreciation (depreciation) |
$ | 267,951,206 | ||
|
|
|
The tax character of distributions paid for the years ended December 31, 2023 and 2022 were as follows:
| Ordinary Income |
Long-Term Capital Gain | Total | ||||||||||||||||||
| 2023 |
2022 | 2023 | 2022 | 2023 | 2022 | |||||||||||||||
| $11,896,032 | $ | 37,394,706 | $ | 63,775,012 | $ | 142,934,921 | $ | 75,671,044 | $ | 180,329,627 | ||||||||||
As of December 31, 2023, the components of distributable earnings (accumulated losses) on a federal income tax basis were as follows:
| Undistributed |
Undistributed Long-Term Capital Gain |
Net Unrealized Appreciation (Depreciation) |
Accumulated Capital Losses |
Total | ||||||||||||
| $17,807,379 | $ | 47,864,892 | $ | 267,951,206 | $ | — | $ | 333,623,477 | ||||||||
The Portfolio utilizes the provisions of the federal income tax laws that provide for the carryforward of capital losses for prior years, offsetting such losses against any future realized capital gains. Net capital losses may be carried forward indefinitely and their character is retained as short-term and/or long-term losses.
As of December 31, 2023, the Portfolio had no accumulated capital losses.
10. Recent Accounting Pronouncement & Regulatory Updates
In June 2022, FASB issued Accounting Standards Update 2022-03—Fair Value Measurement (Topic 820)—Fair Value Measurement of Equity Securities Subject to Contractual Sale Restrictions (“ASU 2022-03”). ASU 2022-03 clarifies the guidance in Topic 820 to indicate that a contractual sale restriction should not be considered in the fair value of an equity security subject to such a restriction, and requires entities with investments in equity securities subject to contractual sale restrictions to disclose certain qualitative and quantitative information about such securities. ASU 2022-03 is effective for fiscal years, and interim periods within those fiscal years, beginning after December 15, 2023. ASU 2022-03 is only applicable to an equity security in which the contractual arrangement that restricts its sale is executed or modified on or after the adoption date.
Effective January 24, 2023, the Securities and Exchange Commission adopted rule and form amendments that require open-end management investment companies to transmit concise and visually engaging annual and semiannual reports to shareholders that highlight certain information deemed by the SEC to be particularly important for investors. Certain other information, including financial statements, will no longer appear in shareholder reports but will, as required, be available online, delivered free of charge upon request, and filed on a semiannual basis on Form N-CSR. The rule and form amendments have a compliance date of July 24, 2024. Accordingly, the rule and form amendments will not impact the Portfolio until its 2024 semiannual shareholder report.
BHFTII-22
Brighthouse Funds Trust II
MetLife Mid Cap Stock Index Portfolio
Report of Independent Registered Public Accounting Firm
To the Board of Trustees of Brighthouse Funds Trust II and Shareholders of the MetLife Mid Cap Stock Index Portfolio:
Opinion on the Financial Statements and Financial Highlights
We have audited the accompanying statement of assets and liabilities, including the schedule of investments, of the MetLife Mid Cap Stock Index Portfolio (the “Fund”) (one of the funds constituting the Brighthouse Funds Trust II), as of December 31, 2023, the related statement of operations for the year then ended, the statements of changes in net assets for each of the two years in the period then ended, the financial highlights for each of the five years in the period then ended, and the related notes. In our opinion, the financial statements and financial highlights present fairly, in all material respects, the financial position of the Fund as of December 31, 2023, and the results of its operations for the year then ended, the changes in its net assets for each of the two years in the period then ended, and the financial highlights for each of the five years in the period then ended in conformity with accounting principles generally accepted in the United States of America.
Basis for Opinion
These financial statements and financial highlights are the responsibility of the Fund’s management. Our responsibility is to express an opinion on the Fund’s financial statements and financial highlights based on our audits. We are a public accounting firm registered with the Public Company Accounting Oversight Board (United States) (PCAOB) and are required to be independent with respect to the Fund in accordance with the U.S. federal securities laws and the applicable rules and regulations of the Securities and Exchange Commission and the PCAOB.
We conducted our audits in accordance with the standards of the PCAOB. Those standards require that we plan and perform the audit to obtain reasonable assurance about whether the financial statements and financial highlights are free of material misstatement, whether due to error or fraud. The Fund is not required to have, nor were we engaged to perform, an audit of its internal control over financial reporting. As part of our audits we are required to obtain an understanding of internal control over financial reporting but not for the purpose of expressing an opinion on the effectiveness of the Fund’s internal control over financial reporting. Accordingly, we express no such opinion.
Our audits included performing procedures to assess the risks of material misstatement of the financial statements and financial highlights, whether due to error or fraud, and performing procedures that respond to those risks. Such procedures included examining, on a test basis, evidence regarding the amounts and disclosures in the financial statements and financial highlights. Our audits also included evaluating the accounting principles used and significant estimates made by management, as well as evaluating the overall presentation of the financial statements and financial highlights. Our procedures included confirmation of securities owned as of December 31, 2023, by correspondence with the custodian and brokers; when replies were not received from brokers, we performed other auditing procedures. We believe that our audits provide a reasonable basis for our opinion.
/s/ Deloitte & Touche LLP
Boston, Massachusetts
February 23, 2024
We have served as the auditor of one or more Brighthouse investment companies since 1983.
BHFTII-23
Brighthouse Funds Trust II
Trustees and Officers
MANAGEMENT OF THE TRUSTS
The Boards of Trustees (the “Board”) of Brighthouse Funds Trust I and Brighthouse Funds Trust II (“Trust I” and “Trust II”, respectively, and collectively the “Trusts”) supervise the Trusts and are responsible for representing the interests of shareholders. The Trustees, the Chairman of the Board and the Chairmen of each subcommittee are the same for both Trusts. The Trustees of each Trust meet periodically throughout the year to oversee the Portfolios’ activities, reviewing, among other things, each Portfolio’s performance and its contractual arrangements with various service providers. The Trustees of each Trust elect the officers of the Trust, who are responsible for administering the Trust’s day-to-day operations.
Trustees and Officers
The Trustees and executive officers of the Trusts, as well as their ages and their principal occupations during the past five years, are set forth below. Unless otherwise indicated, the business address of each is c/o Brighthouse Funds Trust I and Brighthouse Funds Trust II, 11225 N. Community House Rd., Charolette, North Carolina 28277. Each Trustee who is deemed an “interested person,” as such term is defined in the 1940 Act, is referred to as an “Interested Trustee.” Those Trustees who are not “interested persons,” as such term is defined in the 1940 Act, are referred to as “Independent Trustees.” There is no limit to the term a Trustee may serve, other than pursuant to the retirement policy adopted by the Independent Trustees. Trustees serve until their death, resignation, retirement or removal in accordance with Trust I’s and Trust II’s respective organizational documents and policies adopted by the Board of the Trust from time to time. Officers hold office at the pleasure of each Board and serve until their removal or resignation in accordance with the Trusts’ respective organizational documents and policies adopted by the Board of each Trust from time to time.
Trustees of the Trusts
| Name and Year of Birth |
Position(s) |
Term of Office |
Principal Occupation(s) During the Past |
Number of |
Other Directorships Held | |||||
| Interested Trustee | ||||||||||
| John Rosenthal* (1960) |
Trustee | Indefinite; From May 2016 (Trust I and Trust II) to present | Chief Investment Officer, Brighthouse Financial, Inc. (2016 to present). | 73 | None | |||||
| Independent Trustees | ||||||||||
| Dawn M. Vroegop (1966) |
Trustee and Chair of the Board | Indefinite; From December 2000 (Trust I)/May 2009 (Trust II) to present as Trustee; From May 2016 (Trust I and Trust II) until present as Chair |
Retired; Private Investor. | 73 | Trustee, Driehaus Mutual Funds (8 portfolios).** | |||||
| Stephen M. Alderman (1959) |
Trustee | Indefinite; From December 2000 (Trust I)/April 2012 (Trust II) to present | Vice President and General Counsel, IHR Aerial Solutions, LLC; Until 2022, General Counsel, Illini Hi-Reach, Inc.; Until 2020, Shareholder in the law firm of Garfield & Merel, Ltd. | 73 | None | |||||
| Robert J. Boulware (1956) |
Trustee | Indefinite; From March 2008 (Trust I)/April 2012 (Trust II) to present | Managing Member, Pilgrim Funds, LLC (private equity fund). | 73 | Trustee, Vertical Capital Income Fund (closed-end fund);** Trustee, The Private Shares Fund (closed-end fund);** Until 2021, Director, Mid-Con Energy Partners, LP (energy);** Until 2020, Director, Gainsco, Inc. (auto insurance).** | |||||
BHFTII-24
Brighthouse Funds Trust II
Trustees and Officers—(Continued)
| Name and Year of Birth |
Position(s) |
Term of Office |
Principal Occupation(s) During the Past |
Number of |
Other Directorships Held | |||||
| Susan C. Gause (1952) |
Trustee | Indefinite; From March 2008 (Trust I)/April 2012 (Trust II) to present | Private Investor. | 73 | Trustee, HSBC Funds (4 portfolios).** | |||||
| Nancy Hawthorne (1951) |
Trustee | Indefinite; From May 2003 (Trust II)/April 2012 (Trust I) to present | Private Investor. | 73 | Trustee, First Eagle Credit Opportunities Fund;** Trustee and Chair of the Board of Trustees, First Eagle Global Opportunities Fund;** Director, Avid Technology, Inc;** Director, CRA International, Inc.** | |||||
Executive Officers of the Trusts
| Name and Year of Birth |
Position(s) |
Term of Office |
Principal Occupation(s) | |||
| Kristi Slavin (1973) | President and Chief Executive Officer, of Trust I and Trust II | From May 2016 (Trust I and Trust II) to present |
President, Brighthouse Investment Advisers, LLC (2016-present). | |||
| Alan R. Otis (1971) | Chief Financial Officer and Treasurer, of Trust I and Trust II | From November 2017 (Trust I and Trust II) to present |
Executive Vice President, Brighthouse Investment Advisers, LLC (2017-present); formerly, Vice President, Brighthouse Investment Advisers, LLC (2012-2017); Assistant Treasurer, Trust I and Trust II (2012-2017). | |||
| Thomas Watterson (1985) | Secretary, of Trust I and Trust II | From November 2023 (Trust I and Trust II) to present |
Executive Vice President, Chief Legal Officer and Secretary, Brighthouse Investment Advisers, LLC (2023-Present); Managing Corporate Counsel, Brighthouse Financial Inc. (2023-present); Managing Counsel and Director, The Bank of New York Mellon Corporation (2019-2023); Counsel and Vice President, The Bank of New York Mellon Corporation (2016-2019). | |||
| Katie Hellmann (1980) | Chief Compliance Officer (“CCO”), of Trust I and Trust II | From May 2023 (Trust I and Trust II) to present |
Chief Compliance Officer, Brighthouse Investment Advisers, LLC (2023-present) and Head of Funds and Investments Compliance (2023-present). Deputy Chief Compliance Officer, Transamerica Asset Management (2022-2023). Leader and Senior Compliance Counsel – Funds Compliance, Edward Jones (2017-2022). | |||
| Rosemary Morgan (1983) | Anti-Money Laundering Officer, of Trust I and Trust II | From May 2023 (Trust I and Trust II) to present |
Chief Privacy Officer, Leader of Compliance Programs and Assistant General Counsel, Brighthouse Financial, Inc. (2019-2022); Chief Privacy Officer, Head of Compliance Programs & Contracts Law, Brighthouse Financial, Inc. (2022-2023), Chief Compliance Officer and Associate General Counsel, Brighthouse Financial, Inc. (2023-present); Vice President and Chief Compliance Officer, Brighthouse Life Insurance Company (2023-present); Vice President and Chief Compliance Officer (2023-present), Brighthouse Life Insurance Company of NY; Vice President and Chief Compliance Officer (2023-present), New England Life Insurance Company. | |||
| Anna Koska (1981) | Vice President, of Trust I and Trust II | From June 2022 (Trust I and Trust II) to present |
Vice President, Investment and Advisory Services, Brighthouse Investment Advisers, LLC (2022-present); Director of Investment and Advisory Services, Brighthouse Investment Advisers, LLC (2019-2022); Senior Portfolio Analyst, Brighthouse Investment Advisers, LLC (2017-2019). | |||
| * | Mr. Rosenthal is an “interested person” of the Trusts because of his position with Brighthouse Financial, Inc. (“Brighthouse Financial”), an affiliate of BIA. |
| ** | Indicates a directorship with a registered investment company or a company subject to the reporting requirements of the Securities Exchange Act of 1934, as amended. |
| (1) | Previous positions during the past five years with the Trusts, MetLife, Inc. or the Adviser are omitted if not materially different. |
| (2) | The Fund Complex includes 44 Trust I Portfolios and 29 Trust II Portfolios. |
BHFTII-25
Brighthouse Funds Trust II
MetLife Mid Cap Stock Index Portfolio
Board of Trustees’ Consideration of Advisory and Sub-Advisory Agreements
At a meeting held on November 13-14, 2023 (the “November Meeting”), the Boards of Trustees (the “Board”) of Brighthouse Funds Trust I and Brighthouse Funds Trust II (“BFT I” and “BFT II,” respectively, and collectively, the “Trusts”), including a majority of the Trustees who are not “interested persons” of the Trusts (the “Independent Trustees”) under the Investment Company Act of 1940 (the “1940 Act”), approved the continuation of the Trusts’ advisory agreements (each an “Advisory Agreement”) with Brighthouse Investment Advisers, LLC (the “Adviser”) and the applicable sub-advisory and sub-sub-advisory agreements (each a “Sub-Advisory Agreement” and collectively with the Advisory Agreement, the “Agreements”) between the Adviser and the investment sub-advisers and sub-sub-adviser (each a “Sub-Adviser,” and collectively, the “Sub-Advisers”) for the series of the Trusts (each a “Portfolio,” and collectively, the “Portfolios”) for the annual contract renewal period from January 1, 2024 through December 31, 2024.
The Board met with personnel of the Adviser on September 28-29, 2023 (the “September Meeting”) for the specific purpose of giving preliminary consideration to the proposed continuation of the Agreements, including consideration to information that the Adviser and Sub-Advisers had provided for the Board’s review at the request of the Independent Trustees. At the September Meeting, the Adviser reviewed with the Board the performance and fees experienced by each Portfolio, as well as other information. During and after the September Meeting, the Independent Trustees requested additional information and clarifications that the Adviser addressed at the November Meeting (the September Meeting and the November Meeting are referred to collectively as, the “Meetings”). During the contract renewal process, and throughout the year, the Independent Trustees were advised by independent legal counsel, and they met with independent legal counsel in executive sessions outside of the presence of management on a number of occasions to discuss, among other things, the renewal of the Agreements.
In considering the continuation of the Agreements, the Board reviewed a variety of materials that were provided for the specific purpose of assisting the Board in the renewal process, along with various information and materials that were provided to and discussed with the Board throughout the year, at regularly scheduled meetings of the Board and its committees. In particular, information for each Portfolio included, but was not limited to, reports on investment performance, expenses, legal and compliance matters, and asset pricing. Information about the Adviser and each Sub-Adviser included, but was not limited to, reports on the business, operations, and performance of the Adviser and the Sub-Advisers and reports that the Adviser and Sub-Advisers had prepared specifically for the renewal process.
In considering the continuation of the Agreements, the Board also reviewed, among other things, a report for each Portfolio that was prepared by Broadridge (“Broadridge”), an independent organization, which set forth comparative performance and expense information for each Portfolio. In addition, the Independent Trustees reviewed a report that was prepared by JDL Consultants, LLC (“JDL”), an independent consultant to the Independent Trustees, which examined the Broadridge reports for each Portfolio (“JDL Report”). The Independent Trustees met in executive session with representatives of JDL during the September Meeting to review the JDL Report.
At the November Meeting, the Board, including a majority of the Independent Trustees, concluded that the nature, extent, and quality of services provided by the Adviser and each Sub-Adviser supported the renewal of the Agreements. The Board also concluded that the investment services provided to and the performance of each Portfolio was such that each Agreement should continue, and that the fees paid by each Portfolio to the Adviser appeared to be reasonable in light of the nature, extent, and quality of the services provided by the Adviser and each Sub-Adviser. Further, the Board concluded that the Adviser’s profitability in providing services under the Advisory Agreements did not appear unreasonable in light of the nature, extent, and quality of the services provided by the Adviser. The Board reviewed the extent to which the investment advisory fees paid by the Portfolios shared economies of scale with investors or entailed the potential to share economies of scale with investors and concluded that those considerations generally supported the renewal of each Agreement. Finally, the Board considered the Adviser’s recommendation that it approve the renewal of each Sub-Advisory Agreement.
In approving the continuation of each Agreement, the Board, including the Independent Trustees, gave attention to all of the information that was furnished, and each Trustee placed varying degrees of importance on the various pieces of information that were provided to them. The Board evaluated the information provided to it on a Portfolio-by-Portfolio basis, and its decision was made separately with respect to each Portfolio. The following paragraphs provide more information about some of the primary factors that were relevant to the Board’s decisions. The Board did not identify any single factor as determinative, and the Trustees generally attributed different weights to various factors for the various Portfolios.
Nature, extent and quality of services. The Board evaluated the nature, extent, and quality of the services that the Adviser and the Sub-Advisers, as relevant, provided to the Portfolios. The Board considered the Adviser’s services as investment manager to the Portfolios, including its services relating to the hiring and oversight of the Sub-Advisers and, in particular, their investment programs and personnel, succession management of key personnel, trading practices, compliance programs and personnel, and risk management
BHFTII-26
Brighthouse Funds Trust II
MetLife Mid Cap Stock Index Portfolio
Board of Trustees’ Consideration of Advisory and Sub-Advisory Agreements—(Continued)
programs, among other things. The Adviser’s services in coordinating and overseeing the activities of the Trusts’ other service providers were also considered. The Board also considered the systems and processes required by the Adviser to meet additional regulatory and compliance requirements resulting from U.S. Securities and Exchange Commission and other regulatory initiatives, including related to liquidity, valuation, and derivatives risk management. The Board considered information received from the Trusts’ Chief Compliance Officer regarding the Portfolios’ compliance policies and procedures that were established pursuant to Rule 38a-l under the 1940 Act, and relevant aspects of the Adviser’s and Sub-Advisers’ compliance policies and procedures. The Board also noted that it was the practice of the Adviser’s investment, compliance, and legal staff to conduct periodic meetings (through various media) with the Sub-Advisers throughout the year in order to review and assess the services that are provided to the Portfolios, and that personnel of the Adviser routinely prepare and present reports to the Board regarding those meetings. In addition, during the Meetings and throughout the year, the Board considered the expertise, experience, and performance of the personnel of the Adviser who performed the various services that are mentioned above.
With respect to the services provided by each of the Sub-Advisers, the Board considered a variety of information that the Adviser and each Sub-Adviser prepared for the Board’s review. The Board considered each Sub-Adviser’s investment process, each Sub-Adviser’s overall organization and business plans and the investment performance experienced by the Portfolio (as described in more detail below). The Board took into account that each Sub-Adviser’s responsibilities include, among other things, the development and maintenance of an investment program for the applicable Portfolio, the selection of investments and the placement of orders for the purchase and sale of such assets, and the implementation of compliance controls related to the performance of these services. The Board considered, based on the information provided, each Sub-Adviser’s staffing with respect to the management of the Portfolio and other information relating to the Sub-Adviser’s business and operations. The Board also considered the Sub-Adviser’s overall resources and information with respect to any recent turnover of key personnel at the Sub-Adviser. The Board reviewed each Sub-Adviser’s investment experience, as well as information provided regarding the Sub-Adviser’s personnel who provide services to the Portfolios. The Board also considered, among other things, information about each Sub-Adviser’s compliance program, including regarding any compliance matters involving a Sub-Adviser that had been brought to the Board’s attention during the year, as well as the Adviser’s assessment of the financial condition of each Sub-Adviser.
Performance. The Board placed emphasis on the performance of each Portfolio in the context of the performance of the relevant markets in which the Portfolio invests. The Board considered the Adviser’s quarterly presentations to the Board of detailed information about each Portfolio’s investment strategies and performance results and composition, including discussions regarding the relevant effects of market conditions. The Board reviewed and considered the reports prepared by Broadridge, which provided a statistical analysis comparing each Portfolio’s investment performance to that of comparable funds underlying variable insurance products (the “Performance Universe”), and the JDL Report. The Board also compared the performance of each Portfolio to that of comparable funds and other accounts that were managed by the relevant Sub-Adviser, to the extent such information was provided. The Board considered each Portfolio’s performance for periods subsequent to the performance period covered by the Broadridge reports and considered the Adviser’s assessment of the same. The Board also noted that while it found the data provided by Broadridge generally useful, it recognized the limitations of such data, including, in particular, that notable differences may exist between a Portfolio and the other funds in a Broadridge category (for example, with respect to investment strategies) and that the results of the performance comparisons may vary depending on (i) the end dates for the performance periods that were selected and (ii) the selection of the peer groups.
The Board focused particular attention on Portfolios with less favorable performance records. The Board noted the Adviser’s focus on each Sub-Adviser’s performance and that the Adviser had been active in monitoring and responding to any performance issues with respect to the Portfolios.
Fees and Expenses. The Board gave consideration to the level and method of computing the fees payable under the Agreements. The Board reviewed and considered the information in the JDL Report concerning fees and expenses. The Board also reviewed and considered the Broadridge report for each Portfolio, which included various comparisons of the Portfolio’s fees (at December 31, 2022 and various asset levels) and expenses with those of its peers, including, as applicable, a broad group of peer funds (“Expense Universe”), a narrower group of peer funds (“Expense Group”), a broad group of peer sub-advised funds (“Sub-advised Expense Universe”), and a narrower group of peer sub-advised funds (“Sub-advised Expense Group”). In particular, the Board reviewed comparisons of each Portfolio’s contractual management fees with its Expense Group and Sub-advised Expense Universe, contractual sub-adviser fees with its Sub-advised Expense Universe and Sub-advised Expense Group, and total expenses with its Expense Universe, Expense Group and Sub-advised Expense Universe. The Board considered that Broadridge selected the peer funds, which were funds underlying variable insurance products that Broadridge deemed to be comparable to the Portfolios. The Board considered that the fee and expense information in the Broadridge report for each Portfolio reflected information as of the Portfolio’s most recent fiscal year
BHFTII-27
Brighthouse Funds Trust II
MetLife Mid Cap Stock Index Portfolio
Board of Trustees’ Consideration of Advisory and Sub-Advisory Agreements—(Continued)
end at the time the Broadridge report was issued and that historical asset levels may differ from current asset levels, particularly in a period of market volatility. In addition, the Board compared the fee payable to a Sub-Adviser by the Adviser with respect to the Portfolio to the fee payable to the Sub-Adviser by other comparable funds and other accounts, to the extent such information was provided.
The Board noted that the sub-advisory fees for the Portfolios are negotiated at arm’s length by the Adviser and are paid by the Adviser out of its advisory fees. The Board also considered that the Adviser had entered into expense limitation or management fee waiver agreements with certain of the Portfolios pursuant to which the Adviser had agreed to waive a portion of its advisory fee and/or reimburse certain expenses as a means of limiting a Portfolio’s total annual operating expenses or passing through the benefit of a subadvisory fee concession to a Portfolio, as applicable.
Profitability. The Board examined the profitability to the Adviser of each Advisory Agreement, on a Portfolio-by-Portfolio basis. The Board also considered that an affiliate of the Adviser, Brighthouse Securities, LLC, serves as distributor for the Trusts, and, as such, receives Rule 12b-1 payments to support the distribution of the Portfolios. The Board considered the profitability to the Sub-Advisers and their affiliates of their relationships with the Portfolios, to the extent provided, and the Board considered the ability of the Adviser to negotiate with a Sub-Adviser at arm’s length. In reviewing the profitability information, the Board recognized that expense allocation methodologies are inherently subjective and various methodologies may be reasonable while producing different results.
Economies of scale. The Board considered each Portfolio’s fees in light of its size. The Board noted the fee schedules for the Portfolios that contain breakpoints that reduce the fee rate above specified asset levels, including breakpoints in the Advisory Agreements and any corresponding Sub-Advisory Agreement. The Board noted those Portfolios that did not have breakpoints in their advisory fees and considered management’s explanation of the same.
The Board considered the effective fees under the Advisory Agreement and Sub-Advisory Agreement for each Portfolio as a percentage of assets at different asset levels and possible economies of scale that may be realized if the assets of the Portfolio grow. The Board examined, among other data, the effect of a Portfolio’s growth in size, and reduction in size, on various fee schedules. The Board also generally noted that if a Portfolio’s assets increase over time, the Portfolio may realize economies of scale if assets increase proportionally more than certain other expenses.
Other factors. The Board considered other benefits that may be realized by the Adviser and its affiliates from their relationships with the Trusts. Among the benefits realized by the Adviser, the Board recognized that Brighthouse Securities, LLC, as the distributor for the Trusts, receives payments pursuant to Rule 12b-1 from the Portfolios to help compensate for the provision of shareholder services and distribution activities. The Board considered that a Sub-Adviser may engage in soft dollar transactions in managing a Portfolio. In addition, the Board considered that a Sub-Adviser may be affiliated with registered broker-dealers that may, from time to time, receive brokerage commissions from a Portfolio in connection with the sale of portfolio securities (subject to applicable best execution obligations). The Board also considered that a Sub-Adviser and its affiliates could benefit from the opportunity to provide advisory services to additional portfolios of the Trusts and overall reputational benefits.
The Board considered information from the Adviser and Sub-Advisers pertaining to potential conflicts of interest, and the manner in which any potential conflicts were mitigated. In its review, the Board considered information regarding various business relationships among the Adviser and its affiliates and various Sub-Advisers and their affiliates. The Board also considered information about services and/or payments provided to the Adviser by the Sub-Advisers in connection with marketing activities. The Board considered representations from the Adviser that such business relationships and any payments were not considered in the Adviser’s recommendation to renew any of the Sub-Advisory Agreements.
* * * * *
MetLife Mid Cap Stock Index Portfolio. The Board also considered the following information in relation to the Agreements with the Adviser and MetLife Investment Management, LLC regarding the Portfolio:
Among other data relating specifically to the Portfolio’s performance, the Board considered that the Portfolio outperformed the median of its Performance Universe and the average of its Morningstar Category for the one-, three-, and five-year periods ended June 30, 2023. The Board further considered that the Portfolio underperformed its benchmark, the S&P MidCap 400 Index, for the one-, three-, and five-year periods ended October 31, 2023, and the Board noted management’s explanation of the tracking error between the Portfolio and the Index. The Board also noted the presence of certain management fee waivers in effect for the Portfolio.
BHFTII-28
Brighthouse Funds Trust II
MetLife Mid Cap Stock Index Portfolio
Board of Trustees’ Consideration of Advisory and Sub-Advisory Agreements—(Continued)
The Board also considered that the Portfolio’s actual management fees were equal to the Expense Group median, below the Expense Universe median, and above the Sub-advised Expense Universe median. The Board considered that the Portfolio’s total expenses (exclusive of 12b-1 fees) were below the Expense Group median, the Expense Universe median, and the Sub-advised Expense Universe median. The Board noted that the Portfolio’s contractual management fees were below the asset-weighted average of the Investment Classification/Morningstar Category selected by Broadridge at the Portfolio’s current size. The Board also noted that the Portfolio’s contractual sub-advisory fees were below the averages of the Sub-advised Expense Group and the Sub-advised Expense Universe at the Portfolio’s current size.
BHFTII-29
Brighthouse Funds Trust II
MetLife MSCI EAFE Index Portfolio
Managed By MetLife Investment Management, LLC
Portfolio Manager Commentary*
PERFORMANCE
For the twelve months ended December 31, 2023, the Class A, B, E and G shares of the MetLife MSCI EAFE Index Portfolio returned 17.93%, 17.64%, 17.76%, and 17.58%, respectively. The Portfolio’s benchmark, the MSCI EAFE Index¹, returned 18.24%.
MARKET ENVIRONMENT / CONDITIONS
Equity markets climbed in 2023 on signals that the U.S. Federal Reserve (the “Fed”) would begin cutting interest rates in 2024. Equity investors remained hopeful that the Fed would be able to navigate a soft landing as they slowed the pace of quantitative tightening. Other factors that supported the equity markets included a healthy job market, better than expected macroeconomic data, and strong corporate earnings. Some of the fears that concerned equity investors included rising risks of recession and the effect that high bond yields would have on the economy. In addition, continued high inflation and rising geopolitical risk from the wars in Ukraine and Israel weighed on the equity markets.
The U.S. dollar weakened during the year, which positively impacted the U.S. investors’ MSCI EAFE Index return versus the local currency return by approximately 2.08%.
Nineteen of the twenty-one countries comprising the MSCI EAFE Index experienced positive returns for the year. Italy (2.3% beginning weight in the benchmark), up 38.8%; Spain (2.4% beginning weight), up 33.4%; and Denmark (3.0% beginning weight), up 32.1%, were the best-performing countries. Hong Kong (3.0% beginning weight), down 14.8%, and Finland (1.0% beginning weight), down 4.3%, were the worst-performing countries.
The stocks in the MSCI EAFE Index with the largest positive impact on the benchmark return for the year were Novo Nordisk (Denmark), up 55.6%; SAP (Germany), up 52.3%; and ASML Holding (Netherlands), up 41.5%. The stocks with the largest negative impact were Anglo American (United Kingdom), down 32.5%; AIA Group (Hong Kong), down 20.0%; and British American Tobacco (United Kingdom), down 18.9%.
PORTFOLIO REVIEW / PERIOD END POSITIONING
The Portfolio is managed utilizing a stratified sampling strategy versus the MSCI EAFE Index (the “Index”). This strategy seeks to replicate the performance of the Index by owning a subset of Index constituents and neutralizing exposures across countries. The Portfolio is periodically rebalanced for compositional changes in the Index. Factors that impact tracking error include sampling, fair value pricing, transaction costs, cash drag, securities lending, net asset value rounding, and contributions and withdrawals.
Norman Hu
Mirsad Usejnoski
Portfolio Managers
MetLife Investment Management, LLC
* This commentary may include statements that constitute “forward-looking statements” under the U.S. securities laws. Forward-looking statements include, among other things, projections, estimates, and information about possible or future results related to the Portfolio, market or regulatory developments. The views expressed above are not guarantees of future performance or economic results and involve certain risks, uncertainties and assumptions that could cause actual outcomes and results to differ materially from the views expressed herein. The views expressed above are subject to change at any time based upon economic, market, or other conditions and the subadvisory firm undertakes no obligation to update the views expressed herein. Any discussions of specific securities should not be considered a recommendation to buy or sell those securities. The views expressed above (including any forward-looking statement) may not be relied upon as investment advice or as an indication of the Portfolio’s trading intent. Information about the Portfolio’s holdings, asset allocation or country diversification is historical and is not an indication of future Portfolio composition, which may vary. Direct investment in any index is not possible. The performance of any index mentioned in this commentary has not been adjusted for ongoing management, distribution and operating expenses, and sales charges applicable to mutual fund investments. In addition, the returns do not reflect additional fees charged by separate accounts or variable insurance contracts that an investor in the Portfolio may pay. If these additional fees were reflected, performance would have been lower.
1 The MSCI EAFE (Europe, Australasia, Far East) Index is a free float-adjusted market capitalization index that is designed to measure the equity market performance of developed markets, excluding the U.S. & Canada.
BHFTII-1
Brighthouse Funds Trust II
MetLife MSCI EAFE Index Portfolio
A $10,000 INVESTMENT COMPARED TO THE MSCI EAFE INDEX
AVERAGE ANNUAL RETURNS (%) FOR THE YEAR ENDED DECEMBER 31, 2023
| 1 Year | 5 Year | 10 Year | ||||||||||
| MetLife MSCI EAFE Index Portfolio | ||||||||||||
| Class A |
17.93 | 7.99 | 4.05 | |||||||||
| Class B |
17.64 | 7.72 | 3.80 | |||||||||
| Class E |
17.76 | 7.83 | 3.90 | |||||||||
|
Class G |
17.58 | 7.67 | 3.75 | |||||||||
| MSCI EAFE Index | 18.24 | 8.17 | 4.28 | |||||||||
Portfolio performance is calculated including reinvestment of all income and capital gain distributions. Performance numbers are net of all Portfolio expenses but do not include any insurance, sales, separate account or administrative charges of variable annuity or life insurance contracts or any additional expenses that participants may bear relating to the operations of their plans. If these charges were included, the returns would be lower. The performance of any index referenced above has not been adjusted for ongoing management, distribution and operating expenses, and sales charges applicable to mutual fund investments. Direct investment in any index is not possible. The performance of Class A shares, as set forth in the line graph above, will differ from that of other classes because of the difference in expenses paid by policyholders investing in the different share classes.
This information represents past performance and is not indicative of future results. Investment return and principal value may fluctuate so that shares, upon redemption, may be worth more or less than the original cost.
PORTFOLIO COMPOSITION AS OF DECEMBER 31, 2023
Top Holdings
| % of Net Assets |
||||
| Novo Nordisk AS- Class B | 2.0 | |||
| Nestle SA | 1.9 | |||
| ASML Holding NV | 1.8 | |||
| iShares MSCI EAFE ETF | 1.4 | |||
| LVMH Moet Hennessy Louis Vuitton SE | 1.3 | |||
| Shell PLC | 1.3 | |||
| AstraZeneca PLC | 1.2 | |||
| Novartis AG | 1.2 | |||
| Roche Holding AG | 1.2 | |||
| Toyota Motor Corp. | 1.2 | |||
Top Countries
| % of Net Assets |
||||
| Japan | 21.7 | |||
| United Kingdom | 11.7 | |||
| France | 11.3 | |||
| Switzerland | 10.4 | |||
| Germany | 8.2 | |||
| Australia | 7.4 | |||
| Netherlands | 5.9 | |||
| Denmark | 3.3 | |||
| Sweden | 3.1 | |||
| Spain | 2.5 | |||
BHFTII-2
Brighthouse Funds Trust II
MetLife MSCI EAFE Index Portfolio
Understanding Your Portfolio’s Expenses
Shareholder Expense Example
As a shareholder of the Portfolio, you incur ongoing costs, including management fees; distribution and service (12b-1) fees; and other Portfolio expenses. This example is intended to help you understand your ongoing costs (in dollars) (referred to as “expenses”) of investing in the Portfolio and compare these costs with the ongoing costs of investing in other mutual funds. The example is based on an investment of $1,000 invested at the beginning of the period and held for the entire period, July 1, 2023 through December 31, 2023.
Actual Expenses
The first line for each share class of the Portfolio in the table below provides information about actual account values and actual expenses. You may use the information in this line, together with the amount you invested in the particular share class of the Portfolio, to estimate the expenses that you paid over the period. Simply divide your account value by $1,000 (for example, an $8,600 account value divided by $1,000 = 8.6), then multiply the result by the number in the first line under the heading entitled “Expenses Paid During Period” to estimate the expenses you paid on your account during this period.
Hypothetical Example for Comparison Purposes
The second line for each share class of the Portfolio in the table below provides information about hypothetical account values and hypothetical expenses based on the Portfolio’s actual expense ratio and an assumed rate of return of 5% per year before expenses, which is not the Portfolio’s actual return. The hypothetical account values and expenses may not be used to estimate the actual ending account balance or expenses you paid for the period. You may use this information to compare the ongoing costs of investing in the Portfolio and other funds. To do so, compare this 5% hypothetical example with the 5% hypothetical examples that appear in the shareholder reports of the other funds.
Please note that the expenses shown in the table are meant to highlight your ongoing costs only and do not reflect any fees or charges of your variable insurance product or any additional expenses that participants in certain eligible qualified plans may bear relating to the operations of their plan. Therefore, the second line for each share class in the table is useful in comparing ongoing costs only, and will not help you determine the relative total costs of owning different funds. In addition, if these other costs were included, your costs would have been higher.
| MetLife MSCI EAFE Index Portfolio |
Annualized Expense Ratio |
Beginning Account Value July 1, 2023 |
Ending Account Value December 31, 2023 |
Expenses Paid During Period** July 1, 2023 to December 31, 2023 |
||||||||||||||
| Class A (a) |
Actual | 0.39 | % | $ | 1,000.00 | $ | 1,053.20 | $ | 2.02 | |||||||||
| Hypothetical* | 0.39 | % | $ | 1,000.00 | $ | 1,023.24 | $ | 1.99 | ||||||||||
| Class B (a) |
Actual | 0.64 | % | $ | 1,000.00 | $ | 1,052.20 | $ | 3.31 | |||||||||
| Hypothetical* | 0.64 | % | $ | 1,000.00 | $ | 1,021.98 | $ | 3.26 | ||||||||||
| Class E (a) |
Actual | 0.54 | % | $ | 1,000.00 | $ | 1,052.80 | $ | 2.79 | |||||||||
| Hypothetical* | 0.54 | % | $ | 1,000.00 | $ | 1,022.48 | $ | 2.75 | ||||||||||
| Class G (a) |
Actual | 0.69 | % | $ | 1,000.00 | $ | 1,051.90 | $ | 3.57 | |||||||||
| Hypothetical* | 0.69 | % | $ | 1,000.00 | $ | 1,021.73 | $ | 3.52 | ||||||||||
| * | Hypothetical assumes a rate of return of 5% per year before expenses. |
| ** | Expenses paid are equal to the Portfolio’s annualized expense ratio for the most recent six month period, as shown above, multiplied by the average account value over the period, multiplied by the number of days (184 days) in the most recent fiscal half-year, divided by 365 (to reflect the one-half year period). |
| (a) | The annualized expense ratio shown reflects the impact of the management fee waiver as described in Note 6 of the Notes to Financial Statements. |
BHFTII-3
Brighthouse Funds Trust II
MetLife MSCI EAFE Index Portfolio
Schedule of Investments as of December 31, 2023
Common Stocks—96.5% of Net Assets
| Security Description | Shares | Value | ||||||
| Australia—7.4% | ||||||||
| Ampol Ltd. |
15,576 | $ | 383,561 | |||||
| ANZ Group Holdings Ltd. |
172,445 | 3,042,093 | ||||||
| APA Group |
72,572 | 422,063 | ||||||
| Aristocrat Leisure Ltd. |
33,301 | 924,529 | ||||||
| ASX Ltd. |
9,864 | 423,754 | ||||||
| Aurizon Holdings Ltd. |
105,688 | 273,320 | ||||||
| BHP Group Ltd. |
286,894 | 9,847,869 | ||||||
| BlueScope Steel Ltd. |
24,346 | 387,969 | ||||||
| Brambles Ltd. |
77,628 | 719,715 | ||||||
| CAR Group Ltd. |
20,417 | 432,869 | ||||||
| Cochlear Ltd. |
3,634 | 739,356 | ||||||
| Coles Group Ltd. |
76,847 | 843,126 | ||||||
| Commonwealth Bank of Australia |
95,160 | 7,241,011 | ||||||
| Computershare Ltd. |
32,168 | 535,159 | ||||||
| CSL Ltd. |
27,696 | 5,406,738 | ||||||
| Dexus (REIT) |
66,600 | 347,218 | ||||||
| EBOS Group Ltd. |
8,800 | 197,713 | ||||||
| Endeavour Group Ltd. |
82,569 | 293,010 | ||||||
| Flutter Entertainment PLC (a) |
9,898 | 1,744,250 | ||||||
| Fortescue Ltd. |
97,232 | 1,925,812 | ||||||
| Goodman Group (REIT) |
96,640 | 1,661,551 | ||||||
| GPT Group (REIT) |
109,987 | 346,539 | ||||||
| IDP Education Ltd. |
14,103 | 192,157 | ||||||
| IGO Ltd. |
44,707 | 274,632 | ||||||
| Insurance Australia Group Ltd. |
132,599 | 511,547 | ||||||
| Lottery Corp. Ltd. |
128,267 | 422,601 | ||||||
| Macquarie Group Ltd. |
20,862 | 2,603,407 | ||||||
| Medibank Pvt Ltd. |
158,708 | 385,116 | ||||||
| Mineral Resources Ltd. |
11,249 | 535,060 | ||||||
| Mirvac Group (REIT) |
227,393 | 322,477 | ||||||
| National Australia Bank Ltd. |
180,213 | 3,763,700 | ||||||
| Northern Star Resources Ltd. |
65,100 | 609,776 | ||||||
| Orica Ltd. |
24,591 | 266,776 | ||||||
| Origin Energy Ltd. |
97,507 | 563,492 | ||||||
| Pilbara Minerals Ltd. |
157,791 | 423,423 | ||||||
| Qantas Airways Ltd. (a) |
48,695 | 177,762 | ||||||
| QBE Insurance Group Ltd. |
78,602 | 793,653 | ||||||
| Ramsay Health Care Ltd. |
11,010 | 394,238 | ||||||
| REA Group Ltd. |
2,790 | 343,792 | ||||||
| Reece Ltd. |
8,949 | 136,283 | ||||||
| Rio Tinto Ltd. |
20,772 | 1,916,861 | ||||||
| Santos Ltd. |
183,626 | 960,186 | ||||||
| Scentre Group (REIT) |
299,113 | 607,446 | ||||||
| SEEK Ltd. |
23,745 | 431,387 | ||||||
| Sonic Healthcare Ltd. |
24,516 | 535,900 | ||||||
| South32 Ltd. |
261,944 | 595,973 | ||||||
| Stockland (REIT) |
137,064 | 415,988 | ||||||
| Suncorp Group Ltd. |
76,841 | 724,451 | ||||||
| Telstra Group Ltd. |
232,198 | 626,475 | ||||||
| Transurban Group |
175,157 | 1,634,692 | ||||||
| Treasury Wine Estates Ltd. |
45,513 | 333,801 | ||||||
| Vicinity Ltd. (REIT) |
222,989 | 308,943 | ||||||
| Washington H Soul Pattinson & Co. Ltd. |
14,627 | 326,890 | ||||||
| Wesfarmers Ltd. |
64,690 | 2,514,290 | ||||||
| Westpac Banking Corp. |
201,481 | 3,139,419 | ||||||
| WiseTech Global Ltd. |
10,682 | 546,965 | ||||||
| Woodside Energy Group Ltd. |
108,084 | 2,292,718 | ||||||
| Australia—(Continued) | ||||||||
| Woolworths Group Ltd. |
67,773 | $ | 1,717,375 | |||||
|
|
|
|||||||
| 70,488,877 | ||||||||
|
|
|
|||||||
| Austria—0.2% | ||||||||
| Erste Group Bank AG |
19,815 | 804,468 | ||||||
| OMV AG |
8,951 | 393,735 | ||||||
| Verbund AG |
4,216 | 392,213 | ||||||
| voestalpine AG |
3,635 | 114,743 | ||||||
|
|
|
|||||||
| 1,705,159 | ||||||||
|
|
|
|||||||
| Belgium—0.8% | ||||||||
| Ageas SA |
9,698 | 421,920 | ||||||
| Anheuser-Busch InBev SA |
49,872 | 3,224,090 | ||||||
| D’ieteren Group |
923 | 180,665 | ||||||
| Elia Group SA |
2,047 | 256,425 | ||||||
| Groupe Bruxelles Lambert NV |
4,860 | 383,272 | ||||||
| KBC Group NV |
14,353 | 931,883 | ||||||
| Lotus Bakeries NV |
24 | 218,169 | ||||||
| Sofina SA |
888 | 221,132 | ||||||
| Solvay SA |
3,561 | 109,116 | ||||||
| Syensqo SA (a) |
3,561 | 370,787 | ||||||
| UCB SA |
7,036 | 613,151 | ||||||
| Umicore SA |
13,317 | 366,230 | ||||||
| Warehouses De Pauw CVA (REIT) |
9,872 | 310,122 | ||||||
|
|
|
|||||||
| 7,606,962 | ||||||||
|
|
|
|||||||
| Chile—0.1% | ||||||||
| Antofagasta PLC |
20,259 | 433,423 | ||||||
|
|
|
|||||||
| China—0.4% | ||||||||
| BOC Hong Kong Holdings Ltd. |
213,465 | 577,629 | ||||||
| Budweiser Brewing Co. APAC Ltd. |
99,200 | 185,202 | ||||||
| ESR Group Ltd. |
113,800 | 157,077 | ||||||
| Futu Holdings Ltd. (ADR) (a) |
3,200 | 174,816 | ||||||
| Prosus NV |
83,402 | 2,488,384 | ||||||
| SITC International Holdings Co. Ltd. |
77,000 | 132,744 | ||||||
| Wharf Holdings Ltd. |
62,000 | 199,355 | ||||||
|
|
|
|||||||
| 3,915,207 | ||||||||
|
|
|
|||||||
| Denmark—3.3% | ||||||||
| AP Moller - Maersk AS - Class A |
129 | 228,968 | ||||||
| AP Moller - Maersk AS - Class B |
294 | 528,795 | ||||||
| Carlsberg AS - Class B |
5,697 | 714,520 | ||||||
| Chr Hansen Holding AS |
5,612 | 470,766 | ||||||
| Coloplast AS - Class B |
7,681 | 878,722 | ||||||
| Danske Bank AS |
41,066 | 1,097,589 | ||||||
| Demant AS (a) |
5,807 | 255,453 | ||||||
| DSV AS |
10,688 | 1,881,355 | ||||||
| Genmab AS (a) |
3,730 | 1,188,888 | ||||||
| Novo Nordisk AS - Class B |
186,067 | 19,258,215 | ||||||
| Novozymes AS - B Shares |
11,318 | 623,573 | ||||||
| Orsted AS |
10,898 | 602,146 | ||||||
| Pandora AS |
4,872 | 673,509 | ||||||
| Rockwool AS - B Shares |
571 | 167,148 | ||||||
| Tryg AS |
19,542 | 425,298 | ||||||
See accompanying notes to financial statements.
BHFTII-4
Brighthouse Funds Trust II
MetLife MSCI EAFE Index Portfolio
Schedule of Investments as of December 31, 2023
Common Stocks—(Continued)
| Security Description | Shares | Value | ||||||
| Denmark—(Continued) | ||||||||
| Vestas Wind Systems AS (a) |
57,984 | $ | 1,844,561 | |||||
|
|
|
|||||||
| 30,839,506 | ||||||||
|
|
|
|||||||
| Finland—1.1% | ||||||||
| Elisa OYJ |
8,457 | 392,442 | ||||||
| Fortum OYJ |
25,580 | 371,447 | ||||||
| Kesko OYJ - B Shares |
13,341 | 264,565 | ||||||
| Kone Oyj - Class B |
20,595 | 1,031,277 | ||||||
| Metso OYJ |
38,200 | 387,365 | ||||||
| Neste OYJ |
25,004 | 888,933 | ||||||
| Nokia OYJ |
304,070 | 1,045,330 | ||||||
| Nordea Bank Abp |
182,600 | 2,265,179 | ||||||
| Orion OYJ - Class B |
5,744 | 249,211 | ||||||
| Sampo OYJ - A Shares |
24,688 | 1,081,112 | ||||||
| Stora Enso OYJ - R Shares |
33,562 | 464,552 | ||||||
| UPM-Kymmene OYJ |
31,691 | 1,192,835 | ||||||
| Wartsila OYJ Abp |
27,280 | 397,615 | ||||||
|
|
|
|||||||
| 10,031,863 | ||||||||
|
|
|
|||||||
| France—11.3% | ||||||||
| Accor SA |
11,190 | 428,279 | ||||||
| Adevinta ASA (a) |
16,794 | 185,776 | ||||||
| Aeroports de Paris SA |
1,975 | 255,954 | ||||||
| Air Liquide SA |
30,064 | 5,852,098 | ||||||
| Airbus SE |
34,037 | 5,257,225 | ||||||
| Alstom SA |
17,291 | 232,985 | ||||||
| Amundi SA |
2,443 | 167,176 | ||||||
| Arkema SA |
3,712 | 422,517 | ||||||
| AXA SA |
101,420 | 3,312,739 | ||||||
| BioMerieux |
1,839 | 205,003 | ||||||
| BNP Paribas SA |
60,463 | 4,191,953 | ||||||
| Bollore SE |
35,194 | 220,534 | ||||||
| Bouygues SA |
11,159 | 421,641 | ||||||
| Bureau Veritas SA |
14,987 | 379,016 | ||||||
| Capgemini SE |
8,840 | 1,850,443 | ||||||
| Carrefour SA |
35,510 | 650,320 | ||||||
| Cie de Saint-Gobain SA |
26,656 | 1,972,362 | ||||||
| Cie Generale des Etablissements Michelin SCA |
37,738 | 1,356,899 | ||||||
| Covivio SA (REIT) |
3,163 | 171,059 | ||||||
| Credit Agricole SA |
60,667 | 861,376 | ||||||
| Danone SA |
36,852 | 2,391,784 | ||||||
| Dassault Aviation SA |
1,217 | 240,966 | ||||||
| Dassault Systemes SE |
37,933 | 1,858,174 | ||||||
| Edenred SE |
15,079 | 905,966 | ||||||
| Eiffage SA |
4,534 | 486,992 | ||||||
| Engie SA |
105,256 | 1,852,011 | ||||||
| EssilorLuxottica SA |
16,707 | 3,360,166 | ||||||
| Eurazeo SE |
2,867 | 228,104 | ||||||
| Gecina SA (REIT) |
2,150 | 262,727 | ||||||
| Getlink SE |
18,615 | 340,835 | ||||||
| Hermes International SCA |
1,818 | 3,860,740 | ||||||
| Ipsen SA |
2,335 | 278,863 | ||||||
| Kering SA |
4,224 | 1,875,720 | ||||||
| Klepierre SA (REIT) |
12,682 | 346,990 | ||||||
| L’Oreal SA |
13,828 | 6,879,718 | ||||||
| La Francaise des Jeux SAEM |
6,363 | 231,125 | ||||||
| France—(Continued) | ||||||||
| Legrand SA |
14,504 | 1,511,696 | ||||||
| LVMH Moet Hennessy Louis Vuitton SE |
15,691 | 12,735,437 | ||||||
| Orange SA |
105,927 | 1,205,838 | ||||||
| Pernod Ricard SA |
11,848 | 2,096,411 | ||||||
| Publicis Groupe SA |
13,415 | 1,248,314 | ||||||
| Remy Cointreau SA |
1,206 | 153,323 | ||||||
| Renault SA |
11,902 | 487,315 | ||||||
| Safran SA |
19,626 | 3,464,307 | ||||||
| Sanofi SA |
65,154 | 6,463,554 | ||||||
| Sartorius Stedim Biotech |
1,739 | 462,174 | ||||||
| Schneider Electric SE |
31,151 | 6,276,235 | ||||||
| SEB SA |
1,599 | 199,791 | ||||||
| Societe Generale SA |
43,695 | 1,165,693 | ||||||
| Sodexo SA |
5,109 | 562,803 | ||||||
| Teleperformance SE |
3,137 | 458,804 | ||||||
| Thales SA |
5,884 | 870,771 | ||||||
| TotalEnergies SE |
130,662 | 8,881,296 | ||||||
| Unibail-Rodamco-Westfield (REIT) (a) |
5,832 | 429,906 | ||||||
| Veolia Environnement SA |
38,098 | 1,204,094 | ||||||
| Vinci SA |
28,947 | 3,637,851 | ||||||
| Vivendi SE |
31,863 | 341,456 | ||||||
| Worldline SA (a) |
12,492 | 217,100 | ||||||
|
|
|
|||||||
| 107,870,405 | ||||||||
|
|
|
|||||||
| Germany—7.8% | ||||||||
| adidas AG |
9,344 | 1,901,205 | ||||||
| Allianz SE |
23,157 | 6,189,168 | ||||||
| BASF SE |
51,323 | 2,765,401 | ||||||
| Bayer AG |
56,408 | 2,095,407 | ||||||
| Bayerische Motoren Werke AG |
18,182 | 2,023,554 | ||||||
| Bechtle AG |
3,446 | 172,773 | ||||||
| Beiersdorf AG |
5,659 | 848,423 | ||||||
| Brenntag SE |
8,179 | 751,338 | ||||||
| Carl Zeiss Meditec AG |
2,492 | 272,124 | ||||||
| Commerzbank AG |
61,497 | 730,904 | ||||||
| Continental AG |
5,627 | 478,882 | ||||||
| Covestro AG (a) |
10,220 | 594,817 | ||||||
| Daimler Truck Holding AG |
28,970 | 1,088,587 | ||||||
| Delivery Hero SE (a) |
11,033 | 304,851 | ||||||
| Deutsche Bank AG |
110,884 | 1,514,389 | ||||||
| Deutsche Boerse AG |
10,909 | 2,247,440 | ||||||
| Deutsche Lufthansa AG (a) |
35,564 | 316,285 | ||||||
| Deutsche Post AG |
57,787 | 2,864,338 | ||||||
| Deutsche Telekom AG |
186,100 | 4,471,891 | ||||||
| E.ON SE |
128,908 | 1,730,410 | ||||||
| Evonik Industries AG |
12,954 | 264,655 | ||||||
| Fresenius Medical Care AG |
11,169 | 467,345 | ||||||
| Fresenius SE & Co. KGaA |
25,674 | 797,394 | ||||||
| GEA Group AG |
9,989 | 416,004 | ||||||
| Hannover Rueck SE |
3,591 | 858,556 | ||||||
| Heidelberg Materials AG |
7,955 | 711,215 | ||||||
| HelloFresh SE (a) |
10,721 | 169,922 | ||||||
| Henkel AG & Co. KGaA |
5,102 | 366,204 | ||||||
| Infineon Technologies AG |
74,982 | 3,129,375 | ||||||
| Knorr-Bremse AG |
4,409 | 286,190 | ||||||
| LEG Immobilien SE (a) |
3,457 | 302,925 | ||||||
See accompanying notes to financial statements.
BHFTII-5
Brighthouse Funds Trust II
MetLife MSCI EAFE Index Portfolio
Schedule of Investments as of December 31, 2023
Common Stocks—(Continued)
| Security Description | Shares | Value | ||||||
| Germany—(Continued) | ||||||||
| Mercedes-Benz Group AG |
46,263 | $ | 3,197,135 | |||||
| Merck KGaA |
7,195 | 1,145,146 | ||||||
| MTU Aero Engines AG |
3,014 | 650,027 | ||||||
| Muenchener Rueckversicherungs-Gesellschaft AG |
7,758 | 3,214,596 | ||||||
| Nemetschek SE |
3,293 | 285,350 | ||||||
| Puma SE |
5,186 | 289,152 | ||||||
| Rational AG |
371 | 286,812 | ||||||
| Rheinmetall AG |
2,403 | 762,239 | ||||||
| RWE AG |
35,506 | 1,615,323 | ||||||
| SAP SE |
59,175 | 9,108,393 | ||||||
| Scout24 SE |
3,900 | 276,104 | ||||||
| Siemens AG |
43,637 | 8,190,185 | ||||||
| Siemens Energy AG (a) |
31,577 | 418,693 | ||||||
| Siemens Healthineers AG |
16,020 | 931,524 | ||||||
| Symrise AG |
7,141 | 785,949 | ||||||
| Talanx AG |
3,850 | 274,935 | ||||||
| Volkswagen AG |
1,994 | 260,963 | ||||||
| Vonovia SE |
42,326 | 1,334,585 | ||||||
| Wacker Chemie AG |
1,100 | 138,910 | ||||||
| Zalando SE (a) |
11,098 | 262,956 | ||||||
|
|
|
|||||||
| 74,560,949 | ||||||||
|
|
|
|||||||
| Hong Kong—1.8% | ||||||||
| AIA Group Ltd. |
654,800 | 5,687,167 | ||||||
| CK Asset Holdings Ltd. |
104,440 | 522,286 | ||||||
| CK Infrastructure Holdings Ltd. |
49,500 | 275,031 | ||||||
| CLP Holdings Ltd. |
94,377 | 777,898 | ||||||
| Galaxy Entertainment Group Ltd. |
121,000 | 676,295 | ||||||
| Hang Lung Properties Ltd. |
103,000 | 142,910 | ||||||
| Hang Seng Bank Ltd. |
46,300 | 537,919 | ||||||
| Henderson Land Development Co. Ltd. |
83,311 | 257,516 | ||||||
| HKT Trust & HKT Ltd. |
217,980 | 260,743 | ||||||
| Hong Kong & China Gas Co. Ltd. |
645,531 | 496,595 | ||||||
| Hong Kong Exchanges & Clearing Ltd. |
68,900 | 2,357,411 | ||||||
| Hongkong Land Holdings Ltd. |
63,800 | 221,656 | ||||||
| Jardine Matheson Holdings Ltd. |
10,400 | 428,094 | ||||||
| Link REIT (REIT) |
134,649 | 753,003 | ||||||
| MTR Corp. Ltd. |
82,000 | 319,701 | ||||||
| New World Development Co. Ltd. |
86,926 | 134,344 | ||||||
| Power Assets Holdings Ltd. |
93,049 | 538,680 | ||||||
| Sino Land Co. Ltd. (b) |
211,600 | 230,699 | ||||||
| Sun Hung Kai Properties Ltd. |
86,750 | 933,576 | ||||||
| Swire Pacific Ltd. - Class A |
21,817 | 184,227 | ||||||
| Swire Properties Ltd. |
67,200 | 135,491 | ||||||
| Techtronic Industries Co. Ltd. |
78,000 | 932,925 | ||||||
| WH Group Ltd. |
480,500 | 309,928 | ||||||
| Wharf Real Estate Investment Co. Ltd. |
91,976 | 312,855 | ||||||
|
|
|
|||||||
| 17,426,950 | ||||||||
|
|
|
|||||||
| Ireland—0.8% | ||||||||
| AerCap Holdings NV (a) |
11,400 | 847,248 | ||||||
| AIB Group PLC |
89,600 | 383,639 | ||||||
| Bank of Ireland Group PLC |
57,600 | 522,447 | ||||||
| CRH PLC |
40,340 | 2,780,240 | ||||||
| James Hardie Industries PLC (a) |
24,825 | 959,465 | ||||||
| Kerry Group PLC - Class A |
8,369 | 726,303 | ||||||
| Ireland—(Continued) | ||||||||
| Kingspan Group PLC |
9,603 | 830,441 | ||||||
| Smurfit Kappa Group PLC |
15,811 | 623,692 | ||||||
|
|
|
|||||||
| 7,673,475 | ||||||||
|
|
|
|||||||
| Israel—0.6% | ||||||||
| Azrieli Group Ltd. |
2,906 | 188,587 | ||||||
| Bank Hapoalim BM |
73,211 | 659,577 | ||||||
| Bank Leumi Le-Israel BM |
82,474 | 666,523 | ||||||
| Check Point Software Technologies Ltd. (a) |
5,600 | 855,625 | ||||||
| CyberArk Software Ltd. (a) |
2,100 | 460,005 | ||||||
| Elbit Systems Ltd. |
1,528 | 325,610 | ||||||
| Global-e Online Ltd. (a) (b) |
5,200 | 206,076 | ||||||
| ICL Group Ltd. |
44,582 | 225,605 | ||||||
| Israel Discount Bank Ltd. - Class A |
71,026 | 356,412 | ||||||
| Mizrahi Tefahot Bank Ltd. |
9,874 | 383,801 | ||||||
| Nice Ltd. (a) |
3,347 | 671,695 | ||||||
| Teva Pharmaceutical Industries Ltd. (ADR) (a) |
63,253 | 660,361 | ||||||
| Wix.com Ltd. (a) |
3,600 | 442,872 | ||||||
|
|
|
|||||||
| 6,102,749 | ||||||||
|
|
|
|||||||
| Italy—2.2% | ||||||||
| Amplifon SpA |
9,033 | 313,682 | ||||||
| Assicurazioni Generali SpA |
60,938 | 1,286,317 | ||||||
| Banco BPM SpA |
70,000 | 369,838 | ||||||
| Davide Campari-Milano NV |
26,785 | 302,275 | ||||||
| Enel SpA |
466,993 | 3,478,114 | ||||||
| Eni SpA |
132,693 | 2,253,702 | ||||||
| Ferrari NV |
7,237 | 2,440,805 | ||||||
| FinecoBank Banca Fineco SpA |
35,112 | 527,883 | ||||||
| Infrastrutture Wireless Italiane SpA |
24,381 | 309,008 | ||||||
| Intesa Sanpaolo SpA |
888,160 | 2,594,290 | ||||||
| Leonardo SpA |
23,400 | 386,301 | ||||||
| Mediobanca Banca di Credito Finanziario SpA |
33,261 | 411,772 | ||||||
| Moncler SpA |
11,647 | 718,685 | ||||||
| Nexi SpA (a) |
32,431 | 266,071 | ||||||
| Poste Italiane SpA |
29,264 | 332,228 | ||||||
| Prysmian SpA |
14,291 | 651,961 | ||||||
| Recordati Industria Chimica e Farmaceutica SpA |
5,644 | 305,014 | ||||||
| Snam SpA |
112,553 | 579,685 | ||||||
| Telecom Italia SpA (a) |
574,217 | 186,958 | ||||||
| Terna - Rete Elettrica Nazionale |
75,176 | 627,638 | ||||||
| UniCredit SpA |
91,771 | 2,491,117 | ||||||
|
|
|
|||||||
| 20,833,344 | ||||||||
|
|
|
|||||||
| Japan—21.7% | ||||||||
| Advantest Corp. |
42,800 | 1,474,006 | ||||||
| Aeon Co. Ltd. |
37,100 | 827,855 | ||||||
| AGC, Inc. |
9,500 | 352,140 | ||||||
| Aisin Corp. |
8,500 | 296,203 | ||||||
| Ajinomoto Co., Inc. |
25,100 | 970,155 | ||||||
| ANA Holdings, Inc. (a) |
8,400 | 182,056 | ||||||
| Asahi Group Holdings Ltd. |
26,000 | 967,874 | ||||||
| Asahi Intecc Co. Ltd. |
14,200 | 287,908 | ||||||
| Asahi Kasei Corp. |
72,600 | 537,289 | ||||||
| Astellas Pharma, Inc. |
102,800 | 1,232,754 | ||||||
See accompanying notes to financial statements.
BHFTII-6
Brighthouse Funds Trust II
MetLife MSCI EAFE Index Portfolio
Schedule of Investments as of December 31, 2023
Common Stocks—(Continued)
| Security Description | Shares | Value | ||||||
| Japan—(Continued) | ||||||||
| Azbil Corp. |
7,000 | $ | 230,724 | |||||
| Bandai Namco Holdings, Inc. |
34,200 | 683,812 | ||||||
| BayCurrent Consulting, Inc. |
8,000 | 279,699 | ||||||
| Bridgestone Corp. (b) |
33,200 | 1,371,364 | ||||||
| Brother Industries Ltd. |
16,400 | 261,136 | ||||||
| Canon, Inc. (b) |
57,400 | 1,471,461 | ||||||
| Capcom Co. Ltd. |
11,100 | 358,480 | ||||||
| Central Japan Railway Co. |
38,800 | 983,929 | ||||||
| Chiba Bank Ltd. |
33,200 | 239,402 | ||||||
| Chubu Electric Power Co., Inc. |
40,300 | 520,066 | ||||||
| Chugai Pharmaceutical Co. Ltd. |
38,100 | 1,444,807 | ||||||
| Concordia Financial Group Ltd. |
60,900 | 277,795 | ||||||
| Dai Nippon Printing Co. Ltd. |
13,000 | 383,650 | ||||||
| Dai-ichi Life Holdings, Inc. |
53,100 | 1,127,493 | ||||||
| Daifuku Co. Ltd. |
18,500 | 372,834 | ||||||
| Daiichi Sankyo Co. Ltd. |
106,200 | 2,940,493 | ||||||
| Daikin Industries Ltd. |
15,100 | 2,453,188 | ||||||
| Daito Trust Construction Co. Ltd. |
4,100 | 474,657 | ||||||
| Daiwa House Industry Co. Ltd. |
32,600 | 985,033 | ||||||
| Daiwa House REIT Investment Corp. (REIT) |
136 | 242,517 | ||||||
| Daiwa Securities Group, Inc. |
73,700 | 494,023 | ||||||
| Denso Corp. |
93,400 | 1,401,100 | ||||||
| Dentsu Group, Inc. (b) |
10,300 | 263,540 | ||||||
| Disco Corp. |
5,000 | 1,230,560 | ||||||
| East Japan Railway Co. |
17,700 | 1,018,389 | ||||||
| Eisai Co. Ltd. |
14,700 | 735,641 | ||||||
| ENEOS Holdings, Inc. |
153,600 | 608,206 | ||||||
| FANUC Corp. |
55,100 | 1,621,142 | ||||||
| Fast Retailing Co. Ltd. |
10,000 | 2,479,728 | ||||||
| Fuji Electric Co. Ltd. |
8,600 | 368,515 | ||||||
| FUJIFILM Holdings Corp. |
20,600 | 1,234,252 | ||||||
| Fujitsu Ltd. |
9,700 | 1,464,575 | ||||||
| GLP J-REIT (REIT) |
268 | 266,488 | ||||||
| Hamamatsu Photonics KK |
7,000 | 286,969 | ||||||
| Hankyu Hanshin Holdings, Inc. |
13,900 | 441,889 | ||||||
| Hikari Tsushin, Inc. |
1,500 | 248,061 | ||||||
| Hirose Electric Co. Ltd. |
1,515 | 171,241 | ||||||
| Hitachi Construction Machinery Co. Ltd. |
4,800 | 126,759 | ||||||
| Hitachi Ltd. |
52,100 | 3,765,875 | ||||||
| Honda Motor Co. Ltd. |
265,200 | 2,741,752 | ||||||
| Hoshizaki Corp. |
4,700 | 171,613 | ||||||
| Hoya Corp. |
20,100 | 2,500,174 | ||||||
| Hulic Co. Ltd. (b) |
25,800 | 269,447 | ||||||
| Ibiden Co. Ltd. |
5,600 | 308,541 | ||||||
| Idemitsu Kosan Co. Ltd. |
44,340 | 241,529 | ||||||
| Iida Group Holdings Co. Ltd. |
9,300 | 138,849 | ||||||
| Inpex Corp. (b) |
53,100 | 715,811 | ||||||
| Isuzu Motors Ltd. |
29,000 | 372,103 | ||||||
| ITOCHU Corp. |
68,200 | 2,784,272 | ||||||
| Japan Airlines Co. Ltd. |
8,400 | 165,468 | ||||||
| Japan Exchange Group, Inc. |
31,100 | 656,263 | ||||||
| Japan Metropolitan Fund Invest (REIT) |
307 | 221,655 | ||||||
| Japan Post Bank Co. Ltd. |
82,600 | 840,966 | ||||||
| Japan Post Holdings Co. Ltd. |
121,900 | 1,088,046 | ||||||
| Japan Post Insurance Co. Ltd. |
8,200 | 145,607 | ||||||
| Japan Real Estate Investment Corp. (REIT) |
85 | 351,658 | ||||||
| Japan—(Continued) | ||||||||
| Japan Tobacco, Inc. (b) |
66,700 | 1,721,955 | ||||||
| JFE Holdings, Inc. |
30,400 | 470,022 | ||||||
| JSR Corp. |
9,800 | 279,234 | ||||||
| Kajima Corp. |
27,100 | 451,351 | ||||||
| Kansai Electric Power Co., Inc. |
40,700 | 539,094 | ||||||
| Kao Corp. |
25,400 | 1,043,943 | ||||||
| Kawasaki Kisen Kaisha Ltd. |
8,000 | 348,742 | ||||||
| KDDI Corp. |
85,900 | 2,727,551 | ||||||
| KDX Realty Investment Corp. (REIT) |
238 | 271,186 | ||||||
| Keisei Electric Railway Co. Ltd. |
6,600 | 310,633 | ||||||
| Keyence Corp. |
11,200 | 4,910,142 | ||||||
| Kikkoman Corp. |
8,000 | 488,518 | ||||||
| Kintetsu Group Holdings Co. Ltd. |
11,012 | 348,667 | ||||||
| Kirin Holdings Co. Ltd. |
42,600 | 623,802 | ||||||
| Kobe Bussan Co. Ltd. |
9,200 | 271,544 | ||||||
| Koito Manufacturing Co. Ltd. |
7,400 | 114,984 | ||||||
| Komatsu Ltd. |
50,800 | 1,323,630 | ||||||
| Konami Group Corp. |
6,200 | 323,509 | ||||||
| Kose Corp. |
2,300 | 171,939 | ||||||
| Kubota Corp. (b) |
58,600 | 879,525 | ||||||
| Kyocera Corp. |
76,800 | 1,116,491 | ||||||
| Kyowa Kirin Co. Ltd. |
15,200 | 255,685 | ||||||
| Lasertec Corp. |
4,400 | 1,150,080 | ||||||
| LY Corp. |
154,600 | 546,687 | ||||||
| M3, Inc. |
23,200 | 382,117 | ||||||
| Makita Corp. |
11,200 | 308,052 | ||||||
| Marubeni Corp. |
78,800 | 1,240,096 | ||||||
| MatsukiyoCocokara & Co. |
21,000 | 371,223 | ||||||
| Mazda Motor Corp. |
32,900 | 349,030 | ||||||
| McDonald’s Holdings Co. Japan Ltd. (b) |
5,400 | 233,925 | ||||||
| MEIJI Holdings Co. Ltd. |
14,600 | 346,277 | ||||||
| MINEBEA MITSUMI, Inc. |
18,900 | 386,722 | ||||||
| MISUMI Group, Inc. |
19,300 | 325,552 | ||||||
| Mitsubishi Chemical Group Corp. |
74,100 | 452,860 | ||||||
| Mitsubishi Corp. |
198,900 | 3,168,435 | ||||||
| Mitsubishi Electric Corp. |
106,800 | 1,507,865 | ||||||
| Mitsubishi Estate Co. Ltd. |
65,200 | 895,803 | ||||||
| Mitsubishi HC Capital, Inc. |
53,500 | 358,806 | ||||||
| Mitsubishi Heavy Industries Ltd. |
17,300 | 1,006,789 | ||||||
| Mitsubishi UFJ Financial Group, Inc. |
655,688 | 5,643,453 | ||||||
| Mitsui & Co. Ltd. |
75,417 | 2,810,371 | ||||||
| Mitsui Chemicals, Inc. |
8,300 | 245,485 | ||||||
| Mitsui Fudosan Co. Ltd. |
48,600 | 1,188,038 | ||||||
| Mitsui OSK Lines Ltd. |
17,900 | 574,280 | ||||||
| Mizuho Financial Group, Inc. |
138,550 | 2,369,988 | ||||||
| MonotaRO Co. Ltd. |
14,600 | 158,935 | ||||||
| MS&AD Insurance Group Holdings, Inc. |
24,400 | 957,714 | ||||||
| Murata Manufacturing Co. Ltd. |
99,000 | 2,091,070 | ||||||
| NEC Corp. |
13,000 | 767,224 | ||||||
| Nexon Co. Ltd. (b) |
17,300 | 314,233 | ||||||
| Nidec Corp. |
24,400 | 994,480 | ||||||
| Nintendo Co. Ltd. |
59,700 | 3,120,135 | ||||||
| Nippon Building Fund, Inc (REIT) |
102 | 441,294 | ||||||
| Nippon Express Holdings, Inc. |
4,900 | 278,087 | ||||||
| Nippon Paint Holdings Co. Ltd. |
54,000 | 435,229 | ||||||
| Nippon Prologis REIT, Inc. (REIT) |
143 | 275,242 | ||||||
| Nippon Sanso Holdings Corp. |
9,600 | 256,040 | ||||||
See accompanying notes to financial statements.
BHFTII-7
Brighthouse Funds Trust II
MetLife MSCI EAFE Index Portfolio
Schedule of Investments as of December 31, 2023
Common Stocks—(Continued)
| Security Description | Shares | Value | ||||||
| Japan—(Continued) | ||||||||
| Nippon Steel Corp. |
47,300 | $ | 1,080,982 | |||||
| Nippon Telegraph & Telephone Corp. |
1,715,700 | 2,094,982 | ||||||
| Nippon Yusen KK |
27,700 | 858,600 | ||||||
| Nissan Chemical Corp. |
8,600 | 334,855 | ||||||
| Nissan Motor Co. Ltd. |
133,300 | 520,411 | ||||||
| Nissin Foods Holdings Co. Ltd. |
11,400 | 397,571 | ||||||
| Nitori Holdings Co. Ltd. |
4,800 | 641,352 | ||||||
| Nitto Denko Corp. |
7,500 | 559,242 | ||||||
| Nomura Holdings, Inc. |
167,100 | 753,301 | ||||||
| Nomura Real Estate Holdings, Inc. |
4,100 | 107,578 | ||||||
| Nomura Real Estate Master Fund, Inc. (REIT) |
296 | 345,776 | ||||||
| Nomura Research Institute Ltd. |
20,500 | 594,085 | ||||||
| NTT Data Group Corp. |
34,480 | 487,017 | ||||||
| Obayashi Corp. |
40,200 | 347,134 | ||||||
| Obic Co. Ltd. |
4,200 | 721,343 | ||||||
| Odakyu Electric Railway Co. Ltd. |
18,200 | 277,079 | ||||||
| Oji Holdings Corp. |
50,100 | 192,605 | ||||||
| Olympus Corp. |
65,000 | 938,184 | ||||||
| Omron Corp. |
10,100 | 469,044 | ||||||
| Ono Pharmaceutical Co. Ltd. |
23,800 | 425,161 | ||||||
| Open House Group Co. Ltd. |
5,600 | 165,521 | ||||||
| Oracle Corp. Japan |
3,000 | 231,136 | ||||||
| Oriental Land Co. Ltd. |
62,600 | 2,325,426 | ||||||
| ORIX Corp. |
64,400 | 1,206,820 | ||||||
| Osaka Gas Co. Ltd. |
21,700 | 452,982 | ||||||
| Otsuka Corp. |
7,400 | 304,377 | ||||||
| Otsuka Holdings Co. Ltd. |
22,500 | 842,239 | ||||||
| Pan Pacific International Holdings Corp. |
19,800 | 471,298 | ||||||
| Panasonic Holdings Corp. |
127,400 | 1,249,331 | ||||||
| Rakuten Group, Inc. (b) |
86,600 | 384,847 | ||||||
| Recruit Holdings Co. Ltd. |
82,800 | 3,535,507 | ||||||
| Renesas Electronics Corp. (a) |
83,800 | 1,504,172 | ||||||
| Resona Holdings, Inc. |
122,900 | 622,494 | ||||||
| Ricoh Co. Ltd. |
31,500 | 241,341 | ||||||
| Rohm Co. Ltd. |
20,000 | 383,196 | ||||||
| SBI Holdings, Inc. |
16,511 | 370,390 | ||||||
| SCSK Corp. |
11,700 | 231,674 | ||||||
| Secom Co. Ltd. |
11,900 | 855,514 | ||||||
| Seiko Epson Corp. |
16,800 | 250,994 | ||||||
| Sekisui Chemical Co. Ltd. |
22,300 | 320,767 | ||||||
| Sekisui House Ltd. |
31,800 | 704,682 | ||||||
| Seven & i Holdings Co. Ltd. |
43,300 | 1,715,142 | ||||||
| SG Holdings Co. Ltd. |
19,500 | 279,354 | ||||||
| Shimadzu Corp. |
15,600 | 434,766 | ||||||
| Shimano, Inc. |
4,000 | 617,562 | ||||||
| Shimizu Corp. |
34,200 | 227,276 | ||||||
| Shin-Etsu Chemical Co. Ltd. |
104,600 | 4,371,460 | ||||||
| Shionogi & Co. Ltd. |
15,500 | 746,360 | ||||||
| Shiseido Co. Ltd. |
22,700 | 683,481 | ||||||
| Shizuoka Financial Group, Inc. |
25,000 | 211,526 | ||||||
| SMC Corp. |
3,300 | 1,764,993 | ||||||
| SoftBank Corp. |
164,900 | 2,055,407 | ||||||
| SoftBank Group Corp. |
59,100 | 2,611,524 | ||||||
| Sompo Holdings, Inc. |
17,399 | 849,717 | ||||||
| Sony Group Corp. |
72,400 | 6,861,212 | ||||||
| Square Enix Holdings Co. Ltd. |
3,700 | 132,605 | ||||||
| Subaru Corp. |
37,600 | 686,251 | ||||||
| Japan—(Continued) | ||||||||
| SUMCO Corp. |
22,600 | 337,660 | ||||||
| Sumitomo Chemical Co. Ltd. |
80,800 | 196,848 | ||||||
| Sumitomo Corp. |
58,000 | 1,265,300 | ||||||
| Sumitomo Electric Industries Ltd. |
41,334 | 524,662 | ||||||
| Sumitomo Metal Mining Co. Ltd. |
12,800 | 384,107 | ||||||
| Sumitomo Mitsui Financial Group, Inc. |
72,300 | 3,522,240 | ||||||
| Sumitomo Mitsui Trust Holdings, Inc. |
38,852 | 745,196 | ||||||
| Sumitomo Realty & Development Co. Ltd. |
14,700 | 435,735 | ||||||
| Suntory Beverage & Food Ltd. |
8,500 | 280,065 | ||||||
| Suzuki Motor Corp. |
20,000 | 861,017 | ||||||
| Sysmex Corp. |
8,900 | 494,605 | ||||||
| T&D Holdings, Inc. |
25,900 | 411,095 | ||||||
| Taisei Corp. |
10,300 | 351,770 | ||||||
| Takeda Pharmaceutical Co. Ltd. |
90,848 | 2,608,375 | ||||||
| TDK Corp. |
22,400 | 1,061,999 | ||||||
| Terumo Corp. |
37,400 | 1,220,592 | ||||||
| TIS, Inc. |
11,200 | 246,327 | ||||||
| Tobu Railway Co. Ltd. |
12,400 | 332,243 | ||||||
| Toho Co. Ltd. |
5,200 | 175,598 | ||||||
| Tokio Marine Holdings, Inc. |
103,000 | 2,571,801 | ||||||
| Tokyo Electric Power Co. Holdings, Inc. (a) |
87,700 | 457,882 | ||||||
| Tokyo Electron Ltd. |
27,200 | 4,835,502 | ||||||
| Tokyo Gas Co. Ltd. |
20,400 | 467,723 | ||||||
| Tokyu Corp. |
32,900 | 400,924 | ||||||
| TOPPAN Holdings, Inc. |
11,900 | 331,142 | ||||||
| Toray Industries, Inc. |
80,200 | 417,499 | ||||||
| Tosoh Corp. |
15,100 | 192,475 | ||||||
| TOTO Ltd. |
6,200 | 163,259 | ||||||
| Toyota Industries Corp. |
7,900 | 641,529 | ||||||
| Toyota Motor Corp. |
602,300 | 11,057,857 | ||||||
| Toyota Tsusho Corp. |
11,400 | 667,975 | ||||||
| Trend Micro, Inc. |
6,400 | 340,565 | ||||||
| Unicharm Corp. |
22,500 | 812,962 | ||||||
| USS Co. Ltd. |
13,200 | 265,033 | ||||||
| West Japan Railway Co. |
11,600 | 483,135 | ||||||
| Yakult Honsha Co. Ltd. |
14,200 | 318,477 | ||||||
| Yamaha Corp. |
9,100 | 209,798 | ||||||
| Yamaha Motor Co. Ltd. (b) |
56,100 | 499,273 | ||||||
| Yamato Holdings Co. Ltd. |
18,300 | 337,756 | ||||||
| Yaskawa Electric Corp. |
14,600 | 606,870 | ||||||
| Yokogawa Electric Corp. |
16,300 | 309,665 | ||||||
| Zensho Holdings Co. Ltd. |
5,000 | 261,112 | ||||||
| ZOZO, Inc. |
8,400 | 188,768 | ||||||
|
|
|
|||||||
| 206,459,313 | ||||||||
|
|
|
|||||||
| Jordan—0.0% | ||||||||
| Hikma Pharmaceuticals PLC |
11,270 | 256,861 | ||||||
|
|
|
|||||||
| Luxembourg—0.2% | ||||||||
| ArcelorMittal SA |
27,879 | 791,132 | ||||||
| Eurofins Scientific SE |
8,661 | 567,032 | ||||||
| Tenaris SA |
27,400 | 476,716 | ||||||
|
|
|
|||||||
| 1,834,880 | ||||||||
|
|
|
|||||||
| Macau—0.1% | ||||||||
| Sands China Ltd. (a) |
139,600 | 407,379 | ||||||
|
|
|
|||||||
See accompanying notes to financial statements.
BHFTII-8
Brighthouse Funds Trust II
MetLife MSCI EAFE Index Portfolio
Schedule of Investments as of December 31, 2023
Common Stocks—(Continued)
| Security Description | Shares | Value | ||||||
| Netherlands—5.9% | ||||||||
| ABN AMRO Bank NV |
25,269 | $ | 379,921 | |||||
| Adyen NV (a) |
1,246 | 1,607,257 | ||||||
| Aegon Ltd. |
87,263 | 506,167 | ||||||
| Akzo Nobel NV |
10,339 | 854,808 | ||||||
| Argenx SE (a) |
3,256 | 1,238,097 | ||||||
| ASM International NV |
2,706 | 1,410,021 | ||||||
| ASML Holding NV |
22,967 | 17,351,382 | ||||||
| ASR Nederland NV |
9,212 | 435,872 | ||||||
| BE Semiconductor Industries NV |
4,443 | 669,927 | ||||||
| Euronext NV |
4,309 | 374,396 | ||||||
| EXOR NV (b) |
5,925 | 594,362 | ||||||
| Ferrovial SE |
28,340 | 1,035,213 | ||||||
| Heineken Holding NV |
7,134 | 605,117 | ||||||
| Heineken NV |
16,597 | 1,689,735 | ||||||
| IMCD NV |
2,999 | 523,607 | ||||||
| ING Groep NV - Series N |
207,822 | 3,113,109 | ||||||
| JDE Peet’s NV |
7,639 | 205,802 | ||||||
| Koninklijke Ahold Delhaize NV |
55,588 | 1,597,082 | ||||||
| Koninklijke KPN NV |
185,449 | 638,818 | ||||||
| Koninklijke Philips NV |
45,006 | 1,051,744 | ||||||
| NN Group NV |
14,169 | 560,886 | ||||||
| OCI NV |
6,992 | 203,399 | ||||||
| Qiagen NV (a) |
12,443 | 541,718 | ||||||
| Randstad NV |
5,702 | 357,620 | ||||||
| Shell PLC |
377,293 | 12,259,380 | ||||||
| Stellantis NV (Milan-Traded Shares) |
129,155 | 3,026,540 | ||||||
| Universal Music Group NV |
47,580 | 1,359,563 | ||||||
| Wolters Kluwer NV |
13,905 | 1,977,214 | ||||||
|
|
|
|||||||
| 56,168,757 | ||||||||
|
|
|
|||||||
| New Zealand—0.3% | ||||||||
| Auckland International Airport Ltd. |
75,578 | 420,672 | ||||||
| Fisher & Paykel Healthcare Corp. Ltd. - Class C |
26,885 | 401,978 | ||||||
| Mercury NZ Ltd. |
47,715 | 199,396 | ||||||
| Meridian Energy Ltd. |
80,631 | 282,902 | ||||||
| Spark New Zealand Ltd. |
106,324 | 348,829 | ||||||
| Xero Ltd. (a) |
8,809 | 672,420 | ||||||
|
|
|
|||||||
| 2,326,197 | ||||||||
|
|
|
|||||||
| Norway—0.6% | ||||||||
| Aker BP ASA |
16,292 | 473,687 | ||||||
| DNB Bank ASA |
53,584 | 1,138,846 | ||||||
| Equinor ASA |
51,919 | 1,645,454 | ||||||
| Gjensidige Forsikring ASA |
14,357 | 264,918 | ||||||
| Kongsberg Gruppen ASA |
3,470 | 158,906 | ||||||
| Mowi ASA |
23,708 | 424,632 | ||||||
| Norsk Hydro ASA |
75,203 | 506,095 | ||||||
| Orkla ASA |
43,283 | 335,719 | ||||||
| Salmar ASA |
4,072 | 228,009 | ||||||
| Telenor ASA |
36,259 | 416,565 | ||||||
| Yara International ASA |
10,920 | 388,181 | ||||||
|
|
|
|||||||
| 5,981,012 | ||||||||
|
|
|
|||||||
| Portugal—0.2% | ||||||||
| EDP - Energias de Portugal SA |
180,838 | 914,225 | ||||||
| Portugal—(Continued) | ||||||||
| Galp Energia SGPS SA |
24,223 | 356,548 | ||||||
| Jeronimo Martins SGPS SA |
18,255 | 464,455 | ||||||
|
|
|
|||||||
| 1,735,228 | ||||||||
|
|
|
|||||||
| Singapore—1.3% | ||||||||
| CapitaLand Ascendas (REIT) |
204,444 | 468,358 | ||||||
| CapitaLand Integrated Commercial Trust (REIT) |
306,642 | 477,230 | ||||||
| CapitaLand Investment Ltd. |
150,800 | 359,986 | ||||||
| City Developments Ltd. |
27,200 | 136,747 | ||||||
| DBS Group Holdings Ltd. |
103,967 | 2,627,994 | ||||||
| Genting Singapore Ltd. |
348,500 | 264,679 | ||||||
| Grab Holdings Ltd. - Class A (a) |
113,500 | 382,495 | ||||||
| Jardine Cycle & Carriage Ltd. |
6,000 | 134,968 | ||||||
| Keppel (REIT) |
17,200 | 12,105 | ||||||
| Keppel Corp. Ltd. |
86,000 | 460,044 | ||||||
| Mapletree Logistics Trust (REIT) |
198,449 | 260,944 | ||||||
| Mapletree Pan Asia Commercial Trust (REIT) |
135,400 | 160,527 | ||||||
| Oversea-Chinese Banking Corp. Ltd. |
194,464 | 1,911,074 | ||||||
| Sea Ltd. (ADR) (a) |
20,900 | 846,450 | ||||||
| Seatrium Ltd. (a) |
2,556,312 | 228,316 | ||||||
| Sembcorp Industries Ltd. |
52,000 | 208,852 | ||||||
| Singapore Airlines Ltd. |
87,540 | 434,062 | ||||||
| Singapore Exchange Ltd. |
54,400 | 404,565 | ||||||
| Singapore Technologies Engineering Ltd. |
106,000 | 312,090 | ||||||
| Singapore Telecommunications Ltd. |
475,820 | 889,622 | ||||||
| United Overseas Bank Ltd. |
68,792 | 1,481,300 | ||||||
| Wilmar International Ltd. |
97,400 | 262,963 | ||||||
|
|
|
|||||||
| 12,725,371 | ||||||||
|
|
|
|||||||
| South Africa—0.2% | ||||||||
| Anglo American PLC |
72,055 | 1,808,303 | ||||||
|
|
|
|||||||
| Spain—2.5% | ||||||||
| Acciona SA |
1,638 | 242,063 | ||||||
| ACS Actividades de Construccion y Servicios SA |
12,831 | 569,899 | ||||||
| Aena SME SA |
4,224 | 767,372 | ||||||
| Amadeus IT Group SA |
25,117 | 1,802,535 | ||||||
| Banco Bilbao Vizcaya Argentaria SA |
344,037 | 3,136,626 | ||||||
| Banco Santander SA |
915,238 | 3,823,040 | ||||||
| CaixaBank SA |
228,552 | 941,064 | ||||||
| Cellnex Telecom SA (a) |
32,166 | 1,271,723 | ||||||
| EDP Renovaveis SA |
17,703 | 364,691 | ||||||
| Enagas SA |
15,136 | 255,524 | ||||||
| Endesa SA |
16,585 | 338,352 | ||||||
| Grifols SA (a) |
21,632 | 370,992 | ||||||
| Iberdrola SA |
341,492 | 4,468,903 | ||||||
| Industria de Diseno Textil SA |
62,261 | 2,717,324 | ||||||
| Naturgy Energy Group SA (b) |
9,652 | 288,030 | ||||||
| Redeia Corp. SA |
21,616 | 356,502 | ||||||
| Repsol SA |
70,468 | 1,045,746 | ||||||
| Telefonica SA |
292,506 | 1,149,314 | ||||||
|
|
|
|||||||
| 23,909,700 | ||||||||
|
|
|
|||||||
| Sweden—3.1% | ||||||||
| Alfa Laval AB |
15,516 | 623,073 | ||||||
See accompanying notes to financial statements.
BHFTII-9
Brighthouse Funds Trust II
MetLife MSCI EAFE Index Portfolio
Schedule of Investments as of December 31, 2023
Common Stocks—(Continued)
| Security Description | Shares | Value | ||||||
| Sweden—(Continued) | ||||||||
| Assa Abloy AB - Class B |
58,271 | $ | 1,680,119 | |||||
| Atlas Copco AB - A Shares |
154,226 | 2,657,884 | ||||||
| Atlas Copco AB - B Shares |
92,052 | 1,365,751 | ||||||
| Beijer Ref AB |
20,500 | 274,957 | ||||||
| Boliden AB |
16,516 | 515,685 | ||||||
| Epiroc AB - A Shares |
36,338 | 729,690 | ||||||
| Epiroc AB - B Shares |
24,398 | 427,287 | ||||||
| EQT AB |
22,013 | 626,534 | ||||||
| Essity AB - Class B |
34,188 | 847,910 | ||||||
| Evolution AB |
10,621 | 1,272,227 | ||||||
| Fastighets AB Balder - B Shares (a) |
37,572 | 268,552 | ||||||
| Getinge AB - B Shares |
15,453 | 344,960 | ||||||
| H & M Hennes & Mauritz AB - B Shares |
36,983 | 649,569 | ||||||
| Hexagon AB - B Shares |
114,943 | 1,385,972 | ||||||
| Holmen AB - B Shares |
3,296 | 139,534 | ||||||
| Husqvarna AB - B Shares |
25,677 | 211,831 | ||||||
| Industrivarden AB - A Shares |
5,167 | 168,961 | ||||||
| Industrivarden AB - C Shares |
6,120 | 199,733 | ||||||
| Indutrade AB |
12,514 | 326,777 | ||||||
| Investment AB Latour - B Shares |
10,798 | 281,924 | ||||||
| Investor AB - B Shares |
98,906 | 2,297,468 | ||||||
| L E Lundbergforetagen AB - B Shares |
4,755 | 258,683 | ||||||
| Lifco AB - B Shares |
15,748 | 387,462 | ||||||
| Nibe Industrier AB - B Shares |
88,393 | 625,256 | ||||||
| Saab AB - Class B |
4,900 | 295,481 | ||||||
| Sagax AB - Class B |
10,880 | 298,732 | ||||||
| Sandvik AB |
59,255 | 1,283,546 | ||||||
| Securitas AB - B Shares (b) |
28,342 | 278,353 | ||||||
| Skandinaviska Enskilda Banken AB - Class A |
91,449 | 1,259,843 | ||||||
| Skanska AB - B Shares |
16,847 | 305,041 | ||||||
| SKF AB - B Shares |
18,258 | 365,050 | ||||||
| Svenska Cellulosa AB SCA - Class B |
31,044 | 465,538 | ||||||
| Svenska Handelsbanken AB - A Shares |
85,696 | 930,877 | ||||||
| Swedbank AB - A Shares |
49,129 | 993,444 | ||||||
| Swedish Orphan Biovitrum AB (a) |
12,810 | 339,577 | ||||||
| Tele2 AB - B Shares |
34,110 | 293,385 | ||||||
| Telefonaktiebolaget LM Ericsson - B Shares |
168,752 | 1,067,305 | ||||||
| Telia Co. AB |
140,889 | 359,674 | ||||||
| Volvo AB - A Shares |
11,531 | 305,622 | ||||||
| Volvo AB - B Shares |
84,632 | 2,201,879 | ||||||
|
|
|
|||||||
| 29,611,146 | ||||||||
|
|
|
|||||||
| Switzerland—10.4% | ||||||||
| ABB Ltd. |
92,188 | 4,093,830 | ||||||
| Adecco Group AG |
9,221 | 453,453 | ||||||
| Alcon, Inc. |
28,691 | 2,245,952 | ||||||
| Avolta AG (a) |
5,990 | 236,112 | ||||||
| Bachem Holding AG |
2,095 | 162,190 | ||||||
| Baloise Holding AG |
2,719 | 425,966 | ||||||
| Banque Cantonale Vaudoise |
1,980 | 255,261 | ||||||
| Barry Callebaut AG |
187 | 315,809 | ||||||
| BKW AG |
1,390 | 247,184 | ||||||
| Chocoladefabriken Lindt & Spruengli AG |
6 | 727,126 | ||||||
| Chocoladefabriken Lindt & Spruengli AG (Participation Certificate) |
50 | 600,141 | ||||||
| Cie Financiere Richemont SA - Class A |
29,972 | 4,131,190 | ||||||
| Clariant AG |
13,958 | 206,466 | ||||||
| Switzerland—(Continued) | ||||||||
| Coca-Cola HBC AG |
13,800 | 405,128 | ||||||
| DSM-Firmenich AG |
10,717 | 1,091,858 | ||||||
| EMS-Chemie Holding AG |
423 | 342,373 | ||||||
| Geberit AG |
1,837 | 1,179,825 | ||||||
| Givaudan SA |
532 | 2,211,565 | ||||||
| Glencore PLC |
591,248 | 3,547,454 | ||||||
| Helvetia Holding AG |
2,260 | 311,245 | ||||||
| Holcim AG |
29,718 | 2,332,024 | ||||||
| Julius Baer Group Ltd. |
11,250 | 631,688 | ||||||
| Kuehne & Nagel International AG |
3,244 | 1,117,476 | ||||||
| Logitech International SA |
9,636 | 913,809 | ||||||
| Lonza Group AG |
4,276 | 1,797,703 | ||||||
| Nestle SA |
152,235 | 17,606,718 | ||||||
| Novartis AG |
116,429 | 11,747,399 | ||||||
| Partners Group Holding AG |
1,269 | 1,833,381 | ||||||
| Roche Holding AG |
39,883 | 11,551,135 | ||||||
| Roche Holding AG (Bearer Shares) |
1,770 | 549,786 | ||||||
| Sandoz Group AG (a) |
23,538 | 758,752 | ||||||
| Schindler Holding AG |
1,428 | 338,762 | ||||||
| Schindler Holding AG (Participation Certificate) |
2,283 | 570,944 | ||||||
| SGS SA |
8,665 | 747,818 | ||||||
| SIG Group AG |
15,590 | 358,570 | ||||||
| Sika AG |
8,693 | 2,838,275 | ||||||
| Sonova Holding AG |
2,693 | 880,006 | ||||||
| STMicroelectronics NV |
39,053 | 1,960,783 | ||||||
| Straumann Holding AG |
6,539 | 1,057,077 | ||||||
| Swatch Group AG |
4,016 | 584,802 | ||||||
| Swiss Life Holding AG |
1,671 | 1,160,843 | ||||||
| Swiss Prime Site AG |
4,615 | 493,363 | ||||||
| Swiss Re AG |
17,318 | 1,946,416 | ||||||
| Swisscom AG |
1,510 | 908,006 | ||||||
| Temenos AG |
2,932 | 273,428 | ||||||
| UBS Group AG |
188,844 | 5,861,081 | ||||||
| VAT Group AG |
1,513 | 758,733 | ||||||
| Zurich Insurance Group AG |
8,345 | 4,359,723 | ||||||
|
|
|
|||||||
| 99,128,629 | ||||||||
|
|
|
|||||||
| United Arab Emirates—0.0% | ||||||||
| NMC Health PLC (a) (c) (d) |
7,569 | 0 | ||||||
|
|
|
|||||||
| United Kingdom—11.7% | ||||||||
| 3i Group PLC |
55,885 | 1,720,470 | ||||||
| abrdn PLC |
100,841 | 229,166 | ||||||
| Admiral Group PLC |
14,845 | 507,162 | ||||||
| Ashtead Group PLC |
25,877 | 1,793,240 | ||||||
| Associated British Foods PLC |
18,881 | 569,214 | ||||||
| AstraZeneca PLC |
88,013 | 11,855,280 | ||||||
| Auto Trader Group PLC |
45,593 | 418,694 | ||||||
| Aviva PLC |
164,006 | 907,244 | ||||||
| BAE Systems PLC |
175,322 | 2,480,726 | ||||||
| Barclays PLC |
827,548 | 1,612,067 | ||||||
| Barratt Developments PLC |
47,746 | 341,578 | ||||||
| Berkeley Group Holdings PLC |
5,026 | 299,495 | ||||||
| BP PLC |
973,073 | 5,751,067 | ||||||
| British American Tobacco PLC |
121,961 | 3,559,515 | ||||||
| BT Group PLC |
345,083 | 542,125 | ||||||
See accompanying notes to financial statements.
BHFTII-10
Brighthouse Funds Trust II
MetLife MSCI EAFE Index Portfolio
Schedule of Investments as of December 31, 2023
Common Stocks—(Continued)
| Security Description | Shares |
Value | ||||||
| United Kingdom—(Continued) | ||||||||
| Bunzl PLC |
20,033 | $ | 813,256 | |||||
| Burberry Group PLC |
23,361 | 424,304 | ||||||
| Centrica PLC |
320,670 | 573,813 | ||||||
| CK Hutchison Holdings Ltd. |
153,940 | 828,556 | ||||||
| Coca-Cola Europacific Partners PLC |
11,100 | 740,814 | ||||||
| Compass Group PLC |
95,527 | 2,610,573 | ||||||
| Croda International PLC |
8,925 | 573,609 | ||||||
| DCC PLC |
4,751 | 348,665 | ||||||
| Diageo PLC |
129,460 | 4,701,788 | ||||||
| Endeavour Mining PLC |
11,300 | 253,908 | ||||||
| Entain PLC |
39,400 | 497,733 | ||||||
| Experian PLC |
52,775 | 2,150,927 | ||||||
| Haleon PLC |
319,304 | 1,307,439 | ||||||
| Halma PLC |
22,415 | 651,337 | ||||||
| Hargreaves Lansdown PLC |
13,683 | 127,513 | ||||||
| HSBC Holdings PLC |
1,111,005 | 8,974,738 | ||||||
| Imperial Brands PLC |
47,022 | 1,080,684 | ||||||
| Informa PLC |
77,518 | 769,672 | ||||||
| InterContinental Hotels Group PLC |
9,760 | 881,613 | ||||||
| Intertek Group PLC |
9,159 | 494,628 | ||||||
| J Sainsbury PLC |
94,695 | 364,514 | ||||||
| JD Sports Fashion PLC |
148,800 | 314,518 | ||||||
| Kingfisher PLC |
103,242 | 319,555 | ||||||
| Land Securities Group PLC (REIT) |
40,597 | 363,420 | ||||||
| Legal & General Group PLC |
322,853 | 1,029,655 | ||||||
| Lloyds Banking Group PLC |
3,717,260 | 2,251,153 | ||||||
| London Stock Exchange Group PLC |
23,414 | 2,768,182 | ||||||
| M&G PLC |
129,250 | 365,427 | ||||||
| Melrose Industries PLC |
77,883 | 562,773 | ||||||
| Mondi PLC |
29,085 | 568,703 | ||||||
| National Grid PLC |
211,145 | 2,851,284 | ||||||
| NatWest Group PLC |
334,948 | 934,937 | ||||||
| Next PLC |
6,871 | 709,382 | ||||||
| Ocado Group PLC (a) |
33,748 | 324,302 | ||||||
| Pearson PLC |
32,125 | 394,507 | ||||||
| Persimmon PLC |
15,059 | 265,634 | ||||||
| Phoenix Group Holdings PLC |
43,268 | 293,932 | ||||||
| Prudential PLC |
158,081 | 1,779,749 | ||||||
| Reckitt Benckiser Group PLC |
41,120 | 2,837,190 | ||||||
| RELX PLC |
106,108 | 4,208,768 | ||||||
| Rentokil Initial PLC |
138,734 | 788,007 | ||||||
| Rio Tinto PLC |
64,637 | 4,801,025 | ||||||
| Rolls-Royce Holdings PLC (a) |
485,040 | 1,847,442 | ||||||
| Sage Group PLC |
62,616 | 934,187 | ||||||
| Schroders PLC |
46,288 | 252,691 | ||||||
| Segro PLC (REIT) |
66,139 | 744,536 | ||||||
| Severn Trent PLC |
15,346 | 504,773 | ||||||
| Smith & Nephew PLC |
49,971 | 684,156 | ||||||
| Smiths Group PLC |
19,606 | 439,992 | ||||||
| Spirax-Sarco Engineering PLC |
4,349 | 581,013 | ||||||
| SSE PLC |
64,531 | 1,522,528 | ||||||
| St. James’s Place PLC |
30,110 | 261,517 | ||||||
| Standard Chartered PLC |
136,689 | 1,156,383 | ||||||
| Taylor Wimpey PLC |
203,553 | 380,566 | ||||||
| Tesco PLC |
413,105 | 1,528,279 | ||||||
| Unilever PLC |
142,487 | 6,894,887 | ||||||
| United Utilities Group PLC |
38,342 | 516,817 | ||||||
| United Kingdom—(Continued) | ||||||||
| Vodafone Group PLC |
1,260,581 | 1,095,162 | ||||||
| Whitbread PLC |
10,880 | 505,505 | ||||||
| Wise PLC - Class A (a) |
37,366 | 414,883 | ||||||
| WPP PLC |
66,140 | 628,802 | ||||||
|
|
|
|||||||
| 111,383,349 | ||||||||
|
|
|
|||||||
| United States—0.5% | ||||||||
| GSK PLC |
235,120 | 4,343,480 | ||||||
| Monday.com Ltd. (a) |
1,200 | 225,372 | ||||||
|
|
|
|||||||
| 4,568,852 | ||||||||
|
|
|
|||||||
| Total Common Stocks |
917,793,846 | |||||||
|
|
|
|||||||
| Mutual Funds—1.4% |
| |||||||
| United States—1.4% | ||||||||
| iShares MSCI EAFE ETF (b) (e) |
182,400 | 13,743,840 | ||||||
|
|
|
|||||||
| Preferred Stocks—0.4% |
| |||||||
| Germany—0.4% | ||||||||
| Bayerische Motoren Werke AG |
3,581 | 355,866 | ||||||
| Dr. Ing HC F Porsche AG |
6,443 | 568,544 | ||||||
| Henkel AG & Co. KGaA |
9,444 | 760,080 | ||||||
| Porsche Automobil Holding SE |
9,628 | 492,714 | ||||||
| Sartorius AG |
1,542 | 567,693 | ||||||
| Volkswagen AG |
11,612 | 1,434,261 | ||||||
|
|
|
|||||||
| Total Preferred Stocks |
4,179,158 | |||||||
|
|
|
|||||||
| Short-Term Investments—1.4% |
| |||||||
| U.S. Treasury—1.4% | ||||||||
| U.S. Treasury Bills |
800,000 | 800,000 | ||||||
| 5.214%, 02/06/24 (f) |
12,475,000 | 12,410,968 | ||||||
|
|
|
|||||||
| Total Short-Term Investments |
13,210,968 | |||||||
|
|
|
|||||||
| Securities Lending Reinvestments (g)—0.8% |
| |||||||
| Repurchase Agreements—0.3% | ||||||||
| Bank of Nova Scotia |
200,000 | 200,000 | ||||||
See accompanying notes to financial statements.
BHFTII-11
Brighthouse Funds Trust II
MetLife MSCI EAFE Index Portfolio
Schedule of Investments as of December 31, 2023
Securities Lending Reinvestments (g)—(Continued)
| Security Description | Shares/ Principal Amount* |
Value | ||||||
| Repurchase Agreements—(Continued) | ||||||||
| Barclays Bank PLC |
200,000 | $ | 200,000 | |||||
| Deutsche Bank Securities, Inc. |
47,238 | 47,238 | ||||||
| NBC Global Finance Ltd. |
1,300,000 | 1,300,000 | ||||||
| Societe Generale |
||||||||
| Repurchase Agreement dated 12/29/23 at 5.330%, due on 01/02/24 with a maturity value of $500,296; collateralized by U.S. Treasury Obligations with rates ranging from 0.625% - 4.750%, maturity dates ranging from 04/15/26 - 08/15/51, and an aggregate market value of $511,133. |
500,000 | 500,000 | ||||||
| Repurchase Agreement dated 12/29/23 at 5.330%, due on 01/02/24 with a maturity value of $8,101; collateralized by U.S. Treasury Obligations with rates ranging from 0.625% - 5.240%, maturity dates ranging from 04/30/24 - 05/15/32, and an aggregate market value of $8,258. |
8,096 | 8,096 | ||||||
| Repurchase Agreement dated 12/29/23 at 5.510%, due on 01/02/24 with a maturity value of $517,632; collateralized by various Common Stock with an aggregate market value of $575,840. |
517,315 | 517,315 | ||||||
|
|
|
|||||||
| 2,772,649 | ||||||||
|
|
|
|||||||
| Mutual Funds—0.5% | ||||||||
| BlackRock Liquidity Funds FedFund, Institutional Shares |
1,000,000 | 1,000,000 | ||||||
| Dreyfus Treasury Obligations Cash Management Fund, Institutional Class 5.250% (h) |
1,000,000 | 1,000,000 | ||||||
| Fidelity Investments Money Market Government Portfolio, Class I |
1,000,000 | 1,000,000 | ||||||
| HSBC U.S. Government Money Market Fund, Class I 5.300% (h) |
100,000 | 100,000 | ||||||
| Morgan Stanley Liquidity Funds Government Portfolio, Institutional Shares 5.270% (h) |
459,832 | 459,832 | ||||||
| Mutual Funds—(Continued) | ||||||||
| STIT-Government & Agency Portfolio, Institutional Class |
1,000,000 | 1,000,000 | ||||||
|
|
|
|||||||
| 4,559,832 | ||||||||
|
|
|
|||||||
| Total Securities Lending Reinvestments |
7,332,481 | |||||||
|
|
|
|||||||
| Total Investments—100.5% |
956,260,293 | |||||||
| Other assets and liabilities (net)—(0.5)% |
(5,020,438 | ) | ||||||
|
|
|
|||||||
| Net Assets—100.0% | $ | 951,239,855 | ||||||
|
|
|
|||||||
| (a) | Non-income producing security. | |||
| (b) | All or a portion of the security was held on loan. As of December 31, 2023, the market value of securities loaned was $16,482,446 and the collateral received consisted of cash in the amount of $7,332,481 and non-cash collateral with a value of $10,083,654. The cash collateral investments are disclosed in the Schedule of Investments and categorized as Securities Lending Reinvestments. The non-cash collateral received consists of U.S. government securities that are held in safe-keeping by the lending agent, or a third-party custodian, and cannot be sold or repledged by the Portfolio. As such, this collateral is excluded from the Statement of Assets and Liabilities. | |||
| (c) | Significant unobservable inputs were used in the valuation of this portfolio security; i.e. Level 3. | |||
| (d) | Security was valued in good faith under procedures subject to oversight by the Board of Trustees. As of December 31, 2023, these securities represent less than 0.05% of net assets. | |||
| (e) | All or a portion of the security was pledged as collateral against open futures contracts. As of December 31, 2023, the market value of securities pledged was $3,767,500. | |||
| (f) | The rate shown represents current yield to maturity. | |||
| (g) | Represents investment of cash collateral received from securities on loan as of December 31, 2023. | |||
| (h) | The rate shown represents the annualized seven-day yield as of December 31, 2023. | |||
| Ten Largest Industries as of |
% of |
|||
| Banks |
10.7 | |||
| Pharmaceuticals |
8.8 | |||
| Insurance |
4.9 | |||
| Oil, Gas & Consumable Fuels |
4.2 | |||
| Food Products |
4.0 | |||
| Semiconductors & Semiconductor Equipment |
3.8 | |||
| Auto Manufacturers |
3.6 | |||
| Chemicals |
2.9 | |||
| Telecommunications |
2.8 | |||
| Electric |
2.7 | |||
See accompanying notes to financial statements.
BHFTII-12
Brighthouse Funds Trust II
MetLife MSCI EAFE Index Portfolio
Schedule of Investments as of December 31, 2023
Futures Contracts
| Futures Contracts—Long |
Expiration Date |
Number of Contracts |
Notional Amount |
Value/ Unrealized Appreciation/ (Depreciation) |
||||||||||||||||
| MSCI EAFE Index Mini Futures |
03/15/24 | 116 | USD | 13,063,920 | $ | 582,079 | ||||||||||||||
|
|
|
|||||||||||||||||||
Glossary of Abbreviations
Currencies
| (USD)— | United States Dollar |
Other Abbreviations
| (REIT)— | Real Estate Investment Trust | |||
| (ADR)— | American Depositary Receipt | |||
| (ETF)— | Exchange-Traded Fund | |||
See accompanying notes to financial statements.
BHFTII-13
Brighthouse Funds Trust II
MetLife MSCI EAFE Index Portfolio
Schedule of Investments as of December 31, 2023
Fair Value Hierarchy
Accounting principles generally accepted in the United States of America (“GAAP”) define fair market value as the price that the Portfolio would receive to sell an asset or pay to transfer a liability in an orderly transaction between market participants at the measurement date. It establishes a fair value hierarchy that prioritizes inputs to valuation methods and requires disclosure of the fair value hierarchy, separately for each major category of assets and liabilities, that segregates fair value measurements into three levels. Levels 1, 2 and 3 of the fair value hierarchy are defined as follows:
Level 1 - unadjusted quoted prices in active markets for identical investments
Level 2 - other significant observable inputs (including, but not limited to, quoted prices for similar assets or liabilities in markets that are either active or inactive; inputs other than quoted prices that are observable such as interest rates, yield curves, volatilities, prepayment speeds, loss severities, credit risks, default rates, or other market corroborated inputs)
Level 3 - significant unobservable inputs based on the best information available in the circumstances, to the extent observable inputs are unavailable (including the Portfolio’s own assumptions used in determining the fair value of investments and derivative financial instruments)
The inputs or methodologies used for valuing investments are not necessarily an indication of the risk associated with investing in them. Changes to the inputs or methodologies used may result in transfers between levels. A reconciliation of Level 3 securities, if any, will be disclosed following the fair value hierarchy table. For more information about the Portfolio’s policy regarding the valuation of investments, please refer to the Notes to Financial Statements.
The following table summarizes the fair value hierarchy of the Portfolio’s investments as of December 31, 2023:
| Description | Level 1 | Level 2 | Level 3 | Total | ||||||||||||
| Common Stocks |
| |||||||||||||||
| Australia |
$ | — | $ | 70,488,877 | $ | — | $ | 70,488,877 | ||||||||
| Austria |
— | 1,705,159 | — | 1,705,159 | ||||||||||||
| Belgium |
370,787 | 7,236,175 | — | 7,606,962 | ||||||||||||
| Chile |
— | 433,423 | — | 433,423 | ||||||||||||
| China |
174,816 | 3,740,391 | — | 3,915,207 | ||||||||||||
| Denmark |
— | 30,839,506 | — | 30,839,506 | ||||||||||||
| Finland |
— | 10,031,863 | — | 10,031,863 | ||||||||||||
| France |
— | 107,870,405 | — | 107,870,405 | ||||||||||||
| Germany |
— | 74,560,949 | — | 74,560,949 | ||||||||||||
| Hong Kong |
— | 17,426,950 | — | 17,426,950 | ||||||||||||
| Ireland |
847,248 | 6,826,227 | — | 7,673,475 | ||||||||||||
| Israel |
2,624,938 | 3,477,811 | — | 6,102,749 | ||||||||||||
| Italy |
— | 20,833,344 | — | 20,833,344 | ||||||||||||
| Japan |
— | 206,459,313 | — | 206,459,313 | ||||||||||||
| Jordan |
— | 256,861 | — | 256,861 | ||||||||||||
| Luxembourg |
— | 1,834,880 | — | 1,834,880 | ||||||||||||
| Macau |
— | 407,379 | — | 407,379 | ||||||||||||
| Netherlands |
— | 56,168,757 | — | 56,168,757 | ||||||||||||
| New Zealand |
— | 2,326,197 | — | 2,326,197 | ||||||||||||
| Norway |
— | 5,981,012 | — | 5,981,012 | ||||||||||||
| Portugal |
— | 1,735,228 | — | 1,735,228 | ||||||||||||
| Singapore |
1,228,945 | 11,496,426 | — | 12,725,371 | ||||||||||||
| South Africa |
— | 1,808,303 | — | 1,808,303 | ||||||||||||
| Spain |
— | 23,909,700 | — | 23,909,700 | ||||||||||||
| Sweden |
— | 29,611,146 | — | 29,611,146 | ||||||||||||
| Switzerland |
— | 99,128,629 | — | 99,128,629 | ||||||||||||
| United Arab Emirates |
— | — | 0 | 0 | ||||||||||||
| United Kingdom |
740,814 | 110,642,535 | — | 111,383,349 | ||||||||||||
| United States |
225,372 | 4,343,480 | — | 4,568,852 | ||||||||||||
| Total Common Stocks |
6,212,920 | 911,580,926 | 0 | 917,793,846 | ||||||||||||
| Total Mutual Funds* |
13,743,840 | — | — | 13,743,840 | ||||||||||||
| Total Preferred Stocks* |
— | 4,179,158 | — | 4,179,158 | ||||||||||||
| Total Short-Term Investments* |
— | 13,210,968 | — | 13,210,968 | ||||||||||||
| Securities Lending Reinvestments |
| |||||||||||||||
| Repurchase Agreements |
— | 2,772,649 | — | 2,772,649 | ||||||||||||
| Mutual Funds |
4,559,832 | — | — | 4,559,832 | ||||||||||||
| Total Securities Lending Reinvestments |
4,559,832 | 2,772,649 | — | 7,332,481 | ||||||||||||
| Total Investments |
$ | 24,516,592 | $ | 931,743,701 | $ | 0 | $ | 956,260,293 | ||||||||
| Collateral for Securities Loaned (Liability) |
$ | — | $ | (7,332,481 | ) | $ | — | $ | (7,332,481 | ) | ||||||
| Futures Contracts |
| |||||||||||||||
| Futures Contracts (Unrealized Appreciation) |
$ | 582,079 | $ | — | $ | — | $ | 582,079 | ||||||||
| * | See Schedule of Investments for additional detailed categorizations. | |||
Level 3 investments at the beginning and/or end of the period in relation to net assets were not significant and accordingly, a reconciliation of Level 3 assets for the year ended December 31, 2023 is not presented.
See accompanying notes to financial statements.
BHFTII-14
Brighthouse Funds Trust II
MetLife MSCI EAFE Index Portfolio
Statement of Assets and Liabilities
December 31, 2023
| Assets |
| |||
| Investments at value (a) (b) |
$ | 956,260,293 | ||
| Cash |
25,863 | |||
| Cash denominated in foreign currencies (c) |
312,415 | |||
| Receivable for: |
||||
| Investments sold |
209,648 | |||
| Fund shares sold |
163,748 | |||
| Dividends |
2,898,143 | |||
| Variation margin on futures contracts |
6,960 | |||
| Prepaid expenses |
3,580 | |||
|
|
|
|||
| Total Assets |
959,880,650 | |||
| Liabilities |
||||
| Collateral for securities loaned |
7,332,481 | |||
| Payables for: |
||||
| Fund shares redeemed |
571,253 | |||
| Accrued Expenses: |
||||
| Management fees |
235,514 | |||
| Distribution and service fees |
99,876 | |||
| Deferred trustees’ fees |
170,098 | |||
| Other expenses |
231,573 | |||
|
|
|
|||
| Total Liabilities |
8,640,795 | |||
|
|
|
|||
| Net Assets |
$ | 951,239,855 | ||
|
|
|
|||
| Net Assets Consist of: |
||||
| Paid in surplus |
$ | 661,752,864 | ||
| Distributable earnings (Accumulated losses) |
289,486,991 | |||
|
|
|
|||
| Net Assets |
$ | 951,239,855 | ||
|
|
|
|||
| Net Assets |
||||
| Class A |
$ | 492,648,110 | ||
| Class B |
283,981,566 | |||
| Class E |
20,345,458 | |||
| Class G |
154,264,721 | |||
| Capital Shares Outstanding* |
||||
| Class A |
33,185,011 | |||
| Class B |
19,585,707 | |||
| Class E |
1,378,018 | |||
| Class G |
10,729,036 | |||
| Net Asset Value, Offering Price and Redemption Price Per Share |
||||
| Class A |
$ | 14.85 | ||
| Class B |
14.50 | |||
| Class E |
14.76 | |||
| Class G |
14.38 | |||
| * | The Portfolio is authorized to issue an unlimited number of shares. | |||
| (a) | Identified cost of investments was $688,410,348. | |||
| (b) | Includes securities loaned at value of $16,482,446. | |||
| (c) | Identified cost of cash denominated in foreign currencies was $306,337. | |||
Statement of Operations
Year Ended December 31, 2023
| Investment Income |
||||
| Dividends (a) |
$ | 28,884,371 | ||
| Interest |
567,486 | |||
| Securities lending income |
200,713 | |||
|
|
|
|||
| Total investment income |
29,652,570 | |||
| Expenses |
||||
| Management fees |
2,848,883 | |||
| Administration fees |
51,953 | |||
| Custodian and accounting fees |
296,037 | |||
| Distribution and service fees—Class B |
694,875 | |||
| Distribution and service fees—Class E |
30,283 | |||
| Distribution and service fees—Class G |
440,497 | |||
| Audit and tax services |
55,516 | |||
| Legal |
46,603 | |||
| Trustees’ fees and expenses |
46,220 | |||
| Shareholder reporting |
75,267 | |||
| Insurance |
8,769 | |||
| Miscellaneous |
181,457 | |||
|
|
|
|||
| Total expenses |
4,776,360 | |||
| Less management fee waiver |
(22,514 | ) | ||
|
|
|
|||
| Net expenses |
4,753,846 | |||
|
|
|
|||
| Net Investment Income |
24,898,724 | |||
|
|
|
|||
| Net Realized and Unrealized Gain (Loss) |
||||
| Net realized gain (loss) on: |
| |||
| Investments |
14,090,924 | |||
| Futures contracts |
645,222 | |||
| Foreign currency transactions |
(142,358 | ) | ||
|
|
|
|||
| Net realized gain (loss) |
14,593,788 | |||
|
|
|
|||
| Net change in unrealized appreciation (depreciation) on: | ||||
| Investments |
118,169,987 | |||
| Futures contracts |
759,754 | |||
| Foreign currency transactions |
134,232 | |||
|
|
|
|||
| Net change in unrealized appreciation (depreciation) |
119,063,973 | |||
|
|
|
|||
| Net realized and unrealized gain (loss) |
133,657,761 | |||
|
|
|
|||
| Net Increase (Decrease) in Net Assets From Operations |
$ | 158,556,485 | ||
|
|
|
|||
| (a) | Net of foreign withholding taxes of $2,829,004. | |||
See accompanying notes to financial statements.
BHFTII-15
Brighthouse Funds Trust II
MetLife MSCI EAFE Index Portfolio
Statements of Changes in Net Assets
| Year Ended December 31, 2023 |
Year Ended December 31, 2022 |
|||||||
| Increase (Decrease) in Net Assets: |
||||||||
| From Operations |
||||||||
| Net investment income (loss) |
$ | 24,898,724 | $ | 27,369,216 | ||||
| Net realized gain (loss) |
14,593,788 | (2,479,127 | ) | |||||
| Net change in unrealized appreciation (depreciation) |
119,063,973 | (196,121,096 | ) | |||||
|
|
|
|
|
|||||
| Increase (decrease) in net assets from operations |
158,556,485 | (171,231,007 | ) | |||||
|
|
|
|
|
|||||
| From Distributions to Shareholders |
||||||||
| Class A |
(13,370,490 | ) | (33,727,982 | ) | ||||
| Class B |
(6,399,955 | ) | (18,201,803 | ) | ||||
| Class E |
(477,209 | ) | (1,355,293 | ) | ||||
| Class G |
(3,365,808 | ) | (9,230,415 | ) | ||||
|
|
|
|
|
|||||
| Total distributions |
(23,613,462 | ) | (62,515,493 | ) | ||||
|
|
|
|
|
|||||
| Increase (decrease) in net assets from capital share transactions |
(133,323,827 | ) | (32,006,878 | ) | ||||
|
|
|
|
|
|||||
| Total increase (decrease) in net assets |
1,619,196 | (265,753,378 | ) | |||||
| Net Assets |
||||||||
| Beginning of period |
949,620,659 | 1,215,374,037 | ||||||
|
|
|
|
|
|||||
| End of period |
$ | 951,239,855 | $ | 949,620,659 | ||||
|
|
|
|
|
|||||
Other Information:
Capital Shares
Transactions in capital shares were as follows:
| Year Ended December 31, 2023 |
Year Ended December 31, 2022 |
|||||||||||||||
| Shares | Value | Shares | Value | |||||||||||||
| Class A |
||||||||||||||||
| Sales |
1,906,751 | $ | 26,215,882 | 2,149,168 | $ | 26,405,637 | ||||||||||
| Reinvestments |
940,921 | 13,370,490 | 2,746,578 | 33,727,982 | ||||||||||||
| Redemptions |
(8,933,917 | ) | (125,731,851 | ) | (6,135,698 | ) | (83,713,933 | ) | ||||||||
|
|
|
|
|
|
|
|
|
|||||||||
| Net increase (decrease) |
(6,086,245 | ) | $ | (86,145,479 | ) | (1,239,952 | ) | $ | (23,580,314 | ) | ||||||
|
|
|
|
|
|
|
|
|
|||||||||
| Class B |
||||||||||||||||
| Sales |
419,995 | $ | 5,716,368 | 959,199 | $ | 11,583,423 | ||||||||||
| Reinvestments |
460,428 | 6,399,955 | 1,515,554 | 18,201,803 | ||||||||||||
| Redemptions |
(3,341,479 | ) | (45,350,451 | ) | (3,007,156 | ) | (39,805,568 | ) | ||||||||
|
|
|
|
|
|
|
|
|
|||||||||
| Net increase (decrease) |
(2,461,056 | ) | $ | (33,234,128 | ) | (532,403 | ) | $ | (10,020,342 | ) | ||||||
|
|
|
|
|
|
|
|
|
|||||||||
| Class E |
||||||||||||||||
| Sales |
51,411 | $ | 712,542 | 81,108 | $ | 1,030,304 | ||||||||||
| Reinvestments |
33,749 | 477,209 | 110,908 | 1,355,293 | ||||||||||||
| Redemptions |
(345,599 | ) | (4,766,907 | ) | (193,160 | ) | (2,614,362 | ) | ||||||||
|
|
|
|
|
|
|
|
|
|||||||||
| Net increase (decrease) |
(260,439 | ) | $ | (3,577,156 | ) | (1,144 | ) | $ | (228,765 | ) | ||||||
|
|
|
|
|
|
|
|
|
|||||||||
| Class G |
||||||||||||||||
| Sales |
660,996 | $ | 9,010,864 | 916,723 | $ | 11,869,979 | ||||||||||
| Reinvestments |
244,253 | 3,365,808 | 774,364 | 9,230,415 | ||||||||||||
| Redemptions |
(1,686,995 | ) | (22,743,736 | ) | (1,461,455 | ) | (19,277,851 | ) | ||||||||
|
|
|
|
|
|
|
|
|
|||||||||
| Net increase (decrease) |
(781,746 | ) | $ | (10,367,064 | ) | 229,632 | $ | 1,822,543 | ||||||||
|
|
|
|
|
|
|
|
|
|||||||||
| Increase (decrease) derived from capital shares transactions |
$ | (133,323,827 | ) | $ | (32,006,878 | ) | ||||||||||
|
|
|
|
|
|||||||||||||
See accompanying notes to financial statements.
BHFTII-16
Brighthouse Funds Trust II
MetLife MSCI EAFE Index Portfolio
Financial Highlights
| Selected per share data | ||||||||||||||||||||
| Class A | ||||||||||||||||||||
| Year Ended December 31, | ||||||||||||||||||||
| 2023 | 2022 | 2021 | 2020 | 2019 | ||||||||||||||||
| Net Asset Value, Beginning of Period |
$ | 12.90 | $ | 16.17 | $ | 14.86 | $ | 14.32 | $ | 12.16 | ||||||||||
|
|
|
|
|
|
|
|
|
|
|
|||||||||||
| Income (Loss) from Investment Operations |
||||||||||||||||||||
| Net investment income (loss) (a) |
0.39 | 0.38 | 0.40 | 0.27 | 0.40 | |||||||||||||||
| Net realized and unrealized gain (loss) |
1.92 | (2.76 | ) | 1.20 | 0.75 | 2.23 | ||||||||||||||
|
|
|
|
|
|
|
|
|
|
|
|||||||||||
| Total income (loss) from investment operations |
2.31 | (2.38 | ) | 1.60 | 1.02 | 2.63 | ||||||||||||||
|
|
|
|
|
|
|
|
|
|
|
|||||||||||
| Less Distributions |
||||||||||||||||||||
| Distributions from net investment income |
(0.36 | ) | (0.52 | ) | (0.29 | ) | (0.41 | ) | (0.37 | ) | ||||||||||
| Distributions from net realized capital gains |
0.00 | (0.37 | ) | 0.00 | (0.07 | ) | (0.10 | ) | ||||||||||||
|
|
|
|
|
|
|
|
|
|
|
|||||||||||
| Total distributions |
(0.36 | ) | (0.89 | ) | (0.29 | ) | (0.48 | ) | (0.47 | ) | ||||||||||
|
|
|
|
|
|
|
|
|
|
|
|||||||||||
| Net Asset Value, End of Period |
$ | 14.85 | $ | 12.90 | $ | 16.17 | $ | 14.86 | $ | 14.32 | ||||||||||
|
|
|
|
|
|
|
|
|
|
|
|||||||||||
| Total Return (%) (b) |
17.93 | (14.47 | ) | 10.72 | 7.85 | 21.93 | ||||||||||||||
| Ratios/Supplemental Data |
||||||||||||||||||||
| Gross ratio of expenses to average net assets (%) |
0.38 | 0.37 | 0.37 | 0.38 | 0.37 | |||||||||||||||
| Net ratio of expenses to average net assets (%) (c) |
0.38 | 0.37 | 0.37 | 0.38 | 0.37 | |||||||||||||||
| Ratio of net investment income (loss) to average net assets (%) |
2.77 | 2.84 | 2.53 | 2.06 | 2.97 | |||||||||||||||
| Portfolio turnover rate (%) |
13 | 9 | 12 | 18 | 9 | |||||||||||||||
| Net assets, end of period (in millions) |
$ | 492.6 | $ | 506.7 | $ | 655.0 | $ | 622.7 | $ | 591.3 | ||||||||||
| Class B | ||||||||||||||||||||
| Year Ended December 31, | ||||||||||||||||||||
| 2023 | 2022 | 2021 | 2020 | 2019 | ||||||||||||||||
| Net Asset Value, Beginning of Period |
$ | 12.61 | $ | 15.81 | $ | 14.53 | $ | 14.01 | $ | 11.91 | ||||||||||
|
|
|
|
|
|
|
|
|
|
|
|||||||||||
| Income (Loss) from Investment Operations |
||||||||||||||||||||
| Net investment income (loss) (a) |
0.34 | 0.34 | 0.35 | 0.23 | 0.36 | |||||||||||||||
| Net realized and unrealized gain (loss) |
1.87 | (2.69 | ) | 1.18 | 0.74 | 2.17 | ||||||||||||||
|
|
|
|
|
|
|
|
|
|
|
|||||||||||
| Total income (loss) from investment operations |
2.21 | (2.35 | ) | 1.53 | 0.97 | 2.53 | ||||||||||||||
|
|
|
|
|
|
|
|
|
|
|
|||||||||||
| Less Distributions |
||||||||||||||||||||
| Distributions from net investment income |
(0.32 | ) | (0.48 | ) | (0.25 | ) | (0.38 | ) | (0.33 | ) | ||||||||||
| Distributions from net realized capital gains |
0.00 | (0.37 | ) | 0.00 | (0.07 | ) | (0.10 | ) | ||||||||||||
|
|
|
|
|
|
|
|
|
|
|
|||||||||||
| Total distributions |
(0.32 | ) | (0.85 | ) | (0.25 | ) | (0.45 | ) | (0.43 | ) | ||||||||||
|
|
|
|
|
|
|
|
|
|
|
|||||||||||
| Net Asset Value, End of Period |
$ | 14.50 | $ | 12.61 | $ | 15.81 | $ | 14.53 | $ | 14.01 | ||||||||||
|
|
|
|
|
|
|
|
|
|
|
|||||||||||
| Total Return (%) (b) |
17.64 | (14.64 | ) | 10.48 | 7.58 | 21.55 | ||||||||||||||
| Ratios/Supplemental Data |
||||||||||||||||||||
| Gross ratio of expenses to average net assets (%) |
0.63 | 0.62 | 0.62 | 0.63 | 0.62 | |||||||||||||||
| Net ratio of expenses to average net assets (%) (c) |
0.63 | 0.62 | 0.62 | 0.63 | 0.62 | |||||||||||||||
| Ratio of net investment income (loss) to average net assets (%) |
2.47 | 2.59 | 2.28 | 1.82 | 2.74 | |||||||||||||||
| Portfolio turnover rate (%) |
13 | 9 | 12 | 18 | 9 | |||||||||||||||
| Net assets, end of period (in millions) |
$ | 284.0 | $ | 277.9 | $ | 357.0 | $ | 366.2 | $ | 361.6 | ||||||||||
Please see following page for Financial Highlights footnote legend.
See accompanying notes to financial statements.
BHFTII-17
Brighthouse Funds Trust II
MetLife MSCI EAFE Index Portfolio
Financial Highlights
| Selected per share data | ||||||||||||||||||||
| Class E | ||||||||||||||||||||
| Year Ended December 31, | ||||||||||||||||||||
| 2023 | 2022 | 2021 | 2020 | 2019 | ||||||||||||||||
| Net Asset Value, Beginning of Period |
$ | 12.83 | $ | 16.08 | $ | 14.78 | $ | 14.24 | $ | 12.09 | ||||||||||
|
|
|
|
|
|
|
|
|
|
|
|||||||||||
| Income (Loss) from Investment Operations |
||||||||||||||||||||
| Net investment income (loss) (a) |
0.36 | 0.36 | 0.38 | 0.25 | 0.38 | |||||||||||||||
| Net realized and unrealized gain (loss) |
1.90 | (2.75 | ) | 1.18 | 0.75 | 2.21 | ||||||||||||||
|
|
|
|
|
|
|
|
|
|
|
|||||||||||
| Total income (loss) from investment operations |
2.26 | (2.39 | ) | 1.56 | 1.00 | 2.59 | ||||||||||||||
|
|
|
|
|
|
|
|
|
|
|
|||||||||||
| Less Distributions |
||||||||||||||||||||
| Distributions from net investment income |
(0.33 | ) | (0.49 | ) | (0.26 | ) | (0.39 | ) | (0.34 | ) | ||||||||||
| Distributions from net realized capital gains |
0.00 | (0.37 | ) | 0.00 | (0.07 | ) | (0.10 | ) | ||||||||||||
|
|
|
|
|
|
|
|
|
|
|
|||||||||||
| Total distributions |
(0.33 | ) | (0.86 | ) | (0.26 | ) | (0.46 | ) | (0.44 | ) | ||||||||||
|
|
|
|
|
|
|
|
|
|
|
|||||||||||
| Net Asset Value, End of Period |
$ | 14.76 | $ | 12.83 | $ | 16.08 | $ | 14.78 | $ | 14.24 | ||||||||||
|
|
|
|
|
|
|
|
|
|
|
|||||||||||
| Total Return (%) (b) |
17.76 | (14.60 | ) | 10.54 | 7.71 | 21.77 | ||||||||||||||
| Ratios/Supplemental Data |
||||||||||||||||||||
| Gross ratio of expenses to average net assets (%) |
0.53 | 0.52 | 0.52 | 0.53 | 0.52 | |||||||||||||||
| Net ratio of expenses to average net assets (%) (c) |
0.53 | 0.52 | 0.52 | 0.53 | 0.52 | |||||||||||||||
| Ratio of net investment income (loss) to average net assets (%) |
2.57 | 2.69 | 2.38 | 1.92 | 2.85 | |||||||||||||||
| Portfolio turnover rate (%) |
13 | 9 | 12 | 18 | 9 | |||||||||||||||
| Net assets, end of period (in millions) |
$ | 20.3 | $ | 21.0 | $ | 26.4 | $ | 27.1 | $ | 27.2 | ||||||||||
| Class G | ||||||||||||||||||||
| Year Ended December 31, | ||||||||||||||||||||
| 2023 | 2022 | 2021 | 2020 | 2019 | ||||||||||||||||
| Net Asset Value, Beginning of Period |
$ | 12.51 | $ | 15.69 | $ | 14.43 | $ | 13.92 | $ | 11.83 | ||||||||||
|
|
|
|
|
|
|
|
|
|
|
|||||||||||
| Income (Loss) from Investment Operations |
||||||||||||||||||||
| Net investment income (loss) (a) |
0.32 | 0.33 | 0.34 | 0.21 | 0.35 | |||||||||||||||
| Net realized and unrealized gain (loss) |
1.87 | (2.67 | ) | 1.16 | 0.74 | 2.17 | ||||||||||||||
|
|
|
|
|
|
|
|
|
|
|
|||||||||||
| Total income (loss) from investment operations |
2.19 | (2.34 | ) | 1.50 | 0.95 | 2.52 | ||||||||||||||
|
|
|
|
|
|
|
|
|
|
|
|||||||||||
| Less Distributions |
||||||||||||||||||||
| Distributions from net investment income |
(0.32 | ) | (0.47 | ) | (0.24 | ) | (0.37 | ) | (0.33 | ) | ||||||||||
| Distributions from net realized capital gains |
0.00 | (0.37 | ) | 0.00 | (0.07 | ) | (0.10 | ) | ||||||||||||
|
|
|
|
|
|
|
|
|
|
|
|||||||||||
| Total distributions |
(0.32 | ) | (0.84 | ) | (0.24 | ) | (0.44 | ) | (0.43 | ) | ||||||||||
|
|
|
|
|
|
|
|
|
|
|
|||||||||||
| Net Asset Value, End of Period |
$ | 14.38 | $ | 12.51 | $ | 15.69 | $ | 14.43 | $ | 13.92 | ||||||||||
|
|
|
|
|
|
|
|
|
|
|
|||||||||||
| Total Return (%) (b) |
17.58 | (14.66 | ) | 10.35 | 7.52 | 21.58 | ||||||||||||||
| Ratios/Supplemental Data |
||||||||||||||||||||
| Gross ratio of expenses to average net assets (%) |
0.68 | 0.67 | 0.67 | 0.68 | 0.67 | |||||||||||||||
| Net ratio of expenses to average net assets (%) (c) |
0.68 | 0.67 | 0.67 | 0.68 | 0.67 | |||||||||||||||
| Ratio of net investment income (loss) to average net assets (%) |
2.41 | 2.55 | 2.23 | 1.69 | 2.67 | |||||||||||||||
| Portfolio turnover rate (%) |
13 | 9 | 12 | 18 | 9 | |||||||||||||||
| Net assets, end of period (in millions) |
$ | 154.3 | $ | 144.0 | $ | 177.0 | $ | 169.5 | $ | 116.9 | ||||||||||
| (a) | Per share amounts based on average shares outstanding during the period. | |||
| (b) | Total return does not reflect any insurance, sales, separate account or administrative charges of variable annuity or life insurance contracts or any additional expenses that contract owners may bear under their variable contracts. If these charges were included, the returns would be lower. | |||
| (c) | Includes the effects of management fee waivers (see Note 6 of the Notes to Financial Statements). | |||
See accompanying notes to financial statements.
BHFTII-18
Brighthouse Funds Trust II
MetLife MSCI EAFE Index Portfolio
Notes to Financial Statements—December 31, 2023
1. Organization
Brighthouse Funds Trust II (the “Trust”) is organized as a Delaware statutory trust and registered under the Investment Company Act of 1940, as amended (the “1940 Act”), as an open-end management investment company. The Trust, which is managed by Brighthouse Investment Advisers, LLC (“Brighthouse Investment Advisers” or the “Adviser”), currently offers twenty-nine series (the “Portfolios”), each of which operates as a distinct investment vehicle of the Trust. The series included in this report is MetLife MSCI EAFE Index Portfolio (the “Portfolio”), which is diversified. Shares of the Portfolio are not offered directly to the general public and are currently available only to separate accounts of insurance companies, including insurance companies affiliated with the Adviser.
The Portfolio has registered and offers four classes of shares: Class A, B, E and G shares. Shares of each class of the Portfolio represent an equal pro rata interest in the Portfolio and generally give the shareholder the same voting, dividend, liquidation, and other rights. Investment income, realized and unrealized capital gains and losses, the common expenses of the Portfolio, and certain Portfolio-level expense reductions, if any, are allocated on a pro rata basis to each class based on the relative net assets of each class to the net assets of the Portfolio. Each class of shares differs in its respective distribution plan and such distribution expenses are allocated to the corresponding class of shares.
2. Significant Accounting Policies
The preparation of financial statements in conformity with accounting principles generally accepted in the United States of America (“GAAP”) requires management to make estimates and assumptions that affect the reported amounts of assets and liabilities and disclosure of contingent assets and liabilities as of the date of the financial statements and the reported amounts of income and expenses during the reporting period. Actual results could differ from those estimates. In the preparation of these financial statements, management has evaluated events and transactions subsequent to December 31, 2023 through the date the financial statements were issued.
The Portfolio is an investment company and follows the accounting and reporting guidance of the Financial Accounting Standards Board (“FASB”) Accounting Standards Codification Topic 946—Financial Services—Investment Companies. The following is a summary of significant accounting policies consistently followed by the Portfolio in the preparation of its financial statements.
Investment Valuation and Fair Value Measurements - The Portfolio values its investments for purposes of calculating its net asset value (“NAV”) using procedures that allow for a variety of methodologies to be used to value the Portfolio’s investments. The specific methodology used for an investment may vary based on the market data available for a specific investment at the time the Portfolio calculates its NAV or based on other considerations. The procedures also permit a level of judgment to be used in the valuation process.
Domestic and foreign equity securities, such as common stock, exchange-traded funds, rights, warrants, and preferred stock, that are traded on a securities exchange on a valuation date are generally valued at their last quoted sale price or official closing price on the primary exchange for such security, or, if no sales occurred on that day, at the last reported bid price. Equity securities traded over-the-counter (“OTC”) are generally valued at the last reported bid price. In the event of a major exchange closing during the trading day, the Adviser may use other market information obtained from quotation reporting systems, established market makers, or pricing services in valuing the securities. Valuation adjustments may be applied to certain foreign equity securities that are traded solely on foreign exchanges that close before the time as of which the Portfolio determines its NAV to account for the market movement between the close of the foreign exchanges and the time as of which the Portfolio determines its NAV. The Portfolio may use a systematic fair valuation model provided by a pricing service to value securities principally traded in these foreign markets to adjust for possible market movements or other changes that may occur between the close of the foreign exchanges and the time as of which the Portfolio determines its NAV. Foreign equity securities valued using these valuation adjustments are generally categorized as Level 2 within the fair value hierarchy. Equity securities that are actively traded, and have no valuation adjustments applied, are categorized as Level 1 within the fair value hierarchy. Other equity securities traded on inactive markets or valued in reference to similar instruments traded on active markets are generally categorized as Level 2 within the fair value hierarchy.
Investments in registered open-end management investment companies are valued at reported NAV per share on the valuation date and are categorized as Level 1 within the fair value hierarchy.
Debt securities, including corporate, convertible and municipal bonds and notes; obligations of the U.S. Treasury and U.S. government agencies; foreign sovereign issues; and non-U.S. bonds, are generally valued based upon evaluated or composite bid quotations obtained from third-party pricing services and/or brokers and dealers selected by the Adviser (each a “pricing service”). Such pricing services may use matrix pricing, which considers observable inputs including, among other things, issuer details, maturity dates, interest rates, yield curves, rates of prepayment, credit risks/spreads, default rates, reported trades, broker-dealer quotes and quoted prices for similar assets. Short-term obligations with a remaining maturity of sixty days or less may be valued at amortized cost in the absence of market quotes, so long as the amortized cost value of such short-term debt instrument is approximately the same as the fair value of the instrument as determined without the use of amortized cost valuation. Floating rate loans are generally valued based upon
BHFTII-19
Brighthouse Funds Trust II
MetLife MSCI EAFE Index Portfolio
Notes to Financial Statements—December 31, 2023—(Continued)
an evaluated or composite average of aggregate bid and ask quotations supplied by brokers or dealers, as obtained from the pricing service. Securities that use similar valuation techniques and inputs as described above are generally categorized as Level 2 within the fair value hierarchy.
Options, whether on securities, indices, futures contracts, or otherwise, traded on exchanges are valued at the last sale price available as of the close of business on a valuation day or, if there is no such price available, at the last reported bid price. These types of options are categorized as Level 1 within the fair value hierarchy. Futures contracts that are traded on commodity exchanges are valued at their settlement prices established by the exchanges on which they are traded as of the close of such exchanges and are categorized as Level 1 within the fair value hierarchy.
If no current market quotation is readily available or market value quotations are deemed to be unreliable for an investment, the fair value of the investment will be determined in accordance with procedures. A market quotation is readily available only when that quotation is a quoted price (unadjusted) in active markets for identical investments that the Portfolio can access at the measurement date, provided that a quotation will not be readily available if it is not reliable.
Pursuant to Rule 2a-5 under the 1940 Act, the Board of Trustees (the “Board” or “Trustees” ) of the Trust has designated Brighthouse Investment Advisers, acting through its Valuation Committee (“Committee”), as the Portfolio’s “valuation designee” to perform the Portfolio’s fair value determinations. The Board oversees Brighthouse Investment Advisers in its role as the Valuation Designee and receives reports from Brighthouse Investment Advisers regarding its process and the valuation of the Portfolio’s investments to assist with such oversight.
No single standard for determining the fair value of an investment can be set forth because fair value depends upon the facts and circumstances with respect to each investment. Information relating to any relevant factors may be obtained by the Committee from any appropriate source, including the subadviser of the Portfolio, the Custodian, a pricing service, market maker and/or broker for such security or the issuer. Appropriate methodologies for determining fair value under particular circumstances may include: matrix pricing, a discounted cash flow analysis, comparisons of securities with comparable characteristics, value based on multiples of earnings, discount from market price of similar marketable securities, or a combination of these and other methods.
Foreign Currency Translation - The books and records of the Portfolio are maintained in U.S. dollars. The values of securities, currencies, and other assets and liabilities denominated in currencies other than the U.S. dollar are translated into U.S. dollars based upon foreign exchange rates prevailing at the end of the period. Purchases and sales of investment securities, income, and expenses are translated on the respective dates of such transactions. Because the values of investment securities are translated at the foreign exchange rates prevailing at the end of the period, that portion of the results of operations arising from changes in exchange rates and that portion of the results of operations reflecting fluctuations arising from changes in market prices of the investment securities are not separated. Such fluctuations are included in the net realized and unrealized gain or loss on investments.
Net realized foreign exchange gains or losses arise from activity in forward foreign currency exchange contracts, sales of foreign currency, currency gains or losses realized between the trade and settlement dates on securities transactions, and the difference between the amounts of dividends, interest, and foreign withholding taxes recorded by the Portfolio and the U.S. dollar-equivalent of the amounts actually received or paid by the Portfolio. Net unrealized foreign exchange gains and losses arise from changes in the value of assets and liabilities, other than investment securities, resulting from changes in foreign exchange rates.
Investment Transactions and Related Investment Income - Portfolio security transactions are recorded on the trade date. Dividend income is recorded on the ex-dividend date or, for certain foreign securities, when notified. Interest income, which includes amortization of premium and accretion of discount on debt securities, is recorded on the accrual basis. Realized gains and losses on investments are determined on the identified cost basis, which is the same basis used for federal income tax purposes. Foreign income and foreign capital gains on some foreign securities may be subject to foreign taxes, which are accrued as applicable. These foreign taxes have been provided for in accordance with the Portfolio’s understanding of the applicable countries’ tax rules and rates.
In consideration of recent decisions rendered by European courts, the Portfolio has filed tax reclaims for previously withheld taxes on dividends earned in certain European Union (“EU”) countries. These filings are subject to various administrative and judicial proceedings within these countries. During the year ended December 31, 2023, the Portfolio received EU tax reclaim payments in the amount of $159,150 that were not previously accrued for due to uncertainty of collectability. Such amount is included in dividends on the Statement of Operations. No other amounts for additional tax reclaims are reflected in the financial statements due to the uncertainty as to the ultimate resolution of proceedings, the likelihood of receipt of these reclaims, and the potential timing of payment.
Dividends and Distributions to Shareholders - The Portfolio records dividends and distributions on the ex-dividend date. Net realized gains from securities transactions (if any) are generally distributed annually to shareholders. The timing and characterization of certain income and capital gains distributions are determined in accordance with federal tax regulations that may differ from GAAP. Permanent book and tax basis differences relating to shareholder distributions will result in reclassification between distributable earnings (accumulated losses) and paid in surplus. These adjustments have no impact on net assets or the results of operations.
BHFTII-20
Brighthouse Funds Trust II
MetLife MSCI EAFE Index Portfolio
Notes to Financial Statements—December 31, 2023—(Continued)
Income Taxes - It is the Portfolio’s policy to comply with the requirements of the Internal Revenue Code of 1986, as amended, and regulations thereunder, applicable to regulated investment companies, and to distribute, with respect to each taxable year, all of its taxable income to shareholders. Therefore, no federal income tax provision is required. The Portfolio files U.S. federal tax returns. No income tax returns are currently under examination. The Portfolio’s federal tax returns remain subject to examination by the Internal Revenue Service for three fiscal years after the returns are filed. As of December 31, 2023, the Portfolio had no uncertain tax positions that would require financial statement recognition, derecognition or disclosure.
Repurchase Agreements - The Portfolio may enter into repurchase agreements, under the terms of a Master Repurchase Agreement (“MRA”), or Global Master Repurchase Agreement (“GMRA”), with selected commercial banks and broker-dealers, under which the Portfolio acquires securities as collateral and agrees to resell the securities at an agreed-upon time and at an agreed-upon price. The Portfolio, through the Custodian or a subcustodian, under a tri-party repurchase agreement, receives delivery of the underlying securities collateralizing any repurchase agreements. It is the Portfolio’s policy that the market value of the collateral be equal to at least 100% of the repurchase price in the case of a repurchase agreement of one-day duration and equal to at least 102% of the repurchase price in the case of all other repurchase agreements. In the event of default or failure by a party to perform an obligation in connection with any repurchase transaction, the MRA or GMRA gives the non-defaulting party the right to set-off claims and to apply property held by it in connection with any repurchase transaction against obligations owed to it under the agreement.
At December 31, 2023, the Portfolio invested cash collateral for loans of portfolio securities in repurchase agreements with a gross value of $2,772,649, which is included as part of investments at value on the Statement of Assets and Liabilities. The value of the related collateral exceeded the value of the repurchase agreements at December 31, 2023.
Securities Lending - The Portfolio may lend its portfolio securities to certain qualified brokers who borrow securities in order to complete certain securities transactions. By lending its portfolio securities, the Portfolio attempts to increase its net investment income through the receipt of income on collateral held from securities on loan. Any gain or loss in the market price of the loaned securities that might occur, any interest earned, and any dividends declared during the term of the loan, would accrue to the account of the Portfolio.
The Trust has entered into a Non-Custodial Securities Lending Agreement with JPMorgan Chase Bank, N.A. (the “Lending Agent”). Under the agreement, the Lending Agent is authorized to loan portfolio securities on the Portfolio’s behalf. In exchange, the Portfolio generally receives cash, U.S. Government securities, letters of credit, or other collateral deemed appropriate by the Adviser. The Portfolio receives collateral equal to at least 102% of the market value for loans secured by government securities or cash in the same currency as the loaned shares and 105% for all other loaned securities at each loan’s inception. Collateral representing at least 100% of the market value of the loaned securities is maintained for the duration of the loan. Any cash collateral received by the Portfolio is generally invested by the Lending Agent in short-term investments, which may include certificates of deposit, commercial paper, repurchase agreements, including repurchase agreements with respect to equity securities, time deposits, master demand notes and money market funds. The market value of investments made with cash collateral received are disclosed in the Schedule of Investments and the valuation techniques are described in Note 2. The value of the securities on loan may change each business day. If the market value of the collateral at the close of trading on a business day is less than 100% of the market value of the loaned securities at the close of trading on that day, the borrower is required to deliver, by the close of business on the following business day, an additional amount of collateral, so that the total amount of posted collateral is equal to at least 100% of the market value of all the loaned securities as of such preceding day. A portion of the income earned on the collateral is rebated to the borrower of the securities and the remainder is split between the Lending Agent and the Portfolio. On loans collateralized by U.S. government securities, a fee is received from the borrower and is allocated between the Portfolio and the Lending Agent.
Income received by the Portfolio in securities lending transactions during the year ended December 31, 2023 is reflected as securities lending income on the Statement of Operations. The values of any securities loaned by the Portfolio and the related collateral at December 31, 2023 are disclosed in the footnotes to the Schedule of Investments. The value of the related collateral received by the Portfolio exceeded the value of the securities out on loan at December 31, 2023.
The risks associated with lending portfolio securities include, but are not limited to, possible delays in receiving additional collateral or in the recovery of the loaned securities, possible loss of rights in the collateral should the borrower fail financially, as well as risk of loss in the value of the collateral or the value of the investments made with the collateral. To the extent the Portfolio uses cash collateral it receives to invest in repurchase agreements with respect to equity securities, it is subject to the risk of loss if the value of the equity securities declines and the counterparty defaults on its obligation to repurchase such securities. The Lending Agent shall indemnify the Portfolio in the case of default of any securities borrower, subject to the terms of the Non-Custodial Securities Lending Agreement.
BHFTII-21
Brighthouse Funds Trust II
MetLife MSCI EAFE Index Portfolio
Notes to Financial Statements—December 31, 2023—(Continued)
The following table provides a breakdown of transactions accounted for as secured borrowings, the gross obligations by the type of collateral pledged, and the remaining contractual maturities of those transactions.
| Remaining Contractual Maturity of the Agreements As of December 31, 2023 |
||||||||||||||||||||
| Overnight and Continuous |
Up to 30 Days |
31 - 90 Days |
Greater than 90 days |
Total | ||||||||||||||||
| Securities Lending Transactions | ||||||||||||||||||||
| Common Stocks |
$ | (4,290,288 | ) | $ | — | $ | — | $ | — | $ | (4,290,288 | ) | ||||||||
| Mutual Funds |
(3,042,193 | ) | — | — | — | (3,042,193 | ) | |||||||||||||
| Total Borrowings |
$ | (7,332,481 | ) | $ | — | $ | — | $ | — | $ | (7,332,481 | ) | ||||||||
| Gross amount of recognized liabilities for securities lending transactions |
|
$ | (7,332,481 | ) | ||||||||||||||||
|
|
|
|||||||||||||||||||
3. Investments in Derivative Instruments
Futures Contracts - The Portfolio may buy and sell futures contracts as a hedge, to maintain investment exposure to a target asset class or to enhance return. The Portfolio may be subject to fluctuations in equity prices, interest rates, commodity prices, and foreign currency exchange rates in the normal course of pursuing its investment objective. Futures contracts are standardized agreements to buy or sell a security, or deliver a final cash settlement price in connection with an index, interest rate, currency, or other asset. The Portfolio must deposit an amount (“initial margin”) equal to a certain percentage of the face value of the futures contract. The initial margin may be in the form of cash or securities, which is returned when the Portfolio’s obligations under the contract have been satisfied. If cash is deposited as the initial margin, it is shown as cash collateral on the Statement of Assets and Liabilities. Futures contracts are marked-to-market daily and subsequent payments (“variation margin”) are made or received by the Portfolio depending on whether unrealized gains or losses are incurred. These amounts are reflected as receivables or payables on the Statement of Assets and Liabilities and as a component of net change in unrealized appreciation/depreciation on the Statement of Operations. When the contract is closed or expires, the Portfolio records a realized gain or loss equal to the difference between the value of the contract at the time it was opened and the value at the time it was closed. Risks of entering into futures contracts (and related options) include the possibility that the market for these instruments may be illiquid and that a change in the value of the futures contract or option may not correlate perfectly with changes in the value of the underlying asset. The exchange’s clearinghouse, as counterparty to all futures, guarantees the futures contracts against default.
The following table summarizes the fair value of derivatives held by the Portfolio at December 31, 2023 by category of risk exposure:
| Asset Derivatives |
||||||
| Risk Exposure |
Statement of Assets & |
Fair Value |
||||
| Equity |
Unrealized appreciation on futures contracts (a) | $ | 582,079 | |||
|
|
|
|||||
| (a) | Includes cumulative appreciation/depreciation of futures contracts as reported in the Schedule of Investments. Only the current day’s variation margin is reported within the Statement of Assets and Liabilities. | |||
The following tables summarize the effect of derivative instruments on the Statement of Operations, classified by derivative type and category of risk exposure, for the year ended December 31, 2023:
| Statement of Operations Location—Net Realized Gain (Loss) |
Equity | |||
| Futures contracts |
$ | 645,222 | ||
|
|
|
|||
| Statement of Operations Location—Net Change in Unrealized Appreciation (Depreciation) |
Equity | |||
| Futures contracts |
$ | 759,754 | ||
|
|
|
|||
For the year ended December 31, 2023, the average notional par or face amount outstanding for each derivative type was as follows:
| Derivative Description |
Average Notional Par or Face Amount‡ |
|||
| Futures contracts long |
$ | 12,242,978 | ||
| ‡ | Averages are based on activity levels during the period for which the amounts are outstanding. | |||
BHFTII-22
Brighthouse Funds Trust II
MetLife MSCI EAFE Index Portfolio
Notes to Financial Statements—December 31, 2023—(Continued)
4. Certain Risks
In the normal course of business, the Portfolio invests in securities and enters into transactions where risks exist. Those risks include:
Market Risk: The value of securities held by the Portfolio may decline in response to certain events, including those directly involving the issuers whose securities are owned by the Portfolio; conditions affecting the general economy; overall market changes; local, regional or global political, social or economic instability; currency, interest rate, and price fluctuations, or other factors including terrorism, war, natural disasters and the spread of infectious illness including epidemics or pandemics such as the COVID-19 pandemic. These events may also adversely affect the liquidity of securities held by the Portfolio.
Credit and Counterparty Risk: The Portfolio may be exposed to counterparty risk, or the risk that an entity with which the Portfolio has unsettled or open transactions may default. The potential loss could exceed the value of the financial assets and liabilities recorded in the financial statements. Financial assets that potentially expose the Portfolio to credit and counterparty risk consist principally of cash due from counterparties and investments. The Portfolio manages counterparty risk by entering into agreements only with counterparties that it believes have the financial resources to honor their obligations and by monitoring the financial stability of those counterparties. The Subadviser may attempt to mitigate counterparty risk by (i) periodically assessing the creditworthiness of its trading partners, (ii) monitoring and/or limiting the amount of its net exposure to each individual counterparty based on its assessment, and (iii) requiring collateral from the counterparty for certain transactions. In order to preserve certain safeguards for non-standard settlement trades, the Portfolio restricts its exposure to credit and counterparty losses by entering into master netting agreements (“Master Agreements”) with counterparties (approved brokers) with whom it undertakes a significant volume of transactions. Master Agreements govern the terms of certain transactions and reduce the counterparty risk associated with relevant transactions by specifying credit protection mechanisms and providing standardization that improves legal certainty. Master Agreements can also help limit counterparty risk by specifying collateral posting arrangements at pre-arranged exposure levels.
Repurchase and reverse repurchase agreements are primarily executed under GMRAs or MRAs, which provide the right to set-off. Each repurchase and reverse repurchase agreement is initially collateralized at the transaction level. In the event of default, the total market value exposure will be offset against collateral exchanged to date, which would result in a net receivable/(payable) that would be due from/to the counterparty.
Customer Account Agreements and related addenda govern cleared derivatives transactions such as futures, options on futures, and cleared OTC derivatives. Cleared derivative transactions require posting of initial margin as determined by each relevant clearinghouse. The Portfolio’s clearing broker may also require additional initial margin. Clearinghouse-related initial margin is held by the clearinghouse and additional initial margin is held by the Portfolio’s clearing broker. In a cleared derivative transaction, the Portfolio’s counterparty is a clearinghouse rather than a bank or broker. The clearinghouse stands between the buyer and the seller of the contract; therefore, credit risk is limited to failure of or default by the clearinghouse. While offset rights may exist under applicable law, the Portfolio does not have a contractual right of offset against a clearing broker or clearinghouse in the event of a default (including the bankruptcy or insolvency). Additionally, credit risk exists in cleared derivative transactions with respect to initial and variation margin that is held in a clearing broker’s customer accounts. While clearing brokers are required to segregate, by account class, customer margin from their own assets, in the event that a clearing broker becomes insolvent or goes into bankruptcy and at that time there is a shortfall in the aggregate amount of margin held by the clearing broker for all its clients, typically the shortfall would be allocated on a pro-rata basis across all the clearing broker’s customers, for the relevant account class, potentially resulting in losses to the Portfolio. Variation margin, which accounts for changes in market value, is exchanged daily, but may not be netted between futures and cleared OTC derivatives.
Foreign Investment Risk: The investments by the Portfolio in foreign securities, whether direct or indirect, involve risks not present in domestic investments. Because securities may be denominated in foreign currencies, may require settlement in foreign currencies and may pay interest or dividends in foreign currencies, changes in the relationship of these foreign currencies to the U.S. dollar can significantly affect the value of the investments and earnings of the Portfolio. Foreign investments may also subject the Portfolio to foreign government exchange restrictions, expropriation, taxation, unexpected market closures or other political, social or economic developments, such as the imposition of economic sanctions against one or more countries, organizations, entities and/or individuals, all of which could affect the market and/or credit risk of the investments. In addition to the risks described above, risks may arise from forward foreign currency contracts with respect to the potential inability of counterparties to meet the terms of their contracts.
Additional risks associated with each type of investment are described above within the respective security type notes. The Portfolio’s prospectus includes a discussion of the principal risks of investing in the Portfolio.
BHFTII-23
Brighthouse Funds Trust II
MetLife MSCI EAFE Index Portfolio
Notes to Financial Statements—December 31, 2023—(Continued)
5. Investment Transactions
Aggregate cost of purchases and proceeds of sales of investment securities, excluding short-term securities, for the year ended December 31, 2023 were as follows:
| Purchases |
Sales | |||||||||||
| U.S. Government |
Non-U.S. Government | U.S. Government | Non-U.S. Government | |||||||||
| $0 | $ | 124,196,372 | $ | 0 | $ | 258,216,294 | ||||||
6. Investment Management Fees and Other Transactions with Affiliates
Investment Management Agreement - Brighthouse Investment Advisers is the investment adviser to the Portfolio. The Trust has entered into an investment management agreement with Brighthouse Investment Advisers with respect to the Portfolio. For providing investment management services to the Portfolio, Brighthouse Investment Advisers receives monthly compensation at the annual rate of 0.300% of average daily net assets. Fees earned by Brighthouse Investment Advisers with respect to the Portfolio for the year ended December 31, 2023 were $2,848,883.
Brighthouse Investment Advisers has entered into an investment subadvisory agreement with MetLife Investment Management, LLC (“MIM”) with respect to managing the Portfolio. For providing subadvisory services to the Portfolio, Brighthouse Investment Advisers has agreed to pay MIM an investment subadvisory fee for each class of the Portfolio as follows:
| % per annum | Average Daily Net Assets | |||
| 0.050 | % | On the first $500 million | ||
| 0.040 | % | Of the next $500 million | ||
| 0.020 | % | On amounts over $1 billion | ||
Fees earned by MIM with respect to the Portfolio for the year ended December 31, 2023 were $429,719.
Management Fee Waiver - Pursuant to a management fee waiver agreement, the Adviser has agreed, for the period May 1, 2023 to April 30, 2024, to reduce its advisory fees set out above under “Investment Management Agreement” for each class of the Portfolio as follows:
| % per annum reduction | Average Daily Net Assets | |||
| 0.005 | % | Over $500 million and under $1 billion | ||
| 0.010 | % | Of the next $1 billion | ||
| 0.015 | % | On amounts over $2 billion | ||
An identical agreement was in place for the period April 29, 2022 to April 30, 2023. Amounts waived for the year ended December 31, 2023 are shown as a management fee waiver in the Statement of Operations.
Certain officers and trustees of the Trust may also be officers of the Adviser; however, such officers and trustees receive no compensation from the Trust.
Transfer Agency Agreement - Brighthouse Life Insurance Company serves as the transfer agent for the Trust. Brighthouse Life Insurance Company receives no fees for its services to the Trust.
Distribution and Service Fees - The Trust has a distribution agreement with Brighthouse Securities, LLC (the “Distributor”) pursuant to which the Distributor serves as the general distributor of shares of each class (each a “Class”) of each Portfolio. The Distributor is an affiliate of the Trust. The Trust has adopted a Distribution and Services Plan (the “D&S Plan”) relating to Class B, Class D, Class E, Class F and Class G shares of each Portfolio, under Rule 12b-1 under the 1940 Act, pursuant to which the Trust may pay the Distributor a fee (the “Service Fee”) at an annual rate not to exceed 0.25% of each such Portfolio’s average daily net assets attributable to the Class B, Class D, Class E, Class F and Class G shares of the Trust. Each Portfolio may not offer shares of each Class. The D&S Plan also authorizes the Trust, on behalf of each of its Portfolios, to pay to the Distributor a distribution fee (the “Distribution Fee” and together with the Service Fee, the “Fees”) at an annual rate of up to 0.25% of each Portfolio’s average daily net assets attributable to the Class B, Class D, Class E, Class F, and Class G shares in consideration of the services rendered in connection with the sale of such shares by the Distributor. Under the Distribution Agreement with respect to the Trust, Fees are currently paid at an annual rate of 0.25% of average daily net assets in the case of Class B shares, 0.10% of average daily net assets in the case of Class D shares, 0.15% of average daily net assets in the case of Class E shares, 0.20% of average daily net assets in the case of Class F shares and 0.30% of average daily net assets in the case of Class G shares. The D&S Plan is known as a “compensation plan” because the Trust makes payments to the Distributor for services rendered regardless of the actual level of expenditures by the Distributor. Amounts incurred by the Portfolio for the year ended December 31, 2023 are shown as Distribution and service fees in the Statement of Operations.
BHFTII-24
Brighthouse Funds Trust II
MetLife MSCI EAFE Index Portfolio
Notes to Financial Statements—December 31, 2023—(Continued)
Deferred Trustee Compensation - Each Trustee who is not currently an employee of the Adviser or any of its affiliates receives compensation from the Trust for his or her service to the Trust. A deferred compensation plan (the “Plan”) is available to the Trustees on a voluntary basis. Deferred amounts remain in the Trust until distributed in accordance with the provisions of the Plan. The value of a participating Trustee’s deferral account is based on theoretical investments of deferred amounts on the normal payment dates in certain portfolios of the Trust or Brighthouse Funds Trust I, an affiliate of the Trust, as designated by the participating Trustee. Changes in the value of participants’ deferral accounts are reflected as a component of Trustees’ fees and expenses in the Statement of Operations. The portion of the accrued obligations allocated to the Portfolio under the Plan is reflected as Deferred trustees’ fees in the Statement of Assets and Liabilities.
7. Contractual Obligations
Under the Trust’s organizational documents, its officers and Trustees may be indemnified against certain liabilities and expenses arising out of the performance of their duties to the Trust. Additionally, the Trust has a variety of indemnification obligations under contracts with its service providers. The Trust’s maximum exposure under these arrangements is unknown, as this would involve future claims that may be made against the Trust that have not yet occurred.
8. Income Tax Information
The cost basis of investments for federal income tax purposes at December 31, 2023 was as follows:
| Cost basis of investments |
$ | 704,493,028 | ||
|
|
|
|||
| Gross unrealized appreciation |
327,629,969 | |||
| Gross unrealized (depreciation) |
(75,862,705 | ) | ||
|
|
|
|||
| Net unrealized appreciation (depreciation) |
$ | 251,767,264 | ||
|
|
|
The tax character of distributions paid for the years ended December 31, 2023 and 2022 were as follows:
| Ordinary Income |
Long-Term Capital Gain | Total | ||||||||||||||||||
| 2023 |
2022 | 2023 | 2022 | 2023 | 2022 | |||||||||||||||
| $23,613,462 | $ | 38,896,897 | $ | — | $ | 23,618,596 | $ | 23,613,462 | $ | 62,515,493 | ||||||||||
As of December 31, 2023, the components of distributable earnings (accumulated losses) on a federal income tax basis were as follows:
| Undistributed |
Undistributed Long-Term Capital Gain |
Net Unrealized Appreciation (Depreciation) |
Accumulated Capital Losses |
Total | ||||||||||||
| $28,997,442 | $ | 8,724,864 | $ | 251,934,785 | $ | — | $ | 289,657,091 | ||||||||
The Portfolio utilizes the provisions of the federal income tax laws that provide for the carryforward of capital losses for prior years, offsetting such losses against any future realized capital gains. Net capital losses may be carried forward indefinitely and their character is retained as short-term and/or long-term losses.
As of December 31, 2023, the Portfolio had no accumulated capital losses.
During the year ended December 31, 2023, the Portfolio utilized accumulated short-term capital losses of $2,171,029 and long-term capital losses of $867,360.
9. Recent Accounting Pronouncement & Regulatory Updates
In June 2022, FASB issued Accounting Standards Update 2022-03—Fair Value Measurement (Topic 820)—Fair Value Measurement of Equity Securities Subject to Contractual Sale Restrictions (“ASU 2022-03”). ASU 2022-03 clarifies the guidance in Topic 820 to indicate that a contractual sale restriction should not be considered in the fair value of an equity security subject to such a restriction, and requires entities with investments in equity securities subject to contractual sale restrictions to disclose certain qualitative and quantitative information about such securities. ASU 2022-03 is effective for fiscal years, and interim periods within those fiscal years, beginning after December 15, 2023. ASU 2022-03 is only applicable to an equity security in which the contractual arrangement that restricts its sale is executed or modified on or after the adoption date.
Effective January 24, 2023, the Securities and Exchange Commission adopted rule and form amendments that require open-end management investment companies to transmit concise and visually engaging annual and semiannual reports to shareholders that highlight certain information deemed by the SEC to be particularly important for investors. Certain other information, including financial statements, will no longer appear in shareholder reports but will, as required, be available online, delivered free of charge upon request, and filed on a semiannual basis on Form N-CSR. The rule and form amendments have a compliance date of July 24, 2024. Accordingly, the rule and form amendments will not impact the Portfolio until its 2024 semiannual shareholder report.
BHFTII-25
Brighthouse Funds Trust II
MetLife MSCI EAFE Index Portfolio
Report of Independent Registered Public Accounting Firm
To the Board of Trustees of Brighthouse Funds Trust II and Shareholders of the MetLife MSCI EAFE Index Portfolio:
Opinion on the Financial Statements and Financial Highlights
We have audited the accompanying statement of assets and liabilities, including the schedule of investments, of the MetLife MSCI EAFE Index Portfolio (the “Fund”) (one of the funds constituting the Brighthouse Funds Trust II), as of December 31, 2023, the related statement of operations for the year then ended, the statements of changes in net assets for each of the two years in the period then ended, the financial highlights for each of the five years in the period then ended, and the related notes. In our opinion, the financial statements and financial highlights present fairly, in all material respects, the financial position of the Fund as of December 31, 2023, and the results of its operations for the year then ended, the changes in its net assets for each of the two years in the period then ended, and the financial highlights for each of the five years in the period then ended in conformity with accounting principles generally accepted in the United States of America.
Basis for Opinion
These financial statements and financial highlights are the responsibility of the Fund’s management. Our responsibility is to express an opinion on the Fund’s financial statements and financial highlights based on our audits. We are a public accounting firm registered with the Public Company Accounting Oversight Board (United States) (PCAOB) and are required to be independent with respect to the Fund in accordance with the U.S. federal securities laws and the applicable rules and regulations of the Securities and Exchange Commission and the PCAOB.
We conducted our audits in accordance with the standards of the PCAOB. Those standards require that we plan and perform the audit to obtain reasonable assurance about whether the financial statements and financial highlights are free of material misstatement, whether due to error or fraud. The Fund is not required to have, nor were we engaged to perform, an audit of its internal control over financial reporting. As part of our audits we are required to obtain an understanding of internal control over financial reporting but not for the purpose of expressing an opinion on the effectiveness of the Fund’s internal control over financial reporting. Accordingly, we express no such opinion.
Our audits included performing procedures to assess the risks of material misstatement of the financial statements and financial highlights, whether due to error or fraud, and performing procedures that respond to those risks. Such procedures included examining, on a test basis, evidence regarding the amounts and disclosures in the financial statements and financial highlights. Our audits also included evaluating the accounting principles used and significant estimates made by management, as well as evaluating the overall presentation of the financial statements and financial highlights. Our procedures included confirmation of securities owned as of December 31, 2023, by correspondence with the custodian and brokers; when replies were not received from brokers, we performed other auditing procedures. We believe that our audits provide a reasonable basis for our opinion.
/s/ Deloitte & Touche LLP
Boston, Massachusetts
February 23, 2024
We have served as the auditor of one or more Brighthouse investment companies since 1983.
BHFTII-26
Brighthouse Funds Trust II
Trustees and Officers
MANAGEMENT OF THE TRUSTS
The Boards of Trustees (the “Board”) of Brighthouse Funds Trust I and Brighthouse Funds Trust II (“Trust I” and “Trust II”, respectively, and collectively the “Trusts”) supervise the Trusts and are responsible for representing the interests of shareholders. The Trustees, the Chairman of the Board and the Chairmen of each subcommittee are the same for both Trusts. The Trustees of each Trust meet periodically throughout the year to oversee the Portfolios’ activities, reviewing, among other things, each Portfolio’s performance and its contractual arrangements with various service providers. The Trustees of each Trust elect the officers of the Trust, who are responsible for administering the Trust’s day-to-day operations.
Trustees and Officers
The Trustees and executive officers of the Trusts, as well as their ages and their principal occupations during the past five years, are set forth below. Unless otherwise indicated, the business address of each is c/o Brighthouse Funds Trust I and Brighthouse Funds Trust II, 11225 N. Community House Rd., Charolette, North Carolina 28277. Each Trustee who is deemed an “interested person,” as such term is defined in the 1940 Act, is referred to as an “Interested Trustee.” Those Trustees who are not “interested persons,” as such term is defined in the 1940 Act, are referred to as “Independent Trustees.” There is no limit to the term a Trustee may serve, other than pursuant to the retirement policy adopted by the Independent Trustees. Trustees serve until their death, resignation, retirement or removal in accordance with Trust I’s and Trust II’s respective organizational documents and policies adopted by the Board of the Trust from time to time. Officers hold office at the pleasure of each Board and serve until their removal or resignation in accordance with the Trusts’ respective organizational documents and policies adopted by the Board of each Trust from time to time.
Trustees of the Trusts
| Name and Year of Birth |
Position(s) |
Term of Office |
Principal Occupation(s) During the Past |
Number of |
Other Directorships Held | |||||
| Interested Trustee | ||||||||||
| John Rosenthal* (1960) |
Trustee | Indefinite; From May 2016 (Trust I and Trust II) to present | Chief Investment Officer, Brighthouse Financial, Inc. (2016 to present). | 73 | None | |||||
| Independent Trustees | ||||||||||
| Dawn M. Vroegop (1966) |
Trustee and Chair of the Board | Indefinite; From December 2000 (Trust I)/May 2009 (Trust II) to present as Trustee; From May 2016 (Trust I and Trust II) until present as Chair |
Retired; Private Investor. | 73 | Trustee, Driehaus Mutual Funds (8 portfolios).** | |||||
| Stephen M. Alderman (1959) |
Trustee | Indefinite; From December 2000 (Trust I)/April 2012 (Trust II) to present | Vice President and General Counsel, IHR Aerial Solutions, LLC; Until 2022, General Counsel, Illini Hi-Reach, Inc.; Until 2020, Shareholder in the law firm of Garfield & Merel, Ltd. | 73 | None | |||||
| Robert J. Boulware (1956) |
Trustee | Indefinite; From March 2008 (Trust I)/April 2012 (Trust II) to present | Managing Member, Pilgrim Funds, LLC (private equity fund). | 73 | Trustee, Vertical Capital Income Fund (closed-end fund);** Trustee, The Private Shares Fund (closed-end fund);** Until 2021, Director, Mid-Con Energy Partners, LP (energy);** Until 2020, Director, Gainsco, Inc. (auto insurance).** | |||||
BHFTII-27
Brighthouse Funds Trust II
Trustees and Officers—(Continued)
| Name and Year of Birth |
Position(s) |
Term of Office |
Principal Occupation(s) During the Past |
Number of |
Other Directorships Held | |||||
| Susan C. Gause (1952) |
Trustee | Indefinite; From March 2008 (Trust I)/April 2012 (Trust II) to present | Private Investor. | 73 | Trustee, HSBC Funds (4 portfolios).** | |||||
| Nancy Hawthorne (1951) |
Trustee | Indefinite; From May 2003 (Trust II)/April 2012 (Trust I) to present | Private Investor. | 73 | Trustee, First Eagle Credit Opportunities Fund;** Trustee and Chair of the Board of Trustees, First Eagle Global Opportunities Fund;** Director, Avid Technology, Inc;** Director, CRA International, Inc.** | |||||
Executive Officers of the Trusts
| Name and Year of Birth |
Position(s) |
Term of Office |
Principal Occupation(s) | |||
| Kristi Slavin (1973) | President and Chief Executive Officer, of Trust I and Trust II | From May 2016 (Trust I and Trust II) to present |
President, Brighthouse Investment Advisers, LLC (2016-present). | |||
| Alan R. Otis (1971) | Chief Financial Officer and Treasurer, of Trust I and Trust II | From November 2017 (Trust I and Trust II) to present |
Executive Vice President, Brighthouse Investment Advisers, LLC (2017-present); formerly, Vice President, Brighthouse Investment Advisers, LLC (2012-2017); Assistant Treasurer, Trust I and Trust II (2012-2017). | |||
| Thomas Watterson (1985) | Secretary, of Trust I and Trust II | From November 2023 (Trust I and Trust II) to present |
Executive Vice President, Chief Legal Officer and Secretary, Brighthouse Investment Advisers, LLC (2023-Present); Managing Corporate Counsel, Brighthouse Financial Inc. (2023-present); Managing Counsel and Director, The Bank of New York Mellon Corporation (2019-2023); Counsel and Vice President, The Bank of New York Mellon Corporation (2016-2019). | |||
| Katie Hellmann (1980) | Chief Compliance Officer (“CCO”), of Trust I and Trust II | From May 2023 (Trust I and Trust II) to present |
Chief Compliance Officer, Brighthouse Investment Advisers, LLC (2023-present) and Head of Funds and Investments Compliance (2023-present). Deputy Chief Compliance Officer, Transamerica Asset Management (2022-2023). Leader and Senior Compliance Counsel – Funds Compliance, Edward Jones (2017-2022). | |||
| Rosemary Morgan (1983) | Anti-Money Laundering Officer, of Trust I and Trust II | From May 2023 (Trust I and Trust II) to present |
Chief Privacy Officer, Leader of Compliance Programs and Assistant General Counsel, Brighthouse Financial, Inc. (2019-2022); Chief Privacy Officer, Head of Compliance Programs & Contracts Law, Brighthouse Financial, Inc. (2022-2023), Chief Compliance Officer and Associate General Counsel, Brighthouse Financial, Inc. (2023-present); Vice President and Chief Compliance Officer, Brighthouse Life Insurance Company (2023-present); Vice President and Chief Compliance Officer (2023-present), Brighthouse Life Insurance Company of NY; Vice President and Chief Compliance Officer (2023-present), New England Life Insurance Company. | |||
| Anna Koska (1981) | Vice President, of Trust I and Trust II | From June 2022 (Trust I and Trust II) to present |
Vice President, Investment and Advisory Services, Brighthouse Investment Advisers, LLC (2022-present); Director of Investment and Advisory Services, Brighthouse Investment Advisers, LLC (2019-2022); Senior Portfolio Analyst, Brighthouse Investment Advisers, LLC (2017-2019). | |||
| * | Mr. Rosenthal is an “interested person” of the Trusts because of his position with Brighthouse Financial, Inc. (“Brighthouse Financial”), an affiliate of BIA. |
| ** | Indicates a directorship with a registered investment company or a company subject to the reporting requirements of the Securities Exchange Act of 1934, as amended. |
| (1) | Previous positions during the past five years with the Trusts, MetLife, Inc. or the Adviser are omitted if not materially different. |
| (2) | The Fund Complex includes 44 Trust I Portfolios and 29 Trust II Portfolios. |
BHFTII-28
Brighthouse Funds Trust II
MetLife MSCI EAFE Index Portfolio
Board of Trustees’ Consideration of Advisory and Sub-Advisory Agreements
At a meeting held on November 13-14, 2023 (the “November Meeting”), the Boards of Trustees (the “Board”) of Brighthouse Funds Trust I and Brighthouse Funds Trust II (“BFT I” and “BFT II,” respectively, and collectively, the “Trusts”), including a majority of the Trustees who are not “interested persons” of the Trusts (the “Independent Trustees”) under the Investment Company Act of 1940 (the “1940 Act”), approved the continuation of the Trusts’ advisory agreements (each an “Advisory Agreement”) with Brighthouse Investment Advisers, LLC (the “Adviser”) and the applicable sub-advisory and sub-sub-advisory agreements (each a “Sub-Advisory Agreement” and collectively with the Advisory Agreement, the “Agreements”) between the Adviser and the investment sub-advisers and sub-sub-adviser (each a “Sub-Adviser,” and collectively, the “Sub-Advisers”) for the series of the Trusts (each a “Portfolio,” and collectively, the “Portfolios”) for the annual contract renewal period from January 1, 2024 through December 31, 2024.
The Board met with personnel of the Adviser on September 28-29, 2023 (the “September Meeting”) for the specific purpose of giving preliminary consideration to the proposed continuation of the Agreements, including consideration to information that the Adviser and Sub-Advisers had provided for the Board’s review at the request of the Independent Trustees. At the September Meeting, the Adviser reviewed with the Board the performance and fees experienced by each Portfolio, as well as other information. During and after the September Meeting, the Independent Trustees requested additional information and clarifications that the Adviser addressed at the November Meeting (the September Meeting and the November Meeting are referred to collectively as, the “Meetings”). During the contract renewal process, and throughout the year, the Independent Trustees were advised by independent legal counsel, and they met with independent legal counsel in executive sessions outside of the presence of management on a number of occasions to discuss, among other things, the renewal of the Agreements.
In considering the continuation of the Agreements, the Board reviewed a variety of materials that were provided for the specific purpose of assisting the Board in the renewal process, along with various information and materials that were provided to and discussed with the Board throughout the year, at regularly scheduled meetings of the Board and its committees. In particular, information for each Portfolio included, but was not limited to, reports on investment performance, expenses, legal and compliance matters, and asset pricing. Information about the Adviser and each Sub-Adviser included, but was not limited to, reports on the business, operations, and performance of the Adviser and the Sub-Advisers and reports that the Adviser and Sub-Advisers had prepared specifically for the renewal process.
In considering the continuation of the Agreements, the Board also reviewed, among other things, a report for each Portfolio that was prepared by Broadridge (“Broadridge”), an independent organization, which set forth comparative performance and expense information for each Portfolio. In addition, the Independent Trustees reviewed a report that was prepared by JDL Consultants, LLC (“JDL”), an independent consultant to the Independent Trustees, which examined the Broadridge reports for each Portfolio (“JDL Report”). The Independent Trustees met in executive session with representatives of JDL during the September Meeting to review the JDL Report.
At the November Meeting, the Board, including a majority of the Independent Trustees, concluded that the nature, extent, and quality of services provided by the Adviser and each Sub-Adviser supported the renewal of the Agreements. The Board also concluded that the investment services provided to and the performance of each Portfolio was such that each Agreement should continue, and that the fees paid by each Portfolio to the Adviser appeared to be reasonable in light of the nature, extent, and quality of the services provided by the Adviser and each Sub-Adviser. Further, the Board concluded that the Adviser’s profitability in providing services under the Advisory Agreements did not appear unreasonable in light of the nature, extent, and quality of the services provided by the Adviser. The Board reviewed the extent to which the investment advisory fees paid by the Portfolios shared economies of scale with investors or entailed the potential to share economies of scale with investors and concluded that those considerations generally supported the renewal of each Agreement. Finally, the Board considered the Adviser’s recommendation that it approve the renewal of each Sub-Advisory Agreement.
In approving the continuation of each Agreement, the Board, including the Independent Trustees, gave attention to all of the information that was furnished, and each Trustee placed varying degrees of importance on the various pieces of information that were provided to them. The Board evaluated the information provided to it on a Portfolio-by-Portfolio basis, and its decision was made separately with respect to each Portfolio. The following paragraphs provide more information about some of the primary factors that were relevant to the Board’s decisions. The Board did not identify any single factor as determinative, and the Trustees generally attributed different weights to various factors for the various Portfolios.
Nature, extent and quality of services. The Board evaluated the nature, extent, and quality of the services that the Adviser and the Sub-Advisers, as relevant, provided to the Portfolios. The Board considered the Adviser’s services as investment manager to the Portfolios, including its services relating to the hiring and oversight of the Sub-Advisers and, in particular, their investment programs and personnel, succession management of key personnel, trading practices, compliance programs and personnel, and risk management
BHFTII-29
Brighthouse Funds Trust II
MetLife MSCI EAFE Index Portfolio
Board of Trustees’ Consideration of Advisory and Sub-Advisory Agreements—(Continued)
programs, among other things. The Adviser’s services in coordinating and overseeing the activities of the Trusts’ other service providers were also considered. The Board also considered the systems and processes required by the Adviser to meet additional regulatory and compliance requirements resulting from U.S. Securities and Exchange Commission and other regulatory initiatives, including related to liquidity, valuation, and derivatives risk management. The Board considered information received from the Trusts’ Chief Compliance Officer regarding the Portfolios’ compliance policies and procedures that were established pursuant to Rule 38a-l under the 1940 Act, and relevant aspects of the Adviser’s and Sub-Advisers’ compliance policies and procedures. The Board also noted that it was the practice of the Adviser’s investment, compliance, and legal staff to conduct periodic meetings (through various media) with the Sub-Advisers throughout the year in order to review and assess the services that are provided to the Portfolios, and that personnel of the Adviser routinely prepare and present reports to the Board regarding those meetings. In addition, during the Meetings and throughout the year, the Board considered the expertise, experience, and performance of the personnel of the Adviser who performed the various services that are mentioned above.
With respect to the services provided by each of the Sub-Advisers, the Board considered a variety of information that the Adviser and each Sub-Adviser prepared for the Board’s review. The Board considered each Sub-Adviser’s investment process, each Sub-Adviser’s overall organization and business plans and the investment performance experienced by the Portfolio (as described in more detail below). The Board took into account that each Sub-Adviser’s responsibilities include, among other things, the development and maintenance of an investment program for the applicable Portfolio, the selection of investments and the placement of orders for the purchase and sale of such assets, and the implementation of compliance controls related to the performance of these services. The Board considered, based on the information provided, each Sub-Adviser’s staffing with respect to the management of the Portfolio and other information relating to the Sub-Adviser’s business and operations. The Board also considered the Sub-Adviser’s overall resources and information with respect to any recent turnover of key personnel at the Sub-Adviser. The Board reviewed each Sub-Adviser’s investment experience, as well as information provided regarding the Sub-Adviser’s personnel who provide services to the Portfolios. The Board also considered, among other things, information about each Sub-Adviser’s compliance program, including regarding any compliance matters involving a Sub-Adviser that had been brought to the Board’s attention during the year, as well as the Adviser’s assessment of the financial condition of each Sub-Adviser.
Performance. The Board placed emphasis on the performance of each Portfolio in the context of the performance of the relevant markets in which the Portfolio invests. The Board considered the Adviser’s quarterly presentations to the Board of detailed information about each Portfolio’s investment strategies and performance results and composition, including discussions regarding the relevant effects of market conditions. The Board reviewed and considered the reports prepared by Broadridge, which provided a statistical analysis comparing each Portfolio’s investment performance to that of comparable funds underlying variable insurance products (the “Performance Universe”), and the JDL Report. The Board also compared the performance of each Portfolio to that of comparable funds and other accounts that were managed by the relevant Sub-Adviser, to the extent such information was provided. The Board considered each Portfolio’s performance for periods subsequent to the performance period covered by the Broadridge reports and considered the Adviser’s assessment of the same. The Board also noted that while it found the data provided by Broadridge generally useful, it recognized the limitations of such data, including, in particular, that notable differences may exist between a Portfolio and the other funds in a Broadridge category (for example, with respect to investment strategies) and that the results of the performance comparisons may vary depending on (i) the end dates for the performance periods that were selected and (ii) the selection of the peer groups.
The Board focused particular attention on Portfolios with less favorable performance records. The Board noted the Adviser’s focus on each Sub-Adviser’s performance and that the Adviser had been active in monitoring and responding to any performance issues with respect to the Portfolios.
Fees and Expenses. The Board gave consideration to the level and method of computing the fees payable under the Agreements. The Board reviewed and considered the information in the JDL Report concerning fees and expenses. The Board also reviewed and considered the Broadridge report for each Portfolio, which included various comparisons of the Portfolio’s fees (at December 31, 2022 and various asset levels) and expenses with those of its peers, including, as applicable, a broad group of peer funds (“Expense Universe”), a narrower group of peer funds (“Expense Group”), a broad group of peer sub-advised funds (“Sub-advised Expense Universe”), and a narrower group of peer sub-advised funds (“Sub-advised Expense Group”). In particular, the Board reviewed comparisons of each Portfolio’s contractual management fees with its Expense Group and Sub-advised Expense Universe, contractual sub-adviser fees with its Sub-advised Expense Universe and Sub-advised Expense Group, and total expenses with its Expense Universe, Expense Group and Sub-advised Expense Universe. The Board considered that Broadridge selected the peer funds, which were funds underlying variable insurance products that Broadridge deemed to be comparable to the Portfolios. The Board considered that the fee and expense information in the Broadridge report for each Portfolio reflected information as of the Portfolio’s most recent fiscal year
BHFTII-30
Brighthouse Funds Trust II
MetLife MSCI EAFE Index Portfolio
Board of Trustees’ Consideration of Advisory and Sub-Advisory Agreements—(Continued)
end at the time the Broadridge report was issued and that historical asset levels may differ from current asset levels, particularly in a period of market volatility. In addition, the Board compared the fee payable to a Sub-Adviser by the Adviser with respect to the Portfolio to the fee payable to the Sub-Adviser by other comparable funds and other accounts, to the extent such information was provided.
The Board noted that the sub-advisory fees for the Portfolios are negotiated at arm’s length by the Adviser and are paid by the Adviser out of its advisory fees. The Board also considered that the Adviser had entered into expense limitation or management fee waiver agreements with certain of the Portfolios pursuant to which the Adviser had agreed to waive a portion of its advisory fee and/or reimburse certain expenses as a means of limiting a Portfolio’s total annual operating expenses or passing through the benefit of a subadvisory fee concession to a Portfolio, as applicable.
Profitability. The Board examined the profitability to the Adviser of each Advisory Agreement, on a Portfolio-by-Portfolio basis. The Board also considered that an affiliate of the Adviser, Brighthouse Securities, LLC, serves as distributor for the Trusts, and, as such, receives Rule 12b-1 payments to support the distribution of the Portfolios. The Board considered the profitability to the Sub-Advisers and their affiliates of their relationships with the Portfolios, to the extent provided, and the Board considered the ability of the Adviser to negotiate with a Sub-Adviser at arm’s length. In reviewing the profitability information, the Board recognized that expense allocation methodologies are inherently subjective and various methodologies may be reasonable while producing different results.
Economies of scale. The Board considered each Portfolio’s fees in light of its size. The Board noted the fee schedules for the Portfolios that contain breakpoints that reduce the fee rate above specified asset levels, including breakpoints in the Advisory Agreements and any corresponding Sub-Advisory Agreement. The Board noted those Portfolios that did not have breakpoints in their advisory fees and considered management’s explanation of the same.
The Board considered the effective fees under the Advisory Agreement and Sub-Advisory Agreement for each Portfolio as a percentage of assets at different asset levels and possible economies of scale that may be realized if the assets of the Portfolio grow. The Board examined, among other data, the effect of a Portfolio’s growth in size, and reduction in size, on various fee schedules. The Board also generally noted that if a Portfolio’s assets increase over time, the Portfolio may realize economies of scale if assets increase proportionally more than certain other expenses.
Other factors. The Board considered other benefits that may be realized by the Adviser and its affiliates from their relationships with the Trusts. Among the benefits realized by the Adviser, the Board recognized that Brighthouse Securities, LLC, as the distributor for the Trusts, receives payments pursuant to Rule 12b-1 from the Portfolios to help compensate for the provision of shareholder services and distribution activities. The Board considered that a Sub-Adviser may engage in soft dollar transactions in managing a Portfolio. In addition, the Board considered that a Sub-Adviser may be affiliated with registered broker-dealers that may, from time to time, receive brokerage commissions from a Portfolio in connection with the sale of portfolio securities (subject to applicable best execution obligations). The Board also considered that a Sub-Adviser and its affiliates could benefit from the opportunity to provide advisory services to additional portfolios of the Trusts and overall reputational benefits.
The Board considered information from the Adviser and Sub-Advisers pertaining to potential conflicts of interest, and the manner in which any potential conflicts were mitigated. In its review, the Board considered information regarding various business relationships among the Adviser and its affiliates and various Sub-Advisers and their affiliates. The Board also considered information about services and/or payments provided to the Adviser by the Sub-Advisers in connection with marketing activities. The Board considered representations from the Adviser that such business relationships and any payments were not considered in the Adviser’s recommendation to renew any of the Sub-Advisory Agreements.
* * * * *
MetLife MSCI EAFE Index Portfolio. The Board also considered the following information in relation to the Agreements with the Adviser and MetLife Investment Management, LLC regarding the Portfolio:
Among other data relating specifically to the Portfolio’s performance, the Board considered that the Portfolio outperformed the median of its Performance Universe and the average of its Morningstar Category for the one-, three-, and five-year periods ended June 30, 2023. The Board took into account that the Portfolio outperformed its benchmark, the MSCI EAFE Index, for the one-year period ended October 31, 2023 and underperformed its benchmark for the three-and five-year periods ended October 31, 2023, and the Board noted management’s explanation of the tracking error between the Portfolio and the Index. The Board also noted the presence of certain management fee waivers in effect for the Portfolio.
BHFTII-31
Brighthouse Funds Trust II
MetLife MSCI EAFE Index Portfolio
Board of Trustees’ Consideration of Advisory and Sub-Advisory Agreements—(Continued)
The Board also considered that the Portfolio’s actual management fees were above the Expense Group median, the Expense Universe median, and the Sub-advised Expense Universe median. The Board considered that the Portfolio’s total expenses (exclusive of 12b-1 fees) were below the Expense Group median, equal to the Expense Universe median, and above the Sub-advised Expense Universe median. The Board noted that the Portfolio’s contractual management fees were below the asset-weighted average of the Investment Classification/Morningstar Category selected by Broadridge at the Portfolio’s current size. The Board also noted that the Portfolio’s contractual sub-advisory fees were below the averages of the Sub-advised Expense Group and the Sub-advised Expense Universe at the Portfolio’s current size.
BHFTII-32
Brighthouse Funds Trust II
MetLife Russell 2000 Index Portfolio
Managed By MetLife Investment Management, LLC
Portfolio Manager Commentary*
PERFORMANCE
For the twelve months ended December 31, 2023, the Class A, B, E and G shares of the MetLife Russell 2000 Index Portfolio returned 16.80%, 16.51%, 16.65%, and 16.47%, respectively. The Portfolio’s benchmark, the Russell 2000 Index¹, returned 16.93%.
MARKET ENVIRONMENT / CONDITIONS
Equity markets climbed in 2023 on signals that the U.S. Federal Reserve (the “Fed”) would begin cutting interest rates in 2024. Equity investors remained hopeful that the Fed would be able to navigate a soft landing as they slowed the pace of quantitative tightening. Other factors that supported the equity markets included a healthy job market, better than expected macroeconomic data, and strong corporate earnings. Some of the fears that concerned equity investors included rising risks of recession and the effect that high bond yields would have on the economy. In addition, continued high inflation and rising geopolitical risk from the wars in Ukraine and Israel weighed on the equity markets.
During the year, the Federal Open Market Committee (the “FOMC”) met eight times. In December, the FOMC decided to maintain the target range for the Federal Funds Rate at 5.25%-5.50%. The FOMC stated that the growth of economic activity had slowed from its strong pace in the third quarter, and inflation had eased over the past year but remained elevated. The FOMC seeks to achieve maximum employment and inflation at the rate of 2 percent over the long run.
Nine of the eleven sectors comprising the Russell 2000 Index experienced positive returns for the year. Industrials (16.9% beginning weight in the benchmark), up 29.2%, was the best-performing sector and had the largest positive impact on the benchmark return. Technology (10.5% beginning weight), up 27.6%, and Consumer Discretionary (12.4% beginning weight), up 25.7%, were the next best-performing sectors. Utilities (3.9% beginning weight), down 7.3%, and Telecommunications (1.7% beginning weight), down 1.3%, were the worst-performing sectors.
The stocks with the largest positive impact on the benchmark return for the year were ImmunoGen, up 497.8%; MicroStrategy, up 346.2%; and Super Micro Computer, up 246.2%. The stocks with the largest negative impact were Chegg, down 55.0%; Halozyme Therapeutics, down 35.0%; and Patterson-UTI Energy, down 34.2%.
PORTFOLIO REVIEW / PERIOD END POSITIONING
The Portfolio is managed utilizing a stratified sampling strategy versus the Russell 2000 Index (the “Index”). This strategy seeks to replicate the performance of the Index by owning a subset of Index constituents and neutralizing exposures across sectors. The Portfolio is periodically rebalanced for compositional changes in the Russell 2000 Index. Factors that impact tracking error include sampling, transaction costs, cash drag, securities lending, net asset value (“NAV”) rounding, and contributions and withdrawals.
Norman Hu
Mirsad Usejnoski
Portfolio Managers
MetLife Investment Management, LLC
* This commentary may include statements that constitute “forward-looking statements” under the U.S. securities laws. Forward-looking statements include, among other things, projections, estimates, and information about possible or future results related to the Portfolio, market or regulatory developments. The views expressed above are not guarantees of future performance or economic results and involve certain risks, uncertainties and assumptions that could cause actual outcomes and results to differ materially from the views expressed herein. The views expressed above are subject to change at any time based upon economic, market, or other conditions and the subadvisory firm undertakes no obligation to update the views expressed herein. Any discussions of specific securities should not be considered a recommendation to buy or sell those securities. The views expressed above (including any forward-looking statement) may not be relied upon as investment advice or as an indication of the Portfolio’s trading intent. Information about the Portfolio’s holdings, asset allocation or country diversification is historical and is not an indication of future Portfolio composition, which may vary. Direct investment in any index is not possible. The performance of any index mentioned in this commentary has not been adjusted for ongoing management, distribution and operating expenses, and sales charges applicable to mutual fund investments. In addition, the returns do not reflect additional fees charged by separate accounts or variable insurance contracts that an investor in the Portfolio may pay. If these additional fees were reflected, performance would have been lower.
1 The Russell 2000 Index is an unmanaged measure of performance of the 2,000 smallest companies in the Russell 3000 Index.
BHFTII-1
Brighthouse Funds Trust II
MetLife Russell 2000 Index Portfolio
A $10,000 INVESTMENT COMPARED TO THE RUSSELL 2000 INDEX
AVERAGE ANNUAL RETURNS (%) FOR THE YEAR ENDED DECEMBER 31, 2023
| 1 Year | 5 Year | 10 Year | ||||||||||
| MetLife Russell 2000 Index Portfolio | ||||||||||||
| Class A |
16.80 | 9.90 | 7.16 | |||||||||
| Class B |
16.51 | 9.63 | 6.89 | |||||||||
| Class E |
16.65 | 9.74 | 7.00 | |||||||||
|
Class G |
16.47 | 9.57 | 6.84 | |||||||||
| Russell 2000 Index | 16.93 | 9.97 | 7.16 | |||||||||
Portfolio performance is calculated including reinvestment of all income and capital gain distributions. Performance numbers are net of all Portfolio expenses but do not include any insurance, sales, separate account or administrative charges of variable annuity or life insurance contracts or any additional expenses that participants may bear relating to the operations of their plans. If these charges were included, the returns would be lower. The performance of any index referenced above has not been adjusted for ongoing management, distribution and operating expenses, and sales charges applicable to mutual fund investments. Direct investment in any index is not possible. The performance of Class A shares, as set forth in the line graph above, will differ from that of other classes because of the difference in expenses paid by policyholders investing in the different share classes.
This information represents past performance and is not indicative of future results. Investment return and principal value may fluctuate so that shares, upon redemption, may be worth more or less than the original cost.
PORTFOLIO COMPOSITION AS OF DECEMBER 31, 2023
Top Holdings
| % of Net Assets |
||||
| iShares Russell 2000 ETF | 1.5 | |||
| Super Micro Computer, Inc. | 0.5 | |||
| Simpson Manufacturing Co., Inc. | 0.3 | |||
| Cytokinetics, Inc. | 0.3 | |||
| elf Beauty, Inc. | 0.3 | |||
| MicroStrategy, Inc.- Class A | 0.3 | |||
| Light & Wonder, Inc. | 0.3 | |||
| Onto Innovation, Inc. | 0.3 | |||
| Rambus, Inc. | 0.3 | |||
| UFP Industries, Inc. | 0.3 | |||
Top Sectors
| % of Net Assets |
||||
| Financials | 18.0 | |||
| Industrials | 16.4 | |||
| Health Care | 14.8 | |||
| Information Technology | 13.1 | |||
| Consumer Discretionary | 10.6 | |||
| Energy | 6.7 | |||
| Real Estate | 5.9 | |||
| Materials | 4.3 | |||
| Consumer Staples | 3.3 | |||
| Utilities | 2.6 | |||
BHFTII-2
Brighthouse Funds Trust II
MetLife Russell 2000 Index Portfolio
Understanding Your Portfolio’s Expenses
Shareholder Expense Example
As a shareholder of the Portfolio, you incur ongoing costs, including management fees; distribution and service (12b-1) fees; and other Portfolio expenses. This example is intended to help you understand your ongoing costs (in dollars) (referred to as “expenses”) of investing in the Portfolio and compare these costs with the ongoing costs of investing in other mutual funds. The example is based on an investment of $1,000 invested at the beginning of the period and held for the entire period, July 1, 2023 through December 31, 2023.
Actual Expenses
The first line for each share class of the Portfolio in the table below provides information about actual account values and actual expenses. You may use the information in this line, together with the amount you invested in the particular share class of the Portfolio, to estimate the expenses that you paid over the period. Simply divide your account value by $1,000 (for example, an $8,600 account value divided by $1,000 = 8.6), then multiply the result by the number in the first line under the heading entitled “Expenses Paid During Period” to estimate the expenses you paid on your account during this period.
Hypothetical Example for Comparison Purposes
The second line for each share class of the Portfolio in the table below provides information about hypothetical account values and hypothetical expenses based on the Portfolio’s actual expense ratio and an assumed rate of return of 5% per year before expenses, which is not the Portfolio’s actual return. The hypothetical account values and expenses may not be used to estimate the actual ending account balance or expenses you paid for the period. You may use this information to compare the ongoing costs of investing in the Portfolio and other funds. To do so, compare this 5% hypothetical example with the 5% hypothetical examples that appear in the shareholder reports of the other funds.
Please note that the expenses shown in the table are meant to highlight your ongoing costs only and do not reflect any fees or charges of your variable insurance product or any additional expenses that participants in certain eligible qualified plans may bear relating to the operations of their plan. Therefore, the second line for each share class in the table is useful in comparing ongoing costs only, and will not help you determine the relative total costs of owning different funds. In addition, if these other costs were included, your costs would have been higher.
| MetLife Russell 2000 Index Portfolio |
Annualized Expense Ratio |
Beginning Account Value July 1, 2023 |
Ending Account Value December 31, 2023 |
Expenses Paid During Period** July 1, 2023 to December 31, 2023 |
||||||||||||||
| Class A (a) |
Actual | 0.31 | % | $ | 1,000.00 | $ | 1,081.20 | $ | 1.63 | |||||||||
| Hypothetical* | 0.31 | % | $ | 1,000.00 | $ | 1,023.64 | $ | 1.58 | ||||||||||
| Class B (a) |
Actual | 0.56 | % | $ | 1,000.00 | $ | 1,079.30 | $ | 2.93 | |||||||||
| Hypothetical* | 0.56 | % | $ | 1,000.00 | $ | 1,022.38 | $ | 2.85 | ||||||||||
| Class E (a) |
Actual | 0.46 | % | $ | 1,000.00 | $ | 1,080.70 | $ | 2.41 | |||||||||
| Hypothetical* | 0.46 | % | $ | 1,000.00 | $ | 1,022.89 | $ | 2.35 | ||||||||||
| Class G (a) |
Actual | 0.61 | % | $ | 1,000.00 | $ | 1,079.30 | $ | 3.20 | |||||||||
| Hypothetical* | 0.61 | % | $ | 1,000.00 | $ | 1,022.13 | $ | 3.11 | ||||||||||
| * | Hypothetical assumes a rate of return of 5% per year before expenses. |
| ** | Expenses paid are equal to the Portfolio’s annualized expense ratio for the most recent six month period, as shown above, multiplied by the average account value over the period, multiplied by the number of days (184 days) in the most recent fiscal half-year, divided by 365 (to reflect the one-half year period). |
| (a) | The annualized expense ratio shown reflects the impact of the management fee waiver as described in Note 6 of the Notes to Financial Statements. |
BHFTII-3
Brighthouse Funds Trust II
MetLife Russell 2000 Index Portfolio
Schedule of Investments as of December 31, 2023
Common Stocks—96.5% of Net Assets
| Security Description | Shares | Value | ||||||
| Aerospace & Defense—0.8% | ||||||||
| AAR Corp. (a) |
10,986 | $ | 685,526 | |||||
| AeroVironment, Inc. (a) |
8,691 | 1,095,414 | ||||||
| AerSale Corp. (a) |
8,754 | 111,132 | ||||||
| Archer Aviation, Inc. - Class A (a) (b) |
52,219 | 320,625 | ||||||
| Astronics Corp. (a) (b) |
9,068 | 157,964 | ||||||
| Cadre Holdings, Inc. |
6,188 | 203,523 | ||||||
| Ducommun, Inc. (a) |
4,381 | 228,075 | ||||||
| Kaman Corp. |
8,733 | 209,155 | ||||||
| Kratos Defense & Security Solutions, Inc. (a) (b) |
42,530 | 862,934 | ||||||
| Leonardo DRS, Inc. (a) |
23,233 | 465,589 | ||||||
| Moog, Inc. - Class A |
9,540 | 1,381,201 | ||||||
| National Presto Industries, Inc. (b) |
1,752 | 140,651 | ||||||
| Park Aerospace Corp. (b) |
7,125 | 104,737 | ||||||
| Rocket Lab USA, Inc. (a) (b) |
94,124 | 520,506 | ||||||
| Triumph Group, Inc. (a) |
22,281 | 369,419 | ||||||
| V2X, Inc. (a) |
3,920 | 182,045 | ||||||
| Virgin Galactic Holdings, Inc. (a) (b) |
109,517 | 268,317 | ||||||
|
|
|
|||||||
| 7,306,813 | ||||||||
|
|
|
|||||||
| Air Freight & Logistics—0.2% | ||||||||
| Air Transport Services Group, Inc. (a) |
18,490 | 325,609 | ||||||
| Forward Air Corp. |
8,582 | 539,550 | ||||||
| Hub Group, Inc. - Class A (a) |
10,284 | 945,511 | ||||||
| Radiant Logistics, Inc. (a) |
12,471 | 82,808 | ||||||
|
|
|
|||||||
| 1,893,478 | ||||||||
|
|
|
|||||||
| Automobile Components—1.3% | ||||||||
| Adient PLC (a) |
31,676 | 1,151,739 | ||||||
| American Axle & Manufacturing Holdings, Inc. (a) (b) |
38,378 | 338,110 | ||||||
| Atmus Filtration Technologies, Inc. (a) |
5,722 | 134,410 | ||||||
| Cooper-Standard Holdings, Inc. (a) (b) |
5,724 | 111,847 | ||||||
| Dana, Inc. |
43,537 | 636,076 | ||||||
| Dorman Products, Inc. (a) |
9,015 | 751,941 | ||||||
| Fox Factory Holding Corp. (a) |
14,199 | 958,149 | ||||||
| Gentherm, Inc. (a) (b) |
10,812 | 566,116 | ||||||
| Goodyear Tire & Rubber Co. (a) |
92,639 | 1,326,590 | ||||||
| Holley, Inc. (a) (b) |
20,003 | 97,415 | ||||||
| LCI Industries (b) |
8,243 | 1,036,228 | ||||||
| Luminar Technologies, Inc. (a) (b) |
91,895 | 309,686 | ||||||
| Modine Manufacturing Co. (a) (b) |
16,801 | 1,003,020 | ||||||
| Patrick Industries, Inc. (b) |
7,300 | 732,555 | ||||||
| Solid Power, Inc. (a) (b) |
47,374 | 68,692 | ||||||
| Standard Motor Products, Inc. (b) |
6,921 | 275,525 | ||||||
| Stoneridge, Inc. (a) |
9,252 | 181,062 | ||||||
| Visteon Corp. (a) |
9,118 | 1,138,838 | ||||||
| XPEL, Inc. (a) |
7,590 | 408,721 | ||||||
|
|
|
|||||||
| 11,226,720 | ||||||||
|
|
|
|||||||
| Automobiles—0.1% | ||||||||
| Fisker, Inc. (a) (b) |
66,483 | 116,345 | ||||||
| Livewire Group, Inc. (a) (b) |
7,026 | 79,464 | ||||||
| Winnebago Industries, Inc. (b) |
9,506 | 692,798 | ||||||
|
|
|
|||||||
| 888,607 | ||||||||
|
|
|
|||||||
| Banks—9.2% | ||||||||
| 1st Source Corp. (b) |
5,221 | 286,894 | ||||||
| ACNB Corp. (b) |
2,906 | 130,073 | ||||||
| Amalgamated Financial Corp. |
5,989 | 161,344 | ||||||
| Amerant Bancorp, Inc. (b) |
9,340 | 229,484 | ||||||
| American National Bankshares, Inc. (b) |
3,251 | 158,486 | ||||||
| Ameris Bancorp |
22,232 | 1,179,408 | ||||||
| Ames National Corp. (b) |
2,972 | 63,422 | ||||||
| Arrow Financial Corp. (b) |
5,053 | 141,181 | ||||||
| Associated Banc-Corp. |
50,625 | 1,082,869 | ||||||
| Atlantic Union Bankshares Corp. |
24,751 | 904,402 | ||||||
| Axos Financial, Inc. (a) (b) |
18,588 | 1,014,905 | ||||||
| Banc of California, Inc. (b) |
42,539 | 571,299 | ||||||
| BancFirst Corp. (b) |
7,404 | 720,631 | ||||||
| Bancorp, Inc. (a) |
17,068 | 658,142 | ||||||
| Bank First Corp. |
3,147 | 272,719 | ||||||
| Bank of Hawaii Corp. (b) |
13,183 | 955,240 | ||||||
| Bank of Marin Bancorp (b) |
5,192 | 114,328 | ||||||
| Bank of NT Butterfield & Son Ltd. |
16,033 | 513,216 | ||||||
| BankUnited, Inc. (b) |
24,606 | 797,973 | ||||||
| Bankwell Financial Group, Inc. |
1,932 | 58,308 | ||||||
| Banner Corp. |
11,395 | 610,316 | ||||||
| Bar Harbor Bankshares (b) |
5,292 | 155,373 | ||||||
| BayCom Corp. (b) |
4,420 | 104,268 | ||||||
| BCB Bancorp, Inc. (b) |
4,956 | 63,685 | ||||||
| Berkshire Hills Bancorp, Inc. |
14,603 | 362,593 | ||||||
| Blue Foundry Bancorp (a) (b) |
7,608 | 73,569 | ||||||
| Bridgewater Bancshares, Inc. (a) |
6,071 | 82,080 | ||||||
| Brookline Bancorp, Inc. |
30,220 | 329,700 | ||||||
| Burke & Herbert Financial Services Corp. (b) |
2,208 | 138,883 | ||||||
| Business First Bancshares, Inc. (b) |
7,980 | 196,707 | ||||||
| Byline Bancorp, Inc. |
8,821 | 207,823 | ||||||
| C&F Financial Corp. (b) |
1,129 | 76,987 | ||||||
| Cadence Bank |
61,141 | 1,809,162 | ||||||
| Cambridge Bancorp |
2,576 | 178,774 | ||||||
| Camden National Corp. (b) |
4,522 | 170,163 | ||||||
| Capital Bancorp, Inc. |
3,124 | 75,601 | ||||||
| Capital City Bank Group, Inc. |
4,547 | 133,818 | ||||||
| Capitol Federal Financial, Inc. (b) |
43,042 | 277,621 | ||||||
| Capstar Financial Holdings, Inc. |
6,413 | 120,180 | ||||||
| Carter Bankshares, Inc. (a) |
8,108 | 121,377 | ||||||
| Cathay General Bancorp |
23,492 | 1,047,038 | ||||||
| Central Pacific Financial Corp. |
8,161 | 160,608 | ||||||
| Central Valley Community Bancorp (b) |
3,447 | 77,040 | ||||||
| Chemung Financial Corp. |
1,214 | 60,457 | ||||||
| ChoiceOne Financial Services, Inc. (b) |
2,407 | 70,525 | ||||||
| Citizens & Northern Corp. (b) |
4,168 | 93,488 | ||||||
| Citizens Financial Services, Inc. (b) |
1,503 | 97,274 | ||||||
| City Holding Co. (b) |
5,120 | 564,531 | ||||||
| Civista Bancshares, Inc. |
5,230 | 96,441 | ||||||
| CNB Financial Corp. |
6,782 | 153,205 | ||||||
| Coastal Financial Corp. (a) (b) |
3,437 | 152,637 | ||||||
| Codorus Valley Bancorp, Inc. |
3,294 | 84,656 | ||||||
| Colony Bankcorp, Inc. |
5,639 | 74,999 | ||||||
| Columbia Financial, Inc. (a) (b) |
8,867 | 170,956 | ||||||
| Community Bank System, Inc. (b) |
17,926 | 934,124 | ||||||
| Community Trust Bancorp, Inc. |
5,081 | 222,853 | ||||||
| ConnectOne Bancorp, Inc. (b) |
12,128 | 277,852 | ||||||
See accompanying notes to financial statements.
BHFTII-4
Brighthouse Funds Trust II
MetLife Russell 2000 Index Portfolio
Schedule of Investments as of December 31, 2023
Common Stocks—(Continued)
| Security Description | Shares | Value | ||||||
| Banks—(Continued) | ||||||||
| CrossFirst Bankshares, Inc. (a) |
16,519 | $ | 224,328 | |||||
| Customers Bancorp, Inc. (a) |
9,474 | 545,892 | ||||||
| CVB Financial Corp. (b) |
44,953 | 907,601 | ||||||
| Dime Community Bancshares, Inc. |
11,336 | 305,278 | ||||||
| Eagle Bancorp, Inc. |
9,983 | 300,888 | ||||||
| Eastern Bankshares, Inc. |
54,127 | 768,603 | ||||||
| Enterprise Bancorp, Inc. (b) |
3,354 | 108,200 | ||||||
| Enterprise Financial Services Corp. |
12,204 | 544,909 | ||||||
| Equity Bancshares, Inc. - Class A |
4,632 | 157,025 | ||||||
| Esquire Financial Holdings, Inc. |
2,392 | 119,504 | ||||||
| ESSA Bancorp, Inc. (b) |
3,011 | 60,280 | ||||||
| Evans Bancorp, Inc. |
1,818 | 57,322 | ||||||
| Farmers & Merchants Bancorp, Inc. (b) |
4,130 | 102,424 | ||||||
| Farmers National Banc Corp. (b) |
11,007 | 159,051 | ||||||
| FB Financial Corp. |
12,217 | 486,847 | ||||||
| Fidelity D&D Bancorp, Inc. |
1,594 | 92,500 | ||||||
| Financial Institutions, Inc. (b) |
4,838 | 103,049 | ||||||
| First Bancorp |
12,931 | 478,576 | ||||||
| First BanCorp |
57,275 | 942,174 | ||||||
| First Bancorp, Inc. (b) |
3,758 | 106,051 | ||||||
| First Bancshares, Inc. (b) |
10,228 | 299,987 | ||||||
| First Bank |
5,582 | 82,055 | ||||||
| First Busey Corp. |
16,699 | 414,469 | ||||||
| First Business Financial Services, Inc. |
2,763 | 110,796 | ||||||
| First Commonwealth Financial Corp. |
34,297 | 529,546 | ||||||
| First Community Bankshares, Inc. (b) |
5,650 | 209,615 | ||||||
| First Community Corp. (b) |
2,558 | 55,074 | ||||||
| First Financial Bancorp |
31,251 | 742,211 | ||||||
| First Financial Bankshares, Inc. (b) |
43,284 | 1,311,505 | ||||||
| First Financial Corp. |
3,977 | 171,130 | ||||||
| First Foundation, Inc. |
17,120 | 165,722 | ||||||
| First Interstate BancSystem, Inc. - Class A |
27,764 | 853,743 | ||||||
| First Merchants Corp. (b) |
19,730 | 731,588 | ||||||
| First Mid Bancshares, Inc. |
7,438 | 257,801 | ||||||
| First of Long Island Corp. |
7,996 | 105,867 | ||||||
| First Western Financial, Inc. (a) (b) |
2,729 | 54,116 | ||||||
| Five Star Bancorp (b) |
5,331 | 139,566 | ||||||
| Flushing Financial Corp. |
10,410 | 171,557 | ||||||
| FS Bancorp, Inc. |
2,273 | 84,010 | ||||||
| Fulton Financial Corp. (b) |
53,477 | 880,231 | ||||||
| FVCBankcorp, Inc. (a) (b) |
5,163 | 73,315 | ||||||
| German American Bancorp, Inc. (b) |
9,350 | 303,034 | ||||||
| Glacier Bancorp, Inc. (b) |
36,764 | 1,519,088 | ||||||
| Great Southern Bancorp, Inc. (b) |
2,712 | 160,957 | ||||||
| Greene County Bancorp, Inc. (b) |
2,424 | 68,357 | ||||||
| Guaranty Bancshares, Inc. (b) |
2,906 | 97,700 | ||||||
| Hancock Whitney Corp. |
28,838 | 1,401,238 | ||||||
| Hanmi Financial Corp. |
9,877 | 191,614 | ||||||
| HarborOne Bancorp, Inc. |
12,594 | 150,876 | ||||||
| HBT Financial, Inc. |
4,583 | 96,747 | ||||||
| Heartland Financial USA, Inc. |
13,834 | 520,297 | ||||||
| Heritage Commerce Corp. |
20,117 | 199,561 | ||||||
| Heritage Financial Corp. |
12,295 | 262,990 | ||||||
| Hilltop Holdings, Inc. |
15,705 | 552,973 | ||||||
| Hingham Institution For Savings The (b) |
473 | 91,951 | ||||||
| Home Bancorp, Inc. (b) |
2,776 | 116,620 | ||||||
| Home BancShares, Inc. |
63,382 | 1,605,466 | ||||||
| Banks—(Continued) | ||||||||
| HomeStreet, Inc. |
6,159 | 63,438 | ||||||
| HomeTrust Bancshares, Inc. (b) |
5,432 | 146,229 | ||||||
| Hope Bancorp, Inc. |
39,512 | 477,305 | ||||||
| Horizon Bancorp, Inc. |
14,606 | 209,012 | ||||||
| Independent Bank Corp. |
21,792 | 1,140,681 | ||||||
| Independent Bank Group, Inc. |
11,996 | 610,356 | ||||||
| International Bancshares Corp. |
18,077 | 981,943 | ||||||
| John Marshall Bancorp, Inc. (b) |
4,296 | 96,918 | ||||||
| Kearny Financial Corp. (b) |
20,150 | 180,746 | ||||||
| Lakeland Bancorp, Inc. |
21,117 | 312,320 | ||||||
| Lakeland Financial Corp. |
8,350 | 544,086 | ||||||
| LCNB Corp. (b) |
3,649 | 57,545 | ||||||
| Live Oak Bancshares, Inc. (b) |
11,266 | 512,603 | ||||||
| Macatawa Bank Corp. |
9,068 | 102,287 | ||||||
| MainStreet Bancshares, Inc. (b) |
2,403 | 59,618 | ||||||
| Mercantile Bank Corp. |
5,350 | 216,033 | ||||||
| Metrocity Bankshares, Inc. (b) |
5,632 | 135,281 | ||||||
| Metropolitan Bank Holding Corp. (a) (b) |
3,249 | 179,930 | ||||||
| Mid Penn Bancorp, Inc. |
5,091 | 123,609 | ||||||
| Middlefield Banc Corp. |
2,691 | 87,108 | ||||||
| Midland States Bancorp, Inc. |
6,845 | 188,648 | ||||||
| MidWestOne Financial Group, Inc. |
4,795 | 129,033 | ||||||
| MVB Financial Corp. |
3,791 | 85,525 | ||||||
| National Bank Holdings Corp. - Class A (b) |
12,399 | 461,119 | ||||||
| National Bankshares, Inc. (b) |
1,983 | 64,150 | ||||||
| NBT Bancorp, Inc. (b) |
15,340 | 642,899 | ||||||
| Nicolet Bankshares, Inc. (b) |
4,330 | 348,478 | ||||||
| Northeast Bank |
2,320 | 128,041 | ||||||
| Northeast Community Bancorp, Inc. |
4,595 | 81,515 | ||||||
| Northfield Bancorp, Inc. |
12,077 | 151,929 | ||||||
| Northrim BanCorp, Inc. |
1,883 | 107,726 | ||||||
| Northwest Bancshares, Inc. (b) |
42,865 | 534,955 | ||||||
| Norwood Financial Corp. (b) |
2,522 | 82,999 | ||||||
| Oak Valley Bancorp |
2,317 | 69,394 | ||||||
| OceanFirst Financial Corp. |
18,257 | 316,942 | ||||||
| OFG Bancorp |
15,488 | 580,490 | ||||||
| Old National Bancorp |
97,395 | 1,645,002 | ||||||
| Old Second Bancorp, Inc. |
14,378 | 221,996 | ||||||
| Orange County Bancorp, Inc. (b) |
1,834 | 110,480 | ||||||
| Origin Bancorp, Inc. (b) |
9,835 | 349,831 | ||||||
| Orrstown Financial Services, Inc. |
3,982 | 117,469 | ||||||
| Pacific Premier Bancorp, Inc. |
31,429 | 914,898 | ||||||
| Park National Corp. (b) |
4,856 | 645,168 | ||||||
| Parke Bancorp, Inc. (b) |
3,496 | 70,794 | ||||||
| Pathward Financial, Inc. |
8,862 | 469,066 | ||||||
| PCB Bancorp (b) |
4,027 | 74,218 | ||||||
| Peapack-Gladstone Financial Corp. (b) |
6,072 | 181,067 | ||||||
| Penns Woods Bancorp, Inc. |
2,355 | 53,011 | ||||||
| Peoples Bancorp, Inc. |
11,263 | 380,239 | ||||||
| Peoples Financial Services Corp. (b) |
2,533 | 123,357 | ||||||
| Plumas Bancorp |
1,875 | 77,531 | ||||||
| Ponce Financial Group, Inc. (a) |
7,031 | 68,623 | ||||||
| Preferred Bank |
4,191 | 306,153 | ||||||
| Premier Financial Corp. |
11,932 | 287,561 | ||||||
| Primis Financial Corp. (b) |
7,589 | 96,077 | ||||||
| Princeton Bancorp, Inc. (b) |
1,758 | 63,112 | ||||||
| Provident Financial Services, Inc. |
24,532 | 442,312 | ||||||
See accompanying notes to financial statements.
BHFTII-5
Brighthouse Funds Trust II
MetLife Russell 2000 Index Portfolio
Schedule of Investments as of December 31, 2023
Common Stocks—(Continued)
| Security Description | Shares | Value | ||||||
| Banks—(Continued) | ||||||||
| QCR Holdings, Inc. |
5,564 | $ | 324,882 | |||||
| RBB Bancorp (b) |
4,676 | 89,031 | ||||||
| Red River Bancshares, Inc. (b) |
1,618 | 90,786 | ||||||
| Renasant Corp. |
17,894 | 602,670 | ||||||
| Republic Bancorp, Inc. - Class A (b) |
3,075 | 169,617 | ||||||
| S&T Bancorp, Inc. |
12,235 | 408,894 | ||||||
| Sandy Spring Bancorp, Inc. |
15,275 | 416,091 | ||||||
| Seacoast Banking Corp. of Florida |
28,311 | 805,731 | ||||||
| ServisFirst Bancshares, Inc. (b) |
17,117 | 1,140,506 | ||||||
| Shore Bancshares, Inc. |
10,221 | 145,649 | ||||||
| Sierra Bancorp |
3,863 | 87,111 | ||||||
| Simmons First National Corp. - Class A |
40,253 | 798,620 | ||||||
| SmartFinancial, Inc. (b) |
5,462 | 133,764 | ||||||
| South Plains Financial, Inc. |
3,888 | 112,596 | ||||||
| Southern First Bancshares, Inc. (a) |
2,574 | 95,495 | ||||||
| Southern Missouri Bancorp, Inc. (b) |
3,031 | 161,825 | ||||||
| Southern States Bancshares, Inc. |
2,700 | 79,056 | ||||||
| Southside Bancshares, Inc. (b) |
9,274 | 290,462 | ||||||
| SouthState Corp. (b) |
25,549 | 2,157,613 | ||||||
| Stellar Bancorp, Inc. (b) |
15,697 | 437,004 | ||||||
| Sterling Bancorp, Inc. (a) (b) |
7,446 | 42,963 | ||||||
| Stock Yards Bancorp, Inc. (b) |
8,761 | 451,104 | ||||||
| Summit Financial Group, Inc. |
4,198 | 128,837 | ||||||
| Texas Capital Bancshares, Inc. (a) |
16,203 | 1,047,200 | ||||||
| Third Coast Bancshares, Inc. (a) (b) |
4,809 | 95,555 | ||||||
| Timberland Bancorp, Inc. |
2,592 | 81,544 | ||||||
| Tompkins Financial Corp. |
4,590 | 276,456 | ||||||
| Towne Bank |
23,282 | 692,872 | ||||||
| TriCo Bancshares |
10,668 | 458,404 | ||||||
| Triumph Financial, Inc. (a) |
7,535 | 604,156 | ||||||
| TrustCo Bank Corp. |
5,837 | 181,239 | ||||||
| Trustmark Corp. |
20,462 | 570,481 | ||||||
| UMB Financial Corp. |
14,557 | 1,216,237 | ||||||
| United Bankshares, Inc. |
44,009 | 1,652,538 | ||||||
| United Community Banks, Inc. (b) |
38,819 | 1,135,844 | ||||||
| Unity Bancorp, Inc. (b) |
2,408 | 71,253 | ||||||
| Univest Financial Corp. |
9,428 | 207,699 | ||||||
| USCB Financial Holdings, Inc. (a) |
4,023 | 49,282 | ||||||
| Valley National Bancorp (b) |
144,649 | 1,570,888 | ||||||
| Veritex Holdings, Inc. |
17,694 | 411,739 | ||||||
| Virginia National Bankshares Corp. (b) |
1,715 | 58,962 | ||||||
| WaFd, Inc. |
21,024 | 692,951 | ||||||
| Washington Trust Bancorp, Inc. |
5,542 | 179,450 | ||||||
| WesBanco, Inc. |
19,306 | 605,629 | ||||||
| West BanCorp, Inc. (b) |
5,498 | 116,558 | ||||||
| Westamerica BanCorp |
8,792 | 495,957 | ||||||
| WSFS Financial Corp. |
20,665 | 949,143 | ||||||
|
|
|
|||||||
| 80,496,763 | ||||||||
|
|
|
|||||||
| Beverages—0.4% | ||||||||
| Coca-Cola Consolidated, Inc. |
1,600 | 1,485,440 | ||||||
| Duckhorn Portfolio, Inc. (a) |
13,689 | 134,837 | ||||||
| MGP Ingredients, Inc. (b) |
5,324 | 524,520 | ||||||
| National Beverage Corp. (a) (b) |
8,223 | 408,848 | ||||||
| Primo Water Corp. |
51,384 | 773,329 | ||||||
| Beverages—(Continued) | ||||||||
| Vita Coco Co., Inc. (a) (b) |
10,537 | 270,274 | ||||||
|
|
|
|||||||
| 3,597,248 | ||||||||
|
|
|
|||||||
| Biotechnology—7.2% | ||||||||
| 2seventy bio, Inc. (a) |
17,226 | 73,555 | ||||||
| 4D Molecular Therapeutics, Inc. (a) |
13,421 | 271,909 | ||||||
| 89bio, Inc. (a) (b) |
20,747 | 231,744 | ||||||
| ACADIA Pharmaceuticals, Inc. (a) |
40,490 | 1,267,742 | ||||||
| ACELYRIN, Inc. (a) (b) |
11,551 | 86,170 | ||||||
| Actinium Pharmaceuticals, Inc. (a) (b) |
8,804 | 44,724 | ||||||
| ADMA Biologics, Inc. (a) |
70,877 | 320,364 | ||||||
| Aerovate Therapeutics, Inc. (a) |
3,363 | 76,105 | ||||||
| Agenus, Inc. (a) (b) |
115,321 | 95,474 | ||||||
| Agios Pharmaceuticals, Inc. (a) |
18,399 | 409,746 | ||||||
| Akero Therapeutics, Inc. (a) |
17,171 | 400,943 | ||||||
| Aldeyra Therapeutics, Inc. (a) |
15,698 | 55,100 | ||||||
| Alector, Inc. (a) |
20,549 | 163,981 | ||||||
| Alkermes PLC (a) |
55,609 | 1,542,594 | ||||||
| Allakos, Inc. (a) (b) |
22,437 | 61,253 | ||||||
| Allogene Therapeutics, Inc. (a) (b) |
26,931 | 86,449 | ||||||
| Alpine Immune Sciences, Inc. (a) (b) |
10,697 | 203,885 | ||||||
| Altimmune, Inc. (a) (b) |
16,737 | 188,291 | ||||||
| ALX Oncology Holdings, Inc. (a) |
9,262 | 137,911 | ||||||
| Amicus Therapeutics, Inc. (a) |
94,876 | 1,346,290 | ||||||
| AnaptysBio, Inc. (a) |
7,034 | 150,668 | ||||||
| Anavex Life Sciences Corp. (a) (b) |
23,292 | 216,849 | ||||||
| Anika Therapeutics, Inc. (a) |
4,948 | 112,122 | ||||||
| Apogee Therapeutics, Inc. (a) (b) |
6,767 | 189,070 | ||||||
| Arbutus Biopharma Corp. (a) (b) |
38,721 | 96,803 | ||||||
| Arcellx, Inc. (a) (b) |
12,838 | 712,509 | ||||||
| Arcturus Therapeutics Holdings, Inc. (a) |
7,412 | 233,700 | ||||||
| Arcus Biosciences, Inc. (a) |
17,324 | 330,888 | ||||||
| Arcutis Biotherapeutics, Inc. (a) (b) |
27,862 | 89,994 | ||||||
| Ardelyx, Inc. (a) (b) |
77,319 | 479,378 | ||||||
| Arrowhead Pharmaceuticals, Inc. (a) |
34,801 | 1,064,911 | ||||||
| ARS Pharmaceuticals, Inc. (a) (b) |
8,767 | 48,043 | ||||||
| Astria Therapeutics, Inc. (a) (b) |
8,633 | 66,301 | ||||||
| Aura Biosciences, Inc. (a) (b) |
9,525 | 84,392 | ||||||
| Aurinia Pharmaceuticals, Inc. (a) (b) |
46,041 | 413,909 | ||||||
| Avid Bioservices, Inc. (a) (b) |
20,292 | 131,898 | ||||||
| Avidity Biosciences, Inc. (a) |
23,745 | 214,892 | ||||||
| Avita Medical, Inc. (a) (b) |
8,679 | 119,076 | ||||||
| Beam Therapeutics, Inc. (a) (b) |
24,225 | 659,404 | ||||||
| BioCryst Pharmaceuticals, Inc. (a) |
62,014 | 371,464 | ||||||
| Biohaven Ltd. (a) |
22,915 | 980,762 | ||||||
| Biomea Fusion, Inc. (a) (b) |
6,771 | 98,315 | ||||||
| Bluebird Bio, Inc. (a) (b) |
34,986 | 48,281 | ||||||
| Blueprint Medicines Corp. (a) |
20,651 | 1,904,848 | ||||||
| Bridgebio Pharma, Inc. (a) (b) |
38,410 | 1,550,612 | ||||||
| Cabaletta Bio, Inc. (a) |
11,650 | 264,455 | ||||||
| CareDx, Inc. (a) |
17,647 | 211,764 | ||||||
| Caribou Biosciences, Inc. (a) (b) |
25,882 | 148,304 | ||||||
| Catalyst Pharmaceuticals, Inc. (a) (b) |
32,720 | 550,023 | ||||||
| Celcuity, Inc. (a) (b) |
5,835 | 85,016 | ||||||
| Celldex Therapeutics, Inc. (a) (b) |
15,155 | 601,047 | ||||||
See accompanying notes to financial statements.
BHFTII-6
Brighthouse Funds Trust II
MetLife Russell 2000 Index Portfolio
Schedule of Investments as of December 31, 2023
Common Stocks—(Continued)
| Security Description | Shares | Value | ||||||
| Biotechnology—(Continued) | ||||||||
| Cerevel Therapeutics Holdings, Inc. (a) |
23,397 | $ | 992,033 | |||||
| Cogent Biosciences, Inc. (a) (b) |
27,259 | 160,283 | ||||||
| Coherus Biosciences, Inc. (a) (b) |
33,795 | 112,537 | ||||||
| Compass Therapeutics, Inc. (a) |
31,772 | 49,564 | ||||||
| Crinetics Pharmaceuticals, Inc. (a) |
21,639 | 769,916 | ||||||
| Cullinan Oncology, Inc. (a) |
7,747 | 78,942 | ||||||
| Cytokinetics, Inc. (a) (b) |
31,222 | 2,606,725 | ||||||
| Day One Biopharmaceuticals, Inc. (a) (b) |
21,272 | 310,571 | ||||||
| Deciphera Pharmaceuticals, Inc. (a) |
17,465 | 281,710 | ||||||
| Denali Therapeutics, Inc. (a) (b) |
39,602 | 849,859 | ||||||
| Disc Medicine, Inc. (a) |
3,048 | 176,052 | ||||||
| Dynavax Technologies Corp. (a) (b) |
43,478 | 607,822 | ||||||
| Dyne Therapeutics, Inc. (a) (b) |
14,586 | 193,994 | ||||||
| Editas Medicine, Inc. (a) |
27,727 | 280,875 | ||||||
| Emergent BioSolutions, Inc. (a) (b) |
17,598 | 42,235 | ||||||
| Enanta Pharmaceuticals, Inc. (a) |
6,820 | 64,176 | ||||||
| Entrada Therapeutics, Inc. (a) (b) |
7,438 | 112,239 | ||||||
| Erasca, Inc. (a) (b) |
23,988 | 51,094 | ||||||
| Fate Therapeutics, Inc. (a) |
28,366 | 106,089 | ||||||
| Fennec Pharmaceuticals, Inc. (a) |
6,156 | 69,070 | ||||||
| Genelux Corp. (a) (b) |
6,436 | 90,168 | ||||||
| Geron Corp. (a) (b) |
167,062 | 352,501 | ||||||
| Gritstone bio, Inc. (a) (b) |
29,698 | 60,584 | ||||||
| Halozyme Therapeutics, Inc. (a) |
43,382 | 1,603,399 | ||||||
| Heron Therapeutics, Inc. (a) (b) |
32,773 | 55,714 | ||||||
| HilleVax, Inc. (a) (b) |
9,157 | 146,970 | ||||||
| Humacyte, Inc. (a) |
22,468 | 63,809 | ||||||
| Icosavax, Inc. (a) (b) |
9,579 | 150,965 | ||||||
| Ideaya Biosciences, Inc. (a) |
20,121 | 715,905 | ||||||
| Immuneering Corp. - Class A (a) (b) |
7,160 | 52,626 | ||||||
| ImmunityBio, Inc. (a) (b) |
45,051 | 226,156 | ||||||
| ImmunoGen, Inc. (a) |
79,806 | 2,366,248 | ||||||
| Immunovant, Inc. (a) |
18,112 | 763,059 | ||||||
| Inhibrx, Inc. (a) |
11,523 | 437,874 | ||||||
| Inozyme Pharma, Inc. (a) (b) |
16,861 | 71,828 | ||||||
| Insmed, Inc. (a) |
46,084 | 1,428,143 | ||||||
| Intellia Therapeutics, Inc. (a) |
29,573 | 901,681 | ||||||
| Iovance Biotherapeutics, Inc. (a) (b) |
77,033 | 626,278 | ||||||
| Ironwood Pharmaceuticals, Inc. (a) (b) |
44,956 | 514,297 | ||||||
| iTeos Therapeutics, Inc. (a) (b) |
7,999 | 87,589 | ||||||
| Janux Therapeutics, Inc. (a) |
7,592 | 81,462 | ||||||
| KalVista Pharmaceuticals, Inc. (a) (b) |
10,671 | 130,720 | ||||||
| Keros Therapeutics, Inc. (a) |
7,559 | 300,546 | ||||||
| Kiniksa Pharmaceuticals Ltd. - Class A (a) (b) |
11,087 | 194,466 | ||||||
| Krystal Biotech, Inc. (a) |
7,224 | 896,209 | ||||||
| Kura Oncology, Inc. (a) |
23,723 | 341,137 | ||||||
| Kymera Therapeutics, Inc. (a) (b) |
12,984 | 330,573 | ||||||
| Lineage Cell Therapeutics, Inc. (a) (b) |
43,730 | 47,666 | ||||||
| Lyell Immunopharma, Inc. (a) (b) |
59,414 | 115,263 | ||||||
| MacroGenics, Inc. (a) (b) |
21,437 | 206,224 | ||||||
| Madrigal Pharmaceuticals, Inc. (a) (b) |
4,935 | 1,141,860 | ||||||
| MannKind Corp. (a) (b) |
86,216 | 313,826 | ||||||
| MeiraGTx Holdings PLC (a) (b) |
10,435 | 73,254 | ||||||
| Merrimack Pharmaceuticals, Inc. (a) |
3,568 | 47,847 | ||||||
| Mersana Therapeutics, Inc. (a) (b) |
29,899 | 69,366 | ||||||
| MiMedx Group, Inc. (a) |
38,348 | 336,312 | ||||||
| Mineralys Therapeutics, Inc. (a) (b) |
7,262 | 62,453 | ||||||
| Biotechnology—(Continued) | ||||||||
| Mirum Pharmaceuticals, Inc. (a) (b) |
8,984 | 265,208 | ||||||
| Monte Rosa Therapeutics, Inc. (a) |
11,684 | 66,015 | ||||||
| Morphic Holding, Inc. (a) |
12,348 | 356,610 | ||||||
| Myriad Genetics, Inc. (a) |
27,414 | 524,704 | ||||||
| Novavax, Inc. (a) |
29,269 | 140,491 | ||||||
| Nurix Therapeutics, Inc. (a) |
15,059 | 155,409 | ||||||
| Nuvalent, Inc. - Class A (a) (b) |
8,917 | 656,202 | ||||||
| Olema Pharmaceuticals, Inc. (a) |
9,480 | 133,004 | ||||||
| Organogenesis Holdings, Inc. (a) (b) |
24,595 | 100,594 | ||||||
| ORIC Pharmaceuticals, Inc. (a) (b) |
13,189 | 121,339 | ||||||
| Ovid therapeutics, Inc. (a) |
20,173 | 64,957 | ||||||
| PDS Biotechnology Corp. (a) (b) |
9,495 | 47,190 | ||||||
| Poseida Therapeutics, Inc. (a) |
23,094 | 77,596 | ||||||
| Precigen, Inc. (a) (b) |
42,452 | 56,886 | ||||||
| Prime Medicine, Inc. (a) (b) |
13,523 | 119,814 | ||||||
| Protagonist Therapeutics, Inc. (a) |
18,188 | 417,051 | ||||||
| Prothena Corp. PLC (a) |
13,899 | 505,090 | ||||||
| PTC Therapeutics, Inc. (a) |
23,732 | 654,054 | ||||||
| RAPT Therapeutics, Inc. (a) (b) |
10,106 | 251,134 | ||||||
| RayzeBio, Inc. (a) |
6,928 | 430,714 | ||||||
| Recursion Pharmaceuticals, Inc. - Class A (a) (b) |
46,662 | 460,087 | ||||||
| REGENXBIO, Inc. (a) |
14,967 | 268,658 | ||||||
| Relay Therapeutics, Inc. (a) (b) |
28,711 | 316,108 | ||||||
| Replimune Group, Inc. (a) |
16,949 | 142,880 | ||||||
| Revolution Medicines, Inc. (a) (b) |
47,960 | 1,375,493 | ||||||
| Rhythm Pharmaceuticals, Inc. (a) (b) |
17,251 | 793,028 | ||||||
| Rigel Pharmaceuticals, Inc. (a) |
58,974 | 85,512 | ||||||
| Rocket Pharmaceuticals, Inc. (a) (b) |
20,993 | 629,160 | ||||||
| Sage Therapeutics, Inc. (a) |
17,540 | 380,092 | ||||||
| Sana Biotechnology, Inc. (a) (b) |
30,778 | 125,574 | ||||||
| Savara, Inc. (a) |
30,925 | 145,348 | ||||||
| Scholar Rock Holding Corp. (a) |
18,653 | 350,676 | ||||||
| SpringWorks Therapeutics, Inc. (a) (b) |
22,498 | 821,177 | ||||||
| Stoke Therapeutics, Inc. (a) (b) |
9,296 | 48,897 | ||||||
| Summit Therapeutics, Inc. (a) |
40,272 | 105,110 | ||||||
| Sutro Biopharma, Inc. (a) |
18,256 | 78,318 | ||||||
| Syndax Pharmaceuticals, Inc. (a) |
22,105 | 477,689 | ||||||
| Tango Therapeutics, Inc. (a) (b) |
16,583 | 164,172 | ||||||
| TG Therapeutics, Inc. (a) (b) |
45,999 | 785,663 | ||||||
| Travere Therapeutics, Inc. (a) |
24,448 | 219,788 | ||||||
| Twist Bioscience Corp. (a) (b) |
19,106 | 704,247 | ||||||
| Tyra Biosciences, Inc. (a) |
4,942 | 68,447 | ||||||
| UroGen Pharma Ltd. (a) (b) |
9,304 | 139,560 | ||||||
| Vanda Pharmaceuticals, Inc. (a) |
19,612 | 82,763 | ||||||
| Vaxcyte, Inc. (a) |
31,340 | 1,968,152 | ||||||
| Vera Therapeutics, Inc. (a) (b) |
11,588 | 178,223 | ||||||
| Veracyte, Inc. (a) (b) |
24,557 | 675,563 | ||||||
| Vericel Corp. (a) |
16,730 | 595,755 | ||||||
| Verve Therapeutics, Inc. (a) |
17,210 | 239,907 | ||||||
| Viking Therapeutics, Inc. (a) |
32,245 | 600,079 | ||||||
| Vir Biotechnology, Inc. (a) |
28,085 | 282,535 | ||||||
| Viridian Therapeutics, Inc. (a) |
14,165 | 308,514 | ||||||
| Voyager Therapeutics, Inc. (a) |
10,699 | 90,300 | ||||||
| Xencor, Inc. (a) |
19,810 | 420,566 | ||||||
| Y-mAbs Therapeutics, Inc. (a) |
12,818 | 87,419 | ||||||
| Zentalis Pharmaceuticals, Inc. (a) |
19,529 | 295,864 | ||||||
See accompanying notes to financial statements.
BHFTII-7
Brighthouse Funds Trust II
MetLife Russell 2000 Index Portfolio
Schedule of Investments as of December 31, 2023
Common Stocks—(Continued)
| Security Description | Shares | Value | ||||||
| Biotechnology—(Continued) | ||||||||
| Zymeworks, Inc. (a) |
18,380 | $ | 190,968 | |||||
|
|
|
|||||||
| 62,461,046 | ||||||||
|
|
|
|||||||
| Broadline Retail—0.1% | ||||||||
| Big Lots, Inc. |
10,588 | 82,481 | ||||||
| ContextLogic, Inc. - Class A (a) (b) |
8,652 | 51,479 | ||||||
| Dillard’s, Inc. - Class A (b) |
1,105 | 446,033 | ||||||
| Savers Value Village, Inc. (a) |
8,917 | 154,978 | ||||||
|
|
|
|||||||
| 734,971 | ||||||||
|
|
|
|||||||
| Building Products—1.9% | ||||||||
| AAON, Inc. |
22,722 | 1,678,474 | ||||||
| American Woodmark Corp. (a) |
5,524 | 512,903 | ||||||
| Apogee Enterprises, Inc. (b) |
7,504 | 400,789 | ||||||
| AZZ, Inc. |
8,063 | 468,380 | ||||||
| CSW Industrials, Inc. |
5,170 | 1,072,310 | ||||||
| Gibraltar Industries, Inc. (a) |
10,324 | 815,390 | ||||||
| Griffon Corp. |
13,555 | 826,177 | ||||||
| Insteel Industries, Inc. |
5,906 | 226,141 | ||||||
| Janus International Group, Inc. (a) |
28,699 | 374,522 | ||||||
| JELD-WEN Holding, Inc. (a) |
28,116 | 530,830 | ||||||
| Masonite International Corp. (a) |
7,534 | 637,828 | ||||||
| Masterbrand, Inc. (a) |
43,835 | 650,950 | ||||||
| PGT Innovations, Inc. (a) (b) |
19,265 | 784,085 | ||||||
| Quanex Building Products Corp. |
10,969 | 335,322 | ||||||
| Resideo Technologies, Inc. (a) |
48,768 | 917,814 | ||||||
| Simpson Manufacturing Co., Inc. |
14,210 | 2,813,296 | ||||||
| UFP Industries, Inc. |
19,819 | 2,488,275 | ||||||
| Zurn Elkay Water Solutions Corp. - Class C (b) |
49,633 | 1,459,707 | ||||||
|
|
|
|||||||
| 16,993,193 | ||||||||
|
|
|
|||||||
| Capital Markets—1.4% | ||||||||
| AlTi Global, Inc. (a) |
7,628 | 66,821 | ||||||
| Artisan Partners Asset Management, Inc. - Class A (b) |
20,274 | 895,705 | ||||||
| AssetMark Financial Holdings, Inc. (a) |
7,299 | 218,605 | ||||||
| B Riley Financial, Inc. (b) |
6,563 | 137,757 | ||||||
| BGC Group, Inc. - Class A (b) |
119,269 | 861,122 | ||||||
| Brightsphere Investment Group, Inc. |
11,092 | 212,523 | ||||||
| Cohen & Steers, Inc. (b) |
8,580 | 649,763 | ||||||
| Diamond Hill Investment Group, Inc. (b) |
815 | 134,956 | ||||||
| Donnelley Financial Solutions, Inc. (a) |
8,485 | 529,209 | ||||||
| Forge Global Holdings, Inc. (a) |
38,711 | 132,779 | ||||||
| GCM Grosvenor, Inc. - Class A (b) |
15,754 | 141,156 | ||||||
| Hamilton Lane, Inc. - Class A |
12,121 | 1,375,006 | ||||||
| Moelis & Co. - Class A (b) |
22,432 | 1,259,108 | ||||||
| Open Lending Corp. - Class A (a) |
33,748 | 287,196 | ||||||
| P10, Inc. - Class A (b) |
14,767 | 150,919 | ||||||
| Patria Investments Ltd. - Class A (b) |
18,491 | 286,795 | ||||||
| Perella Weinberg Partners (b) |
13,187 | 161,277 | ||||||
| Piper Sandler Cos. |
5,754 | 1,006,202 | ||||||
| PJT Partners, Inc. - Class A (b) |
7,903 | 805,079 | ||||||
| Silvercrest Asset Management Group, Inc. - Class A |
3,311 | 56,287 | ||||||
| StepStone Group, Inc. - Class A |
18,138 | 577,333 | ||||||
| StoneX Group, Inc. (a) |
8,695 | 641,952 | ||||||
| Victory Capital Holdings, Inc. - Class A |
9,416 | 324,287 | ||||||
| Capital Markets—(Continued) | ||||||||
| Virtus Investment Partners, Inc. |
2,293 | 554,356 | ||||||
| WisdomTree, Inc. |
46,043 | 319,078 | ||||||
|
|
|
|||||||
| 11,785,271 | ||||||||
|
|
|
|||||||
| Chemicals—1.8% | ||||||||
| AdvanSix, Inc. |
9,088 | 272,277 | ||||||
| American Vanguard Corp. |
7,328 | 80,388 | ||||||
| Aspen Aerogels, Inc. (a) (b) |
17,010 | 268,418 | ||||||
| Avient Corp. |
30,374 | 1,262,647 | ||||||
| Balchem Corp. |
10,637 | 1,582,254 | ||||||
| Cabot Corp. (b) |
18,488 | 1,543,748 | ||||||
| Core Molding Technologies, Inc. (a) |
2,627 | 48,678 | ||||||
| Ecovyst, Inc. (a) |
31,973 | 312,376 | ||||||
| Hawkins, Inc. |
6,554 | 461,533 | ||||||
| HB Fuller Co. |
17,873 | 1,455,041 | ||||||
| Ingevity Corp. (a) |
11,894 | 561,635 | ||||||
| Innospec, Inc. |
8,439 | 1,040,022 | ||||||
| Intrepid Potash, Inc. (a) (b) |
3,574 | 85,383 | ||||||
| Koppers Holdings, Inc. |
6,870 | 351,881 | ||||||
| Kronos Worldwide, Inc. (b) |
7,992 | 79,440 | ||||||
| Livent Corp. (a) (b) |
60,538 | 1,088,473 | ||||||
| LSB Industries, Inc. (a) |
18,486 | 172,105 | ||||||
| Mativ Holdings, Inc. (b) |
18,543 | 283,893 | ||||||
| Minerals Technologies, Inc. |
11,123 | 793,181 | ||||||
| Orion SA (b) |
18,831 | 522,184 | ||||||
| Perimeter Solutions SA (a) |
53,195 | 244,697 | ||||||
| PureCycle Technologies, Inc. (a) (b) |
39,340 | 159,327 | ||||||
| Quaker Chemical Corp. |
4,562 | 973,622 | ||||||
| Rayonier Advanced Materials, Inc. (a) |
21,520 | 87,156 | ||||||
| Sensient Technologies Corp. |
13,890 | 916,740 | ||||||
| Stepan Co. |
7,227 | 683,313 | ||||||
| Trinseo PLC |
12,474 | 104,407 | ||||||
| Tronox Holdings PLC (b) |
37,491 | 530,873 | ||||||
|
|
|
|||||||
| 15,965,692 | ||||||||
|
|
|
|||||||
| Commercial Services & Supplies—1.5% | ||||||||
| ABM Industries, Inc. |
22,236 | 996,840 | ||||||
| ACCO Brands Corp. |
30,953 | 188,194 | ||||||
| ACV Auctions, Inc. - Class A (a) (b) |
42,821 | 648,738 | ||||||
| Aris Water Solutions, Inc. - Class A |
10,439 | 87,583 | ||||||
| BrightView Holdings, Inc. (a) |
13,931 | 117,299 | ||||||
| Brink’s Co. |
15,273 | 1,343,260 | ||||||
| Casella Waste Systems, Inc. - Class A (a) (b) |
18,858 | 1,611,605 | ||||||
| CECO Environmental Corp. (a) |
9,985 | 202,496 | ||||||
| Cimpress PLC (a) |
6,001 | 480,380 | ||||||
| CoreCivic, Inc. (a) (b) |
37,336 | 542,492 | ||||||
| Deluxe Corp. (b) |
14,396 | 308,794 | ||||||
| Ennis, Inc. |
9,011 | 197,431 | ||||||
| Enviri Corp. (a) (b) |
26,422 | 237,798 | ||||||
| GEO Group, Inc. (a) (b) |
40,071 | 433,969 | ||||||
| Healthcare Services Group, Inc. (a) |
24,352 | 252,530 | ||||||
| HNI Corp. |
15,255 | 638,117 | ||||||
| Interface, Inc. |
19,325 | 243,882 | ||||||
| Liquidity Services, Inc. (a) |
7,856 | 135,202 | ||||||
| Matthews International Corp. - Class A |
9,973 | 365,510 | ||||||
| MillerKnoll, Inc. |
24,387 | 650,645 | ||||||
See accompanying notes to financial statements.
BHFTII-8
Brighthouse Funds Trust II
MetLife Russell 2000 Index Portfolio
Schedule of Investments as of December 31, 2023
Common Stocks—(Continued)
| Security Description | Shares | Value | ||||||
| Commercial Services & Supplies—(Continued) | ||||||||
| Montrose Environmental Group, Inc. (a) |
9,033 | $ | 290,230 | |||||
| OPENLANE, Inc. (a) (b) |
36,524 | 540,920 | ||||||
| Performant Financial Corp. (a) (b) |
22,685 | 70,891 | ||||||
| Pitney Bowes, Inc. (b) |
58,239 | 256,252 | ||||||
| Quad/Graphics, Inc. (a) |
10,673 | 57,848 | ||||||
| SP Plus Corp. (a) |
6,829 | 349,986 | ||||||
| Steelcase, Inc. - Class A |
29,276 | 395,812 | ||||||
| UniFirst Corp. |
5,018 | 917,842 | ||||||
| Viad Corp. (a) |
6,618 | 239,572 | ||||||
| VSE Corp. (b) |
4,282 | 276,660 | ||||||
|
|
|
|||||||
| 13,078,778 | ||||||||
|
|
|
|||||||
| Communications Equipment—0.6% | ||||||||
| ADTRAN Holdings, Inc. |
25,898 | 190,091 | ||||||
| Aviat Networks, Inc. (a) |
3,608 | 117,837 | ||||||
| Calix, Inc. (a) |
19,781 | 864,232 | ||||||
| Clearfield, Inc. (a) (b) |
4,399 | 127,923 | ||||||
| CommScope Holding Co., Inc. (a) |
69,077 | 194,797 | ||||||
| Comtech Telecommunications Corp. |
9,651 | 81,358 | ||||||
| Digi International, Inc. (a) |
11,390 | 296,140 | ||||||
| Extreme Networks, Inc. (a) |
43,045 | 759,314 | ||||||
| Harmonic, Inc. (a) (b) |
36,946 | 481,776 | ||||||
| Infinera Corp. (a) (b) |
62,963 | 299,074 | ||||||
| NETGEAR, Inc. (a) |
10,251 | 149,460 | ||||||
| NetScout Systems, Inc. (a) |
22,412 | 491,943 | ||||||
| Ribbon Communications, Inc. (a) |
24,571 | 71,256 | ||||||
| Viavi Solutions, Inc. (a) |
73,717 | 742,330 | ||||||
|
|
|
|||||||
| 4,867,531 | ||||||||
|
|
|
|||||||
| Construction & Engineering—1.6% | ||||||||
| Ameresco, Inc. - Class A (a) (b) |
10,710 | 339,186 | ||||||
| API Group Corp. (a) |
70,149 | 2,427,156 | ||||||
| Arcosa, Inc. |
16,119 | 1,332,074 | ||||||
| Argan, Inc. |
4,530 | 211,959 | ||||||
| Bowman Consulting Group Ltd. (a) |
3,487 | 123,858 | ||||||
| Comfort Systems USA, Inc. |
11,863 | 2,439,863 | ||||||
| Concrete Pumping Holdings, Inc. (a) |
8,982 | 73,652 | ||||||
| Construction Partners, Inc. - Class A (a) |
13,715 | 596,877 | ||||||
| Dycom Industries, Inc. (a) (b) |
9,366 | 1,077,933 | ||||||
| Fluor Corp. (a) |
47,959 | 1,878,554 | ||||||
| Granite Construction, Inc. (b) |
14,748 | 750,083 | ||||||
| Great Lakes Dredge & Dock Corp. (a) |
21,996 | 168,929 | ||||||
| IES Holdings, Inc. (a) |
2,867 | 227,124 | ||||||
| Limbach Holdings, Inc. (a) |
3,105 | 141,184 | ||||||
| MYR Group, Inc. (a) |
5,521 | 798,502 | ||||||
| Northwest Pipe Co. (a) |
3,497 | 105,819 | ||||||
| Primoris Services Corp. |
17,171 | 570,249 | ||||||
| Sterling Infrastructure, Inc. (a) |
9,847 | 865,847 | ||||||
| Tutor Perini Corp. (a) (b) |
14,544 | 132,351 | ||||||
|
|
|
|||||||
| 14,261,200 | ||||||||
|
|
|
|||||||
| Construction Materials—0.3% | ||||||||
| Knife River Corp. (a) |
18,996 | 1,257,156 | ||||||
| Summit Materials, Inc. - Class A (a) |
40,081 | 1,541,515 | ||||||
| Construction Materials—(Continued) | ||||||||
| U.S. Lime & Minerals, Inc. (b) |
743 | 171,150 | ||||||
|
|
|
|||||||
| 2,969,821 | ||||||||
|
|
|
|||||||
| Consumer Finance—0.8% | ||||||||
| Atlanticus Holdings Corp. (a) (b) |
1,591 | 61,524 | ||||||
| Bread Financial Holdings, Inc. |
16,854 | 555,171 | ||||||
| Encore Capital Group, Inc. (a) |
7,642 | 387,831 | ||||||
| Enova International, Inc. (a) |
10,006 | 553,932 | ||||||
| FirstCash Holdings, Inc. |
12,699 | 1,376,445 | ||||||
| Green Dot Corp. - Class A (a) |
15,976 | 158,162 | ||||||
| LendingClub Corp. (a) |
34,752 | 303,732 | ||||||
| LendingTree, Inc. (a) |
2,891 | 87,655 | ||||||
| Navient Corp. |
28,893 | 537,988 | ||||||
| Nelnet, Inc. - Class A |
4,303 | 379,611 | ||||||
| NerdWallet, Inc. - Class A (a) (b) |
11,864 | 174,638 | ||||||
| PRA Group, Inc. (a) |
12,838 | 336,356 | ||||||
| PROG Holdings, Inc. (a) (b) |
14,229 | 439,818 | ||||||
| Regional Management Corp. |
3,196 | 80,156 | ||||||
| Upstart Holdings, Inc. (a) (b) |
24,285 | 992,285 | ||||||
| World Acceptance Corp. (a) (b) |
1,225 | 159,899 | ||||||
|
|
|
|||||||
| 6,585,203 | ||||||||
|
|
|
|||||||
| Consumer Staples Distribution & Retail—0.5% | ||||||||
| Andersons, Inc. |
10,418 | 599,452 | ||||||
| Chefs’ Warehouse, Inc. (a) (b) |
11,522 | 339,092 | ||||||
| HF Foods Group, Inc. (a) (b) |
13,686 | 73,083 | ||||||
| Ingles Markets, Inc. - Class A |
4,911 | 424,163 | ||||||
| Natural Grocers by Vitamin Cottage, Inc. |
3,115 | 49,840 | ||||||
| PriceSmart, Inc. |
8,107 | 614,348 | ||||||
| SpartanNash Co. (b) |
10,739 | 246,460 | ||||||
| Sprouts Farmers Market, Inc. (a) (b) |
33,660 | 1,619,383 | ||||||
| United Natural Foods, Inc. (a) |
20,059 | 325,558 | ||||||
| Village Super Market, Inc. - Class A (b) |
2,910 | 76,329 | ||||||
| Weis Markets, Inc. (b) |
5,704 | 364,828 | ||||||
|
|
|
|||||||
| 4,732,536 | ||||||||
|
|
|
|||||||
| Containers & Packaging—0.3% | ||||||||
| Greif, Inc. - Class A (b) |
8,109 | 531,869 | ||||||
| Greif, Inc. - Class B |
1,893 | 124,957 | ||||||
| Myers Industries, Inc. |
11,721 | 229,146 | ||||||
| O-I Glass, Inc. (a) (b) |
51,220 | 838,984 | ||||||
| Pactiv Evergreen, Inc. |
13,836 | 189,692 | ||||||
| Ranpak Holdings Corp. (a) |
12,914 | 75,159 | ||||||
| TriMas Corp. (b) |
14,122 | 357,710 | ||||||
|
|
|
|||||||
| 2,347,517 | ||||||||
|
|
|
|||||||
| Distributors—0.0% | ||||||||
| Weyco Group, Inc. |
2,058 | 64,539 | ||||||
|
|
|
|||||||
| Diversified Consumer Services—1.2% | ||||||||
| Adtalem Global Education, Inc. (a) |
13,250 | 781,087 | ||||||
| Carriage Services, Inc. |
4,082 | 102,091 | ||||||
| Chegg, Inc. (a) |
37,722 | 428,522 | ||||||
| Coursera, Inc. (a) (b) |
43,951 | 851,331 | ||||||
| Duolingo, Inc. (a) |
9,754 | 2,212,695 | ||||||
See accompanying notes to financial statements.
BHFTII-9
Brighthouse Funds Trust II
MetLife Russell 2000 Index Portfolio
Schedule of Investments as of December 31, 2023
Common Stocks—(Continued)
| Security Description | Shares | Value | ||||||
| Diversified Consumer Services—(Continued) | ||||||||
| European Wax Center, Inc. - Class A (a) (b) |
11,678 | $ | 158,704 | |||||
| Frontdoor, Inc. (a) |
26,761 | 942,522 | ||||||
| Graham Holdings Co. - Class B |
1,196 | 833,038 | ||||||
| Laureate Education, Inc. |
43,993 | 603,144 | ||||||
| Lincoln Educational Services Corp. (a) |
8,074 | 81,063 | ||||||
| Nerdy, Inc. (a) |
20,830 | 71,447 | ||||||
| OneSpaWorld Holdings Ltd. (a) |
27,979 | 394,504 | ||||||
| Perdoceo Education Corp. |
21,331 | 374,572 | ||||||
| Rover Group, Inc. (a) |
34,168 | 371,748 | ||||||
| Strategic Education, Inc. |
7,318 | 675,964 | ||||||
| Stride, Inc. (a) |
14,188 | 842,342 | ||||||
| Udemy, Inc. (a) (b) |
29,152 | 429,409 | ||||||
| Universal Technical Institute, Inc. (a) |
11,334 | 141,902 | ||||||
| WW International, Inc. (a) |
18,762 | 164,167 | ||||||
|
|
|
|||||||
| 10,460,252 | ||||||||
|
|
|
|||||||
| Diversified REITs—0.6% | ||||||||
| Alexander & Baldwin, Inc. |
23,869 | 453,988 | ||||||
| Alpine Income Property Trust, Inc. (b) |
4,463 | 75,469 | ||||||
| American Assets Trust, Inc. |
15,450 | 347,780 | ||||||
| Armada Hoffler Properties, Inc. |
22,515 | 278,511 | ||||||
| Broadstone Net Lease, Inc. |
63,286 | 1,089,785 | ||||||
| CTO Realty Growth, Inc. |
7,674 | 132,990 | ||||||
| Empire State Realty Trust, Inc. - Class A (b) |
44,942 | 435,488 | ||||||
| Essential Properties Realty Trust, Inc. (b) |
52,120 | 1,332,187 | ||||||
| Gladstone Commercial Corp. (b) |
13,245 | 175,364 | ||||||
| Global Net Lease, Inc. (b) |
64,704 | 643,805 | ||||||
| NexPoint Diversified Real Estate Trust |
10,966 | 87,180 | ||||||
| One Liberty Properties, Inc. (b) |
5,452 | 119,453 | ||||||
|
|
|
|||||||
| 5,172,000 | ||||||||
|
|
|
|||||||
| Diversified Telecommunication Services—0.5% | ||||||||
| Anterix, Inc. (a) |
4,294 | 143,076 | ||||||
| AST SpaceMobile, Inc. (a) (b) |
28,234 | 170,251 | ||||||
| ATN International, Inc. (b) |
3,399 | 132,459 | ||||||
| Bandwidth, Inc. - Class A (a) |
8,108 | 117,323 | ||||||
| Cogent Communications Holdings, Inc. |
14,461 | 1,099,904 | ||||||
| Consolidated Communications Holdings, Inc. (a) |
25,181 | 109,537 | ||||||
| EchoStar Corp. - Class A (a) |
40,964 | 678,773 | ||||||
| Globalstar, Inc. (a) (b) |
230,488 | 447,147 | ||||||
| IDT Corp. - Class B (a) |
5,006 | 170,655 | ||||||
| Liberty Latin America Ltd. - Class A (a) |
13,149 | 96,119 | ||||||
| Liberty Latin America Ltd. - Class C (a) |
47,385 | 347,806 | ||||||
| Lumen Technologies, Inc. (a) (b) |
337,829 | 618,227 | ||||||
| Ooma, Inc. (a) |
8,609 | 92,375 | ||||||
| Shenandoah Telecommunications Co. |
16,904 | 365,464 | ||||||
|
|
|
|||||||
| 4,589,116 | ||||||||
|
|
|
|||||||
| Electric Utilities—0.7% | ||||||||
| ALLETE, Inc. |
19,317 | 1,181,428 | ||||||
| Genie Energy Ltd. - Class B (b) |
6,623 | 186,305 | ||||||
| MGE Energy, Inc. |
12,023 | 869,383 | ||||||
| Otter Tail Corp. (b) |
13,613 | 1,156,697 | ||||||
| PNM Resources, Inc. |
28,574 | 1,188,678 | ||||||
| Electric Utilities—(Continued) | ||||||||
| Portland General Electric Co. |
33,818 | 1,465,672 | ||||||
|
|
|
|||||||
| 6,048,163 | ||||||||
|
|
|
|||||||
| Electrical Equipment—1.3% | ||||||||
| Allient, Inc. |
4,654 | 140,597 | ||||||
| Array Technologies, Inc. (a) (b) |
51,455 | 864,444 | ||||||
| Atkore, Inc. (a) (b) |
12,607 | 2,017,120 | ||||||
| Blink Charging Co. (a) |
18,524 | 62,796 | ||||||
| Bloom Energy Corp. - Class A (a) (b) |
64,618 | 956,346 | ||||||
| Encore Wire Corp. (b) |
5,006 | 1,069,282 | ||||||
| Energy Vault Holdings, Inc. (a) (b) |
34,455 | 80,280 | ||||||
| EnerSys |
13,837 | 1,396,984 | ||||||
| Enovix Corp. (a) (b) |
46,168 | 578,023 | ||||||
| Eos Energy Enterprises, Inc. (a) (b) |
37,219 | 40,569 | ||||||
| Fluence Energy, Inc. (a) (b) |
19,348 | 461,450 | ||||||
| FuelCell Energy, Inc. (a) |
151,705 | 242,728 | ||||||
| GrafTech International Ltd. (b) |
65,339 | 143,092 | ||||||
| LSI Industries, Inc. (b) |
8,816 | 124,129 | ||||||
| NEXTracker, Inc. - Class A (a) (b) |
16,690 | 781,927 | ||||||
| NuScale Power Corp. (a) (b) |
18,459 | 60,730 | ||||||
| Powell Industries, Inc. |
3,142 | 277,753 | ||||||
| Preformed Line Products Co. |
876 | 117,261 | ||||||
| SES AI Corp. (a) (b) |
43,748 | 80,059 | ||||||
| Shoals Technologies Group, Inc. - Class A (a) (b) |
57,645 | 895,803 | ||||||
| Stem, Inc. (a) (b) |
49,764 | 193,084 | ||||||
| SunPower Corp. (a) (b) |
27,543 | 133,033 | ||||||
| Thermon Group Holdings, Inc. (a) |
11,598 | 377,747 | ||||||
| TPI Composites, Inc. (a) (b) |
14,105 | 58,395 | ||||||
| Vicor Corp. (a) (b) |
7,241 | 325,411 | ||||||
|
|
|
|||||||
| 11,479,043 | ||||||||
|
|
|
|||||||
| Electronic Equipment, Instruments & Components—2.6% | ||||||||
| 908 Devices, Inc. (a) (b) |
7,715 | 86,562 | ||||||
| Advanced Energy Industries, Inc. (b) |
12,508 | 1,362,371 | ||||||
| Arlo Technologies, Inc. (a) |
29,346 | 279,374 | ||||||
| Badger Meter, Inc. (b) |
9,792 | 1,511,591 | ||||||
| Bel Fuse, Inc. - Class B |
3,517 | 234,830 | ||||||
| Belden, Inc. |
14,345 | 1,108,151 | ||||||
| Benchmark Electronics, Inc. |
12,513 | 345,859 | ||||||
| Climb Global Solutions, Inc. (b) |
1,406 | 77,091 | ||||||
| CTS Corp. (b) |
10,302 | 450,610 | ||||||
| Daktronics, Inc. (a) |
13,182 | 111,783 | ||||||
| ePlus, Inc. (a) |
8,957 | 715,127 | ||||||
| Evolv Technologies Holdings, Inc. (a) (b) |
38,404 | 181,267 | ||||||
| Fabrinet (a) (b) |
12,219 | 2,325,642 | ||||||
| FARO Technologies, Inc. (a) |
6,602 | 148,743 | ||||||
| Insight Enterprises, Inc. (a) (b) (c) |
9,628 | 1,705,985 | ||||||
| Iteris, Inc. (a) (b) |
14,459 | 75,187 | ||||||
| Itron, Inc. (a) (b) |
15,278 | 1,153,642 | ||||||
| Kimball Electronics, Inc. (a) |
7,836 | 211,180 | ||||||
| Knowles Corp. (a) |
30,951 | 554,332 | ||||||
| Lightwave Logic, Inc. (a) (b) |
39,253 | 195,480 | ||||||
| Luna Innovations, Inc. (a) (b) |
10,812 | 71,900 | ||||||
| Methode Electronics, Inc. |
12,060 | 274,124 | ||||||
| MicroVision, Inc. (a) (b) |
56,055 | 149,106 | ||||||
| Mirion Technologies, Inc. (a) (b) |
67,650 | 693,413 | ||||||
See accompanying notes to financial statements.
BHFTII-10
Brighthouse Funds Trust II
MetLife Russell 2000 Index Portfolio
Schedule of Investments as of December 31, 2023
Common Stocks—(Continued)
| Security Description | Shares | Value | ||||||
| Electronic Equipment, Instruments & Components—(Continued) | ||||||||
| Napco Security Technologies, Inc. |
10,591 | $ | 362,742 | |||||
| nLight, Inc. (a) (b) |
14,866 | 200,691 | ||||||
| Novanta, Inc. (a) |
11,932 | 2,009,468 | ||||||
| OSI Systems, Inc. (a) |
5,288 | 682,416 | ||||||
| Ouster, Inc. (a) |
1 | 8 | ||||||
| PAR Technology Corp. (a) (b) |
8,919 | 388,333 | ||||||
| PC Connection, Inc. |
3,547 | 238,394 | ||||||
| Plexus Corp. (a) (c) |
9,231 | 998,148 | ||||||
| Richardson Electronics Ltd. |
4,045 | 54,001 | ||||||
| Rogers Corp. (a) |
5,809 | 767,195 | ||||||
| Sanmina Corp. (a) |
19,251 | 988,924 | ||||||
| ScanSource, Inc. (a) |
8,101 | 320,881 | ||||||
| SmartRent, Inc. (a) (b) |
62,929 | 200,744 | ||||||
| TTM Technologies, Inc. (a) |
34,551 | 546,251 | ||||||
| Vishay Intertechnology, Inc. (b) |
43,569 | 1,044,349 | ||||||
| Vishay Precision Group, Inc. (a) |
4,194 | 142,890 | ||||||
| Vuzix Corp. (a) (b) |
20,511 | 42,765 | ||||||
|
|
|
|||||||
| 23,011,550 | ||||||||
|
|
|
|||||||
| Energy Equipment & Services—2.3% | ||||||||
| Archrock, Inc. |
45,405 | 699,237 | ||||||
| Atlas Energy Solutions, Inc. (b) |
5,687 | 97,930 | ||||||
| Borr Drilling Ltd. (a) (b) |
77,288 | 568,840 | ||||||
| Bristow Group, Inc. (a) (b) |
8,308 | 234,867 | ||||||
| Cactus, Inc. - Class A (b) |
21,686 | 984,545 | ||||||
| ChampionX Corp. (b) |
65,067 | 1,900,607 | ||||||
| Core Laboratories, Inc. (b) |
15,744 | 278,039 | ||||||
| Diamond Offshore Drilling, Inc. (a) |
35,307 | 458,991 | ||||||
| DMC Global, Inc. (a) (b) |
6,765 | 127,317 | ||||||
| Dril-Quip, Inc. (a) |
11,785 | 274,237 | ||||||
| Expro Group Holdings NV (a) |
29,203 | 464,912 | ||||||
| Forum Energy Technologies, Inc. (a) |
3,314 | 73,471 | ||||||
| Helix Energy Solutions Group, Inc. (a) (b) |
48,941 | 503,114 | ||||||
| Helmerich & Payne, Inc. (b) |
32,515 | 1,177,693 | ||||||
| KLX Energy Services Holdings, Inc. (a) |
4,320 | 48,643 | ||||||
| Kodiak Gas Services, Inc. |
5,429 | 109,014 | ||||||
| Liberty Energy, Inc. (b) |
55,206 | 1,001,437 | ||||||
| Nabors Industries Ltd. (a) (b) |
3,057 | 249,543 | ||||||
| Newpark Resources, Inc. (a) |
22,736 | 150,967 | ||||||
| Noble Corp. PLC (b) |
37,608 | 1,811,201 | ||||||
| Oceaneering International, Inc. (a) |
33,608 | 715,178 | ||||||
| Oil States International, Inc. (a) |
20,142 | 136,764 | ||||||
| Patterson-UTI Energy, Inc. |
118,068 | 1,275,135 | ||||||
| ProFrac Holding Corp. - Class A (a) (b) |
8,200 | 69,536 | ||||||
| ProPetro Holding Corp. (a) |
33,144 | 277,747 | ||||||
| Ranger Energy Services, Inc. |
5,274 | 53,953 | ||||||
| RPC, Inc. (b) |
28,422 | 206,912 | ||||||
| SEACOR Marine Holdings, Inc. (a) |
8,136 | 102,432 | ||||||
| Seadrill Ltd. (a) |
17,044 | 805,840 | ||||||
| Select Water Solutions, Inc. |
28,634 | 217,332 | ||||||
| Solaris Oilfield Infrastructure, Inc. - Class A |
10,753 | 85,594 | ||||||
| TETRA Technologies, Inc. (a) (b) |
42,249 | 190,966 | ||||||
| Tidewater, Inc. (a) |
15,690 | 1,131,406 | ||||||
| U.S. Silica Holdings, Inc. (a) |
25,504 | 288,450 | ||||||
| Valaris Ltd. (a) |
20,427 | 1,400,679 | ||||||
| Energy Equipment & Services—(Continued) | ||||||||
| Weatherford International PLC (a) |
23,800 | 2,328,354 | ||||||
|
|
|
|||||||
| 20,500,883 | ||||||||
|
|
|
|||||||
| Entertainment—0.4% | ||||||||
| Atlanta Braves Holdings, Inc. - Class A (a) (b) |
3,713 | 158,842 | ||||||
| Atlanta Braves Holdings, Inc. - Class C (a) |
15,245 | 603,397 | ||||||
| Cinemark Holdings, Inc. (a) (b) |
37,384 | 526,741 | ||||||
| IMAX Corp. (a) |
15,913 | 239,013 | ||||||
| Lions Gate Entertainment Corp. - Class A (a) (b) |
20,369 | 222,022 | ||||||
| Lions Gate Entertainment Corp. - Class B (a) |
39,080 | 398,225 | ||||||
| Madison Square Garden Entertainment Corp. (a) |
14,606 | 464,325 | ||||||
| Marcus Corp. (b) |
8,228 | 119,964 | ||||||
| Playstudios, Inc. (a) (b) |
28,794 | 78,032 | ||||||
| Reservoir Media, Inc. (a) (b) |
7,562 | 53,917 | ||||||
| Sphere Entertainment Co. (a) |
9,098 | 308,968 | ||||||
| Vivid Seats, Inc. - Class A (a) |
9,790 | 61,873 | ||||||
|
|
|
|||||||
| 3,235,319 | ||||||||
|
|
|
|||||||
| Financial Services—2.3% | ||||||||
| A-Mark Precious Metals, Inc. (b) |
6,654 | 201,283 | ||||||
| Acacia Research Corp. (a) (b) |
12,842 | 50,341 | ||||||
| Alerus Financial Corp. |
6,186 | 138,505 | ||||||
| AvidXchange Holdings, Inc. (a) (b) |
50,990 | 631,766 | ||||||
| Banco Latinoamericano de Comercio Exterior SA |
9,691 | 239,755 | ||||||
| Cannae Holdings, Inc. (a) |
23,433 | 457,178 | ||||||
| Cantaloupe, Inc. (a) |
19,393 | 143,702 | ||||||
| Cass Information Systems, Inc. |
4,551 | 205,023 | ||||||
| Compass Diversified Holdings |
20,864 | 468,397 | ||||||
| Enact Holdings, Inc. (b) |
10,654 | 307,794 | ||||||
| Essent Group Ltd. |
35,218 | 1,857,397 | ||||||
| EVERTEC, Inc. |
21,949 | 898,592 | ||||||
| Federal Agricultural Mortgage Corp. - Class C |
3,118 | 596,224 | ||||||
| Flywire Corp. (a) |
35,628 | 824,788 | ||||||
| I3 Verticals, Inc. - Class A (a) |
7,082 | 149,926 | ||||||
| International Money Express, Inc. (a) |
11,455 | 253,041 | ||||||
| Jackson Financial, Inc. - Class A |
27,422 | 1,404,006 | ||||||
| Marqeta, Inc. - Class A (a) |
165,082 | 1,152,272 | ||||||
| Merchants Bancorp |
4,926 | 209,749 | ||||||
| Mr. Cooper Group, Inc. (a) |
21,652 | 1,409,978 | ||||||
| NewtekOne, Inc. |
8,049 | 111,076 | ||||||
| NMI Holdings, Inc. - Class A (a) |
26,298 | 780,525 | ||||||
| Ocwen Financial Corp. (a) (b) |
2,204 | 67,795 | ||||||
| Pagseguro Digital Ltd. - Class A (a) |
66,936 | 834,692 | ||||||
| Payoneer Global, Inc. (a) (b) |
89,672 | 467,191 | ||||||
| Paysafe Ltd. (a) (b) |
9,881 | 126,378 | ||||||
| PennyMac Financial Services, Inc. (b) |
8,464 | 747,964 | ||||||
| Radian Group, Inc. |
51,613 | 1,473,551 | ||||||
| Remitly Global, Inc. (a) |
43,850 | 851,567 | ||||||
| Repay Holdings Corp. (a) |
27,716 | 236,695 | ||||||
| StoneCo Ltd. - Class A (a) (b) |
97,618 | 1,760,052 | ||||||
| Velocity Financial, Inc. (a) |
2,976 | 51,247 | ||||||
| Walker & Dunlop, Inc. |
10,685 | 1,186,142 | ||||||
| Waterstone Financial, Inc. (b) |
5,854 | 83,127 | ||||||
|
|
|
|||||||
| 20,377,719 | ||||||||
|
|
|
|||||||
See accompanying notes to financial statements.
BHFTII-11
Brighthouse Funds Trust II
MetLife Russell 2000 Index Portfolio
Schedule of Investments as of December 31, 2023
Common Stocks—(Continued)
| Security Description | Shares | Value | ||||||
| Food Products—0.9% | ||||||||
| Alico, Inc. (b) |
2,158 | $ | 62,755 | |||||
| B&G Foods, Inc. (b) |
23,543 | 247,202 | ||||||
| Beyond Meat, Inc. (a) (b) |
20,671 | 183,972 | ||||||
| BRC, Inc. - Class A (a) (b) |
10,280 | 37,316 | ||||||
| Cal-Maine Foods, Inc. |
13,652 | 783,488 | ||||||
| Calavo Growers, Inc. |
5,820 | 171,166 | ||||||
| Dole PLC (b) |
24,276 | 298,352 | ||||||
| Fresh Del Monte Produce, Inc. |
11,441 | 300,326 | ||||||
| Hain Celestial Group, Inc. (a) |
30,259 | 331,336 | ||||||
| J & J Snack Foods Corp. |
4,986 | 833,360 | ||||||
| J.M. Smucker Co. |
1 | 126 | ||||||
| John B Sanfilippo & Son, Inc. |
3,011 | 310,253 | ||||||
| Lancaster Colony Corp. (b) |
6,596 | 1,097,508 | ||||||
| Limoneira Co. (b) |
5,916 | 122,047 | ||||||
| Mission Produce, Inc. (a) (b) |
15,099 | 152,349 | ||||||
| Seneca Foods Corp. - Class A (a) |
1,733 | 90,879 | ||||||
| Simply Good Foods Co. (a) (b) |
29,956 | 1,186,258 | ||||||
| Sovos Brands, Inc. (a) (b) |
18,682 | 411,565 | ||||||
| SunOpta, Inc. (a) (b) |
34,321 | 187,736 | ||||||
| TreeHouse Foods, Inc. (a) |
17,110 | 709,210 | ||||||
| Utz Brands, Inc. (b) |
24,385 | 396,012 | ||||||
| Vital Farms, Inc. (a) |
9,557 | 149,949 | ||||||
| Westrock Coffee Co. (a) |
9,879 | 100,865 | ||||||
|
|
|
|||||||
| 8,164,030 | ||||||||
|
|
|
|||||||
| Gas Utilities—0.9% | ||||||||
| Brookfield Infrastructure Corp. - Class A (b) |
39,846 | 1,405,767 | ||||||
| Chesapeake Utilities Corp. |
7,238 | 764,550 | ||||||
| New Jersey Resources Corp. |
32,290 | 1,439,488 | ||||||
| Northwest Natural Holding Co. |
12,039 | 468,799 | ||||||
| ONE Gas, Inc. (b) |
18,506 | 1,179,203 | ||||||
| RGC Resources, Inc. (b) |
2,683 | 54,572 | ||||||
| Southwest Gas Holdings, Inc. |
20,712 | 1,312,105 | ||||||
| Spire, Inc. |
17,280 | 1,077,235 | ||||||
|
|
|
|||||||
| 7,701,719 | ||||||||
|
|
|
|||||||
| Ground Transportation—0.5% | ||||||||
| ArcBest Corp. |
7,998 | 961,440 | ||||||
| Covenant Logistics Group, Inc. |
3,144 | 144,750 | ||||||
| Daseke, Inc. (a) |
13,563 | 109,860 | ||||||
| FTAI Infrastructure, Inc. (b) |
34,332 | 133,552 | ||||||
| Heartland Express, Inc. |
15,734 | 224,367 | ||||||
| Marten Transport Ltd. |
19,045 | 399,564 | ||||||
| PAM Transportation Services, Inc. (a) |
2,312 | 48,043 | ||||||
| RXO, Inc. (a) (b) |
39,143 | 910,466 | ||||||
| TuSimple Holdings, Inc. - Class A (a) |
51,959 | 45,610 | ||||||
| Universal Logistics Holdings, Inc. (b) |
2,513 | 70,414 | ||||||
| Werner Enterprises, Inc. |
20,993 | 889,473 | ||||||
|
|
|
|||||||
| 3,937,539 | ||||||||
|
|
|
|||||||
| Health Care Equipment & Supplies—2.7% | ||||||||
| Accuray, Inc. (a) (b) |
31,442 | 88,981 | ||||||
| Alphatec Holdings, Inc. (a) |
30,944 | 467,564 | ||||||
| AngioDynamics, Inc. (a) |
12,161 | 95,342 | ||||||
| Artivion, Inc. (a) (b) |
12,730 | 227,612 | ||||||
| Health Care Equipment & Supplies—(Continued) | ||||||||
| AtriCure, Inc. (a) |
15,592 | 556,478 | ||||||
| Atrion Corp. (b) |
495 | 187,501 | ||||||
| Avanos Medical, Inc. (a) |
15,903 | 356,704 | ||||||
| Axogen, Inc. (a) |
14,840 | 101,357 | ||||||
| Axonics, Inc. (a) (b) |
16,781 | 1,044,282 | ||||||
| Butterfly Network, Inc. (a) (b) |
48,574 | 52,460 | ||||||
| Cerus Corp. (a) (b) |
58,541 | 126,449 | ||||||
| ClearPoint Neuro, Inc. (a) |
7,794 | 52,921 | ||||||
| CONMED Corp. (b) |
10,280 | 1,125,763 | ||||||
| CVRx, Inc. (a) |
4,000 | 125,760 | ||||||
| Embecta Corp. |
19,687 | 372,675 | ||||||
| Glaukos Corp. (a) (b) |
15,717 | 1,249,344 | ||||||
| Haemonetics Corp. (a) |
17,072 | 1,459,827 | ||||||
| Inari Medical, Inc. (a) (b) |
17,887 | 1,161,224 | ||||||
| Inmode Ltd. (a) |
26,069 | 579,775 | ||||||
| Inogen, Inc. (a) (b) |
7,987 | 43,849 | ||||||
| Integer Holdings Corp. (a) |
10,999 | 1,089,781 | ||||||
| iRadimed Corp. |
2,491 | 118,248 | ||||||
| iRhythm Technologies, Inc. (a) |
10,140 | 1,085,386 | ||||||
| Lantheus Holdings, Inc. (a) |
22,726 | 1,409,012 | ||||||
| LeMaitre Vascular, Inc. |
6,627 | 376,149 | ||||||
| LivaNova PLC (a) |
18,448 | 954,499 | ||||||
| Merit Medical Systems, Inc. (a) |
19,064 | 1,448,101 | ||||||
| Nano-X Imaging Ltd. (a) (b) |
15,150 | 96,505 | ||||||
| Neogen Corp. (a) (b) |
73,130 | 1,470,644 | ||||||
| Nevro Corp. (a) |
12,102 | 260,435 | ||||||
| Omnicell, Inc. (a) |
14,912 | 561,139 | ||||||
| OraSure Technologies, Inc. (a) |
28,635 | 234,807 | ||||||
| Orthofix Medical, Inc. (a) |
12,079 | 162,825 | ||||||
| OrthoPediatrics Corp. (a) (b) |
5,617 | 182,609 | ||||||
| Outset Medical, Inc. (a) |
16,994 | 91,938 | ||||||
| Paragon 28, Inc. (a) (b) |
16,207 | 201,453 | ||||||
| PROCEPT BioRobotics Corp. (a) |
13,572 | 568,802 | ||||||
| Pulmonx Corp. (a) (b) |
12,235 | 155,996 | ||||||
| Pulse Biosciences, Inc. (a) (b) |
5,792 | 70,894 | ||||||
| RxSight, Inc. (a) |
9,234 | 372,315 | ||||||
| Sanara Medtech, Inc. (a) (b) |
1,366 | 56,143 | ||||||
| Semler Scientific, Inc. (a) |
1,835 | 81,272 | ||||||
| SI-BONE, Inc. (a) |
13,425 | 281,791 | ||||||
| Silk Road Medical, Inc. (a) (b) |
12,651 | 155,228 | ||||||
| STAAR Surgical Co. (a) (b) |
16,470 | 514,029 | ||||||
| Surmodics, Inc. (a) (b) |
4,747 | 172,553 | ||||||
| Tactile Systems Technology, Inc. (a) |
7,825 | 111,897 | ||||||
| TransMedics Group, Inc. (a) (b) |
10,461 | 825,687 | ||||||
| Treace Medical Concepts, Inc. (a) |
15,308 | 195,177 | ||||||
| UFP Technologies, Inc. (a) |
2,379 | 409,283 | ||||||
| Utah Medical Products, Inc. |
1,293 | 108,896 | ||||||
| Varex Imaging Corp. (a) (b) |
12,322 | 252,601 | ||||||
| Zimvie, Inc. (a) |
7,676 | 136,249 | ||||||
| Zynex, Inc. (a) (b) |
7,718 | 84,049 | ||||||
|
|
|
|||||||
| 23,772,261 | ||||||||
|
|
|
|||||||
| Health Care Providers & Services—2.4% | ||||||||
| 23andMe Holding Co. - Class A (a) (b) |
89,589 | 81,840 | ||||||
| Accolade, Inc. (a) |
22,370 | 268,664 | ||||||
| AdaptHealth Corp. (a) (b) |
32,179 | 234,585 | ||||||
See accompanying notes to financial statements.
BHFTII-12
Brighthouse Funds Trust II
MetLife Russell 2000 Index Portfolio
Schedule of Investments as of December 31, 2023
Common Stocks—(Continued)
| Security Description | Shares | Value | ||||||
| Health Care Providers & Services—(Continued) | ||||||||
| Addus HomeCare Corp. (a) |
5,248 | $ | 487,277 | |||||
| Agiliti, Inc. (a) (b) |
9,835 | 77,893 | ||||||
| Alignment Healthcare, Inc. (a) |
27,227 | 234,424 | ||||||
| AMN Healthcare Services, Inc. (a) (b) |
12,730 | 953,222 | ||||||
| Apollo Medical Holdings, Inc. (a) (b) |
14,378 | 550,677 | ||||||
| Brookdale Senior Living, Inc. (a) |
63,084 | 367,149 | ||||||
| Castle Biosciences, Inc. (a) |
7,804 | 168,410 | ||||||
| Community Health Systems, Inc. (a) (b) |
45,180 | 141,413 | ||||||
| CorVel Corp. (a) (b) |
2,945 | 728,033 | ||||||
| Cross Country Healthcare, Inc. (a) (b) |
10,985 | 248,700 | ||||||
| DocGo, Inc. (a) (b) |
28,630 | 160,042 | ||||||
| Enhabit, Inc. (a) (b) |
17,210 | 178,124 | ||||||
| Ensign Group, Inc. |
18,227 | 2,045,252 | ||||||
| Fulgent Genetics, Inc. (a) (b) |
7,417 | 214,425 | ||||||
| Guardant Health, Inc. (a) (b) |
37,275 | 1,008,289 | ||||||
| HealthEquity, Inc. (a) |
28,184 | 1,868,599 | ||||||
| Hims & Hers Health, Inc. (a) |
43,355 | 385,859 | ||||||
| InfuSystem Holdings, Inc. (a) (b) |
6,159 | 64,916 | ||||||
| Invitae Corp. (a) (b) |
83,096 | 52,085 | ||||||
| Joint Corp. (a) (b) |
5,088 | 48,896 | ||||||
| LifeStance Health Group, Inc. (a) (b) |
36,004 | 281,911 | ||||||
| ModivCare, Inc. (a) |
4,229 | 186,034 | ||||||
| National HealthCare Corp. |
4,199 | 388,072 | ||||||
| National Research Corp. |
4,600 | 181,976 | ||||||
| NeoGenomics, Inc. (a) (b) |
42,888 | 693,928 | ||||||
| OPKO Health, Inc. (a) (b) |
136,839 | 206,627 | ||||||
| Option Care Health, Inc. (a) |
56,818 | 1,914,198 | ||||||
| Owens & Minor, Inc. (a) (b) |
24,268 | 467,644 | ||||||
| Patterson Cos., Inc. |
29,387 | 836,060 | ||||||
| Pediatrix Medical Group, Inc. (a) (b) |
28,941 | 269,151 | ||||||
| Pennant Group, Inc. (a) |
11,360 | 158,131 | ||||||
| PetIQ, Inc. (a) |
9,493 | 187,487 | ||||||
| Privia Health Group, Inc. (a) (b) |
37,190 | 856,486 | ||||||
| Progyny, Inc. (a) |
26,342 | 979,396 | ||||||
| Quipt Home Medical Corp. (a) |
14,235 | 72,456 | ||||||
| RadNet, Inc. (a) (b) |
19,948 | 693,592 | ||||||
| Select Medical Holdings Corp. |
35,092 | 824,662 | ||||||
| Surgery Partners, Inc. (a) |
25,332 | 810,371 | ||||||
| U.S. Physical Therapy, Inc. |
4,906 | 456,945 | ||||||
| Viemed Healthcare, Inc. (a) |
11,513 | 90,377 | ||||||
|
|
|
|||||||
| 21,124,278 | ||||||||
|
|
|
|||||||
| Health Care REITs—0.6% | ||||||||
| CareTrust REIT, Inc. |
33,166 | 742,255 | ||||||
| Community Healthcare Trust, Inc. |
8,914 | 237,469 | ||||||
| Diversified Healthcare Trust (b) |
80,864 | 302,431 | ||||||
| Global Medical REIT, Inc. (b) |
21,232 | 235,675 | ||||||
| LTC Properties, Inc. |
13,796 | 443,128 | ||||||
| National Health Investors, Inc. (b) |
14,087 | 786,759 | ||||||
| Physicians Realty Trust |
79,908 | 1,063,575 | ||||||
| Sabra Health Care REIT, Inc. |
76,355 | 1,089,586 | ||||||
| Universal Health Realty Income Trust (b) |
4,263 | 184,375 | ||||||
|
|
|
|||||||
| 5,085,253 | ||||||||
|
|
|
|||||||
| Health Care Technology—0.5% | ||||||||
| American Well Corp. - Class A (a) |
84,042 | 125,223 | ||||||
| Computer Programs & Systems, Inc. (a) |
4,524 | 50,669 | ||||||
| Definitive Healthcare Corp. (a) (b) |
15,540 | 154,468 | ||||||
| Evolent Health, Inc. - Class A (a) |
36,933 | 1,219,897 | ||||||
| Health Catalyst, Inc. (a) |
17,486 | 161,920 | ||||||
| HealthStream, Inc. |
9,080 | 245,432 | ||||||
| Multiplan Corp. (a) (b) |
134,034 | 193,009 | ||||||
| OptimizeRx Corp. (a) (b) |
5,787 | 82,812 | ||||||
| Phreesia, Inc. (a) |
17,014 | 393,874 | ||||||
| Schrodinger, Inc. (a) (b) |
18,164 | 650,271 | ||||||
| Sharecare, Inc. (a) (b) |
103,262 | 111,523 | ||||||
| Simulations Plus, Inc. (b) |
5,451 | 243,932 | ||||||
| Veradigm, Inc. (a) |
38,376 | 402,564 | ||||||
|
|
|
|||||||
| 4,035,594 | ||||||||
|
|
|
|||||||
| Hotel & Resort REITs—0.9% | ||||||||
| Apple Hospitality REIT, Inc. (b) |
71,063 | 1,180,356 | ||||||
| Braemar Hotels & Resorts, Inc. (b) |
21,960 | 54,900 | ||||||
| Chatham Lodging Trust |
16,628 | 178,252 | ||||||
| DiamondRock Hospitality Co. (b) |
70,693 | 663,807 | ||||||
| Pebblebrook Hotel Trust (b) |
40,264 | 643,419 | ||||||
| RLJ Lodging Trust |
53,050 | 621,746 | ||||||
| Ryman Hospitality Properties, Inc. |
19,431 | 2,138,576 | ||||||
| Service Properties Trust (b) |
55,359 | 472,766 | ||||||
| Summit Hotel Properties, Inc. |
35,386 | 237,794 | ||||||
| Sunstone Hotel Investors, Inc. (b) |
70,253 | 753,815 | ||||||
| Xenia Hotels & Resorts, Inc. (b) |
34,808 | 474,085 | ||||||
|
|
|
|||||||
| 7,419,516 | ||||||||
|
|
|
|||||||
| Hotels, Restaurants & Leisure—2.1% | ||||||||
| Accel Entertainment, Inc. (a) |
16,295 | 167,350 | ||||||
| Bally’s Corp. (a) (b) |
8,988 | 125,293 | ||||||
| Biglari Holdings, Inc. - Class B (a) |
261 | 43,047 | ||||||
| BJ’s Restaurants, Inc. (a) |
7,697 | 277,169 | ||||||
| Bloomin’ Brands, Inc. (b) |
29,104 | 819,278 | ||||||
| Bluegreen Vacations Holding Corp. |
3,848 | 289,062 | ||||||
| Bowlero Corp. - Class A (a) (b) |
6,169 | 87,353 | ||||||
| Brinker International, Inc. (a) |
14,683 | 634,012 | ||||||
| Carrols Restaurant Group, Inc. |
12,485 | 98,382 | ||||||
| Century Casinos, Inc. (a) |
9,899 | 48,307 | ||||||
| Cheesecake Factory, Inc. (b) |
16,444 | 575,704 | ||||||
| Chuy’s Holdings, Inc. (a) |
6,087 | 232,706 | ||||||
| Cracker Barrel Old Country Store, Inc. (b) |
7,474 | 576,096 | ||||||
| Dave & Buster’s Entertainment, Inc. (a) |
12,109 | 652,070 | ||||||
| Denny’s Corp. (a) (b) |
18,929 | 205,947 | ||||||
| Dine Brands Global, Inc. |
5,258 | 261,060 | ||||||
| El Pollo Loco Holdings, Inc. (a) |
9,682 | 85,395 | ||||||
| Everi Holdings, Inc. (a) |
28,749 | 324,001 | ||||||
| First Watch Restaurant Group, Inc. (a) (b) |
7,697 | 154,710 | ||||||
| Full House Resorts, Inc. (a) (b) |
11,840 | 63,581 | ||||||
| Global Business Travel Group I (a) |
11,339 | 73,136 | ||||||
| Golden Entertainment, Inc. (b) |
7,102 | 283,583 | ||||||
| Hilton Grand Vacations, Inc. (a) |
26,334 | 1,058,100 | ||||||
| Inspired Entertainment, Inc. (a) |
7,791 | 76,975 | ||||||
| International Game Technology PLC |
36,432 | 998,601 | ||||||
| Jack in the Box, Inc. (b) |
6,636 | 541,697 | ||||||
See accompanying notes to financial statements.
BHFTII-13
Brighthouse Funds Trust II
MetLife Russell 2000 Index Portfolio
Schedule of Investments as of December 31, 2023
Common Stocks—(Continued)
| Security Description | Shares | Value | ||||||
| Hotels, Restaurants & Leisure—(Continued) | ||||||||
| Krispy Kreme, Inc. (b) |
29,632 | $ | 447,147 | |||||
| Kura Sushi USA, Inc. - Class A (a) (b) |
1,965 | 149,340 | ||||||
| Life Time Group Holdings, Inc. (a) (b) |
15,138 | 228,281 | ||||||
| Light & Wonder, Inc. (a) |
30,631 | 2,515,111 | ||||||
| Lindblad Expeditions Holdings, Inc. (a) |
10,934 | 123,226 | ||||||
| Monarch Casino & Resort, Inc. |
4,396 | 303,983 | ||||||
| Mondee Holdings, Inc. (a) (b) |
15,659 | 43,219 | ||||||
| Nathan’s Famous, Inc. |
956 | 74,578 | ||||||
| Noodles & Co. (a) |
13,880 | 43,722 | ||||||
| ONE Group Hospitality, Inc. (a) (b) |
7,883 | 48,244 | ||||||
| Papa John’s International, Inc. (b) |
10,995 | 838,149 | ||||||
| PlayAGS, Inc. (a) |
12,538 | 105,695 | ||||||
| Portillo’s, Inc. - Class A (a) |
14,432 | 229,902 | ||||||
| Potbelly Corp. (a) |
8,856 | 92,279 | ||||||
| RCI Hospitality Holdings, Inc. (b) |
2,918 | 193,347 | ||||||
| Red Robin Gourmet Burgers, Inc. (a) (b) |
5,385 | 67,151 | ||||||
| Red Rock Resorts, Inc. - Class A (b) |
15,880 | 846,880 | ||||||
| Rush Street Interactive, Inc. (a) |
21,900 | 98,331 | ||||||
| Sabre Corp. (a) |
109,871 | 483,432 | ||||||
| SeaWorld Entertainment, Inc. (a) |
12,173 | 643,100 | ||||||
| Shake Shack, Inc. - Class A (a) |
12,560 | 930,947 | ||||||
| Six Flags Entertainment Corp. (a) |
24,247 | 608,115 | ||||||
| Super Group SGHC Ltd. (a) (b) |
46,750 | 148,197 | ||||||
| Sweetgreen, Inc. - Class A (a) (b) |
32,761 | 370,199 | ||||||
| Target Hospitality Corp. (a) |
10,601 | 103,148 | ||||||
| Xponential Fitness, Inc. - Class A (a) (b) |
8,434 | 108,714 | ||||||
|
|
|
|||||||
| 18,597,052 | ||||||||
|
|
|
|||||||
| Household Durables—2.3% | ||||||||
| Beazer Homes USA, Inc. (a) |
9,853 | 332,933 | ||||||
| Cavco Industries, Inc. (a) (b) |
2,935 | 1,017,330 | ||||||
| Century Communities, Inc. |
9,541 | 869,567 | ||||||
| Cricut, Inc. - Class A (b) |
16,270 | 107,219 | ||||||
| Dream Finders Homes, Inc. - Class A (a) (b) |
8,135 | 289,037 | ||||||
| Ethan Allen Interiors, Inc. (b) |
7,632 | 243,613 | ||||||
| GoPro, Inc. - Class A (a) (b) |
43,896 | 152,319 | ||||||
| Green Brick Partners, Inc. (a) |
8,847 | 459,513 | ||||||
| Helen of Troy Ltd. (a) (b) |
8,022 | 969,138 | ||||||
| Hooker Furnishings Corp. (b) |
3,731 | 97,305 | ||||||
| Hovnanian Enterprises, Inc. - Class A (a) (b) |
1,523 | 237,009 | ||||||
| Installed Building Products, Inc. (b) |
7,945 | 1,452,505 | ||||||
| iRobot Corp. (a) (b) |
8,888 | 343,966 | ||||||
| KB Home |
23,414 | 1,462,438 | ||||||
| La-Z-Boy, Inc. |
14,484 | 534,749 | ||||||
| Landsea Homes Corp. (a) |
7,257 | 95,357 | ||||||
| Legacy Housing Corp. (a) |
3,039 | 76,644 | ||||||
| LGI Homes, Inc. (a) (b) |
6,929 | 922,666 | ||||||
| Lovesac Co. (a) |
4,517 | 115,409 | ||||||
| M/I Homes, Inc. (a) |
9,009 | 1,240,900 | ||||||
| MDC Holdings, Inc. |
19,668 | 1,086,657 | ||||||
| Meritage Homes Corp. (c) |
12,017 | 2,093,361 | ||||||
| Skyline Champion Corp. (a) |
17,689 | 1,313,585 | ||||||
| Snap One Holdings Corp. (a) (b) |
5,851 | 52,132 | ||||||
| Sonos, Inc. (a) (b) |
41,381 | 709,270 | ||||||
| Taylor Morrison Home Corp. (a) |
34,496 | 1,840,362 | ||||||
| Tri Pointe Homes, Inc. (a) |
32,041 | 1,134,251 | ||||||
| Household Durables—(Continued) | ||||||||
| Vizio Holding Corp. - Class A (a) |
24,137 | 185,855 | ||||||
| VOXX International Corp. (a) |
4,092 | 43,703 | ||||||
| Worthington Enterprises, Inc. |
10,048 | 578,262 | ||||||
|
|
|
|||||||
| 20,057,055 | ||||||||
|
|
|
|||||||
| Household Products—0.3% | ||||||||
| Central Garden & Pet Co. (Non-Voting Shares) - Class A (a) |
13,396 | 589,960 | ||||||
| Central Garden & Pet Co. (Voting Shares) (a) (b) |
3,370 | 168,870 | ||||||
| Energizer Holdings, Inc. (b) |
23,993 | 760,098 | ||||||
| Oil-Dri Corp. of America |
1,659 | 111,286 | ||||||
| WD-40 Co. (b) |
4,496 | 1,074,859 | ||||||
|
|
|
|||||||
| 2,705,073 | ||||||||
|
|
|
|||||||
| Independent Power and Renewable Electricity Producers—0.3% | ||||||||
| Altus Power, Inc. (a) (b) |
22,201 | 151,633 | ||||||
| Montauk Renewables, Inc. (a) |
22,642 | 201,740 | ||||||
| Ormat Technologies, Inc. (b) |
17,929 | 1,358,839 | ||||||
| Sunnova Energy International, Inc. (a) (b) |
35,349 | 539,072 | ||||||
|
|
|
|||||||
| 2,251,284 | ||||||||
|
|
|
|||||||
| Industrial Conglomerates—0.0% | ||||||||
| Brookfield Business Corp. - Class A |
9,192 | 213,990 | ||||||
|
|
|
|||||||
| Industrial REITs—0.5% | ||||||||
| Innovative Industrial Properties, Inc. |
9,335 | 941,155 | ||||||
| LXP Industrial Trust (b) |
97,303 | 965,246 | ||||||
| Plymouth Industrial REIT, Inc. (b) |
14,464 | 348,148 | ||||||
| Terreno Realty Corp. |
27,441 | 1,719,727 | ||||||
|
|
|
|||||||
| 3,974,276 | ||||||||
|
|
|
|||||||
| Insurance—1.7% | ||||||||
| Ambac Financial Group, Inc. (a) |
15,807 | 260,499 | ||||||
| American Coastal Insurance Corp. - Class C (a) (b) |
6,686 | 63,250 | ||||||
| American Equity Investment Life Holding Co. (a) |
26,105 | 1,456,659 | ||||||
| AMERISAFE, Inc. (b) |
6,171 | 288,679 | ||||||
| BRP Group, Inc. - Class A (a) (b) |
20,510 | 492,650 | ||||||
| CNO Financial Group, Inc. |
37,094 | 1,034,923 | ||||||
| Crawford & Co. - Class A |
5,003 | 65,940 | ||||||
| Donegal Group, Inc. - Class A (b) |
5,184 | 72,524 | ||||||
| eHealth, Inc. (a) |
8,539 | 74,460 | ||||||
| Employers Holdings, Inc. |
8,580 | 338,052 | ||||||
| Enstar Group Ltd. (a) |
4,006 | 1,179,166 | ||||||
| F&G Annuities & Life, Inc. (b) |
6,468 | 297,528 | ||||||
| Fidelis Insurance Holdings Ltd. (a) |
5,432 | 68,823 | ||||||
| Genworth Financial, Inc. - Class A (a) |
157,009 | 1,048,820 | ||||||
| Goosehead Insurance, Inc. - Class A (a) |
7,250 | 549,550 | ||||||
| Greenlight Capital Re Ltd. - Class A (a) (b) |
8,929 | 101,969 | ||||||
| HCI Group, Inc. |
1,987 | 173,664 | ||||||
| Horace Mann Educators Corp. |
13,726 | 448,840 | ||||||
| Investors Title Co. |
444 | 71,990 | ||||||
| James River Group Holdings Ltd. |
13,003 | 120,148 | ||||||
| Lemonade, Inc. (a) (b) |
17,084 | 275,565 | ||||||
| Maiden Holdings Ltd. (a) |
31,157 | 71,350 | ||||||
| MBIA, Inc. (a) (b) |
16,483 | 100,876 | ||||||
| Mercury General Corp. |
9,027 | 336,797 | ||||||
See accompanying notes to financial statements.
BHFTII-14
Brighthouse Funds Trust II
MetLife Russell 2000 Index Portfolio
Schedule of Investments as of December 31, 2023
Common Stocks—(Continued)
| Security Description | Shares | Value | ||||||
| Insurance—(Continued) | ||||||||
| National Western Life Group, Inc. - Class A |
725 | $ | 350,190 | |||||
| Oscar Health, Inc. - Class A (a) |
52,292 | 478,472 | ||||||
| Palomar Holdings, Inc. (a) |
7,992 | 443,556 | ||||||
| ProAssurance Corp. |
16,084 | 221,798 | ||||||
| Safety Insurance Group, Inc. |
4,806 | 365,208 | ||||||
| Selective Insurance Group, Inc. |
20,065 | 1,996,066 | ||||||
| Selectquote, Inc. (a) |
46,670 | 63,938 | ||||||
| SiriusPoint Ltd. (a) |
23,338 | 270,721 | ||||||
| Skyward Specialty Insurance Group, Inc. (a) |
8,182 | 277,206 | ||||||
| Stewart Information Services Corp. |
8,566 | 503,252 | ||||||
| Tiptree, Inc. |
8,311 | 157,577 | ||||||
| Trupanion, Inc. (a) |
13,150 | 401,207 | ||||||
| United Fire Group, Inc. |
7,479 | 150,477 | ||||||
| Universal Insurance Holdings, Inc. |
8,746 | 139,761 | ||||||
|
|
|
|||||||
| 14,812,151 | ||||||||
|
|
|
|||||||
| Interactive Media & Services—0.7% | ||||||||
| Bumble, Inc. - Class A (a) (b) |
34,027 | 501,558 | ||||||
| Cargurus, Inc. (a) |
32,815 | 792,810 | ||||||
| Cars.com, Inc. (a) |
21,736 | 412,332 | ||||||
| Eventbrite, Inc. - Class A (a) |
26,374 | 220,487 | ||||||
| EverQuote, Inc. - Class A (a) (b) |
6,835 | 83,660 | ||||||
| fuboTV, Inc. (a) (b) |
96,554 | 307,042 | ||||||
| Grindr, Inc. (a) |
14,425 | 126,652 | ||||||
| MediaAlpha, Inc. - Class A (a) |
6,460 | 72,029 | ||||||
| Nextdoor Holdings, Inc. (a) |
50,177 | 94,835 | ||||||
| Outbrain, Inc. (a) (b) |
14,324 | 62,739 | ||||||
| QuinStreet, Inc. (a) |
18,173 | 232,978 | ||||||
| Shutterstock, Inc. (b) |
7,975 | 385,033 | ||||||
| TrueCar, Inc. (a) (b) |
29,851 | 103,284 | ||||||
| Vimeo, Inc. (a) |
49,749 | 195,016 | ||||||
| Yelp, Inc. (a) (b) |
22,371 | 1,059,043 | ||||||
| Ziff Davis, Inc. (a) |
15,789 | 1,060,863 | ||||||
| ZipRecruiter, Inc. - Class A (a) |
24,978 | 347,194 | ||||||
|
|
|
|||||||
| 6,057,555 | ||||||||
|
|
|
|||||||
| IT Services—0.5% | ||||||||
| Applied Digital Corp. (a) (b) |
28,272 | 190,553 | ||||||
| BigCommerce Holdings, Inc. - Series 1 (a) |
21,617 | 210,333 | ||||||
| Couchbase, Inc. (a) (b) |
11,669 | 262,786 | ||||||
| DigitalOcean Holdings, Inc. (a) (b) |
21,351 | 783,368 | ||||||
| Fastly, Inc. - Class A (a) |
39,783 | 708,137 | ||||||
| Grid Dynamics Holdings, Inc. (a) (b) |
18,166 | 242,153 | ||||||
| Hackett Group, Inc. |
8,402 | 191,314 | ||||||
| Information Services Group, Inc. (b) |
11,846 | 55,795 | ||||||
| Perficient, Inc. (a) |
11,525 | 758,576 | ||||||
| Squarespace, Inc. - Class A (a) |
17,020 | 561,830 | ||||||
| Thoughtworks Holding, Inc. (a) (b) |
31,553 | 151,770 | ||||||
| Tucows, Inc. - Class A (a) (b) |
3,376 | 91,152 | ||||||
| Unisys Corp. (a) |
23,162 | 130,170 | ||||||
|
|
|
|||||||
| 4,337,937 | ||||||||
|
|
|
|||||||
| Leisure Products—0.4% | ||||||||
| Acushnet Holdings Corp. (b) |
10,476 | 661,769 | ||||||
| AMMO, Inc. (a) (b) |
33,699 | 70,768 | ||||||
| Leisure Products—(Continued) | ||||||||
| Clarus Corp. |
9,026 | 62,234 | ||||||
| Escalade, Inc. (b) |
3,400 | 68,306 | ||||||
| Funko, Inc. - Class A (a) (b) |
11,731 | 90,681 | ||||||
| JAKKS Pacific, Inc. (a) |
2,462 | 87,524 | ||||||
| Johnson Outdoors, Inc. - Class A |
1,720 | 91,882 | ||||||
| Malibu Boats, Inc. - Class A (a) (b) |
6,721 | 368,445 | ||||||
| MasterCraft Boat Holdings, Inc. (a) |
5,986 | 135,523 | ||||||
| Smith & Wesson Brands, Inc. |
15,475 | 209,841 | ||||||
| Sturm Ruger & Co., Inc. |
6,188 | 281,245 | ||||||
| Topgolf Callaway Brands Corp. (a) (b) |
48,290 | 692,479 | ||||||
| Vista Outdoor, Inc. (a) (b) |
19,339 | 571,854 | ||||||
|
|
|
|||||||
| 3,392,551 | ||||||||
|
|
|
|||||||
| Life Sciences Tools & Services—0.3% | ||||||||
| Adaptive Biotechnologies Corp. (a) (b) |
37,677 | 184,617 | ||||||
| BioLife Solutions, Inc. (a) (b) |
11,463 | 186,274 | ||||||
| Codexis, Inc. (a) |
22,591 | 68,903 | ||||||
| CryoPort, Inc. (a) |
14,444 | 223,738 | ||||||
| Cytek Biosciences, Inc. (a) (b) |
39,465 | 359,921 | ||||||
| Harvard Bioscience, Inc. (a) (b) |
13,230 | 70,780 | ||||||
| MaxCyte, Inc. (a) (b) |
27,656 | 129,983 | ||||||
| Mesa Laboratories, Inc. (b) |
1,730 | 181,252 | ||||||
| Nautilus Biotechnology, Inc. (a) (b) |
17,836 | 53,330 | ||||||
| OmniAb, Inc. (a) |
32,073 | 197,890 | ||||||
| OmniAb, Inc. (Earnout Shares) (a) (b) (d) (e) |
4,218 | 0 | ||||||
| Pacific Biosciences of California, Inc. (a) (b) |
83,438 | 818,527 | ||||||
| Quanterix Corp. (a) |
11,230 | 307,028 | ||||||
| Quantum-Si, Inc. (a) (b) |
34,740 | 69,827 | ||||||
| SomaLogic, Inc. (a) (b) |
54,664 | 138,300 | ||||||
|
|
|
|||||||
| 2,990,370 | ||||||||
|
|
|
|||||||
| Machinery—3.4% | ||||||||
| 3D Systems Corp. (a) (b) |
42,023 | 266,846 | ||||||
| Alamo Group, Inc. |
3,307 | 695,098 | ||||||
| Albany International Corp. - Class A |
10,575 | 1,038,676 | ||||||
| Astec Industries, Inc. |
7,396 | 275,131 | ||||||
| Barnes Group, Inc. |
16,460 | 537,090 | ||||||
| Blue Bird Corp. (a) |
8,457 | 228,001 | ||||||
| Chart Industries, Inc. (a) (b) |
14,355 | 1,957,017 | ||||||
| Columbus McKinnon Corp. |
9,111 | 355,511 | ||||||
| Commercial Vehicle Group, Inc. (a) (b) |
10,810 | 75,778 | ||||||
| Desktop Metal, Inc. - Class A (a) (b) |
95,970 | 72,073 | ||||||
| Douglas Dynamics, Inc. |
7,665 | 227,497 | ||||||
| Energy Recovery, Inc. (a) (b) |
18,812 | 354,418 | ||||||
| Enerpac Tool Group Corp. |
18,679 | 580,730 | ||||||
| Enpro, Inc. |
7,028 | 1,101,569 | ||||||
| ESCO Technologies, Inc. |
8,454 | 989,372 | ||||||
| Federal Signal Corp. |
20,069 | 1,540,095 | ||||||
| Franklin Electric Co., Inc. (b) |
15,410 | 1,489,376 | ||||||
| Gencor Industries, Inc. (a) |
3,563 | 57,507 | ||||||
| Gorman-Rupp Co. |
7,300 | 259,369 | ||||||
| Greenbrier Cos., Inc. (b) |
9,698 | 428,458 | ||||||
| Helios Technologies, Inc. |
11,222 | 508,918 | ||||||
| Hillenbrand, Inc. |
23,410 | 1,120,168 | ||||||
| Hillman Solutions Corp. (a) |
65,799 | 606,009 | ||||||
| Hyster-Yale Materials Handling, Inc. |
3,777 | 234,892 | ||||||
| John Bean Technologies Corp. (b) |
10,453 | 1,039,551 | ||||||
See accompanying notes to financial statements.
BHFTII-15
Brighthouse Funds Trust II
MetLife Russell 2000 Index Portfolio
Schedule of Investments as of December 31, 2023
Common Stocks—(Continued)
| Security Description | Shares | Value | ||||||
| Machinery—(Continued) | ||||||||
| Kadant, Inc. |
3,892 | $ | 1,090,967 | |||||
| Kennametal, Inc. (b) |
27,095 | 698,780 | ||||||
| Lindsay Corp. |
3,673 | 474,405 | ||||||
| Luxfer Holdings PLC |
10,353 | 92,556 | ||||||
| Manitowoc Co., Inc. (a) |
11,674 | 194,839 | ||||||
| Mayville Engineering Co., Inc. (a) |
3,733 | 53,830 | ||||||
| Microvast Holdings, Inc. (a) (b) |
76,693 | 107,370 | ||||||
| Miller Industries, Inc. |
3,305 | 139,768 | ||||||
| Mueller Industries, Inc. (b) |
37,724 | 1,778,687 | ||||||
| Mueller Water Products, Inc. - Class A |
52,474 | 755,626 | ||||||
| Nikola Corp. (a) (b) |
201,748 | 176,489 | ||||||
| Omega Flex, Inc. (b) |
1,112 | 78,407 | ||||||
| Park-Ohio Holdings Corp. |
2,839 | 76,539 | ||||||
| Proto Labs, Inc. (a) |
8,980 | 349,861 | ||||||
| REV Group, Inc. |
10,161 | 184,625 | ||||||
| Shyft Group, Inc. |
10,757 | 131,451 | ||||||
| SPX Technologies, Inc. (a) |
14,614 | 1,476,160 | ||||||
| Standex International Corp. |
4,024 | 637,321 | ||||||
| Tennant Co. |
5,981 | 554,379 | ||||||
| Terex Corp. |
22,471 | 1,291,184 | ||||||
| Titan International, Inc. (a) |
18,172 | 270,399 | ||||||
| Trinity Industries, Inc. |
27,337 | 726,891 | ||||||
| Wabash National Corp. (b) |
15,639 | 400,671 | ||||||
| Watts Water Technologies, Inc. - Class A |
9,132 | 1,902,561 | ||||||
|
|
|
|||||||
| 29,682,916 | ||||||||
|
|
|
|||||||
| Marine Transportation—0.3% | ||||||||
| Costamare, Inc. (b) |
14,222 | 148,051 | ||||||
| Eagle Bulk Shipping, Inc. (b) |
3,104 | 171,962 | ||||||
| Genco Shipping & Trading Ltd. |
14,141 | 234,599 | ||||||
| Golden Ocean Group Ltd. |
41,330 | 403,381 | ||||||
| Himalaya Shipping Ltd. (a) (b) |
10,455 | 70,676 | ||||||
| Matson, Inc. |
11,489 | 1,259,194 | ||||||
| Pangaea Logistics Solutions Ltd. (b) |
12,273 | 101,130 | ||||||
| Safe Bulkers, Inc. |
24,109 | 94,748 | ||||||
|
|
|
|||||||
| 2,483,741 | ||||||||
|
|
|
|||||||
| Media—0.6% | ||||||||
| Advantage Solutions, Inc. (a) |
30,961 | 112,079 | ||||||
| AMC Networks, Inc. - Class A (a) (b) |
10,133 | 190,399 | ||||||
| Boston Omaha Corp. - Class A (a) |
7,716 | 121,373 | ||||||
| Cardlytics, Inc. (a) (b) |
11,459 | 105,537 | ||||||
| Clear Channel Outdoor Holdings, Inc. (a) |
126,088 | 229,480 | ||||||
| Daily Journal Corp. (a) (b) |
413 | 140,759 | ||||||
| Entravision Communications Corp. - Class A |
20,365 | 84,922 | ||||||
| EW Scripps Co. - Class A (a) |
19,856 | 158,649 | ||||||
| Gambling.com Group Ltd. (a) |
3,973 | 38,737 | ||||||
| Gannett Co., Inc. (a) (b) |
49,514 | 113,882 | ||||||
| Gray Television, Inc. |
28,294 | 253,514 | ||||||
| iHeartMedia, Inc. - Class A (a) |
39,947 | 106,658 | ||||||
| Integral Ad Science Holding Corp. (a) |
16,409 | 236,126 | ||||||
| John Wiley & Sons, Inc. - Class A (b) |
12,175 | 386,435 | ||||||
| Magnite, Inc. (a) (b) |
44,965 | 419,973 | ||||||
| PubMatic, Inc. - Class A (a) |
14,669 | 239,251 | ||||||
| Scholastic Corp. |
9,313 | 351,100 | ||||||
| Sinclair, Inc. (b) |
9,848 | 128,319 | ||||||
| Media—(Continued) | ||||||||
| Stagwell, Inc. (a) |
26,617 | 176,471 | ||||||
| TechTarget, Inc. (a) (b) |
9,094 | 317,017 | ||||||
| TEGNA, Inc. |
67,507 | 1,032,857 | ||||||
| Thryv Holdings, Inc. (a) (b) |
10,544 | 214,570 | ||||||
| WideOpenWest, Inc. (a) |
18,090 | 73,265 | ||||||
|
|
|
|||||||
| 5,231,373 | ||||||||
|
|
|
|||||||
| Metals & Mining—1.8% | ||||||||
| Alpha Metallurgical Resources, Inc. (b) |
3,844 | 1,302,809 | ||||||
| Arch Resources, Inc. |
5,875 | 974,898 | ||||||
| ATI, Inc. (a) (b) |
43,250 | 1,966,578 | ||||||
| Caledonia Mining Corp. PLC |
5,546 | 67,661 | ||||||
| Carpenter Technology Corp. |
16,114 | 1,140,871 | ||||||
| Century Aluminum Co. (a) |
17,836 | 216,529 | ||||||
| Coeur Mining, Inc. (a) (b) |
107,322 | 349,870 | ||||||
| Commercial Metals Co. |
39,392 | 1,971,176 | ||||||
| Compass Minerals International, Inc. (b) |
11,864 | 300,396 | ||||||
| Constellium SE (a) |
42,559 | 849,478 | ||||||
| Contango ORE, Inc. (a) (b) |
2,967 | 53,732 | ||||||
| Dakota Gold Corp. (a) (b) |
19,923 | 52,198 | ||||||
| Haynes International, Inc. |
4,204 | 239,838 | ||||||
| Hecla Mining Co. (b) |
201,477 | 969,104 | ||||||
| i-80 Gold Corp. (a) |
66,566 | 117,156 | ||||||
| Ivanhoe Electric, Inc. (a) (b) |
21,608 | 217,809 | ||||||
| Kaiser Aluminum Corp. (b) |
5,296 | 377,022 | ||||||
| Materion Corp. |
6,859 | 892,562 | ||||||
| Novagold Resources, Inc. (a) |
80,560 | 301,294 | ||||||
| Olympic Steel, Inc. (b) |
3,243 | 216,308 | ||||||
| Perpetua Resources Corp. (a) (b) |
13,701 | 43,432 | ||||||
| Piedmont Lithium, Inc. (a) (b) |
6,114 | 172,598 | ||||||
| Ramaco Resources, Inc. - Class A |
7,675 | 131,857 | ||||||
| Ryerson Holding Corp. |
9,373 | 325,056 | ||||||
| Schnitzer Steel Industries, Inc. - Class A |
8,757 | 264,111 | ||||||
| SunCoke Energy, Inc. |
29,072 | 312,233 | ||||||
| TimkenSteel Corp. (a) |
14,154 | 331,911 | ||||||
| Tredegar Corp. |
7,835 | 42,387 | ||||||
| Warrior Met Coal, Inc. |
17,236 | 1,050,879 | ||||||
| Worthington Steel, Inc. (a) |
10,048 | 282,349 | ||||||
|
|
|
|||||||
| 15,534,102 | ||||||||
|
|
|
|||||||
| Mortgage Real Estate Investment Trusts—1.2% | ||||||||
| AFC Gamma, Inc. (b) |
5,786 | 69,606 | ||||||
| Angel Oak Mortgage REIT, Inc. |
4,539 | 48,113 | ||||||
| Apollo Commercial Real Estate Finance, Inc. (b) |
46,637 | 547,518 | ||||||
| Arbor Realty Trust, Inc. (b) |
60,290 | 915,202 | ||||||
| ARES Commercial Real Estate Corp. (b) |
17,797 | 184,377 | ||||||
| ARMOUR Residential REIT, Inc. (b) |
16,406 | 316,964 | ||||||
| Blackstone Mortgage Trust, Inc. - Class A (b) |
56,829 | 1,208,753 | ||||||
| BrightSpire Capital, Inc. |
43,419 | 323,037 | ||||||
| Chicago Atlantic Real Estate Finance, Inc. |
5,740 | 92,873 | ||||||
| Chimera Investment Corp. |
78,436 | 391,396 | ||||||
| Claros Mortgage Trust, Inc. (b) |
31,509 | 429,468 | ||||||
| Dynex Capital, Inc. (b) |
17,851 | 223,495 | ||||||
| Ellington Financial, Inc. |
25,082 | 318,792 | ||||||
| Franklin BSP Realty Trust, Inc. (b) |
29,093 | 393,046 | ||||||
| Granite Point Mortgage Trust, Inc. |
17,729 | 105,310 | ||||||
See accompanying notes to financial statements.
BHFTII-16
Brighthouse Funds Trust II
MetLife Russell 2000 Index Portfolio
Schedule of Investments as of December 31, 2023
Common Stocks—(Continued)
| Security Description | Shares | Value | ||||||
| Mortgage Real Estate Investment Trusts—(Continued) | ||||||||
| Hannon Armstrong Sustainable Infrastructure Capital, Inc. (b) |
34,746 | $ | 958,295 | |||||
| Invesco Mortgage Capital, Inc. |
14,200 | 125,812 | ||||||
| KKR Real Estate Finance Trust, Inc. (b) |
19,694 | 260,552 | ||||||
| Ladder Capital Corp. |
39,172 | 450,870 | ||||||
| MFA Financial, Inc. |
33,634 | 379,055 | ||||||
| New York Mortgage Trust, Inc. (b) |
29,554 | 252,096 | ||||||
| Nexpoint Real Estate Finance, Inc. |
2,760 | 43,470 | ||||||
| Orchid Island Capital, Inc. (b) |
17,633 | 148,646 | ||||||
| PennyMac Mortgage Investment Trust |
29,854 | 446,317 | ||||||
| Ready Capital Corp. (b) |
53,836 | 551,819 | ||||||
| Redwood Trust, Inc. (b) |
38,280 | 283,655 | ||||||
| TPG RE Finance Trust, Inc. (b) |
20,840 | 135,460 | ||||||
| Two Harbors Investment Corp. |
32,684 | 455,288 | ||||||
|
|
|
|||||||
| 10,059,285 | ||||||||
|
|
|
|||||||
| Multi-Utilities—0.4% | ||||||||
| Avista Corp. |
25,510 | 911,727 | ||||||
| Black Hills Corp. |
22,343 | 1,205,405 | ||||||
| Northwestern Energy Group, Inc. (b) |
20,178 | 1,026,858 | ||||||
| Unitil Corp. |
5,057 | 265,847 | ||||||
|
|
|
|||||||
| 3,409,837 | ||||||||
|
|
|
|||||||
| Office REITs—0.7% | ||||||||
| Brandywine Realty Trust |
57,362 | 309,755 | ||||||
| City Office REIT, Inc. |
10,797 | 65,970 | ||||||
| COPT Defense Properties |
37,541 | 962,176 | ||||||
| Douglas Emmett, Inc. (b) |
54,193 | 785,798 | ||||||
| Easterly Government Properties, Inc. (b) |
30,700 | 412,608 | ||||||
| Equity Commonwealth |
33,220 | 637,824 | ||||||
| Hudson Pacific Properties, Inc. (b) |
46,635 | 434,172 | ||||||
| JBG SMITH Properties (b) |
33,802 | 574,972 | ||||||
| Office Properties Income Trust |
16,817 | 123,100 | ||||||
| Orion Office REIT, Inc. |
20,172 | 115,384 | ||||||
| Paramount Group, Inc. |
63,271 | 327,111 | ||||||
| Peakstone Realty Trust (b) |
12,370 | 246,534 | ||||||
| Piedmont Office Realty Trust, Inc. - Class A |
41,047 | 291,844 | ||||||
| Postal Realty Trust, Inc. - Class A |
5,867 | 85,423 | ||||||
| SL Green Realty Corp. (b) |
21,168 | 956,159 | ||||||
|
|
|
|||||||
| 6,328,830 | ||||||||
|
|
|
|||||||
| Oil, Gas & Consumable Fuels—4.3% | ||||||||
| Amplify Energy Corp. (a) (b) |
12,277 | 72,803 | ||||||
| Ardmore Shipping Corp. |
13,795 | 194,371 | ||||||
| Berry Corp. |
25,676 | 180,502 | ||||||
| California Resources Corp. (b) |
23,303 | 1,274,208 | ||||||
| Callon Petroleum Co. (a) |
20,557 | 666,047 | ||||||
| Centrus Energy Corp. - Class A (a) (b) |
4,135 | 224,985 | ||||||
| Chord Energy Corp. |
14,046 | 2,334,867 | ||||||
| Civitas Resources, Inc. (b) |
26,907 | 1,839,901 | ||||||
| Clean Energy Fuels Corp. (a) (b) |
54,120 | 207,280 | ||||||
| CNX Resources Corp. (a) (b) |
52,457 | 1,049,140 | ||||||
| Comstock Resources, Inc. (b) |
30,914 | 273,589 | ||||||
| CONSOL Energy, Inc. |
10,171 | 1,022,491 | ||||||
| Crescent Energy Co. - Class A (b) |
26,200 | 346,102 | ||||||
| CVR Energy, Inc. |
10,082 | 305,485 | ||||||
| Oil, Gas & Consumable Fuels—(Continued) | ||||||||
| Delek U.S. Holdings, Inc. |
22,029 | 568,348 | ||||||
| DHT Holdings, Inc. |
46,057 | 451,819 | ||||||
| Dorian LPG Ltd. (b) |
11,086 | 486,343 | ||||||
| Encore Energy Corp. (a) |
49,010 | 192,609 | ||||||
| Energy Fuels, Inc. (a) (b) |
52,621 | 378,345 | ||||||
| Equitrans Midstream Corp. |
146,512 | 1,491,492 | ||||||
| Evolution Petroleum Corp. (b) |
10,655 | 61,906 | ||||||
| Excelerate Energy, Inc. - Class A (b) |
6,800 | 105,128 | ||||||
| FLEX LNG Ltd. |
10,006 | 290,774 | ||||||
| FutureFuel Corp. |
8,809 | 53,559 | ||||||
| Gevo, Inc. (a) (b) |
66,406 | 77,031 | ||||||
| Golar LNG Ltd. |
32,510 | 747,405 | ||||||
| Granite Ridge Resources, Inc. (b) |
9,296 | 55,962 | ||||||
| Green Plains, Inc. (a) (b) |
19,518 | 492,244 | ||||||
| Gulfport Energy Corp. (a) (b) |
3,698 | 492,574 | ||||||
| Hallador Energy Co. (a) (b) |
7,729 | 68,324 | ||||||
| HighPeak Energy, Inc. (b) |
4,361 | 62,101 | ||||||
| International Seaways, Inc. |
13,630 | 619,892 | ||||||
| Kinetik Holdings, Inc. (b) |
5,614 | 187,508 | ||||||
| Kosmos Energy Ltd. (a) |
151,784 | 1,018,471 | ||||||
| Magnolia Oil & Gas Corp. - Class A (b) |
59,583 | 1,268,522 | ||||||
| Matador Resources Co. (b) |
37,921 | 2,156,188 | ||||||
| Murphy Oil Corp. |
49,464 | 2,110,134 | ||||||
| NACCO Industries, Inc. - Class A |
1,389 | 50,698 | ||||||
| NextDecade Corp. (a) (b) |
26,113 | 124,559 | ||||||
| Nordic American Tankers Ltd. |
69,042 | 289,976 | ||||||
| Northern Oil & Gas, Inc. (b) |
29,296 | 1,086,003 | ||||||
| Overseas Shipholding Group, Inc. - Class A |
19,448 | 102,491 | ||||||
| Par Pacific Holdings, Inc. (a) |
18,554 | 674,809 | ||||||
| PBF Energy, Inc. - Class A |
37,048 | 1,628,630 | ||||||
| Peabody Energy Corp. (b) |
38,067 | 925,789 | ||||||
| Permian Resources Corp. (b) |
129,420 | 1,760,112 | ||||||
| REX American Resources Corp. (a) (b) |
5,256 | 248,609 | ||||||
| Riley Exploration Permian, Inc. |
3,073 | 83,708 | ||||||
| Ring Energy, Inc. (a) (b) |
31,938 | 46,629 | ||||||
| SandRidge Energy, Inc. (b) |
10,783 | 147,404 | ||||||
| Scorpio Tankers, Inc. |
15,755 | 957,904 | ||||||
| SFL Corp. Ltd. |
39,560 | 446,237 | ||||||
| SilverBow Resources, Inc. (a) (b) |
7,038 | 204,665 | ||||||
| Sitio Royalties Corp. - Class A (b) |
27,084 | 636,745 | ||||||
| SM Energy Co. (b) |
38,956 | 1,508,376 | ||||||
| Talos Energy, Inc. (a) (b) |
37,534 | 534,109 | ||||||
| Teekay Corp. (a) |
23,214 | 165,980 | ||||||
| Teekay Tankers Ltd. - Class A |
8,028 | 401,159 | ||||||
| Tellurian, Inc. (a) (b) |
171,884 | 129,876 | ||||||
| Uranium Energy Corp. (a) (b) |
123,489 | 790,330 | ||||||
| VAALCO Energy, Inc. (b) |
36,276 | 162,879 | ||||||
| Vertex Energy, Inc. (a) (b) |
22,715 | 77,004 | ||||||
| Vital Energy, Inc. (a) |
7,782 | 354,003 | ||||||
| Vitesse Energy, Inc. |
8,582 | 187,860 | ||||||
| W&T Offshore, Inc. (b) |
33,128 | 107,997 | ||||||
| World Kinect Corp. |
19,981 | 455,167 | ||||||
|
|
|
|||||||
| 37,718,158 | ||||||||
|
|
|
|||||||
See accompanying notes to financial statements.
BHFTII-17
Brighthouse Funds Trust II
MetLife Russell 2000 Index Portfolio
Schedule of Investments as of December 31, 2023
Common Stocks—(Continued)
| Security Description | Shares | Value | ||||||
| Paper & Forest Products—0.1% | ||||||||
| Clearwater Paper Corp. (a) |
5,381 | $ | 194,362 | |||||
| Sylvamo Corp. |
12,273 | 602,727 | ||||||
|
|
|
|||||||
| 797,089 | ||||||||
|
|
|
|||||||
| Passenger Airlines—0.4% | ||||||||
| Allegiant Travel Co. |
5,412 | 447,085 | ||||||
| Blade Air Mobility, Inc. (a) |
20,915 | 73,830 | ||||||
| Frontier Group Holdings, Inc. (a) (b) |
14,756 | 80,568 | ||||||
| Hawaiian Holdings, Inc. (a) |
17,125 | 243,175 | ||||||
| JetBlue Airways Corp. (a) (b) |
110,917 | 615,589 | ||||||
| Joby Aviation, Inc. (a) (b) |
94,014 | 625,193 | ||||||
| SkyWest, Inc. (a) |
13,492 | 704,283 | ||||||
| Spirit Airlines, Inc. |
36,644 | 600,595 | ||||||
| Sun Country Airlines Holdings, Inc. (a) (b) |
12,318 | 193,762 | ||||||
|
|
|
|||||||
| 3,584,080 | ||||||||
|
|
|
|||||||
| Personal Care Products—0.9% | ||||||||
| Beauty Health Co. (a) (b) |
30,052 | 93,462 | ||||||
| BellRing Brands, Inc. (a) |
43,718 | 2,423,289 | ||||||
| Edgewell Personal Care Co. (b) |
16,266 | 595,823 | ||||||
| elf Beauty, Inc. (a) (b) |
17,826 | 2,573,005 | ||||||
| Herbalife Ltd. (a) (b) |
33,308 | 508,280 | ||||||
| Inter Parfums, Inc. |
6,203 | 893,294 | ||||||
| Medifast, Inc. (b) |
3,603 | 242,194 | ||||||
| Nature’s Sunshine Products, Inc. (a) |
4,578 | 79,153 | ||||||
| Nu Skin Enterprises, Inc. - Class A |
16,591 | 322,197 | ||||||
| USANA Health Sciences, Inc. (a) |
3,693 | 197,945 | ||||||
| Waldencast PLC—Class A (a) (b) |
12,854 | 140,623 | ||||||
|
|
|
|||||||
| 8,069,265 | ||||||||
|
|
|
|||||||
| Pharmaceuticals—1.7% | ||||||||
| Amneal Pharmaceuticals, Inc. (a) (b) |
41,091 | 249,422 | ||||||
| Amphastar Pharmaceuticals, Inc. (a) (b) |
13,014 | 804,916 | ||||||
| Amylyx Pharmaceuticals, Inc. (a) |
17,183 | 252,934 | ||||||
| ANI Pharmaceuticals, Inc. (a) |
4,883 | 269,249 | ||||||
| Arvinas, Inc. (a) |
16,311 | 671,361 | ||||||
| Atea Pharmaceuticals, Inc. (a) (b) |
32,816 | 100,089 | ||||||
| Axsome Therapeutics, Inc. (a) (b) |
11,769 | 936,695 | ||||||
| Cassava Sciences, Inc. (a) (b) |
12,781 | 287,700 | ||||||
| Collegium Pharmaceutical, Inc. (a) (b) |
11,356 | 349,538 | ||||||
| Corcept Therapeutics, Inc. (a) |
26,919 | 874,329 | ||||||
| CorMedix, Inc. (a) (b) |
15,077 | 56,689 | ||||||
| Cymabay Therapeutics, Inc. (a) (b) |
37,811 | 893,096 | ||||||
| Edgewise Therapeutics, Inc. (a) |
15,027 | 164,395 | ||||||
| Enliven Therapeutics, Inc. (a) (b) |
7,852 | 108,672 | ||||||
| Evolus, Inc. (a) |
12,622 | 132,910 | ||||||
| EyePoint Pharmaceuticals, Inc. (a) |
8,887 | 205,379 | ||||||
| Harmony Biosciences Holdings, Inc. (a) (b) |
11,160 | 360,468 | ||||||
| Harrow, Inc. (a) (b) |
8,750 | 98,000 | ||||||
| Innoviva, Inc. (a) (b) |
21,386 | 343,031 | ||||||
| Intra-Cellular Therapies, Inc. (a) |
31,401 | 2,248,940 | ||||||
| Ligand Pharmaceuticals, Inc. (a) (b) |
5,595 | 399,595 | ||||||
| Liquidia Corp. (a) (b) |
16,545 | 199,036 | ||||||
| Marinus Pharmaceuticals, Inc. (a) (b) |
16,763 | 182,214 | ||||||
| Neumora Therapeutics, Inc. (a) (b) |
5,399 | 92,053 | ||||||
| Pharmaceuticals—(Continued) | ||||||||
| Nuvation Bio, Inc. (a) |
43,380 | 65,504 | ||||||
| Ocular Therapeutix, Inc. (a) |
26,202 | 116,861 | ||||||
| Omeros Corp. (a) (b) |
20,522 | 67,107 | ||||||
| Pacira BioSciences, Inc. (a) |
15,246 | 514,400 | ||||||
| Phathom Pharmaceuticals, Inc. (a) (b) |
10,477 | 95,655 | ||||||
| Phibro Animal Health Corp. - Class A |
6,746 | 78,119 | ||||||
| Pliant Therapeutics, Inc. (a) (b) |
18,963 | 343,420 | ||||||
| Prestige Consumer Healthcare, Inc. (a) |
16,788 | 1,027,761 | ||||||
| Revance Therapeutics, Inc. (a) (b) |
27,973 | 245,883 | ||||||
| Scilex Holding Co. (a) (b) |
22,005 | 44,890 | ||||||
| scPharmaceuticals, Inc. (a) (b) |
9,746 | 61,107 | ||||||
| SIGA Technologies, Inc. (b) |
18,339 | 102,698 | ||||||
| Supernus Pharmaceuticals, Inc. (a) |
16,728 | 484,108 | ||||||
| Taro Pharmaceutical Industries Ltd. (a) |
2,758 | 115,229 | ||||||
| Tarsus Pharmaceuticals, Inc. (a) (b) |
9,885 | 200,171 | ||||||
| Terns Pharmaceuticals, Inc. (a) |
14,700 | 95,403 | ||||||
| Theravance Biopharma, Inc. (a) (b) |
17,488 | 196,565 | ||||||
| Third Harmonic Bio, Inc. (a) |
7,381 | 80,970 | ||||||
| WaVe Life Sciences Ltd. (a) |
19,986 | 100,929 | ||||||
| Xeris Biopharma Holdings, Inc. (a) |
45,707 | 107,411 | ||||||
| Zevra Therapeutics, Inc. (a) (b) |
11,744 | 76,923 | ||||||
|
|
|
|||||||
| 14,501,825 | ||||||||
|
|
|
|||||||
| Professional Services—2.4% | ||||||||
| Alight, Inc. - Class A (a) |
138,591 | 1,182,181 | ||||||
| ASGN, Inc. (a) |
15,518 | 1,492,366 | ||||||
| Asure Software, Inc. (a) |
6,393 | 60,861 | ||||||
| Barrett Business Services, Inc. |
2,279 | 263,908 | ||||||
| Blacksky Technology, Inc. (a) (b) |
41,812 | 58,537 | ||||||
| CBIZ, Inc. (a) |
15,660 | 980,159 | ||||||
| Conduent, Inc. (a) |
57,110 | 208,452 | ||||||
| CRA International, Inc. |
2,343 | 231,606 | ||||||
| CSG Systems International, Inc. (b) |
10,433 | 555,140 | ||||||
| ExlService Holdings, Inc. (a) |
53,106 | 1,638,320 | ||||||
| Exponent, Inc. (b) |
16,704 | 1,470,620 | ||||||
| First Advantage Corp. (b) |
17,889 | 296,421 | ||||||
| Forrester Research, Inc. (a) |
3,344 | 89,653 | ||||||
| Franklin Covey Co. (a) |
3,849 | 167,547 | ||||||
| Heidrick & Struggles International, Inc. |
6,268 | 185,094 | ||||||
| HireRight Holdings Corp. (a) |
5,408 | 72,738 | ||||||
| Huron Consulting Group, Inc. (a) |
6,424 | 660,387 | ||||||
| IBEX Holdings Ltd. (a) |
3,027 | 57,543 | ||||||
| ICF International, Inc. |
6,347 | 851,069 | ||||||
| Innodata, Inc. (a) (b) |
8,488 | 69,092 | ||||||
| Insperity, Inc. |
11,836 | 1,387,416 | ||||||
| Kelly Services, Inc. - Class A |
11,083 | 239,615 | ||||||
| Kforce, Inc. (b) |
6,564 | 443,464 | ||||||
| Korn Ferry |
17,703 | 1,050,673 | ||||||
| Legalzoom.com, Inc. (a) |
39,984 | 451,819 | ||||||
| Maximus, Inc. |
20,406 | 1,711,247 | ||||||
| Mistras Group, Inc. (a) (b) |
7,064 | 51,709 | ||||||
| NV5 Global, Inc. (a) |
4,636 | 515,152 | ||||||
| Parsons Corp. (a) |
13,848 | 868,408 | ||||||
| Planet Labs PBC (a) (b) |
67,186 | 165,949 | ||||||
| Resources Connection, Inc. |
11,231 | 159,143 | ||||||
| Sterling Check Corp. (a) (b) |
10,883 | 151,491 | ||||||
See accompanying notes to financial statements.
BHFTII-18
Brighthouse Funds Trust II
MetLife Russell 2000 Index Portfolio
Schedule of Investments as of December 31, 2023
Common Stocks—(Continued)
| Security Description | Shares | Value | ||||||
| Professional Services—(Continued) | ||||||||
| TriNet Group, Inc. (a) (b) |
10,657 | $ | 1,267,437 | |||||
| TrueBlue, Inc. (a) |
10,956 | 168,065 | ||||||
| TTEC Holdings, Inc. |
6,343 | 137,453 | ||||||
| Upwork, Inc. (a) |
41,273 | 613,730 | ||||||
| Verra Mobility Corp. (a) |
47,250 | 1,088,168 | ||||||
| Willdan Group, Inc. (a) (b) |
4,570 | 98,255 | ||||||
|
|
|
|||||||
| 21,160,888 | ||||||||
|
|
|
|||||||
| Real Estate Management & Development—0.8% | ||||||||
| Anywhere Real Estate, Inc. (a) (b) |
34,390 | 278,903 | ||||||
| Compass, Inc. - Class A (a) (b) |
101,376 | 381,174 | ||||||
| Cushman & Wakefield PLC (a) (b) |
55,865 | 603,342 | ||||||
| DigitalBridge Group, Inc. |
53,465 | 937,776 | ||||||
| Douglas Elliman, Inc. |
28,807 | 84,981 | ||||||
| eXp World Holdings, Inc. (b) |
23,278 | 361,275 | ||||||
| Forestar Group, Inc. (a) (b) |
5,572 | 184,266 | ||||||
| FRP Holdings, Inc. (a) |
2,285 | 143,681 | ||||||
| Kennedy-Wilson Holdings, Inc. (b) |
39,493 | 488,923 | ||||||
| Marcus & Millichap, Inc. (b) |
7,486 | 326,989 | ||||||
| Newmark Group, Inc. - Class A |
44,390 | 486,514 | ||||||
| Opendoor Technologies, Inc. (a) (b) |
184,227 | 825,337 | ||||||
| RE/MAX Holdings, Inc. - Class A (b) |
6,249 | 83,299 | ||||||
| Redfin Corp. (a) (b) |
35,890 | 370,385 | ||||||
| RMR Group, Inc. - Class A |
4,706 | 132,850 | ||||||
| St. Joe Co. |
11,618 | 699,171 | ||||||
| Star Holdings (a) |
4,337 | 64,968 | ||||||
| Stratus Properties, Inc. (a) |
1,950 | 56,277 | ||||||
| Tejon Ranch Co. (a) (b) |
7,461 | 128,329 | ||||||
|
|
|
|||||||
| 6,638,440 | ||||||||
|
|
|
|||||||
| Residential REITs—0.4% | ||||||||
| Apartment Investment & Management Co. - Class A (a) |
49,916 | 390,842 | ||||||
| BRT Apartments Corp. |
3,996 | 74,286 | ||||||
| Centerspace |
5,179 | 301,418 | ||||||
| Elme Communities |
30,151 | 440,205 | ||||||
| Independence Realty Trust, Inc. |
75,182 | 1,150,284 | ||||||
| NexPoint Residential Trust, Inc. |
6,946 | 239,151 | ||||||
| UMH Properties, Inc. |
19,976 | 306,032 | ||||||
| Veris Residential, Inc. (b) |
26,617 | 418,685 | ||||||
|
|
|
|||||||
| 3,320,903 | ||||||||
|
|
|
|||||||
| Retail REITs—1.1% | ||||||||
| Acadia Realty Trust (b) |
31,446 | 534,267 | ||||||
| Alexander’s, Inc. |
759 | 162,100 | ||||||
| CBL & Associates Properties, Inc. (b) |
9,399 | 229,524 | ||||||
| Getty Realty Corp. |
15,914 | 465,007 | ||||||
| InvenTrust Properties Corp. |
23,184 | 587,482 | ||||||
| Kite Realty Group Trust |
73,131 | 1,671,775 | ||||||
| Macerich Co. (b) |
71,062 | 1,096,487 | ||||||
| NETSTREIT Corp. (b) |
22,581 | 403,071 | ||||||
| Phillips Edison & Co., Inc. (b) |
39,363 | 1,435,962 | ||||||
| Retail Opportunity Investments Corp. |
41,820 | 586,735 | ||||||
| Saul Centers, Inc. (b) |
3,884 | 152,525 | ||||||
| SITE Centers Corp. |
62,650 | 853,919 | ||||||
| Tanger, Inc. (b) |
33,335 | 924,046 | ||||||
| Retail REITs—(Continued) | ||||||||
| Urban Edge Properties |
37,458 | 685,481 | ||||||
| Whitestone REIT (b) |
15,859 | 194,907 | ||||||
|
|
|
|||||||
| 9,983,288 | ||||||||
|
|
|
|||||||
| Semiconductors & Semiconductor Equipment—3.0% | ||||||||
| ACM Research, Inc. - Class A (a) |
16,205 | 316,646 | ||||||
| Aehr Test Systems (a) (b) |
8,684 | 230,387 | ||||||
| Alpha & Omega Semiconductor Ltd. (a) |
7,372 | 192,114 | ||||||
| Ambarella, Inc. (a) |
12,522 | 767,473 | ||||||
| Amkor Technology, Inc. |
37,486 | 1,247,159 | ||||||
| Atomera, Inc. (a) (b) |
7,079 | 49,624 | ||||||
| Axcelis Technologies, Inc. (a) |
10,801 | 1,400,782 | ||||||
| CEVA, Inc. (a) (b) |
8,407 | 190,923 | ||||||
| Cohu, Inc. (a) |
15,880 | 561,993 | ||||||
| Credo Technology Group Holding Ltd. (a) (b) |
38,492 | 749,439 | ||||||
| Diodes, Inc. (a) (b) |
15,147 | 1,219,636 | ||||||
| FormFactor, Inc. (a) (c) |
26,288 | 1,096,472 | ||||||
| Ichor Holdings Ltd. (a) (b) |
10,143 | 341,109 | ||||||
| Impinj, Inc. (a) (b) |
7,712 | 694,311 | ||||||
| indie Semiconductor, Inc. - Class A (a) (b) |
50,888 | 412,702 | ||||||
| inTEST Corp. (a) |
3,622 | 49,259 | ||||||
| Kulicke & Soffa Industries, Inc. (b) |
18,462 | 1,010,241 | ||||||
| MACOM Technology Solutions Holdings, Inc. (a) (b) |
18,249 | 1,696,245 | ||||||
| Maxeon Solar Technologies Ltd. (a) (b) |
8,482 | 60,816 | ||||||
| MaxLinear, Inc. (a) |
25,368 | 602,997 | ||||||
| Navitas Semiconductor Corp. (a) |
37,202 | 300,220 | ||||||
| NVE Corp. (b) |
1,605 | 125,880 | ||||||
| Onto Innovation, Inc. (a) |
16,424 | 2,511,230 | ||||||
| PDF Solutions, Inc. (a) (b) |
10,025 | 322,204 | ||||||
| Photronics, Inc. (a) |
21,105 | 662,064 | ||||||
| Power Integrations, Inc. (b) |
19,120 | 1,569,943 | ||||||
| Rambus, Inc. (a) (b) |
36,566 | 2,495,630 | ||||||
| Semtech Corp. (a) (b) |
21,007 | 460,263 | ||||||
| Silicon Laboratories, Inc. (a) |
10,647 | 1,408,279 | ||||||
| SiTime Corp. (a) (b) |
5,763 | 703,547 | ||||||
| SkyWater Technology, Inc. (a) |
6,922 | 66,590 | ||||||
| SMART Global Holdings, Inc. (a) (b) |
16,723 | 316,566 | ||||||
| Synaptics, Inc. (a) |
13,012 | 1,484,409 | ||||||
| Ultra Clean Holdings, Inc. (a) |
14,480 | 494,347 | ||||||
| Veeco Instruments, Inc. (a) (b) |
16,657 | 516,867 | ||||||
|
|
|
|||||||
| 26,328,367 | ||||||||
|
|
|
|||||||
| Software—5.7% | ||||||||
| 8x8, Inc. (a) |
37,978 | 143,557 | ||||||
| A10 Networks, Inc. |
23,716 | 312,340 | ||||||
| ACI Worldwide, Inc. (a) |
36,393 | 1,113,626 | ||||||
| Adeia, Inc. |
35,163 | 435,670 | ||||||
| Agilysys, Inc. (a) |
6,690 | 567,446 | ||||||
| Alarm.com Holdings, Inc. (a) |
16,373 | 1,058,023 | ||||||
| Alkami Technology, Inc. (a) |
13,618 | 330,237 | ||||||
| Altair Engineering, Inc. - Class A (a) (b) |
18,018 | 1,516,215 | ||||||
| American Software, Inc. - Class A |
11,730 | 132,549 | ||||||
| Amplitude, Inc. - Class A (a) |
23,067 | 293,412 | ||||||
| Appfolio, Inc. - Class A (a) |
6,309 | 1,092,971 | ||||||
| Appian Corp. - Class A (a) |
13,931 | 524,641 | ||||||
| Asana, Inc. - Class A (a) (b) |
26,813 | 509,715 | ||||||
See accompanying notes to financial statements.
BHFTII-19
Brighthouse Funds Trust II
MetLife Russell 2000 Index Portfolio
Schedule of Investments as of December 31, 2023
Common Stocks—(Continued)
| Security Description | Shares | Value | ||||||
| Software—(Continued) | ||||||||
| Aurora Innovation, Inc. (a) (b) |
112,809 | $ | 492,975 | |||||
| AvePoint, Inc. (a) |
52,062 | 427,429 | ||||||
| Bit Digital, Inc. (a) (b) |
25,236 | 106,748 | ||||||
| Blackbaud, Inc. (a) |
14,609 | 1,266,600 | ||||||
| BlackLine, Inc. (a) |
18,965 | 1,184,175 | ||||||
| Box, Inc. - Class A (a) |
47,952 | 1,228,051 | ||||||
| Braze, Inc. - Class A (a) |
17,609 | 935,566 | ||||||
| C3.ai, Inc. - Class A (a) (b) |
27,271 | 782,950 | ||||||
| Cerence, Inc. (a) (b) |
13,068 | 256,917 | ||||||
| Cleanspark, Inc. (a) (b) |
50,398 | 555,890 | ||||||
| Clear Secure, Inc. - Class A |
28,113 | 580,533 | ||||||
| CommVault Systems, Inc. (a) |
14,745 | 1,177,388 | ||||||
| Consensus Cloud Solutions, Inc. (a) |
6,453 | 169,133 | ||||||
| CS Disco, Inc. (a) |
8,074 | 61,282 | ||||||
| Digimarc Corp. (a) (b) |
4,269 | 154,196 | ||||||
| Digital Turbine, Inc. (a) |
31,408 | 215,459 | ||||||
| Domo, Inc. - Class B (a) |
9,814 | 100,986 | ||||||
| E2open Parent Holdings, Inc. (a) (b) |
57,793 | 253,711 | ||||||
| eGain Corp. (a) |
7,231 | 60,234 | ||||||
| Enfusion, Inc. - Class A (a) (b) |
13,228 | 128,312 | ||||||
| EngageSmart, Inc. (a) |
16,515 | 378,194 | ||||||
| Envestnet, Inc. (a) (b) |
16,807 | 832,283 | ||||||
| Everbridge, Inc. (a) |
13,337 | 324,222 | ||||||
| EverCommerce, Inc. (a) |
8,186 | 90,292 | ||||||
| Expensify, Inc. - Class A (a) |
19,004 | 46,940 | ||||||
| Freshworks, Inc. - Class A (a) |
54,559 | 1,281,591 | ||||||
| Instructure Holdings, Inc. (a) |
6,115 | 165,166 | ||||||
| Intapp, Inc. (a) (b) |
9,390 | 357,008 | ||||||
| InterDigital, Inc. (b) |
8,704 | 944,732 | ||||||
| Jamf Holding Corp. (a) (b) |
23,449 | 423,489 | ||||||
| Kaltura, Inc. (a) (b) |
29,792 | 58,094 | ||||||
| LivePerson, Inc. (a) |
24,311 | 92,139 | ||||||
| LiveRamp Holdings, Inc. (a) |
22,004 | 833,512 | ||||||
| Marathon Digital Holdings, Inc. (a) (b) |
70,873 | 1,664,807 | ||||||
| Matterport, Inc. (a) (b) |
85,429 | 229,804 | ||||||
| MeridianLink, Inc. (a) (b) |
8,983 | 222,509 | ||||||
| MicroStrategy, Inc. - Class A (a) (b) |
4,063 | 2,566,272 | ||||||
| Mitek Systems, Inc. (a) (b) |
15,147 | 197,517 | ||||||
| Model N, Inc. (a) |
12,650 | 340,665 | ||||||
| N-able, Inc. (a) |
24,099 | 319,312 | ||||||
| NextNav, Inc. (a) (b) |
19,614 | 87,282 | ||||||
| Olo, Inc. - Class A (a) |
35,254 | 201,653 | ||||||
| ON24, Inc. |
10,058 | 79,257 | ||||||
| OneSpan, Inc. (a) |
13,014 | 139,510 | ||||||
| PagerDuty, Inc. (a) (b) |
29,670 | 686,860 | ||||||
| PowerSchool Holdings, Inc. - Class A (a) (b) |
19,001 | 447,664 | ||||||
| Progress Software Corp. (b) |
14,601 | 792,834 | ||||||
| PROS Holdings, Inc. (a) |
15,005 | 582,044 | ||||||
| Q2 Holdings, Inc. (a) (b) |
18,911 | 820,927 | ||||||
| Qualys, Inc. (a) (b) |
12,476 | 2,448,789 | ||||||
| Rapid7, Inc. (a) (b) |
19,953 | 1,139,316 | ||||||
| Red Violet, Inc. (a) |
3,327 | 66,440 | ||||||
| Rimini Street, Inc. (a) (b) |
16,821 | 55,005 | ||||||
| Riot Platforms, Inc. (a) (b) |
63,362 | 980,210 | ||||||
| Sapiens International Corp. NV |
9,820 | 284,191 | ||||||
| SEMrush Holdings, Inc. - Class A (a) (b) |
10,967 | 149,809 | ||||||
| SolarWinds Corp. (a) |
16,368 | 204,436 | ||||||
| Software—(Continued) | ||||||||
| SoundHound AI, Inc. - Class A (a) (b) |
47,985 | 101,728 | ||||||
| SoundThinking, Inc. (a) |
3,138 | 80,145 | ||||||
| Sprinklr, Inc. - Class A (a) |
34,779 | 418,739 | ||||||
| Sprout Social, Inc. - Class A (a) (b) |
15,663 | 962,335 | ||||||
| SPS Commerce, Inc. (a) |
12,307 | 2,385,589 | ||||||
| Tenable Holdings, Inc. (a) |
38,291 | 1,763,683 | ||||||
| Terawulf, Inc. (a) (b) |
45,615 | 109,476 | ||||||
| Varonis Systems, Inc. (a) (b) |
35,958 | 1,628,178 | ||||||
| Verint Systems, Inc. (a) |
20,243 | 547,168 | ||||||
| Weave Communications, Inc. (a) |
12,297 | 141,047 | ||||||
| Workiva, Inc. (a) (b) |
16,400 | 1,665,092 | ||||||
| Xperi, Inc. (a) |
14,065 | 154,996 | ||||||
| Yext, Inc. (a) |
34,660 | 204,147 | ||||||
| Zeta Global Holdings Corp. - Class A (a) |
45,460 | 400,957 | ||||||
| Zuora, Inc. - Class A (a) (b) |
42,438 | 398,917 | ||||||
|
|
|
|||||||
| 49,665,909 | ||||||||
|
|
|
|||||||
| Specialized REITs—0.4% | ||||||||
| Farmland Partners, Inc. (b) |
15,523 | 193,727 | ||||||
| Four Corners Property Trust, Inc. (b) |
30,138 | 762,491 | ||||||
| Gladstone Land Corp. |
10,827 | 156,450 | ||||||
| Outfront Media, Inc. |
49,314 | 688,423 | ||||||
| PotlatchDeltic Corp. |
25,955 | 1,274,391 | ||||||
| Safehold, Inc. (b) |
16,229 | 379,759 | ||||||
| Uniti Group, Inc. (b) |
80,157 | 463,308 | ||||||
|
|
|
|||||||
| 3,918,549 | ||||||||
|
|
|
|||||||
| Specialty Retail—2.6% | ||||||||
| 1-800-Flowers.com, Inc. - Class A (a) (b) |
9,265 | 99,877 | ||||||
| Aaron’s Co., Inc. |
10,896 | 118,548 | ||||||
| Abercrombie & Fitch Co. - Class A (a) (b) |
16,478 | 1,453,689 | ||||||
| Academy Sports & Outdoors, Inc. |
24,165 | 1,594,890 | ||||||
| America’s Car-Mart, Inc. (a) (b) |
2,086 | 158,056 | ||||||
| American Eagle Outfitters, Inc. (b) |
61,334 | 1,297,827 | ||||||
| Arko Corp. (b) |
31,060 | 256,245 | ||||||
| Asbury Automotive Group, Inc. (a) (b) |
6,920 | 1,556,792 | ||||||
| Beyond, Inc. (a) |
15,298 | 423,602 | ||||||
| Big 5 Sporting Goods Corp. (b) |
7,812 | 49,528 | ||||||
| Boot Barn Holdings, Inc. (a) (b) |
10,047 | 771,208 | ||||||
| Buckle, Inc. |
10,213 | 485,322 | ||||||
| Build-A-Bear Workshop, Inc. (b) |
4,959 | 114,007 | ||||||
| Caleres, Inc. (b) |
11,585 | 356,007 | ||||||
| Camping World Holdings, Inc. - Class A |
14,044 | 368,795 | ||||||
| CarParts.com, Inc. (a) |
18,022 | 56,950 | ||||||
| Carvana Co. (a) (b) |
32,198 | 1,704,562 | ||||||
| Chico’s FAS, Inc. (a) (b) |
41,529 | 314,790 | ||||||
| Children’s Place, Inc. (a) |
3,971 | 92,207 | ||||||
| Designer Brands, Inc. - Class A (b) |
12,484 | 110,483 | ||||||
| Destination XL Group, Inc. (a) (b) |
19,702 | 86,689 | ||||||
| EVgo, Inc. (a) (b) |
35,436 | 126,861 | ||||||
| Foot Locker, Inc. (b) |
27,087 | 843,760 | ||||||
| Genesco, Inc. (a) |
3,961 | 139,467 | ||||||
| Group 1 Automotive, Inc. |
4,603 | 1,402,718 | ||||||
| GrowGeneration Corp. (a) (b) |
19,482 | 48,900 | ||||||
| Guess?, Inc. (b) |
9,669 | 222,967 | ||||||
| Haverty Furniture Cos., Inc. (b) |
4,960 | 176,080 | ||||||
See accompanying notes to financial statements.
BHFTII-20
Brighthouse Funds Trust II
MetLife Russell 2000 Index Portfolio
Schedule of Investments as of December 31, 2023
Common Stocks—(Continued)
| Security Description | Shares | Value | ||||||
| Specialty Retail—(Continued) | ||||||||
| Hibbett, Inc. (b) |
4,141 | $ | 298,235 | |||||
| Lands’ End, Inc. (a) |
5,131 | 49,052 | ||||||
| Leslie’s, Inc. (a) (b) |
59,966 | 414,365 | ||||||
| MarineMax, Inc. (a) |
7,339 | 285,487 | ||||||
| Monro, Inc. (b) |
10,365 | 304,109 | ||||||
| National Vision Holdings, Inc. (a) |
26,199 | 548,345 | ||||||
| ODP Corp. (a) |
10,699 | 602,354 | ||||||
| OneWater Marine, Inc. - Class A (a) (b) |
3,644 | 123,131 | ||||||
| PetMed Express, Inc. |
6,446 | 48,732 | ||||||
| Revolve Group, Inc. (a) (b) |
14,472 | 239,946 | ||||||
| Sally Beauty Holdings, Inc. (a) (b) |
36,161 | 480,218 | ||||||
| Shoe Carnival, Inc. (b) |
6,132 | 185,248 | ||||||
| Signet Jewelers Ltd. (b) |
14,667 | 1,573,182 | ||||||
| Sleep Number Corp. (a) |
7,502 | 111,255 | ||||||
| Sonic Automotive, Inc. - Class A (b) |
5,221 | 293,472 | ||||||
| Sportsman’s Warehouse Holdings, Inc. (a) |
10,935 | 46,583 | ||||||
| Stitch Fix, Inc. - Class A (a) |
28,562 | 101,966 | ||||||
| ThredUp, Inc. - Class A (a) |
22,896 | 51,516 | ||||||
| Tile Shop Holdings, Inc. (a) |
9,826 | 72,319 | ||||||
| Tilly’s, Inc. - Class A (a) |
7,804 | 58,842 | ||||||
| Upbound Group, Inc. (b) |
17,965 | 610,271 | ||||||
| Urban Outfitters, Inc. (a) |
21,577 | 770,083 | ||||||
| Warby Parker, Inc. - Class A (a) |
28,895 | 407,420 | ||||||
| Winmark Corp. |
994 | 415,045 | ||||||
| Zumiez, Inc. (a) |
5,111 | 103,958 | ||||||
|
|
|
|||||||
| 22,625,961 | ||||||||
|
|
|
|||||||
| Technology Hardware, Storage & Peripherals—0.7% | ||||||||
| Corsair Gaming, Inc. (a) |
13,698 | 193,142 | ||||||
| Eastman Kodak Co. (a) |
19,889 | 77,567 | ||||||
| Immersion Corp. (b) |
10,580 | 74,695 | ||||||
| IonQ, Inc. (a) (b) |
54,320 | 673,025 | ||||||
| Super Micro Computer, Inc. (a) |
15,470 | 4,397,502 | ||||||
| Turtle Beach Corp. (a) (b) |
5,364 | 58,736 | ||||||
| Xerox Holdings Corp. |
38,468 | 705,118 | ||||||
|
|
|
|||||||
| 6,179,785 | ||||||||
|
|
|
|||||||
| Textiles, Apparel & Luxury Goods—0.5% | ||||||||
| Figs, Inc. - Class A (a) (b) |
44,317 | 308,003 | ||||||
| G-III Apparel Group Ltd. (a) |
13,787 | 468,482 | ||||||
| Hanesbrands, Inc. (a) (b) |
118,172 | 527,047 | ||||||
| Kontoor Brands, Inc. (b) |
18,681 | 1,166,068 | ||||||
| Movado Group, Inc. |
4,696 | 141,585 | ||||||
| Oxford Industries, Inc. (b) |
4,988 | 498,800 | ||||||
| Rocky Brands, Inc. (b) |
2,393 | 72,221 | ||||||
| Steven Madden Ltd. (b) |
25,264 | 1,061,088 | ||||||
| Vera Bradley, Inc. (a) |
8,929 | 68,753 | ||||||
| Wolverine World Wide, Inc. (b) |
26,161 | 232,571 | ||||||
|
|
|
|||||||
| 4,544,618 | ||||||||
|
|
|
|||||||
| Tobacco—0.2% | ||||||||
| Ispire Technology, Inc. (a) (b) |
6,668 | 80,883 | ||||||
| Turning Point Brands, Inc. |
5,617 | 147,839 | ||||||
| Universal Corp. (b) |
8,059 | 542,532 | ||||||
| Tobacco—(Continued) | ||||||||
| Vector Group Ltd. |
48,791 | 550,363 | ||||||
|
|
|
|||||||
| 1,321,617 | ||||||||
|
|
|
|||||||
| Trading Companies & Distributors—2.0% | ||||||||
| Alta Equipment Group, Inc. |
7,040 | 87,085 | ||||||
| Applied Industrial Technologies, Inc. |
12,837 | 2,216,821 | ||||||
| Beacon Roofing Supply, Inc. (a) |
19,289 | 1,678,529 | ||||||
| BlueLinx Holdings, Inc. (a) |
2,908 | 329,505 | ||||||
| Boise Cascade Co. (b) |
13,372 | 1,729,802 | ||||||
| Custom Truck One Source, Inc. (a) |
20,077 | 124,076 | ||||||
| Distribution Solutions Group, Inc. (a) (b) |
3,388 | 106,925 | ||||||
| DXP Enterprises, Inc. (a) |
4,806 | 161,962 | ||||||
| FTAI Aviation Ltd. |
33,508 | 1,554,771 | ||||||
| GATX Corp. (b) |
11,909 | 1,431,700 | ||||||
| Global Industrial Co. |
3,989 | 154,933 | ||||||
| GMS, Inc. (a) |
13,401 | 1,104,644 | ||||||
| H&E Equipment Services, Inc. |
10,452 | 546,849 | ||||||
| Herc Holdings, Inc. |
9,481 | 1,411,626 | ||||||
| Hudson Technologies, Inc. (a) |
14,689 | 198,155 | ||||||
| Karat Packaging, Inc. (b) |
2,148 | 53,378 | ||||||
| McGrath RentCorp |
8,283 | 990,812 | ||||||
| MRC Global, Inc. (a) |
28,411 | 312,805 | ||||||
| NOW, Inc. (a) |
33,807 | 382,695 | ||||||
| Rush Enterprises, Inc. - Class A (b) |
20,887 | 1,050,616 | ||||||
| Rush Enterprises, Inc. - Class B (b) |
2,708 | 143,470 | ||||||
| Textainer Group Holdings Ltd. |
13,463 | 662,380 | ||||||
| Titan Machinery, Inc. (a) |
6,828 | 197,193 | ||||||
| Transcat, Inc. (a) (b) |
2,736 | 299,127 | ||||||
| Willis Lease Finance Corp. (a) |
960 | 46,925 | ||||||
| Xometry, Inc. - Class A (a) (b) |
11,657 | 418,603 | ||||||
|
|
|
|||||||
| 17,395,387 | ||||||||
|
|
|
|||||||
| Water Utilities—0.4% | ||||||||
| American States Water Co. |
12,211 | 982,009 | ||||||
| Artesian Resources Corp. - Class A (b) |
2,874 | 119,127 | ||||||
| Cadiz, Inc. (a) (b) |
13,587 | 38,044 | ||||||
| California Water Service Group (b) |
19,296 | 1,000,883 | ||||||
| Consolidated Water Co. Ltd. (b) |
5,040 | 179,424 | ||||||
| Global Water Resources, Inc. |
4,624 | 60,482 | ||||||
| Middlesex Water Co. |
5,991 | 393,129 | ||||||
| Pure Cycle Corp. (a) |
6,829 | 71,500 | ||||||
| SJW Group (b) |
10,391 | 679,052 | ||||||
| York Water Co. |
5,110 | 197,348 | ||||||
|
|
|
|||||||
| 3,720,998 | ||||||||
|
|
|
|||||||
| Wireless Telecommunication Services—0.1% | ||||||||
| Gogo, Inc. (a) (b) |
22,220 | 225,089 | ||||||
| Spok Holdings, Inc. (b) |
5,955 | 92,183 | ||||||
| Telephone & Data Systems, Inc. |
34,718 | 637,075 | ||||||
| Tingo Group, Inc. (a) (d) (e) |
44,053 | 30,397 | ||||||
|
|
|
|||||||
| 984,744 | ||||||||
|
|
|
|||||||
| Total Common Stocks |
842,950,411 | |||||||
|
|
|
|||||||
See accompanying notes to financial statements.
BHFTII-21
Brighthouse Funds Trust II
MetLife Russell 2000 Index Portfolio
Schedule of Investments as of December 31, 2023
Mutual Funds—1.5%
| Security Description | Shares/ Principal Amount* |
Value | ||||||
| Investment Company Securities—1.5% | ||||||||
| iShares Russell 2000 ETF (b) |
65,800 | $ | 13,206,718 | |||||
|
|
|
|||||||
| Rights—0.0% |
| |||||||
| Biotechnology—0.0% | ||||||||
| Cartesian Therapeutics, Inc.(a) (b) |
39,548 | 7,119 | ||||||
| Chinook Therapeutics, Inc.(a) |
19,453 | 7,587 | ||||||
| Tobira Therapeutics, Inc.(a) (d) (e) |
4,660 | 37,093 | ||||||
|
|
|
|||||||
| Total Rights |
51,799 | |||||||
|
|
|
|||||||
| Warrants—0.0% |
| |||||||
| Energy Equipment & Services—0.0% | ||||||||
| Nabors Industries Ltd., Expires 06/11/26 (a) |
882 | 9,261 | ||||||
|
|
|
|||||||
| Pharmaceuticals—0.0% | ||||||||
| Cassava Sciences, Inc., Expires 11/15/24 (a) |
5,112 | 2,607 | ||||||
|
|
|
|||||||
| Total Warrants |
11,868 | |||||||
|
|
|
|||||||
| Short-Term Investments—2.3% |
| |||||||
| U.S. Treasury—2.3% | ||||||||
| U.S. Treasury Bills |
2,075,000 | 2,075,000 | ||||||
| 5.228%, 02/06/24 (f) |
17,775,000 | 17,683,764 | ||||||
|
|
|
|||||||
| Total Short-Term Investments |
19,758,764 | |||||||
|
|
|
|||||||
| Securities Lending Reinvestments (g)—16.2% |
| |||||||
| Certificates of Deposit—1.5% | ||||||||
| Barclays Bank PLC |
2,000,000 | 1,999,994 | ||||||
| Mizuho Bank Ltd. |
1,000,000 | 1,000,453 | ||||||
| MUFG Bank Ltd. (London) |
1,000,000 | 992,110 | ||||||
| Oversea-Chinese Banking Corp. Ltd. |
3,000,000 | 3,000,312 | ||||||
| Standard Chartered Bank |
2,000,000 | 2,000,000 | ||||||
| Sumitomo Mitsui Trust Bank Ltd. |
2,000,000 | 2,001,190 | ||||||
| Westpac Banking Corp. |
2,000,000 | 2,002,478 | ||||||
|
|
|
|||||||
| 12,996,537 | ||||||||
|
|
|
|||||||
| Commercial Paper—0.5% | ||||||||
| Australia & New Zealand Banking Group Ltd. |
2,000,000 | 1,966,676 | ||||||
| 5.730%, SOFR + 0.330%, 04/18/24 (h) |
2,000,000 | 2,000,448 | ||||||
|
|
|
|||||||
| 3,967,124 | ||||||||
|
|
|
|||||||
| Repurchase Agreements—11.4% | ||||||||
| Bank of Nova Scotia |
10,305,000 | 10,305,000 | ||||||
| Barclays Bank PLC |
1,300,000 | 1,300,000 | ||||||
| Repurchase Agreement dated 12/29/23 at 5.450%, due on 01/02/24 with a maturity value of $4,002,422; collateralized by various Common Stock with an aggregate market value of $4,459,247. |
4,000,000 | 4,000,000 | ||||||
| Cantor Fitzgerald & Co. |
12,350,000 | 12,350,000 | ||||||
| Citigroup Global Markets, Inc. |
2,000,000 | 2,000,000 | ||||||
| Repurchase Agreement dated 12/29/23 at 5.870%, due on 07/01/24 with a maturity value of $6,180,992; collateralized by U.S. Treasury Obligations with rates ranging from 0.875% - 3.750%, maturity dates ranging from 05/15/28 - 02/15/32, and various Common Stock with an aggregate market value of $6,120,028. |
6,000,000 | 6,000,000 | ||||||
| Deutsche Bank Securities, Inc. |
13,888,613 | 13,888,613 | ||||||
| National Bank Financial, Inc. |
2,000,000 | 2,000,000 | ||||||
See accompanying notes to financial statements.
BHFTII-22
Brighthouse Funds Trust II
MetLife Russell 2000 Index Portfolio
Schedule of Investments as of December 31, 2023
Securities Lending Reinvestments (g)—(Continued)
| Security Description | Shares/ Principal Amount* |
Value | ||||||
| Repurchase Agreements—(Continued) | ||||||||
| National Bank of Canada |
15,000,000 | $ | 15,000,000 | |||||
| NBC Global Finance Ltd. |
16,500,000 | 16,500,000 | ||||||
| Royal Bank of Canada Toronto |
3,000,000 | 3,000,000 | ||||||
| Societe Generale |
7,000,000 | 7,000,000 | ||||||
| Repurchase Agreement dated 12/29/23 at 5.510%, due on 01/02/24 with a maturity value of $2,067,242; collateralized by various Common Stock with an aggregate market value of $2,299,707. |
2,065,977 | 2,065,977 | ||||||
| TD Prime Services LLC |
4,000,000 | 4,000,000 | ||||||
|
|
|
|||||||
| 99,409,590 | ||||||||
|
|
|
|||||||
| Time Deposits—1.1% | ||||||||
| First Abu Dhabi Bank USA NV |
5,000,000 | 5,000,000 | ||||||
| National Bank of Canada |
5,000,000 | 5,000,000 | ||||||
|
|
|
|||||||
| 10,000,000 | ||||||||
|
|
|
|||||||
| Mutual Funds—1.7% | ||||||||
| BlackRock Liquidity Funds FedFund, Institutional Shares |
5,000,000 | 5,000,000 | ||||||
| Dreyfus Treasury Obligations Cash Management Fund, Institutional Class 5.250% (i) |
2,000,000 | 2,000,000 | ||||||
| Mutual Funds—(Continued) | ||||||||
| Goldman Sachs Financial Square Government Fund, Institutional Shares 5.230% (i) |
5,000,000 | 5,000,000 | ||||||
| Morgan Stanley Liquidity Funds Government Portfolio, Institutional Shares 5.270% (i) |
2,000,000 | 2,000,000 | ||||||
| RBC U.S. Government Money Market Fund, Institutional Share 5.230% (i) |
1,000,000 | 1,000,000 | ||||||
|
|
|
|||||||
| 15,000,000 | ||||||||
|
|
|
|||||||
| Total Securities Lending Reinvestments |
141,373,251 | |||||||
|
|
|
|||||||
| Total Investments—116.5% |
1,017,352,811 | |||||||
| Other assets and liabilities (net) —(16.5)% |
(143,811,666 | ) | ||||||
|
|
|
|||||||
| Net Assets—100.0% | $ | 873,541,145 | ||||||
|
|
|
|||||||
| * | Principal amount stated in U.S. dollars unless otherwise noted. | |||
| (a) | Non-income producing security. | |||
| (b) | All or a portion of the security was held on loan. As of December 31, 2023, the market value of securities loaned was $190,457,239 and the collateral received consisted of cash in the amount of $141,337,967 and non-cash collateral with a value of $58,797,525. The cash collateral investments are disclosed in the Schedule of Investments and categorized as Securities Lending Reinvestments. The non-cash collateral received consists of U.S. government securities that are held in safe-keeping by the lending agent, or a third-party custodian, and cannot be sold or repledged by the Portfolio. As such, this collateral is excluded from the Statement of Assets and Liabilities. | |||
| (c) | All or a portion of the security was pledged as collateral against open futures contracts. As of December 31, 2023, the market value of securities pledged was $3,284,652. | |||
| (d) | Significant unobservable inputs were used in the valuation of this portfolio security; i.e. Level 3. | |||
| (e) | Security was valued in good faith under procedures subject to oversight by the Board of Trustees. As of December 31, 2023, these securities represent less than 0.05% of net assets. | |||
| (f) | The rate shown represents current yield to maturity. | |||
| (g) | Represents investment of cash collateral received from securities on loan as of December 31, 2023. | |||
| (h) | Variable or floating rate security. The stated rate represents the rate at December 31, 2023. Maturity date shown for callable securities reflects the earliest possible call date. For securities based on a published reference index and spread, the index and spread are indicated in the description above. For certain variable rate securities, the coupon rate is determined by the issuer/agent based on current market conditions. For certain asset- and mortgage-backed securities, the coupon rate may fluctuate based on changes of the underlying collateral or prepayments of principal. These securities do not indicate a reference index and spread in their description above. | |||
| (i) | The rate shown represents the annualized seven-day yield as of December 31, 2023. | |||
Futures Contracts
| Futures Contracts—Long |
Expiration Date |
Number of Contracts |
Notional Amount |
Value/ Unrealized Appreciation/ (Depreciation) |
||||||||||||||||
| Russell 2000 Index E-Mini Futures |
03/15/24 | 178 | USD | 18,224,530 | $ | 1,542,521 | ||||||||||||||
|
|
|
|||||||||||||||||||
See accompanying notes to financial statements.
BHFTII-23
Brighthouse Funds Trust II
MetLife Russell 2000 Index Portfolio
Schedule of Investments as of December 31, 2023
Glossary of Abbreviations
Currencies
| (USD)— | United States Dollar | |||
Other Abbreviations
| (OBFR)— | U.S. Overnight Bank Funding Rate | |||
| (REIT)— | Real Estate Investment Trust | |||
| (SOFR)— | Secured Overnight Financing Rate | |||
Fair Value Hierarchy
Accounting principles generally accepted in the United States of America (“GAAP”) define fair market value as the price that the Portfolio would receive to sell an asset or pay to transfer a liability in an orderly transaction between market participants at the measurement date. It establishes a fair value hierarchy that prioritizes inputs to valuation methods and requires disclosure of the fair value hierarchy, separately for each major category of assets and liabilities, that segregates fair value measurements into three levels. Levels 1, 2 and 3 of the fair value hierarchy are defined as follows:
Level 1 - unadjusted quoted prices in active markets for identical investments
Level 2 - other significant observable inputs (including, but not limited to, quoted prices for similar assets or liabilities in markets that are either active or inactive; inputs other than quoted prices that are observable such as interest rates, yield curves, volatilities, prepayment speeds, loss severities, credit risks, default rates, or other market corroborated inputs)
Level 3 - significant unobservable inputs based on the best information available in the circumstances, to the extent observable inputs are unavailable (including the Portfolio’s own assumptions used in determining the fair value of investments and derivative financial instruments)
The inputs or methodologies used for valuing investments are not necessarily an indication of the risk associated with investing in them. Changes to the inputs or methodologies used may result in transfers between levels. A reconciliation of Level 3 securities, if any, will be disclosed following the fair value hierarchy table. For more information about the Portfolio’s policy regarding the valuation of investments, please refer to the Notes to Financial Statements.
The following table summarizes the fair value hierarchy of the Portfolio’s investments as of December 31, 2023:
| Description | Level 1 | Level 2 | Level 3 | Total | ||||||||||||
| Common Stocks | ||||||||||||||||
| Aerospace & Defense |
$ | 7,306,813 | $ | — | $ | — | $ | 7,306,813 | ||||||||
| Air Freight & Logistics |
1,893,478 | — | — | 1,893,478 | ||||||||||||
| Automobile Components |
11,226,720 | — | — | 11,226,720 | ||||||||||||
| Automobiles |
888,607 | — | — | 888,607 | ||||||||||||
| Banks |
80,496,763 | — | — | 80,496,763 | ||||||||||||
| Beverages |
3,597,248 | — | — | 3,597,248 | ||||||||||||
| Biotechnology |
62,461,046 | — | — | 62,461,046 | ||||||||||||
| Broadline Retail |
734,971 | — | — | 734,971 | ||||||||||||
| Building Products |
16,993,193 | — | — | 16,993,193 | ||||||||||||
| Capital Markets |
11,785,271 | — | — | 11,785,271 | ||||||||||||
| Chemicals |
15,965,692 | — | — | 15,965,692 | ||||||||||||
| Commercial Services & Supplies |
13,078,778 | — | — | 13,078,778 | ||||||||||||
| Communications Equipment |
4,867,531 | — | — | 4,867,531 | ||||||||||||
| Construction & Engineering |
14,261,200 | — | — | 14,261,200 | ||||||||||||
| Construction Materials |
2,969,821 | — | — | 2,969,821 | ||||||||||||
| Consumer Finance |
6,585,203 | — | — | 6,585,203 | ||||||||||||
| Consumer Staples Distribution & Retail |
4,732,536 | — | — | 4,732,536 | ||||||||||||
| Containers & Packaging |
2,347,517 | — | — | 2,347,517 | ||||||||||||
| Distributors |
64,539 | — | — | 64,539 | ||||||||||||
| Diversified Consumer Services |
10,460,252 | — | — | 10,460,252 | ||||||||||||
| Diversified REITs |
5,172,000 | — | — | 5,172,000 | ||||||||||||
| Diversified Telecommunication Services |
4,589,116 | — | — | 4,589,116 | ||||||||||||
| Electric Utilities |
6,048,163 | — | — | 6,048,163 | ||||||||||||
| Electrical Equipment |
11,479,043 | — | — | 11,479,043 | ||||||||||||
| Electronic Equipment, Instruments & Components |
23,011,550 | — | — | 23,011,550 | ||||||||||||
| Energy Equipment & Services |
20,500,883 | — | — | 20,500,883 | ||||||||||||
| Entertainment |
3,235,319 | — | — | 3,235,319 | ||||||||||||
| Financial Services |
20,377,719 | — | — | 20,377,719 | ||||||||||||
| Food Products |
8,164,030 | — | — | 8,164,030 | ||||||||||||
| Gas Utilities |
7,701,719 | — | — | 7,701,719 | ||||||||||||
| Ground Transportation |
3,937,539 | — | — | 3,937,539 | ||||||||||||
| Health Care Equipment & Supplies |
23,772,261 | — | — | 23,772,261 | ||||||||||||
| Health Care Providers & Services |
21,124,278 | — | — | 21,124,278 | ||||||||||||
| Health Care REITs |
5,085,253 | — | — | 5,085,253 | ||||||||||||
| Health Care Technology |
4,035,594 | — | — | 4,035,594 | ||||||||||||
| Hotel & Resort REITs |
7,419,516 | — | — | 7,419,516 | ||||||||||||
See accompanying notes to financial statements.
BHFTII-24
Brighthouse Funds Trust II
MetLife Russell 2000 Index Portfolio
Schedule of Investments as of December 31, 2023
Fair Value Hierarchy—(Continued)
| Description | Level 1 | Level 2 | Level 3 | Total | ||||||||||||
| Hotels, Restaurants & Leisure |
$ | 18,597,052 | $ | — | $ | — | $ | 18,597,052 | ||||||||
| Household Durables |
20,057,055 | — | — | 20,057,055 | ||||||||||||
| Household Products |
2,705,073 | — | — | 2,705,073 | ||||||||||||
| Independent Power and Renewable Electricity Producers |
2,251,284 | — | — | 2,251,284 | ||||||||||||
| Industrial Conglomerates |
213,990 | — | — | 213,990 | ||||||||||||
| Industrial REITs |
3,974,276 | — | — | 3,974,276 | ||||||||||||
| Insurance |
14,812,151 | — | — | 14,812,151 | ||||||||||||
| Interactive Media & Services |
6,057,555 | — | — | 6,057,555 | ||||||||||||
| IT Services |
4,337,937 | — | — | 4,337,937 | ||||||||||||
| Leisure Products |
3,392,551 | — | — | 3,392,551 | ||||||||||||
| Life Sciences Tools & Services |
2,990,370 | — | 0 | 2,990,370 | ||||||||||||
| Machinery |
29,682,916 | — | — | 29,682,916 | ||||||||||||
| Marine Transportation |
2,483,741 | — | — | 2,483,741 | ||||||||||||
| Media |
5,231,373 | — | — | 5,231,373 | ||||||||||||
| Metals & Mining |
15,534,102 | — | — | 15,534,102 | ||||||||||||
| Mortgage Real Estate Investment Trusts |
10,059,285 | — | — | 10,059,285 | ||||||||||||
| Multi-Utilities |
3,409,837 | — | — | 3,409,837 | ||||||||||||
| Office REITs |
6,328,830 | — | — | 6,328,830 | ||||||||||||
| Oil, Gas & Consumable Fuels |
37,718,158 | — | — | 37,718,158 | ||||||||||||
| Paper & Forest Products |
797,089 | — | — | 797,089 | ||||||||||||
| Passenger Airlines |
3,584,080 | — | — | 3,584,080 | ||||||||||||
| Personal Care Products |
8,069,265 | — | — | 8,069,265 | ||||||||||||
| Pharmaceuticals |
14,501,825 | — | — | 14,501,825 | ||||||||||||
| Professional Services |
21,160,888 | — | — | 21,160,888 | ||||||||||||
| Real Estate Management & Development |
6,638,440 | — | — | 6,638,440 | ||||||||||||
| Residential REITs |
3,320,903 | — | — | 3,320,903 | ||||||||||||
| Retail REITs |
9,983,288 | — | — | 9,983,288 | ||||||||||||
| Semiconductors & Semiconductor Equipment |
26,328,367 | — | — | 26,328,367 | ||||||||||||
| Software |
49,665,909 | — | — | 49,665,909 | ||||||||||||
| Specialized REITs |
3,918,549 | — | — | 3,918,549 | ||||||||||||
| Specialty Retail |
22,625,961 | — | — | 22,625,961 | ||||||||||||
| Technology Hardware, Storage & Peripherals |
6,179,785 | — | — | 6,179,785 | ||||||||||||
| Textiles, Apparel & Luxury Goods |
4,544,618 | — | — | 4,544,618 | ||||||||||||
| Tobacco |
1,321,617 | — | — | 1,321,617 | ||||||||||||
| Trading Companies & Distributors |
17,395,387 | — | — | 17,395,387 | ||||||||||||
| Water Utilities |
3,720,998 | — | — | 3,720,998 | ||||||||||||
| Wireless Telecommunication Services |
954,347 | — | 30,397 | 984,744 | ||||||||||||
| Total Common Stocks |
842,920,014 | |
— |
|
30,397 | 842,950,411 | ||||||||||
| Total Mutual Funds* |
13,206,718 | — | — | 13,206,718 | ||||||||||||
| Total Rights* |
— | 14,706 | 37,093 | 51,799 | ||||||||||||
| Warrants | ||||||||||||||||
| Energy Equipment & Services |
9,261 | — | — | 9,261 | ||||||||||||
| Pharmaceuticals |
— | 2,607 | — | 2,607 | ||||||||||||
| Total Warrants |
9,261 | 2,607 | — | 11,868 | ||||||||||||
| Total Short-Term Investments* |
— | 19,758,764 | — | 19,758,764 | ||||||||||||
| Securities Lending Reinvestments | ||||||||||||||||
| Certificates of Deposit |
— | 12,996,537 | — | 12,996,537 | ||||||||||||
| Commercial Paper |
— | 3,967,124 | — | 3,967,124 | ||||||||||||
| Repurchase Agreements |
— | 99,409,590 | — | 99,409,590 | ||||||||||||
| Time Deposits |
— | 10,000,000 | — | 10,000,000 | ||||||||||||
| Mutual Funds |
15,000,000 | — | — | 15,000,000 | ||||||||||||
| Total Securities Lending Reinvestments |
15,000,000 | 126,373,251 | — | 141,373,251 | ||||||||||||
| Total Investments |
$ | 871,135,993 | $ |
146,149,328 |
|
$ | 67,490 | $ | 1,017,352,811 | |||||||
| Collateral for Securities Loaned (Liability) |
$ | — | $ | (141,337,967 | ) | $ | — | $ | (141,337,967 | ) | ||||||
| Futures Contracts | ||||||||||||||||
| Futures Contracts (Unrealized Appreciation) |
$ | 1,542,521 | $ | — | $ | — | $ | 1,542,521 | ||||||||
| * | See Schedule of Investments for additional detailed categorizations. | |||
Level 3 investments at the beginning and/or end of the period in relation to net assets were not significant and accordingly, a reconciliation of Level 3 assets for the year ended December 31, 2023 is not presented.
See accompanying notes to financial statements.
BHFTII-25
Brighthouse Funds Trust II
MetLife Russell 2000 Index Portfolio
Statement of Assets and Liabilities
December 31, 2023
| Assets |
||||
| Investments at value (a) (b) |
$ | 1,017,352,811 | ||
| Cash |
42,130 | |||
| Receivable for: |
||||
| Investments sold |
371,102 | |||
| Fund shares sold |
90,164 | |||
| Dividends |
927,562 | |||
| Prepaid expenses |
2,962 | |||
|
|
|
|||
| Total Assets |
1,018,786,731 | |||
| Liabilities |
| |||
| Collateral for securities loaned |
141,337,967 | |||
| Payables for: |
||||
| Investments purchased |
482,469 | |||
| Fund shares redeemed |
2,546,764 | |||
| Variation margin on futures contracts |
281,240 | |||
| Accrued Expenses: |
||||
| Management fees |
178,650 | |||
| Distribution and service fees |
86,423 | |||
| Deferred trustees’ fees |
169,435 | |||
| Other expenses |
162,638 | |||
|
|
|
|||
| Total Liabilities |
145,245,586 | |||
|
|
|
|||
| Net Assets |
$ | 873,541,145 | ||
|
|
|
|||
| Net Assets Consist of: |
||||
| Paid in surplus |
$ | 625,781,476 | ||
| Distributable earnings (Accumulated losses) |
247,759,669 | |||
|
|
|
|||
| Net Assets |
$ | 873,541,145 | ||
|
|
|
|||
| Net Assets |
||||
| Class A |
$ | 484,164,127 | ||
| Class B |
185,091,055 | |||
| Class E |
18,118,442 | |||
| Class G |
186,167,521 | |||
| Capital Shares Outstanding* |
| |||
| Class A |
27,743,023 | |||
| Class B |
11,056,511 | |||
| Class E |
1,048,715 | |||
| Class G |
11,216,202 | |||
| Net Asset Value, Offering Price and Redemption Price Per Share |
||||
| Class A |
$ | 17.45 | ||
| Class B |
16.74 | |||
| Class E |
17.28 | |||
| Class G |
16.60 | |||
| * | The Portfolio is authorized to issue an unlimited number of shares. | |||
| (a) | Identified cost of investments was $799,793,720. | |||
| (b) | Includes securities loaned at value of $190,457,239. | |||
Statement of Operations
Year Ended December 31, 2023
| Investment Income |
||||
| Dividends (a) |
$ | 12,894,514 | ||
| Interest |
583,340 | |||
| Securities lending income |
1,345,466 | |||
|
|
|
|||
| Total investment income |
14,823,320 | |||
| Expenses |
| |||
| Management fees |
2,038,247 | |||
| Administration fees |
47,022 | |||
| Custodian and accounting fees |
124,491 | |||
| Distribution and service fees—Class B |
437,051 | |||
| Distribution and service fees—Class E |
26,656 | |||
| Distribution and service fees—Class G |
508,333 | |||
| Audit and tax services |
52,861 | |||
| Legal |
46,603 | |||
| Trustees’ fees and expenses |
46,220 | |||
| Shareholder reporting |
80,260 | |||
| Insurance |
7,275 | |||
| Miscellaneous |
94,623 | |||
|
|
|
|||
| Total expenses |
3,509,642 | |||
| Less management fee waiver |
(15,765 | ) | ||
|
|
|
|||
| Net expenses |
3,493,877 | |||
|
|
|
|||
| Net Investment Income |
11,329,443 | |||
|
|
|
|||
| Net Realized and Unrealized Gain (Loss) |
||||
| Net realized gain (loss) on: |
||||
| Investments |
28,724,246 | |||
| Futures contracts |
86,151 | |||
|
|
|
|||
| Net realized gain (loss) |
28,810,397 | |||
|
|
|
|||
| Net change in unrealized appreciation (depreciation) on: |
||||
| Investments |
87,965,644 | |||
| Futures contracts |
1,798,021 | |||
|
|
|
|||
| Net change in unrealized appreciation (depreciation) |
89,763,665 | |||
|
|
|
|||
| Net realized and unrealized gain (loss) |
118,574,062 | |||
|
|
|
|||
| Net Increase (Decrease) in Net Assets From Operations |
$ | 129,903,505 | ||
|
|
|
|||
| (a) | Net of foreign withholding taxes of $16,200. | |||
See accompanying notes to financial statements.
BHFTII-26
Brighthouse Funds Trust II
MetLife Russell 2000 Index Portfolio
Statements of Changes in Net Assets
| Year Ended December 31, 2023 |
Year Ended December 31, 2022 |
|||||||
| Increase (Decrease) in Net Assets: |
||||||||
| From Operations |
| |||||||
| Net investment income (loss) |
$ | 11,329,443 | $ | 9,953,361 | ||||
| Net realized gain (loss) |
28,810,397 | 13,942,102 | ||||||
| Net change in unrealized appreciation (depreciation) |
89,763,665 | (235,525,982 | ) | |||||
|
|
|
|
|
|||||
| Increase (decrease) in net assets from operations |
129,903,505 | (211,630,519 | ) | |||||
|
|
|
|
|
|||||
| From Distributions to Shareholders |
| |||||||
| Class A |
(13,868,401 | ) | (91,952,917 | ) | ||||
| Class B |
(5,150,963 | ) | (36,689,310 | ) | ||||
| Class E |
(538,424 | ) | (3,810,032 | ) | ||||
| Class G |
(5,013,000 | ) | (34,310,663 | ) | ||||
|
|
|
|
|
|||||
| Total distributions |
(24,570,788 | ) | (166,762,922 | ) | ||||
|
|
|
|
|
|||||
| Increase (decrease) in net assets from capital share transactions |
(28,351,081 | ) | 116,158,599 | |||||
|
|
|
|
|
|||||
| Total increase (decrease) in net assets |
76,981,636 | (262,234,842 | ) | |||||
| Net Assets |
| |||||||
| Beginning of period |
796,559,509 | 1,058,794,351 | ||||||
|
|
|
|
|
|||||
| End of period |
$ | 873,541,145 | $ | 796,559,509 | ||||
|
|
|
|
|
|||||
Other Information:
Capital Shares
Transactions in capital shares were as follows:
| Year Ended December 31, 2023 |
Year Ended December 31, 2022 |
|||||||||||||||
| Shares | Value | Shares | Value | |||||||||||||
| Class A |
||||||||||||||||
| Sales |
3,804,114 | $ | 58,545,200 | 1,581,100 | $ | 28,530,255 | ||||||||||
| Reinvestments |
866,234 | 13,868,401 | 6,130,195 | 91,952,917 | ||||||||||||
| Redemptions |
(5,789,621 | ) | (91,694,034 | ) | (3,305,338 | ) | (59,384,543 | ) | ||||||||
|
|
|
|
|
|
|
|
|
|||||||||
| Net increase (decrease) |
(1,119,273 | ) | $ | (19,280,433 | ) | 4,405,957 | $ | 61,098,629 | ||||||||
|
|
|
|
|
|
|
|
|
|||||||||
| Class B |
|
|||||||||||||||
| Sales |
644,946 | $ | 9,686,494 | 551,272 | $ | 9,549,287 | ||||||||||
| Reinvestments |
335,131 | 5,150,963 | 2,544,335 | 36,689,310 | ||||||||||||
| Redemptions |
(1,557,377 | ) | (24,021,438 | ) | (1,455,986 | ) | (24,957,387 | ) | ||||||||
|
|
|
|
|
|
|
|
|
|||||||||
| Net increase (decrease) |
(577,300 | ) | $ | (9,183,981 | ) | 1,639,621 | $ | 21,281,210 | ||||||||
|
|
|
|
|
|
|
|
|
|||||||||
| Class E |
|
|||||||||||||||
| Sales |
80,037 | $ | 1,250,826 | 105,288 | $ | 1,881,073 | ||||||||||
| Reinvestments |
33,949 | 538,424 | 256,395 | 3,810,032 | ||||||||||||
| Redemptions |
(243,823 | ) | (3,863,035 | ) | (218,489 | ) | (3,805,880 | ) | ||||||||
|
|
|
|
|
|
|
|
|
|||||||||
| Net increase (decrease) |
(129,837 | ) | $ | (2,073,785 | ) | 143,194 | $ | 1,885,225 | ||||||||
|
|
|
|
|
|
|
|
|
|||||||||
| Class G |
|
|||||||||||||||
| Sales |
917,155 | $ | 13,557,451 | 980,158 | $ | 18,094,196 | ||||||||||
| Reinvestments |
328,721 | 5,013,000 | 2,397,670 | 34,310,663 | ||||||||||||
| Redemptions |
(1,060,780 | ) | (16,383,333 | ) | (1,220,436 | ) | (20,511,324 | ) | ||||||||
|
|
|
|
|
|
|
|
|
|||||||||
| Net increase (decrease) |
185,096 | $ | 2,187,118 | 2,157,392 | $ | 31,893,535 | ||||||||||
|
|
|
|
|
|
|
|
|
|||||||||
| Increase (decrease) derived from capital shares transactions |
$ | (28,351,081 | ) | $ | 116,158,599 | |||||||||||
|
|
|
|
|
|||||||||||||
See accompanying notes to financial statements.
BHFTII-27
Brighthouse Funds Trust II
MetLife Russell 2000 Index Portfolio
Financial Highlights
| Selected per share data | ||||||||||||||||||||
| Class A | ||||||||||||||||||||
| Year Ended December 31, | ||||||||||||||||||||
| 2023 | 2022 | 2021 | 2020 | 2019 | ||||||||||||||||
| Net Asset Value, Beginning of Period |
$ | 15.40 | $ | 24.24 | $ | 22.47 | $ | 20.30 | $ | 18.13 | ||||||||||
|
|
|
|
|
|
|
|
|
|
|
|||||||||||
| Income (Loss) from Investment Operations |
||||||||||||||||||||
| Net investment income (loss) (a) |
0.24 | 0.23 | 0.20 | 0.21 | 0.25 | |||||||||||||||
| Net realized and unrealized gain (loss) |
2.30 | (5.23 | ) | 3.09 | 3.26 | 4.16 | ||||||||||||||
|
|
|
|
|
|
|
|
|
|
|
|||||||||||
| Total income (loss) from investment operations |
2.54 | (5.00 | ) | 3.29 | 3.47 | 4.41 | ||||||||||||||
|
|
|
|
|
|
|
|
|
|
|
|||||||||||
| Less Distributions |
|
|||||||||||||||||||
| Distributions from net investment income |
(0.21 | ) | (0.22 | ) | (0.25 | ) | (0.25 | ) | (0.25 | ) | ||||||||||
| Distributions from net realized capital gains |
(0.28 | ) | (3.62 | ) | (1.27 | ) | (1.05 | ) | (1.99 | ) | ||||||||||
|
|
|
|
|
|
|
|
|
|
|
|||||||||||
| Total distributions |
(0.49 | ) | (3.84 | ) | (1.52 | ) | (1.30 | ) | (2.24 | ) | ||||||||||
|
|
|
|
|
|
|
|
|
|
|
|||||||||||
| Net Asset Value, End of Period |
$ | 17.45 | $ | 15.40 | $ | 24.24 | $ | 22.47 | $ | 20.30 | ||||||||||
|
|
|
|
|
|
|
|
|
|
|
|||||||||||
| Total Return (%) (b) |
16.80 | (20.23 | ) | 14.52 | 19.62 | 25.62 | ||||||||||||||
| Ratios/Supplemental Data |
|
|||||||||||||||||||
| Gross ratio of expenses to average net assets (%) |
0.31 | 0.30 | 0.30 | 0.32 | 0.31 | |||||||||||||||
| Net ratio of expenses to average net assets (%) (c) |
0.31 | 0.30 | 0.30 | 0.32 | 0.31 | |||||||||||||||
| Ratio of net investment income (loss) to average net assets (%) |
1.51 | 1.25 | 0.80 | 1.16 | 1.27 | |||||||||||||||
| Portfolio turnover rate (%) |
17 | 22 | 36 | 34 | 19 | |||||||||||||||
| Net assets, end of period (in millions) |
$ | 484.2 | $ | 444.6 | $ | 592.8 | $ | 542.2 | $ | 504.4 | ||||||||||
| Class B | ||||||||||||||||||||
| Year Ended December 31, | ||||||||||||||||||||
| 2023 | 2022 | 2021 | 2020 | 2019 | ||||||||||||||||
| Net Asset Value, Beginning of Period |
$ | 14.79 | $ | 23.45 | $ | 21.79 | $ | 19.72 | $ | 17.66 | ||||||||||
|
|
|
|
|
|
|
|
|
|
|
|||||||||||
| Income (Loss) from Investment Operations |
||||||||||||||||||||
| Net investment income (loss) (a) |
0.19 | 0.17 | 0.13 | 0.16 | 0.19 | |||||||||||||||
| Net realized and unrealized gain (loss) |
2.21 | (5.05 | ) | 3.00 | 3.16 | 4.05 | ||||||||||||||
|
|
|
|
|
|
|
|
|
|
|
|||||||||||
| Total income (loss) from investment operations |
2.40 | (4.88 | ) | 3.13 | 3.32 | 4.24 | ||||||||||||||
|
|
|
|
|
|
|
|
|
|
|
|||||||||||
| Less Distributions |
|
|||||||||||||||||||
| Distributions from net investment income |
(0.17 | ) | (0.16 | ) | (0.20 | ) | (0.20 | ) | (0.19 | ) | ||||||||||
| Distributions from net realized capital gains |
(0.28 | ) | (3.62 | ) | (1.27 | ) | (1.05 | ) | (1.99 | ) | ||||||||||
|
|
|
|
|
|
|
|
|
|
|
|||||||||||
| Total distributions |
(0.45 | ) | (3.78 | ) | (1.47 | ) | (1.25 | ) | (2.18 | ) | ||||||||||
|
|
|
|
|
|
|
|
|
|
|
|||||||||||
| Net Asset Value, End of Period |
$ | 16.74 | $ | 14.79 | $ | 23.45 | $ | 21.79 | $ | 19.72 | ||||||||||
|
|
|
|
|
|
|
|
|
|
|
|||||||||||
| Total Return (%) (b) |
16.51 | (20.44 | ) | 14.23 | 19.35 | 25.30 | ||||||||||||||
| Ratios/Supplemental Data |
|
|||||||||||||||||||
| Gross ratio of expenses to average net assets (%) |
0.56 | 0.55 | 0.55 | 0.57 | 0.56 | |||||||||||||||
| Net ratio of expenses to average net assets (%) (c) |
0.56 | 0.55 | 0.55 | 0.57 | 0.56 | |||||||||||||||
| Ratio of net investment income (loss) to average net assets (%) |
1.26 | 1.00 | 0.54 | 0.91 | 1.01 | |||||||||||||||
| Portfolio turnover rate (%) |
17 | 22 | 36 | 34 | 19 | |||||||||||||||
| Net assets, end of period (in millions) |
$ | 185.1 | $ | 172.1 | $ | 234.3 | $ | 238.3 | $ | 227.8 | ||||||||||
Please see following page for Financial Highlights footnote legend.
See accompanying notes to financial statements.
BHFTII-28
Brighthouse Funds Trust II
MetLife Russell 2000 Index Portfolio
Financial Highlights
| Selected per share data | ||||||||||||||||||||
| Class E | ||||||||||||||||||||
| Year Ended December 31, | ||||||||||||||||||||
| 2023 | 2022 | 2021 | 2020 | 2019 | ||||||||||||||||
| Net Asset Value, Beginning of Period |
$ | 15.25 | $ | 24.03 | $ | 22.30 | $ | 20.15 | $ | 18.01 | ||||||||||
|
|
|
|
|
|
|
|
|
|
|
|||||||||||
| Income (Loss) from Investment Operations |
||||||||||||||||||||
| Net investment income (loss) (a) |
0.21 | 0.20 | 0.16 | 0.18 | 0.22 | |||||||||||||||
| Net realized and unrealized gain (loss) |
2.29 | (5.18 | ) | 3.06 | 3.24 | 4.12 | ||||||||||||||
|
|
|
|
|
|
|
|
|
|
|
|||||||||||
| Total income (loss) from investment operations |
2.50 | (4.98 | ) | 3.22 | 3.42 | 4.34 | ||||||||||||||
|
|
|
|
|
|
|
|
|
|
|
|||||||||||
| Less Distributions |
|
|||||||||||||||||||
| Distributions from net investment income |
(0.19 | ) | (0.18 | ) | (0.22 | ) | (0.22 | ) | (0.21 | ) | ||||||||||
| Distributions from net realized capital gains |
(0.28 | ) | (3.62 | ) | (1.27 | ) | (1.05 | ) | (1.99 | ) | ||||||||||
|
|
|
|
|
|
|
|
|
|
|
|||||||||||
| Total distributions |
(0.47 | ) | (3.80 | ) | (1.49 | ) | (1.27 | ) | (2.20 | ) | ||||||||||
|
|
|
|
|
|
|
|
|
|
|
|||||||||||
| Net Asset Value, End of Period |
$ | 17.28 | $ | 15.25 | $ | 24.03 | $ | 22.30 | $ | 20.15 | ||||||||||
|
|
|
|
|
|
|
|
|
|
|
|||||||||||
| Total Return (%) (b) |
16.65 | (20.33 | ) | 14.31 | 19.45 | 25.40 | ||||||||||||||
| Ratios/Supplemental Data |
|
|||||||||||||||||||
| Gross ratio of expenses to average net assets (%) |
0.46 | 0.45 | 0.45 | 0.47 | 0.46 | |||||||||||||||
| Net ratio of expenses to average net assets (%) (c) |
0.46 | 0.45 | 0.45 | 0.47 | 0.46 | |||||||||||||||
| Ratio of net investment income (loss) to average net assets (%) |
1.35 | 1.10 | 0.65 | 1.01 | 1.11 | |||||||||||||||
| Portfolio turnover rate (%) |
17 | 22 | 36 | 34 | 19 | |||||||||||||||
| Net assets, end of period (in millions) |
$ | 18.1 | $ | 18.0 | $ | 24.9 | $ | 24.4 | $ | 23.9 | ||||||||||
| Class G | ||||||||||||||||||||
| Year Ended December 31, | ||||||||||||||||||||
| 2023 | 2022 | 2021 | 2020 | 2019 | ||||||||||||||||
| Net Asset Value, Beginning of Period |
$ | 14.67 | $ | 23.30 | $ | 21.66 | $ | 19.62 | $ | 17.59 | ||||||||||
|
|
|
|
|
|
|
|
|
|
|
|||||||||||
| Income (Loss) from Investment Operations |
||||||||||||||||||||
| Net investment income (loss) (a) |
0.18 | 0.16 | 0.12 | 0.15 | 0.18 | |||||||||||||||
| Net realized and unrealized gain (loss) |
2.20 | (5.02 | ) | 2.99 | 3.14 | 4.03 | ||||||||||||||
|
|
|
|
|
|
|
|
|
|
|
|||||||||||
| Total income (loss) from investment operations |
2.38 | (4.86 | ) | 3.11 | 3.29 | 4.21 | ||||||||||||||
|
|
|
|
|
|
|
|
|
|
|
|||||||||||
| Less Distributions |
|
|||||||||||||||||||
| Distributions from net investment income |
(0.17 | ) | (0.15 | ) | (0.20 | ) | (0.20 | ) | (0.19 | ) | ||||||||||
| Distributions from net realized capital gains |
(0.28 | ) | (3.62 | ) | (1.27 | ) | (1.05 | ) | (1.99 | ) | ||||||||||
|
|
|
|
|
|
|
|
|
|
|
|||||||||||
| Total distributions |
(0.45 | ) | (3.77 | ) | (1.47 | ) | (1.25 | ) | (2.18 | ) | ||||||||||
|
|
|
|
|
|
|
|
|
|
|
|||||||||||
| Net Asset Value, End of Period |
$ | 16.60 | $ | 14.67 | $ | 23.30 | $ | 21.66 | $ | 19.62 | ||||||||||
|
|
|
|
|
|
|
|
|
|
|
|||||||||||
| Total Return (%) (b) |
16.47 | (20.46 | ) | 14.19 | 19.26 | 25.20 | ||||||||||||||
| Ratios/Supplemental Data |
|
|||||||||||||||||||
| Gross ratio of expenses to average net assets (%) |
0.61 | 0.60 | 0.60 | 0.62 | 0.61 | |||||||||||||||
| Net ratio of expenses to average net assets (%) (c) |
0.61 | 0.60 | 0.60 | 0.62 | 0.61 | |||||||||||||||
| Ratio of net investment income (loss) to average net assets (%) |
1.21 | 0.96 | 0.50 | 0.86 | 0.97 | |||||||||||||||
| Portfolio turnover rate (%) |
17 | 22 | 36 | 34 | 19 | |||||||||||||||
| Net assets, end of period (in millions) |
$ | 186.2 | $ | 161.9 | $ | 206.8 | $ | 189.3 | $ | 166.0 | ||||||||||
| (a) | Per share amounts based on average shares outstanding during the period. | |||
| (b) | Total return does not reflect any insurance, sales, separate account or administrative charges of variable annuity or life insurance contracts or any additional expenses that contract owners may bear under their variable contracts. If these charges were included, the returns would be lower. | |||
| (c) | Includes the effects of management fee waivers (see Note 6 of the Notes to Financial Statements). | |||
See accompanying notes to financial statements.
BHFTII-29
Brighthouse Funds Trust II
MetLife Russell 2000 Index Portfolio
Notes to Financial Statements—December 31, 2023
1. Organization
Brighthouse Funds Trust II (the “Trust”) is organized as a Delaware statutory trust and registered under the Investment Company Act of 1940, as amended (the “1940 Act”), as an open-end management investment company. The Trust, which is managed by Brighthouse Investment Advisers, LLC (“Brighthouse Investment Advisers” or the “Adviser”), currently offers twenty-nine series (the “Portfolios”), each of which operates as a distinct investment vehicle of the Trust. The series included in this report is MetLife Russell 2000 Index Portfolio (the “Portfolio”), which is diversified. Shares of the Portfolio are not offered directly to the general public and are currently available only to separate accounts of insurance companies, including insurance companies affiliated with the Adviser.
The Portfolio has registered and offers four classes of shares: Class A, B, E and G shares. Shares of each class of the Portfolio represent an equal pro rata interest in the Portfolio and generally give the shareholder the same voting, dividend, liquidation, and other rights. Investment income, realized and unrealized capital gains and losses, the common expenses of the Portfolio, and certain Portfolio-level expense reductions, if any, are allocated on a pro rata basis to each class based on the relative net assets of each class to the net assets of the Portfolio. Each class of shares differs in its respective distribution plan and such distribution expenses are allocated to the corresponding class of shares.
2. Significant Accounting Policies
The preparation of financial statements in conformity with accounting principles generally accepted in the United States of America (“GAAP”) requires management to make estimates and assumptions that affect the reported amounts of assets and liabilities and disclosure of contingent assets and liabilities as of the date of the financial statements and the reported amounts of income and expenses during the reporting period. Actual results could differ from those estimates. In the preparation of these financial statements, management has evaluated events and transactions subsequent to December 31, 2023 through the date the financial statements were issued.
The Portfolio is an investment company and follows the accounting and reporting guidance of the Financial Accounting Standards Board (“FASB”) Accounting Standards Codification Topic 946—Financial Services—Investment Companies. The following is a summary of significant accounting policies consistently followed by the Portfolio in the preparation of its financial statements.
Investment Valuation and Fair Value Measurements - The Portfolio values its investments for purposes of calculating its net asset value (“NAV”) using procedures that allow for a variety of methodologies to be used to value the Portfolio’s investments. The specific methodology used for an investment may vary based on the market data available for a specific investment at the time the Portfolio calculates its NAV or based on other considerations. The procedures also permit a level of judgment to be used in the valuation process.
Domestic and foreign equity securities, such as common stock, exchange-traded funds, rights, warrants, and preferred stock, that are traded on a securities exchange on a valuation date are generally valued at their last quoted sale price or official closing price on the primary exchange for such security, or, if no sales occurred on that day, at the last reported bid price. Equity securities traded over-the-counter (“OTC”) are generally valued at the last reported bid price. In the event of a major exchange closing during the trading day, the Adviser may use other market information obtained from quotation reporting systems, established market makers, or pricing services in valuing the securities. Valuation adjustments may be applied to certain foreign equity securities that are traded solely on foreign exchanges that close before the time as of which the Portfolio determines its NAV to account for the market movement between the close of the foreign exchanges and the time as of which the Portfolio determines its NAV. The Portfolio may use a systematic fair valuation model provided by a pricing service to value securities principally traded in these foreign markets to adjust for possible market movements or other changes that may occur between the close of the foreign exchanges and the time as of which the Portfolio determines its NAV. Foreign equity securities valued using these valuation adjustments are generally categorized as Level 2 within the fair value hierarchy. Equity securities that are actively traded, and have no valuation adjustments applied, are categorized as Level 1 within the fair value hierarchy. Other equity securities traded on inactive markets or valued in reference to similar instruments traded on active markets are generally categorized as Level 2 within the fair value hierarchy.
Investments in registered open-end management investment companies are valued at reported NAV per share on the valuation date and are categorized as Level 1 within the fair value hierarchy.
Debt securities, including corporate, convertible and municipal bonds and notes; obligations of the U.S. Treasury and U.S. government agencies; foreign sovereign issues; and non-U.S. bonds, are generally valued based upon evaluated or composite bid quotations obtained from third-party pricing services and/or brokers and dealers selected by the Adviser (each a “pricing service”). Such pricing services may use matrix pricing, which considers observable inputs including, among other things, issuer details, maturity dates, interest rates, yield curves, rates of prepayment, credit risks/spreads, default rates, reported trades, broker-dealer quotes and quoted prices for similar assets. Short-term obligations with a remaining maturity of sixty days or less may be valued at amortized cost in the absence of market quotes, so long as the amortized cost value of such short-term debt instrument is approximately the same as the fair value of the instrument as determined without the use of amortized cost valuation. Floating rate loans are generally valued based upon
BHFTII-30
Brighthouse Funds Trust II
MetLife Russell 2000 Index Portfolio
Notes to Financial Statements—December 31, 2023—(Continued)
an evaluated or composite average of aggregate bid and ask quotations supplied by brokers or dealers, as obtained from the pricing service. Securities that use similar valuation techniques and inputs as described above are generally categorized as Level 2 within the fair value hierarchy.
Options, whether on securities, indices, futures contracts, or otherwise, traded on exchanges are valued at the last sale price available as of the close of business on a valuation day or, if there is no such price available, at the last reported bid price. These types of options are categorized as Level 1 within the fair value hierarchy. Futures contracts that are traded on commodity exchanges are valued at their settlement prices established by the exchanges on which they are traded as of the close of such exchanges and are categorized as Level 1 within the fair value hierarchy.
If no current market quotation is readily available or market value quotations are deemed to be unreliable for an investment, the fair value of the investment will be determined in accordance with procedures. A market quotation is readily available only when that quotation is a quoted price (unadjusted) in active markets for identical investments that the Portfolio can access at the measurement date, provided that a quotation will not be readily available if it is not reliable.
Pursuant to Rule 2a-5 under the 1940 Act, the Board of Trustees (the “Board” or “Trustees”) of the Trust has designated Brighthouse Investment Advisers, acting through its Valuation Committee (“Committee”), as the Portfolio’s “valuation designee” to perform the Portfolio’s fair value determinations. The Board oversees Brighthouse Investment Advisers in its role as the Valuation Designee and receives reports from Brighthouse Investment Advisers regarding its process and the valuation of the Portfolio’s investments to assist with such oversight.
No single standard for determining the fair value of an investment can be set forth because fair value depends upon the facts and circumstances with respect to each investment. Information relating to any relevant factors may be obtained by the Committee from any appropriate source, including the subadviser of the Portfolio, the Custodian, a pricing service, market maker and/or broker for such security or the issuer. Appropriate methodologies for determining fair value under particular circumstances may include: matrix pricing, a discounted cash flow analysis, comparisons of securities with comparable characteristics, value based on multiples of earnings, discount from market price of similar marketable securities, or a combination of these and other methods.
Foreign Currency Translation - The books and records of the Portfolio are maintained in U.S. dollars. The values of securities, currencies, and other assets and liabilities denominated in currencies other than the U.S. dollar are translated into U.S. dollars based upon foreign exchange rates prevailing at the end of the period. Purchases and sales of investment securities, income, and expenses are translated on the respective dates of such transactions. Because the values of investment securities are translated at the foreign exchange rates prevailing at the end of the period, that portion of the results of operations arising from changes in exchange rates and that portion of the results of operations reflecting fluctuations arising from changes in market prices of the investment securities are not separated. Such fluctuations are included in the net realized and unrealized gain or loss on investments.
Net realized foreign exchange gains or losses arise from activity in forward foreign currency exchange contracts, sales of foreign currency, currency gains or losses realized between the trade and settlement dates on securities transactions, and the difference between the amounts of dividends, interest, and foreign withholding taxes recorded by the Portfolio and the U.S. dollar-equivalent of the amounts actually received or paid by the Portfolio. Net unrealized foreign exchange gains and losses arise from changes in the value of assets and liabilities, other than investment securities, resulting from changes in foreign exchange rates.
Investment Transactions and Related Investment Income - Portfolio security transactions are recorded on the trade date. Dividend income is recorded on the ex-dividend date or, for certain foreign securities, when notified. Interest income, which includes amortization of premium and accretion of discount on debt securities, is recorded on the accrual basis. Realized gains and losses on investments are determined on the identified cost basis, which is the same basis used for federal income tax purposes. Foreign income and foreign capital gains on some foreign securities may be subject to foreign taxes, which are accrued as applicable. These foreign taxes have been provided for in accordance with the Portfolio’s understanding of the applicable countries’ tax rules and rates.
Dividends and Distributions to Shareholders - The Portfolio records dividends and distributions on the ex-dividend date. Net realized gains from securities transactions (if any) are generally distributed annually to shareholders. The timing and characterization of certain income and capital gains distributions are determined in accordance with federal tax regulations that may differ from GAAP. Permanent book and tax basis differences relating to shareholder distributions will result in reclassification between distributable earnings (accumulated losses) and paid in surplus. These adjustments have no impact on net assets or the results of operations.
Income Taxes - It is the Portfolio’s policy to comply with the requirements of the Internal Revenue Code of 1986, as amended, and regulations thereunder, applicable to regulated investment companies, and to distribute, with respect to each taxable year, all of its taxable income to shareholders. Therefore, no federal income tax provision is required. The Portfolio files U.S. federal tax returns. No income tax returns are currently under examination. The Portfolio’s federal tax returns remain subject to examination by the Internal Revenue Service for three fiscal years after the returns are filed. As of December 31, 2023, the Portfolio had no uncertain tax positions that would require financial statement recognition, derecognition or disclosure.
BHFTII-31
Brighthouse Funds Trust II
MetLife Russell 2000 Index Portfolio
Notes to Financial Statements—December 31, 2023—(Continued)
Repurchase Agreements - The Portfolio may enter into repurchase agreements, under the terms of a Master Repurchase Agreement (“MRA”), or Global Master Repurchase Agreement (“GMRA”), with selected commercial banks and broker-dealers, under which the Portfolio acquires securities as collateral and agrees to resell the securities at an agreed-upon time and at an agreed-upon price. The Portfolio, through the Custodian or a subcustodian, under a tri-party repurchase agreement, receives delivery of the underlying securities collateralizing any repurchase agreements. It is the Portfolio’s policy that the market value of the collateral be equal to at least 100% of the repurchase price in the case of a repurchase agreement of one-day duration and equal to at least 102% of the repurchase price in the case of all other repurchase agreements. In the event of default or failure by a party to perform an obligation in connection with any repurchase transaction, the MRA or GMRA gives the non-defaulting party the right to set-off claims and to apply property held by it in connection with any repurchase transaction against obligations owed to it under the agreement.
At December 31, 2023, the Portfolio invested cash collateral for loans of portfolio securities in repurchase agreements with a gross value of $99,409,590, which is included as part of investments at value on the Statement of Assets and Liabilities. The value of the related collateral exceeded the value of the repurchase agreements at December 31, 2023.
Securities Lending - The Portfolio may lend its portfolio securities to certain qualified brokers who borrow securities in order to complete certain securities transactions. By lending its portfolio securities, the Portfolio attempts to increase its net investment income through the receipt of income on collateral held from securities on loan. Any gain or loss in the market price of the loaned securities that might occur, any interest earned, and any dividends declared during the term of the loan, would accrue to the account of the Portfolio.
The Trust has entered into a Non-Custodial Securities Lending Agreement with JPMorgan Chase Bank, N.A. (the “Lending Agent”). Under the agreement, the Lending Agent is authorized to loan portfolio securities on the Portfolio’s behalf. In exchange, the Portfolio generally receives cash, U.S. Government securities, letters of credit, or other collateral deemed appropriate by the Adviser. The Portfolio receives collateral equal to at least 102% of the market value for loans secured by government securities or cash in the same currency as the loaned shares and 105% for all other loaned securities at each loan’s inception. Collateral representing at least 100% of the market value of the loaned securities is maintained for the duration of the loan. Any cash collateral received by the Portfolio is generally invested by the Lending Agent in short-term investments, which may include certificates of deposit, commercial paper, repurchase agreements, including repurchase agreements with respect to equity securities, time deposits, master demand notes and money market funds. The market value of investments made with cash collateral received are disclosed in the Schedule of Investments and the valuation techniques are described in Note 2. The value of the securities on loan may change each business day. If the market value of the collateral at the close of trading on a business day is less than 100% of the market value of the loaned securities at the close of trading on that day, the borrower is required to deliver, by the close of business on the following business day, an additional amount of collateral, so that the total amount of posted collateral is equal to at least 100% of the market value of all the loaned securities as of such preceding day. A portion of the income earned on the collateral is rebated to the borrower of the securities and the remainder is split between the Lending Agent and the Portfolio. On loans collateralized by U.S. government securities, a fee is received from the borrower and is allocated between the Portfolio and the Lending Agent.
Income received by the Portfolio in securities lending transactions during the year ended December 31, 2023 is reflected as securities lending income on the Statement of Operations. The values of any securities loaned by the Portfolio and the related collateral at December 31, 2023 are disclosed in the footnotes to the Schedule of Investments. The value of the related collateral received by the Portfolio exceeded the value of the securities out on loan at December 31, 2023.
The risks associated with lending portfolio securities include, but are not limited to, possible delays in receiving additional collateral or in the recovery of the loaned securities, possible loss of rights in the collateral should the borrower fail financially, as well as risk of loss in the value of the collateral or the value of the investments made with the collateral. To the extent the Portfolio uses cash collateral it receives to invest in repurchase agreements with respect to equity securities, it is subject to the risk of loss if the value of the equity securities declines and the counterparty defaults on its obligation to repurchase such securities. The Lending Agent shall indemnify the Portfolio in the case of default of any securities borrower, subject to the terms of the Non-Custodial Securities Lending Agreement.
The following table provides a breakdown of transactions accounted for as secured borrowings, the gross obligations by the type of collateral pledged, and the remaining contractual maturities of those transactions.
| Remaining Contractual Maturity of the Agreements As of December 31, 2023 |
||||||||||||||||||||
| Overnight and Continuous |
Up to 30 Days |
31 - 90 Days |
Greater than 90 days |
Total | ||||||||||||||||
| Securities Lending Transactions | ||||||||||||||||||||
| Common Stocks |
$ | (139,576,988 | ) | $ | — | $ | — | $ | — | $ | (139,576,988 | ) | ||||||||
| Mutual Funds |
(1,760,979 | ) | — | — | — | (1,760,979 | ) | |||||||||||||
| Total Borrowings |
$ | (141,337,967 | ) | $ | — | $ | — | $ | — | $ | (141,337,967 | ) | ||||||||
| Gross amount of recognized liabilities for securities lending transactions |
|
$ | (141,337,967 | ) | ||||||||||||||||
BHFTII-32
Brighthouse Funds Trust II
MetLife Russell 2000 Index Portfolio
Notes to Financial Statements—December 31, 2023—(Continued)
3. Investments in Derivative Instruments
Futures Contracts - The Portfolio may buy and sell futures contracts as a hedge, to maintain investment exposure to a target asset class or to enhance return. The Portfolio may be subject to fluctuations in equity prices, interest rates, commodity prices, and foreign currency exchange rates in the normal course of pursuing its investment objective. Futures contracts are standardized agreements to buy or sell a security, or deliver a final cash settlement price in connection with an index, interest rate, currency, or other asset. The Portfolio must deposit an amount (“initial margin”) equal to a certain percentage of the face value of the futures contract. The initial margin may be in the form of cash or securities, which is returned when the Portfolio’s obligations under the contract have been satisfied. If cash is deposited as the initial margin, it is shown as cash collateral on the Statement of Assets and Liabilities. Futures contracts are marked-to-market daily and subsequent payments (“variation margin”) are made or received by the Portfolio depending on whether unrealized gains or losses are incurred. These amounts are reflected as receivables or payables on the Statement of Assets and Liabilities and as a component of net change in unrealized appreciation/depreciation on the Statement of Operations. When the contract is closed or expires, the Portfolio records a realized gain or loss equal to the difference between the value of the contract at the time it was opened and the value at the time it was closed. Risks of entering into futures contracts (and related options) include the possibility that the market for these instruments may be illiquid and that a change in the value of the futures contract or option may not correlate perfectly with changes in the value of the underlying asset. The exchange’s clearinghouse, as counterparty to all futures, guarantees the futures contracts against default.
The following table summarizes the fair value of derivatives held by the Portfolio at December 31, 2023 by category of risk exposure:
| Asset Derivatives |
||||||
| Risk Exposure |
Statement of Assets & Liabilities Location |
Fair Value | ||||
| Equity |
Unrealized appreciation on futures contracts (a) | $ | 1,542,521 | |||
|
|
|
|||||
| (a) | Includes cumulative appreciation/depreciation of futures contracts as reported in the Schedule of Investments. Only the current day’s variation margin is reported within the Statement of Assets and Liabilities. | |||
The following tables summarize the effect of derivative instruments on the Statement of Operations, classified by derivative type and category of risk exposure, for the year ended December 31, 2023:
| Statement of Operations Location—Net Realized Gain (Loss) |
Equity | |||
| Futures contracts |
$ | 86,151 | ||
|
|
|
|||
| Statement of Operations Location—Net Change in Unrealized Appreciation (Depreciation) |
Equity | |||
| Futures contracts |
$ | 1,798,021 | ||
|
|
|
|||
For the year ended December 31, 2023, the average notional par or face amount outstanding for each derivative type was as follows:
| Derivative Description |
Average Notional Par or Face Amount‡ |
|||
| Futures contracts long |
$ | 12,710,493 | ||
| ‡ | Averages are based on activity levels during the period for which the amounts are outstanding. | |||
4. Certain Risks
In the normal course of business, the Portfolio invests in securities and enters into transactions where risks exist. Those risks include:
Market Risk: The value of securities held by the Portfolio may decline in response to certain events, including those directly involving the issuers whose securities are owned by the Portfolio; conditions affecting the general economy; overall market changes; local, regional or global political, social or economic instability; currency, interest rate, and price fluctuations, or other factors including terrorism, war, natural disasters and the spread of infectious illness including epidemics or pandemics such as the COVID-19 pandemic. These events may also adversely affect the liquidity of securities held by the Portfolio.
Credit and Counterparty Risk: The Portfolio may be exposed to counterparty risk, or the risk that an entity with which the Portfolio has unsettled or open transactions may default. The potential loss could exceed the value of the financial assets and liabilities recorded in the financial statements. Financial assets that potentially expose the Portfolio to credit and counterparty risk consist principally of cash due from counterparties and investments. The Portfolio manages counterparty risk by entering into agreements only with counterparties that it believes have the financial resources to honor their obligations and by monitoring the financial
BHFTII-33
Brighthouse Funds Trust II
MetLife Russell 2000 Index Portfolio
Notes to Financial Statements—December 31, 2023—(Continued)
stability of those counterparties. The Subadviser may attempt to mitigate counterparty risk by (i) periodically assessing the creditworthiness of its trading partners, (ii) monitoring and/or limiting the amount of its net exposure to each individual counterparty based on its assessment, and (iii) requiring collateral from the counterparty for certain transactions. In order to preserve certain safeguards for non-standard settlement trades, the Portfolio restricts its exposure to credit and counterparty losses by entering into master netting agreements (“Master Agreements”) with counterparties (approved brokers) with whom it undertakes a significant volume of transactions. Master Agreements govern the terms of certain transactions and reduce the counterparty risk associated with relevant transactions by specifying credit protection mechanisms and providing standardization that improves legal certainty. Master Agreements can also help limit counterparty risk by specifying collateral posting arrangements at pre-arranged exposure levels.
Customer Account Agreements and related addenda govern cleared derivatives transactions such as futures, options on futures, and cleared OTC derivatives. Cleared derivative transactions require posting of initial margin as determined by each relevant clearinghouse. The Portfolio’s clearing broker may also require additional initial margin. Clearinghouse-related initial margin is held by the clearinghouse and additional initial margin is held by the Portfolio’s clearing broker. In a cleared derivative transaction, the Portfolio’s counterparty is a clearinghouse rather than a bank or broker. The clearinghouse stands between the buyer and the seller of the contract; therefore, credit risk is limited to failure of or default by the clearinghouse. While offset rights may exist under applicable law, the Portfolio does not have a contractual right of offset against a clearing broker or clearinghouse in the event of a default (including the bankruptcy or insolvency). Additionally, credit risk exists in cleared derivative transactions with respect to initial and variation margin that is held in a clearing broker’s customer accounts. While clearing brokers are required to segregate, by account class, customer margin from their own assets, in the event that a clearing broker becomes insolvent or goes into bankruptcy and at that time there is a shortfall in the aggregate amount of margin held by the clearing broker for all its clients, typically the shortfall would be allocated on a pro-rata basis across all the clearing broker’s customers, for the relevant account class, potentially resulting in losses to the Portfolio. Variation margin, which accounts for changes in market value, is exchanged daily, but may not be netted between futures and cleared OTC derivatives.
Repurchase and reverse repurchase agreements are primarily executed under GMRAs or MRAs, which provide the right to set-off. Each repurchase and reverse repurchase agreement is initially collateralized at the transaction level. In the event of default, the total market value exposure will be offset against collateral exchanged to date, which would result in a net receivable/(payable) that would be due from/to the counterparty.
Additional risks associated with each type of investment are described above within the respective security type notes. The Portfolio’s prospectus includes a discussion of the principal risks of investing in the Portfolio.
5. Investment Transactions
Aggregate cost of purchases and proceeds of sales of investment securities, excluding short-term securities, for the year ended December 31, 2023 were as follows:
| Purchases |
Sales | |||||||||||
| U.S. Government |
Non-U.S. Government | U.S. Government | Non-U.S. Government | |||||||||
| $0 | $ | 137,697,021 | $ | 0 | $ | 181,256,698 | ||||||
6. Investment Management Fees and Other Transactions with Affiliates
Investment Management Agreement - Brighthouse Investment Advisers is the investment adviser to the Portfolio. The Trust has entered into an investment management agreement with Brighthouse Investment Advisers with respect to the Portfolio. For providing investment management services to the Portfolio, Brighthouse Investment Advisers receives monthly compensation at the annual rate of 0.250% of average daily net assets. Fees earned by Brighthouse Investment Advisers with respect to the Portfolio for the year ended December 31, 2023 were $2,038,247.
Brighthouse Investment Advisers has entered into an investment subadvisory agreement with MetLife Investment Management, LLC (“MIM”) with respect to managing the Portfolio. For providing subadvisory services to the Portfolio, Brighthouse Investment Advisers has agreed to pay MIM an investment subadvisory fee for each class of the Portfolio as follows:
| % per annum |
Average Daily Net Assets | |
| 0.040% | On the first $500 million | |
| 0.030% | Of the next $500 million | |
| 0.015% | On amounts over $1 billion |
Fees earned by MIM with respect to the Portfolio for the year ended December 31, 2023 were $294,590.
BHFTII-34
Brighthouse Funds Trust II
MetLife Russell 2000 Index Portfolio
Notes to Financial Statements—December 31, 2023—(Continued)
Management Fee Waiver - Pursuant to a management fee waiver agreement, the Adviser has agreed, for the period May 1, 2023 to April 30, 2024, to reduce its advisory fees set out above under “Investment Management Agreement” for each class of the Portfolio as follows:
| % per annum reduction |
Average Daily Net Assets | |
| 0.005% | Over $500 million and under $1 billion | |
| 0.010% | Of the next $1 billion | |
| 0.015% | On amounts over $2 billion |
An identical agreement was in place for the period April 29, 2022 to April 30, 2023. Amounts waived for the year ended December 31, 2023 are shown as a management fee waiver in the Statement of Operations.
Certain officers and trustees of the Trust may also be officers of the Adviser; however, such officers and trustees receive no compensation from the Trust.
Transfer Agency Agreement - Brighthouse Life Insurance Company serves as the transfer agent for the Trust. Brighthouse Life Insurance Company receives no fees for its services to the Trust.
Distribution and Service Fees - The Trust has a distribution agreement with Brighthouse Securities, LLC (the “Distributor”) pursuant to which the Distributor serves as the general distributor of shares of each class (each a “Class”) of each Portfolio. The Distributor is an affiliate of the Trust. The Trust has adopted a Distribution and Services Plan (the “D&S Plan”) relating to Class B, Class D, Class E, Class F and Class G shares of each Portfolio, under Rule 12b-1 under the 1940 Act, pursuant to which the Trust may pay the Distributor a fee (the “Service Fee”) at an annual rate not to exceed 0.25% of each such Portfolio’s average daily net assets attributable to the Class B, Class D, Class E, Class F and Class G shares of the Trust. Each Portfolio may not offer shares of each Class. The D&S Plan also authorizes the Trust, on behalf of each of its Portfolios, to pay to the Distributor a distribution fee (the “Distribution Fee” and together with the Service Fee, the “Fees”) at an annual rate of up to 0.25% of each Portfolio’s average daily net assets attributable to the Class B, Class D, Class E, Class F, and Class G shares in consideration of the services rendered in connection with the sale of such shares by the Distributor. Under the Distribution Agreement with respect to the Trust, Fees are currently paid at an annual rate of 0.25% of average daily net assets in the case of Class B shares, 0.10% of average daily net assets in the case of Class D shares, 0.15% of average daily net assets in the case of Class E shares, 0.20% of average daily net assets in the case of Class F shares and 0.30% of average daily net assets in the case of Class G shares. The D&S Plan is known as a “compensation plan” because the Trust makes payments to the Distributor for services rendered regardless of the actual level of expenditures by the Distributor. Amounts incurred by the Portfolio for the year ended December 31, 2023 are shown as Distribution and service fees in the Statement of Operations.
Deferred Trustee Compensation - Each Trustee who is not currently an employee of the Adviser or any of its affiliates receives compensation from the Trust for his or her service to the Trust. A deferred compensation plan (the “Plan”) is available to the Trustees on a voluntary basis. Deferred amounts remain in the Trust until distributed in accordance with the provisions of the Plan. The value of a participating Trustee’s deferral account is based on theoretical investments of deferred amounts on the normal payment dates in certain portfolios of the Trust or Brighthouse Funds Trust I, an affiliate of the Trust, as designated by the participating Trustee. Changes in the value of participants’ deferral accounts are reflected as a component of Trustees’ fees and expenses in the Statement of Operations. The portion of the accrued obligations allocated to the Portfolio under the Plan is reflected as Deferred trustees’ fees in the Statement of Assets and Liabilities.
7. Contractual Obligations
Under the Trust’s organizational documents, its officers and Trustees may be indemnified against certain liabilities and expenses arising out of the performance of their duties to the Trust. Additionally, the Trust has a variety of indemnification obligations under contracts with its service providers. The Trust’s maximum exposure under these arrangements is unknown, as this would involve future claims that may be made against the Trust that have not yet occurred.
8. Income Tax Information
The cost basis of investments for federal income tax purposes at December 31, 2023 was as follows:
| Cost basis of investments |
$ | 810,111,936 | ||
|
|
|
|||
| Gross unrealized appreciation |
321,534,793 | |||
| Gross unrealized (depreciation) |
(114,293,919 | ) | ||
|
|
|
|||
| Net unrealized appreciation (depreciation) |
$ | 207,240,874 | ||
|
|
|
|||
BHFTII-35
Brighthouse Funds Trust II
MetLife Russell 2000 Index Portfolio
Notes to Financial Statements—December 31, 2023—(Continued)
The tax character of distributions paid for the years ended December 31, 2023 and 2022 were as follows:
| Ordinary Income |
Long-Term Capital Gain | Total | ||||||||||||||||||
| 2023 |
2022 | 2023 | 2022 | 2023 | 2022 | |||||||||||||||
| $10,026,275 |
$ | 24,200,005 | $ | 14,544,513 | $ | 142,562,917 | $ | 24,570,788 | $ | 166,762,922 | ||||||||||
As of December 31, 2023, the components of distributable earnings (accumulated losses) on a federal income tax basis were as follows:
| Undistributed |
Undistributed Long-Term Capital Gain |
Net Unrealized Appreciation (Depreciation) |
Accumulated Capital Losses |
Total | ||||||||||||
| $11,594,092 |
$ | 29,094,138 | $ | 207,240,875 | $ | — | $ | 247,929,105 | ||||||||
The Portfolio utilizes the provisions of the federal income tax laws that provide for the carryforward of capital losses for prior years, offsetting such losses against any future realized capital gains. Net capital losses may be carried forward indefinitely and their character is retained as short-term and/or long-term losses.
As of December 31, 2023, the Portfolio had no accumulated capital losses.
9. Recent Accounting Pronouncement & Regulatory Updates
In June 2022, FASB issued Accounting Standards Update 2022-03—Fair Value Measurement (Topic 820)—Fair Value Measurement of Equity Securities Subject to Contractual Sale Restrictions (“ASU 2022-03”). ASU 2022-03 clarifies the guidance in Topic 820 to indicate that a contractual sale restriction should not be considered in the fair value of an equity security subject to such a restriction, and requires entities with investments in equity securities subject to contractual sale restrictions to disclose certain qualitative and quantitative information about such securities. ASU 2022-03 is effective for fiscal years, and interim periods within those fiscal years, beginning after December 15, 2023. ASU 2022-03 is only applicable to an equity security in which the contractual arrangement that restricts its sale is executed or modified on or after the adoption date.
Effective January 24, 2023, the Securities and Exchange Commission adopted rule and form amendments that require open-end management investment companies to transmit concise and visually engaging annual and semiannual reports to shareholders that highlight certain information deemed by the SEC to be particularly important for investors. Certain other information, including financial statements, will no longer appear in shareholder reports but will, as required, be available online, delivered free of charge upon request, and filed on a semiannual basis on Form N-CSR. The rule and form amendments have a compliance date of July 24, 2024. Accordingly, the rule and form amendments will not impact the Portfolio until its 2024 semiannual shareholder report.
BHFTII-36
Brighthouse Funds Trust II
MetLife Russell 2000 Index Portfolio
Report of Independent Registered Public Accounting Firm
To the Board of Trustees of Brighthouse Funds Trust II and Shareholders of the MetLife Russell 2000 Index Portfolio:
Opinion on the Financial Statements and Financial Highlights
We have audited the accompanying statement of assets and liabilities, including the schedule of investments, of the MetLife Russell 2000 Index Portfolio (the “Fund”) (one of the funds constituting the Brighthouse Funds Trust II), as of December 31, 2023, the related statement of operations for the year then ended, the statements of changes in net assets for each of the two years in the period then ended, the financial highlights for each of the five years in the period then ended, and the related notes. In our opinion, the financial statements and financial highlights present fairly, in all material respects, the financial position of the Fund as of December 31, 2023, and the results of its operations for the year then ended, the changes in its net assets for each of the two years in the period then ended, and the financial highlights for each of the five years in the period then ended in conformity with accounting principles generally accepted in the United States of America.
Basis for Opinion
These financial statements and financial highlights are the responsibility of the Fund’s management. Our responsibility is to express an opinion on the Fund’s financial statements and financial highlights based on our audits. We are a public accounting firm registered with the Public Company Accounting Oversight Board (United States) (PCAOB) and are required to be independent with respect to the Fund in accordance with the U.S. federal securities laws and the applicable rules and regulations of the Securities and Exchange Commission and the PCAOB.
We conducted our audits in accordance with the standards of the PCAOB. Those standards require that we plan and perform the audit to obtain reasonable assurance about whether the financial statements and financial highlights are free of material misstatement, whether due to error or fraud. The Fund is not required to have, nor were we engaged to perform, an audit of its internal control over financial reporting. As part of our audits we are required to obtain an understanding of internal control over financial reporting but not for the purpose of expressing an opinion on the effectiveness of the Fund’s internal control over financial reporting. Accordingly, we express no such opinion.
Our audits included performing procedures to assess the risks of material misstatement of the financial statements and financial highlights, whether due to error or fraud, and performing procedures that respond to those risks. Such procedures included examining, on a test basis, evidence regarding the amounts and disclosures in the financial statements and financial highlights. Our audits also included evaluating the accounting principles used and significant estimates made by management, as well as evaluating the overall presentation of the financial statements and financial highlights. Our procedures included confirmation of securities owned as of December 31, 2023, by correspondence with the custodian and brokers; when replies were not received from brokers, we performed other auditing procedures. We believe that our audits provide a reasonable basis for our opinion.
/s/ Deloitte & Touche LLP
Boston, Massachusetts
February 23, 2024
We have served as the auditor of one or more Brighthouse investment companies since 1983.
BHFTII-37
Brighthouse Funds Trust II
Trustees and Officers
MANAGEMENT OF THE TRUSTS
The Boards of Trustees (the “Board”) of Brighthouse Funds Trust I and Brighthouse Funds Trust II (“Trust I” and “Trust II”, respectively, and collectively the “Trusts”) supervise the Trusts and are responsible for representing the interests of shareholders. The Trustees, the Chairman of the Board and the Chairmen of each subcommittee are the same for both Trusts. The Trustees of each Trust meet periodically throughout the year to oversee the Portfolios’ activities, reviewing, among other things, each Portfolio’s performance and its contractual arrangements with various service providers. The Trustees of each Trust elect the officers of the Trust, who are responsible for administering the Trust’s day-to-day operations.
Trustees and Officers
The Trustees and executive officers of the Trusts, as well as their ages and their principal occupations during the past five years, are set forth below. Unless otherwise indicated, the business address of each is c/o Brighthouse Funds Trust I and Brighthouse Funds Trust II, 11225 N. Community House Rd., Charolette, North Carolina 28277. Each Trustee who is deemed an “interested person,” as such term is defined in the 1940 Act, is referred to as an “Interested Trustee.” Those Trustees who are not “interested persons,” as such term is defined in the 1940 Act, are referred to as “Independent Trustees.” There is no limit to the term a Trustee may serve, other than pursuant to the retirement policy adopted by the Independent Trustees. Trustees serve until their death, resignation, retirement or removal in accordance with Trust I’s and Trust II’s respective organizational documents and policies adopted by the Board of the Trust from time to time. Officers hold office at the pleasure of each Board and serve until their removal or resignation in accordance with the Trusts’ respective organizational documents and policies adopted by the Board of each Trust from time to time.
Trustees of the Trusts
| Name and Year of Birth |
Position(s) |
Term of Office |
Principal Occupation(s) During the Past |
Number of |
Other Directorships Held | |||||
| Interested Trustee | ||||||||||
| John Rosenthal* (1960) |
Trustee | Indefinite; From May 2016 (Trust I and Trust II) to present | Chief Investment Officer, Brighthouse Financial, Inc. (2016 to present). | 73 | None | |||||
| Independent Trustees | ||||||||||
| Dawn M. Vroegop (1966) |
Trustee and Chair of the Board | Indefinite; From December 2000 (Trust I)/May 2009 (Trust II) to present as Trustee; From May 2016 (Trust I and Trust II) until present as Chair |
Retired; Private Investor. | 73 | Trustee, Driehaus Mutual Funds (8 portfolios).** | |||||
| Stephen M. Alderman (1959) |
Trustee | Indefinite; From December 2000 (Trust I)/April 2012 (Trust II) to present | Vice President and General Counsel, IHR Aerial Solutions, LLC; Until 2022, General Counsel, Illini Hi-Reach, Inc.; Until 2020, Shareholder in the law firm of Garfield & Merel, Ltd. | 73 | None | |||||
| Robert J. Boulware (1956) |
Trustee | Indefinite; From March 2008 (Trust I)/April 2012 (Trust II) to present | Managing Member, Pilgrim Funds, LLC (private equity fund). | 73 | Trustee, Vertical Capital Income Fund (closed-end fund);** Trustee, The Private Shares Fund (closed-end fund);** Until 2021, Director, Mid-Con Energy Partners, LP (energy);** Until 2020, Director, Gainsco, Inc. (auto insurance).** | |||||
BHFTII-38
Brighthouse Funds Trust II
Trustees and Officers—(Continued)
| Name and Year of Birth |
Position(s) |
Term of Office |
Principal Occupation(s) During the Past |
Number of |
Other Directorships Held | |||||
| Susan C. Gause (1952) |
Trustee | Indefinite; From March 2008 (Trust I)/April 2012 (Trust II) to present | Private Investor. | 73 | Trustee, HSBC Funds (4 portfolios).** | |||||
| Nancy Hawthorne (1951) |
Trustee | Indefinite; From May 2003 (Trust II)/April 2012 (Trust I) to present | Private Investor. | 73 | Trustee, First Eagle Credit Opportunities Fund;** Trustee and Chair of the Board of Trustees, First Eagle Global Opportunities Fund;** Director, Avid Technology, Inc;** Director, CRA International, Inc.** | |||||
Executive Officers of the Trusts
| Name and Year of Birth |
Position(s) |
Term of Office |
Principal Occupation(s) | |||
| Kristi Slavin (1973) | President and Chief Executive Officer, of Trust I and Trust II | From May 2016 (Trust I and Trust II) to present |
President, Brighthouse Investment Advisers, LLC (2016-present). | |||
| Alan R. Otis (1971) | Chief Financial Officer and Treasurer, of Trust I and Trust II | From November 2017 (Trust I and Trust II) to present |
Executive Vice President, Brighthouse Investment Advisers, LLC (2017-present); formerly, Vice President, Brighthouse Investment Advisers, LLC (2012-2017); Assistant Treasurer, Trust I and Trust II (2012-2017). | |||
| Thomas Watterson (1985) | Secretary, of Trust I and Trust II | From November 2023 (Trust I and Trust II) to present |
Executive Vice President, Chief Legal Officer and Secretary, Brighthouse Investment Advisers, LLC (2023-Present); Managing Corporate Counsel, Brighthouse Financial Inc. (2023-present); Managing Counsel and Director, The Bank of New York Mellon Corporation (2019-2023); Counsel and Vice President, The Bank of New York Mellon Corporation (2016-2019). | |||
| Katie Hellmann (1980) | Chief Compliance Officer (“CCO”), of Trust I and Trust II | From May 2023 (Trust I and Trust II) to present |
Chief Compliance Officer, Brighthouse Investment Advisers, LLC (2023-present) and Head of Funds and Investments Compliance (2023-present). Deputy Chief Compliance Officer, Transamerica Asset Management (2022-2023). Leader and Senior Compliance Counsel – Funds Compliance, Edward Jones (2017-2022). | |||
| Rosemary Morgan (1983) | Anti-Money Laundering Officer, of Trust I and Trust II | From May 2023 (Trust I and Trust II) to present |
Chief Privacy Officer, Leader of Compliance Programs and Assistant General Counsel, Brighthouse Financial, Inc. (2019-2022); Chief Privacy Officer, Head of Compliance Programs & Contracts Law, Brighthouse Financial, Inc. (2022-2023), Chief Compliance Officer and Associate General Counsel, Brighthouse Financial, Inc. (2023-present); Vice President and Chief Compliance Officer, Brighthouse Life Insurance Company (2023-present); Vice President and Chief Compliance Officer (2023-present), Brighthouse Life Insurance Company of NY; Vice President and Chief Compliance Officer (2023-present), New England Life Insurance Company. | |||
| Anna Koska (1981) | Vice President, of Trust I and Trust II | From June 2022 (Trust I and Trust II) to present |
Vice President, Investment and Advisory Services, Brighthouse Investment Advisers, LLC (2022-present); Director of Investment and Advisory Services, Brighthouse Investment Advisers, LLC (2019-2022); Senior Portfolio Analyst, Brighthouse Investment Advisers, LLC (2017-2019). | |||
| * | Mr. Rosenthal is an “interested person” of the Trusts because of his position with Brighthouse Financial, Inc. (“Brighthouse Financial”), an affiliate of BIA. |
| ** | Indicates a directorship with a registered investment company or a company subject to the reporting requirements of the Securities Exchange Act of 1934, as amended. |
| (1) | Previous positions during the past five years with the Trusts, MetLife, Inc. or the Adviser are omitted if not materially different. |
| (2) | The Fund Complex includes 44 Trust I Portfolios and 29 Trust II Portfolios. |
BHFTII-39
Brighthouse Funds Trust II
MetLife Russell 2000 Index Portfolio
Board of Trustees’ Consideration of Advisory and Sub-Advisory Agreements
At a meeting held on November 13-14, 2023 (the “November Meeting”), the Boards of Trustees (the “Board”) of Brighthouse Funds Trust I and Brighthouse Funds Trust II (“BFT I” and “BFT II,” respectively, and collectively, the “Trusts”), including a majority of the Trustees who are not “interested persons” of the Trusts (the “Independent Trustees”) under the Investment Company Act of 1940 (the “1940 Act”), approved the continuation of the Trusts’ advisory agreements (each an “Advisory Agreement”) with Brighthouse Investment Advisers, LLC (the “Adviser”) and the applicable sub-advisory and sub-sub-advisory agreements (each a “Sub-Advisory Agreement” and collectively with the Advisory Agreement, the “Agreements”) between the Adviser and the investment sub-advisers and sub-sub-adviser (each a “Sub-Adviser,” and collectively, the “Sub-Advisers”) for the series of the Trusts (each a “Portfolio,” and collectively, the “Portfolios”) for the annual contract renewal period from January 1, 2024 through December 31, 2024.
The Board met with personnel of the Adviser on September 28-29, 2023 (the “September Meeting”) for the specific purpose of giving preliminary consideration to the proposed continuation of the Agreements, including consideration to information that the Adviser and Sub-Advisers had provided for the Board’s review at the request of the Independent Trustees. At the September Meeting, the Adviser reviewed with the Board the performance and fees experienced by each Portfolio, as well as other information. During and after the September Meeting, the Independent Trustees requested additional information and clarifications that the Adviser addressed at the November Meeting (the September Meeting and the November Meeting are referred to collectively as, the “Meetings”). During the contract renewal process, and throughout the year, the Independent Trustees were advised by independent legal counsel, and they met with independent legal counsel in executive sessions outside of the presence of management on a number of occasions to discuss, among other things, the renewal of the Agreements.
In considering the continuation of the Agreements, the Board reviewed a variety of materials that were provided for the specific purpose of assisting the Board in the renewal process, along with various information and materials that were provided to and discussed with the Board throughout the year, at regularly scheduled meetings of the Board and its committees. In particular, information for each Portfolio included, but was not limited to, reports on investment performance, expenses, legal and compliance matters, and asset pricing. Information about the Adviser and each Sub-Adviser included, but was not limited to, reports on the business, operations, and performance of the Adviser and the Sub-Advisers and reports that the Adviser and Sub-Advisers had prepared specifically for the renewal process.
In considering the continuation of the Agreements, the Board also reviewed, among other things, a report for each Portfolio that was prepared by Broadridge (“Broadridge”), an independent organization, which set forth comparative performance and expense information for each Portfolio. In addition, the Independent Trustees reviewed a report that was prepared by JDL Consultants, LLC (“JDL”), an independent consultant to the Independent Trustees, which examined the Broadridge reports for each Portfolio (“JDL Report”). The Independent Trustees met in executive session with representatives of JDL during the September Meeting to review the JDL Report.
At the November Meeting, the Board, including a majority of the Independent Trustees, concluded that the nature, extent, and quality of services provided by the Adviser and each Sub-Adviser supported the renewal of the Agreements. The Board also concluded that the investment services provided to and the performance of each Portfolio was such that each Agreement should continue, and that the fees paid by each Portfolio to the Adviser appeared to be reasonable in light of the nature, extent, and quality of the services provided by the Adviser and each Sub-Adviser. Further, the Board concluded that the Adviser’s profitability in providing services under the Advisory Agreements did not appear unreasonable in light of the nature, extent, and quality of the services provided by the Adviser. The Board reviewed the extent to which the investment advisory fees paid by the Portfolios shared economies of scale with investors or entailed the potential to share economies of scale with investors and concluded that those considerations generally supported the renewal of each Agreement. Finally, the Board considered the Adviser’s recommendation that it approve the renewal of each Sub-Advisory Agreement.
In approving the continuation of each Agreement, the Board, including the Independent Trustees, gave attention to all of the information that was furnished, and each Trustee placed varying degrees of importance on the various pieces of information that were provided to them. The Board evaluated the information provided to it on a Portfolio-by-Portfolio basis, and its decision was made separately with respect to each Portfolio. The following paragraphs provide more information about some of the primary factors that were relevant to the Board’s decisions. The Board did not identify any single factor as determinative, and the Trustees generally attributed different weights to various factors for the various Portfolios.
Nature, extent and quality of services. The Board evaluated the nature, extent, and quality of the services that the Adviser and the Sub-Advisers, as relevant, provided to the Portfolios. The Board considered the Adviser’s services as investment manager to the Portfolios, including its services relating to the hiring and oversight of the Sub-Advisers and, in particular, their investment programs and personnel, succession management of key personnel, trading practices, compliance programs and personnel, and risk management
BHFTII-40
Brighthouse Funds Trust II
MetLife Russell 2000 Index Portfolio
Board of Trustees’ Consideration of Advisory and Sub-Advisory Agreements—(Continued)
programs, among other things. The Adviser’s services in coordinating and overseeing the activities of the Trusts’ other service providers were also considered. The Board also considered the systems and processes required by the Adviser to meet additional regulatory and compliance requirements resulting from U.S. Securities and Exchange Commission and other regulatory initiatives, including related to liquidity, valuation, and derivatives risk management. The Board considered information received from the Trusts’ Chief Compliance Officer regarding the Portfolios’ compliance policies and procedures that were established pursuant to Rule 38a-l under the 1940 Act, and relevant aspects of the Adviser’s and Sub-Advisers’ compliance policies and procedures. The Board also noted that it was the practice of the Adviser’s investment, compliance, and legal staff to conduct periodic meetings (through various media) with the Sub-Advisers throughout the year in order to review and assess the services that are provided to the Portfolios, and that personnel of the Adviser routinely prepare and present reports to the Board regarding those meetings. In addition, during the Meetings and throughout the year, the Board considered the expertise, experience, and performance of the personnel of the Adviser who performed the various services that are mentioned above.
With respect to the services provided by each of the Sub-Advisers, the Board considered a variety of information that the Adviser and each Sub-Adviser prepared for the Board’s review. The Board considered each Sub-Adviser’s investment process, each Sub-Adviser’s overall organization and business plans and the investment performance experienced by the Portfolio (as described in more detail below). The Board took into account that each Sub-Adviser’s responsibilities include, among other things, the development and maintenance of an investment program for the applicable Portfolio, the selection of investments and the placement of orders for the purchase and sale of such assets, and the implementation of compliance controls related to the performance of these services. The Board considered, based on the information provided, each Sub-Adviser’s staffing with respect to the management of the Portfolio and other information relating to the Sub-Adviser’s business and operations. The Board also considered the Sub-Adviser’s overall resources and information with respect to any recent turnover of key personnel at the Sub-Adviser. The Board reviewed each Sub-Adviser’s investment experience, as well as information provided regarding the Sub-Adviser’s personnel who provide services to the Portfolios. The Board also considered, among other things, information about each Sub-Adviser’s compliance program, including regarding any compliance matters involving a Sub-Adviser that had been brought to the Board’s attention during the year, as well as the Adviser’s assessment of the financial condition of each Sub-Adviser.
Performance. The Board placed emphasis on the performance of each Portfolio in the context of the performance of the relevant markets in which the Portfolio invests. The Board considered the Adviser’s quarterly presentations to the Board of detailed information about each Portfolio’s investment strategies and performance results and composition, including discussions regarding the relevant effects of market conditions. The Board reviewed and considered the reports prepared by Broadridge, which provided a statistical analysis comparing each Portfolio’s investment performance to that of comparable funds underlying variable insurance products (the “Performance Universe”), and the JDL Report. The Board also compared the performance of each Portfolio to that of comparable funds and other accounts that were managed by the relevant Sub-Adviser, to the extent such information was provided. The Board considered each Portfolio’s performance for periods subsequent to the performance period covered by the Broadridge reports and considered the Adviser’s assessment of the same. The Board also noted that while it found the data provided by Broadridge generally useful, it recognized the limitations of such data, including, in particular, that notable differences may exist between a Portfolio and the other funds in a Broadridge category (for example, with respect to investment strategies) and that the results of the performance comparisons may vary depending on (i) the end dates for the performance periods that were selected and (ii) the selection of the peer groups.
The Board focused particular attention on Portfolios with less favorable performance records. The Board noted the Adviser’s focus on each Sub-Adviser’s performance and that the Adviser had been active in monitoring and responding to any performance issues with respect to the Portfolios.
Fees and Expenses. The Board gave consideration to the level and method of computing the fees payable under the Agreements. The Board reviewed and considered the information in the JDL Report concerning fees and expenses. The Board also reviewed and considered the Broadridge report for each Portfolio, which included various comparisons of the Portfolio’s fees (at December 31, 2022 and various asset levels) and expenses with those of its peers, including, as applicable, a broad group of peer funds (“Expense Universe”), a narrower group of peer funds (“Expense Group”), a broad group of peer sub-advised funds (“Sub-advised Expense Universe”), and a narrower group of peer sub-advised funds (“Sub-advised Expense Group”). In particular, the Board reviewed comparisons of each Portfolio’s contractual management fees with its Expense Group and Sub-advised Expense Universe, contractual sub-adviser fees with its Sub-advised Expense Universe and Sub-advised Expense Group, and total expenses with its Expense Universe, Expense Group and Sub-advised Expense Universe. The Board considered that Broadridge selected the peer funds, which were funds underlying variable insurance products that Broadridge deemed to be comparable to the Portfolios. The Board considered that the fee and expense information in the Broadridge report for each Portfolio reflected information as of the Portfolio’s most recent fiscal year
BHFTII-41
Brighthouse Funds Trust II
MetLife Russell 2000 Index Portfolio
Board of Trustees’ Consideration of Advisory and Sub-Advisory Agreements—(Continued)
end at the time the Broadridge report was issued and that historical asset levels may differ from current asset levels, particularly in a period of market volatility. In addition, the Board compared the fee payable to a Sub-Adviser by the Adviser with respect to the Portfolio to the fee payable to the Sub-Adviser by other comparable funds and other accounts, to the extent such information was provided.
The Board noted that the sub-advisory fees for the Portfolios are negotiated at arm’s length by the Adviser and are paid by the Adviser out of its advisory fees. The Board also considered that the Adviser had entered into expense limitation or management fee waiver agreements with certain of the Portfolios pursuant to which the Adviser had agreed to waive a portion of its advisory fee and/or reimburse certain expenses as a means of limiting a Portfolio’s total annual operating expenses or passing through the benefit of a subadvisory fee concession to a Portfolio, as applicable.
Profitability. The Board examined the profitability to the Adviser of each Advisory Agreement, on a Portfolio-by-Portfolio basis. The Board also considered that an affiliate of the Adviser, Brighthouse Securities, LLC, serves as distributor for the Trusts, and, as such, receives Rule 12b-1 payments to support the distribution of the Portfolios. The Board considered the profitability to the Sub-Advisers and their affiliates of their relationships with the Portfolios, to the extent provided, and the Board considered the ability of the Adviser to negotiate with a Sub-Adviser at arm’s length. In reviewing the profitability information, the Board recognized that expense allocation methodologies are inherently subjective and various methodologies may be reasonable while producing different results.
Economies of scale. The Board considered each Portfolio’s fees in light of its size. The Board noted the fee schedules for the Portfolios that contain breakpoints that reduce the fee rate above specified asset levels, including breakpoints in the Advisory Agreements and any corresponding Sub-Advisory Agreement. The Board noted those Portfolios that did not have breakpoints in their advisory fees and considered management’s explanation of the same.
The Board considered the effective fees under the Advisory Agreement and Sub-Advisory Agreement for each Portfolio as a percentage of assets at different asset levels and possible economies of scale that may be realized if the assets of the Portfolio grow. The Board examined, among other data, the effect of a Portfolio’s growth in size, and reduction in size, on various fee schedules. The Board also generally noted that if a Portfolio’s assets increase over time, the Portfolio may realize economies of scale if assets increase proportionally more than certain other expenses.
Other factors. The Board considered other benefits that may be realized by the Adviser and its affiliates from their relationships with the Trusts. Among the benefits realized by the Adviser, the Board recognized that Brighthouse Securities, LLC, as the distributor for the Trusts, receives payments pursuant to Rule 12b-1 from the Portfolios to help compensate for the provision of shareholder services and distribution activities. The Board considered that a Sub-Adviser may engage in soft dollar transactions in managing a Portfolio. In addition, the Board considered that a Sub-Adviser may be affiliated with registered broker-dealers that may, from time to time, receive brokerage commissions from a Portfolio in connection with the sale of portfolio securities (subject to applicable best execution obligations). The Board also considered that a Sub-Adviser and its affiliates could benefit from the opportunity to provide advisory services to additional portfolios of the Trusts and overall reputational benefits.
The Board considered information from the Adviser and Sub-Advisers pertaining to potential conflicts of interest, and the manner in which any potential conflicts were mitigated. In its review, the Board considered information regarding various business relationships among the Adviser and its affiliates and various Sub-Advisers and their affiliates. The Board also considered information about services and/or payments provided to the Adviser by the Sub-Advisers in connection with marketing activities. The Board considered representations from the Adviser that such business relationships and any payments were not considered in the Adviser’s recommendation to renew any of the Sub-Advisory Agreements.
* * * * *
MetLife Russell 2000 Index Portfolio. The Board also considered the following information in relation to the Agreements with the Adviser and MetLife Investment Management, LLC regarding the Portfolio:
Among other data relating specifically to the Portfolio’s performance, the Board considered that the Portfolio outperformed the median of its Performance Universe and the average of its Morningstar Category for the one-year period ended June 30, 2023 and underperformed the median of its Performance Universe and the average of its Morningstar Category for the three- and five-year periods ended June 30, 2023. The Board further considered that the Portfolio underperformed its benchmark, the Russell 2000 Index, for the one-, three-, and five-year periods ended October 31, 2023. The Board took into account management’s discussion of the Portfolio’s performance, including with respect to prevailing market conditions. The Board also noted the presence of certain management fee waivers in effect for the Portfolio.
BHFTII-42
Brighthouse Funds Trust II
MetLife Russell 2000 Index Portfolio
Board of Trustees’ Consideration of Advisory and Sub-Advisory Agreements—(Continued)
The Board also considered that the Portfolio’s actual management fee was below the Expense Group median, equal to the Expense Universe Median, and above the Sub-advised Expense Universe median. The Board also considered that the Portfolio’s total expenses (exclusive of 12b-1 fees) were below the Expense Group median, the Expense Universe median, and the Sub-advised Expense Universe median. The Board noted that the Portfolio’s contractual management fees were below the asset-weighted average of the Investment Classification/Morningstar Category selected by Broadridge at the Portfolio’s current size. The Board also noted that the Portfolio’s contractual sub-advisory fees were above the average of the Sub-advised Expense Group and below the average of the Sub-advised Expense Universe, each at the Portfolio’s current size.
BHFTII-43
Brighthouse Funds Trust II
MetLife Stock Index Portfolio
Managed By MetLife Investment Management, LLC
Portfolio Manager Commentary*
PERFORMANCE
For the twelve months ended December 31, 2023, the Class A, B, D, E and G shares of the MetLife Stock Index Portfolio returned 25.94%, 25.63%, 25.80%, 25.74%, and 25.56%, respectively. The Portfolio’s benchmark, the Standard & Poor’s (“S&P”) 500 Index¹, returned 26.29%.
MARKET ENVIRONMENT / CONDITIONS
Equity markets climbed in 2023 on signals that the U.S. Federal Reserve (the “Fed”) would begin cutting interest rates in 2024. Equity investors remained hopeful that the Fed would be able to navigate a soft landing as they slowed the pace of quantitative tightening. Other factors that supported the equity markets included a healthy job market, better than expected macroeconomic data, and strong corporate earnings. Some of the fears that concerned equity investors included rising risks of recession and the effect that high bond yields would have on the economy. In addition, continued high inflation and rising geopolitical risk from the wars in Ukraine and Israel weighed on equity markets.
During the year, the Federal Open Market Committee (the “FOMC”) met eight times. In December, the FOMC decided to maintain the target range for the Federal Funds Rate at 5.25% to 5.50%. The FOMC stated that the growth of economic activity had slowed from its strong pace in the third quarter, and inflation had eased over the past year but remained elevated. The FOMC seeks to achieve maximum employment and inflation at the rate of 2 percent over the long run.
Nine of the eleven sectors comprising the S&P 500 Index experienced positive returns for the year. Information Technology (25.7% beginning weight in the benchmark), up 57.8%, was the best-performing sector and had the largest positive impact on the benchmark return. Communication Services (7.3% beginning weight), up 55.8%, and Consumer Discretionary (9.8% beginning weight), up 42.4%, were the next best-performing sectors. Utilities (3.2% beginning weight), down 7.1%, and Energy (5.2% beginning weight), down 1.3%, were the worst-performing sectors.
The stocks with the largest positive impact to the benchmark return for the year were NVIDIA, up 239.0%; Microsoft, up 58.2%; and Apple, up 49.0%. The stocks with the largest negative impact were Pfizer, down 41.2%; NextEra Energy, down 25.3%; and Chevron, down 13.6%.
PORTFOLIO REVIEW / PERIOD END POSITIONING
The Portfolio is managed utilizing a full replication strategy versus the S&P 500 Index. This strategy seeks to replicate the performance of the S&P 500 Index by owning all the components of the Index at their respective index capitalization weights. The Portfolio is periodically rebalanced for compositional changes in the S&P 500 Index. Factors that impact tracking error include transaction costs, cash drag, securities lending, net asset value rounding, and contributions and withdrawals.
Norman Hu
Mirsad Usejnoski
Portfolio Managers
MetLife Investment Management, LLC
* This commentary may include statements that constitute “forward-looking statements” under the U.S. securities laws. Forward-looking statements include, among other things, projections, estimates, and information about possible or future results related to the Portfolio, market or regulatory developments. The views expressed above are not guarantees of future performance or economic results and involve certain risks, uncertainties and assumptions that could cause actual outcomes and results to differ materially from the views expressed herein. The views expressed above are subject to change at any time based upon economic, market, or other conditions and the subadvisory firm undertakes no obligation to update the views expressed herein. Any discussions of specific securities should not be considered a recommendation to buy or sell those securities. The views expressed above (including any forward-looking statement) may not be relied upon as investment advice or as an indication of the Portfolio’s trading intent. Information about the Portfolio’s holdings, asset allocation or country diversification is historical and is not an indication of future Portfolio composition, which may vary. Direct investment in any index is not possible. The performance of any index mentioned in this commentary has not been adjusted for ongoing management, distribution and operating expenses, and sales charges applicable to mutual fund investments. In addition, the returns do not reflect additional fees charged by separate accounts or variable insurance contracts that an investor in the Portfolio may pay. If these additional fees were reflected, performance would have been lower.
1 The Standard & Poor’s 500 Index is an unmanaged index consisting of 500 stocks chosen for market size, liquidity, and industry group representation. It is a market-weighted index (stock price times number of shares outstanding) with each stock’s weight in the Index proportionate to its market value.
BHFTII-1
Brighthouse Funds Trust II
MetLife Stock Index Portfolio
A $10,000 INVESTMENT COMPARED TO THE S&P 500 INDEX
AVERAGE ANNUAL RETURNS (%) FOR THE YEAR ENDED DECEMBER 31, 2023
| 1 Year | 5 Year | 10 Year | Since Inception1 | |||||||||||||
| MetLife Stock Index Portfolio | ||||||||||||||||
| Class A |
25.94 | 15.39 | 11.75 | — | ||||||||||||
| Class B |
25.63 | 15.10 | 11.47 | — | ||||||||||||
| Class D |
25.80 | 15.27 | 11.64 | — | ||||||||||||
| Class E |
25.74 | 15.21 | 11.58 | — | ||||||||||||
|
Class G |
25.56 | 15.05 | — | 11.21 | ||||||||||||
| S&P 500 Index | 26.29 | 15.69 | 12.03 | — | ||||||||||||
1 Inception dates of the Class A, Class B, Class D, Class E and Class G shares are 5/1/90, 1/2/01, 4/28/09, 5/1/01 and 11/12/14, respectively.
Portfolio performance is calculated including reinvestment of all income and capital gain distributions. Performance numbers are net of all Portfolio expenses but do not include any insurance, sales, separate account or administrative charges of variable annuity or life insurance contracts or any additional expenses that participants may bear relating to the operations of their plans. If these charges were included, the returns would be lower. The performance of any index referenced above has not been adjusted for ongoing management, distribution and operating expenses, and sales charges applicable to mutual fund investments. Direct investment in any index is not possible. The performance of Class A shares, as set forth in the line graph above, will differ from that of other classes because of the difference in expenses paid by policyholders investing in the different share classes.
This information represents past performance and is not indicative of future results. Investment return and principal value may fluctuate so that shares, upon redemption, may be worth more or less than the original cost.
PORTFOLIO COMPOSITION AS OF DECEMBER 31, 2023
Top Holdings
| % of Net Assets |
||||
| Apple, Inc. | 7.0 | |||
| Microsoft Corp. | 6.9 | |||
| Amazon.com, Inc. | 3.4 | |||
| NVIDIA Corp. | 3.0 | |||
| Alphabet, Inc. - Class A | 2.0 | |||
| Meta Platforms, Inc. - Class A | 1.9 | |||
| Alphabet, Inc. - Class C | 1.7 | |||
| Tesla, Inc. | 1.7 | |||
| Berkshire Hathaway, Inc. - Class B | 1.6 | |||
| JPMorgan Chase & Co. | 1.2 | |||
Top Sectors
| % of Net Assets |
||||
| Information Technology | 28.6 | |||
| Financials | 13.5 | |||
| Health Care | 12.5 | |||
| Consumer Discretionary | 10.8 | |||
| Industrials | 8.7 | |||
| Communication Services | 8.5 | |||
| Consumer Staples | 6.1 | |||
| Energy | 3.9 | |||
| Real Estate | 2.5 | |||
| Materials | 2.4 | |||
BHFTII-2
Brighthouse Funds Trust II
MetLife Stock Index Portfolio
Understanding Your Portfolio’s Expenses
Shareholder Expense Example
As a shareholder of the Portfolio, you incur ongoing costs, including management fees; distribution and service (12b-1) fees; and other Portfolio expenses. This example is intended to help you understand your ongoing costs (in dollars) (referred to as “expenses”) of investing in the Portfolio and compare these costs with the ongoing costs of investing in other mutual funds. The example is based on an investment of $1,000 invested at the beginning of the period and held for the entire period, July 1, 2023 through December 31, 2023.
Actual Expenses
The first line for each share class of the Portfolio in the table below provides information about actual account values and actual expenses. You may use the information in this line, together with the amount you invested in the particular share class of the Portfolio, to estimate the expenses that you paid over the period. Simply divide your account value by $1,000 (for example, an $8,600 account value divided by $1,000 = 8.6), then multiply the result by the number in the first line under the heading entitled “Expenses Paid During Period” to estimate the expenses you paid on your account during this period.
Hypothetical Example for Comparison Purposes
The second line for each share class of the Portfolio in the table below provides information about hypothetical account values and hypothetical expenses based on the Portfolio’s actual expense ratio and an assumed rate of return of 5% per year before expenses, which is not the Portfolio’s actual return. The hypothetical account values and expenses may not be used to estimate the actual ending account balance or expenses you paid for the period. You may use this information to compare the ongoing costs of investing in the Portfolio and other funds. To do so, compare this 5% hypothetical example with the 5% hypothetical examples that appear in the shareholder reports of the other funds.
Please note that the expenses shown in the table are meant to highlight your ongoing costs only and do not reflect any fees or charges of your variable insurance product or any additional expenses that participants in certain eligible qualified plans may bear relating to the operations of their plan. Therefore, the second line for each share class in the table is useful in comparing ongoing costs only, and will not help you determine the relative total costs of owning different funds. In addition, if these other costs were included, your costs would have been higher.
| MetLife Stock Index Portfolio |
Annualized Expense Ratio |
Beginning Account Value July 1, 2023 |
Ending Account Value December 31, 2023 |
Expenses Paid During Period** July 1, 2023 to December 31, 2023 |
||||||||||||||
| Class A (a) |
Actual | 0.26 | % | $ | 1,000.00 | $ | 1,079.00 | $ | 1.36 | |||||||||
| Hypothetical* | 0.26 | % | $ | 1,000.00 | $ | 1,023.90 | $ | 1.33 | ||||||||||
| Class B (a) |
Actual | 0.51 | % | $ | 1,000.00 | $ | 1,077.50 | $ | 2.67 | |||||||||
| Hypothetical* | 0.51 | % | $ | 1,000.00 | $ | 1,022.64 | $ | 2.60 | ||||||||||
| Class D (a) |
Actual | 0.36 | % | $ | 1,000.00 | $ | 1,078.40 | $ | 1.89 | |||||||||
| Hypothetical* | 0.36 | % | $ | 1,000.00 | $ | 1,023.39 | $ | 1.84 | ||||||||||
| Class E (a) |
Actual | 0.41 | % | $ | 1,000.00 | $ | 1,078.00 | $ | 2.15 | |||||||||
| Hypothetical* | 0.41 | % | $ | 1,000.00 | $ | 1,023.14 | $ | 2.09 | ||||||||||
| Class G (a) |
Actual | 0.56 | % | $ | 1,000.00 | $ | 1,077.20 | $ | 2.93 | |||||||||
| Hypothetical* | 0.56 | % | $ | 1,000.00 | $ | 1,022.38 | $ | 2.85 | ||||||||||
| * | Hypothetical assumes a rate of return of 5% per year before expenses. |
| ** | Expenses paid are equal to the Portfolio’s annualized expense ratio for the most recent six month period, as shown above, multiplied by the average account value over the period, multiplied by the number of days (184 days) in the most recent fiscal half-year, divided by 365 (to reflect the one-half year period). |
| (a) | The annualized expense ratio shown reflects the impact of the management fee waiver as described in Note 6 of the Notes to Financial Statements. |
BHFTII-3
Brighthouse Funds Trust II
MetLife Stock Index Portfolio
Schedule of Investments as of December 31, 2023
Common Stocks—99.3% of Net Assets
| Security Description | Shares | Value | ||||||
| Aerospace & Defense—1.6% | ||||||||
| Axon Enterprise, Inc. (a) |
12,991 | $ | 3,355,965 | |||||
| Boeing Co. (a) |
104,885 | 27,339,324 | ||||||
| General Dynamics Corp. |
41,776 | 10,847,974 | ||||||
| Howmet Aerospace, Inc. |
72,143 | 3,904,379 | ||||||
| Huntington Ingalls Industries, Inc. |
7,326 | 1,902,123 | ||||||
| L3Harris Technologies, Inc. |
34,958 | 7,362,854 | ||||||
| Lockheed Martin Corp. |
40,725 | 18,458,199 | ||||||
| Northrop Grumman Corp. |
26,143 | 12,238,584 | ||||||
| RTX Corp. |
265,201 | 22,314,012 | ||||||
| Textron, Inc. |
36,150 | 2,907,183 | ||||||
| TransDigm Group, Inc. |
10,202 | 10,320,343 | ||||||
|
|
|
|||||||
| 120,950,940 | ||||||||
|
|
|
|||||||
| Air Freight & Logistics—0.5% | ||||||||
| C.H. Robinson Worldwide, Inc. |
21,514 | 1,858,594 | ||||||
| Expeditors International of Washington, Inc. |
26,815 | 3,410,868 | ||||||
| FedEx Corp. |
42,661 | 10,791,953 | ||||||
| United Parcel Service, Inc. - Class B |
133,395 | 20,973,696 | ||||||
|
|
|
|||||||
| 37,035,111 | ||||||||
|
|
|
|||||||
| Automobile Components—0.1% | ||||||||
| Aptiv PLC (a) (b) |
52,170 | 4,680,693 | ||||||
| BorgWarner, Inc. (b) |
43,352 | 1,554,169 | ||||||
|
|
|
|||||||
| 6,234,862 | ||||||||
|
|
|
|||||||
| Automobiles—2.0% | ||||||||
| Ford Motor Co. (b) |
725,224 | 8,840,481 | ||||||
| General Motors Co. (b) |
252,582 | 9,072,745 | ||||||
| Tesla, Inc. (a) |
510,090 | 126,747,163 | ||||||
|
|
|
|||||||
| 144,660,389 | ||||||||
|
|
|
|||||||
| Banks—3.2% | ||||||||
| Bank of America Corp. |
1,269,837 | 42,755,412 | ||||||
| Citigroup, Inc. |
352,990 | 18,157,805 | ||||||
| Citizens Financial Group, Inc. |
85,988 | 2,849,642 | ||||||
| Comerica, Inc. (b) |
24,322 | 1,357,411 | ||||||
| Fifth Third Bancorp (b) |
125,604 | 4,332,082 | ||||||
| Huntington Bancshares, Inc. |
267,078 | 3,397,232 | ||||||
| JPMorgan Chase & Co. |
533,208 | 90,698,681 | ||||||
| KeyCorp |
172,680 | 2,486,592 | ||||||
| M&T Bank Corp. |
30,609 | 4,195,882 | ||||||
| PNC Financial Services Group, Inc. |
73,468 | 11,376,520 | ||||||
| Regions Financial Corp. |
171,538 | 3,324,406 | ||||||
| Truist Financial Corp. (b) |
245,977 | 9,081,471 | ||||||
| U.S. Bancorp (b) |
287,168 | 12,428,631 | ||||||
| Wells Fargo & Co. |
669,808 | 32,967,950 | ||||||
| Zions Bancorp NA (b) |
27,324 | 1,198,704 | ||||||
|
|
|
|||||||
| 240,608,421 | ||||||||
|
|
|
|||||||
| Beverages—1.5% | ||||||||
| Brown-Forman Corp. - Class B (b) |
33,748 | 1,927,011 | ||||||
| Coca-Cola Co. |
717,656 | 42,291,468 | ||||||
| Constellation Brands, Inc. - Class A |
29,809 | 7,206,326 | ||||||
| Keurig Dr Pepper, Inc. |
185,691 | 6,187,224 | ||||||
| Beverages—(Continued) | ||||||||
| Molson Coors Beverage Co. - Class B |
34,151 | 2,090,383 | ||||||
| Monster Beverage Corp. (a) |
136,245 | 7,849,074 | ||||||
| PepsiCo, Inc. |
253,575 | 43,067,178 | ||||||
|
|
|
|||||||
| 110,618,664 | ||||||||
|
|
|
|||||||
| Biotechnology—2.0% | ||||||||
| AbbVie, Inc. |
325,630 | 50,462,881 | ||||||
| Amgen, Inc. (b) |
98,706 | 28,429,302 | ||||||
| Biogen, Inc. (a) |
26,724 | 6,915,370 | ||||||
| Gilead Sciences, Inc. |
229,815 | 18,617,313 | ||||||
| Incyte Corp. (a) |
34,307 | 2,154,137 | ||||||
| Moderna, Inc. (a) |
61,180 | 6,084,351 | ||||||
| Regeneron Pharmaceuticals, Inc. (a) |
19,759 | 17,354,132 | ||||||
| Vertex Pharmaceuticals, Inc. (a) |
47,526 | 19,337,854 | ||||||
|
|
|
|||||||
| 149,355,340 | ||||||||
|
|
|
|||||||
| Broadline Retail—3.5% | ||||||||
| Amazon.com, Inc. (a) |
1,677,258 | 254,842,580 | ||||||
| eBay, Inc. |
95,722 | 4,175,394 | ||||||
| Etsy, Inc. (a) (b) |
22,085 | 1,789,989 | ||||||
|
|
|
|||||||
| 260,807,963 | ||||||||
|
|
|
|||||||
| Building Products—0.5% | ||||||||
| A.O. Smith Corp. |
22,654 | 1,867,596 | ||||||
| Allegion PLC (b) |
16,191 | 2,051,238 | ||||||
| Builders FirstSource, Inc. (a) |
22,759 | 3,799,387 | ||||||
| Carrier Global Corp. (b) |
154,751 | 8,890,445 | ||||||
| Johnson Controls International PLC |
125,475 | 7,232,379 | ||||||
| Masco Corp. |
41,406 | 2,773,374 | ||||||
| Trane Technologies PLC |
42,125 | 10,274,287 | ||||||
|
|
|
|||||||
| 36,888,706 | ||||||||
|
|
|
|||||||
| Capital Markets—3.0% | ||||||||
| Ameriprise Financial, Inc. |
18,664 | 7,089,147 | ||||||
| Bank of New York Mellon Corp. |
141,845 | 7,383,032 | ||||||
| BlackRock, Inc. |
25,791 | 20,937,134 | ||||||
| Blackstone, Inc. |
131,050 | 17,157,066 | ||||||
| Cboe Global Markets, Inc. |
19,468 | 3,476,206 | ||||||
| Charles Schwab Corp. |
274,481 | 18,884,293 | ||||||
| CME Group, Inc. |
66,395 | 13,982,787 | ||||||
| FactSet Research Systems, Inc. |
7,007 | 3,342,689 | ||||||
| Franklin Resources, Inc. (b) |
51,995 | 1,548,931 | ||||||
| Goldman Sachs Group, Inc. |
60,147 | 23,202,908 | ||||||
| Intercontinental Exchange, Inc. |
105,564 | 13,557,585 | ||||||
| Invesco Ltd. |
82,914 | 1,479,186 | ||||||
| MarketAxess Holdings, Inc. |
6,991 | 2,047,314 | ||||||
| Moody’s Corp. |
29,027 | 11,336,785 | ||||||
| Morgan Stanley |
233,093 | 21,735,922 | ||||||
| MSCI, Inc. |
14,588 | 8,251,702 | ||||||
| Nasdaq, Inc. |
62,784 | 3,650,262 | ||||||
| Northern Trust Corp. |
38,185 | 3,222,050 | ||||||
| Raymond James Financial, Inc. |
34,659 | 3,864,479 | ||||||
| S&P Global, Inc. (b) |
59,758 | 26,324,594 | ||||||
| State Street Corp. |
56,914 | 4,408,559 | ||||||
See accompanying notes to financial statements.
BHFTII-4
Brighthouse Funds Trust II
MetLife Stock Index Portfolio
Schedule of Investments as of December 31, 2023
Common Stocks—(Continued)
| Security Description | Shares | Value | ||||||
| Capital Markets—(Continued) | ||||||||
| T. Rowe Price Group, Inc. |
41,216 | $ | 4,438,551 | |||||
|
|
|
|||||||
| 221,321,182 | ||||||||
|
|
|
|||||||
| Chemicals—1.6% | ||||||||
| Air Products & Chemicals, Inc. |
40,972 | 11,218,134 | ||||||
| Albemarle Corp. (b) |
21,644 | 3,127,125 | ||||||
| Celanese Corp. (b) |
18,470 | 2,869,684 | ||||||
| CF Industries Holdings, Inc. (b) |
35,237 | 2,801,341 | ||||||
| Corteva, Inc. |
129,977 | 6,228,498 | ||||||
| Dow, Inc. |
129,363 | 7,094,267 | ||||||
| DuPont de Nemours, Inc. |
79,315 | 6,101,703 | ||||||
| Eastman Chemical Co. |
21,867 | 1,964,094 | ||||||
| Ecolab, Inc. |
46,805 | 9,283,772 | ||||||
| FMC Corp. (b) |
23,010 | 1,450,780 | ||||||
| International Flavors & Fragrances, Inc. |
47,082 | 3,812,230 | ||||||
| Linde PLC |
89,432 | 36,730,617 | ||||||
| LyondellBasell Industries NV - Class A |
47,261 | 4,493,576 | ||||||
| Mosaic Co. |
60,280 | 2,153,804 | ||||||
| PPG Industries, Inc. |
43,490 | 6,503,929 | ||||||
| Sherwin-Williams Co. |
43,433 | 13,546,753 | ||||||
|
|
|
|||||||
| 119,380,307 | ||||||||
|
|
|
|||||||
| Commercial Services & Supplies—0.6% | ||||||||
| Cintas Corp. |
15,968 | 9,623,275 | ||||||
| Copart, Inc. (a) |
161,154 | 7,896,546 | ||||||
| Republic Services, Inc. |
37,719 | 6,220,240 | ||||||
| Rollins, Inc. |
51,779 | 2,261,189 | ||||||
| Veralto Corp. (b) |
40,431 | 3,325,854 | ||||||
| Waste Management, Inc. (b) |
67,600 | 12,107,160 | ||||||
|
|
|
|||||||
| 41,434,264 | ||||||||
|
|
|
|||||||
| Communications Equipment—0.8% | ||||||||
| Arista Networks, Inc. (a) |
46,476 | 10,945,563 | ||||||
| Cisco Systems, Inc. |
747,068 | 37,741,875 | ||||||
| F5, Inc. (a) |
11,012 | 1,970,928 | ||||||
| Juniper Networks, Inc. |
58,810 | 1,733,719 | ||||||
| Motorola Solutions, Inc. |
30,611 | 9,583,998 | ||||||
|
|
|
|||||||
| 61,976,083 | ||||||||
|
|
|
|||||||
| Construction & Engineering—0.1% | ||||||||
| Quanta Services, Inc. |
26,796 | 5,782,577 | ||||||
|
|
|
|||||||
| Construction Materials—0.2% | ||||||||
| Martin Marietta Materials, Inc. |
11,399 | 5,687,075 | ||||||
| Vulcan Materials Co. |
24,507 | 5,563,334 | ||||||
|
|
|
|||||||
| 11,250,409 | ||||||||
|
|
|
|||||||
| Consumer Finance—0.5% | ||||||||
| American Express Co. |
106,182 | 19,892,136 | ||||||
| Capital One Financial Corp. |
70,242 | 9,210,131 | ||||||
| Discover Financial Services (b) |
46,119 | 5,183,775 | ||||||
| Synchrony Financial (b) |
76,320 | 2,914,661 | ||||||
|
|
|
|||||||
| 37,200,703 | ||||||||
|
|
|
|||||||
| Consumer Staples Distribution & Retail—1.8% | ||||||||
| Costco Wholesale Corp. |
81,658 | 53,900,813 | ||||||
| Dollar General Corp. |
40,479 | 5,503,120 | ||||||
| Dollar Tree, Inc. (a) (b) |
38,548 | 5,475,743 | ||||||
| Kroger Co. |
122,054 | 5,579,088 | ||||||
| Sysco Corp. (b) |
92,993 | 6,800,578 | ||||||
| Target Corp. |
85,136 | 12,125,069 | ||||||
| Walgreens Boots Alliance, Inc. (b) |
132,250 | 3,453,048 | ||||||
| Walmart, Inc. |
263,104 | 41,478,346 | ||||||
|
|
|
|||||||
| 134,315,805 | ||||||||
|
|
|
|||||||
| Containers & Packaging—0.2% | ||||||||
| Amcor PLC |
266,574 | 2,569,773 | ||||||
| Avery Dennison Corp. (b) |
14,853 | 3,002,682 | ||||||
| Ball Corp. (b) |
58,153 | 3,344,961 | ||||||
| International Paper Co. |
63,818 | 2,307,021 | ||||||
| Packaging Corp. of America (b) |
16,530 | 2,692,902 | ||||||
| Westrock Co. |
47,290 | 1,963,481 | ||||||
|
|
|
|||||||
| 15,880,820 | ||||||||
|
|
|
|||||||
| Distributors—0.1% | ||||||||
| Genuine Parts Co. |
25,857 | 3,581,194 | ||||||
| LKQ Corp. |
49,354 | 2,358,628 | ||||||
| Pool Corp. (b) |
7,134 | 2,844,397 | ||||||
|
|
|
|||||||
| 8,784,219 | ||||||||
|
|
|
|||||||
| Diversified Telecommunication Services—0.7% | ||||||||
| AT&T, Inc. |
1,318,726 | 22,128,222 | ||||||
| Verizon Communications, Inc. |
775,391 | 29,232,241 | ||||||
|
|
|
|||||||
| 51,360,463 | ||||||||
|
|
|
|||||||
| Electric Utilities—1.5% | ||||||||
| Alliant Energy Corp. (b) |
47,064 | 2,414,383 | ||||||
| American Electric Power Co., Inc. |
96,990 | 7,877,528 | ||||||
| Constellation Energy Corp. |
58,905 | 6,885,406 | ||||||
| Duke Energy Corp. (b) |
142,147 | 13,793,945 | ||||||
| Edison International |
70,692 | 5,053,771 | ||||||
| Entergy Corp. |
39,003 | 3,946,714 | ||||||
| Evergy, Inc. (b) |
42,369 | 2,211,662 | ||||||
| Eversource Energy |
64,428 | 3,976,496 | ||||||
| Exelon Corp. |
183,595 | 6,591,061 | ||||||
| FirstEnergy Corp. |
95,249 | 3,491,828 | ||||||
| NextEra Energy, Inc. |
378,410 | 22,984,623 | ||||||
| NRG Energy, Inc. (b) |
41,639 | 2,152,736 | ||||||
| PG&E Corp. |
393,497 | 7,094,751 | ||||||
| Pinnacle West Capital Corp. |
20,914 | 1,502,462 | ||||||
| PPL Corp. |
135,952 | 3,684,299 | ||||||
| Southern Co. |
201,150 | 14,104,638 | ||||||
| Xcel Energy, Inc. |
101,775 | 6,300,890 | ||||||
|
|
|
|||||||
| 114,067,193 | ||||||||
|
|
|
|||||||
| Electrical Equipment—0.6% | ||||||||
| AMETEK, Inc. |
42,567 | 7,018,873 | ||||||
| Eaton Corp. PLC |
73,645 | 17,735,189 | ||||||
| Emerson Electric Co. |
105,147 | 10,233,957 | ||||||
| Generac Holdings, Inc. (a) (b) |
11,330 | 1,464,289 | ||||||
See accompanying notes to financial statements.
BHFTII-5
Brighthouse Funds Trust II
MetLife Stock Index Portfolio
Schedule of Investments as of December 31, 2023
Common Stocks—(Continued)
| Security Description | Shares | Value | ||||||
| Electrical Equipment—(Continued) | ||||||||
| Hubbell, Inc. |
9,892 | $ | 3,253,776 | |||||
| Rockwell Automation, Inc. |
21,150 | 6,566,652 | ||||||
|
|
|
|||||||
| 46,272,736 | ||||||||
|
|
|
|||||||
| Electronic Equipment, Instruments & Components—0.6% | ||||||||
| Amphenol Corp. - Class A |
110,350 | 10,938,995 | ||||||
| CDW Corp. |
24,707 | 5,616,395 | ||||||
| Corning, Inc. |
141,621 | 4,312,359 | ||||||
| Jabil, Inc. |
23,597 | 3,006,258 | ||||||
| Keysight Technologies, Inc. (a) |
32,751 | 5,210,357 | ||||||
| TE Connectivity Ltd. |
57,319 | 8,053,320 | ||||||
| Teledyne Technologies, Inc. (a) |
8,703 | 3,884,062 | ||||||
| Trimble, Inc. (a) (b) |
45,881 | 2,440,869 | ||||||
| Zebra Technologies Corp. - Class A (a) (b) |
9,473 | 2,589,255 | ||||||
|
|
|
|||||||
| 46,051,870 | ||||||||
|
|
|
|||||||
| Energy Equipment & Services—0.4% | ||||||||
| Baker Hughes Co. |
185,586 | 6,343,330 | ||||||
| Halliburton Co. |
165,080 | 5,967,642 | ||||||
| Schlumberger NV |
263,460 | 13,710,458 | ||||||
|
|
|
|||||||
| 26,021,430 | ||||||||
|
|
|
|||||||
| Entertainment—1.2% | ||||||||
| Electronic Arts, Inc. |
45,142 | 6,175,877 | ||||||
| Live Nation Entertainment, Inc. (a) (b) |
26,169 | 2,449,418 | ||||||
| Netflix, Inc. (a) |
80,724 | 39,302,901 | ||||||
| Take-Two Interactive Software, Inc. (a) |
29,171 | 4,695,073 | ||||||
| Walt Disney Co. |
337,478 | 30,470,889 | ||||||
| Warner Bros Discovery, Inc. (a) |
409,282 | 4,657,629 | ||||||
|
|
|
|||||||
| 87,751,787 | ||||||||
|
|
|
|||||||
| Financial Services—4.1% | ||||||||
| Berkshire Hathaway, Inc. - Class B (a) |
335,572 | 119,685,110 | ||||||
| Fidelity National Information Services, Inc. |
109,275 | 6,564,149 | ||||||
| Fiserv, Inc. (a) |
110,696 | 14,704,857 | ||||||
| FleetCor Technologies, Inc. (a) |
13,317 | 3,763,517 | ||||||
| Global Payments, Inc. |
48,025 | 6,099,175 | ||||||
| Jack Henry & Associates, Inc. (b) |
13,432 | 2,194,923 | ||||||
| Mastercard, Inc. - Class A |
152,730 | 65,140,872 | ||||||
| PayPal Holdings, Inc. (a) (b) |
198,848 | 12,211,256 | ||||||
| Visa, Inc. - Class A (b) |
293,992 | 76,540,817 | ||||||
|
|
|
|||||||
| 306,904,676 | ||||||||
|
|
|
|||||||
| Food Products—0.9% | ||||||||
| Archer-Daniels-Midland Co. (b) |
98,375 | 7,104,642 | ||||||
| Bunge Global SA |
26,796 | 2,705,056 | ||||||
| Campbell Soup Co. (b) |
36,229 | 1,566,180 | ||||||
| Conagra Brands, Inc. |
88,154 | 2,526,494 | ||||||
| General Mills, Inc. |
107,209 | 6,983,594 | ||||||
| Hershey Co. |
27,644 | 5,153,947 | ||||||
| Hormel Foods Corp. |
53,419 | 1,715,284 | ||||||
| J.M. Smucker Co. |
19,574 | 2,473,762 | ||||||
| Kellanova |
48,643 | 2,719,630 | ||||||
| Kraft Heinz Co. |
147,042 | 5,437,613 | ||||||
| Lamb Weston Holdings, Inc. |
26,729 | 2,889,138 | ||||||
| Food Products—(Continued) | ||||||||
| McCormick & Co., Inc. (b) |
46,347 | 3,171,062 | ||||||
| Mondelez International, Inc. - Class A |
250,911 | 18,173,484 | ||||||
| Tyson Foods, Inc. - Class A (b) |
52,607 | 2,827,626 | ||||||
|
|
|
|||||||
| 65,447,512 | ||||||||
|
|
|
|||||||
| Gas Utilities—0.0% | ||||||||
| Atmos Energy Corp. (b) |
27,388 | 3,174,269 | ||||||
|
|
|
|||||||
| Ground Transportation—1.1% | ||||||||
| CSX Corp. |
364,471 | 12,636,209 | ||||||
| J.B. Hunt Transport Services, Inc. |
15,028 | 3,001,693 | ||||||
| Norfolk Southern Corp. (b) |
41,708 | 9,858,937 | ||||||
| Old Dominion Freight Line, Inc. (b) |
16,502 | 6,688,756 | ||||||
| Uber Technologies, Inc. (a) |
379,544 | 23,368,524 | ||||||
| Union Pacific Corp. |
112,432 | 27,615,548 | ||||||
|
|
|
|||||||
| 83,169,667 | ||||||||
|
|
|
|||||||
| Health Care Equipment & Supplies—2.6% | ||||||||
| Abbott Laboratories |
320,063 | 35,229,334 | ||||||
| Align Technology, Inc. (a) (b) |
13,137 | 3,599,538 | ||||||
| Baxter International, Inc. |
93,569 | 3,617,377 | ||||||
| Becton Dickinson & Co. |
53,507 | 13,046,612 | ||||||
| Boston Scientific Corp. (a) |
270,056 | 15,611,937 | ||||||
| Cooper Cos., Inc. |
9,134 | 3,456,671 | ||||||
| Dentsply Sirona, Inc. (b) |
39,074 | 1,390,644 | ||||||
| DexCom, Inc. (a) (b) |
71,261 | 8,842,777 | ||||||
| Edwards Lifesciences Corp. (a) |
111,860 | 8,529,325 | ||||||
| GE HealthCare Technologies, Inc. (a) (b) |
72,208 | 5,583,123 | ||||||
| Hologic, Inc. (a) |
45,176 | 3,227,825 | ||||||
| IDEXX Laboratories, Inc. (a) |
15,326 | 8,506,696 | ||||||
| Insulet Corp. (a) (b) |
12,879 | 2,794,485 | ||||||
| Intuitive Surgical, Inc. (a) |
64,935 | 21,906,472 | ||||||
| Medtronic PLC |
245,399 | 20,215,970 | ||||||
| ResMed, Inc. (b) |
27,129 | 4,666,731 | ||||||
| STERIS PLC (b) |
18,222 | 4,006,107 | ||||||
| Stryker Corp. |
62,359 | 18,674,026 | ||||||
| Teleflex, Inc. (b) |
8,667 | 2,161,030 | ||||||
| Zimmer Biomet Holdings, Inc. |
38,543 | 4,690,683 | ||||||
|
|
|
|||||||
| 189,757,363 | ||||||||
|
|
|
|||||||
| Health Care Providers & Services—2.8% | ||||||||
| Cardinal Health, Inc. |
45,457 | 4,582,066 | ||||||
| Cencora, Inc. (b) |
30,747 | 6,314,819 | ||||||
| Centene Corp. (a) |
98,526 | 7,311,614 | ||||||
| Cigna Group |
53,970 | 16,161,317 | ||||||
| CVS Health Corp. |
236,890 | 18,704,834 | ||||||
| DaVita, Inc. (a) |
9,935 | 1,040,791 | ||||||
| Elevance Health, Inc. |
43,335 | 20,435,053 | ||||||
| HCA Healthcare, Inc. |
36,531 | 9,888,211 | ||||||
| Henry Schein, Inc. (a) (b) |
24,084 | 1,823,400 | ||||||
| Humana, Inc. |
22,706 | 10,395,034 | ||||||
| Laboratory Corp. of America Holdings (b) |
15,659 | 3,559,134 | ||||||
| McKesson Corp. |
24,542 | 11,362,455 | ||||||
| Molina Healthcare, Inc. (a) |
10,753 | 3,885,166 | ||||||
| Quest Diagnostics, Inc. |
20,737 | 2,859,218 | ||||||
| UnitedHealth Group, Inc. |
170,590 | 89,810,517 | ||||||
See accompanying notes to financial statements.
BHFTII-6
Brighthouse Funds Trust II
MetLife Stock Index Portfolio
Schedule of Investments as of December 31, 2023
Common Stocks—(Continued)
| Security Description | Shares | Value | ||||||
| Health Care Providers & Services—(Continued) | ||||||||
| Universal Health Services, Inc. - Class B |
11,251 | $ | 1,715,102 | |||||
|
|
|
|||||||
| 209,848,731 | ||||||||
|
|
|
|||||||
| Health Care REITs—0.2% | ||||||||
| Healthpeak Properties, Inc. |
100,900 | 1,997,820 | ||||||
| Ventas, Inc. |
74,213 | 3,698,776 | ||||||
| Welltower, Inc. |
102,080 | 9,204,554 | ||||||
|
|
|
|||||||
| 14,901,150 | ||||||||
|
|
|
|||||||
| Hotel & Resort REITs—0.0% | ||||||||
| Host Hotels & Resorts, Inc. (b) |
130,108 | 2,533,203 | ||||||
|
|
|
|||||||
| Hotels, Restaurants & Leisure—2.2% | ||||||||
| Airbnb, Inc. - Class A (a) |
80,182 | 10,915,977 | ||||||
| Booking Holdings, Inc. (a) |
6,435 | 22,826,361 | ||||||
| Caesars Entertainment, Inc. (a) (b) |
39,785 | 1,865,121 | ||||||
| Carnival Corp. (a) (b) |
185,820 | 3,445,103 | ||||||
| Chipotle Mexican Grill, Inc. (a) |
5,062 | 11,576,591 | ||||||
| Darden Restaurants, Inc. (b) |
22,190 | 3,645,817 | ||||||
| Domino’s Pizza, Inc. |
6,433 | 2,651,876 | ||||||
| Expedia Group, Inc. (a) (b) |
24,590 | 3,732,516 | ||||||
| Hilton Worldwide Holdings, Inc. |
47,297 | 8,612,311 | ||||||
| Las Vegas Sands Corp. (b) |
68,084 | 3,350,414 | ||||||
| Marriott International, Inc. - Class A (b) |
45,500 | 10,260,705 | ||||||
| McDonald’s Corp. |
133,780 | 39,667,108 | ||||||
| MGM Resorts International |
50,400 | 2,251,872 | ||||||
| Norwegian Cruise Line Holdings Ltd. (a) (b) |
78,464 | 1,572,418 | ||||||
| Royal Caribbean Cruises Ltd. (a) (b) |
43,478 | 5,629,966 | ||||||
| Starbucks Corp. |
210,737 | 20,232,859 | ||||||
| Wynn Resorts Ltd. |
17,706 | 1,613,194 | ||||||
| Yum! Brands, Inc. |
51,699 | 6,754,991 | ||||||
|
|
|
|||||||
| 160,605,200 | ||||||||
|
|
|
|||||||
| Household Durables—0.4% | ||||||||
| DR Horton, Inc. |
55,582 | 8,447,352 | ||||||
| Garmin Ltd. (b) |
28,230 | 3,628,684 | ||||||
| Lennar Corp. - Class A |
46,137 | 6,876,259 | ||||||
| Mohawk Industries, Inc. (a) |
9,748 | 1,008,918 | ||||||
| NVR, Inc. (a) |
587 | 4,109,264 | ||||||
| PulteGroup, Inc. |
39,763 | 4,104,337 | ||||||
| Whirlpool Corp. (b) |
10,116 | 1,231,825 | ||||||
|
|
|
|||||||
| 29,406,639 | ||||||||
|
|
|
|||||||
| Household Products—1.2% | ||||||||
| Church & Dwight Co., Inc. (b) |
45,441 | 4,296,901 | ||||||
| Clorox Co. |
22,870 | 3,261,033 | ||||||
| Colgate-Palmolive Co. |
151,860 | 12,104,761 | ||||||
| Kimberly-Clark Corp. |
62,328 | 7,573,475 | ||||||
| Procter & Gamble Co. |
434,696 | 63,700,352 | ||||||
|
|
|
|||||||
| 90,936,522 | ||||||||
|
|
|
|||||||
| Independent Power and Renewable Electricity Producers—0.0% | ||||||||
| AES Corp. (b) |
123,504 | 2,377,452 | ||||||
|
|
|
|||||||
| Industrial Conglomerates—0.8% | ||||||||
| 3M Co. |
101,867 | 11,136,100 | ||||||
| General Electric Co. |
200,738 | 25,620,191 | ||||||
| Honeywell International, Inc. |
121,590 | 25,498,639 | ||||||
|
|
|
|||||||
| 62,254,930 | ||||||||
|
|
|
|||||||
| Industrial REITs—0.3% | ||||||||
| Prologis, Inc. |
170,414 | 22,716,186 | ||||||
|
|
|
|||||||
| Insurance—2.0% | ||||||||
| Aflac, Inc. |
98,080 | 8,091,600 | ||||||
| Allstate Corp. |
48,264 | 6,755,995 | ||||||
| American International Group, Inc. |
129,481 | 8,772,338 | ||||||
| Aon PLC - Class A |
36,927 | 10,746,495 | ||||||
| Arch Capital Group Ltd. (a) |
68,826 | 5,111,707 | ||||||
| Arthur J. Gallagher & Co. |
39,820 | 8,954,722 | ||||||
| Assurant, Inc. (b) |
9,699 | 1,634,184 | ||||||
| Brown & Brown, Inc. |
43,566 | 3,097,978 | ||||||
| Chubb Ltd. |
75,247 | 17,005,822 | ||||||
| Cincinnati Financial Corp. |
28,939 | 2,994,029 | ||||||
| Everest Group Ltd. |
8,005 | 2,830,408 | ||||||
| Globe Life, Inc. |
15,796 | 1,922,689 | ||||||
| Hartford Financial Services Group, Inc. |
55,473 | 4,458,920 | ||||||
| Loews Corp. |
33,764 | 2,349,637 | ||||||
| Marsh & McLennan Cos., Inc. |
90,940 | 17,230,402 | ||||||
| MetLife, Inc. (c) |
114,675 | 7,583,458 | ||||||
| Principal Financial Group, Inc. |
40,454 | 3,182,516 | ||||||
| Progressive Corp. |
107,903 | 17,186,790 | ||||||
| Prudential Financial, Inc. |
66,581 | 6,905,115 | ||||||
| Travelers Cos., Inc. |
42,125 | 8,024,391 | ||||||
| W.R. Berkley Corp. |
37,573 | 2,657,163 | ||||||
| Willis Towers Watson PLC |
19,045 | 4,593,654 | ||||||
|
|
|
|||||||
| 152,090,013 | ||||||||
|
|
|
|||||||
| Interactive Media & Services—5.8% | ||||||||
| Alphabet, Inc. - Class A (a) |
1,091,496 | 152,471,076 | ||||||
| Alphabet, Inc. - Class C (a) (d) |
918,633 | 129,462,949 | ||||||
| Match Group, Inc. (a) |
50,132 | 1,829,818 | ||||||
| Meta Platforms, Inc. - Class A (a) |
409,377 | 144,903,083 | ||||||
|
|
|
|||||||
| 428,666,926 | ||||||||
|
|
|
|||||||
| IT Services—1.2% | ||||||||
| Accenture PLC - Class A |
115,755 | 40,619,587 | ||||||
| Akamai Technologies, Inc. (a) (b) |
27,818 | 3,292,260 | ||||||
| Cognizant Technology Solutions Corp. - Class A |
92,478 | 6,984,863 | ||||||
| EPAM Systems, Inc. (a) |
10,642 | 3,164,292 | ||||||
| Gartner, Inc. (a) |
14,377 | 6,485,609 | ||||||
| International Business Machines Corp. |
168,412 | 27,543,783 | ||||||
| VeriSign, Inc. (a) |
16,383 | 3,374,243 | ||||||
|
|
|
|||||||
| 91,464,637 | ||||||||
|
|
|
|||||||
| Leisure Products—0.0% | ||||||||
| Hasbro, Inc. (b) |
24,053 | 1,228,146 | ||||||
|
|
|
|||||||
| Life Sciences Tools & Services—1.4% | ||||||||
| Agilent Technologies, Inc. |
53,963 | 7,502,476 | ||||||
See accompanying notes to financial statements.
BHFTII-7
Brighthouse Funds Trust II
MetLife Stock Index Portfolio
Schedule of Investments as of December 31, 2023
Common Stocks—(Continued)
| Security Description | Shares | Value | ||||||
| Life Sciences Tools & Services—(Continued) | ||||||||
| Bio-Rad Laboratories, Inc. - Class A (a) |
3,861 | $ | 1,246,678 | |||||
| Bio-Techne Corp. (b) |
29,168 | 2,250,603 | ||||||
| Charles River Laboratories International, Inc. (a) |
9,461 | 2,236,580 | ||||||
| Danaher Corp. |
121,294 | 28,060,154 | ||||||
| Illumina, Inc. (a) |
29,288 | 4,078,061 | ||||||
| IQVIA Holdings, Inc. (a) (b) |
33,774 | 7,814,628 | ||||||
| Mettler-Toledo International, Inc. (a) |
4,000 | 4,851,840 | ||||||
| Revvity, Inc. (b) |
22,760 | 2,487,896 | ||||||
| Thermo Fisher Scientific, Inc. |
71,261 | 37,824,626 | ||||||
| Waters Corp. (a) (b) |
10,905 | 3,590,253 | ||||||
| West Pharmaceutical Services, Inc. |
13,647 | 4,805,382 | ||||||
|
|
|
|||||||
| 106,749,177 | ||||||||
|
|
|
|||||||
| Machinery—1.8% | ||||||||
| Caterpillar, Inc. (b) |
94,089 | 27,819,295 | ||||||
| Cummins, Inc. |
26,143 | 6,263,078 | ||||||
| Deere & Co. |
49,400 | 19,753,578 | ||||||
| Dover Corp. |
25,800 | 3,968,298 | ||||||
| Fortive Corp. |
64,817 | 4,772,476 | ||||||
| IDEX Corp. |
13,948 | 3,028,250 | ||||||
| Illinois Tool Works, Inc. |
50,500 | 13,227,970 | ||||||
| Ingersoll Rand, Inc. |
74,659 | 5,774,127 | ||||||
| Nordson Corp. |
9,990 | 2,638,958 | ||||||
| Otis Worldwide Corp. |
75,482 | 6,753,375 | ||||||
| PACCAR, Inc. |
96,474 | 9,420,686 | ||||||
| Parker-Hannifin Corp. |
23,696 | 10,916,747 | ||||||
| Pentair PLC |
30,487 | 2,216,710 | ||||||
| Snap-on, Inc. |
9,735 | 2,811,857 | ||||||
| Stanley Black & Decker, Inc. |
28,276 | 2,773,876 | ||||||
| Westinghouse Air Brake Technologies Corp. |
33,043 | 4,193,157 | ||||||
| Xylem, Inc. |
44,463 | 5,084,789 | ||||||
|
|
|
|||||||
| 131,417,227 | ||||||||
|
|
|
|||||||
| Media—0.7% | ||||||||
| Charter Communications, Inc. - Class A (a) (b) |
18,552 | 7,210,791 | ||||||
| Comcast Corp. - Class A |
740,630 | 32,476,625 | ||||||
| Fox Corp. - Class A (b) |
45,597 | 1,352,863 | ||||||
| Fox Corp. - Class B |
24,331 | 672,752 | ||||||
| Interpublic Group of Cos., Inc. (b) |
70,640 | 2,305,690 | ||||||
| News Corp. - Class A (b) |
70,192 | 1,723,214 | ||||||
| News Corp. - Class B (b) |
21,174 | 544,595 | ||||||
| Omnicom Group, Inc. |
36,506 | 3,158,134 | ||||||
| Paramount Global - Class B |
88,982 | 1,316,044 | ||||||
|
|
|
|||||||
| 50,760,708 | ||||||||
|
|
|
|||||||
| Metals & Mining—0.4% | ||||||||
| Freeport-McMoRan, Inc. |
264,478 | 11,258,828 | ||||||
| Newmont Corp. |
212,561 | 8,797,900 | ||||||
| Nucor Corp. (b) |
45,341 | 7,891,148 | ||||||
| Steel Dynamics, Inc. (b) |
28,054 | 3,313,177 | ||||||
|
|
|
|||||||
| 31,261,053 | ||||||||
|
|
|
|||||||
| Multi-Utilities—0.7% | ||||||||
| Ameren Corp. |
48,496 | 3,508,201 | ||||||
| CenterPoint Energy, Inc. (b) |
116,420 | 3,326,119 | ||||||
| Multi-Utilities—(Continued) | ||||||||
| CMS Energy Corp. (b) |
53,812 | 3,124,863 | ||||||
| Consolidated Edison, Inc. |
63,671 | 5,792,151 | ||||||
| Dominion Energy, Inc. |
154,336 | 7,253,792 | ||||||
| DTE Energy Co. |
38,026 | 4,192,747 | ||||||
| NiSource, Inc. |
76,219 | 2,023,614 | ||||||
| Public Service Enterprise Group, Inc. |
91,907 | 5,620,113 | ||||||
| Sempra |
116,071 | 8,673,986 | ||||||
| WEC Energy Group, Inc. |
58,177 | 4,896,758 | ||||||
|
|
|
|||||||
| 48,412,344 | ||||||||
|
|
|
|||||||
| Office REITs—0.1% | ||||||||
| Alexandria Real Estate Equities, Inc. (b) |
28,845 | 3,656,681 | ||||||
| Boston Properties, Inc. (b) |
26,629 | 1,868,557 | ||||||
|
|
|
|||||||
| 5,525,238 | ||||||||
|
|
|
|||||||
| Oil, Gas & Consumable Fuels—3.5% | ||||||||
| APA Corp. |
56,570 | 2,029,732 | ||||||
| Chevron Corp. (b) |
323,798 | 48,297,710 | ||||||
| ConocoPhillips |
219,001 | 25,419,446 | ||||||
| Coterra Energy, Inc. |
138,731 | 3,540,415 | ||||||
| Devon Energy Corp. |
118,168 | 5,353,010 | ||||||
| Diamondback Energy, Inc. |
33,011 | 5,119,346 | ||||||
| EOG Resources, Inc. |
107,554 | 13,008,656 | ||||||
| EQT Corp. (b) |
75,864 | 2,932,902 | ||||||
| Exxon Mobil Corp. |
738,793 | 73,864,524 | ||||||
| Hess Corp. |
50,986 | 7,350,142 | ||||||
| Kinder Morgan, Inc. |
356,666 | 6,291,588 | ||||||
| Marathon Oil Corp. |
107,941 | 2,607,855 | ||||||
| Marathon Petroleum Corp. |
70,030 | 10,389,651 | ||||||
| Occidental Petroleum Corp. (b) |
121,779 | 7,271,424 | ||||||
| ONEOK, Inc. |
107,443 | 7,544,647 | ||||||
| Phillips 66 |
81,144 | 10,803,512 | ||||||
| Pioneer Natural Resources Co. |
43,031 | 9,676,811 | ||||||
| Targa Resources Corp. |
41,124 | 3,572,442 | ||||||
| Valero Energy Corp. |
62,792 | 8,162,960 | ||||||
| Williams Cos., Inc. |
224,367 | 7,814,703 | ||||||
|
|
|
|||||||
| 261,051,476 | ||||||||
|
|
|
|||||||
| Passenger Airlines—0.2% | ||||||||
| American Airlines Group, Inc. (a) (b) |
120,536 | 1,656,165 | ||||||
| Delta Air Lines, Inc. |
118,678 | 4,774,416 | ||||||
| Southwest Airlines Co. (b) |
109,945 | 3,175,211 | ||||||
| United Airlines Holdings, Inc. (a) |
60,491 | 2,495,859 | ||||||
|
|
|
|||||||
| 12,101,651 | ||||||||
|
|
|
|||||||
| Personal Care Products—0.2% | ||||||||
| Estee Lauder Cos., Inc. - Class A |
42,845 | 6,266,081 | ||||||
| Kenvue, Inc. |
317,875 | 6,843,849 | ||||||
|
|
|
|||||||
| 13,109,930 | ||||||||
|
|
|
|||||||
| Pharmaceuticals—3.7% | ||||||||
| Bristol-Myers Squibb Co. |
375,284 | 19,255,822 | ||||||
| Catalent, Inc. (a) (b) |
33,248 | 1,493,833 | ||||||
| Eli Lilly & Co. |
147,073 | 85,731,793 | ||||||
| Johnson & Johnson |
443,990 | 69,590,993 | ||||||
See accompanying notes to financial statements.
BHFTII-8
Brighthouse Funds Trust II
MetLife Stock Index Portfolio
Schedule of Investments as of December 31, 2023
Common Stocks—(Continued)
| Security Description | Shares | Value | ||||||
| Pharmaceuticals—(Continued) | ||||||||
| Merck & Co., Inc. |
467,367 | $ | 50,952,350 | |||||
| Pfizer, Inc. |
1,041,406 | 29,982,079 | ||||||
| Viatris, Inc. |
221,263 | 2,396,278 | ||||||
| Zoetis, Inc. |
84,677 | 16,712,699 | ||||||
|
|
|
|||||||
| 276,115,847 | ||||||||
|
|
|
|||||||
| Professional Services—0.7% | ||||||||
| Automatic Data Processing, Inc. |
75,860 | 17,673,104 | ||||||
| Broadridge Financial Solutions, Inc. |
21,698 | 4,464,364 | ||||||
| Ceridian HCM Holding, Inc. (a) (b) |
28,768 | 1,930,908 | ||||||
| Equifax, Inc. (b) |
22,726 | 5,619,913 | ||||||
| Jacobs Solutions, Inc. |
23,223 | 3,014,345 | ||||||
| Leidos Holdings, Inc. |
25,361 | 2,745,075 | ||||||
| Paychex, Inc. |
59,295 | 7,062,627 | ||||||
| Paycom Software, Inc. |
9,046 | 1,869,989 | ||||||
| Robert Half, Inc. |
19,530 | 1,717,078 | ||||||
| Verisk Analytics, Inc. |
26,748 | 6,389,027 | ||||||
|
|
|
|||||||
| 52,486,430 | ||||||||
|
|
|
|||||||
| Real Estate Management & Development—0.2% | ||||||||
| CBRE Group, Inc. - Class A (a) |
56,215 | 5,233,054 | ||||||
| CoStar Group, Inc. (a) |
75,317 | 6,581,953 | ||||||
|
|
|
|||||||
| 11,815,007 | ||||||||
|
|
|
|||||||
| Residential REITs—0.3% | ||||||||
| AvalonBay Communities, Inc. (b) |
26,193 | 4,903,853 | ||||||
| Camden Property Trust |
19,692 | 1,955,219 | ||||||
| Equity Residential |
63,732 | 3,897,849 | ||||||
| Essex Property Trust, Inc. (b) |
11,838 | 2,935,114 | ||||||
| Invitation Homes, Inc. |
106,095 | 3,618,900 | ||||||
| Mid-America Apartment Communities, Inc. |
21,521 | 2,893,714 | ||||||
| UDR, Inc. |
55,813 | 2,137,080 | ||||||
|
|
|
|||||||
| 22,341,729 | ||||||||
|
|
|
|||||||
| Retail REITs—0.3% | ||||||||
| Federal Realty Investment Trust |
13,548 | 1,396,121 | ||||||
| Kimco Realty Corp. |
122,651 | 2,613,693 | ||||||
| Realty Income Corp. (b) |
133,518 | 7,666,604 | ||||||
| Regency Centers Corp. |
30,298 | 2,029,966 | ||||||
| Simon Property Group, Inc. |
60,170 | 8,582,649 | ||||||
|
|
|
|||||||
| 22,289,033 | ||||||||
|
|
|
|||||||
| Semiconductors & Semiconductor Equipment—8.1% | ||||||||
| Advanced Micro Devices, Inc. (a) |
297,989 | 43,926,558 | ||||||
| Analog Devices, Inc. |
91,907 | 18,249,054 | ||||||
| Applied Materials, Inc. |
154,287 | 25,005,294 | ||||||
| Broadcom, Inc. |
80,958 | 90,369,367 | ||||||
| Enphase Energy, Inc. (a) |
25,185 | 3,327,946 | ||||||
| First Solar, Inc. (a) (b) |
19,706 | 3,394,950 | ||||||
| Intel Corp. |
777,585 | 39,073,646 | ||||||
| KLA Corp. |
25,071 | 14,573,772 | ||||||
| Lam Research Corp. |
24,308 | 19,039,484 | ||||||
| Microchip Technology, Inc. |
99,788 | 8,998,882 | ||||||
| Micron Technology, Inc. |
202,517 | 17,282,801 | ||||||
| Monolithic Power Systems, Inc. |
8,837 | 5,574,203 | ||||||
| Semiconductors & Semiconductor Equipment—(Continued) | ||||||||
| NVIDIA Corp. |
455,559 | 225,601,928 | ||||||
| NXP Semiconductors NV |
47,541 | 10,919,217 | ||||||
| ON Semiconductor Corp. (a) (b) |
79,436 | 6,635,289 | ||||||
| Qorvo, Inc. (a) |
17,954 | 2,021,800 | ||||||
| QUALCOMM, Inc. |
205,278 | 29,689,357 | ||||||
| Skyworks Solutions, Inc. |
29,397 | 3,304,811 | ||||||
| Teradyne, Inc. (b) |
28,196 | 3,059,830 | ||||||
| Texas Instruments, Inc. |
167,506 | 28,553,073 | ||||||
|
|
|
|||||||
| 598,601,262 | ||||||||
|
|
|
|||||||
| Software—10.7% | ||||||||
| Adobe, Inc. (a) |
83,974 | 50,098,888 | ||||||
| ANSYS, Inc. (a) |
16,007 | 5,808,620 | ||||||
| Autodesk, Inc. (a) (b) |
39,426 | 9,599,443 | ||||||
| Cadence Design Systems, Inc. (a) |
50,178 | 13,666,982 | ||||||
| Fair Isaac Corp. (a) |
4,559 | 5,306,722 | ||||||
| Fortinet, Inc. (a) |
117,553 | 6,880,377 | ||||||
| Gen Digital, Inc. |
103,990 | 2,373,052 | ||||||
| Intuit, Inc. |
51,690 | 32,307,801 | ||||||
| Microsoft Corp. |
1,370,783 | 515,469,239 | ||||||
| Oracle Corp. |
293,040 | 30,895,207 | ||||||
| Palo Alto Networks, Inc. (a) |
57,326 | 16,904,291 | ||||||
| PTC, Inc. (a) |
21,917 | 3,834,598 | ||||||
| Roper Technologies, Inc. |
19,702 | 10,740,939 | ||||||
| Salesforce, Inc. (a) |
179,457 | 47,222,315 | ||||||
| ServiceNow, Inc. (a) |
37,810 | 26,712,387 | ||||||
| Synopsys, Inc. (a) |
28,050 | 14,443,226 | ||||||
| Tyler Technologies, Inc. (a) |
7,761 | 3,245,029 | ||||||
|
|
|
|||||||
| 795,509,116 | ||||||||
|
|
|
|||||||
| Specialized REITs—1.1% | ||||||||
| American Tower Corp. |
85,978 | 18,560,931 | ||||||
| Crown Castle, Inc. |
80,045 | 9,220,384 | ||||||
| Digital Realty Trust, Inc. (b) |
55,857 | 7,517,235 | ||||||
| Equinix, Inc. |
17,316 | 13,946,133 | ||||||
| Extra Space Storage, Inc. |
38,967 | 6,247,579 | ||||||
| Iron Mountain, Inc. (b) |
53,853 | 3,768,633 | ||||||
| Public Storage |
29,188 | 8,902,340 | ||||||
| SBA Communications Corp. (b) |
19,898 | 5,047,924 | ||||||
| VICI Properties, Inc. |
190,805 | 6,082,863 | ||||||
| Weyerhaeuser Co. |
134,639 | 4,681,398 | ||||||
|
|
|
|||||||
| 83,975,420 | ||||||||
|
|
|
|||||||
| Specialty Retail—2.0% | ||||||||
| AutoZone, Inc. (a) |
3,253 | 8,410,989 | ||||||
| Bath & Body Works, Inc. (b) |
41,937 | 1,810,001 | ||||||
| Best Buy Co., Inc. |
35,725 | 2,796,553 | ||||||
| CarMax, Inc. (a) (b) |
29,264 | 2,245,719 | ||||||
| Home Depot, Inc. |
184,449 | 63,920,801 | ||||||
| Lowe’s Cos., Inc. |
106,441 | 23,688,445 | ||||||
| O’Reilly Automotive, Inc. (a) |
10,912 | 10,367,273 | ||||||
| Ross Stores, Inc. |
62,456 | 8,643,286 | ||||||
| TJX Cos., Inc. |
211,010 | 19,794,848 | ||||||
| Tractor Supply Co. (b) |
19,940 | 4,287,698 | ||||||
| Ulta Beauty, Inc. (a) |
9,080 | 4,449,109 | ||||||
|
|
|
|||||||
| 150,414,722 | ||||||||
|
|
|
|||||||
See accompanying notes to financial statements.
BHFTII-9
Brighthouse Funds Trust II
MetLife Stock Index Portfolio
Schedule of Investments as of December 31, 2023
Common Stocks—(Continued)
| Security Description | Shares/ Principal Amount* |
Value | ||||||
| Technology Hardware, Storage & Peripherals—7.2% | ||||||||
| Apple, Inc. |
2,696,389 | $ | 519,135,774 | |||||
| Hewlett Packard Enterprise Co. |
236,607 | 4,017,587 | ||||||
| HP, Inc. |
160,400 | 4,826,436 | ||||||
| NetApp, Inc. |
38,508 | 3,394,865 | ||||||
| Seagate Technology Holdings PLC (b) |
35,880 | 3,063,076 | ||||||
| Western Digital Corp. (a) |
59,802 | 3,131,831 | ||||||
|
|
|
|||||||
| 537,569,569 | ||||||||
|
|
|
|||||||
| Textiles, Apparel & Luxury Goods—0.5% | ||||||||
| Lululemon Athletica, Inc. (a) |
21,239 | 10,859,288 | ||||||
| NIKE, Inc. - Class B |
225,753 | 24,510,003 | ||||||
| Ralph Lauren Corp. (b) |
7,331 | 1,057,130 | ||||||
| Tapestry, Inc. (b) |
42,270 | 1,555,959 | ||||||
| VF Corp. (b) |
60,965 | 1,146,142 | ||||||
|
|
|
|||||||
| 39,128,522 | ||||||||
|
|
|
|||||||
| Tobacco—0.5% | ||||||||
| Altria Group, Inc. |
326,203 | 13,159,029 | ||||||
| Philip Morris International, Inc. |
286,320 | 26,936,986 | ||||||
|
|
|
|||||||
| 40,096,015 | ||||||||
|
|
|
|||||||
| Trading Companies & Distributors—0.3% | ||||||||
| Fastenal Co. |
105,389 | 6,826,045 | ||||||
| United Rentals, Inc. (b) |
12,502 | 7,168,897 | ||||||
| WW Grainger, Inc. |
8,148 | 6,752,166 | ||||||
|
|
|
|||||||
| 20,747,108 | ||||||||
|
|
|
|||||||
| Water Utilities—0.1% | ||||||||
| American Water Works Co., Inc. |
35,910 | 4,739,761 | ||||||
|
|
|
|||||||
| Wireless Telecommunication Services—0.2% | ||||||||
| T-Mobile U.S., Inc. (b) |
93,850 | 15,046,971 | ||||||
|
|
|
|||||||
| Total Common Stocks |
7,384,760,782 | |||||||
|
|
|
|||||||
| Mutual Funds—0.6% | ||||||||
| Investment Company Securities—0.6% | ||||||||
| SPDR S&P 500 ETF Trust (b) |
97,100 | 46,152,601 | ||||||
|
|
|
|||||||
| Short-Term Investment—0.1% | ||||||||
| U.S. Treasury—0.1% | ||||||||
| U.S. Treasury Bill |
9,750,000 | 9,699,955 | ||||||
|
|
|
|||||||
| Total Short-Term Investments |
9,699,955 | |||||||
|
|
|
|||||||
| Securities Lending Reinvestments (f)—2.5% |
|
|||||||
| Security Description | Principal |
Value | ||||||
| Certificates of Deposit—0.6% | ||||||||
| Bank of America NA |
5,000,000 | 5,001,145 | ||||||
| Bank of Montreal |
2,000,000 | 2,001,628 | ||||||
| BNP Paribas SA |
2,000,000 | 2,000,616 | ||||||
| Credit Agricole Corporate & Investment Bank |
5,000,000 | 5,004,590 | ||||||
| Mitsubishi UFJ Trust & Banking Corp. |
5,000,000 | 4,944,100 | ||||||
| MUFG Bank Ltd. (London) |
1,000,000 | 975,750 | ||||||
| National Westminster Bank PLC |
1,000,000 | 981,890 | ||||||
| 5.880%, 05/02/24 |
3,000,000 | 3,004,860 | ||||||
| Royal Bank of Canada |
5,000,000 | 5,003,100 | ||||||
| Standard Chartered Bank |
7,000,000 | 7,002,899 | ||||||
| 5.790%, SOFR + 0.390%, 04/19/24 (g) |
4,000,000 | 4,000,000 | ||||||
| Westpac Banking Corp. |
5,000,000 | 5,006,195 | ||||||
|
|
|
|||||||
| 44,926,773 | ||||||||
|
|
|
|||||||
| Commercial Paper—0.1% | ||||||||
| Australia & New Zealand Banking Group Ltd. |
1,000,000 | 983,338 | ||||||
| 5.730%, SOFR + 0.330%, 04/18/24 (g) |
1,000,000 | 1,000,224 | ||||||
| ING U.S. Funding LLC |
7,000,000 | 7,003,808 | ||||||
| Old Line Funding LLC |
2,000,000 | 1,987,044 | ||||||
|
|
|
|||||||
| 10,974,414 | ||||||||
|
|
|
|||||||
| Repurchase Agreements—1.2% | ||||||||
| Bank of Nova Scotia |
13,000,000 | 13,000,000 | ||||||
| Barclays Bank PLC |
1,900,000 | 1,900,000 | ||||||
| Repurchase Agreement dated 12/29/23 at 5.670%, due on 04/02/24 with a maturity value of $10,149,625; collateralized by various Common Stock with an aggregate market value of $11,143,970 |
10,000,000 | 10,000,000 | ||||||
See accompanying notes to financial statements.
BHFTII-10
Brighthouse Funds Trust II
MetLife Stock Index Portfolio
Schedule of Investments as of December 31, 2023
Securities Lending Reinvestments (f)—(Continued)
| Security Description | Principal Amount* |
Value | ||||||
| Repurchase Agreements—(Continued) | ||||||||
| Cantor Fitzgerald & Co. |
10,000,000 | $ | 10,000,000 | |||||
| Citigroup Global Markets, Inc. |
20,000,000 | 20,000,000 | ||||||
| Deutsche Bank Securities, Inc. |
161,612 | 161,612 | ||||||
| National Bank Financial, Inc. |
2,000,000 | 2,000,000 | ||||||
| NBC Global Finance Ltd. |
15,000,000 | 15,000,000 | ||||||
| Societe Generale |
10,000,000 | 10,000,000 | ||||||
| Repurchase Agreement dated 12/29/23 at 5.330%, due on 01/02/24 with a maturity value of $900,533; collateralized by U.S. Treasury Obligations with rates ranging from 0.625% - 5.240%, maturity dates ranging from 04/30/24 - 05/15/32, and an aggregate market value of $918,000 |
900,000 | 900,000 | ||||||
| TD Prime Services LLC |
5,000,000 | 5,000,000 | ||||||
|
|
|
|||||||
| 87,961,612 | ||||||||
|
|
|
|||||||
| Time Deposit—0.1% | ||||||||
| First Abu Dhabi Bank USA NV |
5,000,000 | 5,000,000 | ||||||
|
|
|
|||||||
| Mutual Funds—0.5% | ||||||||
| BlackRock Liquidity Funds FedFund, Institutional Shares |
12,065,837 | 12,065,837 | ||||||
| Dreyfus Treasury Obligations Cash Management Fund, Institutional Class 5.250% (h) |
5,000,000 | 5,000,000 | ||||||
| Fidelity Investments Money Market Government Portfolio, Class I |
5,000,000 | 5,000,000 | ||||||
| Goldman Sachs Financial Square Government Fund, Institutional Shares 5.230% (h) |
10,000,000 | 10,000,000 | ||||||
| HSBC U.S. Government Money Market Fund, Class I |
5,000,000 | 5,000,000 | ||||||
|
|
|
|||||||
| 37,065,837 | ||||||||
|
|
|
|||||||
| Total Securities Lending Reinvestments |
185,928,636 | |||||||
|
|
|
|||||||
| Total Investments—102.5% |
7,626,541,974 | |||||||
| Other assets and liabilities (net)—(2.5)% |
(187,388,537 | ) | ||||||
|
|
|
|||||||
| Net Assets—100.0% | $ | 7,439,153,437 | ||||||
|
|
|
|||||||
| * | Principal amount stated in U.S. dollars unless otherwise noted. | |
| (a) | Non-income producing security. | |
| (b) | All or a portion of the security was held on loan. As of December 31, 2023, the market value of securities loaned was $257,820,117 and the collateral received consisted of cash in the amount of $185,769,785 and non-cash collateral with a value of $78,541,697. The cash collateral investments are disclosed in the Schedule of Investments and categorized as Securities Lending Reinvestments. The non-cash collateral received consists of U.S. government securities that are held in safe-keeping by the lending agent, or a third-party custodian, and cannot be sold or repledged by the Portfolio. As such, this collateral is excluded from the Statement of Assets and Liabilities. | |
| (c) | Affiliated Issuer. (See Note 7 of the Notes to Financial Statements for a summary of transactions in securities of affiliated issuers.) | |
| (d) | All or a portion of the security was pledged as collateral against open futures contracts. As of December 31, 2023, the market value of securities pledged was $16,911,600. | |
| (e) | The rate shown represents current yield to maturity. | |
| (f) | Represents investment of cash collateral received from securities on loan as of December 31, 2023. | |
| (g) | Variable or floating rate security. The stated rate represents the rate at December 31, 2023. Maturity date shown for callable securities reflects the earliest possible call date. For securities based on a published reference index and spread, the index and spread are indicated in the description above. For certain variable rate securities, the coupon rate is determined by the issuer/agent based on current market conditions. For certain asset- and mortgage-backed securities, the coupon rate may fluctuate based on changes of the underlying collateral or prepayments of principal. These securities do not indicate a reference index and spread in their description above. | |
| (h) | The rate shown represents the annualized seven-day yield as of December 31, 2023. |
See accompanying notes to financial statements.
BHFTII-11
Brighthouse Funds Trust II
MetLife Stock Index Portfolio
Schedule of Investments as of December 31, 2023
| Futures Contracts | ||||||||||||||||||||
| Futures Contracts—Long |
Expiration Date |
Number of Contracts |
Notional Amount |
Value/ Unrealized Appreciation/ (Depreciation) |
||||||||||||||||
| S&P 500 Index E-Mini Futures |
03/15/24 | 60 | USD | 14,460,000 | $ | 639,951 | ||||||||||||||
|
|
|
|||||||||||||||||||
Glossary Of Abbreviations
Currencies
| (USD)— | United States Dollar | |||
Index Abbreviations
| (FEDEFF PRV)— | Effective Federal Funds Rate | |||
| (SOFR)— | Secured Overnight Financing Rate | |||
Other Abbreviations
| (ETF)— | Exchange-Traded Fund | |||
| (REIT)— | Real Estate Investment Trust | |||
See accompanying notes to financial statements.
BHFTII-12
Brighthouse Funds Trust II
MetLife Stock Index Portfolio
Schedule of Investments as of December 31, 2023
Fair Value Hierarchy
Accounting principles generally accepted in the United States of America (“GAAP”) define fair market value as the price that the Portfolio would receive to sell an asset or pay to transfer a liability in an orderly transaction between market participants at the measurement date. It establishes a fair value hierarchy that prioritizes inputs to valuation methods and requires disclosure of the fair value hierarchy, separately for each major category of assets and liabilities, that segregates fair value measurements into three levels. Levels 1, 2 and 3 of the fair value hierarchy are defined as follows:
Level 1 - unadjusted quoted prices in active markets for identical investments
Level 2 - other significant observable inputs (including, but not limited to, quoted prices for similar assets or liabilities in markets that are either active or inactive; inputs other than quoted prices that are observable such as interest rates, yield curves, volatilities, prepayment speeds, loss severities, credit risks, default rates, or other market corroborated inputs)
Level 3 - significant unobservable inputs based on the best information available in the circumstances, to the extent observable inputs are unavailable (including the Portfolio’s own assumptions used in determining the fair value of investments and derivative financial instruments)
The inputs or methodologies used for valuing investments are not necessarily an indication of the risk associated with investing in them. Changes to the inputs or methodologies used may result in transfers between levels. A reconciliation of Level 3 securities, if any, will be disclosed following the fair value hierarchy table. For more information about the Portfolio’s policy regarding the valuation of investments, please refer to the Notes to Financial Statements.
The following table summarizes the fair value hierarchy of the Portfolio’s investments as of December 31, 2023:
| Description | Level 1 | Level 2 | Level 3 | Total | ||||||||||||
| Total Common Stocks* |
$ | 7,384,760,782 | $ | — | $ | — | $ | 7,384,760,782 | ||||||||
| Total Mutual Funds* |
46,152,601 | — | — | 46,152,601 | ||||||||||||
| Total Short-Term Investment* |
— | 9,699,955 | — | 9,699,955 | ||||||||||||
| Securities Lending Reinvestments | ||||||||||||||||
| Certificates of Deposit |
— | 44,926,773 | — | 44,926,773 | ||||||||||||
| Commercial Paper |
— | 10,974,414 | — | 10,974,414 | ||||||||||||
| Repurchase Agreements |
— | 87,961,612 | — | 87,961,612 | ||||||||||||
| Time Deposit |
— | 5,000,000 | — | 5,000,000 | ||||||||||||
| Mutual Funds |
37,065,837 | — | — | 37,065,837 | ||||||||||||
| Total Securities Lending Reinvestments |
37,065,837 | 148,862,799 | — | 185,928,636 | ||||||||||||
| Total Investments |
$ | 7,467,979,220 | $ | 158,562,754 | $ | — | $ | 7,626,541,974 | ||||||||
| Collateral for Securities Loaned (Liability) |
$ | — | $ | (185,769,785 | ) | $ | — | $ | (185,769,785 | ) | ||||||
| Futures Contracts | ||||||||||||||||
| Futures Contracts (Unrealized Appreciation) |
$ | 639,951 | $ | — | $ | — | $ | 639,951 | ||||||||
| * | See Schedule of Investments for additional detailed categorizations. |
See accompanying notes to financial statements.
BHFTII-13
Brighthouse Funds Trust II
MetLife Stock Index Portfolio
Statement of Assets and Liabilities
December 31, 2023
| Assets |
||||
| Investments at value (a) (b) |
$ | 7,618,958,516 | ||
| Affiliated investments at value (c) |
7,583,458 | |||
| Cash |
3,371,302 | |||
| Receivable for: |
||||
| Investments sold |
2,858,737 | |||
| Fund shares sold |
171,151 | |||
| Dividends |
7,025,506 | |||
| Prepaid expenses |
26,110 | |||
|
|
|
|||
| Total Assets |
7,639,994,780 | |||
| Liabilities |
||||
| Collateral for securities loaned |
185,769,785 | |||
| Payables for: |
||||
| Investments purchased |
177,359 | |||
| Fund shares redeemed |
12,172,079 | |||
| Variation margin on futures contracts |
36,748 | |||
| Accrued Expenses: |
||||
| Management fees |
1,480,233 | |||
| Distribution and service fees |
441,696 | |||
| Deferred trustees’ fees |
185,577 | |||
| Other expenses |
577,866 | |||
|
|
|
|||
| Total Liabilities |
200,841,343 | |||
|
|
|
|||
| Net Assets |
$ | 7,439,153,437 | ||
|
|
|
|||
| Net Assets Consist of: |
||||
| Paid in surplus |
$ | 2,148,181,265 | ||
| Distributable earnings (Accumulated losses) |
5,290,972,172 | |||
|
|
|
|||
| Net Assets |
$ | 7,439,153,437 | ||
|
|
|
|||
| Net Assets |
||||
| Class A |
$ | 5,256,674,728 | ||
| Class B |
1,998,614,688 | |||
| Class D |
44,566,490 | |||
| Class E |
127,229,297 | |||
| Class G |
12,068,234 | |||
| Capital Shares Outstanding* |
||||
| Class A |
86,661,036 | |||
| Class B |
35,168,580 | |||
| Class D |
737,550 | |||
| Class E |
2,121,366 | |||
| Class G |
212,618 | |||
| Net Asset Value, Offering Price and Redemption Price Per Share |
||||
| Class A |
$ | 60.66 | ||
| Class B |
56.83 | |||
| Class D |
60.43 | |||
| Class E |
59.98 | |||
| Class G |
56.76 |
| * | The Portfolio is authorized to issue an unlimited number of shares. | |||
| (a) | Identified cost of investments, excluding affiliated investments, was $2,812,396,145. | |||
| (b) | Includes securities loaned at value of $257,820,117. | |||
| (c) | Identified cost of affiliated investments was $4,301,536. | |||
Statement of Operations
Year Ended December 31, 2023
| Investment Income |
||||
| Dividends (a) |
$ | 116,246,223 | ||
| Dividends from affiliated investments |
258,804 | |||
| Interest |
628,198 | |||
| Securities lending income |
1,203,911 | |||
|
|
|
|||
| Total investment income |
118,337,136 | |||
| Expenses |
||||
| Management fees |
17,536,563 | |||
| Administration fees |
274,372 | |||
| Custodian and accounting fees |
339,110 | |||
| Distribution and service fees—Class B |
4,767,329 | |||
| Distribution and service fees—Class D |
42,136 | |||
| Distribution and service fees—Class E |
184,151 | |||
| Distribution and service fees—Class G |
34,949 | |||
| Audit and tax services |
49,026 | |||
| Legal |
46,603 | |||
| Trustees’ fees and expenses |
46,220 | |||
| Shareholder reporting |
206,705 | |||
| Insurance |
64,424 | |||
| Miscellaneous |
811,361 | |||
|
|
|
|||
| Total expenses |
24,402,949 | |||
| Less management fee waiver |
(877,194 | ) | ||
|
|
|
|||
| Net expenses |
23,525,755 | |||
|
|
|
|||
| Net Investment Income |
94,811,381 | |||
|
|
|
|||
| Net Realized and Unrealized Gain (Loss) |
||||
| Net realized gain (loss) on: | ||||
| Investments |
488,368,206 | |||
| Affiliated investments |
389,424 | |||
| Futures contracts |
1,554,581 | |||
|
|
|
|||
| Net realized gain (loss) |
490,312,211 | |||
|
|
|
|||
| Net change in unrealized appreciation (depreciation) on: | ||||
| Investments |
1,027,790,616 | |||
| Affiliated investments |
(1,293,946 | ) | ||
| Futures contracts |
1,176,201 | |||
|
|
|
|||
| Net change in unrealized appreciation (depreciation) |
1,027,672,871 | |||
|
|
|
|||
| Net realized and unrealized gain (loss) |
1,517,985,082 | |||
|
|
|
|||
| Net Increase (Decrease) in Net Assets From Operations |
$ | 1,612,796,463 | ||
|
|
|
| (a) | Net of foreign withholding taxes of $30,239. | |||
See accompanying notes to financial statements.
BHFTII-14
Brighthouse Funds Trust II
MetLife Stock Index Portfolio
Statements of Changes in Net Assets
| Year Ended December 31, 2023 |
Year Ended December 31, 2022 |
|||||||
| Increase (Decrease) in Net Assets: |
||||||||
| From Operations |
||||||||
| Net investment income (loss) |
$ | 94,811,381 | $ | 96,702,297 | ||||
| Net realized gain (loss) |
490,312,211 | 470,932,624 | ||||||
| Net change in unrealized appreciation (depreciation) |
1,027,672,871 | (2,140,430,274 | ) | |||||
|
|
|
|
|
|||||
| Increase (decrease) in net assets from operations |
1,612,796,463 | (1,572,795,353 | ) | |||||
|
|
|
|
|
|||||
| From Distributions to Shareholders |
||||||||
| Class A |
(394,921,310 | ) | (523,222,271 | ) | ||||
| Class B |
(157,894,581 | ) | (209,856,290 | ) | ||||
| Class D |
(3,308,461 | ) | (4,616,007 | ) | ||||
| Class E |
(9,782,094 | ) | (13,361,393 | ) | ||||
| Class G |
(947,670 | ) | (1,417,670 | ) | ||||
|
|
|
|
|
|||||
| Total distributions |
(566,854,116 | ) | (752,473,631 | ) | ||||
|
|
|
|
|
|||||
| Increase (decrease) in net assets from capital share transactions |
(176,414,570 | ) | 98,868,314 | |||||
|
|
|
|
|
|||||
| Total increase (decrease) in net assets |
869,527,777 | (2,226,400,670 | ) | |||||
| Net Assets |
||||||||
| Beginning of period |
6,569,625,660 | 8,796,026,330 | ||||||
|
|
|
|
|
|||||
| End of period |
$ | 7,439,153,437 | $ | 6,569,625,660 | ||||
|
|
|
|
|
|||||
Other Information:
Capital Shares
Transactions in capital shares were as follows:
| Year Ended December 31, 2023 |
Year Ended December 31, 2022 |
|||||||||||||||
| Shares | Value | Shares | Value | |||||||||||||
| Class A |
||||||||||||||||
| Sales |
3,146,086 | $ | 173,762,587 | 2,899,300 | $ | 162,358,051 | ||||||||||
| Reinvestments |
7,151,780 | 394,921,310 | 10,227,175 | 523,222,271 | ||||||||||||
| Redemptions |
(11,660,749 | ) | (651,362,161 | ) | (10,635,824 | ) | (616,395,193 | ) | ||||||||
|
|
|
|
|
|
|
|
|
|||||||||
| Net increase (decrease) |
(1,362,883 | ) | $ | (82,678,264 | ) | 2,490,651 | $ | 69,185,129 | ||||||||
|
|
|
|
|
|
|
|
|
|||||||||
| Class B |
||||||||||||||||
| Sales |
1,168,610 | $ | 61,632,120 | 1,991,762 | $ | 109,929,514 | ||||||||||
| Reinvestments |
3,048,158 | 157,894,581 | 4,350,255 | 209,856,290 | ||||||||||||
| Redemptions |
(5,711,591 | ) | (301,469,356 | ) | (5,159,347 | ) | (287,833,483 | ) | ||||||||
|
|
|
|
|
|
|
|
|
|||||||||
| Net increase (decrease) |
(1,494,823 | ) | $ | (81,942,655 | ) | 1,182,670 | $ | 31,952,321 | ||||||||
|
|
|
|
|
|
|
|
|
|||||||||
| Class D |
||||||||||||||||
| Sales |
9,745 | $ | 546,381 | 2,641 | $ | 153,238 | ||||||||||
| Reinvestments |
60,121 | 3,308,461 | 90,510 | 4,616,007 | ||||||||||||
| Redemptions |
(91,609 | ) | (5,150,935 | ) | (112,530 | ) | (6,391,127 | ) | ||||||||
|
|
|
|
|
|
|
|
|
|||||||||
| Net increase (decrease) |
(21,743 | ) | $ | (1,296,093 | ) | (19,379 | ) | $ | (1,621,882 | ) | ||||||
|
|
|
|
|
|
|
|
|
|||||||||
| Class E |
||||||||||||||||
| Sales |
34,261 | $ | 1,935,213 | 48,836 | $ | 2,860,744 | ||||||||||
| Reinvestments |
179,028 | 9,782,094 | 263,746 | 13,361,393 | ||||||||||||
| Redemptions |
(376,829 | ) | (20,900,970 | ) | (270,123 | ) | (15,805,606 | ) | ||||||||
|
|
|
|
|
|
|
|
|
|||||||||
| Net increase (decrease) |
(163,540 | ) | $ | (9,183,663 | ) | 42,459 | $ | 416,531 | ||||||||
|
|
|
|
|
|
|
|
|
|||||||||
| Class G |
||||||||||||||||
| Sales |
4,622 | $ | 245,670 | 5,776 | $ | 322,416 | ||||||||||
| Reinvestments |
18,312 | 947,670 | 29,424 | 1,417,670 | ||||||||||||
| Redemptions |
(47,849 | ) | (2,507,235 | ) | (50,935 | ) | (2,803,871 | ) | ||||||||
|
|
|
|
|
|
|
|
|
|||||||||
| Net increase (decrease) |
(24,915 | ) | $ | (1,313,895 | ) | (15,735 | ) | $ | (1,063,785 | ) | ||||||
|
|
|
|
|
|
|
|
|
|||||||||
| Increase (decrease) derived from capital shares transactions |
$ | (176,414,570 | ) | $ | 98,868,314 | |||||||||||
|
|
|
|
|
|||||||||||||
See accompanying notes to financial statements.
BHFTII-15
Brighthouse Funds Trust II
MetLife Stock Index Portfolio
Financial Highlights
| Selected per share data | ||||||||||||||||||||
| Class A | ||||||||||||||||||||
| Year Ended December 31, | ||||||||||||||||||||
| 2023 | 2022 | 2021 | 2020 | 2019 | ||||||||||||||||
| Net Asset Value, Beginning of Period |
$ | 52.23 | $ | 71.87 | $ | 60.62 | $ | 56.03 | $ | 47.25 | ||||||||||
|
|
|
|
|
|
|
|
|
|
|
|||||||||||
| Income (Loss) from Investment Operations |
||||||||||||||||||||
| Net investment income (loss) (a) |
0.80 | 0.82 | 0.77 | 0.87 | 1.02 | |||||||||||||||
| Net realized and unrealized gain (loss) |
12.29 | (14.10 | ) | 15.72 | 8.22 | 13.01 | ||||||||||||||
|
|
|
|
|
|
|
|
|
|
|
|||||||||||
| Total income (loss) from investment operations |
13.09 | (13.28 | ) | 16.49 | 9.09 | 14.03 | ||||||||||||||
|
|
|
|
|
|
|
|
|
|
|
|||||||||||
| Less Distributions |
||||||||||||||||||||
| Distributions from net investment income |
(0.81 | ) | (0.80 | ) | (1.04 | ) | (1.04 | ) | (1.17 | ) | ||||||||||
| Distributions from net realized capital gains |
(3.85 | ) | (5.56 | ) | (4.20 | ) | (3.46 | ) | (4.08 | ) | ||||||||||
|
|
|
|
|
|
|
|
|
|
|
|||||||||||
| Total distributions |
(4.66 | ) | (6.36 | ) | (5.24 | ) | (4.50 | ) | (5.25 | ) | ||||||||||
|
|
|
|
|
|
|
|
|
|
|
|||||||||||
| Net Asset Value, End of Period |
$ | 60.66 | $ | 52.23 | $ | 71.87 | $ | 60.62 | $ | 56.03 | ||||||||||
|
|
|
|
|
|
|
|
|
|
|
|||||||||||
| Total Return (%) (b) |
25.94 | (18.30 | ) | 28.36 | 18.10 | 31.15 | ||||||||||||||
| Ratios/Supplemental Data |
||||||||||||||||||||
| Gross ratio of expenses to average net assets (%) |
0.28 | 0.28 | 0.28 | 0.28 | 0.28 | |||||||||||||||
| Net ratio of expenses to average net assets (%) (c) |
0.26 | 0.26 | 0.26 | 0.27 | 0.27 | |||||||||||||||
| Ratio of net investment income (loss) to average net assets (%) |
1.42 | 1.40 | 1.17 | 1.63 | 1.95 | |||||||||||||||
| Portfolio turnover rate (%) |
11 | 10 | 12 | 13 | 12 | |||||||||||||||
| Net assets, end of period (in millions) |
$ | 5,256.7 | $ | 4,597.2 | $ | 6,147.5 | $ | 5,319.9 | $ | 4,933.6 | ||||||||||
| Class B | ||||||||||||||||||||
| Year Ended December 31, | ||||||||||||||||||||
| 2023 | 2022 | 2021 | 2020 | 2019 | ||||||||||||||||
| Net Asset Value, Beginning of Period |
$ | 49.18 | $ | 68.09 | $ | 57.69 | $ | 53.53 | $ | 45.34 | ||||||||||
|
|
|
|
|
|
|
|
|
|
|
|||||||||||
| Income (Loss) from Investment Operations |
||||||||||||||||||||
| Net investment income (loss) (a) |
0.62 | 0.63 | 0.58 | 0.71 | 0.85 | |||||||||||||||
| Net realized and unrealized gain (loss) |
11.55 | (13.35 | ) | 14.92 | 7.82 | 12.45 | ||||||||||||||
|
|
|
|
|
|
|
|
|
|
|
|||||||||||
| Total income (loss) from investment operations |
12.17 | (12.72 | ) | 15.50 | 8.53 | 13.30 | ||||||||||||||
|
|
|
|
|
|
|
|
|
|
|
|||||||||||
| Less Distributions |
||||||||||||||||||||
| Distributions from net investment income |
(0.67 | ) | (0.63 | ) | (0.90 | ) | (0.91 | ) | (1.03 | ) | ||||||||||
| Distributions from net realized capital gains |
(3.85 | ) | (5.56 | ) | (4.20 | ) | (3.46 | ) | (4.08 | ) | ||||||||||
|
|
|
|
|
|
|
|
|
|
|
|||||||||||
| Total distributions |
(4.52 | ) | (6.19 | ) | (5.10 | ) | (4.37 | ) | (5.11 | ) | ||||||||||
|
|
|
|
|
|
|
|
|
|
|
|||||||||||
| Net Asset Value, End of Period |
$ | 56.83 | $ | 49.18 | $ | 68.09 | $ | 57.69 | $ | 53.53 | ||||||||||
|
|
|
|
|
|
|
|
|
|
|
|||||||||||
| Total Return (%) (b) |
25.63 | (18.51 | ) | 28.04 | 17.83 | 30.80 | ||||||||||||||
| Ratios/Supplemental Data |
||||||||||||||||||||
| Gross ratio of expenses to average net assets (%) |
0.53 | 0.53 | 0.53 | 0.53 | 0.53 | |||||||||||||||
| Net ratio of expenses to average net assets (%) (c) |
0.51 | 0.51 | 0.51 | 0.52 | 0.52 | |||||||||||||||
| Ratio of net investment income (loss) to average net assets (%) |
1.17 | 1.15 | 0.92 | 1.38 | 1.70 | |||||||||||||||
| Portfolio turnover rate (%) |
11 | 10 | 12 | 13 | 12 | |||||||||||||||
| Net assets, end of period (in millions) |
$ | 1,998.6 | $ | 1,803.1 | $ | 2,415.9 | $ | 2,158.0 | $ | 2,043.2 | ||||||||||
Please see page 18 for Financial Highlights footnote legend.
See accompanying notes to financial statements.
BHFTII-16
Brighthouse Funds Trust II
MetLife Stock Index Portfolio
Financial Highlights
| Selected per share data | ||||||||||||||||||||
| Class D | ||||||||||||||||||||
| Year Ended December 31, | ||||||||||||||||||||
| 2023 | 2022 | 2021 | 2020 | 2019 | ||||||||||||||||
| Net Asset Value, Beginning of Period |
$ | 52.04 | $ | 71.62 | $ | 60.43 | $ | 55.86 | $ | 47.11 | ||||||||||
|
|
|
|
|
|
|
|
|
|
|
|||||||||||
| Income (Loss) from Investment Operations |
||||||||||||||||||||
| Net investment income (loss) (a) |
0.74 | 0.75 | 0.70 | 0.82 | 0.96 | |||||||||||||||
| Net realized and unrealized gain (loss) |
12.25 | (14.04 | ) | 15.66 | 8.19 | 12.98 | ||||||||||||||
|
|
|
|
|
|
|
|
|
|
|
|||||||||||
| Total income (loss) from investment operations |
12.99 | (13.29 | ) | 16.36 | 9.01 | 13.94 | ||||||||||||||
|
|
|
|
|
|
|
|
|
|
|
|||||||||||
| Less Distributions |
||||||||||||||||||||
| Distributions from net investment income |
(0.75 | ) | (0.73 | ) | (0.97 | ) | (0.98 | ) | (1.11 | ) | ||||||||||
| Distributions from net realized capital gains |
(3.85 | ) | (5.56 | ) | (4.20 | ) | (3.46 | ) | (4.08 | ) | ||||||||||
|
|
|
|
|
|
|
|
|
|
|
|||||||||||
| Total distributions |
(4.60 | ) | (6.29 | ) | (5.17 | ) | (4.44 | ) | (5.19 | ) | ||||||||||
|
|
|
|
|
|
|
|
|
|
|
|||||||||||
| Net Asset Value, End of Period |
$ | 60.43 | $ | 52.04 | $ | 71.62 | $ | 60.43 | $ | 55.86 | ||||||||||
|
|
|
|
|
|
|
|
|
|
|
|||||||||||
| Total Return (%) (b) |
25.80 | (18.38 | ) | 28.23 | 17.99 | 31.03 | ||||||||||||||
| Ratios/Supplemental Data |
||||||||||||||||||||
| Gross ratio of expenses to average net assets (%) |
0.38 | 0.38 | 0.38 | 0.38 | 0.38 | |||||||||||||||
| Net ratio of expenses to average net assets (%) (c) |
0.36 | 0.36 | 0.36 | 0.37 | 0.37 | |||||||||||||||
| Ratio of net investment income (loss) to average net assets (%) |
1.32 | 1.29 | 1.07 | 1.54 | 1.85 | |||||||||||||||
| Portfolio turnover rate (%) |
11 | 10 | 12 | 13 | 12 | |||||||||||||||
| Net assets, end of period (in millions) |
$ | 44.6 | $ | 39.5 | $ | 55.8 | $ | 48.1 | $ | 48.3 | ||||||||||
| Class E | ||||||||||||||||||||
| Year Ended December 31, | ||||||||||||||||||||
| 2023 | 2022 | 2021 | 2020 | 2019 | ||||||||||||||||
| Net Asset Value, Beginning of Period |
$ | 51.68 | $ | 71.17 | $ | 60.08 | $ | 55.56 | $ | 46.88 | ||||||||||
|
|
|
|
|
|
|
|
|
|
|
|||||||||||
| Income (Loss) from Investment Operations |
||||||||||||||||||||
| Net investment income (loss) (a) |
0.71 | 0.72 | 0.67 | 0.79 | 0.93 | |||||||||||||||
| Net realized and unrealized gain (loss) |
12.16 | (13.96 | ) | 15.57 | 8.14 | 12.91 | ||||||||||||||
|
|
|
|
|
|
|
|
|
|
|
|||||||||||
| Total income (loss) from investment operations |
12.87 | (13.24 | ) | 16.24 | 8.93 | 13.84 | ||||||||||||||
|
|
|
|
|
|
|
|
|
|
|
|||||||||||
| Less Distributions |
||||||||||||||||||||
| Distributions from net investment income |
(0.72 | ) | (0.69 | ) | (0.95 | ) | (0.95 | ) | (1.08 | ) | ||||||||||
| Distributions from net realized capital gains |
(3.85 | ) | (5.56 | ) | (4.20 | ) | (3.46 | ) | (4.08 | ) | ||||||||||
|
|
|
|
|
|
|
|
|
|
|
|||||||||||
| Total distributions |
(4.57 | ) | (6.25 | ) | (5.15 | ) | (4.41 | ) | (5.16 | ) | ||||||||||
|
|
|
|
|
|
|
|
|
|
|
|||||||||||
| Net Asset Value, End of Period |
$ | 59.98 | $ | 51.68 | $ | 71.17 | $ | 60.08 | $ | 55.56 | ||||||||||
|
|
|
|
|
|
|
|
|
|
|
|||||||||||
| Total Return (%) (b) |
25.74 | (18.43 | ) | 28.17 | 17.93 | 30.93 | ||||||||||||||
| Ratios/Supplemental Data |
||||||||||||||||||||
| Gross ratio of expenses to average net assets (%) |
0.43 | 0.43 | 0.43 | 0.43 | 0.43 | |||||||||||||||
| Net ratio of expenses to average net assets (%) (c) |
0.41 | 0.41 | 0.41 | 0.42 | 0.42 | |||||||||||||||
| Ratio of net investment income (loss) to average net assets (%) |
1.27 | 1.25 | 1.02 | 1.48 | 1.80 | |||||||||||||||
| Portfolio turnover rate (%) |
11 | 10 | 12 | 13 | 12 | |||||||||||||||
| Net assets, end of period (in millions) |
$ | 127.2 | $ | 118.1 | $ | 159.6 | $ | 143.3 | $ | 140.2 | ||||||||||
Please see page 18 for Financial Highlights footnote legend.
See accompanying notes to financial statements.
BHFTII-17
Brighthouse Funds Trust II
MetLife Stock Index Portfolio
Financial Highlights
| Selected per share data | ||||||||||||||||||||
| Class G | ||||||||||||||||||||
| Year Ended December 31, | ||||||||||||||||||||
| 2023 | 2022 | 2021 | 2020 | 2019 | ||||||||||||||||
| Net Asset Value, Beginning of Period |
$ | 49.11 | $ | 67.87 | $ | 57.51 | $ | 53.39 | $ | 45.24 | ||||||||||
|
|
|
|
|
|
|
|
|
|
|
|||||||||||
| Income (Loss) from Investment Operations |
||||||||||||||||||||
| Net investment income (loss) (a) |
0.59 | 0.60 | 0.54 | 0.68 | 0.82 | |||||||||||||||
| Net realized and unrealized gain (loss) |
11.53 | (13.31 | ) | 14.89 | 7.78 | 12.44 | ||||||||||||||
|
|
|
|
|
|
|
|
|
|
|
|||||||||||
| Total income (loss) from investment operations |
12.12 | (12.71 | ) | 15.43 | 8.46 | 13.26 | ||||||||||||||
|
|
|
|
|
|
|
|
|
|
|
|||||||||||
| Less Distributions |
||||||||||||||||||||
| Distributions from net investment income |
(0.62 | ) | (0.49 | ) | (0.87 | ) | (0.88 | ) | (1.03 | ) | ||||||||||
| Distributions from net realized capital gains |
(3.85 | ) | (5.56 | ) | (4.20 | ) | (3.46 | ) | (4.08 | ) | ||||||||||
|
|
|
|
|
|
|
|
|
|
|
|||||||||||
| Total distributions |
(4.47 | ) | (6.05 | ) | (5.07 | ) | (4.34 | ) | (5.11 | ) | ||||||||||
|
|
|
|
|
|
|
|
|
|
|
|||||||||||
| Net Asset Value, End of Period |
$ | 56.76 | $ | 49.11 | $ | 67.87 | $ | 57.51 | $ | 53.39 | ||||||||||
|
|
|
|
|
|
|
|
|
|
|
|||||||||||
| Total Return (%) (b) |
25.56 | (18.55 | ) | 27.99 | 17.74 | 30.77 | ||||||||||||||
| Ratios/Supplemental Data |
||||||||||||||||||||
| Gross ratio of expenses to average net assets (%) |
0.58 | 0.58 | 0.58 | 0.58 | 0.58 | |||||||||||||||
| Net ratio of expenses to average net assets (%) (c) |
0.56 | 0.56 | 0.56 | 0.57 | 0.57 | |||||||||||||||
| Ratio of net investment income (loss) to average net assets (%) |
1.12 | 1.09 | 0.87 | 1.33 | 1.65 | |||||||||||||||
| Portfolio turnover rate (%) |
11 | 10 | 12 | 13 | 12 | |||||||||||||||
| Net assets, end of period (in millions) |
$ | 12.1 | $ | 11.7 | $ | 17.2 | $ | 23.2 | $ | 21.8 | ||||||||||
| (a) | Per share amounts based on average shares outstanding during the period. | |||
| (b) | Total return does not reflect any insurance, sales, separate account or administrative charges of variable annuity or life insurance contracts or any additional expenses that contract owners may bear under their variable contracts. If these charges were included, the returns would be lower. | |||
| (c) | Includes the effects of management fee waivers (see Note 6 of the Notes to Financial Statements). | |||
See accompanying notes to financial statements.
BHFTII-18
Brighthouse Funds Trust II
MetLife Stock Index Portfolio
Notes to Financial Statements—December 31, 2023
1. Organization
Brighthouse Funds Trust II (the “Trust”) is organized as a Delaware statutory trust and registered under the Investment Company Act of 1940, as amended (the “1940 Act”), as an open-end management investment company. The Trust, which is managed by Brighthouse Investment Advisers, LLC (“Brighthouse Investment Advisers” or the “Adviser”), currently offers twenty-nine series (the “Portfolios”), each of which operates as a distinct investment vehicle of the Trust. The series included in this report is MetLife Stock Index Portfolio (the “Portfolio”), which is diversified. Shares of the Portfolio are not offered directly to the general public and are currently available only to separate accounts of insurance companies, including insurance companies affiliated with the Adviser.
The Portfolio has registered and offers five classes of shares: Class A, B, D, E and G shares. Shares of each class of the Portfolio represent an equal pro rata interest in the Portfolio and generally give the shareholder the same voting, dividend, liquidation, and other rights. Investment income, realized and unrealized capital gains and losses, the common expenses of the Portfolio, and certain Portfolio-level expense reductions, if any, are allocated on a pro rata basis to each class based on the relative net assets of each class to the net assets of the Portfolio. Each class of shares differs in its respective distribution plan and such distribution expenses are allocated to the corresponding class of shares.
2. Significant Accounting Policies
The preparation of financial statements in conformity with accounting principles generally accepted in the United States of America (“GAAP”) requires management to make estimates and assumptions that affect the reported amounts of assets and liabilities and disclosure of contingent assets and liabilities as of the date of the financial statements and the reported amounts of income and expenses during the reporting period. Actual results could differ from those estimates. In the preparation of these financial statements, management has evaluated events and transactions subsequent to December 31, 2023 through the date the financial statements were issued.
The Portfolio is an investment company and follows the accounting and reporting guidance of the Financial Accounting Standards Board (“FASB”) Accounting Standards Codification Topic 946—Financial Services—Investment Companies. The following is a summary of significant accounting policies consistently followed by the Portfolio in the preparation of its financial statements.
Investment Valuation and Fair Value Measurements - The Portfolio values its investments for purposes of calculating its net asset value (“NAV”) using procedures that allow for a variety of methodologies to be used to value the Portfolio’s investments. The specific methodology used for an investment may vary based on the market data available for a specific investment at the time the Portfolio calculates its NAV or based on other considerations. The procedures also permit a level of judgment to be used in the valuation process.
Domestic and foreign equity securities, such as common stock, exchange-traded funds, rights, warrants, and preferred stock, that are traded on a securities exchange on a valuation date are generally valued at their last quoted sale price or official closing price on the primary exchange for such security, or, if no sales occurred on that day, at the last reported bid price. Equity securities traded over-the-counter (“OTC”) are generally valued at the last reported bid price. In the event of a major exchange closing during the trading day, the Adviser may use other market information obtained from quotation reporting systems, established market makers, or pricing services in valuing the securities. Valuation adjustments may be applied to certain foreign equity securities that are traded solely on foreign exchanges that close before the time as of which the Portfolio determines its NAV to account for the market movement between the close of the foreign exchanges and the time as of which the Portfolio determines its NAV. The Portfolio may use a systematic fair valuation model provided by a pricing service to value securities principally traded in these foreign markets to adjust for possible market movements or other changes that may occur between the close of the foreign exchanges and the time as of which the Portfolio determines its NAV. Foreign equity securities valued using these valuation adjustments are generally categorized as Level 2 within the fair value hierarchy. Equity securities that are actively traded, and have no valuation adjustments applied, are categorized as Level 1 within the fair value hierarchy. Other equity securities traded on inactive markets or valued in reference to similar instruments traded on active markets are generally categorized as Level 2 within the fair value hierarchy.
Investments in registered open-end management investment companies are valued at reported NAV per share on the valuation date and are categorized as Level 1 within the fair value hierarchy.
Debt securities, including corporate, convertible and municipal bonds and notes; obligations of the U.S. Treasury and U.S. government agencies; foreign sovereign issues; and non-U.S. bonds, are generally valued based upon evaluated or composite bid quotations obtained from third-party pricing services and/or brokers and dealers selected by the Adviser (each a “pricing service”). Such pricing services may use matrix pricing, which considers observable inputs including, among other things, issuer details, maturity dates, interest rates, yield curves, rates of prepayment, credit risks/spreads, default rates, reported trades, broker-dealer quotes and quoted prices for similar assets. Short-term obligations with a remaining maturity of sixty days or less may be valued at amortized cost in the absence of market quotes, so long as the amortized cost value of such short-term debt instrument is approximately the same as the fair value of the instrument as determined without the use of amortized cost valuation. Floating rate loans are generally valued based upon
BHFTII-19
Brighthouse Funds Trust II
MetLife Stock Index Portfolio
Notes to Financial Statements—December 31, 2023—(Continued)
an evaluated or composite average of aggregate bid and ask quotations supplied by brokers or dealers, as obtained from the pricing service. Securities that use similar valuation techniques and inputs as described above are generally categorized as Level 2 within the fair value hierarchy.
Options, whether on securities, indices, futures contracts, or otherwise, traded on exchanges are valued at the last sale price available as of the close of business on a valuation day or, if there is no such price available, at the last reported bid price. These types of options are categorized as Level 1 within the fair value hierarchy. Futures contracts that are traded on commodity exchanges are valued at their settlement prices established by the exchanges on which they are traded as of the close of such exchanges and are categorized as Level 1 within the fair value hierarchy.
If no current market quotation is readily available or market value quotations are deemed to be unreliable for an investment, the fair value of the investment will be determined in accordance with procedures. A market quotation is readily available only when that quotation is a quoted price (unadjusted) in active markets for identical investments that the Portfolio can access at the measurement date, provided that a quotation will not be readily available if it is not reliable.
Pursuant to Rule 2a-5 under the 1940 Act, the Board of Trustees (the “Board” or “Trustees”) of the Trust has designated Brighthouse Investment Advisers, acting through its Valuation Committee (“Committee”), as the Portfolio’s “valuation designee” to perform the Portfolio’s fair value determinations. The Board oversees Brighthouse Investment Advisers in its role as the Valuation Designee and receives reports from Brighthouse Investment Advisers regarding its process and the valuation of the Portfolio’s investments to assist with such oversight.
No single standard for determining the fair value of an investment can be set forth because fair value depends upon the facts and circumstances with respect to each investment. Information relating to any relevant factors may be obtained by the Committee from any appropriate source, including the subadviser of the Portfolio, the Custodian, a pricing service, market maker and/or broker for such security or the issuer. Appropriate methodologies for determining fair value under particular circumstances may include: matrix pricing, a discounted cash flow analysis, comparisons of securities with comparable characteristics, value based on multiples of earnings, discount from market price of similar marketable securities, or a combination of these and other methods.
Foreign Currency Translation - The books and records of the Portfolio are maintained in U.S. dollars. The values of securities, currencies, and other assets and liabilities denominated in currencies other than the U.S. dollar are translated into U.S. dollars based upon foreign exchange rates prevailing at the end of the period. Purchases and sales of investment securities, income, and expenses are translated on the respective dates of such transactions. Because the values of investment securities are translated at the foreign exchange rates prevailing at the end of the period, that portion of the results of operations arising from changes in exchange rates and that portion of the results of operations reflecting fluctuations arising from changes in market prices of the investment securities are not separated. Such fluctuations are included in the net realized and unrealized gain or loss on investments.
Net realized foreign exchange gains or losses arise from activity in forward foreign currency exchange contracts, sales of foreign currency, currency gains or losses realized between the trade and settlement dates on securities transactions, and the difference between the amounts of dividends, interest, and foreign withholding taxes recorded by the Portfolio and the U.S. dollar-equivalent of the amounts actually received or paid by the Portfolio. Net unrealized foreign exchange gains and losses arise from changes in the value of assets and liabilities, other than investment securities, resulting from changes in foreign exchange rates.
Investment Transactions and Related Investment Income - Portfolio security transactions are recorded on the trade date. Dividend income is recorded on the ex-dividend date or, for certain foreign securities, when notified. Interest income, which includes amortization of premium and accretion of discount on debt securities, is recorded on the accrual basis. Realized gains and losses on investments are determined on the identified cost basis, which is the same basis used for federal income tax purposes. Foreign income and foreign capital gains on some foreign securities may be subject to foreign taxes, which are accrued as applicable. These foreign taxes have been provided for in accordance with the Portfolio’s understanding of the applicable countries’ tax rules and rates.
Dividends and Distributions to Shareholders - The Portfolio records dividends and distributions on the ex-dividend date. Net realized gains from securities transactions (if any) are generally distributed annually to shareholders. The timing and characterization of certain income and capital gains distributions are determined in accordance with federal tax regulations that may differ from GAAP. Permanent book and tax basis differences relating to shareholder distributions will result in reclassification between distributable earnings (accumulated losses) and paid in surplus. These adjustments have no impact on net assets or the results of operations.
Income Taxes - It is the Portfolio’s policy to comply with the requirements of the Internal Revenue Code of 1986, as amended, and regulations thereunder, applicable to regulated investment companies, and to distribute, with respect to each taxable year, all of its taxable income to shareholders. Therefore, no federal income tax provision is required. The Portfolio files U.S. federal tax returns. No income tax returns are currently under examination. The Portfolio’s federal tax returns remain subject to examination by the Internal Revenue Service for three fiscal years after the returns are filed. As of December 31, 2023, the Portfolio had no uncertain tax positions that would require financial statement recognition, derecognition or disclosure.
BHFTII-20
Brighthouse Funds Trust II
MetLife Stock Index Portfolio
Notes to Financial Statements—December 31, 2023—(Continued)
Repurchase Agreements - The Portfolio may enter into repurchase agreements, under the terms of a Master Repurchase Agreement (“MRA”), or Global Master Repurchase Agreement (“GMRA”), with selected commercial banks and broker-dealers, under which the Portfolio acquires securities as collateral and agrees to resell the securities at an agreed-upon time and at an agreed-upon price. The Portfolio, through the Custodian or a subcustodian, under a tri-party repurchase agreement, receives delivery of the underlying securities collateralizing any repurchase agreements. It is the Portfolio’s policy that the market value of the collateral be equal to at least 100% of the repurchase price in the case of a repurchase agreement of one-day duration and equal to at least 102% of the repurchase price in the case of all other repurchase agreements. In the event of default or failure by a party to perform an obligation in connection with any repurchase transaction, the MRA or GMRA gives the non-defaulting party the right to set-off claims and to apply property held by it in connection with any repurchase transaction against obligations owed to it under the agreement.
At December 31, 2023, the Portfolio invested cash collateral for loans of portfolio securities in repurchase agreements with a gross value of $87,961,612, which is included as part of investments at value on the Statement of Assets and Liabilities. The value of the related collateral exceeded the value of the repurchase agreements at December 31, 2023.
Securities Lending - The Portfolio may lend its portfolio securities to certain qualified brokers who borrow securities in order to complete certain securities transactions. By lending its portfolio securities, the Portfolio attempts to increase its net investment income through the receipt of income on collateral held from securities on loan. Any gain or loss in the market price of the loaned securities that might occur, any interest earned, and any dividends declared during the term of the loan, would accrue to the account of the Portfolio.
The Trust has entered into a Non-Custodial Securities Lending Agreement with JPMorgan Chase Bank, N.A. (the “Lending Agent”). Under the agreement, the Lending Agent is authorized to loan portfolio securities on the Portfolio’s behalf. In exchange, the Portfolio generally receives cash, U.S. Government securities, letters of credit, or other collateral deemed appropriate by the Adviser. The Portfolio receives collateral equal to at least 102% of the market value for loans secured by government securities or cash in the same currency as the loaned shares and 105% for all other loaned securities at each loan’s inception. Collateral representing at least 100% of the market value of the loaned securities is maintained for the duration of the loan. Any cash collateral received by the Portfolio is generally invested by the Lending Agent in short-term investments, which may include certificates of deposit, commercial paper, repurchase agreements, including repurchase agreements with respect to equity securities, time deposits, master demand notes and money market funds. The market value of investments made with cash collateral received are disclosed in the Schedule of Investments and the valuation techniques are described in Note 2. The value of the securities on loan may change each business day. If the market value of the collateral at the close of trading on a business day is less than 100% of the market value of the loaned securities at the close of trading on that day, the borrower is required to deliver, by the close of business on the following business day, an additional amount of collateral, so that the total amount of posted collateral is equal to at least 100% of the market value of all the loaned securities as of such preceding day. A portion of the income earned on the collateral is rebated to the borrower of the securities and the remainder is split between the Lending Agent and the Portfolio. On loans collateralized by U.S. government securities, a fee is received from the borrower and is allocated between the Portfolio and the Lending Agent.
Income received by the Portfolio in securities lending transactions during the year ended December 31, 2023 is reflected as securities lending income on the Statement of Operations. The values of any securities loaned by the Portfolio and the related collateral at December 31, 2023 are disclosed in the footnotes to the Schedule of Investments. The value of the related collateral received by the Portfolio exceeded the value of the securities out on loan at December 31, 2023.
The risks associated with lending portfolio securities include, but are not limited to, possible delays in receiving additional collateral or in the recovery of the loaned securities, possible loss of rights in the collateral should the borrower fail financially, as well as risk of loss in the value of the collateral or the value of the investments made with the collateral. To the extent the Portfolio uses cash collateral it receives to invest in repurchase agreements with respect to equity securities, it is subject to the risk of loss if the value of the equity securities declines and the counterparty defaults on its obligation to repurchase such securities. The Lending Agent shall indemnify the Portfolio in the case of default of any securities borrower, subject to the terms of the Non-Custodial Securities Lending Agreement.
The following table provides a breakdown of transactions accounted for as secured borrowings, the gross obligations by the type of collateral pledged, and the remaining contractual maturities of those transactions.
| Remaining Contractual Maturity of the Agreements As of December 31, 2023 |
||||||||||||||||||||
| Overnight and Continuous |
Up to 30 Days |
31 - 90 Days |
Greater than 90 days |
Total | ||||||||||||||||
| Securities Lending Transactions | ||||||||||||||||||||
| Common Stocks |
$ | (185,040,406 | ) | $ | — | $ | — | $ | — | $ | (185,040,406 | ) | ||||||||
| Mutual Funds |
(729,379 | ) | — | — | — | (729,379 | ) | |||||||||||||
| Total Borrowings |
$ | (185,769,785 | ) | $ | — | $ | — | $ | — | $ | (185,769,785 | ) | ||||||||
| Gross amount of recognized liabilities for securities lending transactions |
|
$ | (185,769,785 | ) | ||||||||||||||||
|
|
|
|||||||||||||||||||
BHFTII-21
Brighthouse Funds Trust II
MetLife Stock Index Portfolio
Notes to Financial Statements—December 31, 2023—(Continued)
3. Investments in Derivative Instruments
Futures Contracts - The Portfolio may buy and sell futures contracts as a hedge, to maintain investment exposure to a target asset class or to enhance return. The Portfolio may be subject to fluctuations in equity prices, interest rates, commodity prices, and foreign currency exchange rates in the normal course of pursuing its investment objective. Futures contracts are standardized agreements to buy or sell a security, or deliver a final cash settlement price in connection with an index, interest rate, currency, or other asset. The Portfolio must deposit an amount (“initial margin”) equal to a certain percentage of the face value of the futures contract. The initial margin may be in the form of cash or securities, which is returned when the Portfolio’s obligations under the contract have been satisfied. If cash is deposited as the initial margin, it is shown as cash collateral on the Statement of Assets and Liabilities. Futures contracts are marked-to-market daily and subsequent payments (“variation margin”) are made or received by the Portfolio depending on whether unrealized gains or losses are incurred. These amounts are reflected as receivables or payables on the Statement of Assets and Liabilities and as a component of net change in unrealized appreciation/depreciation on the Statement of Operations. When the contract is closed or expires, the Portfolio records a realized gain or loss equal to the difference between the value of the contract at the time it was opened and the value at the time it was closed. Risks of entering into futures contracts (and related options) include the possibility that the market for these instruments may be illiquid and that a change in the value of the futures contract or option may not correlate perfectly with changes in the value of the underlying asset. The exchange’s clearinghouse, as counterparty to all futures, guarantees the futures contracts against default.
The following table summarizes the fair value of derivatives held by the Portfolio at December 31, 2023 by category of risk exposure:
| Asset Derivatives |
||||||
| Risk Exposure |
Statement of Assets & |
Fair Value | ||||
| Equity |
Unrealized appreciation on futures contracts (a) | $ | 639,951 | |||
|
|
|
|||||
| (a) | Includes cumulative appreciation/depreciation of futures contracts as reported in the Schedule of Investments. Only the current day’s variation margin is reported within the Statement of Assets and Liabilities. | |||
The following tables summarize the effect of derivative instruments on the Statement of Operations, classified by derivative type and category of risk exposure, for the year ended December 31, 2023:
| Statement of Operations Location—Net Realized Gain (Loss) |
Equity | |||
| Futures contracts |
$ | 1,554,581 | ||
|
|
|
|||
| Statement of Operations Location—Net Change in Unrealized Appreciation (Depreciation) |
Equity | |||
| Futures contracts |
$ | 1,176,201 | ||
|
|
|
|||
For the year ended December 31, 2023, the average notional par or face amount outstanding for each derivative type was as follows:
| Derivative Description |
Average Notional Par or Face Amount‡ |
|||
| Futures contracts long |
$ | 15,822,844 | ||
| ‡ | Averages are based on activity levels during the period for which the amounts are outstanding. | |||
4. Certain Risks
In the normal course of business, the Portfolio invests in securities and enters into transactions where risks exist. Those risks include:
Market Risk: The value of securities held by the Portfolio may decline in response to certain events, including those directly involving the issuers whose securities are owned by the Portfolio; conditions affecting the general economy; overall market changes; local, regional or global political, social or economic instability; currency, interest rate, and price fluctuations, or other factors including terrorism, war, natural disasters and the spread of infectious illness including epidemics or pandemics such as the COVID-19 pandemic. These events may also adversely affect the liquidity of securities held by the Portfolio.
Credit and Counterparty Risk: The Portfolio may be exposed to counterparty risk, or the risk that an entity with which the Portfolio has unsettled or open transactions may default. The potential loss could exceed the value of the financial assets and liabilities recorded in the financial statements. Financial assets that potentially expose the Portfolio to credit and counterparty risk consist principally of cash due from counterparties and investments. The Portfolio manages counterparty risk by entering into agreements only with counterparties that it believes have the financial resources to honor their obligations and by monitoring the financial stability of those counterparties. The Subadviser may attempt to mitigate counterparty risk by (i) periodically assessing the
BHFTII-22
Brighthouse Funds Trust II
MetLife Stock Index Portfolio
Notes to Financial Statements—December 31, 2023—(Continued)
creditworthiness of its trading partners, (ii) monitoring and/or limiting the amount of its net exposure to each individual counterparty based on its assessment, and (iii) requiring collateral from the counterparty for certain transactions. In order to preserve certain safeguards for non-standard settlement trades, the Portfolio restricts its exposure to credit and counterparty losses by entering into master netting agreements (“Master Agreements”) with counterparties (approved brokers) with whom it undertakes a significant volume of transactions. Master Agreements govern the terms of certain transactions and reduce the counterparty risk associated with relevant transactions by specifying credit protection mechanisms and providing standardization that improves legal certainty. Master Agreements can also help limit counterparty risk by specifying collateral posting arrangements at pre-arranged exposure levels.
Customer Account Agreements and related addenda govern cleared derivatives transactions such as futures, options on futures, and cleared OTC derivatives. Cleared derivative transactions require posting of initial margin as determined by each relevant clearinghouse. The Portfolio’s clearing broker may also require additional initial margin. Clearinghouse-related initial margin is held by the clearinghouse and additional initial margin is held by the Portfolio’s clearing broker. In a cleared derivative transaction, the Portfolio’s counterparty is a clearinghouse rather than a bank or broker. The clearinghouse stands between the buyer and the seller of the contract; therefore, credit risk is limited to failure of or default by the clearinghouse. While offset rights may exist under applicable law, the Portfolio does not have a contractual right of offset against a clearing broker or clearinghouse in the event of a default (including the bankruptcy or insolvency). Additionally, credit risk exists in cleared derivative transactions with respect to initial and variation margin that is held in a clearing broker’s customer accounts. While clearing brokers are required to segregate, by account class, customer margin from their own assets, in the event that a clearing broker becomes insolvent or goes into bankruptcy and at that time there is a shortfall in the aggregate amount of margin held by the clearing broker for all its clients, typically the shortfall would be allocated on a pro-rata basis across all the clearing broker’s customers, for the relevant account class, potentially resulting in losses to the Portfolio. Variation margin, which accounts for changes in market value, is exchanged daily, but may not be netted between futures and cleared OTC derivatives.
Additional risks associated with each type of investment are described above within the respective security type notes. The Portfolio’s prospectus includes a discussion of the principal risks of investing in the Portfolio.
5. Investment Transactions
Aggregate cost of purchases and proceeds of sales of investment securities, excluding short-term securities, for the year ended December 31, 2023 were as follows:
| Purchases |
Sales | |||||||||||
| U.S. Government |
Non-U.S. Government | U.S. Government | Non-U.S. Government | |||||||||
| $0 | $ | 758,407,906 | $ | 0 | $ | 1,397,569,051 | ||||||
6. Investment Management Fees and Other Transactions with Affiliates
Investment Management Agreement - Brighthouse Investment Advisers is the investment adviser to the Portfolio. The Trust has entered into an investment management agreement with Brighthouse Investment Advisers with respect to the Portfolio. For providing investment management services to the Portfolio, Brighthouse Investment Advisers receives monthly compensation at the annual rate of 0.250% of average daily net assets. Fees earned by Brighthouse Investment Advisers with respect to the Portfolio for the year ended December 31, 2023 were $17,536,563.
Brighthouse Investment Advisers has entered into an investment subadvisory agreement with MetLife Investment Management, LLC (“MIM”) with respect to managing the Portfolio. For providing subadvisory services to the Portfolio, Brighthouse Investment Advisers has agreed to pay MIM an investment subadvisory fee for each class of the Portfolio as follows:
| % per annum |
Average Daily Net Assets | |
| 0.020% | On the first $500 million | |
| 0.015% | Of the next $500 million | |
| 0.010% | Of the next $1 billion | |
| 0.005% | On amounts over $2 billion |
Fees earned by MIM with respect to the Portfolio for the year ended December 31, 2023 were $525,731.
Management Fee Waiver - Pursuant to a management fee waiver agreement, the Adviser has agreed, for the period May 1, 2023 to April 30, 2024, to reduce its advisory fees set out above under “Investment Management Agreement” for each class of the Portfolio as follows:
| % per annum reduction |
Average Daily Net Assets | |
| 0.005% | Over $500 million and under $1 billion | |
| 0.010% | Of the next $1 billion | |
| 0.015% | On amounts over $2 billion |
BHFTII-23
Brighthouse Funds Trust II
MetLife Stock Index Portfolio
Notes to Financial Statements—December 31, 2023—(Continued)
An identical agreement was in place for the period April 29, 2022 to April 30, 2023. Amounts waived for the year ended December 31, 2023 are shown as a management fee waiver in the Statement of Operations.
Certain officers and trustees of the Trust may also be officers of the Adviser; however, such officers and trustees receive no compensation from the Trust.
Transfer Agency Agreement - Brighthouse Life Insurance Company serves as the transfer agent for the Trust. Brighthouse Life Insurance Company receives no fees for its services to the Trust.
Distribution and Service Fees - The Trust has a distribution agreement with Brighthouse Securities, LLC (the “Distributor”) pursuant to which the Distributor serves as the general distributor of shares of each class (each a “Class”) of each Portfolio. The Distributor is an affiliate of the Trust. The Trust has adopted a Distribution and Services Plan (the “D&S Plan”) relating to Class B, Class D, Class E, Class F and Class G shares of each Portfolio, under Rule 12b-1 under the 1940 Act, pursuant to which the Trust may pay the Distributor a fee (the “Service Fee”) at an annual rate not to exceed 0.25% of each such Portfolio’s average daily net assets attributable to the Class B, Class D, Class E, Class F and Class G shares of the Trust. Each Portfolio may not offer shares of each Class. The D&S Plan also authorizes the Trust, on behalf of each of its Portfolios, to pay to the Distributor a distribution fee (the “Distribution Fee” and together with the Service Fee, the “Fees”) at an annual rate of up to 0.25% of each Portfolio’s average daily net assets attributable to the Class B, Class D, Class E, Class F, and Class G shares in consideration of the services rendered in connection with the sale of such shares by the Distributor. Under the Distribution Agreement with respect to the Trust, Fees are currently paid at an annual rate of 0.25% of average daily net assets in the case of Class B shares, 0.10% of average daily net assets in the case of Class D shares, 0.15% of average daily net assets in the case of Class E shares, 0.20% of average daily net assets in the case of Class F shares and 0.30% of average daily net assets in the case of Class G shares. The D&S Plan is known as a “compensation plan” because the Trust makes payments to the Distributor for services rendered regardless of the actual level of expenditures by the Distributor. Amounts incurred by the Portfolio for the year ended December 31, 2023 are shown as Distribution and service fees in the Statement of Operations.
Deferred Trustee Compensation - Each Trustee who is not currently an employee of the Adviser or any of its affiliates receives compensation from the Trust for his or her service to the Trust. A deferred compensation plan (the “Plan”) is available to the Trustees on a voluntary basis. Deferred amounts remain in the Trust until distributed in accordance with the provisions of the Plan. The value of a participating Trustee’s deferral account is based on theoretical investments of deferred amounts on the normal payment dates in certain portfolios of the Trust or Brighthouse Funds Trust I, an affiliate of the Trust, as designated by the participating Trustee. Changes in the value of participants’ deferral accounts are reflected as a component of Trustees’ fees and expenses in the Statement of Operations. The portion of the accrued obligations allocated to the Portfolio under the Plan is reflected as Deferred trustees’ fees in the Statement of Assets and Liabilities.
7. Transactions in Securities of Affiliated Issuers
A summary of the Portfolio’s transactions in the securities of affiliated issuers during the year ended December 31, 2023 is as follows:
| Security Description |
Market Value December 31, 2022 |
Purchases | Sales | Realized Gain/(Loss) |
Change in Unrealized Appreciation/ (Depreciation) |
Ending Value as of December 31, 2023 |
Income earned from affiliates during the period |
Number of shares held December 31, 2023 |
||||||||||||||||||||||||
| MetLife, Inc. |
$ | 9,600,170 | $ | 17,668 | $ | (1,129,858 | ) | $ | 389,424 | $ | (1,293,946 | ) | $ | 7,583,458 | $ | 258,804 | 114,675 | |||||||||||||||
8. Contractual Obligations
Under the Trust’s organizational documents, its officers and Trustees may be indemnified against certain liabilities and expenses arising out of the performance of their duties to the Trust. Additionally, the Trust has a variety of indemnification obligations under contracts with its service providers. The Trust’s maximum exposure under these arrangements is unknown, as this would involve future claims that may be made against the Trust that have not yet occurred.
9. Income Tax Information
The cost basis of investments for federal income tax purposes at December 31, 2023 was as follows:
| Cost basis of investments |
$ | 2,914,244,889 | ||
|
|
|
|||
| Gross unrealized appreciation |
4,910,571,877 | |||
| Gross unrealized (depreciation) |
(198,274,792 | ) | ||
|
|
|
|||
| Net unrealized appreciation (depreciation) |
$ | 4,712,297,085 | ||
|
|
|
BHFTII-24
Brighthouse Funds Trust II
MetLife Stock Index Portfolio
Notes to Financial Statements—December 31, 2023—(Continued)
The tax character of distributions paid for the years ended December 31, 2023 and 2022 were as follows:
| Ordinary Income |
Long-Term Capital Gain | Total | ||||||||||||||||||
| 2023 |
2022 | 2023 | 2022 | 2023 | 2022 | |||||||||||||||
| $94,678,546 | $ | 104,263,779 | $ | 472,175,570 | $ | 648,209,852 | $ | 566,854,116 | $ | 752,473,631 | ||||||||||
As of December 31, 2023, the components of distributable earnings (accumulated losses) on a federal income tax basis were as follows:
| Undistributed |
Undistributed Long-Term Capital Gain |
Net Unrealized Appreciation (Depreciation) |
Accumulated Capital Losses |
Total | ||||||||||||||
| $98,429,315 | $ | 480,431,350 | $ | 4,712,297,085 | $ | — | $ | 5,291,157,750 | ||||||||||
The Portfolio utilizes the provisions of the federal income tax laws that provide for the carryforward of capital losses for prior years, offsetting such losses against any future realized capital gains. Net capital losses may be carried forward indefinitely and their character is retained as short-term and/or long-term losses.
As of December 31, 2023, the Portfolio had no accumulated capital losses.
10. Recent Accounting Pronouncement & Regulatory Updates
In June 2022, FASB issued Accounting Standards Update 2022-03—Fair Value Measurement (Topic 820)—Fair Value Measurement of Equity Securities Subject to Contractual Sale Restrictions (“ASU 2022-03”). ASU 2022-03 clarifies the guidance in Topic 820 to indicate that a contractual sale restriction should not be considered in the fair value of an equity security subject to such a restriction, and requires entities with investments in equity securities subject to contractual sale restrictions to disclose certain qualitative and quantitative information about such securities. ASU 2022-03 is effective for fiscal years, and interim periods within those fiscal years, beginning after December 15, 2023. ASU 2022-03 is only applicable to an equity security in which the contractual arrangement that restricts its sale is executed or modified on or after the adoption date.
Effective January 24, 2023, the Securities and Exchange Commission adopted rule and form amendments that require open-end management investment companies to transmit concise and visually engaging annual and semiannual reports to shareholders that highlight certain information deemed by the SEC to be particularly important for investors. Certain other information, including financial statements, will no longer appear in shareholder reports but will, as required, be available online, delivered free of charge upon request, and filed on a semiannual basis on Form N-CSR. The rule and form amendments have a compliance date of July 24, 2024. Accordingly, the rule and form amendments will not impact the Portfolio until its 2024 semiannual shareholder report.
BHFTII-25
Brighthouse Funds Trust II
MetLife Stock Index Portfolio
Report of Independent Registered Public Accounting Firm
To the Board of Trustees of Brighthouse Funds Trust II and Shareholders of the MetLife Stock Index Portfolio:
Opinion on the Financial Statements and Financial Highlights
We have audited the accompanying statement of assets and liabilities, including the schedule of investments, of the MetLife Stock Index Portfolio (the “Fund”) (one of the funds constituting the Brighthouse Funds Trust II), as of December 31, 2023, the related statement of operations for the year then ended, the statements of changes in net assets for each of the two years in the period then ended, the financial highlights for each of the five years in the period then ended, and the related notes. In our opinion, the financial statements and financial highlights present fairly, in all material respects, the financial position of the Fund as of December 31, 2023, and the results of its operations for the year then ended, the changes in its net assets for each of the two years in the period then ended, and the financial highlights for each of the five years in the period then ended in conformity with accounting principles generally accepted in the United States of America.
Basis for Opinion
These financial statements and financial highlights are the responsibility of the Fund’s management. Our responsibility is to express an opinion on the Fund’s financial statements and financial highlights based on our audits. We are a public accounting firm registered with the Public Company Accounting Oversight Board (United States) (PCAOB) and are required to be independent with respect to the Fund in accordance with the U.S. federal securities laws and the applicable rules and regulations of the Securities and Exchange Commission and the PCAOB.
We conducted our audits in accordance with the standards of the PCAOB. Those standards require that we plan and perform the audit to obtain reasonable assurance about whether the financial statements and financial highlights are free of material misstatement, whether due to error or fraud. The Fund is not required to have, nor were we engaged to perform, an audit of its internal control over financial reporting. As part of our audits we are required to obtain an understanding of internal control over financial reporting but not for the purpose of expressing an opinion on the effectiveness of the Fund’s internal control over financial reporting. Accordingly, we express no such opinion.
Our audits included performing procedures to assess the risks of material misstatement of the financial statements and financial highlights, whether due to error or fraud, and performing procedures that respond to those risks. Such procedures included examining, on a test basis, evidence regarding the amounts and disclosures in the financial statements and financial highlights. Our audits also included evaluating the accounting principles used and significant estimates made by management, as well as evaluating the overall presentation of the financial statements and financial highlights. Our procedures included confirmation of securities owned as of December 31, 2023, by correspondence with the custodian and brokers; when replies were not received from brokers, we performed other auditing procedures. We believe that our audits provide a reasonable basis for our opinion.
/s/ Deloitte & Touche LLP
Boston, Massachusetts
February 23, 2024
We have served as the auditor of one or more Brighthouse investment companies since 1983.
BHFTII-26
Brighthouse Funds Trust II
Trustees and Officers
MANAGEMENT OF THE TRUSTS
The Boards of Trustees (the “Board”) of Brighthouse Funds Trust I and Brighthouse Funds Trust II (“Trust I” and “Trust II”, respectively, and collectively the “Trusts”) supervise the Trusts and are responsible for representing the interests of shareholders. The Trustees, the Chairman of the Board and the Chairmen of each subcommittee are the same for both Trusts. The Trustees of each Trust meet periodically throughout the year to oversee the Portfolios’ activities, reviewing, among other things, each Portfolio’s performance and its contractual arrangements with various service providers. The Trustees of each Trust elect the officers of the Trust, who are responsible for administering the Trust’s day-to-day operations.
Trustees and Officers
The Trustees and executive officers of the Trusts, as well as their ages and their principal occupations during the past five years, are set forth below. Unless otherwise indicated, the business address of each is c/o Brighthouse Funds Trust I and Brighthouse Funds Trust II, 11225 N. Community House Rd., Charolette, North Carolina 28277. Each Trustee who is deemed an “interested person,” as such term is defined in the 1940 Act, is referred to as an “Interested Trustee.” Those Trustees who are not “interested persons,” as such term is defined in the 1940 Act, are referred to as “Independent Trustees.” There is no limit to the term a Trustee may serve, other than pursuant to the retirement policy adopted by the Independent Trustees. Trustees serve until their death, resignation, retirement or removal in accordance with Trust I’s and Trust II’s respective organizational documents and policies adopted by the Board of the Trust from time to time. Officers hold office at the pleasure of each Board and serve until their removal or resignation in accordance with the Trusts’ respective organizational documents and policies adopted by the Board of each Trust from time to time.
Trustees of the Trusts
| Name and Year of Birth |
Position(s) |
Term of Office |
Principal Occupation(s) During the Past |
Number of |
Other Directorships Held | |||||
| Interested Trustee | ||||||||||
| John Rosenthal* (1960) |
Trustee | Indefinite; From May 2016 (Trust I and Trust II) to present | Chief Investment Officer, Brighthouse Financial, Inc. (2016 to present). | 73 | None | |||||
| Independent Trustees | ||||||||||
| Dawn M. Vroegop (1966) |
Trustee and Chair of the Board | Indefinite; From December 2000 (Trust I)/May 2009 (Trust II) to present as Trustee; From May 2016 (Trust I and Trust II) until present as Chair | Retired; Private Investor. | 73 | Trustee, Driehaus Mutual Funds (8 portfolios).** | |||||
| Stephen M. Alderman (1959) |
Trustee | Indefinite; From December 2000 (Trust I)/April 2012 (Trust II) to present | Vice President and General Counsel, IHR Aerial Solutions, LLC; Until 2022, General Counsel, Illini Hi-Reach, Inc.; Until 2020, Shareholder in the law firm of Garfield & Merel, Ltd. | 73 | None | |||||
| Robert J. Boulware (1956) |
Trustee | Indefinite; From March 2008 (Trust I)/April 2012 (Trust II) to present | Managing Member, Pilgrim Funds, LLC (private equity fund). | 73 | Trustee, Vertical Capital Income Fund (closed-end fund);** Trustee, The Private Shares Fund (closed- end fund);** Until 2021, Director, Mid- Con Energy Partners, LP (energy);** Until 2020, Director, Gainsco, Inc. (auto insurance).** | |||||
BHFTII-27
Brighthouse Funds Trust II
Trustees and Officers—(Continued)
| Name and Year of Birth |
Position(s) |
Term of Office |
Principal Occupation(s) During the Past |
Number of |
Other Directorships Held | |||||
| Susan C. Gause (1952) |
Trustee | Indefinite; From March 2008 (Trust I)/April 2012 (Trust II) to present | Private Investor. | 73 | Trustee, HSBC Funds (4 portfolios).** | |||||
| Nancy Hawthorne (1951) |
Trustee | Indefinite; From May 2003 (Trust II)/April 2012 (Trust I) to present | Private Investor. | 73 | Trustee, First Eagle Credit Opportunities Fund;** Trustee and Chair of the Board of Trustees, First Eagle Global Opportunities Fund;** Director, Avid Technology, Inc;** Director, CRA International, Inc.** | |||||
Executive Officers of the Trusts
| Name and Year of Birth |
Position(s) Held |
Term of Office |
Principal Occupation(s) | |||
| Kristi Slavin (1973) | President and Chief Executive Officer, of Trust I and Trust II | From May 2016 (Trust I and Trust II) to present |
President, Brighthouse Investment Advisers, LLC (2016-present). | |||
| Alan R. Otis (1971) | Chief Financial Officer and Treasurer, of Trust I and Trust II | From November 2017 (Trust I and Trust II) to present |
Executive Vice President, Brighthouse Investment Advisers, LLC (2017-present); formerly, Vice President, Brighthouse Investment Advisers, LLC (2012-2017); Assistant Treasurer, Trust I and Trust II (2012-2017). | |||
| Thomas Watterson (1985) | Secretary, of Trust I and Trust II | From November 2023 (Trust I and Trust II) to present |
Executive Vice President, Chief Legal Officer and Secretary, Brighthouse Investment Advisers, LLC (2023-Present); Managing Corporate Counsel, Brighthouse Financial Inc. (2023-present); Managing Counsel and Director, The Bank of New York Mellon Corporation (2019-2023); Counsel and Vice President, The Bank of New York Mellon Corporation (2016-2019). | |||
| Katie Hellmann (1980) | Chief Compliance Officer (“CCO”), of Trust I and Trust II | From May 2023 (Trust I and Trust II) to present |
Chief Compliance Officer, Brighthouse Investment Advisers, LLC (2023-present) and Head of Funds and Investments Compliance (2023-present). Deputy Chief Compliance Officer, Transamerica Asset Management (2022-2023). Leader and Senior Compliance Counsel-Funds Compliance, Edward Jones (2017-2022). | |||
| Rosemary Morgan (1983) | Anti-Money Laundering Officer, of Trust I and Trust II | From May 2023 (Trust I and Trust II) to present |
Chief Privacy Officer, Leader of Compliance Programs and Assistant General Counsel, Brighthouse Financial, Inc. (2019-2022); Chief Privacy Officer, Head of Compliance Programs & Contracts Law, Brighthouse Financial, Inc. (2022-2023), Chief Compliance Officer and Associate General Counsel, Brighthouse Financial, Inc. (2023-present); Vice President and Chief Compliance Officer, Brighthouse Life Insurance Company (2023-present); Vice President and Chief Compliance Officer (2023-present), Brighthouse Life Insurance Company of NY; Vice President and Chief Compliance Officer (2023-present), New England Life Insurance Company. | |||
| Anna Koska (1981) | Vice President, of Trust I and Trust II | From June 2022 (Trust I and Trust II) to present |
Vice President, Investment and Advisory Services, Brighthouse Investment Advisers, LLC (2022-present); Director of Investment and Advisory Services, Brighthouse Investment Advisers, LLC (2019-2022); Senior Portfolio Analyst, Brighthouse Investment Advisers, LLC (2017-2019). | |||
| * | Mr. Rosenthal is an “interested person” of the Trusts because of his position with Brighthouse Financial, Inc. (“Brighthouse Financial”), an affiliate of BIA. |
| ** | Indicates a directorship with a registered investment company or a company subject to the reporting requirements of the Securities Exchange Act of 1934, as amended. |
| (1) | Previous positions during the past five years with the Trusts, MetLife, Inc. or the Adviser are omitted if not materially different. |
| (2) | The Fund Complex includes 44 Trust I Portfolios and 29 Trust II Portfolios. |
BHFTII-28
Brighthouse Funds Trust II
MetLife Stock Index Portfolio
Board of Trustees’ Consideration of Advisory and Sub-Advisory Agreements
At a meeting held on November 13-14, 2023 (the “November Meeting”), the Boards of Trustees (the “Board”) of Brighthouse Funds Trust I and Brighthouse Funds Trust II (“BFT I” and “BFT II,” respectively, and collectively, the “Trusts”), including a majority of the Trustees who are not “interested persons” of the Trusts (the “Independent Trustees”) under the Investment Company Act of 1940 (the “1940 Act”), approved the continuation of the Trusts’ advisory agreements (each an “Advisory Agreement”) with Brighthouse Investment Advisers, LLC (the “Adviser”) and the applicable sub-advisory and sub-sub-advisory agreements (each a “Sub-Advisory Agreement” and collectively with the Advisory Agreement, the “Agreements”) between the Adviser and the investment sub-advisers and sub-sub-adviser (each a “Sub-Adviser,” and collectively, the “Sub-Advisers”) for the series of the Trusts (each a “Portfolio,” and collectively, the “Portfolios”) for the annual contract renewal period from January 1, 2024 through December 31, 2024.
The Board met with personnel of the Adviser on September 28-29, 2023 (the “September Meeting”) for the specific purpose of giving preliminary consideration to the proposed continuation of the Agreements, including consideration to information that the Adviser and Sub-Advisers had provided for the Board’s review at the request of the Independent Trustees. At the September Meeting, the Adviser reviewed with the Board the performance and fees experienced by each Portfolio, as well as other information. During and after the September Meeting, the Independent Trustees requested additional information and clarifications that the Adviser addressed at the November Meeting (the September Meeting and the November Meeting are referred to collectively as, the “Meetings”). During the contract renewal process, and throughout the year, the Independent Trustees were advised by independent legal counsel, and they met with independent legal counsel in executive sessions outside of the presence of management on a number of occasions to discuss, among other things, the renewal of the Agreements.
In considering the continuation of the Agreements, the Board reviewed a variety of materials that were provided for the specific purpose of assisting the Board in the renewal process, along with various information and materials that were provided to and discussed with the Board throughout the year, at regularly scheduled meetings of the Board and its committees. In particular, information for each Portfolio included, but was not limited to, reports on investment performance, expenses, legal and compliance matters, and asset pricing. Information about the Adviser and each Sub-Adviser included, but was not limited to, reports on the business, operations, and performance of the Adviser and the Sub-Advisers and reports that the Adviser and Sub-Advisers had prepared specifically for the renewal process.
In considering the continuation of the Agreements, the Board also reviewed, among other things, a report for each Portfolio that was prepared by Broadridge (“Broadridge”), an independent organization, which set forth comparative performance and expense information for each Portfolio. In addition, the Independent Trustees reviewed a report that was prepared by JDL Consultants, LLC (“JDL”), an independent consultant to the Independent Trustees, which examined the Broadridge reports for each Portfolio (“JDL Report”). The Independent Trustees met in executive session with representatives of JDL during the September Meeting to review the JDL Report.
At the November Meeting, the Board, including a majority of the Independent Trustees, concluded that the nature, extent, and quality of services provided by the Adviser and each Sub-Adviser supported the renewal of the Agreements. The Board also concluded that the investment services provided to and the performance of each Portfolio was such that each Agreement should continue, and that the fees paid by each Portfolio to the Adviser appeared to be reasonable in light of the nature, extent, and quality of the services provided by the Adviser and each Sub-Adviser. Further, the Board concluded that the Adviser’s profitability in providing services under the Advisory Agreements did not appear unreasonable in light of the nature, extent, and quality of the services provided by the Adviser. The Board reviewed the extent to which the investment advisory fees paid by the Portfolios shared economies of scale with investors or entailed the potential to share economies of scale with investors and concluded that those considerations generally supported the renewal of each Agreement. Finally, the Board considered the Adviser’s recommendation that it approve the renewal of each Sub-Advisory Agreement.
In approving the continuation of each Agreement, the Board, including the Independent Trustees, gave attention to all of the information that was furnished, and each Trustee placed varying degrees of importance on the various pieces of information that were provided to them. The Board evaluated the information provided to it on a Portfolio-by-Portfolio basis, and its decision was made separately with respect to each Portfolio. The following paragraphs provide more information about some of the primary factors that were relevant to the Board’s decisions. The Board did not identify any single factor as determinative, and the Trustees generally attributed different weights to various factors for the various Portfolios.
Nature, extent and quality of services. The Board evaluated the nature, extent, and quality of the services that the Adviser and the Sub-Advisers, as relevant, provided to the Portfolios. The Board considered the Adviser’s services as investment manager to the Portfolios, including its services relating to the hiring and oversight of the Sub-Advisers and, in particular, their investment programs and personnel, succession management of key personnel, trading practices, compliance programs and personnel, and risk management
BHFTII-29
Brighthouse Funds Trust II
MetLife Stock Index Portfolio
Board of Trustees’ Consideration of Advisory And Sub-advisory Agreements—(Continued)
programs, among other things. The Adviser’s services in coordinating and overseeing the activities of the Trusts’ other service providers were also considered. The Board also considered the systems and processes required by the Adviser to meet additional regulatory and compliance requirements resulting from U.S. Securities and Exchange Commission and other regulatory initiatives, including related to liquidity, valuation, and derivatives risk management. The Board considered information received from the Trusts’ Chief Compliance Officer regarding the Portfolios’ compliance policies and procedures that were established pursuant to Rule 38a-l under the 1940 Act, and relevant aspects of the Adviser’s and Sub-Advisers’ compliance policies and procedures. The Board also noted that it was the practice of the Adviser’s investment, compliance, and legal staff to conduct periodic meetings (through various media) with the Sub-Advisers throughout the year in order to review and assess the services that are provided to the Portfolios, and that personnel of the Adviser routinely prepare and present reports to the Board regarding those meetings. In addition, during the Meetings and throughout the year, the Board considered the expertise, experience, and performance of the personnel of the Adviser who performed the various services that are mentioned above.
With respect to the services provided by each of the Sub-Advisers, the Board considered a variety of information that the Adviser and each Sub-Adviser prepared for the Board’s review. The Board considered each Sub-Adviser’s investment process, each Sub-Adviser’s overall organization and business plans and the investment performance experienced by the Portfolio (as described in more detail below). The Board took into account that each Sub-Adviser’s responsibilities include, among other things, the development and maintenance of an investment program for the applicable Portfolio, the selection of investments and the placement of orders for the purchase and sale of such assets, and the implementation of compliance controls related to the performance of these services. The Board considered, based on the information provided, each Sub-Adviser’s staffing with respect to the management of the Portfolio and other information relating to the Sub-Adviser’s business and operations. The Board also considered the Sub-Adviser’s overall resources and information with respect to any recent turnover of key personnel at the Sub-Adviser. The Board reviewed each Sub-Adviser’s investment experience, as well as information provided regarding the Sub-Adviser’s personnel who provide services to the Portfolios. The Board also considered, among other things, information about each Sub-Adviser’s compliance program, including regarding any compliance matters involving a Sub-Adviser that had been brought to the Board’s attention during the year, as well as the Adviser’s assessment of the financial condition of each Sub-Adviser.
Performance. The Board placed emphasis on the performance of each Portfolio in the context of the performance of the relevant markets in which the Portfolio invests. The Board considered the Adviser’s quarterly presentations to the Board of detailed information about each Portfolio’s investment strategies and performance results and composition, including discussions regarding the relevant effects of market conditions. The Board reviewed and considered the reports prepared by Broadridge, which provided a statistical analysis comparing each Portfolio’s investment performance to that of comparable funds underlying variable insurance products (the “Performance Universe”), and the JDL Report. The Board also compared the performance of each Portfolio to that of comparable funds and other accounts that were managed by the relevant Sub-Adviser, to the extent such information was provided. The Board considered each Portfolio’s performance for periods subsequent to the performance period covered by the Broadridge reports and considered the Adviser’s assessment of the same. The Board also noted that while it found the data provided by Broadridge generally useful, it recognized the limitations of such data, including, in particular, that notable differences may exist between a Portfolio and the other funds in a Broadridge category (for example, with respect to investment strategies) and that the results of the performance comparisons may vary depending on (i) the end dates for the performance periods that were selected and (ii) the selection of the peer groups.
The Board focused particular attention on Portfolios with less favorable performance records. The Board noted the Adviser’s focus on each Sub-Adviser’s performance and that the Adviser had been active in monitoring and responding to any performance issues with respect to the Portfolios.
Fees and Expenses. The Board gave consideration to the level and method of computing the fees payable under the Agreements. The Board reviewed and considered the information in the JDL Report concerning fees and expenses. The Board also reviewed and considered the Broadridge report for each Portfolio, which included various comparisons of the Portfolio’s fees (at December 31, 2022 and various asset levels) and expenses with those of its peers, including, as applicable, a broad group of peer funds (“Expense Universe”), a narrower group of peer funds (“Expense Group”), a broad group of peer sub-advised funds (“Sub-advised Expense Universe”), and a narrower group of peer sub-advised funds (“Sub-advised Expense Group”). In particular, the Board reviewed comparisons of each Portfolio’s contractual management fees with its Expense Group and Sub-advised Expense Universe, contractual sub-adviser fees with its Sub-advised Expense Universe and Sub-advised Expense Group, and total expenses with its Expense Universe, Expense Group and Sub-advised Expense Universe. The Board considered that Broadridge selected the peer funds, which were funds underlying variable insurance products that Broadridge deemed to be comparable to the Portfolios. The Board considered that the fee and expense information in the Broadridge report for each Portfolio reflected information as of the Portfolio’s most recent fiscal year
BHFTII-30
Brighthouse Funds Trust II
MetLife Stock Index Portfolio
Board of Trustees’ Consideration of Advisory And Sub-advisory Agreements—(Continued)
end at the time the Broadridge report was issued and that historical asset levels may differ from current asset levels, particularly in a period of market volatility. In addition, the Board compared the fee payable to a Sub-Adviser by the Adviser with respect to the Portfolio to the fee payable to the Sub-Adviser by other comparable funds and other accounts, to the extent such information was provided.
The Board noted that the sub-advisory fees for the Portfolios are negotiated at arm’s length by the Adviser and are paid by the Adviser out of its advisory fees. The Board also considered that the Adviser had entered into expense limitation or management fee waiver agreements with certain of the Portfolios pursuant to which the Adviser had agreed to waive a portion of its advisory fee and/or reimburse certain expenses as a means of limiting a Portfolio’s total annual operating expenses or passing through the benefit of a subadvisory fee concession to a Portfolio, as applicable.
Profitability. The Board examined the profitability to the Adviser of each Advisory Agreement, on a Portfolio-by-Portfolio basis. The Board also considered that an affiliate of the Adviser, Brighthouse Securities, LLC, serves as distributor for the Trusts, and, as such, receives Rule 12b-1 payments to support the distribution of the Portfolios. The Board considered the profitability to the Sub-Advisers and their affiliates of their relationships with the Portfolios, to the extent provided, and the Board considered the ability of the Adviser to negotiate with a Sub-Adviser at arm’s length. In reviewing the profitability information, the Board recognized that expense allocation methodologies are inherently subjective and various methodologies may be reasonable while producing different results.
Economies of scale. The Board considered each Portfolio’s fees in light of its size. The Board noted the fee schedules for the Portfolios that contain breakpoints that reduce the fee rate above specified asset levels, including breakpoints in the Advisory Agreements and any corresponding Sub-Advisory Agreement. The Board noted those Portfolios that did not have breakpoints in their advisory fees and considered management’s explanation of the same.
The Board considered the effective fees under the Advisory Agreement and Sub-Advisory Agreement for each Portfolio as a percentage of assets at different asset levels and possible economies of scale that may be realized if the assets of the Portfolio grow. The Board examined, among other data, the effect of a Portfolio’s growth in size, and reduction in size, on various fee schedules. The Board also generally noted that if a Portfolio’s assets increase over time, the Portfolio may realize economies of scale if assets increase proportionally more than certain other expenses.
Other factors. The Board considered other benefits that may be realized by the Adviser and its affiliates from their relationships with the Trusts. Among the benefits realized by the Adviser, the Board recognized that Brighthouse Securities, LLC, as the distributor for the Trusts, receives payments pursuant to Rule 12b-1 from the Portfolios to help compensate for the provision of shareholder services and distribution activities. The Board considered that a Sub-Adviser may engage in soft dollar transactions in managing a Portfolio. In addition, the Board considered that a Sub-Adviser may be affiliated with registered broker-dealers that may, from time to time, receive brokerage commissions from a Portfolio in connection with the sale of portfolio securities (subject to applicable best execution obligations). The Board also considered that a Sub-Adviser and its affiliates could benefit from the opportunity to provide advisory services to additional portfolios of the Trusts and overall reputational benefits.
The Board considered information from the Adviser and Sub-Advisers pertaining to potential conflicts of interest, and the manner in which any potential conflicts were mitigated. In its review, the Board considered information regarding various business relationships among the Adviser and its affiliates and various Sub-Advisers and their affiliates. The Board also considered information about services and/or payments provided to the Adviser by the Sub-Advisers in connection with marketing activities. The Board considered representations from the Adviser that such business relationships and any payments were not considered in the Adviser’s recommendation to renew any of the Sub-Advisory Agreements.
* * * * *
MetLife Stock Index Portfolio. The Board also considered the following information in relation to the Agreements with the Adviser and MetLife Investment Management, LLC regarding the Portfolio:
Among other data relating specifically to the Portfolio’s performance, the Board considered that the Portfolio outperformed the median of its Performance Universe and the average of its Morningstar Category for the one-, three-, and five-year periods ended June 30, 2023. The Board further considered that the Portfolio underperformed its benchmark, the S&P 500 Index, for the one-, three-, and five-year periods ended October 31, 2023, and the Board noted management’s explanation of the tracking error between the Portfolio and the Index. The Board also noted the presence of certain management fee waivers in effect for the Portfolio.
The Board also considered that the Portfolio’s actual management fees and total expenses (exclusive of 12b-1 fees) were above the Expense Group median, the Expense Universe median, and the Sub-advised Expense Universe median. The Board noted that the
BHFTII-31
Brighthouse Funds Trust II
MetLife Stock Index Portfolio
Board of Trustees’ Consideration of Advisory And Sub-advisory Agreements—(Continued)
Portfolio’s contractual management fees were below the asset-weighted average of the Investment Classification/Morningstar Category selected by Broadridge at the Portfolio’s current size. The Board also noted that the Portfolio’s contractual sub-advisory fees were below the averages of the Sub-advised Expense Group and the Sub-advised Expense Universe at the Portfolio’s current size.
BHFTII-32
Brighthouse Funds Trust II
MFS Total Return Portfolio
Managed by Massachusetts Financial Services Company
Portfolio Manager Commentary*
PERFORMANCE
For the twelve months ended December 31, 2023, the Class A, B, E and F shares of the MFS Total Return Portfolio returned 10.40%, 10.13%, 10.24%, and 10.19%, respectively. The Portfolio’s benchmarks, the Standard & Poor’s (“S&P”) 500 Index¹ and the Bloomberg U.S. Aggregate Bond Index², returned 26.29% and 5.53%, respectively. A blend of the S&P 500 Index (60%) and the Bloomberg U.S. Aggregate Bond Index (40%) returned 17.67%.
MARKET ENVIRONMENT / CONDITIONS
During the reporting period, central banks around the world had to combat the strongest inflationary pressures in four decades, fueled by the global fiscal response to the pandemic, disrupted supply chains and dislocations to energy markets stemming from the war in Ukraine. Interest rates rose substantially, but the effects of tighter monetary policy may not be fully experienced yet, given that monetary policy works with long and variable lags. Strains resulting from the abrupt tightening of monetary policy began to affect some parts of the economy, most acutely among small and regional U.S. banks, which suffered from deposit flight as depositors sought higher yields on their savings. Additionally, activity in the U.S. housing sector slowed as a result of higher mortgage rates. China’s abandonment of its zero-COVID policy ushered in a brief uptick in economic activity in the world’s second-largest economy in early 2023, although its momentum soon stalled as the focus turned to the country’s highly indebted property development sector. In developed markets, consumer demand for services remained stronger than the demand for goods.
Early on, policymakers found themselves in the difficult position of trying to restrain inflation without tipping economies into recession. Despite the challenging macroeconomic and geopolitical environment, central banks focused on controlling price pressures while also confronting increasing financial stability concerns. Central banks had to juggle achieving their inflation mandates while using macroprudential tools to keep banking systems liquid, a potentially difficult balancing act, and one that suggested that we may be nearing a peak in policy rates. As inflationary pressures eased toward the end of the period, financial conditions loosened in anticipation of easier monetary policy, boosting the market’s appetite for risk. Rapid advancements in artificial intelligence were a focus for investors.
Normalizing supply chains, low levels of unemployment across developed markets and signs that inflation levels have peaked were supportive factors for the macroeconomic backdrop during the reporting period.
PORTFOLIO REVIEW / PERIOD END POSITIONING
The Portfolio underperformed its blended benchmark during the reporting period. Overall, the equity portion of the Portfolio notably underperformed the S&P 500 Index, while the fixed income portion outperformed the Bloomberg U.S. Aggregate Bond Index.
Within the equity portion of the Portfolio, an underweight position and stock selection within the Information Technology (“IT”) sector detracted from performance relative to the S&P 500 Index. Within this sector, an underweight position in software giant Microsoft and not owning shares of strong-performing computer graphics processor maker Nvidia and computer and personal electronics maker Apple weighed on relative results.
Stock selection and an overweight position in the Financials sector also hindered relative returns. Within this sector, the Portfolio’s overweight position in financial services provider Charles Schwab weighed on relative returns. Security selection and an underweight position in the Consumer Discretionary sector further dampened relative results. Here, not owning shares of strong performing internet retailer Amazon and electric vehicle manufacturer Tesla detracted from relative results.
Elsewhere, not owning shares of social networking service provider Meta Platforms and overweight positions in shares of global health services provider Cigna and building controls and systems supplier Johnson Controls International held back relative results. Additionally, the Portfolio’s holding of crop science and pharmaceuticals company Bayer (Germany) weakened relative performance.
Stock selection within the Industrials sector contributed to relative performance, led by overweight positions in leading diversified industrial manufacturer Eaton and home improvement products maker Masco. The Portfolio’s underweight position in the Real Estate sector further strengthened relative results. Security selection in the Materials sector also helped relative performance over the reporting period.
Stocks in other sectors that contributed to relative results included overweight positions in shares of semiconductor company Intel and semiconductor solutions provider NXP Semiconductors (Netherlands), and an underweight position in integrated energy company Chevron. Additionally, not owning shares of integrated oil and gas company ExxonMobil, health insurance and Medicare/Medicaid provider UnitedHealth Group, household products maker Procter & Gamble, electricity provider NextEra Energy, and global pharmaceutical company Bristol-Myers Squibb further benefited relative returns.
Within the fixed income portion of the Portfolio, an overweight in Agency Mortgage-Backed Securities (“MBS”) and security selection in the sector modestly weighed on relative returns. Additionally, the Portfolio’s duration and yield curve positioning incrementally detracted from relative returns during the period.
Conversely, an underweight exposure to U.S. Treasuries and overweight exposure to Investment Grade (“IG”) corporates contributed to relative performance. The Portfolio’s bond selection within Asset-Backed Securities (“ABS”) and IG corporates sectors further benefited relative results.
BHFTII-1
Brighthouse Funds Trust II
MFS Total Return Portfolio
Managed by Massachusetts Financial Services Company
Portfolio Manager Commentary*—(Continued)
At the end of December, the equity portion of the Portfolio had the largest overweight allocations in Financials and Industrials. In contrast, the largest underweight allocations were in IT and Consumer Discretionary. Over the trailing twelve months, the equity portion of the Portfolio increased its weighting in Industrials and Communication Services, while decreasing its exposure to Health Care and Consumer Staples.
The fixed income portion of the Portfolio ended the period approximately neutral duration relative to the Bloomberg U.S. Aggregate Bond Index. In terms of sector positioning, the Portfolio was underweight U.S. Treasuries in order to fund overweight positions in IG corporate bonds, ABS, Commercial Mortgage-Backed Securities (“CMBS”), and Agency MBS. Over the trailing twelve months, the fixed income portion of the Portfolio increased exposure to U.S. Treasuries, Agency MBS, and ABS, while decreasing exposure to IG corporate bonds, and CMBS.
The Portfolio utilized U.S. Treasury futures during the period for yield curve management purposes to ensure that overall Portfolio duration and yield curve positioning were consistent with the team’s views. At period end, U.S. Treasury futures used in the Portfolio were short the 10-year portion of the yield curve and long the 2-year, 5-year, 20-year and 30-year segments. Using U.S. Treasury futures instead of cash bonds to achieve this positioning allowed greater efficiency in modestly adjusting duration and yield positioning over the course of the year.
Steven Gorham
Alexander Mackey
Joshua Marston
Johnathan Munko
Portfolio Managers
Massachusetts Financial Services Company
* This commentary may include statements that constitute “forward-looking statements” under the U.S. securities laws. Forward-looking statements include, among other things, projections, estimates, and information about possible or future results related to the Portfolio, market or regulatory developments. The views expressed above are not guarantees of future performance or economic results and involve certain risks, uncertainties and assumptions that could cause actual outcomes and results to differ materially from the views expressed herein. The views expressed above are subject to change at any time based upon economic, market, or other conditions and the subadvisory firm undertakes no obligation to update the views expressed herein. Any discussions of specific securities should not be considered a recommendation to buy or sell those securities. The views expressed above (including any forward-looking statement) may not be relied upon as investment advice or as an indication of the Portfolio’s trading intent. Information about the Portfolio’s holdings, asset allocation or country diversification is historical and is not an indication of future Portfolio composition, which may vary. Direct investment in any index is not possible. The performance of any index mentioned in this commentary has not been adjusted for ongoing management, distribution and operating expenses, and sales charges applicable to mutual fund investments. In addition, the returns do not reflect additional fees charged by separate accounts or variable insurance contracts that an investor in the Portfolio may pay. If these additional fees were reflected, performance would have been lower.
¹ The S&P 500 Index is an unmanaged index consisting of 500 stocks chosen for market size, liquidity, and industry group representation. It is a market-weighted index (stock price times number of shares outstanding) with each stock’s weight in the Index proportionate to its market value.
² The Bloomberg U.S. Aggregate Bond Index is a broad-based benchmark that measures the investment grade, U.S. dollar-denominated, fixed-rate taxable bond market, including Treasuries, government-related and corporate securities, mortgage-backed securities, asset-backed securities, and commercial mortgage-backed securities.
BHFTII-2
Brighthouse Funds Trust II
MFS Total Return Portfolio
A $10,000 INVESTMENT COMPARED TO THE BLOOMBERG U.S. AGGREGATE BOND INDEX & THE S&P 500 INDEX & THE BLENDED INDEX
AVERAGE ANNUAL RETURNS (%) FOR THE YEAR ENDED DECEMBER 31, 2023
| 1 Year |
5 Year |
10 Year |
||||||||||
| MFS Total Return Portfolio |
||||||||||||
| Class A |
10.40 | 8.53 | 6.59 | |||||||||
| Class B |
10.13 | 8.26 | 6.33 | |||||||||
| Class E |
10.24 | 8.36 | 6.43 | |||||||||
|
Class F |
10.19 | 8.31 | 6.38 | |||||||||
| Bloomberg U.S. Aggregate Bond Index |
5.53 | 1.10 | 1.81 | |||||||||
| S&P 500 Index |
26.29 | 15.69 | 12.03 | |||||||||
| Blended Index |
17.67 | 9.98 | 8.09 | |||||||||
Portfolio performance is calculated including reinvestment of all income and capital gain distributions. Performance numbers are net of all Portfolio expenses but do not include any insurance, sales, separate account or administrative charges of variable annuity or life insurance contracts or any additional expenses that participants may bear relating to the operations of their plans. If these charges were included, the returns would be lower. The performance of any index referenced above has not been adjusted for ongoing management, distribution and operating expenses, and sales charges applicable to mutual fund investments. Direct investment in any index is not possible. The performance of Class A shares, as set forth in the line graph above, will differ from that of other classes because of the difference in expenses paid by policyholders investing in the different share classes.
This information represents past performance and is not indicative of future results. Investment return and principal value may fluctuate so that shares, upon redemption, may be worth more or less than the original cost.
PORTFOLIO COMPOSITION AS OF DECEMBER 31, 2023
Top Equity Sectors
| % of Net Assets |
||||
| Financials | 15.8 | |||
| Industrials | 9.3 | |||
| Health Care | 8.0 | |||
| Information Technology | 6.9 | |||
| Communication Services | 4.8 | |||
Top Fixed Income Sectors
| % of Net Assets |
||||
| Agency Mortgage-Backed Securities | 13.0 | |||
| Corporate Bonds & Notes | 12.7 | |||
| U.S. Treasury | 7.0 | |||
| Asset-Backed Securities | 4.8 | |||
| Non-Agency Mortgage-Backed Securities | 1.8 | |||
Top Equity Holdings
| % of Net Assets |
||||
| Goldman Sachs Group, Inc. | 2.4 | |||
| JPMorgan Chase & Co. | 2.1 | |||
| Charles Schwab Corp. | 1.9 | |||
| Comcast Corp. | 1.8 | |||
| Microsoft Corp. | 1.8 | |||
Top Fixed Income Issuers
| % of Net Assets |
||||
| Federal National Mortgage Association | 5.9 | |||
| U.S. Treasury Notes | 3.6 | |||
| Federal Home Loan Mortgage Corp. | 3.4 | |||
| U.S. Treasury Bonds | 3.4 | |||
| Government National Mortgage Association | 2.9 | |||
BHFTII-3
Brighthouse Funds Trust II
MFS Total Return Portfolio
Understanding Your Portfolio’s Expenses
Shareholder Expense Example
As a shareholder of the Portfolio, you incur ongoing costs, including management fees; distribution and service (12b-1) fees; and other Portfolio expenses. This example is intended to help you understand your ongoing costs (in dollars) (referred to as “expenses”) of investing in the Portfolio and compare these costs with the ongoing costs of investing in other mutual funds. The example is based on an investment of $1,000 invested at the beginning of the period and held for the entire period, July 1, 2023 through December 31, 2023.
Actual Expenses
The first line for each share class of the Portfolio in the table below provides information about actual account values and actual expenses. You may use the information in this line, together with the amount you invested in the particular share class of the Portfolio, to estimate the expenses that you paid over the period. Simply divide your account value by $1,000 (for example, an $8,600 account value divided by $1,000 = 8.6), then multiply the result by the number in the first line under the heading entitled “Expenses Paid During Period” to estimate the expenses you paid on your account during this period.
Hypothetical Example for Comparison Purposes
The second line for each share class of the Portfolio in the table below provides information about hypothetical account values and hypothetical expenses based on the Portfolio’s actual expense ratio and an assumed rate of return of 5% per year before expenses, which is not the Portfolio’s actual return. The hypothetical account values and expenses may not be used to estimate the actual ending account balance or expenses you paid for the period. You may use this information to compare the ongoing costs of investing in the Portfolio and other funds. To do so, compare this 5% hypothetical example with the 5% hypothetical examples that appear in the shareholder reports of the other funds.
Please note that the expenses shown in the table are meant to highlight your ongoing costs only and do not reflect any fees or charges of your variable insurance product or any additional expenses that participants in certain eligible qualified plans may bear relating to the operations of their plan. Therefore, the second line for each share class in the table is useful in comparing ongoing costs only, and will not help you determine the relative total costs of owning different funds. In addition, if these other costs were included, your costs would have been higher.
| MFS Total Return Portfolio |
Annualized Expense Ratio |
Beginning Account Value July 1, 2023 |
Ending Account Value December 31, 2023 |
Expenses Paid During Period** July 1, 2023 to December 31, 2023 |
||||||||||||||
| Class A (a) |
Actual | 0.63 | % | $ | 1,000.00 | $ | 1,058.30 | $ | 3.27 | |||||||||
| Hypothetical* | 0.63 | % | $ | 1,000.00 | $ | 1,022.03 | $ | 3.21 | ||||||||||
| Class B (a) |
Actual | 0.88 | % | $ | 1,000.00 | $ | 1,056.90 | $ | 4.56 | |||||||||
| Hypothetical* | 0.88 | % | $ | 1,000.00 | $ | 1,020.77 | $ | 4.48 | ||||||||||
| Class E (a) |
Actual | 0.78 | % | $ | 1,000.00 | $ | 1,057.50 | $ | 4.05 | |||||||||
| Hypothetical* | 0.78 | % | $ | 1,000.00 | $ | 1,021.27 | $ | 3.97 | ||||||||||
| Class F (a) |
Actual | 0.83 | % | $ | 1,000.00 | $ | 1,057.20 | $ | 4.30 | |||||||||
| Hypothetical* | 0.83 | % | $ | 1,000.00 | $ | 1,021.02 | $ | 4.23 | ||||||||||
| * | Hypothetical assumes a rate of return of 5% per year before expenses. |
| ** | Expenses paid are equal to the Portfolio’s annualized expense ratio for the most recent six month period, as shown above, multiplied by the average account value over the period, multiplied by the number of days (184 days) in the most recent fiscal half-year, divided by 365 (to reflect the one-half year period). |
| (a) | The annualized expense ratio shown reflects the impact of the management fee waiver as described in Note 6 of the Notes to Financial Statements. |
BHFTII-4
Brighthouse Funds Trust II
MFS Total Return Portfolio
Schedule of Investments as of December 31, 2023
Common Stocks—58.7% of Net Assets
| Security Description | Shares | Value | ||||||
| Aerospace & Defense—1.2% | ||||||||
| General Dynamics Corp. |
9,666 | $ | 2,509,970 | |||||
| Howmet Aerospace, Inc. |
27,467 | 1,486,514 | ||||||
| L3Harris Technologies, Inc. |
17,131 | 3,608,131 | ||||||
|
|
|
|||||||
| 7,604,615 | ||||||||
|
|
|
|||||||
| Automobile Components—1.3% | ||||||||
| Aptiv PLC (a) |
53,135 | 4,767,272 | ||||||
| Lear Corp. (b) |
21,497 | 3,035,592 | ||||||
|
|
|
|||||||
| 7,802,864 | ||||||||
|
|
|
|||||||
| Banks—4.7% | ||||||||
| Bank of America Corp. |
257,408 | 8,666,927 | ||||||
| JPMorgan Chase & Co. |
75,547 | 12,850,545 | ||||||
| PNC Financial Services Group, Inc. |
18,244 | 2,825,084 | ||||||
| Truist Financial Corp. |
123,111 | 4,545,258 | ||||||
|
|
|
|||||||
| 28,887,814 | ||||||||
|
|
|
|||||||
| Beverages—0.8% | ||||||||
| Constellation Brands, Inc. - Class A |
11,713 | 2,831,618 | ||||||
| Diageo PLC |
62,104 | 2,255,257 | ||||||
|
|
|
|||||||
| 5,086,875 | ||||||||
|
|
|
|||||||
| Building Products—2.5% | ||||||||
| Johnson Controls International PLC |
137,823 | 7,944,118 | ||||||
| Masco Corp. |
108,568 | 7,271,884 | ||||||
|
|
|
|||||||
| 15,216,002 | ||||||||
|
|
|
|||||||
| Capital Markets—7.0% | ||||||||
| Cboe Global Markets, Inc. |
15,425 | 2,754,288 | ||||||
| Charles Schwab Corp. |
170,360 | 11,720,768 | ||||||
| CME Group, Inc. |
10,474 | 2,205,824 | ||||||
| Goldman Sachs Group, Inc. |
37,860 | 14,605,252 | ||||||
| Invesco Ltd. |
74,145 | 1,322,747 | ||||||
| Morgan Stanley |
52,086 | 4,857,020 | ||||||
| Northern Trust Corp. |
69,345 | 5,851,331 | ||||||
|
|
|
|||||||
| 43,317,230 | ||||||||
|
|
|
|||||||
| Chemicals—1.9% | ||||||||
| Axalta Coating Systems Ltd. (a) |
115,948 | 3,938,754 | ||||||
| DuPont de Nemours, Inc. |
45,544 | 3,503,700 | ||||||
| PPG Industries, Inc. |
28,233 | 4,222,245 | ||||||
|
|
|
|||||||
| 11,664,699 | ||||||||
|
|
|
|||||||
| Construction Materials—0.2% | ||||||||
| Summit Materials, Inc. - Class A (a) |
31,736 | 1,220,567 | ||||||
|
|
|
|||||||
| Consumer Staples Distribution & Retail—0.2% | ||||||||
| Target Corp. (b) |
9,380 | 1,335,900 | ||||||
|
|
|
|||||||
| Distributors—0.6% | ||||||||
| LKQ Corp. |
82,265 | 3,931,444 | ||||||
|
|
|
|||||||
| Electric Utilities—2.3% | ||||||||
| Duke Energy Corp. |
43,574 | 4,228,421 | ||||||
| Exelon Corp. |
61,863 | 2,220,882 | ||||||
| PG&E Corp. |
225,915 | 4,073,247 | ||||||
| Southern Co. |
50,634 | 3,550,456 | ||||||
|
|
|
|||||||
| 14,073,006 | ||||||||
|
|
|
|||||||
| Electrical Equipment—2.2% | ||||||||
| Eaton Corp. PLC |
38,692 | 9,317,807 | ||||||
| Regal Rexnord Corp. |
28,549 | 4,225,823 | ||||||
|
|
|
|||||||
| 13,543,630 | ||||||||
|
|
|
|||||||
| Entertainment—0.5% | ||||||||
| Electronic Arts, Inc. |
9,658 | 1,321,311 | ||||||
| Warner Bros Discovery, Inc. (a) |
154,671 | 1,760,156 | ||||||
|
|
|
|||||||
| 3,081,467 | ||||||||
|
|
|
|||||||
| Financial Services—1.0% | ||||||||
| Fidelity National Information Services, Inc. |
41,164 | 2,472,721 | ||||||
| Fiserv, Inc. (a) |
26,244 | 3,486,253 | ||||||
|
|
|
|||||||
| 5,958,974 | ||||||||
|
|
|
|||||||
| Food Products—0.4% | ||||||||
| Archer-Daniels-Midland Co. (b) |
23,355 | 1,686,698 | ||||||
| J.M. Smucker Co. |
8,183 | 1,034,168 | ||||||
|
|
|
|||||||
| 2,720,866 | ||||||||
|
|
|
|||||||
| Ground Transportation—1.1% | ||||||||
| Union Pacific Corp. |
28,155 | 6,915,431 | ||||||
|
|
|
|||||||
| Health Care Equipment & Supplies—1.7% | ||||||||
| Becton Dickinson & Co. |
12,893 | 3,143,700 | ||||||
| Boston Scientific Corp. (a) |
37,380 | 2,160,938 | ||||||
| Medtronic PLC |
66,370 | 5,467,561 | ||||||
|
|
|
|||||||
| 10,772,199 | ||||||||
|
|
|
|||||||
| Health Care Providers & Services—2.5% | ||||||||
| Cigna Group |
32,077 | 9,605,458 | ||||||
| McKesson Corp. |
12,399 | 5,740,489 | ||||||
|
|
|
|||||||
| 15,345,947 | ||||||||
|
|
|
|||||||
| Hotels, Restaurants & Leisure—0.5% | ||||||||
| Booking Holdings, Inc. (a) |
477 | 1,692,024 | ||||||
| Wendy’s Co. |
62,788 | 1,223,110 | ||||||
|
|
|
|||||||
| 2,915,134 | ||||||||
|
|
|
|||||||
| Industrial Conglomerates—0.6% | ||||||||
| Honeywell International, Inc. |
18,245 | 3,826,159 | ||||||
|
|
|
|||||||
| Insurance—3.2% | ||||||||
| Aon PLC - Class A |
20,424 | 5,943,792 | ||||||
| Chubb Ltd. |
27,369 | 6,185,394 | ||||||
| Travelers Cos., Inc. |
13,794 | 2,627,619 | ||||||
See accompanying notes to financial statements.
BHFTII-5
Brighthouse Funds Trust II
MFS Total Return Portfolio
Schedule of Investments as of December 31, 2023
Common Stocks—(Continued)
| Security Description | Shares |
Value | ||||||
| Insurance—(Continued) | ||||||||
| Willis Towers Watson PLC |
21,584 | $ | 5,206,061 | |||||
|
|
|
|||||||
| 19,962,866 | ||||||||
|
|
|
|||||||
| Interactive Media & Services—1.0% | ||||||||
| Alphabet, Inc. - Class A (a) |
45,553 | 6,363,299 | ||||||
|
|
|
|||||||
| IT Services—1.3% | ||||||||
| Accenture PLC - Class A |
10,318 | 3,620,689 | ||||||
| Amdocs Ltd. |
26,213 | 2,303,861 | ||||||
| Cognizant Technology Solutions Corp. - Class A |
31,076 | 2,347,170 | ||||||
|
|
|
|||||||
| 8,271,720 | ||||||||
|
|
|
|||||||
| Life Sciences Tools & Services—0.5% | ||||||||
| ICON PLC (a) |
10,995 | 3,112,355 | ||||||
|
|
|
|||||||
| Machinery—1.1% | ||||||||
| Ingersoll Rand, Inc. |
49,108 | 3,798,013 | ||||||
| Stanley Black & Decker, Inc. |
32,202 | 3,159,016 | ||||||
|
|
|
|||||||
| 6,957,029 | ||||||||
|
|
|
|||||||
| Media—2.5% | ||||||||
| Comcast Corp. - Class A |
253,848 | 11,131,235 | ||||||
| Omnicom Group, Inc. (b) |
47,297 | 4,091,663 | ||||||
|
|
|
|||||||
| 15,222,898 | ||||||||
|
|
|
|||||||
| Metals & Mining—0.2% | ||||||||
| Glencore PLC |
241,832 | 1,450,808 | ||||||
|
|
|
|||||||
| Multi-Utilities—0.5% | ||||||||
| Dominion Energy, Inc. |
30,429 | 1,430,163 | ||||||
| National Grid PLC |
144,332 | 1,948,819 | ||||||
|
|
|
|||||||
| 3,378,982 | ||||||||
|
|
|
|||||||
| Oil, Gas & Consumable Fuels—3.6% | ||||||||
| Chevron Corp. (b) |
12,071 | 1,800,510 | ||||||
| ConocoPhillips |
67,893 | 7,880,341 | ||||||
| Hess Corp. |
39,814 | 5,739,586 | ||||||
| Pioneer Natural Resources Co. |
14,800 | 3,328,224 | ||||||
| Suncor Energy, Inc. |
108,843 | 3,486,952 | ||||||
|
|
|
|||||||
| 22,235,613 | ||||||||
|
|
|
|||||||
| Personal Care Products—0.5% | ||||||||
| Kenvue, Inc. |
147,244 | 3,170,163 | ||||||
|
|
|
|||||||
| Pharmaceuticals—3.2% | ||||||||
| Bayer AG |
79,633 | 2,956,280 | ||||||
| Johnson & Johnson |
47,318 | 7,416,623 | ||||||
| Organon & Co. (b) |
42,277 | 609,634 | ||||||
| Pfizer, Inc. |
206,937 | 5,957,716 | ||||||
| Roche Holding AG |
11,177 | 3,239,454 | ||||||
|
|
|
|||||||
| 20,179,707 | ||||||||
|
|
|
|||||||
| Professional Services—0.6% | ||||||||
| Dun & Bradstreet Holdings, Inc. |
298,244 | 3,489,455 | ||||||
|
|
|
|||||||
| Semiconductors & Semiconductor Equipment—3.1% | ||||||||
| Analog Devices, Inc. (b) |
7,422 | 1,473,712 | ||||||
| Applied Materials, Inc. |
16,683 | 2,703,814 | ||||||
| Intel Corp. |
129,923 | 6,528,631 | ||||||
| NXP Semiconductors NV |
26,464 | 6,078,251 | ||||||
| Taiwan Semiconductor Manufacturing Co. Ltd. (ADR) (b) |
23,334 | 2,426,736 | ||||||
|
|
|
|||||||
| 19,211,144 | ||||||||
|
|
|
|||||||
| Software—2.1% | ||||||||
| Microsoft Corp. |
29,523 | 11,101,829 | ||||||
| Oracle Corp. |
20,213 | 2,131,056 | ||||||
|
|
|
|||||||
| 13,232,885 | ||||||||
|
|
|
|||||||
| Technology Hardware, Storage & Peripherals—0.1% | ||||||||
| Seagate Technology Holdings PLC (b) |
8,210 | 700,888 | ||||||
|
|
|
|||||||
| Tobacco—1.2% | ||||||||
| Altria Group, Inc. |
41,409 | 1,670,439 | ||||||
| Philip Morris International, Inc. |
61,460 | 5,782,157 | ||||||
|
|
|
|||||||
| 7,452,596 | ||||||||
|
|
|
|||||||
| Wireless Telecommunication Services—0.8% | ||||||||
| T-Mobile U.S., Inc. |
32,071 | 5,141,943 | ||||||
|
|
|
|||||||
| Total Common Stocks |
364,755,174 | |||||||
|
|
|
|||||||
| U.S. Treasury & Government Agencies—20.0% |
| |||||||
| Agency Sponsored Mortgage - Backed—13.0% | ||||||||
| Federal Home Loan Mortgage Corp. | ||||||||
| 1.500%, 03/01/51 |
106,153 | 83,113 | ||||||
| 1.500%, 10/01/51 |
171,895 | 133,992 | ||||||
| 2.000%, 04/01/37 |
447,072 | 400,675 | ||||||
| 2.000%, 02/01/42 |
457,477 | 390,615 | ||||||
| 2.000%, 12/01/50 |
97,311 | 79,901 | ||||||
| 2.000%, 08/01/51 |
496,146 | 406,392 | ||||||
| 2.000%, 11/01/51 |
226,875 | 185,621 | ||||||
| 2.000%, 02/01/52 |
1,031,880 | 846,856 | ||||||
| 2.000%, 03/01/52 |
2,176,166 | 1,778,268 | ||||||
| 2.500%, 04/01/37 |
190,643 | 175,499 | ||||||
| 2.500%, 04/01/48 |
61,193 | 53,258 | ||||||
| 2.500%, 02/01/51 |
165,145 | 140,460 | ||||||
| 2.500%, 09/01/51 |
34,540 | 29,376 | ||||||
| 2.500%, 10/01/51 |
280,668 | 240,930 | ||||||
| 2.500%, 12/01/51 |
2,379,935 | 2,025,994 | ||||||
| 2.500%, 03/01/52 |
232,777 | 198,054 | ||||||
| 2.500%, 04/01/52 |
531,207 | 452,046 | ||||||
| 2.500%, 05/01/52 |
1,725,403 | 1,468,232 | ||||||
| 2.500%, 06/01/52 |
220,982 | 188,046 | ||||||
| 2.500%, 09/01/52 |
60,809 | 51,751 | ||||||
| 3.000%, 01/01/38 |
183,567 | 170,288 | ||||||
See accompanying notes to financial statements.
BHFTII-6
Brighthouse Funds Trust II
MFS Total Return Portfolio
Schedule of Investments as of December 31, 2023
U.S. Treasury & Government Agencies—(Continued)
| Security Description | Principal Amount* |
Value | ||||||
| Agency Sponsored Mortgage - Backed—(Continued) | ||||||||
| Federal Home Loan Mortgage Corp. | ||||||||
| 3.000%, 10/01/42 |
208,455 | $ | 191,769 | |||||
| 3.000%, 04/01/43 |
555,898 | 511,648 | ||||||
| 3.000%, 05/01/43 |
471,419 | 433,889 | ||||||
| 3.000%, 05/01/46 |
188,729 | 172,465 | ||||||
| 3.000%, 10/01/46 |
442,098 | 402,398 | ||||||
| 3.000%, 11/01/46 |
459,210 | 418,334 | ||||||
| 3.000%, 03/01/48 |
38,902 | 35,030 | ||||||
| 3.000%, 07/01/50 |
18,128 | 16,321 | ||||||
| 3.000%, 01/01/52 |
320,574 | 283,677 | ||||||
| 3.000%, 04/01/52 |
162,832 | 144,131 | ||||||
| 3.000%, 05/01/52 |
363,334 | 321,285 | ||||||
| 3.000%, 06/01/52 |
795,226 | 703,544 | ||||||
| 3.500%, 11/01/37 |
126,958 | 121,093 | ||||||
| 3.500%, 02/01/42 |
185,540 | 175,700 | ||||||
| 3.500%, 04/01/42 |
122,530 | 116,341 | ||||||
| 3.500%, 12/01/42 |
321,291 | 304,432 | ||||||
| 3.500%, 04/01/43 |
51,665 | 49,000 | ||||||
| 3.500%, 07/01/43 |
15,911 | 14,988 | ||||||
| 3.500%, 08/01/43 |
193,128 | 181,486 | ||||||
| 3.500%, 12/01/45 |
105,957 | 99,021 | ||||||
| 3.500%, 12/01/46 |
511,423 | 477,474 | ||||||
| 3.500%, 05/01/52 |
98,897 | 91,881 | ||||||
| 3.500%, 02/01/53 |
472,337 | 433,271 | ||||||
| 4.000%, 08/01/37 |
33,895 | 33,103 | ||||||
| 4.000%, 11/01/40 |
151,841 | 148,283 | ||||||
| 4.000%, 01/01/41 |
329,689 | 321,520 | ||||||
| 4.000%, 04/01/44 |
114,994 | 111,018 | ||||||
| 4.000%, 08/01/47 |
186,663 | 178,498 | ||||||
| 4.000%, 10/01/52 |
1,189,080 | 1,124,603 | ||||||
| 4.500%, 08/01/24 |
3,277 | 3,262 | ||||||
| 4.500%, 04/01/35 |
13,006 | 13,058 | ||||||
| 4.500%, 06/01/38 |
238,372 | 237,050 | ||||||
| 4.500%, 07/01/39 |
57,441 | 57,425 | ||||||
| 4.500%, 09/01/39 |
31,573 | 31,570 | ||||||
| 4.500%, 10/01/39 |
17,923 | 17,923 | ||||||
| 4.500%, 12/01/39 |
28,788 | 28,792 | ||||||
| 4.500%, 05/01/42 |
52,384 | 52,390 | ||||||
| 4.500%, 10/01/52 |
485,983 | 471,237 | ||||||
| 5.000%, 09/01/33 |
49,575 | 50,447 | ||||||
| 5.000%, 03/01/34 |
16,442 | 16,731 | ||||||
| 5.000%, 04/01/34 |
9,269 | 9,432 | ||||||
| 5.000%, 08/01/35 |
10,668 | 10,856 | ||||||
| 5.000%, 10/01/35 |
32,226 | 32,747 | ||||||
| 5.000%, 11/01/35 |
19,561 | 19,907 | ||||||
| 5.000%, 12/01/36 |
13,406 | 13,642 | ||||||
| 5.000%, 07/01/39 |
91,994 | 93,619 | ||||||
| 5.000%, 08/01/52 |
522,944 | 518,029 | ||||||
| 5.000%, 02/01/53 |
743,957 | 736,442 | ||||||
| 5.000%, 09/01/53 |
98,085 | 97,036 | ||||||
| 5.500%, 12/01/33 |
66,119 | 68,183 | ||||||
| 5.500%, 01/01/34 |
44,020 | 45,395 | ||||||
| 5.500%, 04/01/34 |
7,992 | 8,241 | ||||||
| 5.500%, 11/01/34 |
8,379 | 8,598 | ||||||
| 5.500%, 05/01/35 |
13,287 | 13,703 | ||||||
| 5.500%, 09/01/35 |
12,635 | 12,965 | ||||||
| Agency Sponsored Mortgage - Backed—(Continued) | ||||||||
| Federal Home Loan Mortgage Corp. | ||||||||
| 5.500%, 10/01/35 |
15,829 | 16,242 | ||||||
| 5.500%, 03/01/53 |
495,379 | 498,237 | ||||||
| 5.500%, 04/01/53 |
190,182 | 193,536 | ||||||
| 6.000%, 04/01/34 |
32,247 | 33,545 | ||||||
| 6.000%, 07/01/34 |
15,652 | 16,195 | ||||||
| 6.000%, 08/01/34 |
87,536 | 91,280 | ||||||
| 6.000%, 09/01/34 |
1,938 | 1,995 | ||||||
| 6.000%, 07/01/35 |
11,771 | 12,312 | ||||||
| 6.000%, 08/01/35 |
14,624 | 15,297 | ||||||
| 6.000%, 11/01/35 |
15,885 | 16,616 | ||||||
| 6.000%, 03/01/36 |
12,558 | 12,945 | ||||||
| 6.000%, 10/01/36 |
7,071 | 7,344 | ||||||
| 6.000%, 05/01/37 |
31,027 | 32,562 | ||||||
| 6.000%, 06/01/37 |
9,628 | 10,019 | ||||||
| 6.000%, 12/01/52 |
98,875 | 101,946 | ||||||
| 6.500%, 05/01/34 |
7,394 | 7,711 | ||||||
| 6.500%, 06/01/34 |
22,027 | 22,984 | ||||||
| 6.500%, 08/01/34 |
11,685 | 12,118 | ||||||
| 6.500%, 10/01/34 |
21,588 | 22,349 | ||||||
| 6.500%, 11/01/34 |
32,965 | 34,416 | ||||||
| 6.500%, 05/01/37 |
13,792 | 14,441 | ||||||
| 6.500%, 07/01/37 |
14,559 | 15,330 | ||||||
| Federal Home Loan Mortgage Corp. Multifamily Structured Pass-Through Certificates |
||||||||
| 0.195%, 11/25/27 (c) (d) |
5,207,000 | 40,730 | ||||||
| 0.247%, 12/25/27 (c) (d) |
3,235,000 | 30,928 | ||||||
| 0.275%, 11/25/24 (c) (d) |
4,908,000 | 13,416 | ||||||
| 0.279%, 09/25/27 (c) (d) |
3,341,000 | 34,377 | ||||||
| 0.284%, 11/25/27 (c) (d) |
3,580,123 | 32,906 | ||||||
| 0.290%, 12/25/27 (c) (d) |
3,579,000 | 40,321 | ||||||
| 0.294%, 11/25/32 (c) (d) |
2,615,970 | 48,422 | ||||||
| 0.324%, 11/25/27 (c) (d) |
3,234,280 | 35,177 | ||||||
| 0.327%, 08/25/27 (c) (d) |
3,107,000 | 37,574 | ||||||
| 0.328%, 01/25/31 (c) (d) |
1,567,996 | 27,682 | ||||||
| 0.339%, 10/25/24 (c) (d) |
5,580,641 | 9,040 | ||||||
| 0.349%, 11/25/31 (c) (d) |
2,325,421 | 53,529 | ||||||
| 0.365%, 12/25/27 (c) (d) |
5,502,088 | 71,271 | ||||||
| 0.391%, 08/25/24 (c) (d) |
4,897,000 | 15,142 | ||||||
| 0.419%, 08/25/27 (c) (d) |
2,023,315 | 26,814 | ||||||
| 0.460%, 08/25/24 (c) (d) |
6,852,472 | 16,639 | ||||||
| 0.498%, 12/25/31 (c) (d) |
2,074,891 | 66,768 | ||||||
| 0.508%, 08/25/31 (c) (d) |
484,121 | 15,209 | ||||||
| 0.511%, 07/25/24 (c) (d) |
4,483,000 | 12,711 | ||||||
| 0.515%, 03/25/31 (c) (d) |
1,257,393 | 36,594 | ||||||
| 0.536%, 09/25/31 (c) (d) |
1,578,796 | 52,869 | ||||||
| 0.568%, 12/25/31 (c) (d) |
3,517,256 | 126,870 | ||||||
| 0.570%, 07/25/27 (c) (d) |
3,729,333 | 63,317 | ||||||
| 0.602%, 07/25/24 (c) (d) |
1,098,493 | 2,161 | ||||||
| 0.639%, 06/25/27 (c) (d) |
4,356,000 | 95,673 | ||||||
| 0.732%, 03/25/31 (c) (d) |
539,591 | 24,072 | ||||||
| 0.745%, 06/25/27 (c) (d) |
1,423,605 | 29,933 | ||||||
| 0.781%, 01/25/31 (c) (d) |
658,188 | 30,261 | ||||||
| 0.856%, 09/25/31 (c) (d) |
453,515 | 24,069 | ||||||
| 0.905%, 04/25/24 (c) (d) |
988,370 | 1,244 | ||||||
| 0.936%, 01/25/31 (c) (d) |
441,180 | 24,065 | ||||||
See accompanying notes to financial statements.
BHFTII-7
Brighthouse Funds Trust II
MFS Total Return Portfolio
Schedule of Investments as of December 31, 2023
U.S. Treasury & Government Agencies—(Continued)
| Security Description | Principal Amount* |
Value | ||||||
| Agency Sponsored Mortgage - Backed—(Continued) | ||||||||
| Federal Home Loan Mortgage Corp. Multifamily Structured Pass-Through Certificates |
||||||||
| 0.938%, 07/25/31 (c) (d) |
361,575 | $ | 21,110 | |||||
| 1.081%, 11/25/30 (c) (d) |
400,945 | 24,980 | ||||||
| 1.091%, 07/25/29 (c) (d) |
255,071 | 12,595 | ||||||
| 1.142%, 08/25/29 (c) (d) |
1,578,470 | 82,253 | ||||||
| 1.170%, 09/25/30 (c) (d) |
229,735 | 15,022 | ||||||
| 1.216%, 05/25/31 (c) (d) |
240,722 | 17,614 | ||||||
| 1.342%, 06/25/30 (c) (d) |
396,103 | 28,823 | ||||||
| 1.600%, 08/25/30 (c) (d) |
357,560 | 31,592 | ||||||
| 1.665%, 05/25/30 (c) (d) |
384,386 | 34,258 | ||||||
| 1.798%, 05/25/30 (c) (d) |
1,002,928 | 94,760 | ||||||
| 1.799%, 04/25/30 (c) (d) |
300,000 | 28,693 | ||||||
| 1.868%, 04/25/30 (c) (d) |
808,011 | 77,811 | ||||||
| Federal Home Loan Mortgage Corp. REMICS | ||||||||
| 3.000%, 07/15/39 |
33,516 | 31,650 | ||||||
| 3.500%, 08/15/42 |
134,358 | 125,236 | ||||||
| 4.500%, 12/15/40 (d) |
8,866 | 713 | ||||||
| 5.000%, 01/15/40 |
45,181 | 45,512 | ||||||
| 5.500%, 02/15/36 (d) |
15,388 | 2,757 | ||||||
| Federal National Mortgage Association | ||||||||
| 1.500%, 02/01/42 |
31,279 | 25,921 | ||||||
| 1.500%, 09/01/51 |
959,371 | 747,783 | ||||||
| 1.500%, 10/01/51 |
495,809 | 386,199 | ||||||
| 2.000%, 10/01/36 |
218,432 | 197,041 | ||||||
| 2.000%, 11/01/36 |
205,558 | 184,225 | ||||||
| 2.000%, 12/01/36 |
75,781 | 67,917 | ||||||
| 2.000%, 03/01/37 |
26,594 | 23,834 | ||||||
| 2.000%, 04/01/37 |
212,583 | 190,521 | ||||||
| 2.000%, 05/01/37 |
2,664,925 | 2,388,360 | ||||||
| 2.000%, 02/01/42 |
670,853 | 572,921 | ||||||
| 2.000%, 03/01/42 |
419,551 | 358,173 | ||||||
| 2.000%, 04/01/42 |
700,276 | 597,832 | ||||||
| 2.000%, 08/01/50 |
217,295 | 178,797 | ||||||
| 2.000%, 01/01/51 |
49,636 | 41,052 | ||||||
| 2.000%, 02/01/51 |
81,591 | 67,856 | ||||||
| 2.000%, 04/01/51 |
181,532 | 149,041 | ||||||
| 2.000%, 10/01/51 |
73,117 | 59,863 | ||||||
| 2.000%, 12/01/51 |
3,962,713 | 3,242,619 | ||||||
| 2.000%, 02/01/52 |
378,962 | 310,032 | ||||||
| 2.000%, 03/01/52 |
2,099,191 | 1,715,702 | ||||||
| 2.000%, 04/01/52 |
784,807 | 642,960 | ||||||
| 2.000%, 07/01/52 |
113,972 | 93,194 | ||||||
| 2.500%, 11/01/31 |
16,815 | 15,855 | ||||||
| 2.500%, 10/01/36 |
117,275 | 108,001 | ||||||
| 2.500%, 07/01/37 |
253,739 | 234,366 | ||||||
| 2.500%, 03/01/42 |
324,086 | 288,166 | ||||||
| 2.500%, 04/01/42 |
509,146 | 449,240 | ||||||
| 2.500%, 01/01/50 |
474,334 | 407,005 | ||||||
| 2.500%, 02/01/50 |
180,849 | 155,994 | ||||||
| 2.500%, 03/01/50 |
261,913 | 224,734 | ||||||
| 2.500%, 06/01/50 |
36,412 | 31,568 | ||||||
| 2.500%, 07/01/50 |
362,746 | 314,812 | ||||||
| 2.500%, 10/01/50 |
324,345 | 281,034 | ||||||
| 2.500%, 05/01/51 |
935,478 | 796,676 | ||||||
| 2.500%, 06/01/51 |
694,535 | 590,766 | ||||||
| Agency Sponsored Mortgage - Backed—(Continued) | ||||||||
| Federal National Mortgage Association | ||||||||
| 2.500%, 08/01/51 |
118,899 | 101,888 | ||||||
| 2.500%, 10/01/51 |
46,742 | 39,759 | ||||||
| 2.500%, 12/01/51 |
1,051,205 | 899,288 | ||||||
| 2.500%, 01/01/52 |
1,129,252 | 967,298 | ||||||
| 2.500%, 02/01/52 |
260,073 | 221,351 | ||||||
| 2.500%, 03/01/52 |
607,386 | 522,360 | ||||||
| 2.500%, 04/01/52 |
688,833 | 586,253 | ||||||
| 2.500%, 05/01/52 |
1,060,034 | 901,582 | ||||||
| 2.500%, 06/01/52 |
23,246 | 19,780 | ||||||
| 3.000%, 11/01/28 |
37,523 | 36,260 | ||||||
| 3.000%, 09/01/30 |
25,680 | 24,654 | ||||||
| 3.000%, 12/01/31 |
411,461 | 394,244 | ||||||
| 3.000%, 08/01/33 |
17,026 | 16,211 | ||||||
| 3.000%, 10/01/33 |
403,681 | 384,349 | ||||||
| 3.000%, 12/01/33 |
36,241 | 34,506 | ||||||
| 3.000%, 07/01/37 |
54,907 | 50,928 | ||||||
| 3.000%, 11/01/37 |
95,208 | 88,296 | ||||||
| 3.000%, 09/01/46 |
81,839 | 74,504 | ||||||
| 3.000%, 04/01/51 |
24,079 | 21,322 | ||||||
| 3.000%, 06/01/51 |
108,283 | 97,255 | ||||||
| 3.000%, 12/01/51 |
645,971 | 575,893 | ||||||
| 3.000%, 01/01/52 |
297,710 | 267,063 | ||||||
| 3.000%, 03/01/52 |
1,143,303 | 1,011,597 | ||||||
| 3.000%, 05/01/52 |
593,822 | 525,393 | ||||||
| 3.000%, 07/01/52 |
374,045 | 330,806 | ||||||
| 3.000%, 08/01/52 |
331,728 | 293,381 | ||||||
| 3.000%, 09/01/52 |
24,688 | 21,848 | ||||||
| 3.500%, 04/01/38 |
90,427 | 85,781 | ||||||
| 3.500%, 11/01/41 |
25,408 | 24,040 | ||||||
| 3.500%, 01/01/42 |
235,243 | 222,833 | ||||||
| 3.500%, 01/01/43 |
83,984 | 79,107 | ||||||
| 3.500%, 04/01/43 |
280,253 | 263,742 | ||||||
| 3.500%, 05/01/43 |
234,947 | 221,207 | ||||||
| 3.500%, 07/01/43 |
334,720 | 314,448 | ||||||
| 3.500%, 08/01/43 |
132,373 | 124,794 | ||||||
| 3.500%, 09/01/43 |
487,221 | 457,912 | ||||||
| 3.500%, 02/01/45 |
395,886 | 371,842 | ||||||
| 3.500%, 09/01/45 |
327,673 | 305,812 | ||||||
| 3.500%, 10/01/45 |
271,821 | 254,861 | ||||||
| 3.500%, 01/01/46 |
100,004 | 93,824 | ||||||
| 3.500%, 05/01/46 |
101,277 | 94,964 | ||||||
| 3.500%, 07/01/46 |
342,924 | 321,546 | ||||||
| 3.500%, 05/01/52 |
162,957 | 150,059 | ||||||
| 3.500%, 02/01/53 |
39,566 | 36,298 | ||||||
| 4.000%, 09/01/40 |
245,208 | 239,130 | ||||||
| 4.000%, 11/01/40 |
70,921 | 69,164 | ||||||
| 4.000%, 12/01/40 |
163,565 | 158,683 | ||||||
| 4.000%, 02/01/41 |
88,746 | 86,545 | ||||||
| 4.000%, 06/01/41 |
160,835 | 156,003 | ||||||
| 4.000%, 11/01/41 |
71,839 | 69,970 | ||||||
| 4.000%, 01/01/42 |
481,400 | 468,271 | ||||||
| 4.000%, 04/01/42 |
47,361 | 46,083 | ||||||
| 4.000%, 10/01/42 |
56,810 | 55,279 | ||||||
| 4.000%, 12/01/42 |
60,800 | 59,160 | ||||||
| 4.000%, 01/01/43 |
76,558 | 74,459 | ||||||
See accompanying notes to financial statements.
BHFTII-8
Brighthouse Funds Trust II
MFS Total Return Portfolio
Schedule of Investments as of December 31, 2023
U.S. Treasury & Government Agencies—(Continued)
| Security Description | Principal Amount* |
Value | ||||||
| Agency Sponsored Mortgage - Backed—(Continued) | ||||||||
| Federal National Mortgage Association | ||||||||
| 4.000%, 04/01/43 |
15,582 | $ | 15,157 | |||||
| 4.000%, 05/01/43 |
137,365 | 133,618 | ||||||
| 4.000%, 06/01/43 |
65,231 | 63,467 | ||||||
| 4.000%, 07/01/43 |
52,005 | 50,490 | ||||||
| 4.000%, 04/01/44 |
39,530 | 38,452 | ||||||
| 4.000%, 05/01/44 |
132,578 | 128,962 | ||||||
| 4.000%, 11/01/44 |
46,645 | 44,969 | ||||||
| 4.000%, 06/01/47 |
158,781 | 153,641 | ||||||
| 4.500%, 08/01/33 |
44,291 | 44,397 | ||||||
| 4.500%, 03/01/34 |
123,619 | 123,991 | ||||||
| 4.500%, 06/01/38 |
229,662 | 228,387 | ||||||
| 4.500%, 01/01/40 |
36,533 | 36,417 | ||||||
| 4.500%, 08/01/40 |
10,705 | 10,681 | ||||||
| 4.500%, 02/01/41 |
67,592 | 67,505 | ||||||
| 4.500%, 04/01/41 |
135,375 | 135,200 | ||||||
| 4.500%, 11/01/42 |
32,786 | 32,743 | ||||||
| 4.500%, 01/01/43 |
84,837 | 84,728 | ||||||
| 4.500%, 04/01/44 |
524,031 | 523,355 | ||||||
| 4.500%, 06/01/44 |
48,085 | 47,074 | ||||||
| 4.500%, 09/01/52 |
432,603 | 420,471 | ||||||
| 5.000%, 03/01/26 |
73,459 | 73,967 | ||||||
| 5.000%, 11/01/33 |
25,488 | 25,899 | ||||||
| 5.000%, 03/01/34 |
21,857 | 22,210 | ||||||
| 5.000%, 05/01/34 |
6,710 | 6,818 | ||||||
| 5.000%, 08/01/34 |
8,375 | 8,510 | ||||||
| 5.000%, 09/01/34 |
34,073 | 34,622 | ||||||
| 5.000%, 06/01/35 |
24,364 | 24,758 | ||||||
| 5.000%, 07/01/35 |
67,625 | 68,717 | ||||||
| 5.000%, 08/01/35 |
21,679 | 22,029 | ||||||
| 5.000%, 09/01/35 |
13,796 | 14,019 | ||||||
| 5.000%, 10/01/35 |
58,080 | 59,019 | ||||||
| 5.000%, 07/01/39 |
27,339 | 27,782 | ||||||
| 5.000%, 10/01/39 |
34,370 | 34,919 | ||||||
| 5.000%, 11/01/39 |
16,724 | 16,995 | ||||||
| 5.000%, 11/01/40 |
29,268 | 29,707 | ||||||
| 5.000%, 03/01/41 |
23,354 | 23,704 | ||||||
| 5.000%, 02/01/53 |
397,839 | 393,793 | ||||||
| 5.500%, 02/01/33 |
1,620 | 1,669 | ||||||
| 5.500%, 05/01/33 |
1,289 | 1,321 | ||||||
| 5.500%, 06/01/33 |
50,110 | 51,299 | ||||||
| 5.500%, 07/01/33 |
41,084 | 42,306 | ||||||
| 5.500%, 11/01/33 |
25,349 | 26,104 | ||||||
| 5.500%, 01/01/34 |
22,936 | 23,526 | ||||||
| 5.500%, 02/01/34 |
35,195 | 36,185 | ||||||
| 5.500%, 03/01/34 |
14,709 | 15,059 | ||||||
| 5.500%, 04/01/34 |
16,249 | 16,652 | ||||||
| 5.500%, 05/01/34 |
82,272 | 84,721 | ||||||
| 5.500%, 06/01/34 |
129,616 | 133,476 | ||||||
| 5.500%, 07/01/34 |
28,754 | 29,443 | ||||||
| 5.500%, 09/01/34 |
131,892 | 135,538 | ||||||
| 5.500%, 10/01/34 |
118,790 | 122,064 | ||||||
| 5.500%, 11/01/34 |
170,690 | 175,775 | ||||||
| 5.500%, 12/01/34 |
53,708 | 54,750 | ||||||
| 5.500%, 01/01/35 |
97,028 | 99,921 | ||||||
| 5.500%, 04/01/35 |
27,413 | 28,230 | ||||||
| Agency Sponsored Mortgage - Backed—(Continued) | ||||||||
| Federal National Mortgage Association | ||||||||
| 5.500%, 07/01/35 |
6,936 | 7,143 | ||||||
| 5.500%, 09/01/35 |
67,539 | 69,553 | ||||||
| 5.500%, 11/01/52 |
1,485,811 | 1,495,283 | ||||||
| 5.500%, 11/01/53 |
518,253 | 520,348 | ||||||
| 6.000%, 02/01/32 |
30,888 | 31,859 | ||||||
| 6.000%, 03/01/34 |
8,944 | 9,272 | ||||||
| 6.000%, 04/01/34 |
86,168 | 89,426 | ||||||
| 6.000%, 06/01/34 |
78,326 | 81,573 | ||||||
| 6.000%, 07/01/34 |
50,338 | 52,369 | ||||||
| 6.000%, 08/01/34 |
75,019 | 77,950 | ||||||
| 6.000%, 10/01/34 |
41,340 | 42,649 | ||||||
| 6.000%, 11/01/34 |
16,762 | 17,404 | ||||||
| 6.000%, 12/01/34 |
6,562 | 6,808 | ||||||
| 6.000%, 08/01/35 |
4,930 | 5,103 | ||||||
| 6.000%, 09/01/35 |
13,283 | 13,836 | ||||||
| 6.000%, 10/01/35 |
32,306 | 33,634 | ||||||
| 6.000%, 12/01/35 |
29,246 | 30,478 | ||||||
| 6.000%, 02/01/36 |
40,477 | 42,043 | ||||||
| 6.000%, 04/01/36 |
16,267 | 16,877 | ||||||
| 6.000%, 06/01/36 |
3,122 | 3,261 | ||||||
| 6.000%, 07/01/37 |
26,054 | 27,035 | ||||||
| 6.000%, 02/01/53 |
135,236 | 141,993 | ||||||
| 6.500%, 06/01/31 |
6,817 | 7,106 | ||||||
| 6.500%, 09/01/31 |
14,331 | 14,939 | ||||||
| 6.500%, 02/01/32 |
4,769 | 5,005 | ||||||
| 6.500%, 07/01/32 |
22,735 | 23,809 | ||||||
| 6.500%, 08/01/32 |
14,005 | 14,498 | ||||||
| 6.500%, 01/01/33 |
11,130 | 11,587 | ||||||
| 6.500%, 04/01/34 |
29,643 | 30,830 | ||||||
| 6.500%, 06/01/34 |
6,559 | 6,840 | ||||||
| 6.500%, 04/01/36 |
9,491 | 9,914 | ||||||
| 6.500%, 05/01/36 |
14,406 | 15,067 | ||||||
| 6.500%, 02/01/37 |
33,678 | 35,243 | ||||||
| 6.500%, 05/01/37 |
5,416 | 5,619 | ||||||
| 6.500%, 07/01/37 |
14,363 | 14,967 | ||||||
| Federal National Mortgage Association REMICS | ||||||||
| 2.000%, 05/25/44 |
7,508 | 7,315 | ||||||
| 2.000%, 04/25/46 |
53,141 | 48,179 | ||||||
| 3.000%, 02/25/33 (d) |
61,972 | 5,208 | ||||||
| 3.250%, 05/25/40 |
22,879 | 21,187 | ||||||
| 4.000%, 10/25/40 |
35,510 | 34,377 | ||||||
| 4.000%, 07/25/46 (d) |
83,651 | 15,600 | ||||||
| 5.000%, 03/25/25 |
2,280 | 2,254 | ||||||
| Government National Mortgage Association | ||||||||
| 0.584%, 02/16/59 (c) (d) |
749,418 | 22,961 | ||||||
| 2.000%, 01/20/52 |
1,136,643 | 961,628 | ||||||
| 2.000%, 03/20/52 |
1,032,838 | 873,803 | ||||||
| 2.500%, 08/20/51 |
259,183 | 226,651 | ||||||
| 2.500%, 09/20/51 |
1,056,156 | 923,624 | ||||||
| 2.500%, 11/20/51 |
984,561 | 860,896 | ||||||
| 2.500%, 04/20/52 |
2,117,290 | 1,850,830 | ||||||
| 3.000%, 04/20/45 |
78,083 | 71,956 | ||||||
| 3.000%, 04/20/46 |
35,223 | 32,398 | ||||||
| 3.000%, 08/20/46 |
38,625 | 35,489 | ||||||
| 3.000%, 09/20/46 |
87,931 | 80,775 | ||||||
See accompanying notes to financial statements.
BHFTII-9
Brighthouse Funds Trust II
MFS Total Return Portfolio
Schedule of Investments as of December 31, 2023
U.S. Treasury & Government Agencies—(Continued)
| Security Description | Principal Amount* |
Value | ||||||
| Agency Sponsored Mortgage - Backed—(Continued) | ||||||||
| Government National Mortgage Association | ||||||||
| 3.000%, 11/20/47 |
414,385 | $ | 379,902 | |||||
| 3.000%, 01/20/48 |
578,759 | 530,822 | ||||||
| 3.000%, 02/20/48 |
34,658 | 31,725 | ||||||
| 3.000%, 04/20/48 |
11,976 | 10,967 | ||||||
| 3.000%, 11/20/51 |
164,269 | 148,782 | ||||||
| 3.000%, 06/20/52 |
798,426 | 722,635 | ||||||
| 3.000%, 11/20/52 |
439,674 | 397,937 | ||||||
| 3.500%, 12/15/41 |
190,943 | 180,358 | ||||||
| 3.500%, 02/15/42 |
31,488 | 29,749 | ||||||
| 3.500%, 06/20/43 |
201,062 | 191,034 | ||||||
| 3.500%, 07/20/43 |
251,058 | 238,508 | ||||||
| 3.500%, 11/20/47 |
33,831 | 31,854 | ||||||
| 3.500%, 03/20/48 |
395,819 | 372,619 | ||||||
| 3.500%, 06/20/52 |
568,302 | 528,905 | ||||||
| 3.500%, 09/20/52 |
123,763 | 115,182 | ||||||
| 4.000%, 01/20/41 |
220,665 | 216,287 | ||||||
| 4.000%, 02/20/41 |
54,987 | 53,896 | ||||||
| 4.000%, 04/20/41 |
44,308 | 43,429 | ||||||
| 4.000%, 02/20/42 |
57,151 | 56,017 | ||||||
| 4.000%, 07/20/52 |
208,638 | 199,075 | ||||||
| 4.000%, 09/20/52 |
94,054 | 89,743 | ||||||
| 4.000%, 10/20/52 |
573,304 | 547,024 | ||||||
| 4.500%, 07/20/33 |
3,791 | 3,797 | ||||||
| 4.500%, 09/15/33 |
22,164 | 21,926 | ||||||
| 4.500%, 09/20/33 |
2,640 | 2,644 | ||||||
| 4.500%, 12/20/34 |
1,593 | 1,595 | ||||||
| 4.500%, 03/20/35 |
12,396 | 12,413 | ||||||
| 4.500%, 11/15/39 |
48,436 | 48,218 | ||||||
| 4.500%, 03/15/40 |
81,138 | 80,506 | ||||||
| 4.500%, 04/15/40 |
79,173 | 78,011 | ||||||
| 4.500%, 06/15/40 |
26,897 | 26,487 | ||||||
| 4.500%, 01/20/41 |
61,982 | 61,994 | ||||||
| 4.500%, 09/20/52 |
1,455,421 | 1,420,668 | ||||||
| 4.500%, 11/20/52 |
644,039 | 628,296 | ||||||
| 4.500%, 12/20/52 |
695,165 | 678,493 | ||||||
| 5.000%, 07/20/33 |
9,598 | 9,787 | ||||||
| 5.000%, 03/15/34 |
8,294 | 8,337 | ||||||
| 5.000%, 06/15/34 |
20,302 | 20,409 | ||||||
| 5.000%, 12/15/34 |
6,018 | 6,042 | ||||||
| 5.000%, 06/15/35 |
5,503 | 5,538 | ||||||
| 5.000%, 01/20/53 |
48,200 | 47,886 | ||||||
| 5.000%, 03/20/53 |
534,267 | 530,753 | ||||||
| 5.000%, 05/20/53 |
1,426,758 | 1,416,273 | ||||||
| 5.000%, 09/20/53 |
49,809 | 49,443 | ||||||
| 5.500%, 11/15/32 |
35,324 | 35,702 | ||||||
| 5.500%, 08/15/33 |
55,569 | 56,169 | ||||||
| 5.500%, 12/15/33 |
38,690 | 39,106 | ||||||
| 5.500%, 09/15/34 |
22,252 | 22,430 | ||||||
| 5.500%, 10/15/35 |
6,949 | 7,024 | ||||||
| 5.500%, 02/20/53 |
603,385 | 608,096 | ||||||
| 5.500%, 04/20/53 |
438,371 | 441,598 | ||||||
| 5.500%, 06/20/53 |
494,837 | 498,479 | ||||||
| 6.000%, 12/15/28 |
8,906 | 9,046 | ||||||
| 6.000%, 12/15/31 |
4,871 | 4,967 | ||||||
| 6.000%, 03/15/32 |
765 | 776 | ||||||
| Agency Sponsored Mortgage - Backed—(Continued) | ||||||||
| Government National Mortgage Association | ||||||||
| 6.000%, 10/15/32 |
53,734 | 55,668 | ||||||
| 6.000%, 01/15/33 |
346 | 357 | ||||||
| 6.000%, 02/15/33 |
907 | 929 | ||||||
| 6.000%, 04/15/33 |
51,024 | 52,883 | ||||||
| 6.000%, 08/15/33 |
390 | 401 | ||||||
| 6.000%, 07/15/34 |
21,609 | 22,255 | ||||||
| 6.000%, 09/15/34 |
15,832 | 16,210 | ||||||
| 6.000%, 01/20/35 |
13,598 | 14,359 | ||||||
| 6.000%, 02/20/35 |
6,695 | 7,069 | ||||||
| 6.000%, 04/20/35 |
11,454 | 12,095 | ||||||
| 6.000%, 01/15/38 |
41,727 | 43,009 | ||||||
| Government National Mortgage Association REMICS | ||||||||
| 4.000%, 07/20/41 |
44,951 | 43,481 | ||||||
| 4.500%, 10/20/33 |
101,062 | 100,060 | ||||||
| 4.500%, 09/20/41 |
28,239 | 28,228 | ||||||
| Government National Mortgage Association, TBA | ||||||||
| 3.000%, TBA (e) |
350,000 | 316,858 | ||||||
| 6.000%, TBA (e) |
300,000 | 305,027 | ||||||
| 6.500%, TBA (e) |
525,000 | 537,407 | ||||||
| Seasoned Credit Risk Transfer Trust | ||||||||
| 3.000%, 02/25/59 |
217,568 | 193,890 | ||||||
| 3.250%, 11/25/61 |
169,153 | 146,566 | ||||||
| 3.500%, 08/25/58 |
72,311 | 65,743 | ||||||
| 3.500%, 10/25/58 |
165,807 | 153,836 | ||||||
| Uniform Mortgage-Backed Security, TBA | ||||||||
| 2.500%, TBA (e) |
771,987 | 697,236 | ||||||
|
|
|
|||||||
| 80,591,369 | ||||||||
|
|
|
|||||||
| U.S. Treasury—7.0% | ||||||||
| U.S. Treasury Bonds |
2,600,000 | 1,808,219 | ||||||
| 1.875%, 11/15/51 |
650,000 | 410,922 | ||||||
| 2.250%, 02/15/52 |
2,200,000 | 1,525,047 | ||||||
| 2.375%, 02/15/42 |
1,800,000 | 1,381,078 | ||||||
| 2.375%, 11/15/49 |
11,245,000 | 8,068,287 | ||||||
| 2.500%, 02/15/45 |
68,000 | 51,491 | ||||||
| 2.875%, 05/15/43 |
2,550,000 | 2,093,291 | ||||||
| 2.875%, 11/15/46 |
2,439,000 | 1,953,010 | ||||||
| 4.000%, 11/15/42 |
1,500,000 | 1,457,754 | ||||||
| 4.000%, 11/15/52 |
1,100,000 | 1,085,305 | ||||||
| 4.125%, 08/15/53 (b) |
1,100,000 | 1,111,859 | ||||||
| U.S. Treasury Notes |
3,400,000 | 3,157,352 | ||||||
| 2.500%, 03/31/27 |
3,600,000 | 3,440,672 | ||||||
| 4.625%, 06/30/25 |
3,100,000 | 3,107,387 | ||||||
| 4.750%, 07/31/25 |
3,800,000 | 3,817,219 | ||||||
| 5.000%, 08/31/25 (b) |
8,900,000 | 8,982,047 | ||||||
|
|
|
|||||||
| 43,450,940 | ||||||||
|
|
|
|||||||
| Total U.S. Treasury & Government Agencies |
124,042,309 | |||||||
|
|
|
|||||||
| Corporate Bonds & Notes—12.7% |
| |||||||
| Aerospace/Defense—0.0% | ||||||||
| BAE Systems PLC |
336,000 | 310,033 | ||||||
|
|
|
|||||||
See accompanying notes to financial statements.
BHFTII-10
Brighthouse Funds Trust II
MFS Total Return Portfolio
Schedule of Investments as of December 31, 2023
Corporate Bonds & Notes—(Continued)
| Security Description | Principal Amount* |
Value | ||||||
| Agriculture—0.4% | ||||||||
| BAT International Finance PLC |
1,361,000 | $ | 1,338,492 | |||||
| Philip Morris International, Inc. |
250,000 | 254,454 | ||||||
| 5.125%, 02/15/30 (b) |
301,000 | 305,912 | ||||||
| 5.625%, 11/17/29 (b) |
108,000 | 113,250 | ||||||
| 5.750%, 11/17/32 (b) |
476,000 | 499,544 | ||||||
|
|
|
|||||||
| 2,511,652 | ||||||||
|
|
|
|||||||
| Auto Manufacturers—0.1% | ||||||||
| Stellantis Finance U.S., Inc. |
1,012,000 | 846,710 | ||||||
|
|
|
|||||||
| Auto Parts & Equipment—0.0% | ||||||||
| Lear Corp. |
217,000 | 208,783 | ||||||
|
|
|
|||||||
| Banks—2.5% | ||||||||
| Bank of America Corp. |
961,000 | 796,738 | ||||||
| Barclays PLC |
259,000 | 212,271 | ||||||
| 7.437%, 1Y H15 + 3.500%, 11/02/33 (c) |
774,000 | 866,666 | ||||||
| Deutsche Bank AG |
258,000 | 235,913 | ||||||
| 6.720%, SOFR + 3.180%, 01/18/29 (b) (c) |
628,000 | 657,646 | ||||||
| 7.146%, SOFR + 2.520%, 07/13/27 (c) |
239,000 | 248,078 | ||||||
| Goldman Sachs Group, Inc. |
891,000 | 732,069 | ||||||
| 2.600%, 02/07/30 |
667,000 | 586,120 | ||||||
| HSBC Holdings PLC |
200,000 | 183,505 | ||||||
| 4.700%, 5Y H15 + 3.250%, 03/09/31 (c) |
332,000 | 270,396 | ||||||
| JPMorgan Chase & Co. |
1,450,000 | 1,209,849 | ||||||
| 2.963%, SOFR + 1.260%, 01/25/33 (c) |
555,000 | 475,545 | ||||||
| 3.897%, 3M TSFR + 1.482%, 01/23/49 (c) |
320,000 | 265,239 | ||||||
| Macquarie Group Ltd. |
1,713,000 | 1,562,992 | ||||||
| Mitsubishi UFJ Financial Group, Inc. |
920,000 | 788,072 | ||||||
| Morgan Stanley |
718,000 | 627,659 | ||||||
| 2.943%, SOFR + 1.290%, 01/21/33 (b) (c) |
919,000 | 781,755 | ||||||
| Northern Trust Corp. |
761,000 | 817,188 | ||||||
| Sumitomo Mitsui Financial Group, Inc. |
1,536,000 | 1,366,453 | ||||||
| UBS Group AG |
1,883,000 | 1,501,916 | ||||||
| Wells Fargo & Co. |
1,499,000 | 1,309,251 | ||||||
|
|
|
|||||||
| 15,495,321 | ||||||||
|
|
|
|||||||
| Beverages—0.3% | ||||||||
| Anheuser-Busch InBev Worldwide, Inc. |
208,000 | 197,251 | ||||||
| 8.000%, 11/15/39 |
868,000 | 1,120,333 | ||||||
| Diageo Capital PLC |
835,000 | 751,747 | ||||||
| Keurig Dr Pepper, Inc. |
93,000 | 85,498 | ||||||
|
|
|
|||||||
| 2,154,829 | ||||||||
|
|
|
|||||||
| Building Materials—0.2% | ||||||||
| Martin Marietta Materials, Inc. |
56,000 | 49,302 | ||||||
| Masco Corp. |
1,141,000 | 937,664 | ||||||
| Vulcan Materials Co. |
115,000 | 106,965 | ||||||
|
|
|
|||||||
| 1,093,931 | ||||||||
|
|
|
|||||||
| Chemicals—0.1% | ||||||||
| RPM International, Inc. |
443,000 | 373,318 | ||||||
|
|
|
|||||||
| Commercial Services—0.5% | ||||||||
| Ashtead Capital, Inc. |
1,117,000 | 1,103,400 | ||||||
| ERAC USA Finance LLC |
215,000 | 251,247 | ||||||
| Experian Finance PLC |
533,000 | 527,775 | ||||||
| Global Payments, Inc. |
467,000 | 399,467 | ||||||
| Verisk Analytics, Inc. |
570,000 | 556,036 | ||||||
| 5.750%, 04/01/33 |
413,000 | 442,977 | ||||||
|
|
|
|||||||
| 3,280,902 | ||||||||
|
|
|
|||||||
| Cosmetics/Personal Care—0.1% | ||||||||
| Kenvue, Inc. |
846,000 | 872,048 | ||||||
|
|
|
|||||||
| Diversified Financial Services—1.3% | ||||||||
| AerCap Ireland Capital DAC / AerCap Global Aviation Trust |
1,700,000 | 1,574,066 | ||||||
| 3.650%, 07/21/27 |
320,000 | 304,051 | ||||||
| 4.875%, 01/16/24 (b) |
150,000 | 149,904 | ||||||
| Air Lease Corp. |
410,000 | 375,435 | ||||||
| 2.875%, 01/15/32 (b) |
538,000 | 455,234 | ||||||
| Avolon Holdings Funding Ltd. |
640,000 | 591,898 | ||||||
| 4.375%, 05/01/26 (144A) |
215,000 | 208,033 | ||||||
| Capital One Financial Corp. |
1,373,000 | 1,226,230 | ||||||
| 3.750%, 03/09/27 (b) |
554,000 | 528,964 | ||||||
| Charles Schwab Corp. |
1,045,000 | 1,078,703 | ||||||
See accompanying notes to financial statements.
BHFTII-11
Brighthouse Funds Trust II
MFS Total Return Portfolio
Schedule of Investments as of December 31, 2023
Corporate Bonds & Notes—(Continued)
| Security Description | Principal Amount* |
Value | ||||||
| Diversified Financial Services—(Continued) | ||||||||
| Consumers Securitization Funding LLC |
381,000 | $ | 382,484 | |||||
| Intercontinental Exchange, Inc. |
657,000 | 569,264 | ||||||
| LPL Holdings, Inc. |
770,000 | 697,259 | ||||||
|
|
|
|||||||
| 8,141,525 | ||||||||
|
|
|
|||||||
| Electric—1.1% | ||||||||
| American Electric Power Co., Inc. |
368,000 | 392,777 | ||||||
| Brazos Securitization LLC |
448,000 | 462,963 | ||||||
| Duke Energy Carolinas LLC |
1,151,000 | 1,172,317 | ||||||
| Duke Energy Corp. |
875,000 | 846,957 | ||||||
| Electricite de France SA |
200,000 | 226,182 | ||||||
| Enel Finance International NV |
315,000 | 322,920 | ||||||
| Exelon Corp. |
533,000 | 508,464 | ||||||
| Georgia Power Co. |
44,000 | 34,734 | ||||||
| Jersey Central Power & Light Co. |
275,000 | 232,095 | ||||||
| 4.300%, 01/15/26 (144A) |
422,000 | 412,788 | ||||||
| Oncor Electric Delivery Co. LLC |
646,000 | 681,813 | ||||||
| Pacific Gas & Electric Co. |
145,000 | 130,679 | ||||||
| 2.500%, 02/01/31 |
466,000 | 384,399 | ||||||
| 3.000%, 06/15/28 (b) |
418,000 | 380,946 | ||||||
| 3.300%, 08/01/40 (b) |
283,000 | 207,089 | ||||||
| Xcel Energy, Inc. |
297,000 | 274,649 | ||||||
|
|
|
|||||||
| 6,671,772 | ||||||||
|
|
|
|||||||
| Electronics—0.1% | ||||||||
| Arrow Electronics, Inc. |
749,000 | 633,075 | ||||||
|
|
|
|||||||
| Entertainment—0.2% | ||||||||
| Warnermedia Holdings, Inc. |
848,000 | 747,581 | ||||||
| 5.141%, 03/15/52 (b) |
493,000 | 423,169 | ||||||
|
|
|
|||||||
| 1,170,750 | ||||||||
|
|
|
|||||||
| Environmental Control—0.3% | ||||||||
| Republic Services, Inc. |
272,000 | 220,647 | ||||||
| Waste Management, Inc. |
1,645,000 | 1,677,970 | ||||||
|
|
|
|||||||
| 1,898,617 | ||||||||
|
|
|
|||||||
| Gas—0.1% | ||||||||
| APA Infrastructure Ltd. |
84,000 | 81,489 | ||||||
| East Ohio Gas Co. |
365,000 | 303,385 | ||||||
| NiSource, Inc. |
136,000 | 136,580 | ||||||
|
|
|
|||||||
| 521,454 | ||||||||
|
|
|
|||||||
| Healthcare-Products—0.1% | ||||||||
| Alcon Finance Corp. |
200,000 | 173,366 | ||||||
| Boston Scientific Corp. |
470,000 | 419,659 | ||||||
|
|
|
|||||||
| 593,025 | ||||||||
|
|
|
|||||||
| Healthcare-Services—0.3% | ||||||||
| Adventist Health System |
731,000 | 743,529 | ||||||
| HCA, Inc. |
522,000 | 497,418 | ||||||
| Humana, Inc. |
395,000 | 420,791 | ||||||
| Laboratory Corp. of America Holdings |
152,000 | 140,074 | ||||||
| Northwell Healthcare, Inc. |
51,000 | 41,208 | ||||||
| 4.260%, 11/01/47 |
407,000 | 344,632 | ||||||
|
|
|
|||||||
| 2,187,652 | ||||||||
|
|
|
|||||||
| Insurance—0.8% | ||||||||
| AIA Group Ltd. |
804,000 | 740,774 | ||||||
| Aon Corp. |
539,000 | 515,587 | ||||||
| 4.500%, 12/15/28 |
564,000 | 557,078 | ||||||
| Brown & Brown, Inc. |
618,000 | 563,646 | ||||||
| Corebridge Financial, Inc. |
955,000 | 863,288 | ||||||
| 5.750%, 01/15/34 |
351,000 | 358,780 | ||||||
| Fairfax Financial Holdings Ltd. |
870,000 | 869,156 | ||||||
| Liberty Mutual Group, Inc. |
331,000 | 250,154 | ||||||
|
|
|
|||||||
| 4,718,463 | ||||||||
|
|
|
|||||||
| Internet—0.1% | ||||||||
| Booking Holdings, Inc. |
424,000 | 427,172 | ||||||
|
|
|
|||||||
| Lodging—0.2% | ||||||||
| Las Vegas Sands Corp. |
257,000 | 236,802 | ||||||
See accompanying notes to financial statements.
BHFTII-12
Brighthouse Funds Trust II
MFS Total Return Portfolio
Schedule of Investments as of December 31, 2023
Corporate Bonds & Notes—(Continued)
| Security Description | Principal Amount* |
Value | ||||||
| Lodging—(Continued) | ||||||||
| Marriott International, Inc. |
475,000 | $ | 391,932 | |||||
| 2.850%, 04/15/31 |
2,000 | 1,731 | ||||||
| 4.625%, 06/15/30 (b) |
582,000 | 571,519 | ||||||
|
|
|
|||||||
| 1,201,984 | ||||||||
|
|
|
|||||||
| Machinery-Diversified—0.2% | ||||||||
| CNH Industrial Capital LLC |
540,000 | 539,584 | ||||||
| Westinghouse Air Brake Technologies Corp. |
248,000 | 239,741 | ||||||
| 4.700%, 09/15/28 |
660,000 | 652,643 | ||||||
|
|
|
|||||||
| 1,431,968 | ||||||||
|
|
|
|||||||
| Media—0.4% | ||||||||
| Charter Communications Operating LLC/Charter Communications Operating Capital |
628,000 | 443,875 | ||||||
| 5.250%, 04/01/53 (b) |
505,000 | 422,960 | ||||||
| 5.375%, 05/01/47 |
132,000 | 112,177 | ||||||
| 6.384%, 10/23/35 |
310,000 | 314,679 | ||||||
| Cox Communications, Inc. |
404,000 | 328,491 | ||||||
| Time Warner Cable Enterprises LLC |
592,000 | 685,463 | ||||||
|
|
|
|||||||
| 2,307,645 | ||||||||
|
|
|
|||||||
| Mining—0.4% | ||||||||
| Anglo American Capital PLC |
1,340,000 | 1,139,911 | ||||||
| 3.875%, 03/16/29 (144A) (b) |
200,000 | 187,585 | ||||||
| 5.625%, 04/01/30 (144A) (b) |
524,000 | 531,852 | ||||||
| Glencore Funding LLC |
502,000 | 430,695 | ||||||
| 2.850%, 04/27/31 (144A) (b) |
208,000 | 179,358 | ||||||
|
|
|
|||||||
| 2,469,401 | ||||||||
|
|
|
|||||||
| Oil & Gas—0.6% | ||||||||
| BP Capital Markets America, Inc. |
1,226,000 | 1,068,149 | ||||||
| Eni SpA |
1,046,000 | 1,045,613 | ||||||
| Phillips 66 |
904,000 | 761,278 | ||||||
| Valero Energy Corp. |
596,000 | 653,309 | ||||||
|
|
|
|||||||
| 3,528,349 | ||||||||
|
|
|
|||||||
| Pharmaceuticals—0.1% | ||||||||
| Cigna Group |
148,000 | 115,693 | ||||||
| CVS Health Corp. |
719,000 | 737,851 | ||||||
|
|
|
|||||||
| 853,544 | ||||||||
|
|
|
|||||||
| Pipelines—0.4% | ||||||||
| Kinder Morgan Energy Partners LP |
522,000 | 521,198 | ||||||
| Plains All American Pipeline LP / PAA Finance Corp. |
538,000 | 495,064 | ||||||
| Sabine Pass Liquefaction LLC |
147,000 | 143,658 | ||||||
| Spectra Energy Partners LP |
236,000 | 227,204 | ||||||
| Targa Resources Corp. |
217,000 | 199,517 | ||||||
| 6.125%, 03/15/33 (b) |
647,000 | 681,186 | ||||||
|
|
|
|||||||
| 2,267,827 | ||||||||
|
|
|
|||||||
| Real Estate Investment Trusts—0.9% | ||||||||
| Boston Properties LP |
389,000 | 309,671 | ||||||
| Brixmor Operating Partnership LP |
512,000 | 478,439 | ||||||
| 4.125%, 05/15/29 (b) |
51,000 | 48,534 | ||||||
| Crown Castle, Inc. |
843,000 | 801,346 | ||||||
| Equinix, Inc. |
517,000 | 468,007 | ||||||
| 2.500%, 05/15/31 (b) |
618,000 | 524,573 | ||||||
| 2.625%, 11/18/24 (b) |
800,000 | 779,198 | ||||||
| GLP Capital LP/GLP Financing II, Inc. |
513,000 | 510,034 | ||||||
| Public Storage Operating Co. |
1,221,000 | 1,263,980 | ||||||
| Realty Income Corp. |
153,000 | 139,010 | ||||||
|
|
|
|||||||
| 5,322,792 | ||||||||
|
|
|
|||||||
| Retail—0.2% | ||||||||
| Alimentation Couche-Tard, Inc. |
619,000 | 466,000 | ||||||
| Genuine Parts Co. |
1,005,000 | 839,762 | ||||||
|
|
|
|||||||
| 1,305,762 | ||||||||
|
|
|
|||||||
| Semiconductors—0.1% | ||||||||
| Broadcom, Inc. |
395,000 | 378,949 | ||||||
| 4.926%, 05/15/37 (144A) |
208,000 | 201,288 | ||||||
|
|
|
|||||||
| 580,237 | ||||||||
|
|
|
|||||||
| Software—0.1% | ||||||||
| Fiserv, Inc. |
198,000 | 174,070 | ||||||
| Oracle Corp. |
213,000 | 212,031 | ||||||
| Roper Technologies, Inc. |
422,000 | 358,231 | ||||||
|
|
|
|||||||
| 744,332 | ||||||||
|
|
|
|||||||
See accompanying notes to financial statements.
BHFTII-13
Brighthouse Funds Trust II
MFS Total Return Portfolio
Schedule of Investments as of December 31, 2023
Corporate Bonds & Notes—(Continued)
| Security Description | Principal Amount* |
Value | ||||||
| Telecommunications—0.5% | ||||||||
| Rogers Communications, Inc. |
1,514,000 | $ | 1,393,218 | |||||
| T-Mobile USA, Inc. |
557,000 | 502,575 | ||||||
| Verizon Communications, Inc. |
310,000 | 283,343 | ||||||
| 4.812%, 03/15/39 (b) |
573,000 | 553,988 | ||||||
| Vodafone Group PLC |
214,000 | 215,779 | ||||||
|
|
|
|||||||
| 2,948,903 | ||||||||
|
|
|
|||||||
| Total Corporate Bonds & Notes |
79,073,776 | |||||||
|
|
|
|||||||
| Asset-Backed Securities—4.8% |
| |||||||
| Asset-Backed - Automobile—0.4% | ||||||||
| ARI Fleet Lease Trust |
135,447 | 136,952 | ||||||
| Chesapeake Funding II LLC |
567,831 | 569,325 | ||||||
| Credit Acceptance Auto Loan Trust |
328,000 | 317,143 | ||||||
| 6.390%, 08/15/33 (144A) |
155,000 | 157,180 | ||||||
| Enterprise Fleet Financing LLC |
376,000 | 384,318 | ||||||
| GLS Auto Select Receivables Trust |
519,779 | 521,754 | ||||||
| 6.370%, 06/15/28 (144A) |
107,000 | 107,920 | ||||||
| Toyota Lease Owner Trust |
112,131 | 111,957 | ||||||
|
|
|
|||||||
| 2,306,549 | ||||||||
|
|
|
|||||||
| Asset-Backed - Home Equity—0.0% | ||||||||
| Bayview Financial Revolving Asset Trust |
124,336 | 186,687 | ||||||
| GMACM Home Equity Loan Trust |
24,750 | 24,648 | ||||||
| Home Equity Loan Trust |
20,344 | 692 | ||||||
|
|
|
|||||||
| 212,027 | ||||||||
|
|
|
|||||||
| Asset-Backed - Other—4.4% | ||||||||
| ACRES Commercial Realty Ltd. |
535,500 | 526,003 | ||||||
| Allegro CLO IV Ltd. |
702,748 | 699,918 | ||||||
| Arbor Realty Commercial Real Estate Notes Ltd. |
625,000 | 609,797 | ||||||
| 7.076%, 1M TSFR + 1.714%, 08/15/34 (144A) (c) |
522,000 | 500,834 | ||||||
| 7.438%, SOFR30A + 2.100%, 01/15/37 (144A) (c) |
1,466,500 | 1,430,185 | ||||||
| BSPRT Issuer Ltd. |
1,463,000 | 1,408,358 | ||||||
| 7.388%, SOFR30A + 2.050%, 02/15/37 (144A) (c) |
524,000 | 510,445 | ||||||
| 7.526%, 1M TSFR + 2.164%, 12/15/38 (144A) (c) |
245,000 | 239,804 | ||||||
| Asset-Backed - Other—(Continued) | ||||||||
| Business Jet Securities LLC |
218,597 | 202,208 | ||||||
| CHCP Ltd. |
650,500 | 645,464 | ||||||
| Columbia Cent CLO 28 Ltd. |
1,026,773 | 1,019,472 | ||||||
| Cutwater Ltd. |
198,866 | 198,767 | ||||||
| Dryden 55 CLO Ltd. |
1,382,011 | 1,379,809 | ||||||
| Dryden XXVI Senior Loan Fund |
489,179 | 488,594 | ||||||
| Kubota Credit Owner Trust |
449,940 | 451,293 | ||||||
| LCCM Trust |
682,500 | 643,398 | ||||||
| LoanCore Issuer Ltd. |
1,547,500 | 1,523,770 | ||||||
| 7.376%, 1M TSFR + 2.014%, 11/15/38 (144A) (c) |
3,913,500 | 3,731,992 | ||||||
| MF1 Ltd. |
256,681 | 256,699 | ||||||
| 7.306%, 1M TSFR + 1.950%, 02/19/37 (144A) (c) |
650,507 | 633,645 | ||||||
| MidOcean Credit CLO II |
1,156,232 | 1,150,714 | ||||||
| Neuberger Berman CLO XV |
508,944 | 505,317 | ||||||
| Neuberger Berman CLO XX Ltd. |
600,000 | 598,803 | ||||||
| Oaktree CLO Ltd. |
1,503,087 | 1,482,770 | ||||||
| OCP CLO Ltd. |
4,041,128 | 3,996,255 | ||||||
| OneMain Financial Issuance Trust |
427,000 | 427,965 | ||||||
| Starwood Ltd. |
1,507,000 | 1,426,817 | ||||||
| U.S. Small Business Administration |
272 | 271 | ||||||
| 4.950%, 03/01/25 |
5,343 | 5,327 | ||||||
| 4.990%, 09/01/24 |
1,550 | 1,538 | ||||||
| 5.110%, 08/01/25 |
7,880 | 7,807 | ||||||
| 5.180%, 05/01/24 |
353 | 351 | ||||||
| 5.520%, 06/01/24 |
811 | 809 | ||||||
| Voya Ltd. |
584,168 | 579,067 | ||||||
|
|
|
|||||||
| 27,284,266 | ||||||||
|
|
|
|||||||
| Total Asset-Backed Securities |
29,802,842 | |||||||
|
|
|
|||||||
| Mortgage-Backed Securities—1.8% |
| |||||||
| Commercial Mortgage-Backed Securities—1.8% | ||||||||
| AREIT Trust |
1,549,362 | 1,527,647 | ||||||
| 7.188%, SOFR30A + 1.850%, 01/20/37 (144A) (c) |
892,000 | 864,410 | ||||||
See accompanying notes to financial statements.
BHFTII-14
Brighthouse Funds Trust II
MFS Total Return Portfolio
Schedule of Investments as of December 31, 2023
Mortgage-Backed Securities—(Continued)
| Security Description | Shares/ Principal Amount* |
Value | ||||||
| Commercial Mortgage-Backed Securities—(Continued) | ||||||||
| BANK |
533,187 | $ | 560,601 | |||||
| Benchmark Mortgage Trust |
38,197 | 40,016 | ||||||
| BXMT Ltd. |
1,532,500 | 1,418,349 | ||||||
| COMM Mortgage Trust |
1,300,833 | 1,261,749 | ||||||
| CSAIL Commercial Mortgage Trust |
738,578 | 714,457 | ||||||
| JPMBB Commercial Mortgage Securities Trust |
1,590,000 | 1,549,736 | ||||||
| Morgan Stanley Bank of America Merrill Lynch Trust |
519,442 | 484,106 | ||||||
| MSWF Commercial Mortgage Trust |
591,406 | 636,941 | ||||||
| Ready Capital Mortgage Financing LLC |
310,012 | 309,024 | ||||||
| 7.270%, 1M TSFR + 1.914%, 11/25/36 (144A) † (c) |
320,000 | 307,766 | ||||||
| Wells Fargo Commercial Mortgage Trust |
1,706,327 | 1,649,622 | ||||||
|
|
|
|||||||
| Total Mortgage-Backed Securities |
11,324,424 | |||||||
|
|
|
|||||||
| Preferred Stocks—0.8% |
| |||||||
| Household Products—0.5% | ||||||||
| Henkel AG & Co. KGaA |
39,889 | 3,208,347 | ||||||
|
|
|
|||||||
| Technology Hardware, Storage & Peripherals—0.3% | ||||||||
| Samsung Electronics Co. Ltd. |
32,693 | 1,576,516 | ||||||
|
|
|
|||||||
| Total Preferred Stocks |
4,784,863 | |||||||
|
|
|
|||||||
| Municipals—0.4% |
| |||||||
| New Jersey Turnpike Authority |
1,050,000 | 1,308,273 | ||||||
| Rhode Island Student Loan Authority |
800,000 | 819,694 | ||||||
| State Board of Administration Finance Corp. |
314,000 | 267,841 | ||||||
|
|
|
|||||||
| Total Municipals |
2,395,808 | |||||||
|
|
|
|||||||
| Short-Term Investments—0.8% |
| |||||||
| Discount Note—0.8% | ||||||||
| Federal Home Loan Bank |
4,986,000 | 4,983,114 | ||||||
|
|
|
|||||||
| Repurchase Agreement—0.0% | ||||||||
| Fixed Income Clearing Corp. |
1,118 | 1,118 | ||||||
|
|
|
|||||||
| Total Short-Term Investments |
4,984,232 | |||||||
|
|
|
|||||||
| Securities Lending Reinvestments (h)—3.9% |
| |||||||
| Repurchase Agreements—1.6% | ||||||||
| Bank of Nova Scotia |
2,100,000 | 2,100,000 | ||||||
| Barclays Bank PLC |
400,000 | 400,000 | ||||||
| Cantor Fitzgerald & Co. |
1,000,000 | 1,000,000 | ||||||
| Deutsche Bank Securities, Inc. |
3,005,227 | 3,005,227 | ||||||
| NBC Global Finance Ltd. |
2,900,000 | 2,900,000 | ||||||
| Societe Generale |
200,000 | 200,000 | ||||||
| Repurchase Agreement dated 12/29/23 at 5.510%, due on 01/02/24 with a maturity value of $100,061; collateralized by various Common Stock with an aggregate market value of $111,313. |
100,000 | 100,000 | ||||||
| TD Prime Services LLC |
250,000 | 250,000 | ||||||
|
|
|
|||||||
| 9,955,227 | ||||||||
|
|
|
|||||||
See accompanying notes to financial statements.
BHFTII-15
Brighthouse Funds Trust II
MFS Total Return Portfolio
Schedule of Investments as of December 31, 2023
Securities Lending Reinvestments (h)—(Continued)
| Security Description | Shares | Value | ||||||
| Mutual Funds—2.3% | ||||||||
| BlackRock Liquidity Funds FedFund, Institutional Shares 5.260% (i) |
3,000,000 | $ | 3,000,000 | |||||
| Dreyfus Treasury Obligations Cash Management Fund, Institutional Class 5.250% (i) |
4,000,000 | 4,000,000 | ||||||
| Goldman Sachs Financial Square Government Fund, Institutional Shares 5.230% (i) |
3,000,000 | 3,000,000 | ||||||
| HSBC U.S. Government Money Market Fund, Class I 5.300% (i) |
500,000 | 500,000 | ||||||
| Morgan Stanley Liquidity Funds Government Portfolio, Institutional Shares 5.270% (i) |
1,000,000 | 1,000,000 | ||||||
| RBC U.S. Government Money Market Fund, Institutional Share 5.230% (i) |
500,000 | 500,000 | ||||||
| State Street Institutional U.S. Government Money Market Fund, Premier Class 5.320% (i) |
2,000,000 | 2,000,000 | ||||||
|
|
|
|||||||
| 14,000,000 | ||||||||
|
|
|
|||||||
| Total Securities Lending Reinvestments |
23,955,227 | |||||||
|
|
|
|||||||
| Total Investments—103.9% |
645,118,655 | |||||||
|
|
|
|||||||
| Other assets and liabilities (net)—(3.9)% |
(24,176,119 | ) | ||||||
|
|
|
|||||||
| Net Assets— 100.0% | $ | 620,942,536 | ||||||
|
|
|
|||||||
| * | Principal amount stated in U.S. dollars unless otherwise noted. | |||
| † | Restricted securities are not registered under the Securities Act of 1933 and are subject to legal restrictions on resale. These securities generally may be resold in transactions exempt from registration or to the public if the securities are subsequently registered. Disposal of these securities may involve time-consuming negotiations and prompt sale at an acceptable price may be difficult. As of December 31, 2023, the market value of restricted securities was $616,790, which is 0.1% of net assets. See details shown in the Restricted Securities table that follows. | |||
| (a) | Non-income producing security. | |||
| (b) | All or a portion of the security was held on loan. As of December 31, 2023, the market value of securities loaned was $41,239,273 and the collateral received consisted of cash in the amount of $23,955,227 and non-cash collateral with a value of $18,650,987. The cash collateral investments are disclosed in the Schedule of Investments and categorized as Securities Lending Reinvestments. The non-cash collateral received consists of U.S. government securities that are held in safe-keeping by the lending agent, or a third-party custodian, and cannot be sold or repledged by the Portfolio. As such, this collateral is excluded from the Statement of Assets and Liabilities. | |||
| (c) | Variable or floating rate security. The stated rate represents the rate at December 31, 2023. Maturity date shown for callable securities reflects the earliest possible call date. For securities based on a published reference index and spread, the index and spread are indicated in the description above. For certain variable rate securities, the coupon rate is determined by the issuer/agent based on current market conditions. For certain asset- and mortgage-backed securities, the coupon rate may fluctuate based on changes of the underlying collateral or prepayments of principal. These securities do not indicate a reference index and spread in their description above. | |||
| (d) | Interest only security. | |||
| (e) | TBA (To Be Announced) Securities are purchased on a forward commitment basis with an approximate principal amount and no defined maturity date. The actual principal and maturity date will be determined upon settlement date. | |||
| (f) | All or a portion of the security was pledged as collateral against open futures contracts. As of December 31, 2023, the market value of securities pledged was $546,965. | |||
| (g) | The rate shown represents current yield to maturity. | |||
| (h) | Represents investment of cash collateral received from securities on loan as of December 31, 2023. | |||
| (i) | The rate shown represents the annualized seven-day yield as of December 31, 2023. | |||
| (144A) | Securities exempt from registration under Rule 144A of the Securities Act of 1933. These securities may be resold in transactions exempt from registration, normally to qualified institutional buyers. As of December 31, 2023, the market value of 144A securities was $49,506,767, which is 8.0% of net assets. |
| Restricted Securities |
Acquisition Date |
Principal Amount |
Cost | Value | ||||||||||||
| Ready Capital Mortgage Financing LLC, 6.470%, 04/25/38 |
03/19/21 | $ | 310,012 | $ | 310,012 | $ | 309,024 | |||||||||
| Ready Capital Mortgage Financing LLC, 7.270%, 11/25/36 |
11/12/21 | 320,000 | 320,000 | 307,766 | ||||||||||||
|
|
|
|||||||||||||||
| $ | 616,790 | |||||||||||||||
|
|
|
|||||||||||||||
Futures Contracts
| Futures Contracts—Long |
Expiration Date |
Number of Contracts |
Notional Value |
Value/ Unrealized Appreciation/ (Depreciation) |
||||||||||||||||
| U.S. Treasury Note 2 Year Futures |
03/28/24 | 55 | USD | 11,325,273 | $ | 116,193 | ||||||||||||||
| U.S. Treasury Note 5 Year Futures |
03/28/24 | 192 | USD | 20,884,500 | 479,803 | |||||||||||||||
| U.S. Treasury Ultra Long Bond Futures |
03/19/24 | 49 | USD | 6,546,094 | 626,019 | |||||||||||||||
| Futures Contracts—Short |
||||||||||||||||||||
| U.S. Treasury Note Ultra 10 Year Futures |
03/19/24 | (67 | ) | USD | (7,907,047 | ) | (354,134 | ) | ||||||||||||
|
|
|
|||||||||||||||||||
| Net Unrealized Appreciation |
|
$ | 867,881 | |||||||||||||||||
|
|
|
|||||||||||||||||||
See accompanying notes to financial statements.
BHFTII-16
Brighthouse Funds Trust II
MFS Total Return Portfolio
Schedule of Investments as of December 31, 2023
Glossary of Abbreviations
Currencies
| (USD)— | United States Dollar | |||
Index Abbreviations
| (H15)— | U.S. Treasury Yield Curve Rate T-Note Constant Maturity Index | |||
| (SOFR)— | Secured Overnight Financing Rate | |||
| (SOFR30A)— | Secured Overnight Financing Rate 30-Day Average | |||
| (TSFR)— | Term Secured Financing Rate | |||
Other Abbreviations
| (ADR)— | American Depositary Receipt | |||
| (CLO)— | Collateralized Loan Obligation | |||
| (DAC)— | Designated Activity Company | |||
| (REMIC)— | Real Estate Mortgage Investment Conduit | |||
Fair Value Hierarchy
Accounting principles generally accepted in the United States of America (“GAAP”) define fair market value as the price that the Portfolio would receive to sell an asset or pay to transfer a liability in an orderly transaction between market participants at the measurement date. It establishes a fair value hierarchy that prioritizes inputs to valuation methods and requires disclosure of the fair value hierarchy, separately for each major category of assets and liabilities, that segregates fair value measurements into three levels. Levels 1, 2 and 3 of the fair value hierarchy are defined as follows:
Level 1 - unadjusted quoted prices in active markets for identical investments
Level 2 - other significant observable inputs (including, but not limited to, quoted prices for similar assets or liabilities in markets that are either active or inactive; inputs other than quoted prices that are observable such as interest rates, yield curves, volatilities, prepayment speeds, loss severities, credit risks, default rates, or other market corroborated inputs)
Level 3 - significant unobservable inputs based on the best information available in the circumstances, to the extent observable inputs are unavailable (including the Portfolio’s own assumptions used in determining the fair value of investments and derivative financial instruments)
The inputs or methodologies used for valuing investments are not necessarily an indication of the risk associated with investing in them. Changes to the inputs or methodologies used may result in transfers between levels. A reconciliation of Level 3 securities, if any, will be disclosed following the fair value hierarchy table. For more information about the Portfolio’s policy regarding the valuation of investments, please refer to the Notes to Financial Statements.
The following table summarizes the fair value hierarchy of the Portfolio’s investments as of December 31, 2023:
| Description | Level 1 | Level 2 | Level 3 | Total | ||||||||||||
| Common Stocks | ||||||||||||||||
| Aerospace & Defense |
$ | 7,604,615 | $ | — | $ | — | $ | 7,604,615 | ||||||||
| Automobile Components |
7,802,864 | — | — | 7,802,864 | ||||||||||||
| Banks |
28,887,814 | — | — | 28,887,814 | ||||||||||||
| Beverages |
2,831,618 | 2,255,257 | — | 5,086,875 | ||||||||||||
| Building Products |
15,216,002 | — | — | 15,216,002 | ||||||||||||
| Capital Markets |
43,317,230 | — | — | 43,317,230 | ||||||||||||
| Chemicals |
11,664,699 | — | — | 11,664,699 | ||||||||||||
| Construction Materials |
1,220,567 | — | — | 1,220,567 | ||||||||||||
| Consumer Staples Distribution & Retail |
1,335,900 | — | — | 1,335,900 | ||||||||||||
| Distributors |
3,931,444 | — | — | 3,931,444 | ||||||||||||
| Electric Utilities |
14,073,006 | — | — | 14,073,006 | ||||||||||||
| Electrical Equipment |
13,543,630 | — | — | 13,543,630 | ||||||||||||
| Entertainment |
3,081,467 | — | — | 3,081,467 | ||||||||||||
| Financial Services |
5,958,974 | — | — | 5,958,974 | ||||||||||||
| Food Products |
2,720,866 | — | — | 2,720,866 | ||||||||||||
| Ground Transportation |
6,915,431 | — | — | 6,915,431 | ||||||||||||
| Health Care Equipment & Supplies |
10,772,199 | — | — | 10,772,199 | ||||||||||||
| Health Care Providers & Services |
15,345,947 | — | — | 15,345,947 | ||||||||||||
| Hotels, Restaurants & Leisure |
2,915,134 | — | — | 2,915,134 | ||||||||||||
| Industrial Conglomerates |
3,826,159 | — | — | 3,826,159 | ||||||||||||
| Insurance |
19,962,866 | — | — | 19,962,866 | ||||||||||||
| Interactive Media & Services |
6,363,299 | — | — | 6,363,299 | ||||||||||||
| IT Services |
8,271,720 | — | — | 8,271,720 | ||||||||||||
| Life Sciences Tools & Services |
3,112,355 | — | — | 3,112,355 | ||||||||||||
| Machinery |
6,957,029 | — | — | 6,957,029 | ||||||||||||
| Media |
15,222,898 | — | — | 15,222,898 | ||||||||||||
| Metals & Mining |
— | 1,450,808 | — | 1,450,808 | ||||||||||||
See accompanying notes to financial statements.
BHFTII-17
Brighthouse Funds Trust II
MFS Total Return Portfolio
Schedule of Investments as of December 31, 2023
Fair Value Hierarchy—(Continued)
| Description | Level 1 | Level 2 | Level 3 | Total | ||||||||||||
| Multi-Utilities |
$ | 1,430,163 | $ | 1,948,819 | $ | — | $ | 3,378,982 | ||||||||
| Oil, Gas & Consumable Fuels |
22,235,613 | — | — | 22,235,613 | ||||||||||||
| Personal Care Products |
3,170,163 | — | — | 3,170,163 | ||||||||||||
| Pharmaceuticals |
13,983,973 | 6,195,734 | — | 20,179,707 | ||||||||||||
| Professional Services |
3,489,455 | — | — | 3,489,455 | ||||||||||||
| Semiconductors & Semiconductor Equipment |
19,211,144 | — | — | 19,211,144 | ||||||||||||
| Software |
13,232,885 | — | — | 13,232,885 | ||||||||||||
| Technology Hardware, Storage & Peripherals |
700,888 | — | — | 700,888 | ||||||||||||
| Tobacco |
7,452,596 | — | — | 7,452,596 | ||||||||||||
| Wireless Telecommunication Services |
5,141,943 | — | — | 5,141,943 | ||||||||||||
| Total Common Stocks |
352,904,556 | 11,850,618 | — | 364,755,174 | ||||||||||||
| Total U.S. Treasury & Government Agencies* |
— | 124,042,309 | — | 124,042,309 | ||||||||||||
| Total Corporate Bonds & Notes* |
— | 79,073,776 | — | 79,073,776 | ||||||||||||
| Total Asset-Backed Securities* |
— | 29,802,842 | — | 29,802,842 | ||||||||||||
| Total Mortgage-Backed Securities* |
— | 11,324,424 | — | 11,324,424 | ||||||||||||
| Total Preferred Stocks* |
— | 4,784,863 | — | 4,784,863 | ||||||||||||
| Total Municipals* |
— | 2,395,808 | — | 2,395,808 | ||||||||||||
| Total Short-Term Investments* |
— | 4,984,232 | — | 4,984,232 | ||||||||||||
| Securities Lending Reinvestments | ||||||||||||||||
| Repurchase Agreements |
— | 9,955,227 | — | 9,955,227 | ||||||||||||
| Mutual Funds |
14,000,000 | — | — | 14,000,000 | ||||||||||||
| Total Securities Lending Reinvestments |
14,000,000 | 9,955,227 | — | 23,955,227 | ||||||||||||
| Total Investments |
$ | 366,904,556 | $ | 278,214,099 | $ | — | $ | 645,118,655 | ||||||||
| Collateral for Securities Loaned (Liability) |
$ | — | $ | (23,955,227 | ) | $ | — | $ | (23,955,227 | ) | ||||||
| Futures Contracts | ||||||||||||||||
| Futures Contracts (Unrealized Appreciation) |
$ | 1,222,015 | $ | — | $ | — | $ | 1,222,015 | ||||||||
| Futures Contracts (Unrealized Depreciation) |
(354,134 | ) | — | — | (354,134 | ) | ||||||||||
| Total Futures Contracts |
$ | 867,881 | $ | — | $ | — | $ | 867,881 | ||||||||
| * | See Schedule of Investments for additional detailed categorizations. | |||
See accompanying notes to financial statements.
BHFTII-18
Brighthouse Funds Trust II
MFS Total Return Portfolio
Statement of Assets and Liabilities
December 31, 2023
| Assets |
||||
| Investments at value (a) (b) |
$ | 645,118,655 | ||
| Cash |
970 | |||
| Cash denominated in foreign currencies (c) |
7 | |||
| Receivable for: |
||||
| Fund shares sold |
155,987 | |||
| Dividends and interest |
2,601,195 | |||
| Variation margin on futures contracts |
3,673 | |||
| Prepaid expenses |
2,252 | |||
|
|
|
|||
| Total Assets |
647,882,739 | |||
| Liabilities |
||||
| Collateral for securities loaned |
23,955,227 | |||
| Payables for: |
||||
| TBA securities purchased |
1,837,950 | |||
| Fund shares redeemed |
457,402 | |||
| Accrued Expenses: |
||||
| Management fees |
284,046 | |||
| Distribution and service fees |
82,571 | |||
| Deferred trustees’ fees |
169,145 | |||
| Other expenses |
153,862 | |||
|
|
|
|||
| Total Liabilities |
26,940,203 | |||
|
|
|
|||
| Net Assets |
$ | 620,942,536 | ||
|
|
|
|||
| Net Assets Consist of: |
||||
| Paid in surplus |
$ | 511,114,404 | ||
| Distributable earnings (Accumulated losses) |
109,828,132 | |||
|
|
|
|||
| Net Assets |
$ | 620,942,536 | ||
|
|
|
|||
| Net Assets |
||||
| Class A |
$ | 159,711,285 | ||
| Class B |
151,231,359 | |||
| Class E |
19,622,695 | |||
| Class F |
290,377,197 | |||
| Capital Shares Outstanding* |
||||
| Class A |
1,055,028 | |||
| Class B |
1,020,988 | |||
| Class E |
130,747 | |||
| Class F |
1,944,779 | |||
| Net Asset Value, Offering Price and Redemption Price Per Share |
||||
| Class A |
$ | 151.38 | ||
| Class B |
148.12 | |||
| Class E |
150.08 | |||
| Class F |
149.31 |
| * | The Portfolio is authorized to issue an unlimited number of shares. | |
| (a) | Identified cost of investments was $576,314,567. | |
| (b) | Includes securities loaned at value of $41,239,273. | |
| (c) | Identified cost of cash denominated in foreign currencies was $7. |
Statement of Operations
Year Ended December 31, 2023
| Investment Income |
||||
| Dividends (a) |
$ | 8,501,849 | ||
| Interest |
10,785,753 | |||
| Securities lending income |
69,514 | |||
| Other income |
5,446 | |||
|
|
|
|||
| Total investment income |
19,362,562 | |||
| Expenses |
||||
| Management fees |
3,488,528 | |||
| Administration fees |
47,339 | |||
| Custodian and accounting fees |
159,446 | |||
| Distribution and service fees—Class B |
376,605 | |||
| Distribution and service fees—Class E |
29,165 | |||
| Distribution and service fees—Class F |
571,034 | |||
| Audit and tax services |
69,608 | |||
| Legal |
46,604 | |||
| Trustees’ fees and expenses |
46,220 | |||
| Shareholder reporting |
51,338 | |||
| Insurance |
5,705 | |||
| Miscellaneous |
22,768 | |||
|
|
|
|||
| Total expenses |
4,914,360 | |||
| Less management fee waiver |
(140,775 | ) | ||
|
|
|
|||
| Net expenses |
4,773,585 | |||
|
|
|
|||
| Net Investment Income |
14,588,977 | |||
|
|
|
|||
| Net Realized and Unrealized Gain (Loss) |
||||
| Net realized gain (loss) on: | ||||
| Investments |
29,573,011 | |||
| Futures contracts |
(1,150,930 | ) | ||
| Foreign currency transactions |
(2,082 | ) | ||
|
|
|
|||
| Net realized gain (loss) |
28,419,999 | |||
|
|
|
|||
| Net change in unrealized appreciation (depreciation) on: |
| |||
| Investments |
15,485,104 | |||
| Futures contracts |
984,392 | |||
| Foreign currency transactions |
11,904 | |||
|
|
|
|||
| Net change in unrealized appreciation (depreciation) |
16,481,400 | |||
|
|
|
|||
| Net realized and unrealized gain (loss) |
44,901,399 | |||
|
|
|
|||
| Net Increase (Decrease) in Net Assets From Operations |
$ | 59,490,376 | ||
|
|
|
|||
| (a) | Net of foreign withholding taxes of $122,980. |
See accompanying notes to financial statements.
BHFTII-19
Brighthouse Funds Trust II
MFS Total Return Portfolio
Statements of Changes in Net Assets
| Year Ended December 31, 2023 |
Year Ended December 31, 2022 |
|||||||
| Increase (Decrease) in Net Assets: |
||||||||
| From Operations |
||||||||
| Net investment income (loss) |
$ | 14,588,977 | $ | 12,037,012 | ||||
| Net realized gain (loss) |
28,419,999 | 31,895,327 | ||||||
| Net change in unrealized appreciation (depreciation) |
16,481,400 | (118,575,214 | ) | |||||
|
|
|
|
|
|||||
| Increase (decrease) in net assets from operations |
59,490,376 | (74,642,875 | ) | |||||
|
|
|
|
|
|||||
| From Distributions to Shareholders |
||||||||
| Class A |
(11,361,184 | ) | (19,044,690 | ) | ||||
| Class B |
(10,868,967 | ) | (19,219,957 | ) | ||||
| Class E |
(1,394,786 | ) | (2,383,256 | ) | ||||
| Class F |
(20,447,945 | ) | (35,961,907 | ) | ||||
|
|
|
|
|
|||||
| Total distributions |
(44,072,882 | ) | (76,609,810 | ) | ||||
|
|
|
|
|
|||||
| Increase (decrease) in net assets from capital share transactions |
(22,995,157 | ) | 5,101,489 | |||||
|
|
|
|
|
|||||
| Total increase (decrease) in net assets |
(7,577,663 | ) | (146,151,196 | ) | ||||
| Net Assets |
||||||||
| Beginning of period |
628,520,199 | 774,671,395 | ||||||
|
|
|
|
|
|||||
| End of period |
$ | 620,942,536 | $ | 628,520,199 | ||||
|
|
|
|
|
|||||
Other Information:
Capital Shares
Transactions in capital shares were as follows:
| Year Ended December 31, 2023 |
Year Ended December 31, 2022 |
|||||||||||||||
| Shares | Value | Shares | Value | |||||||||||||
| Class A |
||||||||||||||||
| Sales |
41,362 | $ | 5,990,728 | 40,183 | $ | 6,481,341 | ||||||||||
| Reinvestments |
80,325 | 11,361,184 | 134,354 | 19,044,690 | ||||||||||||
| Redemptions |
(139,805 | ) | (20,384,607 | ) | (112,852 | ) | (18,101,618 | ) | ||||||||
|
|
|
|
|
|
|
|
|
|||||||||
| Net increase (decrease) |
(18,118 | ) | $ | (3,032,695 | ) | 61,685 | $ | 7,424,413 | ||||||||
|
|
|
|
|
|
|
|
|
|||||||||
| Class B |
||||||||||||||||
| Sales |
29,917 | $ | 4,300,833 | 26,320 | $ | 3,944,580 | ||||||||||
| Reinvestments |
78,425 | 10,868,967 | 138,213 | 19,219,957 | ||||||||||||
| Redemptions |
(156,870 | ) | (22,364,918 | ) | (171,754 | ) | (26,706,506 | ) | ||||||||
|
|
|
|
|
|
|
|
|
|||||||||
| Net increase (decrease) |
(48,528 | ) | $ | (7,195,118 | ) | (7,221 | ) | $ | (3,541,969 | ) | ||||||
|
|
|
|
|
|
|
|
|
|||||||||
| Class E |
||||||||||||||||
| Sales |
4,763 | $ | 695,902 | 17,666 | $ | 2,678,918 | ||||||||||
| Reinvestments |
9,939 | 1,394,786 | 16,937 | 2,383,256 | ||||||||||||
| Redemptions |
(25,032 | ) | (3,667,617 | ) | (21,179 | ) | (3,256,187 | ) | ||||||||
|
|
|
|
|
|
|
|
|
|||||||||
| Net increase (decrease) |
(10,330 | ) | $ | (1,576,929 | ) | 13,424 | $ | 1,805,987 | ||||||||
|
|
|
|
|
|
|
|
|
|||||||||
| Class F |
||||||||||||||||
| Sales |
61,230 | $ | 8,793,693 | 56,534 | $ | 8,750,656 | ||||||||||
| Reinvestments |
146,412 | 20,447,945 | 256,742 | 35,961,907 | ||||||||||||
| Redemptions |
(280,452 | ) | (40,432,053 | ) | (286,951 | ) | (45,299,505 | ) | ||||||||
|
|
|
|
|
|
|
|
|
|||||||||
| Net increase (decrease) |
(72,810 | ) | $ | (11,190,415 | ) | 26,325 | $ | (586,942 | ) | |||||||
|
|
|
|
|
|
|
|
|
|||||||||
| Increase (decrease) derived from capital shares transactions |
$ | (22,995,157 | ) | $ | 5,101,489 | |||||||||||
|
|
|
|
|
|||||||||||||
See accompanying notes to financial statements.
BHFTII-20
Brighthouse Funds Trust II
MFS Total Return Portfolio
Financial Highlights
| Selected per share data | ||||||||||||||||||||
| Class A | ||||||||||||||||||||
| Year Ended December 31, | ||||||||||||||||||||
| 2023 | 2022 | 2021 | 2020 | 2019 | ||||||||||||||||
| Net Asset Value, Beginning of Period |
$ | 147.81 | $ | 186.11 | $ | 176.57 | $ | 172.66 | $ | 153.14 | ||||||||||
|
|
|
|
|
|
|
|
|
|
|
|||||||||||
| Income (Loss) from Investment Operations |
||||||||||||||||||||
| Net investment income (loss) (a) |
3.72 | 3.11 | 2.70 | 3.23 | 3.67 | |||||||||||||||
| Net realized and unrealized gain (loss) |
10.89 | (21.88 | ) | 21.69 | 11.99 | 26.62 | ||||||||||||||
|
|
|
|
|
|
|
|
|
|
|
|||||||||||
| Total income (loss) from investment operations |
14.61 | (18.77 | ) | 24.39 | 15.22 | 30.29 | ||||||||||||||
|
|
|
|
|
|
|
|
|
|
|
|||||||||||
| Less Distributions |
||||||||||||||||||||
| Distributions from net investment income |
(3.35 | ) | (3.10 | ) | (3.57 | ) | (4.17 | ) | (4.05 | ) | ||||||||||
| Distributions from net realized capital gains |
(7.69 | ) | (16.43 | ) | (11.28 | ) | (7.14 | ) | (6.72 | ) | ||||||||||
|
|
|
|
|
|
|
|
|
|
|
|||||||||||
| Total distributions |
(11.04 | ) | (19.53 | ) | (14.85 | ) | (11.31 | ) | (10.77 | ) | ||||||||||
|
|
|
|
|
|
|
|
|
|
|
|||||||||||
| Net Asset Value, End of Period |
$ | 151.38 | $ | 147.81 | $ | 186.11 | $ | 176.57 | $ | 172.66 | ||||||||||
|
|
|
|
|
|
|
|
|
|
|
|||||||||||
| Total Return (%) (b) |
10.40 | (9.63 | ) | 14.22 | 9.76 | 20.37 | ||||||||||||||
| Ratios/Supplemental Data |
||||||||||||||||||||
| Gross ratio of expenses to average net assets (%) |
0.64 | 0.63 | 0.62 | 0.64 | 0.63 | |||||||||||||||
| Net ratio of expenses to average net assets (%) (c) |
0.62 | 0.60 | 0.59 | 0.64 | 0.63 | |||||||||||||||
| Ratio of net investment income (loss) to average net assets (%) |
2.55 | 1.96 | 1.47 | 1.97 | 2.23 | |||||||||||||||
| Portfolio turnover rate (%) |
32 | (d) | 62 | (d) | 92 | (d) | 78 | (d) | 42 | (d) | ||||||||||
| Net assets, end of period (in millions) |
$ | 159.7 | $ | 158.6 | $ | 188.2 | $ | 176.7 | $ | 174.7 | ||||||||||
| Class B | ||||||||||||||||||||
| Year Ended December 31, | ||||||||||||||||||||
| 2023 | 2022 | 2021 | 2020 | 2019 | ||||||||||||||||
| Net Asset Value, Beginning of Period |
$ | 144.80 | $ | 182.66 | $ | 173.56 | $ | 169.83 | $ | 150.75 | ||||||||||
|
|
|
|
|
|
|
|
|
|
|
|||||||||||
| Income (Loss) from Investment Operations |
||||||||||||||||||||
| Net investment income (loss) (a) |
3.28 | 2.66 | 2.20 | 2.77 | 3.21 | |||||||||||||||
| Net realized and unrealized gain (loss) |
10.67 | (21.48 | ) | 21.32 | 11.80 | 26.19 | ||||||||||||||
|
|
|
|
|
|
|
|
|
|
|
|||||||||||
| Total income (loss) from investment operations |
13.95 | (18.82 | ) | 23.52 | 14.57 | 29.40 | ||||||||||||||
|
|
|
|
|
|
|
|
|
|
|
|||||||||||
| Less Distributions |
||||||||||||||||||||
| Distributions from net investment income |
(2.94 | ) | (2.61 | ) | (3.14 | ) | (3.70 | ) | (3.60 | ) | ||||||||||
| Distributions from net realized capital gains |
(7.69 | ) | (16.43 | ) | (11.28 | ) | (7.14 | ) | (6.72 | ) | ||||||||||
|
|
|
|
|
|
|
|
|
|
|
|||||||||||
| Total distributions |
(10.63 | ) | (19.04 | ) | (14.42 | ) | (10.84 | ) | (10.32 | ) | ||||||||||
|
|
|
|
|
|
|
|
|
|
|
|||||||||||
| Net Asset Value, End of Period |
$ | 148.12 | $ | 144.80 | $ | 182.66 | $ | 173.56 | $ | 169.83 | ||||||||||
|
|
|
|
|
|
|
|
|
|
|
|||||||||||
| Total Return (%) (b) |
10.13 | (9.87 | ) | 13.93 | 9.49 | 20.07 | ||||||||||||||
| Ratios/Supplemental Data |
||||||||||||||||||||
| Gross ratio of expenses to average net assets (%) |
0.89 | 0.88 | 0.87 | 0.89 | 0.88 | |||||||||||||||
| Net ratio of expenses to average net assets (%) (c) |
0.87 | 0.85 | 0.84 | 0.89 | 0.88 | |||||||||||||||
| Ratio of net investment income (loss) to average net assets (%) |
2.29 | 1.70 | 1.22 | 1.73 | 1.98 | |||||||||||||||
| Portfolio turnover rate (%) |
32 | (d) | 62 | (d) | 92 | (d) | 78 | (d) | 42 | (d) | ||||||||||
| Net assets, end of period (in millions) |
$ | 151.2 | $ | 154.9 | $ | 196.7 | $ | 193.4 | $ | 198.8 | ||||||||||
Please see following page for Financial Highlights footnote legend.
See accompanying notes to financial statements.
BHFTII-21
Brighthouse Funds Trust II
MFS Total Return Portfolio
Financial Highlights
| Selected per share data | ||||||||||||||||||||
| Class E | ||||||||||||||||||||
| Year Ended December 31, | ||||||||||||||||||||
| 2023 | 2022 | 2021 | 2020 | 2019 | ||||||||||||||||
| Net Asset Value, Beginning of Period |
$ | 146.61 | $ | 184.72 | $ | 175.35 | $ | 171.52 | $ | 152.17 | ||||||||||
|
|
|
|
|
|
|
|
|
|
|
|||||||||||
| Income (Loss) from Investment Operations |
||||||||||||||||||||
| Net investment income (loss) (a) |
3.46 | 2.85 | 2.41 | 2.97 | 3.40 | |||||||||||||||
| Net realized and unrealized gain (loss) |
10.80 | (21.71 | ) | 21.55 | 11.90 | 26.45 | ||||||||||||||
|
|
|
|
|
|
|
|
|
|
|
|||||||||||
| Total income (loss) from investment operations |
14.26 | (18.86 | ) | 23.96 | 14.87 | 29.85 | ||||||||||||||
|
|
|
|
|
|
|
|
|
|
|
|||||||||||
| Less Distributions |
||||||||||||||||||||
| Distributions from net investment income |
(3.10 | ) | (2.82 | ) | (3.31 | ) | (3.90 | ) | (3.78 | ) | ||||||||||
| Distributions from net realized capital gains |
(7.69 | ) | (16.43 | ) | (11.28 | ) | (7.14 | ) | (6.72 | ) | ||||||||||
|
|
|
|
|
|
|
|
|
|
|
|||||||||||
| Total distributions |
(10.79 | ) | (19.25 | ) | (14.59 | ) | (11.04 | ) | (10.50 | ) | ||||||||||
|
|
|
|
|
|
|
|
|
|
|
|||||||||||
| Net Asset Value, End of Period |
$ | 150.08 | $ | 146.61 | $ | 184.72 | $ | 175.35 | $ | 171.52 | ||||||||||
|
|
|
|
|
|
|
|
|
|
|
|||||||||||
| Total Return (%) (b) |
10.24 | (9.77 | ) | 14.05 | 9.60 | 20.19 | ||||||||||||||
| Ratios/Supplemental Data |
||||||||||||||||||||
| Gross ratio of expenses to average net assets (%) |
0.79 | 0.78 | 0.77 | 0.79 | 0.78 | |||||||||||||||
| Net ratio of expenses to average net assets (%) (c) |
0.77 | 0.75 | 0.74 | 0.79 | 0.78 | |||||||||||||||
| Ratio of net investment income (loss) to average net assets (%) |
2.39 | 1.81 | 1.32 | 1.83 | 2.08 | |||||||||||||||
| Portfolio turnover rate (%) |
32 | (d) | 62 | (d) | 92 | (d) | 78 | (d) | 42 | (d) | ||||||||||
| Net assets, end of period (in millions) |
$ | 19.6 | $ | 20.7 | $ | 23.6 | $ | 23.0 | $ | 24.1 | ||||||||||
| Class F | ||||||||||||||||||||
| Year Ended December 31, | ||||||||||||||||||||
| 2023 | 2022 | 2021 | 2020 | 2019 | ||||||||||||||||
| Net Asset Value, Beginning of Period |
$ | 145.89 | $ | 183.89 | $ | 174.64 | $ | 170.86 | $ | 151.61 | ||||||||||
|
|
|
|
|
|
|
|
|
|
|
|||||||||||
| Income (Loss) from Investment Operations |
||||||||||||||||||||
| Net investment income (loss) (a) |
3.38 | 2.76 | 2.31 | 2.87 | 3.31 | |||||||||||||||
| Net realized and unrealized gain (loss) |
10.75 | (21.62 | ) | 21.45 | 11.86 | 26.34 | ||||||||||||||
|
|
|
|
|
|
|
|
|
|
|
|||||||||||
| Total income (loss) from investment operations |
14.13 | (18.86 | ) | 23.76 | 14.73 | 29.65 | ||||||||||||||
|
|
|
|
|
|
|
|
|
|
|
|||||||||||
| Less Distributions |
||||||||||||||||||||
| Distributions from net investment income |
(3.02 | ) | (2.71 | ) | (3.23 | ) | (3.81 | ) | (3.68 | ) | ||||||||||
| Distributions from net realized capital gains |
(7.69 | ) | (16.43 | ) | (11.28 | ) | (7.14 | ) | (6.72 | ) | ||||||||||
|
|
|
|
|
|
|
|
|
|
|
|||||||||||
| Total distributions |
(10.71 | ) | (19.14 | ) | (14.51 | ) | (10.95 | ) | (10.40 | ) | ||||||||||
|
|
|
|
|
|
|
|
|
|
|
|||||||||||
| Net Asset Value, End of Period |
$ | 149.31 | $ | 145.89 | $ | 183.89 | $ | 174.64 | $ | 170.86 | ||||||||||
|
|
|
|
|
|
|
|
|
|
|
|||||||||||
| Total Return (%) (b) |
10.19 | (9.82 | ) | 13.99 | 9.54 | 20.13 | ||||||||||||||
| Ratios/Supplemental Data |
||||||||||||||||||||
| Gross ratio of expenses to average net assets (%) |
0.84 | 0.83 | 0.82 | 0.84 | 0.83 | |||||||||||||||
| Net ratio of expenses to average net assets (%) (c) |
0.82 | 0.80 | 0.79 | 0.84 | 0.83 | |||||||||||||||
| Ratio of net investment income (loss) to average net assets (%) |
2.35 | 1.76 | 1.27 | 1.77 | 2.03 | |||||||||||||||
| Portfolio turnover rate (%) |
32 | (d) | 62 | (d) | 92 | (d) | 78 | (d) | 42 | (d) | ||||||||||
| Net assets, end of period (in millions) |
$ | 290.4 | $ | 294.3 | $ | 366.2 | $ | 357.4 | $ | 362.6 | ||||||||||
| (a) | Per share amounts based on average shares outstanding during the period. | |||
| (b) | Total return does not reflect any insurance, sales, separate account or administrative charges of variable annuity or life insurance contracts or any additional expenses that contract owners may bear under their variable contracts. If these charges were included, the returns would be lower. | |||
| (c) | Includes the effects of management fee waivers (see Note 6 of the Notes to Financial Statements). | |||
| (d) | Includes mortgage dollar roll and TBA transactions; excluding these transactions the portfolio turnover rates would have been 22%, 30%, 29%, 40%, and 29% for the years ended December 31, 2023, 2022, 2021, 2020, and 2019, respectively. | |||
See accompanying notes to financial statements.
BHFTII-22
Brighthouse Funds Trust II
MFS Total Return Portfolio
Notes to Financial Statements—December 31, 2023
1. Organization
Brighthouse Funds Trust II (the “Trust”) is organized as a Delaware statutory trust and registered under the Investment Company Act of 1940, as amended (the “1940 Act”), as an open-end management investment company. The Trust, which is managed by Brighthouse Investment Advisers, LLC (“Brighthouse Investment Advisers” or the “Adviser”), currently offers twenty-nine series (the “Portfolios”), each of which operates as a distinct investment vehicle of the Trust. The series included in this report is MFS Total Return Portfolio (the “Portfolio”), which is diversified. Shares of the Portfolio are not offered directly to the general public and are currently available only to separate accounts of insurance companies, including insurance companies affiliated with the Adviser.
The Portfolio has registered and offers four classes of shares: Class A, B, E and F shares. Shares of each class of the Portfolio represent an equal pro rata interest in the Portfolio and generally give the shareholder the same voting, dividend, liquidation, and other rights. Investment income, realized and unrealized capital gains and losses, the common expenses of the Portfolio, and certain Portfolio-level expense reductions, if any, are allocated on a pro rata basis to each class based on the relative net assets of each class to the net assets of the Portfolio. Each class of shares differs in its respective distribution plan and such distribution expenses are allocated to the corresponding class of shares.
2. Significant Accounting Policies
The preparation of financial statements in conformity with accounting principles generally accepted in the United States of America (“GAAP”) requires management to make estimates and assumptions that affect the reported amounts of assets and liabilities and disclosure of contingent assets and liabilities as of the date of the financial statements and the reported amounts of income and expenses during the reporting period. Actual results could differ from those estimates. In the preparation of these financial statements, management has evaluated events and transactions subsequent to December 31, 2023 through the date the financial statements were issued.
The Portfolio is an investment company and follows the accounting and reporting guidance of the Financial Accounting Standards Board (“FASB”) Accounting Standards Codification Topic 946—Financial Services—Investment Companies. The following is a summary of significant accounting policies consistently followed by the Portfolio in the preparation of its financial statements.
Investment Valuation and Fair Value Measurements - The Portfolio values its investments for purposes of calculating its net asset value (“NAV”) using procedures that allow for a variety of methodologies to be used to value the Portfolio’s investments. The specific methodology used for an investment may vary based on the market data available for a specific investment at the time the Portfolio calculates its NAV or based on other considerations. The procedures also permit a level of judgment to be used in the valuation process.
Debt securities, including corporate, convertible and municipal bonds and notes; obligations of the U.S. Treasury and U.S. government agencies; foreign sovereign issues; and non-U.S. bonds, are generally valued based upon evaluated or composite bid quotations obtained from third-party pricing services and/or brokers and dealers selected by the Adviser (each a “pricing service”). Such pricing services may use matrix pricing, which considers observable inputs including, among other things, issuer details, maturity dates, interest rates, yield curves, rates of prepayment, credit risks/spreads, default rates, reported trades, broker-dealer quotes and quoted prices for similar assets. Short-term obligations with a remaining maturity of sixty days or less may be valued at amortized cost in the absence of market quotes, so long as the amortized cost value of such short-term debt instrument is approximately the same as the fair value of the instrument as determined without the use of amortized cost valuation. Floating rate loans are generally valued based upon an evaluated or composite average of aggregate bid and ask quotations supplied by brokers or dealers, as obtained from the pricing service. Securities that use similar valuation techniques and inputs as described above are generally categorized as Level 2 within the fair value hierarchy.
Mortgage- and asset-backed securities are generally valued based upon evaluated or composite bid quotations obtained from pricing services selected by the Adviser. These securities are usually issued as separate tranches, or classes, of securities within each deal. The pricing models for these securities usually consider tranche-level attributes, current market data, estimated cash flows and market-based yield spreads for each tranche and incorporate deal collateral performance, as available. Mortgage- and asset-backed securities that use similar valuation techniques and inputs as described above are generally categorized as Level 2 within the fair value hierarchy.
Domestic and foreign equity securities, such as common stock, exchange-traded funds, rights, warrants, and preferred stock, that are traded on a securities exchange on a valuation date are generally valued at their last quoted sale price or official closing price on the primary exchange for such security, or, if no sales occurred on that day, at the last reported bid price. Equity securities traded over-the-counter (“OTC”) are generally valued at the last reported bid price. In the event of a major exchange closing during the trading day, the Adviser may use other market information obtained from quotation reporting systems, established market makers, or pricing services in valuing the securities. Valuation adjustments may be applied to certain foreign equity securities that are traded
BHFTII-23
Brighthouse Funds Trust II
MFS Total Return Portfolio
Notes to Financial Statements—December 31, 2023—(Continued)
solely on foreign exchanges that close before the time as of which the Portfolio determines its NAV to account for the market movement between the close of the foreign exchanges and the time as of which the Portfolio determines its NAV. The Portfolio may use a systematic fair valuation model provided by a pricing service to value securities principally traded in these foreign markets to adjust for possible market movements or other changes that may occur between the close of the foreign exchanges and the time as of which the Portfolio determines its NAV. Foreign equity securities valued using these valuation adjustments are generally categorized as Level 2 within the fair value hierarchy. Equity securities that are actively traded, and have no valuation adjustments applied, are categorized as Level 1 within the fair value hierarchy. Other equity securities traded on inactive markets or valued in reference to similar instruments traded on active markets are generally categorized as Level 2 within the fair value hierarchy.
Investments in registered open-end management investment companies are valued at reported NAV per share on the valuation date and are categorized as Level 1 within the fair value hierarchy.
Futures contracts that are traded on commodity exchanges are valued at their closing prices as of the close of such exchanges and are categorized as Level 1 within the fair value hierarchy.
If no current market quotation is readily available or market value quotations are deemed to be unreliable for an investment, the fair value of the investment will be determined in accordance with procedures. A market quotation is readily available only when that quotation is a quoted price (unadjusted) in active markets for identical investments that the Portfolio can access at the measurement date, provided that a quotation will not be readily available if it is not reliable.
Pursuant to Rule 2a-5 under the 1940 Act, the Board of Trustees (the “Board” or “Trustees” ) of the Trust has designated Brighthouse Investment Advisers, acting through its Valuation Committee (“Committee”), as the Portfolio’s “valuation designee” to perform the Portfolio’s fair value determinations. The Board oversees Brighthouse Investment Advisers in its role as the Valuation Designee and receives reports from Brighthouse Investment Advisers regarding its process and the valuation of the Portfolio’s investments to assist with such oversight.
No single standard for determining the fair value of an investment can be set forth because fair value depends upon the facts and circumstances with respect to each investment. Information relating to any relevant factors may be obtained by the Committee from any appropriate source, including the subadviser of the Portfolio, the Custodian, a pricing service, market maker and/or broker for such security or the issuer. Appropriate methodologies for determining fair value under particular circumstances may include: matrix pricing, a discounted cash flow analysis, comparisons of securities with comparable characteristics, value based on multiples of earnings, discount from market price of similar marketable securities, or a combination of these and other methods.
Foreign Currency Translation - The books and records of the Portfolio are maintained in U.S. dollars. The values of securities, currencies, and other assets and liabilities denominated in currencies other than the U.S. dollar are translated into U.S. dollars based upon foreign exchange rates prevailing at the end of the period. Purchases and sales of investment securities, income, and expenses are translated on the respective dates of such transactions. Because the values of investment securities are translated at the foreign exchange rates prevailing at the end of the period, that portion of the results of operations arising from changes in exchange rates and that portion of the results of operations reflecting fluctuations arising from changes in market prices of the investment securities are not separated. Such fluctuations are included in the net realized and unrealized gain or loss on investments.
Net realized foreign exchange gains or losses arise from activity in forward foreign currency exchange contracts, sales of foreign currency, currency gains or losses realized between the trade and settlement dates on securities transactions, and the difference between the amounts of dividends, interest, and foreign withholding taxes recorded by the Portfolio and the U.S. dollar-equivalent of the amounts actually received or paid by the Portfolio. Net unrealized foreign exchange gains and losses arise from changes in the value of assets and liabilities, other than investment securities, resulting from changes in foreign exchange rates.
Investment Transactions and Related Investment Income - Portfolio security transactions are recorded on the trade date. Dividend income is recorded on the ex-dividend date or, for certain foreign securities, when notified. Interest income, which includes amortization of premium and accretion of discount on debt securities, is recorded on the accrual basis. Realized gains and losses on investments are determined on the identified cost basis, which is the same basis used for federal income tax purposes. Foreign income and foreign capital gains on some foreign securities may be subject to foreign taxes, which are accrued as applicable. These foreign taxes have been provided for in accordance with the Portfolio’s understanding of the applicable countries’ tax rules and rates.
Dividends and Distributions to Shareholders - The Portfolio records dividends and distributions on the ex-dividend date. Net realized gains from securities transactions (if any) are generally distributed annually to shareholders. The timing and characterization of certain income and capital gains distributions are determined in accordance with federal tax regulations that may differ from GAAP. Permanent book and tax basis differences relating to shareholder distributions will result in reclassification between distributable earnings (accumulated losses) and paid in surplus. These adjustments have no impact on net assets or the results of operations.
BHFTII-24
Brighthouse Funds Trust II
MFS Total Return Portfolio
Notes to Financial Statements—December 31, 2023—(Continued)
Income Taxes - It is the Portfolio’s policy to comply with the requirements of the Internal Revenue Code of 1986, as amended, and regulations thereunder, applicable to regulated investment companies, and to distribute, with respect to each taxable year, all of its taxable income to shareholders. Therefore, no federal income tax provision is required. The Portfolio files U.S. federal tax returns. No income tax returns are currently under examination. The Portfolio’s federal tax returns remain subject to examination by the Internal Revenue Service for three fiscal years after the returns are filed. As of December 31, 2023, the Portfolio had no uncertain tax positions that would require financial statement recognition, derecognition or disclosure.
Collateralized Obligations - The Portfolio may invest in collateralized bond obligations (“CBOs”), collateralized loan obligations (“CLOs”), other collateralized debt obligations (“CDOs”), and other similarly structured securities. CDOs, CBOs and CLOs are types of asset-backed securities. A CBO is a trust that is backed by a diversified pool of high risk, below investment grade fixed-income securities. The collateral can be from many types of fixed-income securities such as high yield debt, residential privately issued mortgage-related securities, commercial privately issued mortgage-related securities, trust preferred securities and emerging market debt. A CLO is a trust typically collateralized by a pool of loans that may include, among others, domestic and foreign senior secured loans, senior unsecured loans, and subordinate corporate loans, including loans that may be rated below investment grade or equivalent unrated loans. Other CDOs are trusts backed by other types of assets representing obligations of various parties.
For CDOs, CBOs and CLOs, the cash flow from the trust is split into two or more portions, called tranches, varying in risk and yield. The riskiest portion is typically the “equity” or “first loss” tranche, which bears the bulk of defaults from the bonds or loans in the trust and serves to protect the other, more senior tranches from default in all but the most severe circumstances. Senior tranches are paid from the cash flows from the underlying assets before the junior tranches and equity tranches. Losses are first borne by the equity tranches, next by the junior tranches, and finally by the senior tranches. The risks of an investment in a CBO, CLO or other CDO depend largely on the quality and type of the collateral securities and the class of the instrument in which a Portfolio invests. If some debt instruments go into default and the cash collected by the CBO, CLO or CDO is insufficient to pay all of its investors, those in the lowest, most junior tranches suffer losses first. Since they are partially protected from defaults, senior tranches typically have higher ratings and lower potential yields than their underlying securities, and can be rated investment grade. Despite the protection from the equity tranche, more senior tranches can experience substantial losses due to actual defaults, increased sensitivity to defaults due to collateral default and disappearance of protecting tranches, market anticipation of defaults, as well as aversion to CBO, CLO or other CDO securities as a class.
Mortgage-Related and Other Asset-Backed Securities - The Portfolio may invest in mortgage-related or other asset-backed securities. These securities may include mortgage pass-through securities, collateralized mortgage obligations (“CMOs”), commercial mortgage-backed securities, CMO residuals, stripped mortgage-backed securities (“SMBS”), and other securities that directly or indirectly represent a participation in, or are secured by or payable from, mortgage loans on real property or other receivables. The value of some mortgage- or asset-backed securities may be particularly sensitive to changes in prevailing interest rates. Early repayment of principal on some mortgage-related securities may expose the Portfolio to a lower rate of return upon reinvestment of principal. The value of these securities may fluctuate in response to the market’s perception of the creditworthiness of the issuers. Additionally, although mortgages and mortgage-related securities are generally supported by some form of government or private guarantee and/or insurance, there is no assurance that private guarantors or insurers will meet their obligations.
In one type of SMBS, one class receives all of the interest from the mortgage assets (the interest-only or “IO” class), while the other class will receive all of the principal (the principal-only or “PO” class). Because principal will not be received at the maturity of an IO, adjustments are made to the book value of the security until maturity. These adjustments are netted against payments received for the IOs and the net amount is included in interest income on the Statement of Operations of the Portfolio. Payments received for POs are treated as reductions to the cost and par value of the securities. Details of mortgage-related and other asset-backed securities held by the Portfolio are included in the Portfolio’s Schedule of Investments.
The Portfolio may invest a significant portion of its assets in securities of issuers that hold mortgage- and asset-backed securities and direct investments in securities backed by commercial and residential mortgage loans and other financial assets. The value and related income of these securities are sensitive to changes in economic conditions, including delinquencies and/or defaults, and may be negatively impacted by increased volatility of market prices and periods of illiquidity.
Mortgage Dollar Rolls - The Portfolio may enter into mortgage “dollar rolls” in which a Portfolio sells to-be-announced (“TBA”) mortgage-backed securities for delivery in the current month and simultaneously contracts to repurchase substantially similar (same type, coupon, and maturity) securities on a specified future date. For the duration of the transaction, or roll period, the Portfolio foregoes principal (including prepayments of principal) and interest paid on the securities sold. Dollar rolls are accounted for as purchase and sale transactions; gain or loss is recognized at the commencement of the term of the dollar roll and each time the mortgage-backed security is rolled.
Mortgage dollar roll transactions involve the risk that the market value of the securities that the Portfolio is required to repurchase or reacquire may be less than the agreed-upon repurchase price of those securities and that the investment performance of securities purchased with proceeds from these transactions does not exceed the income, capital appreciation, and gain or loss that would have been realized on the securities transferred or sold, as applicable, as part of the treasury or mortgage dollar roll.
BHFTII-25
Brighthouse Funds Trust II
MFS Total Return Portfolio
Notes to Financial Statements—December 31, 2023—(Continued)
TBA Purchase and Forward Sale Commitments - The Portfolio may enter into TBA commitments to purchase or sell securities for a fixed price at a future date. TBA commitments are considered securities in themselves, and involve a risk of loss if the value of the security to be purchased or sold declines or increases prior to the settlement date, which is in addition to the risk of decline in the value of the Portfolio’s other assets. TBA forward sale commitments are valued at the current market value of the underlying securities, according to the procedures described under “Investment Valuation and Fair Value Measurements”.
When-Issued and Delayed-Delivery Securities - The Portfolio may purchase securities on a when-issued or delayed-delivery basis. Settlement of such transactions will occur beyond the customary settlement period. The Portfolio may purchase securities under such conditions only with the intention of actually acquiring them, but may enter into a separate agreement to sell the securities before the settlement date. Since the value of securities purchased may fluctuate prior to settlement, the Portfolio may be required to pay more at settlement than the security is worth. In addition, the Portfolio is not entitled to any of the interest earned prior to settlement.
Repurchase Agreements - The Portfolio may enter into repurchase agreements, under the terms of a Master Repurchase Agreement (“MRA”), or Global Master Repurchase Agreement (“GMRA”), with selected commercial banks and broker-dealers, under which the Portfolio acquires securities as collateral and agrees to resell the securities at an agreed-upon time and at an agreed-upon price. The Portfolio, through the Custodian or a subcustodian, under a tri-party repurchase agreement, receives delivery of the underlying securities collateralizing any repurchase agreements. It is the Portfolio’s policy that the market value of the collateral be equal to at least 100% of the repurchase price in the case of a repurchase agreement of one-day duration and equal to at least 102% of the repurchase price in the case of all other repurchase agreements. In the event of default or failure by a party to perform an obligation in connection with any repurchase transaction, the MRA or GMRA gives the non-defaulting party the right to set-off claims and to apply property held by it in connection with any repurchase transaction against obligations owed to it under the agreement.
At December 31, 2023, the Portfolio had direct investments in repurchase agreements with a gross value of $1,118. Additionally, the Portfolio invested cash collateral for loans of portfolio securities in repurchase agreements with a gross value of $9,955,227. The combined value of all repurchase agreements is included as part of investments at value on the Statement of Assets and Liabilities. The value of the related collateral exceeded the value of the repurchase agreements at December 31, 2023.
Securities Lending - The Portfolio may lend its portfolio securities to certain qualified brokers who borrow securities in order to complete certain securities transactions. By lending its portfolio securities, the Portfolio attempts to increase its net investment income through the receipt of income on collateral held from securities on loan. Any gain or loss in the market price of the loaned securities that might occur, any interest earned, and any dividends declared during the term of the loan, would accrue to the account of the Portfolio.
The Trust has entered into a Non-Custodial Securities Lending Agreement with JPMorgan Chase Bank, N.A. (the “Lending Agent”). Under the agreement, the Lending Agent is authorized to loan portfolio securities on the Portfolio’s behalf. In exchange, the Portfolio generally receives cash, U.S. Government securities, letters of credit, or other collateral deemed appropriate by the Adviser. The Portfolio receives collateral equal to at least 102% of the market value for loans secured by government securities or cash in the same currency as the loaned shares and 105% for all other loaned securities at each loan’s inception. Collateral representing at least 100% of the market value of the loaned securities is maintained for the duration of the loan. Any cash collateral received by the Portfolio is generally invested by the Lending Agent in short-term investments, which may include certificates of deposit, commercial paper, repurchase agreements, including repurchase agreements with respect to equity securities, time deposits, master demand notes and money market funds. The market value of investments made with cash collateral received are disclosed in the Schedule of Investments and the valuation techniques are described in Note 2. The value of the securities on loan may change each business day. If the market value of the collateral at the close of trading on a business day is less than 100% of the market value of the loaned securities at the close of trading on that day, the borrower is required to deliver, by the close of business on the following business day, an additional amount of collateral, so that the total amount of posted collateral is equal to at least 100% of the market value of all the loaned securities as of such preceding day. A portion of the income earned on the collateral is rebated to the borrower of the securities and the remainder is split between the Lending Agent and the Portfolio. On loans collateralized by U.S. government securities, a fee is received from the borrower and is allocated between the Portfolio and the Lending Agent.
Income received by the Portfolio in securities lending transactions during the year ended December 31, 2023 is reflected as securities lending income on the Statement of Operations. The values of any securities loaned by the Portfolio and the related collateral at December 31, 2023 are disclosed in the footnotes to the Schedule of Investments. The value of the related collateral received by the Portfolio exceeded the value of the securities out on loan at December 31, 2023.
The risks associated with lending portfolio securities include, but are not limited to, possible delays in receiving additional collateral or in the recovery of the loaned securities, possible loss of rights in the collateral should the borrower fail financially, as well as risk of loss in the value of the collateral or the value of the investments made with the collateral. To the extent the Portfolio uses cash collateral it receives to invest in repurchase agreements with respect to equity securities, it is subject to the risk of loss if the value of the equity securities declines and the counterparty defaults on its obligation to repurchase such securities. The Lending Agent shall indemnify the Portfolio in the case of default of any securities borrower, subject to the terms of the Non-Custodial Securities Lending Agreement.
BHFTII-26
Brighthouse Funds Trust II
MFS Total Return Portfolio
Notes to Financial Statements—December 31, 2023—(Continued)
The following table provides a breakdown of transactions accounted for as secured borrowings, the gross obligations by the type of collateral pledged, and the remaining contractual maturities of those transactions.
| Remaining Contractual Maturity of the Agreements As of December 31, 2023 |
||||||||||||||||||||
| Overnight and Continuous |
Up to 30 Days |
31 - 90 Days |
Greater than 90 days |
Total | ||||||||||||||||
| Securities Lending Transactions |
| |||||||||||||||||||
| Common Stocks |
$ | (8,148,709 | ) | $ | — | $ | — | $ | — | $ | (8,148,709 | ) | ||||||||
| Corporate Bonds & Notes |
(15,173,734 | ) | — | — | — | (15,173,734 | ) | |||||||||||||
| U.S. Treasury & Government Agencies |
(632,784 | ) | — | — | — | (632,784 | ) | |||||||||||||
| Total Borrowings |
$ | (23,955,227 | ) | $ | — | $ | — | $ | — | $ | (23,955,227 | ) | ||||||||
| Gross amount of recognized liabilities for securities lending transactions |
|
$ | (23,955,227 | ) | ||||||||||||||||
|
|
|
|||||||||||||||||||
3. Investments in Derivative Instruments
Futures Contracts - The Portfolio may buy and sell futures contracts as a hedge, to maintain investment exposure to a target asset class or to enhance return. The Portfolio may be subject to fluctuations in equity prices, interest rates, commodity prices, and foreign currency exchange rates in the normal course of pursuing its investment objective. Futures contracts are standardized agreements to buy or sell a security, or deliver a final cash settlement price in connection with an index, interest rate, currency, or other asset. The Portfolio must deposit an amount (“initial margin”) equal to a certain percentage of the face value of the futures contract. The initial margin may be in the form of cash or securities, which is returned when the Portfolio’s obligations under the contract have been satisfied. If cash is deposited as the initial margin, it is shown as cash collateral on the Statement of Assets and Liabilities. Futures contracts are marked-to-market daily and subsequent payments (“variation margin”) are made or received by the Portfolio depending on whether unrealized gains or losses are incurred. These amounts are reflected as receivables or payables on the Statement of Assets and Liabilities and as a component of net change in unrealized appreciation/depreciation on the Statement of Operations. When the contract is closed or expires, the Portfolio records a realized gain or loss equal to the difference between the value of the contract at the time it was opened and the value at the time it was closed. Risks of entering into futures contracts (and related options) include the possibility that the market for these instruments may be illiquid and that a change in the value of the futures contract or option may not correlate perfectly with changes in the value of the underlying asset. The exchange’s clearinghouse, as counterparty to all futures, guarantees the futures contracts against default.
The following table summarizes the fair value of derivatives held by the Portfolio at December 31, 2023 by category of risk exposure:
| Asset Derivatives |
Liability Derivatives |
|||||||||||
| Risk Exposure |
Statement of Assets & |
Fair Value | Statement of Assets & |
Fair Value | ||||||||
| Interest Rate |
Unrealized appreciation on futures contracts (a) | $ | 1,222,015 | Unrealized depreciation on futures contracts (a) | $ | 354,134 | ||||||
|
|
|
|
|
|||||||||
| (a) | Includes cumulative appreciation/depreciation of futures contracts as reported in the Schedule of Investments. Only the current day’s variation margin is reported within the Statement of Assets and Liabilities. | |||
The following tables summarize the effect of derivative instruments on the Statement of Operations, classified by derivative type and category of risk exposure, for the year ended December 31, 2023:
| Statement of Operations Location—Net Realized Gain (Loss) |
Interest Rate | |||
| Futures contracts |
$ | (1,150,930 | ) | |
|
|
|
|||
| Statement of Operations Location—Net Change in Unrealized Appreciation (Depreciation) |
Interest Rate | |||
| Futures contracts |
$ | 984,392 | ||
|
|
|
|||
For the year ended December 31, 2023, the average notional par or face amount outstanding for each derivative type was as follows:
| Derivative Description |
Average Notional Par or Face Amount‡ |
|||
| Futures contracts long |
$ | 35,571,964 | ||
| Futures contracts short |
(10,308,536 | ) | ||
| ‡ | Averages are based on activity levels during the period for which the amounts are outstanding. | |||
BHFTII-27
Brighthouse Funds Trust II
MFS Total Return Portfolio
Notes to Financial Statements—December 31, 2023—(Continued)
4. Certain Risks
In the normal course of business, the Portfolio invests in securities and enters into transactions where risks exist. Those risks include:
Market Risk: The value of securities held by the Portfolio may decline in response to certain events, including those directly involving the issuers whose securities are owned by the Portfolio; conditions affecting the general economy; overall market changes; local, regional or global political, social or economic instability; currency, interest rate, and price fluctuations, or other factors including terrorism, war, natural disasters and the spread of infectious illness including epidemics or pandemics such as the COVID-19 pandemic. These events may also adversely affect the liquidity of securities held by the Portfolio.
Credit and Counterparty Risk: The Portfolio may be exposed to counterparty risk, or the risk that an entity with which the Portfolio has unsettled or open transactions may default. The potential loss could exceed the value of the financial assets and liabilities recorded in the financial statements. Financial assets that potentially expose the Portfolio to credit and counterparty risk consist principally of cash due from counterparties and investments. The Portfolio manages counterparty risk by entering into agreements only with counterparties that it believes have the financial resources to honor their obligations and by monitoring the financial stability of those counterparties. The Subadviser may attempt to mitigate counterparty risk by (i) periodically assessing the creditworthiness of its trading partners, (ii) monitoring and/or limiting the amount of its net exposure to each individual counterparty based on its assessment, and (iii) requiring collateral from the counterparty for certain transactions. In order to preserve certain safeguards for non-standard settlement trades, the Portfolio restricts its exposure to credit and counterparty losses by entering into master netting agreements (“Master Agreements”) with counterparties (approved brokers) with whom it undertakes a significant volume of transactions. Master Agreements govern the terms of certain transactions and reduce the counterparty risk associated with relevant transactions by specifying credit protection mechanisms and providing standardization that improves legal certainty. Master Agreements can also help limit counterparty risk by specifying collateral posting arrangements at pre-arranged exposure levels.
Repurchase and reverse repurchase agreements are primarily executed under GMRAs or MRAs, which provide the right to set-off. Each repurchase and reverse repurchase agreement is initially collateralized at the transaction level. In the event of default, the total market value exposure will be offset against collateral exchanged to date, which would result in a net receivable/(payable) that would be due from/to the counterparty.
Master Securities Forward Transaction Agreements (“MSFTA”) govern the considerations and factors surrounding the settlement of certain forward settling transactions, such as TBA securities and delayed-delivery or secured borrowings transactions by and between the Portfolio and select counterparties. The MSFTA maintains provisions for, among other things, initiation and confirmation, payment and transfer, events of default, termination, and maintenance of collateral.
Customer Account Agreements and related addenda govern cleared derivatives transactions such as futures, options on futures, and cleared OTC derivatives. Cleared derivative transactions require posting of initial margin as determined by each relevant clearinghouse. The Portfolio’s clearing broker may also require additional initial margin. Clearinghouse-related initial margin is held by the clearinghouse and additional initial margin is held by the Portfolio’s clearing broker. In a cleared derivative transaction, the Portfolio’s counterparty is a clearinghouse rather than a bank or broker. The clearinghouse stands between the buyer and the seller of the contract; therefore, credit risk is limited to failure of or default by the clearinghouse. While offset rights may exist under applicable law, the Portfolio does not have a contractual right of offset against a clearing broker or clearinghouse in the event of a default (including the bankruptcy or insolvency). Additionally, credit risk exists in cleared derivative transactions with respect to initial and variation margin that is held in a clearing broker’s customer accounts. While clearing brokers are required to segregate, by account class, customer margin from their own assets, in the event that a clearing broker becomes insolvent or goes into bankruptcy and at that time there is a shortfall in the aggregate amount of margin held by the clearing broker for all its clients, typically the shortfall would be allocated on a pro-rata basis across all the clearing broker’s customers, for the relevant account class, potentially resulting in losses to the Portfolio. Variation margin, which accounts for changes in market value, is exchanged daily, but may not be netted between futures and cleared OTC derivatives.
LIBOR Replacement Risk: LIBOR was the offered rate at which major international banks could obtain wholesale, unsecured funding. The terms of investments, financings or other transactions (including certain derivatives transactions) to which the Portfolio may be a party have historically been tied to LIBOR. In connection with the global transition away from LIBOR led by regulators and market participants, LIBOR was last published on a representative basis at the end of June 2023. The United Kingdom’s Financial Conduct Authority, which regulates LIBOR, has ceased publishing all LIBOR settings, but some USD LIBOR settings will continue to be published under a synthetic methodology until September 30, 2024 for certain legacy contracts. Alternative reference rates to LIBOR have been established in most major currencies (e.g., the Secured Overnight Financing Rate for U.S. dollar LIBOR and the Sterling Overnight Index Average for GBP LIBOR) and the transition to new reference rates continues. The full impact of the transition on the Portfolio, the financial instruments in which the Portfolio invests and financial markets more generally cannot yet be fully determined.
Additional risks associated with each type of investment are described above within the respective security type notes. The Portfolio’s prospectus includes a discussion of the principal risks of investing in the Portfolio.
BHFTII-28
Brighthouse Funds Trust II
MFS Total Return Portfolio
Notes to Financial Statements—December 31, 2023—(Continued)
5. Investment Transactions
Aggregate cost of purchases and proceeds of sales of investment securities, including mortgage dollar roll and TBA transactions but excluding short-term securities, for the year ended December 31, 2023 were as follows:
| Purchases |
Sales | |||||||||||
| U.S. Government |
Non-U.S. Government | U.S. Government | Non-U.S. Government | |||||||||
| $118,379,652 | $ | 77,254,775 | $ | 114,114,734 | $ | 134,752,976 | ||||||
Purchases and sales of mortgage dollar rolls and TBA transactions for the year ended December 31, 2023 were as follows:
| Purchases |
Sales | |||
| $60,158,113 | $ | 60,955,621 | ||
6. Investment Management Fees and Other Transactions with Affiliates
Investment Management Agreement - Brighthouse Investment Advisers is the investment adviser to the Portfolio. The Trust has entered into an investment management agreement with Brighthouse Investment Advisers with respect to the Portfolio. For providing investment management services to the Portfolio, Brighthouse Investment Advisers receives monthly compensation at the following annual rates:
|
Management Fees earned by |
% per annum | Average Daily Net Assets | ||||
| $3,488,528 | 0.600 | % | Of the first $250 million | |||
| 0.550 | % | Of the next $500 million | ||||
| 0.500 | % | On amounts in excess of $750 million | ||||
Brighthouse Investment Advisers has entered into an investment subadvisory agreement with respect to managing the Portfolio. Massachusetts Financial Services Company (the “Subadviser”) is compensated by Brighthouse Investment Advisers to provide subadvisory services for the Portfolio.
Management Fee Waiver - Pursuant to a management fee waiver agreement, the Adviser has agreed, for the period May 1, 2023 to April 30, 2024, to reduce its advisory fees set out above under “Investment Management Agreement” for each class of the Portfolio as follows:
| % per annum reduction |
Average Daily Net Assets | |
| 0.070% | $200 million to $250 million | |
| 0.020% | $250 million to $500 million | |
| 0.050% | $500 million to $1 billion | |
| 0.075% | $1 billion to $1.25 billion | |
| 0.025% | $1.25 billion to $1.5 billion | |
| (0.025)% | $1.5 billion to $3.84 billion |
An identical agreement was in place for the period April 29, 2022 to April 30, 2023. Amounts waived for the year ended December 31, 2023 are shown as a management fee waiver in the Statement of Operations.
During year ended December 31, 2023, the Subadviser voluntarily reimbursed the Portfolio for certain trading costs. This reimbursement amount of $5,446 is reflected as Other income in the Statement of Operations and had no impact on total return.
Certain officers and trustees of the Trust may also be officers of the Advisers; however, such officers and trustees receive no compensation from the Trust.
Transfer Agency Agreement - Brighthouse Life Insurance Company serves as the transfer agent for the Trust. Brighthouse Life Insurance Company receives no fees for its services to the Trust.
Distribution and Service Fees - The Trust has a distribution agreement with Brighthouse Securities, LLC (the “Distributor”) pursuant to which the Distributor serves as the general distributor of shares of each class (each a “Class”) of each Portfolio. The Distributor is an affiliate of the Trust. The Trust has adopted a Distribution and Services Plan (the “D&S Plan”) relating to Class B, Class D, Class E, Class F and Class G shares of each Portfolio, under Rule 12b-1 under the 1940 Act, pursuant to which the Trust may pay the Distributor a fee (the “Service Fee”) at an annual rate not to exceed 0.25% of each such Portfolio’s average daily net assets attributable to the Class B, Class D, Class E, Class F and Class G shares of the Trust. Each Portfolio may not offer shares of each Class. The D&S Plan also
BHFTII-29
Brighthouse Funds Trust II
MFS Total Return Portfolio
Notes to Financial Statements—December 31, 2023—(Continued)
authorizes the Trust, on behalf of each of its Portfolios, to pay to the Distributor a distribution fee (the “Distribution Fee” and together with the Service Fee, the “Fees”) at an annual rate of up to 0.25% of each Portfolio’s average daily net assets attributable to the Class B, Class D, Class E, Class F, and Class G shares in consideration of the services rendered in connection with the sale of such shares by the Distributor. Under the Distribution Agreement with respect to the Trust, Fees are currently paid at an annual rate of 0.25% of average daily net assets in the case of Class B shares, 0.10% of average daily net assets in the case of Class D shares, 0.15% of average daily net assets in the case of Class E shares, 0.20% of average daily net assets in the case of Class F shares and 0.30% of average daily net assets in the case of Class G shares. The D&S Plan is known as a “compensation plan” because the Trust makes payments to the Distributor for services rendered regardless of the actual level of expenditures by the Distributor. Amounts incurred by the Portfolio for the year ended December 31, 2023 are shown as Distribution and service fees in the Statement of Operations.
Deferred Trustee Compensation - Each Trustee who is not currently an employee of the Adviser or any of its affiliates receives compensation from the Trust for his or her service to the Trust. A deferred compensation plan (the “Plan”) is available to the Trustees on a voluntary basis. Deferred amounts remain in the Trust until distributed in accordance with the provisions of the Plan. The value of a participating Trustee’s deferral account is based on theoretical investments of deferred amounts on the normal payment dates in certain portfolios of the Trust or Brighthouse Funds Trust I, an affiliate of the Trust, as designated by the participating Trustee. Changes in the value of participants’ deferral accounts are reflected as a component of Trustees’ fees and expenses in the Statement of Operations. The portion of the accrued obligations allocated to the Portfolio under the Plan is reflected as Deferred trustees’ fees in the Statement of Assets and Liabilities.
7. Contractual Obligations
Under the Trust’s organizational documents, its officers and Trustees may be indemnified against certain liabilities and expenses arising out of the performance of their duties to the Trust. Additionally, the Trust has a variety of indemnification obligations under contracts with its service providers. The Trust’s maximum exposure under these arrangements is unknown, as this would involve future claims that may be made against the Trust that have not yet occurred.
8. Income Tax Information
The cost basis of investments for federal income tax purposes at December 31, 2023 was as follows:
| Cost basis of investments |
$ | 579,203,364 | ||
|
|
|
|||
| Gross unrealized appreciation |
102,410,696 | |||
| Gross unrealized (depreciation) |
(36,495,405 | ) | ||
|
|
|
|||
| Net unrealized appreciation (depreciation) |
$ | 65,915,291 | ||
|
|
|
The tax character of distributions paid for the years ended December 31, 2023 and 2022 were as follows:
| Ordinary Income |
Long-Term Capital Gain | Total | ||||||||||||||||||
| 2023 |
2022 | 2023 | 2022 | 2023 | 2022 | |||||||||||||||
| $12,611,575 | $ | 13,064,326 | $ | 31,461,307 | $ | 63,545,484 | $ | 44,072,882 | $ | 76,609,810 | ||||||||||
As of December 31, 2023, the components of distributable earnings (accumulated losses) on a federal income tax basis were as follows:
| Undistributed |
Undistributed Long-Term Capital Gain |
Net Unrealized Appreciation (Depreciation) |
Accumulated Capital Losses |
Total | ||||||||||||
| $14,891,215 | $ | 29,180,971 | $ | 65,925,092 | $ | — | $ | 109,997,278 | ||||||||
The Portfolio utilizes the provisions of the federal income tax laws that provide for the carryforward of capital losses for prior years, offsetting such losses against any future realized capital gains. Net capital losses may be carried forward indefinitely and their character is retained as short-term and/or long-term losses.
As of December 31, 2023, the Portfolio had no accumulated capital losses.
9. Recent Accounting Pronouncement & Regulatory Updates
In June 2022, FASB issued Accounting Standards Update 2022-03—Fair Value Measurement (Topic 820)—Fair Value Measurement of Equity Securities Subject to Contractual Sale Restrictions (“ASU 2022-03”). ASU 2022-03 clarifies the guidance in Topic 820 to indicate that a contractual sale restriction should not be considered in the fair value of an equity security subject to such a restriction,
BHFTII-30
Brighthouse Funds Trust II
MFS Total Return Portfolio
Notes to Financial Statements—December 31, 2023—(Continued)
and requires entities with investments in equity securities subject to contractual sale restrictions to disclose certain qualitative and quantitative information about such securities. ASU 2022-03 is effective for fiscal years, and interim periods within those fiscal years, beginning after December 15, 2023. ASU 2022-03 is only applicable to an equity security in which the contractual arrangement that restricts its sale is executed or modified on or after the adoption date.
Effective January 24, 2023, the Securities and Exchange Commission adopted rule and form amendments that require open-end management investment companies to transmit concise and visually engaging annual and semiannual reports to shareholders that highlight certain information deemed by the SEC to be particularly important for investors. Certain other information, including financial statements, will no longer appear in shareholder reports but will, as required, be available online, delivered free of charge upon request, and filed on a semiannual basis on Form N-CSR. The rule and form amendments have a compliance date of July 24, 2024. Accordingly, the rule and form amendments will not impact the Portfolio until its 2024 semiannual shareholder report.
BHFTII-31
Brighthouse Funds Trust II
MFS Total Return Portfolio
Report of Independent Registered Public Accounting Firm
To the Board of Trustees of Brighthouse Funds Trust II and Shareholders of the MFS Total Return Portfolio:
Opinion on the Financial Statements and Financial Highlights
We have audited the accompanying statement of assets and liabilities, including the schedule of investments, of the MFS Total Return Portfolio (the “Fund”) (one of the funds constituting the Brighthouse Funds Trust II), as of December 31, 2023, the related statement of operations for the year then ended, the statements of changes in net assets for each of the two years in the period then ended, the financial highlights for each of the five years in the period then ended, and the related notes. In our opinion, the financial statements and financial highlights present fairly, in all material respects, the financial position of the Fund as of December 31, 2023, and the results of its operations for the year then ended, the changes in its net assets for each of the two years in the period then ended, and the financial highlights for each of the five years in the period then ended in conformity with accounting principles generally accepted in the United States of America.
Basis for Opinion
These financial statements and financial highlights are the responsibility of the Fund’s management. Our responsibility is to express an opinion on the Fund’s financial statements and financial highlights based on our audits. We are a public accounting firm registered with the Public Company Accounting Oversight Board (United States) (PCAOB) and are required to be independent with respect to the Fund in accordance with the U.S. federal securities laws and the applicable rules and regulations of the Securities and Exchange Commission and the PCAOB.
We conducted our audits in accordance with the standards of the PCAOB. Those standards require that we plan and perform the audit to obtain reasonable assurance about whether the financial statements and financial highlights are free of material misstatement, whether due to error or fraud. The Fund is not required to have, nor were we engaged to perform, an audit of its internal control over financial reporting. As part of our audits we are required to obtain an understanding of internal control over financial reporting but not for the purpose of expressing an opinion on the effectiveness of the Fund’s internal control over financial reporting. Accordingly, we express no such opinion.
Our audits included performing procedures to assess the risks of material misstatement of the financial statements and financial highlights, whether due to error or fraud, and performing procedures that respond to those risks. Such procedures included examining, on a test basis, evidence regarding the amounts and disclosures in the financial statements and financial highlights. Our audits also included evaluating the accounting principles used and significant estimates made by management, as well as evaluating the overall presentation of the financial statements and financial highlights. Our procedures included confirmation of securities owned as of December 31, 2023, by correspondence with the custodian and brokers; when replies were not received from brokers, we performed other auditing procedures. We believe that our audits provide a reasonable basis for our opinion.
/s/ Deloitte & Touche LLP
Boston, Massachusetts
February 23, 2024
We have served as the auditor of one or more Brighthouse investment companies since 1983.
BHFTII-32
Brighthouse Funds Trust II
Trustees and Officers
MANAGEMENT OF THE TRUSTS
The Boards of Trustees (the “Board”) of Brighthouse Funds Trust I and Brighthouse Funds Trust II (“Trust I” and “Trust II”, respectively, and collectively the “Trusts”) supervise the Trusts and are responsible for representing the interests of shareholders. The Trustees, the Chairman of the Board and the Chairmen of each subcommittee are the same for both Trusts. The Trustees of each Trust meet periodically throughout the year to oversee the Portfolios’ activities, reviewing, among other things, each Portfolio’s performance and its contractual arrangements with various service providers. The Trustees of each Trust elect the officers of the Trust, who are responsible for administering the Trust’s day-to-day operations.
Trustees and Officers
The Trustees and executive officers of the Trusts, as well as their ages and their principal occupations during the past five years, are set forth below. Unless otherwise indicated, the business address of each is c/o Brighthouse Funds Trust I and Brighthouse Funds Trust II, 11225 N. Community House Rd., Charolette, North Carolina 28277. Each Trustee who is deemed an “interested person,” as such term is defined in the 1940 Act, is referred to as an “Interested Trustee.” Those Trustees who are not “interested persons,” as such term is defined in the 1940 Act, are referred to as “Independent Trustees.” There is no limit to the term a Trustee may serve, other than pursuant to the retirement policy adopted by the Independent Trustees. Trustees serve until their death, resignation, retirement or removal in accordance with Trust I’s and Trust II’s respective organizational documents and policies adopted by the Board of the Trust from time to time. Officers hold office at the pleasure of each Board and serve until their removal or resignation in accordance with the Trusts’ respective organizational documents and policies adopted by the Board of each Trust from time to time.
Trustees of the Trusts
| Name and Year of Birth |
Position(s) |
Term of Office |
Principal Occupation(s) During the Past |
Number of |
Other Directorships Held | |||||
| Interested Trustee | ||||||||||
| John Rosenthal* (1960) |
Trustee | Indefinite; From May 2016 (Trust I and Trust II) to present | Chief Investment Officer, Brighthouse Financial, Inc. (2016 to present). | 73 | None | |||||
| Independent Trustees | ||||||||||
| Dawn M. Vroegop (1966) |
Trustee and Chair of the Board | Indefinite; From December 2000 (Trust I)/May 2009 (Trust II) to present as Trustee; From May 2016 (Trust I and Trust II) until present as Chair |
Retired; Private Investor. | 73 | Trustee, Driehaus Mutual Funds (8 portfolios).** | |||||
| Stephen M. Alderman (1959) |
Trustee | Indefinite; From December 2000 (Trust I)/April 2012 (Trust II) to present | Vice President and General Counsel, IHR Aerial Solutions, LLC; Until 2022, General Counsel, Illini Hi-Reach, Inc.; Until 2020, Shareholder in the law firm of Garfield & Merel, Ltd. | 73 | None | |||||
| Robert J. Boulware (1956) |
Trustee | Indefinite; From March 2008 (Trust I)/April 2012 (Trust II) to present | Managing Member, Pilgrim Funds, LLC (private equity fund). | 73 | Trustee, Vertical Capital Income Fund (closed-end fund);** Trustee, The Private Shares Fund (closed-end fund);** Until 2021, Director, Mid-Con Energy Partners, LP (energy);** Until 2020, Director, Gainsco, Inc. (auto insurance).** | |||||
BHFTII-33
Brighthouse Funds Trust II
Trustees and Officers—(Continued)
| Name and Year of Birth |
Position(s) |
Term of Office |
Principal Occupation(s) During the Past |
Number of |
Other Directorships Held | |||||
| Susan C. Gause (1952) |
Trustee | Indefinite; From March 2008 (Trust I)/April 2012 (Trust II) to present | Private Investor. | 73 | Trustee, HSBC Funds (4 portfolios).** | |||||
| Nancy Hawthorne (1951) |
Trustee | Indefinite; From May 2003 (Trust II)/April 2012 (Trust I) to present | Private Investor. | 73 | Trustee, First Eagle Credit Opportunities Fund;** Trustee and Chair of the Board of Trustees, First Eagle Global Opportunities Fund;** Director, Avid Technology, Inc;** Director, CRA International, Inc.** | |||||
Executive Officers of the Trusts
| Name and Year of Birth |
Position(s) |
Term of Office |
Principal Occupation(s) | |||
| Kristi Slavin (1973) | President and Chief Executive Officer, of Trust I and Trust II | From May 2016 (Trust I and Trust II) to present |
President, Brighthouse Investment Advisers, LLC (2016-present). | |||
| Alan R. Otis (1971) | Chief Financial Officer and Treasurer, of Trust I and Trust II | From November 2017 (Trust I and Trust II) to present |
Executive Vice President, Brighthouse Investment Advisers, LLC (2017-present); formerly, Vice President, Brighthouse Investment Advisers, LLC (2012-2017); Assistant Treasurer, Trust I and Trust II (2012-2017). | |||
| Thomas Watterson (1985) | Secretary, of Trust I and Trust II | From November 2023 (Trust I and Trust II) to present |
Executive Vice President, Chief Legal Officer and Secretary, Brighthouse Investment Advisers, LLC (2023-Present); Managing Corporate Counsel, Brighthouse Financial Inc. (2023-present); Managing Counsel and Director, The Bank of New York Mellon Corporation (2019-2023); Counsel and Vice President, The Bank of New York Mellon Corporation (2016-2019). | |||
| Katie Hellmann (1980) | Chief Compliance Officer (“CCO”), of Trust I and Trust II | From May 2023 (Trust I and Trust II) to present |
Chief Compliance Officer, Brighthouse Investment Advisers, LLC (2023-present) and Head of Funds and Investments Compliance (2023-present). Deputy Chief Compliance Officer, Transamerica Asset Management (2022-2023). Leader and Senior Compliance Counsel – Funds Compliance, Edward Jones (2017-2022). | |||
| Rosemary Morgan (1983) | Anti-Money Laundering Officer, of Trust I and Trust II | From May 2023 (Trust I and Trust II) to present |
Chief Privacy Officer, Leader of Compliance Programs and Assistant General Counsel, Brighthouse Financial, Inc. (2019-2022); Chief Privacy Officer, Head of Compliance Programs & Contracts Law, Brighthouse Financial, Inc. (2022-2023), Chief Compliance Officer and Associate General Counsel, Brighthouse Financial, Inc. (2023-present); Vice President and Chief Compliance Officer, Brighthouse Life Insurance Company (2023-present); Vice President and Chief Compliance Officer (2023-present), Brighthouse Life Insurance Company of NY; Vice President and Chief Compliance Officer (2023-present), New England Life Insurance Company. | |||
| Anna Koska (1981) | Vice President, of Trust I and Trust II | From June 2022 (Trust I and Trust II) to present |
Vice President, Investment and Advisory Services, Brighthouse Investment Advisers, LLC (2022-present); Director of Investment and Advisory Services, Brighthouse Investment Advisers, LLC (2019-2022); Senior Portfolio Analyst, Brighthouse Investment Advisers, LLC (2017-2019). | |||
| * | Mr. Rosenthal is an “interested person” of the Trusts because of his position with Brighthouse Financial, Inc. (“Brighthouse Financial”), an affiliate of BIA. |
| ** | Indicates a directorship with a registered investment company or a company subject to the reporting requirements of the Securities Exchange Act of 1934, as amended. |
| (1) | Previous positions during the past five years with the Trusts, MetLife, Inc. or the Adviser are omitted if not materially different. |
| (2) | The Fund Complex includes 44 Trust I Portfolios and 29 Trust II Portfolios. |
BHFTII-34
Brighthouse Funds Trust II
MFS Total Return Portfolio
Board of Trustees’ Consideration of Advisory and Sub-Advisory Agreements
At a meeting held on November 13-14, 2023 (the “November Meeting”), the Boards of Trustees (the “Board”) of Brighthouse Funds Trust I and Brighthouse Funds Trust II (“BFT I” and “BFT II,” respectively, and collectively, the “Trusts”), including a majority of the Trustees who are not “interested persons” of the Trusts (the “Independent Trustees”) under the Investment Company Act of 1940 (the “1940 Act”), approved the continuation of the Trusts’ advisory agreements (each an “Advisory Agreement”) with Brighthouse Investment Advisers, LLC (the “Adviser”) and the applicable sub-advisory and sub-sub-advisory agreements (each a “Sub-Advisory Agreement” and collectively with the Advisory Agreement, the “Agreements”) between the Adviser and the investment sub-advisers and sub-sub-adviser (each a “Sub-Adviser,” and collectively, the “Sub-Advisers”) for the series of the Trusts (each a “Portfolio,” and collectively, the “Portfolios”) for the annual contract renewal period from January 1, 2024 through December 31, 2024.
The Board met with personnel of the Adviser on September 28-29, 2023 (the “September Meeting”) for the specific purpose of giving preliminary consideration to the proposed continuation of the Agreements, including consideration to information that the Adviser and Sub-Advisers had provided for the Board’s review at the request of the Independent Trustees. At the September Meeting, the Adviser reviewed with the Board the performance and fees experienced by each Portfolio, as well as other information. During and after the September Meeting, the Independent Trustees requested additional information and clarifications that the Adviser addressed at the November Meeting (the September Meeting and the November Meeting are referred to collectively as, the “Meetings”). During the contract renewal process, and throughout the year, the Independent Trustees were advised by independent legal counsel, and they met with independent legal counsel in executive sessions outside of the presence of management on a number of occasions to discuss, among other things, the renewal of the Agreements.
In considering the continuation of the Agreements, the Board reviewed a variety of materials that were provided for the specific purpose of assisting the Board in the renewal process, along with various information and materials that were provided to and discussed with the Board throughout the year, at regularly scheduled meetings of the Board and its committees. In particular, information for each Portfolio included, but was not limited to, reports on investment performance, expenses, legal and compliance matters, and asset pricing. Information about the Adviser and each Sub-Adviser included, but was not limited to, reports on the business, operations, and performance of the Adviser and the Sub-Advisers and reports that the Adviser and Sub-Advisers had prepared specifically for the renewal process.
In considering the continuation of the Agreements, the Board also reviewed, among other things, a report for each Portfolio that was prepared by Broadridge (“Broadridge”), an independent organization, which set forth comparative performance and expense information for each Portfolio. In addition, the Independent Trustees reviewed a report that was prepared by JDL Consultants, LLC (“JDL”), an independent consultant to the Independent Trustees, which examined the Broadridge reports for each Portfolio (“JDL Report”). The Independent Trustees met in executive session with representatives of JDL during the September Meeting to review the JDL Report.
At the November Meeting, the Board, including a majority of the Independent Trustees, concluded that the nature, extent, and quality of services provided by the Adviser and each Sub-Adviser supported the renewal of the Agreements. The Board also concluded that the investment services provided to and the performance of each Portfolio was such that each Agreement should continue, and that the fees paid by each Portfolio to the Adviser appeared to be reasonable in light of the nature, extent, and quality of the services provided by the Adviser and each Sub-Adviser. Further, the Board concluded that the Adviser’s profitability in providing services under the Advisory Agreements did not appear unreasonable in light of the nature, extent, and quality of the services provided by the Adviser. The Board reviewed the extent to which the investment advisory fees paid by the Portfolios shared economies of scale with investors or entailed the potential to share economies of scale with investors and concluded that those considerations generally supported the renewal of each Agreement. Finally, the Board considered the Adviser’s recommendation that it approve the renewal of each Sub-Advisory Agreement.
In approving the continuation of each Agreement, the Board, including the Independent Trustees, gave attention to all of the information that was furnished, and each Trustee placed varying degrees of importance on the various pieces of information that were provided to them. The Board evaluated the information provided to it on a Portfolio-by-Portfolio basis, and its decision was made separately with respect to each Portfolio. The following paragraphs provide more information about some of the primary factors that were relevant to the Board’s decisions. The Board did not identify any single factor as determinative, and the Trustees generally attributed different weights to various factors for the various Portfolios.
Nature, extent and quality of services. The Board evaluated the nature, extent, and quality of the services that the Adviser and the Sub-Advisers, as relevant, provided to the Portfolios. The Board considered the Adviser’s services as investment manager to the Portfolios, including its services relating to the hiring and oversight of the Sub-Advisers and, in particular, their investment programs and personnel, succession management of key personnel, trading practices, compliance programs and personnel, and risk management
BHFTII-35
Brighthouse Funds Trust II
MFS Total Return Portfolio
Board of Trustees’ Consideration of Advisory and Sub-Advisory Agreements—(Continued)
programs, among other things. The Adviser’s services in coordinating and overseeing the activities of the Trusts’ other service providers were also considered. The Board also considered the systems and processes required by the Adviser to meet additional regulatory and compliance requirements resulting from U.S. Securities and Exchange Commission and other regulatory initiatives, including related to liquidity, valuation, and derivatives risk management. The Board considered information received from the Trusts’ Chief Compliance Officer regarding the Portfolios’ compliance policies and procedures that were established pursuant to Rule 38a-l under the 1940 Act, and relevant aspects of the Adviser’s and Sub-Advisers’ compliance policies and procedures. The Board also noted that it was the practice of the Adviser’s investment, compliance, and legal staff to conduct periodic meetings (through various media) with the Sub-Advisers throughout the year in order to review and assess the services that are provided to the Portfolios, and that personnel of the Adviser routinely prepare and present reports to the Board regarding those meetings. In addition, during the Meetings and throughout the year, the Board considered the expertise, experience, and performance of the personnel of the Adviser who performed the various services that are mentioned above.
With respect to the services provided by each of the Sub-Advisers, the Board considered a variety of information that the Adviser and each Sub-Adviser prepared for the Board’s review. The Board considered each Sub-Adviser’s investment process, each Sub-Adviser’s overall organization and business plans and the investment performance experienced by the Portfolio (as described in more detail below). The Board took into account that each Sub-Adviser’s responsibilities include, among other things, the development and maintenance of an investment program for the applicable Portfolio, the selection of investments and the placement of orders for the purchase and sale of such assets, and the implementation of compliance controls related to the performance of these services. The Board considered, based on the information provided, each Sub-Adviser’s staffing with respect to the management of the Portfolio and other information relating to the Sub-Adviser’s business and operations. The Board also considered the Sub-Adviser’s overall resources and information with respect to any recent turnover of key personnel at the Sub-Adviser. The Board reviewed each Sub-Adviser’s investment experience, as well as information provided regarding the Sub-Adviser’s personnel who provide services to the Portfolios. The Board also considered, among other things, information about each Sub-Adviser’s compliance program, including regarding any compliance matters involving a Sub-Adviser that had been brought to the Board’s attention during the year, as well as the Adviser’s assessment of the financial condition of each Sub-Adviser.
Performance. The Board placed emphasis on the performance of each Portfolio in the context of the performance of the relevant markets in which the Portfolio invests. The Board considered the Adviser’s quarterly presentations to the Board of detailed information about each Portfolio’s investment strategies and performance results and composition, including discussions regarding the relevant effects of market conditions. The Board reviewed and considered the reports prepared by Broadridge, which provided a statistical analysis comparing each Portfolio’s investment performance to that of comparable funds underlying variable insurance products (the “Performance Universe”), and the JDL Report. The Board also compared the performance of each Portfolio to that of comparable funds and other accounts that were managed by the relevant Sub-Adviser, to the extent such information was provided. The Board considered each Portfolio’s performance for periods subsequent to the performance period covered by the Broadridge reports and considered the Adviser’s assessment of the same. The Board also noted that while it found the data provided by Broadridge generally useful, it recognized the limitations of such data, including, in particular, that notable differences may exist between a Portfolio and the other funds in a Broadridge category (for example, with respect to investment strategies) and that the results of the performance comparisons may vary depending on (i) the end dates for the performance periods that were selected and (ii) the selection of the peer groups.
The Board focused particular attention on Portfolios with less favorable performance records. The Board noted the Adviser’s focus on each Sub-Adviser’s performance and that the Adviser had been active in monitoring and responding to any performance issues with respect to the Portfolios.
Fees and Expenses. The Board gave consideration to the level and method of computing the fees payable under the Agreements. The Board reviewed and considered the information in the JDL Report concerning fees and expenses. The Board also reviewed and considered the Broadridge report for each Portfolio, which included various comparisons of the Portfolio’s fees (at December 31, 2022 and various asset levels) and expenses with those of its peers, including, as applicable, a broad group of peer funds (“Expense Universe”), a narrower group of peer funds (“Expense Group”), a broad group of peer sub-advised funds (“Sub-advised Expense Universe”), and a narrower group of peer sub-advised funds (“Sub-advised Expense Group”). In particular, the Board reviewed comparisons of each Portfolio’s contractual management fees with its Expense Group and Sub-advised Expense Universe, contractual sub-adviser fees with its Sub-advised Expense Universe and Sub-advised Expense Group, and total expenses with its Expense Universe, Expense Group and Sub-advised Expense Universe. The Board considered that Broadridge selected the peer funds, which were funds underlying variable insurance products that Broadridge deemed to be comparable to the Portfolios. The Board considered that the fee and expense information in the Broadridge report for each Portfolio reflected information as of the Portfolio’s most recent fiscal year
BHFTII-36
Brighthouse Funds Trust II
MFS Total Return Portfolio
Board of Trustees’ Consideration of Advisory and Sub-Advisory Agreements—(Continued)
end at the time the Broadridge report was issued and that historical asset levels may differ from current asset levels, particularly in a period of market volatility. In addition, the Board compared the fee payable to a Sub-Adviser by the Adviser with respect to the Portfolio to the fee payable to the Sub-Adviser by other comparable funds and other accounts, to the extent such information was provided.
The Board noted that the sub-advisory fees for the Portfolios are negotiated at arm’s length by the Adviser and are paid by the Adviser out of its advisory fees. The Board also considered that the Adviser had entered into expense limitation or management fee waiver agreements with certain of the Portfolios pursuant to which the Adviser had agreed to waive a portion of its advisory fee and/or reimburse certain expenses as a means of limiting a Portfolio’s total annual operating expenses or passing through the benefit of a subadvisory fee concession to a Portfolio, as applicable.
Profitability. The Board examined the profitability to the Adviser of each Advisory Agreement, on a Portfolio-by-Portfolio basis. The Board also considered that an affiliate of the Adviser, Brighthouse Securities, LLC, serves as distributor for the Trusts, and, as such, receives Rule 12b-1 payments to support the distribution of the Portfolios. The Board considered the profitability to the Sub-Advisers and their affiliates of their relationships with the Portfolios, to the extent provided, and the Board considered the ability of the Adviser to negotiate with a Sub-Adviser at arm’s length. In reviewing the profitability information, the Board recognized that expense allocation methodologies are inherently subjective and various methodologies may be reasonable while producing different results.
Economies of scale. The Board considered each Portfolio’s fees in light of its size. The Board noted the fee schedules for the Portfolios that contain breakpoints that reduce the fee rate above specified asset levels, including breakpoints in the Advisory Agreements and any corresponding Sub-Advisory Agreement. The Board noted those Portfolios that did not have breakpoints in their advisory fees and considered management’s explanation of the same.
The Board considered the effective fees under the Advisory Agreement and Sub-Advisory Agreement for each Portfolio as a percentage of assets at different asset levels and possible economies of scale that may be realized if the assets of the Portfolio grow. The Board examined, among other data, the effect of a Portfolio’s growth in size, and reduction in size, on various fee schedules. The Board also generally noted that if a Portfolio’s assets increase over time, the Portfolio may realize economies of scale if assets increase proportionally more than certain other expenses.
Other factors. The Board considered other benefits that may be realized by the Adviser and its affiliates from their relationships with the Trusts. Among the benefits realized by the Adviser, the Board recognized that Brighthouse Securities, LLC, as the distributor for the Trusts, receives payments pursuant to Rule 12b-1 from the Portfolios to help compensate for the provision of shareholder services and distribution activities. The Board considered that a Sub-Adviser may engage in soft dollar transactions in managing a Portfolio. In addition, the Board considered that a Sub-Adviser may be affiliated with registered broker-dealers that may, from time to time, receive brokerage commissions from a Portfolio in connection with the sale of portfolio securities (subject to applicable best execution obligations). The Board also considered that a Sub-Adviser and its affiliates could benefit from the opportunity to provide advisory services to additional portfolios of the Trusts and overall reputational benefits.
The Board considered information from the Adviser and Sub-Advisers pertaining to potential conflicts of interest, and the manner in which any potential conflicts were mitigated. In its review, the Board considered information regarding various business relationships among the Adviser and its affiliates and various Sub-Advisers and their affiliates. The Board also considered information about services and/or payments provided to the Adviser by the Sub-Advisers in connection with marketing activities. The Board considered representations from the Adviser that such business relationships and any payments were not considered in the Adviser’s recommendation to renew any of the Sub-Advisory Agreements.
* * * * *
MFS Total Return Portfolio. The Board also considered the following information in relation to the Agreements with the Adviser and Massachusetts Financial Services Company regarding the Portfolio:
Among other data relating specifically to the Portfolio’s performance, the Board considered that the Portfolio underperformed the median of its Performance Universe and the average of its Morningstar Category for the one-year period ended June 30, 2023 and outperformed the median of its Performance Universe and the average of its Morningstar Category for the three- and five-year periods ended June 30, 2023. The Board further considered that the Portfolio underperformed its blended benchmark, the S&P 500 Index (60%) and Bloomberg U.S. Aggregate Bond Index (40%), for the one- and five-year periods ended October 31, 2023 and outperformed its blended benchmark for the three-year period ended October 31, 2023. The Board also noted the presence of certain management fee waivers in effect for the Portfolio.
BHFTII-37
Brighthouse Funds Trust II
MFS Total Return Portfolio
Board of Trustees’ Consideration of Advisory and Sub-Advisory Agreements—(Continued)
The Board also considered that the Portfolio’s actual management fees and total expenses (exclusive of 12b-l fees) were below the Expense Group median, the Expense Universe median, and the Sub-advised Expense Universe median. The Board noted that the Portfolio’s contractual management fees were below the asset-weighted average of the Investment Classification/Morningstar Category selected by Broadridge at the Portfolio’s current size. The Board also noted that the Portfolio’s contractual sub-advisory fees were above the averages of the Sub-advised Expense Group and the Sub-advised Expense Universe at the Portfolio’s current size.
BHFTII-38
Brighthouse Funds Trust II
MFS Value Portfolio
Managed by Massachusetts Financial Services Company
Portfolio Manager Commentary*
PERFORMANCE
For the twelve months ended December 31, 2023, the Class A, B, D and E shares of the MFS Value Portfolio returned 8.15%, 7.85%, 8.00%, and 7.97%, respectively. The Portfolio’s benchmark, the Russell 1000 Value Index¹, returned 11.46%.
MARKET ENVIRONMENT / CONDITIONS
During the reporting period, central banks around the world had to combat the strongest inflationary pressures in four decades, fueled by the global fiscal response to the pandemic, disrupted supply chains and dislocations to energy markets stemming from the war in Ukraine. Interest rates rose substantially, but the effects of tighter monetary policy may not be fully experienced yet, given that monetary policy works with long and variable lags. Strains resulting from the abrupt tightening of monetary policy began to affect some parts of the economy, most acutely among small and regional U.S. banks, which suffered from deposit flight as depositors sought higher yields on their savings. Additionally, activity in the U.S. housing sector slowed as a result of higher mortgage rates. China’s abandonment of its zero-COVID policy ushered in a brief uptick in economic activity in the world’s second-largest economy in early 2023, although its momentum soon stalled as the focus turned to the country’s highly indebted property development sector. In developed markets, consumer demand for services remained stronger than the demand for goods.
Early on, policymakers found themselves in the difficult position of trying to restrain inflation without tipping economies into recession. Despite the challenging macroeconomic and geopolitical environment, central banks focused on controlling price pressures while also confronting increasing financial stability concerns. Central banks had to juggle achieving their inflation mandates while using macroprudential tools to keep banking systems liquid, a potentially difficult balancing act, and one that suggested that we may be nearing a peak in policy rates. As inflationary pressures eased toward the end of the period, financial conditions loosened in anticipation of easier monetary policy, boosting the market’s appetite for risk. Rapid advancements in artificial intelligence were a focus for investors.
Normalizing supply chains, low levels of unemployment across developed markets, and signs that inflation levels have peaked were supportive factors for the macroeconomic backdrop.
PORTFOLIO REVIEW / PERIOD END POSITIONING
The Portfolio underperformed its benchmark, the Russell 1000 Value Index (the “Index”), during the reporting period. An underweight position and, to a lesser extent, stock selection in the Communication Services sector detracted most from relative performance. Within this sector, not holding shares of social networking service provider Meta Platforms and technology company Alphabet hindered relative performance. Both companies transitioned out of the Index during the annual reconstitution in June.
Stock selection in the Industrials sector also weakened relative returns. Within this sector, the Portfolio’s overweight position in global security company Northrop Grumman and not owning shares of diversified technology and financial services company General Electric detracted from relative returns.
Stock selection and an underweight position in the Information Technology (“IT”) sector weighed on relative performance. Within this sector, not holding shares of semiconductor company Intel and customer information software manager Salesforce dampened relative results.
Elsewhere, the Portfolio’s overweight positions in pharmaceutical giant Pfizer, global health services provider Cigna, energy products and services supplier Dominion Energy, and holding shares of premium drinks distributor Diageo (United Kingdom) detracted from relative returns.
Conversely, an underweight position and stock selection in the Energy sector contributed to relative results. Within this sector, an underweight position in integrated energy company Chevron and not holding shares of integrated oil and gas company ExxonMobil bolstered relative performance.
Stock selection in the Consumer Discretionary sector also supported relative results led by the Portfolio’s position in hotel and residential properties operator Marriott International.
Individual stocks in other sectors that aided relative performance included semiconductor industry services provider KLA, IT servicing firm Accenture, semiconductor solutions provider NXP Semiconductors (Netherlands), and overweight positions in leading diversified industrial manufacturer Eaton and global financial services firm JPMorgan Chase. Additionally, not holding shares of electricity provider NextEra Energy and pharmaceutical company Bristol-Myers Squibb further supported relative results.
During the reporting period, the Portfolio’s relative currency exposure, resulting primarily from differences in holdings of securities denominated in foreign currencies, was another contributor to relative performance.
BHFTII-1
Brighthouse Funds Trust II
MFS Value Portfolio
Managed by Massachusetts Financial Services Company
Portfolio Manager Commentary*—(Continued)
Over the trailing twelve months, the Portfolio’s absolute exposure to IT, Energy, and Real Estate increased. Conversely, exposure to Health Care, Industrials, and Materials decreased. At the end of the period, the Portfolio’s top overweights relative to the Index included the Financials, Utilities, and Industrials sectors, while the Portfolio was most underweight Real Estate, Energy, and Consumer Discretionary.
Nevin P. Chitkara
Katherine Cannan
Portfolio Managers
Massachusetts Financial Services Company
* This commentary may include statements that constitute “forward-looking statements” under the U.S. securities laws. Forward-looking statements include, among other things, projections, estimates, and information about possible or future results related to the Portfolio, market or regulatory developments. The views expressed above are not guarantees of future performance or economic results and involve certain risks, uncertainties and assumptions that could cause actual outcomes and results to differ materially from the views expressed herein. The views expressed above are subject to change at any time based upon economic, market, or other conditions and the subadvisory firm undertakes no obligation to update the views expressed herein. Any discussions of specific securities should not be considered a recommendation to buy or sell those securities. The views expressed above (including any forward-looking statement) may not be relied upon as investment advice or as an indication of the Portfolio’s trading intent. Information about the Portfolio’s holdings, asset allocation or country diversification is historical and is not an indication of future Portfolio composition, which may vary. Direct investment in any index is not possible. The performance of any index mentioned in this commentary has not been adjusted for ongoing management, distribution and operating expenses, and sales charges applicable to mutual fund investments. In addition, the returns do not reflect additional fees charged by separate accounts or variable insurance contracts that an investor in the Portfolio may pay. If these additional fees were reflected, performance would have been lower.
¹ The Russell 1000 Value Index is an unmanaged measure of the largest capitalized U.S. domiciled companies with a less than average growth orientation. Companies in this Index generally have a low price-to-book and price-to-earnings ratio, higher dividend yields and lower forecasted growth values.
BHFTII-2
Brighthouse Funds Trust II
MFS Value Portfolio
A $10,000 INVESTMENT COMPARED TO THE RUSSELL 1000 VALUE INDEX
AVERAGE ANNUAL RETURNS (%) FOR THE YEAR ENDED DECEMBER 31, 2023
| 1 Year | 5 Year | 10 Year | ||||||||||
| MFS Value Portfolio | ||||||||||||
| Class A |
8.15 | 11.55 | 8.78 | |||||||||
| Class B |
7.85 | 11.27 | 8.51 | |||||||||
| Class D |
8.00 | 11.43 | 8.67 | |||||||||
| Class E |
7.97 | 11.39 | 8.62 | |||||||||
| Russell 1000 Value Index | 11.46 | 10.91 | 8.40 | |||||||||
Portfolio performance is calculated including reinvestment of all income and capital gain distributions. Performance numbers are net of all Portfolio expenses but do not include any insurance, sales, separate account or administrative charges of variable annuity or life insurance contracts or any additional expenses that participants may bear relating to the operations of their plans. If these charges were included, the returns would be lower. The performance of any index referenced above has not been adjusted for ongoing management, distribution and operating expenses, and sales charges applicable to mutual fund investments. Direct investment in any index is not possible. The performance of Class A shares, as set forth in the line graph above, will differ from that of other classes because of the difference in expenses paid by policyholders investing in the different share classes.
This information represents past performance and is not indicative of future results. Investment return and principal value may fluctuate so that shares, upon redemption, may be worth more or less than the original cost.
PORTFOLIO COMPOSITION AS OF DECEMBER 31, 2023
Top Holdings
| % of Net Assets |
||||
| JPMorgan Chase & Co. | 4.4 | |||
| Cigna Group | 2.9 | |||
| Progressive Corp. | 2.8 | |||
| ConocoPhillips | 2.7 | |||
| Comcast Corp. - Class A | 2.5 | |||
| Marsh & McLennan Cos., Inc. | 2.4 | |||
| McKesson Corp. | 2.2 | |||
| Northrop Grumman Corp. | 2.2 | |||
| Johnson & Johnson | 2.2 | |||
| Aon PLC - Class A | 2.2 | |||
Top Sectors
| % of Net Assets |
||||
| Financials | 25.1 | |||
| Industrials | 16.6 | |||
| Health Care | 14.6 | |||
| Information Technology | 8.5 | |||
| Consumer Staples | 7.8 | |||
| Utilities | 7.6 | |||
| Energy | 5.8 | |||
| Consumer Discretionary | 3.5 | |||
| Materials | 3.5 | |||
| Communication Services | 3.3 | |||
BHFTII-3
Brighthouse Funds Trust II
MFS Value Portfolio
Understanding Your Portfolio’s Expenses
Shareholder Expense Example
As a shareholder of the Portfolio, you incur ongoing costs, including management fees; distribution and service (12b-1) fees; and other Portfolio expenses. This example is intended to help you understand your ongoing costs (in dollars) (referred to as “expenses”) of investing in the Portfolio and compare these costs with the ongoing costs of investing in other mutual funds. The example is based on an investment of $1,000 invested at the beginning of the period and held for the entire period, July 1, 2023 through December 31, 2023.
Actual Expenses
The first line for each share class of the Portfolio in the table below provides information about actual account values and actual expenses. You may use the information in this line, together with the amount you invested in the particular share class of the Portfolio, to estimate the expenses that you paid over the period. Simply divide your account value by $1,000 (for example, an $8,600 account value divided by $1,000 = 8.6), then multiply the result by the number in the first line under the heading entitled “Expenses Paid During Period” to estimate the expenses you paid on your account during this period.
Hypothetical Example for Comparison Purposes
The second line for each share class of the Portfolio in the table below provides information about hypothetical account values and hypothetical expenses based on the Portfolio’s actual expense ratio and an assumed rate of return of 5% per year before expenses, which is not the Portfolio’s actual return. The hypothetical account values and expenses may not be used to estimate the actual ending account balance or expenses you paid for the period. You may use this information to compare the ongoing costs of investing in the Portfolio and other funds. To do so, compare this 5% hypothetical example with the 5% hypothetical examples that appear in the shareholder reports of the other funds.
Please note that the expenses shown in the table are meant to highlight your ongoing costs only and do not reflect any fees or charges of your variable insurance product or any additional expenses that participants in certain eligible qualified plans may bear relating to the operations of their plan. Therefore, the second line for each share class in the table is useful in comparing ongoing costs only, and will not help you determine the relative total costs of owning different funds. In addition, if these other costs were included, your costs would have been higher.
| MFS Value Portfolio |
Annualized Expense Ratio |
Beginning Account Value July 1, 2023 |
Ending Account Value December 31, 2023 |
Expenses Paid During Period** July 1, 2023 to December 31, 2023 |
||||||||||||||
| Class A (a) |
Actual | 0.58% | $1,000.00 | $1,059.40 | $3.01 | |||||||||||||
| Hypothetical* | 0.58% | $1,000.00 | $1,022.28 | $2.96 | ||||||||||||||
| Class B (a) |
Actual | 0.83% | $1,000.00 | $1,057.50 | $4.30 | |||||||||||||
| Hypothetical* | 0.83% | $1,000.00 | $1,021.02 | $4.23 | ||||||||||||||
| Class D (a) |
Actual | 0.68% | $1,000.00 | $1,058.90 | $3.53 | |||||||||||||
| Hypothetical* | 0.68% | $1,000.00 | $1,021.78 | $3.47 | ||||||||||||||
| Class E (a) |
Actual | 0.73% | $1,000.00 | $1,058.40 | $3.79 | |||||||||||||
| Hypothetical* | 0.73% | $1,000.00 | $1,021.53 | $3.72 | ||||||||||||||
| * | Hypothetical assumes a rate of return of 5% per year before expenses. |
| ** | Expenses paid are equal to the Portfolio’s annualized expense ratio for the most recent six month period, as shown above, multiplied by the average account value over the period, multiplied by the number of days (184 days) in the most recent fiscal half-year, divided by 365 (to reflect the one-half year period). |
| (a) | The annualized expense ratio shown reflects the impact of the management fee waiver as described in Note 5 of the Notes to Financial Statements. |
BHFTII-4
Brighthouse Funds Trust II
MFS Value Portfolio
Schedule of Investments as of December 31, 2023
Common Stocks—98.5% of Net Assets
| Security Description | Shares | Value | ||||||
| Aerospace & Defense—5.7% | ||||||||
| General Dynamics Corp. |
202,396 | $ | 52,556,170 | |||||
| Northrop Grumman Corp. |
132,037 | 61,811,801 | ||||||
| RTX Corp. |
510,858 | 42,983,592 | ||||||
|
|
|
|||||||
| 157,351,563 | ||||||||
|
|
|
|||||||
| Banks—6.8% | ||||||||
| Citigroup, Inc. |
701,033 | 36,061,138 | ||||||
| JPMorgan Chase & Co. |
726,065 | 123,503,656 | ||||||
| PNC Financial Services Group, Inc. |
200,644 | 31,069,723 | ||||||
|
|
|
|||||||
| 190,634,517 | ||||||||
|
|
|
|||||||
| Beverages—2.5% | ||||||||
| Diageo PLC |
989,970 | 35,949,967 | ||||||
| PepsiCo, Inc. (a) |
205,853 | 34,962,074 | ||||||
|
|
|
|||||||
| 70,912,041 | ||||||||
|
|
|
|||||||
| Biotechnology—1.2% | ||||||||
| AbbVie, Inc. |
214,431 | 33,230,372 | ||||||
|
|
|
|||||||
| Building Products—1.5% | ||||||||
| Johnson Controls International PLC |
315,697 | 18,196,775 | ||||||
| Trane Technologies PLC |
93,992 | 22,924,649 | ||||||
|
|
|
|||||||
| 41,121,424 | ||||||||
|
|
|
|||||||
| Capital Markets—5.5% | ||||||||
| BlackRock, Inc. |
39,532 | 32,092,078 | ||||||
| KKR & Co., Inc. (a) |
300,380 | 24,886,483 | ||||||
| Morgan Stanley |
585,905 | 54,635,641 | ||||||
| Nasdaq, Inc. |
708,682 | 41,202,771 | ||||||
|
|
|
|||||||
| 152,816,973 | ||||||||
|
|
|
|||||||
| Chemicals—3.4% | ||||||||
| Corteva, Inc. |
292,520 | 14,017,558 | ||||||
| DuPont de Nemours, Inc. |
521,361 | 40,108,302 | ||||||
| PPG Industries, Inc. |
140,774 | 21,052,752 | ||||||
| Sherwin-Williams Co. |
66,838 | 20,846,772 | ||||||
|
|
|
|||||||
| 96,025,384 | ||||||||
|
|
|
|||||||
| Commercial Services & Supplies—0.1% | ||||||||
| Veralto Corp. (a) |
17,323 | 1,424,990 | ||||||
|
|
|
|||||||
| Consumer Finance — 1.9% | ||||||||
| American Express Co. |
275,257 | 51,566,646 | ||||||
|
|
|
|||||||
| Consumer Staples Distribution & Retail—1.3% | ||||||||
| Target Corp. |
264,002 | 37,599,165 | ||||||
|
|
|
|||||||
| Electric Utilities—6.4% | ||||||||
| American Electric Power Co., Inc. (a) |
162,117 | 13,167,143 | ||||||
| Duke Energy Corp. (a) |
516,131 | 50,085,352 | ||||||
| Exelon Corp. |
562,171 | 20,181,939 | ||||||
| PG&E Corp. (a) |
1,195,199 | 21,549,438 | ||||||
| Southern Co. |
706,691 | 49,553,173 | ||||||
| Xcel Energy, Inc. |
374,623 | 23,192,910 | ||||||
|
|
|
|||||||
| 177,729,955 | ||||||||
|
|
|
|||||||
| Electrical Equipment—1.5% | ||||||||
| Eaton Corp. PLC |
167,964 | 40,449,090 | ||||||
|
|
|
|||||||
| Food Products—1.8% | ||||||||
| Archer-Daniels-Midland Co. (a) |
102,546 | 7,405,872 | ||||||
| Nestle SA |
367,552 | 42,539,503 | ||||||
|
|
|
|||||||
| 49,945,375 | ||||||||
|
|
|
|||||||
| Ground Transportation—2.7% | ||||||||
| Canadian National Railway Co. |
131,729 | 16,549,114 | ||||||
| Union Pacific Corp. |
243,355 | 59,772,855 | ||||||
|
|
|
|||||||
| 76,321,969 | ||||||||
|
|
|
|||||||
| Health Care Equipment & Supplies—2.3% | ||||||||
| Abbott Laboratories |
263,328 | 28,984,513 | ||||||
| Boston Scientific Corp. (b) |
331,315 | 19,153,320 | ||||||
| Medtronic PLC |
182,702 | 15,050,991 | ||||||
|
|
|
|||||||
| 63,188,824 | ||||||||
|
|
|
|||||||
| Health Care Providers & Services—5.7% | ||||||||
| Cigna Group |
265,079 | 79,377,907 | ||||||
| Elevance Health, Inc. |
34,762 | 16,392,369 | ||||||
| McKesson Corp. |
135,080 | 62,539,338 | ||||||
|
|
|
|||||||
| 158,309,614 | ||||||||
|
|
|
|||||||
| Hotels, Restaurants & Leisure—1.4% | ||||||||
| Marriott International, Inc. - Class A |
178,634 | 40,283,753 | ||||||
|
|
|
|||||||
| Household Products—1.0% | ||||||||
| Kimberly-Clark Corp. |
162,999 | 19,806,008 | ||||||
| Reckitt Benckiser Group PLC |
129,636 | 8,943,553 | ||||||
|
|
|
|||||||
| 28,749,561 | ||||||||
|
|
|
|||||||
| Industrial Conglomerates—1.8% | ||||||||
| Honeywell International, Inc. |
236,263 | 49,546,714 | ||||||
|
|
|
|||||||
| Industrial REITs—1.9% | ||||||||
| Prologis, Inc. |
389,619 | 51,936,213 | ||||||
|
|
|
|||||||
| Insurance—10.9% | ||||||||
| Aon PLC - Class A |
206,304 | 60,038,590 | ||||||
| Chubb Ltd. |
229,596 | 51,888,696 | ||||||
| Marsh & McLennan Cos., Inc. |
355,107 | 67,282,123 | ||||||
| Progressive Corp. |
493,244 | 78,563,905 | ||||||
| Travelers Cos., Inc. |
238,296 | 45,393,005 | ||||||
|
|
|
|||||||
| 303,166,319 | ||||||||
|
|
|
|||||||
| IT Services—2.1% | ||||||||
| Accenture PLC - Class A |
165,397 | 58,039,461 | ||||||
|
|
|
|||||||
| Machinery—2.4% | ||||||||
| Illinois Tool Works, Inc. (a) |
149,129 | 39,062,850 | ||||||
| Otis Worldwide Corp. |
102,988 | 9,214,336 | ||||||
| PACCAR, Inc. |
191,673 | 18,716,869 | ||||||
|
|
|
|||||||
| 66,994,055 | ||||||||
|
|
|
|||||||
See accompanying notes to financial statements.
BHFTII-5
Brighthouse Funds Trust II
MFS Value Portfolio
Schedule of Investments as of December 31, 2023
Common Stocks—(Continued)
| Security Description | Shares/ Principal Amount* |
Value | ||||||
| Media—3.3% | ||||||||
| Charter Communications, Inc. - Class A (a) (b) |
55,092 | $ | 21,413,159 | |||||
| Comcast Corp. - Class A |
1,601,413 | 70,221,960 | ||||||
|
|
|
|||||||
| 91,635,119 | ||||||||
|
|
|
|||||||
| Multi-Utilities—1.2% | ||||||||
| Dominion Energy, Inc. (a) |
700,824 | 32,938,728 | ||||||
|
|
|
|||||||
| Oil, Gas & Consumable Fuels—5.8% | ||||||||
| Chevron Corp. |
141,923 | 21,169,235 | ||||||
| ConocoPhillips |
648,495 | 75,270,815 | ||||||
| EOG Resources, Inc. |
204,604 | 24,746,854 | ||||||
| Pioneer Natural Resources Co. |
182,663 | 41,077,255 | ||||||
|
|
|
|||||||
| 162,264,159 | ||||||||
|
|
|
|||||||
| Personal Care Products—1.1% | ||||||||
| Kenvue, Inc. |
1,364,174 | 29,370,666 | ||||||
|
|
|
|||||||
| Pharmaceuticals—5.4% | ||||||||
| Johnson & Johnson |
393,538 | 61,683,146 | ||||||
| Merck & Co., Inc. |
335,002 | 36,521,918 | ||||||
| Pfizer, Inc. |
1,556,784 | 44,819,811 | ||||||
| Roche Holding AG |
29,483 | 8,545,121 | ||||||
|
|
|
|||||||
| 151,569,996 | ||||||||
|
|
|
|||||||
| Professional Services—1.0% | ||||||||
| Equifax, Inc. (a) |
115,767 | 28,628,021 | ||||||
|
|
|
|||||||
| Semiconductors & Semiconductor Equipment—6.4% | ||||||||
| Analog Devices, Inc. |
281,625 | 55,919,460 | ||||||
| KLA Corp. |
82,893 | 48,185,701 | ||||||
| NXP Semiconductors NV |
145,541 | 33,427,857 | ||||||
| Texas Instruments, Inc. |
243,539 | 41,513,658 | ||||||
|
|
|
|||||||
| 179,046,676 | ||||||||
|
|
|
|||||||
| Specialized REITs—0.4% | ||||||||
| Public Storage |
34,049 | 10,384,945 | ||||||
|
|
|
|||||||
| Specialty Retail—2.1% | ||||||||
| Lowe’s Cos., Inc. |
259,911 | 57,843,193 | ||||||
|
|
|
|||||||
| Total Common Stocks |
2,741,025,481 | |||||||
|
|
|
|||||||
| Short-Term Investments—1.4% |
| |||||||
| Discount Note—1.4% | ||||||||
| Federal Home Loan Bank |
39,647,000 | 39,624,049 | ||||||
|
|
|
|||||||
| Repurchase Agreement—0.0% | ||||||||
| Fixed Income Clearing Corp. |
74,121 | 74,121 | ||||||
|
|
|
|||||||
| Total Short-Term Investments |
39,698,170 | |||||||
|
|
|
|||||||
| Securities Lending Reinvestments (d)—1.1% |
| |||||||
| Security Description | Shares/ Principal |
Value | ||||||
| Certificate of Deposit—0.1% | ||||||||
| Bank of America NA |
2,000,000 | 2,000,458 | ||||||
|
|
|
|||||||
| Repurchase Agreements—0.7% | ||||||||
| Bank of Nova Scotia |
2,000,000 | 2,000,000 | ||||||
| Barclays Bank PLC |
900,000 | 900,000 | ||||||
| Citigroup Global Markets, Inc. |
4,000,000 | 4,000,000 | ||||||
| Deutsche Bank Securities, Inc. |
3,612,464 | 3,612,464 | ||||||
| NBC Global Finance Ltd. |
4,200,000 | 4,200,000 | ||||||
| Royal Bank of Canada Toronto |
1,000,000 | 1,000,000 | ||||||
| Societe Generale |
2,900,000 | 2,900,000 | ||||||
| Repurchase Agreement dated 12/29/23 at 5.330%, due on 01/02/24 with a maturity value of $600,355; collateralized by U.S. Treasury Obligations with rates ranging from 0.625% - 5.240%, maturity dates ranging from 04/30/24 - 05/15/32, and an aggregate market value of $612,000. |
600,000 | 600,000 | ||||||
|
|
|
|||||||
| 19,212,464 | ||||||||
|
|
|
|||||||
| Mutual Funds—0.3% | ||||||||
| BlackRock Liquidity Funds FedFund, Institutional Shares |
2,000,000 | 2,000,000 | ||||||
See accompanying notes to financial statements.
BHFTII-6
Brighthouse Funds Trust II
MFS Value Portfolio
Schedule of Investments as of December 31, 2023
Securities Lending Reinvestments—(Continued)
| Security Description | Shares |
Value | ||||||
| Mutual Funds—(Continued) | ||||||||
| Dreyfus Treasury Obligations Cash Management Fund, Institutional Class 5.250% (f) |
2,000,000 | $ | 2,000,000 | |||||
| Morgan Stanley Liquidity Funds Government Portfolio, Institutional Shares 5.270% (f) |
2,000,000 | 2,000,000 | ||||||
| STIT-Government & Agency Portfolio, Institutional Class |
1,000,000 | 1,000,000 | ||||||
|
|
|
|||||||
| 7,000,000 | ||||||||
|
|
|
|||||||
| Total Securities Lending Reinvestments |
28,212,922 | |||||||
|
|
|
|||||||
| Total Investments—101.0% |
2,808,936,573 | |||||||
| Other assets and liabilities (net)—(1.0)% |
(27,350,816 | ) | ||||||
|
|
|
|||||||
| Net Assets—100.0% | $ | 2,781,585,757 | ||||||
|
|
|
|||||||
| * | Principal amount stated in U.S. dollars unless otherwise noted. | |||
| (a) | All or a portion of the security was held on loan. As of December 31, 2023, the market value of securities loaned was $36,649,725 and the collateral received consisted of cash in the amount of $28,212,464 and non-cash collateral with a value of $9,328,081. The cash collateral investments are disclosed in the Schedule of Investments and categorized as Securities Lending Reinvestments. The non-cash collateral received consists of U.S. government securities that are held in safe-keeping by the lending agent, or a third-party custodian, and cannot be sold or repledged by the Portfolio. As such, this collateral is excluded from the Statement of Assets and Liabilities. | |||
| (b) | Non-income producing security. | |||
| (c) | The rate shown represents current yield to maturity. | |||
| (d) | Represents investment of cash collateral received from securities on loan as of December 31, 2023. | |||
| (e) | Variable or floating rate security. The stated rate represents the rate at December 31, 2023. Maturity date shown for callable securities reflects the earliest possible call date. For securities based on a published reference index and spread, the index and spread are indicated in the description above. For certain variable rate securities, the coupon rate is determined by the issuer/agent based on current market conditions. For certain asset- and mortgage-backed securities, the coupon rate may fluctuate based on changes of the underlying collateral or prepayments of principal. These securities do not indicate a reference index and spread in their description above. | |||
| (f) | The rate shown represents the annualized seven-day yield as of December 31, 2023. |
Glossary of Abbreviations
Index Abbreviations
| (SOFR)— | Secured Overnight Financing Rate |
Other Abbreviations
| (REIT)— | Real Estate Investment Trust |
See accompanying notes to financial statements.
BHFTII-7
Brighthouse Funds Trust II
MFS Value Portfolio
Schedule of Investments as of December 31, 2023
Fair Value Hierarchy
Accounting principles generally accepted in the United States of America (“GAAP”) define fair market value as the price that the Portfolio would receive to sell an asset or pay to transfer a liability in an orderly transaction between market participants at the measurement date. It establishes a fair value hierarchy that prioritizes inputs to valuation methods and requires disclosure of the fair value hierarchy, separately for each major category of assets and liabilities, that segregates fair value measurements into three levels. Levels 1, 2 and 3 of the fair value hierarchy are defined as follows:
Level 1 - unadjusted quoted prices in active markets for identical investments
Level 2 - other significant observable inputs (including, but not limited to, quoted prices for similar assets or liabilities in markets that are either active or inactive; inputs other than quoted prices that are observable such as interest rates, yield curves, volatilities, prepayment speeds, loss severities, credit risks, default rates, or other market corroborated inputs)
Level 3 - significant unobservable inputs based on the best information available in the circumstances, to the extent observable inputs are unavailable (including the Portfolio’s own assumptions used in determining the fair value of investments and derivative financial instruments)
The inputs or methodologies used for valuing investments are not necessarily an indication of the risk associated with investing in them. Changes to the inputs or methodologies used may result in transfers between levels. A reconciliation of Level 3 securities, if any, will be disclosed following the fair value hierarchy table. For more information about the Portfolio’s policy regarding the valuation of investments, please refer to the Notes to Financial Statements.
The following table summarizes the fair value hierarchy of the Portfolio’s investments as of December 31, 2023:
| Description | Level 1 | Level 2 | Level 3 | Total | ||||||||||||
| Common Stocks |
| |||||||||||||||
| Aerospace & Defense |
$ | 157,351,563 | $ | — | $ | — | $ | 157,351,563 | ||||||||
| Banks |
190,634,517 | — | — | 190,634,517 | ||||||||||||
| Beverages |
34,962,074 | 35,949,967 | — | 70,912,041 | ||||||||||||
| Biotechnology |
33,230,372 | — | — | 33,230,372 | ||||||||||||
| Building Products |
41,121,424 | — | — | 41,121,424 | ||||||||||||
| Capital Markets |
152,816,973 | — | — | 152,816,973 | ||||||||||||
| Chemicals |
96,025,384 | — | — | 96,025,384 | ||||||||||||
| Commercial Services & Supplies |
1,424,990 | — | — | 1,424,990 | ||||||||||||
| Consumer Finance |
51,566,646 | — | — | 51,566,646 | ||||||||||||
| Consumer Staples Distribution & Retail |
37,599,165 | — | — | 37,599,165 | ||||||||||||
| Electric Utilities |
177,729,955 | — | — | 177,729,955 | ||||||||||||
| Electrical Equipment |
40,449,090 | — | — | 40,449,090 | ||||||||||||
| Food Products |
7,405,872 | 42,539,503 | — | 49,945,375 | ||||||||||||
| Ground Transportation |
76,321,969 | — | — | 76,321,969 | ||||||||||||
| Health Care Equipment & Supplies |
63,188,824 | — | — | 63,188,824 | ||||||||||||
| Health Care Providers & Services |
158,309,614 | — | — | 158,309,614 | ||||||||||||
| Hotels, Restaurants & Leisure |
40,283,753 | — | — | 40,283,753 | ||||||||||||
| Household Products |
19,806,008 | 8,943,553 | — | 28,749,561 | ||||||||||||
| Industrial Conglomerates |
49,546,714 | — | — | 49,546,714 | ||||||||||||
| Industrial REITs |
51,936,213 | — | — | 51,936,213 | ||||||||||||
| Insurance |
303,166,319 | — | — | 303,166,319 | ||||||||||||
| IT Services |
58,039,461 | — | — | 58,039,461 | ||||||||||||
| Machinery |
66,994,055 | — | — | 66,994,055 | ||||||||||||
| Media |
91,635,119 | — | — | 91,635,119 | ||||||||||||
| Multi-Utilities |
32,938,728 | — | — | 32,938,728 | ||||||||||||
| Oil, Gas & Consumable Fuels |
162,264,159 | — | — | 162,264,159 | ||||||||||||
| Personal Care Products |
29,370,666 | — | — | 29,370,666 | ||||||||||||
| Pharmaceuticals |
143,024,875 | 8,545,121 | — | 151,569,996 | ||||||||||||
| Professional Services |
28,628,021 | — | — | 28,628,021 | ||||||||||||
| Semiconductors & Semiconductor Equipment |
179,046,676 | — | — | 179,046,676 | ||||||||||||
| Specialized REITs |
10,384,945 | — | — | 10,384,945 | ||||||||||||
| Specialty Retail |
57,843,193 | — | — | 57,843,193 | ||||||||||||
| Total Common Stocks |
2,645,047,337 | 95,978,144 | — | 2,741,025,481 | ||||||||||||
| Total Short-Term Investments* |
— | 39,698,170 | — | 39,698,170 | ||||||||||||
| Securities Lending Reinvestments | ||||||||||||||||
| Certificate of Deposit |
— | 2,000,458 | — | 2,000,458 | ||||||||||||
| Repurchase Agreements |
— | 19,212,464 | — | 19,212,464 | ||||||||||||
| Mutual Funds |
7,000,000 | — | — | 7,000,000 | ||||||||||||
| Total Securities Lending Reinvestments |
7,000,000 | 21,212,922 | — | 28,212,922 | ||||||||||||
| Total Investments |
$ | 2,652,047,337 | $ | 156,889,236 | $ | — | $ | 2,808,936,573 | ||||||||
| Collateral for Securities Loaned (Liability) |
$ | — | $ | (28,212,464 | ) | $ | — | $ | (28,212,464 | ) | ||||||
| * | See Schedule of Investments for additional detailed categorizations. | |||
See accompanying notes to financial statements.
BHFTII-8
Brighthouse Funds Trust II
MFS Value Portfolio
Statement of Assets and Liabilities
December 31, 2023
| Assets |
| |||
| Investments at value (a) (b) |
$ | 2,808,936,573 | ||
| Cash |
81,163 | |||
| Receivable for: |
| |||
| Fund shares sold |
579,404 | |||
| Dividends and interest |
3,491,096 | |||
| Prepaid expenses |
9,989 | |||
|
|
|
|||
| Total Assets |
2,813,098,225 | |||
|
|
|
|||
| Liabilities |
| |||
| Collateral for securities loaned |
28,212,464 | |||
| Payables for: |
| |||
| Fund shares redeemed |
1,326,293 | |||
| Accrued Expenses: |
| |||
| Management fees |
1,292,427 | |||
| Distribution and service fees |
184,264 | |||
| Deferred trustees’ fees |
305,155 | |||
| Other expenses |
191,865 | |||
|
|
|
|||
| Total Liabilities |
31,512,468 | |||
|
|
|
|||
| Net Assets |
$ | 2,781,585,757 | ||
|
|
|
|||
| Net Assets Consist of: |
| |||
| Paid in surplus |
$ | 1,715,161,203 | ||
| Distributable earnings (Accumulated losses) |
1,066,424,554 | |||
|
|
|
|||
| Net Assets |
$ | 2,781,585,757 | ||
|
|
|
|||
| Net Assets |
| |||
| Class A |
$ | 1,847,926,994 | ||
| Class B |
809,833,772 | |||
| Class D |
9,965,612 | |||
| Class E |
113,859,379 | |||
| Capital Shares Outstanding* |
| |||
| Class A |
132,719,577 | |||
| Class B |
59,438,437 | |||
| Class D |
719,961 | |||
| Class E |
8,268,893 | |||
| Net Asset Value, Offering Price and Redemption Price Per Share |
| |||
| Class A |
$ | 13.92 | ||
| Class B |
13.62 | |||
| Class D |
13.84 | |||
| Class E |
13.77 | |||
| * | The Portfolio is authorized to issue an unlimited number of shares. | |
| (a) | Identified cost of investments was $2,041,787,937. | |
| (b) | Includes securities loaned at value of $36,649,725. |
Statement of Operations
Year Ended December 31, 2023
| Investment Income |
| |||
| Dividends (a) |
$ | 65,633,235 | ||
| Interest |
897,837 | |||
| Securities lending income |
408,485 | |||
| Other income |
25,450 | |||
|
|
|
|||
| Total investment income |
66,965,007 | |||
|
|
|
|||
| Expenses |
| |||
| Management fees |
17,063,386 | |||
| Administration fees |
116,660 | |||
| Custodian and accounting fees |
160,763 | |||
| Distribution and service fees—Class B |
2,006,560 | |||
| Distribution and service fees—Class D |
9,951 | |||
| Distribution and service fees—Class E |
169,260 | |||
| Audit and tax services |
49,026 | |||
| Legal |
46,604 | |||
| Trustees’ fees and expenses |
46,220 | |||
| Shareholder reporting |
100,287 | |||
| Insurance |
25,915 | |||
| Miscellaneous |
32,095 | |||
|
|
|
|||
| Total expenses |
19,826,727 | |||
| Less management fee waiver |
(1,760,564 | ) | ||
|
|
|
|||
| Net expenses |
18,066,163 | |||
|
|
|
|||
| Net Investment Income |
48,898,844 | |||
|
|
|
|||
| Net Realized and Unrealized Gain (Loss) |
| |||
| Net realized gain (loss) on : |
| |||
| Investments |
252,196,337 | |||
| Foreign currency transactions |
24,155 | |||
|
|
|
|||
| Net realized gain (loss) |
252,220,492 | |||
|
|
|
|||
| Net change in unrealized appreciation (depreciation) on: |
| |||
| Investments |
(88,766,703 | ) | ||
| Foreign currency transactions |
66,846 | |||
|
|
|
|||
| Net change in unrealized appreciation (depreciation) |
(88,699,857 | ) | ||
|
|
|
|||
| Net realized and unrealized gain (loss) |
163,520,635 | |||
|
|
|
|||
| Net Increase (Decrease) in Net Assets From Operations |
$ | 212,419,479 | ||
|
|
|
|||
| (a) | Net of foreign withholding taxes of $389,559. | |||
See accompanying notes to financial statements.
BHFTII-9
Brighthouse Funds Trust II
MFS Value Portfolio
Statements of Changes in Net Assets
| Year Ended December 31, 2023 |
Year Ended December 31, 2022 |
|||||||
| Increase (Decrease) in Net Assets: |
| |||||||
| From Operations |
| |||||||
| Net investment income (loss) |
$ | 48,898,844 | $ | 50,479,266 | ||||
| Net realized gain (loss) |
252,220,492 | 328,098,170 | ||||||
| Net change in unrealized appreciation (depreciation) |
(88,699,857 | ) | (602,225,796 | ) | ||||
|
|
|
|
|
|||||
| Increase (decrease) in net assets from operations |
212,419,479 | (223,648,360 | ) | |||||
|
|
|
|
|
|||||
| From Distributions to Shareholders |
| |||||||
| Class A |
(252,945,382 | ) | (325,553,922 | ) | ||||
| Class B |
(110,751,351 | ) | (140,703,302 | ) | ||||
| Class D |
(1,363,104 | ) | (1,770,839 | ) | ||||
| Class E |
(15,486,301 | ) | (19,633,868 | ) | ||||
|
|
|
|
|
|||||
| Total distributions |
(380,546,138 | ) | (487,661,931 | ) | ||||
|
|
|
|
|
|||||
| Increase (decrease) in net assets from capital share transactions |
113,957,024 | (33,328,010 | ) | |||||
|
|
|
|
|
|||||
| Total increase (decrease) in net assets |
(54,169,635 | ) | (744,638,301 | ) | ||||
| Net Assets |
| |||||||
| Beginning of period |
2,835,755,392 | 3,580,393,693 | ||||||
|
|
|
|
|
|||||
| End of period |
$ | 2,781,585,757 | $ | 2,835,755,392 | ||||
|
|
|
|
|
|||||
Other Information:
Capital Shares
Transactions in capital shares were as follows:
| Year Ended December 31, 2023 |
Year Ended December 31, 2022 |
|||||||||||||||
| Shares | Value | Shares | Value | |||||||||||||
| Class A |
| |||||||||||||||
| Sales |
2,980,330 | $ | 42,506,951 | 3,558,300 | $ | 62,373,937 | ||||||||||
| Reinvestments |
19,623,381 | 252,945,382 | 23,850,104 | 325,553,922 | ||||||||||||
| Redemptions |
(15,683,933 | ) | (213,809,170 | ) | (26,943,916 | ) | (434,923,735 | ) | ||||||||
|
|
|
|
|
|
|
|
|
|||||||||
| Net increase (decrease) |
6,919,778 | $ | 81,643,163 | 464,488 | $ | (46,995,876 | ) | |||||||||
|
|
|
|
|
|
|
|
|
|||||||||
| Class B |
| |||||||||||||||
| Sales |
2,048,734 | $ | 28,653,519 | 2,310,908 | $ | 36,958,204 | ||||||||||
| Reinvestments |
8,768,911 | 110,751,351 | 10,492,416 | 140,703,302 | ||||||||||||
| Redemptions |
(8,193,151 | ) | (110,138,625 | ) | (10,789,269 | ) | (170,456,811 | ) | ||||||||
|
|
|
|
|
|
|
|
|
|||||||||
| Net increase (decrease) |
2,624,494 | $ | 29,266,245 | 2,014,055 | $ | 7,204,695 | ||||||||||
|
|
|
|
|
|
|
|
|
|||||||||
| Class D |
| |||||||||||||||
| Sales |
9,377 | $ | 127,790 | 5,410 | $ | 86,922 | ||||||||||
| Reinvestments |
106,326 | 1,363,104 | 130,305 | 1,770,839 | ||||||||||||
| Redemptions |
(107,550 | ) | (1,473,582 | ) | (93,633 | ) | (1,474,422 | ) | ||||||||
|
|
|
|
|
|
|
|
|
|||||||||
| Net increase (decrease) |
8,153 | $ | 17,312 | 42,082 | $ | 383,339 | ||||||||||
|
|
|
|
|
|
|
|
|
|||||||||
| Class E |
| |||||||||||||||
| Sales |
387,514 | $ | 5,461,962 | 547,791 | $ | 8,963,066 | ||||||||||
| Reinvestments |
1,213,660 | 15,486,301 | 1,451,136 | 19,633,868 | ||||||||||||
| Redemptions |
(1,310,107 | ) | (17,917,959 | ) | (1,412,098 | ) | (22,517,102 | ) | ||||||||
|
|
|
|
|
|
|
|
|
|||||||||
| Net increase (decrease) |
291,067 | $ | 3,030,304 | 586,829 | $ | 6,079,832 | ||||||||||
|
|
|
|
|
|
|
|
|
|||||||||
| Increase (decrease) derived from capital shares transactions |
$ | 113,957,024 | $ | (33,328,010 | ) | |||||||||||
|
|
|
|
|
|||||||||||||
See accompanying notes to financial statements.
BHFTII-10
Brighthouse Funds Trust II
MFS Value Portfolio
Financial Highlights
| Selected per share data | ||||||||||||||||||||
| Class A | ||||||||||||||||||||
| Year Ended December 31, | ||||||||||||||||||||
| 2023 |
2022 |
2021 |
2020 |
2019 |
||||||||||||||||
| Net Asset Value, Beginning of Period |
$ | 14.91 | $ | 19.12 | $ | 15.63 | $ | 16.44 | $ | 13.81 | ||||||||||
|
|
|
|
|
|
|
|
|
|
|
|||||||||||
| Income (Loss) from Investment Operations |
| |||||||||||||||||||
| Net investment income (loss) (a) |
0.26 | 0.28 | 0.26 | 0.26 | 0.29 | |||||||||||||||
| Net realized and unrealized gain (loss) |
0.79 | (1.68 | ) | 3.69 | 0.17 | 3.71 | ||||||||||||||
|
|
|
|
|
|
|
|
|
|
|
|||||||||||
| Total income (loss) from investment operations |
1.05 | (1.40 | ) | 3.95 | 0.43 | 4.00 | ||||||||||||||
|
|
|
|
|
|
|
|
|
|
|
|||||||||||
| Less Distributions |
||||||||||||||||||||
| Distributions from net investment income |
(0.28 | ) | (0.30 | ) | (0.28 | ) | (0.30 | ) | (0.31 | ) | ||||||||||
| Distributions from net realized capital gains |
(1.76 | ) | (2.51 | ) | (0.18 | ) | (0.94 | ) | (1.06 | ) | ||||||||||
|
|
|
|
|
|
|
|
|
|
|
|||||||||||
| Total distributions |
(2.04 | ) | (2.81 | ) | (0.46 | ) | (1.24 | ) | (1.37 | ) | ||||||||||
|
|
|
|
|
|
|
|
|
|
|
|||||||||||
| Net Asset Value, End of Period |
$ | 13.92 | $ | 14.91 | $ | 19.12 | $ | 15.63 | $ | 16.44 | ||||||||||
|
|
|
|
|
|
|
|
|
|
|
|||||||||||
| Total Return (%) (b) |
8.15 | (5.98 | ) | 25.54 | 3.96 | 30.13 | ||||||||||||||
| Ratios/Supplemental Data |
||||||||||||||||||||
| Gross ratio of expenses to average net assets (%) |
0.64 | 0.63 | 0.63 | 0.64 | 0.63 | |||||||||||||||
| Net ratio of expenses to average net assets (%) (c) |
0.58 | 0.58 | 0.57 | 0.58 | 0.57 | |||||||||||||||
| Ratio of net investment income (loss) to average net assets (%) |
1.85 | 1.73 | 1.47 | 1.79 | 1.86 | |||||||||||||||
| Portfolio turnover rate (%) |
14 | 13 | 8 | 13 | 12 | |||||||||||||||
| Net assets, end of period (in millions) |
$ | 1,847.9 | $ | 1,876.1 | $ | 2,396.8 | $ | 2,393.8 | $ | 2,400.3 | ||||||||||
| Class B | ||||||||||||||||||||
| Year Ended December 31, | ||||||||||||||||||||
| 2023 |
2022 |
2021 |
2020 |
2019 |
||||||||||||||||
| Net Asset Value, Beginning of Period |
$ | 14.63 | $ | 18.81 | $ | 15.38 | $ | 16.20 | $ | 13.62 | ||||||||||
|
|
|
|
|
|
|
|
|
|
|
|||||||||||
| Income (Loss) from Investment Operations |
| |||||||||||||||||||
| Net investment income (loss) (a) |
0.22 | 0.23 | 0.21 | 0.22 | 0.24 | |||||||||||||||
| Net realized and unrealized gain (loss) |
0.77 | (1.65 | ) | 3.64 | 0.16 | 3.67 | ||||||||||||||
|
|
|
|
|
|
|
|
|
|
|
|||||||||||
| Total income (loss) from investment operations |
0.99 | (1.42 | ) | 3.85 | 0.38 | 3.91 | ||||||||||||||
|
|
|
|
|
|
|
|
|
|
|
|||||||||||
| Less Distributions |
| |||||||||||||||||||
| Distributions from net investment income |
(0.24 | ) | (0.25 | ) | (0.24 | ) | (0.26 | ) | (0.27 | ) | ||||||||||
| Distributions from net realized capital gains |
(1.76 | ) | (2.51 | ) | (0.18 | ) | (0.94 | ) | (1.06 | ) | ||||||||||
|
|
|
|
|
|
|
|
|
|
|
|||||||||||
| Total distributions |
(2.00 | ) | (2.76 | ) | (0.42 | ) | (1.20 | ) | (1.33 | ) | ||||||||||
|
|
|
|
|
|
|
|
|
|
|
|||||||||||
| Net Asset Value, End of Period |
$ | 13.62 | $ | 14.63 | $ | 18.81 | $ | 15.38 | $ | 16.20 | ||||||||||
|
|
|
|
|
|
|
|
|
|
|
|||||||||||
| Total Return (%) (b) |
7.85 | (6.22 | ) | 25.30 | 3.66 | 29.85 | ||||||||||||||
| Ratios/Supplemental Data |
| |||||||||||||||||||
| Gross ratio of expenses to average net assets (%) |
0.89 | 0.88 | 0.88 | 0.89 | 0.88 | |||||||||||||||
| Net ratio of expenses to average net assets (%) (c) |
0.83 | 0.83 | 0.82 | 0.83 | 0.82 | |||||||||||||||
| Ratio of net investment income (loss) to average net assets (%) |
1.60 | 1.48 | 1.22 | 1.54 | 1.61 | |||||||||||||||
| Portfolio turnover rate (%) |
14 | 13 | 8 | 13 | 12 | |||||||||||||||
| Net assets, end of period (in millions) |
$ | 809.8 | $ | 831.3 | $ | 1,030.7 | $ | 947.8 | $ | 948.8 | ||||||||||
Please see following page for Financial Highlights footnote legend.
See accompanying notes to financial statements.
BHFTII-11
Brighthouse Funds Trust II
MFS Value Portfolio
Financial Highlights
| Selected per share data | ||||||||||||||||||||
| Class D | ||||||||||||||||||||
| Year Ended December 31, | ||||||||||||||||||||
| 2023 |
2022 |
2021 |
2020 |
2019 |
||||||||||||||||
| Net Asset Value, Beginning of Period |
$ | 14.84 | $ | 19.03 | $ | 15.56 | $ | 16.37 | $ | 13.76 | ||||||||||
|
|
|
|
|
|
|
|
|
|
|
|||||||||||
| Income (Loss) from Investment Operations |
| |||||||||||||||||||
| Net investment income (loss) (a) |
0.24 | 0.26 | 0.24 | 0.24 | 0.27 | |||||||||||||||
| Net realized and unrealized gain (loss) |
0.78 | (1.66 | ) | 3.67 | 0.17 | 3.69 | ||||||||||||||
|
|
|
|
|
|
|
|
|
|
|
|||||||||||
| Total income (loss) from investment operations |
1.02 | (1.40 | ) | 3.91 | 0.41 | 3.96 | ||||||||||||||
|
|
|
|
|
|
|
|
|
|
|
|||||||||||
| Less Distributions |
||||||||||||||||||||
| Distributions from net investment income |
(0.26 | ) | (0.28 | ) | (0.26 | ) | (0.28 | ) | (0.29 | ) | ||||||||||
| Distributions from net realized capital gains |
(1.76 | ) | (2.51 | ) | (0.18 | ) | (0.94 | ) | (1.06 | ) | ||||||||||
|
|
|
|
|
|
|
|
|
|
|
|||||||||||
| Total distributions |
(2.02 | ) | (2.79 | ) | (0.44 | ) | (1.22 | ) | (1.35 | ) | ||||||||||
|
|
|
|
|
|
|
|
|
|
|
|||||||||||
| Net Asset Value, End of Period |
$ | 13.84 | $ | 14.84 | $ | 19.03 | $ | 15.56 | $ | 16.37 | ||||||||||
|
|
|
|
|
|
|
|
|
|
|
|||||||||||
| Total Return (%) (b) |
8.00 | (6.02 | ) | 25.42 | 3.85 | 29.96 | ||||||||||||||
| Ratios/Supplemental Data |
||||||||||||||||||||
| Gross ratio of expenses to average net assets (%) |
0.74 | 0.73 | 0.73 | 0.74 | 0.73 | |||||||||||||||
| Net ratio of expenses to average net assets (%) (c) |
0.68 | 0.68 | 0.67 | 0.68 | 0.67 | |||||||||||||||
| Ratio of net investment income (loss) to average net assets (%) |
1.75 | 1.64 | 1.37 | 1.69 | 1.76 | |||||||||||||||
| Portfolio turnover rate (%) |
14 | 13 | 8 | 13 | 12 | |||||||||||||||
| Net assets, end of period (in millions) |
$ | 10.0 | $ | 10.6 | $ | 12.7 | $ | 11.5 | $ | 12.6 | ||||||||||
| Class E | ||||||||||||||||||||
| Year Ended December 31, | ||||||||||||||||||||
| 2023 |
2022 |
2021 |
2020 |
2019 |
||||||||||||||||
| Net Asset Value, Beginning of Period |
$ | 14.77 | $ | 18.96 | $ | 15.50 | $ | 16.32 | $ | 13.71 | ||||||||||
|
|
|
|
|
|
|
|
|
|
|
|||||||||||
| Income (Loss) from Investment Operations |
| |||||||||||||||||||
| Net investment income (loss) (a) |
0.23 | 0.25 | 0.23 | 0.23 | 0.26 | |||||||||||||||
| Net realized and unrealized gain (loss) |
0.79 | (1.66 | ) | 3.66 | 0.16 | 3.70 | ||||||||||||||
|
|
|
|
|
|
|
|
|
|
|
|||||||||||
| Total income (loss) from investment operations |
1.02 | (1.41 | ) | 3.89 | 0.39 | 3.96 | ||||||||||||||
|
|
|
|
|
|
|
|
|
|
|
|||||||||||
| Less Distributions |
| |||||||||||||||||||
| Distributions from net investment income |
(0.26 | ) | (0.27 | ) | (0.25 | ) | (0.27 | ) | (0.29 | ) | ||||||||||
| Distributions from net realized capital gains |
(1.76 | ) | (2.51 | ) | (0.18 | ) | (0.94 | ) | (1.06 | ) | ||||||||||
|
|
|
|
|
|
|
|
|
|
|
|||||||||||
| Total distributions |
(2.02 | ) | (2.78 | ) | (0.43 | ) | (1.21 | ) | (1.35 | ) | ||||||||||
|
|
|
|
|
|
|
|
|
|
|
|||||||||||
| Net Asset Value, End of Period |
$ | 13.77 | $ | 14.77 | $ | 18.96 | $ | 15.50 | $ | 16.32 | ||||||||||
|
|
|
|
|
|
|
|
|
|
|
|||||||||||
| Total Return (%) (b) |
7.97 | (6.10 | ) | 25.40 | 3.75 | 30.00 | ||||||||||||||
| Ratios/Supplemental Data |
| |||||||||||||||||||
| Gross ratio of expenses to average net assets (%) |
0.79 | 0.78 | 0.78 | 0.79 | 0.78 | |||||||||||||||
| Net ratio of expenses to average net assets (%) (c) |
0.73 | 0.73 | 0.72 | 0.73 | 0.72 | |||||||||||||||
| Ratio of net investment income (loss) to average net assets (%) |
1.70 | 1.59 | 1.32 | 1.64 | 1.71 | |||||||||||||||
| Portfolio turnover rate (%) |
14 | 13 | 8 | 13 | 12 | |||||||||||||||
| Net assets, end of period (in millions) |
$ | 113.9 | $ | 117.8 | $ | 140.1 | $ | 128.5 | $ | 132.8 | ||||||||||
| (a) | Per share amounts based on average shares outstanding during the period. | |||
| (b) | Total return does not reflect any insurance, sales, separate account or administrative charges of variable annuity or life insurance contracts or any additional expenses that contract owners may bear under their variable contracts. If these charges were included, the returns would be lower. | |||
| (c) | Includes the effects of management fee waivers (see Note 5 of the Notes to Financial Statements). | |||
See accompanying notes to financial statements.
BHFTII-12
Brighthouse Funds Trust II
MFS Value Portfolio
Notes to Financial Statements—December 31, 2023
1. Organization
Brighthouse Funds Trust II (the “Trust”) is organized as a Delaware statutory trust and registered under the Investment Company Act of 1940, as amended (the “1940 Act”), as an open-end management investment company. The Trust, which is managed by Brighthouse Investment Advisers, LLC (“Brighthouse Investment Advisers” or the “Adviser”), currently offers twenty-nine series (the “Portfolios”), each of which operates as a distinct investment vehicle of the Trust. The series included in this report is MFS Value Portfolio (the “Portfolio”), which is diversified. Shares of the Portfolio are not offered directly to the general public and are currently available only to separate accounts of insurance companies, including insurance companies affiliated with the Adviser.
The Portfolio has registered and offers four classes of shares: Class A, B, D and E shares. Shares of each class of the Portfolio represent an equal pro rata interest in the Portfolio and generally give the shareholder the same voting, dividend, liquidation, and other rights. Investment income, realized and unrealized capital gains and losses, the common expenses of the Portfolio, and certain Portfolio-level expense reductions, if any, are allocated on a pro rata basis to each class based on the relative net assets of each class to the net assets of the Portfolio. Each class of shares differs in its respective distribution plan and such distribution expenses are allocated to the corresponding class of shares.
2. Significant Accounting Policies
The preparation of financial statements in conformity with accounting principles generally accepted in the United States of America (“GAAP”) requires management to make estimates and assumptions that affect the reported amounts of assets and liabilities and disclosure of contingent assets and liabilities as of the date of the financial statements and the reported amounts of income and expenses during the reporting period. Actual results could differ from those estimates. In the preparation of these financial statements, management has evaluated events and transactions subsequent to December 31, 2023 through the date the financial statements were issued.
The Portfolio is an investment company and follows the accounting and reporting guidance of the Financial Accounting Standards Board (“FASB”) Accounting Standards Codification Topic 946—Financial Services—Investment Companies. The following is a summary of significant accounting policies consistently followed by the Portfolio in the preparation of its financial statements.
Investment Valuation and Fair Value Measurements - The Portfolio values its investments for purposes of calculating its net asset value (“NAV”) using procedures that allow for a variety of methodologies to be used to value the Portfolio’s investments. The specific methodology used for an investment may vary based on the market data available for a specific investment at the time the Portfolio calculates its NAV or based on other considerations. The procedures also permit a level of judgment to be used in the valuation process.
Domestic and foreign equity securities, such as common stock, exchange-traded funds, rights, warrants, and preferred stock, that are traded on a securities exchange on a valuation date are generally valued at their last quoted sale price or official closing price on the primary exchange for such security, or, if no sales occurred on that day, at the last reported bid price. Equity securities traded over-the-counter (“OTC”) are generally valued at the last reported bid price. In the event of a major exchange closing during the trading day, the Adviser may use other market information obtained from quotation reporting systems, established market makers, or pricing services in valuing the securities. Valuation adjustments may be applied to certain foreign equity securities that are traded solely on foreign exchanges that close before the time as of which the Portfolio determines its NAV to account for the market movement between the close of the foreign exchanges and the time as of which the Portfolio determines its NAV. The Portfolio may use a systematic fair valuation model provided by a pricing service to value securities principally traded in these foreign markets to adjust for possible market movements or other changes that may occur between the close of the foreign exchanges and the time as of which the Portfolio determines its NAV. Foreign equity securities valued using these valuation adjustments are generally categorized as Level 2 within the fair value hierarchy. Equity securities that are actively traded, and have no valuation adjustments applied, are categorized as Level 1 within the fair value hierarchy. Other equity securities traded on inactive markets or valued in reference to similar instruments traded on active markets are generally categorized as Level 2 within the fair value hierarchy.
Investments in registered open-end management investment companies are valued at reported NAV per share on the valuation date and are categorized as Level 1 within the fair value hierarchy.
Debt securities, including corporate, convertible and municipal bonds and notes; obligations of the U.S. Treasury and U.S. government agencies; foreign sovereign issues; and non-U.S. bonds, are generally valued based upon evaluated or composite bid quotations obtained from third-party pricing services and/or brokers and dealers selected by the Adviser (each a “pricing service”). Such pricing services may use matrix pricing, which considers observable inputs including, among other things, issuer details, maturity dates, interest rates, yield curves, rates of prepayment, credit risks/spreads, default rates, reported trades, broker-dealer quotes and quoted prices for similar assets. Short-term obligations with a remaining maturity of sixty days or less may be valued at amortized cost in the absence of market quotes, so long as the amortized cost value of such short-term debt instrument is approximately the same as the fair value of the instrument as determined without the use of amortized cost valuation. Floating rate loans are generally valued based upon
BHFTII-13
Brighthouse Funds Trust II
MFS Value Portfolio
Notes to Financial Statements—December 31, 2023—(Continued)
an evaluated or composite average of aggregate bid and ask quotations supplied by brokers or dealers, as obtained from the pricing service. Securities that use similar valuation techniques and inputs as described above are generally categorized as Level 2 within the fair value hierarchy.
Options, whether on securities, indices, futures contracts, or otherwise, traded on exchanges are valued at the last sale price available as of the close of business on a valuation day or, if there is no such price available, at the last reported bid price. These types of options are categorized as Level 1 within the fair value hierarchy. Futures contracts that are traded on commodity exchanges are valued at their settlement prices established by the exchanges on which they are traded as of the close of such exchanges and are categorized as Level 1 within the fair value hierarchy.
If no current market quotation is readily available or market value quotations are deemed to be unreliable for an investment, the fair value of the investment will be determined in accordance with procedures. A market quotation is readily available only when that quotation is a quoted price (unadjusted) in active markets for identical investments that the Portfolio can access at the measurement date, provided that a quotation will not be readily available if it is not reliable.
Pursuant to Rule 2a-5 under the 1940 Act, the Board of Trustees (the “Board” or “Trustees”) of the Trust has designated Brighthouse Investment Advisers, acting through its Valuation Committee (“Committee”), as the Portfolio’s “valuation designee” to perform the Portfolio’s fair value determinations. The Board oversees Brighthouse Investment Advisers in its role as the Valuation Designee and receives reports from Brighthouse Investment Advisers regarding its process and the valuation of the Portfolio’s investments to assist with such oversight.
No single standard for determining the fair value of an investment can be set forth because fair value depends upon the facts and circumstances with respect to each investment. Information relating to any relevant factors may be obtained by the Committee from any appropriate source, including the subadviser of the Portfolio, the Custodian, a pricing service, market maker and/or broker for such security or the issuer. Appropriate methodologies for determining fair value under particular circumstances may include: matrix pricing, a discounted cash flow analysis, comparisons of securities with comparable characteristics, value based on multiples of earnings, discount from market price of similar marketable securities, or a combination of these and other methods.
Foreign Currency Translation - The books and records of the Portfolio are maintained in U.S. dollars. The values of securities, currencies, and other assets and liabilities denominated in currencies other than the U.S. dollar are translated into U.S. dollars based upon foreign exchange rates prevailing at the end of the period. Purchases and sales of investment securities, income, and expenses are translated on the respective dates of such transactions. Because the values of investment securities are translated at the foreign exchange rates prevailing at the end of the period, that portion of the results of operations arising from changes in exchange rates and that portion of the results of operations reflecting fluctuations arising from changes in market prices of the investment securities are not separated. Such fluctuations are included in the net realized and unrealized gain or loss on investments.
Net realized foreign exchange gains or losses arise from activity in forward foreign currency exchange contracts, sales of foreign currency, currency gains or losses realized between the trade and settlement dates on securities transactions, and the difference between the amounts of dividends, interest, and foreign withholding taxes recorded by the Portfolio and the U.S. dollar-equivalent of the amounts actually received or paid by the Portfolio. Net unrealized foreign exchange gains and losses arise from changes in the value of assets and liabilities, other than investment securities, resulting from changes in foreign exchange rates.
Investment Transactions and Related Investment Income - Portfolio security transactions are recorded on the trade date. Dividend income is recorded on the ex-dividend date or, for certain foreign securities, when notified. Interest income, which includes amortization of premium and accretion of discount on debt securities, is recorded on the accrual basis. Realized gains and losses on investments are determined on the identified cost basis, which is the same basis used for federal income tax purposes. Foreign income and foreign capital gains on some foreign securities may be subject to foreign taxes, which are accrued as applicable. These foreign taxes have been provided for in accordance with the Portfolio’s understanding of the applicable countries’ tax rules and rates.
Dividends and Distributions to Shareholders - The Portfolio records dividends and distributions on the ex-dividend date. Net realized gains from securities transactions (if any) are generally distributed annually to shareholders. The timing and characterization of certain income and capital gains distributions are determined in accordance with federal tax regulations that may differ from GAAP. Permanent book and tax basis differences relating to shareholder distributions will result in reclassification between distributable earnings (accumulated losses) and paid in surplus. These adjustments have no impact on net assets or the results of operations.
Income Taxes - It is the Portfolio’s policy to comply with the requirements of the Internal Revenue Code of 1986, as amended, and regulations thereunder, applicable to regulated investment companies, and to distribute, with respect to each taxable year, all of its taxable income to shareholders. Therefore, no federal income tax provision is required. The Portfolio files U.S. federal tax returns. No income tax returns are currently under examination. The Portfolio’s federal tax returns remain subject to examination by the Internal Revenue Service for three fiscal years after the returns are filed. As of December 31, 2023, the Portfolio had no uncertain tax positions that would require financial statement recognition, derecognition or disclosure.
BHFTII-14
Brighthouse Funds Trust II
MFS Value Portfolio
Notes to Financial Statements—December 31, 2023—(Continued)
Repurchase Agreements - The Portfolio may enter into repurchase agreements, under the terms of a Master Repurchase Agreement (“MRA”), or Global Master Repurchase Agreement (“GMRA”), with selected commercial banks and broker-dealers, under which the Portfolio acquires securities as collateral and agrees to resell the securities at an agreed-upon time and at an agreed-upon price. The Portfolio, through the Custodian or a subcustodian, under a tri-party repurchase agreement, receives delivery of the underlying securities collateralizing any repurchase agreements. It is the Portfolio’s policy that the market value of the collateral be equal to at least 100% of the repurchase price in the case of a repurchase agreement of one-day duration and equal to at least 102% of the repurchase price in the case of all other repurchase agreements. In the event of default or failure by a party to perform an obligation in connection with any repurchase transaction, the MRA or GMRA gives the non-defaulting party the right to set-off claims and to apply property held by it in connection with any repurchase transaction against obligations owed to it under the agreement.
At December 31, 2023, the Portfolio had direct investments in repurchase agreements with a gross value of $74,121. Additionally, the Portfolio invested cash collateral for loans of portfolio securities in repurchase agreements with a gross value of $19,212,464. The combined value of all repurchase agreements is included as part of investments at value on the Statement of Assets and Liabilities. The value of the related collateral exceeded the value of the repurchase agreements at December 31, 2023.
Securities Lending - The Portfolio may lend its portfolio securities to certain qualified brokers who borrow securities in order to complete certain securities transactions. By lending its portfolio securities, the Portfolio attempts to increase its net investment income through the receipt of income on collateral held from securities on loan. Any gain or loss in the market price of the loaned securities that might occur, any interest earned, and any dividends declared during the term of the loan, would accrue to the account of the Portfolio.
The Trust has entered into a Non-Custodial Securities Lending Agreement with JPMorgan Chase Bank, N.A. (the “Lending Agent”). Under the agreement, the Lending Agent is authorized to loan portfolio securities on the Portfolio’s behalf. In exchange, the Portfolio generally receives cash, U.S. Government securities, letters of credit, or other collateral deemed appropriate by the Adviser. The Portfolio receives collateral equal to at least 102% of the market value for loans secured by government securities or cash in the same currency as the loaned shares and 105% for all other loaned securities at each loan’s inception. Collateral representing at least 100% of the market value of the loaned securities is maintained for the duration of the loan. Any cash collateral received by the Portfolio is generally invested by the Lending Agent in short-term investments, which may include certificates of deposit, commercial paper, repurchase agreements, including repurchase agreements with respect to equity securities, time deposits, master demand notes and money market funds. The market value of investments made with cash collateral received are disclosed in the Schedule of Investments and the valuation techniques are described in Note 2. The value of the securities on loan may change each business day. If the market value of the collateral at the close of trading on a business day is less than 100% of the market value of the loaned securities at the close of trading on that day, the borrower is required to deliver, by the close of business on the following business day, an additional amount of collateral, so that the total amount of posted collateral is equal to at least 100% of the market value of all the loaned securities as of such preceding day. A portion of the income earned on the collateral is rebated to the borrower of the securities and the remainder is split between the Lending Agent and the Portfolio. On loans collateralized by U.S. government securities, a fee is received from the borrower and is allocated between the Portfolio and the Lending Agent.
Income received by the Portfolio in securities lending transactions during the year ended December 31, 2023 is reflected as securities lending income on the Statement of Operations. The values of any securities loaned by the Portfolio and the related collateral at December 31, 2023 are disclosed in the footnotes to the Schedule of Investments. The value of the related collateral received by the Portfolio exceeded the value of the securities out on loan at December 31, 2023.
The risks associated with lending portfolio securities include, but are not limited to, possible delays in receiving additional collateral or in the recovery of the loaned securities, possible loss of rights in the collateral should the borrower fail financially, as well as risk of loss in the value of the collateral or the value of the investments made with the collateral. To the extent the Portfolio uses cash collateral it receives to invest in repurchase agreements with respect to equity securities, it is subject to the risk of loss if the value of the equity securities declines and the counterparty defaults on its obligation to repurchase such securities. The Lending Agent shall indemnify the Portfolio in the case of default of any securities borrower, subject to the terms of the Non-Custodial Securities Lending Agreement.
All securities on loan are classified as Common Stocks in the Portfolio’s Schedule of Investments as of December 31, 2023. For all securities on loan, the remaining contractual maturity of the agreements is overnight and continuous.
3. Certain Risks
In the normal course of business, the Portfolio invests in securities and enters into transactions where risks exist. Those risks include:
Market Risk: The value of securities held by the Portfolio may decline in response to certain events, including those directly involving the issuers whose securities are owned by the Portfolio; conditions affecting the general economy; overall market changes; local, regional or global political, social or economic instability; currency, interest rate, and price fluctuations, or other factors including
BHFTII-15
Brighthouse Funds Trust II
MFS Value Portfolio
Notes to Financial Statements—December 31, 2023—(Continued)
terrorism, war, natural disasters and the spread of infectious illness including epidemics or pandemics such as the COVID-19 pandemic. These events may also adversely affect the liquidity of securities held by the Portfolio.
Credit and Counterparty Risk: The Portfolio may be exposed to counterparty risk, or the risk that an entity with which the Portfolio has unsettled or open transactions may default. The potential loss could exceed the value of the financial assets and liabilities recorded in the financial statements. Financial assets that potentially expose the Portfolio to credit and counterparty risk consist principally of cash due from counterparties and investments. The Portfolio manages counterparty risk by entering into agreements only with counterparties that it believes have the financial resources to honor their obligations and by monitoring the financial stability of those counterparties. The Subadviser may attempt to mitigate counterparty risk by (i) periodically assessing the creditworthiness of its trading partners, (ii) monitoring and/or limiting the amount of its net exposure to each individual counterparty based on its assessment, and (iii) requiring collateral from the counterparty for certain transactions. In order to preserve certain safeguards for non-standard settlement trades, the Portfolio restricts its exposure to credit and counterparty losses by entering into master netting agreements (“Master Agreements”) with counterparties (approved brokers) with whom it undertakes a significant volume of transactions. Master Agreements govern the terms of certain transactions and reduce the counterparty risk associated with relevant transactions by specifying credit protection mechanisms and providing standardization that improves legal certainty. Master Agreements can also help limit counterparty risk by specifying collateral posting arrangements at pre-arranged exposure levels.
Repurchase and reverse repurchase agreements are primarily executed under GMRAs or MRAs, which provide the right to set-off. Each repurchase and reverse repurchase agreement is initially collateralized at the transaction level. In the event of default, the total market value exposure will be offset against collateral exchanged to date, which would result in a net receivable/(payable) that would be due from/to the counterparty.
Additional risks associated with each type of investment are described above within the respective security type notes. The Portfolio’s prospectus includes a discussion of the principal risks of investing in the Portfolio.
4. Investment Transactions
Aggregate cost of purchases and proceeds of sales of investment securities, excluding short-term securities, for the year ended December 31, 2023 were as follows:
| Purchases |
Sales | |||||||||||
| U.S. Government |
Non-U.S. Government | U.S. Government | Non-U.S. Government | |||||||||
| $0 | $ | 381,456,715 | $ | 0 | $ | 632,412,200 | ||||||
The Portfolio engaged in security transactions with other accounts managed by Massachusetts Financial Services Company, the subadviser to the Portfolio, that amounted to $361,671 in purchases and $9,095,325 in sales of investments, which are included above, and resulted in net realized gains of $2,857,930.
5. Investment Management Fees and Other Transactions with Affiliates
Investment Management Agreement - Brighthouse Investment Advisers is the investment adviser to the Portfolio. The Trust has entered into an investment management agreement with Brighthouse Investment Advisers with respect to the Portfolio. For providing investment management services to the Portfolio, the Adviser receives monthly compensation at the following annual rates:
|
Management |
% per annum | Average Daily Net Assets | ||||
| $17,063,386 | 0.700 | % | First $250 million | |||
| 0.650 | % | Of the next $500 million | ||||
| 0.600 | % | On amounts in excess of $750 million | ||||
The Adviser has entered into an investment subadvisory agreement with respect to managing the Portfolio. Massachusetts Financial Services Company (the “Subadviser”) is compensated by the Adviser to provide subadvisory services for the Portfolio.
BHFTII-16
Brighthouse Funds Trust II
MFS Value Portfolio
Notes to Financial Statements—December 31, 2023—(Continued)
Management Fee Waiver - Pursuant to a management fee waiver agreement, the Adviser has agreed, for the period May 1, 2023 to April 30, 2024, to reduce its advisory fees set out above under “Investment Management Agreement” for each class of the Portfolio as follows:
| % per annum reduction |
Average Daily Net Assets | |
| 0.100% | First $100 million | |
| 0.050% | $100 million to $200 million | |
| 0.075% | $200 million to $250 million | |
| 0.025% | $250 million to $500 million | |
| 0.050% | $500 million to $750 million | |
| 0.025% | $1 billion to $1.5 billion | |
| 0.100% | $1.5 billion to $3 billion | |
| 0.125% | Over $3 billion |
An identical agreement was in place for the period January 1, 2023 to April 30, 2023. Amounts waived for the year ended December 31, 2023 are shown as a management fee waiver in the Statement of Operations.
During the year ended December 31, 2023, the Subadviser voluntarily reimbursed the Portfolio for certain trading costs. This reimbursement amount of $25,450 is reflected as Other income in the Statement of Operations and had no impact on total return.
Certain officers and trustees of the Trust may also be officers of the Adviser; however, such officers and trustees receive no compensation from the Trust.
Transfer Agency Agreement - Brighthouse Life Insurance Company serves as the transfer agent for the Trust. Brighthouse Life Insurance Company receives no fees for its services to the Trust.
Distribution and Service Fees - The Trust has a distribution agreement with Brighthouse Securities, LLC (the “Distributor”) pursuant to which the Distributor serves as the general distributor of shares of each class (each a “Class”) of each Portfolio. The Distributor is an affiliate of the Trust. The Trust has adopted a Distribution and Services Plan (the “D&S Plan”) relating to Class B, Class D, Class E, Class F and Class G shares of each Portfolio, under Rule 12b-1 under the 1940 Act, pursuant to which the Trust may pay the Distributor a fee (the “Service Fee”) at an annual rate not to exceed 0.25% of each such Portfolio’s average daily net assets attributable to the Class B, Class D, Class E, Class F and Class G shares of the Trust. Each Portfolio may not offer shares of each Class. The D&S Plan also authorizes the Trust, on behalf of each of its Portfolios, to pay to the Distributor a distribution fee (the “Distribution Fee” and together with the Service Fee, the “Fees”) at an annual rate of up to 0.25% of each Portfolio’s average daily net assets attributable to the Class B, Class D, Class E, Class F, and Class G shares in consideration of the services rendered in connection with the sale of such shares by the Distributor. Under the Distribution Agreement with respect to the Trust, Fees are currently paid at an annual rate of 0.25% of average daily net assets in the case of Class B shares, 0.10% of average daily net assets in the case of Class D shares, 0.15% of average daily net assets in the case of Class E shares, 0.20% of average daily net assets in the case of Class F shares and 0.30% of average daily net assets in the case of Class G shares. The D&S Plan is known as a “compensation plan” because the Trust makes payments to the Distributor for services rendered regardless of the actual level of expenditures by the Distributor. Amounts incurred by the Portfolio for the year ended December 31, 2023 are shown as Distribution and service fees in the Statement of Operations.
Deferred Trustee Compensation - Each Trustee who is not currently an employee of the Adviser or any of its affiliates receives compensation from the Trust for his or her service to the Trust. A deferred compensation plan (the “Plan”) is available to the Trustees on a voluntary basis. Deferred amounts remain in the Trust until distributed in accordance with the provisions of the Plan. The value of a participating Trustee’s deferral account is based on theoretical investments of deferred amounts on the normal payment dates in certain portfolios of the Trust or Brighthouse Funds Trust I, an affiliate of the Trust, as designated by the participating Trustee. Changes in the value of participants’ deferral accounts are reflected as a component of Trustees’ fees and expenses in the Statement of Operations. The portion of the accrued obligations allocated to the Portfolio under the Plan is reflected as Deferred trustees’ fees in the Statement of Assets and Liabilities.
6. Contractual Obligations
Under the Trust’s organizational documents, its officers and Trustees may be indemnified against certain liabilities and expenses arising out of the performance of their duties to the Trust. Additionally, the Trust has a variety of indemnification obligations under contracts with its service providers. The Trust’s maximum exposure under these arrangements is unknown, as this would involve future claims that may be made against the Trust that have not yet occurred.
BHFTII-17
Brighthouse Funds Trust II
MFS Value Portfolio
Notes to Financial Statements—December 31, 2023—(Continued)
7. Income Tax Information
The cost basis of investments for federal income tax purposes at December 31, 2023 was as follows:
| Cost basis of investments |
$ | 2,043,726,987 | ||
|
|
|
|||
| Gross unrealized appreciation |
824,031,659 | |||
| Gross unrealized (depreciation) |
(58,822,073 | ) | ||
|
|
|
|||
| Net unrealized appreciation (depreciation) |
$ | 765,209,586 | ||
|
|
|
The tax character of distributions paid for the years ended December 31, 2023 and 2022 were as follows:
| Ordinary Income |
Long-Term Capital Gain | Total | ||||||||||||||||||
| 2023 |
2022 | 2023 | 2022 | 2023 | 2022 | |||||||||||||||
| $49,915,522 | $ | 56,310,542 | $ | 330,630,616 | $ | 431,351,389 | $ | 380,546,138 | $ | 487,661,931 | ||||||||||
As of December 31, 2023, the components of distributable earnings (accumulated losses) on a federal income tax basis were as follows:
| Undistributed |
Undistributed Long-Term Capital Gain |
Net Unrealized Appreciation (Depreciation) |
Accumulated Capital Losses |
Total | ||||||||||||
| $49,134,839 | $ | 252,295,751 | $ | 765,299,118 | $ | — | $ | 1,066,729,708 | ||||||||
The Portfolio utilizes the provisions of the federal income tax laws that provide for the carryforward of capital losses for prior years, offsetting such losses against any future realized capital gains. Net capital losses may be carried forward indefinitely and their character is retained as short-term and/or long-term losses.
As of December 31, 2023, the Portfolio had no accumulated capital losses.
8. Recent Accounting Pronouncement & Regulatory Updates
In June 2022, FASB issued Accounting Standards Update 2022-03—Fair Value Measurement (Topic 820)—Fair Value Measurement of Equity Securities Subject to Contractual Sale Restrictions (“ASU 2022-03”). ASU 2022-03 clarifies the guidance in Topic 820 to indicate that a contractual sale restriction should not be considered in the fair value of an equity security subject to such a restriction, and requires entities with investments in equity securities subject to contractual sale restrictions to disclose certain qualitative and quantitative information about such securities. ASU 2022-03 is effective for fiscal years, and interim periods within those fiscal years, beginning after December 15, 2023. ASU 2022-03 is only applicable to an equity security in which the contractual arrangement that restricts its sale is executed or modified on or after the adoption date.
Effective January 24, 2023, the Securities and Exchange Commission adopted rule and form amendments that require open-end management investment companies to transmit concise and visually engaging annual and semiannual reports to shareholders that highlight certain information deemed by the SEC to be particularly important for investors. Certain other information, including financial statements, will no longer appear in shareholder reports but will, as required, be available online, delivered free of charge upon request, and filed on a semiannual basis on Form N-CSR. The rule and form amendments have a compliance date of July 24, 2024. Accordingly, the rule and form amendments will not impact the Portfolio until its 2024 semiannual shareholder report.
BHFTII-18
Brighthouse Funds Trust II
MFS Value Portfolio
Report of Independent Registered Public Accounting Firm
To the Board of Trustees of Brighthouse Funds Trust II and Shareholders of the MFS Value Portfolio:
Opinion on the Financial Statements and Financial Highlights
We have audited the accompanying statement of assets and liabilities, including the schedule of investments, of the MFS Value Portfolio (the “Fund”) (one of the funds constituting the Brighthouse Funds Trust II), as of December 31, 2023, the related statement of operations for the year then ended, the statements of changes in net assets for each of the two years in the period then ended, the financial highlights for each of the five years in the period then ended, and the related notes. In our opinion, the financial statements and financial highlights present fairly, in all material respects, the financial position of the Fund as of December 31, 2023, and the results of its operations for the year then ended, the changes in its net assets for each of the two years in the period then ended, and the financial highlights for each of the five years in the period then ended in conformity with accounting principles generally accepted in the United States of America.
Basis for Opinion
These financial statements and financial highlights are the responsibility of the Fund’s management. Our responsibility is to express an opinion on the Fund’s financial statements and financial highlights based on our audits. We are a public accounting firm registered with the Public Company Accounting Oversight Board (United States) (PCAOB) and are required to be independent with respect to the Fund in accordance with the U.S. federal securities laws and the applicable rules and regulations of the Securities and Exchange Commission and the PCAOB.
We conducted our audits in accordance with the standards of the PCAOB. Those standards require that we plan and perform the audit to obtain reasonable assurance about whether the financial statements and financial highlights are free of material misstatement, whether due to error or fraud. The Fund is not required to have, nor were we engaged to perform, an audit of its internal control over financial reporting. As part of our audits we are required to obtain an understanding of internal control over financial reporting but not for the purpose of expressing an opinion on the effectiveness of the Fund’s internal control over financial reporting. Accordingly, we express no such opinion.
Our audits included performing procedures to assess the risks of material misstatement of the financial statements and financial highlights, whether due to error or fraud, and performing procedures that respond to those risks. Such procedures included examining, on a test basis, evidence regarding the amounts and disclosures in the financial statements and financial highlights. Our audits also included evaluating the accounting principles used and significant estimates made by management, as well as evaluating the overall presentation of the financial statements and financial highlights. Our procedures included confirmation of securities owned as of December 31, 2023, by correspondence with the custodian and brokers; when replies were not received from brokers, we performed other auditing procedures. We believe that our audits provide a reasonable basis for our opinion.
/s/ Deloitte & Touche LLP
Boston, Massachusetts
February 23, 2024
We have served as the auditor of one or more Brighthouse investment companies since 1983.
BHFTII-19
Brighthouse Funds Trust II
Trustees and Officers
MANAGEMENT OF THE TRUSTS
The Boards of Trustees (the “Board”) of Brighthouse Funds Trust I and Brighthouse Funds Trust II (“Trust I” and “Trust II”, respectively, and collectively the “Trusts”) supervise the Trusts and are responsible for representing the interests of shareholders. The Trustees, the Chairman of the Board and the Chairmen of each subcommittee are the same for both Trusts. The Trustees of each Trust meet periodically throughout the year to oversee the Portfolios’ activities, reviewing, among other things, each Portfolio’s performance and its contractual arrangements with various service providers. The Trustees of each Trust elect the officers of the Trust, who are responsible for administering the Trust’s day-to-day operations.
Trustees and Officers
The Trustees and executive officers of the Trusts, as well as their ages and their principal occupations during the past five years, are set forth below. Unless otherwise indicated, the business address of each is c/o Brighthouse Funds Trust I and Brighthouse Funds Trust II, 11225 N. Community House Rd., Charolette, North Carolina 28277. Each Trustee who is deemed an “interested person,” as such term is defined in the 1940 Act, is referred to as an “Interested Trustee.” Those Trustees who are not “interested persons,” as such term is defined in the 1940 Act, are referred to as “Independent Trustees.” There is no limit to the term a Trustee may serve, other than pursuant to the retirement policy adopted by the Independent Trustees. Trustees serve until their death, resignation, retirement or removal in accordance with Trust I’s and Trust II’s respective organizational documents and policies adopted by the Board of the Trust from time to time. Officers hold office at the pleasure of each Board and serve until their removal or resignation in accordance with the Trusts’ respective organizational documents and policies adopted by the Board of each Trust from time to time.
Trustees of the Trusts
| Name and Year of Birth |
Position(s) |
Term of Office |
Principal Occupation(s) During the Past |
Number of |
Other Directorships Held | |||||
| Interested Trustee | ||||||||||
| John Rosenthal* (1960) |
Trustee | Indefinite; From May 2016 (Trust I and Trust II) to present | Chief Investment Officer, Brighthouse Financial, Inc. (2016 to present). | 73 | None | |||||
| Independent Trustees | ||||||||||
| Dawn M. Vroegop (1966) |
Trustee and Chair of the Board | Indefinite; From December 2000 (Trust I)/May 2009 (Trust II) to present as Trustee; From May 2016 (Trust I and Trust II) until present as Chair | Retired; Private Investor. | 73 | Trustee, Driehaus Mutual Funds (8 portfolios).** | |||||
| Stephen M. Alderman (1959) |
Trustee | Indefinite; From December 2000 (Trust I)/April 2012 (Trust II) to present | Vice President and General Counsel, IHR Aerial Solutions, LLC; Until 2022, General Counsel, Illini Hi-Reach, Inc.; Until 2020, Shareholder in the law firm of Garfield & Merel, Ltd. | 73 | None | |||||
| Robert J. Boulware (1956) |
Trustee | Indefinite; From March 2008 (Trust I)/April 2012 (Trust II) to present | Managing Member, Pilgrim Funds, LLC (private equity fund). | 73 | Trustee, Vertical Capital Income Fund (closed-end fund);** Trustee, The Private Shares Fund (closed- end fund);** Until 2021, Director, Mid- Con Energy Partners, LP (energy);** Until 2020, Director, Gainsco, Inc. (auto insurance).** | |||||
BHFTII-20
Brighthouse Funds Trust II
Trustees and Officers—(Continued)
| Name and Year of Birth |
Position(s) |
Term of Office |
Principal Occupation(s) During the Past |
Number of |
Other Directorships Held | |||||
| Susan C. Gause (1952) |
Trustee | Indefinite; From March 2008 (Trust I)/April 2012 (Trust II) to present | Private Investor. | 73 | Trustee, HSBC Funds (4 portfolios).** | |||||
| Nancy Hawthorne (1951) |
Trustee | Indefinite; From May 2003 (Trust II)/April 2012 (Trust I) to present | Private Investor. | 73 | Trustee, First Eagle Credit Opportunities Fund;** Trustee and Chair of the Board of Trustees, First Eagle Global Opportunities Fund;** Director, Avid Technology, Inc;** Director, CRA International, Inc.** | |||||
Executive Officers of the Trusts
| Name and Year of Birth |
Position(s) Held |
Term of Office |
Principal Occupation(s) | |||
| Kristi Slavin (1973) | President and Chief Executive Officer, of Trust I and Trust II | From May 2016 (Trust I and Trust II) to present |
President, Brighthouse Investment Advisers, LLC (2016-present). | |||
| Alan R. Otis (1971) | Chief Financial Officer and Treasurer, of Trust I and Trust II | From November 2017 (Trust I and Trust II) to present |
Executive Vice President, Brighthouse Investment Advisers, LLC (2017-present); formerly, Vice President, Brighthouse Investment Advisers, LLC (2012-2017); Assistant Treasurer, Trust I and Trust II (2012-2017). | |||
| Thomas Watterson (1985) | Secretary, of Trust I and Trust II | From November 2023 (Trust I and Trust II) to present |
Executive Vice President, Chief Legal Officer and Secretary, Brighthouse Investment Advisers, LLC (2023-Present); Managing Corporate Counsel, Brighthouse Financial Inc. (2023-present); Managing Counsel and Director, The Bank of New York Mellon Corporation (2019-2023); Counsel and Vice President, The Bank of New York Mellon Corporation (2016-2019). | |||
| Katie Hellmann (1980) | Chief Compliance Officer (“CCO”), of Trust I and Trust II | From May 2023 (Trust I and Trust II) to present |
Chief Compliance Officer, Brighthouse Investment Advisers, LLC (2023-present) and Head of Funds and Investments Compliance (2023-present). Deputy Chief Compliance Officer, Transamerica Asset Management (2022-2023). Leader and Senior Compliance Counsel-Funds Compliance, Edward Jones (2017-2022). | |||
| Rosemary Morgan (1983) | Anti-Money Laundering Officer, of Trust I and Trust II | From May 2023 (Trust I and Trust II) to present |
Chief Privacy Officer, Leader of Compliance Programs and Assistant General Counsel, Brighthouse Financial, Inc. (2019-2022); Chief Privacy Officer, Head of Compliance Programs & Contracts Law, Brighthouse Financial, Inc. (2022-2023), Chief Compliance Officer and Associate General Counsel, Brighthouse Financial, Inc. (2023-present); Vice President and Chief Compliance Officer, Brighthouse Life Insurance Company (2023-present); Vice President and Chief Compliance Officer (2023-present), Brighthouse Life Insurance Company of NY; Vice President and Chief Compliance Officer (2023-present), New England Life Insurance Company. | |||
| Anna Koska (1981) | Vice President, of Trust I and Trust II | From June 2022 (Trust I and Trust II) to present |
Vice President, Investment and Advisory Services, Brighthouse Investment Advisers, LLC (2022-present); Director of Investment and Advisory Services, Brighthouse Investment Advisers, LLC (2019-2022); Senior Portfolio Analyst, Brighthouse Investment Advisers, LLC (2017-2019). | |||
| * | Mr. Rosenthal is an “interested person” of the Trusts because of his position with Brighthouse Financial, Inc. (“Brighthouse Financial”), an affiliate of BIA. |
| ** | Indicates a directorship with a registered investment company or a company subject to the reporting requirements of the Securities Exchange Act of 1934, as amended. |
| (1) | Previous positions during the past five years with the Trusts, MetLife, Inc. or the Adviser are omitted if not materially different. |
| (2) | The Fund Complex includes 44 Trust I Portfolios and 29 Trust II Portfolios. |
BHFTII-21
Brighthouse Funds Trust II
MFS Value Portfolio
Board of Trustees’ Consideration of Advisory and Sub-Advisory Agreements
At a meeting held on November 13-14, 2023 (the “November Meeting”), the Boards of Trustees (the “Board”) of Brighthouse Funds Trust I and Brighthouse Funds Trust II (“BFT I” and “BFT II,” respectively, and collectively, the “Trusts”), including a majority of the Trustees who are not “interested persons” of the Trusts (the “Independent Trustees”) under the Investment Company Act of 1940 (the “1940 Act”), approved the continuation of the Trusts’ advisory agreements (each an “Advisory Agreement”) with Brighthouse Investment Advisers, LLC (the “Adviser”) and the applicable sub-advisory and sub-sub-advisory agreements (each a “Sub-Advisory Agreement” and collectively with the Advisory Agreement, the “Agreements”) between the Adviser and the investment sub-advisers and sub-sub-adviser (each a “Sub-Adviser,” and collectively, the “Sub-Advisers”) for the series of the Trusts (each a “Portfolio,” and collectively, the “Portfolios”) for the annual contract renewal period from January 1, 2024 through December 31, 2024.
The Board met with personnel of the Adviser on September 28-29, 2023 (the “September Meeting”) for the specific purpose of giving preliminary consideration to the proposed continuation of the Agreements, including consideration to information that the Adviser and Sub-Advisers had provided for the Board’s review at the request of the Independent Trustees. At the September Meeting, the Adviser reviewed with the Board the performance and fees experienced by each Portfolio, as well as other information. During and after the September Meeting, the Independent Trustees requested additional information and clarifications that the Adviser addressed at the November Meeting (the September Meeting and the November Meeting are referred to collectively as, the “Meetings”). During the contract renewal process, and throughout the year, the Independent Trustees were advised by independent legal counsel, and they met with independent legal counsel in executive sessions outside of the presence of management on a number of occasions to discuss, among other things, the renewal of the Agreements.
In considering the continuation of the Agreements, the Board reviewed a variety of materials that were provided for the specific purpose of assisting the Board in the renewal process, along with various information and materials that were provided to and discussed with the Board throughout the year, at regularly scheduled meetings of the Board and its committees. In particular, information for each Portfolio included, but was not limited to, reports on investment performance, expenses, legal and compliance matters, and asset pricing. Information about the Adviser and each Sub-Adviser included, but was not limited to, reports on the business, operations, and performance of the Adviser and the Sub-Advisers and reports that the Adviser and Sub-Advisers had prepared specifically for the renewal process.
In considering the continuation of the Agreements, the Board also reviewed, among other things, a report for each Portfolio that was prepared by Broadridge (“Broadridge”), an independent organization, which set forth comparative performance and expense information for each Portfolio. In addition, the Independent Trustees reviewed a report that was prepared by JDL Consultants, LLC (“JDL”), an independent consultant to the Independent Trustees, which examined the Broadridge reports for each Portfolio (“JDL Report”). The Independent Trustees met in executive session with representatives of JDL during the September Meeting to review the JDL Report.
At the November Meeting, the Board, including a majority of the Independent Trustees, concluded that the nature, extent, and quality of services provided by the Adviser and each Sub-Adviser supported the renewal of the Agreements. The Board also concluded that the investment services provided to and the performance of each Portfolio was such that each Agreement should continue, and that the fees paid by each Portfolio to the Adviser appeared to be reasonable in light of the nature, extent, and quality of the services provided by the Adviser and each Sub-Adviser. Further, the Board concluded that the Adviser’s profitability in providing services under the Advisory Agreements did not appear unreasonable in light of the nature, extent, and quality of the services provided by the Adviser. The Board reviewed the extent to which the investment advisory fees paid by the Portfolios shared economies of scale with investors or entailed the potential to share economies of scale with investors and concluded that those considerations generally supported the renewal of each Agreement. Finally, the Board considered the Adviser’s recommendation that it approve the renewal of each Sub-Advisory Agreement.
In approving the continuation of each Agreement, the Board, including the Independent Trustees, gave attention to all of the information that was furnished, and each Trustee placed varying degrees of importance on the various pieces of information that were provided to them. The Board evaluated the information provided to it on a Portfolio-by-Portfolio basis, and its decision was made separately with respect to each Portfolio. The following paragraphs provide more information about some of the primary factors that were relevant to the Board’s decisions. The Board did not identify any single factor as determinative, and the Trustees generally attributed different weights to various factors for the various Portfolios.
Nature, extent and quality of services. The Board evaluated the nature, extent, and quality of the services that the Adviser and the Sub-Advisers, as relevant, provided to the Portfolios. The Board considered the Adviser’s services as investment manager to the Portfolios, including its services relating to the hiring and oversight of the Sub-Advisers and, in particular, their investment programs and personnel, succession management of key personnel, trading practices, compliance programs and personnel, and risk management
BHFTII-22
Brighthouse Funds Trust II
MFS Value Portfolio
Board of Trustees’ Consideration of Advisory and Sub-Advisory Agreements—(Continued)
programs, among other things. The Adviser’s services in coordinating and overseeing the activities of the Trusts’ other service providers were also considered. The Board also considered the systems and processes required by the Adviser to meet additional regulatory and compliance requirements resulting from U.S. Securities and Exchange Commission and other regulatory initiatives, including related to liquidity, valuation, and derivatives risk management. The Board considered information received from the Trusts’ Chief Compliance Officer regarding the Portfolios’ compliance policies and procedures that were established pursuant to Rule 38a-l under the 1940 Act, and relevant aspects of the Adviser’s and Sub-Advisers’ compliance policies and procedures. The Board also noted that it was the practice of the Adviser’s investment, compliance, and legal staff to conduct periodic meetings (through various media) with the Sub-Advisers throughout the year in order to review and assess the services that are provided to the Portfolios, and that personnel of the Adviser routinely prepare and present reports to the Board regarding those meetings. In addition, during the Meetings and throughout the year, the Board considered the expertise, experience, and performance of the personnel of the Adviser who performed the various services that are mentioned above.
With respect to the services provided by each of the Sub-Advisers, the Board considered a variety of information that the Adviser and each Sub-Adviser prepared for the Board’s review. The Board considered each Sub-Adviser’s investment process, each Sub-Adviser’s overall organization and business plans and the investment performance experienced by the Portfolio (as described in more detail below). The Board took into account that each Sub-Adviser’s responsibilities include, among other things, the development and maintenance of an investment program for the applicable Portfolio, the selection of investments and the placement of orders for the purchase and sale of such assets, and the implementation of compliance controls related to the performance of these services. The Board considered, based on the information provided, each Sub-Adviser’s staffing with respect to the management of the Portfolio and other information relating to the Sub-Adviser’s business and operations. The Board also considered the Sub-Adviser’s overall resources and information with respect to any recent turnover of key personnel at the Sub-Adviser. The Board reviewed each Sub-Adviser’s investment experience, as well as information provided regarding the Sub-Adviser’s personnel who provide services to the Portfolios. The Board also considered, among other things, information about each Sub-Adviser’s compliance program, including regarding any compliance matters involving a Sub-Adviser that had been brought to the Board’s attention during the year, as well as the Adviser’s assessment of the financial condition of each Sub-Adviser.
Performance. The Board placed emphasis on the performance of each Portfolio in the context of the performance of the relevant markets in which the Portfolio invests. The Board considered the Adviser’s quarterly presentations to the Board of detailed information about each Portfolio’s investment strategies and performance results and composition, including discussions regarding the relevant effects of market conditions. The Board reviewed and considered the reports prepared by Broadridge, which provided a statistical analysis comparing each Portfolio’s investment performance to that of comparable funds underlying variable insurance products (the “Performance Universe”), and the JDL Report. The Board also compared the performance of each Portfolio to that of comparable funds and other accounts that were managed by the relevant Sub-Adviser, to the extent such information was provided. The Board considered each Portfolio’s performance for periods subsequent to the performance period covered by the Broadridge reports and considered the Adviser’s assessment of the same. The Board also noted that while it found the data provided by Broadridge generally useful, it recognized the limitations of such data, including, in particular, that notable differences may exist between a Portfolio and the other funds in a Broadridge category (for example, with respect to investment strategies) and that the results of the performance comparisons may vary depending on (i) the end dates for the performance periods that were selected and (ii) the selection of the peer groups.
The Board focused particular attention on Portfolios with less favorable performance records. The Board noted the Adviser’s focus on each Sub-Adviser’s performance and that the Adviser had been active in monitoring and responding to any performance issues with respect to the Portfolios.
Fees and Expenses. The Board gave consideration to the level and method of computing the fees payable under the Agreements. The Board reviewed and considered the information in the JDL Report concerning fees and expenses. The Board also reviewed and considered the Broadridge report for each Portfolio, which included various comparisons of the Portfolio’s fees (at December 31, 2022 and various asset levels) and expenses with those of its peers, including, as applicable, a broad group of peer funds (“Expense Universe”), a narrower group of peer funds (“Expense Group”), a broad group of peer sub-advised funds (“Sub-advised Expense Universe”), and a narrower group of peer sub-advised funds (“Sub-advised Expense Group”). In particular, the Board reviewed comparisons of each Portfolio’s contractual management fees with its Expense Group and Sub-advised Expense Universe, contractual sub-adviser fees with its Sub-advised Expense Universe and Sub-advised Expense Group, and total expenses with its Expense Universe, Expense Group and Sub-advised Expense Universe. The Board considered that Broadridge selected the peer funds, which were funds underlying variable insurance products that Broadridge deemed to be comparable to the Portfolios. The Board considered that the fee and expense information in the Broadridge report for each Portfolio reflected information as of the Portfolio’s most recent fiscal year
BHFTII-23
Brighthouse Funds Trust II
MFS Value Portfolio
Board of Trustees’ Consideration of Advisory and Sub-Advisory Agreements—(Continued)
end at the time the Broadridge report was issued and that historical asset levels may differ from current asset levels, particularly in a period of market volatility. In addition, the Board compared the fee payable to a Sub-Adviser by the Adviser with respect to the Portfolio to the fee payable to the Sub-Adviser by other comparable funds and other accounts, to the extent such information was provided.
The Board noted that the sub-advisory fees for the Portfolios are negotiated at arm’s length by the Adviser and are paid by the Adviser out of its advisory fees. The Board also considered that the Adviser had entered into expense limitation or management fee waiver agreements with certain of the Portfolios pursuant to which the Adviser had agreed to waive a portion of its advisory fee and/or reimburse certain expenses as a means of limiting a Portfolio’s total annual operating expenses or passing through the benefit of a subadvisory fee concession to a Portfolio, as applicable.
Profitability. The Board examined the profitability to the Adviser of each Advisory Agreement, on a Portfolio-by-Portfolio basis. The Board also considered that an affiliate of the Adviser, Brighthouse Securities, LLC, serves as distributor for the Trusts, and, as such, receives Rule 12b-1 payments to support the distribution of the Portfolios. The Board considered the profitability to the Sub-Advisers and their affiliates of their relationships with the Portfolios, to the extent provided, and the Board considered the ability of the Adviser to negotiate with a Sub-Adviser at arm’s length. In reviewing the profitability information, the Board recognized that expense allocation methodologies are inherently subjective and various methodologies may be reasonable while producing different results.
Economies of scale. The Board considered each Portfolio’s fees in light of its size. The Board noted the fee schedules for the Portfolios that contain breakpoints that reduce the fee rate above specified asset levels, including breakpoints in the Advisory Agreements and any corresponding Sub-Advisory Agreement. The Board noted those Portfolios that did not have breakpoints in their advisory fees and considered management’s explanation of the same.
The Board considered the effective fees under the Advisory Agreement and Sub-Advisory Agreement for each Portfolio as a percentage of assets at different asset levels and possible economies of scale that may be realized if the assets of the Portfolio grow. The Board examined, among other data, the effect of a Portfolio’s growth in size, and reduction in size, on various fee schedules. The Board also generally noted that if a Portfolio’s assets increase over time, the Portfolio may realize economies of scale if assets increase proportionally more than certain other expenses.
Other factors. The Board considered other benefits that may be realized by the Adviser and its affiliates from their relationships with the Trusts. Among the benefits realized by the Adviser, the Board recognized that Brighthouse Securities, LLC, as the distributor for the Trusts, receives payments pursuant to Rule 12b-1 from the Portfolios to help compensate for the provision of shareholder services and distribution activities. The Board considered that a Sub-Adviser may engage in soft dollar transactions in managing a Portfolio. In addition, the Board considered that a Sub-Adviser may be affiliated with registered broker-dealers that may, from time to time, receive brokerage commissions from a Portfolio in connection with the sale of portfolio securities (subject to applicable best execution obligations). The Board also considered that a Sub-Adviser and its affiliates could benefit from the opportunity to provide advisory services to additional portfolios of the Trusts and overall reputational benefits.
The Board considered information from the Adviser and Sub-Advisers pertaining to potential conflicts of interest, and the manner in which any potential conflicts were mitigated. In its review, the Board considered information regarding various business relationships among the Adviser and its affiliates and various Sub-Advisers and their affiliates. The Board also considered information about services and/or payments provided to the Adviser by the Sub-Advisers in connection with marketing activities. The Board considered representations from the Adviser that such business relationships and any payments were not considered in the Adviser’s recommendation to renew any of the Sub-Advisory Agreements.
* * * * *
MFS Value Portfolio. The Board also considered the following information in relation to the Agreements with the Adviser and Massachusetts Financial Services Company regarding the Portfolio:
Among other data relating specifically to the Portfolio’s performance, the Board considered that the Portfolio underperformed the median of its Performance Universe and the average of its Morningstar Category for the one-and three-year periods ended June 30, 2023 and outperformed the median of its Performance Universe and the average of its Morningstar Category for the five-year period ended June 30, 2023. The Board further considered that the Portfolio outperformed its benchmark, the Russell 1000 Value Index, for the one-and five-year periods ended October 31, 2023 and underperformed the same benchmark for the three-year period ended October 31, 2023. The Board took into account management’s discussion of the Portfolio’s performance, including with respect to prevailing market conditions. The Board also noted the presence of certain management fee waivers in effect for the Portfolio. In
BHFTII-24
Brighthouse Funds Trust II
MFS Value Portfolio
Board of Trustees’ Consideration of Advisory and Sub-Advisory Agreements—(Continued)
addition, the Board considered that the Adviser had negotiated reductions to the Portfolio’s sub-advisory fee schedule and that the Adviser agreed to waive a portion of its advisory fee in order for contract holders to benefit from the lower sub-advisory fee effective January 1, 2023.
The Board also considered that the Portfolio’s actual management fees and total expenses (exclusive of 12b-l fees) were below the Expense Group median, the Expense Universe median, and the Sub-advised Expense Universe median. The Board further noted that the Portfolio’s contractual management fees were above the asset-weighted average of the Investment Classification/Morningstar Category selected by Broadridge at the Portfolio’s current size. The Board took into account that the Portfolio’s contractual sub-advisory fees were below the averages of the Sub-advised Expense Group and the Sub-advised Expense Universe at the Portfolio’s current size.
BHFTII-25
Brighthouse Funds Trust II
Neuberger Berman Genesis Portfolio
Managed By Neuberger Berman Investment Advisers LLC
Portfolio Manager Commentary*
PERFORMANCE
For the twelve months ended December 31, 2023, the Class A, B and E shares of the Neuberger Berman Genesis Portfolio returned 15.53%, 15.20%, and 15.35%, respectively. The Portfolio’s benchmark, the Russell 2000 Value Index¹, returned 14.65%.
MARKET ENVIRONMENT / CONDITIONS
The market overcame several headwinds during the year, including elevated inflation, the U.S. Federal Reserve’s (the “Fed”) rate hikes, concerns that the economy could fall into a recession, a mini crisis in the regional banking industry, and numerous geopolitical events. Despite this, the economy continued to expand, and corporate results often exceeded expectations. Investor sentiment was positive late in the year, largely driven by the Fed’s “pivot,” as it indicated the likely end to rate hikes and potential for rate cuts in 2024, buoying hopes that the Fed could orchestrate a “soft landing.” All told, the Russell 2000 Value Index rose 14.65% during the year. In contrast, the large-cap S&P 500 Index rose 26.29% during the same period.
PORTFOLIO REVIEW / PERIOD END POSITIONING
It was another volatile year in the equity markets. During 2023, the Portfolio largely performed as we would expect in each material up- and down-market period (outperforming in the down-markets that were characterized by investor fear and uncertainty and underperforming in the up-markets when investor risk tolerance and speculation was on the rise). During the full year, the Portfolio appreciated strongly and outperformed the Russell 2000 Value Index due to strong sector allocation, which was partially offset by negative stock selection.
An overweight to the software industry within the Information Technology (“IT”) sector added the most value. Our overweight in the Industrials sector, a lack of names in the Utilities sector, and underweight to regional banks also added considerable value. On the downside, the Portfolio’s overweight to Health Care and a small cash position were modest drags on relative performance.
Stock selection was positive in the Health Care, Materials, and Consumer Staples sectors in 2023. Within Health Care, our life sciences tools & services positions added the most value, as these long-held names benefited from the increased demand for their higher margin products, driven by the growth in drug research and Glucagon-like peptide-1 (“GLP-1”) demand. Within the Materials sector, our chemicals and containers & packaging names outperformed. Within Consumer Staples, our household product names outperformed.
Examples of individual stocks that contributed to the Portfolio’s absolute performance included FICO, a company that provides decision management tools used to automate and improve business performance. The stock outperformed, driven by strong operating performance for both its Scores and software businesses. Manhattan Associates, Inc., which provides software solutions that enable the efficient movement of goods through the supply chain, was also additive for returns. The stock performed well on the back of earnings results that showed continued progress on its transition toward a subscription-led offering and solid traction for its new product offerings. Elsewhere, Qualys, Inc., a supplier of cloud-based security and compliance solutions, contributed to results. The company has a leading market position in the vulnerability management market and has successfully launched additional add-on products over time. The stock performed well in the period after reporting strong results and continued return of capital to shareholders in the form of a repurchase program.
Holdings in the Industrials, Financials, and Consumer Discretionary sectors were the largest detractors from relative results. Within Industrials, several of our holdings declined due to company-specific factors. Our Industrials holdings are balanced between steadier businesses that have a high percentage of recurring revenue and cyclicals that have greater sensitivity to economic conditions. Our holdings have leadership positions in niche markets, strong technical expertise, durable customer relationships and/or relative scale. Within Financials, our banking names underperformed the names in the benchmark, due in part to their higher valuations at the start of the period. The Portfolio is underweight regional banks, and we reduced our exposure throughout the year due to the challenging industry dynamics. Our bank holdings have conservative credit and risk management cultures, robust capitalization, long-term customer relationships and the ability to compound tangible book value over the long run.
Individual holdings that were negative for the Portfolio’s absolute performance during the reporting period included Valmont Industries, Inc. The company is the leading manufacturer of engineered, fabricated metal products, steel and aluminum pole, tower, and other structures with market-leading positions across a portfolio of duopoly/oligopoly businesses. The stock underperformed due to concerns about lower farm income and crop prices impacting the company’s agriculture segment (~30% of sales). Driven Brands Holdings, Inc., the largest auto services company in North America serving both retail and commercial customers, detracted from returns. The company operates in a large, defensive, and fragmented market and enjoys strong competitive moats from its technology, marketing, diversified platform and superior franchise economics. The stock underperformed due to weak earnings results driven by challenges in its car wash and glass business, as well as elevated financial leverage. CVB Financial Corp., a Southern California-based
BHFTII-1
Brighthouse Funds Trust II
Neuberger Berman Genesis Portfolio
Managed By Neuberger Berman Investment Advisers LLC
Portfolio Manager Commentary*—(Continued)
small business-oriented lender, was also a headwind for performance. The stock underperformed due to concerns around its liquidity, funding costs and commercial real estate exposure.
We made several adjustments to Portfolio holdings throughout the reporting period. While the Portfolio’s sector positioning is driven by bottom-up stock selection, the Portfolio had the largest overweights in IT and Industrials at the end of the reporting period. In contrast, the Portfolio’s largest sector underweights relative to the benchmark were Financials and Real Estate.
Judy Vale^
Robert W. D’Alelio
Brett S. Reiner
Gregory G. Spiegel
Portfolio Managers
Neuberger Berman Investment Advisers LLC
* This commentary may include statements that constitute “forward-looking statements” under the U.S. securities laws. Forward-looking statements include, among other things, projections, estimates, and information about possible or future results related to the Portfolio, market or regulatory developments. The views expressed above are not guarantees of future performance or economic results and involve certain risks, uncertainties and assumptions that could cause actual outcomes and results to differ materially from the views expressed herein. The views expressed above are subject to change at any time based upon economic, market, or other conditions and the subadvisory firm undertakes no obligation to update the views expressed herein. Any discussions of specific securities should not be considered a recommendation to buy or sell those securities. The views expressed above (including any forward-looking statement) may not be relied upon as investment advice or as an indication of the Portfolio’s trading intent. Information about the Portfolio’s holdings, asset allocation or country diversification is historical and is not an indication of future Portfolio composition, which may vary. Direct investment in any index is not possible. The performance of any index mentioned in this commentary has not been adjusted for ongoing management, distribution and operating expenses, and sales charges applicable to mutual fund investments. In addition, the returns do not reflect additional fees charged by separate accounts or variable insurance contracts that an investor in the Portfolio may pay. If these additional fees were reflected, performance would have been lower.
^ Judy Vale relinquished her portfolio management duties for the Portfolio in January 2024.
1 The Russell 2000 Value Index is an unmanaged measure of performance of those Russell 2000 companies that have lower price-to-book ratios and lower forecasted growth values.
BHFTII-2
Brighthouse Funds Trust II
Neuberger Berman Genesis Portfolio
A $10,000 INVESTMENT COMPARED TO THE RUSSELL 2000 VALUE INDEX
AVERAGE ANNUAL RETURNS (%) FOR THE YEAR ENDED DECEMBER 31, 2023
| 1 Year | 5 Year | 10 Year | ||||||||||
| Neuberger Berman Genesis Portfolio | ||||||||||||
| Class A |
15.53 | 12.40 | 8.75 | |||||||||
| Class B |
15.20 | 12.13 | 8.48 | |||||||||
| Class E |
15.35 | 12.24 | 8.58 | |||||||||
| Russell 2000 Value Index | 14.65 | 10.00 | 6.76 | |||||||||
Portfolio performance is calculated including reinvestment of all income and capital gain distributions. Performance numbers are net of all Portfolio expenses but do not include any insurance, sales, separate account or administrative charges of variable annuity or life insurance contracts or any additional expenses that participants may bear relating to the operations of their plans. If these charges were included, the returns would be lower. The performance of any index referenced above has not been adjusted for ongoing management, distribution and operating expenses, and sales charges applicable to mutual fund investments. Direct investment in any index is not possible. The performance of Class A shares, as set forth in the line graph above, will differ from that of other classes because of the difference in expenses paid by policyholders investing in the different share classes.
This information represents past performance and is not indicative of future results. Investment return and principal value may fluctuate so that shares, upon redemption, may be worth more or less than the original cost.
BHFTII-3
PORTFOLIO COMPOSITION AS OF DECEMBER 31, 2023
Top Holdings
| % of Net Assets |
||||
| Fair Isaac Corp. | 2.5 | |||
| Qualys, Inc. | 2.4 | |||
| Manhattan Associates, Inc. | 2.2 | |||
| RBC Bearings, Inc. | 2.2 | |||
| Pool Corp. | 2.2 | |||
| SPS Commerce, Inc. | 2.1 | |||
| Lattice Semiconductor Corp. | 1.9 | |||
| Eagle Materials, Inc. | 1.8 | |||
| Chemed Corp. | 1.8 | |||
| Bio-Techne Corp. | 1.8 | |||
Top Sectors
| % of Net Assets |
||||
| Industrials | 27.8 | |||
| Information Technology | 21.6 | |||
| Financials | 12.0 | |||
| Health Care | 10.8 | |||
| Consumer Discretionary | 9.8 | |||
| Energy | 5.7 | |||
| Materials | 4.2 | |||
| Consumer Staples | 2.6 | |||
| Communication Services | 2.3 | |||
| Real Estate | 1.8 | |||
Brighthouse Funds Trust II
Neuberger Berman Genesis Portfolio
Understanding Your Portfolio’s Expenses
Shareholder Expense Example
As a shareholder of the Portfolio, you incur ongoing costs, including management fees; distribution and service (12b-1) fees; and other Portfolio expenses. This example is intended to help you understand your ongoing costs (in dollars) (referred to as “expenses”) of investing in the Portfolio and compare these costs with the ongoing costs of investing in other mutual funds. The example is based on an investment of $1,000 invested at the beginning of the period and held for the entire period, July 1, 2023 through December 31, 2023.
Actual Expenses
The first line for each share class of the Portfolio in the table below provides information about actual account values and actual expenses. You may use the information in this line, together with the amount you invested in the particular share class of the Portfolio, to estimate the expenses that you paid over the period. Simply divide your account value by $1,000 (for example, an $8,600 account value divided by $1,000 = 8.6), then multiply the result by the number in the first line under the heading entitled “Expenses Paid During Period” to estimate the expenses you paid on your account during this period.
Hypothetical Example for Comparison Purposes
The second line for each share class of the Portfolio in the table below provides information about hypothetical account values and hypothetical expenses based on the Portfolio’s actual expense ratio and an assumed rate of return of 5% per year before expenses, which is not the Portfolio’s actual return. The hypothetical account values and expenses may not be used to estimate the actual ending account balance or expenses you paid for the period. You may use this information to compare the ongoing costs of investing in the Portfolio and other funds. To do so, compare this 5% hypothetical example with the 5% hypothetical examples that appear in the shareholder reports of the other funds.
Please note that the expenses shown in the table are meant to highlight your ongoing costs only and do not reflect any fees or charges of your variable insurance product or any additional expenses that participants in certain eligible qualified plans may bear relating to the operations of their plan. Therefore, the second line for each share class in the table is useful in comparing ongoing costs only, and will not help you determine the relative total costs of owning different funds. In addition, if these other costs were included, your costs would have been higher.
| Neuberger Berman Genesis Portfolio |
Annualized Expense Ratio |
Beginning Account Value July 1, 2023 |
Ending Account Value December 31, 2023 |
Expenses Paid During Period** July 1, 2023 to December 31, 2023 |
||||||||||||||
| Class A (a) |
Actual | 0.81 | % | $ | 1,000.00 | $ | 1,031.30 | $ | 4.15 | |||||||||
| Hypothetical* | 0.81 | % | $ | 1,000.00 | $ | 1,021.12 | $ | 4.13 | ||||||||||
| Class B (a) |
Actual | 1.06 | % | $ | 1,000.00 | $ | 1,029.70 | $ | 5.42 | |||||||||
| Hypothetical* | 1.06 | % | $ | 1,000.00 | $ | 1,019.86 | $ | 5.40 | ||||||||||
| Class E (a) |
Actual | 0.96 | % | $ | 1,000.00 | $ | 1,030.40 | $ | 4.91 | |||||||||
| Hypothetical* | 0.96 | % | $ | 1,000.00 | $ | 1,020.37 | $ | 4.89 | ||||||||||
| * | Hypothetical assumes a rate of return of 5% per year before expenses. |
| ** | Expenses paid are equal to the Portfolio’s annualized expense ratio for the most recent six month period, as shown above, multiplied by the average account value over the period, multiplied by the number of days (184 days) in the most recent fiscal half-year, divided by 365 (to reflect the one-half year period). |
| (a) | The annualized expense ratio shown reflects the impact of the management fee waiver as described in Note 5 of the Notes to Financial Statements. |
BHFTII-4
Brighthouse Funds Trust II
Neuberger Berman Genesis Portfolio
Schedule of Investments as of December 31, 2023
Common Stocks—98.6% of Net Assets
| Security Description | Shares | Value | ||||||
| Automobile Components—1.6% | ||||||||
| Fox Factory Holding Corp. (a) |
126,878 | $ | 8,561,727 | |||||
| LCI Industries |
48,038 | 6,038,857 | ||||||
|
|
|
|||||||
| 14,600,584 | ||||||||
|
|
|
|||||||
| Banks—6.6% | ||||||||
| Bank of Hawaii Corp. |
83,242 | 6,031,715 | ||||||
| Community Bank System, Inc. |
178,646 | 9,309,243 | ||||||
| Cullen/Frost Bankers, Inc. |
85,144 | 9,237,273 | ||||||
| First Financial Bankshares, Inc. |
230,741 | 6,991,452 | ||||||
| Glacier Bancorp, Inc. |
182,880 | 7,556,602 | ||||||
| Lakeland Financial Corp. |
70,037 | 4,563,611 | ||||||
| Prosperity Bancshares, Inc. |
104,491 | 7,077,175 | ||||||
| Stock Yards Bancorp, Inc. |
80,212 | 4,130,116 | ||||||
| United Community Banks, Inc. |
233,182 | 6,822,905 | ||||||
|
|
|
|||||||
| 61,720,092 | ||||||||
|
|
|
|||||||
| Building Products—2.1% | ||||||||
| CSW Industrials, Inc. |
66,792 | 13,853,329 | ||||||
| Hayward Holdings, Inc. (a) |
454,688 | 6,183,757 | ||||||
|
|
|
|||||||
| 20,037,086 | ||||||||
|
|
|
|||||||
| Capital Markets—1.8% | ||||||||
| Hamilton Lane, Inc. - Class A |
41,818 | 4,743,834 | ||||||
| Houlihan Lokey, Inc. |
60,069 | 7,202,874 | ||||||
| MarketAxess Holdings, Inc. |
16,210 | 4,747,098 | ||||||
|
|
|
|||||||
| 16,693,806 | ||||||||
|
|
|
|||||||
| Chemicals—1.4% | ||||||||
| Element Solutions, Inc. |
330,275 | 7,642,564 | ||||||
| Quaker Chemical Corp. |
24,970 | 5,329,097 | ||||||
|
|
|
|||||||
| 12,971,661 | ||||||||
|
|
|
|||||||
| Commercial Services & Supplies—2.5% | ||||||||
| Casella Waste Systems, Inc. - Class A (a) |
32,003 | 2,734,976 | ||||||
| Rollins, Inc. |
168,762 | 7,369,837 | ||||||
| Tetra Tech, Inc. |
79,121 | 13,207,669 | ||||||
|
|
|
|||||||
| 23,312,482 | ||||||||
|
|
|
|||||||
| Communications Equipment—0.3% | ||||||||
| NetScout Systems, Inc. (a) |
130,518 | 2,864,870 | ||||||
|
|
|
|||||||
| Construction & Engineering—2.3% | ||||||||
| Arcosa, Inc. |
92,507 | 7,644,779 | ||||||
| Valmont Industries, Inc. |
60,146 | 14,044,692 | ||||||
|
|
|
|||||||
| 21,689,471 | ||||||||
|
|
|
|||||||
| Construction Materials—1.8% | ||||||||
| Eagle Materials, Inc. |
84,862 | 17,213,408 | ||||||
|
|
|
|||||||
| Consumer Staples Distribution & Retail—0.4% | ||||||||
| Grocery Outlet Holding Corp. (a) |
126,149 | 3,400,977 | ||||||
|
|
|
|||||||
| Containers & Packaging—0.9% | ||||||||
| AptarGroup, Inc. |
70,179 | 8,675,528 | ||||||
|
|
|
|||||||
| Distributors—2.2% | ||||||||
| Pool Corp. |
51,053 | 20,355,342 | ||||||
|
|
|
|||||||
| Diversified Consumer Services—0.6% | ||||||||
| Bright Horizons Family Solutions, Inc. (a) |
55,281 | 5,209,681 | ||||||
|
|
|
|||||||
| Electronic Equipment, Instruments & Components—3.8% | ||||||||
| Advanced Energy Industries, Inc. |
55,862 | 6,084,489 | ||||||
| Littelfuse, Inc. |
62,280 | 16,663,637 | ||||||
| Novanta, Inc. (a) |
54,660 | 9,205,290 | ||||||
| Rogers Corp. (a) |
23,300 | 3,077,231 | ||||||
|
|
|
|||||||
| 35,030,647 | ||||||||
|
|
|
|||||||
| Energy Equipment & Services—2.9% | ||||||||
| Cactus, Inc. - Class A |
109,477 | 4,970,256 | ||||||
| Oceaneering International, Inc. (a) |
299,139 | 6,365,678 | ||||||
| Tidewater, Inc. (a) |
170,121 | 12,267,425 | ||||||
| Transocean Ltd. (a) |
508,444 | 3,228,619 | ||||||
|
|
|
|||||||
| 26,831,978 | ||||||||
|
|
|
|||||||
| Financial Services—1.3% | ||||||||
| Jack Henry & Associates, Inc. |
39,303 | 6,422,503 | ||||||
| Shift4 Payments, Inc. - Class A (a) |
73,275 | 5,447,264 | ||||||
|
|
|
|||||||
| 11,869,767 | ||||||||
|
|
|
|||||||
| Food Products—0.9% | ||||||||
| Simply Good Foods Co. (a) |
115,812 | 4,586,155 | ||||||
| Utz Brands, Inc. |
244,737 | 3,974,529 | ||||||
|
|
|
|||||||
| 8,560,684 | ||||||||
|
|
|
|||||||
| Health Care Equipment & Supplies—3.3% | ||||||||
| Atrion Corp. |
11,462 | 4,341,691 | ||||||
| Haemonetics Corp. (a) |
176,329 | 15,077,893 | ||||||
| QuidelOrtho Corp. (a) |
50,156 | 3,696,497 | ||||||
| UFP Technologies, Inc. (a) |
46,813 | 8,053,709 | ||||||
|
|
|
|||||||
| 31,169,790 | ||||||||
|
|
|
|||||||
| Health Care Providers & Services—2.2% | ||||||||
| Chemed Corp. |
28,910 | 16,905,123 | ||||||
| CorVel Corp. (a) |
13,202 | 3,263,666 | ||||||
|
|
|
|||||||
| 20,168,789 | ||||||||
|
|
|
|||||||
| Health Care Technology—0.4% | ||||||||
| Simulations Plus, Inc. |
80,260 | 3,591,635 | ||||||
|
|
|
|||||||
| Hotels, Restaurants & Leisure—1.2% | ||||||||
| Texas Roadhouse, Inc. |
92,149 | 11,263,372 | ||||||
|
|
|
|||||||
| Household Products—1.3% | ||||||||
| Church & Dwight Co., Inc. |
39,691 | 3,753,181 | ||||||
| WD-40 Co. |
34,369 | 8,216,597 | ||||||
|
|
|
|||||||
| 11,969,778 | ||||||||
|
|
|
|||||||
See accompanying notes to financial statements.
BHFTII-5
Brighthouse Funds Trust II
Neuberger Berman Genesis Portfolio
Schedule of Investments as of December 31, 2023
Common Stocks—(Continued)
| Security Description | Shares |
Value | ||||||
| Insurance—2.3% | ||||||||
| AMERISAFE, Inc. |
115,630 | $ | 5,409,171 | |||||
| Hagerty, Inc. - Class A (a) |
210,933 | 1,645,277 | ||||||
| RLI Corp. |
77,224 | 10,280,059 | ||||||
| Stewart Information Services Corp. |
68,085 | 3,999,994 | ||||||
|
|
|
|||||||
| 21,334,501 | ||||||||
|
|
|
|||||||
| Life Sciences Tools & Services—4.3% | ||||||||
| Bio-Techne Corp. |
216,343 | 16,693,026 | ||||||
| ICON PLC (a) |
29,602 | 8,379,438 | ||||||
| Stevanato Group SpA |
202,217 | 5,518,502 | ||||||
| West Pharmaceutical Services, Inc. |
25,926 | 9,129,063 | ||||||
|
|
|
|||||||
| 39,720,029 | ||||||||
|
|
|
|||||||
| Machinery—12.7% | ||||||||
| Crane Co. |
23,695 | 2,799,327 | ||||||
| Esab Corp. |
111,099 | 9,623,395 | ||||||
| ESCO Technologies, Inc. |
46,447 | 5,435,692 | ||||||
| Federal Signal Corp. |
17,119 | 1,313,712 | ||||||
| Graco, Inc. |
111,132 | 9,641,812 | ||||||
| Hillman Solutions Corp. (a) |
497,178 | 4,579,009 | ||||||
| Kadant, Inc. |
56,206 | 15,755,104 | ||||||
| Lindsay Corp. |
49,611 | 6,407,757 | ||||||
| Nordson Corp. |
37,593 | 9,930,567 | ||||||
| Omega Flex, Inc. |
27,327 | 1,926,827 | ||||||
| RBC Bearings, Inc. (a) |
71,467 | 20,360,234 | ||||||
| SPX Technologies, Inc. (a) |
106,267 | 10,734,030 | ||||||
| Standex International Corp. |
50,429 | 7,986,945 | ||||||
| Toro Co. |
123,308 | 11,836,335 | ||||||
|
|
|
|||||||
| 118,330,746 | ||||||||
|
|
|
|||||||
| Marine Transportation—1.6% | ||||||||
| Kirby Corp. (a) |
191,449 | 15,024,918 | ||||||
|
|
|
|||||||
| Media—2.3% | ||||||||
| Cable One, Inc. |
9,488 | 5,280,926 | ||||||
| Nexstar Media Group, Inc. |
86,169 | 13,506,991 | ||||||
| TechTarget, Inc. (a) |
89,454 | 3,118,366 | ||||||
|
|
|
|||||||
| 21,906,283 | ||||||||
|
|
|
|||||||
| Oil, Gas & Consumable Fuels—2.8% | ||||||||
| Matador Resources Co. |
101,227 | 5,755,767 | ||||||
| Sitio Royalties Corp. - Class A |
344,938 | 8,109,492 | ||||||
| Southwestern Energy Co. (a) |
1,096,673 | 7,183,208 | ||||||
| Texas Pacific Land Corp. |
2,429 | 3,819,481 | ||||||
| Viper Energy, Inc. |
43,828 | 1,375,323 | ||||||
|
|
|
|||||||
| 26,243,271 | ||||||||
|
|
|
|||||||
| Pharmaceuticals—0.7% | ||||||||
| Amphastar Pharmaceuticals, Inc. (a) |
102,987 | 6,369,746 | ||||||
|
|
|
|||||||
| Professional Services—3.6% | ||||||||
| CBIZ, Inc. (a) |
39,506 | 2,472,681 | ||||||
| CRA International, Inc. |
35,671 | 3,526,079 | ||||||
| Exponent, Inc. |
151,108 | 13,303,548 | ||||||
| FTI Consulting, Inc. (a) |
72,882 | 14,514,450 | ||||||
|
|
|
|||||||
| 33,816,758 | ||||||||
|
|
|
|||||||
| Real Estate Management & Development—1.8% | ||||||||
| Colliers International Group, Inc. |
13,606 | 1,721,431 | ||||||
| FirstService Corp. |
93,919 | 15,223,331 | ||||||
|
|
|
|||||||
| 16,944,762 | ||||||||
|
|
|
|||||||
| Semiconductors & Semiconductor Equipment—4.2% | ||||||||
| Lattice Semiconductor Corp. (a) |
258,875 | 17,859,786 | ||||||
| MKS Instruments, Inc. |
57,848 | 5,950,824 | ||||||
| Power Integrations, Inc. |
184,981 | 15,188,790 | ||||||
|
|
|
|||||||
| 38,999,400 | ||||||||
|
|
|
|||||||
| Software—13.3% | ||||||||
| Aspen Technology, Inc. (a) |
50,436 | 11,103,485 | ||||||
| CommVault Systems, Inc. (a) |
93,255 | 7,446,412 | ||||||
| Fair Isaac Corp. (a) |
19,976 | 23,252,264 | ||||||
| Manhattan Associates, Inc. (a) |
95,127 | 20,482,746 | ||||||
| Model N, Inc. (a) |
210,696 | 5,674,043 | ||||||
| Qualys, Inc. (a) |
112,347 | 22,051,469 | ||||||
| SPS Commerce, Inc. (a) |
99,071 | 19,203,923 | ||||||
| Tyler Technologies, Inc. (a) |
21,587 | 9,025,956 | ||||||
| Vertex, Inc. - Class A (a) |
221,601 | 5,969,931 | ||||||
|
|
|
|||||||
| 124,210,229 | ||||||||
|
|
|
|||||||
| Specialty Retail—4.3% | ||||||||
| Asbury Automotive Group, Inc. (a) |
70,006 | 15,749,250 | ||||||
| Floor & Decor Holdings, Inc. - Class A (a) |
88,725 | 9,898,161 | ||||||
| Tractor Supply Co. |
31,651 | 6,805,915 | ||||||
| Winmark Corp. |
18,855 | 7,872,905 | ||||||
|
|
|
|||||||
| 40,326,231 | ||||||||
|
|
|
|||||||
| Trading Companies & Distributors—2.9% | ||||||||
| Richelieu Hardware Ltd. |
133,234 | 4,824,397 | ||||||
| SiteOne Landscape Supply, Inc. (a) |
36,888 | 5,994,300 | ||||||
| Transcat, Inc. (a) |
42,085 | 4,601,153 | ||||||
| Watsco, Inc. |
27,350 | 11,718,655 | ||||||
|
|
|
|||||||
| 27,138,505 | ||||||||
|
|
|
|||||||
| Total Common Stocks |
919,566,807 | |||||||
|
|
|
|||||||
See accompanying notes to financial statements.
BHFTII-6
Brighthouse Funds Trust II
Neuberger Berman Genesis Portfolio
Schedule of Investments as of December 31, 2023
Short-Term Investment—1.5%
| Security Description | Principal |
Value | ||||||
| Repurchase Agreement—1.5% | ||||||||
| Fixed Income Clearing Corp. |
14,079,142 | $ | 14,079,142 | |||||
|
|
|
|||||||
| Total Short-Term Investments |
14,079,142 | |||||||
|
|
|
|||||||
| Total Investments— 100.1% |
933,645,949 | |||||||
| Other assets and liabilities (net)—(0.1)% |
(1,033,535 | ) | ||||||
|
|
|
|||||||
| Net Assets—100.0% | $ | 932,612,414 | ||||||
|
|
|
|||||||
| * | Principal amount stated in U.S. dollars unless otherwise noted. | |||
| (a) | Non-income producing security. | |||
Fair Value Hierarchy
Accounting principles generally accepted in the United States of America (“GAAP”) define fair market value as the price that the Portfolio would receive to sell an asset or pay to transfer a liability in an orderly transaction between market participants at the measurement date. It establishes a fair value hierarchy that prioritizes inputs to valuation methods and requires disclosure of the fair value hierarchy, separately for each major category of assets and liabilities, that segregates fair value measurements into three levels. Levels 1, 2 and 3 of the fair value hierarchy are defined as follows:
Level 1 - unadjusted quoted prices in active markets for identical investments
Level 2 - other significant observable inputs (including, but not limited to, quoted prices for similar assets or liabilities in markets that are either active or inactive; inputs other than quoted prices that are observable such as interest rates, yield curves, volatilities, prepayment speeds, loss severities, credit risks, default rates, or other market corroborated inputs)
Level 3 - significant unobservable inputs based on the best information available in the circumstances, to the extent observable inputs are unavailable (including the Portfolio’s own assumptions used in determining the fair value of investments and derivative financial instruments)
The inputs or methodologies used for valuing investments are not necessarily an indication of the risk associated with investing in them. Changes to the inputs or methodologies used may result in transfers between levels. A reconciliation of Level 3 securities, if any, will be disclosed following the fair value hierarchy table. For more information about the Portfolio’s policy regarding the valuation of investments, please refer to the Notes to Financial Statements.
The following table summarizes the fair value hierarchy of the Portfolio’s investments as of December 31, 2023:
| Description | Level 1 | Level 2 | Level 3 | Total | ||||||||||||
| Total Common Stocks* |
$ | 919,566,807 | $ | — | $ | — | $ | 919,566,807 | ||||||||
| Total Short-Term Investment* |
— | 14,079,142 | — | 14,079,142 | ||||||||||||
| Total Investments |
$ | 919,566,807 | $ | 14,079,142 | $ | — | $ | 933,645,949 | ||||||||
| * | See Schedule of Investments for additional detailed categorizations. | |||
See accompanying notes to financial statements.
BHFTII-7
Brighthouse Funds Trust II
Neuberger Berman Genesis Portfolio
Statement of Assets and Liabilities
December 31, 2023
| Assets |
||||
| Investments at value (a) |
$ | 933,645,949 | ||
| Receivable for: |
||||
| Fund shares sold |
308,967 | |||
| Dividends and interest |
437,545 | |||
| Prepaid expenses |
3,310 | |||
|
|
|
|||
| Total Assets |
934,395,771 | |||
|
|
|
|||
| Liabilities |
||||
| Payables for: |
||||
| Investments purchased |
227,611 | |||
| Fund shares redeemed |
580,832 | |||
| Accrued Expenses: |
||||
| Management fees |
592,922 | |||
| Distribution and service fees |
64,936 | |||
| Deferred trustees’ fees |
192,719 | |||
| Other expenses |
124,337 | |||
|
|
|
|||
| Total Liabilities |
1,783,357 | |||
|
|
|
|||
| Net Assets |
$ | 932,612,414 | ||
|
|
|
|||
| Net Assets Consist of: |
||||
| Paid in surplus |
$ | 491,210,817 | ||
| Distributable earnings (Accumulated losses) |
441,401,597 | |||
|
|
|
|||
| Net Assets |
$ | 932,612,414 | ||
|
|
|
|||
| Net Assets |
||||
| Class A |
$ | 593,885,780 | ||
| Class B |
273,466,741 | |||
| Class E |
65,259,893 | |||
| Capital Shares Outstanding* |
||||
| Class A |
32,157,377 | |||
| Class B |
15,476,364 | |||
| Class E |
3,632,001 | |||
| Net Asset Value, Offering Price and Redemption Price Per Share |
||||
| Class A |
$ | 18.47 | ||
| Class B |
17.67 | |||
| Class E |
17.97 |
| * | The Portfolio is authorized to issue an unlimited number of shares. | |||
| (a) | Identified cost of investments was $580,716,092. | |||
Statement of Operations
Year Ended December 31, 2023
| Investment Income |
||||
| Dividends (a) |
$ | 9,033,305 | ||
| Interest |
224,364 | |||
|
|
|
|||
| Total investment income |
9,257,669 | |||
|
|
|
|||
| Expenses |
||||
| Management fees |
7,521,467 | |||
| Administration fees |
46,306 | |||
| Custodian and accounting fees |
75,213 | |||
| Distribution and service fees—Class B |
663,282 | |||
| Distribution and service fees-—Class E |
97,470 | |||
| Audit and tax services |
46,856 | |||
| Legal |
46,603 | |||
| Trustees’ fees and expenses |
46,220 | |||
| Shareholder reporting |
75,926 | |||
| Insurance |
8,127 | |||
| Miscellaneous |
18,886 | |||
|
|
|
|||
| Total expenses |
8,646,356 | |||
| Less management fee waiver |
(579,467 | ) | ||
| Less broker commission recapture |
(19,853 | ) | ||
|
|
|
|||
| Net expenses |
8,047,036 | |||
|
|
|
|||
| Net Investment Income |
1,210,633 | |||
|
|
|
|||
| Net Realized and Unrealized Gain (Loss) |
||||
| Net realized gain (loss) on : | ||||
| Investments |
87,446,440 | |||
| Foreign currency transactions |
(498 | ) | ||
|
|
|
|||
| Net realized gain (loss) |
87,445,942 | |||
|
|
|
|||
| Net change in unrealized appreciation on investments |
43,080,157 | |||
|
|
|
|||
| Net realized and unrealized gain (loss) |
130,526,099 | |||
|
|
|
|||
| Net Increase (Decrease) in Net Assets From Operations |
$ | 131,736,732 | ||
|
|
|
| (a) | Net of foreign withholding taxes of $25,819. | |||
See accompanying notes to financial statements.
BHFTII-8
Brighthouse Funds Trust II
Neuberger Berman Genesis Portfolio
Statements of Changes in Net Assets
| Year Ended December 31, 2023 |
Year Ended December 31, 2022 |
|||||||
| Increase (Decrease) in Net Assets: |
||||||||
| From Operations |
||||||||
| Net investment income (loss) |
$ | 1,210,633 | $ | 979,597 | ||||
| Net realized gain (loss) |
87,445,942 | 80,792,553 | ||||||
| Net change in unrealized appreciation (depreciation) |
43,080,157 | (311,766,210 | ) | |||||
|
|
|
|
|
|||||
| Increase (decrease) in net assets from operations |
131,736,732 | (229,994,060 | ) | |||||
|
|
|
|
|
|||||
| From Distributions to Shareholders |
||||||||
| Class A |
(51,424,650 | ) | (106,970,605 | ) | ||||
| Class B |
(24,209,465 | ) | (50,463,350 | ) | ||||
| Class E |
(5,813,703 | ) | (12,512,018 | ) | ||||
|
|
|
|
|
|||||
| Total distributions |
(81,447,818 | ) | (169,945,973 | ) | ||||
|
|
|
|
|
|||||
| Increase (decrease) in net assets from capital share transactions |
(8,695,362 | ) | 76,708,143 | |||||
|
|
|
|
|
|||||
| Total increase (decrease) in net assets |
41,593,552 | (323,231,890 | ) | |||||
| Net Assets |
||||||||
| Beginning of period |
891,018,862 | 1,214,250,752 | ||||||
|
|
|
|
|
|||||
| End of period |
$ | 932,612,414 | $ | 891,018,862 | ||||
|
|
|
|
|
|||||
Other Information:
Capital Shares
Transactions in capital shares were as follows:
| Year Ended December 31, 2023 |
Year Ended December 31, 2022 |
|||||||||||||||
| Shares | Value | Shares | Value | |||||||||||||
| Class A |
||||||||||||||||
| Sales |
458,017 | $ | 8,073,333 | 403,662 | $ | 8,348,547 | ||||||||||
| Reinvestments |
2,960,544 | 51,424,650 | 6,413,106 | 106,970,605 | ||||||||||||
| Redemptions |
(3,618,864 | ) | (65,270,485 | ) | (3,336,606 | ) | (63,956,922 | ) | ||||||||
|
|
|
|
|
|
|
|
|
|||||||||
| Net increase (decrease) |
(200,303 | ) | $ | (5,772,502 | ) | 3,480,162 | $ | 51,362,230 | ||||||||
|
|
|
|
|
|
|
|
|
|||||||||
| Class B |
||||||||||||||||
| Sales |
682,055 | $ | 11,541,873 | 596,860 | $ | 11,834,859 | ||||||||||
| Reinvestments |
1,454,022 | 24,209,465 | 3,142,176 | 50,463,350 | ||||||||||||
| Redemptions |
(2,066,712 | ) | (35,441,549 | ) | (2,136,947 | ) | (40,638,832 | ) | ||||||||
|
|
|
|
|
|
|
|
|
|||||||||
| Net increase (decrease) |
69,365 | $ | 309,789 | 1,602,089 | $ | 21,659,377 | ||||||||||
|
|
|
|
|
|
|
|
|
|||||||||
| Class E |
||||||||||||||||
| Sales |
30,435 | $ | 523,699 | 34,853 | $ | 711,204 | ||||||||||
| Reinvestments |
343,599 | 5,813,703 | 768,551 | 12,512,018 | ||||||||||||
| Redemptions |
(550,244 | ) | (9,570,051 | ) | (489,775 | ) | (9,536,686 | ) | ||||||||
|
|
|
|
|
|
|
|
|
|||||||||
| Net increase (decrease) |
(176,210 | ) | $ | (3,232,649 | ) | 313,629 | $ | 3,686,536 | ||||||||
|
|
|
|
|
|
|
|
|
|||||||||
| Increase (decrease) derived from capital shares transactions |
$ | (8,695,362 | ) | $ | 76,708,143 | |||||||||||
|
|
|
|
|
|||||||||||||
See accompanying notes to financial statements.
BHFTII-9
Brighthouse Funds Trust II
Neuberger Berman Genesis Portfolio
Financial Highlights
| Selected per share data | ||||||||||||||||||||
| Class A | ||||||||||||||||||||
| Year Ended December 31, | ||||||||||||||||||||
| 2023 | 2022 | 2021 | 2020 | 2019 | ||||||||||||||||
| Net Asset Value, Beginning of Period |
$ | 17.51 | $ | 26.57 | $ | 24.01 | $ | 20.75 | $ | 18.56 | ||||||||||
|
|
|
|
|
|
|
|
|
|
|
|||||||||||
| Income (Loss) from Investment Operations |
||||||||||||||||||||
| Net investment income (loss) (a) |
0.04 | 0.04 | (0.01 | ) | 0.03 | 0.05 | ||||||||||||||
| Net realized and unrealized gain (loss) |
2.57 | (5.32 | ) | 4.26 | 4.74 | 5.19 | ||||||||||||||
|
|
|
|
|
|
|
|
|
|
|
|||||||||||
| Total income (loss) from investment operations |
2.61 | (5.28 | ) | 4.25 | 4.77 | 5.24 | ||||||||||||||
|
|
|
|
|
|
|
|
|
|
|
|||||||||||
| Less Distributions |
||||||||||||||||||||
| Distributions from net investment income |
(0.02 | ) | 0.00 | (0.02 | ) | (0.04 | ) | (0.05 | ) | |||||||||||
| Distributions from net realized capital gains |
(1.63 | ) | (3.78 | ) | (1.67 | ) | (1.47 | ) | (3.00 | ) | ||||||||||
|
|
|
|
|
|
|
|
|
|
|
|||||||||||
| Total distributions |
(1.65 | ) | (3.78 | ) | (1.69 | ) | (1.51 | ) | (3.05 | ) | ||||||||||
|
|
|
|
|
|
|
|
|
|
|
|||||||||||
| Net Asset Value, End of Period |
$ | 18.47 | $ | 17.51 | $ | 26.57 | $ | 24.01 | $ | 20.75 | ||||||||||
|
|
|
|
|
|
|
|
|
|
|
|||||||||||
| Total Return (%) (b) |
15.53 | (19.15 | ) | 18.41 | 25.11 | 29.68 | ||||||||||||||
| Ratios/Supplemental Data |
||||||||||||||||||||
| Gross ratio of expenses to average net assets (%) |
0.87 | 0.86 | 0.84 | 0.86 | 0.87 | |||||||||||||||
| Net ratio of expenses to average net assets (%) (c) |
0.80 | 0.81 | 0.83 | 0.85 | 0.85 | |||||||||||||||
| Ratio of net investment income (loss) to average net assets (%) |
0.22 | 0.18 | (0.04 | ) | 0.17 | 0.23 | ||||||||||||||
| Portfolio turnover rate (%) |
16 | 13 | 10 | 12 | 11 | |||||||||||||||
| Net assets, end of period (in millions) |
$ | 593.9 | $ | 566.6 | $ | 767.1 | $ | 739.6 | $ | 670.9 | ||||||||||
| Class B | ||||||||||||||||||||
| Year Ended December 31, | ||||||||||||||||||||
| 2023 | 2022 | 2021 | 2020 | 2019 | ||||||||||||||||
| Net Asset Value, Beginning of Period |
$ | 16.84 | $ | 25.79 | $ | 23.39 | $ | 20.27 | $ | 18.18 | ||||||||||
|
|
|
|
|
|
|
|
|
|
|
|||||||||||
| Income (Loss) from Investment Operations |
||||||||||||||||||||
| Net investment income (loss) (a) |
(0.01 | ) | (0.01 | ) | (0.07 | ) | (0.02 | ) | (0.00 | ) (d) | ||||||||||
| Net realized and unrealized gain (loss) |
2.47 | (5.16 | ) | 4.14 | 4.61 | 5.09 | ||||||||||||||
|
|
|
|
|
|
|
|
|
|
|
|||||||||||
| Total income (loss) from investment operations |
2.46 | (5.17 | ) | 4.07 | 4.59 | 5.09 | ||||||||||||||
|
|
|
|
|
|
|
|
|
|
|
|||||||||||
| Less Distributions |
||||||||||||||||||||
| Distributions from net realized capital gains |
(1.63 | ) | (3.78 | ) | (1.67 | ) | (1.47 | ) | (3.00 | ) | ||||||||||
|
|
|
|
|
|
|
|
|
|
|
|||||||||||
| Total distributions |
(1.63 | ) | (3.78 | ) | (1.67 | ) | (1.47 | ) | (3.00 | ) | ||||||||||
|
|
|
|
|
|
|
|
|
|
|
|||||||||||
| Net Asset Value, End of Period |
$ | 17.67 | $ | 16.84 | $ | 25.79 | $ | 23.39 | $ | 20.27 | ||||||||||
|
|
|
|
|
|
|
|
|
|
|
|||||||||||
| Total Return (%) (b) |
15.20 | (19.32 | ) | 18.12 | 24.76 | 29.41 | ||||||||||||||
| Ratios/Supplemental Data |
||||||||||||||||||||
| Gross ratio of expenses to average net assets (%) |
1.12 | 1.11 | 1.09 | 1.11 | 1.12 | |||||||||||||||
| Net ratio of expenses to average net assets (%) (c) |
1.05 | 1.06 | 1.08 | 1.10 | 1.10 | |||||||||||||||
| Ratio of net investment income (loss) to average net assets (%) |
(0.03 | ) | (0.07 | ) | (0.29 | ) | (0.08 | ) | (0.02 | ) | ||||||||||
| Portfolio turnover rate (%) |
16 | 13 | 10 | 12 | 11 | |||||||||||||||
| Net assets, end of period (in millions) |
$ | 273.5 | $ | 259.4 | $ | 356.0 | $ | 345.9 | $ | 313.9 | ||||||||||
Please see following page for Financial Highlights footnote legend.
See accompanying notes to financial statements.
BHFTII-10
Brighthouse Funds Trust II
Neuberger Berman Genesis Portfolio
Financial Highlights
| Selected per share data | ||||||||||||||||||||
| Class E | ||||||||||||||||||||
| Year Ended December 31, | ||||||||||||||||||||
| 2023 | 2022 | 2021 | 2020 | 2019 | ||||||||||||||||
| Net Asset Value, Beginning of Period |
$ | 17.08 | $ | 26.07 | $ | 23.61 | $ | 20.42 | $ | 18.30 | ||||||||||
|
|
|
|
|
|
|
|
|
|
|
|||||||||||
| Income (Loss) from Investment Operations |
||||||||||||||||||||
| Net investment income (loss) (a) |
0.01 | 0.01 | (0.05 | ) | 0.00 | (d) | 0.02 | |||||||||||||
| Net realized and unrealized gain (loss) |
2.51 | (5.22 | ) | 4.18 | 4.67 | 5.12 | ||||||||||||||
|
|
|
|
|
|
|
|
|
|
|
|||||||||||
| Total income (loss) from investment operations |
2.52 | (5.21 | ) | 4.13 | 4.67 | 5.14 | ||||||||||||||
|
|
|
|
|
|
|
|
|
|
|
|||||||||||
| Less Distributions |
||||||||||||||||||||
| Distributions from net investment income |
0.00 | 0.00 | 0.00 | (0.01 | ) | (0.02 | ) | |||||||||||||
| Distributions from net realized capital gains |
(1.63 | ) | (3.78 | ) | (1.67 | ) | (1.47 | ) | (3.00 | ) | ||||||||||
|
|
|
|
|
|
|
|
|
|
|
|||||||||||
| Total distributions |
(1.63 | ) | (3.78 | ) | (1.67 | ) | (1.48 | ) | (3.02 | ) | ||||||||||
|
|
|
|
|
|
|
|
|
|
|
|||||||||||
| Net Asset Value, End of Period |
$ | 17.97 | $ | 17.08 | $ | 26.07 | $ | 23.61 | $ | 20.42 | ||||||||||
|
|
|
|
|
|
|
|
|
|
|
|||||||||||
| Total Return (%) (b) |
15.35 | (19.26 | ) | 18.21 | 24.96 | 29.49 | ||||||||||||||
| Ratios/Supplemental Data |
||||||||||||||||||||
| Gross ratio of expenses to average net assets (%) |
1.02 | 1.01 | 0.99 | 1.01 | 1.02 | |||||||||||||||
| Net ratio of expenses to average net assets (%) (c) |
0.95 | 0.96 | 0.98 | 1.00 | 1.00 | |||||||||||||||
| Ratio of net investment income (loss) to average net assets (%) |
0.06 | 0.03 | (0.19 | ) | 0.02 | 0.08 | ||||||||||||||
| Portfolio turnover rate (%) |
16 | 13 | 10 | 12 | 11 | |||||||||||||||
| Net assets, end of period (in millions) |
$ | 65.3 | $ | 65.0 | $ | 91.1 | $ | 90.2 | $ | 82.5 | ||||||||||
| (a) | Per share amounts based on average shares outstanding during the period. | |||
| (b) | Total return does not reflect any insurance, sales, separate account or administrative charges of variable annuity or life insurance contracts or any additional expenses that contract owners may bear under their variable contracts. If these charges were included, the returns would be lower. | |||
| (c) | Includes the effects of management fee waivers (see Note 5 of the Notes to Financial Statements). | |||
| (d) | Net investment income (loss) was less than $0.01. | |||
See accompanying notes to financial statements.
BHFTII-11
Brighthouse Funds Trust II
Neuberger Berman Genesis Portfolio
Notes to Financial Statements—December 31, 2023
1. Organization
Brighthouse Funds Trust II (the “Trust”) is organized as a Delaware statutory trust and registered under the Investment Company Act of 1940, as amended (the “1940 Act”), as an open-end management investment company. The Trust, which is managed by Brighthouse Investment Advisers, LLC (“Brighthouse Investment Advisers” or the “Adviser”), currently offers twenty-nine series (the “Portfolios”), each of which operates as a distinct investment vehicle of the Trust.The series included in this report is Neuberger Berman Genesis Portfolio (the “Portfolio”), which is diversified. Shares of the Portfolio are not offered directly to the general public and are currently available only to separate accounts of insurance companies, including insurance companies affiliated with the Adviser.
The Portfolio has registered and offers three classes of shares: Class A, B and E shares. Shares of each class of the Portfolio represent an equal pro rata interest in the Portfolio and generally give the shareholder the same voting, dividend, liquidation, and other rights. Investment income, realized and unrealized capital gains and losses, the common expenses of the Portfolio, and certain Portfolio-level expense reductions, if any, are allocated on a pro rata basis to each class based on the relative net assets of each class to the net assets of the Portfolio. Each class of shares differs in its respective distribution plan and such distribution expenses are allocated to the corresponding class of shares.
2. Significant Accounting Policies
The preparation of financial statements in conformity with accounting principles generally accepted in the United States of America (“GAAP”) requires management to make estimates and assumptions that affect the reported amounts of assets and liabilities and disclosure of contingent assets and liabilities as of the date of the financial statements and the reported amounts of income and expenses during the reporting period. Actual results could differ from those estimates. In the preparation of these financial statements, management has evaluated events and transactions subsequent to December 31, 2023 through the date the financial statements were issued.
The Portfolio is an investment company and follows the accounting and reporting guidance of the Financial Accounting Standards Board (“FASB”) Accounting Standards Codification Topic 946—Financial Services—Investment Companies. The following is a summary of significant accounting policies consistently followed by the Portfolio in the preparation of its financial statements.
Investment Valuation and Fair Value Measurements - The Portfolio values its investments for purposes of calculating its net asset value (“NAV”) using procedures that allow for a variety of methodologies to be used to value the Portfolio’s investments. The specific methodology used for an investment may vary based on the market data available for a specific investment at the time the Portfolio calculates its NAV or based on other considerations. The procedures also permit a level of judgment to be used in the valuation process.
Domestic and foreign equity securities, such as common stock, exchange-traded funds, rights, warrants, and preferred stock, that are traded on a securities exchange on a valuation date are generally valued at their last quoted sale price or official closing price on the primary exchange for such security, or, if no sales occurred on that day, at the last reported bid price. Equity securities traded over-the-counter (“OTC”) are generally valued at the last reported bid price. In the event of a major exchange closing during the trading day, the Adviser may use other market information obtained from quotation reporting systems, established market makers, or pricing services in valuing the securities. Valuation adjustments may be applied to certain foreign equity securities that are traded solely on foreign exchanges that close before the time as of which the Portfolio determines its NAV to account for the market movement between the close of the foreign exchanges and the time as of which the Portfolio determines its NAV. The Portfolio may use a systematic fair valuation model provided by a pricing service to value securities principally traded in these foreign markets to adjust for possible market movements or other changes that may occur between the close of the foreign exchanges and the time as of which the Portfolio determines its NAV. Foreign equity securities valued using these valuation adjustments are generally categorized as Level 2 within the fair value hierarchy. Equity securities that are actively traded, and have no valuation adjustments applied, are categorized as Level 1 within the fair value hierarchy. Other equity securities traded on inactive markets or valued in reference to similar instruments traded on active markets are generally categorized as Level 2 within the fair value hierarchy.
Investments in registered open-end management investment companies are valued at reported NAV per share on the valuation date and are categorized as Level 1 within the fair value hierarchy.
Debt securities, including corporate, convertible and municipal bonds and notes; obligations of the U.S. Treasury and U.S. government agencies; foreign sovereign issues; and non-U.S. bonds, are generally valued based upon evaluated or composite bid quotations obtained from third-party pricing services and/or brokers and dealers selected by the Adviser (each a “pricing service”). Such pricing services may use matrix pricing, which considers observable inputs including, among other things, issuer details, maturity dates, interest rates, yield curves, rates of prepayment, credit risks/spreads, default rates, reported trades, broker-dealer quotes and quoted prices for similar assets. Short-term obligations with a remaining maturity of sixty days or less may be valued at amortized cost in the absence of market quotes, so long as the amortized cost value of such short-term debt instrument is approximately the same as the fair value of the instrument as determined without the use of amortized cost valuation. Floating rate loans are generally valued based upon
BHFTII-12
Brighthouse Funds Trust II
Neuberger Berman Genesis Portfolio
Notes to Financial Statements—December 31, 2023—(Continued)
an evaluated or composite average of aggregate bid and ask quotations supplied by brokers or dealers, as obtained from the pricing service. Securities that use similar valuation techniques and inputs as described above are generally categorized as Level 2 within the fair value hierarchy.
Options, whether on securities, indices, futures contracts, or otherwise, traded on exchanges are valued at the last sale price available as of the close of business on a valuation day or, if there is no such price available, at the last reported bid price. These types of options are categorized as Level 1 within the fair value hierarchy. Futures contracts that are traded on commodity exchanges are valued at their settlement prices established by the exchanges on which they are traded as of the close of such exchanges and are categorized as Level 1 within the fair value hierarchy.
If no current market quotation is readily available or market value quotations are deemed to be unreliable for an investment, the fair value of the investment will be determined in accordance with procedures. A market quotation is readily available only when that quotation is a quoted price (unadjusted) in active markets for identical investments that the Portfolio can access at the measurement date, provided that a quotation will not be readily available if it is not reliable.
Pursuant to Rule 2a-5 under the 1940 Act, the Board of Trustees (the “Board” or “Trustees”) of the Trust has designated Brighthouse Investment Advisers, acting through its Valuation Committee (“Committee”), as the Portfolio’s “valuation designee” to perform the Portfolio’s fair value determinations. The Board oversees Brighthouse Investment Advisers in its role as the Valuation Designee and receives reports from Brighthouse Investment Advisers regarding its process and the valuation of the Portfolio’s investments to assist with such oversight.
No single standard for determining the fair value of an investment can be set forth because fair value depends upon the facts and circumstances with respect to each investment. Information relating to any relevant factors may be obtained by the Committee from any appropriate source, including the subadviser of the Portfolio, the Custodian, a pricing service, market maker and/or broker for such security or the issuer. Appropriate methodologies for determining fair value under particular circumstances may include: matrix pricing, a discounted cash flow analysis, comparisons of securities with comparable characteristics, value based on multiples of earnings, discount from market price of similar marketable securities, or a combination of these and other methods.
Foreign Currency Translation - The books and records of the Portfolio are maintained in U.S. dollars. The values of securities, currencies, and other assets and liabilities denominated in currencies other than the U.S. dollar are translated into U.S. dollars based upon foreign exchange rates prevailing at the end of the period. Purchases and sales of investment securities, income, and expenses are translated on the respective dates of such transactions. Because the values of investment securities are translated at the foreign exchange rates prevailing at the end of the period, that portion of the results of operations arising from changes in exchange rates and that portion of the results of operations reflecting fluctuations arising from changes in market prices of the investment securities are not separated. Such fluctuations are included in the net realized and unrealized gain or loss on investments.
Net realized foreign exchange gains or losses arise from activity in forward foreign currency exchange contracts, sales of foreign currency, currency gains or losses realized between the trade and settlement dates on securities transactions, and the difference between the amounts of dividends, interest, and foreign withholding taxes recorded by the Portfolio and the U.S. dollar-equivalent of the amounts actually received or paid by the Portfolio. Net unrealized foreign exchange gains and losses arise from changes in the value of assets and liabilities, other than investment securities, resulting from changes in foreign exchange rates.
Investment Transactions and Related Investment Income - Portfolio security transactions are recorded on the trade date. Dividend income is recorded on the ex-dividend date or, for certain foreign securities, when notified. Interest income, which includes amortization of premium and accretion of discount on debt securities, is recorded on the accrual basis. Realized gains and losses on investments are determined on the identified cost basis, which is the same basis used for federal income tax purposes. Foreign income and foreign capital gains on some foreign securities may be subject to foreign taxes, which are accrued as applicable. These foreign taxes have been provided for in accordance with the Portfolio’s understanding of the applicable countries’ tax rules and rates.
Dividends and Distributions to Shareholders - The Portfolio records dividends and distributions on the ex-dividend date. Net realized gains from securities transactions (if any) are generally distributed annually to shareholders. The timing and characterization of certain income and capital gains distributions are determined in accordance with federal tax regulations that may differ from GAAP. Permanent book and tax basis differences relating to shareholder distributions will result in reclassification between distributable earnings (accumulated losses) and paid in surplus. These adjustments have no impact on net assets or the results of operations.
Income Taxes - It is the Portfolio’s policy to comply with the requirements of the Internal Revenue Code of 1986, as amended, and regulations thereunder, applicable to regulated investment companies, and to distribute, with respect to each taxable year, all of its taxable income to shareholders. Therefore, no federal income tax provision is required. The Portfolio files U.S. federal tax returns. No income tax returns are currently under examination. The Portfolio’s federal tax returns remain subject to examination by the Internal Revenue Service for three fiscal years after the returns are filed. As of December 31, 2023, the Portfolio had no uncertain tax positions that would require financial statement recognition, derecognition or disclosure.
BHFTII-13
Brighthouse Funds Trust II
Neuberger Berman Genesis Portfolio
Notes to Financial Statements—December 31, 2023—(Continued)
Repurchase Agreements - The Portfolio may enter into repurchase agreements, under the terms of a Master Repurchase Agreement (“MRA”), or Global Master Repurchase Agreement (“GMRA”), with selected commercial banks and broker-dealers, under which the Portfolio acquires securities as collateral and agrees to resell the securities at an agreed-upon time and at an agreed-upon price. The Portfolio, through the Custodian or a subcustodian, under a tri-party repurchase agreement, receives delivery of the underlying securities collateralizing any repurchase agreements. It is the Portfolio’s policy that the market value of the collateral be equal to at least 100% of the repurchase price in the case of a repurchase agreement of one-day duration and equal to at least 102% of the repurchase price in the case of all other repurchase agreements. In the event of default or failure by a party to perform an obligation in connection with any repurchase transaction, the MRA or GMRA gives the non-defaulting party the right to set-off claims and to apply property held by it in connection with any repurchase transaction against obligations owed to it under the agreement.
At December 31, 2023, the Portfolio had direct investments in repurchase agreements with a gross value of $14,079,142, which is included as part of investments at value on the Statement of Assets and Liabilities. The value of the related collateral exceeded the value of the repurchase agreements at December 31, 2023.
Directed Brokerage Agreement - The Trust has entered into a directed brokerage arrangement with Capital Institutional Services, Inc. (“CAPIS”). Under this arrangement, the Portfolio directs certain trades to CAPIS in return for a recapture credit. CAPIS issues a cash rebate to the Portfolio. Amounts paid to the Portfolio are shown separately as broker commission recapture on the Statement of Operations of the Portfolio. Additionally, these amounts have been excluded from the calculation of the net ratio of expenses to average net assets presented in the Financial Highlights for each share class.
3. Certain Risks
In the normal course of business, the Portfolio invests in securities and enters into transactions where risks exist. Those risks include:
Market Risk: The value of securities held by the Portfolio may decline in response to certain events, including those directly involving the issuers whose securities are owned by the Portfolio; conditions affecting the general economy; overall market changes; local, regional or global political, social or economic instability; currency, interest rate, and price fluctuations, or other factors including terrorism, war, natural disasters and the spread of infectious illness including epidemics or pandemics such as the COVID-19 pandemic. These events may also adversely affect the liquidity of securities held by the Portfolio.
Credit and Counterparty Risk: The Portfolio may be exposed to counterparty risk, or the risk that an entity with which the Portfolio has unsettled or open transactions may default. The potential loss could exceed the value of the financial assets and liabilities recorded in the financial statements. Financial assets that potentially expose the Portfolio to credit and counterparty risk consist principally of cash due from counterparties and investments. The Portfolio manages counterparty risk by entering into agreements only with counterparties that it believes have the financial resources to honor their obligations and by monitoring the financial stability of those counterparties. The Subadviser may attempt to mitigate counterparty risk by (i) periodically assessing the creditworthiness of its trading partners, (ii) monitoring and/or limiting the amount of its net exposure to each individual counterparty based on its assessment, and (iii) requiring collateral from the counterparty for certain transactions. In order to preserve certain safeguards for non-standard settlement trades, the Portfolio restricts its exposure to credit and counterparty losses by entering into master netting agreements (“Master Agreements”) with counterparties (approved brokers) with whom it undertakes a significant volume of transactions. Master Agreements govern the terms of certain transactions and reduce the counterparty risk associated with relevant transactions by specifying credit protection mechanisms and providing standardization that improves legal certainty. Master Agreements can also help limit counterparty risk by specifying collateral posting arrangements at pre-arranged exposure levels.
Repurchase and reverse repurchase agreements are primarily executed under GMRAs or MRAs, which provide the right to set-off. Each repurchase and reverse repurchase agreement is initially collateralized at the transaction level. In the event of default, the total market value exposure will be offset against collateral exchanged to date, which would result in a net receivable/(payable) that would be due from/to the counterparty.
Additional risks associated with each type of investment are described above within the respective security type notes. The Portfolio’s prospectus includes a discussion of the principal risks of investing in the Portfolio.
4. Investment Transactions
Aggregate cost of purchases and proceeds of sales of investment securities, excluding short-term securities, for the year ended December 31, 2023 were as follows:
| Purchases |
Sales | |||||||||||
| U.S. Government |
Non-U.S. Government | U.S. Government | Non-U.S. Government | |||||||||
| $0 | $ | 146,383,161 | $ | 0 | $ | 235,236,204 | ||||||
BHFTII-14
Brighthouse Funds Trust II
Neuberger Berman Genesis Portfolio
Notes to Financial Statements—December 31, 2023—(Continued)
5. Investment Management Fees and Other Transactions with Affiliates
Investment Management Agreement - Brighthouse Investment Advisers is the investment adviser to the Portfolio. The Trust has entered into an investment management agreement with Brighthouse Investment Advisers with respect to the Portfolio. For providing investment management services to the Portfolio, Brighthouse Investment Advisers receives monthly compensation at the following annual rates:
| Management |
% per annum | Average Daily Net Assets | ||||
| $7,521,467 | 0.850 | % | Of the first $500 million | |||
| 0.800 | % | Of the next $500 million | ||||
| 0.750 | % | On amounts in excess of $1 billion | ||||
Brighthouse Investment Advisers has entered into an investment subadvisory agreement with respect to managing the Portfolio. Neuberger Berman Investment Advisers LLC is compensated by Brighthouse Investment Advisers to provide subadvisory services for the Portfolio.
Management Fee Waiver - Pursuant to a management fee waiver agreement, the Adviser has agreed, for the period May 1, 2023 to April 30, 2024, to reduce its advisory fees set out above under “Investment Management Agreement” for each class of the Portfolio as follows:
| % per annum reduction |
Average Daily Net Assets | |
| 0.075% | First $500 million | |
| 0.050% | Over $500 million |
An identical agreement was in place for the period April 29, 2022 to April 30, 2023. Amounts waived for the year ended December 31, 2023 are shown as management fee waivers in the Statement of Operations.
Certain officers and trustees of the Trust may also be officers of the Adviser; however, such officers and trustees receive no compensation from the Trust.
Transfer Agency Agreement - Brighthouse Life Insurance Company serves as the transfer agent for the Trust. Brighthouse Life Insurance Company receives no fees for its services to the Trust.
Distribution and Service Fees - The Trust has a distribution agreement with Brighthouse Securities, LLC (the “Distributor”) pursuant to which the Distributor serves as the general distributor of shares of each class (each a “Class”) of each Portfolio. The Distributor is an affiliate of the Trust. The Trust has adopted a Distribution and Services Plan (the “D&S Plan”) relating to Class B, Class D, Class E, Class F and Class G shares of each Portfolio, under Rule 12b-1 under the 1940 Act, pursuant to which the Trust may pay the Distributor a fee (the “Service Fee”) at an annual rate not to exceed 0.25% of each such Portfolio’s average daily net assets attributable to the Class B, Class D, Class E, Class F and Class G shares of the Trust. Each Portfolio may not offer shares of each Class. The D&S Plan also authorizes the Trust, on behalf of each of its Portfolios, to pay to the Distributor a distribution fee (the “Distribution Fee” and together with the Service Fee, the “Fees”) at an annual rate of up to 0.25% of each Portfolio’s average daily net assets attributable to the Class B, Class D, Class E, Class F, and Class G shares in consideration of the services rendered in connection with the sale of such shares by the Distributor. Under the Distribution Agreement with respect to the Trust, Fees are currently paid at an annual rate of 0.25% of average daily net assets in the case of Class B shares, 0.10% of average daily net assets in the case of Class D shares, 0.15% of average daily net assets in the case of Class E shares, 0.20% of average daily net assets in the case of Class F shares and 0.30% of average daily net assets in the case of Class G shares. The D&S Plan is known as a “compensation plan” because the Trust makes payments to the Distributor for services rendered regardless of the actual level of expenditures by the Distributor. Amounts incurred by the Portfolio for the year ended December 31, 2023 are shown as Distribution and service fees in the Statement of Operations.
Deferred Trustee Compensation - Each Trustee who is not currently an employee of the Adviser or any of its affiliates receives compensation from the Trust for his or her service to the Trust. A deferred compensation plan (the “Plan”) is available to the Trustees on a voluntary basis. Deferred amounts remain in the Trust until distributed in accordance with the provisions of the Plan. The value of a participating Trustee’s deferral account is based on theoretical investments of deferred amounts on the normal payment dates in certain portfolios of the Trust or Brighthouse Funds Trust I, an affiliate of the Trust, as designated by the participating Trustee. Changes in the value of participants’ deferral accounts are reflected as a component of Trustees’ fees and expenses in the Statement of Operations. The portion of the accrued obligations allocated to the Portfolio under the Plan is reflected as Deferred trustees’ fees in the Statement of Assets and Liabilities.
BHFTII-15
Brighthouse Funds Trust II
Neuberger Berman Genesis Portfolio
Notes to Financial Statements—December 31, 2023—(Continued)
6. Contractual Obligations
Under the Trust’s organizational documents, its officers and Trustees may be indemnified against certain liabilities and expenses arising out of the performance of their duties to the Trust. Additionally, the Trust has a variety of indemnification obligations under contracts with its service providers. The Trust’s maximum exposure under these arrangements is unknown, as this would involve future claims that may be made against the Trust that have not yet occurred.
7. Income Tax Information
The cost basis of investments for federal income tax purposes at December 31, 2023 was as follows:
| Cost basis of investments |
$ | 581,008,247 | ||
|
|
|
|||
| Gross unrealized appreciation |
379,159,964 | |||
| Gross unrealized (depreciation) |
(26,522,262 | ) | ||
|
|
|
|||
| Net unrealized appreciation (depreciation) |
$ | 352,637,702 | ||
|
|
|
The tax character of distributions paid for the years ended December 31, 2023 and 2022 were as follows:
| Ordinary Income |
Long-Term Capital Gain | Total | ||||||||||||||||||
| 2023 |
2022 | 2023 | 2022 | 2023 | 2022 | |||||||||||||||
| $746,186 | $ | — | $ | 80,701,632 | $ | 169,945,973 | $ | 81,447,818 | $ | 169,945,973 | ||||||||||
As of December 31, 2023, the components of distributable earnings (accumulated losses) on a federal income tax basis were as follows:
| Undistributed |
Undistributed Long-Term Capital Gain |
Net Unrealized Appreciation (Depreciation) |
Accumulated Capital Losses |
Total | ||||||||||||
| $800,176 | $ | 88,156,438 | $ | 352,637,702 | $ | — | $ | 441,594,316 | ||||||||
The Portfolio utilizes the provisions of the federal income tax laws that provide for the carryforward of capital losses for prior years, offsetting such losses against any future realized capital gains. Net capital losses may be carried forward indefinitely and their character is retained as short-term and/or long-term losses.
As of December 31, 2023, the Portfolio had no accumulated capital losses.
8. Recent Accounting Pronouncement & Regulatory Updates
In June 2022, FASB issued Accounting Standards Update 2022-03—Fair Value Measurement (Topic 820)—Fair Value Measurement of Equity Securities Subject to Contractual Sale Restrictions (“ASU 2022-03”). ASU 2022-03 clarifies the guidance in Topic 820 to indicate that a contractual sale restriction should not be considered in the fair value of an equity security subject to such a restriction, and requires entities with investments in equity securities subject to contractual sale restrictions to disclose certain qualitative and quantitative information about such securities. ASU 2022-03 is effective for fiscal years, and interim periods within those fiscal years, beginning after December 15, 2023. ASU 2022-03 is only applicable to an equity security in which the contractual arrangement that restricts its sale is executed or modified on or after the adoption date.
Effective January 24, 2023, the Securities and Exchange Commission adopted rule and form amendments that require open-end management investment companies to transmit concise and visually engaging annual and semiannual reports to shareholders that highlight certain information deemed by the SEC to be particularly important for investors. Certain other information, including financial statements, will no longer appear in shareholder reports but will, as required, be available online, delivered free of charge upon request, and filed on a semiannual basis on Form N-CSR. The rule and form amendments have a compliance date of July 24, 2024. Accordingly, the rule and form amendments will not impact the Portfolio until its 2024 semiannual shareholder report.
BHFTII-16
Brighthouse Funds Trust II
Neuberger Berman Genesis Portfolio
Report of Independent Registered Public Accounting Firm
To the Board of Trustees of Brighthouse Funds Trust II and Shareholders of the Neuberger Berman Genesis Portfolio:
Opinion on the Financial Statements and Financial Highlights
We have audited the accompanying statement of assets and liabilities, including the schedule of investments, of the Neuberger Berman Genesis Portfolio (the “Fund”) (one of the funds constituting the Brighthouse Funds Trust II), as of December 31, 2023, the related statement of operations for the year then ended, the statements of changes in net assets for each of the two years in the period then ended, the financial highlights for each of the five years in the period then ended, and the related notes. In our opinion, the financial statements and financial highlights present fairly, in all material respects, the financial position of the Fund as of December 31, 2023, and the results of its operations for the year then ended, the changes in its net assets for each of the two years in the period then ended, and the financial highlights for each of the five years in the period then ended in conformity with accounting principles generally accepted in the United States of America.
Basis for Opinion
These financial statements and financial highlights are the responsibility of the Fund’s management. Our responsibility is to express an opinion on the Fund’s financial statements and financial highlights based on our audits. We are a public accounting firm registered with the Public Company Accounting Oversight Board (United States) (PCAOB) and are required to be independent with respect to the Fund in accordance with the U.S. federal securities laws and the applicable rules and regulations of the Securities and Exchange Commission and the PCAOB.
We conducted our audits in accordance with the standards of the PCAOB. Those standards require that we plan and perform the audit to obtain reasonable assurance about whether the financial statements and financial highlights are free of material misstatement, whether due to error or fraud. The Fund is not required to have, nor were we engaged to perform, an audit of its internal control over financial reporting. As part of our audits we are required to obtain an understanding of internal control over financial reporting but not for the purpose of expressing an opinion on the effectiveness of the Fund’s internal control over financial reporting. Accordingly, we express no such opinion.
Our audits included performing procedures to assess the risks of material misstatement of the financial statements and financial highlights, whether due to error or fraud, and performing procedures that respond to those risks. Such procedures included examining, on a test basis, evidence regarding the amounts and disclosures in the financial statements and financial highlights. Our audits also included evaluating the accounting principles used and significant estimates made by management, as well as evaluating the overall presentation of the financial statements and financial highlights. Our procedures included confirmation of securities owned as of December 31, 2023, by correspondence with the custodian and brokers; when replies were not received from brokers, we performed other auditing procedures. We believe that our audits provide a reasonable basis for our opinion.
/s/ Deloitte & Touche LLP
Boston, Massachusetts
February 23, 2024
We have served as the auditor of one or more Brighthouse investment companies since 1983.
BHFTII-17
Brighthouse Funds Trust II
Trustees and Officers
MANAGEMENT OF THE TRUSTS
The Boards of Trustees (the “Board”) of Brighthouse Funds Trust I and Brighthouse Funds Trust II (“Trust I” and “Trust II”, respectively, and collectively the “Trusts”) supervise the Trusts and are responsible for representing the interests of shareholders. The Trustees, the Chairman of the Board and the Chairmen of each subcommittee are the same for both Trusts. The Trustees of each Trust meet periodically throughout the year to oversee the Portfolios’ activities, reviewing, among other things, each Portfolio’s performance and its contractual arrangements with various service providers. The Trustees of each Trust elect the officers of the Trust, who are responsible for administering the Trust’s day-to-day operations.
Trustees and Officers
The Trustees and executive officers of the Trusts, as well as their ages and their principal occupations during the past five years, are set forth below. Unless otherwise indicated, the business address of each is c/o Brighthouse Funds Trust I and Brighthouse Funds Trust II, 11225 N. Community House Rd., Charolette, North Carolina 28277. Each Trustee who is deemed an “interested person,” as such term is defined in the 1940 Act, is referred to as an “Interested Trustee.” Those Trustees who are not “interested persons,” as such term is defined in the 1940 Act, are referred to as “Independent Trustees.” There is no limit to the term a Trustee may serve, other than pursuant to the retirement policy adopted by the Independent Trustees. Trustees serve until their death, resignation, retirement or removal in accordance with Trust I’s and Trust II’s respective organizational documents and policies adopted by the Board of the Trust from time to time. Officers hold office at the pleasure of each Board and serve until their removal or resignation in accordance with the Trusts’ respective organizational documents and policies adopted by the Board of each Trust from time to time.
Trustees of the Trusts
| Name and Year of Birth |
Position(s) |
Term of Office |
Principal Occupation(s) During the Past |
Number of |
Other Directorships Held | |||||
| Interested Trustee | ||||||||||
| John Rosenthal* (1960) |
Trustee | Indefinite; From May 2016 (Trust I and Trust II) to present | Chief Investment Officer, Brighthouse Financial, Inc. (2016 to present). | 73 | None | |||||
| Independent Trustees | ||||||||||
| Dawn M. Vroegop (1966) |
Trustee and Chair of the Board | Indefinite; From December 2000 (Trust I)/May 2009 (Trust II) to present as Trustee; From May 2016 (Trust I and Trust II) until present as Chair | Retired; Private Investor. | 73 | Trustee, Driehaus Mutual Funds (8 portfolios).** | |||||
| Stephen M. Alderman (1959) |
Trustee | Indefinite; From December 2000 (Trust I)/April 2012 (Trust II) to present | Vice President and General Counsel, IHR Aerial Solutions, LLC; Until 2022, General Counsel, Illini Hi-Reach, Inc.; Until 2020, Shareholder in the law firm of Garfield & Merel, Ltd. | 73 | None | |||||
| Robert J. Boulware (1956) |
Trustee | Indefinite; From March 2008 (Trust I)/April 2012 (Trust II) to present | Managing Member, Pilgrim Funds, LLC (private equity fund). | 73 | Trustee, Vertical Capital Income Fund (closed-end fund);** Trustee, The Private Shares Fund (closed- end fund);** Until 2021, Director, Mid- Con Energy Partners, LP (energy);** Until 2020, Director, Gainsco, Inc. (auto insurance).** | |||||
BHFTII-18
Brighthouse Funds Trust II
Trustees and Officers—(Continued)
| Name and Year of Birth |
Position(s) |
Term of Office |
Principal Occupation(s) During the Past |
Number of |
Other Directorships Held | |||||
| Susan C. Gause (1952) |
Trustee | Indefinite; From March 2008 (Trust I)/April 2012 (Trust II) to present | Private Investor. | 73 | Trustee, HSBC Funds (4 portfolios).** | |||||
| Nancy Hawthorne (1951) |
Trustee | Indefinite; From May 2003 (Trust II)/April 2012 (Trust I) to present | Private Investor. | 73 | Trustee, First Eagle Credit Opportunities Fund;** Trustee and Chair of the Board of Trustees, First Eagle Global Opportunities Fund;** Director, Avid Technology, Inc;** Director, CRA International, Inc.** | |||||
Executive Officers of the Trusts
| Name and Year of Birth |
Position(s) Held |
Term of Office |
Principal Occupation(s) | |||
| Kristi Slavin (1973) | President and Chief Executive Officer, of Trust I and Trust II | From May 2016 (Trust I and Trust II) to present |
President, Brighthouse Investment Advisers, LLC (2016-present). | |||
| Alan R. Otis (1971) | Chief Financial Officer and Treasurer, of Trust I and Trust II | From November 2017 (Trust I and Trust II) to present |
Executive Vice President, Brighthouse Investment Advisers, LLC (2017-present); formerly, Vice President, Brighthouse Investment Advisers, LLC (2012-2017); Assistant Treasurer, Trust I and Trust II (2012-2017). | |||
| Thomas Watterson (1985) | Secretary, of Trust I and Trust II | From November 2023 (Trust I and Trust II) to present |
Executive Vice President, Chief Legal Officer and Secretary, Brighthouse Investment Advisers, LLC (2023-Present); Managing Corporate Counsel, Brighthouse Financial Inc. (2023-present); Managing Counsel and Director, The Bank of New York Mellon Corporation (2019-2023); Counsel and Vice President, The Bank of New York Mellon Corporation (2016-2019). | |||
| Katie Hellmann (1980) | Chief Compliance Officer (“CCO”), of Trust I and Trust II | From May 2023 (Trust I and Trust II) to present |
Chief Compliance Officer, Brighthouse Investment Advisers, LLC (2023-present) and Head of Funds and Investments Compliance (2023-present). Deputy Chief Compliance Officer, Transamerica Asset Management (2022-2023). Leader and Senior Compliance Counsel-Funds Compliance, Edward Jones (2017-2022). | |||
| Rosemary Morgan (1983) | Anti-Money Laundering Officer, of Trust I and Trust II | From May 2023 (Trust I and Trust II) to present |
Chief Privacy Officer, Leader of Compliance Programs and Assistant General Counsel, Brighthouse Financial, Inc. (2019-2022); Chief Privacy Officer, Head of Compliance Programs & Contracts Law, Brighthouse Financial, Inc. (2022-2023), Chief Compliance Officer and Associate General Counsel, Brighthouse Financial, Inc. (2023-present); Vice President and Chief Compliance Officer, Brighthouse Life Insurance Company (2023-present); Vice President and Chief Compliance Officer (2023-present), Brighthouse Life Insurance Company of NY; Vice President and Chief Compliance Officer (2023-present), New England Life Insurance Company. | |||
| Anna Koska (1981) | Vice President, of Trust I and Trust II | From June 2022 (Trust I and Trust II) to present |
Vice President, Investment and Advisory Services, Brighthouse Investment Advisers, LLC (2022-present); Director of Investment and Advisory Services, Brighthouse Investment Advisers, LLC (2019-2022); Senior Portfolio Analyst, Brighthouse Investment Advisers, LLC (2017-2019). | |||
| * | Mr. Rosenthal is an “interested person” of the Trusts because of his position with Brighthouse Financial, Inc. (“Brighthouse Financial”), an affiliate of BIA. |
| ** | Indicates a directorship with a registered investment company or a company subject to the reporting requirements of the Securities Exchange Act of 1934, as amended. |
| (1) | Previous positions during the past five years with the Trusts, MetLife, Inc. or the Adviser are omitted if not materially different. |
| (2) | The Fund Complex includes 44 Trust I Portfolios and 29 Trust II Portfolios. |
BHFTII-19
Brighthouse Funds Trust II
Neuberger Berman Genesis Portfolio
Board of Trustees’ Consideration of Advisory and Sub-Advisory Agreements
At a meeting held on November 13-14, 2023 (the “November Meeting”), the Boards of Trustees (the “Board”) of Brighthouse Funds Trust I and Brighthouse Funds Trust II (“BFT I” and “BFT II,” respectively, and collectively, the “Trusts”), including a majority of the Trustees who are not “interested persons” of the Trusts (the “Independent Trustees”) under the Investment Company Act of 1940 (the “1940 Act”), approved the continuation of the Trusts’ advisory agreements (each an “Advisory Agreement”) with Brighthouse Investment Advisers, LLC (the “Adviser”) and the applicable sub-advisory and sub-sub-advisory agreements (each a “Sub-Advisory Agreement” and collectively with the Advisory Agreement, the “Agreements”) between the Adviser and the investment sub-advisers and sub-sub-adviser (each a “Sub-Adviser,” and collectively, the “Sub-Advisers”) for the series of the Trusts (each a “Portfolio,” and collectively, the “Portfolios”) for the annual contract renewal period from January 1, 2024 through December 31, 2024.
The Board met with personnel of the Adviser on September 28-29, 2023 (the “September Meeting”) for the specific purpose of giving preliminary consideration to the proposed continuation of the Agreements, including consideration to information that the Adviser and Sub-Advisers had provided for the Board’s review at the request of the Independent Trustees. At the September Meeting, the Adviser reviewed with the Board the performance and fees experienced by each Portfolio, as well as other information. During and after the September Meeting, the Independent Trustees requested additional information and clarifications that the Adviser addressed at the November Meeting (the September Meeting and the November Meeting are referred to collectively as, the “Meetings”). During the contract renewal process, and throughout the year, the Independent Trustees were advised by independent legal counsel, and they met with independent legal counsel in executive sessions outside of the presence of management on a number of occasions to discuss, among other things, the renewal of the Agreements.
In considering the continuation of the Agreements, the Board reviewed a variety of materials that were provided for the specific purpose of assisting the Board in the renewal process, along with various information and materials that were provided to and discussed with the Board throughout the year, at regularly scheduled meetings of the Board and its committees. In particular, information for each Portfolio included, but was not limited to, reports on investment performance, expenses, legal and compliance matters, and asset pricing. Information about the Adviser and each Sub-Adviser included, but was not limited to, reports on the business, operations, and performance of the Adviser and the Sub-Advisers and reports that the Adviser and Sub-Advisers had prepared specifically for the renewal process.
In considering the continuation of the Agreements, the Board also reviewed, among other things, a report for each Portfolio that was prepared by Broadridge (“Broadridge”), an independent organization, which set forth comparative performance and expense information for each Portfolio. In addition, the Independent Trustees reviewed a report that was prepared by JDL Consultants, LLC (“JDL”), an independent consultant to the Independent Trustees, which examined the Broadridge reports for each Portfolio (“JDL Report”). The Independent Trustees met in executive session with representatives of JDL during the September Meeting to review the JDL Report.
At the November Meeting, the Board, including a majority of the Independent Trustees, concluded that the nature, extent, and quality of services provided by the Adviser and each Sub-Adviser supported the renewal of the Agreements. The Board also concluded that the investment services provided to and the performance of each Portfolio was such that each Agreement should continue, and that the fees paid by each Portfolio to the Adviser appeared to be reasonable in light of the nature, extent, and quality of the services provided by the Adviser and each Sub-Adviser. Further, the Board concluded that the Adviser’s profitability in providing services under the Advisory Agreements did not appear unreasonable in light of the nature, extent, and quality of the services provided by the Adviser. The Board reviewed the extent to which the investment advisory fees paid by the Portfolios shared economies of scale with investors or entailed the potential to share economies of scale with investors and concluded that those considerations generally supported the renewal of each Agreement. Finally, the Board considered the Adviser’s recommendation that it approve the renewal of each Sub-Advisory Agreement.
In approving the continuation of each Agreement, the Board, including the Independent Trustees, gave attention to all of the information that was furnished, and each Trustee placed varying degrees of importance on the various pieces of information that were provided to them. The Board evaluated the information provided to it on a Portfolio-by-Portfolio basis, and its decision was made separately with respect to each Portfolio. The following paragraphs provide more information about some of the primary factors that were relevant to the Board’s decisions. The Board did not identify any single factor as determinative, and the Trustees generally attributed different weights to various factors for the various Portfolios.
Nature, extent and quality of services. The Board evaluated the nature, extent, and quality of the services that the Adviser and the Sub-Advisers, as relevant, provided to the Portfolios. The Board considered the Adviser’s services as investment manager to the Portfolios, including its services relating to the hiring and oversight of the Sub-Advisers and, in particular, their investment programs and personnel, succession management of key personnel, trading practices, compliance programs and personnel, and risk management
BHFTII-20
Brighthouse Funds Trust II
Neuberger Berman Genesis Portfolio
Board of Trustees’ Consideration of Advisory and Sub-Advisory Agreements—(Continued)
programs, among other things. The Adviser’s services in coordinating and overseeing the activities of the Trusts’ other service providers were also considered. The Board also considered the systems and processes required by the Adviser to meet additional regulatory and compliance requirements resulting from U.S. Securities and Exchange Commission and other regulatory initiatives, including related to liquidity, valuation, and derivatives risk management. The Board considered information received from the Trusts’ Chief Compliance Officer regarding the Portfolios’ compliance policies and procedures that were established pursuant to Rule 38a-l under the 1940 Act, and relevant aspects of the Adviser’s and Sub-Advisers’ compliance policies and procedures. The Board also noted that it was the practice of the Adviser’s investment, compliance, and legal staff to conduct periodic meetings (through various media) with the Sub-Advisers throughout the year in order to review and assess the services that are provided to the Portfolios, and that personnel of the Adviser routinely prepare and present reports to the Board regarding those meetings. In addition, during the Meetings and throughout the year, the Board considered the expertise, experience, and performance of the personnel of the Adviser who performed the various services that are mentioned above.
With respect to the services provided by each of the Sub-Advisers, the Board considered a variety of information that the Adviser and each Sub-Adviser prepared for the Board’s review. The Board considered each Sub-Adviser’s investment process, each Sub-Adviser’s overall organization and business plans and the investment performance experienced by the Portfolio (as described in more detail below). The Board took into account that each Sub-Adviser’s responsibilities include, among other things, the development and maintenance of an investment program for the applicable Portfolio, the selection of investments and the placement of orders for the purchase and sale of such assets, and the implementation of compliance controls related to the performance of these services. The Board considered, based on the information provided, each Sub-Adviser’s staffing with respect to the management of the Portfolio and other information relating to the Sub-Adviser’s business and operations. The Board also considered the Sub-Adviser’s overall resources and information with respect to any recent turnover of key personnel at the Sub-Adviser. The Board reviewed each Sub-Adviser’s investment experience, as well as information provided regarding the Sub-Adviser’s personnel who provide services to the Portfolios. The Board also considered, among other things, information about each Sub-Adviser’s compliance program, including regarding any compliance matters involving a Sub-Adviser that had been brought to the Board’s attention during the year, as well as the Adviser’s assessment of the financial condition of each Sub-Adviser.
Performance. The Board placed emphasis on the performance of each Portfolio in the context of the performance of the relevant markets in which the Portfolio invests. The Board considered the Adviser’s quarterly presentations to the Board of detailed information about each Portfolio’s investment strategies and performance results and composition, including discussions regarding the relevant effects of market conditions. The Board reviewed and considered the reports prepared by Broadridge, which provided a statistical analysis comparing each Portfolio’s investment performance to that of comparable funds underlying variable insurance products (the “Performance Universe”), and the JDL Report. The Board also compared the performance of each Portfolio to that of comparable funds and other accounts that were managed by the relevant Sub-Adviser, to the extent such information was provided. The Board considered each Portfolio’s performance for periods subsequent to the performance period covered by the Broadridge reports and considered the Adviser’s assessment of the same. The Board also noted that while it found the data provided by Broadridge generally useful, it recognized the limitations of such data, including, in particular, that notable differences may exist between a Portfolio and the other funds in a Broadridge category (for example, with respect to investment strategies) and that the results of the performance comparisons may vary depending on (i) the end dates for the performance periods that were selected and (ii) the selection of the peer groups.
The Board focused particular attention on Portfolios with less favorable performance records. The Board noted the Adviser’s focus on each Sub-Adviser’s performance and that the Adviser had been active in monitoring and responding to any performance issues with respect to the Portfolios.
Fees and Expenses. The Board gave consideration to the level and method of computing the fees payable under the Agreements. The Board reviewed and considered the information in the JDL Report concerning fees and expenses. The Board also reviewed and considered the Broadridge report for each Portfolio, which included various comparisons of the Portfolio’s fees (at December 31, 2022 and various asset levels) and expenses with those of its peers, including, as applicable, a broad group of peer funds (“Expense Universe”), a narrower group of peer funds (“Expense Group”), a broad group of peer sub-advised funds (“Sub-advised Expense Universe”), and a narrower group of peer sub-advised funds (“Sub-advised Expense Group”). In particular, the Board reviewed comparisons of each Portfolio’s contractual management fees with its Expense Group and Sub-advised Expense Universe, contractual sub-adviser fees with its Sub-advised Expense Universe and Sub-advised Expense Group, and total expenses with its Expense Universe, Expense Group and Sub-advised Expense Universe. The Board considered that Broadridge selected the peer funds, which were funds underlying variable insurance products that Broadridge deemed to be comparable to the Portfolios. The Board considered that the fee and expense information in the Broadridge report for each Portfolio reflected information as of the Portfolio’s most recent fiscal year
BHFTII-21
Brighthouse Funds Trust II
Neuberger Berman Genesis Portfolio
Board of Trustees’ Consideration of Advisory and Sub-Advisory Agreements—(Continued)
end at the time the Broadridge report was issued and that historical asset levels may differ from current asset levels, particularly in a period of market volatility. In addition, the Board compared the fee payable to a Sub-Adviser by the Adviser with respect to the Portfolio to the fee payable to the Sub-Adviser by other comparable funds and other accounts, to the extent such information was provided.
The Board noted that the sub-advisory fees for the Portfolios are negotiated at arm’s length by the Adviser and are paid by the Adviser out of its advisory fees. The Board also considered that the Adviser had entered into expense limitation or management fee waiver agreements with certain of the Portfolios pursuant to which the Adviser had agreed to waive a portion of its advisory fee and/or reimburse certain expenses as a means of limiting a Portfolio’s total annual operating expenses or passing through the benefit of a subadvisory fee concession to a Portfolio, as applicable.
Profitability. The Board examined the profitability to the Adviser of each Advisory Agreement, on a Portfolio-by-Portfolio basis. The Board also considered that an affiliate of the Adviser, Brighthouse Securities, LLC, serves as distributor for the Trusts, and, as such, receives Rule 12b-1 payments to support the distribution of the Portfolios. The Board considered the profitability to the Sub-Advisers and their affiliates of their relationships with the Portfolios, to the extent provided, and the Board considered the ability of the Adviser to negotiate with a Sub-Adviser at arm’s length. In reviewing the profitability information, the Board recognized that expense allocation methodologies are inherently subjective and various methodologies may be reasonable while producing different results.
Economies of scale. The Board considered each Portfolio’s fees in light of its size. The Board noted the fee schedules for the Portfolios that contain breakpoints that reduce the fee rate above specified asset levels, including breakpoints in the Advisory Agreements and any corresponding Sub-Advisory Agreement. The Board noted those Portfolios that did not have breakpoints in their advisory fees and considered management’s explanation of the same.
The Board considered the effective fees under the Advisory Agreement and Sub-Advisory Agreement for each Portfolio as a percentage of assets at different asset levels and possible economies of scale that may be realized if the assets of the Portfolio grow. The Board examined, among other data, the effect of a Portfolio’s growth in size, and reduction in size, on various fee schedules. The Board also generally noted that if a Portfolio’s assets increase over time, the Portfolio may realize economies of scale if assets increase proportionally more than certain other expenses.
Other factors. The Board considered other benefits that may be realized by the Adviser and its affiliates from their relationships with the Trusts. Among the benefits realized by the Adviser, the Board recognized that Brighthouse Securities, LLC, as the distributor for the Trusts, receives payments pursuant to Rule 12b-1 from the Portfolios to help compensate for the provision of shareholder services and distribution activities. The Board considered that a Sub-Adviser may engage in soft dollar transactions in managing a Portfolio. In addition, the Board considered that a Sub-Adviser may be affiliated with registered broker-dealers that may, from time to time, receive brokerage commissions from a Portfolio in connection with the sale of portfolio securities (subject to applicable best execution obligations). The Board also considered that a Sub-Adviser and its affiliates could benefit from the opportunity to provide advisory services to additional portfolios of the Trusts and overall reputational benefits.
The Board considered information from the Adviser and Sub-Advisers pertaining to potential conflicts of interest, and the manner in which any potential conflicts were mitigated. In its review, the Board considered information regarding various business relationships among the Adviser and its affiliates and various Sub-Advisers and their affiliates. The Board also considered information about services and/or payments provided to the Adviser by the Sub-Advisers in connection with marketing activities. The Board considered representations from the Adviser that such business relationships and any payments were not considered in the Adviser’s recommendation to renew any of the Sub-Advisory Agreements.
* * * * *
Neuberger Berman Genesis Portfolio. The Board also considered the following information in relation to the Agreements with the Adviser and Neuberger Berman Investment Advisers LLC regarding the Portfolio:
Among other data relating specifically to the Portfolio’s performance, the Board considered that the Portfolio outperformed the median of one of its Performance Universes and the average of its Morningstar Category for the one-, three-, and five-year periods ended June 30, 2023. The Board also considered that the Portfolio outperformed the median of its other Performance Universe and the average of a different, but still comparable, Morningstar Category for the one-and five-year periods ended June 30, 2023 and underperformed the median of that Performance Universe and average of that Morningstar Category for the three-year period ended June 30, 2023. The Board further considered that the Portfolio outperformed its benchmark, the Russell 2000 Value Index, for the one-
BHFTII-22
Brighthouse Funds Trust II
Neuberger Berman Genesis Portfolio
Board of Trustees’ Consideration of Advisory and Sub-Advisory Agreements—(Continued)
and five-year periods ended October 31, 2023 and underperformed its benchmark for the three-year period ended October 31, 2023. The Board also noted the presence of certain management fee waivers in effect for the Portfolio.
The Board also considered that the Portfolio’s actual management fees were above the Expense Group median, the Expense Universe median, and the Sub-advised Expense Universe median. The Board also considered that the Portfolio’s total expenses (exclusive of 12b-1 fees) were below the Expense Group median, Expense Universe median, and the Sub-advised Expense Universe median. The Board noted that the Portfolio’s contractual management fees were above the asset-weighted average of the Investment Classification/Morningstar Category selected by Broadridge at the Portfolio’s current size. The Board also noted that the Portfolio’s contractual sub-advisory fees were above the averages of the Sub-advised Expense Group, and the Sub-advised Expense Universe at the Portfolio’s current size.
BHFTII-23
Brighthouse Funds Trust II
T. Rowe Price Large Cap Growth Portfolio
Managed by T. Rowe Price Associates, Inc.
Portfolio Manager Commentary*
PERFORMANCE
For the twelve months ended December 31, 2023, the Class A, B and E shares of the T. Rowe Price Large Cap Growth Portfolio returned 46.81%, 46.53%, and 46.66%, respectively. The Portfolio’s benchmark, the Russell 1000 Growth Index¹, returned 42.68%.
MARKET ENVIRONMENT / CONDITIONS
U.S. equities produced strong gains in 2023, driven by generally favorable corporate earnings, a resilient economy, and increased investor interest in artificial intelligence. The market overcame bearish factors such as regional bank turmoil in March, uncertainty around Congress and President Biden agreeing to raise the debt ceiling, geopolitical concerns stemming from the ongoing Russian invasion of Ukraine and from Israel’s response to deadly Hamas attacks in early October, and a sluggish Chinese economic recovery. Arguably the most significant factor affecting the U.S. economy throughout the year was rising interest rates in response to elevated inflation. The U.S. Federal Reserve (the “Fed”) raised short-term interest rates four times through the end of July, lifting the federal funds target rate to the 5.25% to 5.50% range. Equities rallied through year-end as the Federal Open Market Committee at their mid-December policy meeting projected three quarter-point interest rate cuts in 2024.
Domestic Investment Grade bonds produced positive returns in 2023, as a strong year-end rally offset earlier losses stemming from rising interest rates. Short-term U.S. Treasury yields rose as the Fed lifted the fed funds target rate through July, before keeping the target range steady through year-end. Intermediate- and long-term U.S. Treasury yields climbed to multiyear highs by late October and the 10-year yield reached the 5.00% level for the first time in about 16 years. Yields then plunged in the last two months of the year amid signs of disinflation, labor market softening, and expectations for interest rate cuts in 2024. The 10-year yield ended the year at 3.88%.
PORTFOLIO REVIEW / PERIOD END POSITIONING
The Portfolio posted positive returns and outperformed its benchmark, the Russell 1000 Growth Index (the “Index”), during the reporting period. Broadly speaking, both security selection and sector allocation drove relative outperformance.
The Communication Services sector was a significant contributor to relative returns due to an overweight allocation and favorable stock selection, led by Meta Platforms and Spotify. Shares of Meta Platforms bounced back significantly in 2023 as the social media giant’s advertising revenue reaccelerated and engagement trends improved, while its aggressive pivot toward cost discipline benefited margins. Spotify outperformed during the year as investors appreciated the streaming platform company’s renewed focus on profitability and expense efficiency alongside continued strength in monthly active user and premium subscriber metrics, which provided support for the company’s freemium conversion model.
An underweight allocation coupled with strong stock selection in Industrials also contributed to relative performance. A position in FedEx, which was eliminated in August, contributed. The stock traded higher early in the year as investors responded positively to earnings that demonstrated improving margins and the company’s cost cutting efforts and focus on efficiency.
An underweight allocation to the Consumer Staples sector further contributed to relative results. We maintained an underweight given the sector’s moderate growth trajectory. Many Consumer Staples firms operate well-entrenched, mature businesses that enjoy relatively stable demand; however, there are few companies in the sector that meet our growth threshold.
Stock selection in the Information Technology sector contributed and was driven by a holding in Nvidia. Shares of the leading chipmaker traded sharply higher following consecutive blowout quarterly reports and impressive guidance that reflected improved visibility around future demand for advanced graphics processing units (“GPUs”) that are critical for the build out of artificial intelligence infrastructure. Nvidia’s dominant position in state-of-the-art GPUs, combined with its embedded software, has created an expanding moat behind which the chipmaker should be able to continue to innovate and grow earnings. An underweight position in Apple was also beneficial as the technology giant underperformed its sector peers during the period.
Conversely, the Financials sector detracted from relative results due to an overweight allocation, which was partially offset by favorable stock selection. While the sector had double-digit positive returns for the year, it underperformed the broader index driven by regional bank failures early in the period that weighed on the overall sector.
Unfavorable stock selection in the Consumer Discretionary sector further detracted from relative results, which was partially offset by asset allocation effects. The Portfolio’s underweight exposure to Tesla detracted. Shares of the electric vehicle manufacturer outperformed in the first half of the year, recovering ground early in the period after management assuaged concerns about the low-end of margin structures following price cuts and reaffirmed strong levels of demand.
At the end of the period, the Portfolio was overweight relative to the Index in the Communication Services, Health Care, and Financials
BHFTII-1
Brighthouse Funds Trust II
T. Rowe Price Large Cap Growth Portfolio
Managed by T. Rowe Price Associates, Inc.
Portfolio Manager Commentary*—(Continued)
sectors. The Portfolio was underweight Consumer Staples and Industrials. Portfolio positioning decisions are driven primarily by bottom-up stock selection informed by rigorous internal research at the individual company level.
Joseph B. Fath
Portfolio Manager
T. Rowe Price Associates, Inc.
* This commentary may include statements that constitute “forward-looking statements” under the U.S. securities laws. Forward-looking statements include, among other things, projections, estimates, and information about possible or future results related to the Portfolio, market or regulatory developments. The views expressed above are not guarantees of future performance or economic results and involve certain risks, uncertainties and assumptions that could cause actual outcomes and results to differ materially from the views expressed herein. The views expressed above are subject to change at any time based upon economic, market, or other conditions and the subadvisory firm undertakes no obligation to update the views expressed herein. Any discussions of specific securities should not be considered a recommendation to buy or sell those securities. The views expressed above (including any forward-looking statement) may not be relied upon as investment advice or as an indication of the Portfolio’s trading intent. Information about the Portfolio’s holdings, asset allocation or country diversification is historical and is not an indication of future Portfolio composition, which may vary. Direct investment in any index is not possible. The performance of any index mentioned in this commentary has not been adjusted for ongoing management, distribution and operating expenses, and sales charges applicable to mutual fund investments. In addition, the returns do not reflect additional fees charged by separate accounts or variable insurance contracts that an investor in the Portfolio may pay. If these additional fees were reflected, performance would have been lower.
¹ The Russell 1000 Growth Index is an unmanaged measure of performance of the largest capitalized U.S. companies, within the Russell 1000 companies, that have higher price-to-book ratios and forecasted growth values.
BHFTII-2
Brighthouse Funds Trust II
T. Rowe Price Large Cap Growth Portfolio
A $10,000 INVESTMENT COMPARED TO THE RUSSELL 1000 GROWTH INDEX
AVERAGE ANNUAL RETURNS (%) FOR THE YEAR ENDED DECEMBER 31, 2023
| 1 Year | 5 Year | 10 Year | ||||||||||
| T. Rowe Price Large Cap Growth Portfolio | ||||||||||||
| Class A |
46.81 | 13.52 | 11.88 | |||||||||
| Class B |
46.53 | 13.23 | 11.60 | |||||||||
| Class E |
46.66 | 13.35 | 11.72 | |||||||||
| Russell 1000 Growth Index | 42.68 | 19.50 | 14.86 | |||||||||
Portfolio performance is calculated including reinvestment of all income and capital gain distributions. Performance numbers are net of all Portfolio expenses but do not include any insurance, sales, separate account or administrative charges of variable annuity or life insurance contracts or any additional expenses that participants may bear relating to the operations of their plans. If these charges were included, the returns would be lower. The performance of any index referenced above has not been adjusted for ongoing management, distribution and operating expenses, and sales charges applicable to mutual fund investments. Direct investment in any index is not possible. The performance of Class A shares, as set forth in the line graph above, will differ from that of other classes because of the difference in expenses paid by policyholders investing in the different share classes.
This information represents past performance and is not indicative of future results. Investment return and principal value may fluctuate so that shares, upon redemption, may be worth more or less than the original cost.
PORTFOLIO COMPOSITION AS OF DECEMBER 31, 2023
Top Holdings
| % of Net Assets |
||||
| Microsoft Corp. | 13.5 | |||
| Apple, Inc. | 8.4 | |||
| Amazon.com, Inc. | 7.5 | |||
| NVIDIA Corp. | 6.2 | |||
| Alphabet, Inc. - Class A | 5.6 | |||
| Meta Platforms, Inc. - Class A | 3.8 | |||
| Visa, Inc. - Class A | 3.2 | |||
| Eli Lilly & Co. | 3.0 | |||
| UnitedHealth Group, Inc. | 2.7 | |||
| Mastercard, Inc. - Class A | 2.4 | |||
Top Sectors
| % of Net Assets |
||||
| Information Technology | 43.0 | |||
| Communication Services | 15.0 | |||
| Consumer Discretionary | 14.9 | |||
| Health Care | 12.9 | |||
| Financials | 8.5 | |||
| Industrials | 2.5 | |||
| Consumer Staples | 1.0 | |||
| Materials | 0.9 | |||
| Energy | 0.8 | |||
BHFTII-3
Brighthouse Funds Trust II
T. Rowe Price Large Cap Growth Portfolio
Understanding Your Portfolio’s Expenses
Shareholder Expense Example
As a shareholder of the Portfolio, you incur ongoing costs, including management fees; distribution and service (12b-1) fees; and other Portfolio expenses. This example is intended to help you understand your ongoing costs (in dollars) (referred to as “expenses”) of investing in the Portfolio and compare these costs with the ongoing costs of investing in other mutual funds. The example is based on an investment of $1,000 invested at the beginning of the period and held for the entire period, July 1, 2023 through December 31, 2023.
Actual Expenses
The first line for each share class of the Portfolio in the table below provides information about actual account values and actual expenses. You may use the information in this line, together with the amount you invested in the particular share class of the Portfolio, to estimate the expenses that you paid over the period. Simply divide your account value by $1,000 (for example, an $8,600 account value divided by $1,000 = 8.6), then multiply the result by the number in the first line under the heading entitled “Expenses Paid During Period” to estimate the expenses you paid on your account during this period.
Hypothetical Example for Comparison Purposes
The second line for each share class of the Portfolio in the table below provides information about hypothetical account values and hypothetical expenses based on the Portfolio’s actual expense ratio and an assumed rate of return of 5% per year before expenses, which is not the Portfolio’s actual return. The hypothetical account values and expenses may not be used to estimate the actual ending account balance or expenses you paid for the period. You may use this information to compare the ongoing costs of investing in the Portfolio and other funds. To do so, compare this 5% hypothetical example with the 5% hypothetical examples that appear in the shareholder reports of the other funds.
Please note that the expenses shown in the table are meant to highlight your ongoing costs only and do not reflect any fees or charges of your variable insurance product or any additional expenses that participants in certain eligible qualified plans may bear relating to the operations of their plan. Therefore, the second line for each share class in the table is useful in comparing ongoing costs only, and will not help you determine the relative total costs of owning different funds. In addition, if these other costs were included, your costs would have been higher.
| T. Rowe Price Large Cap Growth Portfolio |
Annualized Expense Ratio |
Beginning Account Value July 1, 2023 |
Ending Account Value December 31, 2023 |
Expenses Paid During Period** July 1, 2023 to December 31, 2023 |
||||||||||||||
| Class A (a) |
Actual | 0.54 | % | $ | 1,000.00 | $ | 1,103.40 | $ | 2.86 | |||||||||
| Hypothetical* | 0.54 | % | $ | 1,000.00 | $ | 1,022.48 | $ | 2.75 | ||||||||||
| Class B (a) |
Actual | 0.79 | % | $ | 1,000.00 | $ | 1,102.10 | $ | 4.19 | |||||||||
| Hypothetical* | 0.79 | % | $ | 1,000.00 | $ | 1,021.22 | $ | 4.02 | ||||||||||
| Class E (a) |
Actual | 0.69 | % | $ | 1,000.00 | $ | 1,102.70 | $ | 3.66 | |||||||||
| Hypothetical* | 0.69 | % | $ | 1,000.00 | $ | 1,021.73 | $ | 3.52 | ||||||||||
| * | Hypothetical assumes a rate of return of 5% per year before expenses. |
| ** | Expenses paid are equal to the Portfolio’s annualized expense ratio for the most recent six month period, as shown above, multiplied by the average account value over the period, multiplied by the number of days (184 days) in the most recent fiscal half-year, divided by 365 (to reflect the one-half year period). |
| (a) | The annualized expense ratio shown reflects the impact of the management fee waiver as described in Note 5 of the Notes to Financial Statements. |
BHFTII-4
Brighthouse Funds Trust II
T. Rowe Price Large Cap Growth Portfolio
Schedule of Investments as of December 31, 2023
Common Stocks—97.8% of Net Assets
| Security Description | Shares | Value | ||||||
| Aerospace & Defense—0.5% | ||||||||
| Airbus SE |
63,357 | $ | 9,779,679 | |||||
|
|
|
|||||||
| Automobiles—3.4% | ||||||||
| Ferrari NV (a) |
34,451 | 11,659,252 | ||||||
| Rivian Automotive, Inc. - Class A (a) (b) |
1,292,590 | 30,324,161 | ||||||
| Tesla, Inc. (b) |
120,518 | 29,946,313 | ||||||
|
|
|
|||||||
| 71,929,726 | ||||||||
|
|
|
|||||||
| Biotechnology—1.5% | ||||||||
| Argenx SE (ADR) (b) |
25,812 | 9,819,659 | ||||||
| Legend Biotech Corp. (ADR) (a) (b) |
101,801 | 6,125,366 | ||||||
| Vertex Pharmaceuticals, Inc. (b) |
40,232 | 16,369,999 | ||||||
|
|
|
|||||||
| 32,315,024 | ||||||||
|
|
|
|||||||
| Broadline Retail—8.1% | ||||||||
| Amazon.com, Inc. (b) |
1,059,033 | 160,909,474 | ||||||
| Coupang, Inc. (b) |
782,572 | 12,669,841 | ||||||
|
|
|
|||||||
| 173,579,315 | ||||||||
|
|
|
|||||||
| Capital Markets—0.7% | ||||||||
| Charles Schwab Corp. |
211,791 | 14,571,221 | ||||||
|
|
|
|||||||
| Chemicals—0.9% | ||||||||
| Linde PLC |
47,099 | 19,344,030 | ||||||
|
|
|
|||||||
| Commercial Services & Supplies—0.3% | ||||||||
| Cintas Corp. |
10,919 | 6,580,444 | ||||||
|
|
|
|||||||
| Consumer Staples Distribution & Retail—1.1% | ||||||||
| Dollar General Corp. |
154,058 | 20,944,185 | ||||||
| Maplebear, Inc. (a) (b) |
26,334 | 618,059 | ||||||
| Maplebear, Inc. † (b) (d) |
58,169 | 1,296,965 | ||||||
|
|
|
|||||||
| 22,859,209 | ||||||||
|
|
|
|||||||
| Electronic Equipment, Instruments & Components—1.1% | ||||||||
| Amphenol Corp. - Class A |
1,951 | 193,403 | ||||||
| Teledyne Technologies, Inc. (b) |
52,409 | 23,389,612 | ||||||
|
|
|
|||||||
| 23,583,015 | ||||||||
|
|
|
|||||||
| Energy Equipment & Services—0.8% | ||||||||
| Schlumberger NV |
317,747 | 16,535,554 | ||||||
|
|
|
|||||||
| Entertainment—1.9% | ||||||||
| Netflix, Inc. (b) |
57,009 | 27,756,542 | ||||||
| Spotify Technology SA (b) |
67,366 | 12,658,745 | ||||||
|
|
|
|||||||
| 40,415,287 | ||||||||
|
|
|
|||||||
| Financial Services—6.7% | ||||||||
| Fiserv, Inc. (b) |
178,191 | 23,670,892 | ||||||
| Mastercard, Inc. - Class A |
121,103 | 51,651,640 | ||||||
| Visa, Inc. - Class A (a) |
259,299 | 67,508,495 | ||||||
|
|
|
|||||||
| 142,831,027 | ||||||||
|
|
|
|||||||
| Ground Transportation—0.9% | ||||||||
| Old Dominion Freight Line, Inc. |
23,172 | 9,392,307 | ||||||
| Uber Technologies, Inc. (b) |
154,900 | 9,537,193 | ||||||
|
|
|
|||||||
| 18,929,500 | ||||||||
|
|
|
|||||||
| Health Care Equipment & Supplies—2.0% | ||||||||
| Intuitive Surgical, Inc. (b) |
99,076 | 33,424,279 | ||||||
| Stryker Corp. |
31,887 | 9,548,881 | ||||||
|
|
|
|||||||
| 42,973,160 | ||||||||
|
|
|
|||||||
| Health Care Providers & Services—3.7% | ||||||||
| Cigna Group |
75,845 | 22,711,785 | ||||||
| UnitedHealth Group, Inc. |
107,850 | 56,779,790 | ||||||
|
|
|
|||||||
| 79,491,575 | ||||||||
|
|
|
|||||||
| Hotels, Restaurants & Leisure—1.7% | ||||||||
| Booking Holdings, Inc. (b) |
2,524 | 8,953,183 | ||||||
| Chipotle Mexican Grill, Inc. (b) |
6,735 | 15,402,676 | ||||||
| Las Vegas Sands Corp. (a) |
245,350 | 12,073,673 | ||||||
|
|
|
|||||||
| 36,429,532 | ||||||||
|
|
|
|||||||
| Insurance—1.0% | ||||||||
| Chubb Ltd. |
93,110 | 21,042,860 | ||||||
|
|
|
|||||||
| Interactive Media & Services—11.8% | ||||||||
| Alphabet, Inc. - Class A (b) |
854,420 | 119,353,930 | ||||||
| Alphabet, Inc. - Class C (b) |
271,442 | 38,254,321 | ||||||
| Meta Platforms, Inc. - Class A (b) |
228,570 | 80,904,637 | ||||||
| Pinterest, Inc. - Class A (b) |
386,516 | 14,316,553 | ||||||
|
|
|
|||||||
| 252,829,441 | ||||||||
|
|
|
|||||||
| IT Services—1.7% | ||||||||
| Accenture PLC - Class A |
48,467 | 17,007,555 | ||||||
| MongoDB, Inc. (a) (b) |
10,532 | 4,306,008 | ||||||
| Shopify, Inc. - Class A (b) |
180,060 | 14,026,674 | ||||||
| Stripe, Inc. - Class B † (b) (c) (d) |
63,278 | 1,413,631 | ||||||
|
|
|
|||||||
| 36,753,868 | ||||||||
|
|
|
|||||||
| Life Sciences Tools & Services—1.6% | ||||||||
| Avantor, Inc. (a) (b) |
295,276 | 6,741,151 | ||||||
| Danaher Corp. |
60,710 | 14,044,651 | ||||||
| Thermo Fisher Scientific, Inc. |
24,488 | 12,997,986 | ||||||
|
|
|
|||||||
| 33,783,788 | ||||||||
|
|
|
|||||||
| Media—0.3% | ||||||||
| Trade Desk, Inc. - Class A (a) (b) |
76,885 | 5,532,644 | ||||||
|
|
|
|||||||
| Pharmaceuticals—3.5% | ||||||||
| Eli Lilly & Co. |
108,689 | 63,356,992 | ||||||
| Zoetis, Inc. |
57,643 | 11,376,999 | ||||||
|
|
|
|||||||
| 74,733,991 | ||||||||
|
|
|
|||||||
| Professional Services—0.5% | ||||||||
| Ceridian HCM Holding, Inc. (a) (b) |
74,159 | 4,977,552 | ||||||
| TransUnion |
98,425 | 6,762,782 | ||||||
|
|
|
|||||||
| 11,740,334 | ||||||||
|
|
|
|||||||
See accompanying notes to financial statements.
BHFTII-5
Brighthouse Funds Trust II
T. Rowe Price Large Cap Growth Portfolio
Schedule of Investments as of December 31, 2023
Common Stocks—(Continued)
| Security Description | Shares |
Value | ||||||
| Semiconductors & Semiconductor Equipment—9.6% | ||||||||
| Advanced Micro Devices, Inc. (b) |
141,528 | $ | 20,862,643 | |||||
| ASML Holding NV |
37,370 | 28,286,100 | ||||||
| Intel Corp. |
177,400 | 8,914,350 | ||||||
| Lam Research Corp. |
18,596 | 14,565,503 | ||||||
| NVIDIA Corp. |
269,301 | 133,363,241 | ||||||
|
|
|
|||||||
| 205,991,837 | ||||||||
|
|
|
|||||||
| Software—21.9% | ||||||||
| Adobe, Inc. (b) |
44,224 | 26,384,038 | ||||||
| Atlassian Corp. - Class A (b) |
63,709 | 15,153,823 | ||||||
| Aurora Innovation, Inc. (a) (b) |
804,390 | 3,515,184 | ||||||
| Dynatrace, Inc. (a) (b) |
242,357 | 13,254,504 | ||||||
| Epic Games, Inc. † (b) (c) (d) |
7,488 | 3,524,602 | ||||||
| Intuit, Inc. |
55,059 | 34,413,527 | ||||||
| Magic Leap, Inc. - Class A † (b) (c) (d) |
10,914 | 52,387 | ||||||
| Microsoft Corp. |
769,333 | 289,299,981 | ||||||
| Monday.com Ltd. (b) |
9,224 | 1,732,360 | ||||||
| Roper Technologies, Inc. |
35,599 | 19,407,507 | ||||||
| Salesforce, Inc. (b) |
95,201 | 25,051,191 | ||||||
| ServiceNow, Inc. (b) |
51,692 | 36,519,881 | ||||||
|
|
|
|||||||
| 468,308,985 | ||||||||
|
|
|
|||||||
| Specialty Retail—0.6% | ||||||||
| Floor & Decor Holdings, Inc. - Class A (a) (b) |
41,434 | 4,622,377 | ||||||
| Ross Stores, Inc. |
62,279 | 8,618,791 | ||||||
|
|
|
|||||||
| 13,241,168 | ||||||||
|
|
|
|||||||
| Technology Hardware, Storage & Peripherals—8.4% | ||||||||
| Apple, Inc. |
936,115 | 180,230,221 | ||||||
|
|
|
|||||||
| Textiles, Apparel & Luxury Goods—0.6% | ||||||||
| NIKE, Inc. - Class B |
120,012 | 13,029,703 | ||||||
|
|
|
|||||||
| Wireless Telecommunication Services—1.0% | ||||||||
| T-Mobile U.S., Inc. (a) |
141,009 | 22,607,973 | ||||||
|
|
|
|||||||
| Total Common Stocks |
2,091,974,111 | |||||||
|
|
|
|||||||
| Preferred Stocks—0.9% | ||||||||
| Automobiles—0.3% | ||||||||
| Dr. Ing HC F Porsche AG |
70,729 | 6,237,316 | ||||||
|
|
|
|||||||
| Life Sciences Tools & Services—0.6% | ||||||||
| Sartorius AG |
33,527 | 12,335,256 | ||||||
|
|
|
|||||||
| Total Preferred Stocks |
18,572,572 | |||||||
|
|
|
|||||||
| Convertible Preferred Stocks—0.8% | ||||||||
| Automobiles—0.2% | ||||||||
| GM Cruise Holdings LLC - Class F † (b) (c) (d) |
196,100 | 1,145,224 | ||||||
| Nuro, Inc. - Series C † (b) (c) (d) |
179,741 | 735,141 | ||||||
| Automobiles—(Continued) | ||||||||
| Sila Nanotechnologies, Inc. - Series F † (b) (c) (d) |
52,110 | 1,056,791 | ||||||
| Waymo LLC - Series A2 † (b) (c) (d) |
26,511 | 1,512,452 | ||||||
|
|
|
|||||||
| 4,449,608 | ||||||||
|
|
|
|||||||
| Commercial Services & Supplies—0.2% | ||||||||
| Redwood Materials, Inc. - Series D † (b) (c) (d) |
110,579 | 5,278,580 | ||||||
|
|
|
|||||||
| Consumer Staples Distribution & Retail—0.1% | ||||||||
| Rappi, Inc. - Series E † (b) (c) (d) |
52,748 | 1,198,435 | ||||||
|
|
|
|||||||
| Financial Services—0.1% | ||||||||
| ANT Group Co. Ltd. † (b) (c) (d) |
2,959,806 | 2,898,242 | ||||||
|
|
|
|||||||
| Software—0.2% | ||||||||
| Celonis SE - Series D † (b) (c) (d) |
1,177 | 262,565 | ||||||
| Databricks, Inc. - Series I † (b) (c) (d) |
68,560 | 4,893,813 | ||||||
|
|
|
|||||||
| 5,156,378 | ||||||||
|
|
|
|||||||
| Total Convertible Preferred Stocks |
18,981,243 | |||||||
|
|
|
|||||||
| Short-Term Investment—0.4% |
| |||||||
| Mutual Funds—0.4% | ||||||||
| T. Rowe Price Government Reserve Fund (e) |
7,856,074 | 7,856,074 | ||||||
|
|
|
|||||||
| Total Short-Term Investments |
7,856,074 | |||||||
|
|
|
|||||||
| Securities Lending Reinvestments (f)—5.5% |
| |||||||
| Certificates of Deposit—0.6% | ||||||||
| Mizuho Bank Ltd. |
1,000,000 | 1,000,453 | ||||||
| National Westminster Bank PLC |
2,000,000 | 2,003,240 | ||||||
| Oversea-Chinese Banking Corp. Ltd. |
2,000,000 | 2,000,208 | ||||||
| Royal Bank of Canada |
2,000,000 | 2,001,240 | ||||||
| Standard Chartered Bank |
1,000,000 | 1,000,000 | ||||||
| Sumitomo Mitsui Banking Corp. |
4,000,000 | 4,000,492 | ||||||
| Sumitomo Mitsui Trust Bank Ltd. |
1,000,000 | 1,000,595 | ||||||
| Westpac Banking Corp. |
1,000,000 | 1,001,239 | ||||||
|
|
|
|||||||
| 14,007,467 | ||||||||
|
|
|
|||||||
| Commercial Paper—0.2% | ||||||||
| Australia & New Zealand Banking Group Ltd. |
1,000,000 | 983,338 | ||||||
| 5.730%, SOFR + 0.330%, 04/18/24 (g) |
1,000,000 | 1,000,224 | ||||||
See accompanying notes to financial statements.
BHFTII-6
Brighthouse Funds Trust II
T. Rowe Price Large Cap Growth Portfolio
Schedule of Investments as of December 31, 2023
Securities Lending Reinvestments (f)—(Continued)
| Security Description | Principal Amount* |
Value | ||||||
| Commercial Paper—(Continued) | ||||||||
| Old Line Funding LLC |
2,000,000 | $ | 2,000,000 | |||||
|
|
|
|||||||
| 3,983,562 | ||||||||
|
|
|
|||||||
| Repurchase Agreements—3.6% | ||||||||
| Bank of Nova Scotia |
13,100,000 | 13,100,000 | ||||||
| Barclays Bank PLC |
1,600,000 | 1,600,000 | ||||||
| Repurchase Agreement dated 12/29/23 at 5.450%, due on 01/02/24 with a maturity value of $5,003,028; collateralized by various Common Stock with an aggregate market value of $5,574,059 |
5,000,000 | 5,000,000 | ||||||
| Cantor Fitzgerald & Co. |
10,000,000 | 10,000,000 | ||||||
| Citigroup Global Markets, Inc. |
7,000,000 | 7,000,000 | ||||||
| Deutsche Bank Securities, Inc. |
2,314,899 | 2,314,899 | ||||||
| National Bank of Canada |
15,000,000 | 15,000,000 | ||||||
| NBC Global Finance Ltd. |
7,200,000 | 7,200,000 | ||||||
| Royal Bank of Canada Toronto |
3,000,000 | 3,000,000 | ||||||
| Repurchase Agreements—(Continued) | ||||||||
| Societe Generale |
7,000,000 | 7,000,000 | ||||||
| Repurchase Agreement dated 12/29/23 at 5.330%, due on 01/02/24 with a maturity value of $100,059; collateralized by U.S. Treasury Obligations with rates ranging from 0.625% - 5.240%, maturity dates ranging from 04/30/24 - 05/15/32, and an aggregate market value of $102,000 |
100,000 | 100,000 | ||||||
| TD Prime Services LLC |
5,000,000 | 5,000,000 | ||||||
|
|
|
|||||||
| 76,314,899 | ||||||||
|
|
|
|||||||
| Time Deposits—0.5% | ||||||||
| DZ Bank AG (NY) |
3,000,000 | 3,000,000 | ||||||
| First Abu Dhabi Bank USA NV |
4,000,000 | 4,000,000 | ||||||
| National Bank of Canada |
5,000,000 | 5,000,000 | ||||||
|
|
|
|||||||
| 12,000,000 | ||||||||
|
|
|
|||||||
| Mutual Funds—0.6% | ||||||||
| BlackRock Liquidity Funds FedFund, Institutional Shares |
5,000,000 | 5,000,000 | ||||||
| Morgan Stanley Liquidity Funds Government Portfolio, Institutional Shares 5.270% (h) |
2,000,000 | 2,000,000 | ||||||
| RBC U.S. Government Money Market Fund, Institutional Share |
5,000,000 | 5,000,000 | ||||||
|
|
|
|||||||
| 12,000,000 | ||||||||
|
|
|
|||||||
| Total Securities Lending Reinvestments |
118,305,928 | |||||||
|
|
|
|||||||
| Total Investments—105.4% |
2,255,689,928 | |||||||
| Other assets and liabilities (net)—(5.4)% |
(116,327,397 | ) | ||||||
|
|
|
|||||||
| Net Assets—100.0% | $ | 2,139,362,531 | ||||||
|
|
|
|||||||
| * | Principal amount stated in U.S. dollars unless otherwise noted. | |||
| † | Restricted securities are not registered under the Securities Act of 1933 and are subject to legal restrictions on resale. These securities generally may be resold in transactions exempt from registration or to the public if the securities are subsequently registered. Disposal of these securities may involve time-consuming negotiations and prompt sale at an acceptable price may be difficult. As of December 31, 2023, the market value of restricted securities was $25,268,828, which is 1.2% of net assets. See details shown in the Restricted Securities table that follows. | |||
See accompanying notes to financial statements.
BHFTII-7
Brighthouse Funds Trust II
T. Rowe Price Large Cap Growth Portfolio
Schedule of Investments as of December 31, 2023
| (a) | All or a portion of the security was held on loan. As of December 31, 2023, the market value of securities loaned was $146,682,223 and the collateral received consisted of cash in the amount of $118,286,229 and non-cash collateral with a value of $32,039,726. The cash collateral investments are disclosed in the Schedule of Investments and categorized as Securities Lending Reinvestments. The non-cash collateral received consists of U.S. government securities that are held in safe-keeping by the lending agent, or a third-party custodian, and cannot be sold or repledged by the Portfolio. As such, this collateral is excluded from the Statement of Assets and Liabilities. | |||
| (b) | Non-income producing security. | |||
| (c) | Significant unobservable inputs were used in the valuation of this portfolio security; i.e. Level 3. | |||
| (d) | Security was valued in good faith under procedures subject to oversight by the Board of Trustees. As of December 31, 2023, these securities represent 1.2% of net assets. | |||
| (e) | Affiliated Issuer. (See Note 6 of the Notes to Financial Statements for a summary of transactions in securities of affiliated issuers.) | |||
| (f) | Represents investment of cash collateral received from securities on loan as of December 31, 2023. | |||
| (g) | Variable or floating rate security. The stated rate represents the rate at December 31, 2023. Maturity date shown for callable securities reflects the earliest possible call date. For securities based on a published reference index and spread, the index and spread are indicated in the description above. For certain variable rate securities, the coupon rate is determined by the issuer/agent based on current market conditions. For certain asset- and mortgage-backed securities, the coupon rate may fluctuate based on changes of the underlying collateral or prepayments of principal. These securities do not indicate a reference index and spread in their description above. | |||
| (h) | The rate shown represents the annualized seven-day yield as of December 31, 2023. | |||
| Restricted Securities |
Acquisition Date |
Shares | Cost | Value | ||||||||||||
| ANT Group Co. Ltd. |
08/14/23 | 2,959,806 | $ | 2,959,806 | $ | 2,898,242 | ||||||||||
| Celonis SE - Series D |
10/04/22 | 1,177 | 435,243 | 262,565 | ||||||||||||
| Databricks, Inc. - Series I |
09/14/23 | 68,560 | 5,039,160 | 4,893,813 | ||||||||||||
| Epic Games, Inc. |
06/18/20 | 7,488 | 4,310,738 | 3,524,602 | ||||||||||||
| GM Cruise Holdings LLC - Class F |
05/07/19 | 196,100 | 3,578,825 | 1,145,224 | ||||||||||||
| Magic Leap, Inc. - Class A |
01/20/16-10/12/17 | 10,914 | 5,305,346 | 52,387 | ||||||||||||
| Maplebear, Inc. |
07/02/20-11/18/20 | 58,169 | 2,796,825 | 1,296,965 | ||||||||||||
| Nuro, Inc. - Series C |
10/30/20 | 179,741 | 2,346,447 | 735,141 | ||||||||||||
| Rappi, Inc. - Series E |
09/08/20-09/24/20 | 52,748 | 3,151,484 | 1,198,435 | ||||||||||||
| Redwood Materials, Inc. - Series D |
06/02/23 | 110,579 | 5,278,583 | 5,278,580 | ||||||||||||
| Sila Nanotechnologies, Inc. - Series F |
01/07/21 | 52,110 | 2,150,726 | 1,056,791 | ||||||||||||
| Stripe, Inc. - Class B |
12/17/19 | 63,278 | 992,832 | 1,413,631 | ||||||||||||
| Waymo LLC - Series A2 |
05/08/20 | 26,511 | 2,276,425 | 1,512,452 | ||||||||||||
|
|
|
|||||||||||||||
| $ | 25,268,828 | |||||||||||||||
|
|
|
|||||||||||||||
Glossary of Abbreviations
Index Abbreviations
| (FEDEFF PRV)— | Effective Federal Funds Rate | |
| (OBFR)— | U.S. Overnight Bank Funding Rate | |
| (SOFR)— | Secured Overnight Financing Rate |
Other Abbreviations
| (ADR)— | American Depositary Receipt |
See accompanying notes to financial statements.
BHFTII-8
Brighthouse Funds Trust II
T. Rowe Price Large Cap Growth Portfolio
Schedule of Investments as of December 31, 2023
Fair Value Hierarchy
Accounting principles generally accepted in the United States of America (“GAAP”) define fair market value as the price that the Portfolio would receive to sell an asset or pay to transfer a liability in an orderly transaction between market participants at the measurement date. It establishes a fair value hierarchy that prioritizes inputs to valuation methods and requires disclosure of the fair value hierarchy, separately for each major category of assets and liabilities, that segregates fair value measurements into three levels. Levels 1, 2 and 3 of the fair value hierarchy are defined as follows:
Level 1 - unadjusted quoted prices in active markets for identical investments
Level 2 - other significant observable inputs (including, but not limited to, quoted prices for similar assets or liabilities in markets that are either active or inactive; inputs other than quoted prices that are observable such as interest rates, yield curves, volatilities, prepayment speeds, loss severities, credit risks, default rates, or other market corroborated inputs)
Level 3 - significant unobservable inputs based on the best information available in the circumstances, to the extent observable inputs are unavailable (including the Portfolio’s own assumptions used in determining the fair value of investments and derivative financial instruments)
The inputs or methodologies used for valuing investments are not necessarily an indication of the risk associated with investing in them. Changes to the inputs or methodologies used may result in transfers between levels. A reconciliation of Level 3 securities, if any, will be disclosed following the fair value hierarchy table. For more information about the Portfolio’s policy regarding the valuation of investments, please refer to the Notes to Financial Statements.
The following table summarizes the fair value hierarchy of the Portfolio’s investments as of December 31, 2023:
| Description | Level 1 | Level 2 | Level 3 | Total | ||||||||||||
| Common Stocks |
| |||||||||||||||
| Aerospace & Defense |
$ | — | $ | 9,779,679 | $ | — | $ | 9,779,679 | ||||||||
| Automobiles |
71,929,726 | — | — | 71,929,726 | ||||||||||||
| Biotechnology |
32,315,024 | — | — | 32,315,024 | ||||||||||||
| Broadline Retail |
173,579,315 | — | — | 173,579,315 | ||||||||||||
| Capital Markets |
14,571,221 | — | — | 14,571,221 | ||||||||||||
| Chemicals |
19,344,030 | — | — | 19,344,030 | ||||||||||||
| Commercial Services & Supplies |
6,580,444 | — | — | 6,580,444 | ||||||||||||
| Consumer Staples Distribution & Retail |
21,562,244 | 1,296,965 | — | 22,859,209 | ||||||||||||
| Electronic Equipment, Instruments & Components |
23,583,015 | — | — | 23,583,015 | ||||||||||||
| Energy Equipment & Services |
16,535,554 | — | — | 16,535,554 | ||||||||||||
| Entertainment |
40,415,287 | — | — | 40,415,287 | ||||||||||||
| Financial Services |
142,831,027 | — | — | 142,831,027 | ||||||||||||
| Ground Transportation |
18,929,500 | — | — | 18,929,500 | ||||||||||||
| Health Care Equipment & Supplies |
42,973,160 | — | — | 42,973,160 | ||||||||||||
| Health Care Providers & Services |
79,491,575 | — | — | 79,491,575 | ||||||||||||
| Hotels, Restaurants & Leisure |
36,429,532 | — | — | 36,429,532 | ||||||||||||
| Insurance |
21,042,860 | — | — | 21,042,860 | ||||||||||||
| Interactive Media & Services |
252,829,441 | — | — | 252,829,441 | ||||||||||||
| IT Services |
35,340,237 | — | 1,413,631 | 36,753,868 | ||||||||||||
| Life Sciences Tools & Services |
33,783,788 | — | — | 33,783,788 | ||||||||||||
| Media |
5,532,644 | — | — | 5,532,644 | ||||||||||||
| Pharmaceuticals |
74,733,991 | — | — | 74,733,991 | ||||||||||||
| Professional Services |
11,740,334 | — | — | 11,740,334 | ||||||||||||
| Semiconductors & Semiconductor Equipment |
205,991,837 | — | — | 205,991,837 | ||||||||||||
| Software |
464,731,996 | — | 3,576,989 | 468,308,985 | ||||||||||||
| Specialty Retail |
13,241,168 | — | — | 13,241,168 | ||||||||||||
| Technology Hardware, Storage & Peripherals |
180,230,221 | — | — | 180,230,221 | ||||||||||||
| Textiles, Apparel & Luxury Goods |
13,029,703 | — | — | 13,029,703 | ||||||||||||
| Wireless Telecommunication Services |
22,607,973 | — | — | 22,607,973 | ||||||||||||
| Total Common Stocks |
2,075,906,847 | 11,076,644 | 4,990,620 | 2,091,974,111 | ||||||||||||
| Total Preferred Stocks* |
— | 18,572,572 | — | 18,572,572 | ||||||||||||
| Total Convertible Preferred Stocks* |
— | — | 18,981,243 | 18,981,243 | ||||||||||||
| Total Short-Term Investment* |
7,856,074 | — | — | 7,856,074 | ||||||||||||
| Securities Lending Reinvestments |
| |||||||||||||||
| Certificates of Deposit |
— | 14,007,467 | — | 14,007,467 | ||||||||||||
| Commercial Paper |
— | 3,983,562 | — | 3,983,562 | ||||||||||||
| Repurchase Agreements |
— | 76,314,899 | — | 76,314,899 | ||||||||||||
| Time Deposits |
— | 12,000,000 | — | 12,000,000 | ||||||||||||
| Mutual Funds |
12,000,000 | — | — | 12,000,000 | ||||||||||||
| Total Securities Lending Reinvestments |
12,000,000 | 106,305,928 | — | 118,305,928 | ||||||||||||
| Total Investments |
$ | 2,095,762,921 | $ | 135,955,144 | $ | 23,971,863 | $ | 2,255,689,928 | ||||||||
| Collateral for Securities Loaned (Liability) |
$ | — | $ | (118,286,229 | ) | $ | — | $ | (118,286,229 | ) | ||||||
| * | See Schedule of Investments for additional detailed categorizations. | |||
See accompanying notes to financial statements.
BHFTII-9
Brighthouse Funds Trust II
T. Rowe Price Large Cap Growth Portfolio
Schedule of Investments as of December 31, 2023
Following is a reconciliation of Level 3 assets for which significant unobservable inputs were used to determine fair value:
| Investments in Securities |
Balance as of December 31, 2022 |
Purchases | Sales | Realized Gain/ (Loss) |
Transfers Out | Change in Unrealized Appreciation/ (Depreciation) |
Balance as of December 31, 2023 |
Change in Unrealized Appreciation/ (Depreciation) from Investments Held at December 31, 2023 |
||||||||||||||||||||||||
| Common Stocks | ||||||||||||||||||||||||||||||||
| Consumer Staples Distribution & Retail |
$ | 917,097 | $ | — | $ | — | $ | — | $ | (917,097 | ) | $ | — | $ | — | $ | — | |||||||||||||||
| IT Services |
1,171,276 | — | — | — | — | 242,355 | 1,413,631 | 242,355 | ||||||||||||||||||||||||
| Software |
5,615,913 | — | (251,752 | ) | 42,990 | — | (1,830,162 | ) | 3,576,989 | (1,830,162 | ) | |||||||||||||||||||||
| Convertible Preferred Stocks | ||||||||||||||||||||||||||||||||
| Automobiles |
9,356,576 | — | — | — | — | (4,906,968 | ) | 4,449,608 | (4,906,968 | ) | ||||||||||||||||||||||
| Commercial Services & Supplies |
— | 5,278,584 | — | — | — | (4 | ) | 5,278,580 | (4 | ) | ||||||||||||||||||||||
| Consumer Staples Distribution & Retail |
3,802,392 | — | — | — | (1,902,937 | ) | (701,020 | ) | 1,198,435 | (701,020 | ) | |||||||||||||||||||||
| Financial Services |
— | 2,959,806 | — | — | — | (61,564 | ) | 2,898,242 | (61,564 | ) | ||||||||||||||||||||||
| Internet & Direct Marketing Retail |
4,358,552 | — | (4,228,294 | ) | (3,954,996 | ) | — | 3,824,738 | — | — | ||||||||||||||||||||||
| Software |
435,243 | 5,039,160 | — | — | — | (318,025 | ) | 5,156,378 | (318,025 | ) | ||||||||||||||||||||||
|
|
|
|
|
|
|
|
|
|
|
|
|
|
|
|
|
|||||||||||||||||
| $ | 25,657,049 | $ | 13,277,550 | $ | (4,480,046 | ) | $ | (3,912,006 | ) | $ | (2,820,034 | ) | $ | (3,750,650 | ) | $ | 23,971,863 | $ | (7,575,388 | ) | ||||||||||||
|
|
|
|
|
|
|
|
|
|
|
|
|
|
|
|
|
|||||||||||||||||
| Fair Value at December 31, 2023 |
Valuation Technique(s) |
Unobservable Input |
Range | Weighted Average |
Relationship Between Fair Value and Input; if input value increases then Fair Value: |
|||||||||||||||||||
| Common Stock | ||||||||||||||||||||||||
| IT Services |
$1,413,631 (a) | Market Transaction Method | Precedent Transaction | $ | 20.13 | $ | 21.42 | $ | 20.78 | Increase | ||||||||||||||
| Calibration Model | Enterprise Value/Gross Profit | 11.6x | 13.19x | 12.8x | Increase | |||||||||||||||||||
| Implied Discount | 0.00 | % | 0.00 | % | 0.00 | % | Decrease | |||||||||||||||||
| Software |
3,524,602 | (b) | Calibration Model | Enterprise Value/Sales | 5.0x | 5.8x | 5.4x | Increase | ||||||||||||||||
| Enterprise Value/Gross Profit | 8.1x | 8.1x | 8.1x | Increase | ||||||||||||||||||||
| Implied Discount | 10.00 | % | 10.00 | % | 10.00 | % | Decrease | |||||||||||||||||
| 52,387 | Market Transaction Method | Precedent Transaction | $ | 19.20 | $ | 19.20 | $ | 19.20 | Increase | |||||||||||||||
| Discount for Lack of Certainty | 75.00 | % | 75.00 | % | 75.00 | % | Decrease | |||||||||||||||||
| Convertible Preferred Stocks | ||||||||||||||||||||||||
| Automobiles |
1,145,224 | Discounted Projected Multiple | Forward Enterprise Value/Sales | 3.5x | 5.3x | 4.4x | Increase | |||||||||||||||||
| Discount Rate | 35.00 | % | 35.00 | % | 35.00 | % | Decrease | |||||||||||||||||
| Discount for Lack of Marketability | 10.00 | % | 10.00 | % | 10.00 | % | Decrease | |||||||||||||||||
| 735,141 | (c) | Comparable Company Analysis | Market Comparable Adjustment | -80.00 | % | -80.00 | % | -80.00 | % | Decrease | ||||||||||||||
| 1,056,791 | (d) | Comparable Company Analysis | Enterprise Value/Sales | 1.4x | 1.4x | 1.4x | Increase | |||||||||||||||||
| Discount for Lack of Marketability | 10.00 | % | 10.00 | % | 10.00 | % | Decrease | |||||||||||||||||
| 1,512,452 | Market Transaction Method | Precedent Transaction | $ | 78.20 | $ | 78.20 | $ | 78.20 | Increase | |||||||||||||||
| Discounted Projected Multiple | Forward Enterprise Value/Sales | 3.6x | 5.5x | 4.6x | Increase | |||||||||||||||||||
| Discount Rate | 30.00 | % | 30.00 | % | 30.00 | % | Decrease | |||||||||||||||||
| Discount for Lack of Marketability | 10.00 | % | 10.00 | % | 10.00 | % | Decrease | |||||||||||||||||
| Commercial Services & Supplies |
5,278,580 | Market Transaction Method | Precedent Transaction | $ | 47.74 | $ | 47.74 | $ | 47.74 | Increase | ||||||||||||||
| Consumer Staples Distribution & Retail |
1,198,435 | (d) | Comparable Company Analysis | Enterprise Value/GMV | 0.5x | 0.6x | 0.6x | Increase | ||||||||||||||||
| Enterprise Value/Gross Profit | 5.0x | 6.0x | 5.5x | Increase | ||||||||||||||||||||
| Enterprise Value/EBITDA | 14.5x | 23.1x | 18.8x | Increase | ||||||||||||||||||||
| Discount for Lack of Marketability | 10.00 | % | 10.00 | % | 10.00 | % | Decrease | |||||||||||||||||
| Financial Services |
2,898,242 | (e) | Discounted Cash Flow | Contingent Payment Owed | 70.00 | % | 70.00 | % | 70.00 | % | Increase | |||||||||||||
| Accrued Interest Rate | 3.55 | % | 3.55 | % | 3.55 | % | Increase | |||||||||||||||||
| Discount Rate | 5.73 | % | 5.73 | % | 5.73 | % | Decrease | |||||||||||||||||
| Software |
262,565 | (f) | Calibration Model | Enterprise Value/Sales | 11.7x | 14.8x | 13.3x | Increase | ||||||||||||||||
| Enterprise Value/Gross Profit | 14.9x | 18.9x | 16.9x | Increase | ||||||||||||||||||||
| Implied Premium | 0.0 | % | 0.0 | % | 0.0 | % | Increase | |||||||||||||||||
| 4,893,813 | Market Transaction Method | Precedent Transactions | $ | 65.00 | $ | 73.50 | $ | 71.38 | Increase | |||||||||||||||
See accompanying notes to financial statements.
BHFTII-10
Brighthouse Funds Trust II
T. Rowe Price Large Cap Growth Portfolio
Schedule of Investments as of December 31, 2023
| (a) | For the year ended December 31, 2023, the valuation technique for investments amounting to $1,413,631 changed to a multi-tiered approach. The investments were previously valued utilizing only a comparable company analysis. The change was due to the consideration of the most recent financial information that was available at the time the investments were valued. |
| (b) | For the year ended December 31, 2023, the valuation technique for investments amounting to $3,524,602 changed to a calibration model approach. The investments were previously valued utilizing a multi-tiered approach. The change was due to the consideration of the most recent financial information that was available at the time the investments were valued. |
| (c) | For the year ended December 31, 2023, the valuation technique for investments amounting to $735,141 changed to a comparable company approach. The investments were previously valued utilizing a discounted cash flow analysis. The change was due to the consideration of the most recent financial information that was available at the time the investments were valued. |
| (d) | For the year ended December 31, 2023, the valuation technique for investments amounting to $2,255,225 changed to a comparable company approach. The investments were previously valued utilizing a multi-tiered approach. The change was due to the consideration of the most recent financial information that was available at the time the investments were valued. |
| (e) | For the year ended December 31, 2023, the valuation technique for investments amounting to $2,898,242 changed to a discounted cash flow method. The investments were previously valued utilizing a comparable company analysis. The change was due to the consideration of the most recent financial information that was available at the time the investments were valued. |
| (f) | For the year ended December 31, 2023, the valuation technique for investments amounting to $262,565 changed to a calibration model approach. The investments were previously valued utilizing a market transaction approach. The change was due to the consideration of the most recent financial information that was available at the time the investments were valued. |
See accompanying notes to financial statements.
BHFTII-11
Brighthouse Funds Trust II
T. Rowe Price Large Cap Growth Portfolio
Statement of Assets and Liabilities
December 31, 2023
| Assets |
| |||
| Investments at value (a) (b) |
$ | 2,247,833,854 | ||
| Affiliated investments at value (c) |
7,856,074 | |||
| Cash |
1,300,000 | |||
| Cash denominated in foreign currencies (d) |
79 | |||
| Receivable for: |
||||
| Investments sold |
3,020,538 | |||
| Fund shares sold |
328,975 | |||
| Dividends and interest |
308,997 | |||
| Dividends on affiliated investments |
51,570 | |||
| Prepaid expenses |
7,955 | |||
|
|
|
|||
| Total Assets |
2,260,708,042 | |||
|
|
|
|||
| Liabilities |
||||
| Collateral for securities loaned |
118,286,229 | |||
| Payables for: |
||||
| Affiliated investments purchased |
36,250 | |||
| Fund shares redeemed |
1,539,142 | |||
| Accrued Expenses: |
||||
| Management fees |
928,509 | |||
| Distribution and service fees |
204,928 | |||
| Deferred trustees’ fees |
192,719 | |||
| Other expenses |
157,734 | |||
|
|
|
|||
| Total Liabilities |
121,345,511 | |||
|
|
|
|||
| Net Assets |
$ | 2,139,362,531 | ||
|
|
|
|||
| Net Assets Consist of: |
||||
| Paid in surplus |
$ | 1,170,642,360 | ||
| Distributable earnings (Accumulated losses) |
968,720,171 | |||
|
|
|
|||
| Net Assets |
$ | 2,139,362,531 | ||
|
|
|
|||
| Net Assets |
||||
| Class A |
$ | 1,153,209,477 | ||
| Class B |
951,886,682 | |||
| Class E |
34,266,372 | |||
| Capital Shares Outstanding* |
| |||
| Class A |
55,703,422 | |||
| Class B |
48,431,617 | |||
| Class E |
1,698,419 | |||
| Net Asset Value, Offering Price and Redemption Price Per Share |
| |||
| Class A |
$ | 20.70 | ||
| Class B |
19.65 | |||
| Class E |
20.18 | |||
| * | The Portfolio is authorized to issue an unlimited number of shares. | |||
| (a) | Identified cost of investments, excluding affiliated investments, was $1,396,568,600. | |||
| (b) | Includes securities loaned at value of $146,682,223. | |||
| (c) | Identified cost of affiliated investments was $7,856,074. | |||
| (d) | Identified cost of cash denominated in foreign currencies was $78. | |||
Statement of Operations
Year Ended December 31, 2023
| Investment Income |
| |||
| Dividends (a) |
$ | 10,326,255 | ||
| Dividends from affiliated investments |
440,803 | |||
| Securities lending income |
383,392 | |||
|
|
|
|||
| Total investment income |
11,150,450 | |||
|
|
|
|||
| Expenses |
| |||
| Management fees |
12,123,508 | |||
| Administration fees |
89,467 | |||
| Custodian and accounting fees |
122,274 | |||
| Distribution and service fees—Class B |
2,217,045 | |||
| Distribution and service fees—Class E |
47,240 | |||
| Audit and tax services |
59,836 | |||
| Legal |
46,604 | |||
| Trustees’ fees and expenses |
46,220 | |||
| Shareholder reporting |
77,800 | |||
| Insurance |
17,601 | |||
| Miscellaneous |
26,498 | |||
|
|
|
|||
| Total expenses |
14,874,093 | |||
| Less management fee waiver |
(1,647,833 | ) | ||
|
|
|
|||
| Net expenses |
13,226,260 | |||
|
|
|
|||
| Net Investment Loss |
(2,075,810 | ) | ||
|
|
|
|||
| Net Realized and Unrealized Gain (Loss) |
| |||
| Net realized gain (loss) on: |
| |||
| Investments |
195,722,979 | |||
| Foreign currency transactions |
11,897 | |||
|
|
|
|||
| Net realized gain (loss) |
195,734,876 | |||
|
|
|
|||
| Net change in unrealized appreciation (depreciation) on: |
| |||
| Investments |
568,165,564 | |||
| Foreign currency transactions |
258 | |||
|
|
|
|||
| Net change in unrealized appreciation (depreciation) |
568,165,822 | |||
|
|
|
|||
| Net realized and unrealized gain (loss) |
763,900,698 | |||
|
|
|
|||
| Net Increase (Decrease) in Net Assets From Operations |
$ | 761,824,888 | ||
|
|
|
|||
| (a) | Net of foreign withholding taxes of $128,497. | |||
See accompanying notes to financial statements.
BHFTII-12
Brighthouse Funds Trust II
T. Rowe Price Large Cap Growth Portfolio
Statements of Changes in Net Assets
| Year Ended December 31, 2023 |
Year Ended December 31, 2022 |
|||||||
| Increase (Decrease) in Net Assets: |
||||||||
| From Operations |
||||||||
| Net investment income (loss) |
$ | (2,075,810 | ) | $ | (4,315,887 | ) | ||
| Net realized gain (loss) |
195,734,876 | (72,248,029 | ) | |||||
| Net change in unrealized appreciation (depreciation) |
568,165,822 | (1,079,294,369 | ) | |||||
|
|
|
|
|
|||||
| Increase (decrease) in net assets from operations |
761,824,888 | (1,155,858,285 | ) | |||||
|
|
|
|
|
|||||
| From Distributions to Shareholders |
||||||||
| Class A |
0 | (234,334,024 | ) | |||||
| Class B |
0 | (196,064,384 | ) | |||||
| Class E |
0 | (7,160,168 | ) | |||||
| From return of capital |
||||||||
| Class A |
0 | (268,119 | ) | |||||
| Class B |
0 | (224,332 | ) | |||||
| Class E |
0 | (8,192 | ) | |||||
|
|
|
|
|
|||||
| Total distributions |
0 | (438,059,219 | ) | |||||
|
|
|
|
|
|||||
| Increase (decrease) in net assets from capital share transactions |
(347,909,887 | ) | 496,138,148 | |||||
|
|
|
|
|
|||||
| Total increase (decrease) in net assets |
413,915,001 | (1,097,779,356 | ) | |||||
| Net Assets |
||||||||
| Beginning of period |
1,725,447,530 | 2,823,226,886 | ||||||
|
|
|
|
|
|||||
| End of period |
$ | 2,139,362,531 | $ | 1,725,447,530 | ||||
|
|
|
|
|
|||||
Other Information:
Capital Shares
Transactions in capital shares were as follows:
| Year Ended December 31, 2023 |
Year Ended December 31, 2022 |
|||||||||||||||
| Shares | Value | Shares | Value | |||||||||||||
| Class A |
||||||||||||||||
| Sales |
2,535,682 | $ | 41,954,459 | 4,855,504 | $ | 105,816,814 | ||||||||||
| Reinvestments |
0 | 0 | 15,619,317 | 234,602,143 | ||||||||||||
| Redemptions |
(13,590,400 | ) | (247,229,763 | ) | (2,515,907 | ) | (48,783,830 | ) | ||||||||
|
|
|
|
|
|
|
|
|
|||||||||
| Net increase (decrease) |
(11,054,718 | ) | $ | (205,275,304 | ) | 17,958,914 | $ | 291,635,127 | ||||||||
|
|
|
|
|
|
|
|
|
|||||||||
| Class B |
||||||||||||||||
| Sales |
2,596,348 | $ | 43,211,852 | 5,967,725 | $ | 112,865,385 | ||||||||||
| Reinvestments |
0 | 0 | 13,716,891 | 196,288,716 | ||||||||||||
| Redemptions |
(10,659,879 | ) | (181,785,768 | ) | (5,765,886 | ) | (105,167,463 | ) | ||||||||
|
|
|
|
|
|
|
|
|
|||||||||
| Net increase (decrease) |
(8,063,531 | ) | $ | (138,573,916 | ) | 13,918,730 | $ | 203,986,638 | ||||||||
|
|
|
|
|
|
|
|
|
|||||||||
| Class E |
||||||||||||||||
| Sales |
57,910 | $ | 989,546 | 71,309 | $ | 1,293,534 | ||||||||||
| Reinvestments |
0 | 0 | 488,641 | 7,168,360 | ||||||||||||
| Redemptions |
(290,887 | ) | (5,050,213 | ) | (391,485 | ) | (7,945,511 | ) | ||||||||
|
|
|
|
|
|
|
|
|
|||||||||
| Net increase (decrease) |
(232,977 | ) | $ | (4,060,667 | ) | 168,465 | $ | 516,383 | ||||||||
|
|
|
|
|
|
|
|
|
|||||||||
| Increase (decrease) derived from capital shares transactions |
$ | (347,909,887 | ) | $ | 496,138,148 | |||||||||||
|
|
|
|
|
|||||||||||||
See accompanying notes to financial statements.
BHFTII-13
Brighthouse Funds Trust II
T. Rowe Price Large Cap Growth Portfolio
Financial Highlights
| Selected per share data | ||||||||||||||||||||
| Class A | ||||||||||||||||||||
| Year Ended December 31, | ||||||||||||||||||||
| 2023 | 2022 | 2021 | 2020 | 2019 | ||||||||||||||||
| Net Asset Value, Beginning of Period |
$ | 14.10 | $ | 30.81 | $ | 28.79 | $ | 22.93 | $ | 20.71 | ||||||||||
|
|
|
|
|
|
|
|
|
|
|
|||||||||||
| Income (Loss) from Investment Operations |
| |||||||||||||||||||
| Net investment income (loss) (a) |
0.00 | (b) | (0.02 | ) | (0.06 | ) | (0.01 | ) | 0.06 | |||||||||||
| Net realized and unrealized gain (loss) |
6.60 | (12.17 | ) | 5.55 | 7.90 | 5.91 | ||||||||||||||
|
|
|
|
|
|
|
|
|
|
|
|||||||||||
| Total income (loss) from investment operations |
6.60 | (12.19 | ) | 5.49 | 7.89 | 5.97 | ||||||||||||||
|
|
|
|
|
|
|
|
|
|
|
|||||||||||
| Less Distributions |
||||||||||||||||||||
| Distributions from net investment income |
0.00 | 0.00 | 0.00 | (0.06 | ) | (0.10 | ) | |||||||||||||
| Distributions from net realized capital gains |
0.00 | (4.52 | ) | (3.47 | ) | (1.97 | ) | (3.65 | ) | |||||||||||
| Distributions from return of capital |
0.00 | (0.00 | )(d) | 0.00 | 0.00 | 0.00 | ||||||||||||||
|
|
|
|
|
|
|
|
|
|
|
|||||||||||
| Total distributions |
0.00 | (4.52 | ) | (3.47 | ) | (2.03 | ) | (3.75 | ) | |||||||||||
|
|
|
|
|
|
|
|
|
|
|
|||||||||||
| Net Asset Value, End of Period |
$ | 20.70 | $ | 14.10 | $ | 30.81 | $ | 28.79 | $ | 22.93 | ||||||||||
|
|
|
|
|
|
|
|
|
|
|
|||||||||||
| Total Return (%) (e) |
46.81 | (40.46 | ) | 20.22 | 36.95 | 30.99 | ||||||||||||||
| Ratios/Supplemental Data |
||||||||||||||||||||
| Gross ratio of expenses to average net assets (%) |
0.63 | 0.62 | 0.62 | 0.63 | 0.63 | |||||||||||||||
| Net ratio of expenses to average net assets (%) (f) (g) |
0.54 | 0.55 | 0.54 | 0.55 | 0.55 | |||||||||||||||
| Ratio of net investment income (loss) to average net assets (%) |
0.01 | (0.10 | ) | (0.21 | ) | (0.05 | ) | 0.26 | ||||||||||||
| Portfolio turnover rate (%) |
31 | 31 | 21 | 33 | 26 | |||||||||||||||
| Net assets, end of period (in millions) |
$ | 1,153.2 | $ | 941.0 | $ | 1,503.7 | $ | 1,507.0 | $ | 1,427.4 | ||||||||||
| Class B | ||||||||||||||||||||
| Year Ended December 31, | ||||||||||||||||||||
| 2023 | 2022 | 2021 | 2020 | 2019 | ||||||||||||||||
| Net Asset Value, Beginning of Period |
$ | 13.42 | $ | 29.74 | $ | 27.96 | $ | 22.32 | $ | 20.25 | ||||||||||
|
|
|
|
|
|
|
|
|
|
|
|||||||||||
| Income (Loss) from Investment Operations |
| |||||||||||||||||||
| Net investment income (loss) (a) |
(0.04 | ) | (0.06 | ) | (0.14 | ) | (0.07 | ) | 0.00 | (b) | ||||||||||
| Net realized and unrealized gain (loss) |
6.27 | (11.74 | ) | 5.39 | 7.68 | 5.76 | ||||||||||||||
|
|
|
|
|
|
|
|
|
|
|
|||||||||||
| Total income (loss) from investment operations |
6.23 | (11.80 | ) | 5.25 | 7.61 | 5.76 | ||||||||||||||
|
|
|
|
|
|
|
|
|
|
|
|||||||||||
| Less Distributions |
| |||||||||||||||||||
| Distributions from net investment income |
0.00 | 0.00 | 0.00 | (0.00 | )(c) | (0.04 | ) | |||||||||||||
| Distributions from net realized capital gains |
0.00 | (4.52 | ) | (3.47 | ) | (1.97 | ) | (3.65 | ) | |||||||||||
| Distributions from return of capital |
0.00 | (0.00 | )(d) | 0.00 | 0.00 | 0.00 | ||||||||||||||
|
|
|
|
|
|
|
|
|
|
|
|||||||||||
| Total distributions |
0.00 | (4.52 | ) | (3.47 | ) | (1.97 | ) | (3.69 | ) | |||||||||||
|
|
|
|
|
|
|
|
|
|
|
|||||||||||
| Net Asset Value, End of Period |
$ | 19.65 | $ | 13.42 | $ | 29.74 | $ | 27.96 | $ | 22.32 | ||||||||||
|
|
|
|
|
|
|
|
|
|
|
|||||||||||
| Total Return (%) (e) |
46.42 | (h) | (40.67 | ) | 19.95 | 36.64 | 30.59 | |||||||||||||
| Ratios/Supplemental Data |
| |||||||||||||||||||
| Gross ratio of expenses to average net assets (%) |
0.88 | 0.87 | 0.87 | 0.88 | 0.88 | |||||||||||||||
| Net ratio of expenses to average net assets (%) (f) (g) |
0.79 | 0.80 | 0.79 | 0.80 | 0.80 | |||||||||||||||
| Ratio of net investment income (loss) to average net assets (%) |
(0.24 | ) | (0.35 | ) | (0.46 | ) | (0.30 | ) | 0.01 | |||||||||||
| Portfolio turnover rate (%) |
31 | 31 | 21 | 33 | 26 | |||||||||||||||
| Net assets, end of period (in millions) |
$ | 951.9 | $ | 757.9 | $ | 1,266.1 | $ | 1,175.6 | $ | 973.6 | ||||||||||
Please see following page for Financial Highlights footnote legend.
See accompanying notes to financial statements.
BHFTII-14
Brighthouse Funds Trust II
T. Rowe Price Large Cap Growth Portfolio
Financial Highlights
| Selected per share data | ||||||||||||||||||||
| Class E | ||||||||||||||||||||
| Year Ended December 31, | ||||||||||||||||||||
| 2023 | 2022 | 2021 | 2020 | 2019 | ||||||||||||||||
| Net Asset Value, Beginning of Period |
$ | 13.76 | $ | 30.29 | $ | 28.39 | $ | 22.63 | $ | 20.49 | ||||||||||
|
|
|
|
|
|
|
|
|
|
|
|||||||||||
| Income (Loss) from Investment Operations |
||||||||||||||||||||
| Net investment income (loss) (a) |
(0.02 | ) | (0.05 | ) | (0.11 | ) | (0.05 | ) | 0.02 | |||||||||||
| Net realized and unrealized gain (loss) |
6.44 | (11.96 | ) | 5.48 | 7.80 | 5.84 | ||||||||||||||
|
|
|
|
|
|
|
|
|
|
|
|||||||||||
| Total income (loss) from investment operations |
6.42 | (12.01 | ) | 5.37 | 7.75 | 5.86 | ||||||||||||||
|
|
|
|
|
|
|
|
|
|
|
|||||||||||
| Less Distributions |
||||||||||||||||||||
| Distributions from net investment income |
0.00 | 0.00 | 0.00 | (0.02 | ) | (0.07 | ) | |||||||||||||
| Distributions from net realized capital gains |
0.00 | (4.52 | ) | (3.47 | ) | (1.97 | ) | (3.65 | ) | |||||||||||
| Distributions from return of capital |
0.00 | (0.00 | )(d) | 0.00 | 0.00 | 0.00 | ||||||||||||||
|
|
|
|
|
|
|
|
|
|
|
|||||||||||
| Total distributions |
0.00 | (4.52 | ) | (3.47 | ) | (1.99 | ) | (3.72 | ) | |||||||||||
|
|
|
|
|
|
|
|
|
|
|
|||||||||||
| Net Asset Value, End of Period |
$ | 20.18 | $ | 13.76 | $ | 30.29 | $ | 28.39 | $ | 22.63 | ||||||||||
|
|
|
|
|
|
|
|
|
|
|
|||||||||||
| Total Return (%) (e) |
46.66 | (40.58 | ) | 20.08 | 36.79 | 30.70 | ||||||||||||||
| Ratios/Supplemental Data |
||||||||||||||||||||
| Gross ratio of expenses to average net assets (%) |
0.78 | 0.77 | 0.77 | 0.78 | 0.78 | |||||||||||||||
| Net ratio of expenses to average net assets (%) (f) (g) |
0.69 | 0.70 | 0.69 | 0.70 | 0.70 | |||||||||||||||
| Ratio of net investment income (loss) to average net assets (%) |
(0.14 | ) | (0.25 | ) | (0.36 | ) | (0.20 | ) | 0.11 | |||||||||||
| Portfolio turnover rate (%) |
31 | 31 | 21 | 33 | 26 | |||||||||||||||
| Net assets, end of period (in millions) |
$ | 34.3 | $ | 26.6 | $ | 53.4 | $ | 51.6 | $ | 42.0 | ||||||||||
| (a) | Per share amounts based on average shares outstanding during the period. | |
| (b) | Net investment income (loss) was less than $0.01. | |
| (c) | Distributions from net investment income were less than $0.01. | |
| (d) | Distributions from return of capital were less than $0.01. | |
| (e) | Total return does not reflect any insurance, sales, separate account or administrative charges of variable annuity or life insurance contracts or any additional expenses that contract owners may bear under their variable contracts. If these charges were included, the returns would be lower. | |
| (f) | The effect of the voluntary portion of the waiver on the net ratio of expenses to average net assets was 0.02% for the years ended December 31, 2023 and 2022 and 0.03% for each of the years ended December 31, 2021 through 2019 (see Note 5 of the Notes to Financial Statements). | |
| (g) | Includes the effects of management fee waivers (see Note 5 of the Notes to Financial Statements). | |
| (h) | Generally accepted accounting principles may require adjustments to be made to the net assets of the Portfolio at period end for financial reporting purposes, and as such, the net asset values for shareholder transactions and the returns based on those net asset values may differ from the returns reported in the portfolio manager commentary section of this report. |
See accompanying notes to financial statements.
BHFTII-15
Brighthouse Funds Trust II
T. Rowe Price Large Cap Growth Portfolio
Notes to Financial Statements—December 31, 2023
1. Organization
Brighthouse Funds Trust II (the “Trust”) is organized as a Delaware statutory trust and registered under the Investment Company Act of 1940, as amended (the “1940 Act”), as an open-end management investment company. The Trust, which is managed by Brighthouse Investment Advisers, LLC (“Brighthouse Investment Advisers” or the “Adviser”), currently offers twenty-nine series (the “Portfolios”), each of which operates as a distinct investment vehicle of the Trust.The series included in this report is T. Rowe Price Large Cap Growth Portfolio (the “Portfolio”), which is diversified.Shares of the Portfolio are not offered directly to the general public and are currently available only to separate accounts of insurance companies, including insurance companies affiliated with the Adviser (together, the “Insurance Companies”).
The Portfolio has registered and offers three classes of shares: Class A, B and E shares. Shares of each class of the Portfolio represent an equal pro rata interest in the Portfolio and generally give the shareholder the same voting, dividend, liquidation, and other rights. Investment income, realized and unrealized capital gains and losses, the common expenses of the Portfolio, and certain Portfolio-level expense reductions, if any, are allocated on a pro rata basis to each class based on the relative net assets of each class to the net assets of the Portfolio. Each class of shares differs in its respective distribution plan and such distribution expenses are allocated to the corresponding class of shares.
2. Significant Accounting Policies
The preparation of financial statements in conformity with accounting principles generally accepted in the United States of America (“GAAP”) requires management to make estimates and assumptions that affect the reported amounts of assets and liabilities and disclosure of contingent assets and liabilities as of the date of the financial statements and the reported amounts of income and expenses during the reporting period. Actual results could differ from those estimates. In the preparation of these financial statements, management has evaluated events and transactions subsequent to December 31, 2023 through the date the financial statements were issued.
The Portfolio is an investment company and follows the accounting and reporting guidance of the Financial Accounting Standards Board (“FASB”) Accounting Standards Codification Topic 946—Financial Services—Investment Companies. The following is a summary of significant accounting policies consistently followed by the Portfolio in the preparation of its financial statements.
Investment Valuation and Fair Value Measurements - The Portfolio values its investments for purposes of calculating its net asset value (“NAV”) using procedures that allow for a variety of methodologies to be used to value the Portfolio’s investments. The specific methodology used for an investment may vary based on the market data available for a specific investment at the time the Portfolio calculates its NAV or based on other considerations. The procedures also permit a level of judgment to be used in the valuation process.
Domestic and foreign equity securities, such as common stock, exchange-traded funds, rights, warrants, and preferred stock, that are traded on a securities exchange on a valuation date are generally valued at their last quoted sale price or official closing price on the primary exchange for such security, or, if no sales occurred on that day, at the last reported bid price. Equity securities traded over-the-counter (“OTC”) are generally valued at the last reported bid price. In the event of a major exchange closing during the trading day, the Adviser may use other market information obtained from quotation reporting systems, established market makers, or pricing services in valuing the securities. Valuation adjustments may be applied to certain foreign equity securities that are traded solely on foreign exchanges that close before the time as of which the Portfolio determines its NAV to account for the market movement between the close of the foreign exchanges and the time as of which the Portfolio determines its NAV. The Portfolio may use a systematic fair valuation model provided by a pricing service to value securities principally traded in these foreign markets to adjust for possible market movements or other changes that may occur between the close of the foreign exchanges and the time as of which the Portfolio determines its NAV. Foreign equity securities valued using these valuation adjustments are generally categorized as Level 2 within the fair value hierarchy. Equity securities that are actively traded, and have no valuation adjustments applied, are categorized as Level 1 within the fair value hierarchy. Other equity securities traded on inactive markets or valued in reference to similar instruments traded on active markets are generally categorized as Level 2 within the fair value hierarchy.
Investments in registered open-end management investment companies are valued at reported NAV per share on the valuation date and are categorized as Level 1 within the fair value hierarchy.
Debt securities, including corporate, convertible and municipal bonds and notes; obligations of the U.S. Treasury and U.S. government agencies; foreign sovereign issues; and non-U.S. bonds, are generally valued based upon evaluated or composite bid quotations obtained from third-party pricing services and/or brokers and dealers selected by the Adviser (each a “pricing service”). Such pricing services may use matrix pricing, which considers observable inputs including, among other things, issuer details, maturity dates, interest rates, yield curves, rates of prepayment, credit risks/spreads, default rates, reported trades, broker-dealer quotes and quoted prices for similar assets. Short-term obligations with a remaining maturity of sixty days or less may be valued at amortized cost in the absence of market quotes, so long as the amortized cost value of such short-term debt instrument is approximately the same as the fair
BHFTII-16
Brighthouse Funds Trust II
T. Rowe Price Large Cap Growth Portfolio
Notes to Financial Statements—December 31, 2023—(Continued)
value of the instrument as determined without the use of amortized cost valuation. Floating rate loans are generally valued based upon an evaluated or composite average of aggregate bid and ask quotations supplied by brokers or dealers, as obtained from the pricing service. Securities that use similar valuation techniques and inputs as described above are generally categorized as Level 2 within the fair value hierarchy.
Options, whether on securities, indices, futures contracts, or otherwise, traded on exchanges are valued at the last sale price available as of the close of business on a valuation day or, if there is no such price available, at the last reported bid price. These types of options are categorized as Level 1 within the fair value hierarchy. Futures contracts that are traded on commodity exchanges are valued at their settlement prices established by the exchanges on which they are traded as of the close of such exchanges and are categorized as Level 1 within the fair value hierarchy.
If no current market quotation is readily available or market value quotations are deemed to be unreliable for an investment, the fair value of the investment will be determined in accordance with procedures. A market quotation is readily available only when that quotation is a quoted price (unadjusted) in active markets for identical investments that the Portfolio can access at the measurement date, provided that a quotation will not be readily available if it is not reliable.
Pursuant to Rule 2a-5 under the 1940 Act, the Board of Trustees (the “Board” or “Trustees”) of the Trust has designated Brighthouse Investment Advisers, acting through its Valuation Committee (“Committee”), as the Portfolio’s “valuation designee” to perform the Portfolio’s fair value determinations. The Board oversees Brighthouse Investment Advisers in its role as the Valuation Designee and receives reports from Brighthouse Investment Advisers regarding its process and the valuation of the Portfolio’s investments to assist with such oversight.
No single standard for determining the fair value of an investment can be set forth because fair value depends upon the facts and circumstances with respect to each investment. Information relating to any relevant factors may be obtained by the Committee from any appropriate source, including the subadviser of the Portfolio, the Custodian, a pricing service, market maker and/or broker for such security or the issuer. Appropriate methodologies for determining fair value under particular circumstances may include: matrix pricing, a discounted cash flow analysis, comparisons of securities with comparable characteristics, value based on multiples of earnings, discount from market price of similar marketable securities, or a combination of these and other methods.
Foreign Currency Translation - The books and records of the Portfolio are maintained in U.S. dollars. The values of securities, currencies, and other assets and liabilities denominated in currencies other than the U.S. dollar are translated into U.S. dollars based upon foreign exchange rates prevailing at the end of the period. Purchases and sales of investment securities, income, and expenses are translated on the respective dates of such transactions. Because the values of investment securities are translated at the foreign exchange rates prevailing at the end of the period, that portion of the results of operations arising from changes in exchange rates and that portion of the results of operations reflecting fluctuations arising from changes in market prices of the investment securities are not separated. Such fluctuations are included in the net realized and unrealized gain or loss on investments.
Net realized foreign exchange gains or losses arise from activity in forward foreign currency exchange contracts, sales of foreign currency, currency gains or losses realized between the trade and settlement dates on securities transactions, and the difference between the amounts of dividends, interest, and foreign withholding taxes recorded by the Portfolio and the U.S. dollar-equivalent of the amounts actually received or paid by the Portfolio. Net unrealized foreign exchange gains and losses arise from changes in the value of assets and liabilities, other than investment securities, resulting from changes in foreign exchange rates.
Investment Transactions and Related Investment Income - Portfolio security transactions are recorded on the trade date. Dividend income is recorded on the ex-dividend date or, for certain foreign securities, when notified. Interest income, which includes amortization of premium and accretion of discount on debt securities, is recorded on the accrual basis. Realized gains and losses on investments are determined on the identified cost basis, which is the same basis used for federal income tax purposes. Foreign income and foreign capital gains on some foreign securities may be subject to foreign taxes, which are accrued as applicable. These foreign taxes have been provided for in accordance with the Portfolio’s understanding of the applicable countries’ tax rules and rates.
Dividends and Distributions to Shareholders - The Portfolio records dividends and distributions on the ex-dividend date. Net realized gains from securities transactions (if any) are generally distributed annually to shareholders. The timing and characterization of certain income and capital gains distributions are determined in accordance with federal tax regulations that may differ from GAAP. Permanent book and tax basis differences relating to shareholder distributions will result in reclassification between distributable earnings (accumulated losses) and paid in surplus. Book tax differences are primarily due to net operating losses. These adjustments have no impact on net assets or the results of operations.
Income Taxes - It is the Portfolio’s policy to comply with the requirements of the Internal Revenue Code of 1986, as amended, and regulations thereunder, applicable to regulated investment companies, and to distribute, with respect to each taxable year, all of its taxable income to shareholders. Therefore, no federal income tax provision is required. The Portfolio files U.S. federal tax returns. No income tax returns are currently under examination. The Portfolio’s federal tax returns remain subject to examination by the Internal
Revenue Service for three fiscal years after the returns are filed. As of December 31, 2023, the Portfolio had no uncertain tax positions that would require financial statement recognition, derecognition or disclosure.
BHFTII-17
Brighthouse Funds Trust II
T. Rowe Price Large Cap Growth Portfolio
Notes to Financial Statements—December 31, 2023—(Continued)
Repurchase Agreements - The Portfolio may enter into repurchase agreements, under the terms of a Master Repurchase Agreement (“MRA”), or Global Master Repurchase Agreement (“GMRA”), with selected commercial banks and broker-dealers, under which the Portfolio acquires securities as collateral and agrees to resell the securities at an agreed-upon time and at an agreed-upon price. The Portfolio, through the Custodian or a subcustodian, under a tri-party repurchase agreement, receives delivery of the underlying securities collateralizing any repurchase agreements. It is the Portfolio’s policy that the market value of the collateral be equal to at least 100% of the repurchase price in the case of a repurchase agreement of one-day duration and equal to at least 102% of the repurchase price in the case of all other repurchase agreements. In the event of default or failure by a party to perform an obligation in connection with any repurchase transaction, the MRA or GMRA gives the non-defaulting party the right to set-off claims and to apply property held by it in connection with any repurchase transaction against obligations owed to it under the agreement.
At December 31, 2023, the Portfolio invested cash collateral for loans of portfolio securities in repurchase agreements with a gross value of $76,314,899, which is included as part of investments at value on the Statement of Assets and Liabilities. The value of the related collateral exceeded the value of the repurchase agreements at December 31, 2023.
Securities Lending - The Portfolio may lend its portfolio securities to certain qualified brokers who borrow securities in order to complete certain securities transactions. By lending its portfolio securities, the Portfolio attempts to increase its net investment income through the receipt of income on collateral held from securities on loan. Any gain or loss in the market price of the loaned securities that might occur, any interest earned, and any dividends declared during the term of the loan, would accrue to the account of the Portfolio.
The Trust has entered into a Non-Custodial Securities Lending Agreement with JPMorgan Chase Bank, N.A. (the “Lending Agent”). Under the agreement, the Lending Agent is authorized to loan portfolio securities on the Portfolio’s behalf. In exchange, the Portfolio generally receives cash, U.S. Government securities, letters of credit, or other collateral deemed appropriate by the Adviser. The Portfolio receives collateral equal to at least 102% of the market value for loans secured by government securities or cash in the same currency as the loaned shares and 105% for all other loaned securities at each loan’s inception. Collateral representing at least 100% of the market value of the loaned securities is maintained for the duration of the loan. Any cash collateral received by the Portfolio is generally invested by the Lending Agent in short-term investments, which may include certificates of deposit, commercial paper, repurchase agreements, including repurchase agreements with respect to equity securities, time deposits, master demand notes and money market funds. The market value of investments made with cash collateral received are disclosed in the Schedule of Investments and the valuation techniques are described in Note 2. The value of the securities on loan may change each business day. If the market value of the collateral at the close of trading on a business day is less than 100% of the market value of the loaned securities at the close of trading on that day, the borrower is required to deliver, by the close of business on the following business day, an additional amount of collateral, so that the total amount of posted collateral is equal to at least 100% of the market value of all the loaned securities as of such preceding day. A portion of the income earned on the collateral is rebated to the borrower of the securities and the remainder is split between the Lending Agent and the Portfolio. On loans collateralized by U.S. government securities, a fee is received from the borrower and is allocated between the Portfolio and the Lending Agent.
Income received by the Portfolio in securities lending transactions during the year ended December 31, 2023 is reflected as securities lending income on the Statement of Operations. The values of any securities loaned by the Portfolio and the related collateral at December 31, 2023 are disclosed in the footnotes to the Schedule of Investments. The value of the related collateral received by the Portfolio exceeded the value of the securities out on loan at December 31, 2023.
The risks associated with lending portfolio securities include, but are not limited to, possible delays in receiving additional collateral or in the recovery of the loaned securities, possible loss of rights in the collateral should the borrower fail financially, as well as risk of loss in the value of the collateral or the value of the investments made with the collateral. To the extent the Portfolio uses cash collateral it receives to invest in repurchase agreements with respect to equity securities, it is subject to the risk of loss if the value of the equity securities declines and the counterparty defaults on its obligation to repurchase such securities. The Lending Agent shall indemnify the Portfolio in the case of default of any securities borrower, subject to the terms of the Non-Custodial Securities Lending Agreement.
All securities on loan are classified as Common Stocks in the Portfolio’s Schedule of Investments as of December 31, 2023. For all securities on loan, the remaining contractual maturity of the agreements is overnight and continuous.
3. Certain Risks
In the normal course of business, the Portfolio invests in securities and enters into transactions where risks exist. Those risks include:
Market Risk: The value of securities held by the Portfolio may decline in response to certain events, including those directly involving the issuers whose securities are owned by the Portfolio; conditions affecting the general economy; overall market changes; local, regional or global political, social or economic instability; currency, interest rate, and price fluctuations, or other factors including terrorism, war, natural disasters and the spread of infectious illness including epidemics or pandemics such as the COVID-19 pandemic. These events may also adversely affect the liquidity of securities held by the Portfolio.
BHFTII-18
Brighthouse Funds Trust II
T. Rowe Price Large Cap Growth Portfolio
Notes to Financial Statements—December 31, 2023—(Continued)
Credit and Counterparty Risk: The Portfolio may be exposed to counterparty risk, or the risk that an entity with which the Portfolio has unsettled or open transactions may default. The potential loss could exceed the value of the financial assets and liabilities recorded in the financial statements. Financial assets that potentially expose the Portfolio to credit and counterparty risk consist principally of cash due from counterparties and investments. The Portfolio manages counterparty risk by entering into agreements only with counterparties that it believes have the financial resources to honor their obligations and by monitoring the financial stability of those counterparties. The Subadviser may attempt to mitigate counterparty risk by (i) periodically assessing the creditworthiness of its trading partners, (ii) monitoring and/or limiting the amount of its net exposure to each individual counterparty based on its assessment, and (iii) requiring collateral from the counterparty for certain transactions. In order to preserve certain safeguards for non-standard settlement trades, the Portfolio restricts its exposure to credit and counterparty losses by entering into master netting agreements (“Master Agreements”) with counterparties (approved brokers) with whom it undertakes a significant volume of transactions. Master Agreements govern the terms of certain transactions and reduce the counterparty risk associated with relevant transactions by specifying credit protection mechanisms and providing standardization that improves legal certainty. Master Agreements can also help limit counterparty risk by specifying collateral posting arrangements at pre-arranged exposure levels.
Repurchase and reverse repurchase agreements are primarily executed under GMRAs or MRAs, which provide the right to set-off. Each repurchase and reverse repurchase agreement is initially collateralized at the transaction level. In the event of default, the total market value exposure will be offset against collateral exchanged to date, which would result in a net receivable/(payable) that would be due from/to the counterparty.
Additional risks associated with each type of investment are described above within the respective security type notes. The Portfolio’s prospectus includes a discussion of the principal risks of investing in the Portfolio.
4. Investment Transactions
Aggregate cost of purchases and proceeds of sales of investment securities, excluding short-term securities, for the year ended December 31, 2023 were as follows:
| Purchases |
Sales | |||||||
| U.S. Government |
Non-U.S. Government | U.S. Government | Non-U.S. Government | |||||
| $ 0 | $ 613,739,377 | $ | 0 | $ 892,235,084 | ||||
The Portfolio engaged in security transactions with other accounts managed by T. Rowe Price Associates, Inc., the subadviser to the Portfolio, that amounted to $1,472,918 in purchases of investments, which are included above.
5. Investment Management Fees and Other Transactions with Affiliates
Investment Management Agreement - Brighthouse Investment Advisers is the investment adviser to the Portfolio. The Trust has entered into an investment management agreement with Brighthouse Investment Advisers with respect to the Portfolio. For providing investment management services to the Portfolio, Brighthouse Investment Advisers receives monthly compensation at the following annual rates:
| Management Fees earned by Brighthouse Investment Advisers for the year ended December 31, 2023 |
% per annum | Average Daily Net Assets | ||||
| $12,123,508 | 0.650 | % | Of the first $50 million | |||
| 0.600 | % | On amounts in excess of $50 million | ||||
Brighthouse Investment Advisers has entered into an investment subadvisory agreement with respect to managing the Portfolio. T. Rowe Price Associates, Inc. (“T. Rowe Price”) is compensated by Brighthouse Investment Advisers to provide subadvisory services for the Portfolio.
Management Fee Waivers - Pursuant to a management fee waiver agreement, the Adviser has agreed for the period May 1, 2023 to April 30, 2024, to reduce its advisory fees set out above under “Investment Management Agreement” for each class of the Portfolio as follows:
If the Portfolio’s average daily net assets are between $1 billion to $2 billion.
| % per annum reduction |
Average Daily Net Assets | |
| 0.080% | On the first $50 million | |
| 0.050% | Of the next $50 million | |
| 0.060% | Of the next $900 million | |
| 0.045% | Of the next $500 million | |
| 0.060% | On amounts in excess of $1.5 billion |
BHFTII-19
Brighthouse Funds Trust II
T. Rowe Price Large Cap Growth Portfolio
Notes to Financial Statements—December 31, 2023—(Continued)
If the Portfolio’s average daily net assets are between $2 billion to $3 billion.
| % per annum reduction |
Average Daily Net Assets | |
| 0.090% | On the first $50 million | |
| 0.060% | Of the next $50 million | |
| 0.070% | Of the next $900 million | |
| 0.045% | Of the next $500 million | |
| 0.060% | On amounts in excess of $1.5 billion |
An identical expense agreement was in place for the period April 1, 2023 to April 30, 2023.
For the period April 29, 2022 to March 31, 2023, the Adviser had agreed to reduce its advisory fees set out above under “Investment Management Agreement” for each class of the Portfolio as follows provided the Portfolio’s average daily net assets exceeded $1 billion.
| % per annum reduction |
Average Daily Net Assets | |
| 0.080% | On the first $50 million | |
| 0.050% | Of the next $50 million | |
| 0.060% | Of the next $900 million | |
| 0.035% | Of the next $500 million | |
| 0.050% | Of the next $1.5 billion | |
| 0.075% | On amounts in excess of $3 billion |
Amounts waived for the year ended December 31, 2023 amounted to $1,174,593 and are included in the total amount shown as management fee waivers in the Statement of Operations.
With respect to the Portfolio, T. Rowe Price will provide the Adviser a transitional fee credit to eliminate any discontinuity between the tiered subadvisory fee schedule and the flat fee schedule that takes effect once assets exceed certain fee breakpoint levels. During the year ended December 31, 2023, credits received amounted to $8,438 and are included in the total amount shown as management fee waivers in the Statement of Operations.
T. Rowe Price agreed to a voluntary subadvisory fee waiver that applies if (i) assets under management by T. Rowe Price for the Trust and Brighthouse Funds Trust I (“BHFTI), an affiliate of the Trust, in the aggregate, exceed $750 million, (ii) T. Rowe Price subadvises three or more portfolios of the Trust and BHFTI in the aggregate, and (iii) at least one of those portfolios is a large cap domestic equity portfolio.
If the aforementioned conditions are met, T. Rowe Price will waive its subadvisory fee paid by Brighthouse Investment Advisers by 5% for combined Trust and BHFTI average daily net assets over $750 million, 7.5% for the next $1.5 billion of combined assets, and 10% for amounts over $3 billion. Brighthouse Investment Advisers has voluntarily agreed to reduce its advisory fee for the Portfolio by the amount waived (if any) by T. Rowe Price for the Portfolio pursuant to this voluntary subadvisory fee waiver. Because these fee waivers are voluntary, and not contractual, they may be discontinued by T. Rowe Price and Brighthouse Investment Advisers at any time. Amounts voluntarily waived by Brighthouse Investment Advisers for the year ended December 31, 2023 amounted to $464,802 and are included in the total amount shown as management fee waivers in the Statement of Operations.
Certain officers and trustees of the Trust may also be officers of Brighthouse Investment Advisers however, such officers and trustees receive no compensation from the Trust.
Transfer Agency Agreement - Brighthouse Life Insurance Company serves as the transfer agent for the Trust. Brighthouse Life Insurance Company receives no fees for its services to the Trust.
Distribution and Service Fees - The Trust has a distribution agreement with Brighthouse Securities, LLC (the “Distributor”) pursuant to which the Distributor serves as the general distributor of shares of each class (each a “Class”) of each Portfolio. The Distributor is an affiliate of the Trust. The Trust has adopted a Distribution and Services Plan (the “D&S Plan”) relating to Class B, Class D, Class E, Class F and Class G shares of each Portfolio, under Rule 12b-1 under the 1940 Act, pursuant to which the Trust may pay the Distributor a fee (the “Service Fee”) at an annual rate not to exceed 0.25% of each such Portfolio’s average daily net assets attributable to the Class B, Class D, Class E, Class F and Class G shares of the Trust. Each Portfolio may not offer shares of each Class. The D&S Plan also authorizes the Trust, on behalf of each of its Portfolios, to pay to the Distributor a distribution fee (the “Distribution Fee” and together with the Service Fee, the “Fees”) at an annual rate of up to 0.25% of each Portfolio’s average daily net assets attributable to the Class B, Class D, Class E, Class F, and Class G shares in consideration of the services rendered in connection with the sale of such shares by the Distributor. Under the Distribution Agreement with respect to the Trust, Fees are currently paid at an annual rate of 0.25% of average daily net assets in the case of Class B shares, 0.10% of average daily net assets in the case of Class D shares, 0.15% of average daily net assets in the case of Class E shares, 0.20% of average daily net assets in the case of Class F shares and 0.30% of average daily net assets in the case of Class G shares. The D&S Plan is known as a “compensation plan” because the Trust makes payments to the Distributor for services rendered regardless of the actual level of expenditures by the Distributor. Amounts incurred by the Portfolio for the year ended December 31, 2023 are shown as Distribution and service fees in the Statement of Operations.
BHFTII-20
Brighthouse Funds Trust II
T. Rowe Price Large Cap Growth Portfolio
Notes to Financial Statements—December 31, 2023—(Continued)
Deferred Trustee Compensation - Each Trustee who is not currently an employee of the Adviser or any of its affiliates receives compensation from the Trust for his or her service to the Trust. A deferred compensation plan (the “Plan”) is available to the Trustees on a voluntary basis. Deferred amounts remain in the Trust until distributed in accordance with the provisions of the Plan. The value of a participating Trustee’s deferral account is based on theoretical investments of deferred amounts on the normal payment dates in certain portfolios of the Trust or Brighthouse Funds Trust I, an affiliate of the Trust, as designated by the participating Trustee. Changes in the value of participants’ deferral accounts are reflected as a component of Trustees’ fees and expenses in the Statement of Operations. The portion of the accrued obligations allocated to the Portfolio under the Plan is reflected as Deferred trustees’ fees in the Statement of Assets and Liabilities.
6. Transactions in Securities of Affiliated Issuers
A summary of the Portfolio’s transactions in the securities of affiliated issuers during the year ended December 31, 2023 is as follows:
| Security Description |
Market Value December 31, 2022 |
Purchases | Sales | Ending Value as of December 31, 2023 |
Income earned from affiliates during the period |
Number of shares held December 31, 2023 |
||||||||||||||||||
| T. Rowe Price Government Reserve Fund |
$ | 80,378,630 | $ | 306,484,386 | $ | (379,006,942 | ) | $ | 7,856,074 | $ | 440,803 | 7,856,074 | ||||||||||||
7. Contractual Obligations
Under the Trust’s organizational documents, its officers and Trustees may be indemnified against certain liabilities and expenses arising out of the performance of their duties to the Trust. Additionally, the Trust has a variety of indemnification obligations under contracts with its service providers. The Trust’s maximum exposure under these arrangements is unknown, as this would involve future claims that may be made against the Trust that have not yet occurred.
8. Income Tax Information
The cost basis of investments for federal income tax purposes at December 31, 2023 was as follows:
| Cost basis of investments |
$ | 1,415,502,429 | ||
|
|
|
|||
| Gross unrealized appreciation |
875,088,850 | |||
| Gross unrealized (depreciation) |
(34,901,350 | ) | ||
|
|
|
|||
| Net unrealized appreciation (depreciation) |
$ | 840,187,500 | ||
|
|
|
The tax character of distributions paid for the years ended December 31, 2023 and 2022 were as follows:
| Ordinary Income |
Long-Term Capital Gain | Return of Capital | Total | |||||||||||||||||||||||||
| 2023 |
2022 | 2023 | 2022 | 2023 | 2022 | 2023 | 2022 | |||||||||||||||||||||
| $— | $ | 43,467,423 | $ | — | $ | 394,091,153 | $ | — | $ | 500,643 | $ | — | $ | 438,059,219 | ||||||||||||||
As of December 31, 2023, the components of distributable earnings (accumulated losses) on a federal income tax basis were as follows:
| Undistributed |
Undistributed Long-Term Capital Gain |
Net Unrealized Appreciation (Depreciation) |
Accumulated Capital Losses |
Total | ||||||||||||
| $— | $ | 128,725,020 | $ | 840,187,870 | $ | — | $ | 968,912,890 | ||||||||
The Portfolio utilizes the provisions of the federal income tax laws that provide for the carryforward of capital losses for prior years, offsetting such losses against any future realized capital gains. Net capital losses may be carried forward indefinitely and their character is retained as short-term and/or long-term losses.
As of December 31, 2023, the Portfolio had no accumulated capital losses.
During the year ended December 31, 2023, the Portfolio utilized accumulated short-term capital losses of $63,510,258.
9. Recent Accounting Pronouncement & Regulatory Updates
In June 2022, FASB issued Accounting Standards Update 2022-03—Fair Value Measurement (Topic 820)—Fair Value Measurement of Equity Securities Subject to Contractual Sale Restrictions (“ASU 2022-03”). ASU 2022-03 clarifies the guidance in Topic 820 to indicate that a contractual sale restriction should not be considered in the fair value of an equity security subject to such a restriction, and
BHFTII-21
Brighthouse Funds Trust II
T. Rowe Price Large Cap Growth Portfolio
Notes to Financial Statements—December 31, 2023—(Continued)
requires entities with investments in equity securities subject to contractual sale restrictions to disclose certain qualitative and quantitative information about such securities. ASU 2022-03 is effective for fiscal years, and interim periods within those fiscal years, beginning after December 15, 2023. ASU 2022-03 is only applicable to an equity security in which the contractual arrangement that restricts its sale is executed or modified on or after the adoption date.
Effective January 24, 2023, the Securities and Exchange Commission adopted rule and form amendments that require open-end management investment companies to transmit concise and visually engaging annual and semiannual reports to shareholders that highlight certain information deemed by the SEC to be particularly important for investors. Certain other information, including financial statements, will no longer appear in shareholder reports but will, as required, be available online, delivered free of charge upon request, and filed on a semiannual basis on Form N-CSR. The rule and form amendments have a compliance date of July 24, 2024. Accordingly, the rule and form amendments will not impact the Portfolio until its 2024 semiannual shareholder report.
BHFTII-22
Brighthouse Funds Trust II
T. Rowe Price Large Cap Growth Portfolio
Report of Independent Registered Public Accounting Firm
To the Board of Trustees of Brighthouse Funds Trust II and Shareholders of the T. Rowe Price Large Cap Growth Portfolio:
Opinion on the Financial Statements and Financial Highlights
We have audited the accompanying statement of assets and liabilities, including the schedule of investments, of the T. Rowe Price Large Cap Growth Portfolio (the “Fund”) (one of the funds constituting the Brighthouse Funds Trust II), as of December 31, 2023, the related statement of operations for the year then ended, the statements of changes in net assets for each of the two years in the period then ended, the financial highlights for each of the five years in the period then ended, and the related notes. In our opinion, the financial statements and financial highlights present fairly, in all material respects, the financial position of the Fund as of December 31, 2023, and the results of its operations for the year then ended, the changes in its net assets for each of the two years in the period then ended, and the financial highlights for each of the five years in the period then ended in conformity with accounting principles generally accepted in the United States of America.
Basis for Opinion
These financial statements and financial highlights are the responsibility of the Fund’s management. Our responsibility is to express an opinion on the Fund’s financial statements and financial highlights based on our audits. We are a public accounting firm registered with the Public Company Accounting Oversight Board (United States) (PCAOB) and are required to be independent with respect to the Fund in accordance with the U.S. federal securities laws and the applicable rules and regulations of the Securities and Exchange Commission and the PCAOB.
We conducted our audits in accordance with the standards of the PCAOB. Those standards require that we plan and perform the audit to obtain reasonable assurance about whether the financial statements and financial highlights are free of material misstatement, whether due to error or fraud. The Fund is not required to have, nor were we engaged to perform, an audit of its internal control over financial reporting. As part of our audits we are required to obtain an understanding of internal control over financial reporting but not for the purpose of expressing an opinion on the effectiveness of the Fund’s internal control over financial reporting. Accordingly, we express no such opinion.
Our audits included performing procedures to assess the risks of material misstatement of the financial statements and financial highlights, whether due to error or fraud, and performing procedures that respond to those risks. Such procedures included examining, on a test basis, evidence regarding the amounts and disclosures in the financial statements and financial highlights. Our audits also included evaluating the accounting principles used and significant estimates made by management, as well as evaluating the overall presentation of the financial statements and financial highlights. Our procedures included confirmation of securities owned as of December 31, 2023, by correspondence with the custodian and brokers; when replies were not received from brokers, we performed other auditing procedures. We believe that our audits provide a reasonable basis for our opinion.
/s/ Deloitte & Touche LLP
Boston, Massachusetts
February 23, 2024
We have served as the auditor of one or more Brighthouse investment companies since 1983.
BHFTII-23
Brighthouse Funds Trust II
Trustees and Officers
MANAGEMENT OF THE TRUSTS
The Boards of Trustees (the “Board”) of Brighthouse Funds Trust I and Brighthouse Funds Trust II (“Trust I” and “Trust II”, respectively, and collectively the “Trusts”) supervise the Trusts and are responsible for representing the interests of shareholders. The Trustees, the Chairman of the Board and the Chairmen of each subcommittee are the same for both Trusts. The Trustees of each Trust meet periodically throughout the year to oversee the Portfolios’ activities, reviewing, among other things, each Portfolio’s performance and its contractual arrangements with various service providers. The Trustees of each Trust elect the officers of the Trust, who are responsible for administering the Trust’s day-to-day operations.
Trustees and Officers
The Trustees and executive officers of the Trusts, as well as their ages and their principal occupations during the past five years, are set forth below. Unless otherwise indicated, the business address of each is c/o Brighthouse Funds Trust I and Brighthouse Funds Trust II, 11225 N. Community House Rd., Charolette, North Carolina 28277. Each Trustee who is deemed an “interested person,” as such term is defined in the 1940 Act, is referred to as an “Interested Trustee.” Those Trustees who are not “interested persons,” as such term is defined in the 1940 Act, are referred to as “Independent Trustees.” There is no limit to the term a Trustee may serve, other than pursuant to the retirement policy adopted by the Independent Trustees. Trustees serve until their death, resignation, retirement or removal in accordance with Trust I’s and Trust II’s respective organizational documents and policies adopted by the Board of the Trust from time to time. Officers hold office at the pleasure of each Board and serve until their removal or resignation in accordance with the Trusts’ respective organizational documents and policies adopted by the Board of each Trust from time to time.
Trustees of the Trusts
| Name and Year of Birth |
Position(s) |
Term of Office |
Principal Occupation(s) During the Past |
Number of |
Other Directorships Held | |||||
| Interested Trustee | ||||||||||
| John Rosenthal* (1960) |
Trustee | Indefinite; From May 2016 (Trust I and Trust II) to present | Chief Investment Officer, Brighthouse Financial, Inc. (2016 to present). | 73 | None | |||||
| Independent Trustees | ||||||||||
| Dawn M. Vroegop (1966) |
Trustee and Chair of the Board | Indefinite; From December 2000 (Trust I)/May 2009 (Trust II) to present as Trustee; From May 2016 (Trust I and Trust II) until present as Chair | Retired; Private Investor. | 73 | Trustee, Driehaus Mutual Funds (8 portfolios).** | |||||
| Stephen M. Alderman (1959) |
Trustee | Indefinite; From December 2000 (Trust I)/April 2012 (Trust II) to present | Vice President and General Counsel, IHR Aerial Solutions, LLC; Until 2022, General Counsel, Illini Hi-Reach, Inc.; Until 2020, Shareholder in the law firm of Garfield & Merel, Ltd. | 73 | None | |||||
| Robert J. Boulware (1956) |
Trustee | Indefinite; From March 2008 (Trust I)/April 2012 (Trust II) to present | Managing Member, Pilgrim Funds, LLC (private equity fund). | 73 | Trustee, Vertical Capital Income Fund (closed-end fund);** Trustee, The Private Shares Fund (closed- end fund);** Until 2021, Director, Mid- Con Energy Partners, LP (energy);** Until 2020, Director, Gainsco, Inc. (auto insurance).** | |||||
BHFTII-24
Brighthouse Funds Trust II
Trustees and Officers—(Continued)
| Name and Year of Birth |
Position(s) |
Term of Office |
Principal Occupation(s) During the Past |
Number of |
Other Directorships Held | |||||
| Susan C. Gause (1952) |
Trustee | Indefinite; From March 2008 (Trust I)/April 2012 (Trust II) to present | Private Investor. | 73 | Trustee, HSBC Funds (4 portfolios).** | |||||
| Nancy Hawthorne (1951) |
Trustee | Indefinite; From May 2003 (Trust II)/April 2012 (Trust I) to present | Private Investor. | 73 | Trustee, First Eagle Credit Opportunities Fund;** Trustee and Chair of the Board of Trustees, First Eagle Global Opportunities Fund;** Director, Avid Technology, Inc;** Director, CRA International, Inc.** | |||||
Executive Officers of the Trusts
| Name and Year of Birth |
Position(s) Held |
Term of Office |
Principal Occupation(s) | |||
| Kristi Slavin (1973) | President and Chief Executive Officer, of Trust I and Trust II | From May 2016 (Trust I and Trust II) to present |
President, Brighthouse Investment Advisers, LLC (2016-present). | |||
| Alan R. Otis (1971) | Chief Financial Officer and Treasurer, of Trust I and Trust II | From November 2017 (Trust I and Trust II) to present |
Executive Vice President, Brighthouse Investment Advisers, LLC (2017-present); formerly, Vice President, Brighthouse Investment Advisers, LLC (2012-2017); Assistant Treasurer, Trust I and Trust II (2012-2017). | |||
| Thomas Watterson (1985) | Secretary, of Trust I and Trust II | From November 2023 (Trust I and Trust II) to present |
Executive Vice President, Chief Legal Officer and Secretary, Brighthouse Investment Advisers, LLC (2023-Present); Managing Corporate Counsel, Brighthouse Financial Inc. (2023-present); Managing Counsel and Director, The Bank of New York Mellon Corporation (2019-2023); Counsel and Vice President, The Bank of New York Mellon Corporation (2016-2019). | |||
| Katie Hellmann (1980) | Chief Compliance Officer (“CCO”), of Trust I and Trust II | From May 2023 (Trust I and Trust II) to present |
Chief Compliance Officer, Brighthouse Investment Advisers, LLC (2023-present) and Head of Funds and Investments Compliance (2023-present). Deputy Chief Compliance Officer, Transamerica Asset Management (2022-2023). Leader and Senior Compliance Counsel-Funds Compliance, Edward Jones (2017-2022). | |||
| Rosemary Morgan (1983) | Anti-Money Laundering Officer, of Trust I and Trust II | From May 2023 (Trust I and Trust II) to present |
Chief Privacy Officer, Leader of Compliance Programs and Assistant General Counsel, Brighthouse Financial, Inc. (2019-2022); Chief Privacy Officer, Head of Compliance Programs & Contracts Law, Brighthouse Financial, Inc. (2022-2023), Chief Compliance Officer and Associate General Counsel, Brighthouse Financial, Inc. (2023-present); Vice President and Chief Compliance Officer, Brighthouse Life Insurance Company (2023-present); Vice President and Chief Compliance Officer (2023-present), Brighthouse Life Insurance Company of NY; Vice President and Chief Compliance Officer (2023-present), New England Life Insurance Company. | |||
| Anna Koska (1981) | Vice President, of Trust I and Trust II | From June 2022 (Trust I and Trust II) to present |
Vice President, Investment and Advisory Services, Brighthouse Investment Advisers, LLC (2022-present); Director of Investment and Advisory Services, Brighthouse Investment Advisers, LLC (2019-2022); Senior Portfolio Analyst, Brighthouse Investment Advisers, LLC (2017-2019). | |||
| * | Mr. Rosenthal is an “interested person” of the Trusts because of his position with Brighthouse Financial, Inc. (“Brighthouse Financial”), an affiliate of BIA. |
| ** | Indicates a directorship with a registered investment company or a company subject to the reporting requirements of the Securities Exchange Act of 1934, as amended. |
| (1) | Previous positions during the past five years with the Trusts, MetLife, Inc. or the Adviser are omitted if not materially different. |
| (2) | The Fund Complex includes 44 Trust I Portfolios and 29 Trust II Portfolios. |
BHFTII-25
Brighthouse Funds Trust II
T. Rowe Price Large Cap Growth Portfolio
Board of Trustees’ Consideration of Advisory and Sub-Advisory Agreements
At a meeting held on November 13-14, 2023 (the “November Meeting”), the Boards of Trustees (the “Board”) of Brighthouse Funds Trust I and Brighthouse Funds Trust II (“BFT I” and “BFT II,” respectively, and collectively, the “Trusts”), including a majority of the Trustees who are not “interested persons” of the Trusts (the “Independent Trustees”) under the Investment Company Act of 1940 (the “1940 Act”), approved the continuation of the Trusts’ advisory agreements (each an “Advisory Agreement”) with Brighthouse Investment Advisers, LLC (the “Adviser”) and the applicable sub-advisory and sub-sub-advisory agreements (each a “Sub-Advisory Agreement” and collectively with the Advisory Agreement, the “Agreements”) between the Adviser and the investment sub-advisers and sub-sub-adviser (each a “Sub-Adviser,” and collectively, the “Sub-Advisers”) for the series of the Trusts (each a “Portfolio,” and collectively, the “Portfolios”) for the annual contract renewal period from January 1, 2024 through December 31, 2024.
The Board met with personnel of the Adviser on September 28-29, 2023 (the “September Meeting”) for the specific purpose of giving preliminary consideration to the proposed continuation of the Agreements, including consideration to information that the Adviser and Sub-Advisers had provided for the Board’s review at the request of the Independent Trustees. At the September Meeting, the Adviser reviewed with the Board the performance and fees experienced by each Portfolio, as well as other information. During and after the September Meeting, the Independent Trustees requested additional information and clarifications that the Adviser addressed at the November Meeting (the September Meeting and the November Meeting are referred to collectively as, the “Meetings”). During the contract renewal process, and throughout the year, the Independent Trustees were advised by independent legal counsel, and they met with independent legal counsel in executive sessions outside of the presence of management on a number of occasions to discuss, among other things, the renewal of the Agreements.
In considering the continuation of the Agreements, the Board reviewed a variety of materials that were provided for the specific purpose of assisting the Board in the renewal process, along with various information and materials that were provided to and discussed with the Board throughout the year, at regularly scheduled meetings of the Board and its committees. In particular, information for each Portfolio included, but was not limited to, reports on investment performance, expenses, legal and compliance matters, and asset pricing. Information about the Adviser and each Sub-Adviser included, but was not limited to, reports on the business, operations, and performance of the Adviser and the Sub-Advisers and reports that the Adviser and Sub-Advisers had prepared specifically for the renewal process.
In considering the continuation of the Agreements, the Board also reviewed, among other things, a report for each Portfolio that was prepared by Broadridge (“Broadridge”), an independent organization, which set forth comparative performance and expense information for each Portfolio. In addition, the Independent Trustees reviewed a report that was prepared by JDL Consultants, LLC (“JDL”), an independent consultant to the Independent Trustees, which examined the Broadridge reports for each Portfolio (“JDL Report”). The Independent Trustees met in executive session with representatives of JDL during the September Meeting to review the JDL Report.
At the November Meeting, the Board, including a majority of the Independent Trustees, concluded that the nature, extent, and quality of services provided by the Adviser and each Sub-Adviser supported the renewal of the Agreements. The Board also concluded that the investment services provided to and the performance of each Portfolio was such that each Agreement should continue, and that the fees paid by each Portfolio to the Adviser appeared to be reasonable in light of the nature, extent, and quality of the services provided by the Adviser and each Sub-Adviser. Further, the Board concluded that the Adviser’s profitability in providing services under the Advisory Agreements did not appear unreasonable in light of the nature, extent, and quality of the services provided by the Adviser. The Board reviewed the extent to which the investment advisory fees paid by the Portfolios shared economies of scale with investors or entailed the potential to share economies of scale with investors and concluded that those considerations generally supported the renewal of each Agreement. Finally, the Board considered the Adviser’s recommendation that it approve the renewal of each Sub-Advisory Agreement.
In approving the continuation of each Agreement, the Board, including the Independent Trustees, gave attention to all of the information that was furnished, and each Trustee placed varying degrees of importance on the various pieces of information that were provided to them. The Board evaluated the information provided to it on a Portfolio-by-Portfolio basis, and its decision was made separately with respect to each Portfolio. The following paragraphs provide more information about some of the primary factors that were relevant to the Board’s decisions. The Board did not identify any single factor as determinative, and the Trustees generally attributed different weights to various factors for the various Portfolios.
Nature, extent and quality of services. The Board evaluated the nature, extent, and quality of the services that the Adviser and the Sub-Advisers, as relevant, provided to the Portfolios. The Board considered the Adviser’s services as investment manager to the Portfolios, including its services relating to the hiring and oversight of the Sub-Advisers and, in particular, their investment programs
BHFTII-26
Brighthouse Funds Trust II
T. Rowe Price Large Cap Growth Portfolio
Board of Trustees’ Consideration of Advisory and Sub-Advisory Agreements—(Continued)
and personnel, succession management of key personnel, trading practices, compliance programs and personnel, and risk management programs, among other things. The Adviser’s services in coordinating and overseeing the activities of the Trusts’ other service providers were also considered. The Board also considered the systems and processes required by the Adviser to meet additional regulatory and compliance requirements resulting from U.S. Securities and Exchange Commission and other regulatory initiatives, including related to liquidity, valuation, and derivatives risk management. The Board considered information received from the Trusts’ Chief Compliance Officer regarding the Portfolios’ compliance policies and procedures that were established pursuant to Rule 38a-l under the 1940 Act, and relevant aspects of the Adviser’s and Sub-Advisers’ compliance policies and procedures. The Board also noted that it was the practice of the Adviser’s investment, compliance, and legal staff to conduct periodic meetings (through various media) with the Sub-Advisers throughout the year in order to review and assess the services that are provided to the Portfolios, and that personnel of the Adviser routinely prepare and present reports to the Board regarding those meetings. In addition, during the Meetings and throughout the year, the Board considered the expertise, experience, and performance of the personnel of the Adviser who performed the various services that are mentioned above.
With respect to the services provided by each of the Sub-Advisers, the Board considered a variety of information that the Adviser and each Sub-Adviser prepared for the Board’s review. The Board considered each Sub-Adviser’s investment process, each Sub-Adviser’s overall organization and business plans and the investment performance experienced by the Portfolio (as described in more detail below). The Board took into account that each Sub-Adviser’s responsibilities include, among other things, the development and maintenance of an investment program for the applicable Portfolio, the selection of investments and the placement of orders for the purchase and sale of such assets, and the implementation of compliance controls related to the performance of these services. The Board considered, based on the information provided, each Sub-Adviser’s staffing with respect to the management of the Portfolio and other information relating to the Sub-Adviser’s business and operations. The Board also considered the Sub-Adviser’s overall resources and information with respect to any recent turnover of key personnel at the Sub-Adviser. The Board reviewed each Sub-Adviser’s investment experience, as well as information provided regarding the Sub-Adviser’s personnel who provide services to the Portfolios. The Board also considered, among other things, information about each Sub-Adviser’s compliance program, including regarding any compliance matters involving a Sub-Adviser that had been brought to the Board’s attention during the year, as well as the Adviser’s assessment of the financial condition of each Sub-Adviser.
Performance. The Board placed emphasis on the performance of each Portfolio in the context of the performance of the relevant markets in which the Portfolio invests. The Board considered the Adviser’s quarterly presentations to the Board of detailed information about each Portfolio’s investment strategies and performance results and composition, including discussions regarding the relevant effects of market conditions. The Board reviewed and considered the reports prepared by Broadridge, which provided a statistical analysis comparing each Portfolio’s investment performance to that of comparable funds underlying variable insurance products (the “Performance Universe”), and the JDL Report. The Board also compared the performance of each Portfolio to that of comparable funds and other accounts that were managed by the relevant Sub-Adviser, to the extent such information was provided. The Board considered each Portfolio’s performance for periods subsequent to the performance period covered by the Broadridge reports and considered the Adviser’s assessment of the same. The Board also noted that while it found the data provided by Broadridge generally useful, it recognized the limitations of such data, including, in particular, that notable differences may exist between a Portfolio and the other funds in a Broadridge category (for example, with respect to investment strategies) and that the results of the performance comparisons may vary depending on (i) the end dates for the performance periods that were selected and (ii) the selection of the peer groups.
The Board focused particular attention on Portfolios with less favorable performance records. The Board noted the Adviser’s focus on each Sub-Adviser’s performance and that the Adviser had been active in monitoring and responding to any performance issues with respect to the Portfolios.
Fees and Expenses. The Board gave consideration to the level and method of computing the fees payable under the Agreements. The Board reviewed and considered the information in the JDL Report concerning fees and expenses. The Board also reviewed and considered the Broadridge report for each Portfolio, which included various comparisons of the Portfolio’s fees (at December 31, 2022 and various asset levels) and expenses with those of its peers, including, as applicable, a broad group of peer funds (“Expense Universe”), a narrower group of peer funds (“Expense Group”), a broad group of peer sub-advised funds (“Sub-advised Expense Universe”), and a narrower group of peer sub-advised funds (“Sub-advised Expense Group”). In particular, the Board reviewed comparisons of each Portfolio’s contractual management fees with its Expense Group and Sub-advised Expense Universe, contractual sub-adviser fees with its Sub-advised Expense Universe and Sub-advised Expense Group, and total expenses with its Expense Universe, Expense Group and Sub-advised Expense Universe. The Board considered that Broadridge selected the peer funds, which were funds underlying variable insurance products that Broadridge deemed to be comparable to the Portfolios. The Board considered that the fee
BHFTII-27
Brighthouse Funds Trust II
T. Rowe Price Large Cap Growth Portfolio
Board of Trustees’ Consideration of Advisory and Sub-Advisory Agreements—(Continued)
and expense information in the Broadridge report for each Portfolio reflected information as of the Portfolio’s most recent fiscal year end at the time the Broadridge report was issued and that historical asset levels may differ from current asset levels, particularly in a period of market volatility. In addition, the Board compared the fee payable to a Sub-Adviser by the Adviser with respect to the Portfolio to the fee payable to the Sub-Adviser by other comparable funds and other accounts, to the extent such information was provided.
The Board noted that the sub-advisory fees for the Portfolios are negotiated at arm’s length by the Adviser and are paid by the Adviser out of its advisory fees. The Board also considered that the Adviser had entered into expense limitation or management fee waiver agreements with certain of the Portfolios pursuant to which the Adviser had agreed to waive a portion of its advisory fee and/or reimburse certain expenses as a means of limiting a Portfolio’s total annual operating expenses or passing through the benefit of a subadvisory fee concession to a Portfolio, as applicable.
Profitability. The Board examined the profitability to the Adviser of each Advisory Agreement, on a Portfolio-by-Portfolio basis. The Board also considered that an affiliate of the Adviser, Brighthouse Securities, LLC, serves as distributor for the Trusts, and, as such, receives Rule 12b-1 payments to support the distribution of the Portfolios. The Board considered the profitability to the Sub-Advisers and their affiliates of their relationships with the Portfolios, to the extent provided, and the Board considered the ability of the Adviser to negotiate with a Sub-Adviser at arm’s length. In reviewing the profitability information, the Board recognized that expense allocation methodologies are inherently subjective and various methodologies may be reasonable while producing different results.
Economies of scale. The Board considered each Portfolio’s fees in light of its size. The Board noted the fee schedules for the Portfolios that contain breakpoints that reduce the fee rate above specified asset levels, including breakpoints in the Advisory Agreements and any corresponding Sub-Advisory Agreement. The Board noted those Portfolios that did not have breakpoints in their advisory fees and considered management’s explanation of the same.
The Board considered the effective fees under the Advisory Agreement and Sub-Advisory Agreement for each Portfolio as a percentage of assets at different asset levels and possible economies of scale that may be realized if the assets of the Portfolio grow. The Board examined, among other data, the effect of a Portfolio’s growth in size, and reduction in size, on various fee schedules. The Board also generally noted that if a Portfolio’s assets increase over time, the Portfolio may realize economies of scale if assets increase proportionally more than certain other expenses.
Other factors. The Board considered other benefits that may be realized by the Adviser and its affiliates from their relationships with the Trusts. Among the benefits realized by the Adviser, the Board recognized that Brighthouse Securities, LLC, as the distributor for the Trusts, receives payments pursuant to Rule 12b-1 from the Portfolios to help compensate for the provision of shareholder services and distribution activities. The Board considered that a Sub-Adviser may engage in soft dollar transactions in managing a Portfolio. In addition, the Board considered that a Sub-Adviser may be affiliated with registered broker-dealers that may, from time to time, receive brokerage commissions from a Portfolio in connection with the sale of portfolio securities (subject to applicable best execution obligations). The Board also considered that a Sub-Adviser and its affiliates could benefit from the opportunity to provide advisory services to additional portfolios of the Trusts and overall reputational benefits.
The Board considered information from the Adviser and Sub-Advisers pertaining to potential conflicts of interest, and the manner in which any potential conflicts were mitigated. In its review, the Board considered information regarding various business relationships among the Adviser and its affiliates and various Sub-Advisers and their affiliates. The Board also considered information about services and/or payments provided to the Adviser by the Sub-Advisers in connection with marketing activities. The Board considered representations from the Adviser that such business relationships and any payments were not considered in the Adviser’s recommendation to renew any of the Sub-Advisory Agreements.
* * * * *
T. Rowe Price Large Cap Growth Portfolio. The Board also considered the following information in relation to the Agreements with the Adviser and T. Rowe Price Associates, Inc. regarding the Portfolio:
Among other data relating specifically to the Portfolio’s performance, the Board considered that the Portfolio outperformed the median of its Performance Universe and the average of its Morningstar Category for the one-year period ended June 30, 2023 and underperformed the median of its Performance Universe and the average of its Morningstar Category for the three-and five-year periods ended June 30, 2023. The Board also considered that the Portfolio outperformed its benchmark, the Russell 1000 Growth Index, for the one-year period ended October 31, 2023 and underperformed its benchmark for the three-and five-year periods ended October 31, 2023. The Board took into account management’s discussion of the Portfolio’s performance, including with respect to
BHFTII-28
Brighthouse Funds Trust II
T. Rowe Price Large Cap Growth Portfolio
Board of Trustees’ Consideration of Advisory and Sub-Advisory Agreements—(Continued)
prevailing market conditions. The Board also noted the presence of certain management fee waivers in effect for the Portfolio. In addition, the Board considered that the Adviser had negotiated reductions to the Portfolio’s sub-advisory fee schedule and that the Adviser agreed to waive a portion of its advisory fee in order for contract holders to benefit from the lower sub-advisory fee effective April 1, 2023.
The Board also considered that the Portfolio’s actual management fees and total expenses (exclusive of 12b-1 fees) were below the Expense Group median, the Expense Universe median, and the Sub-advised Expense Universe median. The Board noted that the Portfolio’s contractual management fees were above the asset-weighted average of the Investment Classification/Morningstar Category selected by Broadridge at the Portfolio’s current size. The Board also noted that the Portfolio’s contractual sub-advisory fees were above the averages of the Sub-advised Expense Group and the Sub-advised Expense Universe at the Portfolio’s current size.
BHFTII-29
Brighthouse Funds Trust II
T. Rowe Price Small Cap Growth Portfolio
Managed by T. Rowe Price Associates, Inc.
Portfolio Manager Commentary*
PERFORMANCE
For the twelve months ended December 31, 2023, the Class A, B, E and G shares of the T. Rowe Price Small Cap Growth Portfolio returned 21.57%, 21.28%, 21.42%, and 21.24%, respectively. The Portfolio’s benchmark, the MSCI U.S. Small Cap Growth Index¹, returned 22.27%.
MARKET ENVIRONMENT / CONDITIONS
U.S. equities produced strong gains in 2023, driven by generally favorable corporate earnings, a resilient economy, and increased investor interest in artificial intelligence. The market overcame bearish factors such as regional bank turmoil in March, uncertainty around Congress and President Biden agreeing to raise the debt ceiling, geopolitical concerns stemming from the ongoing Russian invasion of Ukraine and from Israel’s response to deadly Hamas attacks in early October, and a sluggish Chinese economic recovery. Arguably the most significant factor affecting the U.S. economy throughout the year was rising interest rates in response to elevated inflation. The U.S. Federal Reserve (the “Fed”) raised short-term interest rates four times through the end of July, lifting the federal funds target rate to the 5.25% to 5.50% range. Equities rallied through year-end as the Federal Open Market Committee at their mid-December policy meeting projected three quarter-point interest rate cuts in 2024.
Domestic Investment Grade bonds produced positive returns in 2023, as a strong year-end rally offset earlier losses stemming from rising interest rates. Short-term U.S. Treasury yields rose as the Fed lifted the fed funds target rate through July, before keeping the target range steady through year-end. Intermediate- and long-term U.S. Treasury yields climbed to multiyear highs by late October and the 10-year yield reached the 5.00% level for the first time in about 16 years. Yields then plunged in the last two months of the year amid signs of disinflation, labor market softening, and expectations for interest rate cuts in 2024. The 10-year yield ended the year at 3.88%.
PORTFOLIO REVIEW / PERIOD END POSITIONING
The Portfolio posted positive returns but underperformed its benchmark, the MSCI U.S. Small Cap Growth Index (the “Index”), during the reporting period. Broadly speaking, sector allocation detracted from relative performance, which was partially offset by stock selection.
Stock selection in the Financials sector detracted from relative performance. Affirm Holdings offers a digital commerce platform with point-of-sale payment and merchant commerce solutions, as well as a consumer-focused app. The stock traded higher during the period due to strong product differentiation as instability in financial markets and legacy banks drove consumers to alternative payment options. Additionally, optimism around the end of the tightening cycle helped results in the latter part of 2023. An underweight position in Affirm Holdings for most of the year weighed on relative performance.
The Real Estate sector also weighed on relative performance due to unfavorable stock selection. Rexford Industrial Realty is a real estate investment trust that invests in, operates, and redevelops industrial properties throughout southern California, the largest industrial market in the U.S. The company felt the pressure of weakened industrial fundamentals during the year as constrained supply eased with rent increases pricing tenants out of the market and as reduced port traffic due to shifts in global trade increased availability.
Stock selection in the Information Technology (“IT”) sector further hindered relative returns, driven by an underweight position in MicroStrategy for most of the year. MicroStrategy provides enterprise analytics and mobility software through licensing and cloud-based subscriptions. The company’s capital allocation strategy is highly levered to bitcoin as it remains the single largest corporate holder of the cryptocurrency.
In contrast, the Industrials sector was the largest contributor to relative results, primarily due to favorable security selection. Builders FirstSource manufactures and supplies building materials and construction elements for contractors and consumers. The company outperformed its Index counterparts during the year and benefited from a strong balance sheet and solid cash flows.
Positive stock selection in the Consumer Staples sector also aided relative performance. Coca-Cola Consolidated is the largest independent Coca-Cola bottler in the U.S. In our view, it has a solid, long-term relationship with The Coca-Cola Company, enabling it to secure new distribution and manufacturing territories as The Coca-Cola Company divests its company-owned bottling rights in the U.S. The stock rose during the period as net sales and earnings increased significantly compared with the prior year.
BHFTII-1
Brighthouse Funds Trust II
T. Rowe Price Small Cap Growth Portfolio
Managed by T. Rowe Price Associates, Inc.
Portfolio Manager Commentary*—(Continued)
At the end of the period, the Portfolio was overweight relative to the Index in the Industrials, IT, Health Care, Energy, and Consumer Staples sectors. The Portfolio was underweight Financials, Real Estate, Communication Services, Materials, Utilities, and Consumer Discretionary. While stock selection is primarily based on a quantitative model, we take into consideration fundamental insights. In constructing the Portfolio, sector weights are usually in-line with those of the Index, but we will occasionally overweight or underweight certain sectors based on our analysis.
Sudhir Nanda
Portfolio Manager
T. Rowe Price Associates, Inc.
* This commentary may include statements that constitute “forward-looking statements” under the U.S. securities laws. Forward-looking statements include, among other things, projections, estimates, and information about possible or future results related to the Portfolio, market or regulatory developments. The views expressed above are not guarantees of future performance or economic results and involve certain risks, uncertainties and assumptions that could cause actual outcomes and results to differ materially from the views expressed herein. The views expressed above are subject to change at any time based upon economic, market, or other conditions and the subadvisory firm undertakes no obligation to update the views expressed herein. Any discussions of specific securities should not be considered a recommendation to buy or sell those securities. The views expressed above (including any forward-looking statement) may not be relied upon as investment advice or as an indication of the Portfolio’s trading intent. Information about the Portfolio’s holdings, asset allocation or country diversification is historical and is not an indication of future Portfolio composition, which may vary. Direct investment in any index is not possible. The performance of any index mentioned in this commentary has not been adjusted for ongoing management, distribution and operating expenses, and sales charges applicable to mutual fund investments. In addition, the returns do not reflect additional fees charged by separate accounts or variable insurance contracts that an investor in the Portfolio may pay. If these additional fees were reflected, performance would have been lower.
¹ The MSCI U.S. Small Cap Growth Index represents the growth companies of the MSCI U.S. Small Cap 1750 Index. (The MSCI U.S. Small Cap 1750 Index represents the universe of small capitalization companies in the U.S. equity market).
BHFTII-2
Brighthouse Funds Trust II
T. Rowe Price Small Cap Growth Portfolio
A $10,000 INVESTMENT COMPARED TO THE MSCI U.S. SMALL CAP GROWTH INDEX
AVERAGE ANNUAL RETURNS (%) FOR THE YEAR ENDED DECEMBER 31, 2023
| 1 Year | 5 Year | 10 Year | Since Inception1 | |||||||||||||
| T. Rowe Price Small Cap Growth Portfolio | ||||||||||||||||
| Class A |
21.57 | 11.84 | 9.44 | — | ||||||||||||
| Class B |
21.28 | 11.56 | 9.17 | — | ||||||||||||
| Class E |
21.42 | 11.67 | 9.28 | — | ||||||||||||
| Class G |
21.24 | 11.51 | — | 9.40 | ||||||||||||
| MSCI U.S. Small Cap Growth Index | 22.27 | 12.29 | 8.55 | — | ||||||||||||
1 Inception dates of the Class A, Class B, Class E and Class G shares are 3/3/97, 7/30/02, 5/1/01 and 11/12/14, respectively.
Portfolio performance is calculated including reinvestment of all income and capital gain distributions. Performance numbers are net of all Portfolio expenses but do not include any insurance, sales, separate account or administrative charges of variable annuity or life insurance contracts or any additional expenses that participants may bear relating to the operations of their plans. If these charges were included, the returns would be lower. The performance of any index referenced above has not been adjusted for ongoing management, distribution and operating expenses, and sales charges applicable to mutual fund investments. Direct investment in any index is not possible. The performance of Class A shares, as set forth in the line graph above, will differ from that of other classes because of the difference in expenses paid by policyholders investing in the different share classes.
This information represents past performance and is not indicative of future results. Investment return and principal value may fluctuate so that shares, upon redemption, may be worth more or less than the original cost.
PORTFOLIO COMPOSITION AS OF DECEMBER 31, 2023
Top Holdings
| % of Net Assets |
||||
| TopBuild Corp. | 1.0 | |||
| Fabrinet | 1.0 | |||
| Weatherford International PLC | 0.9 | |||
| Ensign Group, Inc. | 0.9 | |||
| Curtiss-Wright Corp. | 0.9 | |||
| Comfort Systems USA, Inc. | 0.9 | |||
| UFP Industries, Inc. | 0.8 | |||
| SPS Commerce, Inc. | 0.8 | |||
| Onto Innovation, Inc. | 0.8 | |||
| Murphy USA, Inc. | 0.8 | |||
Top Sectors
| % of Net Assets |
||||
| Health Care | 23.1 | |||
| Industrials | 22.5 | |||
| Information Technology | 18.8 | |||
| Consumer Discretionary | 13.7 | |||
| Financials | 6.4 | |||
| Consumer Staples | 4.2 | |||
| Materials | 3.8 | |||
| Energy | 3.8 | |||
| Communication Services | 2.1 | |||
| Real Estate | 0.8 | |||
BHFTII-3
Brighthouse Funds Trust II
T. Rowe Price Small Cap Growth Portfolio
Understanding Your Portfolio’s Expenses
Shareholder Expense Example
As a shareholder of the Portfolio, you incur ongoing costs, including management fees; distribution and service (12b-1) fees; and other Portfolio expenses. This example is intended to help you understand your ongoing costs (in dollars) (referred to as “expenses”) of investing in the Portfolio and compare these costs with the ongoing costs of investing in other mutual funds. The example is based on an investment of $1,000 invested at the beginning of the period and held for the entire period, July 1, 2023 through December 31, 2023.
Actual Expenses
The first line for each share class of the Portfolio in the table below provides information about actual account values and actual expenses. You may use the information in this line, together with the amount you invested in the particular share class of the Portfolio, to estimate the expenses that you paid over the period. Simply divide your account value by $1,000 (for example, an $8,600 account value divided by $1,000 = 8.6), then multiply the result by the number in the first line under the heading entitled “Expenses Paid During Period” to estimate the expenses you paid on your account during this period.
Hypothetical Example for Comparison Purposes
The second line for each share class of the Portfolio in the table below provides information about hypothetical account values and hypothetical expenses based on the Portfolio’s actual expense ratio and an assumed rate of return of 5% per year before expenses, which is not the Portfolio’s actual return. The hypothetical account values and expenses may not be used to estimate the actual ending account balance or expenses you paid for the period. You may use this information to compare the ongoing costs of investing in the Portfolio and other funds. To do so, compare this 5% hypothetical example with the 5% hypothetical examples that appear in the shareholder reports of the other funds.
Please note that the expenses shown in the table are meant to highlight your ongoing costs only and do not reflect any fees or charges of your variable insurance product or any additional expenses that participants in certain eligible qualified plans may bear relating to the operations of their plan. Therefore, the second line for each share class in the table is useful in comparing ongoing costs only, and will not help you determine the relative total costs of owning different funds. In addition, if these other costs were included, your costs would have been higher.
| T. Rowe Price Small Cap Growth Portfolio |
Annualized Expense Ratio |
Beginning Account Value July 1, 2023 |
Ending Account Value December 31, 2023 |
Expenses Paid During Period** July 1, 2023 to December 31, 2023 |
||||||||||||||
| Class A (a) |
Actual | 0.49 | % | $ | 1,000.00 | $ | 1,064.20 | $ | 2.55 | |||||||||
| Hypothetical* | 0.49 | % | $ | 1,000.00 | $ | 1,022.74 | $ | 2.50 | ||||||||||
| Class B (a) |
Actual | 0.74 | % | $ | 1,000.00 | $ | 1,062.70 | $ | 3.85 | |||||||||
| Hypothetical* | 0.74 | % | $ | 1,000.00 | $ | 1,021.48 | $ | 3.77 | ||||||||||
| Class E (a) |
Actual | 0.64 | % | $ | 1,000.00 | $ | 1,063.50 | $ | 3.33 | |||||||||
| Hypothetical* | 0.64 | % | $ | 1,000.00 | $ | 1,021.98 | $ | 3.26 | ||||||||||
| Class G (a) |
Actual | 0.79 | % | $ | 1,000.00 | $ | 1,062.50 | $ | 4.11 | |||||||||
| Hypothetical* | 0.79 | % | $ | 1,000.00 | $ | 1,021.22 | $ | 4.02 | ||||||||||
| * | Hypothetical assumes a rate of return of 5% per year before expenses. |
| ** | Expenses paid are equal to the Portfolio’s annualized expense ratio for the most recent six month period, as shown above, multiplied by the average account value over the period, multiplied by the number of days (184 days) in the most recent fiscal half-year, divided by 365 (to reflect the one-half year period). |
| (a) | The annualized expense ratio shown reflects the impact of the management fee waiver as described in Note 5 of the Notes to Financial Statements. |
BHFTII-4
Brighthouse Funds Trust II
T. Rowe Price Small Cap Growth Portfolio
Schedule of Investments as of December 31, 2023
Common Stocks—99.5% of Net Assets
| Security Description | Shares | Value | ||||||
| Aerospace & Defense—2.0% | ||||||||
| Cadre Holdings, Inc. |
39,400 | $ | 1,295,866 | |||||
| Curtiss-Wright Corp. |
49,492 | 11,026,323 | ||||||
| Leonardo DRS, Inc. (a) |
228,037 | 4,569,862 | ||||||
| Moog, Inc. - Class A |
8,258 | 1,195,593 | ||||||
| Woodward, Inc. |
49,411 | 6,726,319 | ||||||
|
|
|
|||||||
| 24,813,963 | ||||||||
|
|
|
|||||||
| Air Freight & Logistics—0.5% | ||||||||
| GXO Logistics, Inc. (a) |
99,244 | 6,069,763 | ||||||
|
|
|
|||||||
| Automobile Components—0.6% | ||||||||
| LCI Industries (b) |
5,702 | 716,799 | ||||||
| Patrick Industries, Inc. (b) |
25,532 | 2,562,136 | ||||||
| Visteon Corp. (a) |
28,030 | 3,500,947 | ||||||
|
|
|
|||||||
| 6,779,882 | ||||||||
|
|
|
|||||||
| Banks—0.7% | ||||||||
| Bancorp, Inc. (a) |
133,069 | 5,131,141 | ||||||
| ServisFirst Bancshares, Inc. (b) |
43,500 | 2,898,405 | ||||||
|
|
|
|||||||
| 8,029,546 | ||||||||
|
|
|
|||||||
| Beverages—0.8% | ||||||||
| Celsius Holdings, Inc. (a) |
37,861 | 2,064,182 | ||||||
| Coca-Cola Consolidated, Inc. |
8,174 | 7,588,741 | ||||||
|
|
|
|||||||
| 9,652,923 | ||||||||
|
|
|
|||||||
| Biotechnology—10.0% | ||||||||
| ACADIA Pharmaceuticals, Inc. (a) |
152,764 | 4,783,041 | ||||||
| Agios Pharmaceuticals, Inc. (a) |
46,240 | 1,029,765 | ||||||
| Akero Therapeutics, Inc. (a) (b) |
62,748 | 1,465,166 | ||||||
| Alector, Inc. (a) |
28,182 | 224,892 | ||||||
| Alkermes PLC (a) |
109,363 | 3,033,730 | ||||||
| Allogene Therapeutics, Inc. (a) (b) |
61,692 | 198,031 | ||||||
| Amicus Therapeutics, Inc. (a) |
148,739 | 2,110,606 | ||||||
| Arcellx, Inc. (a) |
22,700 | 1,259,850 | ||||||
| Avidity Biosciences, Inc. (a)(b) |
64,328 | 582,168 | ||||||
| Biohaven Ltd. (a)(b) |
118,829 | 5,085,881 | ||||||
| Biomea Fusion, Inc. (a)(b) |
19,500 | 283,140 | ||||||
| Blueprint Medicines Corp. (a) |
77,023 | 7,104,601 | ||||||
| Bridgebio Pharma, Inc. (a)(b) |
71,600 | 2,890,492 | ||||||
| Catalyst Pharmaceuticals, Inc. (a)(b) |
135,800 | 2,282,798 | ||||||
| Cerevel Therapeutics Holdings, Inc. (a) |
77,954 | 3,305,250 | ||||||
| Crinetics Pharmaceuticals, Inc. (a) |
30,972 | 1,101,984 | ||||||
| CRISPR Therapeutics AG (a)(b) |
63,278 | 3,961,203 | ||||||
| Cytokinetics, Inc. (a)(b) |
76,277 | 6,368,367 | ||||||
| Day One Biopharmaceuticals, Inc. (a)(b) |
36,371 | 531,017 | ||||||
| Denali Therapeutics, Inc. (a)(b) |
40,732 | 874,109 | ||||||
| Exelixis, Inc. (a) |
255,707 | 6,134,411 | ||||||
| Halozyme Therapeutics, Inc. (a)(b) |
156,293 | 5,776,589 | ||||||
| Ideaya Biosciences, Inc. (a) |
33,824 | 1,203,458 | ||||||
| IGM Biosciences, Inc. (a)(b) |
22,768 | 189,202 | ||||||
| ImmunoGen, Inc. (a) |
114,300 | 3,388,995 | ||||||
| Immunovant, Inc. (a) |
30,416 | 1,281,426 | ||||||
| Insmed, Inc. (a) |
181,860 | 5,635,841 | ||||||
| Intellia Therapeutics, Inc. (a)(b) |
52,699 | 1,606,792 | ||||||
| Ionis Pharmaceuticals, Inc. (a) (b) |
101,146 | $ | 5,116,976 | |||||
| Iovance Biotherapeutics, Inc. (a) (b) |
134,544 | 1,093,843 | ||||||
| Karuna Therapeutics, Inc. (a) (b) |
27,342 | 8,654,016 | ||||||
| Krystal Biotech, Inc. (a) (b) |
12,900 | 1,600,374 | ||||||
| Kymera Therapeutics, Inc. (a) (b) |
56,695 | 1,443,455 | ||||||
| Madrigal Pharmaceuticals, Inc. (a) |
6,151 | 1,423,218 | ||||||
| Monte Rosa Therapeutics, Inc. (a) |
9,800 | 55,370 | ||||||
| MoonLake Immunotherapeutics (a) (b) |
12,800 | 772,992 | ||||||
| Morphic Holding, Inc. (a) (b) |
30,637 | 884,797 | ||||||
| Natera, Inc. (a) |
56,244 | 3,523,124 | ||||||
| Neurocrine Biosciences, Inc. (a) |
26,879 | 3,541,577 | ||||||
| Nurix Therapeutics, Inc. (a) |
23,600 | 243,552 | ||||||
| Nuvalent, Inc. - Class A (a) |
20,557 | 1,512,790 | ||||||
| Prothena Corp. PLC (a)(b) |
66,278 | 2,408,542 | ||||||
| PTC Therapeutics, Inc. (a) |
72,654 | 2,002,344 | ||||||
| Relay Therapeutics, Inc. (a) (b) |
91,000 | 1,001,910 | ||||||
| Replimune Group, Inc. (a) |
73,809 | 622,210 | ||||||
| Revolution Medicines, Inc. (a) (b) |
35,256 | 1,011,142 | ||||||
| Rhythm Pharmaceuticals, Inc. (a) |
30,800 | 1,415,876 | ||||||
| Rocket Pharmaceuticals, Inc. (a) (b) |
45,297 | 1,357,551 | ||||||
| Scholar Rock Holding Corp. (a) (b) |
55,206 | 1,037,873 | ||||||
| SpringWorks Therapeutics, Inc. (a) |
17,096 | 624,004 | ||||||
| Ultragenyx Pharmaceutical, Inc. (a) |
52,135 | 2,493,096 | ||||||
| Vaxcyte, Inc. (a) (b) |
42,309 | 2,657,005 | ||||||
| Xencor, Inc. (a) |
74,124 | 1,573,653 | ||||||
| Zentalis Pharmaceuticals, Inc. (a) |
24,973 | 378,341 | ||||||
|
|
|
|||||||
| 122,142,436 | ||||||||
|
|
|
|||||||
| Building Products—3.2% | ||||||||
| AAON, Inc. (b) |
61,006 | 4,506,513 | ||||||
| Azek Co., Inc. (a) |
92,700 | 3,545,775 | ||||||
| Builders FirstSource, Inc. (a) |
38,986 | 6,508,323 | ||||||
| CSW Industrials, Inc. |
23,231 | 4,818,342 | ||||||
| Gibraltar Industries, Inc. (a) |
18,223 | 1,439,253 | ||||||
| Simpson Manufacturing Co., Inc. |
41,600 | 8,235,968 | ||||||
| UFP Industries, Inc. |
78,635 | 9,872,624 | ||||||
|
|
|
|||||||
| 38,926,798 | ||||||||
|
|
|
|||||||
| Capital Markets—1.9% | ||||||||
| Blue Owl Capital, Inc. (b) |
251,301 | 3,744,385 | ||||||
| FactSet Research Systems, Inc. |
9,889 | 4,717,547 | ||||||
| Hamilton Lane, Inc. - Class A |
39,000 | 4,424,160 | ||||||
| LPL Financial Holdings, Inc. |
10,431 | 2,374,304 | ||||||
| MarketAxess Holdings, Inc. |
13,294 | 3,893,148 | ||||||
| StoneX Group, Inc. (a) |
51,300 | 3,787,479 | ||||||
|
|
|
|||||||
| 22,941,023 | ||||||||
|
|
|
|||||||
| Chemicals—1.4% | ||||||||
| Axalta Coating Systems Ltd. (a) |
159,171 | 5,407,039 | ||||||
| Balchem Corp. |
15,399 | 2,290,601 | ||||||
| Element Solutions, Inc. |
126,262 | 2,921,703 | ||||||
| Olin Corp. |
87,783 | 4,735,893 | ||||||
| Quaker Chemical Corp. |
9,300 | 1,984,806 | ||||||
|
|
|
|||||||
| 17,340,042 | ||||||||
|
|
|
|||||||
See accompanying notes to financial statements.
BHFTII-5
Brighthouse Funds Trust II
T. Rowe Price Small Cap Growth Portfolio
Schedule of Investments as of December 31, 2023
Common Stocks—(Continued)
| Security Description | Shares | Value | ||||||
| Commercial Services & Supplies—1.8% | ||||||||
| Casella Waste Systems, Inc. - Class A (a)(b) |
104,462 | $ | 8,927,322 | |||||
| Clean Harbors, Inc. (a) |
35,417 | 6,180,621 | ||||||
| MSA Safety, Inc. |
23,705 | 4,002,115 | ||||||
| Rentokil Initial PLC (ADR) (b) |
107,121 | 3,064,732 | ||||||
|
|
|
|||||||
| 22,174,790 | ||||||||
|
|
|
|||||||
| Communications Equipment—0.1% | ||||||||
| Extreme Networks, Inc. (a) |
72,780 | 1,283,839 | ||||||
|
|
|
|||||||
| Construction & Engineering—1.9% | ||||||||
| API Group Corp. (a) |
157,100 | 5,435,660 | ||||||
| Comfort Systems USA, Inc. |
51,691 | 10,631,288 | ||||||
| EMCOR Group, Inc. |
11,370 | 2,449,439 | ||||||
| WillScot Mobile Mini Holdings Corp. (a) |
95,068 | 4,230,526 | ||||||
|
|
|
|||||||
| 22,746,913 | ||||||||
|
|
|
|||||||
| Construction Materials—0.7% | ||||||||
| Eagle Materials, Inc. |
39,691 | 8,050,922 | ||||||
|
|
|
|||||||
| Consumer Staples Distribution & Retail—0.8% | ||||||||
| BJ’s Wholesale Club Holdings, Inc. (a) |
16,222 | 1,081,359 | ||||||
| Casey’s General Stores, Inc. |
12,318 | 3,384,247 | ||||||
| Performance Food Group Co. (a) |
74,321 | 5,139,297 | ||||||
|
|
|
|||||||
| 9,604,903 | ||||||||
|
|
|
|||||||
| Containers & Packaging—0.2% | ||||||||
| Graphic Packaging Holding Co. |
119,814 | 2,953,415 | ||||||
|
|
|
|||||||
| Distributors—0.4% | ||||||||
| Pool Corp. |
13,531 | 5,394,945 | ||||||
|
|
|
|||||||
| Diversified Consumer Services—1.0% |
||||||||
| Bright Horizons Family Solutions, Inc. (a) (b) |
28,163 | 2,654,081 | ||||||
| Duolingo, Inc. (a) |
17,600 | 3,992,560 | ||||||
| Grand Canyon Education, Inc. (a) |
44,674 | 5,898,755 | ||||||
|
|
|
|||||||
| 12,545,396 | ||||||||
|
|
|
|||||||
| Diversified Telecommunication Services—0.7% |
||||||||
| Cogent Communications Holdings, Inc. (b) |
41,733 | 3,174,212 | ||||||
| Iridium Communications, Inc. (b) |
140,816 | 5,795,987 | ||||||
|
|
|
|||||||
| 8,970,199 | ||||||||
|
|
|
|||||||
| Electrical Equipment—1.2% | ||||||||
| Array Technologies, Inc. (a) (b) |
120,596 | 2,026,013 | ||||||
| Atkore, Inc. (a) (b) |
46,232 | 7,397,120 | ||||||
| Vertiv Holdings Co. (b) |
118,937 | 5,712,544 | ||||||
|
|
|
|||||||
| 15,135,677 | ||||||||
|
|
|
|||||||
| Electronic Equipment, Instruments & Components—3.1% | ||||||||
| Advanced Energy Industries, Inc. (b) |
41,824 | 4,555,470 | ||||||
| Fabrinet (a)(b) |
62,650 | 11,924,174 | ||||||
| Littelfuse, Inc. |
10,201 | 2,729,380 | ||||||
| Novanta, Inc. (a) |
51,992 | 8,755,973 | ||||||
| Teledyne Technologies, Inc. (a) |
8,542 | 3,812,209 | ||||||
| Vontier Corp. |
154,661 | 5,343,538 | ||||||
| Zebra Technologies Corp. - Class A (a) |
4,007 | 1,095,233 | ||||||
|
|
|
|||||||
| 38,215,977 | ||||||||
|
|
|
|||||||
| Energy Equipment & Services—2.3% | ||||||||
| ChampionX Corp. |
109,855 | $ | 3,208,865 | |||||
| Expro Group Holdings NV (a) |
69,608 | 1,108,159 | ||||||
| Noble Corp. PLC (b) |
88,100 | 4,242,896 | ||||||
| TechnipFMC PLC (b) |
132,116 | 2,660,816 | ||||||
| Tidewater, Inc. (a) |
54,100 | 3,901,151 | ||||||
| Transocean Ltd. (a) (b) |
285,600 | 1,813,560 | ||||||
| Weatherford International PLC (a) |
115,926 | 11,341,041 | ||||||
|
|
|
|||||||
| 28,276,488 | ||||||||
|
|
|
|||||||
| Entertainment—0.7% | ||||||||
| Endeavor Group Holdings, Inc. - Class A |
221,207 | 5,249,242 | ||||||
| TKO Group Holdings, Inc. (b) |
43,686 | 3,563,904 | ||||||
|
|
|
|||||||
| 8,813,146 | ||||||||
|
|
|
|||||||
| Financial Services—2.0% | ||||||||
| Affirm Holdings, Inc. (a) (b) |
187,800 | 9,228,492 | ||||||
| Euronet Worldwide, Inc. (a) |
36,156 | 3,669,472 | ||||||
| EVERTEC, Inc. |
70,243 | 2,875,748 | ||||||
| NCR Atleos Corp. (a) |
31,768 | 771,645 | ||||||
| Payoneer Global, Inc. (a) |
447,500 | 2,331,475 | ||||||
| Shift4 Payments, Inc. - Class A (a) (b) |
77,199 | 5,738,974 | ||||||
|
|
|
|||||||
| 24,615,806 | ||||||||
|
|
|
|||||||
| Food Products—0.7% | ||||||||
| Post Holdings, Inc. (a) (b) |
60,725 | 5,347,443 | ||||||
| Simply Good Foods Co. (a) (b) |
76,350 | 3,023,460 | ||||||
|
|
|
|||||||
| 8,370,903 | ||||||||
|
|
|
|||||||
| Ground Transportation—1.7% | ||||||||
| Landstar System, Inc. |
26,103 | 5,054,846 | ||||||
| Saia, Inc. (a) |
19,668 | 8,618,911 | ||||||
| XPO, Inc. (a) |
82,533 | 7,229,065 | ||||||
|
|
|
|||||||
| 20,902,822 | ||||||||
|
|
|
|||||||
| Health Care Equipment & Supplies—4.4% | ||||||||
| AtriCure, Inc. (a) |
41,634 | 1,485,917 | ||||||
| CONMED Corp. (b) |
33,717 | 3,692,349 | ||||||
| Embecta Corp. |
13,180 | 249,497 | ||||||
| Globus Medical, Inc. - Class A (a) |
99,189 | 5,285,782 | ||||||
| Haemonetics Corp. (a)(b) |
42,077 | 3,598,004 | ||||||
| Inari Medical, Inc. (a) (b) |
41,252 | 2,678,080 | ||||||
| Inspire Medical Systems, Inc. (a) |
19,899 | 4,048,054 | ||||||
| iRhythm Technologies, Inc. (a) (b) |
26,104 | 2,794,172 | ||||||
| Lantheus Holdings, Inc. (a) (b) |
92,169 | 5,714,478 | ||||||
| Merit Medical Systems, Inc. (a) (b) |
91,427 | 6,944,795 | ||||||
| Omnicell, Inc. (a) |
33,934 | 1,276,936 | ||||||
| Penumbra, Inc. (a) (b) |
14,414 | 3,625,698 | ||||||
| PROCEPT BioRobotics Corp. (a)(b) |
62,915 | 2,636,768 | ||||||
| Shockwave Medical, Inc. (a) |
11,431 | 2,178,291 | ||||||
| STERIS PLC |
23,090 | 5,076,337 | ||||||
| TransMedics Group, Inc. (a) |
29,900 | 2,360,007 | ||||||
|
|
|
|||||||
| 53,645,165 | ||||||||
|
|
|
|||||||
| Health Care Providers & Services—4.3% | ||||||||
| Addus HomeCare Corp. (a) |
44,308 | 4,113,998 | ||||||
| AMN Healthcare Services, Inc. (a) (b) |
57,304 | 4,290,924 | ||||||
See accompanying notes to financial statements.
BHFTII-6
Brighthouse Funds Trust II
T. Rowe Price Small Cap Growth Portfolio
Schedule of Investments as of December 31, 2023
Common Stocks—(Continued)
| Security Description | Shares | Value | ||||||
| Health Care Providers & Services—(Continued) | ||||||||
| Chemed Corp. |
2,795 | $ | 1,634,376 | |||||
| CorVel Corp. (a) (b) |
25,518 | 6,308,305 | ||||||
| Ensign Group, Inc. (b) |
99,723 | 11,189,918 | ||||||
| Guardant Health, Inc. (a) |
83,685 | 2,263,679 | ||||||
| Molina Healthcare, Inc. (a) (b) |
24,591 | 8,884,974 | ||||||
| NeoGenomics, Inc. (a) (b) |
65,673 | 1,062,589 | ||||||
| Option Care Health, Inc. (a) |
197,091 | 6,639,996 | ||||||
| Tenet Healthcare Corp. (a) |
86,200 | 6,514,134 | ||||||
|
|
|
|||||||
| 52,902,893 | ||||||||
|
|
|
|||||||
| Health Care Technology—0.2% | ||||||||
| Evolent Health, Inc. - Class A (a) |
69,552 | 2,297,303 | ||||||
|
|
|
|||||||
| Hotels, Restaurants & Leisure—5.1% | ||||||||
| Bloomin’ Brands, Inc. (b) |
115,405 | 3,248,651 | ||||||
| Boyd Gaming Corp. |
111,290 | 6,967,867 | ||||||
| Cava Group, Inc. (a) (b) |
15,723 | 675,775 | ||||||
| Choice Hotels International, Inc. (b) |
39,227 | 4,444,419 | ||||||
| Churchill Downs, Inc. (b) |
67,238 | 9,072,423 | ||||||
| Domino’s Pizza, Inc. |
13,321 | 5,491,316 | ||||||
| Everi Holdings, Inc. (a) |
56,481 | 636,541 | ||||||
| Hilton Grand Vacations, Inc. (a) |
57,668 | 2,317,100 | ||||||
| Light & Wonder, Inc. (a) (b) |
38,400 | 3,153,024 | ||||||
| Red Rock Resorts, Inc. - Class A |
42,100 | 2,245,193 | ||||||
| SeaWorld Entertainment, Inc. (a) (b) |
24,697 | 1,304,743 | ||||||
| Texas Roadhouse, Inc. |
74,706 | 9,131,314 | ||||||
| Travel & Leisure Co. (b) |
33,835 | 1,322,610 | ||||||
| Wendy’s Co. |
168,725 | 3,286,763 | ||||||
| Wingstop, Inc. |
32,600 | 8,364,508 | ||||||
|
|
|
|||||||
| 61,662,247 | ||||||||
|
|
|
|||||||
| Household Durables—2.5% | ||||||||
| Cavco Industries, Inc. (a) (b) |
12,220 | 4,235,696 | ||||||
| Green Brick Partners, Inc. (a) |
56,468 | 2,932,948 | ||||||
| Skyline Champion Corp. (a) |
56,160 | 4,170,442 | ||||||
| Tempur Sealy International, Inc. (b) |
140,086 | 7,140,183 | ||||||
| TopBuild Corp. (a) |
33,581 | 12,568,025 | ||||||
|
|
|
|||||||
| 31,047,294 | ||||||||
|
|
|
|||||||
| Independent Power and Renewable Electricity Producers—0.3% | ||||||||
| Ormat Technologies, Inc. (b) |
45,173 | 3,423,662 | ||||||
|
|
|
|||||||
| Industrial REITs—0.6% | ||||||||
| First Industrial Realty Trust, Inc. |
65,629 | 3,456,679 | ||||||
| Rexford Industrial Realty, Inc. (b) |
39,933 | 2,240,241 | ||||||
| Terreno Realty Corp. |
25,483 | 1,597,020 | ||||||
|
|
|
|||||||
| 7,293,940 | ||||||||
|
|
|
|||||||
| Insurance—1.9% | ||||||||
| Kinsale Capital Group, Inc. (b) |
8,435 | 2,824,966 | ||||||
| Palomar Holdings, Inc. (a) |
14,915 | 827,783 | ||||||
| Primerica, Inc. |
32,225 | 6,630,616 | ||||||
| RLI Corp. |
26,400 | 3,514,368 | ||||||
| Ryan Specialty Holdings, Inc. (a) (b) |
105,463 | 4,537,018 | ||||||
| Selective Insurance Group, Inc. |
46,038 | 4,579,860 | ||||||
|
|
|
|||||||
| 22,914,611 | ||||||||
|
|
|
|||||||
| IT Services—0.5% | ||||||||
| Gartner, Inc. (a) |
7,478 | $ | 3,373,401 | |||||
| Perficient, Inc. (a) (b) |
44,059 | 2,899,963 | ||||||
|
|
|
|||||||
| 6,273,364 | ||||||||
|
|
|
|||||||
| Leisure Products—0.7% | ||||||||
| Brunswick Corp. (b) |
31,611 | 3,058,364 | ||||||
| Mattel, Inc. (a) |
260,649 | 4,921,053 | ||||||
|
|
|
|||||||
| 7,979,417 | ||||||||
|
|
|
|||||||
| Life Sciences Tools & Services—2.5% | ||||||||
| 10X Genomics, Inc. - Class A (a) (b) |
73,700 | 4,124,252 | ||||||
| Bruker Corp. |
32,437 | 2,383,471 | ||||||
| Charles River Laboratories International, Inc. (a) |
18,218 | 4,306,735 | ||||||
| Medpace Holdings, Inc. (a) |
28,035 | 8,593,569 | ||||||
| Repligen Corp. (a) (b) |
30,118 | 5,415,216 | ||||||
| West Pharmaceutical Services, Inc. |
14,973 | 5,272,293 | ||||||
|
|
|
|||||||
| 30,095,536 | ||||||||
|
|
|
|||||||
| Machinery—4.2% | ||||||||
| Albany International Corp. - Class A (b) |
7,836 | 769,652 | ||||||
| Federal Signal Corp. |
85,129 | 6,532,799 | ||||||
| John Bean Technologies Corp. (b) |
38,517 | 3,830,516 | ||||||
| Kadant, Inc. (b) |
27,100 | 7,596,401 | ||||||
| Lincoln Electric Holdings, Inc. (b) |
28,126 | 6,116,280 | ||||||
| RBC Bearings, Inc. (a)(b) |
26,539 | 7,560,696 | ||||||
| SPX Technologies, Inc. (a) (b) |
65,701 | 6,636,458 | ||||||
| Symbotic, Inc. (a) (b) |
44,800 | 2,299,584 | ||||||
| Toro Co. (b) |
20,551 | 1,972,690 | ||||||
| Watts Water Technologies, Inc. - Class A (b) |
38,606 | 8,043,174 | ||||||
|
|
|
|||||||
| 51,358,250 | ||||||||
|
|
|
|||||||
| Media—0.7% | ||||||||
| Nexstar Media Group, Inc. |
45,774 | 7,175,074 | ||||||
| Thryv Holdings, Inc. (a) (b) |
48,957 | 996,275 | ||||||
|
|
|
|||||||
| 8,171,349 | ||||||||
|
|
|
|||||||
| Metals & Mining—1.1% | ||||||||
| Alpha Metallurgical Resources, Inc. (b) |
15,388 | 5,215,301 | ||||||
| ATI, Inc. (a) (b) |
151,959 | 6,909,576 | ||||||
| Ivanhoe Electric, Inc. (a) (b) |
101,200 | 1,020,096 | ||||||
|
|
|
|||||||
| 13,144,973 | ||||||||
|
|
|
|||||||
| Oil, Gas & Consumable Fuels—1.5% | ||||||||
| Centrus Energy Corp. - Class A (a) (b) |
34,400 | 1,871,704 | ||||||
| Kosmos Energy Ltd. (a) |
349,682 | 2,346,366 | ||||||
| Matador Resources Co. (b) |
106,213 | 6,039,271 | ||||||
| PBF Energy, Inc. - Class A |
11,700 | 514,332 | ||||||
| Range Resources Corp. (b) |
43,630 | 1,328,097 | ||||||
| SM Energy Co. |
56,766 | 2,197,980 | ||||||
| Southwestern Energy Co. (a) |
596,300 | 3,905,765 | ||||||
|
|
|
|||||||
| 18,203,515 | ||||||||
|
|
|
|||||||
| Paper & Forest Products—0.4% | ||||||||
| Louisiana-Pacific Corp. |
76,177 | 5,395,617 | ||||||
|
|
|
|||||||
See accompanying notes to financial statements.
BHFTII-7
Brighthouse Funds Trust II
T. Rowe Price Small Cap Growth Portfolio
Schedule of Investments as of December 31, 2023
Common Stocks—(Continued)
| Security Description |
Shares | Value | ||||||
| Personal Care Products—1.9% | ||||||||
| BellRing Brands, Inc. (a) |
137,140 | $ | 7,601,670 | |||||
| Coty, Inc. - Class A (a) (b) |
237,575 | 2,950,682 | ||||||
| elf Beauty, Inc. (a) |
51,500 | 7,433,510 | ||||||
| Inter Parfums, Inc. |
37,301 | 5,371,717 | ||||||
|
|
|
|||||||
| 23,357,579 | ||||||||
|
|
|
|||||||
| Pharmaceuticals—1.8% | ||||||||
| Amphastar Pharmaceuticals, Inc. (a) (b) |
68,600 | 4,242,910 | ||||||
| Arvinas, Inc. (a) (b) |
39,254 | 1,615,695 | ||||||
| Catalent, Inc. (a) |
58,118 | 2,611,242 | ||||||
| Cymabay Therapeutics, Inc. (a) (b) |
68,730 | 1,623,403 | ||||||
| Intra-Cellular Therapies, Inc. (a) |
79,496 | 5,693,503 | ||||||
| Pacira BioSciences, Inc. (a) |
41,035 | 1,384,521 | ||||||
| Pliant Therapeutics, Inc. (a) (b) |
24,605 | 445,596 | ||||||
| Prestige Consumer Healthcare, Inc. (a) |
41,135 | 2,518,285 | ||||||
| Supernus Pharmaceuticals, Inc. (a) |
48,192 | 1,394,676 | ||||||
|
|
|
|||||||
| 21,529,831 | ||||||||
|
|
|
|||||||
| Professional Services—4.4% | ||||||||
| ASGN, Inc. (a) |
21,220 | 2,040,727 | ||||||
| Booz Allen Hamilton Holding Corp. |
63,736 | 8,152,472 | ||||||
| Broadridge Financial Solutions, Inc. |
17,898 | 3,682,514 | ||||||
| CACI International, Inc. - Class A (a) |
24,128 | 7,814,094 | ||||||
| CBIZ, Inc. (a) (b) |
96,873 | 6,063,281 | ||||||
| ExlService Holdings, Inc. (a) (b) |
244,721 | 7,549,643 | ||||||
| Exponent, Inc. |
12,294 | 1,082,364 | ||||||
| FTI Consulting, Inc. (a) |
28,766 | 5,728,749 | ||||||
| Insperity, Inc. |
40,357 | 4,730,648 | ||||||
| NV5 Global, Inc. (a) (b) |
13,554 | 1,506,120 | ||||||
| Paylocity Holding Corp. (a) |
12,831 | 2,115,190 | ||||||
| Verra Mobility Corp. (a) |
153,400 | 3,532,802 | ||||||
|
|
|
|||||||
| 53,998,604 | ||||||||
|
|
|
|||||||
| Residential REITs—0.2% | ||||||||
| Equity LifeStyle Properties, Inc. (b) |
35,019 | 2,470,240 | ||||||
|
|
|
|||||||
| Semiconductors & Semiconductor Equipment—4.7% | ||||||||
| Axcelis Technologies, Inc. (a) |
52,330 | 6,786,678 | ||||||
| Cirrus Logic, Inc. (a) |
38,512 | 3,203,813 | ||||||
| Diodes, Inc. (a) |
66,466 | 5,351,842 | ||||||
| Entegris, Inc. |
17,974 | 2,153,645 | ||||||
| FormFactor, Inc. (a) (b) |
56,981 | 2,376,678 | ||||||
| Kulicke & Soffa Industries, Inc. (b) |
66,922 | 3,661,972 | ||||||
| Lattice Semiconductor Corp. (a) |
73,772 | 5,089,530 | ||||||
| MaxLinear, Inc. (a) |
80,973 | 1,924,728 | ||||||
| MKS Instruments, Inc. |
17,752 | 1,826,148 | ||||||
| Monolithic Power Systems, Inc. |
6,450 | 4,068,531 | ||||||
| Onto Innovation, Inc. (a) (b) |
62,165 | 9,505,029 | ||||||
| Photronics, Inc. (a) |
15,800 | 495,646 | ||||||
| Power Integrations, Inc. |
47,159 | 3,872,225 | ||||||
| Rambus, Inc. (a) |
107,493 | 7,336,397 | ||||||
|
|
|
|||||||
| 57,652,862 | ||||||||
|
|
|
|||||||
| Software—10.2% | ||||||||
| A10 Networks, Inc. |
124,626 | 1,641,324 | ||||||
| Security Description |
Shares | Value | ||||||
| Software—(Continued) | ||||||||
| ACI Worldwide, Inc. (a) (b) |
71,434 | $ | 2,185,880 | |||||
| Agilysys, Inc. (a) |
44,200 | 3,749,044 | ||||||
| Appfolio, Inc. - Class A (a) |
22,300 | 3,863,252 | ||||||
| Aspen Technology, Inc. (a) |
7,290 | 1,604,894 | ||||||
| Blackbaud, Inc. (a) |
42,700 | 3,702,090 | ||||||
| Box, Inc. - Class A (a) (b) |
167,031 | 4,277,664 | ||||||
| Descartes Systems Group, Inc. (a) |
100,767 | 8,470,474 | ||||||
| DoubleVerify Holdings, Inc. (a) |
148,440 | 5,459,623 | ||||||
| Fair Isaac Corp. (a) |
4,801 | 5,588,412 | ||||||
| Fortinet, Inc. (a) |
51,174 | 2,995,214 | ||||||
| Informatica, Inc. - Class A (a) (b) |
129,100 | 3,665,149 | ||||||
| Manhattan Associates, Inc. (a) (b) |
25,337 | 5,455,563 | ||||||
| Marathon Digital Holdings, Inc. (a) (b) |
83,900 | 1,970,811 | ||||||
| MicroStrategy, Inc. - Class A (a) (b) |
6,800 | 4,295,016 | ||||||
| NCR Voyix Corp. (a) |
75,409 | 1,275,166 | ||||||
| Nutanix, Inc. - Class A (a) (b) |
190,188 | 9,070,066 | ||||||
| PowerSchool Holdings, Inc. - Class A (a) (b) |
136,010 | 3,204,396 | ||||||
| PTC, Inc. (a) |
33,261 | 5,819,345 | ||||||
| Qualys, Inc. (a) (b) |
43,253 | 8,489,699 | ||||||
| Rapid7, Inc. (a) (b) |
54,949 | 3,137,588 | ||||||
| Riot Platforms, Inc. (a) (b) |
66,500 | 1,028,755 | ||||||
| Sapiens International Corp. NV |
101,842 | 2,947,307 | ||||||
| Smartsheet, Inc. - Class A (a) |
108,431 | 5,185,170 | ||||||
| SPS Commerce, Inc. (a) |
50,248 | 9,740,072 | ||||||
| Tenable Holdings, Inc. (a) |
100,529 | 4,630,366 | ||||||
| Teradata Corp. (a) |
64,082 | 2,788,208 | ||||||
| Tyler Technologies, Inc. (a) |
12,082 | 5,051,726 | ||||||
| Workiva, Inc. (a) (b) |
35,608 | 3,615,280 | ||||||
|
|
|
|||||||
| 124,907,554 | ||||||||
|
|
|
|||||||
| Specialty Retail—2.7% | ||||||||
| Abercrombie & Fitch Co. - Class A (a) |
33,400 | 2,946,548 | ||||||
| Academy Sports & Outdoors, Inc. |
48,525 | 3,202,650 | ||||||
| Asbury Automotive Group, Inc. (a) (b) |
17,556 | 3,949,573 | ||||||
| Carvana Co. (a)(b) |
64,600 | 3,419,924 | ||||||
| Dick’s Sporting Goods, Inc. (b) |
30,147 | 4,430,102 | ||||||
| Murphy USA, Inc. |
26,520 | 9,455,971 | ||||||
| Penske Automotive Group, Inc. (b) |
21,735 | 3,488,685 | ||||||
| Valvoline, Inc. (a) (b) |
52,998 | 1,991,665 | ||||||
|
|
|
|||||||
| 32,885,118 | ||||||||
|
|
|
|||||||
| Technology Hardware, Storage & Peripherals—0.1% | ||||||||
| Pure Storage, Inc. - Class A (a) |
12,694 | 452,668 | ||||||
| Super Micro Computer, Inc. (a) |
3,592 | 1,021,062 | ||||||
|
|
|
|||||||
| 1,473,730 | ||||||||
|
|
|
|||||||
| Textiles, Apparel & Luxury Goods—0.7% | ||||||||
| Crocs, Inc. (a) |
32,546 | 3,040,122 | ||||||
| Deckers Outdoor Corp. (a) |
8,479 | 5,667,618 | ||||||
|
|
|
|||||||
| 8,707,740 | ||||||||
|
|
|
|||||||
| Trading Companies & Distributors—1.5% | ||||||||
| Boise Cascade Co. |
3,900 | 504,504 | ||||||
| Core & Main, Inc. - Class A (a) |
126,900 | 5,128,029 | ||||||
See accompanying notes to financial statements.
BHFTII-8
Brighthouse Funds Trust II
T. Rowe Price Small Cap Growth Portfolio
Schedule of Investments as of December 31, 2023
Common Stocks—(Continued)
| Security Description |
Shares/ Principal Amount* |
Value | ||||||
| Trading Companies & Distributors—(Continued) | ||||||||
| Herc Holdings, Inc. (b) |
15,678 | $ | 2,334,297 | |||||
| McGrath RentCorp |
14,087 | 1,685,087 | ||||||
| SiteOne Landscape Supply, Inc. (a) (b) |
31,902 | 5,184,075 | ||||||
| Watsco, Inc. (b) |
9,232 | 3,955,635 | ||||||
|
|
|
|||||||
| 18,791,627 | ||||||||
|
|
|
|||||||
| Total Common Stocks |
1,216,336,538 | |||||||
|
|
|
|||||||
| Escrow Shares—0.0% |
| |||||||
| Wireless Telecommunication Services—0.0% | ||||||||
| GCI Liberty, Inc. (a) (c) (d) |
89,469 | 0 | ||||||
|
|
|
|||||||
| Short-Term Investment—0.2% |
| |||||||
| Mutual Funds—0.2% | ||||||||
| T. Rowe Price Government Reserve Fund (e) |
2,922,979 | 2,922,979 | ||||||
|
|
|
|||||||
| Total Short-Term Investments (Cost $2,922,979) |
2,922,979 | |||||||
|
|
|
|||||||
| Securities Lending Reinvestments (f)—11.2% |
| |||||||
| Certificates of Deposit—0.7% | ||||||||
| Barclays Bank PLC |
||||||||
| 5.710%, SOFR + 0.320%, 06/20/24 (g) |
2,000,000 | 1,999,994 | ||||||
| Mizuho Bank Ltd. |
||||||||
| 5.790%, SOFR + 0.400%, 04/18/24 (g) |
1,000,000 | 1,000,453 | ||||||
| Standard Chartered Bank |
||||||||
| 5.790%, SOFR + 0.390%, 04/19/24 (g) |
2,000,000 | 2,000,000 | ||||||
| Sumitomo Mitsui Trust Bank Ltd. |
||||||||
| 5.800%, SOFR + 0.400%, 04/24/24 (g) |
2,000,000 | 2,001,190 | ||||||
| Westpac Banking Corp. |
||||||||
| 5.950%, SOFR + 0.550%, 10/11/24 (g) |
2,000,000 | 2,002,478 | ||||||
|
|
|
|||||||
| 9,004,115 | ||||||||
|
|
|
|||||||
| Commercial Paper—0.3% | ||||||||
| Australia & New Zealand Banking Group Ltd. |
||||||||
| 5.640%, 04/18/24 |
1,000,000 | 983,338 | ||||||
| 5.730%, SOFR + 0.330%, 04/18/24 (g) |
1,000,000 | 1,000,224 | ||||||
| Old Line Funding LLC |
||||||||
| 5.620%, SOFR + 0.230%, 03/11/24 (g) |
1,000,000 | 1,000,000 | ||||||
|
|
|
|||||||
| 2,983,562 | ||||||||
|
|
|
|||||||
| Repurchase Agreements—6.8% | ||||||||
| Bank of Nova Scotia |
14,400,000 | 14,400,000 | ||||||
| Barclays Bank PLC |
||||||||
| Repurchase Agreement dated 12/29/23 at 5.330%, due on 01/02/24 with a maturity value of $1,701,007; collateralized by U.S. Treasury Obligations with rates ranging from 0.000% - 5.500%, maturity dates ranging from 01/31/24 - 05/15/48, and an aggregate market value of $1,734,951. |
1,700,000 | 1,700,000 | ||||||
| Barclays Bank PLC |
||||||||
| Repurchase Agreement dated 12/29/23 at 5.450%, due on 01/02/24 with a maturity value of $4,002,422; collateralized by various Common Stock with an aggregate market value of $4,459,247. |
4,000,000 | 4,000,000 | ||||||
| Cantor Fitzgerald & Co. Repurchase Agreement dated 12/29/23 at 5.400%, due on 01/02/24 with a maturity value of $2,001,200; collateralized by U.S. Government Agency Obligations with rates ranging from 0.375% - 26.636%, maturity dates ranging from 10/15/24 - 11/20/73, and an aggregate market value of $2,040,000. |
2,000,000 | 2,000,000 | ||||||
| Citigroup Global Markets, Inc. Repurchase Agreement dated 12/29/23 at 5.870%, due on 07/01/24 with a maturity value of $4,120,661; collateralized by U.S. Treasury Obligations with rates ranging from 0.875% - 3.750%, maturity dates ranging from 05/15/28 - 02/15/32, and various Common Stock with an aggregate market value of $4,080,019. |
4,000,000 | 4,000,000 | ||||||
| Deutsche Bank Securities, Inc. Repurchase Agreement dated 12/29/23 at 5.300%, due on 01/02/24 with a maturity value of $7,022,690; collateralized by U.S. Treasury Obligations with zero coupon, maturity dates ranging from 05/15/34 - 08/15/51, and an aggregate market value of $7,158,928. |
7,018,557 | 7,018,557 | ||||||
| National Bank of Canada Repurchase Agreement dated 12/29/23 at 5.450%, due on 01/05/24 with a maturity value of $14,014,836; collateralized by various Common Stock with an aggregate market value of $15,623,849. |
14,000,000 | 14,000,000 | ||||||
| NBC Global Finance Ltd. Repurchase Agreement dated 12/29/23 at 5.550%, due on 01/02/24 with a maturity value of $27,617,020; collateralized by various Common Stock with an aggregate market value of $30,801,988. |
27,600,000 | 27,600,000 | ||||||
| Societe Generale Repurchase Agreement dated 12/29/23 at 5.330%, due on 01/02/24 with a maturity value of $7,004,146; collateralized by U.S. Treasury Obligations with rates ranging from 0.625% - 4.750%, maturity dates ranging from 04/15/26 - 08/15/51, and an aggregate market value of $7,155,857. |
7,000,000 | 7,000,000 | ||||||
| Repurchase Agreement dated 12/29/23 at 5.330%, due on 01/02/24 with a maturity value of $900,533; collateralized by U.S. Treasury Obligations with rates ranging from 0.625% - 5.240%, maturity dates ranging from 04/30/24 - 05/15/32, and an aggregate market value of $918,000. |
900,000 | 900,000 | ||||||
| Repurchase Agreement dated 12/29/23 at 5.510%, due on 01/02/24 with a maturity value of $400,245; collateralized by various Common Stock with an aggregate market value of $445,253. |
400,000 | 400,000 | ||||||
| TD Prime Services LLC Repurchase Agreement dated 12/29/23 at 5.420%, due on 01/02/24 with a maturity value of $600,361; collateralized by various Common Stock with an aggregate market value of $661,717. |
600,000 | 600,000 | ||||||
|
|
|
|||||||
| 83,618,557 | ||||||||
|
|
|
|||||||
See accompanying notes to financial statements.
BHFTII-9
Brighthouse Funds Trust II
T. Rowe Price Small Cap Growth Portfolio
Schedule of Investments as of December 31, 2023
Securities Lending Reinvestments (f)—(Continued)
|
Security Description |
Shares/ Principal Amount* |
Value | ||||||
| Time Deposits—0.7% | ||||||||
| First Abu Dhabi Bank USA NV |
4,000,000 | $ | 4,000,000 | |||||
| National Bank of Canada |
4,000,000 | 4,000,000 | ||||||
|
|
|
|||||||
| 8,000,000 | ||||||||
|
|
|
|||||||
| Mutual Funds—2.7% | ||||||||
| BlackRock Liquidity Funds FedFund, Institutional |
10,000,000 | 10,000,000 | ||||||
| Dreyfus Treasury Obligations Cash Management Fund, Institutional Class 5.250% (h) |
5,000,000 | 5,000,000 | ||||||
| Fidelity Investments Money Market Government Portfolio, |
5,000,000 | 5,000,000 | ||||||
| Goldman Sachs Financial Square Government Fund, Institutional Shares 5.230% (h) |
5,000,000 | 5,000,000 | ||||||
| HSBC U.S. Government Money Market Fund, |
1,000,000 | 1,000,000 | ||||||
| Morgan Stanley Liquidity Funds Government Portfolio, Institutional |
3,780,445 | 3,780,445 | ||||||
| RBC U.S. Government Money Market Fund, Institutional |
1,000,000 | 1,000,000 | ||||||
| Western Asset Institutional Government Reserves Fund, Institutional Class 5.270% (h) |
2,000,000 | 2,000,000 | ||||||
|
|
|
|||||||
| 32,780,445 | ||||||||
|
|
|
|||||||
| Total Securities Lending Reinvestments |
136,386,679 | |||||||
|
|
|
|||||||
| Total Investments—110.9% |
1,355,646,196 | |||||||
| Other assets and liabilities (net)—(10.9)% |
(133,474,871 | ) | ||||||
|
|
|
|||||||
| Net Assets—100.0% | $1,222,171,325 | |||||||
|
|
|
|||||||
| * | Principal amount stated in U.S. dollars unless otherwise noted. | |||
| (a) | Non-income producing security. | |||
| (b) | All or a portion of the security was held on loan. As of December 31, 2023, the market value of securities loaned was $197,583,142 and the collateral received consisted of cash in the amount of $136,370,331 and non-cash collateral with a value of $69,268,614. The cash collateral investments are disclosed in the Schedule of Investments and categorized as Securities Lending Reinvestments. The non-cash collateral received consists of U.S. government securities that are held in safe-keeping by the lending agent, or a third-party custodian, and cannot be sold or repledged by the Portfolio. As such, this collateral is excluded from the Statement of Assets and Liabilities. | |||
| (c) | Security was valued in good faith under procedures subject to oversight by the Board of Trustees. As of December 31, 2023, these securities represent less than 0.05% of net assets. | |||
| (d) | Significant unobservable inputs were used in the valuation of this portfolio security; i.e. Level 3. | |||
| (e) | Affiliated Issuer. (See Note 6 of the Notes to Financial Statements for a summary of transactions in securities of affiliated issuers.) | |||
| (f) | Represents investment of cash collateral received from securities on loan as of December 31, 2023. | |||
| (g) | Variable or floating rate security. The stated rate represents the rate at December 31, 2023. Maturity date shown for callable securities reflects the earliest possible call date. For securities based on a published reference index and spread, the index and spread are indicated in the description above. For certain variable rate securities, the coupon rate is determined by the issuer/agent based on current market conditions. For certain asset- and mortgage-backed securities, the coupon rate may fluctuate based on changes of the underlying collateral or prepayments of principal. These securities do not indicate a reference index and spread in their description above. | |||
| (h) | The rate shown represents the annualized seven-day yield as of December 31, 2023. | |||
Glossary of Abbreviations
Index Abbreviations
| (OBFR)— | U.S. Overnight Bank Funding Rate | |||
| (SOFR)— | Secured Overnight Financing Rate | |||
Other Abbreviations
| (REIT)— | Real Estate Investment Trust | |||
| (ADR)— | American Depositary Receipt | |||
See accompanying notes to financial statements.
BHFTII-10
Brighthouse Funds Trust II
T. Rowe Price Small Cap Growth Portfolio
Schedule of Investments as of December 31, 2023
Fair Value Hierarchy
Accounting principles generally accepted in the United States of America (“GAAP”) define fair market value as the price that the Portfolio would receive to sell an asset or pay to transfer a liability in an orderly transaction between market participants at the measurement date. It establishes a fair value hierarchy that prioritizes inputs to valuation methods and requires disclosure of the fair value hierarchy, separately for each major category of assets and liabilities, that segregates fair value measurements into three levels. Levels 1, 2 and 3 of the fair value hierarchy are defined as follows:
Level 1 - unadjusted quoted prices in active markets for identical investments
Level 2 - other significant observable inputs (including, but not limited to, quoted prices for similar assets or liabilities in markets that are either active or inactive; inputs other than quoted prices that are observable such as interest rates, yield curves, volatilities, prepayment speeds, loss severities, credit risks, default rates, or other market corroborated inputs)
Level 3 - significant unobservable inputs based on the best information available in the circumstances, to the extent observable inputs are unavailable (including the Portfolio’s own assumptions used in determining the fair value of investments and derivative financial instruments)
The inputs or methodologies used for valuing investments are not necessarily an indication of the risk associated with investing in them. Changes to the inputs or methodologies used may result in transfers between levels. A reconciliation of Level 3 securities, if any, will be disclosed following the fair value hierarchy table. For more information about the Portfolio’s policy regarding the valuation of investments, please refer to the Notes to Financial Statements.
The following table summarizes the fair value hierarchy of the Portfolio’s investments as of December 31, 2023:
| Description | Level 1 | Level 2 | Level 3 | Total | ||||||||||||
| Total Common Stocks* |
$ | 1,216,336,538 | $ | — | $ | — | $ | 1,216,336,538 | ||||||||
| Total Escrow Shares* |
— | — | 0 | 0 | ||||||||||||
| Total Short-Term Investment* |
2,922,979 | — | — | 2,922,979 | ||||||||||||
| Securities Lending Reinvestments |
||||||||||||||||
| Certificates of Deposit |
— | 9,004,115 | — | 9,004,115 | ||||||||||||
| Commercial Paper |
— | 2,983,562 | — | 2,983,562 | ||||||||||||
| Repurchase Agreements |
— | 83,618,557 | — | 83,618,557 | ||||||||||||
| Time Deposits |
— | 8,000,000 | — | 8,000,000 | ||||||||||||
| Mutual Funds |
32,780,445 | — | — | 32,780,445 | ||||||||||||
| Total Securities Lending Reinvestments |
32,780,445 | 103,606,234 | — | 136,386,679 | ||||||||||||
| Total Investments |
$ | 1,252,039,962 | $ | 103,606,234 | $ | 0 | $ | 1,355,646,196 | ||||||||
| Collateral for Securities Loaned (Liability) |
$ | — | $ | (136,370,331 | ) | $ | — | $ | (136,370,331 | ) | ||||||
* See Schedule of Investments for additional detailed categorizations.
Level 3 investments at the beginning and/or end of the period in relation to net assets were not significant and accordingly, a reconciliation of Level 3 assets for the year ended December 31, 2023 is not presented.
See accompanying notes to financial statements.
BHFTII-11
Brighthouse Funds Trust II
T. Rowe Price Small Cap Growth Portfolio
Statement of Assets and Liabilities
December 31, 2023
| Assets |
||||
| Investments at value (a) (b) |
$ | 1,352,723,217 | ||
| Affiliated investments at value (c) |
2,922,979 | |||
| Cash |
736,083 | |||
| Receivable for: |
||||
| Investments sold |
5,381,199 | |||
| Fund shares sold |
120,156 | |||
| Dividends and interest |
291,262 | |||
| Dividends on affiliated investments |
42,689 | |||
| Prepaid expenses |
4,373 | |||
|
|
|
|||
| Total Assets |
1,362,221,958 | |||
|
|
|
|||
| Liabilities |
||||
| Collateral for securities loaned |
136,370,331 | |||
| Payables for: |
||||
| Affiliated investments purchased |
28,825 | |||
| Investments purchased |
1,466,412 | |||
| Fund shares redeemed |
1,364,185 | |||
| Accrued Expenses: |
||||
| Management fees |
457,066 | |||
| Distribution and service fees |
68,255 | |||
| Deferred trustees’ fees |
169,435 | |||
| Other expenses |
126,124 | |||
|
|
|
|||
| Total Liabilities |
140,050,633 | |||
|
|
|
|||
| Net Assets |
$ | 1,222,171,325 | ||
|
|
|
|||
| Net Assets Consist of: |
||||
| Paid in surplus |
$ | 861,649,272 | ||
| Distributable earnings (Accumulated losses) |
360,522,053 | |||
|
|
|
|||
| Net Assets |
$ | 1,222,171,325 | ||
|
|
|
|||
| Net Assets |
||||
| Class A |
$ | 888,333,005 | ||
| Class B |
319,786,244 | |||
| Class E |
11,793,510 | |||
| Class G |
2,258,566 | |||
| Capital Shares Outstanding* |
||||
| Class A |
44,635,317 | |||
| Class B |
18,687,524 | |||
| Class E |
651,957 | |||
| Class G |
142,790 | |||
| Net Asset Value, Offering Price and Redemption Price Per Share |
||||
| Class A |
$ | 19.90 | ||
| Class B |
17.11 | |||
| Class E |
18.09 | |||
| Class G |
15.82 |
| * | The Portfolio is authorized to issue an unlimited number of shares. | |||||
| (a) | Includes securities loaned at value of $197,583,142. | |||||
| (b) | Identified cost of investments, excluding affiliated investments, was $1,054,537,830. | |||||
| (c) | Identified cost of affiliated investments was $2,922,979. |
Statement of Operations
Year Ended December 31, 2023
| Investment Income |
||||
| Dividends (a) |
$ | 6,126,243 | ||
| Dividends from affiliated investments |
478,760 | |||
| Securities lending income |
386,952 | |||
|
|
|
|||
| Total investment income |
6,991,955 | |||
|
|
|
|||
| Expenses |
||||
| Management fees |
5,536,286 | |||
| Administration fees |
58,550 | |||
| Custodian and accounting fees |
99,730 | |||
| Distribution and service fees—Class B |
760,630 | |||
| Distribution and service fees—Class E |
17,114 | |||
| Distribution and service fees—Class G |
7,015 | |||
| Audit and tax services |
49,026 | |||
| Legal |
46,604 | |||
| Trustees’ fees and expenses |
46,220 | |||
| Shareholder reporting |
64,793 | |||
| Insurance |
10,369 | |||
| Miscellaneous |
24,268 | |||
|
|
|
|||
| Total expenses |
6,720,605 | |||
| Less management fee waiver |
(250,677) | |||
|
|
|
|||
| Net expenses |
6,469,928 | |||
|
|
|
|||
| Net Investment Income |
522,027 | |||
|
|
|
|||
| Net Realized and Unrealized Gain (Loss) |
||||
| Net realized gain on investments |
62,927,469 | |||
| Net change in unrealized appreciation on investments |
168,667,135 | |||
|
|
|
|||
| Net realized and unrealized gain (loss) |
231,594,604 | |||
|
|
|
|||
| Net Increase (Decrease) in Net Assets From Operations |
$ | 232,116,631 | ||
|
|
|
| (a) |
Net of foreign withholding taxes of $14,249. |
See accompanying notes to financial statements.
BHFTII-12
Brighthouse Funds Trust II
T. Rowe Price Small Cap Growth Portfolio
Statements of Changes in Net Assets
| Year Ended December 31, 2023 |
Year Ended December 31, 2022 |
|||||||
| Increase (Decrease) in Net Assets: |
||||||||
| From Operations |
||||||||
| Net investment income (loss) |
$ | 522,027 | $ | 1,110,558 | ||||
| Net realized gain (loss) |
62,927,469 | 28,492,225 | ||||||
| Net change in unrealized appreciation (depreciation) |
168,667,135 | (380,886,473 | ) | |||||
|
|
|
|
|
|||||
| Increase (decrease) in net assets from operations |
232,116,631 | (351,283,690 | ) | |||||
|
|
|
|
|
|||||
| From Distributions to Shareholders |
||||||||
| Class A |
(21,037,626 | ) | (171,022,527 | ) | ||||
| Class B |
(8,437,862 | ) | (66,915,169 | ) | ||||
| Class E |
(301,040 | ) | (2,467,717 | ) | ||||
| Class G |
(72,978 | ) | (608,513 | ) | ||||
|
|
|
|
|
|||||
| Total distributions |
(29,849,506 | ) | (241,013,926 | ) | ||||
|
|
|
|
|
|||||
| Increase (decrease) in net assets from capital share transactions |
(125,038,073 | ) | 139,260,329 | |||||
|
|
|
|
|
|||||
| Total increase (decrease) in net assets |
77,229,052 | (453,037,287 | ) | |||||
| Net Assets |
||||||||
| Beginning of period |
1,144,942,273 | 1,597,979,560 | ||||||
|
|
|
|
|
|||||
| End of period |
$ | 1,222,171,325 | $ | 1,144,942,273 | ||||
|
|
|
|
|
|||||
Other Information:
Capital Shares
Transactions in capital shares were as follows:
| Year Ended December 31, 2023 |
Year Ended December 31, 2022 |
|||||||||||||||
| Shares | Value | Shares | Value | |||||||||||||
| Class A |
||||||||||||||||
| Sales |
766,043 | $ | 13,786,603 | 1,159,910 | $ | 24,725,896 | ||||||||||
| Reinvestments |
1,150,855 | 21,037,626 | 10,803,697 | 171,022,527 | ||||||||||||
| Redemptions |
(7,200,895 | ) | (133,051,591 | ) | (4,704,546 | ) | (86,774,666 | ) | ||||||||
|
|
|
|
|
|
|
|
|
|||||||||
| Net increase (decrease) |
(5,283,997 | ) | $ | (98,227,362 | ) | 7,259,061 | $ | 108,973,757 | ||||||||
|
|
|
|
|
|
|
|
|
|||||||||
| Class B |
||||||||||||||||
| Sales |
671,872 | $ | 10,482,622 | 469,023 | $ | 8,199,606 | ||||||||||
| Reinvestments |
536,078 | 8,437,862 | 4,880,756 | 66,915,169 | ||||||||||||
| Redemptions |
(2,800,769 | ) | (43,955,810 | ) | (2,665,685 | ) | (44,533,888 | ) | ||||||||
|
|
|
|
|
|
|
|
|
|||||||||
| Net increase (decrease) |
(1,592,819 | ) | $ | (25,035,326 | ) | 2,684,094 | $ | 30,580,887 | ||||||||
|
|
|
|
|
|
|
|
|
|||||||||
| Class E |
||||||||||||||||
| Sales |
29,068 | $ | 494,268 | 14,846 | $ | 263,506 | ||||||||||
| Reinvestments |
18,102 | 301,040 | 170,776 | 2,467,717 | ||||||||||||
| Redemptions |
(129,780 | ) | (2,138,004 | ) | (155,646 | ) | (2,933,087 | ) | ||||||||
|
|
|
|
|
|
|
|
|
|||||||||
| Net increase (decrease) |
(82,610 | ) | $ | (1,342,696 | ) | 29,976 | $ | (201,864 | ) | |||||||
|
|
|
|
|
|
|
|
|
|||||||||
| Class G |
| |||||||||||||||
| Sales |
2,804 | $ | 40,564 | 4,589 | $ | 79,792 | ||||||||||
| Reinvestments |
5,016 | 72,978 | 47,877 | 608,513 | ||||||||||||
| Redemptions |
(37,943 | ) | (546,231 | ) | (48,856 | ) | (780,756 | ) | ||||||||
|
|
|
|
|
|
|
|
|
|||||||||
| Net increase (decrease) |
(30,123 | ) | $ | (432,689 | ) | 3,610 | $ | (92,451 | ) | |||||||
|
|
|
|
|
|
|
|
|
|||||||||
| Increase (decrease) derived from capital shares transactions |
$ | (125,038,073 | ) | $ | 139,260,329 | |||||||||||
|
|
|
|
|
|||||||||||||
See accompanying notes to financial statements.
BHFTII-13
Brighthouse Funds Trust II
T. Rowe Price Small Cap Growth Portfolio
Financial Highlights
| Selected per share data | ||||||||||||||||||||
| Class A | ||||||||||||||||||||
| Year Ended December 31, | ||||||||||||||||||||
| 2023 | 2022 | 2021 | 2020 | 2019 | ||||||||||||||||
| Net Asset Value, Beginning of Period |
$ | 16.77 | $ | 27.02 | $ | 27.04 | $ | 24.43 | $ | 21.23 | ||||||||||
|
|
|
|
|
|
|
|
|
|
|
|||||||||||
| Income (Loss) from Investment Operations |
||||||||||||||||||||
| Net investment income (loss) (a) |
0.02 | 0.03 | (0.01 | ) | 0.03 | 0.05 | ||||||||||||||
| Net realized and unrealized gain (loss) |
3.56 | (6.25 | ) | 2.99 | 5.09 | 6.61 | ||||||||||||||
|
|
|
|
|
|
|
|
|
|
|
|||||||||||
| Total income (loss) from investment operations |
3.58 | (6.22 | ) | 2.98 | 5.12 | 6.66 | ||||||||||||||
|
|
|
|
|
|
|
|
|
|
|
|||||||||||
| Less Distributions |
||||||||||||||||||||
| Distributions from net investment income |
(0.01 | ) | (0.05 | ) | (0.01 | ) | (0.05 | ) | (0.01 | ) | ||||||||||
| Distributions from net realized capital gains |
(0.44 | ) | (3.98 | ) | (2.99 | ) | (2.46 | ) | (3.45 | ) | ||||||||||
|
|
|
|
|
|
|
|
|
|
|
|||||||||||
| Total distributions |
(0.45 | ) | (4.03 | ) | (3.00 | ) | (2.51 | ) | (3.46 | ) | ||||||||||
|
|
|
|
|
|
|
|
|
|
|
|||||||||||
| Net Asset Value, End of Period |
$ | 19.90 | $ | 16.77 | $ | 27.02 | $ | 27.04 | $ | 24.43 | ||||||||||
|
|
|
|
|
|
|
|
|
|
|
|||||||||||
| Total Return (%) (b) |
21.57 | (22.15 | ) | 11.67 | 24.34 | 33.16 | ||||||||||||||
| Ratios/Supplemental Data |
||||||||||||||||||||
| Gross ratio of expenses to average net assets (%) |
0.51 | 0.50 | 0.49 | 0.50 | 0.50 | |||||||||||||||
| Net ratio of expenses to average net assets (%) (c) |
0.48 | 0.48 | 0.47 | 0.48 | 0.48 | |||||||||||||||
| Ratio of net investment income (loss) to average net assets (%) |
0.11 | 0.16 | (0.04 | ) | 0.13 | 0.23 | ||||||||||||||
| Portfolio turnover rate (%) |
34 | 34 | 28 | 36 | 17 | |||||||||||||||
| Net assets, end of period (in millions) |
$ | 888.3 | $ | 837.2 | $ | 1,152.5 | $ | 1,174.3 | $ | 985.3 | ||||||||||
| Class B | ||||||||||||||||||||
| Year Ended December 31, | ||||||||||||||||||||
| 2023 | 2022 | 2021 | 2020 | 2019 | ||||||||||||||||
| Net Asset Value, Beginning of Period |
$ | 14.50 | $ | 24.09 | $ | 24.47 | $ | 22.36 | $ | 19.71 | ||||||||||
|
|
|
|
|
|
|
|
|
|
|
|||||||||||
| Income (Loss) from Investment Operations |
||||||||||||||||||||
| Net investment income (loss) (a) |
(0.02 | ) | (0.02 | ) | (0.07 | ) | (0.02 | ) | (0.00 | )(d) | ||||||||||
| Net realized and unrealized gain (loss) |
3.07 | (5.59 | ) | 2.68 | 4.59 | 6.10 | ||||||||||||||
|
|
|
|
|
|
|
|
|
|
|
|||||||||||
| Total income (loss) from investment operations |
3.05 | (5.61 | ) | 2.61 | 4.57 | 6.10 | ||||||||||||||
|
|
|
|
|
|
|
|
|
|
|
|||||||||||
| Less Distributions |
||||||||||||||||||||
| Distributions from net realized capital gains |
(0.44 | ) | (3.98 | ) | (2.99 | ) | (2.46 | ) | (3.45 | ) | ||||||||||
|
|
|
|
|
|
|
|
|
|
|
|||||||||||
| Total distributions |
(0.44 | ) | (3.98 | ) | (2.99 | ) | (2.46 | ) | (3.45 | ) | ||||||||||
|
|
|
|
|
|
|
|
|
|
|
|||||||||||
| Net Asset Value, End of Period |
$ | 17.11 | $ | 14.50 | $ | 24.09 | $ | 24.47 | $ | 22.36 | ||||||||||
|
|
|
|
|
|
|
|
|
|
|
|||||||||||
| Total Return (%) (b) |
21.28 | (22.34 | ) | 11.36 | 24.04 | 32.84 | ||||||||||||||
| Ratios/Supplemental Data |
||||||||||||||||||||
| Gross ratio of expenses to average net assets (%) |
0.76 | 0.75 | 0.74 | 0.75 | 0.75 | |||||||||||||||
| Net ratio of expenses to average net assets (%) (c) |
0.73 | 0.73 | 0.72 | 0.73 | 0.73 | |||||||||||||||
| Ratio of net investment income (loss) to average net assets (%) |
(0.14 | ) | (0.10 | ) | (0.29 | ) | (0.11 | ) | (0.02 | ) | ||||||||||
| Portfolio turnover rate (%) |
34 | 34 | 28 | 36 | 17 | |||||||||||||||
| Net assets, end of period (in millions) |
$ | 319.8 | $ | 294.1 | $ | 423.9 | $ | 441.3 | $ | 408.4 | ||||||||||
Please see following page for Financial Highlights footnote legend.
See accompanying notes to financial statements.
BHFTII-14
Brighthouse Funds Trust II
T. Rowe Price Small Cap Growth Portfolio
Financial Highlights
| Selected per share data | ||||||||||||||||||||
| Class E | ||||||||||||||||||||
| Year Ended December 31, | ||||||||||||||||||||
| 2023 | 2022 | 2021 | 2020 | 2019 | ||||||||||||||||
| Net Asset Value, Beginning of Period |
$ | 15.29 | $ | 25.09 | $ | 25.34 | $ | 23.05 | $ | 20.22 | ||||||||||
|
|
|
|
|
|
|
|
|
|
|
|||||||||||
| Income (Loss) from Investment Operations |
||||||||||||||||||||
| Net investment income (loss) (a) |
(0.01 | ) | (0.00 | )(d) | (0.05 | ) | (0.00 | )(d) | 0.02 | |||||||||||
| Net realized and unrealized gain (loss) |
3.25 | (5.82 | ) | 2.79 | 4.76 | 6.26 | ||||||||||||||
|
|
|
|
|
|
|
|
|
|
|
|||||||||||
| Total income (loss) from investment operations |
3.24 | (5.82 | ) | 2.74 | 4.76 | 6.28 | ||||||||||||||
|
|
|
|
|
|
|
|
|
|
|
|||||||||||
| Less Distributions |
||||||||||||||||||||
| Distributions from net investment income |
0.00 | 0.00 | 0.00 | (0.01 | ) | 0.00 | ||||||||||||||
| Distributions from net realized capital gains |
(0.44 | ) | (3.98 | ) | (2.99 | ) | (2.46 | ) | (3.45 | ) | ||||||||||
|
|
|
|
|
|
|
|
|
|
|
|||||||||||
| Total distributions |
(0.44 | ) | (3.98 | ) | (2.99 | ) | (2.47 | ) | (3.45 | ) | ||||||||||
|
|
|
|
|
|
|
|
|
|
|
|||||||||||
| Net Asset Value, End of Period |
$ | 18.09 | $ | 15.29 | $ | 25.09 | $ | 25.34 | $ | 23.05 | ||||||||||
|
|
|
|
|
|
|
|
|
|
|
|||||||||||
| Total Return (%) (b) |
21.42 | (22.28 | ) | 11.49 | 24.20 | 32.90 | ||||||||||||||
| Ratios/Supplemental Data |
||||||||||||||||||||
| Gross ratio of expenses to average net assets (%) |
0.66 | 0.65 | 0.64 | 0.65 | 0.65 | |||||||||||||||
| Net ratio of expenses to average net assets (%) (c) |
0.63 | 0.63 | 0.62 | 0.63 | 0.63 | |||||||||||||||
| Ratio of net investment income (loss) to average net assets (%) |
(0.04 | ) | (0.00 | )(e) | (0.19 | ) | (0.01 | ) | 0.08 | |||||||||||
| Portfolio turnover rate (%) |
34 | 34 | 28 | 36 | 17 | |||||||||||||||
| Net assets, end of period (in millions) |
$ | 11.8 | $ | 11.2 | $ | 17.7 | $ | 18.6 | $ | 16.9 | ||||||||||
| Class G | ||||||||||||||||||||
| Year Ended December 31, | ||||||||||||||||||||
| 2023 | 2022 | 2021 | 2020 | 2019 | ||||||||||||||||
| Net Asset Value, Beginning of Period |
$ | 13.44 | $ | 22.74 | $ | 23.26 | $ | 21.39 | $ | 18.99 | ||||||||||
|
|
|
|
|
|
|
|
|
|
|
|||||||||||
| Income (Loss) from Investment Operations |
||||||||||||||||||||
| Net investment income (loss) (a) |
(0.03 | ) | (0.02 | ) | (0.08 | ) | (0.03 | ) | (0.01 | ) | ||||||||||
| Net realized and unrealized gain (loss) |
2.85 | (5.30 | ) | 2.55 | 4.36 | 5.86 | ||||||||||||||
|
|
|
|
|
|
|
|
|
|
|
|||||||||||
| Total income (loss) from investment operations |
2.82 | (5.32 | ) | 2.47 | 4.33 | 5.85 | ||||||||||||||
|
|
|
|
|
|
|
|
|
|
|
|||||||||||
| Less Distributions |
||||||||||||||||||||
| Distributions from net realized capital gains |
(0.44 | ) | (3.98 | ) | (2.99 | ) | (2.46 | ) | (3.45 | ) | ||||||||||
|
|
|
|
|
|
|
|
|
|
|
|||||||||||
| Total distributions |
(0.44 | ) | (3.98 | ) | (2.99 | ) | (2.46 | ) | (3.45 | ) | ||||||||||
|
|
|
|
|
|
|
|
|
|
|
|||||||||||
| Net Asset Value, End of Period |
$ | 15.82 | $ | 13.44 | $ | 22.74 | $ | 23.26 | $ | 21.39 | ||||||||||
|
|
|
|
|
|
|
|
|
|
|
|||||||||||
| Total Return (%) (b) |
21.24 | (22.40 | ) | 11.34 | 24.00 | 32.75 | ||||||||||||||
| Ratios/Supplemental Data |
||||||||||||||||||||
| Gross ratio of expenses to average net assets (%) |
0.81 | 0.80 | 0.79 | 0.80 | 0.80 | |||||||||||||||
| Net ratio of expenses to average net assets (%) (c) |
0.78 | 0.78 | 0.77 | 0.78 | 0.78 | |||||||||||||||
| Ratio of net investment income (loss) to average net assets (%) |
(0.19 | ) | (0.15 | ) | (0.34 | ) | (0.17 | ) | (0.07 | ) | ||||||||||
| Portfolio turnover rate (%) |
34 | 34 | 28 | 36 | 17 | |||||||||||||||
| Net assets, end of period (in millions) |
$ | 2.3 | $ | 2.3 | $ | 3.8 | $ | 4.2 | $ | 4.5 | ||||||||||
| (a) | Per share amounts based on average shares outstanding during the period. | |||
| (b) | Total return does not reflect any insurance, sales, separate account or administrative charges of variable annuity or life insurance contracts or any additional expenses that contract owners may bear under their variable contracts. If these charges were included, the returns would be lower. | |||
| (c) | Includes the effects of management fee waivers (see Note 5 of the Notes to Financial Statements). | |||
| (d) | Net investment income (loss) was less than $0.01. | |||
| (e) | Ratio of net investment income (loss) to average net assets was less than 0.01%. | |||
See accompanying notes to financial statements.
BHFTII-15
Brighthouse Funds Trust II
T. Rowe Price Small Cap Growth Portfolio
Notes to Financial Statements—December 31, 2023
1. Organization
Brighthouse Funds Trust II (the “Trust”) is organized as a Delaware statutory trust and registered under the Investment Company Act of 1940, as amended (the “1940 Act”), as an open-end management investment company. The Trust, which is managed by Brighthouse Investment Advisers, LLC (“Brighthouse Investment Advisers” or the “Adviser”), currently offers twenty-nine series (the “Portfolios”), each of which operates as a distinct investment vehicle of the Trust.The series included in this report is T. Rowe Price Small Cap Growth Portfolio (the “Portfolio”), which is diversified. Shares of the Portfolio are not offered directly to the general public and are currently available only to separate accounts of insurance companies, including insurance companies affiliated with the Adviser.
The Portfolio has registered and offers four classes of shares: Class A, B, E and G shares. Shares of each class of the Portfolio represent an equal pro rata interest in the Portfolio and generally give the shareholder the same voting, dividend, liquidation, and other rights. Investment income, realized and unrealized capital gains and losses, the common expenses of the Portfolio, and certain Portfolio-level expense reductions, if any, are allocated on a pro rata basis to each class based on the relative net assets of each class to the net assets of the Portfolio. Each class of shares differs in its respective distribution plan and such distribution expenses are allocated to the corresponding class of shares.
2. Significant Accounting Policies
The preparation of financial statements in conformity with accounting principles generally accepted in the United States of America (“GAAP”) requires management to make estimates and assumptions that affect the reported amounts of assets and liabilities and disclosure of contingent assets and liabilities as of the date of the financial statements and the reported amounts of income and expenses during the reporting period. Actual results could differ from those estimates. In the preparation of these financial statements, management has evaluated events and transactions subsequent to December 31, 2023 through the date the financial statements were issued.
The Portfolio is an investment company and follows the accounting and reporting guidance of the Financial Accounting Standards Board (“FASB”) Accounting Standards Codification Topic 946- Financial Services- Investment Companies. The following is a summary of significant accounting policies consistently followed by the Portfolio in the preparation of its financial statements.
Investment Valuation and Fair Value Measurements - The Portfolio values its investments for purposes of calculating its net asset value (“NAV”) using procedures that allow for a variety of methodologies to be used to value the Portfolio’s investments. The specific methodology used for an investment may vary based on the market data available for a specific investment at the time the Portfolio calculates its NAV or based on other considerations. The procedures also permit a level of judgment to be used in the valuation process.
Domestic and foreign equity securities, such as common stock, exchange-traded funds, rights, warrants, and preferred stock, that are traded on a securities exchange on a valuation date are generally valued at their last quoted sale price or official closing price on the primary exchange for such security, or, if no sales occurred on that day, at the last reported bid price. Equity securities traded over-the-counter (“OTC”) are generally valued at the last reported bid price. In the event of a major exchange closing during the trading day, the Adviser may use other market information obtained from quotation reporting systems, established market makers, or pricing services in valuing the securities. Valuation adjustments may be applied to certain foreign equity securities that are traded solely on foreign exchanges that close before the time as of which the Portfolio determines its NAV to account for the market movement between the close of the foreign exchanges and the time as of which the Portfolio determines its NAV. The Portfolio may use a systematic fair valuation model provided by a pricing service to value securities principally traded in these foreign markets to adjust for possible market movements or other changes that may occur between the close of the foreign exchanges and the time as of which the Portfolio determines its NAV. Foreign equity securities valued using these valuation adjustments are generally categorized as Level 2 within the fair value hierarchy. Equity securities that are actively traded, and have no valuation adjustments applied, are categorized as Level 1 within the fair value hierarchy. Other equity securities traded on inactive markets or valued in reference to similar instruments traded on active markets are generally categorized as Level 2 within the fair value hierarchy.
Investments in registered open-end management investment companies are valued at reported NAV per share on the valuation date and are categorized as Level 1 within the fair value hierarchy.
Debt securities, including corporate, convertible and municipal bonds and notes; obligations of the U.S. Treasury and U.S. government agencies; foreign sovereign issues; and non-U.S. bonds, are generally valued based upon evaluated or composite bid quotations obtained from third-party pricing services and/or brokers and dealers selected by the Adviser (each a “pricing service”). Such pricing services may use matrix pricing, which considers observable inputs including, among other things, issuer details, maturity dates, interest rates, yield curves, rates of prepayment, credit risks/spreads, default rates, reported trades, broker-dealer quotes and quoted prices for similar assets. Short-term obligations with a remaining maturity of sixty days or less may be valued at amortized cost in the absence of market quotes, so long as the amortized cost value of such short-term debt instrument is approximately the same as the fair value of the instrument as determined without the use of amortized cost valuation. Floating rate loans are generally valued based upon
BHFTII-16
Brighthouse Funds Trust II
T. Rowe Price Small Cap Growth Portfolio
Notes to Financial Statements—December 31, 2023—(Continued)
an evaluated or composite average of aggregate bid and ask quotations supplied by brokers or dealers, as obtained from the pricing service. Securities that use similar valuation techniques and inputs as described above are generally categorized as Level 2 within the fair value hierarchy.
Options, whether on securities, indices, futures contracts, or otherwise, traded on exchanges are valued at the last sale price available as of the close of business on a valuation day or, if there is no such price available, at the last reported bid price. These types of options are categorized as Level 1 within the fair value hierarchy. Futures contracts that are traded on commodity exchanges are valued at their settlement prices established by the exchanges on which they are traded as of the close of such exchanges and are categorized as Level 1 within the fair value hierarchy.
If no current market quotation is readily available or market value quotations are deemed to be unreliable for an investment, the fair value of the investment will be determined in accordance with procedures. A market quotation is readily available only when that quotation is a quoted price (unadjusted) in active markets for identical investments that the Portfolio can access at the measurement date, provided that a quotation will not be readily available if it is not reliable.
Pursuant to Rule 2a-5 under the 1940 Act, the Board of Trustees (the “Board” or “Trustees”) of the Trust has designated Brighthouse Investment Advisers, acting through its Valuation Committee (“Committee”), as the Portfolio’s “valuation designee” to perform the Portfolio’s fair value determinations. The Board oversees Brighthouse Investment Advisers in its role as the Valuation Designee and receives reports from Brighthouse Investment Advisers regarding its process and the valuation of the Portfolio’s investments to assist with such oversight.
No single standard for determining the fair value of an investment can be set forth because fair value depends upon the facts and circumstances with respect to each investment. Information relating to any relevant factors may be obtained by the Committee from any appropriate source, including the subadviser of the Portfolio, the Custodian, a pricing service, market maker and/or broker for such security or the issuer. Appropriate methodologies for determining fair value under particular circumstances may include: matrix pricing, a discounted cash flow analysis, comparisons of securities with comparable characteristics, value based on multiples of earnings, discount from market price of similar marketable securities, or a combination of these and other methods.
Foreign Currency Translation - The books and records of the Portfolio are maintained in U.S. dollars. The values of securities, currencies, and other assets and liabilities denominated in currencies other than the U.S. dollar are translated into U.S. dollars based upon foreign exchange rates prevailing at the end of the period. Purchases and sales of investment securities, income, and expenses are translated on the respective dates of such transactions. Because the values of investment securities are translated at the foreign exchange rates prevailing at the end of the period, that portion of the results of operations arising from changes in exchange rates and that portion of the results of operations reflecting fluctuations arising from changes in market prices of the investment securities are not separated. Such fluctuations are included in the net realized and unrealized gain or loss on investments.
Net realized foreign exchange gains or losses arise from activity in forward foreign currency exchange contracts, sales of foreign currency, currency gains or losses realized between the trade and settlement dates on securities transactions, and the difference between the amounts of dividends, interest, and foreign withholding taxes recorded by the Portfolio and the U.S. dollar-equivalent of the amounts actually received or paid by the Portfolio. Net unrealized foreign exchange gains and losses arise from changes in the value of assets and liabilities, other than investment securities, resulting from changes in foreign exchange rates.
Investment Transactions and Related Investment Income - Portfolio security transactions are recorded on the trade date. Dividend income is recorded on the ex-dividend date or, for certain foreign securities, when notified. Interest income, which includes amortization of premium and accretion of discount on debt securities, is recorded on the accrual basis. Realized gains and losses on investments are determined on the identified cost basis, which is the same basis used for federal income tax purposes. Foreign income and foreign capital gains on some foreign securities may be subject to foreign taxes, which are accrued as applicable. These foreign taxes have been provided for in accordance with the Portfolio’s understanding of the applicable countries’ tax rules and rates.
Dividends and Distributions to Shareholders - The Portfolio records dividends and distributions on the ex-dividend date. Net realized gains from securities transactions (if any) are generally distributed annually to shareholders. The timing and characterization of certain income and capital gains distributions are determined in accordance with federal tax regulations that may differ from GAAP. Permanent book and tax basis differences relating to shareholder distributions will result in reclassification between distributable earnings (accumulated losses) and paid in surplus. These adjustments have no impact on net assets or the results of operations.
Income Taxes - It is the Portfolio’s policy to comply with the requirements of the Internal Revenue Code of 1986, as amended, and regulations thereunder, applicable to regulated investment companies, and to distribute, with respect to each taxable year, all of its taxable income to shareholders. Therefore, no federal income tax provision is required. The Portfolio files U.S. federal tax returns. No income tax returns are currently under examination. The Portfolio’s federal tax returns remain subject to examination by the Internal Revenue Service for three fiscal years after the returns are filed. As of December 31, 2023, the Portfolio had no uncertain tax positions that would require financial statement recognition, derecognition or disclosure.
BHFTII-17
Brighthouse Funds Trust II
T. Rowe Price Small Cap Growth Portfolio
Notes to Financial Statements—December 31, 2023—(Continued)
Repurchase Agreements - The Portfolio may enter into repurchase agreements, under the terms of a Master Repurchase Agreement (“MRA”), or Global Master Repurchase Agreement (“GMRA”), with selected commercial banks and broker-dealers, under which the Portfolio acquires securities as collateral and agrees to resell the securities at an agreed-upon time and at an agreed-upon price. The Portfolio, through the Custodian or a subcustodian, under a tri-party repurchase agreement, receives delivery of the underlying securities collateralizing any repurchase agreements. It is the Portfolio’s policy that the market value of the collateral be equal to at least 100% of the repurchase price in the case of a repurchase agreement of one-day duration and equal to at least 102% of the repurchase price in the case of all other repurchase agreements. In the event of default or failure by a party to perform an obligation in connection with any repurchase transaction, the MRA or GMRA gives the non-defaulting party the right to set-off claims and to apply property held by it in connection with any repurchase transaction against obligations owed to it under the agreement.
At December 31, 2023, the Portfolio invested cash collateral for loans of portfolio securities in repurchase agreements with a gross value of $83,618,557, which is included as part of investments at value on the Statement of Assets and Liabilities. The value of the related collateral exceeded the value of the repurchase agreements at December 31, 2023.
Securities Lending - The Portfolio may lend its portfolio securities to certain qualified brokers who borrow securities in order to complete certain securities transactions. By lending its portfolio securities, the Portfolio attempts to increase its net investment income through the receipt of income on collateral held from securities on loan. Any gain or loss in the market price of the loaned securities that might occur, any interest earned, and any dividends declared during the term of the loan, would accrue to the account of the Portfolio.
The Trust has entered into a Non-Custodial Securities Lending Agreement with JPMorgan Chase Bank, N.A. (the “Lending Agent”). Under the agreement, the Lending Agent is authorized to loan portfolio securities on the Portfolio’s behalf. In exchange, the Portfolio generally receives cash, U.S. Government securities, letters of credit, or other collateral deemed appropriate by the Adviser. The Portfolio receives collateral equal to at least 102% of the market value for loans secured by government securities or cash in the same currency as the loaned shares and 105% for all other loaned securities at each loan’s inception. Collateral representing at least 100% of the market value of the loaned securities is maintained for the duration of the loan. Any cash collateral received by the Portfolio is generally invested by the Lending Agent in short-term investments, which may include certificates of deposit, commercial paper, repurchase agreements, including repurchase agreements with respect to equity securities, time deposits, master demand notes and money market funds. The market value of investments made with cash collateral received are disclosed in the Schedule of Investments and the valuation techniques are described in Note 2. The value of the securities on loan may change each business day. If the market value of the collateral at the close of trading on a business day is less than 100% of the market value of the loaned securities at the close of trading on that day, the borrower is required to deliver, by the close of business on the following business day, an additional amount of collateral, so that the total amount of posted collateral is equal to at least 100% of the market value of all the loaned securities as of such preceding day. A portion of the income earned on the collateral is rebated to the borrower of the securities and the remainder is split between the Lending Agent and the Portfolio. On loans collateralized by U.S. government securities, a fee is received from the borrower and is allocated between the Portfolio and the Lending Agent.
Income received by the Portfolio in securities lending transactions during the year ended December 31, 2023 is reflected as securities lending income on the Statement of Operations. The values of any securities loaned by the Portfolio and the related collateral at December 31, 2023 are disclosed in the footnotes to the Schedule of Investments. The value of the related collateral received by the Portfolio exceeded the value of the securities out on loan at December 31, 2023.
The risks associated with lending portfolio securities include, but are not limited to, possible delays in receiving additional collateral or in the recovery of the loaned securities, possible loss of rights in the collateral should the borrower fail financially, as well as risk of loss in the value of the collateral or the value of the investments made with the collateral. To the extent the Portfolio uses cash collateral it receives to invest in repurchase agreements with respect to equity securities, it is subject to the risk of loss if the value of the equity securities declines and the counterparty defaults on its obligation to repurchase such securities. The Lending Agent shall indemnify the Portfolio in the case of default of any securities borrower, subject to the terms of the Non-Custodial Securities Lending Agreement.
All securities on loan are classified as Common Stocks in the Portfolio’s Schedule of Investments as of December 31, 2023. For all securities on loan, the remaining contractual maturity of the agreements is overnight and continuous.
3. Certain Risks
In the normal course of business, the Portfolio invests in securities and enters into transactions where risks exist. Those risks include:
Market Risk: The value of securities held by the Portfolio may decline in response to certain events, including those directly involving the issuers whose securities are owned by the Portfolio; conditions affecting the general economy; overall market changes; local, regional or global political, social or economic instability; currency, interest rate, and price fluctuations, or other factors including terrorism, war, natural disasters and the spread of infectious illness including epidemics or pandemics such as the COVID-19 pandemic. These events may also adversely affect the liquidity of securities held by the Portfolio.
BHFTII-18
Brighthouse Funds Trust II
T. Rowe Price Small Cap Growth Portfolio
Notes to Financial Statements—December 31, 2023—(Continued)
Credit and Counterparty Risk: The Portfolio may be exposed to counterparty risk, or the risk that an entity with which the Portfolio has unsettled or open transactions may default. The potential loss could exceed the value of the financial assets and liabilities recorded in the financial statements. Financial assets that potentially expose the Portfolio to credit and counterparty risk consist principally of cash due from counterparties and investments. The Portfolio manages counterparty risk by entering into agreements only with counterparties that it believes have the financial resources to honor their obligations and by monitoring the financial stability of those counterparties. The Subadviser may attempt to mitigate counterparty risk by (i) periodically assessing the creditworthiness of its trading partners, (ii) monitoring and/or limiting the amount of its net exposure to each individual counterparty based on its assessment, and (iii) requiring collateral from the counterparty for certain transactions. In order to preserve certain safeguards for non-standard settlement trades, the Portfolio restricts its exposure to credit and counterparty losses by entering into master netting agreements (“Master Agreements”) with counterparties (approved brokers) with whom it undertakes a significant volume of transactions. Master Agreements govern the terms of certain transactions and reduce the counterparty risk associated with relevant transactions by specifying credit protection mechanisms and providing standardization that improves legal certainty. Master Agreements can also help limit counterparty risk by specifying collateral posting arrangements at pre-arranged exposure levels.
Repurchase and reverse repurchase agreements are primarily executed under GMRAs or MRAs, which provide the right to set-off. Each repurchase and reverse repurchase agreement is initially collateralized at the transaction level. In the event of default, the total market value exposure will be offset against collateral exchanged to date, which would result in a net receivable/(payable) that would be due from/to the counterparty.
Additional risks associated with each type of investment are described above within the respective security type notes. The Portfolio’s prospectus includes a discussion of the principal risks of investing in the Portfolio.
4. Investment Transactions
Aggregate cost of purchases and proceeds of sales of investment securities, excluding short-term securities, for the year ended December 31, 2023 were as follows:
| Purchases |
Sales | |||||||||||
| U.S. Government |
Non-U.S. Government | U.S. Government | Non-U.S. Government | |||||||||
| $0 | $ | 397,474,702 | $ | 0 | $ | 542,953,500 | ||||||
5. Investment Management Fees and Other Transactions with Affiliates
Investment Management Agreement - Brighthouse Investment Advisers is the investment adviser to the Portfolio. The Trust has entered into an investment management agreement with Brighthouse Investment Advisers with respect to the Portfolio. For providing investment management services to the Portfolio, Brighthouse Investment Advisers receives monthly compensation at the following annual rates:
|
Management |
% per annum | Average Daily Net Assets | ||||
| $5,536,286 | 0.550 | % | Of the first $100 million | |||
| 0.500 | % | Of the next $300 million | ||||
| 0.450 | % | On amounts in excess of $400 million | ||||
Brighthouse Investment Advisers has entered into an investment subadvisory agreement with respect to managing the Portfolio. T. Rowe Price Associates, Inc. (“T. Rowe Price”) is compensated by Brighthouse Investment Advisers to provide subadvisory services for the Portfolio.
Management Fee Waivers - T. Rowe Price agreed to a voluntary subadvisory fee waiver that applies if (i) assets under management by T. Rowe Price for the Trust and Brighthouse Funds Trust I (“BHFTI”), an affiliate of the Trust, in the aggregate, exceed $750 million (ii) T. Rowe Price subadvises three or more portfolios of the Trust and BHFTI in the aggregate, and (iii) at least one of those portfolios is a large cap domestic equity portfolio.
If the aforementioned conditions are met, T. Rowe Price will waive its subadvisory fee paid by Brighthouse Investment Advisers by 5% for combined Trust and BHFTI average daily net assets over $750 million, 7.5% for the next $1.5 billion of combined assets, and 10% for amounts over $3 billion. Brighthouse Investment Advisers has voluntarily agreed to reduce its advisory fee for the Portfolio by the amount waived (if any) by T. Rowe Price for the Portfolio pursuant to this voluntary subadvisory fee waiver. Because these fee waivers are voluntary, and not contractual, they may be discontinued by T. Rowe Price and Brighthouse Investment Advisers at any time. Amounts waived for the year ended December 31, 2023 are shown as management fee waivers in the Statement of Operations.
BHFTII-19
Brighthouse Funds Trust II
T. Rowe Price Small Cap Growth Portfolio
Notes to Financial Statements—December 31, 2023—(Continued)
Certain officers and trustees of the Trust may also be officers of the Adviser; however, such officers and trustees receive no compensation from the Trust.
Transfer Agency Agreement - Brighthouse Life Insurance Company serves as the transfer agent for the Trust. Brighthouse Life Insurance Company receives no fees for its services to the Trust.
Distribution and Service Fees - The Trust has a distribution agreement with Brighthouse Securities, LLC (the “Distributor”) pursuant to which the Distributor serves as the general distributor of shares of each class (each a “Class”) of each Portfolio. The Distributor is an affiliate of the Trust. The Trust has adopted a Distribution and Services Plan (the “D&S Plan”) relating to Class B, Class D, Class E, Class F and Class G shares of each Portfolio, under Rule 12b-1 under the 1940 Act, pursuant to which the Trust may pay the Distributor a fee (the “Service Fee”) at an annual rate not to exceed 0.25% of each such Portfolio’s average daily net assets attributable to the Class B, Class D, Class E, Class F and Class G shares of the Trust. Each Portfolio may not offer shares of each Class. The D&S Plan also authorizes the Trust, on behalf of each of its Portfolios, to pay to the Distributor a distribution fee (the “Distribution Fee” and together with the Service Fee, the “Fees”) at an annual rate of up to 0.25% of each Portfolio’s average daily net assets attributable to the Class B, Class D, Class E, Class F, and Class G shares in consideration of the services rendered in connection with the sale of such shares by the Distributor. Under the Distribution Agreement with respect to the Trust, Fees are currently paid at an annual rate of 0.25% of average daily net assets in the case of Class B shares, 0.10% of average daily net assets in the case of Class D shares, 0.15% of average daily net assets in the case of Class E shares, 0.20% of average daily net assets in the case of Class F shares and 0.30% of average daily net assets in the case of Class G shares. The D&S Plan is known as a “compensation plan” because the Trust makes payments to the Distributor for services rendered regardless of the actual level of expenditures by the Distributor. Amounts incurred by the Portfolio for the year ended December 31, 2023 are shown as Distribution and service fees in the Statement of Operations.
Deferred Trustee Compensation - Each Trustee who is not currently an employee of the Adviser or any of its affiliates receives compensation from the Trust for his or her service to the Trust. A deferred compensation plan (the “Plan”) is available to the Trustees on a voluntary basis. Deferred amounts remain in the Trust until distributed in accordance with the provisions of the Plan. The value of a participating Trustee’s deferral account is based on theoretical investments of deferred amounts on the normal payment dates in certain portfolios of the Trust or Brighthouse Funds Trust I, an affiliate of the Trust, as designated by the participating Trustee. Changes in the value of participants’ deferral accounts are reflected as a component of Trustees’ fees and expenses in the Statement of Operations. The portion of the accrued obligations allocated to the Portfolio under the Plan is reflected as Deferred trustees’ fees in the Statement of Assets and Liabilities.
6. Transactions in Securities of Affiliated Issuers
A summary of the Portfolio’s transactions in the securities of affiliated issuers during the year ended December 31, 2023 is as follows:
| Security Description |
Market Value December 31, 2022 |
Purchases | Sales | Ending Value as of December 31, 2023 |
Income earned from affiliates during the period |
Number of shares held at December 31, 2023 | ||||||||
| T. Rowe Price Government Reserve Fund | $ | 12,481,374 | $153,833,426 | $(163,391,821) | $2,922,979 | $478,760 | 2,922,979 | |||||||
7. Contractual Obligations
Under the Trust’s organizational documents, its officers and Trustees may be indemnified against certain liabilities and expenses arising out of the performance of their duties to the Trust. Additionally, the Trust has a variety of indemnification obligations under contracts with its service providers. The Trust’s maximum exposure under these arrangements is unknown, as this would involve future claims that may be made against the Trust that have not yet occurred.
8. Income Tax Information
The cost basis of investments for federal income tax purposes at December 31, 2023 was as follows:
| Cost basis of investments |
$ | 1,058,507,286 | ||
|
|
|
|||
| Gross unrealized appreciation |
346,003,955 | |||
| Gross unrealized (depreciation) |
(48,865,046 | ) | ||
|
|
|
|||
| Net unrealized appreciation (depreciation) |
$ | 297,138,909 | ||
|
|
|
BHFTII-20
Brighthouse Funds Trust II
T. Rowe Price Small Cap Growth Portfolio
Notes to Financial Statements—December 31, 2023—(Continued)
The tax character of distributions paid for the years ended December 31, 2023 and 2022 were as follows:
| Ordinary Income |
Long-Term Capital Gain | Total | ||||||||||||||||||
| 2023 |
2022 | 2023 | 2022 | 2023 | 2022 | |||||||||||||||
| $470,640 | $ | 8,966,857 | $ | 29,378,866 | $ | 232,047,069 | $ | 29,849,506 | $ | 241,013,926 | ||||||||||
As of December 31, 2023, the components of distributable earnings (accumulated losses) on a federal income tax basis were as follows:
| Undistributed |
Undistributed Long-Term Capital Gain |
Net Unrealized Appreciation (Depreciation) |
Accumulated Capital Losses |
Total | ||||||||||||
| $537,739 | $ | 63,014,842 | $ | 297,138,909 | $ | — | $ | 360,691,490 | ||||||||
The Portfolio utilizes the provisions of the federal income tax laws that provide for the carryforward of capital losses for prior years, offsetting such losses against any future realized capital gains. Net capital losses may be carried forward indefinitely and their character is retained as short-term and/or long-term losses.
As of December 31, 2023, the Portfolio had no accumulated capital losses.
9. Recent Accounting Pronouncement & Regulatory Updates
In June 2022, FASB issued Accounting Standards Update 2022-03—Fair Value Measurement (Topic 820)—Fair Value Measurement of Equity Securities Subject to Contractual Sale Restrictions (“ASU 2022-03”). ASU 2022-03 clarifies the guidance in Topic 820 to indicate that a contractual sale restriction should not be considered in the fair value of an equity security subject to such a restriction, and requires entities with investments in equity securities subject to contractual sale restrictions to disclose certain qualitative and quantitative information about such securities. ASU 2022-03 is effective for fiscal years, and interim periods within those fiscal years, beginning after December 15, 2023. ASU 2022-03 is only applicable to an equity security in which the contractual arrangement that restricts its sale is executed or modified on or after the adoption date.
Effective January 24, 2023, the Securities and Exchange Commission adopted rule and form amendments that require open-end management investment companies to transmit concise and visually engaging annual and semiannual reports to shareholders that highlight certain information deemed by the SEC to be particularly important for investors. Certain other information, including financial statements, will no longer appear in shareholder reports but will, as required, be available online, delivered free of charge upon request, and filed on a semiannual basis on Form N-CSR. The rule and form amendments have a compliance date of July 24, 2024. Accordingly, the rule and form amendments will not impact the Portfolio until its 2024 semiannual shareholder report.
BHFTII-21
Brighthouse Funds Trust II
T. Rowe Price Small Cap Growth Portfolio
Report of Independent Registered Public Accounting Firm
To the Board of Trustees of Brighthouse Funds Trust II and Shareholders of the T. Rowe Price Small Cap Growth Portfolio:
Opinion on the Financial Statements and Financial Highlights
We have audited the accompanying statement of assets and liabilities, including the schedule of investments, of the T. Rowe Price Small Cap Growth Portfolio (the “Fund”) (one of the funds constituting the Brighthouse Funds Trust II), as of December 31, 2023, the related statement of operations for the year then ended, the statements of changes in net assets for each of the two years in the period then ended, the financial highlights for each of the five years in the period then ended, and the related notes. In our opinion, the financial statements and financial highlights present fairly, in all material respects, the financial position of the Fund as of December 31, 2023, and the results of its operations for the year then ended, the changes in its net assets for each of the two years in the period then ended, and the financial highlights for each of the five years in the period then ended in conformity with accounting principles generally accepted in the United States of America.
Basis for Opinion
These financial statements and financial highlights are the responsibility of the Fund’s management. Our responsibility is to express an opinion on the Fund’s financial statements and financial highlights based on our audits. We are a public accounting firm registered with the Public Company Accounting Oversight Board (United States) (PCAOB) and are required to be independent with respect to the Fund in accordance with the U.S. federal securities laws and the applicable rules and regulations of the Securities and Exchange Commission and the PCAOB.
We conducted our audits in accordance with the standards of the PCAOB. Those standards require that we plan and perform the audit to obtain reasonable assurance about whether the financial statements and financial highlights are free of material misstatement, whether due to error or fraud. The Fund is not required to have, nor were we engaged to perform, an audit of its internal control over financial reporting. As part of our audits we are required to obtain an understanding of internal control over financial reporting but not for the purpose of expressing an opinion on the effectiveness of the Fund’s internal control over financial reporting. Accordingly, we express no such opinion.
Our audits included performing procedures to assess the risks of material misstatement of the financial statements and financial highlights, whether due to error or fraud, and performing procedures that respond to those risks. Such procedures included examining, on a test basis, evidence regarding the amounts and disclosures in the financial statements and financial highlights. Our audits also included evaluating the accounting principles used and significant estimates made by management, as well as evaluating the overall presentation of the financial statements and financial highlights. Our procedures included confirmation of securities owned as of December 31, 2023, by correspondence with the custodian and brokers; when replies were not received from brokers, we performed other auditing procedures. We believe that our audits provide a reasonable basis for our opinion.
/s/ Deloitte & Touche LLP
Boston, Massachusetts
February 23, 2024
We have served as the auditor of one or more Brighthouse investment companies since 1983.
BHFTII-22
Brighthouse Funds Trust II
Trustees and Officers
MANAGEMENT OF THE TRUSTS
The Boards of Trustees (the “Board”) of Brighthouse Funds Trust I and Brighthouse Funds Trust II (“Trust I” and “Trust II”, respectively, and collectively the “Trusts”) supervise the Trusts and are responsible for representing the interests of shareholders. The Trustees, the Chairman of the Board and the Chairmen of each subcommittee are the same for both Trusts. The Trustees of each Trust meet periodically throughout the year to oversee the Portfolios’ activities, reviewing, among other things, each Portfolio’s performance and its contractual arrangements with various service providers. The Trustees of each Trust elect the officers of the Trust, who are responsible for administering the Trust’s day-to-day operations.
Trustees and Officers
The Trustees and executive officers of the Trusts, as well as their ages and their principal occupations during the past five years, are set forth below. Unless otherwise indicated, the business address of each is c/o Brighthouse Funds Trust I and Brighthouse Funds Trust II, 11225 N. Community House Rd., Charolette, North Carolina 28277. Each Trustee who is deemed an “interested person,” as such term is defined in the 1940 Act, is referred to as an “Interested Trustee.” Those Trustees who are not “interested persons,” as such term is defined in the 1940 Act, are referred to as “Independent Trustees.” There is no limit to the term a Trustee may serve, other than pursuant to the retirement policy adopted by the Independent Trustees. Trustees serve until their death, resignation, retirement or removal in accordance with Trust I’s and Trust II’s respective organizational documents and policies adopted by the Board of the Trust from time to time. Officers hold office at the pleasure of each Board and serve until their removal or resignation in accordance with the Trusts’ respective organizational documents and policies adopted by the Board of each Trust from time to time.
Trustees of the Trusts
| Name and Year of Birth |
Position(s) |
Term of Office |
Principal Occupation(s) During the Past |
Number of |
Other Directorships Held | |||||
| Interested Trustee | ||||||||||
| John Rosenthal* (1960) |
Trustee | Indefinite; From May 2016 (Trust I and Trust II) to present | Chief Investment Officer, Brighthouse Financial, Inc. (2016 to present). | 73 | None | |||||
| Independent Trustees | ||||||||||
| Dawn M. Vroegop (1966) |
Trustee and Chair of the Board | Indefinite; From December 2000 (Trust I)/May 2009 (Trust II) to present as Trustee; From May 2016 (Trust I and Trust II) until present as Chair | Retired; Private Investor. | 73 | Trustee, Driehaus Mutual Funds (8 portfolios).** | |||||
| Stephen M. Alderman (1959) |
Trustee | Indefinite; From December 2000 (Trust I)/April 2012 (Trust II) to present | Vice President and General Counsel, IHR Aerial Solutions, LLC; Until 2022, General Counsel, Illini Hi-Reach, Inc.; Until 2020, Shareholder in the law firm of Garfield & Merel, Ltd. | 73 | None | |||||
| Robert J. Boulware (1956) |
Trustee | Indefinite; From March 2008 (Trust I)/April 2012 (Trust II) to present | Managing Member, Pilgrim Funds, LLC (private equity fund). | 73 | Trustee, Vertical Capital Income Fund (closed-end fund);** Trustee, The Private Shares Fund (closed- end fund);** Until 2021, Director, Mid- Con Energy Partners, LP (energy);** Until 2020, Director, Gainsco, Inc. (auto insurance).** | |||||
BHFTII-23
Brighthouse Funds Trust II
Trustees and Officers—(Continued)
| Name and Year of Birth |
Position(s) |
Term of Office |
Principal Occupation(s) During the Past |
Number of |
Other Directorships Held | |||||
| Susan C. Gause (1952) |
Trustee | Indefinite; From March 2008 (Trust I)/April 2012 (Trust II) to present | Private Investor. | 73 | Trustee, HSBC Funds (4 portfolios).** | |||||
| Nancy Hawthorne (1951) |
Trustee | Indefinite; From May 2003 (Trust II)/April 2012 (Trust I) to present | Private Investor. | 73 | Trustee, First Eagle Credit Opportunities Fund;** Trustee and Chair of the Board of Trustees, First Eagle Global Opportunities Fund;** Director, Avid Technology, Inc;** Director, CRA International, Inc.** | |||||
Executive Officers of the Trusts
| Name and Year of Birth |
Position(s) |
Term of Office |
Principal Occupation(s) | |||
| Kristi Slavin (1973) | President and Chief Executive Officer, of Trust I and Trust II | From May 2016 (Trust I and Trust II) to present |
President, Brighthouse Investment Advisers, LLC (2016-present). | |||
| Alan R. Otis (1971) | Chief Financial Officer and Treasurer, of Trust I and Trust II | From November 2017 (Trust I and Trust II) to present |
Executive Vice President, Brighthouse Investment Advisers, LLC (2017-present); formerly, Vice President, Brighthouse Investment Advisers, LLC (2012-2017); Assistant Treasurer, Trust I and Trust II (2012-2017). | |||
| Thomas Watterson (1985) | Secretary, of Trust I and Trust II | From November 2023 (Trust I and Trust II) to present |
Executive Vice President, Chief Legal Officer and Secretary, Brighthouse Investment Advisers, LLC (2023-Present); Managing Corporate Counsel, Brighthouse Financial Inc. (2023-present); Managing Counsel and Director, The Bank of New York Mellon Corporation (2019-2023); Counsel and Vice President, The Bank of New York Mellon Corporation (2016-2019). | |||
| Katie Hellmann (1980) | Chief Compliance Officer (“CCO”), of Trust I and Trust II | From May 2023 (Trust I and Trust II) to present |
Chief Compliance Officer, Brighthouse Investment Advisers, LLC (2023-present) and Head of Funds and Investments Compliance (2023-present). Deputy Chief Compliance Officer, Transamerica Asset Management (2022-2023). Leader and Senior Compliance Counsel-Funds Compliance, Edward Jones (2017-2022). | |||
| Rosemary Morgan (1983) | Anti-Money Laundering Officer, of Trust I and Trust II | From May 2023 (Trust I and Trust II) to present |
Chief Privacy Officer, Leader of Compliance Programs and Assistant General Counsel, Brighthouse Financial, Inc. (2019-2022); Chief Privacy Officer, Head of Compliance Programs & Contracts Law, Brighthouse Financial, Inc. (2022-2023), Chief Compliance Officer and Associate General Counsel, Brighthouse Financial, Inc. (2023-present); Vice President and Chief Compliance Officer, Brighthouse Life Insurance Company (2023-present); Vice President and Chief Compliance Officer (2023-present), Brighthouse Life Insurance Company of NY; Vice President and Chief Compliance Officer (2023-present), New England Life Insurance Company. | |||
| Anna Koska (1981) | Vice President, of Trust I and Trust II | From June 2022 (Trust I and Trust II) to present |
Vice President, Investment and Advisory Services, Brighthouse Investment Advisers, LLC (2022-present); Director of Investment and Advisory Services, Brighthouse Investment Advisers, LLC (2019-2022); Senior Portfolio Analyst, Brighthouse Investment Advisers, LLC (2017-2019). | |||
| * | Mr. Rosenthal is an “interested person” of the Trusts because of his position with Brighthouse Financial, Inc. (“Brighthouse Financial”), an affiliate of BIA. |
| ** | Indicates a directorship with a registered investment company or a company subject to the reporting requirements of the Securities Exchange Act of 1934, as amended. |
| (1) | Previous positions during the past five years with the Trusts, MetLife, Inc. or the Adviser are omitted if not materially different. |
| (2) | The Fund Complex includes 44 Trust I Portfolios and 29 Trust II Portfolios. |
BHFTII-24
Brighthouse Funds Trust II
T. Rowe Price Small Cap Growth Portfolio
Board of Trustees’ Consideration of Advisory and Sub-Advisory Agreements
At a meeting held on November 13-14, 2023 (the “November Meeting”), the Boards of Trustees (the “Board”) of Brighthouse Funds Trust I and Brighthouse Funds Trust II (“BFT I” and “BFT II,” respectively, and collectively, the “Trusts”), including a majority of the Trustees who are not “interested persons” of the Trusts (the “Independent Trustees”) under the Investment Company Act of 1940 (the “1940 Act”), approved the continuation of the Trusts’ advisory agreements (each an “Advisory Agreement”) with Brighthouse Investment Advisers, LLC (the “Adviser”) and the applicable sub-advisory and sub-sub-advisory agreements (each a “Sub-Advisory Agreement” and collectively with the Advisory Agreement, the “Agreements”) between the Adviser and the investment sub-advisers and sub-sub-adviser (each a “Sub-Adviser,” and collectively, the “Sub-Advisers”) for the series of the Trusts (each a “Portfolio,” and collectively, the “Portfolios”) for the annual contract renewal period from January 1, 2024 through December 31, 2024.
The Board met with personnel of the Adviser on September 28-29, 2023 (the “September Meeting”) for the specific purpose of giving preliminary consideration to the proposed continuation of the Agreements, including consideration to information that the Adviser and Sub-Advisers had provided for the Board’s review at the request of the Independent Trustees. At the September Meeting, the Adviser reviewed with the Board the performance and fees experienced by each Portfolio, as well as other information. During and after the September Meeting, the Independent Trustees requested additional information and clarifications that the Adviser addressed at the November Meeting (the September Meeting and the November Meeting are referred to collectively as, the “Meetings”). During the contract renewal process, and throughout the year, the Independent Trustees were advised by independent legal counsel, and they met with independent legal counsel in executive sessions outside of the presence of management on a number of occasions to discuss, among other things, the renewal of the Agreements.
In considering the continuation of the Agreements, the Board reviewed a variety of materials that were provided for the specific purpose of assisting the Board in the renewal process, along with various information and materials that were provided to and discussed with the Board throughout the year, at regularly scheduled meetings of the Board and its committees. In particular, information for each Portfolio included, but was not limited to, reports on investment performance, expenses, legal and compliance matters, and asset pricing. Information about the Adviser and each Sub-Adviser included, but was not limited to, reports on the business, operations, and performance of the Adviser and the Sub-Advisers and reports that the Adviser and Sub-Advisers had prepared specifically for the renewal process.
In considering the continuation of the Agreements, the Board also reviewed, among other things, a report for each Portfolio that was prepared by Broadridge (“Broadridge”), an independent organization, which set forth comparative performance and expense information for each Portfolio. In addition, the Independent Trustees reviewed a report that was prepared by JDL Consultants, LLC (“JDL”), an independent consultant to the Independent Trustees, which examined the Broadridge reports for each Portfolio (“JDL Report”). The Independent Trustees met in executive session with representatives of JDL during the September Meeting to review the JDL Report.
At the November Meeting, the Board, including a majority of the Independent Trustees, concluded that the nature, extent, and quality of services provided by the Adviser and each Sub-Adviser supported the renewal of the Agreements. The Board also concluded that the investment services provided to and the performance of each Portfolio was such that each Agreement should continue, and that the fees paid by each Portfolio to the Adviser appeared to be reasonable in light of the nature, extent, and quality of the services provided by the Adviser and each Sub-Adviser. Further, the Board concluded that the Adviser’s profitability in providing services under the Advisory Agreements did not appear unreasonable in light of the nature, extent, and quality of the services provided by the Adviser. The Board reviewed the extent to which the investment advisory fees paid by the Portfolios shared economies of scale with investors or entailed the potential to share economies of scale with investors and concluded that those considerations generally supported the renewal of each Agreement. Finally, the Board considered the Adviser’s recommendation that it approve the renewal of each Sub-Advisory Agreement.
In approving the continuation of each Agreement, the Board, including the Independent Trustees, gave attention to all of the information that was furnished, and each Trustee placed varying degrees of importance on the various pieces of information that were provided to them. The Board evaluated the information provided to it on a Portfolio-by-Portfolio basis, and its decision was made separately with respect to each Portfolio. The following paragraphs provide more information about some of the primary factors that were relevant to the Board’s decisions. The Board did not identify any single factor as determinative, and the Trustees generally attributed different weights to various factors for the various Portfolios.
Nature, extent and quality of services. The Board evaluated the nature, extent, and quality of the services that the Adviser and the Sub-Advisers, as relevant, provided to the Portfolios. The Board considered the Adviser’s services as investment manager to the Portfolios, including its services relating to the hiring and oversight of the Sub-Advisers and, in particular, their investment programs and personnel, succession management of key personnel, trading practices, compliance programs and personnel, and risk management
BHFTII-25
Brighthouse Funds Trust II
T. Rowe Price Small Cap Growth Portfolio
Board of Trustees’ Consideration of Advisory and Sub-Advisory Agreements—(Continued)
programs, among other things. The Adviser’s services in coordinating and overseeing the activities of the Trusts’ other service providers were also considered. The Board also considered the systems and processes required by the Adviser to meet additional regulatory and compliance requirements resulting from U.S. Securities and Exchange Commission and other regulatory initiatives, including related to liquidity, valuation, and derivatives risk management. The Board considered information received from the Trusts’ Chief Compliance Officer regarding the Portfolios’ compliance policies and procedures that were established pursuant to Rule 38a-l under the 1940 Act, and relevant aspects of the Adviser’s and Sub-Advisers’ compliance policies and procedures. The Board also noted that it was the practice of the Adviser’s investment, compliance, and legal staff to conduct periodic meetings (through various media) with the Sub-Advisers throughout the year in order to review and assess the services that are provided to the Portfolios, and that personnel of the Adviser routinely prepare and present reports to the Board regarding those meetings. In addition, during the Meetings and throughout the year, the Board considered the expertise, experience, and performance of the personnel of the Adviser who performed the various services that are mentioned above.
With respect to the services provided by each of the Sub-Advisers, the Board considered a variety of information that the Adviser and each Sub-Adviser prepared for the Board’s review. The Board considered each Sub-Adviser’s investment process, each Sub-Adviser’s overall organization and business plans and the investment performance experienced by the Portfolio (as described in more detail below). The Board took into account that each Sub-Adviser’s responsibilities include, among other things, the development and maintenance of an investment program for the applicable Portfolio, the selection of investments and the placement of orders for the purchase and sale of such assets, and the implementation of compliance controls related to the performance of these services. The Board considered, based on the information provided, each Sub-Adviser’s staffing with respect to the management of the Portfolio and other information relating to the Sub-Adviser’s business and operations. The Board also considered the Sub-Adviser’s overall resources and information with respect to any recent turnover of key personnel at the Sub-Adviser. The Board reviewed each Sub-Adviser’s investment experience, as well as information provided regarding the Sub-Adviser’s personnel who provide services to the Portfolios. The Board also considered, among other things, information about each Sub-Adviser’s compliance program, including regarding any compliance matters involving a Sub-Adviser that had been brought to the Board’s attention during the year, as well as the Adviser’s assessment of the financial condition of each Sub-Adviser.
Performance. The Board placed emphasis on the performance of each Portfolio in the context of the performance of the relevant markets in which the Portfolio invests. The Board considered the Adviser’s quarterly presentations to the Board of detailed information about each Portfolio’s investment strategies and performance results and composition, including discussions regarding the relevant effects of market conditions. The Board reviewed and considered the reports prepared by Broadridge, which provided a statistical analysis comparing each Portfolio’s investment performance to that of comparable funds underlying variable insurance products (the “Performance Universe”), and the JDL Report. The Board also compared the performance of each Portfolio to that of comparable funds and other accounts that were managed by the relevant Sub-Adviser, to the extent such information was provided. The Board considered each Portfolio’s performance for periods subsequent to the performance period covered by the Broadridge reports and considered the Adviser’s assessment of the same. The Board also noted that while it found the data provided by Broadridge generally useful, it recognized the limitations of such data, including, in particular, that notable differences may exist between a Portfolio and the other funds in a Broadridge category (for example, with respect to investment strategies) and that the results of the performance comparisons may vary depending on (i) the end dates for the performance periods that were selected and (ii) the selection of the peer groups.
The Board focused particular attention on Portfolios with less favorable performance records. The Board noted the Adviser’s focus on each Sub-Adviser’s performance and that the Adviser had been active in monitoring and responding to any performance issues with respect to the Portfolios.
Fees and Expenses. The Board gave consideration to the level and method of computing the fees payable under the Agreements. The Board reviewed and considered the information in the JDL Report concerning fees and expenses. The Board also reviewed and considered the Broadridge report for each Portfolio, which included various comparisons of the Portfolio’s fees (at December 31, 2022 and various asset levels) and expenses with those of its peers, including, as applicable, a broad group of peer funds (“Expense Universe”), a narrower group of peer funds (“Expense Group”), a broad group of peer sub-advised funds (“Sub-advised Expense Universe”), and a narrower group of peer sub-advised funds (“Sub-advised Expense Group”). In particular, the Board reviewed comparisons of each Portfolio’s contractual management fees with its Expense Group and Sub-advised Expense Universe, contractual sub-adviser fees with its Sub-advised Expense Universe and Sub-advised Expense Group, and total expenses with its Expense Universe, Expense Group and Sub-advised Expense Universe. The Board considered that Broadridge selected the peer funds, which were funds
BHFTII-26
Brighthouse Funds Trust II
T. Rowe Price Small Cap Growth Portfolio
Board of Trustees’ Consideration of Advisory and Sub-Advisory Agreements—(Continued)
underlying variable insurance products that Broadridge deemed to be comparable to the Portfolios. The Board considered that the fee and expense information in the Broadridge report for each Portfolio reflected information as of the Portfolio’s most recent fiscal year end at the time the Broadridge report was issued and that historical asset levels may differ from current asset levels, particularly in a period of market volatility. In addition, the Board compared the fee payable to a Sub-Adviser by the Adviser with respect to the Portfolio to the fee payable to the Sub-Adviser by other comparable funds and other accounts, to the extent such information was provided.
The Board noted that the sub-advisory fees for the Portfolios are negotiated at arm’s length by the Adviser and are paid by the Adviser out of its advisory fees. The Board also considered that the Adviser had entered into expense limitation or management fee waiver agreements with certain of the Portfolios pursuant to which the Adviser had agreed to waive a portion of its advisory fee and/or reimburse certain expenses as a means of limiting a Portfolio’s total annual operating expenses or passing through the benefit of a subadvisory fee concession to a Portfolio, as applicable.
Profitability. The Board examined the profitability to the Adviser of each Advisory Agreement, on a Portfolio-by-Portfolio basis. The Board also considered that an affiliate of the Adviser, Brighthouse Securities, LLC, serves as distributor for the Trusts, and, as such, receives Rule 12b-1 payments to support the distribution of the Portfolios. The Board considered the profitability to the Sub-Advisers and their affiliates of their relationships with the Portfolios, to the extent provided, and the Board considered the ability of the Adviser to negotiate with a Sub-Adviser at arm’s length. In reviewing the profitability information, the Board recognized that expense allocation methodologies are inherently subjective and various methodologies may be reasonable while producing different results.
Economies of scale. The Board considered each Portfolio’s fees in light of its size. The Board noted the fee schedules for the Portfolios that contain breakpoints that reduce the fee rate above specified asset levels, including breakpoints in the Advisory Agreements and any corresponding Sub-Advisory Agreement. The Board noted those Portfolios that did not have breakpoints in their advisory fees and considered management’s explanation of the same.
The Board considered the effective fees under the Advisory Agreement and Sub-Advisory Agreement for each Portfolio as a percentage of assets at different asset levels and possible economies of scale that may be realized if the assets of the Portfolio grow. The Board examined, among other data, the effect of a Portfolio’s growth in size, and reduction in size, on various fee schedules. The Board also generally noted that if a Portfolio’s assets increase over time, the Portfolio may realize economies of scale if assets increase proportionally more than certain other expenses.
Other factors. The Board considered other benefits that may be realized by the Adviser and its affiliates from their relationships with the Trusts. Among the benefits realized by the Adviser, the Board recognized that Brighthouse Securities, LLC, as the distributor for the Trusts, receives payments pursuant to Rule 12b-1 from the Portfolios to help compensate for the provision of shareholder services and distribution activities. The Board considered that a Sub-Adviser may engage in soft dollar transactions in managing a Portfolio. In addition, the Board considered that a Sub-Adviser may be affiliated with registered broker-dealers that may, from time to time, receive brokerage commissions from a Portfolio in connection with the sale of portfolio securities (subject to applicable best execution obligations). The Board also considered that a Sub-Adviser and its affiliates could benefit from the opportunity to provide advisory services to additional portfolios of the Trusts and overall reputational benefits.
The Board considered information from the Adviser and Sub-Advisers pertaining to potential conflicts of interest, and the manner in which any potential conflicts were mitigated. In its review, the Board considered information regarding various business relationships among the Adviser and its affiliates and various Sub-Advisers and their affiliates. The Board also considered information about services and/or payments provided to the Adviser by the Sub-Advisers in connection with marketing activities. The Board considered representations from the Adviser that such business relationships and any payments were not considered in the Adviser’s recommendation to renew any of the Sub-Advisory Agreements.
* * * * *
T. Rowe Price Small Cap Growth Portfolio. The Board also considered the following information in relation to the Agreements with the Adviser and T. Rowe Price Associates, Inc. regarding the Portfolio:
Among other data relating specifically to the Portfolio’s performance, the Board considered that the Portfolio outperformed the median of its Performance Universe and the average of its Morningstar Category for the one-, three-, and five-year periods ended June 30, 2023. The Board also considered that the Portfolio outperformed its benchmark, the MSCI U.S. Small Cap Growth Index, for the one-, three-, and five-year periods ended October 31, 2023. The Board also noted the presence of certain management fee waivers in effect for the Portfolio.
BHFTII-27
Brighthouse Funds Trust II
T. Rowe Price Small Cap Growth Portfolio
Board of Trustees’ Consideration of Advisory and Sub-Advisory Agreements—(Continued)
The Board also considered that the Portfolio’s actual management fees and total expenses (exclusive of 12b-1 fees) were below the Expense Group median, the Expense Universe median, and the Sub-advised Expense Universe median. The Board noted that the Portfolio’s contractual management fees were below the asset-weighted average of the Investment Classification/Morningstar Category selected by Broadridge at the Portfolio’s current size. The Board also noted that the Portfolio’s contractual sub-advisory fees were below the averages of the Sub-advised Expense Group and the Sub-advised Expense Universe at the Portfolio’s current size.
BHFTII-28
Brighthouse Funds Trust II
VanEck Global Natural Resources Portfolio
Managed By Van Eck Associates Corporation
Portfolio Manager Commentary*
PERFORMANCE
For the twelve months ended December 31, 2023, the Class A and B shares of the VanEck Global Natural Resources Portfolio returned -3.49% and -3.64%, respectively. The Portfolio’s benchmark, the Standard & Poor’s (“S&P”) North American Natural Resources Sector Index¹, returned 3.66%.
MARKET ENVIRONMENT / CONDITIONS
On the whole, resource equities underperformed broader global equity and bond markets during the year. From a macroeconomic perspective, drivers of underperformance included easing inflationary pressures, a pullback in commodity prices and shifting investor sentiment amid a more dovish outlook for interest rates in 2024.
Within traditional energy, West Texas Intermediate (“WTI”) crude oil prices surged above $90 per barrel in September due to supply constraints, strong demand, and geopolitical tensions, before falling below $70 by year’s end amid global growth concerns and increased U.S. output. The year was marked by significant consolidation within the U.S. oil and gas industry, highlighted by Exxon Mobil’s acquisition of Pioneer Natural Resources and Chevron’s purchase of Hess. Meanwhile, within renewable energy, lingering supply-chain issues and higher borrowing costs weighed on companies for the second year in a row.
In the metals and mining industry, base and industrial metals experienced price declines, largely affected by China’s slowing real estate market and subdued electric vehicle sales in the U.S. Supply overhangs for metals like copper, lithium and cobalt contrasted with iron ore, though, which benefited from relatively strong demand. Gold reached an all-time high in 2023, buoyed by central bank purchases and geopolitical uncertainties, outshining the miners who underperformed relative to the metal.
Agriculture saw mixed results in 2023. U.S. stocks of wheat and corn ended higher, but usage remained flat due to decreasing exports and lower animal feed demand. Fertilizer prices stabilized, benefiting from more secure European natural gas supplies. Notably, protein producers, especially in the poultry industry, found success, driven by high cattle prices and the impact of avian flu.
PORTFOLIO REVIEW / PERIOD END POSITIONING
The Portfolio’s underperformance was largely a result of security selection within the Materials sector, including positions within the diversified metals & mining and copper sub-industries. The Portfolio’s overweight allocation to the fertilizers & agricultural chemicals sub-industry also detracted. Relative losses were partially offset by positive security selection within the Energy sector, including positions within the integrated oil & gas and oil & gas equipment & services sub-industries.
Notable Portfolio changes during the period included the addition of two integrated oil & gas companies, Exxon Mobil and BP PLC (United Kingdom), as well as the exit of oil & gas equipment & services company, Liberty Energy and oil & gas exploration & production company, Devon Energy.
At the end of the year, the Portfolio’s largest allocations were to the Energy and Materials sectors which, combined, accounted for approximately 80% of the Portfolio’s total exposure. At the industry level, the Portfolio’s largest allocations were to oil, gas & consumable fuels and metals & mining, which accounted for approximately 33% and 28% of the Portfolio’s total exposure, respectively.
Shawn Reynolds
Charles Cameron
Portfolio Managers
Van Eck Associates Corporation
* This commentary may include statements that constitute “forward-looking statements” under the U.S. securities laws. Forward-looking statements include, among other things, projections, estimates, and information about possible or future results related to the Portfolio, market or regulatory developments. The views expressed above are not guarantees of future performance or economic results and involve certain risks, uncertainties and assumptions that could cause actual outcomes and results to differ materially from the views expressed herein. The views expressed above are subject to change at any time based upon economic, market, or other conditions and the subadvisory firm undertakes no obligation to update the views expressed herein. Any discussions of specific securities should not be considered a recommendation to buy or sell those securities. The views expressed above (including any forward-looking statement) may not be relied upon as investment advice or as an indication of the Portfolio’s trading intent. Information about the Portfolio’s holdings, asset allocation or country diversification is historical and is not an indication of future Portfolio composition, which may vary. Direct investment in any index is not possible. The performance of any index mentioned in this commentary has not been adjusted for ongoing management, distribution and operating expenses, and sales charges applicable to mutual fund investments. In addition, the returns do not reflect additional fees charged by separate accounts or variable insurance contracts that an investor in the Portfolio may pay. If these additional fees were reflected, performance would have been lower.
1 The S&P North American Natural Resources Sector Index was developed as an equity benchmark for U.S. traded natural resource related stocks.
BHFTII-1
Brighthouse Funds Trust II
VanEck Global Natural Resources Portfolio
A $10,000 INVESTMENT COMPARED TO THE S&P NORTH AMERICAN NATURAL RESOURCES SECTOR INDEX
AVERAGE ANNUAL RETURNS (%) FOR THE YEAR ENDED DECEMBER 31, 2023
| 1 Year | 5 Year | 10 Year | ||||||||||
| VanEck Global Natural Resources Portfolio | ||||||||||||
| Class A |
-3.49 | 11.18 | -0.48 | |||||||||
| Class B |
-3.64 | 10.92 | -0.72 | |||||||||
| S&P North American Natural Resources Sector Index | 3.66 | 13.13 | 2.85 | |||||||||
Portfolio performance is calculated including reinvestment of all income and capital gain distributions. Performance numbers are net of all Portfolio expenses but do not include any insurance, sales, separate account or administrative charges of variable annuity or life insurance contracts or any additional expenses that participants may bear relating to the operations of their plans. If these charges were included, the returns would be lower. The performance of any index referenced above has not been adjusted for ongoing management, distribution and operating expenses, and sales charges applicable to mutual fund investments. Direct investment in any index is not possible. The performance of Class A shares, as set forth in the line graph above, will differ from that of other classes because of the difference in expenses paid by policyholders investing in the different share classes.
This information represents past performance and is not indicative of future results. Investment return and principal value may fluctuate so that shares, upon redemption, may be worth more or less than the original cost.
PORTFOLIO COMPOSITION AS OF DECEMBER 31, 2023
Top Holdings
| % of Net Assets |
||||
| Freeport-McMoRan, Inc. | 3.3 | |||
| Shell PLC (ADR) | 3.3 | |||
| Glencore PLC | 3.0 | |||
| Vale SA (ADR) | 2.8 | |||
| Valero Energy Corp. | 2.8 | |||
| Exxon Mobil Corp. | 2.6 | |||
| Eni SpA | 2.5 | |||
| ConocoPhillips | 2.4 | |||
| JBS SA | 2.1 | |||
| OCI NV | 2.1 | |||
Top Sectors
| % of Net Assets |
||||
| Energy | 42.5 | |||
| Materials | 39.2 | |||
| Industrials | 6.1 | |||
| Consumer Staples | 5.2 | |||
| Utilities | 2.7 | |||
| Financials | 2.0 | |||
| Information Technology | 0.3 | |||
BHFTII-2
Brighthouse Funds Trust II
VanEck Global Natural Resources Portfolio
Understanding Your Portfolio’s Expenses
Shareholder Expense Example
As a shareholder of the Portfolio, you incur ongoing costs, including management fees; distribution and service (12b-1) fees; and other Portfolio expenses. This example is intended to help you understand your ongoing costs (in dollars) (referred to as “expenses”) of investing in the Portfolio and compare these costs with the ongoing costs of investing in other mutual funds. The example is based on an investment of $1,000 invested at the beginning of the period and held for the entire period, July 1, 2023 through December 31, 2023.
Actual Expenses
The first line for each share class of the Portfolio in the table below provides information about actual account values and actual expenses. You may use the information in this line, together with the amount you invested in the particular share class of the Portfolio, to estimate the expenses that you paid over the period. Simply divide your account value by $1,000 (for example, an $8,600 account value divided by $1,000 = 8.6), then multiply the result by the number in the first line under the heading entitled “Expenses Paid During Period” to estimate the expenses you paid on your account during this period.
Hypothetical Example for Comparison Purposes
The second line for each share class of the Portfolio in the table below provides information about hypothetical account values and hypothetical expenses based on the Portfolio’s actual expense ratio and an assumed rate of return of 5% per year before expenses, which is not the Portfolio’s actual return. The hypothetical account values and expenses may not be used to estimate the actual ending account balance or expenses you paid for the period. You may use this information to compare the ongoing costs of investing in the Portfolio and other funds. To do so, compare this 5% hypothetical example with the 5% hypothetical examples that appear in the shareholder reports of the other funds.
Please note that the expenses shown in the table are meant to highlight your ongoing costs only and do not reflect any fees or charges of your variable insurance product or any additional expenses that participants in certain eligible qualified plans may bear relating to the operations of their plan. Therefore, the second line for each share class in the table is useful in comparing ongoing costs only, and will not help you determine the relative total costs of owning different funds. In addition, if these other costs were included, your costs would have been higher.
| VanEck Global Natural Resources Portfolio |
Annualized Expense Ratio |
Beginning Account Value July 1, 2023 |
Ending Account Value December 31, 2023 |
Expenses Paid During Period** July 1, 2023 to December 31, 2023 |
||||||||||||||
| Class A (a) |
Actual | 0.77 | % | $ | 1,000.00 | $ | 1,016.20 | $ | 3.91 | |||||||||
| Hypothetical* | 0.77 | % | $ | 1,000.00 | $ | 1,021.32 | $ | 3.92 | ||||||||||
| Class B (a) |
Actual | 1.02 | % | $ | 1,000.00 | $ | 1,015.50 | $ | 5.18 | |||||||||
| Hypothetical* | 1.02 | % | $ | 1,000.00 | $ | 1,020.06 | $ | 5.19 | ||||||||||
| * | Hypothetical assumes a rate of return of 5% per year before expenses. |
| ** | Expenses paid are equal to the Portfolio’s annualized expense ratio for the most recent six month period, as shown above, multiplied by the average account value over the period, multiplied by the number of days (184 days) in the most recent fiscal half-year, divided by 365 (to reflect the one-half year period). |
| (a) | The annualized expense ratio shown reflects the impact of the management fee waiver as described in Note 5 of the Notes to Financial Statements. |
BHFTII-3
Brighthouse Funds Trust II
VanEck Global Natural Resources Portfolio
Schedule of Investments as of December 31, 2023
Common Stocks—98.0% of Net Assets
| Security Description | Shares | Value | ||||||
| Chemicals—10.9% | ||||||||
| Arcadium Lithium PLC (a) |
1,632,347 | $ | 12,469,589 | |||||
| CF Industries Holdings, Inc. (b) |
195,200 | 15,518,400 | ||||||
| Corteva, Inc. |
326,533 | 15,647,461 | ||||||
| Mosaic Co. |
352,100 | 12,580,533 | ||||||
| Nutrien Ltd. (b) |
244,323 | 13,762,715 | ||||||
| OCI NV |
600,357 | 17,453,470 | ||||||
| Yara International ASA |
97,500 | 3,464,468 | ||||||
|
|
|
|||||||
| 90,896,636 | ||||||||
|
|
|
|||||||
| Containers & Packaging—0.3% | ||||||||
| Graphic Packaging Holding Co. |
95,725 | 2,359,621 | ||||||
|
|
|
|||||||
| Electrical Equipment—2.7% | ||||||||
| Array Technologies, Inc. (a) (b) |
531,200 | 8,924,160 | ||||||
| Nexans SA |
97,870 | 8,570,906 | ||||||
| Soltec Power Holdings SA (a) (b) |
121,089 | 460,334 | ||||||
| Stem, Inc. (a) (b) |
1,197,832 | 4,647,588 | ||||||
|
|
|
|||||||
| 22,602,988 | ||||||||
|
|
|
|||||||
| Energy Equipment & Services—9.6% | ||||||||
| Baker Hughes Co. |
447,200 | 15,285,296 | ||||||
| ChampionX Corp. (b) |
76,422 | 2,232,287 | ||||||
| Halliburton Co. |
352,100 | 12,728,415 | ||||||
| NOV, Inc. |
302,350 | 6,131,658 | ||||||
| Saipem SpA (a) (b) |
5,940,200 | 9,646,053 | ||||||
| Schlumberger NV |
298,400 | 15,528,736 | ||||||
| TechnipFMC PLC |
613,000 | 12,345,820 | ||||||
| Valaris Ltd. (a) (b) |
91,643 | 6,283,960 | ||||||
|
|
|
|||||||
| 80,182,225 | ||||||||
|
|
|
|||||||
| Food Products—5.2% | ||||||||
| Bunge Global SA (b) |
111,300 | 11,235,735 | ||||||
| JBS SA |
3,428,000 | 17,522,674 | ||||||
| Pilgrim’s Pride Corp. (a) |
521,500 | 14,424,690 | ||||||
|
|
|
|||||||
| 43,183,099 | ||||||||
|
|
|
|||||||
| Independent Power and Renewable Electricity Producers—2.7% | ||||||||
| Ormat Technologies, Inc. (b) |
161,300 | 12,224,927 | ||||||
| Sunnova Energy International, Inc. (a) (b) |
690,366 | 10,528,081 | ||||||
|
|
|
|||||||
| 22,753,008 | ||||||||
|
|
|
|||||||
| Machinery—1.7% | ||||||||
| Chart Industries, Inc. (a) (b) |
102,120 | 13,922,020 | ||||||
|
|
|
|||||||
| Marine Transportation—1.7% | ||||||||
| Kirby Corp. (a) |
177,831 | 13,956,177 | ||||||
|
|
|
|||||||
| Metals & Mining—28.0% | ||||||||
| 5E Advanced Materials, Inc. (a) (b) |
139,500 | 196,695 | ||||||
| Agnico Eagle Mines Ltd. (b) |
261,233 | 14,328,630 | ||||||
| Alamos Gold, Inc. - Class A |
705,000 | 9,496,350 | ||||||
| Barrick Gold Corp. |
934,035 | 16,896,693 | ||||||
| Eldorado Gold Corp. (a) (b) |
514,200 | 6,669,174 | ||||||
| Endeavour Mining PLC (b) |
449,300 | 10,094,458 | ||||||
| Metals & Mining—(Continued) | ||||||||
| Euro Manganese, Inc. (a) |
2,118,507 | $ | 143,990 | |||||
| First Quantum Minerals Ltd. |
478,300 | 3,916,497 | ||||||
| Franco-Nevada Corp. |
96,000 | 10,637,760 | ||||||
| Freeport-McMoRan, Inc. |
644,100 | 27,419,337 | ||||||
| Glencore PLC |
4,230,300 | 25,378,581 | ||||||
| Ivanhoe Mines Ltd. - Class A (a) (b) |
1,316,800 | 12,769,994 | ||||||
| Kinross Gold Corp. |
2,196,400 | 13,288,220 | ||||||
| MP Materials Corp. (a) (b) |
712,985 | 14,152,752 | ||||||
| Newmont Corp. |
335,517 | 13,887,049 | ||||||
| Nouveau Monde Graphite, Inc. (a) |
179,033 | 467,276 | ||||||
| Pan American Silver Corp. |
529,900 | 8,653,267 | ||||||
| Piedmont Lithium, Inc. (a) (b) |
142,008 | 4,008,886 | ||||||
| Rio Tinto PLC (ADR) (b) |
222,200 | 16,545,012 | ||||||
| Talon Metals Corp. (a) |
3,846,700 | 522,551 | ||||||
| Vale SA (ADR) (b) |
1,474,500 | 23,385,570 | ||||||
|
|
|
|||||||
| 232,858,742 | ||||||||
|
|
|
|||||||
| Mortgage Real Estate Investment Trusts—2.0% | ||||||||
| Hannon Armstrong Sustainable Infrastructure Capital, Inc. (b) |
608,990 | 16,795,944 | ||||||
|
|
|
|||||||
| Oil, Gas & Consumable Fuels—32.9% | ||||||||
| BP PLC (ADR) (b) |
454,500 | 16,089,300 | ||||||
| Chesapeake Energy Corp. (b) |
154,100 | 11,856,454 | ||||||
| Chevron Corp. |
54,100 | 8,069,556 | ||||||
| ConocoPhillips |
175,522 | 20,372,839 | ||||||
| Diamondback Energy, Inc. |
94,606 | 14,671,498 | ||||||
| Eni SpA |
1,226,800 | 20,823,175 | ||||||
| EQT Corp. (b) |
397,700 | 15,375,082 | ||||||
| Equinor ASA (ADR) |
457,400 | 14,472,136 | ||||||
| Excelerate Energy, Inc. - Class A (b) |
212,200 | 3,280,612 | ||||||
| Exxon Mobil Corp. |
213,224 | 21,318,135 | ||||||
| Hess Corp. |
29,000 | 4,180,640 | ||||||
| Kosmos Energy Ltd. (a) (b) |
1,222,500 | 8,202,975 | ||||||
| Marathon Oil Corp. |
371,900 | 8,985,104 | ||||||
| Neste OYJ |
116,200 | 4,128,483 | ||||||
| Permian Resources Corp. (b) |
640,070 | 8,704,952 | ||||||
| PetroChina Co. Ltd. - Class H |
25,278,000 | 16,663,422 | ||||||
| Pioneer Natural Resources Co. |
38,887 | 8,744,909 | ||||||
| Shell PLC (ADR) |
413,000 | 27,175,400 | ||||||
| TotalEnergies SE |
255,500 | 17,355,721 | ||||||
| Valero Energy Corp. (b) |
177,400 | 23,062,000 | ||||||
|
|
|
|||||||
| 273,532,393 | ||||||||
|
|
|
|||||||
| Semiconductors & Semiconductor Equipment—0.3% | ||||||||
| SolarEdge Technologies, Inc. (a) (b) |
28,600 | 2,676,960 | ||||||
|
|
|
|||||||
| Total Common Stocks |
815,719,813 | |||||||
|
|
|
|||||||
| Short-Term Investment—1.8% |
| |||||||
| Mutual Funds—1.8% | ||||||||
| Invesco STIC Prime Portfolio, Institutional Class, 5.300% (c) |
14,828,686 | 14,830,169 | ||||||
|
|
|
|||||||
| Total Short-Term Investments |
14,830,169 | |||||||
|
|
|
|||||||
See accompanying notes to financial statements.
BHFTII-4
Brighthouse Funds Trust II
VanEck Global Natural Resources Portfolio
Schedule of Investments as of December 31, 2023
Securities Lending Reinvestments (d)—18.4%
| Security Description | Principal Amount* |
Value | ||||||
| Certificates of Deposit—3.7% | ||||||||
| Barclays Bank PLC |
3,000,000 | $ | 2,999,991 | |||||
| 5.790%, SOFR + 0.400%, 02/14/24 (e) |
2,000,000 | 2,000,564 | ||||||
| BNP Paribas SA |
2,000,000 | 2,000,616 | ||||||
| Mizuho Bank Ltd. |
3,000,000 | 3,001,359 | ||||||
| MUFG Bank Ltd. (London) |
1,000,000 | 975,750 | ||||||
| National Westminster Bank PLC |
3,000,000 | 3,004,860 | ||||||
| Oversea-Chinese Banking Corp. Ltd. |
3,000,000 | 3,000,312 | ||||||
| Royal Bank of Canada |
3,000,000 | 3,001,860 | ||||||
| Standard Chartered Bank |
2,000,000 | 2,000,000 | ||||||
| Sumitomo Mitsui Banking Corp. |
3,000,000 | 3,000,369 | ||||||
| Sumitomo Mitsui Trust Bank Ltd. |
3,000,000 | 3,001,785 | ||||||
| Westpac Banking Corp. |
3,000,000 | 3,003,717 | ||||||
|
|
|
|||||||
| 30,991,183 | ||||||||
|
|
|
|||||||
| Commercial Paper—0.6% | ||||||||
| Australia & New Zealand Banking Group Ltd. |
2,000,000 | 1,966,676 | ||||||
| 5.730%, SOFR + 0.330%, 04/18/24 (e) |
2,000,000 | 2,000,448 | ||||||
| Old Line Funding LLC |
1,000,000 | 1,000,000 | ||||||
|
|
|
|||||||
| 4,967,124 | ||||||||
|
|
|
|||||||
| Repurchase Agreements—11.4% | ||||||||
| Bank of Nova Scotia |
19,500,000 | 19,500,000 | ||||||
| Barclays Bank PLC |
3,100,000 | 3,100,000 | ||||||
| Repurchase Agreement dated 12/29/23 at 5.450%, due on 01/02/24 with a maturity value of $8,981,338; collateralized by various Common Stock with an aggregate market value of $10,006,442. |
8,975,903 | 8,975,903 | ||||||
| Citigroup Global Markets, Inc. |
5,000,000 | 5,000,000 | ||||||
| Repurchase Agreements—(Continued) | ||||||||
| Citigroup Global Markets, Inc. |
5,000,000 | $ | 5,000,000 | |||||
| Deutsche Bank Securities, Inc. |
4,795,763 | 4,795,763 | ||||||
| Mizuho Securities USA, Inc. |
2,500,000 | 2,500,000 | ||||||
| National Bank Financial, Inc. |
2,000,000 | 2,000,000 | ||||||
| National Bank of Canada |
20,000,000 | 20,000,000 | ||||||
| NBC Global Finance Ltd. |
12,400,000 | 12,400,000 | ||||||
| Societe Generale |
1,700,000 | 1,700,000 | ||||||
| Repurchase Agreement dated 12/29/23 at 5.330%, due on 01/02/24 with a maturity value of $2,001,184; collateralized by U.S. Treasury Obligations with rates ranging from 0.625% - 5.240%, maturity dates ranging from 04/30/24 - 05/15/32, and an aggregate market value of $2,040,001. |
2,000,000 | 2,000,000 | ||||||
| TD Prime Services LLC |
8,000,000 | 8,000,000 | ||||||
|
|
|
|||||||
| 94,971,666 | ||||||||
|
|
|
|||||||
See accompanying notes to financial statements.
BHFTII-5
Brighthouse Funds Trust II
VanEck Global Natural Resources Portfolio
Schedule of Investments as of December 31, 2023
Securities Lending Reinvestments (d)—(Continued)
| Security Description | Shares/ Principal Amount* |
Value | ||||||
| Time Deposits—1.2% | ||||||||
| DZ Bank AG (NY) |
2,000,000 | $ | 2,000,000 | |||||
| First Abu Dhabi Bank USA NV |
4,000,000 | 4,000,000 | ||||||
| National Bank of Canada |
4,500,000 | 4,500,000 | ||||||
|
|
|
|||||||
| 10,500,000 | ||||||||
|
|
|
|||||||
| Mutual Funds—1.5% | ||||||||
| BlackRock Liquidity Funds FedFund, Institutional Shares |
5,000,000 | 5,000,000 | ||||||
| Dreyfus Treasury Obligations Cash Management Fund, Institutional Class 5.250% (c) |
1,000,000 | 1,000,000 | ||||||
| Goldman Sachs Financial Square Government Fund, Institutional Shares 5.230% (c) |
5,000,000 | 5,000,000 | ||||||
| HSBC U.S. Government Money Market Fund, Class I 5.300% (c) |
250,000 | 250,000 | ||||||
| Western Asset Institutional Government Reserves Fund, Institutional Class 5.270% (c) |
1,000,000 | 1,000,000 | ||||||
|
|
|
|||||||
| 12,250,000 | ||||||||
|
|
|
|||||||
| Total Securities Lending Reinvestments |
153,679,973 | |||||||
|
|
|
|||||||
| Total Investments—118.2% |
984,229,955 | |||||||
| Other assets and liabilities (net)—(18.2)% |
(151,867,044 | ) | ||||||
|
|
|
|||||||
| Net Assets—100.0% | $ | 832,362,911 | ||||||
|
|
|
|||||||
| * | Principal amount stated in U.S. dollars unless otherwise noted. | |||
| (a) | Non-income producing security. | |||
| (b) | All or a portion of the security was held on loan. As of December 31, 2023, the market value of securities loaned was $191,829,999 and the collateral received consisted of cash in the amount of $153,636,353 and non-cash collateral with a value of $46,842,354. The cash collateral investments are disclosed in the Schedule of Investments and categorized as Securities Lending Reinvestments. The non-cash collateral received consists of U.S. government securities that are held in safe-keeping by the lending agent, or a third-party custodian, and cannot be sold or repledged by the Portfolio. As such, this collateral is excluded from the Statement of Assets and Liabilities. | |||
| (c) | The rate shown represents the annualized seven-day yield as of December 31, 2023. | |||
| (d) | Represents investment of cash collateral received from securities on loan as of December 31, 2023. | |||
| (e) | Variable or floating rate security. The stated rate represents the rate at December 31, 2023. Maturity date shown for callable securities reflects the earliest possible call date. For securities based on a published reference index and spread, the index and spread are indicated in the description above. For certain variable rate securities, the coupon rate is determined by the issuer/agent based on current market conditions. For certain asset- and mortgage-backed securities, the coupon rate may fluctuate based on changes of the underlying collateral or prepayments of principal. These securities do not indicate a reference index and spread in their description above. | |||
Glossary of Abbreviations
Index Abbreviations
| (FEDEFF PRV)— | Effective Federal Funds Rate | |||
| (OBFR)— | U.S. Overnight Bank Funding Rate | |||
| (SOFR)— | Secured Overnight Financing Rate | |||
Other Abbreviations
| (ADR)— | American Depositary Receipt | |||
See accompanying notes to financial statements.
BHFTII-6
Brighthouse Funds Trust II
VanEck Global Natural Resources Portfolio
Schedule of Investments as of December 31, 2023
Fair Value Hierarchy
Accounting principles generally accepted in the United States of America (“GAAP”) define fair market value as the price that the Portfolio would receive to sell an asset or pay to transfer a liability in an orderly transaction between market participants at the measurement date. It establishes a fair value hierarchy that prioritizes inputs to valuation methods and requires disclosure of the fair value hierarchy, separately for each major category of assets and liabilities, that segregates fair value measurements into three levels. Levels 1, 2 and 3 of the fair value hierarchy are defined as follows:
Level 1 - unadjusted quoted prices in active markets for identical investments
Level 2 - other significant observable inputs (including, but not limited to, quoted prices for similar assets or liabilities in markets that are either active or inactive; inputs other than quoted prices that are observable such as interest rates, yield curves, volatilities, prepayment speeds, loss severities, credit risks, default rates, or other market corroborated inputs)
Level 3 - significant unobservable inputs based on the best information available in the circumstances, to the extent observable inputs are unavailable (including the Portfolio’s own assumptions used in determining the fair value of investments and derivative financial instruments)
The inputs or methodologies used for valuing investments are not necessarily an indication of the risk associated with investing in them. Changes to the inputs or methodologies used may result in transfers between levels. A reconciliation of Level 3 securities, if any, will be disclosed following the fair value hierarchy table. For more information about the Portfolio’s policy regarding the valuation of investments, please refer to the Notes to Financial Statements.
The following table summarizes the fair value hierarchy of the Portfolio’s investments as of December 31, 2023:
| Description | Level 1 | Level 2 | Level 3 | Total | ||||||||||||
| Common Stocks | ||||||||||||||||
| Chemicals |
$ | 69,978,698 | $ | 20,917,938 | $ | — | $ | 90,896,636 | ||||||||
| Containers & Packaging |
2,359,621 | — | — | 2,359,621 | ||||||||||||
| Electrical Equipment |
13,571,748 | 9,031,240 | — | 22,602,988 | ||||||||||||
| Energy Equipment & Services |
70,536,172 | 9,646,053 | — | 80,182,225 | ||||||||||||
| Food Products |
25,660,425 | 17,522,674 | — | 43,183,099 | ||||||||||||
| Independent Power and Renewable Electricity Producers |
22,753,008 | — | — | 22,753,008 | ||||||||||||
| Machinery |
13,922,020 | — | — | 13,922,020 | ||||||||||||
| Marine Transportation |
13,956,177 | — | — | 13,956,177 | ||||||||||||
| Metals & Mining |
207,336,171 | 25,522,571 | — | 232,858,742 | ||||||||||||
| Mortgage Real Estate Investment Trusts |
16,795,944 | — | — | 16,795,944 | ||||||||||||
| Oil, Gas & Consumable Fuels |
214,561,592 | 58,970,801 | — | 273,532,393 | ||||||||||||
| Semiconductors & Semiconductor Equipment |
2,676,960 | — | — | 2,676,960 | ||||||||||||
| Total Common Stocks |
674,108,536 | 141,611,277 | — | 815,719,813 | ||||||||||||
| Total Short-Term Investment* |
14,830,169 | — | — | 14,830,169 | ||||||||||||
| Securities Lending Reinvestments | ||||||||||||||||
| Certificates of Deposit |
— | 30,991,183 | — | 30,991,183 | ||||||||||||
| Commercial Paper |
— | 4,967,124 | — | 4,967,124 | ||||||||||||
| Repurchase Agreements |
— | 94,971,666 | — | 94,971,666 | ||||||||||||
| Time Deposits |
— | 10,500,000 | — | 10,500,000 | ||||||||||||
| Mutual Funds |
12,250,000 | — | — | 12,250,000 | ||||||||||||
| Total Securities Lending Reinvestments |
12,250,000 | 141,429,973 | — | 153,679,973 | ||||||||||||
| Total Investments |
$ | 701,188,705 | $ | 283,041,250 | $ | — | $ | 984,229,955 | ||||||||
| Collateral for Securities Loaned (Liability) |
$ | — | $ | (153,636,353 | ) | $ | — | $ | (153,636,353 | ) | ||||||
| * | See Schedule of Investments for additional detailed categorizations. | |||
See accompanying notes to financial statements.
BHFTII-7
Brighthouse Funds Trust II
VanEck Global Natural Resources Portfolio
Statement of Assets and Liabilities
December 31, 2023
| Assets |
| |||
| Investments at value (a) (b) |
$ | 984,229,955 | ||
| Cash |
292,640 | |||
| Cash denominated in foreign currencies (c) |
1,600 | |||
| Receivable for: |
| |||
| Investments sold |
6,620,866 | |||
| Fund shares sold |
24,396 | |||
| Dividends |
609,239 | |||
| Prepaid expenses |
2,721 | |||
|
|
|
|||
| Total Assets |
991,781,417 | |||
|
|
|
|||
| Liabilities |
| |||
| Collateral for securities loaned |
153,636,353 | |||
| Payables for: |
| |||
| Investments purchased |
4,946,693 | |||
| Fund shares redeemed |
63,809 | |||
| Accrued Expenses: |
| |||
| Management fees |
490,680 | |||
| Distribution and service fees |
16,155 | |||
| Deferred trustees’ fees |
168,251 | |||
| Other expenses |
96,565 | |||
|
|
|
|||
| Total Liabilities |
159,418,506 | |||
|
|
|
|||
| Net Assets |
$ | 832,362,911 | ||
|
|
|
|||
| Net Assets Consist of: |
| |||
| Paid in surplus |
$ | 730,637,341 | ||
| Distributable earnings (Accumulated losses) |
101,725,570 | |||
|
|
|
|||
| Net Assets |
$ | 832,362,911 | ||
|
|
|
|||
| Net Assets |
| |||
| Class A |
$ | 753,744,575 | ||
| Class B |
78,618,336 | |||
| Capital Shares Outstanding* |
| |||
| Class A |
63,365,390 | |||
| Class B |
6,657,266 | |||
| Net Asset Value, Offering Price and Redemption Price Per Share |
| |||
| Class A |
$ | 11.90 | ||
| Class B |
11.81 | |||
| * | The Portfolio is authorized to issue an unlimited number of shares. | |||
| (a) | Identified cost of investments was $925,660,948. | |||
| (b) | Includes securities loaned at value of $191,829,999. | |||
| (c) | Identified cost of cash denominated in foreign currencies was $1,592. | |||
Statement of Operations
Year Ended December 31, 2023
| Investment Income |
| |||
| Dividends (a) |
$ | 25,982,722 | ||
| Interest |
1,630 | |||
| Securities lending income |
1,598,890 | |||
|
|
|
|||
| Total investment income |
27,583,242 | |||
|
|
|
|||
| Expenses |
| |||
| Management fees |
6,302,876 | |||
| Administration fees |
44,995 | |||
| Custodian and accounting fees |
93,064 | |||
| Distribution and service fees—Class B |
200,478 | |||
| Audit and tax services |
49,026 | |||
| Legal |
46,604 | |||
| Trustees’ fees and expenses |
46,220 | |||
| Shareholder reporting |
31,494 | |||
| Insurance |
7,816 | |||
| Miscellaneous |
23,271 | |||
|
|
|
|||
| Total expenses |
6,845,844 | |||
| Less management fee waiver |
(478,907 | ) | ||
| Less broker commission recapture |
(3,971 | ) | ||
|
|
|
|||
| Net expenses |
6,362,966 | |||
|
|
|
|||
| Net Investment Income |
21,220,276 | |||
|
|
|
|||
| Net Realized and Unrealized Gain (Loss) |
| |||
| Net realized gain (loss) on : |
| |||
| Investments |
58,853,731 | |||
| Foreign currency transactions |
19,530 | |||
|
|
|
|||
| Net realized gain (loss) |
58,873,261 | |||
|
|
|
|||
| Net change in unrealized appreciation (depreciation) on: |
| |||
| Investments |
(102,075,413 | ) | ||
| Foreign currency transactions |
2,685 | |||
|
|
|
|||
| Net change in unrealized appreciation (depreciation) |
(102,072,728 | ) | ||
|
|
|
|||
| Net realized and unrealized gain (loss) |
(43,199,467 | ) | ||
|
|
|
|||
| Net Increase (Decrease) in Net Assets From Operations |
$ | (21,979,191 | ) | |
|
|
|
|||
| (a) | Net of foreign withholding taxes of $1,626,511. | |||
See accompanying notes to financial statements.
BHFTII-8
Brighthouse Funds Trust II
VanEck Global Natural Resources Portfolio
Statements of Changes in Net Assets
| Year Ended December 31, 2023 |
Year Ended December 31, 2022 |
|||||||||||
| Increase (Decrease) in Net Assets: |
| |||||||||||
| From Operations |
| |||||||||||
| Net investment income (loss) |
$ | 21,220,276 | $ | 26,243,421 | ||||||||
| Net realized gain (loss) |
58,873,261 | 259,684,223 | ||||||||||
| Net change in unrealized appreciation (depreciation) |
(102,072,728 | ) | (172,518,168 | ) | ||||||||
|
|
|
|
|
|||||||||
| Increase (decrease) in net assets from operations |
(21,979,191 | ) | 113,409,476 | |||||||||
|
|
|
|
|
|||||||||
| From Distributions to Shareholders |
| |||||||||||
| Class A |
(22,123,408 | ) | (23,035,876 | ) | ||||||||
| Class B |
(2,280,208 | ) | (2,217,944 | ) | ||||||||
|
|
|
|
|
|||||||||
| Total distributions |
(24,403,616 | ) | (25,253,820 | ) | ||||||||
|
|
|
|
|
|||||||||
| Increase (decrease) in net assets from capital share transactions |
56,889,649 | (378,938,677 | ) | |||||||||
|
|
|
|
|
|||||||||
| Total increase (decrease) in net assets |
10,506,842 | (290,783,021 | ) | |||||||||
| Net Assets |
| |||||||||||
| Beginning of period |
821,856,069 | 1,112,639,090 | ||||||||||
|
|
|
|
|
|||||||||
| End of period |
$ | 832,362,911 | $ | 821,856,069 | ||||||||
|
|
|
|
|
|||||||||
Other Information:
Capital Shares
Transactions in capital shares were as follows:
| Year Ended December 31, 2023 |
Year Ended December 31, 2022 |
|||||||||||||||
| Shares | Value | Shares | Value | |||||||||||||
| Class A |
||||||||||||||||
| Sales |
7,825,456 | $ | 88,544,541 | 4,082,759 | $ | 51,049,554 | ||||||||||
| Reinvestments |
1,902,271 | 22,123,408 | 1,765,201 | 23,035,876 | ||||||||||||
| Redemptions |
(4,713,626 | ) | (57,094,484 | ) | (31,319,887 | ) | (425,200,626 | ) | ||||||||
|
|
|
|
|
|
|
|
|
|||||||||
| Net increase (decrease) |
5,014,101 | $ | 53,573,465 | (25,471,927 | ) | $ | (351,115,196 | ) | ||||||||
|
|
|
|
|
|
|
|
|
|||||||||
| Class B |
||||||||||||||||
| Sales |
985,783 | $ | 11,819,500 | 819,909 | $ | 10,172,694 | ||||||||||
| Reinvestments |
197,079 | 2,280,208 | 171,006 | 2,217,944 | ||||||||||||
| Redemptions |
(898,037 | ) | (10,783,524 | ) | (2,991,889 | ) | (40,214,119 | ) | ||||||||
|
|
|
|
|
|
|
|
|
|||||||||
| Net increase (decrease) |
284,825 | $ | 3,316,184 | (2,000,974 | ) | $ | (27,823,481 | ) | ||||||||
|
|
|
|
|
|
|
|
|
|||||||||
| Increase (decrease) derived from capital shares transactions |
$ | 56,889,649 | $ | (378,938,677 | ) | |||||||||||
|
|
|
|
|
|||||||||||||
See accompanying notes to financial statements.
BHFTII-9
Brighthouse Funds Trust II
VanEck Global Natural Resources Portfolio
Financial Highlights
| Selected per share data | ||||||||||||||||||||
| Class A | ||||||||||||||||||||
| Year Ended December 31, | ||||||||||||||||||||
| 2023 | 2022 | 2021 | 2020 | 2019 | ||||||||||||||||
| Net Asset Value, Beginning of Period |
$ | 12.71 | $ | 12.08 | $ | 10.29 | $ | 8.59 | $ | 7.69 | ||||||||||
|
|
|
|
|
|
|
|
|
|
|
|||||||||||
| Income (Loss) from Investment Operations |
| |||||||||||||||||||
| Net investment income (loss) (a) |
0.32 | 0.36 | 0.24 | 0.10 | 0.12 | |||||||||||||||
| Net realized and unrealized gain (loss) |
(0.76 | ) | 0.65 | 1.70 | 1.70 | 0.83 | ||||||||||||||
|
|
|
|
|
|
|
|
|
|
|
|||||||||||
| Total income (loss) from investment operations |
(0.44 | ) | 1.01 | 1.94 | 1.80 | 0.95 | ||||||||||||||
|
|
|
|
|
|
|
|
|
|
|
|||||||||||
| Less Distributions |
| |||||||||||||||||||
| Distributions from net investment income |
(0.37 | ) | (0.38 | ) | (0.15 | ) | (0.10 | ) | (0.05 | ) | ||||||||||
|
|
|
|
|
|
|
|
|
|
|
|||||||||||
| Total distributions |
(0.37 | ) | (0.38 | ) | (0.15 | ) | (0.10 | ) | (0.05 | ) | ||||||||||
|
|
|
|
|
|
|
|
|
|
|
|||||||||||
| Net Asset Value, End of Period |
$ | 11.90 | $ | 12.71 | $ | 12.08 | $ | 10.29 | $ | 8.59 | ||||||||||
|
|
|
|
|
|
|
|
|
|
|
|||||||||||
| Total Return (%) (b) |
(3.49 | ) | 8.24 | 18.82 | 21.58 | 12.44 | (c) | |||||||||||||
| Ratios/Supplemental Data |
||||||||||||||||||||
| Gross ratio of expenses to average net assets (%) |
0.83 | 0.81 | 0.81 | 0.81 | 0.81 | |||||||||||||||
| Net ratio of expenses to average net assets (%) (d) |
0.77 | 0.75 | 0.74 | 0.75 | 0.77 | |||||||||||||||
| Ratio of net investment income (loss) to average net assets (%) |
2.66 | 2.74 | 2.01 | 1.34 | 1.46 | |||||||||||||||
| Portfolio turnover rate (%) |
43 | 40 | 23 | 48 | 33 | |||||||||||||||
| Net assets, end of period (in millions) |
$ | 753.7 | $ | 741.5 | $ | 1,012.3 | $ | 1,115.4 | $ | 1,084.7 | ||||||||||
| Class B | ||||||||||||||||||||
| Year Ended December 31, | ||||||||||||||||||||
| 2023 | 2022 | 2021 | 2020 | 2019 | ||||||||||||||||
| Net Asset Value, Beginning of Period |
$ | 12.61 | $ | 11.98 | $ | 10.21 | $ | 8.53 | $ | 7.62 | ||||||||||
|
|
|
|
|
|
|
|
|
|
|
|||||||||||
| Income (Loss) from Investment Operations |
| |||||||||||||||||||
| Net investment income (loss) (a) |
0.29 | 0.32 | 0.20 | 0.08 | 0.10 | |||||||||||||||
| Net realized and unrealized gain (loss) |
(0.76 | ) | 0.65 | 1.69 | 1.68 | 0.84 | ||||||||||||||
|
|
|
|
|
|
|
|
|
|
|
|||||||||||
| Total income (loss) from investment operations |
(0.47 | ) | 0.97 | 1.89 | 1.76 | 0.94 | ||||||||||||||
|
|
|
|
|
|
|
|
|
|
|
|||||||||||
| Less Distributions |
| |||||||||||||||||||
| Distributions from net investment income |
(0.33 | ) | (0.34 | ) | (0.12 | ) | (0.08 | ) | (0.03 | ) | ||||||||||
|
|
|
|
|
|
|
|
|
|
|
|||||||||||
| Total distributions |
(0.33 | ) | (0.34 | ) | (0.12 | ) | (0.08 | ) | (0.03 | ) | ||||||||||
|
|
|
|
|
|
|
|
|
|
|
|||||||||||
| Net Asset Value, End of Period |
$ | 11.81 | $ | 12.61 | $ | 11.98 | $ | 10.21 | $ | 8.53 | ||||||||||
|
|
|
|
|
|
|
|
|
|
|
|||||||||||
| Total Return (%) (b) |
(3.64 | ) | 7.98 | 18.51 | 21.18 | 12.35 | ||||||||||||||
| Ratios/Supplemental Data |
| |||||||||||||||||||
| Gross ratio of expenses to average net assets (%) |
1.08 | 1.06 | 1.06 | 1.06 | 1.06 | |||||||||||||||
| Net ratio of expenses to average net assets (%) (d) |
1.02 | 1.00 | 0.99 | 1.00 | 1.02 | |||||||||||||||
| Ratio of net investment income (loss) to average net assets (%) |
2.43 | 2.50 | 1.76 | 1.09 | 1.20 | |||||||||||||||
| Portfolio turnover rate (%) |
43 | 40 | 23 | 48 | 33 | |||||||||||||||
| Net assets, end of period (in millions) |
$ | 78.6 | $ | 80.4 | $ | 100.3 | $ | 109.6 | $ | 105.5 | ||||||||||
| (a) | Per share amounts based on average shares outstanding during the period. | |||
| (b) | Total return does not reflect any insurance, sales, separate account or administrative charges of variable annuity or life insurance contracts or any additional expenses that contract owners may bear under their variable contracts. If these charges were included, the returns would be lower. | |||
| (c) | Generally accepted accounting principles may require adjustments to be made to the net assets of the Portfolio at period end for financial reporting purposes, and as such, the net asset values for shareholder transactions and the returns based on those net asset values may differ from the returns reported in the portfolio manager commentary section of this report. | |||
| (d) | Includes the effects of management fee waivers (see Note 5 of the Notes to Financial Statements). | |||
See accompanying notes to financial statements.
BHFTII-10
Brighthouse Funds Trust II
VanEck Global Natural Resources Portfolio
Notes to Financial Statements—December 31, 2023
1. Organization
Brighthouse Funds Trust II (the “Trust”) is organized as a Delaware statutory trust and registered under the Investment Company Act of 1940, as amended (the “1940 Act”), as an open-end management investment company. The Trust, which is managed by Brighthouse Investment Advisers, LLC (“Brighthouse Investment Advisers” or the “Adviser”), currently offers twenty-nine series (the “Portfolios”), each of which operates as a distinct investment vehicle of the Trust. The series included in this report is VanEck Global Natural Resources Portfolio (the “Portfolio”), which is diversified. Shares of the Portfolio are not offered directly to the general public and are currently available only to separate accounts of insurance companies, including insurance companies affiliated with the Adviser.
The Portfolio has registered and offers two classes of shares: Class A and B shares. Shares of each class of the Portfolio represent an equal pro rata interest in the Portfolio and generally give the shareholder the same voting, dividend, liquidation, and other rights. Investment income, realized and unrealized capital gains and losses, the common expenses of the Portfolio, and certain Portfolio-level expense reductions, if any, are allocated on a pro rata basis to each class based on the relative net assets of each class to the net assets of the Portfolio. Each class of shares differs in its respective distribution plan and such distribution expenses are allocated to the corresponding class of shares.
2. Significant Accounting Policies
The preparation of financial statements in conformity with accounting principles generally accepted in the United States of America (“GAAP”) requires management to make estimates and assumptions that affect the reported amounts of assets and liabilities and disclosure of contingent assets and liabilities as of the date of the financial statements and the reported amounts of income and expenses during the reporting period. Actual results could differ from those estimates. In the preparation of these financial statements, management has evaluated events and transactions subsequent to December 31, 2023 through the date the financial statements were issued.
The Portfolio is an investment company and follows the accounting and reporting guidance of the Financial Accounting Standards Board (“FASB”) Accounting Standards Codification Topic 946- Financial Services- Investment Companies. The following is a summary of significant accounting policies consistently followed by the Portfolio in the preparation of its financial statements.
Investment Valuation and Fair Value Measurements - The Portfolio values its investments for purposes of calculating its net asset value (“NAV”) using procedures that allow for a variety of methodologies to be used to value the Portfolio’s investments. The specific methodology used for an investment may vary based on the market data available for a specific investment at the time the Portfolio calculates its NAV or based on other considerations. The procedures also permit a level of judgment to be used in the valuation process.
Domestic and foreign equity securities, such as common stock, exchange-traded funds, rights, warrants, and preferred stock, that are traded on a securities exchange on a valuation date are generally valued at their last quoted sale price or official closing price on the primary exchange for such security, or, if no sales occurred on that day, at the last reported bid price. Equity securities traded over-the-counter (“OTC”) are generally valued at the last reported bid price. In the event of a major exchange closing during the trading day, the Adviser may use other market information obtained from quotation reporting systems, established market makers, or pricing services in valuing the securities. Valuation adjustments may be applied to certain foreign equity securities that are traded solely on foreign exchanges that close before the time as of which the Portfolio determines its NAV to account for the market movement between the close of the foreign exchanges and the time as of which the Portfolio determines its NAV. The Portfolio may use a systematic fair valuation model provided by a pricing service to value securities principally traded in these foreign markets to adjust for possible market movements or other changes that may occur between the close of the foreign exchanges and the time as of which the Portfolio determines its NAV. Foreign equity securities valued using these valuation adjustments are generally categorized as Level 2 within the fair value hierarchy. Equity securities that are actively traded, and have no valuation adjustments applied, are categorized as Level 1 within the fair value hierarchy. Other equity securities traded on inactive markets or valued in reference to similar instruments traded on active markets are generally categorized as Level 2 within the fair value hierarchy.
Investments in registered open-end management investment companies are valued at reported NAV per share on the valuation date and are categorized as Level 1 within the fair value hierarchy.
Debt securities, including corporate, convertible and municipal bonds and notes; obligations of the U.S. Treasury and U.S. government agencies; foreign sovereign issues; and non-U.S. bonds, are generally valued based upon evaluated or composite bid quotations obtained from third-party pricing services and/or brokers and dealers selected by the Adviser (each a “pricing service”). Such pricing services may use matrix pricing, which considers observable inputs including, among other things, issuer details, maturity dates, interest rates, yield curves, rates of prepayment, credit risks/spreads, default rates, reported trades, broker-dealer quotes and quoted prices for similar assets. Short-term obligations with a remaining maturity of sixty days or less may be valued at amortized cost in the
absence of market quotes, so long as the amortized cost value of such short-term debt instrument is approximately the same as the fair
BHFTII-11
Brighthouse Funds Trust II
VanEck Global Natural Resources Portfolio
Notes to Financial Statements—December 31, 2023—(Continued)
value of the instrument as determined without the use of amortized cost valuation. Floating rate loans are generally valued based upon an evaluated or composite average of aggregate bid and ask quotations supplied by brokers or dealers, as obtained from the pricing service. Securities that use similar valuation techniques and inputs as described above are generally categorized as Level 2 within the fair value hierarchy.
Options, whether on securities, indices, futures contracts, or otherwise, traded on exchanges are valued at the last sale price available as of the close of business on a valuation day or, if there is no such price available, at the last reported bid price. These types of options are categorized as Level 1 within the fair value hierarchy. Futures contracts that are traded on commodity exchanges are valued at their settlement prices established by the exchanges on which they are traded as of the close of such exchanges and are categorized as Level 1 within the fair value hierarchy.
If no current market quotation is readily available or market value quotations are deemed to be unreliable for an investment, the fair value of the investment will be determined in accordance with procedures. A market quotation is readily available only when that quotation is a quoted price (unadjusted) in active markets for identical investments that the Portfolio can access at the measurement date, provided that a quotation will not be readily available if it is not reliable.
Pursuant to Rule 2a-5 under the 1940 Act, the Board of Trustees (the “Board” or “Trustees”) of the Trust has designated Brighthouse Investment Advisers, acting through its Valuation Committee (“Committee”), as the Portfolio’s “valuation designee” to perform the Portfolio’s fair value determinations. The Board oversees Brighthouse Investment Advisers in its role as the Valuation Designee and receives reports from Brighthouse Investment Advisers regarding its process and the valuation of the Portfolio’s investments to assist with such oversight.
No single standard for determining the fair value of an investment can be set forth because fair value depends upon the facts and circumstances with respect to each investment. Information relating to any relevant factors may be obtained by the Committee from any appropriate source, including the subadviser of the Portfolio, the Custodian, a pricing service, market maker and/or broker for such security or the issuer. Appropriate methodologies for determining fair value under particular circumstances may include: matrix pricing, a discounted cash flow analysis, comparisons of securities with comparable characteristics, value based on multiples of earnings, discount from market price of similar marketable securities, or a combination of these and other methods.
Foreign Currency Translation - The books and records of the Portfolio are maintained in U.S. dollars. The values of securities, currencies, and other assets and liabilities denominated in currencies other than the U.S. dollar are translated into U.S. dollars based upon foreign exchange rates prevailing at the end of the period. Purchases and sales of investment securities, income, and expenses are translated on the respective dates of such transactions. Because the values of investment securities are translated at the foreign exchange rates prevailing at the end of the period, that portion of the results of operations arising from changes in exchange rates and that portion of the results of operations reflecting fluctuations arising from changes in market prices of the investment securities are not separated. Such fluctuations are included in the net realized and unrealized gain or loss on investments.
Net realized foreign exchange gains or losses arise from activity in forward foreign currency exchange contracts, sales of foreign currency, currency gains or losses realized between the trade and settlement dates on securities transactions, and the difference between the amounts of dividends, interest, and foreign withholding taxes recorded by the Portfolio and the U.S. dollar-equivalent of the amounts actually received or paid by the Portfolio. Net unrealized foreign exchange gains and losses arise from changes in the value of assets and liabilities, other than investment securities, resulting from changes in foreign exchange rates.
Investment Transactions and Related Investment Income - Portfolio security transactions are recorded on the trade date. Dividend income is recorded on the ex-dividend date or, for certain foreign securities, when notified. Interest income, which includes amortization of premium and accretion of discount on debt securities, is recorded on the accrual basis. Realized gains and losses on investments are determined on the identified cost basis, which is the same basis used for federal income tax purposes. Foreign income and foreign capital gains on some foreign securities may be subject to foreign taxes, which are accrued as applicable. These foreign taxes have been provided for in accordance with the Portfolio’s understanding of the applicable countries’ tax rules and rates.
Dividends and Distributions to Shareholders - The Portfolio records dividends and distributions on the ex-dividend date. Net realized gains from securities transactions (if any) are generally distributed annually to shareholders. The timing and characterization of certain income and capital gains distributions are determined in accordance with federal tax regulations that may differ from GAAP. Permanent book and tax basis differences relating to shareholder distributions will result in reclassification between distributable earnings (accumulated losses) and paid in surplus. These adjustments have no impact on net assets or the results of operations.
Income Taxes - It is the Portfolio’s policy to comply with the requirements of the Internal Revenue Code of 1986, as amended, and regulations thereunder, applicable to regulated investment companies, and to distribute, with respect to each taxable year, all of its taxable income to shareholders. Therefore, no federal income tax provision is required. The Portfolio files U.S. federal tax returns. No income tax returns are currently under examination. The Portfolio’s federal tax returns remain subject to examination by the Internal Revenue Service for three fiscal years after the returns are filed. As of December 31, 2023, the Portfolio had no uncertain tax positions that would require financial statement recognition, derecognition or disclosure.
BHFTII-12
Brighthouse Funds Trust II
VanEck Global Natural Resources Portfolio
Notes to Financial Statements—December 31, 2023—(Continued)
Repurchase Agreements - The Portfolio may enter into repurchase agreements, under the terms of a Master Repurchase Agreement (“MRA”), or Global Master Repurchase Agreement (“GMRA”), with selected commercial banks and broker-dealers, under which the Portfolio acquires securities as collateral and agrees to resell the securities at an agreed-upon time and at an agreed-upon price. The Portfolio, through the Custodian or a subcustodian, under a tri-party repurchase agreement, receives delivery of the underlying securities collateralizing any repurchase agreements. It is the Portfolio’s policy that the market value of the collateral be equal to at least 100% of the repurchase price in the case of a repurchase agreement of one-day duration and equal to at least 102% of the repurchase price in the case of all other repurchase agreements. In the event of default or failure by a party to perform an obligation in connection with any repurchase transaction, the MRA or GMRA gives the non-defaulting party the right to set-off claims and to apply property held by it in connection with any repurchase transaction against obligations owed to it under the agreement.
At December 31, 2023, the Portfolio invested cash collateral for loans of portfolio securities in repurchase agreements with a gross value of $94,971,666, which is included as part of investments at value on the Statement of Assets and Liabilities. The value of the related collateral exceeded the value of the repurchase agreements at December 31, 2023.
Securities Lending - The Portfolio may lend its portfolio securities to certain qualified brokers who borrow securities in order to complete certain securities transactions. By lending its portfolio securities, the Portfolio attempts to increase its net investment income through the receipt of income on collateral held from securities on loan. Any gain or loss in the market price of the loaned securities that might occur, any interest earned, and any dividends declared during the term of the loan, would accrue to the account of the Portfolio.
The Trust has entered into a Non-Custodial Securities Lending Agreement with JPMorgan Chase Bank, N.A. (the “Lending Agent”). Under the agreement, the Lending Agent is authorized to loan portfolio securities on the Portfolio’s behalf. In exchange, the Portfolio generally receives cash, U.S. Government securities, letters of credit, or other collateral deemed appropriate by the Adviser. The Portfolio receives collateral equal to at least 102% of the market value for loans secured by government securities or cash in the same currency as the loaned shares and 105% for all other loaned securities at each loan’s inception. Collateral representing at least 100% of the market value of the loaned securities is maintained for the duration of the loan. Any cash collateral received by the Portfolio is generally invested by the Lending Agent in short-term investments, which may include certificates of deposit, commercial paper, repurchase agreements, including repurchase agreements with respect to equity securities, time deposits, master demand notes and money market funds. The market value of investments made with cash collateral received are disclosed in the Schedule of Investments and the valuation techniques are described in Note 2. The value of the securities on loan may change each business day. If the market value of the collateral at the close of trading on a business day is less than 100% of the market value of the loaned securities at the close of trading on that day, the borrower is required to deliver, by the close of business on the following business day, an additional amount of collateral, so that the total amount of posted collateral is equal to at least 100% of the market value of all the loaned securities as of such preceding day. A portion of the income earned on the collateral is rebated to the borrower of the securities and the remainder is split between the Lending Agent and the Portfolio. On loans collateralized by U.S. government securities, a fee is received from the borrower and is allocated between the Portfolio and the Lending Agent.
Income received by the Portfolio in securities lending transactions during the year ended December 31, 2023 is reflected as securities lending income on the Statement of Operations. The values of any securities loaned by the Portfolio and the related collateral at December 31, 2023 are disclosed in the footnotes to the Schedule of Investments. The value of the related collateral received by the Portfolio exceeded the value of the securities out on loan at December 31, 2023.
The risks associated with lending portfolio securities include, but are not limited to, possible delays in receiving additional collateral or in the recovery of the loaned securities, possible loss of rights in the collateral should the borrower fail financially, as well as risk of loss in the value of the collateral or the value of the investments made with the collateral. To the extent the Portfolio uses cash collateral it receives to invest in repurchase agreements with respect to equity securities, it is subject to the risk of loss if the value of the equity securities declines and the counterparty defaults on its obligation to repurchase such securities. The Lending Agent shall indemnify the Portfolio in the case of default of any securities borrower, subject to the terms of the Non-Custodial Securities Lending Agreement.
All securities on loan are classified as Common Stocks in the Portfolio’s Schedule of Investments as of December 31, 2023. For all securities on loan, the remaining contractual maturity of the agreements is overnight and continuous.
Directed Brokerage Agreement - The Trust has entered into a directed brokerage arrangement with Capital Institutional Services, Inc. (“CAPIS”). Under this arrangement, the Portfolio directs certain trades to CAPIS in return for a recapture credit. CAPIS issues a cash rebate to the Portfolio. Amounts paid to the Portfolio are shown separately as broker commission recapture on the Statement of Operations of the Portfolio. Additionally, these amounts have been excluded from the calculation of the net ratio of expenses to average net assets presented in the Financial Highlights for each share class.
BHFTII-13
Brighthouse Funds Trust II
VanEck Global Natural Resources Portfolio
Notes to Financial Statements—December 31, 2023—(Continued)
3. Certain Risks
In the normal course of business, the Portfolio invests in securities and enters into transactions where risks exist. Those risks include:
Market Risk: The value of securities held by the Portfolio may decline in response to certain events, including those directly involving the issuers whose securities are owned by the Portfolio; conditions affecting the general economy; overall market changes; local, regional or global political, social or economic instability; currency, interest rate, and price fluctuations, or other factors including terrorism, war, natural disasters and the spread of infectious illness including epidemics or pandemics such as the COVID-19 pandemic. These events may also adversely affect the liquidity of securities held by the Portfolio.
Credit and Counterparty Risk: The Portfolio may be exposed to counterparty risk, or the risk that an entity with which the Portfolio has unsettled or open transactions may default. The potential loss could exceed the value of the financial assets and liabilities recorded in the financial statements. Financial assets that potentially expose the Portfolio to credit and counterparty risk consist principally of cash due from counterparties and investments. The Portfolio manages counterparty risk by entering into agreements only with counterparties that it believes have the financial resources to honor their obligations and by monitoring the financial stability of those counterparties. The Subadviser may attempt to mitigate counterparty risk by (i) periodically assessing the creditworthiness of its trading partners, (ii) monitoring and/or limiting the amount of its net exposure to each individual counterparty based on its assessment, and (iii) requiring collateral from the counterparty for certain transactions. In order to preserve certain safeguards for non-standard settlement trades, the Portfolio restricts its exposure to credit and counterparty losses by entering into master netting agreements (“Master Agreements”) with counterparties (approved brokers) with whom it undertakes a significant volume of transactions. Master Agreements govern the terms of certain transactions and reduce the counterparty risk associated with relevant transactions by specifying credit protection mechanisms and providing standardization that improves legal certainty. Master Agreements can also help limit counterparty risk by specifying collateral posting arrangements at pre-arranged exposure levels.
Repurchase and reverse repurchase agreements are primarily executed under GMRAs or MRAs, which provide the right to set-off. Each repurchase and reverse repurchase agreement is initially collateralized at the transaction level. In the event of default, the total market value exposure will be offset against collateral exchanged to date, which would result in a net receivable/(payable) that would be due from/to the counterparty.
Natural Resource and Foreign Investment Risk: The Portfolio may concentrate its investments in companies which are significantly engaged in the exploration, development, production and distribution of gold and other natural resources such as strategic and other metals, minerals, forest products, oil, natural gas and coal and by investing in gold bullion and coins. Since the Portfolio may concentrate its investments, it may be subject to greater risks and market fluctuations than other more diversified portfolios. The production and marketing of gold and other natural resources may be affected by actions and changes in governments. In addition, gold and natural resources may be cyclical in nature. In addition, the investments by the Portfolio in foreign securities, whether direct or indirect, may involve risks not present in domestic investments. Since securities may be denominated in foreign currencies, may require settlement in foreign currencies and pay interest or dividends in foreign currencies, changes in the relationship of these foreign currencies to the U.S. dollar can significantly affect the value of the investments and earnings of the Portfolio. Foreign investments may also subject the Portfolio to foreign government exchange restrictions, expropriation, taxation, unexpected market closures or other political, social or economic developments, ,such as the imposition of economic sanctions against one or more countries, organizations, entities and/or individuals, all of which could affect the market and/or credit risk of the investments. In addition to the risks described above, risks may arise from forward foreign currency contracts with respect to the potential inability of counterparties to meet the terms of their contracts.
Additional risks associated with each type of investment are described above within the respective security type notes. The Portfolio’s prospectus includes a discussion of the principal risks of investing in the Portfolio.
4. Investment Transactions
Aggregate cost of purchases and proceeds of sales of investment securities, excluding short-term securities, for the year ended December 31, 2023 were as follows:
| Purchases |
Sales | ||||||||||||||
| U.S. Government |
Non-U.S. Government | U.S. Government | Non-U.S. Government | ||||||||||||
| $0 | $405,534,953 | $0 | $335,745,590 | ||||||||||||
BHFTII-14
Brighthouse Funds Trust II
VanEck Global Natural Resources Portfolio
Notes to Financial Statements—December 31, 2023—(Continued)
5. Investment Management Fees and Other Transactions with Affiliates
Investment Management Agreement - Brighthouse Investment Advisers is the investment adviser to the Portfolio. The Trust has entered into an investment management agreement with Brighthouse Investment Advisers with respect to the Portfolio. For providing investment management services to the Portfolio, Brighthouse Investment Advisers receives monthly compensation at the following annual rates:
|
Management |
% per annum | Average Daily Net Assets | ||||||||
| $6,302,876 | 0.800% | Of the first $250 million | ||||||||
| 0.775% | Of the next $750 million | |||||||||
| 0.750% | On amounts in excess of $1 billion | |||||||||
Brighthouse Investment Advisers has entered into an investment subadvisory agreement with respect to managing the Portfolio. Van Eck Associates Corporation is compensated by Brighthouse Investment Advisers to provide subadvisory services for the Portfolio.
Management Fee Waiver - Pursuant to a management fee waiver agreement, the Adviser has agreed, for the period May 1, 2023 to April 30, 2024, to reduce its advisory fees set out above under “Investment Management Agreement” for each class of the Portfolio as follows:
| % per annum reduction |
Average Daily Net Assets | |
| 0.050% 0.075% |
Of the first $500 million On amounts over $500 million |
An identical agreement was in place for the period April 29, 2022 to April 30, 2023. Amounts waived for the year ended December 31, 2023 are shown as a management fee waiver in the Statement of Operations.
Certain officers and trustees of the Trust may also be officers of the Adviser; however, such officers and trustees receive no compensation from the Trust.
Transfer Agency Agreement - Brighthouse Life Insurance Company serves as the transfer agent for the Trust. Brighthouse Life Insurance Company receives no fees for its services to the Trust.
Distribution and Service Fees - The Trust has a distribution agreement with Brighthouse Securities, LLC (the “Distributor”) pursuant to which the Distributor serves as the general distributor of shares of each class (each a “Class”) of each Portfolio. The Distributor is an affiliate of the Trust. The Trust has adopted a Distribution and Services Plan (the “D&S Plan”) relating to Class B, Class D, Class E, Class F and Class G shares of each Portfolio, under Rule 12b-1 under the 1940 Act, pursuant to which the Trust may pay the Distributor a fee (the “Service Fee”) at an annual rate not to exceed 0.25% of each such Portfolio’s average daily net assets attributable to the Class B, Class D, Class E, Class F and Class G shares of the Trust. Each Portfolio may not offer shares of each Class. The D&S Plan also authorizes the Trust, on behalf of each of its Portfolios, to pay to the Distributor a distribution fee (the “Distribution Fee” and together with the Service Fee, the “Fees”) at an annual rate of up to 0.25% of each Portfolio’s average daily net assets attributable to the Class B, Class D, Class E, Class F, and Class G shares in consideration of the services rendered in connection with the sale of such shares by the Distributor. Under the Distribution Agreement with respect to the Trust, Fees are currently paid at an annual rate of 0.25% of average daily net assets in the case of Class B shares, 0.10% of average daily net assets in the case of Class D shares, 0.15% of average daily net assets in the case of Class E shares, 0.20% of average daily net assets in the case of Class F shares and 0.30% of average daily net assets in the case of Class G shares. The D&S Plan is known as a “compensation plan” because the Trust makes payments to the Distributor for services rendered regardless of the actual level of expenditures by the Distributor. Amounts incurred by the Portfolio for the year ended December 31, 2023 are shown as Distribution and service fees in the Statement of Operations.
Deferred Trustee Compensation - Each Trustee who is not currently an employee of the Adviser or any of its affiliates receives compensation from the Trust for his or her service to the Trust. A deferred compensation plan (the “Plan”) is available to the Trustees on a voluntary basis. Deferred amounts remain in the Trust until distributed in accordance with the provisions of the Plan. The value of a participating Trustee’s deferral account is based on theoretical investments of deferred amounts on the normal payment dates in certain portfolios of the Trust or Brighthouse Funds Trust I, an affiliate of the Trust, as designated by the participating Trustee. Changes in the value of participants’ deferral accounts are reflected as a component of Trustees’ fees and expenses in the Statement of Operations. The portion of the accrued obligations allocated to the Portfolio under the Plan is reflected as Deferred trustees’ fees in the Statement of Assets and Liabilities.
BHFTII-15
Brighthouse Funds Trust II
VanEck Global Natural Resources Portfolio
Notes to Financial Statements—December 31, 2023—(Continued)
6. Contractual Obligations
Under the Trust’s organizational documents, its officers and Trustees may be indemnified against certain liabilities and expenses arising out of the performance of their duties to the Trust. Additionally, the Trust has a variety of indemnification obligations under contracts with its service providers. The Trust’s maximum exposure under these arrangements is unknown, as this would involve future claims that may be made against the Trust that have not yet occurred.
7. Income Tax Information
The cost basis of investments for federal income tax purposes at December 31, 2023 was as follows:
| Cost basis of investments |
$ | 933,404,111 | ||
|
|
|
|||
| Gross unrealized appreciation |
103,557,624 | |||
| Gross unrealized (depreciation) |
(52,731,780 | ) | ||
|
|
|
|||
| Net unrealized appreciation (depreciation) |
$ | 50,825,844 | ||
|
|
|
The tax character of distributions paid for the years ended December 31, 2023 and 2022 were as follows:
| Ordinary Income |
Long-Term Capital Gain | Total | |||||||||||||||||||||||
| 2023 |
2022 | 2023 | 2022 | 2023 | 2022 | ||||||||||||||||||||
| $24,403,616 | $25,253,820 | $— | $— | $24,403,616 | $25,253,820 | ||||||||||||||||||||
As of December 31, 2023, the components of distributable earnings (accumulated losses) on a federal income tax basis were as follows:
| Undistributed |
Undistributed Long-Term Capital Gain |
Net Unrealized Appreciation (Depreciation) |
Accumulated Capital Losses |
Total | ||||||||||||||||
| $20,995,001 | $ | 30,072,751 | $ | 50,826,113 | $ | — | $ | 101,893,865 | ||||||||||||
The Portfolio utilizes the provisions of the federal income tax laws that provide for the carryforward of capital losses for prior years, offsetting such losses against any future realized capital gains. Net capital losses may be carried forward indefinitely and their character is retained as short-term and/or long-term losses.
As of December 31, 2023, the Portfolio had no accumulated capital losses.
During the year ended December 31, 2023, the Portfolio utilized accumulated short-term capital losses of $2,552,494 and accumulated long-term capital losses of $24,721,656.
8. Recent Accounting Pronouncement & Regulatory Updates
In June 2022, FASB issued Accounting Standards Update 2022-03 — Fair Value Measurement (Topic 820) — Fair Value Measurement of Equity Securities Subject to Contractual Sale Restrictions (“ASU 2022-03”). ASU 2022-03 clarifies the guidance in Topic 820 to indicate that a contractual sale restriction should not be considered in the fair value of an equity security subject to such a restriction, and requires entities with investments in equity securities subject to contractual sale restrictions to disclose certain qualitative and quantitative information about such securities. ASU 2022-03 is effective for fiscal years, and interim periods within those fiscal years, beginning after December 15, 2023. ASU 2022-03 is only applicable to an equity security in which the contractual arrangement that restricts its sale is executed or modified on or after the adoption date.
Effective January 24, 2023, the Securities and Exchange Commission adopted rule and form amendments that require open-end management investment companies to transmit concise and visually engaging annual and semiannual reports to shareholders that highlight certain information deemed by the SEC to be particularly important for investors. Certain other information, including financial statements, will no longer appear in shareholder reports but will, as required, be available online, delivered free of charge upon request, and filed on a semiannual basis on Form N-CSR. The rule and form amendments have a compliance date of July 24, 2024. Accordingly, the rule and form amendments will not impact the Portfolio until its 2024 semiannual shareholder report.
BHFTII-16
Brighthouse Funds Trust II
VanEck Global Natural Resources Portfolio
Report of Independent Registered Public Accounting Firm
To the Board of Trustees of Brighthouse Funds Trust II and Shareholders of the VanEck Global Natural Resources Portfolio:
Opinion on the Financial Statements and Financial Highlights
We have audited the accompanying statement of assets and liabilities, including the schedule of investments, of the VanEck Global Natural Resources Portfolio (the “Fund”) (one of the funds constituting the Brighthouse Funds Trust II), as of December 31, 2023, the related statement of operations for the year then ended, the statements of changes in net assets for each of the two years in the period then ended, the financial highlights for each of the five years in the period then ended, and the related notes. In our opinion, the financial statements and financial highlights present fairly, in all material respects, the financial position of the Fund as of December 31, 2023, and the results of its operations for the year then ended, the changes in its net assets for each of the two years in the period then ended, and the financial highlights for each of the five years in the period then ended in conformity with accounting principles generally accepted in the United States of America.
Basis for Opinion
These financial statements and financial highlights are the responsibility of the Fund’s management. Our responsibility is to express an opinion on the Fund’s financial statements and financial highlights based on our audits. We are a public accounting firm registered with the Public Company Accounting Oversight Board (United States) (PCAOB) and are required to be independent with respect to the Fund in accordance with the U.S. federal securities laws and the applicable rules and regulations of the Securities and Exchange Commission and the PCAOB.
We conducted our audits in accordance with the standards of the PCAOB. Those standards require that we plan and perform the audit to obtain reasonable assurance about whether the financial statements and financial highlights are free of material misstatement, whether due to error or fraud. The Fund is not required to have, nor were we engaged to perform, an audit of its internal control over financial reporting. As part of our audits we are required to obtain an understanding of internal control over financial reporting but not for the purpose of expressing an opinion on the effectiveness of the Fund’s internal control over financial reporting. Accordingly, we express no such opinion.
Our audits included performing procedures to assess the risks of material misstatement of the financial statements and financial highlights, whether due to error or fraud, and performing procedures that respond to those risks. Such procedures included examining, on a test basis, evidence regarding the amounts and disclosures in the financial statements and financial highlights. Our audits also included evaluating the accounting principles used and significant estimates made by management, as well as evaluating the overall presentation of the financial statements and financial highlights. Our procedures included confirmation of securities owned as of December 31, 2023, by correspondence with the custodian and brokers; when replies were not received from brokers, we performed other auditing procedures. We believe that our audits provide a reasonable basis for our opinion.
/s/ Deloitte & Touche LLP
Boston, Massachusetts
February 23, 2024
We have served as the auditor of one or more Brighthouse investment companies since 1983.
BHFTII-17
Brighthouse Funds Trust II
Trustees and Officers
MANAGEMENT OF THE TRUSTS
The Boards of Trustees (the “Board”) of Brighthouse Funds Trust I and Brighthouse Funds Trust II (“Trust I” and “Trust II”, respectively, and collectively the “Trusts”) supervise the Trusts and are responsible for representing the interests of shareholders. The Trustees, the Chairman of the Board and the Chairmen of each subcommittee are the same for both Trusts. The Trustees of each Trust meet periodically throughout the year to oversee the Portfolios’ activities, reviewing, among other things, each Portfolio’s performance and its contractual arrangements with various service providers. The Trustees of each Trust elect the officers of the Trust, who are responsible for administering the Trust’s day-to-day operations.
Trustees and Officers
The Trustees and executive officers of the Trusts, as well as their ages and their principal occupations during the past five years, are set forth below. Unless otherwise indicated, the business address of each is c/o Brighthouse Funds Trust I and Brighthouse Funds Trust II, 11225 N. Community House Rd., Charolette, North Carolina 28277. Each Trustee who is deemed an “interested person,” as such term is defined in the 1940 Act, is referred to as an “Interested Trustee.” Those Trustees who are not “interested persons,” as such term is defined in the 1940 Act, are referred to as “Independent Trustees.” There is no limit to the term a Trustee may serve, other than pursuant to the retirement policy adopted by the Independent Trustees. Trustees serve until their death, resignation, retirement or removal in accordance with Trust I’s and Trust II’s respective organizational documents and policies adopted by the Board of the Trust from time to time. Officers hold office at the pleasure of each Board and serve until their removal or resignation in accordance with the Trusts’ respective organizational documents and policies adopted by the Board of each Trust from time to time.
Trustees of the Trusts
| Name and Year of Birth |
Position(s) |
Term of Office |
Principal Occupation(s) During the Past |
Number of |
Other Directorships Held | |||||
| Interested Trustee | ||||||||||
| John Rosenthal* (1960) |
Trustee | Indefinite; From May 2016 (Trust I and Trust II) to present | Chief Investment Officer, Brighthouse Financial, Inc. (2016 to present). | 73 | None | |||||
| Independent Trustees | ||||||||||
| Dawn M. Vroegop (1966) |
Trustee and Chair of the Board | Indefinite; From December 2000 (Trust I)/May 2009 (Trust II) to present as Trustee; From May 2016 (Trust I and Trust II) until present as Chair | Retired; Private Investor. | 73 | Trustee, Driehaus Mutual Funds (8 portfolios).** | |||||
| Stephen M. Alderman (1959) |
Trustee | Indefinite; From December 2000 (Trust I)/April 2012 (Trust II) to present | Vice President and General Counsel, IHR Aerial Solutions, LLC; Until 2022, General Counsel, Illini Hi-Reach, Inc.; Until 2020, Shareholder in the law firm of Garfield & Merel, Ltd. | 73 | None | |||||
| Robert J. Boulware (1956) |
Trustee | Indefinite; From March 2008 (Trust I)/April 2012 (Trust II) to present | Managing Member, Pilgrim Funds, LLC (private equity fund). | 73 | Trustee, Vertical Capital Income Fund (closed-end fund);** Trustee, The Private Shares Fund (closed- end fund);** Until 2021, Director, Mid- Con Energy Partners, LP (energy);** Until 2020, Director, Gainsco, Inc. (auto insurance).** | |||||
| Susan C. Gause (1952) |
Trustee | Indefinite; From March 2008 (Trust I)/April 2012 (Trust II) to present | Private Investor. | 73 | Trustee, HSBC Funds (4 portfolios).** | |||||
BHFTII-18
Brighthouse Funds Trust II
Trustees and Officers—(Continued)
| Name and Year of Birth |
Position(s) |
Term of Office |
Principal Occupation(s) During the Past |
Number of |
Other Directorships Held | |||||
| Nancy Hawthorne (1951) |
Trustee | Indefinite; From May 2003 (Trust II)/April 2012 (Trust I) to present | Private Investor. | 73 | Trustee, First Eagle Credit Opportunities Fund;** Trustee and Chair of the Board of Trustees, First Eagle Global Opportunities Fund;** Director, Avid Technology, Inc;** Director, CRA International, Inc.** | |||||
Executive Officers of the Trusts
| Name and Year of Birth |
Position(s) |
Term of Office |
Principal Occupation(s) | |||
| Kristi Slavin (1973) | President and Chief Executive Officer, of Trust I and Trust II | From May 2016 (Trust I and Trust II) to present |
President, Brighthouse Investment Advisers, LLC (2016-present). | |||
| Alan R. Otis (1971) | Chief Financial Officer and Treasurer, of Trust I and Trust II | From November 2017 (Trust I and Trust II) to present |
Executive Vice President, Brighthouse Investment Advisers, LLC (2017-present); formerly, Vice President, Brighthouse Investment Advisers, LLC (2012-2017); Assistant Treasurer, Trust I and Trust II (2012-2017). | |||
| Thomas Watterson (1985) | Secretary, of Trust I and Trust II | From November 2023 (Trust I and Trust II) to present |
Executive Vice President, Chief Legal Officer and Secretary, Brighthouse Investment Advisers, LLC (2023-Present); Managing Corporate Counsel, Brighthouse Financial Inc. (2023-present); Managing Counsel and Director, The Bank of New York Mellon Corporation (2019-2023); Counsel and Vice President, The Bank of New York Mellon Corporation (2016-2019). | |||
| Katie Hellmann (1980) | Chief Compliance Officer (“CCO”), of Trust I and Trust II | From May 2023 (Trust I and Trust II) to present |
Chief Compliance Officer, Brighthouse Investment Advisers, LLC (2023-present) and Head of Funds and Investments Compliance (2023-present). Deputy Chief Compliance Officer, Transamerica Asset Management (2022-2023). Leader and Senior Compliance Counsel – Funds Compliance, Edward Jones (2017-2022). | |||
| Rosemary Morgan (1983) | Anti-Money Laundering Officer, of Trust I and Trust II | From May 2023 (Trust I and Trust II) to present |
Chief Privacy Officer, Leader of Compliance Programs and Assistant General Counsel, Brighthouse Financial, Inc. (2019-2022); Chief Privacy Officer, Head of Compliance Programs & Contracts Law, Brighthouse Financial, Inc. (2022-2023), Chief Compliance Officer and Associate General Counsel, Brighthouse Financial, Inc. (2023-present); Vice President and Chief Compliance Officer, Brighthouse Life Insurance Company (2023-present); Vice President and Chief Compliance Officer (2023-present), Brighthouse Life Insurance Company of NY; Vice President and Chief Compliance Officer (2023-present), New England Life Insurance Company. | |||
| Anna Koska (1981) | Vice President, of Trust I and Trust II | From June 2022 (Trust I and Trust II) to present |
Vice President, Investment and Advisory Services, Brighthouse Investment Advisers, LLC (2022-present); Director of Investment and Advisory Services, Brighthouse Investment Advisers, LLC (2019-2022); Senior Portfolio Analyst, Brighthouse Investment Advisers, LLC (2017-2019). | |||
| * | Mr. Rosenthal is an “interested person” of the Trusts because of his position with Brighthouse Financial, Inc. (“Brighthouse Financial”), an affiliate of BIA. |
| ** | Indicates a directorship with a registered investment company or a company subject to the reporting requirements of the Securities Exchange Act of 1934, as amended. |
| (1) | Previous positions during the past five years with the Trusts, MetLife, Inc. or the Adviser are omitted if not materially different. |
| (2) | The Fund Complex includes 44 Trust I Portfolios and 29 Trust II Portfolios. |
BHFTII-19
Brighthouse Funds Trust II
VanEck Global Natural Resources Portfolio
Board of Trustees’ Consideration of Advisory and Sub-Advisory Agreements
At a meeting held on November 13-14, 2023 (the “November Meeting”), the Boards of Trustees (the “Board”) of Brighthouse Funds Trust I and Brighthouse Funds Trust II (“BFT I” and “BFT II,” respectively, and collectively, the “Trusts”), including a majority of the Trustees who are not “interested persons” of the Trusts (the “Independent Trustees”) under the Investment Company Act of 1940 (the “1940 Act”), approved the continuation of the Trusts’ advisory agreements (each an “Advisory Agreement”) with Brighthouse Investment Advisers, LLC (the “Adviser”) and the applicable sub-advisory and sub-sub-advisory agreements (each a “Sub-Advisory Agreement” and collectively with the Advisory Agreement, the “Agreements”) between the Adviser and the investment sub-advisers and sub-sub-adviser (each a “Sub-Adviser,” and collectively, the “Sub-Advisers”) for the series of the Trusts (each a “Portfolio,” and collectively, the “Portfolios”) for the annual contract renewal period from January 1, 2024 through December 31, 2024.
The Board met with personnel of the Adviser on September 28-29, 2023 (the “September Meeting”) for the specific purpose of giving preliminary consideration to the proposed continuation of the Agreements, including consideration to information that the Adviser and Sub-Advisers had provided for the Board’s review at the request of the Independent Trustees. At the September Meeting, the Adviser reviewed with the Board the performance and fees experienced by each Portfolio, as well as other information. During and after the September Meeting, the Independent Trustees requested additional information and clarifications that the Adviser addressed at the November Meeting (the September Meeting and the November Meeting are referred to collectively as, the “Meetings”). During the contract renewal process, and throughout the year, the Independent Trustees were advised by independent legal counsel, and they met with independent legal counsel in executive sessions outside of the presence of management on a number of occasions to discuss, among other things, the renewal of the Agreements.
In considering the continuation of the Agreements, the Board reviewed a variety of materials that were provided for the specific purpose of assisting the Board in the renewal process, along with various information and materials that were provided to and discussed with the Board throughout the year, at regularly scheduled meetings of the Board and its committees. In particular, information for each Portfolio included, but was not limited to, reports on investment performance, expenses, legal and compliance matters, and asset pricing. Information about the Adviser and each Sub-Adviser included, but was not limited to, reports on the business, operations, and performance of the Adviser and the Sub-Advisers and reports that the Adviser and Sub-Advisers had prepared specifically for the renewal process.
In considering the continuation of the Agreements, the Board also reviewed, among other things, a report for each Portfolio that was prepared by Broadridge (“Broadridge”), an independent organization, which set forth comparative performance and expense information for each Portfolio. In addition, the Independent Trustees reviewed a report that was prepared by JDL Consultants, LLC (“JDL”), an independent consultant to the Independent Trustees, which examined the Broadridge reports for each Portfolio (“JDL Report”). The Independent Trustees met in executive session with representatives of JDL during the September Meeting to review the JDL Report.
At the November Meeting, the Board, including a majority of the Independent Trustees, concluded that the nature, extent, and quality of services provided by the Adviser and each Sub-Adviser supported the renewal of the Agreements. The Board also concluded that the investment services provided to and the performance of each Portfolio was such that each Agreement should continue, and that the fees paid by each Portfolio to the Adviser appeared to be reasonable in light of the nature, extent, and quality of the services provided by the Adviser and each Sub-Adviser. Further, the Board concluded that the Adviser’s profitability in providing services under the Advisory Agreements did not appear unreasonable in light of the nature, extent, and quality of the services provided by the Adviser. The Board reviewed the extent to which the investment advisory fees paid by the Portfolios shared economies of scale with investors or entailed the potential to share economies of scale with investors and concluded that those considerations generally supported the renewal of each Agreement. Finally, the Board considered the Adviser’s recommendation that it approve the renewal of each Sub-Advisory Agreement.
In approving the continuation of each Agreement, the Board, including the Independent Trustees, gave attention to all of the information that was furnished, and each Trustee placed varying degrees of importance on the various pieces of information that were provided to them. The Board evaluated the information provided to it on a Portfolio-by-Portfolio basis, and its decision was made separately with respect to each Portfolio. The following paragraphs provide more information about some of the primary factors that were relevant to the Board’s decisions. The Board did not identify any single factor as determinative, and the Trustees generally attributed different weights to various factors for the various Portfolios.
BHFTII-20
Brighthouse Funds Trust II
VanEck Global Natural Resources Portfolio
Board of Trustees’ Consideration of Advisory and Sub-Advisory Agreements—(Continued)
Nature, extent and quality of services. The Board evaluated the nature, extent, and quality of the services that the Adviser and the Sub-Advisers, as relevant, provided to the Portfolios. The Board considered the Adviser’s services as investment manager to the Portfolios, including its services relating to the hiring and oversight of the Sub-Advisers and, in particular, their investment programs and personnel, succession management of key personnel, trading practices, compliance programs and personnel, and risk management programs, among other things. The Adviser’s services in coordinating and overseeing the activities of the Trusts’ other service providers were also considered. The Board also considered the systems and processes required by the Adviser to meet additional regulatory and compliance requirements resulting from U.S. Securities and Exchange Commission and other regulatory initiatives, including related to liquidity, valuation, and derivatives risk management. The Board considered information received from the Trusts’ Chief Compliance Officer regarding the Portfolios’ compliance policies and procedures that were established pursuant to Rule 38a-l under the 1940 Act, and relevant aspects of the Adviser’s and Sub-Advisers’ compliance policies and procedures. The Board also noted that it was the practice of the Adviser’s investment, compliance, and legal staff to conduct periodic meetings (through various media) with the Sub-Advisers throughout the year in order to review and assess the services that are provided to the Portfolios, and that personnel of the Adviser routinely prepare and present reports to the Board regarding those meetings. In addition, during the Meetings and throughout the year, the Board considered the expertise, experience, and performance of the personnel of the Adviser who performed the various services that are mentioned above.
With respect to the services provided by each of the Sub-Advisers, the Board considered a variety of information that the Adviser and each Sub-Adviser prepared for the Board’s review. The Board considered each Sub-Adviser’s investment process, each Sub-Adviser’s overall organization and business plans and the investment performance experienced by the Portfolio (as described in more detail below). The Board took into account that each Sub-Adviser’s responsibilities include, among other things, the development and maintenance of an investment program for the applicable Portfolio, the selection of investments and the placement of orders for the purchase and sale of such assets, and the implementation of compliance controls related to the performance of these services. The Board considered, based on the information provided, each Sub-Adviser’s staffing with respect to the management of the Portfolio and other information relating to the Sub-Adviser’s business and operations. The Board also considered the Sub-Adviser’s overall resources and information with respect to any recent turnover of key personnel at the Sub-Adviser. The Board reviewed each Sub-Adviser’s investment experience, as well as information provided regarding the Sub-Adviser’s personnel who provide services to the Portfolios. The Board also considered, among other things, information about each Sub-Adviser’s compliance program, including regarding any compliance matters involving a Sub-Adviser that had been brought to the Board’s attention during the year, as well as the Adviser’s assessment of the financial condition of each Sub-Adviser.
Performance. The Board placed emphasis on the performance of each Portfolio in the context of the performance of the relevant markets in which the Portfolio invests. The Board considered the Adviser’s quarterly presentations to the Board of detailed information about each Portfolio’s investment strategies and performance results and composition, including discussions regarding the relevant effects of market conditions. The Board reviewed and considered the reports prepared by Broadridge, which provided a statistical analysis comparing each Portfolio’s investment performance to that of comparable funds underlying variable insurance products (the “Performance Universe”), and the JDL Report. The Board also compared the performance of each Portfolio to that of comparable funds and other accounts that were managed by the relevant Sub-Adviser, to the extent such information was provided. The Board considered each Portfolio’s performance for periods subsequent to the performance period covered by the Broadridge reports and considered the Adviser’s assessment of the same. The Board also noted that while it found the data provided by Broadridge generally useful, it recognized the limitations of such data, including, in particular, that notable differences may exist between a Portfolio and the other funds in a Broadridge category (for example, with respect to investment strategies) and that the results of the performance comparisons may vary depending on (i) the end dates for the performance periods that were selected and (ii) the selection of the peer groups.
The Board focused particular attention on Portfolios with less favorable performance records. The Board noted the Adviser’s focus on each Sub-Adviser’s performance and that the Adviser had been active in monitoring and responding to any performance issues with respect to the Portfolios.
Fees and Expenses. The Board gave consideration to the level and method of computing the fees payable under the Agreements. The Board reviewed and considered the information in the JDL Report concerning fees and expenses. The Board also reviewed and considered the Broadridge report for each Portfolio, which included various comparisons of the Portfolio’s fees (at December 31, 2022 and various asset levels) and expenses with those of its peers, including, as applicable, a broad group of peer funds (“Expense Universe”), a narrower group of peer funds (“Expense Group”), a broad group of peer sub-advised funds (“Sub-advised Expense Universe”), and a narrower group of peer sub-advised funds (“Sub-advised Expense Group”). In particular, the Board reviewed comparisons of each Portfolio’s contractual management fees with its Expense Group and Sub-advised Expense Universe, contractual
BHFTII-21
Brighthouse Funds Trust II
VanEck Global Natural Resources Portfolio
Board of Trustees’ Consideration of Advisory and Sub-Advisory Agreements—(Continued)
sub-adviser fees with its Sub-advised Expense Universe and Sub-advised Expense Group, and total expenses with its Expense Universe, Expense Group and Sub-advised Expense Universe. The Board considered that Broadridge selected the peer funds, which were funds underlying variable insurance products that Broadridge deemed to be comparable to the Portfolios. The Board considered that the fee and expense information in the Broadridge report for each Portfolio reflected information as of the Portfolio’s most recent fiscal year end at the time the Broadridge report was issued and that historical asset levels may differ from current asset levels, particularly in a period of market volatility. In addition, the Board compared the fee payable to a Sub-Adviser by the Adviser with respect to the Portfolio to the fee payable to the Sub-Adviser by other comparable funds and other accounts, to the extent such information was provided.
The Board noted that the sub-advisory fees for the Portfolios are negotiated at arm’s length by the Adviser and are paid by the Adviser out of its advisory fees. The Board also considered that the Adviser had entered into expense limitation or management fee waiver agreements with certain of the Portfolios pursuant to which the Adviser had agreed to waive a portion of its advisory fee and/or reimburse certain expenses as a means of limiting a Portfolio’s total annual operating expenses or passing through the benefit of a subadvisory fee concession to a Portfolio, as applicable.
Profitability. The Board examined the profitability to the Adviser of each Advisory Agreement, on a Portfolio-by-Portfolio basis. The Board also considered that an affiliate of the Adviser, Brighthouse Securities, LLC, serves as distributor for the Trusts, and, as such, receives Rule 12b-1 payments to support the distribution of the Portfolios. The Board considered the profitability to the Sub-Advisers and their affiliates of their relationships with the Portfolios, to the extent provided, and the Board considered the ability of the Adviser to negotiate with a Sub-Adviser at arm’s length. In reviewing the profitability information, the Board recognized that expense allocation methodologies are inherently subjective and various methodologies may be reasonable while producing different results.
Economies of scale. The Board considered each Portfolio’s fees in light of its size. The Board noted the fee schedules for the Portfolios that contain breakpoints that reduce the fee rate above specified asset levels, including breakpoints in the Advisory Agreements and any corresponding Sub-Advisory Agreement. The Board noted those Portfolios that did not have breakpoints in their advisory fees and considered management’s explanation of the same.
The Board considered the effective fees under the Advisory Agreement and Sub-Advisory Agreement for each Portfolio as a percentage of assets at different asset levels and possible economies of scale that may be realized if the assets of the Portfolio grow. The Board examined, among other data, the effect of a Portfolio’s growth in size, and reduction in size, on various fee schedules. The Board also generally noted that if a Portfolio’s assets increase over time, the Portfolio may realize economies of scale if assets increase proportionally more than certain other expenses.
Other factors. The Board considered other benefits that may be realized by the Adviser and its affiliates from their relationships with the Trusts. Among the benefits realized by the Adviser, the Board recognized that Brighthouse Securities, LLC, as the distributor for the Trusts, receives payments pursuant to Rule 12b-1 from the Portfolios to help compensate for the provision of shareholder services and distribution activities. The Board considered that a Sub-Adviser may engage in soft dollar transactions in managing a Portfolio. In addition, the Board considered that a Sub-Adviser may be affiliated with registered broker-dealers that may, from time to time, receive brokerage commissions from a Portfolio in connection with the sale of portfolio securities (subject to applicable best execution obligations). The Board also considered that a Sub-Adviser and its affiliates could benefit from the opportunity to provide advisory services to additional portfolios of the Trusts and overall reputational benefits.
The Board considered information from the Adviser and Sub-Advisers pertaining to potential conflicts of interest, and the manner in which any potential conflicts were mitigated. In its review, the Board considered information regarding various business relationships among the Adviser and its affiliates and various Sub-Advisers and their affiliates. The Board also considered information about services and/or payments provided to the Adviser by the Sub-Advisers in connection with marketing activities. The Board considered representations from the Adviser that such business relationships and any payments were not considered in the Adviser’s recommendation to renew any of the Sub-Advisory Agreements.
* * * * *
VanEck Global Natural Resources Portfolio. The Board also considered the following information in relation to the Agreements with the Adviser and Van Eck Associates Corporation regarding the Portfolio:
Among other data relating specifically to the Portfolio’s performance, the Board considered that the Portfolio underperformed the median of its Performance Universe and the average of its Morningstar Category for the one-and five-year periods ended June 30, 2023 and outperformed the median of its Performance Universe and the average of its Morningstar Category for the three-year period ended
BHFTII-22
Brighthouse Funds Trust II
VanEck Global Natural Resources Portfolio
Board of Trustees’ Consideration of Advisory and Sub-Advisory Agreements—(Continued)
June 30, 2023. The Board also considered that the Portfolio underperformed its benchmark, the S&P North American Natural Resources Sector Index, for the one-, three-, and five-year periods ended October 31, 2023. The Board also noted that the Portfolio underperformed its other benchmark, the S&P Global Natural Resources Index, for the one-, three-, and five-year periods ended October 31, 2023. The Board took into account management’s discussion of the Portfolio’s performance, including with respect to prevailing market conditions. The Board also noted the presence of certain management fee waivers in effect for the Portfolio.
The Board also considered that the Portfolio’s actual management fees were equal to the Expense Group median and the Sub-advised Expense Universe median and above the Expense Universe median. The Board also considered that the Portfolio’s total expenses (exclusive of 12b-1 fees) were equal to the Expense Group median, the Expense Universe median, and the Sub-advised Expense Universe median. The Board further noted that the Portfolio’s contractual management fees were above the asset-weighted average of the Investment Classification/Morningstar Category selected by Broadridge at the Portfolio’s current size. The Board also noted that the Portfolio’s contractual sub-advisory fees were above the averages of the Sub-advised Expense Group and the Sub-advised Expense Universe at the Portfolio’s current size.
BHFTII-23
Brighthouse Funds Trust II
Western Asset Management Strategic Bond Opportunities Portfolio
Managed By Western Asset Management Company, LLC
Portfolio Manager Commentary*
PERFORMANCE
For the twelve months ended December 31, 2023, the Class A, B and E shares of the Western Asset Management Strategic Bond Opportunities Portfolio returned 9.44%, 9.22%, and 9.30%, respectively. The Portfolio’s benchmark, the Bloomberg U.S. Aggregate Bond Index¹, returned 5.53%.
MARKET ENVIRONMENT / CONDITIONS
2023 was marked by market volatility, including a significant rise—and subsequent sharp fall—in United States Treasury (“UST”) yields as well as spread-tightening across spread sectors. The market digested shifting fundamental crosscurrents including continued U.S. economic resilience, moderating inflation and a data-dependent U.S. Federal Reserve (the “Fed”) outlook. During the first quarter of 2023, developments in the regional banking sector came to the forefront when Silicon Valley Bank and Signature Bank were shut down after the banks failed to stem deposit outflows, but contagion risks were mitigated when the Federal Deposit Insurance Corporation guaranteed uninsured deposits. Midway through the year, strong economic momentum, continued signs of labor market tightness and higher fed funds rate expectations from Federal Open Market Committee (“FOMC”) members revived a “higher-for-longer” fed funds narrative. Concerns over UST supply also put upward pressure on long-term yields with the 30- and 10-year yields surpassing the 5% mark for the first time since the global financial crisis. However, softer inflation readings ultimately set the stage for the Fed to slow the pace of rate hikes and ultimately hold the fed funds target rate range steady at 5.25% to 5.50% during the last three meetings of the year. The Fed’s December “dot plot” showed the median FOMC member was expecting 75 basis points in rate cuts during 2024. During the fourth quarter of 2023, optimism that the Fed might have succeeded in controlling inflation while averting an economic “hard landing”—coupled with the possibility of less restrictive policy rates next year—spurred UST yields to change course and plummet with the yield on the 10-year UST ultimately ending the year at 3.88%, close to where it began 2023.
PORTFOLIO REVIEW / PERIOD END POSITIONING
For the twelve-month period ended December 31, 2023, the Western Asset Strategic Bond Opportunities Portfolio had a positive return and outperformed its benchmark.
One of the most significant contributors to the Portfolio’s outperformance over the reporting period was its tactical credit exposure, including High Yield (“HY”) and Bank Loans as spreads tightened over the year. The Portfolio’s underweight to Investment Grade (“IG”) corporates had a negative impact as spreads tightened.
The Portfolio’s structured product exposure was in aggregate a positive contributor mainly due to Collateralized Loan Obligations (“CLO”) and Non-agency Residential Mortgage-Backed Securities (“RMBS”). In the residential space, housing was expected to cool and we did not see a significant risk of defaults relative to historical levels. In the commercial space, fundamental performance was positive with limited distress outside of the office sector.
The Portfolio’s exposure to Emerging Market (“EM”) Debt and Currency in aggregate had a positive impact over the year. The team maintained modest EM exposure throughout the year given the ongoing hiking cycle across Domestic Market (“DM”) and EM central banks, the sharp rise in the U.S. dollar, and China downside growth risks. Value opportunities exist in select EM countries where fundamentals still appear sound. EM corporate spreads and sovereign yields remain attractive relative to comparable DM yields.
The Portfolio’s macro positioning, including the effects of both duration and yield curve, was significantly negative for performance as the negative impact during the second and third quarters, when rates rose to multi-year highs, offset the positive impact during the first and fourth quarters, when rates rallied. We calibrated portfolio duration positioning within a range of 5.7 years to 7.0 years to take advantage of UST volatility engendered by heightened market uncertainty around Fed policy and the U.S. economic outlook.
Sector positioning changes during the year were mainly focused on corporate credit, where the team added select names which had been impacted by the higher move in rates, and Bank Loans where the team reduced exposure given the relative outperformance of the sector and the potential impact that rising rates might have on more vulnerable credits. Security selection focused on high-yielding names with resilient credit profiles that could potentially deliver double-digit returns.
During the period, we tactically calibrated the Portfolio’s exposure in commodity currencies such as the Canadian dollar and Australian dollar as a way to express global growth sentiment, as well as in the British pound and Euro given shifting market concerns over recession risks in those regions.
During the twelve months ended December 31, 2023, the Portfolio utilized derivatives including interest rate futures and options as well as interest rate swaps to manage the Portfolio’s duration and yield curve exposure. Credit default swaps (“CDX”) on single names and on the CDX HY Index were used as an efficient, low-cost way of adjusting credit exposures on the margin. We also used Mortgage-Backed Securities (“MBS”) derivatives to gain exposure to specific characteristics of MBS. The Portfolio used FX forwards and options to hedge and take outright positions in a variety of currencies. Finally, we used equity options for tail risk hedging. The net impact of all derivative transactions on the Portfolio’s performance was negative.
During the reporting period, the Portfolio remained diversified across HY and Bank Loans, which continued to offer strong income and return generation potential, EM debt for attractive spread pick-up, mortgage credit with an emphasis on RMBS due to the better
BHFTII-1
Brighthouse Funds Trust II
Western Asset Management Strategic Bond Opportunities Portfolio
Managed By Western Asset Management Company, LLC
Portfolio Manager Commentary*—(continued)
fundamental outlook for housing, CLO tranches given their attractive valuations and IG corporate credit (mainly for carry and liquidity).
S. Kenneth Leech
Michael Buchanan
Mark S. Lindbloom
Annabel Rudebeck
Rafael Zielonka
Portfolio Managers
Western Asset Management Company, LLC
* This commentary may include statements that constitute “forward-looking statements” under the U.S. securities laws. Forward-looking statements include, among other things, projections, estimates, and information about possible or future results related to the Portfolio, market or regulatory developments. The views expressed above are not guarantees of future performance or economic results and involve certain risks, uncertainties and assumptions that could cause actual outcomes and results to differ materially from the views expressed herein. The views expressed above are subject to change at any time based upon economic, market, or other conditions and the subadvisory firm undertakes no obligation to update the views expressed herein. Any discussions of specific securities should not be considered a recommendation to buy or sell those securities. The views expressed above (including any forward-looking statement) may not be relied upon as investment advice or as an indication of the Portfolio’s trading intent. Information about the Portfolio’s holdings, asset allocation or country diversification is historical and is not an indication of future Portfolio composition, which may vary. Direct investment in any index is not possible. The performance of any index mentioned in this commentary has not been adjusted for ongoing management, distribution and operating expenses, and sales charges applicable to mutual fund investments. In addition, the returns do not reflect additional fees charged by separate accounts or variable insurance contracts that an investor in the Portfolio may pay. If these additional fees were reflected, performance would have been lower.
1 The Bloomberg U.S. Aggregate Bond Index is a broad-based benchmark that measures the investment grade, U.S. dollar-denominated, fixed-rate taxable bond market, including Treasuries, government-related and corporate securities, mortgage-backed securities, asset-backed securities, and commercial mortgage-backed securities.
BHFTII-2
Brighthouse Funds Trust II
Western Asset Management Strategic Bond Opportunities Portfolio
A $10,000 INVESTMENT COMPARED TO THE BLOOMBERG U.S. AGGREGATE BOND INDEX
AVERAGE ANNUAL RETURNS (%) FOR THE YEAR ENDED DECEMBER 31, 2023
| 1 Year | 5 Year | 10 Year | ||||||||||
| Western Asset Management Strategic Bond Opportunities Portfolio |
|
|||||||||||
| Class A |
9.44 | 2.80 | 3.01 | |||||||||
| Class B |
9.22 | 2.54 | 2.76 | |||||||||
|
Class E |
9.30 | 2.65 | 2.87 | |||||||||
| Bloomberg U.S. Aggregate Bond Index | 5.53 | 1.10 | 1.81 | |||||||||
Portfolio performance is calculated including reinvestment of all income and capital gain distributions. Performance numbers are net of all Portfolio expenses but do not include any insurance, sales, separate account or administrative charges of variable annuity or life insurance contracts or any additional expenses that participants may bear relating to the operations of their plans. If these charges were included, the returns would be lower. The performance of any index referenced above has not been adjusted for ongoing management, distribution and operating expenses, and sales charges applicable to mutual fund investments. Direct investment in any index is not possible. The performance of Class A shares, as set forth in the line graph above, will differ from that of other classes because of the difference in expenses paid by policyholders investing in the different share classes.
This information represents past performance and is not indicative of future results. Investment return and principal value may fluctuate so that shares, upon redemption, may be worth more or less than the original cost.
PORTFOLIO COMPOSITION AS OF DECEMBER 31, 2023
Top Sectors
| % of Net Assets |
||||
| Corporate Bonds & Notes | 51.4 | |||
| Floating Rate Loans | 13.8 | |||
| Asset-Backed Securities | 9.7 | |||
| Non-Agency Mortgage-Backed Securities | 9.4 | |||
| Agency Mortgage-Backed Securities | 7.1 | |||
| Foreign Government | 3.6 | |||
| Convertible Preferred Stocks | 0.5 | |||
| Convertible Bonds | 0.5 | |||
| Purchased Options | 0.1 | |||
| Common Stocks | 0.1 | |||
BHFTII-3
Brighthouse Funds Trust II
Western Asset Management Strategic Bond Opportunities Portfolio
Understanding Your Portfolio’s Expenses
Shareholder Expense Example
As a shareholder of the Portfolio, you incur ongoing costs, including management fees; distribution and service (12b-1) fees; and other Portfolio expenses. This example is intended to help you understand your ongoing costs (in dollars) (referred to as “expenses”) of investing in the Portfolio and compare these costs with the ongoing costs of investing in other mutual funds. The example is based on an investment of $1,000 invested at the beginning of the period and held for the entire period, July 1, 2023 through December 31, 2023.
Actual Expenses
The first line for each share class of the Portfolio in the table below provides information about actual account values and actual expenses. You may use the information in this line, together with the amount you invested in the particular share class of the Portfolio, to estimate the expenses that you paid over the period. Simply divide your account value by $1,000 (for example, an $8,600 account value divided by $1,000 = 8.6), then multiply the result by the number in the first line under the heading entitled “Expenses Paid During Period” to estimate the expenses you paid on your account during this period.
Hypothetical Example for Comparison Purposes
The second line for each share class of the Portfolio in the table below provides information about hypothetical account values and hypothetical expenses based on the Portfolio’s actual expense ratio and an assumed rate of return of 5% per year before expenses, which is not the Portfolio’s actual return. The hypothetical account values and expenses may not be used to estimate the actual ending account balance or expenses you paid for the period. You may use this information to compare the ongoing costs of investing in the Portfolio and other funds. To do so, compare this 5% hypothetical example with the 5% hypothetical examples that appear in the shareholder reports of the other funds.
Please note that the expenses shown in the table are meant to highlight your ongoing costs only and do not reflect any fees or charges of your variable insurance product or any additional expenses that participants in certain eligible qualified plans may bear relating to the operations of their plan. Therefore, the second line for each share class in the table is useful in comparing ongoing costs only, and will not help you determine the relative total costs of owning different funds. In addition, if these other costs were included, your costs would have been higher.
| Western Asset Management Strategic Bond Opportunities Portfolio |
Annualized Expense Ratio |
Beginning Account Value July 1, 2023 |
Ending Account Value December 31, 2023 |
Expenses Paid During Period** July 1, 2023 to December 31, 2023 |
||||||||||||||
| Class A (a) |
Actual | 0.56 | % | $ | 1,000.00 | $ | 1,055.80 | $ | 2.90 | |||||||||
| Hypothetical* | 0.56 | % | $ | 1,000.00 | $ | 1,022.38 | $ | 2.85 | ||||||||||
| Class B (a) |
Actual | 0.81 | % | $ | 1,000.00 | $ | 1,054.40 | $ | 4.19 | |||||||||
| Hypothetical* | 0.81 | % | $ | 1,000.00 | $ | 1,021.12 | $ | 4.13 | ||||||||||
| Class E (a) |
Actual | 0.71 | % | $ | 1,000.00 | $ | 1,055.10 | $ | 3.68 | |||||||||
| Hypothetical* | 0.71 | % | $ | 1,000.00 | $ | 1,021.63 | $ | 3.62 | ||||||||||
| * | Hypothetical assumes a rate of return of 5% per year before expenses. |
| ** | Expenses paid are equal to the Portfolio’s annualized expense ratio for the most recent six month period, as shown above, multiplied by the average account value over the period, multiplied by the number of days (184 days) in the most recent fiscal half-year, divided by 365 (to reflect the one-half year period). |
| (a) | The annualized expense ratio shown reflects the impact of the management fee waiver as described in Note 6 of the Notes to Financial Statements. |
BHFTII-4
Brighthouse Funds Trust II
Western Asset Management Strategic Bond Opportunities Portfolio
Schedule of Investments as of December 31, 2023
Corporate Bonds & Notes—51.4% of Net Assets
| Security Description | Principal Amount* |
Value | ||||||
| Aerospace/Defense—1.4% | ||||||||
| Boeing Co. |
2,000,000 | $ | 2,071,102 | |||||
| 5.930%, 05/01/60 |
2,630,000 | 2,723,339 | ||||||
| Bombardier, Inc. |
5,925,000 | 5,926,043 | ||||||
| TransDigm, Inc. |
4,350,000 | 4,342,484 | ||||||
| 6.750%, 08/15/28 (144A) (a) |
4,100,000 | 4,194,636 | ||||||
| 7.125%, 12/01/31 (144A) (a) |
4,760,000 | 4,988,075 | ||||||
| Triumph Group, Inc. |
6,347,000 | 6,749,051 | ||||||
|
|
|
|||||||
| 30,994,730 | ||||||||
|
|
|
|||||||
| Agriculture—0.3% | ||||||||
| Altria Group, Inc. |
530,000 | 432,199 | ||||||
| 4.800%, 02/14/29 (a) |
115,000 | 114,633 | ||||||
| 5.950%, 02/14/49 (a) |
529,000 | 538,793 | ||||||
| Darling Ingredients, Inc. |
6,010,000 | 6,014,447 | ||||||
|
|
|
|||||||
| 7,100,072 | ||||||||
|
|
|
|||||||
| Airlines—1.7% | ||||||||
| Air Canada |
6,033,000 | 5,763,867 | ||||||
| Air Canada Pass-Through Trust |
431,522 | 415,340 | ||||||
| American Airlines Pass-Through Trust |
1,976,250 | 1,919,722 | ||||||
| American Airlines, Inc. |
3,420,000 | 3,459,091 | ||||||
| 8.500%, 05/15/29 (144A) (a) |
2,950,000 | 3,115,197 | ||||||
| American Airlines, Inc. / AAdvantage Loyalty IP Ltd. |
5,566,667 | 5,526,511 | ||||||
| 5.750%, 04/20/29 (144A) (a) |
2,590,000 | 2,524,635 | ||||||
| Spirit Loyalty Cayman Ltd. / Spirit IP Cayman Ltd. |
9,375,999 | 6,742,919 | ||||||
| United Airlines Pass-Through Trust |
456,000 | 441,696 | ||||||
| United Airlines, Inc. |
2,590,000 | 2,422,260 | ||||||
| VistaJet Malta Finance PLC / Vista Management Holding, Inc. |
4,820,000 | 4,145,616 | ||||||
| 9.500%, 06/01/28 (144A) (a) |
1,120,000 | 947,859 | ||||||
|
|
|
|||||||
| 37,424,713 | ||||||||
|
|
|
|||||||
| Auto Manufacturers—1.7% | ||||||||
| Ford Motor Co. |
11,420,000 | 9,498,055 | ||||||
| 5.291%, 12/08/46 (a) |
1,000,000 | 881,164 | ||||||
| Ford Motor Credit Co. LLC |
5,930,000 | 5,112,541 | ||||||
| General Motors Co. |
2,564,000 | 2,744,137 | ||||||
| Auto Manufacturers—(Continued) | ||||||||
| JB Poindexter & Co., Inc. |
2,410,000 | 2,458,200 | ||||||
| Mclaren Finance PLC |
6,510,000 | 5,582,729 | ||||||
| PM General Purchaser LLC |
11,555,000 | 11,717,747 | ||||||
|
|
|
|||||||
| 37,994,573 | ||||||||
|
|
|
|||||||
| Auto Parts & Equipment—0.9% | ||||||||
| Clarios Global LP/Clarios U.S. Finance Co. |
3,960,000 | 3,973,805 | ||||||
| Titan International, Inc. |
10,820,000 | 10,824,555 | ||||||
| ZF North America Capital, Inc. |
4,115,000 | 4,068,376 | ||||||
| 7.125%, 04/14/30 (144A) (a) |
950,000 | 1,012,504 | ||||||
|
|
|
|||||||
| 19,879,240 | ||||||||
|
|
|
|||||||
| Banks—4.8% | ||||||||
| Banco Mercantil del Norte SA |
2,150,000 | 2,064,218 | ||||||
| Bank of Nova Scotia |
900,000 | 935,016 | ||||||
| Barclays PLC |
200,000 | 193,635 | ||||||
| 8.000%, 5Y H15 + 5.672% 06/15/24 (b) |
5,160,000 | 5,124,522 | ||||||
| BBVA Bancomer SA |
5,980,000 | 5,417,731 | ||||||
| BNP Paribas SA |
1,930,000 | 1,970,086 | ||||||
| Citigroup, Inc. |
3,890,000 | 3,580,403 | ||||||
| Comerica Bank |
9,782,000 | 9,580,400 | ||||||
| Credit Agricole SA |
1,750,000 | 1,750,644 | ||||||
| 8.125%, 5Y USD Swap + 6.185%, 12/23/25 (144A) (b) |
8,970,000 | 9,135,263 | ||||||
| Credit Suisse AG |
1,530,000 | 1,508,303 | ||||||
| 4.750%, 08/09/24 (a) |
2,700,000 | 2,683,276 | ||||||
| 7.950%, 01/09/25 |
2,990,000 | 3,055,844 | ||||||
| Danske Bank AS |
6,450,000 | 6,495,727 | ||||||
| HSBC Holdings PLC |
390,000 | 372,474 | ||||||
| 6.500%, 5Y USD ICE Swap + 3.606%, 03/23/28 (b) |
670,000 | 646,242 | ||||||
| Intesa Sanpaolo SpA |
3,090,000 | 3,074,514 | ||||||
| 7.800%, 11/28/53 (144A) † |
4,870,000 | 5,347,121 | ||||||
See accompanying notes to financial statements.
BHFTII-5
Brighthouse Funds Trust II
Western Asset Management Strategic Bond Opportunities Portfolio
Schedule of Investments as of December 31, 2023
Corporate Bonds & Notes—(Continued)
| Security Description | Principal Amount* |
Value | ||||||
| Banks—(Continued) | ||||||||
| Lloyds Banking Group PLC |
5,450,000 | $ | 5,858,498 | |||||
| 7.500%, 5Y USD Swap + 4.760%, 06/27/24 (b) |
3,580,000 | 3,543,850 | ||||||
| 8.000%, 5Y H15 + 3.913%, 09/27/29 (b) |
3,260,000 | 3,266,513 | ||||||
| NatWest Group PLC |
6,600,000 | 7,024,597 | ||||||
| PNC Financial Services Group, Inc. |
570,000 | 557,723 | ||||||
| 6.037%, SOFR + 2.140%, 10/28/33 (b) |
115,000 | 120,153 | ||||||
| Toronto-Dominion Bank |
3,122,000 | 3,249,343 | ||||||
| Truist Financial Corp. |
190,000 | 183,978 | ||||||
| U.S. Bancorp |
270,000 | 258,618 | ||||||
| UBS Group AG |
890,000 | 949,770 | ||||||
| 7.000%, 5Y USD Swap + 4.344%, 01/31/24 (144A) (b) |
6,080,000 | 6,078,124 | ||||||
| 9.250%, 5Y H15 + 4.745%, 11/13/28 (144A) (b) |
4,090,000 | 4,412,198 | ||||||
| UniCredit SpA |
4,960,000 | 4,664,770 | ||||||
| 7.296%, 5Y USD ICE Swap + 4.914%, 04/02/34 (144A) (a) (b) |
1,750,000 | 1,799,149 | ||||||
|
|
|
|||||||
| 104,902,703 | ||||||||
|
|
|
|||||||
| Biotechnology—0.2% | ||||||||
| Cidron Aida Finco SARL |
4,110,000 | 4,920,188 | ||||||
|
|
|
|||||||
| Building Materials—0.5% | ||||||||
| Builders FirstSource, Inc. |
2,644,000 | 2,384,836 | ||||||
| Smyrna Ready Mix Concrete LLC |
5,470,000 | 5,385,649 | ||||||
| 8.875%, 11/15/31 (144A) (a) |
2,520,000 | 2,648,964 | ||||||
|
|
|
|||||||
| 10,419,449 | ||||||||
|
|
|
|||||||
| Chemicals—0.1% | ||||||||
| Minerals Technologies, Inc. |
1,690,000 | 1,625,256 | ||||||
|
|
|
|||||||
| Coal—0.1% | ||||||||
| Teck Resources Ltd. |
1,774,000 | 1,799,695 | ||||||
|
|
|
|||||||
| Commercial Services—2.5% | ||||||||
| Adtalem Global Education, Inc. |
2,601,000 | 2,501,914 | ||||||
| Allied Universal Holdco LLC/Allied Universal Finance Corp. |
3,050,000 | 3,033,984 | ||||||
| Commercial Services—(Continued) | ||||||||
| Carriage Services, Inc. |
5,050,000 | 4,485,107 | ||||||
| GEO Group, Inc. |
5,880,000 | 5,968,200 | ||||||
| GTCR W-2 Merger Sub LLC |
5,740,000 | 6,065,586 | ||||||
| Legends Hospitality Holding Co. LLC / Legends Hospitality Co.-Issuer, Inc. |
6,680,000 | 6,669,980 | ||||||
| Metropolitan Museum of Art |
2,025,000 | 1,620,508 | ||||||
| Paysafe Finance PLC / Paysafe Holdings U.S. Corp. |
3,300,000 | 2,912,137 | ||||||
| PECF USS Intermediate Holding III Corp. |
5,656,000 | 2,884,560 | ||||||
| Prime Security Services Borrower LLC / Prime Finance, Inc. |
2,720,000 | 2,704,139 | ||||||
| RR Donnelley & Sons Co. |
1,740,000 | 1,729,125 | ||||||
| StoneMor, Inc. |
3,000,000 | 2,355,000 | ||||||
| United Rentals North America, Inc. |
2,260,000 | 2,206,302 | ||||||
| 5.250%, 01/15/30 (a) |
4,000,000 | 3,938,484 | ||||||
| 5.500%, 05/15/27 (a) |
2,316,000 | 2,321,114 | ||||||
| 6.000%, 12/15/29 (144A) |
1,760,000 | 1,786,872 | ||||||
| WW International, Inc. |
1,210,000 | 793,456 | ||||||
| ZipRecruiter, Inc. |
1,810,000 | 1,579,995 | ||||||
|
|
|
|||||||
| 55,556,463 | ||||||||
|
|
|
|||||||
| Computers—0.4% | ||||||||
| Crowdstrike Holdings, Inc. |
2,405,000 | 2,173,463 | ||||||
| NCR Voyix Corp. |
3,900,000 | 3,707,346 | ||||||
| Vericast Corp. |
1,800,000 | 1,908,000 | ||||||
| 12.500%, 12/15/27 (144A) (a) |
230,000 | 260,475 | ||||||
|
|
|
|||||||
| 8,049,284 | ||||||||
|
|
|
|||||||
| Distribution/Wholesale—0.7% | ||||||||
| American News Co. LLC |
11,543,742 | 12,842,413 | ||||||
| H&E Equipment Services, Inc. |
3,480,000 | 3,164,418 | ||||||
|
|
|
|||||||
| 16,006,831 | ||||||||
|
|
|
|||||||
| Diversified Financial Services—2.8% | ||||||||
| Accelerate360 Holdings LLC |
10,418,100 | 10,834,824 | ||||||
| AerCap Ireland Capital DAC / AerCap Global Aviation Trust |
2,410,000 | 2,097,494 | ||||||
See accompanying notes to financial statements.
BHFTII-6
Brighthouse Funds Trust II
Western Asset Management Strategic Bond Opportunities Portfolio
Schedule of Investments as of December 31, 2023
Corporate Bonds & Notes—(Continued)
| Security Description | Principal Amount* |
Value | ||||||
| Diversified Financial Services—(Continued) | ||||||||
| Aviation Capital Group LLC |
1,760,000 | $ | 1,750,244 | |||||
| Avolon Holdings Funding Ltd. |
1,950,000 | 1,883,338 | ||||||
| B3 SA - Brasil Bolsa Balcao |
4,000,000 | 3,496,842 | ||||||
| Burford Capital Global Finance LLC |
720,000 | 690,432 | ||||||
| 9.250%, 07/01/31 (144A) |
2,850,000 | 3,028,980 | ||||||
| Charles Schwab Corp. |
520,000 | 446,963 | ||||||
| 5.853%, SOFR + 2.500%, 05/19/34 (a) (b) |
1,370,000 | 1,414,185 | ||||||
| Global Aircraft Leasing Co. Ltd. |
8,831,208 | 8,301,336 | ||||||
| LPL Holdings, Inc. |
3,910,000 | 3,618,379 | ||||||
| Midcap Financial Issuer Trust |
4,665,000 | 4,364,107 | ||||||
| Rocket Mortgage LLC / Rocket Mortgage Co.-Issuer, Inc. |
11,350,000 | 10,272,731 | ||||||
| StoneX Group, Inc. |
4,252,000 | 4,295,455 | ||||||
| Vanguard Group, Inc. |
7,460,000 | 4,884,588 | ||||||
|
|
|
|||||||
| 61,379,898 | ||||||||
|
|
|
|||||||
| Electric—0.7% | ||||||||
| FirstEnergy Corp. |
1,830,000 | 1,580,992 | ||||||
| 4.150%, 07/15/27 (a) |
1,640,000 | 1,577,359 | ||||||
| NSG Holdings LLC / NSG Holdings, Inc. |
130,779 | 129,635 | ||||||
| Panoche Energy Center LLC |
409,524 | 414,643 | ||||||
| Southern California Edison Co. |
1,217,000 | 994,321 | ||||||
| TransAlta Corp. |
8,869,000 | 8,812,208 | ||||||
| 7.750%, 11/15/29 (a) |
2,110,000 | 2,240,999 | ||||||
|
|
|
|||||||
| 15,750,157 | ||||||||
|
|
|
|||||||
| Energy-Alternate Sources—0.2% | ||||||||
| Alta Wind Holdings LLC |
750,315 | 647,116 | ||||||
| Sunnova Energy Corp. |
4,460,000 | 3,796,620 | ||||||
|
|
|
|||||||
| 4,443,736 | ||||||||
|
|
|
|||||||
| Engineering & Construction—0.8% | ||||||||
| Gatwick Airport Finance PLC |
5,030,000 | 6,130,988 | ||||||
| TopBuild Corp. |
3,960,000 | 3,588,203 | ||||||
| 4.125%, 02/15/32 (144A) (a) |
320,000 | 284,666 | ||||||
| Engineering & Construction—(Continued) | ||||||||
| Tutor Perini Corp. |
6,993,000 | 6,823,436 | ||||||
|
|
|
|||||||
| 16,827,293 | ||||||||
|
|
|
|||||||
| Entertainment—1.0% | ||||||||
| Allen Media LLC / Allen Media Co.-Issuer, Inc. |
6,590,000 | 3,524,530 | ||||||
| AMC Entertainment Holdings, Inc. |
2,390,000 | 1,660,060 | ||||||
| Banijay Entertainment SASU |
1,340,000 | 1,379,577 | ||||||
| Boyne USA, Inc. |
3,030,000 | 2,849,396 | ||||||
| Caesars Entertainment, Inc. |
2,560,000 | 2,625,119 | ||||||
| Caesars Resort Collection LLC / CRC Finco, Inc. |
6,122,000 | 6,121,356 | ||||||
| Mohegan Tribal Gaming Authority |
3,372,000 | 3,182,325 | ||||||
| 13.250%, 12/15/27 (144A) |
1,520,000 | 1,618,800 | ||||||
|
|
|
|||||||
| 22,961,163 | ||||||||
|
|
|
|||||||
| Environmental Control—0.6% | ||||||||
| Clean Harbors, Inc. |
2,528,000 | 2,416,420 | ||||||
| GFL Environmental, Inc. |
7,457,000 | 7,024,196 | ||||||
| 5.125%, 12/15/26 (144A) (a) |
1,660,000 | 1,642,408 | ||||||
| 6.750%, 01/15/31 (144A) |
2,020,000 | 2,081,167 | ||||||
|
|
|
|||||||
| 13,164,191 | ||||||||
|
|
|
|||||||
| Food—0.1% | ||||||||
| Co-operative Group Holdings Ltd. |
2,410,000 | 3,017,092 | ||||||
|
|
|
|||||||
| Food Service—0.0% | ||||||||
| TKC Holdings, Inc. |
1,190,000 | 1,100,750 | ||||||
|
|
|
|||||||
| Forest Products & Paper—0.2% | ||||||||
| Suzano Austria GmbH |
3,010,000 | 2,497,672 | ||||||
| 5.750%, 07/14/26 |
1,200,000 | 1,211,177 | ||||||
|
|
|
|||||||
| 3,708,849 | ||||||||
|
|
|
|||||||
| Healthcare-Products—0.3% | ||||||||
| Medline Borrower LP |
6,700,000 | 6,315,262 | ||||||
|
|
|
|||||||
| Healthcare-Services—1.3% | ||||||||
| Akumin, Inc. |
2,332,000 | 1,888,920 | ||||||
| 7.500%, 08/01/28 (144A) † |
3,840,000 | 2,911,104 | ||||||
See accompanying notes to financial statements.
BHFTII-7
Brighthouse Funds Trust II
Western Asset Management Strategic Bond Opportunities Portfolio
Schedule of Investments as of December 31, 2023
Corporate Bonds & Notes—(Continued)
| Security Description | Principal Amount* |
Value | ||||||
| Healthcare-Services—(Continued) | ||||||||
| CHS / Community Health Systems, Inc. |
6,140,000 | $ | 4,826,869 | |||||
| 6.000%, 01/15/29 (144A) (a) |
1,850,000 | 1,665,240 | ||||||
| 6.125%, 04/01/30 (144A) |
5,530,000 | 3,580,343 | ||||||
| 10.875%, 01/15/32 (144A) (a) |
3,110,000 | 3,250,354 | ||||||
| Fresenius Medical Care U.S. Finance II, Inc. |
700,000 | 690,843 | ||||||
| HCA, Inc. |
360,000 | 346,579 | ||||||
| 7.500%, 11/06/33 |
1,938,000 | 2,180,714 | ||||||
| LifePoint Health, Inc. |
7,190,000 | 7,266,147 | ||||||
| U.S. Renal Care, Inc. |
1,375,850 | 1,045,646 | ||||||
|
|
|
|||||||
| 29,652,759 | ||||||||
|
|
|
|||||||
| Home Builders—0.3% | ||||||||
| MDC Holdings, Inc. |
1,195,000 | 1,110,874 | ||||||
| Winnebago Industries, Inc. |
5,189,000 | 5,098,192 | ||||||
|
|
|
|||||||
| 6,209,066 | ||||||||
|
|
|
|||||||
| Housewares—0.2% | ||||||||
| Newell Brands, Inc. |
4,350,000 | 4,290,017 | ||||||
|
|
|
|||||||
| Insurance—1.0% | ||||||||
| Highlands Holdings Bond Issuer Ltd. / Highlands Holdings Bond Co.-Issuer, Inc. |
8,209,469 | 8,342,503 | ||||||
| Massachusetts Mutual Life Insurance Co. |
6,285,000 | 5,331,451 | ||||||
| NMI Holdings, Inc. |
3,380,000 | 3,385,611 | ||||||
| Saga PLC |
5,800,000 | 5,914,377 | ||||||
|
|
|
|||||||
| 22,973,942 | ||||||||
|
|
|
|||||||
| Internet—0.7% | ||||||||
| Acuris Finance U.S., Inc. / Acuris Finance SARL |
2,900,000 | 2,363,500 | ||||||
| Gen Digital, Inc. |
5,110,000 | 5,339,030 | ||||||
| Tencent Holdings Ltd. |
2,640,000 | 2,512,175 | ||||||
| Ziff Davis, Inc. |
5,586,000 | 5,124,765 | ||||||
|
|
|
|||||||
| 15,339,470 | ||||||||
|
|
|
|||||||
| Iron/Steel—0.2% | ||||||||
| Vale Overseas Ltd. |
2,990,000 | 3,057,946 | ||||||
| Iron/Steel—(Continued) | ||||||||
| Vale Overseas Ltd. |
1,180,000 | 1,295,743 | ||||||
|
|
|
|||||||
| 4,353,689 | ||||||||
|
|
|
|||||||
| Leisure Time—2.0% | ||||||||
| Carnival Corp. |
2,140,000 | 1,989,639 | ||||||
| 5.750%, 03/01/27 (144A) (a) |
6,090,000 | 5,940,390 | ||||||
| 10.500%, 06/01/30 (144A) |
210,000 | 229,698 | ||||||
| Carnival Holdings Bermuda Ltd. |
6,010,000 | 6,541,398 | ||||||
| NCL Corp. Ltd. |
8,470,000 | 8,276,525 | ||||||
| 8.125%, 01/15/29 (144A) |
1,790,000 | 1,869,802 | ||||||
| Royal Caribbean Cruises Ltd. |
5,900,000 | 5,698,657 | ||||||
| 8.250%, 01/15/29 (144A) |
1,340,000 | 1,424,014 | ||||||
| 9.250%, 01/15/29 (144A) (a) |
2,010,000 | 2,162,002 | ||||||
| 11.625%, 08/15/27 (144A) |
950,000 | 1,033,761 | ||||||
| Viking Cruises Ltd. |
2,700,000 | 2,605,500 | ||||||
| 9.125%, 07/15/31 (144A) |
3,710,000 | 3,953,364 | ||||||
| VOC Escrow Ltd. |
3,420,000 | 3,275,741 | ||||||
|
|
|
|||||||
| 45,000,491 | ||||||||
|
|
|
|||||||
| Lodging—1.4% | ||||||||
| Full House Resorts, Inc. |
5,025,000 | 4,723,500 | ||||||
| Melco Resorts Finance Ltd. |
940,000 | 911,800 | ||||||
| 5.375%, 12/04/29 (144A) (a) |
7,230,000 | 6,364,420 | ||||||
| Sands China Ltd. |
200,000 | 181,826 | ||||||
| 3.100%, 03/08/29 |
1,240,000 | 1,080,897 | ||||||
| 3.500%, 08/08/31 (a) |
470,000 | 393,342 | ||||||
| 5.375%, 08/08/25 (a) |
4,610,000 | 4,546,215 | ||||||
| 5.650%, 08/08/28 |
1,240,000 | 1,229,644 | ||||||
| Wynn Macau Ltd. |
11,000,000 | 10,852,331 | ||||||
|
|
|
|||||||
| 30,283,975 | ||||||||
|
|
|
|||||||
| Machinery-Construction & Mining—0.2% | ||||||||
| Vertiv Group Corp. |
4,110,000 | 3,856,082 | ||||||
|
|
|
|||||||
| Media—2.8% | ||||||||
| Altice Financing SA |
4,030,000 | 3,576,256 | ||||||
| CCO Holdings LLC / CCO Holdings Capital Corp. |
4,630,000 | 4,046,297 | ||||||
| 5.000%, 02/01/28 (144A) (a) |
2,990,000 | 2,860,780 | ||||||
| Charter Communications Operating LLC / Charter Communications Operating Capital |
1,260,000 | 1,162,833 | ||||||
| 5.375%, 04/01/38 |
1,580,000 | 1,424,804 | ||||||
See accompanying notes to financial statements.
BHFTII-8
Brighthouse Funds Trust II
Western Asset Management Strategic Bond Opportunities Portfolio
Schedule of Investments as of December 31, 2023
Corporate Bonds & Notes—(Continued)
| Security Description | Principal Amount* |
Value | ||||||
| Media—(Continued) | ||||||||
| CSC Holdings LLC |
4,370,000 | $ | 3,324,477 | |||||
| 5.250%, 06/01/24 |
3,790,000 | 3,710,054 | ||||||
| 6.500%, 02/01/29 (144A) (a) |
5,320,000 | 4,695,432 | ||||||
| 7.500%, 04/01/28 (144A) (a) |
7,830,000 | 5,857,545 | ||||||
| 11.250%, 05/15/28 (144A) |
5,110,000 | 5,265,140 | ||||||
| Directv Financing LLC / Directv Financing Co.-Obligor, Inc. |
5,690,000 | 5,346,192 | ||||||
| DISH DBS Corp. |
4,330,000 | 3,453,608 | ||||||
| 5.875%, 11/15/24 (a) |
6,460,000 | 6,057,947 | ||||||
| DISH Network Corp. |
5,240,000 | 5,469,811 | ||||||
| Gannett Holdings LLC |
600,000 | 529,500 | ||||||
| McClatchy Co. LLC |
3,135,999 | 3,433,919 | ||||||
| Time Warner Cable LLC |
2,362,000 | 2,138,077 | ||||||
|
|
|
|||||||
| 62,352,672 | ||||||||
|
|
|
|||||||
| Metal Fabricate/Hardware—0.4% | ||||||||
| Advanced Drainage Systems, Inc. |
490,000 | 472,850 | ||||||
| 6.375%, 06/15/30 (144A) (a) |
2,710,000 | 2,730,308 | ||||||
| Park-Ohio Industries, Inc. |
5,700,000 | 5,272,500 | ||||||
|
|
|
|||||||
| 8,475,658 | ||||||||
|
|
|
|||||||
| Mining—2.0% | ||||||||
| Anglo American Capital PLC |
2,740,000 | 2,631,871 | ||||||
| First Quantum Minerals Ltd. |
7,550,000 | 6,758,273 | ||||||
| 6.875%, 10/15/27 (144A) (a) |
9,300,000 | 7,903,558 | ||||||
| 7.500%, 04/01/25 (144A) (a) |
1,000,000 | 953,495 | ||||||
| Freeport Minerals Corp. |
4,240,000 | 4,399,000 | ||||||
| Freeport-McMoRan, Inc. |
14,801,000 | 14,399,006 | ||||||
| Glencore Finance Canada Ltd. |
1,000,000 | 968,588 | ||||||
| Hudbay Minerals, Inc. |
2,660,000 | 2,572,956 | ||||||
| 6.125%, 04/01/29 (144A) (a) |
2,854,000 | 2,798,287 | ||||||
| Midwest Vanadium Pty, Ltd. |
931,574 | 0 | ||||||
| Northwest Acquisitions ULC / Dominion Finco, Inc. |
8,475,000 | 848 | ||||||
|
|
|
|||||||
| 43,385,882 | ||||||||
|
|
|
|||||||
| Multi-National—0.5% | ||||||||
| Inter-American Development Bank |
876,000,000 | 10,752,281 | ||||||
|
|
|
|||||||
| Office/Business Equipment—0.1% | ||||||||
| CDW LLC / CDW Finance Corp. |
1,610,000 | 1,472,176 | ||||||
|
|
|
|||||||
| Oil & Gas—6.5% | ||||||||
| Berry Petroleum Co. LLC |
10,690,000 | 10,342,575 | ||||||
| Chord Energy Corp. |
6,890,000 | 6,890,000 | ||||||
| Continental Resources, Inc. |
3,630,000 | 3,613,517 | ||||||
| Crescent Energy Finance LLC |
2,590,000 | 2,687,306 | ||||||
| Endeavor Energy Resources LP / EER Finance, Inc. |
3,770,000 | 3,773,558 | ||||||
| EQT Corp. |
3,480,000 | 3,734,875 | ||||||
| Hilcorp Energy I LP / Hilcorp Finance Co. |
3,440,000 | 3,308,974 | ||||||
| 8.375%, 11/01/33 (144A) (a) |
2,500,000 | 2,648,600 | ||||||
| KazMunayGas National Co. JSC |
300,000 | 297,151 | ||||||
| 6.375%, 10/24/48 (144A) |
1,060,000 | 995,128 | ||||||
| MEG Energy Corp. |
870,000 | 845,329 | ||||||
| 7.125%, 02/01/27 (144A) (a) |
5,290,000 | 5,375,878 | ||||||
| Nabors Industries Ltd. |
1,220,000 | 1,172,676 | ||||||
| Neptune Energy Bondco PLC |
5,270,000 | 5,222,493 | ||||||
| Noble Finance II LLC |
2,560,000 | 2,663,816 | ||||||
| Northern Oil & Gas, Inc. |
5,580,000 | 5,649,750 | ||||||
| Occidental Petroleum Corp. |
1,630,000 | 1,208,221 | ||||||
| 6.450%, 09/15/36 (a) |
5,682,000 | 6,011,563 | ||||||
| 7.150%, 05/15/28 |
6,482,000 | 6,848,039 | ||||||
| 7.950%, 06/15/39 |
9,359,000 | 10,903,235 | ||||||
| Permian Resources Operating LLC |
8,880,000 | 8,657,643 | ||||||
| 7.000%, 01/15/32 (144A) (a) |
1,790,000 | 1,846,694 | ||||||
| 9.875%, 07/15/31 (144A) |
3,670,000 | 4,078,287 | ||||||
| Petrobras Global Finance BV |
1,000,000 | 1,007,642 | ||||||
| 6.850%, 06/05/15 (a) |
6,170,000 | 5,809,288 | ||||||
| Range Resources Corp. |
2,970,000 | 2,745,438 | ||||||
| 8.250%, 01/15/29 (a) |
9,260,000 | 9,583,845 | ||||||
| Shelf Drilling Holdings Ltd. |
3,680,000 | 3,601,113 | ||||||
| Southwestern Energy Co. |
7,230,000 | 6,689,282 | ||||||
| 8.375%, 09/15/28 (a) |
5,212,000 | 5,392,241 | ||||||
See accompanying notes to financial statements.
BHFTII-9
Brighthouse Funds Trust II
Western Asset Management Strategic Bond Opportunities Portfolio
Schedule of Investments as of December 31, 2023
Corporate Bonds & Notes—(Continued)
| Security Description | Principal Amount* |
Value | ||||||
| Oil & Gas—(Continued) | ||||||||
| YPF SA |
3,360,000 | $ | 3,006,340 | |||||
| 8.500%, 07/28/25 (144A) |
6,350,000 | 6,130,032 | ||||||
|
|
|
|||||||
| 142,740,529 | ||||||||
|
|
|
|||||||
| Packaging & Containers—0.4% | ||||||||
| ARD Finance SA |
4,470,000 | 2,088,295 | ||||||
| Ardagh Metal Packaging Finance USA LLC / Ardagh Metal Packaging Finance PLC |
3,680,000 | 3,666,816 | ||||||
| Cascades, Inc. / Cascades USA, Inc. |
2,610,000 | 2,525,175 | ||||||
| Sealed Air Corp. / Sealed Air Corp. U.S. |
1,560,000 | 1,573,435 | ||||||
|
|
|
|||||||
| 9,853,721 | ||||||||
|
|
|
|||||||
| Pharmaceuticals—1.4% | ||||||||
| AdaptHealth LLC |
890,000 | 686,858 | ||||||
| Bausch Health Cos., Inc. |
480,000 | 217,660 | ||||||
| 5.500%, 11/01/25 (144A) (a) |
2,470,000 | 2,259,482 | ||||||
| 6.125%, 02/01/27 (144A) |
2,150,000 | 1,451,250 | ||||||
| 7.000%, 01/15/28 (144A) |
1,070,000 | 465,033 | ||||||
| Cheplapharm Arzneimittel GmbH |
2,840,000 | 2,685,241 | ||||||
| Option Care Health, Inc. |
5,440,000 | 4,916,447 | ||||||
| Teva Pharmaceutical Finance Co. LLC |
5,085,000 | 4,866,304 | ||||||
| Teva Pharmaceutical Finance Netherlands III BV |
2,490,000 | 2,305,490 | ||||||
| 4.750%, 05/09/27 (a) |
5,760,000 | 5,515,199 | ||||||
| 8.125%, 09/15/31 |
4,210,000 | 4,591,346 | ||||||
|
|
|
|||||||
| 29,960,310 | ||||||||
|
|
|
|||||||
| Pipelines—3.7% | ||||||||
| Blue Racer Midstream LLC / Blue Racer Finance Corp. |
5,130,000 | 5,196,499 | ||||||
| El Paso Natural Gas Co. LLC |
1,000,000 | 1,067,925 | ||||||
| 8.375%, 06/15/32 |
190,000 | 221,391 | ||||||
| Energy Transfer LP |
1,090,000 | 1,127,173 | ||||||
| 7.125%, 5Y H15 + 5.306%, 05/15/30 (b) |
1,950,000 | 1,796,883 | ||||||
| 9.669%, 3M TSFR + 4.290%, 01/16/24 (b) |
2,030,000 | 1,949,438 | ||||||
| Enterprise Products Operating LLC |
13,090,000 | 11,731,784 | ||||||
| EQM Midstream Partners LP |
1,880,000 | 1,879,137 | ||||||
| 6.500%, 07/01/27 (144A) (a) |
1,660,000 | 1,690,265 | ||||||
| 7.500%, 06/01/30 (144A) (a) |
2,660,000 | 2,859,551 | ||||||
| Pipelines—(Continued) | ||||||||
| Howard Midstream Energy Partners LLC |
3,590,000 | 3,550,053 | ||||||
| 8.875%, 07/15/28 (144A) (a) |
2,570,000 | 2,697,379 | ||||||
| Kinder Morgan, Inc. |
67,000 | 76,569 | ||||||
| Plains All American Pipeline LP |
4,228,000 | 4,085,305 | ||||||
| Rockies Express Pipeline LLC |
2,480,000 | 2,503,634 | ||||||
| Southern Natural Gas Co. LLC |
25,000 | 29,187 | ||||||
| Summit Midstream Holdings LLC / Summit Midstream Finance Corp. |
1,220,000 | 1,210,264 | ||||||
| Tallgrass Energy Partners LP / Tallgrass Energy Finance Corp. |
3,230,000 | 3,002,423 | ||||||
| Targa Resources Partners LP / Targa Resources Partners Finance Corp. |
3,480,000 | 3,380,507 | ||||||
| Venture Global Calcasieu Pass LLC |
2,200,000 | 1,864,386 | ||||||
| 4.125%, 08/15/31 (144A) |
2,450,000 | 2,158,464 | ||||||
| 6.250%, 01/15/30 (144A) (a) |
6,270,000 | 6,236,074 | ||||||
| Venture Global LNG, Inc. |
3,090,000 | 3,088,400 | ||||||
| 9.875%, 02/01/32 (144A) |
2,720,000 | 2,833,258 | ||||||
| Western Midstream Operating LP |
4,900,000 | 4,264,108 | ||||||
| 5.450%, 04/01/44 |
11,710,000 | 10,601,110 | ||||||
|
|
|
|||||||
| 81,101,167 | ||||||||
|
|
|
|||||||
| Real Estate—0.2% | ||||||||
| Country Garden Holdings Co. Ltd. |
1,110,000 | 81,862 | ||||||
| Cushman & Wakefield U.S. Borrower LLC |
2,400,000 | 2,543,448 | ||||||
| Five Point Operating Co. LP/Five Point Capital Corp. |
2,007,000 | 1,986,930 | ||||||
|
|
|
|||||||
| 4,612,240 | ||||||||
|
|
|
|||||||
| Real Estate Investment Trusts—0.3% | ||||||||
| Ladder Capital Finance Holdings LLLP / Ladder Capital Finance Corp. |
526,000 | 495,609 | ||||||
| 4.750%, 06/15/29 (144A) (a) |
2,090,000 | 1,884,521 | ||||||
| MPT Operating Partnership LP/MPT Finance Corp. |
570,000 | 409,865 | ||||||
| Service Properties Trust |
2,416,000 | 2,211,984 | ||||||
| 8.625%, 11/15/31 (144A) (a) |
690,000 | 722,729 | ||||||
|
|
|
|||||||
| 5,724,708 | ||||||||
|
|
|
|||||||
See accompanying notes to financial statements.
BHFTII-10
Brighthouse Funds Trust II
Western Asset Management Strategic Bond Opportunities Portfolio
Schedule of Investments as of December 31, 2023
Corporate Bonds & Notes—(Continued)
| Security Description | Principal Amount* |
Value | ||||||
| Retail—1.5% | ||||||||
| Bath & Body Works, Inc. |
1,810,000 | $ | 1,790,200 | |||||
| 6.625%, 10/01/30 (144A) (a) |
4,890,000 | 4,997,834 | ||||||
| Doman Building Materials Group Ltd. |
3,680,000 | 2,553,352 | ||||||
| FirstCash, Inc. |
3,060,000 | 2,930,467 | ||||||
| Foot Locker, Inc. |
6,295,000 | 5,209,113 | ||||||
| Michaels Cos., Inc. |
2,630,000 | 2,079,238 | ||||||
| QVC, Inc. |
2,450,000 | 1,768,952 | ||||||
| 4.450%, 02/15/25 (a) |
1,010,000 | 947,940 | ||||||
| 4.850%, 04/01/24 (a) |
3,540,000 | 3,503,628 | ||||||
| Sally Holdings LLC/Sally Capital, Inc. |
3,910,000 | 3,910,974 | ||||||
| Suburban Propane Partners LP / Suburban Energy Finance Corp. |
2,430,000 | 2,203,005 | ||||||
| Superior Plus LP / Superior General Partner, Inc. |
2,320,000 | 2,151,266 | ||||||
|
|
|
|||||||
| 34,045,969 | ||||||||
|
|
|
|||||||
| Software—0.9% | ||||||||
| AthenaHealth Group, Inc. |
3,840,000 | 3,483,562 | ||||||
| Black Knight InfoServ LLC |
3,680,000 | 3,498,686 | ||||||
| Central Parent, Inc./CDK Global, Inc. |
8,550,000 | 8,719,790 | ||||||
| Open Text Holdings, Inc. |
2,500,000 | 2,262,687 | ||||||
| Rackspace Technology Global, Inc. |
4,980,000 | 1,999,991 | ||||||
|
|
|
|||||||
| 19,964,716 | ||||||||
|
|
|
|||||||
| Telecommunications—1.0% | ||||||||
| Altice France Holding SA |
10,320,000 | 6,683,429 | ||||||
| British Telecommunications PLC |
3,875,000 | 4,794,919 | ||||||
| CommScope, Inc. |
390,000 | 347,677 | ||||||
| Millicom International Cellular SA |
3,930,000 | 3,267,453 | ||||||
| 6.250%, 03/25/29 (144A) (a) |
1,395,000 | 1,322,217 | ||||||
| Sprint Capital Corp. |
2,069,000 | 2,553,690 | ||||||
| Vmed O2 U.K. Financing I PLC |
4,620,000 | 4,123,840 | ||||||
|
|
|
|||||||
| 23,093,225 | ||||||||
|
|
|
|||||||
| Transportation—0.4% | ||||||||
| Carriage Purchaser, Inc. |
3,155,000 | 2,583,044 | ||||||
| RXO, Inc. |
1,170,000 | 1,207,276 | ||||||
| XPO, Inc. |
2,630,000 | 2,661,586 | ||||||
| 7.125%, 02/01/32 (144A) |
1,900,000 | 1,960,956 | ||||||
|
|
|
|||||||
| 8,412,862 | ||||||||
|
|
|
|||||||
| Total Corporate Bonds & Notes |
1,133,249,195 | |||||||
|
|
|
|||||||
| Floating Rate Loans (i)—13.8% |
| |||||||
| Advertising—0.2% | ||||||||
| CB Poly U.S. Holdings, Inc. |
5,302,875 | 5,273,046 | ||||||
|
|
|
|||||||
| Aerospace/Defense—0.2% | ||||||||
| Vertex Aerospace Services Corp. |
||||||||
| 2021 First Lien Term Loan, 8.706%, 1M TSFR + 3.250%, 12/06/28 |
4,967,031 | 4,978,580 | ||||||
|
|
|
|||||||
| Airlines—0.0% | ||||||||
| United Airlines, Inc. |
901,180 | 905,573 | ||||||
|
|
|
|||||||
| Apparel—0.1% | ||||||||
| Fanatics Commerce Intermediate Holdco LLC |
2,161,058 | 2,161,058 | ||||||
|
|
|
|||||||
| Auto Parts & Equipment—0.3% | ||||||||
| Clarios Global LP |
||||||||
| 2023 Incremental Term Loan, 9.106%, 1M TSFR + 3.750%, 05/06/30 |
3,291,750 | 3,302,037 | ||||||
| First Brands Group LLC |
||||||||
| 2022 Incremental Term Loan, 10.881%, 6M TSFR + 5.000%, 03/30/27 |
3,404,211 | 3,382,934 | ||||||
|
|
|
|||||||
| 6,684,971 | ||||||||
|
|
|
|||||||
| Building Materials—0.2% | ||||||||
| Emrld Borrower LP |
2,593,500 | 2,604,382 | ||||||
| Quikrete Holdings, Inc. |
||||||||
| 2023 Term Loan B, 8.220%, 1M TSFR + 2.750%, 03/19/29 |
2,340,751 | 2,351,577 | ||||||
|
|
|
|||||||
| 4,955,959 | ||||||||
|
|
|
|||||||
| Commercial Services—1.8% | ||||||||
| Adtalem Global Education, Inc. |
||||||||
| 2021 Term Loan B, 9.470%, 1M TSFR + 4.000%, 08/12/28 |
778,127 | 781,434 | ||||||
See accompanying notes to financial statements.
BHFTII-11
Brighthouse Funds Trust II
Western Asset Management Strategic Bond Opportunities Portfolio
Schedule of Investments as of December 31, 2023
Floating Rate Loans (i)—(Continued)
| Security Description | Principal Amount* |
Value | ||||||
| Commercial Services—(Continued) | ||||||||
| Allied Universal Holdco LLC |
||||||||
| 2021 USD Incremental Term Loan B, 9.206%, |
5,352,621 | $ | 5,330,038 | |||||
| 2023 Term Loan B, 10.106%, 1M TSFR + 4.750%, 05/12/28 |
2,513,700 | 2,519,087 | ||||||
| DS Parent, Inc. |
4,830,000 | 4,624,725 | ||||||
| Garda World Security Corp. |
||||||||
| 2022 Term Loan B, 9.625%, 3M TSFR + 4.250%, 02/01/29 |
3,654,670 | 3,663,047 | ||||||
| GTCR W Merger Sub LLC |
||||||||
| USD Term Loan B, 09/20/30 (j) |
2,530,000 | 2,540,462 | ||||||
| MPH Acquisition Holdings LLC |
||||||||
| 2021 Term Loan B, 9.900%, 3M TSFR + 4.250%, 09/01/28 |
3,581,679 | 3,463,036 | ||||||
| PECF USS Intermediate Holding III Corp. |
5,213,600 | 4,090,142 | ||||||
| Peer Holding III BV |
3,340,000 | 3,353,567 | ||||||
| Prime Security Services Borrower LLC |
||||||||
| 2023 Term Loan B, 7.841%, 1M TSFR + 2.500%, 10/14/30 |
2,250,000 | 2,258,125 | ||||||
| Ryan LLC |
||||||||
| Delayed Draw Term Loan, 11/14/30 (k) |
493,333 | 495,800 | ||||||
| Term Loan, 9.856%, 1M TSFR + 4.500%, 11/14/30 |
4,796,667 | 4,820,650 | ||||||
| Verscend Holding Corp. |
||||||||
| 2021 Term Loan B, 9.470%, 1M TSFR + 4.000%, 08/27/25 |
1,862,672 | 1,867,620 | ||||||
| WW International, Inc. |
2,260,000 | 1,613,075 | ||||||
|
|
|
|||||||
| 41,420,808 | ||||||||
|
|
|
|||||||
| Computers—1.2% | ||||||||
| Amentum Government Services Holdings LLC |
||||||||
| 2022 Term Loan, 9.358%, 1M TSFR + 4.000%, 02/15/29 |
5,708,001 | 5,722,271 | ||||||
| Term Loan B, 9.470%, 1M TSFR + 4.000%, 01/29/27 |
4,554,873 | 4,569,107 | ||||||
| Magenta Buyer LLC |
||||||||
| 2021 USD 1st Lien Term Loan, 10.645%, 3M TSFR + 5.000%, 07/27/28 |
2,976,890 | 2,093,126 | ||||||
| NEXUS Buyer LLC |
||||||||
| 2023 Term Loan B2, 9.738%, 1M TSFR + 4.500%, 12/13/28 |
4,910,000 | 4,897,725 | ||||||
| Redstone Holdco 2 LP |
||||||||
| 2021 Term Loan, 10.220%, 1M TSFR + 4.750%, 04/27/28 |
5,344,792 | 4,064,549 | ||||||
| UST Holdings Ltd. |
3,361,301 | 3,354,998 | ||||||
|
|
|
|||||||
| 24,701,776 | ||||||||
|
|
|
|||||||
| Diversified Financial Services—1.5% | ||||||||
| Advisor Group, Inc. |
||||||||
| 2023 Term Loan B, 9.856%, 1M TSFR + 4.500%, 08/17/28 |
3,150,000 | 3,163,976 | ||||||
| Diversified Financial Services—(Continued) | ||||||||
| AqGen Island Holdings, Inc. |
||||||||
| Term Loan, 8.970%, 1M TSFR + 3.500%, 08/02/28 |
4,442,771 | 4,442,771 | ||||||
| Aretec Group, Inc. |
||||||||
| 2023 Incremental Term Loan, 9.956%, 1M TSFR + 4.500%, 08/09/30 |
2,683,258 | 2,686,194 | ||||||
| Citadel Securities LP |
||||||||
| 2023 Term Loan B, 7.970%, 1M TSFR + 2.500%, 07/29/30 |
2,924,096 | 2,933,053 | ||||||
| CTC Holdings LP |
2,212,365 | 2,198,538 | ||||||
| Deerfield Dakota Holding LLC |
||||||||
| 2021 USD 2nd Lien Term Loan, 12.360%, 3M TSFR + 6.750%, 04/07/28 |
2,060,000 | 1,980,175 | ||||||
| Focus Financial Partners LLC |
||||||||
| 2021 Term Loan B4, 7.856%, 1M TSFR + 2.500%, 06/30/28 |
4,965,082 | 4,974,391 | ||||||
| 2022 Term Loan B5, 8.606%, 1M TSFR + 3.250%, 06/30/28 |
3,740 | 3,752 | ||||||
| Greystone Select Financial LLC |
3,367,988 | 3,351,148 | ||||||
| Hudson River Trading LLC |
||||||||
| 2021 Term Loan, 8.356%, 1M TSFR + 3.000%, 03/20/28 |
3,384,667 | 3,378,849 | ||||||
| Jane Street Group LLC |
||||||||
| 2021 Term Loan, 8.220%, 1M TSFR + 2.750%, 01/26/28 |
3,183,900 | 3,205,789 | ||||||
|
|
|
|||||||
| 32,318,636 | ||||||||
|
|
|
|||||||
| Engineering & Construction—0.3% | ||||||||
| Brown Group Holding LLC |
||||||||
| 2022 Incremental Term Loan B2, 9.106% - 9.138%, 3M TSFR + 3.750%, 07/02/29 (c) |
664,950 | 667,800 | ||||||
| Term Loan B, 8.206%, 1M TSFR + 2.750%, 06/07/28 |
4,917,913 | 4,926,475 | ||||||
|
|
|
|||||||
| 5,594,275 | ||||||||
|
|
|
|||||||
| Entertainment—1.2% | ||||||||
| Allen Media LLC |
||||||||
| 2021 Term Loan B, 10.998%, 3M TSFR + 5.500%, 02/10/27 |
8,672,673 | 7,769,267 | ||||||
| Caesars Entertainment Corp. |
1,756,725 | 1,764,411 | ||||||
| Cinemark USA, Inc. |
||||||||
| 2023 Term Loan B, 9.106% - 9.110%, 1M TSFR + 3.750%, 05/24/30 (c) |
6,669,600 | 6,682,939 | ||||||
| Flutter Entertainment PLC |
5,540,000 | 5,559,623 | ||||||
| UFC Holdings LLC |
||||||||
| 2021 Term Loan B, 8.399%, 3M TSFR + 2.750%, 04/29/26 |
3,592,050 | 3,607,765 | ||||||
|
|
|
|||||||
| 25,384,005 | ||||||||
|
|
|
|||||||
See accompanying notes to financial statements.
BHFTII-12
Brighthouse Funds Trust II
Western Asset Management Strategic Bond Opportunities Portfolio
Schedule of Investments as of December 31, 2023
Floating Rate Loans (i)—(Continued)
| Security Description | Principal Amount* |
Value | ||||||
| Environmental Control—0.2% | ||||||||
| LRS Holdings LLC |
4,115,703 | $ | 4,053,967 | |||||
|
|
|
|||||||
| Food—0.2% | ||||||||
| 8th Avenue Food & Provisions, Inc. |
||||||||
| 2018 2nd Lien Term Loan, 13.220%, 1M TSFR + 7.750%, 10/01/26 |
1,452,297 | 1,164,259 | ||||||
| Froneri International Ltd. |
||||||||
| 2020 EUR Term Loan B1, 6.097%, 6M EURIBOR + 2.125%, 01/29/27 (EUR) |
2,780,000 | 3,045,006 | ||||||
|
|
|
|||||||
| 4,209,265 | ||||||||
|
|
|
|||||||
| Healthcare-Products—0.3% | ||||||||
| Agiliti Health, Inc. |
||||||||
| 2023 Term Loan, 8.395%, 3M TSFR + 3.000%, 05/01/30 |
3,341,625 | 3,345,802 | ||||||
| Sotera Health Holdings LLC |
||||||||
| 2023 Incremental Term Loan B, 9.106%, 1M TSFR + 3.750%, 12/11/26 |
3,383,000 | 3,387,229 | ||||||
|
|
|
|||||||
| 6,733,031 | ||||||||
|
|
|
|||||||
| Healthcare-Services—0.4% | ||||||||
| EyeCare Partners LLC |
||||||||
| 2021 2nd Lien Term Loan, 12.395%, 3M TSFR + 6.750%, 11/15/29 |
3,930,000 | 1,185,551 | ||||||
| 2021 Incremental Term Loan, 9.395%, 3M TSFR + 3.750%, 11/15/28 |
4,195,275 | 2,106,028 | ||||||
| Knight Health Holdings LLC |
5,674,141 | 1,645,501 | ||||||
| LifePoint Health, Inc. |
||||||||
| 2023 Term Loan B, 11.168%, 3M TSFR + 5.500%, 11/16/28 |
3,816,772 | 3,811,605 | ||||||
|
|
|
|||||||
| 8,748,685 | ||||||||
|
|
|
|||||||
| Home Furnishings—0.3% | ||||||||
| AI Aqua Merger Sub, Inc. |
||||||||
| 2023 Incremental Term Loan, 07/31/28 (j) |
5,850,000 | 5,882,906 | ||||||
|
|
|
|||||||
| Housewares—0.2% | ||||||||
| Solis IV BV |
||||||||
| USD Term Loan B1, 8.880%, 3M TSFR + 3.500%, 02/26/29 |
4,391,991 | 4,385,131 | ||||||
|
|
|
|||||||
| Insurance—1.0% | ||||||||
| Acrisure LLC |
||||||||
| 2020 Term Loan B, 9.150%, 3M LIBOR + 3.500%, 02/15/27 |
2,877,875 | 2,876,592 | ||||||
| AssuredPartners, Inc. |
||||||||
| 2023 Term Loan B4, 9.106%, 1M TSFR + 3.750%, 02/12/27 |
2,871,658 | 2,887,093 | ||||||
| Insurance—(Continued) | ||||||||
| Asurion LLC |
||||||||
| 2021 Second Lien Term Loan B4, 10.720%, 1M TSFR + 5.250%, 01/20/29 |
8,950,000 | 8,476,133 | ||||||
| 2021 Term Loan B9, 8.606%, 1M TSFR + 3.250%, 07/31/27 |
3,195,870 | 3,177,893 | ||||||
| Howden Group Holdings Ltd. |
||||||||
| 2023 USD Term Loan B, 9.356%, 1M TSFR + 4.000%, 04/18/30 |
932,950 | 936,158 | ||||||
| Sedgwick Claims Management Services, Inc. |
||||||||
| 2023 Term Loan B, 9.106%, 1M TSFR + 3.750%, 02/24/28 |
3,794,471 | 3,811,664 | ||||||
|
|
|
|||||||
| 22,165,533 | ||||||||
|
|
|
|||||||
| Investment Companies—0.3% | ||||||||
| Cardinal Parent, Inc. |
||||||||
| 2020 Term Loan B, 9.998%, 3M TSFR + 4.500%, 11/12/27 |
6,107,781 | 5,626,793 | ||||||
| Jump Financial LLC |
1,825,857 | 1,816,727 | ||||||
|
|
|
|||||||
| 7,443,520 | ||||||||
|
|
|
|||||||
| Leisure Time—0.7% | ||||||||
| 19th Holdings Golf LLC |
||||||||
| 2022 Term Loan B, 8.696%, 1M TSFR + 3.350%, 02/07/29 |
5,998,601 | 5,968,608 | ||||||
| Carnival Corp. |
||||||||
| 2023 Term Loan B, 8.357%, 1M TSFR + 3.000%, 08/08/27 |
1,781,050 | 1,787,729 | ||||||
| Equinox Holdings, Inc. |
||||||||
| 2020 Term Loan B2, 14.612%, 6M LIBOR + 9.000%, 03/08/24 |
2,142,300 | 2,100,257 | ||||||
| Hayward Industries, Inc. |
||||||||
| 2022 Term Loan, 8.706%, 1M TSFR + 3.250%, 05/30/28 |
2,073,750 | 2,073,103 | ||||||
| Topgolf Callaway Brands Corp. |
3,414,200 | 3,417,857 | ||||||
|
|
|
|||||||
| 15,347,554 | ||||||||
|
|
|
|||||||
| Machinery-Diversified—0.2% | ||||||||
| SPX Flow, Inc. |
||||||||
| 2022 Term Loan, 9.956%, 1M TSFR + 4.500%, 04/05/29 |
4,709,977 | 4,730,583 | ||||||
|
|
|
|||||||
| Media—0.3% | ||||||||
| A-L Parent LLC |
||||||||
| 2023 Take Back Term Loan, 10.856%, 1M TSFR + 5.500%, 06/30/28 |
3,471,300 | 3,356,313 | ||||||
| Virgin Media Bristol LLC |
||||||||
| 2023 USD Term Loan Y, 8.790%, 6M TSFR + 3.250%, 03/31/31 |
2,620,000 | 2,615,908 | ||||||
|
|
|
|||||||
| 5,972,221 | ||||||||
|
|
|
|||||||
See accompanying notes to financial statements.
BHFTII-13
Brighthouse Funds Trust II
Western Asset Management Strategic Bond Opportunities Portfolio
Schedule of Investments as of December 31, 2023
Floating Rate Loans (i)—(Continued)
| Security Description | Principal Amount* |
Value | ||||||
| Real Estate Investment Trusts—0.1% | ||||||||
| Apollo Commercial Real Estate Finance, Inc. |
||||||||
| 2021 Incremental Term Loan B1, 8.970%, 1M TSFR + 3.500%, 03/11/28 |
2,091,605 | $ | 2,055,002 | |||||
|
|
|
|||||||
| Retail—0.9% | ||||||||
| Dave & Buster’s, Inc. |
||||||||
| 2023 Term Loan B5, 7.606%, 1M TSFR + 2.250%, 09/20/30 |
3,235,925 | 3,241,413 | ||||||
| Lakeshore Intermediate LLC |
3,684,574 | 3,686,416 | ||||||
| Michaels Cos., Inc. |
||||||||
| 2021 Term Loan B, 9.860%, 3M TSFR + 4.250%, 04/15/28 |
418,926 | 350,589 | ||||||
| Pacific Bells LLC |
3,204,684 | 3,200,679 | ||||||
| Spencer Spirit IH LLC |
5,163,227 | 5,158,384 | ||||||
| Thermostat Purchaser III, Inc. |
4,072,718 | 4,042,172 | ||||||
|
|
|
|||||||
| 19,679,653 | ||||||||
|
|
|
|||||||
| Software—1.4% | ||||||||
| Athenahealth Group, Inc. |
||||||||
| 2022 Term Loan B, 8.606%, 1M TSFR + 3.250%, 02/15/29 |
717,635 | 716,140 | ||||||
| Cloudera, Inc. |
||||||||
| 2021 Second Lien Term Loan, 11.456%, 1M TSFR + 6.000%, 10/08/29 |
1,090,000 | 1,050,033 | ||||||
| 2021 Term Loan, 9.206%, 1M TSFR + 3.750%, 10/08/28 |
3,420,000 | 3,397,199 | ||||||
| DCert Buyer, Inc. |
||||||||
| 2019 Term Loan B, 9.356%, 1M TSFR + 4.000%, 10/16/26 |
4,237,379 | 4,208,577 | ||||||
| 2021 2nd Lien Term Loan, 12.356%, 1M TSFR + 7.000%, 02/19/29 |
8,990,000 | 8,220,231 | ||||||
| EVERTEC Group LLC |
||||||||
| 2023 Term Loan B, 8.956%, 1M TSFR + 3.500%, 10/30/30 |
1,971,000 | 1,978,391 | ||||||
| MRI Software LLC |
||||||||
| 2020 Term Loan, 10.948%, 3M TSFR + 5.500%, 02/10/26 |
925,154 | 907,808 | ||||||
| 2020 Term Loan B, 10.948%, 3M TSFR + 5.500%, 02/10/27 |
1,608,595 | 1,584,466 | ||||||
| Planview Parent, Inc. |
5,551,276 | 5,516,220 | ||||||
| Project Alpha Intermediate Holding, Inc. |
||||||||
| 2023 1st Lien Term Loan B, 10.106%, 1M TSFR + 4.750%, 10/28/30 |
3,650,000 | 3,680,226 | ||||||
|
|
|
|||||||
| 31,259,291 | ||||||||
|
|
|
|||||||
| Telecommunications—0.2% | ||||||||
| Global Tel*Link Corp. |
||||||||
| 2018 1st Lien Term Loan, 9.748% - 9.783%, 3M TSFR + 4.250%, 11/29/25 (c) |
4,096,927 | 3,918,113 | ||||||
|
|
|
|||||||
| Transportation—0.1% | ||||||||
| Worldwide Express Operations LLC |
||||||||
| 2021 1st Lien Term Loan, 9.360%, 3M TSFR + 4.000%, 07/26/28 |
2,699,356 | 2,652,748 | ||||||
|
|
|
|||||||
| Total Floating Rate Loans |
303,615,890 | |||||||
|
|
|
|||||||
| Asset-Backed Securities—9.7% |
| |||||||
| Asset-Backed - Automobile—0.3% | ||||||||
| Avis Budget Rental Car Funding AESOP LLC |
7,750,000 | 6,910,513 | ||||||
|
|
|
|||||||
| Asset-Backed - Home Equity—0.2% | ||||||||
| Bear Stearns Asset-Backed Securities Trust |
8,770 | 8,440 | ||||||
| WaMu Asset-Backed Certificates WaMu Trust |
6,575,570 | 4,697,898 | ||||||
|
|
|
|||||||
| 4,706,338 | ||||||||
|
|
|
|||||||
| Asset-Backed - Manufactured Housing—0.1% | ||||||||
| Origen Manufactured Housing Contract Trust |
288,805 | 264,730 | ||||||
| 7.800%, 04/15/37 (b) |
292,890 | 274,379 | ||||||
| UCFC Manufactured Housing Contract |
928,863 | 817,500 | ||||||
|
|
|
|||||||
| 1,356,609 | ||||||||
|
|
|
|||||||
| Asset-Backed - Other—8.7% | ||||||||
| AB BSL CLO 4 Ltd. |
1,200,000 | 1,203,540 | ||||||
| Apidos CLO XXII Ltd. |
5,490,000 | 5,446,327 | ||||||
| APL Finance DAC |
1,200,000 | 1,207,469 | ||||||
| Applebee’s Funding LLC / IHOP Funding LLC |
3,150,000 | 3,229,537 | ||||||
| Bain Capital Credit CLO Ltd. |
4,690,000 | 4,697,978 | ||||||
| Barings CLO Ltd. |
5,740,000 | 5,559,810 | ||||||
| Bear Stearns Asset-Backed Securities Trust |
969,230 | 411,450 | ||||||
| Benefit Street Partners CLO IV Ltd. |
3,120,000 | 3,119,910 | ||||||
| Buckhorn Park CLO Ltd. |
5,890,000 | 5,883,026 | ||||||
See accompanying notes to financial statements.
BHFTII-14
Brighthouse Funds Trust II
Western Asset Management Strategic Bond Opportunities Portfolio
Schedule of Investments as of December 31, 2023
Asset-Backed Securities—(Continued)
| Security Description | Principal Amount* |
Value | ||||||
| Asset-Backed - Other—(Continued) | ||||||||
| Canyon Capital CLO Ltd. |
750,000 | $ | 727,675 | |||||
| Carlyle Global Market Strategies CLO Ltd. |
8,383,428 | 8,370,593 | ||||||
| Carlyle U.S. CLO Ltd. |
8,500,000 | 8,168,891 | ||||||
| CarVal CLO VII-C Ltd. |
5,900,000 | 5,919,311 | ||||||
| Catskill Park CLO Ltd. |
7,600,000 | 7,144,380 | ||||||
| CWHEQ Revolving Home Equity Loan Resuritization Trust |
5,260 | 5,257 | ||||||
| Dividend Solar Loans LLC |
2,504,297 | 2,209,496 | ||||||
| Driven Brands Funding, LLC |
1,905,000 | 1,839,687 | ||||||
| Dryden 43 Senior Loan Fund |
2,790,000 | 2,560,718 | ||||||
| Dryden 75 CLO Ltd. |
7,200,000 | 6,622,020 | ||||||
| FNA VI LLC |
713,204 | 650,791 | ||||||
| Fortress Credit BSL XII Ltd. |
2,250,000 | 1,984,615 | ||||||
| Golub Capital Partners CLO 53B Ltd. |
3,640,000 | 3,507,064 | ||||||
| Golub Capital Partners CLO 66B Ltd. |
1,210,000 | 1,211,764 | ||||||
| Greenwood Park CLO Ltd. |
7,380,000 | 6,433,419 | ||||||
| Greywolf CLO II Ltd. |
4,090,000 | 3,937,840 | ||||||
| Halsey Point CLO I Ltd. |
2,770,000 | 2,438,348 | ||||||
| Kestrel Aircraft Funding Ltd. |
1,316,491 | 1,161,803 | ||||||
| LFS LLC |
1,000,000 | 984,432 | ||||||
| Long Beach Mortgage Loan Trust |
1,717 | 1,704 | ||||||
| Marathon CLO 14 Ltd. |
2,950,000 | 2,919,998 | ||||||
| MidOcean Credit CLO VII |
4,000,000 | 3,814,336 | ||||||
| MKS CLO Ltd. |
2,150,000 | 2,074,539 | ||||||
| Neuberger Berman Loan Advisers CLO 44 Ltd. |
3,560,000 | 3,486,194 | ||||||
| Oaktree CLO Ltd. |
4,550,000 | 4,328,488 | ||||||
| Ocean Trails CLO X |
4,690,000 | 4,196,162 | ||||||
| Asset-Backed - Other—(Continued) | ||||||||
| Ocean Trails CLO XIV Ltd. |
5,190,000 | 5,206,302 | ||||||
| Palmer Square Loan Funding Ltd. |
5,270,000 | 5,273,204 | ||||||
| Peace Park CLO Ltd. |
2,250,000 | 2,190,406 | ||||||
| Pioneer Aircraft Finance Ltd. |
2,512,504 | 2,211,079 | ||||||
| Rad CLO Ltd. |
2,160,000 | 2,158,404 | ||||||
| RR 18 Ltd. |
7,070,000 | 6,880,312 | ||||||
| Sculptor CLO XXVI Ltd. |
4,370,000 | 4,092,286 | ||||||
| Structured Asset Securities Corp. Mortgage Loan Trust |
2,536,543 | 54,265 | ||||||
| Sycamore Tree CLO Ltd. |
5,830,000 | 5,838,162 | ||||||
| Symphony CLO XIX Ltd. |
2,147,144 | 2,143,939 | ||||||
| TCI-Symphony CLO Ltd. |
1,720,000 | 1,662,512 | ||||||
| 12.405%, 3M TSFR + 7.012%, 10/13/32 (144A) (b) |
6,440,000 | 5,942,561 | ||||||
| Thrust Engine Leasing DAC |
3,055,489 | 2,625,841 | ||||||
| Trinitas CLO XXVI Ltd. |
||||||||
| 8.268%, 3M TSFR + 2.950%, 01/20/35 (144A) (b) |
3,100,000 | 3,100,000 | ||||||
| TSTAT Ltd. |
3,550,000 | 3,550,128 | ||||||
| Valley Stream Park CLO Ltd. |
2,725,000 | 2,717,446 | ||||||
| Voya CLO Ltd. |
2,360,000 | 2,281,745 | ||||||
| Whitebox CLO IV Ltd. |
6,220,000 | 6,239,873 | ||||||
| Whitehorse XII Ltd. |
6,180,000 | 5,828,686 | ||||||
| Z Capital Credit Partners CLO Ltd. |
4,290,000 | 3,937,285 | ||||||
|
|
|
|||||||
| 191,393,008 | ||||||||
|
|
|
|||||||
| Asset-Backed - Student Loan—0.4% | ||||||||
| College Avenue Student Loans LLC |
2,558,000 | 2,474,738 | ||||||
| Educational Funding Co. LLC |
2,811,689 | 1,780,391 | ||||||
| National Collegiate Student Loan Trust |
1,952,760 | 1,819,563 | ||||||
| SMB Private Education Loan Trust |
3,467,749 | 3,118,571 | ||||||
|
|
|
|||||||
| 9,193,263 | ||||||||
|
|
|
|||||||
| Total Asset-Backed Securities |
213,559,731 | |||||||
|
|
|
|||||||
See accompanying notes to financial statements.
BHFTII-15
Brighthouse Funds Trust II
Western Asset Management Strategic Bond Opportunities Portfolio
Schedule of Investments as of December 31, 2023
Mortgage-Backed Securities—9.4%
| Security Description | Principal Amount* |
Value | ||||||
| Collateralized Mortgage Obligations—6.0% | ||||||||
| Angel Oak Mortgage Trust |
3,722,458 | $ | 3,353,212 | |||||
| Banc of America Funding Corp. |
15,994,402 | 13,098,135 | ||||||
| Banc of America Funding Trust |
19,928,113 | 14,795,279 | ||||||
| 4.733%, 03/27/36 (144A) (b) |
3,924,534 | 3,219,842 | ||||||
| 7.259%, 01/27/30 (144A) (b) |
23,676,570 | 8,491,223 | ||||||
| Banc of America Mortgage Trust |
22,029 | 18,839 | ||||||
| BCAP LLC Trust |
2,749,876 | 2,432,093 | ||||||
| Bear Stearns Asset-Backed Securities I Trust |
171,425 | 208,173 | ||||||
| BRAVO Residential Funding Trust |
5,669,895 | 5,295,790 | ||||||
| 6.435%, 05/25/63 (144A) (g) |
3,921,907 | 3,957,617 | ||||||
| 7.103%, 10/25/63 (144A) (g) |
3,719,801 | 3,742,994 | ||||||
| CIM Trust |
1,329,258 | 1,316,993 | ||||||
| Citigroup Mortgage Loan Trust, Inc. |
4,368,480 | 4,384,483 | ||||||
| Countrywide Alternative Loan Trust |
727,358 | 624,631 | ||||||
| 5.750%, 01/25/37 |
1,363,472 | 669,226 | ||||||
| 6.000%, 01/25/37 |
1,077,464 | 653,466 | ||||||
| 6.177%, -6x 1M TSFR + 38.313%, 08/25/37 (b) |
570,169 | 734,922 | ||||||
| 6.718%, -4x 1M TSFR + 28.142%, 07/25/36 (b) |
1,429,517 | 1,346,490 | ||||||
| Countrywide Alternative Loan Trust Resecuritization |
1,859,339 | 888,415 | ||||||
| Countrywide Reperforming Loan REMICS Trust |
1,742,133 | 84,052 | ||||||
| CSMC Mortgage-Backed Trust |
464,612 | 450,206 | ||||||
| CSMC Trust |
1,757,698 | 1,708,374 | ||||||
| 3.937%, 09/27/60 (144A) |
5,360,000 | 5,199,120 | ||||||
| GreenPoint Mortgage Funding Trust |
460,760 | 432,830 | ||||||
| GSMPS Mortgage Loan Trust |
710,882 | 581,913 | ||||||
| HarborView Mortgage Loan Trust |
542,516 | 496,407 | ||||||
| IndyMac INDX Mortgage Loan Trust |
489,766 | 343,296 | ||||||
| Legacy Mortgage Asset Trust |
2,770,000 | 2,767,797 | ||||||
| 6.250%, 06/25/60 (144A) (g) |
1,937,346 | 1,935,537 | ||||||
| Lehman XS Trust |
743,831 | 675,980 | ||||||
| MASTR Seasoned Securitization Trust |
27,624 | 27,327 | ||||||
| Merrill Lynch Mortgage Investors Trust |
20,975 | 18,319 | ||||||
| 5.395%, 08/25/33 (b) |
172,846 | 157,314 | ||||||
| Collateralized Mortgage Obligations—(Continued) | ||||||||
| MFA Trust |
3,380,000 | 3,391,893 | ||||||
| New Residential Mortgage Loan Trust |
2,860,000 | 2,348,362 | ||||||
| 3.500%, 12/25/58 (144A) (b) |
2,572,211 | 2,387,428 | ||||||
| 3.750%, 11/25/58 (144A) (b) |
3,197,836 | 2,976,711 | ||||||
| 4.014%, 04/25/62 (144A) (b) |
4,239,096 | 3,774,592 | ||||||
| 4.250%, 09/25/56 (144A) (b) |
5,006,637 | 4,688,330 | ||||||
| NovaStar Mortgage Funding Trust |
196,237 | 177,240 | ||||||
| OBX Trust |
1,011,222 | 1,011,301 | ||||||
| PRKCM Trust |
4,922,620 | 4,911,395 | ||||||
| Residential Accredit Loans, Inc. Trust |
1,734,847 | 1,409,942 | ||||||
| Residential Asset Securitization Trust |
685,801 | 637,277 | ||||||
| Residential Mortgage Loan Trust |
2,980,000 | 2,854,833 | ||||||
| Sequoia Mortgage Trust |
3,979 | 3,793 | ||||||
| 6.483%, 6M TSFR + 1.108%, 06/20/33 (b) |
27,989 | 26,658 | ||||||
| Structured Adjustable Rate Mortgage Loan Trust |
274,783 | 172,013 | ||||||
| 6.957%, 1M TSFR + 1.614%, 09/25/37 (b) |
1,671,765 | 1,514,936 | ||||||
| Structured Asset Mortgage Investments II Trust |
99,045 | 68,464 | ||||||
| 6.030%, 1M TSFR + 0.674%, 02/25/36 (b) |
1,207,553 | 985,936 | ||||||
| Towd Point Mortgage Trust |
2,900,000 | 2,267,384 | ||||||
| 7.720%, 1M TSFR + 2.364%, 05/25/58 (144A) (b) |
1,220,000 | 1,245,840 | ||||||
| Verus Securitization Trust |
2,995,815 | 2,909,925 | ||||||
| 6.968%, 12/25/68 (144A) (g) |
2,620,000 | 2,640,737 | ||||||
| WaMu Mortgage Pass-Through Certificates Trust |
223,906 | 197,217 | ||||||
| 5.584%, 08/25/33 (b) |
353,241 | 338,283 | ||||||
| 5.810%, 12M MTA + 0.798%, 03/25/47 (b) |
704,355 | 604,626 | ||||||
| 6.010%, 1M TSFR + 0.654%, 12/25/45 (b) |
144,974 | 140,748 | ||||||
| 6.430%, 1M TSFR + 1.074%, 12/25/45 (b) |
5,006,686 | 3,241,196 | ||||||
| Washington Mutual Mortgage Pass-Through Certificates WMALT Trust |
6,491,024 | 1,040,405 | ||||||
|
|
|
|||||||
| 132,077,760 | ||||||||
|
|
|
|||||||
| Commercial Mortgage-Backed Securities—3.4% | ||||||||
| 2023-MIC Trust |
1,080,000 | 1,128,402 | ||||||
| BAMLL Re-REMICS Trust |
4,663,101 | 954,723 | ||||||
| Benchmark Mortgage Trust |
1,210,000 | 1,130,753 | ||||||
| 6.363%, 07/15/56 (b) |
1,120,000 | 1,173,340 | ||||||
See accompanying notes to financial statements.
BHFTII-16
Brighthouse Funds Trust II
Western Asset Management Strategic Bond Opportunities Portfolio
Schedule of Investments as of December 31, 2023
Mortgage-Backed Securities—(Continued)
| Security Description | Principal Amount* |
Value | ||||||
| Commercial Mortgage-Backed Securities—(Continued) | ||||||||
| BFLD Trust |
2,960,000 | $ | 92,802 | |||||
| BX Commercial Mortgage Trust |
9,066,697 | 7,307,476 | ||||||
| CFK Trust |
4,800,000 | 3,514,913 | ||||||
| Citigroup Commercial Mortgage Trust |
1,750,000 | 1,416,396 | ||||||
| 3.225%, 09/15/48 (144A) |
2,000,000 | 1,500,198 | ||||||
| 4.422%, 07/10/47 (b) |
1,210,000 | 1,127,189 | ||||||
| 5.820%, 10/12/40 (144A) (b) |
1,120,000 | 1,133,761 | ||||||
| CoreVest American Finance Ltd. |
4,010,000 | 4,018,000 | ||||||
| CSMC Trust |
7,420,000 | 6,544,889 | ||||||
| 4.373%, 09/15/37 (144A) |
6,620,000 | 3,111,019 | ||||||
| 12.794%, PRIME + 4.294%, 07/15/32 (144A) (b) |
6,285,000 | 5,262,393 | ||||||
| CSMC Trust Capital Certificates |
10,593,644 | 10,487,129 | ||||||
| GS Mortgage Securities Corp. Trust |
1,540,000 | 918,992 | ||||||
| GS Mortgage Securities Trust |
4,000,000 | 2,773,755 | ||||||
| JP Morgan Chase Commercial Mortgage Securities Trust |
568,000 | 474,423 | ||||||
| 6.349%, 02/15/51 (b) |
26,681 | 24,675 | ||||||
| 9.742%, 1M TSFR + 4.379%, 11/15/38 (144A) (b) |
3,760,000 | 3,569,349 | ||||||
| MHC Trust |
4,496,000 | 4,377,373 | ||||||
| ML-CFC Commercial Mortgage Trust |
131,595 | 19,871 | ||||||
| 5.450%, 08/12/48 (144A) (b) |
15,057 | 2,274 | ||||||
| 6.193%, 09/12/49 (b) |
39,625 | 38,602 | ||||||
| 6.222%, 09/12/49 (b) |
54,761 | 53,356 | ||||||
| MSWF Commercial Mortgage Trust |
2,210,000 | 2,287,958 | ||||||
| 7.252%, 12/15/56 (b) |
2,260,000 | 2,317,689 | ||||||
| Multifamily Trust |
2,342,274 | 2,335,835 | ||||||
| SMR Mortgage Trust |
2,755,343 | 2,160,631 | ||||||
| Soho Trust |
3,330,000 | 1,923,391 | ||||||
| UBS Commercial Mortgage Trust |
1,004,064 | 943,313 | ||||||
| Waikiki Beach Hotel Trust |
1,860,000 | 1,805,718 | ||||||
|
|
|
|||||||
| 75,930,588 | ||||||||
|
|
|
|||||||
| Total Mortgage-Backed Securities |
208,008,348 | |||||||
|
|
|
|||||||
| U.S. Treasury & Government Agencies—7.1% |
| |||||||
| Security Description | Principal Amount* |
Value | ||||||
| Agency Sponsored Mortgage - Backed—7.1% | ||||||||
| Federal Home Loan Mortgage Corp. |
729,309 | 605,480 | ||||||
| 1.500%, 07/01/41 |
578,468 | 479,349 | ||||||
| 3.000%, 06/01/35 |
2,373,426 | 2,223,080 | ||||||
| 4.000%, 07/01/49 |
5,576,629 | 5,373,774 | ||||||
| 4.500%, 02/01/47 |
1,426,072 | 1,410,572 | ||||||
| 7.000%, 03/01/39 |
30,743 | 32,795 | ||||||
| Federal Home Loan Mortgage Corp. STACR REMICS Trust |
8,290,000 | 8,579,337 | ||||||
| 8.387%, SOFR30A + 3.050%, 01/25/34 (144A) (b) |
4,750,000 | 4,793,236 | ||||||
| 9.087%, SOFR30A + 3.750%, 02/25/42 (144A) (b) |
2,717,000 | 2,805,088 | ||||||
| 10.087%, SOFR30A + 4.750%, 02/25/42 (144A) (b) |
1,090,000 | 1,127,513 | ||||||
| 10.552%, SOFR30A + 5.214%, 06/25/50 (144A) (b) |
3,939,234 | 4,317,115 | ||||||
| 11.087%, SOFR30A + 5.750%, 09/25/42 (144A) (b) |
3,780,000 | 4,202,560 | ||||||
| Federal National Mortgage Association | ||||||||
| 2.000%, 07/01/36 |
3,901,286 | 3,519,291 | ||||||
| 2.000%, 08/01/41 |
4,064,835 | 3,481,562 | ||||||
| 2.000%, 08/01/51 |
2,537,379 | 2,112,386 | ||||||
| 2.000%, 10/01/51 |
12,465,820 | 10,367,210 | ||||||
| 2.500%, 07/01/41 |
2,290,816 | 2,039,239 | ||||||
| 2.500%, 04/01/51 |
7,780,418 | 6,654,301 | ||||||
| 2.500%, 09/01/51 |
326,600 | 282,107 | ||||||
| 2.500%, 10/01/51 |
1,455,855 | 1,253,171 | ||||||
| 2.500%, 03/01/52 |
4,786,398 | 4,111,563 | ||||||
| 3.000%, 06/01/51 |
14,170,085 | 12,555,241 | ||||||
| 3.500%, 08/01/45 |
15,702,440 | 14,654,627 | ||||||
| 4.000%, 03/01/52 |
3,760,981 | 3,561,017 | ||||||
| 4.500%, 04/01/48 |
1,004,072 | 993,476 | ||||||
| 4.500%, 04/01/49 |
41,032 | 40,422 | ||||||
| 4.500%, 10/01/49 |
22,155 | 21,842 | ||||||
| 4.500%, 08/01/58 |
70,136 | 68,311 | ||||||
| 7.000%, 05/01/26 |
214 | 221 | ||||||
| 7.000%, 07/01/30 |
159 | 164 | ||||||
| 7.000%, 07/01/31 |
812 | 837 | ||||||
| 7.000%, 09/01/31 |
586 | 605 | ||||||
| 7.000%, 10/01/31 |
778 | 803 | ||||||
| 7.000%, 11/01/31 |
12,120 | 12,504 | ||||||
| 7.000%, 01/01/32 |
3,943 | 4,068 | ||||||
| 7.500%, 01/01/30 |
137 | 141 | ||||||
| 7.500%, 02/01/30 |
185 | 185 | ||||||
| 7.500%, 06/01/30 |
22 | 22 | ||||||
| 7.500%, 08/01/30 |
47 | 47 | ||||||
| 7.500%, 09/01/30 |
240 | 243 | ||||||
| 7.500%, 10/01/30 |
4 | 3 | ||||||
| 7.500%, 11/01/30 |
6,283 | 6,304 | ||||||
| 7.500%, 02/01/31 |
384 | 384 | ||||||
| 8.000%, 08/01/27 |
55 | 55 | ||||||
| 8.000%, 07/01/30 |
146 | 154 | ||||||
| 8.000%, 09/01/30 |
261 | 263 | ||||||
| Federal National Mortgage Association Connecticut Avenue Securities |
23,832 | 23,832 | ||||||
| 7.837%, SOFR30A + 2.500%, 10/25/43 (144A) (b) |
1,810,000 | 1,851,723 | ||||||
See accompanying notes to financial statements.
BHFTII-17
Brighthouse Funds Trust II
Western Asset Management Strategic Bond Opportunities Portfolio
Schedule of Investments as of December 31, 2023
U.S. Treasury & Government Agencies—(Continued)
| Security Description | Principal Amount* |
Value | ||||||
| Agency Sponsored Mortgage - Backed—(Continued) | ||||||||
| Federal National Mortgage Association Connecticut Avenue Securities |
7,990,000 | $ | 8,054,488 | |||||
| 8.852%, SOFR30A + 3.514%, 10/25/39 (144A) (b) |
11,030,000 | 11,204,482 | ||||||
| 9.237%, SOFR30A + 3.900%, 07/25/43 (144A) (b) |
1,470,000 | 1,498,969 | ||||||
| 9.552%, SOFR30A + 4.214%, 07/25/39 (144A) (b) |
3,341,753 | 3,466,242 | ||||||
| 9.802%, SOFR30A + 4.464%, 04/25/31 (144A) (b) |
5,000,000 | 5,352,569 | ||||||
| Federal National Mortgage Association REMICS |
14,948 | 14,739 | ||||||
| 5.802%, SOFR30A + 0.464%, 05/25/34 (b) |
32,042 | 31,944 | ||||||
| FREMF Mortgage Trust |
2,174,173 | 2,157,058 | ||||||
| Government National Mortgage Association |
||||||||
| Zero Coupon, 04/16/52 (b) (l) |
1,899,020 | 19 | ||||||
| 0.164%, 03/16/47 (b) (l) |
81,704 | 24 | ||||||
| 0.585%, 07/16/58 (b) (l) |
983,630 | 27,763 | ||||||
| 2.500%, 03/20/51 |
2,650,953 | 2,318,289 | ||||||
| 2.500%, 05/20/51 |
290,410 | 249,609 | ||||||
| 3.500%, 12/20/50 |
2,533,573 | 2,378,968 | ||||||
| 4.500%, 11/20/50 |
970,977 | 948,109 | ||||||
| 4.500%, 12/20/50 |
166,191 | 164,193 | ||||||
| 5.500%, 01/15/34 |
15,024 | 15,186 | ||||||
| 5.500%, 03/20/34 |
2,421 | 2,521 | ||||||
| 5.500%, 04/15/34 |
4,593 | 4,642 | ||||||
| 5.500%, 07/15/34 |
25,184 | 25,456 | ||||||
| 5.500%, 10/15/34 |
25,984 | 26,188 | ||||||
| 5.750%, 10/15/38 |
22,725 | 23,444 | ||||||
| 6.000%, 05/20/32 |
3,201 | 3,343 | ||||||
| 6.000%, 02/15/33 |
577 | 595 | ||||||
| 6.000%, 03/15/33 |
1,774 | 1,820 | ||||||
| 6.000%, 06/15/33 |
1,054 | 1,089 | ||||||
| 6.000%, 07/15/33 |
2,445 | 2,512 | ||||||
| 6.000%, 09/15/33 |
934 | 951 | ||||||
| 6.000%, 10/15/33 |
951 | 980 | ||||||
| 6.000%, 11/20/33 |
3,913 | 4,097 | ||||||
| 6.500%, 03/15/29 |
326 | 333 | ||||||
| 6.500%, 02/15/32 |
200 | 208 | ||||||
| 6.500%, 03/15/32 |
211 | 216 | ||||||
| 6.500%, 11/15/32 |
454 | 463 | ||||||
| Government National Mortgage Association REMICS |
2,378 | 2,369 | ||||||
| Government National Mortgage Association, TBA |
900,000 | 761,941 | ||||||
| 5.500%, TBA (m) |
1,500,000 | 1,510,785 | ||||||
| Multifamily Connecticut Avenue Securities Trust |
2,620,063 | 2,547,891 | ||||||
| 9.202%, SOFR30A + 3.864%, 03/25/50 (144A) (b) |
3,918,971 | 3,777,675 | ||||||
| Seasoned Credit Risk Transfer Trust |
||||||||
| 4.000%, 07/25/56 (b) |
2,275,958 | 2,245,225 | ||||||
| 4.250%, 05/25/60 (144A) (b) |
4,710,000 | 4,185,108 | ||||||
|
|
|
|||||||
| Total U.S. Treasury & Government Agencies |
156,580,726 | |||||||
|
|
|
|||||||
| Foreign Government—3.6% |
| |||||||
| Security Description | Principal Amount* |
Value | ||||||
| Regional Government—0.6% | ||||||||
| Provincia de Buenos Aires |
24,455,990 | 9,335,234 | ||||||
| Provincia de Cordoba |
5,515,415 | 4,655,560 | ||||||
|
|
|
|||||||
| 13,990,794 | ||||||||
|
|
|
|||||||
| Sovereign—3.0% | ||||||||
| Angola Government International Bonds |
1,520,000 | 1,334,536 | ||||||
| 9.125%, 11/26/49 |
1,710,000 | 1,393,650 | ||||||
| Bahamas Government International Bonds |
2,570,000 | 2,546,613 | ||||||
| 8.950%, 10/15/32 |
1,660,000 | 1,557,339 | ||||||
| Brazil Government International Bond |
2,970,000 | 3,048,960 | ||||||
| Dominican Republic International Bonds |
1,200,000 | 1,104,000 | ||||||
| 4.875%, 09/23/32 |
4,020,000 | 3,654,783 | ||||||
| 5.500%, 02/22/29 (144A) |
2,100,000 | 2,050,125 | ||||||
| Egypt Government International Bonds |
2,450,000 | 1,883,315 | ||||||
| 7.053%, 01/15/32 |
1,940,000 | 1,324,566 | ||||||
| El Salvador Government International Bond |
500,000 | 440,484 | ||||||
| Ghana Government International Bond |
1,630,000 | 1,020,791 | ||||||
| Indonesia Treasury Bonds |
9,599,000,000 | 620,004 | ||||||
| 7.000%, 05/15/27 (IDR) |
131,339,000,000 | 8,659,144 | ||||||
| Ivory Coast Government International Bonds |
1,630,000 | 1,512,752 | ||||||
| 6.125%, 06/15/33 |
1,840,000 | 1,688,826 | ||||||
| Jamaica Government International Bond |
227,000,000 | 1,470,116 | ||||||
| Jordan Government International Bonds |
2,340,000 | 2,366,325 | ||||||
| 7.750%, 01/15/28 (144A) |
3,150,000 | 3,254,517 | ||||||
| Mexico Bonos |
271,470,000 | 15,637,862 | ||||||
| Nigeria Government International Bond |
2,600,000 | 2,339,012 | ||||||
| Republic of Kenya Government International Bond |
1,520,000 | 1,215,725 | ||||||
| Republic of Uzbekistan International Bond |
1,650,000 | 1,381,875 | ||||||
| Senegal Government International Bond |
1,520,000 | 1,355,870 | ||||||
| Sri Lanka Government International Bond |
1,580,000 | 792,453 | ||||||
| Ukraine Government International Bond |
6,330,000 | 1,472,358 | ||||||
| Uruguay Government International Bond |
48,339,319 | 1,292,638 | ||||||
|
|
|
|||||||
| 66,418,639 | ||||||||
|
|
|
|||||||
| Total Foreign Government |
80,409,433 | |||||||
|
|
|
|||||||
See accompanying notes to financial statements.
BHFTII-18
Brighthouse Funds Trust II
Western Asset Management Strategic Bond Opportunities Portfolio
Schedule of Investments as of December 31, 2023
Convertible Preferred Stocks—0.5%
| Security Description | Shares/ Principal |
Value | ||||||
| Banks—0.3% | ||||||||
| Wells Fargo & Co. - Series L, |
4,965 | $ | 5,936,253 | |||||
|
|
|
|||||||
| Pipelines—0.2% | ||||||||
| Equitrans Midstream Corp, |
34,193 | 760,794 | ||||||
| MPLX LP - Series A |
||||||||
| 9.539% (e) (f) (g) |
164,916 | 5,870,417 | ||||||
|
|
|
|||||||
| 6,631,211 | ||||||||
|
|
|
|||||||
| Total Convertible Preferred Stocks |
12,567,464 | |||||||
|
|
|
|||||||
| Convertible Bonds—0.5% |
| |||||||
| Entertainment—0.2% | ||||||||
| DraftKings Holdings, Inc. |
||||||||
| Zero Coupon, 03/15/28 |
6,160,000 | 4,937,240 | ||||||
|
|
|
|||||||
| Media—0.3% | ||||||||
| DISH Network Corp. |
||||||||
| Zero Coupon, 12/15/25 |
7,460,000 | 4,625,200 | ||||||
| 3.375%, 08/15/26 |
140,000 | 74,200 | ||||||
| Gannett Co., Inc. |
695,000 | 559,128 | ||||||
|
|
|
|||||||
| 5,258,528 | ||||||||
|
|
|
|||||||
| Total Convertible Bonds |
10,195,768 | |||||||
|
|
|
|||||||
| Common Stocks—0.1% |
| |||||||
| Automobile Components—0.0% | ||||||||
| Lear Corp. (a) |
399 | 56,343 | ||||||
|
|
|
|||||||
| Chemicals—0.0% | ||||||||
| LyondellBasell Industries NV - Class A |
23 | 2,184 | ||||||
|
|
|
|||||||
| Media—0.0% | ||||||||
| Cengage Learning, Inc. (o) |
10,995 | 99,417 | ||||||
|
|
|
|||||||
| Oil, Gas & Consumable Fuels—0.1% | ||||||||
| Ascent CNR Corp. - Class A (e) (f) (o) |
1,399,556 | 27,991 | ||||||
| Berry Corp. |
170,615 | 1,199,423 | ||||||
|
|
|
|||||||
| 1,227,414 | ||||||||
|
|
|
|||||||
| Total Common Stocks |
1,385,358 | |||||||
|
|
|
|||||||
| Municipals—0.0% | ||||||||
| Virginia Housing Development Authority |
260,160 | 258,267 | ||||||
|
|
|
|||||||
| Escrow Shares—0.0% |
| |||||||
| Security Description | Shares/ Principal |
Value | ||||||
| Forest Products & Paper—0.0% | ||||||||
| Sino Forest Corp. (e) (f) (o) |
1,246,000 | 0 | ||||||
| Sino Forest Corp. (e) (f) (o) |
500,000 | 0 | ||||||
|
|
|
|||||||
| Total Escrow Shares |
0 | |||||||
|
|
|
|||||||
| Short-Term Investment—0.7% |
| |||||||
| Repurchase Agreement—0.7% | ||||||||
| Fixed Income Clearing Corp. |
15,251,446 | 15,251,446 | ||||||
|
|
|
|||||||
| Total Short-Term Investments |
15,251,446 | |||||||
|
|
|
|||||||
| Securities Lending Reinvestments (p)—15.7% |
| |||||||
| Certificates of Deposit—3.3% | ||||||||
| Bank of America NA |
2,000,000 | 2,000,458 | ||||||
| Bank of Montreal |
2,000,000 | 2,001,628 | ||||||
| Barclays Bank PLC |
3,000,000 | 2,999,991 | ||||||
| 5.790%, SOFR + 0.400%, 02/14/24 (b) |
4,000,000 | 4,001,128 | ||||||
| BNP Paribas SA |
2,000,000 | 2,000,616 | ||||||
| Citibank NA |
3,000,000 | 3,000,738 | ||||||
| Mitsubishi UFJ Trust & Banking Corp. |
||||||||
| Zero Coupon, 03/13/24 |
5,000,000 | 4,944,100 | ||||||
| Mizuho Bank Ltd. |
5,000,000 | 5,002,265 | ||||||
| MUFG Bank Ltd. (London) |
||||||||
| Zero Coupon, 06/10/24 |
6,500,000 | 6,342,375 | ||||||
| National Westminster Bank PLC |
3,000,000 | 3,004,860 | ||||||
| Oversea-Chinese Banking Corp. Ltd. |
5,000,000 | 5,000,520 | ||||||
| Standard Chartered Bank |
4,000,000 | 4,001,657 | ||||||
| 5.790%, SOFR + 0.390%, 04/19/24 (b) |
2,000,000 | 2,000,000 | ||||||
| Sumitomo Mitsui Banking Corp. |
5,000,000 | 5,000,615 | ||||||
| Sumitomo Mitsui Trust Bank Ltd. |
||||||||
| Zero Coupon, 02/15/24 |
1,000,000 | 992,860 | ||||||
| Zero Coupon, 02/27/24 |
2,000,000 | 1,982,100 | ||||||
| 5.800%, SOFR + 0.400%, 04/24/24 (b) |
5,000,000 | 5,002,975 | ||||||
See accompanying notes to financial statements.
BHFTII-19
Brighthouse Funds Trust II
Western Asset Management Strategic Bond Opportunities Portfolio
Schedule of Investments as of December 31, 2023
Securities Lending Reinvestments (p)—(Continued)
| Security Description | Principal |
Value | ||||||
| Certificates of Deposit—(Continued) | ||||||||
| Svenska Handelsbanken AB |
5,000,000 | $ | 5,004,135 | |||||
| Wells Fargo Bank NA |
2,000,000 | 2,001,646 | ||||||
| Westpac Banking Corp. |
6,000,000 | 6,007,434 | ||||||
|
|
|
|||||||
| 72,292,101 | ||||||||
|
|
|
|||||||
| Commercial Paper—0.7% | ||||||||
| Australia & New Zealand Banking Group Ltd. |
4,000,000 | 3,933,352 | ||||||
| 5.730%, SOFR + 0.330%, 04/18/24 (b) |
4,000,000 | 4,000,896 | ||||||
| ING U.S. Funding LLC |
5,000,000 | 5,002,720 | ||||||
| Old Line Funding LLC |
2,000,000 | 1,987,044 | ||||||
| 5.620%, SOFR + 0.230%, 03/11/24 (b) |
1,000,000 | 1,000,000 | ||||||
|
|
|
|||||||
| 15,924,012 | ||||||||
|
|
|
|||||||
| Repurchase Agreements—9.3% | ||||||||
| Bank of Nova Scotia |
27,000,000 | 27,000,000 | ||||||
| Barclays Bank PLC |
||||||||
| Repurchase Agreement dated 12/29/23 at 5.330%, due on 01/02/24 with a maturity value of $4,991,390; collateralized by U.S. Treasury Obligations with rates ranging from 0.000% - 5.500%, maturity dates ranging from 01/31/24 - 05/15/48, and an aggregate market value of $5,090,995 |
4,988,436 | 4,988,436 | ||||||
| Barclays Bank PLC |
8,000,000 | 8,000,000 | ||||||
| Cantor Fitzgerald & Co. |
5,000,000 | 5,000,000 | ||||||
| Citigroup Global Markets, Inc. | ||||||||
| Repurchase Agreement dated 12/29/23 at 5.620%, due on 02/02/24 with a maturity value of $3,016,392; collateralized by U.S. Treasury Obligations with rates ranging from 0.125% - 3.750%, maturity dates ranging from 01/15/30 - 08/15/32, and various Common Stock with an aggregate market value of $3,060,003 |
3,000,000 | 3,000,000 | ||||||
| Repurchase Agreements—(Continued) | ||||||||
| Citigroup Global Markets, Inc. | ||||||||
| Repurchase Agreement dated 12/29/23 at 5.870%, due on 07/01/24 with a maturity value of $10,301,653; collateralized by U.S. Treasury Obligations with rates ranging from 0.875% - 3.750%, maturity dates ranging from 05/15/28 - 02/15/32, and various Common Stock with an aggregate market value of $10,200,046 |
10,000,000 | 10,000,000 | ||||||
| ING Financial Markets LLC |
2,922,038 | 2,922,038 | ||||||
| National Bank Financial, Inc. |
5,802,492 | 5,802,492 | ||||||
| National Bank of Canada |
||||||||
| Repurchase Agreement dated 12/29/23 at 5.450%, due on 01/05/24 with a maturity value of $50,052,986; collateralized by various Common Stock with an aggregate market value of $55,799,460 |
50,000,000 | 50,000,000 | ||||||
| Repurchase Agreement dated 12/29/23 at 5.470%, due on 01/02/24 with a maturity value of $5,003,039; collateralized by various Common Stock with an aggregate market value of $5,580,036 |
5,000,000 | 5,000,000 | ||||||
| NBC Global Finance Ltd. |
42,500,000 | 42,500,000 | ||||||
| Royal Bank of Canada Toronto |
15,000,000 | 15,000,000 | ||||||
| Societe Generale | ||||||||
| Repurchase Agreement dated 12/29/23 at 5.330%, due on 01/02/24 with a maturity value of $10,005,922; collateralized by U.S. Treasury Obligations with rates ranging from 0.625% - 4.750%, maturity dates ranging from 04/15/26 - 08/15/51, and an aggregate market value of $10,222,653 |
10,000,000 | 10,000,000 | ||||||
| Repurchase Agreement dated 12/29/23 at 5.330%, due on 01/02/24 with a maturity value of $2,101,244; collateralized by U.S. Treasury Obligations with rates ranging from 0.625% - 5.240%, maturity dates ranging from 04/30/24 - 05/15/32, and an aggregate market value of $2,142,001 |
2,100,000 | 2,100,000 | ||||||
See accompanying notes to financial statements.
BHFTII-20
Brighthouse Funds Trust II
Western Asset Management Strategic Bond Opportunities Portfolio
Schedule of Investments as of December 31, 2023
Securities Lending Reinvestments (p)—(Continued)
| Security Description | Shares/ Principal |
Value | ||||||
| Repurchase Agreements—(Continued) | ||||||||
| Societe Generale | ||||||||
| Repurchase Agreement dated 12/29/23 at 5.510%, due on 01/02/24 with a maturity value of $1,000,612; collateralized by various Common Stock with an aggregate market value of $1,113,133 |
1,000,000 | $ | 1,000,000 | |||||
| TD Prime Services LLC |
12,125,000 | 12,125,000 | ||||||
|
|
|
|||||||
| 204,437,966 | ||||||||
|
|
|
|||||||
| Time Deposits—1.7% | ||||||||
| DZ Bank AG (NY) |
8,000,000 | 8,000,000 | ||||||
| First Abu Dhabi Bank USA NV |
10,000,000 | 10,000,000 | ||||||
| National Bank of Canada |
15,000,000 | 15,000,000 | ||||||
| Nordea Bank Abp |
5,000,000 | 5,000,000 | ||||||
|
|
|
|||||||
| 38,000,000 | ||||||||
|
|
|
|||||||
| Mutual Funds—0.7% | ||||||||
| BlackRock Liquidity Funds FedFund, Institutional Shares 5.260% (q) |
1,000,000 | 1,000,000 | ||||||
| Dreyfus Treasury Obligations Cash Management Fund, Institutional Class 5.250% (q) |
5,000,000 | 5,000,000 | ||||||
| Goldman Sachs Financial Square Government Fund, Institutional Shares 5.230% (q) |
5,000,000 | 5,000,000 | ||||||
| HSBC U.S. Government Money Market Fund, Class I 5.300% (q) |
2,000,000 | 2,000,000 | ||||||
| Morgan Stanley Liquidity Funds Government Portfolio, Institutional Shares 5.270% (q) |
2,000,000 | 2,000,000 | ||||||
| RBC U.S. Government Money Market Fund, Institutional Share 5.230% (q) |
1,000,000 | 1,000,000 | ||||||
|
|
|
|||||||
| 16,000,000 | ||||||||
|
|
|
|||||||
| Total Securities Lending Reinvestments |
346,654,079 | |||||||
|
|
|
|||||||
| Total Purchased Options—0.1% (r) |
1,631,014 | |||||||
| Total Investments—112.6% |
2,483,366,719 | |||||||
| Unfunded Loan Commitments—(0.0)% |
(493,333 | ) | ||||||
| Net Investments—112.6% |
2,482,873,386 | |||||||
| Other assets and liabilities (net)—(12.6)% |
(277,618,806 | ) | ||||||
|
|
|
|||||||
| Net Assets—100.0% | $ | 2,205,254,580 | ||||||
|
|
|
|||||||
| * | Principal and notional amounts stated in U.S. dollars unless otherwise noted. | |||
| † | Restricted securities are not registered under the Securities Act of 1933 and are subject to legal restrictions on resale. These securities generally may be resold in transactions exempt from registration or to the public if the securities are subsequently registered. Disposal of these securities may involve time-consuming negotiations and prompt sale at an acceptable price may be difficult. As of December 31, 2023, the market value of restricted securities was $15,563,496, which is 0.7% of net assets. See details shown in the Restricted Securities table that follows. | |||
| (a) | All or a portion of the security was held on loan. As of December 31, 2023, the market value of securities loaned was $376,565,675 and the collateral received consisted of cash in the amount of $346,426,548 and non-cash collateral with a value of $45,365,654. The cash collateral investments are disclosed in the Schedule of Investments and categorized as Securities Lending Reinvestments. The non-cash collateral received consists of U.S. government securities that are held in safe-keeping by the lending agent, or a third-party custodian, and cannot be sold or repledged by the Portfolio. As such, this collateral is excluded from the Statement of Assets and Liabilities. | |||
| (b) | Variable or floating rate security. The stated rate represents the rate at December 31, 2023. Maturity date shown for callable securities reflects the earliest possible call date. For securities based on a published reference index and spread, the index and spread are indicated in the description above. For certain variable rate securities, the coupon rate is determined by the issuer/agent based on current market conditions. For certain asset- and mortgage-backed securities, the coupon rate may fluctuate based on changes of the underlying collateral or prepayments of principal. These securities do not indicate a reference index and spread in their description above. | |||
| (c) | The stated interest rates represent the range of rates at December 31, 2023 of the underlying contracts within the senior loan facility. | |||
| (d) | Payment-in-kind security for which part of the income earned may be paid as additional principal. | |||
| (e) | Security was valued in good faith under procedures subject to oversight by the Board of Trustees. As of December 31, 2023, these securities represent 0.5% of net assets. | |||
| (f) | Significant unobservable inputs were used in the valuation of this portfolio security; i.e. Level 3. | |||
| (g) | Security is a “step-up” bond where coupon increases or steps up at a predetermined date. Rate shown is current coupon rate. | |||
| (h) | Non-income producing; security is in default and/or issuer is in bankruptcy. | |||
| (i) | Floating rate loans (“Senior Loans”) often require prepayments from excess cash flows or permit the borrowers to repay at their election. The degree to which borrowers repay, whether as a contractual requirement or at their election, cannot be predicted with accuracy. As a result, the actual remaining maturity may be substantially less than the stated maturities shown. However, Senior Loans will generally have an expected average life of approximately two to four years. Senior Loans typically have rates of interest which are determined periodically by reference to a base lending rate, plus a spread. These base rates are primarily the Secured Overnight Financing Rate and secondarily, the prime rate offered by one or more major United States banks. Base lending rates may be subject to a floor, or a minimum rate | |||
| (j) | This loan will settle after December 31, 2023, at which time the interest rate will be determined. | |||
| (k) | Unfunded or partially unfunded loan commitments. The Portfolio may enter into certain credit agreements for which all or a portion may be unfunded. The Portfolio is obligated to fund these commitments at the borrower’s discretion. | |||
| (l) | Interest only security. | |||
| (m) | TBA (To Be Announced) Securities are purchased on a forward commitment basis with an approximate principal amount and no defined maturity date. The actual principal and maturity date will be determined upon settlement date. | |||
| (n) | Principal amount of security is adjusted for inflation. | |||
| (o) | Non-income producing security. | |||
| (p) | Represents investment of cash collateral received from securities on loan as of December 31, 2023. | |||
| (q) | The rate shown represents the annualized seven-day yield as of December 31, 2023. | |||
| (r) | For a breakout of open positions, see details shown in the Purchased Options table that follows. | |||
See accompanying notes to financial statements.
BHFTII-21
Brighthouse Funds Trust II
Western Asset Management Strategic Bond Opportunities Portfolio
Schedule of Investments as of December 31, 2023
| (144A) | Securities exempt from registration under Rule 144A of the Securities Act of 1933. These securities may be resold in transactions exempt from registration, normally to qualified institutional buyers. As of December 31, 2023, the market value of 144A securities was $1,251,881,311, which is 56.8% of net assets. | |||
| Restricted Securities |
Acquisition Date |
Principal Amount |
Cost | Value | ||||||||||||
| Akumin, Inc., 7.500%, 08/01/28 |
03/17/22-03/21/22 | $ | 3,840,000 | $ | 3,276,759 | $ | 2,911,104 | |||||||||
| Akumin, Inc., 7.000%, 11/01/25 |
09/01/22-02/16/23 | 2,332,000 | 2,085,246 | 1,888,920 | ||||||||||||
| Countrywide Reperforming Loan REMICS Trust, 0.789%, 03/25/35 |
01/08/15 | 1,742,133 | 253,698 | 84,052 | ||||||||||||
| Intesa Sanpaolo SpA, 7.800%, 11/28/53 |
11/28/23-12/01/23 | 4,870,000 | 4,986,755 | 5,347,121 | ||||||||||||
| Massachusetts Mutual Life Insurance Co., 4.900%, 04/01/77 |
03/20/17 | 6,285,000 | 6,262,919 | 5,331,451 | ||||||||||||
| Midwest Vanadium Pty, Ltd., 13.250%, 02/15/18 |
05/24/11 | 931,574 | 960,686 | 0 | ||||||||||||
| Northwest Acquisitions ULC/Dominion Finco, Inc., 7.125%, 11/01/22 |
10/06/17-11/21/19 | 8,475,000 | 8,571,525 | 848 | ||||||||||||
|
|
|
|||||||||||||||
| $ | 15,563,496 | |||||||||||||||
|
|
|
|||||||||||||||
Forward Foreign Currency Exchange Contracts
|
Contracts to Buy |
Counterparty |
Settlement Date |
In Exchange for |
Unrealized Appreciation/ (Depreciation) |
||||||||||||||||||
| AUD | 65,003,994 | BNP |
01/19/24 | USD | 41,366,408 | $ | 2,953,416 | |||||||||||||||
| BRL | 20,550,000 | GSBU |
01/19/24 | USD | 4,137,389 | 88,502 | ||||||||||||||||
| BRL | 29,890,000 | JPMC |
01/19/24 | USD | 6,091,546 | 55,018 | ||||||||||||||||
| BRL | 3,853,206 | MSCS |
01/19/24 | USD | 752,565 | 39,807 | ||||||||||||||||
| CAD | 5,120,940 | BOA |
01/19/24 | USD | 3,746,488 | 119,187 | ||||||||||||||||
| CAD | 29,151,622 | BOA |
01/19/24 | USD | 21,399,770 | 606,091 | ||||||||||||||||
| CAD | 4,000,000 | MSCS |
01/19/24 | USD | 2,927,814 | 91,690 | ||||||||||||||||
| EUR | 2,756,000 | BNP |
01/19/24 | USD | 2,977,031 | 67,351 | ||||||||||||||||
| GBP | 5,624,840 | BNP |
01/19/24 | USD | 6,858,564 | 311,763 | ||||||||||||||||
| GBP | 7,338,000 | BNP |
01/19/24 | USD | 9,010,770 | 343,426 | ||||||||||||||||
| IDR | 24,556,068,998 | MSCS |
01/19/24 | USD | 1,593,102 | 1,518 | ||||||||||||||||
| JPY | 3,127,193,649 | MSCS |
01/19/24 | USD | 21,226,338 | 1,001,162 | ||||||||||||||||
| MXN | 22,990,000 | GSBU |
01/19/24 | USD | 1,268,496 | 81,953 | ||||||||||||||||
| MXN | 46,003,790 | GSBU |
01/19/24 | USD | 2,532,899 | 169,397 | ||||||||||||||||
| MXN | 52,861,645 | GSBU |
01/19/24 | USD | 2,957,763 | 147,368 | ||||||||||||||||
| MXN | 99,988,800 | GSBU |
01/19/24 | USD | 5,408,472 | 464,942 | ||||||||||||||||
| MXN | 13,690,000 | JPMC |
01/19/24 | USD | 777,934 | 26,226 | ||||||||||||||||
| MXN | 18,772,000 | JPMC |
01/19/24 | USD | 1,027,649 | 75,032 | ||||||||||||||||
| MXN | 21,444,000 | JPMC |
01/19/24 | USD | 1,222,827 | 36,809 | ||||||||||||||||
| MXN | 23,110,000 | JPMC |
01/19/24 | USD | 1,277,572 | 79,926 | ||||||||||||||||
| MXN | 27,319,000 | JPMC |
01/19/24 | USD | 1,561,398 | 43,340 | ||||||||||||||||
| MXN | 34,898,000 | JPMC |
01/19/24 | USD | 1,997,637 | 52,296 | ||||||||||||||||
| MXN | 38,693,000 | JPMC |
01/19/24 | USD | 2,186,730 | 86,125 | ||||||||||||||||
| MXN | 47,260,000 | JPMC |
01/19/24 | USD | 2,628,272 | 147,814 | ||||||||||||||||
| MXN | 47,340,000 | JPMC |
01/19/24 | USD | 2,628,783 | 152,003 | ||||||||||||||||
| MXN | 47,480,000 | JPMC |
01/19/24 | USD | 2,629,429 | 159,581 | ||||||||||||||||
| MXN | 51,610,000 | JPMC |
01/19/24 | USD | 2,944,432 | 87,177 | ||||||||||||||||
| MXN | 51,650,000 | JPMC |
01/19/24 | USD | 2,937,804 | 96,154 | ||||||||||||||||
| MXN | 90,340,000 | JPMC |
01/19/24 | USD | 4,863,629 | 443,008 | ||||||||||||||||
| MXN | 99,700,000 | JPMC |
01/19/24 | USD | 5,706,959 | 149,491 | ||||||||||||||||
| MXN | 109,490,000 | JPMC |
01/19/24 | USD | 5,971,781 | 459,740 | ||||||||||||||||
| MXN | 39,960,000 | MSCS |
01/19/24 | USD | 2,304,325 | 42,953 | ||||||||||||||||
| NOK | 90,189,450 | MSCS |
01/19/24 | USD | 8,376,036 | 504,506 | ||||||||||||||||
See accompanying notes to financial statements.
BHFTII-22
Brighthouse Funds Trust II
Western Asset Management Strategic Bond Opportunities Portfolio
Schedule of Investments as of December 31, 2023
Forward Foreign Currency Exchange Contracts—(Continued)
| Contracts to Deliver |
Counterparty |
Settlement Date |
In Exchange for |
Unrealized Appreciation/ (Depreciation) |
||||||||||||||||||
| AUD | 13,030,000 | BNP |
01/19/24 | USD | 8,924,437 | $ | 40,563 | |||||||||||||||
| AUD | 986,000 | BNP |
01/19/24 | USD | 630,409 | (41,847 | ) | |||||||||||||||
| AUD | 5,640,000 | MSCS |
01/19/24 | USD | 3,843,178 | (2,182 | ) | |||||||||||||||
| CAD | 11,502,133 | BNP |
01/19/24 | USD | 8,379,783 | (302,901 | ) | |||||||||||||||
| CAD | 8,051,540 | BNP |
01/19/24 | USD | 5,921,404 | (156,511 | ) | |||||||||||||||
| CAD | 7,310,000 | CBNA |
01/19/24 | USD | 5,335,439 | (182,704 | ) | |||||||||||||||
| CAD | 8,220,000 | JPMC |
01/19/24 | USD | 5,988,775 | (216,306 | ) | |||||||||||||||
| CAD | 7,030,000 | JPMC |
01/19/24 | USD | 5,118,753 | (188,026 | ) | |||||||||||||||
| CHF | 9,710,000 | GSBU |
01/19/24 | USD | 11,619,419 | 56,280 | ||||||||||||||||
| CNH | 60,360,000 | JPMC |
01/19/24 | USD | 8,481,292 | 1,219 | ||||||||||||||||
| CNH | 400 | JPMC |
01/19/24 | USD | 55 | (1 | ) | |||||||||||||||
| EUR | 11,740,974 | BNP |
01/19/24 | USD | 12,447,795 | (521,732 | ) | |||||||||||||||
| EUR | 4,320,000 | BNP |
01/19/24 | USD | 4,590,889 | (181,148 | ) | |||||||||||||||
| EUR | 4,080,000 | BNP |
01/19/24 | USD | 4,393,387 | (113,536 | ) | |||||||||||||||
| EUR | 3,860,000 | BNP |
01/19/24 | USD | 4,202,534 | (61,369 | ) | |||||||||||||||
| GBP | 34,269,215 | BNP |
01/19/24 | USD | 41,884,723 | (1,800,338 | ) | |||||||||||||||
| GBP | 5,870,000 | BNP |
01/19/24 | USD | 7,271,814 | (211,034 | ) | |||||||||||||||
| GBP | 5,830,000 | BNP |
01/19/24 | USD | 7,217,209 | (214,648 | ) | |||||||||||||||
| IDR | 66,342,324,172 | JPMC |
01/19/24 | USD | 4,231,555 | (76,575 | ) | |||||||||||||||
| IDR | 102,837,040,000 | MSCS |
01/19/24 | USD | 6,611,189 | (66,831 | ) | |||||||||||||||
| JPY | 796,610,000 | MSCS |
01/19/24 | USD | 5,361,238 | (300,915 | ) | |||||||||||||||
| JPY | 766,860,000 | MSCS |
01/19/24 | USD | 5,180,725 | (269,971 | ) | |||||||||||||||
| JPY | 684,355,000 | MSCS |
01/19/24 | USD | 4,748,871 | (115,395 | ) | |||||||||||||||
| JPY | 456,540,000 | MSCS |
01/19/24 | USD | 3,061,765 | (183,235 | ) | |||||||||||||||
| JPY | 320,530,000 | MSCS |
01/19/24 | USD | 2,180,337 | (97,930 | ) | |||||||||||||||
| MXN | 185,860,812 | CBNA |
01/16/24 | USD | 10,341,400 | (581,473 | ) | |||||||||||||||
| MXN | 110,580,000 | GSBU |
01/19/24 | USD | 6,217,866 | (277,683 | ) | |||||||||||||||
| MXN | 111,293,200 | JPMC |
01/19/24 | USD | 6,219,700 | (317,742 | ) | |||||||||||||||
| MXN | 60,130,000 | JPMC |
01/19/24 | USD | 3,477,809 | (54,270 | ) | |||||||||||||||
| MXN | 56,110,000 | JPMC |
01/19/24 | USD | 3,239,546 | (56,396 | ) | |||||||||||||||
| MXN | 52,940,000 | JPMC |
01/19/24 | USD | 3,049,829 | (59,904 | ) | |||||||||||||||
| MXN | 52,172,400 | JPMC |
01/19/24 | USD | 2,965,649 | (98,996 | ) | |||||||||||||||
| MXN | 46,760,000 | JPMC |
01/19/24 | USD | 2,698,923 | (47,793 | ) | |||||||||||||||
| MXN | 38,458,000 | JPMC |
01/19/24 | USD | 2,237,581 | (21,469 | ) | |||||||||||||||
| MXN | 37,290,000 | JPMC |
01/19/24 | USD | 2,027,179 | (163,262 | ) | |||||||||||||||
| MXN | 36,441,289 | JPMC |
01/19/24 | USD | 1,985,663 | (154,924 | ) | |||||||||||||||
| MXN | 27,261,000 | JPMC |
01/19/24 | USD | 1,466,385 | (134,946 | ) | |||||||||||||||
| MXN | 21,491,000 | JPMC |
01/19/24 | USD | 1,244,616 | (17,781 | ) | |||||||||||||||
| MXN | 7,890,000 | JPMC |
01/19/24 | USD | 454,650 | (8,815 | ) | |||||||||||||||
| MXN | 1,797,600 | JPMC |
01/19/24 | USD | 102,399 | (3,193 | ) | |||||||||||||||
| MXN | 1,420,000 | JPMC |
01/19/24 | USD | 80,726 | (2,686 | ) | |||||||||||||||
| MXN | 65,470,000 | MSCS |
01/19/24 | USD | 3,773,238 | (72,517 | ) | |||||||||||||||
| MXN | 38,720,000 | MSCS |
01/19/24 | USD | 2,196,379 | (78,062 | ) | |||||||||||||||
| NOK | 34,820,000 | BNP |
01/19/24 | USD | 3,220,140 | (208,426 | ) | |||||||||||||||
| NOK | 32,370,000 | BNP |
01/19/24 | USD | 2,942,739 | (244,587 | ) | |||||||||||||||
| NOK | 23,000,000 | BNP |
01/19/24 | USD | 2,108,229 | (156,476 | ) | |||||||||||||||
| NZD | 2,981,769 | JPMC |
01/19/24 | USD | 1,797,072 | (87,943 | ) | |||||||||||||||
|
|
|
|||||||||||||||||||||
| Net Unrealized Appreciation |
|
$ | 1,128,355 | |||||||||||||||||||
|
|
|
|||||||||||||||||||||
See accompanying notes to financial statements.
BHFTII-23
Brighthouse Funds Trust II
Western Asset Management Strategic Bond Opportunities Portfolio
Schedule of Investments as of December 31, 2023
Futures Contracts
| Futures Contracts—Long |
Expiration Date |
Number of Contracts |
Notional Value | Value/ Unrealized Appreciation/ (Depreciation) |
||||||||||||||||
| 3 Month SOFR Futures |
03/18/25 | 410 | USD | 98,676,750 | $ | (362,611 | ) | |||||||||||||
| 3 Month SONIA Futures |
03/19/24 | 287 | GBP | 68,008,238 | 840,063 | |||||||||||||||
| 3 Month SONIA Futures |
09/17/24 | 296 | GBP | 70,658,900 | 1,045,632 | |||||||||||||||
| 3 Month SONIA Futures |
03/18/25 | 5 | GBP | 1,204,813 | 25,883 | |||||||||||||||
| Australian 10 Year Treasury Bond Futures |
03/15/24 | 202 | AUD | 23,566,475 | 395,877 | |||||||||||||||
| Euro-Bund Futures |
03/07/24 | 493 | EUR | 67,649,460 | 1,980,407 | |||||||||||||||
| U.S. Treasury Long Bond Futures |
03/19/24 | 229 | USD | 28,610,688 | 2,120,903 | |||||||||||||||
| U.S. Treasury Note 10 Year Futures |
03/19/24 | 1,612 | USD | 181,979,688 | 6,086,742 | |||||||||||||||
| U.S. Treasury Note 2 Year Futures |
03/28/24 | 2,402 | USD | 494,605,577 | 5,047,430 | |||||||||||||||
| U.S. Treasury Note 5 Year Futures |
03/28/24 | 979 | USD | 106,489,196 | 2,391,050 | |||||||||||||||
| U.S. Treasury Note Ultra 10 Year Futures |
03/19/24 | 591 | USD | 69,747,234 | 3,337,204 | |||||||||||||||
| U.S. Treasury Ultra Long Bond Futures |
03/19/24 | 1,379 | USD | 184,225,781 | 16,579,250 | |||||||||||||||
| United Kingdom Long Gilt Bond Futures |
03/26/24 | 225 | GBP | 23,096,250 | 1,651,334 | |||||||||||||||
| Futures Contracts—Short |
||||||||||||||||||||
| 3 Month SOFR Futures |
03/19/24 | (508 | ) | USD | (120,195,975 | ) | 662,233 | |||||||||||||
| 3 Month SOFR Futures |
06/18/24 | (167 | ) | USD | (39,668,763 | ) | (184,343 | ) | ||||||||||||
| Euro-Buxl 30 Year Bond Futures |
03/07/24 | (25 | ) | EUR | (3,543,000 | ) | (301,301 | ) | ||||||||||||
|
|
|
|||||||||||||||||||
| Net Unrealized Appreciation |
|
$ | 41,315,753 | |||||||||||||||||
|
|
|
|||||||||||||||||||
Purchased Options
| Foreign Currency Options |
Strike Price |
Counterparty | Expiration Date |
Number of Contracts |
Notional Amount |
Premiums Paid |
Market Value |
Unrealized Appreciation/ (Depreciation) |
||||||||||||||||||||||||||||
| USD Call/CAD Put |
CAD | 1.372 | BNP | 03/21/24 | 15,350,000 | USD | 15,350,000 | $ | 36,226 | $ | 17,852 | $ | (18,374 | ) | ||||||||||||||||||||||
| USD Call/CHF Put |
CHF | 0.853 | GSBU | 03/15/24 | 11,703,575 | USD | 11,703,575 | 66,523 | 64,557 | (1,966 | ) | |||||||||||||||||||||||||
| USD Call/EUR Put |
EUR | 1.055 | CBNA | 02/02/24 | 1,522,334 | USD | 1,522,334 | 19,996 | 344 | (19,652 | ) | |||||||||||||||||||||||||
| USD Call/EUR Put |
EUR | 1.055 | JPMC | 02/02/24 | 11,983,427 | USD | 11,983,427 | 140,505 | 2,708 | (137,797 | ) | |||||||||||||||||||||||||
| USD Call/EUR Put |
EUR | 1.060 | JPMC | 02/06/24 | 8,327,498 | USD | 8,327,498 | 57,585 | 3,581 | (54,004 | ) | |||||||||||||||||||||||||
| USD Call/EUR Put |
EUR | 1.062 | BNP | 02/22/24 | 15,530,000 | USD | 15,530,000 | 42,858 | 14,256 | (28,602 | ) | |||||||||||||||||||||||||
| USD Put/MXN Call |
MXN | 17.973 | CBNA | 01/11/24 | 17,840,000 | USD | 17,840,000 | 371,875 | 868,380 | 496,505 | ||||||||||||||||||||||||||
| USD Put/NOK Call |
NOK | 10.132 | GSBU | 02/16/24 | 24,390,000 | USD | 24,390,000 | 181,949 | 418,800 | 236,851 | ||||||||||||||||||||||||||
|
|
|
|
|
|
|
|||||||||||||||||||||||||||||||
| Totals |
|
$ | 917,517 | $ | 1,390,478 | $ | 472,961 | |||||||||||||||||||||||||||||
|
|
|
|
|
|
|
|||||||||||||||||||||||||||||||
| Options on Exchange-Traded Futures Contracts |
Strike Price |
Expiration Date |
Number of Contracts |
Notional Amount |
Premiums Paid |
Market Value |
Unrealized Appreciation/ (Depreciation) |
|||||||||||||||||||||||||||||
| Put - S&P 500 Index E-Mini Futures |
USD | 4,000.000 | 02/16/24 | 312 | USD | 15,600 | $ | 742,718 | $ | 46,020 | $ | (696,698 | ) | |||||||||||||||||||||||
| Put - U.S. Treasury Note 10 Year Futures |
USD | 111.000 | 01/26/24 | 690 | USD | 690,000 | 173,694 | 172,500 | (1,194 | ) | ||||||||||||||||||||||||||
| Put - U.S. Treasury Note 5 Year Futures |
USD | 105.000 | 01/26/24 | 1,409 | USD | 1,409,000 | 222,594 | 22,016 | (200,578 | ) | ||||||||||||||||||||||||||
|
|
|
|
|
|
|
|||||||||||||||||||||||||||||||
| Totals |
|
$ | 1,139,006 | $ | 240,536 | $ | (898,470 | ) | ||||||||||||||||||||||||||||
|
|
|
|
|
|
|
|||||||||||||||||||||||||||||||
Written Options
| Foreign Currency Options |
Strike Price |
Counterparty | Expiration Date |
Number of Contracts |
Notional Amount |
Premiums Received |
Market Value |
Unrealized Appreciation/ (Depreciation) |
||||||||||||||||||||||||||||||||
| USD Put/BRL Call |
BRL | 4.710 | GSBU | 02/15/24 | (12,900,000 | ) | USD | (12,900,000 | ) | $ | (108,567 | ) | $ | (63,816 | ) | $ | 44,751 | |||||||||||||||||||||||
| USD Put/MXN Call |
MXN | 17.293 | JPMC | 01/11/24 | (17,840,000 | ) | USD | (17,840,000 | ) | (122,382 | ) | (387,628 | ) | (265,246 | ) | |||||||||||||||||||||||||
|
|
|
|
|
|
|
|||||||||||||||||||||||||||||||||||
| Totals |
|
$ | (230,949 | ) | $ | (451,444 | ) | $ | (220,495 | ) | ||||||||||||||||||||||||||||||
|
|
|
|
|
|
|
|||||||||||||||||||||||||||||||||||
See accompanying notes to financial statements.
BHFTII-24
Brighthouse Funds Trust II
Western Asset Management Strategic Bond Opportunities Portfolio
Schedule of Investments as of December 31, 2023
Written Options—(Continued)
| Options on Exchange-Traded Futures Contracts |
Strike Price |
Expiration Date |
Number of Contracts |
Notional Amount |
Premiums Received |
Market Value |
Unrealized Appreciation/ (Depreciation) |
|||||||||||||||||||||||||||||
| Call - U.S. Treasury Note 5 Year Futures |
USD | 110.000 | 01/26/24 | (1,409 | ) | USD | (1,409,000 | ) | $ | (228,727 | ) | $ | (341,243 | ) | $ | (112,516 | ) | |||||||||||||||||||
| Put - S&P 500 Index E-Mini Futures |
USD | 3,600.000 | 02/16/24 | (119 | ) | USD | (5,950 | ) | (169,325 | ) | (7,735 | ) | 161,590 | |||||||||||||||||||||||
| Put - S&P 500 Index E-Mini Futures |
USD | 3,700.000 | 02/16/24 | (193 | ) | USD | (9,650 | ) | (115,310 | ) | (15,440 | ) | 99,870 | |||||||||||||||||||||||
|
|
|
|
|
|
|
|||||||||||||||||||||||||||||||
| Totals |
|
$ | (513,362 | ) | $ | (364,418 | ) | $ | 148,944 | |||||||||||||||||||||||||||
|
|
|
|
|
|
|
|||||||||||||||||||||||||||||||
Securities in the amount of $552,045 have been received at the custodian bank as collateral for OTC option contracts.
Swap Agreements
OTC Interest Rate Swaps
| Pay/Receive |
Floating Rate Index |
Payment Frequency |
Fixed Rate |
Payment Frequency |
Maturity Date |
Counterparty | Notional Amount |
Market Value |
Upfront Premium Paid/ (Received) |
Unrealized Appreciation/ (Depreciation)(1) |
||||||||||||||||||||||||||||||
| Pay |
1-Day CDI | Maturity | 10.230% | Maturity | 01/02/29 | JPMC | BRL | 179,120,000 | $ | 141,737 | $ | — | $ | 141,737 | ||||||||||||||||||||||||||
|
|
|
|
|
|
|
|||||||||||||||||||||||||||||||||||
Centrally Cleared Interest Rate Swaps
| Pay/Receive |
Floating Rate Index |
Payment Frequency |
Fixed Rate |
Payment |
Maturity Date |
Notional Amount |
Market Value |
Upfront Premiums Paid/ (Received) |
Unrealized Appreciation/ (Depreciation) |
|||||||||||||||||||||||
| Pay |
28-Day TIIE | Monthly | 7.440% | Monthly | 07/20/29 | MXN | 1,162,650,000 | $ | (3,220,842 | ) | $ | 333,744 | $ | (3,554,586 | ) | |||||||||||||||||
| Pay |
28-Day TIIE | Monthly | 7.450% | Monthly | 07/18/29 | MXN | 1,118,490,000 | (3,068,189 | ) | 264,598 | (3,332,787 | ) | ||||||||||||||||||||
| Receive |
12M SOFR | Annually | 2.600% | Annually | 02/15/48 | USD | 1,500,000 | 194,793 | 166,379 | 28,414 | ||||||||||||||||||||||
| Receive |
12M SOFR | Annually | 3.050% | Annually | 02/15/48 | USD | 21,216,000 | 1,197,614 | 737,762 | 459,852 | ||||||||||||||||||||||
| Receive |
12M SOFR | Annually | 3.150% | Annually | 05/15/48 | USD | 27,465,000 | 1,092,734 | (25,821 | ) | 1,118,555 | |||||||||||||||||||||
|
|
|
|
|
|
|
|||||||||||||||||||||||||||
| Totals |
|
$ | (3,803,890 | ) | $ | 1,476,662 | $ | (5,280,552 | ) | |||||||||||||||||||||||
|
|
|
|
|
|
|
|||||||||||||||||||||||||||
Centrally Cleared Credit Default Swaps on Credit Indices and Corporate Issues—Buy Protection (a)
| Reference Obligation |
Fixed Deal (Pay) Rate |
Payment Frequency |
Maturity Date |
Implied Credit Spread at December 31, 2023 (b) |
Notional Amount (c) |
Market Value |
Upfront Premiums Paid/(Received) |
Unrealized Appreciation/ (Depreciation) |
||||||||||||||||||||||||||||
| CDX.NA.HY.41 |
(5.000 | %) | Quarterly | 12/20/28 | 3.563 | % | USD | 8,919,009 | $ | (520,219 | ) | $ | (60,604 | ) | $ | (459,615 | ) | |||||||||||||||||||
| General Motors Co. 4.200%, due 10/01/27 |
(5.000 | %) | Quarterly | 06/20/26 | 0.808 | % | USD | 13,700,000 | (1,339,846 | ) | (1,319,565 | ) | (20,281 | ) | ||||||||||||||||||||||
|
|
|
|
|
|
|
|||||||||||||||||||||||||||||||
| Totals |
|
$ | (1,860,065 | ) | $ | (1,380,169 | ) | $ | (479,896 | ) | ||||||||||||||||||||||||||
|
|
|
|
|
|
|
|||||||||||||||||||||||||||||||
Centrally Cleared Credit Default Swaps on Corporate Issues—Sell Protection (d)
| Reference Obligation |
Fixed Deal Receive Rate |
Payment Frequency |
Maturity Date |
Implied Credit Spread at December 31, 2023 (b) |
Notional Amount (c) |
Market Value |
Upfront Premiums Paid/(Received) |
Unrealized Appreciation/ (Depreciation) |
||||||||||||||||||||||||
| Ford Motor Co. 4.346%, due 12/08/26 |
5.000 | % | Quarterly | 06/20/26 | 1.172 | % | USD | 13,700,000 | $ | 1,214,436 | $ | 981,779 | $ | 232,657 | ||||||||||||||||||
|
|
|
|
|
|
|
|||||||||||||||||||||||||||
OTC Credit Default Swaps on Corporate Issues—Buy Protection (a)
| Reference Obligation |
Fixed Deal (Pay) Rate |
Payment Frequency |
Maturity Date |
Counterparty |
Implied Credit Spread at December 31, 2023 (b) |
Notional Amount (c) |
Market Value |
Upfront Premium Paid/(Received) |
Unrealized Appreciation/ (Depreciation) |
|||||||||||||||||||||||||
| Daimler AG 1.400%, due 01/12/24 |
(1.000 | %) | Quarterly | 12/20/24 | MSCS | 0.352 | % | EUR | 11,300,000 | $ | (99,613 | ) | $ | (49,450 | ) | $ | (50,163 | ) | ||||||||||||||||
|
|
|
|
|
|
|
|||||||||||||||||||||||||||||
See accompanying notes to financial statements.
BHFTII-25
Brighthouse Funds Trust II
Western Asset Management Strategic Bond Opportunities Portfolio
Schedule of Investments as of December 31, 2023
OTC Credit Default Swaps on Corporate Issues—Sell Protection (d)
| Reference Obligation |
Fixed Deal Receive Rate |
Payment Frequency |
Maturity Date |
Counterparty |
Implied Credit Spread at December 31, 2023 (b) |
Notional Amount (c) |
Market Value |
Upfront Premium Paid/(Received) |
Unrealized Appreciation/ (Depreciation) |
|||||||||||||||||||||||||
| Volkswagen International Finance NV 5.547%, due 11/16/24 |
1.000 | % | Quarterly | 12/20/24 | MSCS | 0.888 | % | EUR | 11,300,000 | $ | 67,117 | $ | 25,919 | $ | 41,198 | |||||||||||||||||||
|
|
|
|
|
|
|
|||||||||||||||||||||||||||||
| (a) | If the Portfolio is a buyer of protection and a credit event occurs, as defined under the terms of that particular swap agreement, the Portfolio will either (i) receive from the seller of protection an amount equal to the notional amount of the swap and deliver the referenced obligation or underlying securities comprising the referenced index or (ii) receive a net settlement amount in the form of cash or securities equal to the notional amount of the swap less the recovery value of the referenced obligation or underlying securities comprising the referenced index. | |||
| (b) | Implied credit spreads, represented in absolute terms, utilized in determining the market value of credit default swap agreements on corporate issues or indices as of period end serve as an indicator of the current status of the payment/performance risk and represent the likelihood or risk of default for the credit derivative. The implied credit spread of a particular referenced entity reflects the cost of buying/selling protection and may include upfront payments required to be made to enter into the agreement. Wider credit spreads represent a deterioration of the referenced entity’s credit soundness and a greater likelihood or risk of default or other credit event occurring as defined under the terms of the agreement. A credit spread identified as “Defaulted” indicates a credit event has occurred for the referenced entity or obligation. | |||
| (c) | The maximum potential amount of future undiscounted payments that the Portfolio could be required to make under a credit default swap contract would be the notional amount of the contract. These potential amounts would be partially offset by any recovery values of the referenced debt obligation or net amounts received from the settlement of purchased protection credit default swap contracts entered into by the Portfolio for the same referenced debt obligation. | |||
| (d) | If the Portfolio is a seller of protection and a credit event occurs, as defined under the terms of that particular swap agreement, the Portfolio will either (i) pay to the buyer of protection an amount equal to the notional amount of the swap and take delivery of the referenced obligation or underlying securities comprising the referenced index or (ii) pay a net settlement amount in the form of cash or securities equal to the notional amount of the swap less the recovery value of the referenced obligation or underlying securities comprising the referenced index. | |||
| (1) | There was no upfront premium paid or (received) therefore, Market Value equals Unrealized Appreciation/(Depreciation). | |||
Glossary of Abbreviations
Counterparties
| (BNP)— | BNP Paribas SA | |||
| (BOA)— | Bank of America NA | |||
| (CBNA)— | Citibank NA | |||
| (GSBU)— | Goldman Sachs Bank USA | |||
| (JPMC)— | JPMorgan Chase Bank NA | |||
| (MSCS)— | Morgan Stanley Capital Services LLC | |||
Currencies
| (AUD)— | Australian Dollar | |||
| (BRL)— | Brazilian Real | |||
| (CAD)— | Canadian Dollar | |||
| (CHF)— | Swiss Franc | |||
| (CNH)— | Chinese Renminbi | |||
| (EUR)— | Euro | |||
| (GBP)— | British Pound | |||
| (IDR)— | Indonesian Rupiah | |||
| (INR)— | Indian Rupee | |||
| (JMD)— | Jamaican Dollar | |||
| (JPY)— | Japanese Yen | |||
| (MXN)— | Mexican Peso | |||
| (NOK)— | Norwegian Krone | |||
| (NZD)— | New Zealand Dollar | |||
| (USD)— | United States Dollar | |||
| (UYU)— | Uruguayan Peso | |||
Index Abbreviations
| (CDI)— | Brazil Interbank Deposit Rate | |||
| (CDX.NA.HY)— | Markit North America High Yield CDS Index | |||
| (EURIBOR)— | Euro InterBank Offered Rate | |||
| (H15)— | U.S. Treasury Yield Curve Rate T-Note Constant Maturity Index | |||
| (LIBOR)— | London Interbank Offered Rate | |||
| (MTA)— | Monthly Treasury Average Index | |||
| (OBFR)— | U.S. Overnight Bank Funding Rate | |||
| (PRIME)— | U.S. Federal Reserve Prime Rate | |||
| (SOFR)— | Secured Overnight Financing Rate | |||
| (SOFR30A)— | Secured Overnight Financing Rate 30-Day Average | |||
| (SONIA)— | Sterling Overnight Index Average Deposit Rate | |||
| (TIIE)— | Mexican Interbank Equilibrium Interest Rate | |||
| (TSFR)— | Term Secured Financing Rate | |||
| (UKG) — | U.K. Government Bond | |||
Other Abbreviations
| (CLO)— | Collateralized Loan Obligation | |||
| (DAC)— | Designated Activity Company | |||
| (ICE)— | Intercontinental Exchange, Inc. | |||
| (REMIC)— | Real Estate Mortgage Investment Conduit | |||
| (STACR)— | Structured Agency Credit Risk | |||
See accompanying notes to financial statements.
BHFTII-26
Brighthouse Funds Trust II
Western Asset Management Strategic Bond Opportunities Portfolio
Schedule of Investments as of December 31, 2023
Fair Value Hierarchy
Accounting principles generally accepted in the United States of America (“GAAP”) define fair market value as the price that the Portfolio would receive to sell an asset or pay to transfer a liability in an orderly transaction between market participants at the measurement date. It establishes a fair value hierarchy that prioritizes inputs to valuation methods and requires disclosure of the fair value hierarchy, separately for each major category of assets and liabilities, that segregates fair value measurements into three levels. Levels 1, 2 and 3 of the fair value hierarchy are defined as follows:
Level 1 - unadjusted quoted prices in active markets for identical investments
Level 2 - other significant observable inputs (including, but not limited to, quoted prices for similar assets or liabilities in markets that are either active or inactive; inputs other than quoted prices that are observable such as interest rates, yield curves, volatilities, prepayment speeds, loss severities, credit risks, default rates, or other market corroborated inputs)
Level 3 - significant unobservable inputs based on the best information available in the circumstances, to the extent observable inputs are unavailable (including the Portfolio’s own assumptions used in determining the fair value of investments and derivative financial instruments)
The inputs or methodologies used for valuing investments are not necessarily an indication of the risk associated with investing in them. Changes to the inputs or methodologies used may result in transfers between levels. A reconciliation of Level 3 securities, if any, will be disclosed following the fair value hierarchy table. For more information about the Portfolio’s policy regarding the valuation of investments, please refer to the Notes to Financial Statements.
The following table summarizes the fair value hierarchy of the Portfolio’s investments as of December 31, 2023:
| Description | Level 1 | Level 2 | Level 3 | Total | ||||||||||||
| Corporate Bonds & Notes |
| |||||||||||||||
| Aerospace/Defense |
$ | — | $ | 30,994,730 | $ | — | $ | 30,994,730 | ||||||||
| Agriculture |
— | 7,100,072 | — | 7,100,072 | ||||||||||||
| Airlines |
— | 37,424,713 | — | 37,424,713 | ||||||||||||
| Auto Manufacturers |
— | 37,994,573 | — | 37,994,573 | ||||||||||||
| Auto Parts & Equipment |
— | 19,879,240 | — | 19,879,240 | ||||||||||||
| Banks |
— | 104,902,703 | — | 104,902,703 | ||||||||||||
| Biotechnology |
— | 4,920,188 | — | 4,920,188 | ||||||||||||
| Building Materials |
— | 10,419,449 | — | 10,419,449 | ||||||||||||
| Chemicals |
— | 1,625,256 | — | 1,625,256 | ||||||||||||
| Coal |
— | 1,799,695 | — | 1,799,695 | ||||||||||||
| Commercial Services |
— | 55,556,463 | — | 55,556,463 | ||||||||||||
| Computers |
— | 8,049,284 | — | 8,049,284 | ||||||||||||
| Distribution/Wholesale |
— | 16,006,831 | — | 16,006,831 | ||||||||||||
| Diversified Financial Services |
— | 56,495,310 | 4,884,588 | 61,379,898 | ||||||||||||
| Electric |
— | 15,750,157 | — | 15,750,157 | ||||||||||||
| Energy-Alternate Sources |
— | 4,443,736 | — | 4,443,736 | ||||||||||||
| Engineering & Construction |
— | 16,827,293 | — | 16,827,293 | ||||||||||||
| Entertainment |
— | 22,961,163 | — | 22,961,163 | ||||||||||||
| Environmental Control |
— | 13,164,191 | — | 13,164,191 | ||||||||||||
| Food |
— | 3,017,092 | — | 3,017,092 | ||||||||||||
| Food Service |
— | 1,100,750 | — | 1,100,750 | ||||||||||||
| Forest Products & Paper |
— | 3,708,849 | — | 3,708,849 | ||||||||||||
| Healthcare-Products |
— | 6,315,262 | — | 6,315,262 | ||||||||||||
| Healthcare-Services |
— | 29,652,759 | — | 29,652,759 | ||||||||||||
| Home Builders |
— | 6,209,066 | — | 6,209,066 | ||||||||||||
| Housewares |
— | 4,290,017 | — | 4,290,017 | ||||||||||||
| Insurance |
— | 22,973,942 | — | 22,973,942 | ||||||||||||
| Internet |
— | 15,339,470 | — | 15,339,470 | ||||||||||||
| Iron/Steel |
— | 4,353,689 | — | 4,353,689 | ||||||||||||
| Leisure Time |
— | 45,000,491 | — | 45,000,491 | ||||||||||||
| Lodging |
— | 30,283,975 | — | 30,283,975 | ||||||||||||
| Machinery-Construction & Mining |
— | 3,856,082 | — | 3,856,082 | ||||||||||||
| Media |
— | 62,352,672 | — | 62,352,672 | ||||||||||||
| Metal Fabricate/Hardware |
— | 8,475,658 | — | 8,475,658 | ||||||||||||
| Mining |
— | 43,385,882 | 0 | 43,385,882 | ||||||||||||
| Multi-National |
— | 10,752,281 | — | 10,752,281 | ||||||||||||
| Office/Business Equipment |
— | 1,472,176 | — | 1,472,176 | ||||||||||||
| Oil & Gas |
— | 142,740,529 | — | 142,740,529 | ||||||||||||
| Packaging & Containers |
— | 9,853,721 | — | 9,853,721 | ||||||||||||
| Pharmaceuticals |
— | 29,960,310 | — | 29,960,310 | ||||||||||||
| Pipelines |
— | 81,101,167 | — | 81,101,167 | ||||||||||||
See accompanying notes to financial statements.
BHFTII-27
Brighthouse Funds Trust II
Western Asset Management Strategic Bond Opportunities Portfolio
Schedule of Investments as of December 31, 2023
Fair Value Hierarchy—(Continued)
| Description | Level 1 | Level 2 | Level 3 | Total | ||||||||||||
| Real Estate |
$ | — | $ | 4,612,240 | $ | — | $ | 4,612,240 | ||||||||
| Real Estate Investment Trusts |
— | 5,724,708 | — | 5,724,708 | ||||||||||||
| Retail |
— | 34,045,969 | — | 34,045,969 | ||||||||||||
| Software |
— | 19,964,716 | — | 19,964,716 | ||||||||||||
| Telecommunications |
— | 23,093,225 | — | 23,093,225 | ||||||||||||
| Transportation |
— | 8,412,862 | — | 8,412,862 | ||||||||||||
| Total Corporate Bonds & Notes |
— | 1,128,364,607 | 4,884,588 | 1,133,249,195 | ||||||||||||
| Total Floating Rate Loans (Less Unfunded Loan Commitments of $493,333)* |
— | 303,122,557 | — | 303,122,557 | ||||||||||||
| Total Asset-Backed Securities* |
— | 213,559,731 | — | 213,559,731 | ||||||||||||
| Total Mortgage-Backed Securities* |
— | 208,008,348 | — | 208,008,348 | ||||||||||||
| Total U.S. Treasury & Government Agencies* |
— | 156,580,726 | — | 156,580,726 | ||||||||||||
| Total Foreign Government* |
— | 80,409,433 | — | 80,409,433 | ||||||||||||
| Convertible Preferred Stocks |
| |||||||||||||||
| Banks |
5,936,253 | — | — | 5,936,253 | ||||||||||||
| Pipelines |
760,794 | — | 5,870,417 | 6,631,211 | ||||||||||||
| Total Convertible Preferred Stocks |
6,697,047 | — | 5,870,417 | 12,567,464 | ||||||||||||
| Total Convertible Bonds* |
— | 10,195,768 | — | 10,195,768 | ||||||||||||
| Common Stocks |
| |||||||||||||||
| Automobile Components |
56,343 | — | — | 56,343 | ||||||||||||
| Chemicals |
2,184 | — | — | 2,184 | ||||||||||||
| Media |
99,417 | — | — | 99,417 | ||||||||||||
| Oil, Gas & Consumable Fuels |
1,199,423 | — | 27,991 | 1,227,414 | ||||||||||||
| Total Common Stocks |
1,357,367 | — | 27,991 | 1,385,358 | ||||||||||||
| Total Municipals* |
— | 258,267 | — | 258,267 | ||||||||||||
| Total Escrow Shares* |
— | — | 0 | 0 | ||||||||||||
| Total Short-Term Investment* |
— | 15,251,446 | — | 15,251,446 | ||||||||||||
| Securities Lending Reinvestments |
| |||||||||||||||
| Certificates of Deposit |
— | 72,292,101 | — | 72,292,101 | ||||||||||||
| Commercial Paper |
— | 15,924,012 | — | 15,924,012 | ||||||||||||
| Repurchase Agreements |
— | 204,437,966 | — | 204,437,966 | ||||||||||||
| Time Deposits |
— | 38,000,000 | — | 38,000,000 | ||||||||||||
| Mutual Funds |
16,000,000 | — | — | 16,000,000 | ||||||||||||
| Total Securities Lending Reinvestments |
16,000,000 | 330,654,079 | — | 346,654,079 | ||||||||||||
| Purchased Options |
| |||||||||||||||
| Foreign Currency Options at Value |
— | 1,390,478 | — | 1,390,478 | ||||||||||||
| Options on Exchange-Traded Futures Contracts at Value |
240,536 | — | — | 240,536 | ||||||||||||
| Total Purchased Options |
240,536 | 1,390,478 | — | 1,631,014 | ||||||||||||
| Total Net Investments |
$ | 24,294,950 | $ | 2,447,795,440 | $ | 10,782,996 | $ | 2,482,873,386 | ||||||||
| Collateral for Securities Loaned (Liability) |
$ | — | $ | (346,426,548 | ) | $ | — | $ | (346,426,548 | ) | ||||||
| Forward Contracts |
| |||||||||||||||
| Forward Foreign Currency Exchange Contracts (Unrealized Appreciation) |
$ | — | $ | 9,282,834 | $ | — | $ | 9,282,834 | ||||||||
| Forward Foreign Currency Exchange Contracts (Unrealized Depreciation) |
— | (8,154,479 | ) | — | (8,154,479 | ) | ||||||||||
| Total Forward Contracts |
$ | — | $ | 1,128,355 | $ | — | $ | 1,128,355 | ||||||||
| Futures Contracts |
| |||||||||||||||
| Futures Contracts (Unrealized Appreciation) |
$ | 42,164,008 | $ | — | $ | — | $ | 42,164,008 | ||||||||
| Futures Contracts (Unrealized Depreciation) |
(848,255 | ) | — | — | (848,255 | ) | ||||||||||
| Total Futures Contracts |
$ | 41,315,753 | $ | — | $ | — | $ | 41,315,753 | ||||||||
| Written Options |
| |||||||||||||||
| Foreign Currency Options at Value |
$ | — | $ | (451,444 | ) | $ | — | $ | (451,444 | ) | ||||||
| Options on Exchange-Traded Futures Contracts at Value |
(364,418 | ) | — | — | (364,418 | ) | ||||||||||
| Total Written Options |
$ | (364,418 | ) | $ | (451,444 | ) | $ | — | $ | (815,862 | ) | |||||
See accompanying notes to financial statements.
BHFTII-28
Brighthouse Funds Trust II
Western Asset Management Strategic Bond Opportunities Portfolio
Schedule of Investments as of December 31, 2023
Fair Value Hierarchy—(Continued)
| Description | Level 1 | Level 2 | Level 3 | Total | ||||||||||||
| Centrally Cleared Swap Contracts |
| |||||||||||||||
| Centrally Cleared Swap Contracts (Unrealized Appreciation) |
$ | — | $ | 1,839,478 | $ | — | $ | 1,839,478 | ||||||||
| Centrally Cleared Swap Contracts (Unrealized Depreciation) |
— | (7,367,269 | ) | — | (7,367,269 | ) | ||||||||||
| Total Centrally Cleared Swap Contracts |
$ | — | $ | (5,527,791 | ) | $ | — | $ | (5,527,791 | ) | ||||||
| OTC Swap Contracts |
| |||||||||||||||
| OTC Swap Contracts at Value (Assets) |
$ | — | $ | 208,854 | $ | — | $ | 208,854 | ||||||||
| OTC Swap Contracts at Value (Liabilities) |
— | (99,613 | ) | — | (99,613 | ) | ||||||||||
| Total OTC Swap Contracts |
$ | — | $ | 109,241 | $ | — | $ | 109,241 | ||||||||
| * | See Schedule of Investments for additional detailed categorizations. | |||
Level 3 investments at the beginning and/or end of the period in relation to net assets were not significant and accordingly, a reconciliation of Level 3 assets for the year ended December 31, 2023 is not presented.
During the year ended December 31, 2023, transfers into Level 3 in the amount of $16,712,986 were due to the cessation of a vendor or broker providing prices based on market indications which resulted in a lack of significant observable inputs.
See accompanying notes to financial statements.
BHFTII-29
Brighthouse Funds Trust II
Western Asset Management Strategic Bond Opportunities Portfolio
Statement of Assets and Liabilities
December 31, 2023
| Assets |
||||
| Investments at value (a) (b) (c) |
$ | 2,482,873,386 | ||
| Cash |
745,272 | |||
| Cash denominated in foreign currencies (d) |
13,049,596 | |||
| Cash collateral (e) |
38,912,108 | |||
| OTC swap contracts at market value (f) |
208,854 | |||
| Unrealized appreciation on forward foreign currency exchange contracts |
9,282,834 | |||
| Receivable for: |
||||
| Investments sold |
7,309,982 | |||
| Fund shares sold |
622,114 | |||
| Interest |
30,281,518 | |||
| Variation margin on futures contracts |
4,912,242 | |||
| Interest on OTC swap contracts |
4,204 | |||
| Variation margin on centrally cleared swap contracts |
163,212 | |||
| Prepaid expenses |
8,244 | |||
|
|
|
|||
| Total Assets |
2,588,373,566 | |||
| Liabilities |
||||
| Written options at value (g) |
815,862 | |||
| OTC swap contracts at market value (h) |
99,613 | |||
| Unrealized depreciation on forward foreign currency exchange contracts |
8,154,479 | |||
| Collateral for securities loaned |
346,426,548 | |||
| Cash collateral for OTC option contacts |
950,000 | |||
| Payables for: |
||||
| Investments purchased |
21,882,276 | |||
| TBA securities purchased |
2,172,164 | |||
| Fund shares redeemed |
644,028 | |||
| Premium on purchased options |
240,217 | |||
| Interest on OTC swap contracts |
381 | |||
| Accrued Expenses: |
||||
| Management fees |
967,444 | |||
| Distribution and service fees |
163,119 | |||
| Deferred trustees’ fees |
306,049 | |||
| Other expenses |
296,806 | |||
|
|
|
|||
| Total Liabilities |
383,118,986 | |||
|
|
|
|||
| Net Assets |
$ | 2,205,254,580 | ||
|
|
|
|||
| Net Assets Consist of: | ||||
| Paid in surplus |
$ | 2,701,327,879 | ||
| Distributable earnings (Accumulated losses) |
(496,073,299 | ) | ||
|
|
|
|||
| Net Assets |
$ | 2,205,254,580 | ||
|
|
|
|||
| Net Assets |
||||
| Class A |
$ | 1,367,933,887 | ||
| Class B |
698,727,776 | |||
| Class E |
138,592,917 | |||
| Capital Shares Outstanding* |
||||
| Class A |
124,622,557 | |||
| Class B |
64,321,833 | |||
| Class E |
12,701,589 | |||
| Net Asset Value, Offering Price and Redemption Price Per Share |
||||
| Class A |
$ | 10.98 | ||
| Class B |
10.86 | |||
| Class E |
10.91 |
| * | The Portfolio is authorized to issue an unlimited number of shares. | |||
| (a) | Identified cost of investments was $2,584,691,401. | |||
| (b) | Includes securities loaned at value of $376,565,675. | |||
| (c) | Investments at value is net of unfunded loan commitments of $493,333. | |||
| (d) | Identified cost of cash denominated in foreign currencies was $12,708,880 | |||
| (e) | Includes collateral of $18,246,908 for futures contracts, $240,000 for OTC option contracts and OTC swap contracts, and $20,425,200 for centrally cleared swap contracts. | |||
| (f) | Net premium paid on OTC swap contracts was $25,919. | |||
| (g) | Premiums received on written options were $744,311. | |||
| (h) | Net premium received on OTC swap contracts was $49,450. | |||
Statement of Operations
Year Ended December 31, 2023
| Investment Income |
| |||
| Dividends |
$ | 1,354,511 | ||
| Interest (a) |
170,018,973 | |||
| Securities lending income |
1,044,041 | |||
|
|
|
|||
| Total investment income |
172,417,525 | |||
| Expenses |
||||
| Management fees |
12,569,327 | |||
| Administration fees |
107,710 | |||
| Custodian and accounting fees |
300,005 | |||
| Distribution and service fees—Class B |
1,719,818 | |||
| Distribution and service fees—Class E |
209,742 | |||
| Audit and tax services |
102,621 | |||
| Legal |
49,341 | |||
| Trustees’ fees and expenses |
46,220 | |||
| Shareholder reporting |
118,438 | |||
| Insurance |
20,710 | |||
| Miscellaneous |
35,353 | |||
|
|
|
|||
| Total expenses |
15,279,285 | |||
| Less management fee waiver |
(1,045,817 | ) | ||
|
|
|
|||
| Net expenses |
14,233,468 | |||
|
|
|
|||
| Net Investment Income |
158,184,057 | |||
|
|
|
|||
| Net Realized and Unrealized Gain (Loss) |
||||
| Net realized gain (loss) on: | ||||
| Investments |
(104,986,676 | ) | ||
| Purchased options |
(12,467,915 | ) | ||
| Futures contracts |
(87,794,064 | ) | ||
| Written options |
4,394,091 | |||
| Swap contracts |
(2,583,647 | ) | ||
| Foreign currency transactions |
2,753,131 | |||
| Forward foreign currency transactions |
3,741,339 | |||
|
|
|
|||
| Net realized gain (loss) |
(196,943,741 | ) | ||
|
|
|
|||
| Net change in unrealized appreciation (depreciation) on: | ||||
| Investments |
172,129,023 | |||
| Purchased options |
2,016,462 | |||
| Futures contracts |
64,776,942 | |||
| Written options |
(538,622 | ) | ||
| Swap contracts |
617,741 | |||
| Foreign currency transactions |
(311,508 | ) | ||
| Forward foreign currency transactions |
(3,195,795 | ) | ||
|
|
|
|||
| Net change in unrealized appreciation (depreciation) |
235,494,243 | |||
|
|
|
|||
| Net realized and unrealized gain (loss) |
38,550,502 | |||
|
|
|
|||
| Net Increase (Decrease) in Net Assets From Operations |
$ | 196,734,559 | ||
|
|
|
|||
| (a) | Net of foreign withholding taxes of $135,748. | |||
See accompanying notes to financial statements.
BHFTII-30
Brighthouse Funds Trust II
Western Asset Management Strategic Bond Opportunities Portfolio
Statements of Changes in Net Assets
| Year Ended December 31, 2023 |
Year Ended December 31, 2022 |
|||||||
| Increase (Decrease) in Net Assets: |
||||||||
| From Operations |
||||||||
| Net investment income (loss) |
$ | 158,184,057 | $ | 136,427,170 | ||||
| Net realized gain (loss) |
(196,943,741 | ) | (261,837,234 | ) | ||||
| Net change in unrealized appreciation (depreciation) |
235,494,243 | (363,442,900 | ) | |||||
|
|
|
|
|
|||||
| Increase (decrease) in net assets from operations |
196,734,559 | (488,852,964 | ) | |||||
|
|
|
|
|
|||||
| From Distributions to Shareholders |
||||||||
| Class A |
(90,318,027 | ) | (93,994,936 | ) | ||||
| Class B |
(43,728,800 | ) | (44,422,317 | ) | ||||
| Class E |
(9,014,042 | ) | (9,671,952 | ) | ||||
|
|
|
|
|
|||||
| Total distributions |
(143,060,869 | ) | (148,089,205 | ) | ||||
|
|
|
|
|
|||||
| Increase (decrease) in net assets from capital share transactions |
(68,706,337 | ) | (188,743,143 | ) | ||||
|
|
|
|
|
|||||
| Total increase (decrease) in net assets |
(15,032,647 | ) | (825,685,312 | ) | ||||
| Net Assets |
||||||||
| Beginning of period |
2,220,287,227 | 3,045,972,539 | ||||||
|
|
|
|
|
|||||
| End of period |
$ | 2,205,254,580 | $ | 2,220,287,227 | ||||
|
|
|
|
|
|||||
Other Information:
Capital Shares
Transactions in capital shares were as follows:
| Year Ended December 31, 2023 |
Year Ended December 31, 2022 |
|||||||||||||||
| Shares | Value | Shares | Value | |||||||||||||
| Class A |
||||||||||||||||
| Sales |
2,435,159 | $ | 25,907,780 | 1,315,656 | $ | 15,365,983 | ||||||||||
| Reinvestments |
8,701,159 | 90,318,027 | 8,568,363 | 93,994,936 | ||||||||||||
| Redemptions |
(15,878,941 | ) | (169,015,191 | ) | (21,420,235 | ) | (255,304,453 | ) | ||||||||
|
|
|
|
|
|
|
|
|
|||||||||
| Net increase (decrease) |
(4,742,623 | ) | $ | (52,789,384 | ) | (11,536,216 | ) | $ | (145,943,534 | ) | ||||||
|
|
|
|
|
|
|
|
|
|||||||||
| Class B |
||||||||||||||||
| Sales |
3,022,691 | $ | 31,935,935 | 2,908,805 | $ | 34,162,427 | ||||||||||
| Reinvestments |
4,249,640 | 43,728,800 | 4,082,933 | 44,422,317 | ||||||||||||
| Redemptions |
(7,898,744 | ) | (83,486,126 | ) | (9,234,182 | ) | (108,086,123 | ) | ||||||||
|
|
|
|
|
|
|
|
|
|||||||||
| Net increase (decrease) |
(626,413 | ) | $ | (7,821,391 | ) | (2,242,444 | ) | $ | (29,501,379 | ) | ||||||
|
|
|
|
|
|
|
|
|
|||||||||
| Class E |
||||||||||||||||
| Sales |
422,658 | $ | 4,487,539 | 607,209 | $ | 7,561,747 | ||||||||||
| Reinvestments |
872,608 | 9,014,042 | 885,710 | 9,671,952 | ||||||||||||
| Redemptions |
(2,030,606 | ) | (21,597,143 | ) | (2,587,227 | ) | (30,531,929 | ) | ||||||||
|
|
|
|
|
|
|
|
|
|||||||||
| Net increase (decrease) |
(735,340 | ) | $ | (8,095,562 | ) | (1,094,308 | ) | $ | (13,298,230 | ) | ||||||
|
|
|
|
|
|
|
|
|
|||||||||
| Increase (decrease) derived from capital shares transactions |
$ | (68,706,337 | ) | $ | (188,743,143 | ) | ||||||||||
|
|
|
|
|
|||||||||||||
See accompanying notes to financial statements.
BHFTII-31
Brighthouse Funds Trust II
Western Asset Management Strategic Bond Opportunities Portfolio
Financial Highlights
| Selected per share data | ||||||||||||||||||||
| Class A | ||||||||||||||||||||
| Year Ended December 31, | ||||||||||||||||||||
| 2023 | 2022 | 2021 | 2020 | 2019 | ||||||||||||||||
| Net Asset Value, Beginning of Period |
$ | 10.72 | $ | 13.73 | $ | 13.87 | $ | 13.81 | $ | 12.68 | ||||||||||
|
|
|
|
|
|
|
|
|
|
|
|||||||||||
| Income (Loss) from Investment Operations |
||||||||||||||||||||
| Net investment income (loss) (a) |
0.78 | 0.65 | 0.62 | 0.68 | 0.71 | |||||||||||||||
| Net realized and unrealized gain (loss) |
0.21 | (2.93 | ) | (0.24 | ) | 0.20 | 1.09 | |||||||||||||
|
|
|
|
|
|
|
|
|
|
|
|||||||||||
| Total income (loss) from investment operations |
0.99 | (2.28 | ) | 0.38 | 0.88 | 1.80 | ||||||||||||||
|
|
|
|
|
|
|
|
|
|
|
|||||||||||
| Less Distributions |
||||||||||||||||||||
| Distributions from net investment income |
(0.73 | ) | (0.73 | ) | (0.52 | ) | (0.82 | ) | (0.67 | ) | ||||||||||
|
|
|
|
|
|
|
|
|
|
|
|||||||||||
| Total distributions |
(0.73 | ) | (0.73 | ) | (0.52 | ) | (0.82 | ) | (0.67 | ) | ||||||||||
|
|
|
|
|
|
|
|
|
|
|
|||||||||||
| Net Asset Value, End of Period |
$ | 10.98 | $ | 10.72 | $ | 13.73 | $ | 13.87 | $ | 13.81 | ||||||||||
|
|
|
|
|
|
|
|
|
|
|
|||||||||||
| Total Return (%) (b) |
9.64 | (c) | (16.66 | ) | 2.82 | 6.92 | 14.49 | |||||||||||||
| Ratios/Supplemental Data |
||||||||||||||||||||
| Gross ratio of expenses to average net assets (%) |
0.61 | 0.60 | 0.60 | 0.60 | 0.60 | |||||||||||||||
| Net ratio of expenses to average net assets (%) (d) |
0.56 | 0.55 | 0.54 | 0.55 | 0.54 | |||||||||||||||
| Ratio of net investment income (loss) to average net assets (%) |
7.29 | 5.51 | 4.55 | 5.17 | 5.32 | |||||||||||||||
| Portfolio turnover rate (%) |
47 | (e) | 28 | 69 | (e) | 66 | (e) | 58 | (e) | |||||||||||
| Net assets, end of period (in millions) |
$ | 1,367.9 | $ | 1,387.4 | $ | 1,934.4 | $ | 1,971.5 | $ | 2,007.9 | ||||||||||
| Class B | ||||||||||||||||||||
| Year Ended December 31, | ||||||||||||||||||||
| 2023 | 2022 | 2021 | 2020 | 2019 | ||||||||||||||||
| Net Asset Value, Beginning of Period |
$ | 10.62 | $ | 13.59 | $ | 13.73 | $ | 13.69 | $ | 12.57 | ||||||||||
|
|
|
|
|
|
|
|
|
|
|
|||||||||||
| Income (Loss) from Investment Operations |
||||||||||||||||||||
| Net investment income (loss) (a) |
0.75 | 0.61 | 0.58 | 0.64 | 0.67 | |||||||||||||||
| Net realized and unrealized gain (loss) |
0.19 | (2.89 | ) | (0.23 | ) | 0.18 | 1.08 | |||||||||||||
|
|
|
|
|
|
|
|
|
|
|
|||||||||||
| Total income (loss) from investment operations |
0.94 | (2.28 | ) | 0.35 | 0.82 | 1.75 | ||||||||||||||
|
|
|
|
|
|
|
|
|
|
|
|||||||||||
| Less Distributions |
||||||||||||||||||||
| Distributions from net investment income |
(0.70 | ) | (0.69 | ) | (0.49 | ) | (0.78 | ) | (0.63 | ) | ||||||||||
|
|
|
|
|
|
|
|
|
|
|
|||||||||||
| Total distributions |
(0.70 | ) | (0.69 | ) | (0.49 | ) | (0.78 | ) | (0.63 | ) | ||||||||||
|
|
|
|
|
|
|
|
|
|
|
|||||||||||
| Net Asset Value, End of Period |
$ | 10.86 | $ | 10.62 | $ | 13.59 | $ | 13.73 | $ | 13.69 | ||||||||||
|
|
|
|
|
|
|
|
|
|
|
|||||||||||
| Total Return (%) (b) |
9.22 | (16.93 | ) | 2.61 | 6.61 | 14.23 | ||||||||||||||
| Ratios/Supplemental Data |
||||||||||||||||||||
| Gross ratio of expenses to average net assets (%) |
0.86 | 0.85 | 0.85 | 0.85 | 0.85 | |||||||||||||||
| Net ratio of expenses to average net assets (%) (d) |
0.81 | 0.80 | 0.79 | 0.80 | 0.79 | |||||||||||||||
| Ratio of net investment income (loss) to average net assets (%) |
7.05 | 5.28 | 4.30 | 4.92 | 5.07 | |||||||||||||||
| Portfolio turnover rate (%) |
47 | (e) | 28 | 69 | (e) | 66 | (e) | 58 | (e) | |||||||||||
| Net assets, end of period (in millions) |
$ | 698.7 | $ | 689.6 | $ | 913.2 | $ | 879.8 | $ | 852.0 | ||||||||||
Please see following page for Financial Highlights footnote legend.
See accompanying notes to financial statements.
BHFTII-32
Brighthouse Funds Trust II
Western Asset Management Strategic Bond Opportunities Portfolio
Financial Highlights
| Selected per share data | ||||||||||||||||||||
| Class E | ||||||||||||||||||||
| Year Ended December 31, | ||||||||||||||||||||
| 2023 | 2022 | 2021 | 2020 | 2019 | ||||||||||||||||
| Net Asset Value, Beginning of Period |
$ | 10.66 | $ | 13.65 | $ | 13.79 | $ | 13.73 | $ | 12.61 | ||||||||||
|
|
|
|
|
|
|
|
|
|
|
|||||||||||
| Income (Loss) from Investment Operations |
||||||||||||||||||||
| Net investment income (loss) (a) |
0.76 | 0.63 | 0.60 | 0.66 | 0.69 | |||||||||||||||
| Net realized and unrealized gain (loss) |
0.20 | (2.91 | ) | (0.24 | ) | 0.19 | 1.08 | |||||||||||||
|
|
|
|
|
|
|
|
|
|
|
|||||||||||
| Total income (loss) from investment operations |
0.96 | (2.28 | ) | 0.36 | 0.85 | 1.77 | ||||||||||||||
|
|
|
|
|
|
|
|
|
|
|
|||||||||||
| Less Distributions |
||||||||||||||||||||
| Distributions from net investment income |
(0.71 | ) | (0.71 | ) | (0.50 | ) | (0.79 | ) | (0.65 | ) | ||||||||||
|
|
|
|
|
|
|
|
|
|
|
|||||||||||
| Total distributions |
(0.71 | ) | (0.71 | ) | (0.50 | ) | (0.79 | ) | (0.65 | ) | ||||||||||
|
|
|
|
|
|
|
|
|
|
|
|||||||||||
| Net Asset Value, End of Period |
$ | 10.91 | $ | 10.66 | $ | 13.65 | $ | 13.79 | $ | 13.73 | ||||||||||
|
|
|
|
|
|
|
|
|
|
|
|||||||||||
| Total Return (%) (b) |
9.30 | (16.78 | ) | 2.68 | 6.77 | 14.30 | ||||||||||||||
| Ratios/Supplemental Data |
||||||||||||||||||||
| Gross ratio of expenses to average net assets (%) |
0.76 | 0.75 | 0.75 | 0.75 | 0.75 | |||||||||||||||
| Net ratio of expenses to average net assets (%) (d) |
0.71 | 0.70 | 0.69 | 0.70 | 0.69 | |||||||||||||||
| Ratio of net investment income (loss) to average net assets (%) |
7.14 | 5.37 | 4.40 | 5.03 | 5.17 | |||||||||||||||
| Portfolio turnover rate (%) |
47 | (e) | 28 | 69 | (e) | 66 | (e) | 58 | (e) | |||||||||||
| Net assets, end of period (in millions) |
$ | 138.6 | $ | 143.3 | $ | 198.3 | $ | 215.1 | $ | 224.2 | ||||||||||
| (a) | Per share amounts based on average shares outstanding during the period. | |||
| (b) | Total return does not reflect any insurance, sales, separate account or administrative charges of variable annuity or life insurance contracts or any additional expenses that contract owners may bear under their variable contracts. If these charges were included, the returns would be lower. | |||
| (c) | Generally accepted accounting principles may require adjustments to be made to the net assets of the Portfolio at period end for financial reporting purposes, and as such, the net asset values for shareholder transactions and the returns based on those net asset values may differ from the returns reported in the portfolio manager commentary section of this report. | |||
| (d) | Includes the effects of management fee waivers (see Note 6 of the Notes to Financial Statements). | |||
| (e) | Includes mortgage dollar roll and TBA transactions; excluding these transactions the portfolio turnover rates would have been 46%, 69%, 63%, and 52% for the years ended December 31, 2023, 2021, 2020, and 2019, respectively. | |||
See accompanying notes to financial statements.
BHFTII-33
Brighthouse Funds Trust II
Western Asset Management Strategic Bond Opportunities Portfolio
Notes to Financial Statements—December 31, 2023
1. Organization
Brighthouse Funds Trust II (the “Trust”) is organized as a Delaware statutory trust and registered under the Investment Company Act of 1940, as amended (the “1940 Act”), as an open-end management investment company. The Trust, which is managed by Brighthouse Investment Advisers, LLC (“Brighthouse Investment Advisers” or the “Adviser”), currently offers twenty-nine series (the “Portfolios”), each of which operates as a distinct investment vehicle of the Trust. The series included in this report is Western Asset Management Strategic Bond Opportunities Portfolio (the “Portfolio”), which is diversified. Shares of the Portfolio are not offered directly to the general public and are currently available only to separate accounts of insurance companies, including insurance companies affiliated with the Adviser.
The Portfolio has registered and offers three classes of shares: Class A, B and E shares. Shares of each class of the Portfolio represent an equal pro rata interest in the Portfolio and generally give the shareholder the same voting, dividend, liquidation, and other rights. Investment income, realized and unrealized capital gains and losses, the common expenses of the Portfolio, and certain Portfolio-level expense reductions, if any, are allocated on a pro rata basis to each class based on the relative net assets of each class to the net assets of the Portfolio. Each class of shares differs in its respective distribution plan and such distribution expenses are allocated to the corresponding class of shares.
2. Significant Accounting Policies
The preparation of financial statements in conformity with accounting principles generally accepted in the United States of America (“GAAP”) requires management to make estimates and assumptions that affect the reported amounts of assets and liabilities and disclosure of contingent assets and liabilities as of the date of the financial statements and the reported amounts of income and expenses during the reporting period. Actual results could differ from those estimates. In the preparation of these financial statements, management has evaluated events and transactions subsequent to December 31, 2023 through the date the financial statements were issued.
The Portfolio is an investment company and follows the accounting and reporting guidance of the Financial Accounting Standards Board (“FASB”) Accounting Standards Codification Topic 946—Financial Services—Investment Companies. The following is a summary of significant accounting policies consistently followed by the Portfolio in the preparation of its financial statements.
Investment Valuation and Fair Value Measurements - The Portfolio values its investments for purposes of calculating its net asset value (“NAV”) using procedures that allow for a variety of methodologies to be used to value the Portfolio’s investments. The specific methodology used for an investment may vary based on the market data available for a specific investment at the time the Portfolio calculates its NAV or based on other considerations. The procedures also permit a level of judgment to be used in the valuation process.
Debt securities, including corporate, convertible and municipal bonds and notes; obligations of the U.S. Treasury and U.S. government agencies; foreign sovereign issues; and non-U.S. bonds, are generally valued based upon evaluated or composite bid quotations obtained from third-party pricing services and/or brokers and dealers selected by the Adviser (each a “pricing service”). Such pricing services may use matrix pricing, which considers observable inputs including, among other things, issuer details, maturity dates, interest rates, yield curves, rates of prepayment, credit risks/spreads, default rates, reported trades, broker-dealer quotes and quoted prices for similar assets. Short-term obligations with a remaining maturity of sixty days or less may be valued at amortized cost in the absence of market quotes, so long as the amortized cost value of such short-term debt instrument is approximately the same as the fair value of the instrument as determined without the use of amortized cost valuation. Floating rate loans are generally valued based upon an evaluated or composite average of aggregate bid and ask quotations supplied by brokers or dealers, as obtained from the pricing service. Securities that use similar valuation techniques and inputs as described above are generally categorized as Level 2 within the fair value hierarchy.
Mortgage-and asset-backed securities are generally valued based upon evaluated or composite bid quotations obtained from pricing services selected by the Adviser. These securities are usually issued as separate tranches, or classes, of securities within each deal. The pricing models for these securities usually consider tranche-level attributes, current market data, estimated cash flows and market-based yield spreads for each tranche and incorporate deal collateral performance, as available. Mortgage-and asset-backed securities that use similar valuation techniques and inputs as described above are generally categorized as Level 2 within the fair value hierarchy.
Domestic and foreign equity securities, such as common stock, exchange-traded funds, rights, warrants, and preferred stock, that are traded on a securities exchange on a valuation date are generally valued at their last quoted sale price or official closing price on the primary exchange for such security, or, if no sales occurred on that day, at the last reported bid price. Equity securities traded over-the-counter (“OTC”) are generally valued at the last reported bid price. In the event of a major exchange closing during the trading day, the Adviser may use other market information obtained from quotation reporting systems, established market makers, or pricing services in valuing the securities. Valuation adjustments may be applied to certain foreign equity securities that are traded solely on foreign exchanges that close before the time as of which the Portfolio determines its NAV to account for the market
BHFTII-34
Brighthouse Funds Trust II
Western Asset Management Strategic Bond Opportunities Portfolio
Notes to Financial Statements—December 31, 2023—(Continued)
movement between the close of the foreign exchanges and the time as of which the Portfolio determines its NAV. The Portfolio may use a systematic fair valuation model provided by a pricing service to value securities principally traded in these foreign markets to adjust for possible market movements or other changes that may occur between the close of the foreign exchanges and the time as of which the Portfolio determines its NAV. Foreign equity securities valued using these valuation adjustments are generally categorized as Level 2 within the fair value hierarchy. Equity securities that are actively traded, and have no valuation adjustments applied, are categorized as Level 1 within the fair value hierarchy. Other equity securities traded on inactive markets or valued in reference to similar instruments traded on active markets are generally categorized as Level 2 within the fair value hierarchy.
Investments in registered open-end management investment companies are valued at reported NAV per share on the valuation date and are categorized as Level 1 within the fair value hierarchy.
Foreign currency forward contracts are valued through a third-party pricing service by interpolating between forward and spot currency rates in the London foreign exchange markets as of a designated hour on a valuation day. These contracts are generally categorized as Level 2 within the fair value hierarchy.
Options, whether on securities, indices, futures contracts, or otherwise, traded on exchanges are valued at the last sale price available as of the close of business on a valuation day or, if there is no such price available, at the last reported bid price. These types of options are categorized as Level 1 within the fair value hierarchy. Futures contracts that are traded on commodity exchanges are valued at their settlement prices established by the exchanges on which they are traded as of the close of such exchanges and are categorized as Level 1 within the fair value hierarchy.
Options, including options on swaps (“swaptions”) and currencies, and synthetic futures contracts that are traded OTC are generally valued based upon interdealer bid and ask prices or prices provided by pricing service providers who use a series of techniques, including simulation pricing models, to determine the value of the contracts. The pricing models use inputs that are observed from actively quoted markets such as issuer details, indices, spreads, interest rates, yield curves, credit curves, measures of volatility and exchange rates. These contracts are generally categorized as Level 2 within the fair value hierarchy.
Swap contracts (other than centrally cleared swaps listed or traded on a multilateral or trade facility platform) are marked-to-market daily based on quotations and prices supplied by market makers, broker-dealers and other pricing services. Such quotations and prices are derived utilizing observable data, including the underlying reference securities or indices, credit spread quotations and expected default recovery rates determined by the pricing service. These contracts are generally categorized as Level 2 within the fair value hierarchy.
Centrally cleared swaps listed or traded on a multilateral or trade facility platform, such as a registered exchange, are valued at the daily settlement price determined by the respective exchange or a pricing service when the exchange price is not available. For centrally cleared credit default swaps, the clearing facility requires its members to provide actionable price levels across complete term structures. These levels along with external third-party prices are used to produce daily settlement prices. These securities are categorized as Level 2 within the fair value hierarchy. Centrally cleared interest rate swaps are valued using a pricing model that references the underlying rates, including, but not limited to, the overnight index swap rate, the respective interbank offered forward rate or other interest rates, yield curves or credit spreads to produce the daily settlement price. These securities are categorized as Level 2 within the fair value hierarchy.
If no current market quotation is readily available or market value quotations are deemed to be unreliable for an investment, the fair value of the investment will be determined in accordance with procedures. A market quotation is readily available only when that quotation is a quoted price (unadjusted) in active markets for identical investments that the Portfolio can access at the measurement date, provided that a quotation will not be readily available if it is not reliable.
Pursuant to Rule 2a-5 under the 1940 Act, the Board of Trustees (the “Board” or “Trustees” ) of the Trust has designated Brighthouse Investment Advisers, acting through its Valuation Committee (“Committee”), as the Portfolio’s “valuation designee” to perform the Portfolio’s fair value determinations. The Board oversees Brighthouse Investment Advisers in its role as the Valuation Designee and receives reports from Brighthouse Investment Advisers regarding its process and the valuation of the Portfolio’s investments to assist with such oversight.
No single standard for determining the fair value of an investment can be set forth because fair value depends upon the facts and circumstances with respect to each investment. Information relating to any relevant factors may be obtained by the Committee from any appropriate source, including the subadviser of the Portfolio, the Custodian, a pricing service, market maker and/or broker for such security or the issuer. Appropriate methodologies for determining fair value under particular circumstances may include: matrix pricing, a discounted cash flow analysis, comparisons of securities with comparable characteristics, value based on multiples of earnings, discount from market price of similar marketable securities, or a combination of these and other methods.
Foreign Currency Translation - The books and records of the Portfolio are maintained in U.S. dollars. The values of securities, currencies, and other assets and liabilities denominated in currencies other than the U.S. dollar are translated into U.S. dollars based
BHFTII-35
Brighthouse Funds Trust II
Western Asset Management Strategic Bond Opportunities Portfolio
Notes to Financial Statements—December 31, 2023—(Continued)
upon foreign exchange rates prevailing at the end of the period. Purchases and sales of investment securities, income, and expenses are translated on the respective dates of such transactions. Because the values of investment securities are translated at the foreign exchange rates prevailing at the end of the period, that portion of the results of operations arising from changes in exchange rates and that portion of the results of operations reflecting fluctuations arising from changes in market prices of the investment securities are not separated. Such fluctuations are included in the net realized and unrealized gain or loss on investments.
Net realized foreign exchange gains or losses arise from activity in forward foreign currency exchange contracts, sales of foreign currency, currency gains or losses realized between the trade and settlement dates on securities transactions, and the difference between the amounts of dividends, interest, and foreign withholding taxes recorded by the Portfolio and the U.S. dollar-equivalent of the amounts actually received or paid by the Portfolio. Net unrealized foreign exchange gains and losses arise from changes in the value of assets and liabilities, other than investment securities, resulting from changes in foreign exchange rates.
Investment Transactions and Related Investment Income - Portfolio security transactions are recorded on the trade date. Dividend income is recorded on the ex-dividend date or, for certain foreign securities, when notified. Interest income, which includes amortization of premium and accretion of discount on debt securities, is recorded on the accrual basis. Realized gains and losses on investments are determined on the identified cost basis, which is the same basis used for federal income tax purposes. Foreign income and foreign capital gains on some foreign securities may be subject to foreign taxes, which are accrued as applicable. These foreign taxes have been provided for in accordance with the Portfolio’s understanding of the applicable countries’ tax rules and rates.
Dividends and Distributions to Shareholders - The Portfolio records dividends and distributions on the ex-dividend date. Net realized gains from securities transactions (if any) are generally distributed annually to shareholders. The timing and characterization of certain income and capital gains distributions are determined in accordance with federal tax regulations that may differ from GAAP. Permanent book and tax basis differences relating to shareholder distributions will result in reclassification between distributable earnings (accumulated losses) and paid in surplus. These adjustments have no impact on net assets or the results of operations.
Income Taxes - It is the Portfolio’s policy to comply with the requirements of the Internal Revenue Code of 1986, as amended, and regulations thereunder, applicable to regulated investment companies, and to distribute, with respect to each taxable year, all of its taxable income to shareholders. Therefore, no federal income tax provision is required. The Portfolio files U.S. federal tax returns. No income tax returns are currently under examination. The Portfolio’s federal tax returns remain subject to examination by the Internal Revenue Service for three fiscal years after the returns are filed. As of December 31, 2023, the Portfolio had no uncertain tax positions that would require financial statement recognition, derecognition or disclosure.
High-Yield Debt Securities - The Portfolio may invest in high-yield debt securities, or “junk bonds,” which are securities that are rated below “investment grade” or, if not rated, are of equivalent quality. A portfolio with high-yield debt securities generally will be exposed to greater market risk and credit risk than a portfolio that invests only in investment grade debt securities because issuers of high-yield debt securities are generally less secure financially, are more likely to default on their obligations, and their securities are more sensitive to interest rate changes and downturns in the economy. In addition, the secondary market for lower-rated debt securities may not be as liquid as that for more highly rated debt securities. As a result, the Portfolio’s subadviser may find it more difficult to value or sell lower-rated debt securities and may have to sell them at prices significantly lower than the values assigned to them by the Portfolio.
Floating Rate Loans - The Portfolio may invest in loans arranged through private negotiation between one or more financial institutions. The Portfolio’s investment in any such loan may be in the form of a participation in or an assignment of the loan. In connection with purchasing participations, the Portfolio generally will have no right to enforce compliance by the borrower with the terms of the loan agreement relating to the loan, nor any rights of set-off against the borrower. The purchase of assignments will typically result in the Portfolio having a direct contractual relationship with the borrower, and the Portfolio may enforce compliance by the borrower with the terms of the loan agreement. The Portfolio may not benefit directly from any collateral supporting the loan in which it has purchased the participation or assignment.
The Portfolio may invest in multiple series or tranches of a loan, which may have varying terms and carry different associated risks. When the Portfolio purchases assignments, it acquires direct rights against the borrower of the loan. These loans may include participations in bridge loans, which are loans taken out by borrowers for a short period (typically less than one year) pending arrangement of more permanent financing.
The Portfolio will assume the credit risk of both the borrower and the lender that is selling the participation. In the event of the insolvency of the lender selling the participation, the Portfolio may be treated as a general creditor of the lender and may not benefit from any set-off between the lender and the borrower.
Unfunded Loan Commitments - The Portfolio may enter into certain credit agreements, all or a portion of which may be unfunded. The Portfolio is obligated to fund these commitments at the borrower’s discretion. These commitments, if any, are disclosed in the Schedule of Investments. As of December 31, 2023, the Portfolio had open unfunded loan commitments of $493,333. At December 31, 2023, the Portfolio had sufficient cash and/or securities to cover these commitments.
BHFTII-36
Brighthouse Funds Trust II
Western Asset Management Strategic Bond Opportunities Portfolio
Notes to Financial Statements—December 31, 2023—(Continued)
Collateralized Obligations - The Portfolio may invest in collateralized bond obligations (“CBOs”), collateralized loan obligations (“CLOs”), other collateralized debt obligations (“CDOs”), and other similarly structured securities. CDOs, CBOs and CLOs are types of asset-backed securities. A CBO is a trust that is backed by a diversified pool of high risk, below investment grade fixed-income securities. The collateral can be from many types of fixed-income securities such as high yield debt, residential privately issued mortgage-related securities, commercial privately issued mortgage-related securities, trust preferred securities and emerging market debt. A CLO is a trust typically collateralized by a pool of loans that may include, among others, domestic and foreign senior secured loans, senior unsecured loans, and subordinate corporate loans, including loans that may be rated below investment grade or equivalent unrated loans. Other CDOs are trusts backed by other types of assets representing obligations of various parties.
For CDOs, CBOs and CLOs, the cash flow from the trust is split into two or more portions, called tranches, varying in risk and yield. The riskiest portion is typically the “equity” or “first loss” tranche, which bears the bulk of defaults from the bonds or loans in the trust and serves to protect the other, more senior tranches from default in all but the most severe circumstances. Senior tranches are paid from the cash flows from the underlying assets before the junior tranches and equity tranches. Losses are first borne by the equity tranches, next by the junior tranches, and finally by the senior tranches. The risks of an investment in a CBO, CLO or other CDO depend largely on the quality and type of the collateral securities and the class of the instrument in which a Portfolio invests. If some debt instruments go into default and the cash collected by the CBO, CLO or CDO is insufficient to pay all of its investors, those in the lowest, most junior tranches suffer losses first. Since they are partially protected from defaults, senior tranches typically have higher ratings and lower potential yields than their underlying securities, and can be rated investment grade. Despite the protection from the equity tranche, more senior tranches can experience substantial losses due to actual defaults, increased sensitivity to defaults due to collateral default and disappearance of protecting tranches, market anticipation of defaults, as well as aversion to CBO, CLO or other CDO securities as a class.
Mortgage-Related and Other Asset-Backed Securities - The Portfolio may invest in mortgage-related or other asset-backed securities. These securities may include mortgage pass-through securities, collateralized mortgage obligations (“CMOs”), commercial mortgage-backed securities, CMO residuals, stripped mortgage-backed securities (“SMBS”), and other securities that directly or indirectly represent a participation in, or are secured by or payable from, mortgage loans on real property or other receivables. The value of some mortgage- or asset-backed securities may be particularly sensitive to changes in prevailing interest rates. Early repayment of principal on some mortgage-related securities may expose the Portfolio to a lower rate of return upon reinvestment of principal. The value of these securities may fluctuate in response to the market’s perception of the creditworthiness of the issuers. Additionally, although mortgages and mortgage-related securities are generally supported by some form of government or private guarantee and/or insurance, there is no assurance that private guarantors or insurers will meet their obligations.
In one type of SMBS, one class receives all of the interest from the mortgage assets (the interest-only or “IO” class), while the other class will receive all of the principal (the principal-only or “PO” class). Because principal will not be received at the maturity of an IO, adjustments are made to the book value of the security until maturity. These adjustments are netted against payments received for the IOs and the net amount is included in interest income on the Statement of Operations of the Portfolio. Payments received for POs are treated as reductions to the cost and par value of the securities. Details of mortgage-related and other asset-backed securities held by the Portfolio are included in the Portfolio’s Schedule of Investments.
The Portfolio may invest a significant portion of its assets in securities of issuers that hold mortgage- and asset-backed securities and direct investments in securities backed by commercial and residential mortgage loans and other financial assets. The value and related income of these securities are sensitive to changes in economic conditions, including delinquencies and/or defaults, and may be negatively impacted by increased volatility of market prices and periods of illiquidity.
Mortgage Dollar Rolls - The Portfolio may enter into mortgage “dollar rolls” in which a Portfolio sells to-be-announced (“TBA”) mortgage-backed securities for delivery in the current month and simultaneously contracts to repurchase substantially similar (same type, coupon, and maturity) securities on a specified future date. For the duration of the transaction, or roll period, the Portfolio foregoes principal (including prepayments of principal) and interest paid on the securities sold. Dollar rolls are accounted for as purchase and sale transactions; gain or loss is recognized at the commencement of the term of the dollar roll and each time the mortgage-backed security is rolled.
Mortgage dollar roll transactions involve the risk that the market value of the securities that the Portfolio is required to reacquire may be less than the agreed-upon repurchase price of those securities and that the investment performance of securities purchased with proceeds from these transactions does not exceed the income, capital appreciation and gain or loss that would have been realized on the securities transferred or sold, as applicable, as part of the treasury or mortgage dollar roll.
TBA Purchase and Forward Sale Commitments - The Portfolio may enter into TBA commitments to purchase or sell securities for a fixed price at a future date. TBA commitments are considered securities in themselves, and involve a risk of loss if the value of the security to be purchased or sold declines or increases prior to the settlement date, which is in addition to the risk of decline in the value of the Portfolio’s other assets. TBA forward sale commitments are valued at the current market value of the underlying securities, according to the procedures described under “Investment Valuation and Fair Value Measurements”.
BHFTII-37
Brighthouse Funds Trust II
Western Asset Management Strategic Bond Opportunities Portfolio
Notes to Financial Statements—December 31, 2023—(Continued)
When-Issued and Delayed-Delivery Securities - The Portfolio may purchase securities on a when-issued or delayed-delivery basis. Settlement of such transactions will occur beyond the customary settlement period. The Portfolio may purchase securities under such conditions only with the intention of actually acquiring them, but may enter into a separate agreement to sell the securities before the settlement date. Since the value of securities purchased may fluctuate prior to settlement, the Portfolio may be required to pay more at settlement than the security is worth. In addition, the Portfolio is not entitled to any of the interest earned prior to settlement.
Repurchase Agreements - The Portfolio may enter into repurchase agreements, under the terms of a Master Repurchase Agreement (“MRA”), or Global Master Repurchase Agreement (“GMRA”), with selected commercial banks and broker-dealers, under which the Portfolio acquires securities as collateral and agrees to resell the securities at an agreed-upon time and at an agreed-upon price. The Portfolio, through the Custodian or a subcustodian, under a tri-party repurchase agreement, receives delivery of the underlying securities collateralizing any repurchase agreements. It is the Portfolio’s policy that the market value of the collateral be equal to at least 100% of the repurchase price in the case of a repurchase agreement of one-day duration and equal to at least 102% of the repurchase price in the case of all other repurchase agreements. In the event of default or failure by a party to perform an obligation in connection with any repurchase transaction, the MRA or GMRA gives the non-defaulting party the right to set-off claims and to apply property held by it in connection with any repurchase transaction against obligations owed to it under the agreement.
At December 31, 2023, the Portfolio had direct investments in repurchase agreements with a gross value of $15,251,446. Additionally, the Portfolio invested cash collateral for loans of portfolio securities in repurchase agreements with a gross value of $204,437,966. The combined value of all repurchase agreements is included as part of investments at value on the Statement of Assets and Liabilities. The value of the related collateral exceeded the value of the repurchase agreements at December 31, 2023.
Securities Lending - The Portfolio may lend its portfolio securities to certain qualified brokers who borrow securities in order to complete certain securities transactions. By lending its portfolio securities, the Portfolio attempts to increase its net investment income through the receipt of income on collateral held from securities on loan. Any gain or loss in the market price of the loaned securities that might occur, any interest earned, and any dividends declared during the term of the loan, would accrue to the account of the Portfolio.
The Trust has entered into a Non-Custodial Securities Lending Agreement with JPMorgan Chase Bank, N.A. (the “Lending Agent”). Under the agreement, the Lending Agent is authorized to loan portfolio securities on the Portfolio’s behalf. In exchange, the Portfolio generally receives cash, U.S. Government securities, letters of credit, or other collateral deemed appropriate by the Adviser. The Portfolio receives collateral equal to at least 102% of the market value for loans secured by government securities or cash in the same currency as the loaned shares and 105% for all other loaned securities at each loan’s inception. Collateral representing at least 100% of the market value of the loaned securities is maintained for the duration of the loan. Any cash collateral received by the Portfolio is generally invested by the Lending Agent in short-term investments, which may include certificates of deposit, commercial paper, repurchase agreements, including repurchase agreements with respect to equity securities, time deposits, master demand notes and money market funds. The market value of investments made with cash collateral received are disclosed in the Schedule of Investments and the valuation techniques are described in Note 2. The value of the securities on loan may change each business day. If the market value of the collateral at the close of trading on a business day is less than 100% of the market value of the loaned securities at the close of trading on that day, the borrower is required to deliver, by the close of business on the following business day, an additional amount of collateral, so that the total amount of posted collateral is equal to at least 100% of the market value of all the loaned securities as of such preceding day. A portion of the income earned on the collateral is rebated to the borrower of the securities and the remainder is split between the Lending Agent and the Portfolio. On loans collateralized by U.S. government securities, a fee is received from the borrower and is allocated between the Portfolio and the Lending Agent.
Income received by the Portfolio in securities lending transactions during the year ended December 31, 2023 is reflected as securities lending income on the Statement of Operations. The values of any securities loaned by the Portfolio and the related collateral at December 31, 2023 are disclosed in the footnotes to the Schedule of Investments. The value of the related collateral received by the Portfolio exceeded the value of the securities out on loan at December 31, 2023.
The risks associated with lending portfolio securities include, but are not limited to, possible delays in receiving additional collateral or in the recovery of the loaned securities, possible loss of rights in the collateral should the borrower fail financially, as well as risk of loss in the value of the collateral or the value of the investments made with the collateral. To the extent the Portfolio uses cash collateral it receives to invest in repurchase agreements with respect to equity securities, it is subject to the risk of loss if the value of the equity securities declines and the counterparty defaults on its obligation to repurchase such securities. The Lending Agent shall indemnify the Portfolio in the case of default of any securities borrower, subject to the terms of the Non-Custodial Securities Lending Agreement.
BHFTII-38
Brighthouse Funds Trust II
Western Asset Management Strategic Bond Opportunities Portfolio
Notes to Financial Statements—December 31, 2023—(Continued)
The following table provides a breakdown of transactions accounted for as secured borrowings, the gross obligations by the type of collateral pledged, and the remaining contractual maturities of those transactions.
| Remaining Contractual Maturity of the Agreements As of December 31, 2023 |
||||||||||||||||||||
| Overnight and Continuous |
Up to 30 Days |
31 - 90 Days |
Greater than 90 days |
Total | ||||||||||||||||
| Securities Lending Transactions | ||||||||||||||||||||
| Common Stocks |
$ | (51,821 | ) | $ | — | $ | — | $ | — | $ | (51,821 | ) | ||||||||
| Corporate Bonds & Notes |
(346,374,727 | ) | — | — | — | (346,374,727 | ) | |||||||||||||
| Total Borrowings |
$ | (346,426,548 | ) | $ | — | $ | — | $ | — | $ | (346,426,548 | ) | ||||||||
| Gross amount of recognized liabilities for securities lending transactions |
|
$ | (346,426,548 | ) | ||||||||||||||||
|
|
|
|||||||||||||||||||
3. Investments in Derivative Instruments
Forward Foreign Currency Exchange Contracts - The Portfolio may enter into forward foreign currency exchange contracts to obtain investment exposure, enhance return or hedge or protect its portfolio holdings against the risk of future movements in certain foreign currency exchange rates. When entering into these contracts, the Portfolio agrees to buy or sell a fixed quantity of foreign currency for an agreed-upon price on an agreed-upon future date. These contracts are valued daily and the Portfolio’s net equity therein, representing unrealized gain or loss on the contracts as measured by the difference between the forward foreign exchange rates at the dates of entry into the contracts and the forward foreign exchange rates at the valuation date, is included in the Statement of Assets and Liabilities. When a contract is closed, the Portfolio recognizes a realized gain or loss equal to the difference between the value of the contract at the time it was opened and the value at the time it was closed.
Realized and unrealized gains and losses on forward foreign currency exchange contracts are included in the Statement of Operations. These contracts involve market and/or credit risk in excess of the amount recognized in the Statement of Assets and Liabilities. The use of forward foreign currency exchange contracts does not eliminate fluctuations in the underlying prices of the securities of the Portfolio, but it does establish a rate of exchange that can be achieved in the future. Although forward foreign currency exchange contracts may limit the risk of loss due to a decline in the value of the currency holdings, they also limit any potential gain that might result should the value of the currency increase. In addition, the Portfolio could be exposed to losses if the counterparties to the contracts are unable or unwilling to meet the terms of the contracts. The Portfolio may also experience losses even when such contracts are used for hedging purposes. The Portfolio’s maximum potential loss from such contracts is the aggregate face value in U.S. dollars at the time the contract was opened.
Futures Contracts - The Portfolio may buy and sell futures contracts as a hedge, to maintain investment exposure to a target asset class or to enhance return. The Portfolio may be subject to fluctuations in equity prices, interest rates, commodity prices, and foreign currency exchange rates in the normal course of pursuing its investment objective. Futures contracts are standardized agreements to buy or sell a security, or deliver a final cash settlement price in connection with an index, interest rate, currency, or other asset. The Portfolio must deposit an amount (“initial margin”) equal to a certain percentage of the face value of the futures contract. The initial margin may be in the form of cash or securities, which is returned when the Portfolio’s obligations under the contract have been satisfied. If cash is deposited as the initial margin, it is shown as cash collateral on the Statement of Assets and Liabilities. Futures contracts are marked-to-market daily and subsequent payments (“variation margin”) are made or received by the Portfolio depending on whether unrealized gains or losses are incurred. These amounts are reflected as receivables or payables on the Statement of Assets and Liabilities and as a component of net change in unrealized appreciation/depreciation on the Statement of Operations. When the contract is closed or expires, the Portfolio records a realized gain or loss equal to the difference between the value of the contract at the time it was opened and the value at the time it was closed. Risks of entering into futures contracts (and related options) include the possibility that the market for these instruments may be illiquid and that a change in the value of the futures contract or option may not correlate perfectly with changes in the value of the underlying asset. The exchange’s clearinghouse, as counterparty to all futures, guarantees the futures contracts against default.
Options Contracts - An option contract purchased by the Portfolio gives the Portfolio the right, but not the obligation, to buy (call) or sell (put) an underlying instrument at a fixed exercise price during a specified period or on a specified date. Call options written by the Portfolio give the holder the right to buy the underlying instrument from the Portfolio at a fixed exercise price; put options written by the Portfolio give the holder the right to sell the underlying instrument to the Portfolio at a fixed exercise price.
The Portfolio may use options to hedge against changes in values of securities the Portfolio owns or expects to purchase, to maintain investment exposure to a target asset class or to enhance return. When the Portfolio owns the underlying instrument, writing puts or buying calls tend to increase the Portfolio’s exposure to the underlying instrument and writing calls or buying puts tends to decrease the Portfolio’s exposure to the underlying instrument. Options can also be used to hedge other Portfolio investments. For options used
BHFTII-39
Brighthouse Funds Trust II
Western Asset Management Strategic Bond Opportunities Portfolio
Notes to Financial Statements—December 31, 2023—(Continued)
to hedge the Portfolio’s investments, the potential risk to the Portfolio is that the change in value of options contracts may not correspond perfectly to the change in value of the hedged instruments. The Portfolio also bears the risk of an unfavorable change in the value of the underlying instrument or the risk that the Portfolio may not be able to enter into a closing transaction due to an illiquid market. The Portfolio’s maximum risk of loss from counterparty credit risk, as opposed to investment and other types of risk, in respect of purchased options is typically the premium initially paid for the option plus any unrealized gains.
The main risk associated with purchasing an option is that the option expires without being exercised. In this case, the option is worthless when it expires and the premium paid for the option is considered a realized loss. The risk associated with writing a call option on an underlying instrument that the Portfolio owns is that the Portfolio may forgo the opportunity for a profit if the market value of the underlying instrument increases and the option is exercised, requiring the Portfolio to sell the underlying instrument at a price below its market value. When the Portfolio writes a call option on a security it does not own, its exposure on such an option is theoretically unlimited. The risk in writing a put option is that the Portfolio may incur a loss if the market value of the underlying instrument decreases and the option is exercised, requiring the Portfolio to purchase the underlying instrument at a price above its market value. In addition, the Portfolio risks not being able to enter into a closing transaction for the written option as the result of an illiquid market for the option.
Purchases of put and call options are recorded as investments, the value of which are marked-to-market daily. When the Portfolio enters into a closing sale transaction, the Portfolio will realize a gain or loss depending on whether the sales proceeds from the closing sale transaction are greater or less than the premium initially paid for the option. When the Portfolio exercises a put option, it will realize a gain or loss from the sale of the underlying instrument and the proceeds from such sale will be decreased by the premium originally paid for the put option. When the Portfolio exercises a call option, the cost of the security which the Portfolio purchases upon exercise will be increased by the premium originally paid for the call option.
The premium received by the Portfolio for a written option is recorded as an asset and an equivalent liability. The liability is subsequently marked-to-market to reflect the current value of the option written. When a written option expires without being exercised or the Portfolio enters into a closing purchase transaction, the Portfolio realizes a gain (or loss if the cost of the closing purchase transaction exceeds the premium received when the option was sold) without regard to any unrealized gain or loss on the underlying instrument and the liability related to such option is eliminated. When a written call option is exercised, the Portfolio realizes a gain or loss, as adjusted for the premium received, from the sale of the underlying instrument. When a written put option is exercised, the premium received by the Portfolio is offset against the amount paid for the purchase of the underlying instrument.
Swaptions are similar to options on securities except that instead of selling or purchasing the right to buy or sell a security, the writer or purchaser of the swaptions is granting or buying the right to enter into a previously agreed upon interest rate or credit default swap agreement at any time before the expiration of the option.
An Option on Exchange-Traded Futures Contract (“Futures Option”) is an option contract in which the underlying instrument is a single futures contract.
Swap Agreements - The Portfolio may enter into swap agreements in which the Portfolio and a counterparty agree to either make periodic net payments on a specified notional amount or a net payment upon termination. Swap agreements are either privately negotiated in the OTC market (“OTC swaps”) or executed in a multilateral or other trade facility platform, such as a registered swap execution facility (“centrally cleared swaps”). The Portfolio may enter into swap agreements for the purposes of managing exposure to interest rate, credit or market risk, or for other purposes. In connection with these agreements, securities or cash may be paid or received, as applicable, by the Portfolio as collateral or margin in accordance with the terms of the respective swap agreements to provide assets of value and recourse in the event of default or bankruptcy/insolvency. Securities posted by the Portfolio as collateral for swap contracts are identified in the Schedule of Investments and restricted cash, if any, is reflected on the Statement of Assets and Liabilities.
Swap agreements are marked-to-market daily. The fair value of an OTC swap is reflected on the Statement of Assets and Liabilities. The changes in value, if any, are reflected as a component of net change in unrealized appreciation/depreciation on the Statement of Operations. Daily changes in valuation of centrally cleared swaps, if any, are recorded as a receivable or payable for variation margin on the Statement of Assets and Liabilities and as a component of unrealized appreciation/depreciation on the Statement of Operations. The Portfolio may pay or receive an upfront payment upon entering into a swap agreement. Upon termination or maturity of the swap, upfront premiums are recorded as realized gains or losses on the Statement of Operations. A liquidation payment received or made at the termination of the swap is recorded as realized gain or loss on the Statement of Operations. Net periodic payments received or paid by the Portfolio are included as part of realized gains or losses on the Statement of Operations.
Swap transactions involve, to varying degrees, elements of interest rate, credit, and market risk in excess of the amounts recognized in the Statement of Assets and Liabilities. Such risks include the possibility that there will be no liquid market for these agreements, that the counterparty to the agreements may default on its obligation to perform, or that there may be unfavorable changes in market conditions or interest rates. In addition, entering into swap agreements involves documentation risk resulting from the possibility that
BHFTII-40
Brighthouse Funds Trust II
Western Asset Management Strategic Bond Opportunities Portfolio
Notes to Financial Statements—December 31, 2023—(Continued)
the parties to a swap agreement may disagree as to the meaning of contractual terms in the agreement. The Portfolio may enter into swap transactions with counterparties in accordance with guidelines established by the Board. These guidelines provide for a minimum credit rating for each counterparty and various credit enhancement techniques (for example, collateralization of amounts due from counterparties) to limit exposure to counterparties that have lower credit ratings. The Portfolio’s maximum risk of loss from counterparty credit risk is the discounted value of the net cash flows to be received from the counterparty over the contract’s remaining life, to the extent that amount is positive, or the fair value of the contract. The risk may be mitigated by having a master netting arrangement between the Portfolio and the counterparty and by the posting of collateral by the counterparty to cover the Portfolio’s exposure to the counterparty. Counterparty risk related to centrally cleared swaps is mitigated due to the protection against defaults provided by the clearinghouse. A party to a cleared swap is subject to the credit risk of the clearinghouse and the clearing member through which it holds its cleared position.
Centrally Cleared Swaps: Certain swaps are required to be (or are capable of being) cleared through a regulated clearinghouse. Since the Portfolio is not a member of a clearinghouse and only members of a clearinghouse (“clearing members” or “clearing brokers”) can participate directly in the clearinghouse, the Portfolio holds cleared swaps through accounts at a clearing member. The Portfolio typically will be required to post margin required by the clearinghouse and/or its clearing member; the margin required by a clearinghouse and/or clearing member may be greater than the margin the Portfolio would be required to post in an uncleared derivative transaction.
Credit Default Swaps: The Portfolio is subject to credit risk in the normal course of pursuing its investment objectives. The Portfolio may enter into credit default swaps to manage its exposure to the market or certain sectors of the market, to reduce its risk exposure to defaults of corporate and/or sovereign issuers, or to create exposure to corporate and/or sovereign issuers to which it is not otherwise exposed. Credit default swaps involve one party making a stream of payments (referred to as the buyer of protection) to another party (referred to as the seller of protection) in exchange for the right to receive a specified return if a credit event occurs for the referenced entity, obligation or index. A credit event is defined under the terms of each swap agreement and may include, but is not limited to, underlying entity default, bankruptcy, write-down, principal shortfall or interest shortfall. As the seller of protection, if an underlying credit event occurs, the Portfolio will either pay the buyer an amount equal to the notional amount of the swap and take delivery of the referenced obligation (or underlying security comprising the relevant component of the referenced index), or pay a net settlement amount in the form of cash or securities equal to the notional amount of the swap less the recovery value of the referenced obligation (or underlying security comprising the relevant component of the referenced index). In return, the Portfolio would receive from the counterparty an upfront or periodic stream of payments throughout the life of the credit default swap agreement provided that no credit event has occurred. As the seller of protection, the Portfolio will effectively add leverage to its portfolio because, in addition to its total net assets, the Portfolio would be subject to investment exposure on the notional amount of the credit default swap.
The Portfolio may also purchase credit default swap contracts in order to hedge against the risk of default of debt securities held in its portfolio. This would involve the risk that the investment may be worthless when it expires and would only generate income in the event of an actual default by the issuer of the underlying obligation (as opposed to a credit downgrade or other indication of financial instability). It would also involve credit risk, whereby the seller may fail to satisfy its payment obligations to the Portfolio in the event of a default. As the buyer of protection, if an underlying credit event occurs, the Portfolio will either receive from the seller of protection an amount equal to the notional amount of the swap and deliver the referenced obligation (or underlying security comprising the relevant component of the referenced index), or receive a net settlement amount in the form of cash or securities equal to the notional amount of the swap less the recovery value of the referenced obligation (or underlying security comprising the relevant component of the referenced index). If no credit event occurs and the Portfolio is a buyer of protection, the Portfolio will typically recover nothing under the credit default swap agreement, but it will have had to pay the required upfront payment or stream of continuing payments under the credit default swap agreement. Recovery values are at times established through the credit event auction process in which market participants are ensured that a transparent price has been set for the defaulted obligation.
Credit default swap agreements on credit indices involve one party making a stream of payments to another party in exchange for the right to receive a specified return in the event of a write-down, principal shortfall, interest shortfall or default of all or part of the referenced entities comprising the credit index. A credit index is a basket of credit instruments or exposures designed to be representative of some part of the credit market as a whole. An index credit default swap references all the names in the index, and if there is a credit event involving an entity in the index, the credit event is settled based on that entity’s weight in the index. A Portfolio may use credit default swaps on credit indices as a hedge for credit default swaps or bonds held in the portfolio, which is less expensive than it would be to buy many individual credit default swaps to achieve similar effect. Credit default swaps on indices are benchmarks for protecting investors owning bonds against default, and may be used to speculate on changes in credit quality.
Implied credit spreads, represented in absolute terms, utilized in determining the market value of credit default swap agreements on a credit index or corporate or sovereign issuer, serve as some indication of the status of the payment/performance risk and the likelihood or risk of default for the credit derivative. The implied credit spread of a particular referenced entity or index also reflects the cost of buying/selling protection and may reflect upfront payments required to be made to enter into the agreement. Wider credit spreads
BHFTII-41
Brighthouse Funds Trust II
Western Asset Management Strategic Bond Opportunities Portfolio
Notes to Financial Statements—December 31, 2023—(Continued)
generally represent a deterioration of the referenced entity’s credit soundness and a greater likelihood or risk of default or other credit event occurring as defined under the terms of the particular swap agreement. When no implied credit spread is available for a credit default swap, the current unrealized appreciation/depreciation on the position may be used as an indicator of the current status of the payment/performance risk.
The maximum potential amount of future payments (undiscounted) that the Portfolio as a seller of protection could be required to make under a credit default swap agreement equals the notional amount of the agreement. Notional amounts of all credit default swap agreements outstanding as of December 31, 2023, for which the Portfolio is the seller of protection, are disclosed in the Schedule of Investments. These potential amounts would be partially offset by any recovery values of the respective referenced obligations, upfront payments received upon entering into the agreement or net amounts received from the settlement of buy protection credit default swap agreements entered into by the Portfolio for the same referenced entity or entities.
Interest Rate Swaps: The Portfolio may enter into interest rate swaps to manage its exposure to interest rates, to adjust its interest rate sensitivity (duration), to preserve a return or spread on a particular investment, or otherwise as a substitute for a direct investment in debt securities. The Portfolio is subject to interest rate risk exposure in the normal course of pursuing its investment objectives. Because the Portfolio holds fixed rate bonds, the value of these bonds may decrease if interest rates rise. To help hedge against this risk and to maintain its ability to generate income at prevailing market rates, the Portfolio may enter into interest rate swap agreements. Interest rate swaps are agreements in which one party pays a stream of interest payments, either fixed or floating rate, for another party’s stream of interest payments, either fixed or floating, on the same notional amount for a specified period of time. Other forms of interest rate swap agreements may include: (1) interest rate caps, under which, in return for a premium, one party agrees to make payments to the other to the extent that interest rates exceed a specified rate, or “cap”; (2) interest rate floors, under which, in return for a premium, one party agrees to make payments to the other to the extent that interest rates fall below a specified rate, or “floor”; (3) interest rate collars, under which a party sells a cap and purchases a floor or vice versa in an attempt to protect itself against interest rate movements exceeding given minimum or maximum levels; and (4) basis swaps, under which two parties can exchange variable interest rates based on different segments of money market reference rates. The Portfolio’s maximum risk of loss from counterparty credit risk, as opposed to investment and other types of risk, in respect of interest rate swaps is typically the discounted net value of the cash flows to be received from the counterparty over the contract’s remaining life, to the extent that amount is positive.
The following table summarizes the fair value of derivatives held by the Portfolio at December 31, 2023 by category of risk exposure:
| Asset Derivatives |
Liability Derivatives |
|
||||||||||
| Risk Exposure |
Statement of Assets & |
Fair Value | Statement of Assets & |
Fair Value | ||||||||
| Interest Rate |
Investments at market value (a) (e) | $ | 194,516 | |||||||||
| OTC swap contracts at market value | 141,737 | |||||||||||
| Unrealized appreciation on centrally cleared swap contracts (a) (b) | 1,606,821 | Unrealized depreciation on centrally cleared swap contracts (a) (b) | $ | 6,887,373 | ||||||||
| Unrealized appreciation on futures contracts (a) (c) | 42,164,008 | Unrealized depreciation on futures contracts (a) (c) | 848,255 | |||||||||
| Written options at value (a) | 341,243 | |||||||||||
| Credit |
OTC swap contracts at market value (d) | 67,117 | OTC swap contracts at market value (d) | 99,613 | ||||||||
| Unrealized appreciation on centrally cleared swap contracts (a) (b) | 232,657 | Unrealized depreciation on centrally cleared swap contracts (a) (b) | 479,896 | |||||||||
| Equity |
Investments at market value (a) (e) | 46,020 | ||||||||||
| Written options at value (a) | 23,175 | |||||||||||
| Foreign Exchange |
Investments at market value (e) | 1,390,478 | ||||||||||
| Unrealized appreciation on forward foreign currency exchange contracts | 9,282,834 | Unrealized depreciation on forward foreign currency exchange contracts | 8,154,479 | |||||||||
| Written options at value | 451,444 | |||||||||||
|
|
|
|
|
|||||||||
| Total | $ | 55,126,188 | $ | 17,285,478 | ||||||||
|
|
|
|
|
|||||||||
| (a) | Financial instrument not subject to a master netting agreement. | |||
| (b) |
Represents the unrealized appreciation/depreciation of centrally cleared swaps as reported in the Schedule of Investments. Only the variation margin is reported within the Statement of Assets and Liabilities. | |||
| (c) | Includes cumulative appreciation/depreciation of futures contracts as reported in the Schedule of Investments. Only the current day’s variation margin is reported within the Statement of Assets and Liabilities. | |||
| (d) | Excludes OTC swap interest receivable of $4,204 and OTC swap interest payable of $381. | |||
| (e) | Represents purchased options which are part of investments at value as shown in the Statement of Assets and Liabilities. | |||
The Portfolio is required to disclose the impact of offsetting assets and liabilities represented in the Statement of Assets and Liabilities to enable users of the financial statements to evaluate the effect or potential effect of netting arrangements on its financial position for recognized assets and liabilities.
BHFTII-42
Brighthouse Funds Trust II
Western Asset Management Strategic Bond Opportunities Portfolio
Notes to Financial Statements—December 31, 2023—(Continued)
The following table presents the Portfolio’s derivative assets by counterparty net of amounts available for offset under a master netting agreement (“MNA”) (see Note 4), or similar agreement, and net of the related collateral received by the Portfolio as of December 31, 2023.
| Counterparty |
Derivative Assets subject to an MNA by Counterparty |
Financial Instruments available for offset |
Collateral Received† |
Net Amount* |
||||||||||||
| Bank of America NA |
$ | 725,278 | $ | — | $ | — | $ | 725,278 | ||||||||
| BNP Paribas SA |
3,748,627 | (3,748,627 | ) | — | — | |||||||||||
| Citibank NA |
868,724 | (764,177 | ) | (104,547 | ) | — | ||||||||||
| Goldman Sachs Bank USA |
1,491,799 | (341,499 | ) | (485,178 | ) | 665,122 | ||||||||||
| JPMorgan Chase Bank NA |
2,298,985 | (2,098,656 | ) | — | 200,329 | |||||||||||
| Morgan Stanley Capital Services LLC |
1,748,753 | (1,286,651 | ) | — | 462,102 | |||||||||||
|
|
|
|
|
|
|
|
|
|||||||||
| $ | 10,882,166 | $ | (8,239,610 | ) | $ | (589,725 | ) | $ | 2,052,831 | |||||||
|
|
|
|
|
|
|
|
|
|||||||||
The following table presents the Portfolio’s derivative liabilities by counterparty net of amounts available for offset under an MNA, or similar agreement, and net of the related collateral pledged by the Portfolio as of December 31, 2023.
| Counterparty |
Derivative Liabilities subject to an MNA by Counterparty |
Financial Instruments available for offset |
Collateral Pledged† |
Net Amount** |
||||||||||||
| BNP Paribas SA |
$ | 4,214,553 | $ | (3,748,627 | ) | $ | — | $ | 465,926 | |||||||
| Citibank NA |
764,177 | (764,177 | ) | — | — | |||||||||||
| Goldman Sachs Bank USA |
341,499 | (341,499 | ) | — | — | |||||||||||
| JPMorgan Chase Bank NA |
2,098,656 | (2,098,656 | ) | — | — | |||||||||||
| Morgan Stanley Capital Services LLC |
1,286,651 | (1,286,651 | ) | — | — | |||||||||||
|
|
|
|
|
|
|
|
|
|||||||||
| $ | 8,705,536 | $ | (8,239,610 | ) | $ | — | $ | 465,926 | ||||||||
|
|
|
|
|
|
|
|
|
|||||||||
| * | Net amount represents the net amount receivable from the counterparty in the event of default. | |||
| ** | Net amount represents the net amount payable due to the counterparty in the event of default. | |||
| † | In some instances, the actual collateral received and/or pledged may be more than the amount shown here due to overcollateralization. | |||
The following tables summarize the effect of derivative instruments on the Statement of Operations, classified by derivative type and category of risk exposure, for the year ended December 31, 2023:
| Statement of Operations Location—Net |
Interest Rate | Credit | Equity | Foreign Exchange |
Total | |||||||||||||||
| Purchased options |
$ | (598,856) | $ | (259,622 | ) | $ | (8,582,347) | $ | (3,027,090) | $ | (12,467,915) | |||||||||
| Forward foreign currency transactions |
— | — | — | 3,741,339 | 3,741,339 | |||||||||||||||
| Futures contracts |
(87,794,064 | ) | — | — | — | (87,794,064 | ) | |||||||||||||
| Swap contracts |
(378,069 | ) | (2,205,578 | ) | — | — | (2,583,647 | ) | ||||||||||||
| Written options |
420,356 | 744,901 | 2,385,237 | 843,597 | 4,394,091 | |||||||||||||||
|
|
|
|
|
|
|
|
|
|
|
|||||||||||
| $ | (88,350,633) | $ | (1,720,299) | $ | (6,197,110) | $ | 1,557,846 | $ | (94,710,196) | |||||||||||
|
|
|
|
|
|
|
|
|
|
|
|||||||||||
| Statement of Operations Location—Net |
Interest Rate | Credit | Equity | Foreign Exchange |
Total | |||||||||||||||
| Purchased options |
$ | (192,971 | ) | $ | 434,317 | $ | 755,350 | $ | 1,019,766 | $ | 2,016,462 | |||||||||
| Forward foreign currency transactions |
— | — | — | (3,195,795 | ) | (3,195,795 | ) | |||||||||||||
| Futures contracts |
64,776,942 | — | — | — | 64,776,942 | |||||||||||||||
| Swap contracts |
(868,831 | ) | 1,486,572 | — | — | 617,741 | ||||||||||||||
| Written options |
(112,516 | ) | 186,722 | (303,665 | ) | (309,163 | ) | (538,622 | ) | |||||||||||
|
|
|
|
|
|
|
|
|
|
|
|||||||||||
| $ | 63,602,624 | $ | 2,107,611 | $ | 451,685 | $ | (2,485,192) | $ | 63,676,728 | |||||||||||
|
|
|
|
|
|
|
|
|
|
|
|||||||||||
BHFTII-43
Brighthouse Funds Trust II
Western Asset Management Strategic Bond Opportunities Portfolio
Notes to Financial Statements—December 31, 2023—(Continued)
For the year ended December 31, 2023, the average notional par or face amount outstanding for each derivative type was as follows:
| Derivative Description |
Average Notional Par or Face Amount‡ |
|||
| Purchased options |
$ | 135,390,000 | ||
| Forward foreign currency transactions |
412,088,022 | |||
| Futures contracts long |
1,803,256,472 | |||
| Futures contracts short |
(176,825,124 | ) | ||
| Swap contracts |
277,507,181 | |||
| Written options |
(235,208,086 | ) | ||
| ‡ | Averages are based on activity levels during the period for which the amounts are outstanding. | |||
4. Certain Risks
In the normal course of business, the Portfolio invests in securities and enters into transactions where risks exist. Those risks include:
Market Risk: The value of securities held by the Portfolio may decline in response to certain events, including those directly involving the issuers whose securities are owned by the Portfolio; conditions affecting the general economy; overall market changes; local, regional or global political, social or economic instability; currency, interest rate, and price fluctuations, or other factors including terrorism, war, natural disasters and the spread of infectious illness including epidemics or pandemics such as the COVID-19 pandemic. These events may also adversely affect the liquidity of securities held by the Portfolio.
Credit and Counterparty Risk: The Portfolio may be exposed to counterparty risk, or the risk that an entity with which the Portfolio has unsettled or open transactions may default. The potential loss could exceed the value of the financial assets and liabilities recorded in the financial statements. Financial assets that potentially expose the Portfolio to credit and counterparty risk consist principally of cash due from counterparties and investments. The Portfolio manages counterparty risk by entering into agreements only with counterparties that it believes have the financial resources to honor their obligations and by monitoring the financial stability of those counterparties. The Subadviser may attempt to mitigate counterparty risk by (i) periodically assessing the creditworthiness of its trading partners, (ii) monitoring and/or limiting the amount of its net exposure to each individual counterparty based on its assessment, and (iii) requiring collateral from the counterparty for certain transactions. In order to preserve certain safeguards for non-standard settlement trades, the Portfolio restricts its exposure to credit and counterparty losses by entering into master netting agreements (“Master Agreements”) with counterparties (approved brokers) with whom it undertakes a significant volume of transactions. Master Agreements govern the terms of certain transactions and reduce the counterparty risk associated with relevant transactions by specifying credit protection mechanisms and providing standardization that improves legal certainty. Master Agreements can also help limit counterparty risk by specifying collateral posting arrangements at pre-arranged exposure levels. Collateral requirements may differ by type of derivative or investment, as applicable. Collateral or margin requirements are set by the broker or exchange clearinghouse for exchange-traded derivatives (e.g., futures contracts and exchange-traded options), while collateral terms are contract specific for OTC traded derivatives (e.g., forward foreign currency exchange contracts, swap agreements and OTC options).
For derivatives traded under an International Swaps and Derivatives Association, Inc. Master Agreement (“ISDA Master Agreement”) or similar master agreement, the collateral requirements are netted across all transactions traded under such agreement and one amount is posted from one party to the other to collateralize such obligations. The ISDA Master Agreement gives each party to the agreement the right to terminate all transactions traded under such agreement if there is a certain deterioration in the credit quality of the other party. The ISDA Master Agreement gives the Portfolio the right, upon an event of default by the applicable counterparty or a termination of the agreement, to close out all transactions traded under such agreement and to net amounts owed under each transaction to one net amount payable by one party to the other. This right to close out and net payments across all transactions traded under the ISDA Master Agreement could result in a reduction of the Portfolio’s credit risk to such counterparty equal to any amounts payable by the Portfolio under the applicable transactions, if any. However, absent an event of default by the counterparty or a termination of the agreement, the ISDA Master Agreement does not result in an offset of reported amounts of assets and liabilities in the Statement of Assets and Liabilities across transactions between the Portfolio and the applicable counterparty. The enforceability of the right to offset may vary by jurisdiction. Cash collateral that has been pledged to cover obligations of the Portfolio under derivative contracts, if any, will be reported separately in the Statement of Assets and Liabilities. Securities pledged as collateral, if any, for the same purpose are noted in the Schedule of Investments.
Repurchase and reverse repurchase agreements are primarily executed under GMRAs or MRAs, which provide the right to set-off. Each repurchase and reverse repurchase agreement is initially collateralized at the transaction level. In the event of default, the total market value exposure will be offset against collateral exchanged to date, which would result in a net receivable/(payable) that would be due from/to the counterparty.
BHFTII-44
Brighthouse Funds Trust II
Western Asset Management Strategic Bond Opportunities Portfolio
Notes to Financial Statements—December 31, 2023—(Continued)
Master Securities Forward Transaction Agreements (“MSFTA”) govern the considerations and factors surrounding the settlement of certain forward settling transactions, such as TBA securities and delayed-delivery or secured borrowings transactions by and between the Portfolio and select counterparties. The MSFTA maintains provisions for, among other things, initiation and confirmation, payment and transfer, events of default, termination, and maintenance of collateral.
Customer Account Agreements and related addenda govern cleared derivatives transactions such as futures, options on futures, and cleared OTC derivatives. Cleared derivative transactions require posting of initial margin as determined by each relevant clearinghouse. The Portfolio’s clearing broker may also require additional initial margin. Clearinghouse-related initial margin is held by the clearinghouse and additional initial margin is held by the Portfolio’s clearing broker. In a cleared derivative transaction, the Portfolio’s counterparty is a clearinghouse rather than a bank or broker. The clearinghouse stands between the buyer and the seller of the contract; therefore, credit risk is limited to failure of or default by the clearinghouse. While offset rights may exist under applicable law, the Portfolio does not have a contractual right of offset against a clearing broker or clearinghouse in the event of a default (including the bankruptcy or insolvency). Additionally, credit risk exists in cleared derivative transactions with respect to initial and variation margin that is held in a clearing broker’s customer accounts. While clearing brokers are required to segregate, by account class, customer margin from their own assets, in the event that a clearing broker becomes insolvent or goes into bankruptcy and at that time there is a shortfall in the aggregate amount of margin held by the clearing broker for all its clients, typically the shortfall would be allocated on a pro-rata basis across all the clearing broker’s customers, for the relevant account class, potentially resulting in losses to the Portfolio. Variation margin, which accounts for changes in market value, is exchanged daily, but may not be netted between futures and cleared OTC derivatives.
Foreign Investment Risk: The investments by the Portfolio in foreign securities, whether direct or indirect, involve risks not present in domestic investments. Because securities may be denominated in foreign currencies, may require settlement in foreign currencies and may pay interest or dividends in foreign currencies, changes in the relationship of these foreign currencies to the U.S. dollar can significantly affect the value of the investments and earnings of the Portfolio. Foreign investments may also subject the Portfolio to foreign government exchange restrictions, expropriation, taxation, unexpected market closures or other political, social or economic developments, such as the imposition of economic sanctions against one or more countries, organizations, entities and/or individuals, all of which could affect the market and/or credit risk of the investments. In addition to the risks described above, risks may arise from forward foreign currency contracts with respect to the potential inability of counterparties to meet the terms of their contracts.
LIBOR Replacement Risk: LIBOR was the offered rate at which major international banks could obtain wholesale, unsecured funding. The terms of investments, financings or other transactions (including certain derivatives transactions) to which the Portfolio may be a party have historically been tied to LIBOR. In connection with the global transition away from LIBOR led by regulators and market participants, LIBOR was last published on a representative basis at the end of June 2023. The United Kingdom’s Financial Conduct Authority, which regulates LIBOR, has ceased publishing all LIBOR settings, but some USD LIBOR settings will continue to be published under a synthetic methodology until September 30, 2024 for certain legacy contracts. Alternative reference rates to LIBOR have been established in most major currencies (e.g., the Secured Overnight Financing Rate for U.S. dollar LIBOR and the Sterling Overnight Index Average for GBP LIBOR) and the transition to new reference rates continues. The full impact of the transition on the Portfolio, the financial instruments in which the Portfolio invests and financial markets more generally cannot yet be fully determined.
Additional risks associated with each type of investment are described above within the respective security type notes. The Portfolio’s prospectus includes a discussion of the principal risks of investing in the Portfolio.
5. Investment Transactions
Aggregate cost of purchases and proceeds of sales of investment securities, including mortgage dollar roll and TBA transactions but excluding short-term securities, for the year ended December 31, 2023 were as follows:
| Purchases |
Sales | |||||||||||
| U.S. Government |
Non-U.S. Government | U.S. Government | Non-U.S. Government | |||||||||
| $82,085,710 | $ | 893,286,794 | $ | 120,838,695 | $ | 917,142,171 | ||||||
Purchases and sales of TBA transactions for the year ended December 31, 2023 were as follows:
| Purchases |
Sales | |||
| $13,372,066 | $ | 11,154,164 | ||
BHFTII-45
Brighthouse Funds Trust II
Western Asset Management Strategic Bond Opportunities Portfolio
Notes to Financial Statements—December 31, 2023—(Continued)
6. Investment Management Fees and Other Transactions with Affiliates
Investment Management Agreement - Brighthouse Investment Advisers is the investment adviser to the Portfolio. The Trust has entered into an investment management agreement with Brighthouse Investment Advisers with respect to the Portfolio. For providing investment management services to the Portfolio, Brighthouse Investment Advisers receives monthly compensation at the following annual rates:
|
Management |
% per annum | Average Daily Net Assets | ||||
| $12,569,327 | 0.650 | % | Of the first $500 million | |||
| 0.550 | % | On amounts in excess of $500 million | ||||
Brighthouse Investment Advisers has entered into an investment subadvisory agreement with respect to managing the Portfolio. Western Asset Management Company, LLC (“Western Asset”) is compensated by Brighthouse Investment Advisers to provide subadvisory services for the Portfolio.
Western Asset may delegate to its affiliate, Western Asset Management Company Limited, any of its responsibilities with respect to transactions in foreign currencies and debt securities denominated in foreign currencies, and may delegate to its affiliate, Western Asset Management Company Pte. Ltd., any of its responsibilities with respect to transactions in investments exposed to China.
Management Fee Waiver - Pursuant to a management fee waiver agreement, the Adviser has agreed, for the period May 1, 2023 to April 30, 2024, to reduce its advisory fees set out above under “Investment Management Agreement” for each class of the Portfolio as follows:
| % per annum reduction |
Average Daily Net Assets | |
| 0.055% | On the first $500 million | |
| 0.025% | On the next $500 million | |
| 0.050% | On the next $1 billion | |
| 0.075% | On amounts in excess of $2 billion |
An identical agreement was in place for the period April 29, 2022 to April 30, 2023. Amounts waived for the year ended December 31, 2023 are shown as a management fee waiver in the Statement of Operations.
Certain officers and trustees of the Trust may also be officers of the Adviser; however, such officers and trustees receive no compensation from the Trust.
Transfer Agency Agreement - Brighthouse Life Insurance Company serves as the transfer agent for the Trust. Brighthouse Life Insurance Company receives no fees for its services to the Trust.
Distribution and Service Fees - The Trust has a distribution agreement with Brighthouse Securities, LLC (the “Distributor”) pursuant to which the Distributor serves as the general distributor of shares of each class (each a “Class”) of each Portfolio. The Distributor is an affiliate of the Trust. The Trust has adopted a Distribution and Services Plan (the “D&S Plan”) relating to Class B, Class D, Class E, Class F and Class G shares of each Portfolio, under Rule 12b-1 under the 1940 Act, pursuant to which the Trust may pay the Distributor a fee (the “Service Fee”) at an annual rate not to exceed 0.25% of each such Portfolio’s average daily net assets attributable to the Class B, Class D, Class E, Class F and Class G shares of the Trust. Each Portfolio may not offer shares of each Class. The D&S Plan also authorizes the Trust, on behalf of each of its Portfolios, to pay to the Distributor a distribution fee (the “Distribution Fee” and together with the Service Fee, the “Fees”) at an annual rate of up to 0.25% of each Portfolio’s average daily net assets attributable to the Class B, Class D, Class E, Class F, and Class G shares in consideration of the services rendered in connection with the sale of such shares by the Distributor. Under the Distribution Agreement with respect to the Trust, Fees are currently paid at an annual rate of 0.25% of average daily net assets in the case of Class B shares, 0.10% of average daily net assets in the case of Class D shares, 0.15% of average daily net assets in the case of Class E shares, 0.20% of average daily net assets in the case of Class F shares and 0.30% of average daily net assets in the case of Class G shares. The D&S Plan is known as a “compensation plan” because the Trust makes payments to the Distributor for services rendered regardless of the actual level of expenditures by the Distributor. Amounts incurred by the Portfolio for the year ended December 31, 2023 are shown as Distribution and service fees in the Statement of Operations.
Deferred Trustee Compensation - Each Trustee who is not currently an employee of the Adviser or any of its affiliates receives compensation from the Trust for his or her service to the Trust. A deferred compensation plan (the “Plan”) is available to the Trustees on a voluntary basis. Deferred amounts remain in the Trust until distributed in accordance with the provisions of the Plan. The value of a participating Trustee’s deferral account is based on theoretical investments of deferred amounts on the normal payment dates in certain portfolios of the Trust or Brighthouse Funds Trust I, an affiliate of the Trust, as designated by the participating Trustee.
BHFTII-46
Brighthouse Funds Trust II
Western Asset Management Strategic Bond Opportunities Portfolio
Notes to Financial Statements—December 31, 2023—(Continued)
Changes in the value of participants’ deferral accounts are reflected as a component of Trustees’ fees and expenses in the Statement of Operations. The portion of the accrued obligations allocated to the Portfolio under the Plan is reflected as Deferred trustees’ fees in the Statement of Assets and Liabilities.
7. Contractual Obligations
Under the Trust’s organizational documents, its officers and Trustees may be indemnified against certain liabilities and expenses arising out of the performance of their duties to the Trust. Additionally, the Trust has a variety of indemnification obligations under contracts with its service providers. The Trust’s maximum exposure under these arrangements is unknown, as this would involve future claims that may be made against the Trust that have not yet occurred.
8. Income Tax Information
The cost basis of investments for federal income tax purposes at December 31, 2023 was as follows:
| Cost basis of investments |
$ | 2,596,076,492 | ||
|
|
|
|||
| Gross unrealized appreciation |
45,672,781 | |||
| Gross unrealized (depreciation) |
(163,082,738 | ) | ||
|
|
|
|||
| Net unrealized appreciation (depreciation) |
$ | (117,409,957 | ) | |
|
|
|
The tax character of distributions paid for the years ended December 31, 2023 and 2022 were as follows:
| Ordinary Income |
Long-Term Capital Gain | Total | ||||||||||||||||||
| 2023 |
2022 | 2023 | 2022 | 2023 | 2022 | |||||||||||||||
| $143,060,869 | $ | 148,089,205 | $ | — | $ | — | $ | 143,060,869 | $ | 148,089,205 | ||||||||||
As of December 31, 2023, the components of distributable earnings (accumulated losses) on a federal income tax basis were as follows:
| Undistributed |
Undistributed Long-Term Capital Gain |
Net Unrealized Appreciation (Depreciation) |
Accumulated Capital Losses |
Total | ||||||||||||
| $158,363,664 | $ | — | $ | (116,880,040 | ) | $ | (537,250,873 | ) | $ | (495,767,249 | ) | |||||
The Portfolio utilizes the provisions of the federal income tax laws that provide for the carryforward of capital losses for prior years, offsetting such losses against any future realized capital gains. Net capital losses may be carried forward indefinitely and their character is retained as short-term and/or long-term losses.
As of December 31, 2023, the Portfolio had accumulated short-term capital losses of $153,201,209 and accumulated long-term capital losses of $384,049,664.
9. Recent Accounting Pronouncement & Regulatory Updates
In June 2022, FASB issued Accounting Standards Update 2022-03—Fair Value Measurement (Topic 820)—Fair Value Measurement of Equity Securities Subject to Contractual Sale Restrictions (“ASU 2022-03”). ASU 2022-03 clarifies the guidance in Topic 820 to indicate that a contractual sale restriction should not be considered in the fair value of an equity security subject to such a restriction, and requires entities with investments in equity securities subject to contractual sale restrictions to disclose certain qualitative and quantitative information about such securities. ASU 2022-03 is effective for fiscal years, and interim periods within those fiscal years, beginning after December 15, 2023. ASU 2022-03 is only applicable to an equity security in which the contractual arrangement that restricts its sale is executed or modified on or after the adoption date.
Effective January 24, 2023, the Securities and Exchange Commission adopted rule and form amendments that require open-end management investment companies to transmit concise and visually engaging annual and semiannual reports to shareholders that highlight certain information deemed by the SEC to be particularly important for investors. Certain other information, including financial statements, will no longer appear in shareholder reports but will, as required, be available online, delivered free of charge upon request, and filed on a semiannual basis on Form N-CSR. The rule and form amendments have a compliance date of July 24, 2024. Accordingly, the rule and form amendments will not impact the Portfolio until its 2024 semiannual shareholder report.
BHFTII-47
Brighthouse Funds Trust II
Western Asset Management Strategic Bond Opportunities Portfolio
Report of Independent Registered Public Accounting Firm
To the Board of Trustees of Brighthouse Funds Trust II and Shareholders of the Western Asset Management Strategic Bond Opportunities Portfolio:
Opinion on the Financial Statements and Financial Highlights
We have audited the accompanying statement of assets and liabilities, including the schedule of investments, of the Western Asset Management Strategic Bond Opportunities Portfolio (the “Fund”) (one of the funds constituting the Brighthouse Funds Trust II), as of December 31, 2023, the related statement of operations for the year then ended, the statements of changes in net assets for each of the two years in the period then ended, the financial highlights for each of the five years in the period then ended, and the related notes. In our opinion, the financial statements and financial highlights present fairly, in all material respects, the financial position of the Fund as of December 31, 2023, and the results of its operations for the year then ended, the changes in its net assets for each of the two years in the period then ended, and the financial highlights for each of the five years in the period then ended in conformity with accounting principles generally accepted in the United States of America.
Basis for Opinion
These financial statements and financial highlights are the responsibility of the Fund’s management. Our responsibility is to express an opinion on the Fund’s financial statements and financial highlights based on our audits. We are a public accounting firm registered with the Public Company Accounting Oversight Board (United States) (PCAOB) and are required to be independent with respect to the Fund in accordance with the U.S. federal securities laws and the applicable rules and regulations of the Securities and Exchange Commission and the PCAOB.
We conducted our audits in accordance with the standards of the PCAOB. Those standards require that we plan and perform the audit to obtain reasonable assurance about whether the financial statements and financial highlights are free of material misstatement, whether due to error or fraud. The Fund is not required to have, nor were we engaged to perform, an audit of its internal control over financial reporting. As part of our audits we are required to obtain an understanding of internal control over financial reporting but not for the purpose of expressing an opinion on the effectiveness of the Fund’s internal control over financial reporting. Accordingly, we express no such opinion.
Our audits included performing procedures to assess the risks of material misstatement of the financial statements and financial highlights, whether due to error or fraud, and performing procedures that respond to those risks. Such procedures included examining, on a test basis, evidence regarding the amounts and disclosures in the financial statements and financial highlights. Our audits also included evaluating the accounting principles used and significant estimates made by management, as well as evaluating the overall presentation of the financial statements and financial highlights. Our procedures included confirmation of securities owned as of December 31, 2023, by correspondence with the custodian, brokers, and agent banks; when replies were not received from brokers or agent banks, we performed other auditing procedures. We believe that our audits provide a reasonable basis for our opinion.
/s/ Deloitte & Touche LLP
Boston, Massachusetts
February 23, 2024
We have served as the auditor of one or more Brighthouse investment companies since 1983.
BHFTII-48
Brighthouse Funds Trust II
Trustees and Officers
MANAGEMENT OF THE TRUSTS
The Boards of Trustees (the “Board”) of Brighthouse Funds Trust I and Brighthouse Funds Trust II (“Trust I” and “Trust II”, respectively, and collectively the “Trusts”) supervise the Trusts and are responsible for representing the interests of shareholders. The Trustees, the Chairman of the Board and the Chairmen of each subcommittee are the same for both Trusts. The Trustees of each Trust meet periodically throughout the year to oversee the Portfolios’ activities, reviewing, among other things, each Portfolio’s performance and its contractual arrangements with various service providers. The Trustees of each Trust elect the officers of the Trust, who are responsible for administering the Trust’s day-to-day operations.
Trustees and Officers
The Trustees and executive officers of the Trusts, as well as their ages and their principal occupations during the past five years, are set forth below. Unless otherwise indicated, the business address of each is c/o Brighthouse Funds Trust I and Brighthouse Funds Trust II, 11225 N. Community House Rd., Charolette, North Carolina 28277. Each Trustee who is deemed an “interested person,” as such term is defined in the 1940 Act, is referred to as an “Interested Trustee.” Those Trustees who are not “interested persons,” as such term is defined in the 1940 Act, are referred to as “Independent Trustees.” There is no limit to the term a Trustee may serve, other than pursuant to the retirement policy adopted by the Independent Trustees. Trustees serve until their death, resignation, retirement or removal in accordance with Trust I’s and Trust II’s respective organizational documents and policies adopted by the Board of the Trust from time to time. Officers hold office at the pleasure of each Board and serve until their removal or resignation in accordance with the Trusts’ respective organizational documents and policies adopted by the Board of each Trust from time to time.
Trustees of the Trusts
| Name and Year of Birth |
Position(s) |
Term of Office |
Principal Occupation(s) During the Past |
Number of |
Other Directorships Held | |||||
| Interested Trustee | ||||||||||
| John Rosenthal* (1960) |
Trustee | Indefinite; From May 2016 (Trust I and Trust II) to present | Chief Investment Officer, Brighthouse Financial, Inc. (2016 to present). | 73 | None | |||||
| Independent Trustees | ||||||||||
| Dawn M. Vroegop (1966) |
Trustee and Chair of the Board | Indefinite; From December 2000 (Trust I)/May 2009 (Trust II) to present as Trustee; From May 2016 (Trust I and Trust II) until present as Chair |
Retired; Private Investor. | 73 | Trustee, Driehaus Mutual Funds (8 portfolios).** | |||||
| Stephen M. Alderman (1959) |
Trustee | Indefinite; From December 2000 (Trust I)/April 2012 (Trust II) to present | Vice President and General Counsel, IHR Aerial Solutions, LLC; Until 2022, General Counsel, Illini Hi-Reach, Inc.; Until 2020, Shareholder in the law firm of Garfield & Merel, Ltd. | 73 | None | |||||
| Robert J. Boulware (1956) |
Trustee | Indefinite; From March 2008 (Trust I)/April 2012 (Trust II) to present | Managing Member, Pilgrim Funds, LLC (private equity fund). | 73 | Trustee, Vertical Capital Income Fund (closed-end fund);** Trustee, The Private Shares Fund (closed-end fund);** Until 2021, Director, Mid-Con Energy Partners, LP (energy);** Until 2020, Director, Gainsco, Inc. (auto insurance).** | |||||
BHFTII-49
Brighthouse Funds Trust II
Trustees and Officers—(Continued)
| Name and Year of Birth |
Position(s) |
Term of Office |
Principal Occupation(s) During the Past |
Number of |
Other Directorships Held | |||||
| Susan C. Gause (1952) |
Trustee | Indefinite; From March 2008 (Trust I)/April 2012 (Trust II) to present | Private Investor. | 73 | Trustee, HSBC Funds (4 portfolios).** | |||||
| Nancy Hawthorne (1951) |
Trustee | Indefinite; From May 2003 (Trust II)/April 2012 (Trust I) to present | Private Investor. | 73 | Trustee, First Eagle Credit Opportunities Fund;** Trustee and Chair of the Board of Trustees, First Eagle Global Opportunities Fund;** Director, Avid Technology, Inc;** Director, CRA International, Inc.** | |||||
Executive Officers of the Trusts
| Name and Year of Birth |
Position(s) |
Term of Office |
Principal Occupation(s) | |||
| Kristi Slavin (1973) | President and Chief Executive Officer, of Trust I and Trust II | From May 2016 (Trust I and Trust II) to present |
President, Brighthouse Investment Advisers, LLC (2016-present). | |||
| Alan R. Otis (1971) | Chief Financial Officer and Treasurer, of Trust I and Trust II | From November 2017 (Trust I and Trust II) to present |
Executive Vice President, Brighthouse Investment Advisers, LLC (2017-present); formerly, Vice President, Brighthouse Investment Advisers, LLC (2012-2017); Assistant Treasurer, Trust I and Trust II (2012-2017). | |||
| Thomas Watterson (1985) | Secretary, of Trust I and Trust II | From November 2023 (Trust I and Trust II) to present |
Executive Vice President, Chief Legal Officer and Secretary, Brighthouse Investment Advisers, LLC (2023-Present); Managing Corporate Counsel, Brighthouse Financial Inc. (2023-present); Managing Counsel and Director, The Bank of New York Mellon Corporation (2019-2023); Counsel and Vice President, The Bank of New York Mellon Corporation (2016-2019). | |||
| Katie Hellmann (1980) | Chief Compliance Officer (“CCO”), of Trust I and Trust II | From May 2023 (Trust I and Trust II) to present |
Chief Compliance Officer, Brighthouse Investment Advisers, LLC (2023-present) and Head of Funds and Investments Compliance (2023-present). Deputy Chief Compliance Officer, Transamerica Asset Management (2022-2023). Leader and Senior Compliance Counsel – Funds Compliance, Edward Jones (2017-2022). | |||
| Rosemary Morgan (1983) | Anti-Money Laundering Officer, of Trust I and Trust II | From May 2023 (Trust I and Trust II) to present |
Chief Privacy Officer, Leader of Compliance Programs and Assistant General Counsel, Brighthouse Financial, Inc. (2019-2022); Chief Privacy Officer, Head of Compliance Programs & Contracts Law, Brighthouse Financial, Inc. (2022-2023), Chief Compliance Officer and Associate General Counsel, Brighthouse Financial, Inc. (2023-present); Vice President and Chief Compliance Officer, Brighthouse Life Insurance Company (2023-present); Vice President and Chief Compliance Officer (2023-present), Brighthouse Life Insurance Company of NY; Vice President and Chief Compliance Officer (2023-present), New England Life Insurance Company. | |||
| Anna Koska (1981) | Vice President, of Trust I and Trust II | From June 2022 (Trust I and Trust II) to present |
Vice President, Investment and Advisory Services, Brighthouse Investment Advisers, LLC (2022-present); Director of Investment and Advisory Services, Brighthouse Investment Advisers, LLC (2019-2022); Senior Portfolio Analyst, Brighthouse Investment Advisers, LLC (2017-2019). | |||
| * | Mr. Rosenthal is an “interested person” of the Trusts because of his position with Brighthouse Financial, Inc. (“Brighthouse Financial”), an affiliate of BIA. |
| ** | Indicates a directorship with a registered investment company or a company subject to the reporting requirements of the Securities Exchange Act of 1934, as amended. |
| (1) | Previous positions during the past five years with the Trusts, MetLife, Inc. or the Adviser are omitted if not materially different. |
| (2) | The Fund Complex includes 44 Trust I Portfolios and 29 Trust II Portfolios. |
BHFTII-50
Brighthouse Funds Trust II
Western Asset Management Strategic Bond Opportunities Portfolio
Board of Trustees’ Consideration of Advisory and Sub-Advisory Agreements
At a meeting held on November 13-14, 2023 (the “November Meeting”), the Boards of Trustees (the “Board”) of Brighthouse Funds Trust I and Brighthouse Funds Trust II (“BFT I” and “BFT II,” respectively, and collectively, the “Trusts”), including a majority of the Trustees who are not “interested persons” of the Trusts (the “Independent Trustees”) under the Investment Company Act of 1940 (the “1940 Act”), approved the continuation of the Trusts’ advisory agreements (each an “Advisory Agreement”) with Brighthouse Investment Advisers, LLC (the “Adviser”) and the applicable sub-advisory and sub-sub-advisory agreements (each a “Sub-Advisory Agreement” and collectively with the Advisory Agreement, the “Agreements”) between the Adviser and the investment sub-advisers and sub-sub-adviser (each a “Sub-Adviser,” and collectively, the “Sub-Advisers”) for the series of the Trusts (each a “Portfolio,” and collectively, the “Portfolios”) for the annual contract renewal period from January 1, 2024 through December 31, 2024.
The Board met with personnel of the Adviser on September 28-29, 2023 (the “September Meeting”) for the specific purpose of giving preliminary consideration to the proposed continuation of the Agreements, including consideration to information that the Adviser and Sub-Advisers had provided for the Board’s review at the request of the Independent Trustees. At the September Meeting, the Adviser reviewed with the Board the performance and fees experienced by each Portfolio, as well as other information. During and after the September Meeting, the Independent Trustees requested additional information and clarifications that the Adviser addressed at the November Meeting (the September Meeting and the November Meeting are referred to collectively as, the “Meetings”). During the contract renewal process, and throughout the year, the Independent Trustees were advised by independent legal counsel, and they met with independent legal counsel in executive sessions outside of the presence of management on a number of occasions to discuss, among other things, the renewal of the Agreements.
In considering the continuation of the Agreements, the Board reviewed a variety of materials that were provided for the specific purpose of assisting the Board in the renewal process, along with various information and materials that were provided to and discussed with the Board throughout the year, at regularly scheduled meetings of the Board and its committees. In particular, information for each Portfolio included, but was not limited to, reports on investment performance, expenses, legal and compliance matters, and asset pricing. Information about the Adviser and each Sub-Adviser included, but was not limited to, reports on the business, operations, and performance of the Adviser and the Sub-Advisers and reports that the Adviser and Sub-Advisers had prepared specifically for the renewal process.
In considering the continuation of the Agreements, the Board also reviewed, among other things, a report for each Portfolio that was prepared by Broadridge (“Broadridge”), an independent organization, which set forth comparative performance and expense information for each Portfolio. In addition, the Independent Trustees reviewed a report that was prepared by JDL Consultants, LLC (“JDL”), an independent consultant to the Independent Trustees, which examined the Broadridge reports for each Portfolio (“JDL Report”). The Independent Trustees met in executive session with representatives of JDL during the September Meeting to review the JDL Report.
At the November Meeting, the Board, including a majority of the Independent Trustees, concluded that the nature, extent, and quality of services provided by the Adviser and each Sub-Adviser supported the renewal of the Agreements. The Board also concluded that the investment services provided to and the performance of each Portfolio was such that each Agreement should continue, and that the fees paid by each Portfolio to the Adviser appeared to be reasonable in light of the nature, extent, and quality of the services provided by the Adviser and each Sub-Adviser. Further, the Board concluded that the Adviser’s profitability in providing services under the Advisory Agreements did not appear unreasonable in light of the nature, extent, and quality of the services provided by the Adviser. The Board reviewed the extent to which the investment advisory fees paid by the Portfolios shared economies of scale with investors or entailed the potential to share economies of scale with investors and concluded that those considerations generally supported the renewal of each Agreement. Finally, the Board considered the Adviser’s recommendation that it approve the renewal of each Sub-Advisory Agreement.
In approving the continuation of each Agreement, the Board, including the Independent Trustees, gave attention to all of the information that was furnished, and each Trustee placed varying degrees of importance on the various pieces of information that were provided to them. The Board evaluated the information provided to it on a Portfolio-by-Portfolio basis, and its decision was made separately with respect to each Portfolio. The following paragraphs provide more information about some of the primary factors that were relevant to the Board’s decisions. The Board did not identify any single factor as determinative, and the Trustees generally attributed different weights to various factors for the various Portfolios.
Nature, extent and quality of services. The Board evaluated the nature, extent, and quality of the services that the Adviser and the Sub-Advisers, as relevant, provided to the Portfolios. The Board considered the Adviser’s services as investment manager to the Portfolios, including its services relating to the hiring and oversight of the Sub-Advisers and, in particular, their investment programs and personnel, succession management of key personnel, trading practices, compliance programs and personnel, and risk management
BHFTII-51
Brighthouse Funds Trust II
Western Asset Management Strategic Bond Opportunities Portfolio
Board of Trustees’ Consideration of Advisory and Sub-Advisory Agreements—(Continued)
programs, among other things. The Adviser’s services in coordinating and overseeing the activities of the Trusts’ other service providers were also considered. The Board also considered the systems and processes required by the Adviser to meet additional regulatory and compliance requirements resulting from U.S. Securities and Exchange Commission and other regulatory initiatives, including related to liquidity, valuation, and derivatives risk management. The Board considered information received from the Trusts’ Chief Compliance Officer regarding the Portfolios’ compliance policies and procedures that were established pursuant to Rule 38a-l under the 1940 Act, and relevant aspects of the Adviser’s and Sub-Advisers’ compliance policies and procedures. The Board also noted that it was the practice of the Adviser’s investment, compliance, and legal staff to conduct periodic meetings (through various media) with the Sub-Advisers throughout the year in order to review and assess the services that are provided to the Portfolios, and that personnel of the Adviser routinely prepare and present reports to the Board regarding those meetings. In addition, during the Meetings and throughout the year, the Board considered the expertise, experience, and performance of the personnel of the Adviser who performed the various services that are mentioned above.
With respect to the services provided by each of the Sub-Advisers, the Board considered a variety of information that the Adviser and each Sub-Adviser prepared for the Board’s review. The Board considered each Sub-Adviser’s investment process, each Sub-Adviser’s overall organization and business plans and the investment performance experienced by the Portfolio (as described in more detail below). The Board took into account that each Sub-Adviser’s responsibilities include, among other things, the development and maintenance of an investment program for the applicable Portfolio, the selection of investments and the placement of orders for the purchase and sale of such assets, and the implementation of compliance controls related to the performance of these services. The Board considered, based on the information provided, each Sub-Adviser’s staffing with respect to the management of the Portfolio and other information relating to the Sub-Adviser’s business and operations. The Board also considered the Sub-Adviser’s overall resources and information with respect to any recent turnover of key personnel at the Sub-Adviser. The Board reviewed each Sub-Adviser’s investment experience, as well as information provided regarding the Sub-Adviser’s personnel who provide services to the Portfolios. The Board also considered, among other things, information about each Sub-Adviser’s compliance program, including regarding any compliance matters involving a Sub-Adviser that had been brought to the Board’s attention during the year, as well as the Adviser’s assessment of the financial condition of each Sub-Adviser.
Performance. The Board placed emphasis on the performance of each Portfolio in the context of the performance of the relevant markets in which the Portfolio invests. The Board considered the Adviser’s quarterly presentations to the Board of detailed information about each Portfolio’s investment strategies and performance results and composition, including discussions regarding the relevant effects of market conditions. The Board reviewed and considered the reports prepared by Broadridge, which provided a statistical analysis comparing each Portfolio’s investment performance to that of comparable funds underlying variable insurance products (the “Performance Universe”), and the JDL Report. The Board also compared the performance of each Portfolio to that of comparable funds and other accounts that were managed by the relevant Sub-Adviser, to the extent such information was provided. The Board considered each Portfolio’s performance for periods subsequent to the performance period covered by the Broadridge reports and considered the Adviser’s assessment of the same. The Board also noted that while it found the data provided by Broadridge generally useful, it recognized the limitations of such data, including, in particular, that notable differences may exist between a Portfolio and the other funds in a Broadridge category (for example, with respect to investment strategies) and that the results of the performance comparisons may vary depending on (i) the end dates for the performance periods that were selected and (ii) the selection of the peer groups.
The Board focused particular attention on Portfolios with less favorable performance records. The Board noted the Adviser’s focus on each Sub-Adviser’s performance and that the Adviser had been active in monitoring and responding to any performance issues with respect to the Portfolios.
Fees and Expenses. The Board gave consideration to the level and method of computing the fees payable under the Agreements. The Board reviewed and considered the information in the JDL Report concerning fees and expenses. The Board also reviewed and considered the Broadridge report for each Portfolio, which included various comparisons of the Portfolio’s fees (at December 31, 2022 and various asset levels) and expenses with those of its peers, including, as applicable, a broad group of peer funds (“Expense Universe”), a narrower group of peer funds (“Expense Group”), a broad group of peer sub-advised funds (“Sub-advised Expense Universe”), and a narrower group of peer sub-advised funds (“Sub-advised Expense Group”). In particular, the Board reviewed comparisons of each Portfolio’s contractual management fees with its Expense Group and Sub-advised Expense Universe, contractual sub-adviser fees with its Sub-advised Expense Universe and Sub-advised Expense Group, and total expenses with its Expense Universe, Expense Group and Sub-advised Expense Universe. The Board considered that Broadridge selected the peer funds, which were funds underlying variable insurance products that Broadridge deemed to be comparable to the Portfolios. The Board considered that the fee and expense information in the Broadridge report for each Portfolio reflected information as of the Portfolio’s most recent fiscal year
BHFTII-52
Brighthouse Funds Trust II
Western Asset Management Strategic Bond Opportunities Portfolio
Board of Trustees’ Consideration of Advisory and Sub-Advisory Agreements—(Continued)
end at the time the Broadridge report was issued and that historical asset levels may differ from current asset levels, particularly in a period of market volatility. In addition, the Board compared the fee payable to a Sub-Adviser by the Adviser with respect to the Portfolio to the fee payable to the Sub-Adviser by other comparable funds and other accounts, to the extent such information was provided.
The Board noted that the sub-advisory fees for the Portfolios are negotiated at arm’s length by the Adviser and are paid by the Adviser out of its advisory fees. The Board also considered that the Adviser had entered into expense limitation or management fee waiver agreements with certain of the Portfolios pursuant to which the Adviser had agreed to waive a portion of its advisory fee and/or reimburse certain expenses as a means of limiting a Portfolio’s total annual operating expenses or passing through the benefit of a subadvisory fee concession to a Portfolio, as applicable.
Profitability. The Board examined the profitability to the Adviser of each Advisory Agreement, on a Portfolio-by-Portfolio basis. The Board also considered that an affiliate of the Adviser, Brighthouse Securities, LLC, serves as distributor for the Trusts, and, as such, receives Rule 12b-1 payments to support the distribution of the Portfolios. The Board considered the profitability to the Sub-Advisers and their affiliates of their relationships with the Portfolios, to the extent provided, and the Board considered the ability of the Adviser to negotiate with a Sub-Adviser at arm’s length. In reviewing the profitability information, the Board recognized that expense allocation methodologies are inherently subjective and various methodologies may be reasonable while producing different results.
Economies of scale. The Board considered each Portfolio’s fees in light of its size. The Board noted the fee schedules for the Portfolios that contain breakpoints that reduce the fee rate above specified asset levels, including breakpoints in the Advisory Agreements and any corresponding Sub-Advisory Agreement. The Board noted those Portfolios that did not have breakpoints in their advisory fees and considered management’s explanation of the same.
The Board considered the effective fees under the Advisory Agreement and Sub-Advisory Agreement for each Portfolio as a percentage of assets at different asset levels and possible economies of scale that may be realized if the assets of the Portfolio grow. The Board examined, among other data, the effect of a Portfolio’s growth in size, and reduction in size, on various fee schedules. The Board also generally noted that if a Portfolio’s assets increase over time, the Portfolio may realize economies of scale if assets increase proportionally more than certain other expenses.
Other factors. The Board considered other benefits that may be realized by the Adviser and its affiliates from their relationships with the Trusts. Among the benefits realized by the Adviser, the Board recognized that Brighthouse Securities, LLC, as the distributor for the Trusts, receives payments pursuant to Rule 12b-1 from the Portfolios to help compensate for the provision of shareholder services and distribution activities. The Board considered that a Sub-Adviser may engage in soft dollar transactions in managing a Portfolio. In addition, the Board considered that a Sub-Adviser may be affiliated with registered broker-dealers that may, from time to time, receive brokerage commissions from a Portfolio in connection with the sale of portfolio securities (subject to applicable best execution obligations). The Board also considered that a Sub-Adviser and its affiliates could benefit from the opportunity to provide advisory services to additional portfolios of the Trusts and overall reputational benefits.
The Board considered information from the Adviser and Sub-Advisers pertaining to potential conflicts of interest, and the manner in which any potential conflicts were mitigated. In its review, the Board considered information regarding various business relationships among the Adviser and its affiliates and various Sub-Advisers and their affiliates. The Board also considered information about services and/or payments provided to the Adviser by the Sub-Advisers in connection with marketing activities. The Board considered representations from the Adviser that such business relationships and any payments were not considered in the Adviser’s recommendation to renew any of the Sub-Advisory Agreements.
* * * * *
Western Asset Management Strategic Bond Opportunities Portfolio. The Board also considered the following information in relation to the Agreement with the Adviser, Western Asset Management Company, LLC and Western Asset Management Company Pte. Ltd. regarding the Portfolio:
Among other data relating specifically to the Portfolio’s performance, the Board considered that the Portfolio underperformed the median of its Performance Universe and the average of its Morningstar Category for the one-, three-, and five-year periods ended June 30, 2023. The Board further considered that the Portfolio outperformed its benchmark, the Bloomberg U.S. Aggregate Bond Index, for the one-, three-, and five-year periods ended October 31, 2023. The Board also considered that the Portfolio outperformed its blended benchmark for the one-and three-year periods ended October 31, 2023 and underperformed its blended benchmark for the five-year period ended October 31, 2023. The Board took into account management’s discussion of the Portfolio’s performance,
BHFTII-53
Brighthouse Funds Trust II
Western Asset Management Strategic Bond Opportunities Portfolio
Board of Trustees’ Consideration of Advisory and Sub-Advisory Agreements—(Continued)
including with respect to prevailing market conditions. The Board also noted the presence of certain management fee waivers in effect for the Portfolio.
The Board also considered that the Portfolio’s actual management fees and total expenses (exclusive of 12b-1 fees) were below the Expense Group median, the Expense Universe median, and the Sub-advised Expense Universe median. The Board noted that the Portfolio’s contractual management fees were below the asset-weighted average of the Investment Classification/Morningstar Category selected by Broadridge at the Portfolio’s current size. The Board also noted that the Portfolio’s contractual sub-advisory fees were below the averages of the Sub-advised Expense Group and the Sub-advised Expense Universe at the Portfolio’s current size.
BHFTII-54
Brighthouse Funds Trust II
Western Asset Management U.S. Government Portfolio
Managed By Western Asset Management Company, LLC
Portfolio Manager Commentary*
PERFORMANCE
For the twelve months ended December 31, 2023, the Class A, B and E shares of the Western Asset Management U.S. Government Portfolio returned 4.87%, 4.59%, and 4.70%, respectively. The Portfolio’s benchmark, the Bloomberg U.S. Intermediate Government Bond Index¹, returned 4.30%.
MARKET ENVIRONMENT / CONDITIONS
2023 was marked by market volatility, including a significant rise—and subsequent sharp fall—in U.S. Treasury (“UST”) yields as well as spread-tightening across spread sectors. The market digested shifting fundamental crosscurrents including continued U.S. economic resilience, moderating inflation and a data-dependent U.S. Federal Reserve (the “Fed”) outlook. During the first quarter of 2023, developments in the regional banking sector came to the forefront when Silicon Valley Bank and Signature Bank were shut down after the banks failed to stem deposit outflows, but contagion risks were mitigated when the Federal Deposit Insurance Corporation guaranteed uninsured deposits. Midway through the year, strong economic momentum, continued signs of labor market tightness and higher fed funds rate expectations from the Federal Open Market Committee (“FOMC”) members revived a “higher-for-longer” fed funds narrative. Concerns over UST supply also put upward pressure on long-term yields with the 30- and 10-year yields surpassing the 5% mark for the first time since the global financial crisis. However, softer inflation readings ultimately set the stage for the Fed to slow the pace of rate hikes and ultimately hold the fed funds target rate range steady at 5.25% to 5.50% during the last three meetings of the year. The Fed’s December “dot plot” showed the median FOMC member was expecting 75 basis points in rate cuts during 2024. During the fourth quarter of 2023, optimism that the Fed might have succeeded in controlling inflation while averting an economic “hard landing”—coupled with the possibility of less restrictive policy rates next year—spurred UST yields to change course and plummet with the yield on the 10-year UST ultimately ending the year at 3.88%, close to where it began 2023.
PORTFOLIO REVIEW / PERIOD END POSITIONING
For the twelve-month period ended December 31, 2023, the Western Asset Management U.S. Government Portfolio had a positive return and outperformed its benchmark, the Bloomberg U.S. Intermediate Government Bond Index (the “Index”).
Over the twelve-month period, the most significant contributor to the Portfolio’s performance was its interest rate positioning, including both duration and yield curve. The Portfolio generally maintained a modest duration overweight, and tactically added at the start of the fourth quarter of the year, which contributed to performance as yields significantly fell. Tactical yield curve positioning that was generally overweight the intermediate and long end segments and underweight the front end (2-year Key Rate Duration) modestly contributed as yield curve movement was mixed, but the full yield curve (3-month to 30-year) ended flatter over the course of the reporting period. The second largest contributor to performance was the Portfolio’s tactical positioning in Agency Mortgage-Backed Securities (“MBS”) as spreads fluctuated but ultimately tightened during the period. The third largest contributor to performance was the Portfolio’s overweight exposure to structured products, including Non-Agency Residential MBS and Commercial MBS (“CMBS”), as structured product spreads were mostly tighter during the period. The fourth largest contributor was the Portfolio’s overweight exposure to Emerging Markets (“EM”) as U.S. dollar-denominated EM bond spreads tightened. Finally, exposures to Agency Debentures contributed as spreads tightened, particularly during the first half of 2023.
The Portfolio’s modest exposure to Treasury Inflation-Protected Securities (“TIPS”) was the main detractor from performance as breakeven inflation rates fluctuated but ultimately ended lower during the reporting period.
During the twelve-month period ended December 31, 2023, the Portfolio used interest rate futures to adjust its duration and yield curve exposure. The Portfolio also used Agency MBS derivatives to gain exposure to specific characteristics of Agency MBS. The net impact of all derivative transactions on the Portfolio’s performance was slightly negative.
BHFTII-1
Brighthouse Funds Trust II
Western Asset Management U.S. Government Portfolio
Managed By Western Asset Management Company, LLC
Portfolio Manager Commentary*—(Continued)
As of December 31, 2023, the Portfolio continued to be overweight duration and spread products. It was underweight U.S. Treasuries relative to the Index. The Portfolio was overweight Agency Debentures and modestly overweight Agency MBS. At period-end, the Portfolio also held out-of-benchmark exposures to EM Debt, structured products (including Non-Agency Residential MBS and CMBS) and TIPS.
Fredrick Marki
S. Kenneth Leech
Mark S. Lindbloom
Portfolio Managers
Western Asset Management Company, LLC
* This commentary may include statements that constitute “forward-looking statements” under the U.S. securities laws. Forward-looking statements include, among other things, projections, estimates, and information about possible or future results related to the Portfolio, market or regulatory developments. The views expressed above are not guarantees of future performance or economic results and involve certain risks, uncertainties and assumptions that could cause actual outcomes and results to differ materially from the views expressed herein. The views expressed above are subject to change at any time based upon economic, market, or other conditions and the subadvisory firm undertakes no obligation to update the views expressed herein. Any discussions of specific securities should not be considered a recommendation to buy or sell those securities. The views expressed above (including any forward-looking statement) may not be relied upon as investment advice or as an indication of the Portfolio’s trading intent. Information about the Portfolio’s holdings, asset allocation or country diversification is historical and is not an indication of future Portfolio composition, which may vary. Direct investment in any index is not possible. The performance of any index mentioned in this commentary has not been adjusted for ongoing management, distribution and operating expenses, and sales charges applicable to mutual fund investments. In addition, the returns do not reflect additional fees charged by separate accounts or variable insurance contracts that an investor in the Portfolio may pay. If these additional fees were reflected, performance would have been lower.
1 The Bloomberg U.S. Intermediate Government Bond Index includes most obligations of the U.S. Treasury, agencies and quasi-federal corporations having maturities between one and ten years.
BHFTII-2
Brighthouse Funds Trust II
Western Asset Management U.S. Government Portfolio
A $10,000 INVESTMENT COMPARED TO THE BLOOMBERG U.S. INTERMEDIATE GOVERNMENT BOND INDEX
AVERAGE ANNUAL RETURNS (%) FOR THE YEAR ENDED DECEMBER 31, 2023
| 1 Year | 5 Year | 10 Year | ||||||||||
| Western Asset Management U.S. Government Portfolio | ||||||||||||
| Class A |
4.87 | 0.95 | 1.23 | |||||||||
| Class B |
4.59 | 0.70 | 0.98 | |||||||||
| Class E |
4.70 | 0.81 | 1.07 | |||||||||
| Bloomberg U.S. Intermediate Government Bond Index | 4.30 | 1.03 | 1.24 | |||||||||
Portfolio performance is calculated including reinvestment of all income and capital gain distributions. Performance numbers are net of all Portfolio expenses but do not include any insurance, sales, separate account or administrative charges of variable annuity or life insurance contracts or any additional expenses that participants may bear relating to the operations of their plans. If these charges were included, the returns would be lower. The performance of any index referenced above has not been adjusted for ongoing management, distribution and operating expenses, and sales charges applicable to mutual fund investments. Direct investment in any index is not possible. The performance of Class A shares, as set forth in the line graph above, will differ from that of other classes because of the difference in expenses paid by policyholders investing in the different share classes.
This information represents past performance and is not indicative of future results. Investment return and principal value may fluctuate so that shares, upon redemption, may be worth more or less than the original cost.
PORTFOLIO COMPOSITION AS OF DECEMBER 31, 2023
Top Sectors
| % of Net Assets |
||||
| U.S. Treasury & Government Agencies | 50.1 | |||
| Agency Mortgage-Backed Securities | 36.7 | |||
| Foreign Government | 5.1 | |||
| Corporate Bonds & Notes | 4.3 | |||
| Non-Agency Mortgage-Backed Securities | 3.8 | |||
BHFTII-3
Brighthouse Funds Trust II
Western Asset Management U.S. Government Portfolio
Understanding Your Portfolio’s Expenses
Shareholder Expense Example
As a shareholder of the Portfolio, you incur ongoing costs, including management fees; distribution and service (12b-1) fees; and other Portfolio expenses. This example is intended to help you understand your ongoing costs (in dollars) (referred to as “expenses”) of investing in the Portfolio and compare these costs with the ongoing costs of investing in other mutual funds. The example is based on an investment of $1,000 invested at the beginning of the period and held for the entire period, July 1, 2023 through December 31, 2023.
Actual Expenses
The first line for each share class of the Portfolio in the table below provides information about actual account values and actual expenses. You may use the information in this line, together with the amount you invested in the particular share class of the Portfolio, to estimate the expenses that you paid over the period. Simply divide your account value by $1,000 (for example, an $8,600 account value divided by $1,000 = 8.6), then multiply the result by the number in the first line under the heading entitled “Expenses Paid During Period” to estimate the expenses you paid on your account during this period.
Hypothetical Example for Comparison Purposes
The second line for each share class of the Portfolio in the table below provides information about hypothetical account values and hypothetical expenses based on the Portfolio’s actual expense ratio and an assumed rate of return of 5% per year before expenses, which is not the Portfolio’s actual return. The hypothetical account values and expenses may not be used to estimate the actual ending account balance or expenses you paid for the period. You may use this information to compare the ongoing costs of investing in the Portfolio and other funds. To do so, compare this 5% hypothetical example with the 5% hypothetical examples that appear in the shareholder reports of the other funds.
Please note that the expenses shown in the table are meant to highlight your ongoing costs only and do not reflect any fees or charges of your variable insurance product or any additional expenses that participants in certain eligible qualified plans may bear relating to the operations of their plan. Therefore, the second line for each share class in the table is useful in comparing ongoing costs only, and will not help you determine the relative total costs of owning different funds. In addition, if these other costs were included, your costs would have been higher.
| Western Asset Management U.S. Government Portfolio |
Annualized Expense Ratio |
Beginning Account Value July 1, 2023 |
Ending Account Value December 31, 2023 |
Expenses Paid During Period** July 1, 2023 to December 31, 2023 |
||||||||||||||
| Class A (a) | Actual | 0.50 | % | $ | 1,000.00 | $ | 1,031.30 | $ | 2.56 | |||||||||
| Hypothetical* | 0.50 | % | $ | 1,000.00 | $ | 1,022.69 | $ | 2.55 | ||||||||||
| Class B (a) |
Actual | 0.75 | % | $ | 1,000.00 | $ | 1,030.50 | $ | 3.84 | |||||||||
| Hypothetical* | 0.75 | % | $ | 1,000.00 | $ | 1,021.43 | $ | 3.82 | ||||||||||
| Class E (a) | Actual | 0.65 | % | $ | 1,000.00 | $ | 1,031.40 | $ | 3.33 | |||||||||
| Hypothetical* | 0.65 | % | $ | 1,000.00 | $ | 1,021.93 | $ | 3.31 | ||||||||||
| * | Hypothetical assumes a rate of return of 5% per year before expenses. |
| ** | Expenses paid are equal to the Portfolio’s annualized expense ratio for the most recent six month period, as shown above, multiplied by the average account value over the period, multiplied by the number of days (184 days) in the most recent fiscal half-year, divided by 365 (to reflect the one-half year period). |
| (a) | The annualized expense ratio shown reflects the impact of the management fee waiver as described in Note 6 of the Notes to Financial Statements. |
BHFTII-4
Brighthouse Funds Trust II
Western Asset Management U.S. Government Portfolio
Schedule of Investments as of December 31, 2023
U.S. Treasury & Government Agencies—86.8% of Net Assets
| Security Description | Principal Amount* |
Value | ||||||
| Agency Sponsored Mortgage—Backed—36.7% | ||||||||
| Federal Home Loan Mortgage Corp. |
||||||||
| 1.500%, 05/01/41 |
3,808,616 | $ | 3,161,950 | |||||
| 1.500%, 07/01/41 |
2,809,701 | 2,328,268 | ||||||
| 1.500%, 10/01/41 |
679,484 | 563,049 | ||||||
| 1.500%, 11/01/41 |
85,732 | 71,041 | ||||||
| 2.000%, 10/01/40 |
2,322,546 | 1,999,044 | ||||||
| 2.000%, 07/01/41 |
2,267,487 | 1,945,283 | ||||||
| 2.000%, 09/01/41 |
3,356,836 | 2,872,929 | ||||||
| 2.000%, 11/01/41 |
1,413,864 | 1,216,433 | ||||||
| 2.000%, 12/01/41 |
2,998,686 | 2,562,307 | ||||||
| 2.000%, 01/01/42 |
2,458,818 | 2,100,981 | ||||||
| 2.000%, 08/01/42 |
2,512,931 | 2,145,655 | ||||||
| 2.000%, 11/01/50 |
844,154 | 702,356 | ||||||
| 2.000%, 02/01/51 |
2,170,376 | 1,802,640 | ||||||
| 2.000%, 03/01/51 |
2,292,417 | 1,906,344 | ||||||
| 2.000%, 04/01/51 |
1,968,534 | 1,641,369 | ||||||
| 2.000%, 05/01/51 |
3,531,610 | 2,918,186 | ||||||
| 2.000%, 06/01/51 |
4,580,054 | 3,780,602 | ||||||
| 2.000%, 08/01/51 |
1,260,767 | 1,032,496 | ||||||
| 2.000%, 11/01/51 |
515,686 | 427,615 | ||||||
| 2.000%, 02/01/52 |
90,064 | 74,661 | ||||||
| 2.106%, 5Y H15 + 1.285%, 03/01/47 (a) |
244,756 | 228,086 | ||||||
| 2.500%, 04/01/41 |
147,778 | 131,570 | ||||||
| 2.500%, 06/01/50 |
119,540 | 102,784 | ||||||
| 2.500%, 10/01/50 |
1,088,445 | 943,044 | ||||||
| 2.500%, 11/01/50 |
3,529,847 | 3,056,289 | ||||||
| 2.500%, 12/01/50 |
3,911,841 | 3,381,028 | ||||||
| 2.500%, 01/01/51 |
1,113,049 | 954,291 | ||||||
| 2.500%, 02/01/51 |
130,851 | 112,019 | ||||||
| 2.500%, 03/01/51 |
215,523 | 187,476 | ||||||
| 2.500%, 05/01/51 |
155,345 | 135,259 | ||||||
| 2.500%, 07/01/51 |
4,539,248 | 3,892,027 | ||||||
| 2.500%, 08/01/51 |
2,913,662 | 2,511,714 | ||||||
| 2.500%, 09/01/51 |
1,461,779 | 1,262,186 | ||||||
| 2.500%, 11/01/51 |
1,448,574 | 1,248,410 | ||||||
| 2.500%, 01/01/52 |
13,393,179 | 11,535,567 | ||||||
| 2.500%, 02/01/52 |
1,139,175 | 981,939 | ||||||
| 2.500%, 03/01/52 |
619,693 | 533,897 | ||||||
| 2.871%, 1Y RFUCCT + 1.619%, 11/01/47 (a) |
926,953 | 889,179 | ||||||
| 3.000%, 09/01/32 |
163,712 | 156,579 | ||||||
| 3.000%, 04/01/38 |
320,450 | 296,915 | ||||||
| 3.000%, 10/01/46 |
251,394 | 228,858 | ||||||
| 3.000%, 04/01/47 |
446,599 | 405,544 | ||||||
| 3.000%, 09/01/48 |
1,048,025 | 944,696 | ||||||
| 3.000%, 09/01/49 |
3,089,182 | 2,784,339 | ||||||
| 3.000%, 11/01/49 |
677,213 | 609,693 | ||||||
| 3.000%, 01/01/50 |
42,483 | 38,494 | ||||||
| 3.000%, 03/01/50 |
60,994 | 54,905 | ||||||
| 3.000%, 05/01/50 |
175,085 | 157,785 | ||||||
| 3.000%, 03/01/52 |
533,337 | 471,891 | ||||||
| 3.000%, 04/01/52 |
809,899 | 716,547 | ||||||
| 3.006%, 1Y RFUCCT + 1.628%, 11/01/48 (a) |
3,129,229 | 2,967,149 | ||||||
| 3.098%, 1Y RFUCCT + 1.621%, 02/01/50 (a) |
1,539,274 | 1,458,856 | ||||||
| 3.500%, 04/01/33 |
1,487,154 | 1,446,636 | ||||||
| 3.500%, 01/01/38 |
1,778,495 | 1,689,852 | ||||||
| 3.500%, 10/01/42 |
377,134 | 354,300 | ||||||
| Agency Sponsored Mortgage—Backed—(Continued) | ||||||||
| Federal Home Loan Mortgage Corp. |
||||||||
| 3.500%, 02/01/44 |
148,045 | 138,715 | ||||||
| 3.500%, 06/01/46 |
248,369 | 233,190 | ||||||
| 3.500%, 07/01/47 |
3,997,311 | 3,730,311 | ||||||
| 3.500%, 01/01/48 |
80,298 | 74,934 | ||||||
| 3.500%, 04/01/52 |
1,612,215 | 1,492,089 | ||||||
| 4.000%, 04/01/43 |
514,855 | 500,236 | ||||||
| 4.000%, 07/01/43 |
1,406,873 | 1,370,406 | ||||||
| 4.000%, 08/01/43 |
1,472,316 | 1,427,336 | ||||||
| 4.220%, 08/01/33 |
100,000 | 97,456 | ||||||
| 4.500%, 06/01/38 |
446,098 | 448,072 | ||||||
| 4.500%, 04/01/47 |
264,832 | 261,003 | ||||||
| 4.500%, 05/01/47 |
243,666 | 240,987 | ||||||
| 4.500%, 06/01/47 |
443,667 | 440,238 | ||||||
| 4.500%, 04/01/49 |
216,402 | 213,132 | ||||||
| 4.500%, 06/01/52 |
3,943,594 | 3,841,153 | ||||||
| 5.000%, 08/01/33 |
7,985 | 8,126 | ||||||
| 5.000%, 01/01/36 |
10,109 | 10,272 | ||||||
| 5.000%, 01/01/40 |
7,191 | 7,279 | ||||||
| 5.000%, 04/01/41 |
9,009 | 9,168 | ||||||
| 5.000%, 06/01/41 |
930,646 | 936,878 | ||||||
| 5.000%, 04/01/44 |
16,721 | 16,944 | ||||||
| 5.000%, 07/01/52 |
1,798,503 | 1,781,599 | ||||||
| 5.000%, 12/01/52 |
374,317 | 370,625 | ||||||
| 5.000%, 01/01/53 |
1,010,152 | 1,000,658 | ||||||
| 5.000%, 03/01/53 |
564,715 | 561,605 | ||||||
| 5.000%, 04/01/53 |
779,509 | 771,473 | ||||||
| 5.000%, 05/01/53 |
1,257,451 | 1,252,861 | ||||||
| 5.500%, 04/01/53 |
2,288,219 | 2,299,494 | ||||||
| 5.500%, 05/01/53 |
285,490 | 287,305 | ||||||
| 5.500%, 07/01/53 |
392,910 | 394,923 | ||||||
| 5.500%, 08/01/53 |
1,247,615 | 1,253,726 | ||||||
| 5.500%, 09/01/53 |
496,984 | 500,034 | ||||||
| 6.000%, 10/01/36 |
240,315 | 249,874 | ||||||
| 6.000%, 07/01/53 |
191,654 | 196,650 | ||||||
| 6.000%, 09/01/53 |
984,823 | 1,005,974 | ||||||
| 6.500%, 09/01/39 |
82,991 | 87,119 | ||||||
| 8.000%, 09/01/30 |
1,110 | 1,157 | ||||||
| Federal Home Loan Mortgage Corp. Multifamily Structured Pass-Through Certificates |
62,986,701 | 979,607 | ||||||
| 0.482%, 01/25/34 (a) (b) |
52,258,136 | 1,756,856 | ||||||
| 0.508%, 01/25/29 (a) (b) |
84,798,929 | 1,886,072 | ||||||
| 0.743%, 09/25/27 (a) (b) |
16,705,738 | 390,390 | ||||||
| 0.850%, 11/25/30 (a) (b) |
31,716,530 | 1,414,043 | ||||||
| 0.879%, 11/25/30 (a) (b) |
41,737,809 | 1,970,425 | ||||||
| 3.291%, 03/25/27 |
4,670,000 | 4,492,911 | ||||||
| Federal Home Loan Mortgage Corp. REMICS |
1,595,985 | 214,982 | ||||||
| 2.500%, 05/25/50 (b) |
705,051 | 109,248 | ||||||
| 2.500%, 01/25/51 (b) |
22,162,926 | 3,511,414 | ||||||
| 4.500%, 04/15/32 |
105,829 | 104,140 | ||||||
| 6.000%, 05/15/36 |
162,940 | 170,865 | ||||||
| Federal Home Loan Mortgage Corp. STACR REMICS Trust |
2,222,108 | 2,214,837 | ||||||
| 6.637%, SOFR30A + 1.300%, 02/25/42 (144A) (a) |
2,044,842 | 2,044,850 | ||||||
| 6.837%, SOFR30A + 1.500%, 10/25/41 (144A) (a) |
2,270,000 | 2,250,139 | ||||||
| 7.437%, SOFR30A + 2.100%, 10/25/33 (144A) (a) |
980,000 | 983,092 | ||||||
| 7.737%, SOFR30A + 2.400%, 02/25/42 (144A) (a) |
3,420,000 | 3,460,532 | ||||||
BHFTII-5
See accompanying notes to financial statements.
Brighthouse Funds Trust II
Western Asset Management U.S. Government Portfolio
Schedule of Investments as of December 31, 2023
U.S. Treasury & Government Agencies—(Continued)
| Security Description | Principal Amount* |
Value | ||||||
| Agency Sponsored Mortgage—Backed—(Continued) | ||||||||
| Federal Home Loan Mortgage Corp. Structured Agency Credit Risk Debt Notes |
||||||||
| 7.637%, SOFR30A + 2.300%, 08/25/33 (144A) (a) |
1,735,270 | $ | 1,751,570 | |||||
| Federal National Mortgage Association |
||||||||
| 1.500%, 04/01/41 |
318,196 | 264,689 | ||||||
| 2.000%, 08/01/40 |
68,085 | 58,611 | ||||||
| 2.000%, 11/01/41 |
3,941,605 | 3,389,216 | ||||||
| 2.000%, 12/01/41 |
170,700 | 145,885 | ||||||
| 2.000%, 06/01/42 |
3,681,303 | 3,143,900 | ||||||
| 2.000%, 08/01/42 |
1,063,462 | 906,140 | ||||||
| 2.000%, 08/01/50 |
128,975 | 107,594 | ||||||
| 2.000%, 09/01/50 |
208,509 | 172,083 | ||||||
| 2.000%, 10/01/50 |
1,278,903 | 1,051,994 | ||||||
| 2.000%, 12/01/50 |
2,667,592 | 2,195,026 | ||||||
| 2.000%, 01/01/51 |
6,185,657 | 5,141,598 | ||||||
| 2.000%, 02/01/51 |
4,239,508 | 3,515,264 | ||||||
| 2.000%, 03/01/51 |
7,718,239 | 6,393,515 | ||||||
| 2.000%, 04/01/51 |
4,512,067 | 3,713,396 | ||||||
| 2.000%, 05/01/51 |
3,576,233 | 2,931,708 | ||||||
| 2.000%, 08/01/51 |
942,600 | 776,884 | ||||||
| 2.000%, 10/01/51 |
1,903,179 | 1,582,780 | ||||||
| 2.000%, 02/01/52 |
958,322 | 794,639 | ||||||
| 2.000%, 03/01/52 |
4,903,655 | 4,057,019 | ||||||
| 2.149%, 02/01/32 (a) |
437,412 | 367,985 | ||||||
| 2.500%, 10/01/40 |
2,757,262 | 2,455,071 | ||||||
| 2.500%, 03/01/41 |
452,946 | 403,276 | ||||||
| 2.500%, 04/01/41 |
775,992 | 690,893 | ||||||
| 2.500%, 05/01/41 |
1,758,426 | 1,568,880 | ||||||
| 2.500%, 06/01/50 |
423,719 | 364,870 | ||||||
| 2.500%, 10/01/50 |
2,339,049 | 2,004,524 | ||||||
| 2.500%, 11/01/50 |
411,605 | 355,385 | ||||||
| 2.500%, 12/01/50 |
209,787 | 180,174 | ||||||
| 2.500%, 01/01/51 |
305,596 | 264,101 | ||||||
| 2.500%, 02/01/51 |
1,680,698 | 1,444,586 | ||||||
| 2.500%, 03/01/51 |
368,885 | 318,782 | ||||||
| 2.500%, 04/01/51 |
690,316 | 597,089 | ||||||
| 2.500%, 05/01/51 |
1,542,858 | 1,320,270 | ||||||
| 2.500%, 06/01/51 |
2,590,165 | 2,231,768 | ||||||
| 2.500%, 07/01/51 |
2,437,805 | 2,107,470 | ||||||
| 2.500%, 08/01/51 |
836,632 | 721,071 | ||||||
| 2.500%, 09/01/51 |
2,178,684 | 1,882,464 | ||||||
| 2.500%, 10/01/51 |
3,219,181 | 2,768,398 | ||||||
| 2.500%, 11/01/51 |
1,405,926 | 1,215,415 | ||||||
| 2.500%, 12/01/51 |
8,308,342 | 7,149,720 | ||||||
| 2.500%, 01/01/52 |
3,455,811 | 2,967,334 | ||||||
| 2.500%, 02/01/52 |
3,303,480 | 2,842,248 | ||||||
| 2.500%, 03/01/52 |
1,424,699 | 1,225,563 | ||||||
| 2.500%, 04/01/52 |
355,287 | 305,722 | ||||||
| 2.500%, 09/01/61 |
5,101,568 | 4,224,602 | ||||||
| 2.930%, 07/01/28 |
2,506,483 | 2,364,651 | ||||||
| 2.930%, 06/01/30 |
149,110 | 137,077 | ||||||
| 3.000%, 07/01/35 |
396,273 | 371,411 | ||||||
| 3.000%, 02/01/36 |
617,440 | 577,020 | ||||||
| 3.000%, 04/01/36 |
460,293 | 430,364 | ||||||
| 3.000%, 07/01/36 |
990,308 | 923,529 | ||||||
| 3.000%, 08/01/36 |
5,148,854 | 4,799,352 | ||||||
| Agency Sponsored Mortgage—Backed—(Continued) | ||||||||
| Federal National Mortgage Association |
||||||||
| 3.000%, 10/01/36 |
2,041,560 | 1,900,371 | ||||||
| 3.000%, 12/01/36 |
1,695,318 | 1,578,045 | ||||||
| 3.000%, 12/01/37 |
399,901 | 369,071 | ||||||
| 3.000%, 06/01/38 |
521,402 | 486,722 | ||||||
| 3.000%, 09/01/42 |
1,075,973 | 992,471 | ||||||
| 3.000%, 06/01/43 |
158,773 | 145,923 | ||||||
| 3.000%, 07/01/43 |
389,134 | 357,640 | ||||||
| 3.000%, 10/01/43 |
364,542 | 335,069 | ||||||
| 3.000%, 01/01/45 |
326,053 | 299,696 | ||||||
| 3.000%, 08/01/46 |
343,279 | 312,645 | ||||||
| 3.000%, 09/01/46 |
256,549 | 233,651 | ||||||
| 3.000%, 02/01/47 |
78,570 | 72,212 | ||||||
| 3.000%, 08/01/47 |
38,054 | 34,659 | ||||||
| 3.000%, 11/01/48 |
3,435,468 | 3,125,260 | ||||||
| 3.000%, 01/01/50 |
83,754 | 75,497 | ||||||
| 3.000%, 02/01/50 |
10,277,187 | 9,327,195 | ||||||
| 3.000%, 03/01/50 |
5,480,777 | 4,934,992 | ||||||
| 3.000%, 08/01/50 |
338,980 | 303,166 | ||||||
| 3.000%, 11/01/50 |
505,762 | 456,552 | ||||||
| 3.000%, 06/01/51 |
358,702 | 324,360 | ||||||
| 3.000%, 08/01/51 |
1,800,827 | 1,626,813 | ||||||
| 3.000%, 09/01/51 |
310,101 | 276,198 | ||||||
| 3.000%, 11/01/51 |
408,380 | 368,410 | ||||||
| 3.000%, 12/01/51 |
664,292 | 599,200 | ||||||
| 3.000%, 01/01/52 |
1,417,084 | 1,278,396 | ||||||
| 3.000%, 03/01/52 |
4,306,811 | 3,873,547 | ||||||
| 3.500%, 12/01/34 |
115,120 | 110,302 | ||||||
| 3.500%, 01/01/35 |
78,989 | 75,684 | ||||||
| 3.500%, 02/01/37 |
142,054 | 135,597 | ||||||
| 3.500%, 03/01/37 |
90,083 | 86,539 | ||||||
| 3.500%, 12/01/37 |
148,590 | 141,342 | ||||||
| 3.500%, 08/01/39 |
144,837 | 138,416 | ||||||
| 3.500%, 02/01/40 |
570,954 | 547,018 | ||||||
| 3.500%, 06/01/42 |
2,280,837 | 2,131,445 | ||||||
| 3.500%, 08/01/42 |
2,547,859 | 2,393,611 | ||||||
| 3.500%, 09/01/42 |
185,815 | 174,565 | ||||||
| 3.500%, 10/01/42 |
1,320,383 | 1,240,445 | ||||||
| 3.500%, 12/01/42 |
150,402 | 141,918 | ||||||
| 3.500%, 03/01/43 |
912,316 | 863,938 | ||||||
| 3.500%, 12/01/46 |
1,507,634 | 1,420,489 | ||||||
| 3.500%, 03/01/47 |
127,408 | 118,905 | ||||||
| 3.500%, 11/01/48 |
380,214 | 355,087 | ||||||
| 3.500%, 06/01/49 |
9,369,183 | 8,743,903 | ||||||
| 3.500%, 03/01/50 |
149,174 | 138,846 | ||||||
| 3.500%, 01/01/52 |
767,870 | 714,091 | ||||||
| 3.500%, 03/01/52 |
1,300,170 | 1,207,939 | ||||||
| 3.500%, 05/01/52 |
3,018,159 | 2,792,174 | ||||||
| 4.000%, 02/01/40 |
291,375 | 284,154 | ||||||
| 4.000%, 06/01/42 |
2,129,576 | 2,075,900 | ||||||
| 4.000%, 07/01/42 |
622,085 | 605,312 | ||||||
| 4.000%, 10/01/42 |
704,015 | 683,072 | ||||||
| 4.000%, 11/01/42 |
501,102 | 486,197 | ||||||
| 4.000%, 05/01/43 |
5,437,906 | 5,291,861 | ||||||
| 4.000%, 07/01/43 |
18,321 | 17,776 | ||||||
| 4.000%, 08/01/43 |
482,760 | 468,395 | ||||||
| 4.000%, 10/01/43 |
2,677,401 | 2,604,352 | ||||||
See accompanying notes to financial statements.
BHFTII-6
Brighthouse Funds Trust II
Western Asset Management U.S. Government Portfolio
Schedule of Investments as of December 31, 2023
U.S. Treasury & Government Agencies—(Continued)
| Security Description | Principal Amount* |
Value | ||||||
| Agency Sponsored Mortgage—Backed—(Continued) | ||||||||
| Federal National Mortgage Association |
||||||||
| 4.000%, 09/01/44 |
408,300 | $ | 393,633 | |||||
| 4.000%, 05/01/48 |
3,227,049 | 3,108,063 | ||||||
| 4.000%, 10/01/48 |
1,636,488 | 1,571,254 | ||||||
| 4.000%, 07/01/52 |
1,578,589 | 1,493,292 | ||||||
| 4.230%, 10/01/32 |
100,000 | 98,104 | ||||||
| 4.500%, 11/01/31 |
178,216 | 177,376 | ||||||
| 4.500%, 12/01/31 |
226,208 | 224,831 | ||||||
| 4.500%, 10/01/44 |
517,560 | 513,698 | ||||||
| 4.500%, 01/01/45 |
42,439 | 42,132 | ||||||
| 4.500%, 06/01/47 |
158,324 | 156,847 | ||||||
| 4.500%, 07/01/47 |
571,762 | 565,551 | ||||||
| 4.500%, 08/01/47 |
39,423 | 39,121 | ||||||
| 4.500%, 06/01/48 |
202,765 | 200,692 | ||||||
| 4.500%, 07/01/48 |
442,912 | 436,824 | ||||||
| 4.500%, 08/01/48 |
718,972 | 708,941 | ||||||
| 4.500%, 11/01/48 |
378,570 | 373,249 | ||||||
| 4.500%, 02/01/49 |
146,619 | 144,467 | ||||||
| 4.500%, 08/01/49 |
163,375 | 161,601 | ||||||
| 4.500%, 09/01/49 |
1,982,290 | 1,954,654 | ||||||
| 4.500%, 11/01/49 |
578,966 | 574,409 | ||||||
| 4.500%, 04/01/50 |
107,636 | 104,805 | ||||||
| 4.500%, 06/01/52 |
252,925 | 245,250 | ||||||
| 4.500%, 07/01/52 |
3,939,430 | 3,827,215 | ||||||
| 4.500%, 08/01/58 |
736,431 | 717,266 | ||||||
| 4.500%, 01/01/59 |
1,535,737 | 1,495,770 | ||||||
| 4.720%, 05/01/33 |
200,000 | 203,520 | ||||||
| 4.820%, 07/01/33 |
100,000 | 102,066 | ||||||
| 4.880%, 09/01/28 |
1,702,000 | 1,737,590 | ||||||
| 5.000%, 01/01/39 |
3,224 | 3,277 | ||||||
| 5.000%, 12/01/39 |
5,277 | 5,363 | ||||||
| 5.000%, 05/01/40 |
13,922 | 14,144 | ||||||
| 5.000%, 07/01/40 |
10,174 | 10,339 | ||||||
| 5.000%, 11/01/40 |
259,881 | 264,095 | ||||||
| 5.000%, 01/01/41 |
20,824 | 21,145 | ||||||
| 5.000%, 02/01/41 |
20,571 | 20,904 | ||||||
| 5.000%, 04/01/41 |
28,385 | 28,810 | ||||||
| 5.000%, 05/01/41 |
618,734 | 628,518 | ||||||
| 5.000%, 06/01/41 |
51,496 | 52,268 | ||||||
| 5.000%, 12/01/47 |
1,265,301 | 1,285,750 | ||||||
| 5.000%, 06/01/52 |
436,232 | 435,709 | ||||||
| 5.000%, 07/01/52 |
1,310,797 | 1,320,076 | ||||||
| 5.000%, 10/01/52 |
655,519 | 649,779 | ||||||
| 5.000%, 11/01/52 |
732,266 | 724,953 | ||||||
| 5.000%, 12/01/52 |
94,578 | 93,631 | ||||||
| 5.000%, 01/01/53 |
476,157 | 471,682 | ||||||
| 5.000%, 02/01/53 |
478,705 | 474,203 | ||||||
| 5.000%, 06/01/53 |
879,297 | 878,892 | ||||||
| 5.000%, 07/01/53 |
758,885 | 767,481 | ||||||
| 5.100%, 12/01/33 |
300,000 | 314,136 | ||||||
| 5.340%, 09/01/28 |
200,000 | 208,062 | ||||||
| 5.360%, 12/01/33 |
1,000,000 | 1,067,764 | ||||||
| 5.490%, 10/01/33 |
99,850 | 106,140 | ||||||
| 5.500%, 10/01/33 |
99,850 | 106,214 | ||||||
| 5.500%, 11/01/33 (c) (d) |
300,000 | 319,025 | ||||||
| 5.500%, 08/01/52 |
165,727 | 166,454 | ||||||
| 5.500%, 10/01/52 |
180,294 | 181,301 | ||||||
| Agency Sponsored Mortgage—Backed—(Continued) | ||||||||
| Federal National Mortgage Association |
||||||||
| 5.500%, 11/01/52 |
1,972,163 | 1,984,691 | ||||||
| 5.500%, 04/01/53 |
382,579 | 385,189 | ||||||
| 5.500%, 05/01/53 |
670,622 | 673,737 | ||||||
| 5.500%, 06/01/53 |
1,867,642 | 1,877,356 | ||||||
| 5.500%, 07/01/53 |
580,991 | 585,994 | ||||||
| 5.500%, 08/01/53 |
1,097,679 | 1,107,568 | ||||||
| 5.850%, 11/01/33 |
700,000 | 772,425 | ||||||
| 6.000%, 07/01/41 |
176,763 | 184,649 | ||||||
| 6.000%, 12/01/52 |
1,244,522 | 1,266,621 | ||||||
| 6.000%, 03/01/53 |
752,233 | 765,010 | ||||||
| 6.000%, 06/01/53 |
5,586,951 | 5,729,837 | ||||||
| 6.000%, 07/01/53 |
286,703 | 296,900 | ||||||
| 6.500%, 03/01/26 |
208 | 215 | ||||||
| 6.500%, 04/01/29 |
18,780 | 19,682 | ||||||
| 6.500%, 05/01/32 |
3,451 | 3,518 | ||||||
| 7.000%, 02/01/29 |
182 | 188 | ||||||
| 7.000%, 11/01/37 |
12,047 | 12,429 | ||||||
| 7.000%, 12/01/37 |
6,557 | 6,765 | ||||||
| 7.000%, 02/01/38 |
2,392 | 2,468 | ||||||
| 7.000%, 11/01/38 |
25,881 | 26,956 | ||||||
| 7.000%, 02/01/39 |
293,610 | 309,333 | ||||||
| 8.000%, 05/01/28 |
211 | 211 | ||||||
| 8.000%, 07/01/32 |
596 | 609 | ||||||
| Federal National Mortgage Association Interest STRIPS |
| |||||||
| 2.000%, 03/25/50 (b) |
2,490,964 | 296,812 | ||||||
| 2.500%, 01/25/48 (b) |
920,067 | 106,987 | ||||||
| 3.500%, 11/25/41 (b) |
584,928 | 88,346 | ||||||
| 4.000%, 04/25/42 (b) |
843,705 | 154,657 | ||||||
| 4.500%, 11/25/39 (b) |
469,481 | 86,499 | ||||||
| Federal National Mortgage Association REMICS |
| |||||||
| Zero Coupon, 03/25/42 (e) |
126,219 | 113,492 | ||||||
| 0.698%, -1 x SOFR30A + 6.036%, 03/25/42 (a) (b) |
2,053,157 | 124,847 | ||||||
| 0.698%, -1 x SOFR30A + 6.036%, 12/25/42 (a) (b) |
227,122 | 29,569 | ||||||
| 1.098%, -1 x SOFR30A + 6.436%, 10/25/41 (a) (b) |
1,427,697 | 120,302 | ||||||
| 1.198%, -1 x SOFR30A + 6.536%, 03/25/42 (a) (b) |
496,460 | 33,600 | ||||||
| 2.000%, 10/25/50 (b) |
4,714,269 | 574,812 | ||||||
| 2.500%, 10/25/47 (b) |
792,353 | 111,696 | ||||||
| 2.500%, 12/25/47 (b) |
843,871 | 112,783 | ||||||
| 2.500%, 04/25/48 (b) |
814,091 | 116,829 | ||||||
| 2.500%, 08/25/50 (b) |
10,079,195 | 1,634,028 | ||||||
| 2.500%, 09/25/50 (b) |
702,201 | 110,997 | ||||||
| 3.000%, 02/25/51 (b) |
662,291 | 106,810 | ||||||
| 3.500%, 10/25/48 |
32,579 | 30,298 | ||||||
| 4.490%, 01/25/43 (a) |
100,678 | 96,426 | ||||||
| 5.500%, 07/25/41 |
2,730,024 | 2,816,843 | ||||||
| 5.500%, 04/25/42 |
654,061 | 670,959 | ||||||
| 6.000%, 05/25/42 |
363,029 | 380,502 | ||||||
| 6.500%, 06/25/39 |
9,402 | 9,564 | ||||||
| 6.500%, 07/25/42 |
696,259 | 745,474 | ||||||
| Federal National Mortgage Association-Aces |
| |||||||
| 2.232%, 02/25/27 |
586,643 | 555,857 | ||||||
| 3.061%, 05/25/27 (a) |
158,146 | 151,675 | ||||||
| Government National Mortgage Association |
| |||||||
| Zero Coupon, 09/16/46 (a) (b) |
7,645,960 | 76 | ||||||
| 0.029%, 03/16/49 (a) (b) |
1,184,683 | 133 | ||||||
.
BHFTII-7
See accompanying notes to financial statements.
Brighthouse Funds Trust II
Western Asset Management U.S. Government Portfolio
Schedule of Investments as of December 31, 2023
U.S. Treasury & Government Agencies—(Continued)
| Security Description | Principal Amount* |
Value | ||||||
| Agency Sponsored Mortgage—Backed—(Continued) | ||||||||
| Government National Mortgage Association |
||||||||
| 0.051%, 10/16/54 (a)(b) |
10,362,952 | $ | 13,630 | |||||
| 0.111%, 02/16/53 (a)(b) |
3,841,386 | 7,682 | ||||||
| 0.125%, 04/16/54 (a)(b) |
9,745,699 | 29,425 | ||||||
| 0.152%, 02/16/48 (a)(b) |
820,788 | 2,867 | ||||||
| 0.618%, 03/16/60 (a)(b) |
1,422,517 | 49,513 | ||||||
| 0.628%, 09/16/55 (a)(b) |
6,225,649 | 153,913 | ||||||
| 0.633%, 10/16/58 (a)(b) |
11,232,146 | 385,433 | ||||||
| 0.640%, 02/16/61 (a)(b) |
1,350,414 | 66,139 | ||||||
| 0.706%, 12/16/59 (a)(b) |
26,362,089 | 1,077,548 | ||||||
| 1.008%, 02/16/46 (a)(b) |
2,711,717 | 58,296 | ||||||
| 1.500%, 06/16/63 |
2,518,724 | 1,913,865 | ||||||
| 2.000%, 08/20/50 |
122,249 | 103,514 | ||||||
| 2.000%, 03/20/51 |
3,250,722 | 2,686,098 | ||||||
| 2.500%, 10/20/49 |
365,607 | 321,691 | ||||||
| 2.500%, 06/20/51 |
81,928 | 70,869 | ||||||
| 2.500%, 08/20/51 |
80,569 | 69,690 | ||||||
| 2.500%, 10/20/51 |
333,768 | 288,695 | ||||||
| 2.500%, 12/20/51 |
171,144 | 148,047 | ||||||
| 2.500%, 08/20/52 |
10,869,601 | 9,506,908 | ||||||
| 3.000%, 09/15/42 |
290,308 | 265,038 | ||||||
| 3.000%, 10/15/42 |
1,568,559 | 1,423,492 | ||||||
| 3.000%, 11/15/42 |
567,778 | 511,405 | ||||||
| 3.000%, 11/20/46 |
157,830 | 144,861 | ||||||
| 3.000%, 09/20/47 |
50,232 | 46,031 | ||||||
| 3.000%, 11/20/47 |
63,743 | 58,438 | ||||||
| 3.000%, 12/20/47 |
676,331 | 619,204 | ||||||
| 3.000%, 01/20/50 |
595,825 | 540,169 | ||||||
| 3.000%, 02/20/51 |
100,322 | 91,539 | ||||||
| 3.000%, 09/20/51 |
7,376,437 | 6,680,872 | ||||||
| 3.000%, 11/20/51 |
776,019 | 705,200 | ||||||
| 3.000%, 01/20/52 |
92,289 | 82,588 | ||||||
| 3.000%, 02/20/52 |
2,430,123 | 2,206,089 | ||||||
| 3.000%, 03/20/52 |
1,769,884 | 1,598,979 | ||||||
| 3.000%, 04/20/52 |
2,296,478 | 2,030,232 | ||||||
| 3.500%, 06/20/44 |
613,495 | 582,225 | ||||||
| 3.500%, 03/20/45 |
47,814 | 45,131 | ||||||
| 3.500%, 01/20/46 |
125,806 | 118,905 | ||||||
| 3.500%, 03/20/46 |
666,656 | 628,597 | ||||||
| 3.500%, 04/20/46 |
349,051 | 329,102 | ||||||
| 3.500%, 05/20/46 |
163,013 | 153,695 | ||||||
| 3.500%, 06/20/46 |
277,821 | 261,900 | ||||||
| 3.500%, 07/20/46 |
168,342 | 158,684 | ||||||
| 3.500%, 09/20/46 |
15,358 | 14,451 | ||||||
| 3.500%, 05/20/47 |
2,222,887 | 2,095,050 | ||||||
| 3.500%, 06/15/48 |
1,860,058 | 1,758,915 | ||||||
| 3.500%, 09/20/48 |
420,601 | 395,951 | ||||||
| 3.500%, 02/20/49 |
13,209 | 12,400 | ||||||
| 3.500%, 10/20/49 |
104,987 | 98,336 | ||||||
| 3.500%, 01/20/50 |
996,473 | 930,785 | ||||||
| 3.500%, 02/20/50 |
139,277 | 129,635 | ||||||
| 3.500%, 05/15/50 |
320,005 | 299,850 | ||||||
| 3.500%, 07/20/50 |
167,887 | 157,768 | ||||||
| 3.500%, 02/20/52 |
3,948,363 | 3,674,643 | ||||||
| 3.500%, 03/20/52 |
461,760 | 425,208 | ||||||
| 3.500%, 06/20/52 |
547,828 | 503,075 | ||||||
| 4.000%, 09/20/45 |
219,976 | 214,248 | ||||||
| Agency Sponsored Mortgage—Backed—(Continued) | ||||||||
| Government National Mortgage Association |
||||||||
| 4.000%, 11/20/45 |
2,487,918 | 2,414,084 | ||||||
| 4.000%, 08/20/46 |
1,807,282 | 1,745,726 | ||||||
| 4.000%, 06/20/47 |
795,205 | 766,579 | ||||||
| 4.000%, 07/20/47 |
134,459 | 129,607 | ||||||
| 4.000%, 11/20/47 |
384,488 | 371,159 | ||||||
| 4.000%, 12/20/47 |
150,166 | 144,711 | ||||||
| 4.000%, 02/20/48 |
138,804 | 134,100 | ||||||
| 4.000%, 03/20/48 |
1,072,354 | 1,035,951 | ||||||
| 4.000%, 04/20/48 |
131,678 | 127,195 | ||||||
| 4.000%, 05/20/48 |
108,629 | 104,897 | ||||||
| 4.000%, 08/20/48 |
1,487,341 | 1,430,936 | ||||||
| 4.000%, 09/20/48 |
413,805 | 397,798 | ||||||
| 4.000%, 03/20/49 |
227,402 | 219,240 | ||||||
| 4.000%, 04/20/49 |
198,231 | 191,112 | ||||||
| 4.000%, 11/20/49 |
68,655 | 65,692 | ||||||
| 4.000%, 01/20/50 |
107,682 | 105,341 | ||||||
| 4.000%, 02/20/50 |
93,391 | 91,146 | ||||||
| 4.000%, 03/15/50 |
31,753 | 30,524 | ||||||
| 4.000%, 03/20/50 |
59,041 | 57,758 | ||||||
| 4.000%, 04/20/50 |
392,696 | 377,243 | ||||||
| 4.000%, 06/20/52 |
646,022 | 618,992 | ||||||
| 4.500%, 01/20/40 |
175,344 | 175,504 | ||||||
| 4.500%, 05/20/40 |
223,144 | 223,280 | ||||||
| 4.500%, 09/20/40 |
5,018 | 5,016 | ||||||
| 4.500%, 01/20/41 |
42,742 | 42,751 | ||||||
| 4.500%, 07/20/41 |
276,149 | 276,204 | ||||||
| 4.500%, 08/20/47 |
258,793 | 256,453 | ||||||
| 4.500%, 04/20/48 |
390,006 | 385,696 | ||||||
| 4.500%, 05/20/48 |
713,920 | 705,701 | ||||||
| 4.500%, 06/20/48 |
716,062 | 707,709 | ||||||
| 4.500%, 07/20/48 |
53,655 | 53,024 | ||||||
| 4.500%, 08/20/48 |
1,828,102 | 1,806,490 | ||||||
| 4.500%, 09/20/48 |
157,405 | 155,536 | ||||||
| 4.500%, 10/20/48 |
380,420 | 375,884 | ||||||
| 4.500%, 12/20/48 |
166,087 | 164,090 | ||||||
| 4.500%, 01/20/49 |
1,464,370 | 1,446,680 | ||||||
| 4.500%, 02/20/49 |
537,552 | 531,035 | ||||||
| 4.500%, 03/20/49 |
1,375,640 | 1,359,046 | ||||||
| 4.500%, 04/20/49 |
174,837 | 172,717 | ||||||
| 4.500%, 02/20/50 |
241,915 | 238,992 | ||||||
| 4.500%, 03/20/50 |
158,140 | 156,189 | ||||||
| 4.500%, 12/20/50 |
234,181 | 231,365 | ||||||
| 4.500%, 08/20/52 |
933,736 | 911,439 | ||||||
| 4.500%, 09/20/52 |
1,203,398 | 1,179,876 | ||||||
| 5.000%, 07/20/40 |
180,420 | 183,658 | ||||||
| 5.000%, 05/20/48 |
120,096 | 120,991 | ||||||
| 5.000%, 10/20/48 |
606,557 | 610,608 | ||||||
| 5.000%, 11/20/48 |
335,313 | 337,974 | ||||||
| 5.000%, 12/20/48 |
364,635 | 366,677 | ||||||
| 5.000%, 01/20/49 |
243,704 | 244,768 | ||||||
| 5.000%, 03/20/49 |
74,582 | 74,885 | ||||||
| 5.000%, 04/20/49 |
274,135 | 275,324 | ||||||
| 5.000%, 09/20/49 |
107,852 | 108,622 | ||||||
| 5.000%, 11/20/49 |
162,999 | 164,188 | ||||||
| 5.000%, 12/20/49 |
105,475 | 106,274 | ||||||
| 5.000%, 01/20/50 |
288,017 | 289,885 | ||||||
See accompanying notes to financial statements.
BHFTII-8
Brighthouse Funds Trust II
Western Asset Management U.S. Government Portfolio
Schedule of Investments as of December 31, 2023
U.S. Treasury & Government Agencies—(Continued)
| Security Description | Principal Amount* |
Value | ||||||
| Agency Sponsored Mortgage—Backed—(Continued) | ||||||||
| Government National Mortgage Association |
||||||||
| 5.000%, 04/20/50 |
62,060 | $ | 62,563 | |||||
| 5.000%, 09/20/52 |
471,005 | 473,523 | ||||||
| 5.000%, 10/20/52 |
1,122,114 | 1,115,455 | ||||||
| 5.000%, 11/20/52 |
1,418,035 | 1,408,037 | ||||||
| 5.000%, 12/20/52 |
3,796,382 | 3,772,238 | ||||||
| 5.000%, 01/20/53 |
3,148,738 | 3,133,796 | ||||||
| 5.000%, 08/20/53 |
2,664,698 | 2,656,258 | ||||||
| 5.500%, 06/15/36 |
134,963 | 136,401 | ||||||
| 5.500%, 11/20/52 |
1,680,537 | 1,694,001 | ||||||
| 5.500%, 02/20/53 |
1,636,446 | 1,654,985 | ||||||
| 5.500%, 03/20/53 |
2,708,677 | 2,731,585 | ||||||
| 5.500%, 04/20/53 |
3,403,269 | 3,428,318 | ||||||
| 5.500%, 05/20/53 |
1,081,005 | 1,091,930 | ||||||
| 5.500%, 07/20/53 |
691,974 | 700,534 | ||||||
| 5.500%, 08/20/53 |
3,586,248 | 3,624,124 | ||||||
| 6.000%, 03/15/33 |
325,010 | 335,816 | ||||||
| 6.000%, 11/20/34 |
511 | 539 | ||||||
| 6.000%, 06/20/35 |
798 | 843 | ||||||
| 6.000%, 07/20/36 |
38,822 | 40,235 | ||||||
| 6.000%, 09/20/36 |
1,877 | 1,982 | ||||||
| 6.000%, 07/20/38 |
112,133 | 118,429 | ||||||
| 6.000%, 09/20/38 |
267,172 | 277,240 | ||||||
| 6.000%, 06/20/39 |
1,328 | 1,402 | ||||||
| 6.000%, 05/20/40 |
21,159 | 22,342 | ||||||
| 6.000%, 06/20/40 |
73,898 | 78,013 | ||||||
| 6.000%, 08/20/40 |
42,600 | 44,176 | ||||||
| 6.000%, 09/20/40 |
97,720 | 103,205 | ||||||
| 6.000%, 10/20/40 |
43,802 | 46,256 | ||||||
| 6.000%, 11/20/40 |
79,900 | 83,098 | ||||||
| 6.000%, 01/20/41 |
45,475 | 47,844 | ||||||
| 6.000%, 03/20/41 |
280,783 | 296,342 | ||||||
| 6.000%, 07/20/41 |
68,965 | 72,832 | ||||||
| 6.000%, 12/20/41 |
34,573 | 36,514 | ||||||
| 6.000%, 06/20/53 |
585,138 | 595,106 | ||||||
| 6.000%, 07/20/53 |
1,277,775 | 1,305,611 | ||||||
| 6.000%, 09/20/53 |
1,194,232 | 1,218,614 | ||||||
| 6.500%, 06/15/31 |
793 | 813 | ||||||
| 6.500%, 08/15/34 |
62,048 | 64,359 | ||||||
| 6.500%, 10/20/37 |
104,285 | 110,475 | ||||||
| 6.500%, 09/20/53 |
396,457 | 409,485 | ||||||
| 6.500%, 11/20/53 |
300,000 | 311,365 | ||||||
| 7.500%, 09/15/29 |
424 | 428 | ||||||
| 8.500%, 06/15/25 |
1,074 | 1,073 | ||||||
| Government National Mortgage Association REMICS |
||||||||
| 0.627%, -1 x 1M TSFR + 5.986%, 08/16/42 (a) (b) |
345,471 | 39,866 | ||||||
| 1.178%, -1 x 1M TSFR + 6.536%, 01/20/40 (a) (b) |
20,107 | 102 | ||||||
| 3.000%, 07/20/49 |
529,394 | 472,356 | ||||||
| 4.000%, 08/20/48 |
42,404 | 40,391 | ||||||
| 5.768%, 12M TSFR + 0.965%, 10/20/68 (a) |
1,521,913 | 1,517,822 | ||||||
| 5.817%, 1M TSFR + 0.494%, 12/20/60 (a) |
6,580,590 | 6,544,546 | ||||||
| 5.837%, 1M TSFR + 0.514%, 12/20/60 (a) |
1,256,060 | 1,249,142 | ||||||
| 5.837%, 1M TSFR + 0.514%, 08/20/70 (a) |
39,039 | 38,492 | ||||||
| 5.867%, 1M TSFR + 0.544%, 10/20/64 (a) |
2,510,811 | 2,494,794 | ||||||
| 5.887%, 1M TSFR + 0.564%, 07/20/70 (a) |
4,370,473 | 4,233,147 | ||||||
| 5.917%, 1M TSFR + 0.594%, 03/20/61 (a) |
1,145,195 | 1,140,838 | ||||||
| 5.937%, 1M TSFR + 0.614%, 12/20/60 (a) |
10,115,644 | 10,068,792 | ||||||
| Agency Sponsored Mortgage—Backed—(Continued) | ||||||||
| Government National Mortgage Association REMICS |
||||||||
| 5.937%, 1M TSFR + 0.614%, 07/20/70 (a) |
293,539 | 285,487 | ||||||
| 6.587%, 1M TSFR + 1.264%, 05/20/70 (a) |
1,047,446 | 1,043,378 | ||||||
| 6.687%, 1M TSFR + 1.364%, 04/20/70 (a) |
102,389 | 103,300 | ||||||
| Government National Mortgage Association, TBA |
||||||||
| 2.000%, TBA (f) |
1,900,000 | 1,608,543 | ||||||
| 2.500%, TBA (f) |
2,800,000 | 2,449,132 | ||||||
| 3.000%, TBA (f) |
2,600,000 | 2,353,806 | ||||||
| 3.500%, TBA (f) |
2,500,000 | 2,328,125 | ||||||
| 4.000%, TBA (f) |
700,000 | 668,283 | ||||||
| 5.000%, TBA (f) |
100,000 | 99,297 | ||||||
| 5.500%, TBA (f) |
500,000 | 503,595 | ||||||
| 6.000%, TBA (f) |
100,000 | 101,676 | ||||||
| 6.500%, TBA (f) |
700,000 | 714,793 | ||||||
| Uniform Mortgage-Backed Security, TBA |
||||||||
| 2.000%, TBA (f) |
1,300,000 | 1,062,344 | ||||||
| 3.000%, TBA (f) |
1,200,000 | 1,061,391 | ||||||
| 4.000%, TBA (f) |
1,100,000 | 1,040,316 | ||||||
| 4.500%, TBA (f) |
900,000 | 872,367 | ||||||
| 5.000%, TBA (f) |
4,800,000 | 4,748,625 | ||||||
| 5.500%, TBA (f) |
6,100,000 | 6,125,734 | ||||||
| 6.000%, TBA (f) |
300,000 | 304,594 | ||||||
| 6.500%, TBA (f) |
2,000,000 | 2,049,453 | ||||||
|
|
|
|||||||
| 521,151,136 | ||||||||
|
|
|
|||||||
| Federal Agencies—32.3% |
||||||||
| Federal Farm Credit Banks Funding Corp. |
| |||||||
| 0.200%, 01/04/24 |
10,000,000 | 9,997,154 | ||||||
| 0.230%, 01/19/24 |
15,000,000 | 14,963,998 | ||||||
| 0.375%, 01/15/25 |
10,000,000 | 9,581,051 | ||||||
| 0.460%, 11/03/25 |
10,000,000 | 9,316,932 | ||||||
| 0.780%, 06/16/25 |
10,000,000 | 9,457,627 | ||||||
| 0.875%, 11/18/24 |
5,000,000 | 4,827,645 | ||||||
| 1.050%, 11/17/25 |
10,000,000 | 9,411,244 | ||||||
| 1.240%, 09/03/30 |
8,000,000 | 6,565,847 | ||||||
| 1.680%, 09/17/35 |
1,195,000 | 878,827 | ||||||
| 1.750%, 02/25/25 |
18,350,000 | 17,758,612 | ||||||
| 2.600%, 04/05/27 |
10,000,000 | 9,556,727 | ||||||
| 2.625%, 05/16/24 |
15,000,000 | 14,850,515 | ||||||
| 2.700%, 10/26/27 |
10,000,000 | 9,532,078 | ||||||
| 5.480%, 06/27/42 |
3,000,000 | 2,938,443 | ||||||
| Federal Home Loan Banks |
||||||||
| 0.375%, 09/04/25 |
15,000,000 | 14,025,733 | ||||||
| 0.500%, 04/14/25 |
14,000,000 | 13,297,238 | ||||||
| 0.750%, 06/30/25 |
7,770,000 | 7,363,062 | ||||||
| 1.020%, 02/24/27 |
9,990,000 | 9,052,831 | ||||||
| 1.750%, 09/12/25 |
10,000,000 | 9,566,177 | ||||||
| 2.250%, 03/04/36 |
15,000,000 | 11,568,900 | ||||||
| 2.500%, 02/13/24 |
10,000,000 | 9,966,217 | ||||||
| 2.750%, 12/13/24 |
10,000,000 | 9,809,073 | ||||||
| 3.000%, 07/08/24 |
7,000,000 | 6,919,437 | ||||||
| Federal Home Loan Mortgage Corp. |
| |||||||
| Zero Coupon, 12/14/29 |
7,443,000 | 5,830,435 | ||||||
| Zero Coupon, 12/17/29 |
5,562,000 | 4,353,558 | ||||||
| Zero Coupon, 09/15/36 |
10,000,000 | 5,727,480 | ||||||
| Zero Coupon, 12/15/36 |
24,765,000 | 13,708,942 | ||||||
See accompanying notes to financial statements.
BHFTII-9
Brighthouse Funds Trust II
Western Asset Management U.S. Government Portfolio
Schedule of Investments as of December 31, 2023
U.S. Treasury & Government Agencies—(Continued)
| Security Description | Principal Amount* |
Value | ||||||
| Federal Agencies—(Continued) | ||||||||
| Federal Home Loan Mortgage Corp. STRIPS |
| |||||||
| Zero Coupon, 07/15/28 |
5,400,000 | $ | 4,497,716 | |||||
| Zero Coupon, 07/15/32 |
9,000,000 | 6,219,331 | ||||||
| Federal National Mortgage Association |
||||||||
| 0.625%, 04/22/25 |
5,000,000 | 4,753,899 | ||||||
| 2.625%, 09/06/24 |
17,500,000 | 17,216,148 | ||||||
| Federal National Mortgage Association Principal STRIPS |
| |||||||
| Zero Coupon, 05/15/30 |
30,000,000 | 22,996,879 | ||||||
| Resolution Funding Corp. Interest STRIPS |
| |||||||
| Zero Coupon, 07/15/26 |
4,230,000 | 3,770,810 | ||||||
| Zero Coupon, 07/15/29 |
14,000,000 | 11,009,729 | ||||||
| Zero Coupon, 10/15/29 |
14,996,000 | 11,762,811 | ||||||
| Resolution Funding Corp. Principal STRIPS |
| |||||||
| Zero Coupon, 01/15/30 |
51,000,000 | 39,226,591 | ||||||
| Zero Coupon, 04/15/30 |
54,000,000 | 41,122,406 | ||||||
| Tennessee Valley Authority |
||||||||
| 3.875%, 03/15/28 |
15,000,000 | 14,933,106 | ||||||
| U.S. Department of Housing & Urban Development |
||||||||
| 2.668%, 08/01/24 |
8,000,000 | 7,894,210 | ||||||
| 2.738%, 08/01/25 |
6,000,000 | 5,827,239 | ||||||
| U.S. International Development Finance Corp. |
||||||||
| 1.110%, 05/15/29 |
11,000,000 | 10,048,703 | ||||||
| 3.540%, 06/15/30 |
7,647,333 | 7,502,846 | ||||||
|
|
|
|||||||
| 459,608,207 | ||||||||
|
|
|
|||||||
| U.S. Treasury—17.8% |
||||||||
| U.S. Treasury Bonds |
||||||||
| 1.375%, 08/15/50 |
50,000 | 27,861 | ||||||
| 4.000%, 11/15/42 |
4,000,000 | 3,887,344 | ||||||
| 4.750%, 02/15/41 |
4,500,000 | 4,865,098 | ||||||
| U.S. Treasury Inflation-Indexed Bond |
5,864,026 | 3,818,666 | ||||||
| U.S. Treasury Inflation-Indexed Notes |
13,097,070 | 12,392,224 | ||||||
| 1.125%, 01/15/33 (g) |
2,065,800 | 1,954,036 | ||||||
| 1.625%, 10/15/27 (g) |
15,579,600 | 15,460,346 | ||||||
| U.S. Treasury Notes |
10,000,000 | 9,900,391 | ||||||
| 1.875%, 08/31/24 |
20,000,000 | 19,590,625 | ||||||
| 1.875%, 07/31/26 |
39,900,000 | 37,744,465 | ||||||
| 2.750%, 05/31/29 |
22,000,000 | 20,770,234 | ||||||
| 3.875%, 11/30/29 |
67,000,000 | 66,871,758 | ||||||
| 3.875%, 08/15/33 |
48,000,000 | 47,940,000 | ||||||
| 4.125%, 08/31/30 |
8,000,000 | 8,100,312 | ||||||
|
|
|
|||||||
| 253,323,360 | ||||||||
|
|
|
|||||||
| Total U.S. Treasury & Government Agencies |
1,234,082,703 | |||||||
|
|
|
|||||||
| Foreign Government—5.1% | ||||||||
| Sovereign—5.1% | ||||||||
| Colombia Government International Bond |
||||||||
| 5.625%, 02/26/44 |
4,840,000 | 4,063,247 | ||||||
| Indonesia Government International Bond |
||||||||
| 4.750%, 02/11/29 |
6,280,000 | 6,324,973 | ||||||
| Sovereign—(Continued) | ||||||||
| Israel Government AID Bonds |
||||||||
| 5.500%, 04/26/24 |
21,550,000 | 21,541,247 | ||||||
| 5.500%, 09/18/33 |
6,961,000 | 7,644,994 | ||||||
| Mexico Government International Bond |
||||||||
| 4.500%, 04/22/29 (h) |
12,280,000 | 12,084,728 | ||||||
| Peru Government International Bonds |
||||||||
| 3.300%, 03/11/41 |
3,420,000 | 2,656,177 | ||||||
| 3.550%, 03/10/51 |
1,090,000 | 824,967 | ||||||
| 3.600%, 01/15/72 |
1,580,000 | 1,111,672 | ||||||
| 6.550%, 03/14/37 |
320,000 | 356,000 | ||||||
| Qatar Government International Bond |
||||||||
| 5.103%, 04/23/48 (144A) |
7,300,000 | 7,383,220 | ||||||
| Republic of Poland Government International Bonds |
||||||||
| 3.250%, 04/06/26 |
5,010,000 | 4,854,690 | ||||||
| 4.000%, 01/22/24 |
2,858,000 | 2,852,415 | ||||||
|
|
|
|||||||
| Total Foreign Government |
||||||||
| (Cost $79,871,880) |
71,698,330 | |||||||
|
|
|
|||||||
| Corporate Bonds & Notes—4.3% | ||||||||
| Chemicals—0.1% | ||||||||
| MEGlobal BV |
||||||||
| 4.250%, 11/03/26 (144A) |
1,540,000 | 1,486,112 | ||||||
|
|
|
|||||||
| Diversified Financial Services—3.1% | ||||||||
| Private Export Funding Corp. |
||||||||
| 3.250%, 06/15/25 |
20,000,000 | 19,609,777 | ||||||
| 5.500%, 03/14/25 (144A) |
25,000,000 | 25,163,145 | ||||||
|
|
|
|||||||
| 44,772,922 | ||||||||
|
|
|
|||||||
| Electric—0.6% |
||||||||
| Enel Chile SA |
||||||||
| 4.875%, 06/12/28 |
4,000,000 | 3,952,118 | ||||||
| Perusahaan Perseroan Persero PT Perusahaan Listrik Negara |
||||||||
| 5.450%, 05/21/28 (144A) |
4,000,000 | 4,065,000 | ||||||
|
|
|
|||||||
| 8,017,118 | ||||||||
|
|
|
|||||||
| Oil & Gas—0.5% |
||||||||
| Ecopetrol SA |
||||||||
| 5.375%, 06/26/26 |
4,260,000 | 4,176,170 | ||||||
| Petroleos Mexicanos |
||||||||
| 6.375%, 01/23/45 |
3,610,000 | 2,352,201 | ||||||
|
|
|
|||||||
| 6,528,371 | ||||||||
|
|
|
|||||||
| Total Corporate Bonds & Notes |
60,804,523 | |||||||
|
|
|
|||||||
| Mortgage-Backed Securities—3.8% | ||||||||
| Collateralized Mortgage Obligations—2.0% | ||||||||
| Banc of America Mortgage Trust |
10,414 | 9,628 | ||||||
| CIM Trust |
2,281,419 | 1,988,233 | ||||||
| 5.000%, 05/25/62 (144A) (a) |
2,732,364 | 2,707,151 | ||||||
| Citigroup Mortgage Loan Trust, Inc. |
23,181 | 22,481 | ||||||
See accompanying notes to financial statements.
BHFTII-10
Brighthouse Funds Trust II
Western Asset Management U.S. Government Portfolio
Schedule of Investments as of December 31, 2023
Mortgage-Backed Securities—(Continued)
| Security Description | Principal Amount* |
Value | ||||||
| Collateralized Mortgage Obligations—(Continued) | ||||||||
| Countrywide Alternative Loan Trust |
879,391 | $ | 700,129 | |||||
| Countrywide Reperforming Loan REMICS Trust |
161,948 | 148,032 | ||||||
| CSMC Trust |
627,256 | 491,188 | ||||||
| 0.938%, 05/25/66 (144A) (a) |
955,018 | 756,023 | ||||||
| 1.169%, 03/25/56 (144A) (a) |
539,986 | 418,804 | ||||||
| 1.756%, 10/25/66 (144A) (a) |
631,879 | 524,251 | ||||||
| 2.000%, 10/25/60 (144A) (a) |
778,388 | 690,377 | ||||||
| 3.904%, 04/25/62 (144A) (a) |
1,737,783 | 1,628,255 | ||||||
| 8.830%, SOFR30A + 3.500%, 10/25/66 (144A) † (a) |
2,069,895 | 2,015,511 | ||||||
| Ellington Financial Mortgage Trust |
950,000 | 660,178 | ||||||
| GMACM Mortgage Loan Trust |
69,609 | 62,224 | ||||||
| GS Mortgage-Backed Securities Trust |
1,528,614 | 1,469,346 | ||||||
| 4.000%, 05/25/62 (144A) (a) |
711,874 | 657,927 | ||||||
| JP Morgan Mortgage Trust |
392,033 | 343,953 | ||||||
| 5.201%, 06/25/34 (a) |
25,916 | 24,213 | ||||||
| Legacy Mortgage Asset Trust |
708,687 | 684,189 | ||||||
| MASTR Adjustable Rate Mortgages Trust |
96,732 | 83,248 | ||||||
| MASTR Reperforming Loan Trust |
1,855,292 | 932,111 | ||||||
| Morgan Stanley Mortgage Loan Trust |
50,189 | 43,644 | ||||||
| 5.610%, 1M TSFR + 0.254%, 06/25/36 (a) |
412,527 | 81,466 | ||||||
| New Residential Mortgage Loan Trust |
543,886 | 449,711 | ||||||
| 2.750%, 07/25/59 (144A) (a) |
1,113,589 | 1,047,657 | ||||||
| 3.250%, 09/25/56 (144A) (a) |
1,020,498 | 937,444 | ||||||
| 4.000%, 02/25/57 (144A) (a) |
862,224 | 816,393 | ||||||
| 4.000%, 05/25/57 (144A) (a) |
1,314,212 | 1,240,291 | ||||||
| NovaStar Mortgage Funding Trust |
385,707 | 348,369 | ||||||
| OBX Trust |
675,509 | 516,187 | ||||||
| 5.949%, 02/25/63 (144A) (i) |
659,100 | 659,151 | ||||||
| PRKCM Trust |
| |||||||
| 1.510%, 08/25/56 (144A) (a) |
1,494,738 | 1,185,746 | ||||||
| 2.071%, 11/25/56 (144A) (a) |
795,384 | 663,057 | ||||||
| SACO I Trust |
7,492 | 6,076 | ||||||
| Structured Asset Mortgage Investments II Trust |
77,925 | 63,913 | ||||||
| Structured Asset Securities Corp. |
49,361 | 43,239 | ||||||
| 5.820%, 1M TSFR + 0.464%, 04/25/35 (144A) (a) |
1,171,369 | 1,014,599 | ||||||
| Towd Point Mortgage Trust |
763,046 | 676,492 | ||||||
| 3.000%, 04/25/60 (144A) (a) |
940,000 | 705,006 | ||||||
|
|
|
|||||||
| 27,515,893 | ||||||||
|
|
|
|||||||
| Commercial Mortgage-Backed Securities—1.8% | ||||||||
| BANK |
860,000 | 736,265 | ||||||
| 3.538%, 11/15/54 |
1,580,000 | 1,488,924 | ||||||
| 5.779%, 04/15/56 |
770,000 | 784,525 | ||||||
| Benchmark Mortgage Trust |
2,700,000 | 2,779,779 | ||||||
| BLP Commercial Mortgage Trust |
4,300,000 | 4,274,577 | ||||||
| BX Commercial Mortgage Trust |
1,130,000 | 1,130,925 | ||||||
| BX Trust |
3,000,000 | 2,936,068 | ||||||
| 6.277%, 1M TSFR + 0.914%, 02/15/36 (144A) (a) |
585,199 | 575,659 | ||||||
| Citigroup Commercial Mortgage Trust |
1,520,000 | 1,538,676 | ||||||
| GS Mortgage Securities Trust |
3,414,000 | 3,024,438 | ||||||
| LAQ Mortgage Trust |
693,060 | 687,731 | ||||||
| Morgan Stanley Bank of America Merrill Lynch Trust |
3,129,700 | 2,985,958 | ||||||
| MTN Commercial Mortgage Trust |
2,980,000 | 2,905,054 | ||||||
|
|
|
|||||||
| 25,848,579 | ||||||||
|
|
|
|||||||
| Total Mortgage-Backed Securities |
53,364,472 | |||||||
|
|
|
|||||||
| Asset-Backed Securities—0.0% | ||||||||
| Asset-Backed-Home Equity—0.0% | ||||||||
| Morgan Stanley Mortgage Loan Trust |
110,015 | 38,389 | ||||||
| 5.770%, 1M TSFR + 0.414%, 03/25/36 (a) |
37,312 | 36,903 | ||||||
|
|
|
|||||||
| 75,292 | ||||||||
|
|
|
|||||||
| Asset-Backed-Other—0.0% | ||||||||
| Structured Asset Securities Corp. Mortgage Loan Trust |
4,548,285 | 97,303 | ||||||
|
|
|
|||||||
| Total Asset-Backed Securities |
|
172,595 | ||||||
|
|
|
|||||||
| Short-Term Investment—1.4% |
| |||||||
| Repurchase Agreement—1.4% | ||||||||
| Fixed Income Clearing Corp. |
20,342,579 | 20,342,579 | ||||||
|
|
|
|||||||
| Total Short-Term Investments |
|
20,342,579 | ||||||
|
|
|
|||||||
| Total Investments—101.4% |
|
1,440,465,202 | ||||||
| Other assets and liabilities (net) —(1.4)% |
|
(19,199,179 | ) | |||||
|
|
|
|||||||
| Net Assets —100.0% |
|
$ | 1,421,266,023 | |||||
|
|
|
|||||||
See accompanying notes to financial statements.
BHFTII-11
Brighthouse Funds Trust II
Western Asset Management U.S. Government Portfolio
Schedule of Investments as of December 31, 2023
| * | Principal amount stated in U.S. dollars unless otherwise noted. | |||||||||
| † | Restricted securities are not registered under the Securities Act of 1933 and are subject to legal restrictions on resale. These securities generally may be resold in transactions exempt from registration or to the public if the securities are subsequently registered. Disposal of these securities may involve time-consuming negotiations and prompt sale at an acceptable price may be difficult. As of December 31, 2023, the market value of restricted securities was $2,015,511, which is 0.1% of net assets. See details shown in the Restricted Securities table that follows. | |||||||||
| (a) | Variable or floating rate security. The stated rate represents the rate at December 31, 2023. Maturity date shown for callable securities reflects the earliest possible call date. For securities based on a published reference index and spread, the index and spread are indicated in the description above. For certain variable rate securities, the coupon rate is determined by the issuer/agent based on current market conditions. For certain asset- and mortgage-backed securities, the coupon rate may fluctuate based on changes of the underlying collateral or prepayments of principal. These securities do not indicate a reference index and spread in their description above. | |||||||||
| (b) | Interest only security. | |||||||||
| (c) | Security was valued in good faith under procedures subject to oversight by the Board of Trustees. As of December 31, 2023, these securities represent less than 0.05% of net assets. | |||||||||
| (d) | Significant unobservable inputs were used in the valuation of this portfolio security; i.e. Level 3. | |||||||||
| (e) | Principal only security. | |||||||||
| (f) | TBA (To Be Announced) Securities are purchased on a forward commitment basis with an approximate principal amount and no defined maturity date. The actual principal and maturity date will be determined upon settlement date. | |||||||||
| (g) | Principal amount of security is adjusted for inflation. | |||||||||
| (h) | All or a portion of the security was held on loan. As of December 31, 2023, the market value of securities loaned was $353,291 and the collateral received consisted of non-cash collateral with a value of $364,456. The non-cash collateral received consists of U.S. government securities that are held in safe-keeping by the lending agent, or a third-party custodian, and cannot be sold or repledged by the Portfolio. As such, this collateral is excluded from the Statement of Assets and Liabilities. | |||||||||
| (i) | Security is a “step-up” bond where coupon increases or steps up at a predetermined date. Rate shown is current coupon rate. | |||||||||
| (144A) | Securities exempt from registration under Rule 144A of the Securities Act of 1933. These securities may be resold in transactions exempt from registration, normally to qualified institutional buyers. As of December 31, 2023, the market value of 144A securities was $91,025,068, which is 6.4% of net assets. | |||||||||
| Restricted Securities |
Acquisition Date |
Principal Amount |
Cost | Value | ||||||||||||
| CSMC Trust, 8.830%, 10/25/66 |
07/14/22 | $ | 2,069,895 | $ | 2,069,894 | $ | 2,015,511 | |||||||||
|
|
|
|||||||||||||||
See accompanying notes to financial statements.
BHFTII-12
Brighthouse Funds Trust II
Western Asset Management U.S. Government Portfolio
Schedule of Investments as of December 31, 2023
Futures Contracts
| Futures Contracts—Long |
Expiration Date |
Number of Contracts |
Notional Amount |
Value/ Unrealized Appreciation/ (Depreciation) |
||||||||||||||||
| U.S. Treasury Note 10 Year Futures |
03/19/24 | 2 | USD | 225,781 | $ | 965 | ||||||||||||||
|
|
|
|||||||||||||||||||
Glossary of Abbreviations
| Currencies | ||
| (USD)— | United States Dollar |
| Index Abbreviations | ||
| (H15)— | U.S. Treasury Yield Curve Rate T-Note Constant Maturity Index | |
| (RFUCCT)— | Refinitiv USD IBOR Consumer Cash Fallbacks Term | |
| (SOFR30A)— | Secured Overnight Financing Rate 30-Day Average | |
| (TSFR)— | Term Secured Financing Rate |
| Other Abbreviations | ||
| (ACES)— | Alternative Credit Enhancement Securities | |
| (REMIC)— | Real Estate Mortgage Investment Conduit | |
| (STACR)— | Structured Agency Credit Risk |
Fair Value Hierarchy
Accounting principles generally accepted in the United States of America (“GAAP”) define fair market value as the price that the Portfolio would receive to sell an asset or pay to transfer a liability in an orderly transaction between market participants at the measurement date. It establishes a fair value hierarchy that prioritizes inputs to valuation methods and requires disclosure of the fair value hierarchy, separately for each major category of assets and liabilities, that segregates fair value measurements into three levels. Levels 1, 2 and 3 of the fair value hierarchy are defined as follows:
Level 1 - unadjusted quoted prices in active markets for identical investments
Level 2 - other significant observable inputs (including, but not limited to, quoted prices for similar assets or liabilities in markets that are either active or inactive; inputs other than quoted prices that are observable such as interest rates, yield curves, volatilities, prepayment speeds, loss severities, credit risks, default rates, or other market corroborated inputs)
Level 3 - significant unobservable inputs based on the best information available in the circumstances, to the extent observable inputs are unavailable (including the Portfolio’s own assumptions used in determining the fair value of investments and derivative financial instruments)
The inputs or methodologies used for valuing investments are not necessarily an indication of the risk associated with investing in them. Changes to the inputs or methodologies used may result in transfers between levels. A reconciliation of Level 3 securities, if any, will be disclosed following the fair value hierarchy table. For more information about the Portfolio’s policy regarding the valuation of investments, please refer to the Notes to Financial Statements.
The following table summarizes the fair value hierarchy of the Portfolio’s investments as of December 31, 2023:
| Description | Level 1 | Level 2 | Level 3 | Total | ||||||||||||
| U.S. Treasury & Government Agencies |
| |||||||||||||||
| Agency Sponsored Mortgage - Backed |
$ | — | $ | 520,832,111 | $ | 319,025 | $ | 521,151,136 | ||||||||
| Federal Agencies |
— | 459,608,207 | — | 459,608,207 | ||||||||||||
| U.S. Treasury |
— | 253,323,360 | — | 253,323,360 | ||||||||||||
| Total U.S. Treasury & Government Agencies |
— | 1,233,763,678 | 319,025 | 1,234,082,703 | ||||||||||||
| Total Foreign Government* |
— | 71,698,330 | — | 71,698,330 | ||||||||||||
| Total Corporate Bonds & Notes* |
— | 60,804,523 | — | 60,804,523 | ||||||||||||
| Total Mortgage-Backed Securities* |
— | 53,364,472 | — | 53,364,472 | ||||||||||||
| Total Asset-Backed Securities* |
— | 172,595 | — | 172,595 | ||||||||||||
| Total Short-Term Investment* |
— | 20,342,579 | — | 20,342,579 | ||||||||||||
| Total Investments |
$ | — | $ | 1,440,146,177 | $ | 319,025 | $ | 1,440,465,202 | ||||||||
| Futures Contracts |
| |||||||||||||||
| Futures Contracts (Unrealized Appreciation) |
$ | 965 | $ | — | $ | — | $ | 965 | ||||||||
| * | See Schedule of Investments for additional detailed categorizations. | |||
Level 3 investments at the beginning and/or end of the period in relation to net assets were not significant and accordingly, a reconciliation of Level 3 assets for the year ended December 31, 2023 is not presented.
See accompanying notes to financial statements.
BHFTII-13
Brighthouse Funds Trust II
Western Asset Management U.S. Government Portfolio
| Statement of Assets and Liabilities |
| |||
| December 31, 2023 |
| |||
| Assets |
| |||
| Investments at value (a)(b) |
$ | 1,440,465,202 | ||
| Cash |
419 | |||
| Cash collateral for futures contracts |
30,873 | |||
| Receivable for: |
| |||
| Investments sold |
1,040,856 | |||
| TBA securities sold |
92,210,965 | |||
| Fund shares sold |
380,710 | |||
| Principal paydowns |
36,684 | |||
| Interest |
6,424,040 | |||
| Variation margin on futures contracts |
3,917 | |||
| Prepaid expenses |
5,448 | |||
|
|
|
|||
| Total Assets |
1,540,599,114 | |||
|
|
|
|||
| Liabilities |
| |||
| Payables for: |
| |||
| Investments purchased |
1,014,750 | |||
| TBA securities purchased |
117,200,576 | |||
| Fund shares redeemed |
155,654 | |||
| Accrued Expenses: |
| |||
| Management fees |
552,284 | |||
| Distribution and service fees |
64,658 | |||
| Deferred trustees’ fees |
169,327 | |||
| Other expenses |
175,842 | |||
|
|
|
|||
| Total Liabilities |
119,333,091 | |||
|
|
|
|||
| Net Assets |
$ | 1,421,266,023 | ||
|
|
|
|||
| Net Assets Consist of: |
| |||
| Paid in surplus |
$ | 1,674,806,140 | ||
| Distributable earnings (Accumulated losses) |
(253,540,117 | ) | ||
|
|
|
|||
| Net Assets |
$ | 1,421,266,023 | ||
|
|
|
|||
| Net Assets |
| |||
| Class A |
$ | 1,108,441,752 | ||
| Class B |
299,531,129 | |||
| Class E |
13,293,142 | |||
| Capital Shares Outstanding* |
| |||
| Class A |
105,169,979 | |||
| Class B |
28,555,056 | |||
| Class E |
1,264,953 | |||
| Net Asset Value, Offering Price and Redemption Price Per Share |
| |||
| Class A |
$ | 10.54 | ||
| Class B |
10.49 | |||
| Class E |
10.51 | |||
| * | The Portfolio is authorized to issue an unlimited number of shares. | |||
| (a) | Identified cost of investments was $1,520,649,535. | |||
| (b) | Includes securities loaned at value of $353,291. | |||
| Statement of Operations |
| |||
| Year Ended December 31, 2023 |
| |||
| Investment Income |
| |||
| Interest |
$ | 44,628,722 | ||
| Securities lending income |
8,697 | |||
|
|
|
|||
| Total investment income |
44,637,419 | |||
|
|
|
|||
| Expenses |
| |||
| Management fees |
6,967,244 | |||
| Administration fees |
76,962 | |||
| Custodian and accounting fees |
183,410 | |||
| Distribution and service fees - Class B |
748,293 | |||
| Distribution and service fees - Class E |
20,313 | |||
| Audit and tax services |
75,018 | |||
| Legal |
46,604 | |||
| Trustees’ fees and expenses |
46,220 | |||
| Shareholder reporting |
56,755 | |||
| Insurance |
13,866 | |||
| Miscellaneous |
27,518 | |||
|
|
|
|||
| Total expenses |
8,262,203 | |||
| Less management fee waiver |
(330,500 | ) | ||
|
|
|
|||
| Net expenses |
7,931,703 | |||
|
|
|
|||
| Net Investment Income |
36,705,716 | |||
|
|
|
|||
| Net Realized and Unrealized Gain (Loss) |
| |||
| Net realized gain (loss) on : |
| |||
| Investments |
(29,247,970 | ) | ||
| Futures contracts |
(4,518,500 | ) | ||
|
|
|
|||
| Net realized gain (loss) |
(33,766,470 | ) | ||
|
|
|
|||
| Net change in unrealized appreciation (depreciation) on: |
| |||
| Investments |
62,015,868 | |||
| Futures contracts |
241,462 | |||
|
|
|
|||
| Net change in unrealized appreciation (depreciation) |
62,257,330 | |||
|
|
|
|||
| Net realized and unrealized gain (loss) |
28,490,860 | |||
|
|
|
|||
| Net Increase (Decrease) in Net Assets From Operations |
$ | 65,196,576 | ||
|
|
|
|||
See accompanying notes to financial statements.
BHFTII-14
Brighthouse Funds Trust II
Western Asset Management U.S. Government Portfolio
Statements of Changes in Net Assets
| Year Ended December 31, 2023 |
Year Ended December 31, 2022 |
|||||||||||
| Increase (Decrease) in Net Assets: |
||||||||||||
| From Operations |
||||||||||||
| Net investment income (loss) |
$ | 36,705,716 | $ | 23,542,377 | ||||||||
| Net realized gain (loss) |
(33,766,470 | ) | (38,710,791 | ) | ||||||||
| Net change in unrealized appreciation (depreciation) |
62,257,330 | (148,836,492 | ) | |||||||||
|
|
|
|
|
|||||||||
| Increase (decrease) in net assets from operations |
65,196,576 | (164,004,906 | ) | |||||||||
|
|
|
|
|
|||||||||
| From Distributions to Shareholders |
||||||||||||
| Class A |
(26,339,958 | ) | (29,881,117 | ) | ||||||||
| Class B |
(6,192,310 | ) | (6,716,761 | ) | ||||||||
| Class E |
(291,071 | ) | (335,920 | ) | ||||||||
|
|
|
|
|
|||||||||
| Total distributions |
(32,823,339 | ) | (36,933,798 | ) | ||||||||
|
|
|
|
|
|||||||||
| Increase (decrease) in net assets from capital share transactions |
(71,461,470 | ) | (266,436,445 | ) | ||||||||
|
|
|
|
|
|||||||||
| Total increase (decrease) in net assets |
(39,088,233 | ) | (467,375,149 | ) | ||||||||
| Net Assets |
||||||||||||
| Beginning of period |
1,460,354,256 | 1,927,729,405 | ||||||||||
|
|
|
|
|
|||||||||
| End of period |
$ | 1,421,266,023 | $ | 1,460,354,256 | ||||||||
|
|
|
|
|
|||||||||
Other Information:
Capital Shares
Transactions in capital shares were as follows:
| Year Ended December 31, 2023 |
Year Ended December 31, 2022 |
|||||||||||||||
| Shares | Value | Shares | Value | |||||||||||||
| Class A |
||||||||||||||||
| Sales |
2,397,782 | $ | 24,808,435 | 1,219,504 | $ | 13,184,971 | ||||||||||
| Reinvestments |
2,579,820 | 26,339,958 | 2,867,670 | 29,881,117 | ||||||||||||
| Redemptions |
(11,627,271 | ) | (118,736,964 | ) | (23,993,655 | ) | (258,436,571 | ) | ||||||||
|
|
|
|
|
|
|
|
|
|||||||||
| Net increase (decrease) |
(6,649,669 | ) | $ | (67,588,571 | ) | (19,906,481 | ) | $ | (215,370,483 | ) | ||||||
|
|
|
|
|
|
|
|
|
|||||||||
| Class B |
||||||||||||||||
| Sales |
3,569,147 | $ | 36,782,857 | 3,089,388 | $ | 33,212,463 | ||||||||||
| Reinvestments |
608,282 | 6,192,310 | 647,087 | 6,716,761 | ||||||||||||
| Redemptions |
(4,464,311 | ) | (45,667,375 | ) | (8,317,215 | ) | (89,135,628 | ) | ||||||||
|
|
|
|
|
|
|
|
|
|||||||||
| Net increase (decrease) |
(286,882 | ) | $ | (2,692,208 | ) | (4,580,740 | ) | $ | (49,206,404 | ) | ||||||
|
|
|
|
|
|
|
|
|
|||||||||
| Class E |
||||||||||||||||
| Sales |
70,269 | $ | 727,876 | 62,148 | $ | 673,994 | ||||||||||
| Reinvestments |
28,564 | 291,071 | 32,331 | 335,920 | ||||||||||||
| Redemptions |
(213,234 | ) | (2,199,638 | ) | (267,442 | ) | (2,869,472 | ) | ||||||||
|
|
|
|
|
|
|
|
|
|||||||||
| Net increase (decrease) |
(114,401 | ) | $ | (1,180,691 | ) | (172,963 | ) | $ | (1,859,558 | ) | ||||||
|
|
|
|
|
|
|
|
|
|||||||||
| Increase (decrease) derived from capital shares transactions |
$ | (71,461,470 | ) | $ | (266,436,445 | ) | ||||||||||
|
|
|
|
|
|||||||||||||
See accompanying notes to financial statements.
BHFTII-15
Brighthouse Funds Trust II
Western Asset Management U.S. Government Portfolio
Financial Highlights
| Selected per share data | ||||||||||||||||||||
| Class A | ||||||||||||||||||||
| Year Ended December 31, | ||||||||||||||||||||
| 2023 | 2022 | 2021 | 2020 | 2019 | ||||||||||||||||
| Net Asset Value, Beginning of Period |
$ | 10.29 | $ | 11.58 | $ | 12.08 | $ | 11.85 | $ | 11.49 | ||||||||||
|
|
|
|
|
|
|
|
|
|
|
|||||||||||
| Income (Loss) from Investment Operations |
||||||||||||||||||||
| Net investment income (loss) (a) |
0.27 | 0.16 | 0.10 | 0.20 | 0.29 | |||||||||||||||
| Net realized and unrealized gain (loss) |
0.22 | (1.20 | ) | (0.28 | ) | 0.42 | 0.40 | |||||||||||||
|
|
|
|
|
|
|
|
|
|
|
|||||||||||
| Total income (loss) from investment operations |
0.49 | (1.04 | ) | (0.18 | ) | 0.62 | 0.69 | |||||||||||||
|
|
|
|
|
|
|
|
|
|
|
|||||||||||
| Less Distributions |
| |||||||||||||||||||
| Distributions from net investment income |
(0.24 | ) | (0.25 | ) | (0.32 | ) | (0.39 | ) | (0.33 | ) | ||||||||||
|
|
|
|
|
|
|
|
|
|
|
|||||||||||
| Total distributions |
(0.24 | ) | (0.25 | ) | (0.32 | ) | (0.39 | ) | (0.33 | ) | ||||||||||
|
|
|
|
|
|
|
|
|
|
|
|||||||||||
| Net Asset Value, End of Period |
$ | 10.54 | $ | 10.29 | $ | 11.58 | $ | 12.08 | $ | 11.85 | ||||||||||
|
|
|
|
|
|
|
|
|
|
|
|||||||||||
| Total Return (%) (b) |
4.87 | (9.01 | ) | (1.52 | ) | 5.24 | 6.03 | |||||||||||||
| Ratios/Supplemental Data |
| |||||||||||||||||||
| Gross ratio of expenses to average net assets (%) |
0.52 | 0.51 | 0.50 | 0.51 | 0.50 | |||||||||||||||
| Net ratio of expenses to average net assets (%) (c) |
0.50 | 0.49 | 0.48 | 0.48 | 0.48 | |||||||||||||||
| Ratio of net investment income (loss) to average net assets (%) |
2.61 | 1.48 | 0.83 | 1.69 | 2.48 | |||||||||||||||
| Portfolio turnover rate (%) |
86 | (d) | 103 | (d) | 167 | (d) | 226 | (d) | 208 | (d) | ||||||||||
| Net assets, end of period (in millions) |
$ | 1,108.4 | $ | 1,150.8 | $ | 1,525.0 | $ | 1,493.8 | $ | 1,544.1 | ||||||||||
| Class B | ||||||||||||||||||||
| Year Ended December 31, | ||||||||||||||||||||
| 2023 | 2022 | 2021 | 2020 | 2019 | ||||||||||||||||
| Net Asset Value, Beginning of Period |
$ | 10.24 | $ | 11.51 | $ | 12.01 | $ | 11.79 | $ | 11.43 | ||||||||||
|
|
|
|
|
|
|
|
|
|
|
|||||||||||
| Income (Loss) from Investment Operations |
| |||||||||||||||||||
| Net investment income (loss) (a) |
0.24 | 0.13 | 0.07 | 0.17 | 0.26 | |||||||||||||||
| Net realized and unrealized gain (loss) |
0.22 | (1.18 | ) | (0.28 | ) | 0.40 | 0.39 | |||||||||||||
|
|
|
|
|
|
|
|
|
|
|
|||||||||||
| Total income (loss) from investment operations |
0.46 | (1.05 | ) | (0.21 | ) | 0.57 | 0.65 | |||||||||||||
|
|
|
|
|
|
|
|
|
|
|
|||||||||||
| Less Distributions |
||||||||||||||||||||
| Distributions from net investment income |
(0.21 | ) | (0.22 | ) | (0.29 | ) | (0.35 | ) | (0.29 | ) | ||||||||||
|
|
|
|
|
|
|
|
|
|
|
|||||||||||
| Total distributions |
(0.21 | ) | (0.22 | ) | (0.29 | ) | (0.35 | ) | (0.29 | ) | ||||||||||
|
|
|
|
|
|
|
|
|
|
|
|||||||||||
| Net Asset Value, End of Period |
$ | 10.49 | $ | 10.24 | $ | 11.51 | $ | 12.01 | $ | 11.79 | ||||||||||
|
|
|
|
|
|
|
|
|
|
|
|||||||||||
| Total Return (%) (b) |
4.59 | (9.17 | ) | (1.77 | ) | 4.91 | 5.78 | |||||||||||||
| Ratios/Supplemental Data |
||||||||||||||||||||
| Gross ratio of expenses to average net assets (%) |
0.77 | 0.76 | 0.75 | 0.76 | 0.75 | |||||||||||||||
| Net ratio of expenses to average net assets (%)(c) |
0.75 | 0.74 | 0.73 | 0.73 | 0.73 | |||||||||||||||
| Ratio of net investment income (loss) to average net assets (%) |
2.36 | 1.24 | 0.58 | 1.43 | 2.23 | |||||||||||||||
| Portfolio turnover rate (%) |
86 | (d) | 103 | (d) | 167 | (d) | 226 | (d) | 208 | (d) | ||||||||||
| Net assets, end of period (in millions) |
$ | 299.5 | $ | 295.4 | $ | 384.8 | $ | 396.6 | $ | 367.9 | ||||||||||
Please see following page for Financial Highlights footnote legend.
See accompanying notes to financial statements.
BHFTII-16
Brighthouse Funds Trust II
Western Asset Management U.S. Government Portfolio
Financial Highlights
| Selected per share data | ||||||||||||||||||||
| Class E | ||||||||||||||||||||
| Year Ended December 31, | ||||||||||||||||||||
| 2023 | 2022 | 2021 | 2020 | 2019 | ||||||||||||||||
| Net Asset Value, Beginning of Period |
$ | 10.26 | $ | 11.54 | $ | 12.03 | $ | 11.81 | $ | 11.45 | ||||||||||
|
|
|
|
|
|
|
|
|
|
|
|||||||||||
| Income (Loss) from Investment Operations |
||||||||||||||||||||
| Net investment income (loss)(a) |
0.25 | 0.14 | 0.08 | 0.18 | 0.27 | |||||||||||||||
| Net realized and unrealized gain (loss) |
0.23 | (1.19 | ) | (0.27 | ) | 0.41 | 0.40 | |||||||||||||
|
|
|
|
|
|
|
|
|
|
|
|||||||||||
| Total income (loss) from investment operations |
0.48 | (1.05 | ) | (0.19 | ) | 0.59 | 0.67 | |||||||||||||
|
|
|
|
|
|
|
|
|
|
|
|||||||||||
| Less Distributions |
||||||||||||||||||||
| Distributions from net investment income |
(0.23 | ) | (0.23 | ) | (0.30 | ) | (0.37 | ) | (0.31 | ) | ||||||||||
|
|
|
|
|
|
|
|
|
|
|
|||||||||||
| Total distributions |
(0.23 | ) | (0.23 | ) | (0.30 | ) | (0.37 | ) | (0.31 | ) | ||||||||||
|
|
|
|
|
|
|
|
|
|
|
|||||||||||
| Net Asset Value, End of Period |
$ | 10.51 | $ | 10.26 | $ | 11.54 | $ | 12.03 | $ | 11.81 | ||||||||||
|
|
|
|
|
|
|
|
|
|
|
|||||||||||
| Total Return (%) (b) |
4.70 | (9.12 | ) | (1.60 | ) | 5.01 | 5.88 | |||||||||||||
| Ratios/Supplemental Data |
||||||||||||||||||||
| Gross ratio of expenses to average net assets (%) |
0.67 | 0.66 | 0.65 | 0.66 | 0.65 | |||||||||||||||
| Net ratio of expenses to average net assets (%)(c) |
0.65 | 0.64 | 0.63 | 0.63 | 0.63 | |||||||||||||||
| Ratio of net investment income (loss) to average net assets (%) |
2.46 | 1.34 | 0.69 | 1.54 | 2.33 | |||||||||||||||
| Portfolio turnover rate (%) |
86 | (d) | 103 | (d) | 167 | (d) | 226 | (d) | 208 | (d) | ||||||||||
| Net assets, end of period (in millions) |
$ | 13.3 | $ | 14.2 | $ | 17.9 | $ | 20.1 | $ | 19.5 | ||||||||||
| (a) | Per share amounts based on average shares outstanding during the period. | |||
| (b) | Total return does not reflect any insurance, sales, separate account or administrative charges of variable annuity or life insurance contracts or any additional expenses that contract owners may bear under their variable contracts. If these charges were included, the returns would be lower. | |||
| (c) | Includes the effects of management fee waivers (see Note 6 of the Notes to Financial Statements). | |||
| (d) | Includes mortgage dollar roll and TBA transactions; excluding these transactions the portfolio turnover rates would have been 39%, 43%, 70%, 100%, and 76% for the years ended December 31, 2023, 2022, 2021, 2020, and 2019, respectively. | |||
See accompanying notes to financial statements.
BHFTII-17
Brighthouse Funds Trust II
Western Asset Management U.S. Government Portfolio
Notes to Financial Statements—December 31, 2023
1. Organization
Brighthouse Funds Trust II (the “Trust”) is organized as a Delaware statutory trust and registered under the Investment Company Act of 1940, as amended (the “1940 Act”), as an open-end management investment company. The Trust, which is managed by Brighthouse Investment Advisers, LLC (“Brighthouse Investment Advisers” or the “Adviser”), currently offers twenty-nine series (the “Portfolios”), each of which operates as a distinct investment vehicle of the Trust. The series included in this report is Western Asset Management U.S. Government Portfolio (the “Portfolio”), which is diversified. Shares of the Portfolio are not offered directly to the general public and are currently available only to separate accounts of insurance companies, including insurance companies affiliated with the Adviser.
The Portfolio has registered and offers three classes of shares: Class A, B and E shares. Shares of each class of the Portfolio represent an equal pro rata interest in the Portfolio and generally give the shareholder the same voting, dividend, liquidation, and other rights. Investment income, realized and unrealized capital gains and losses, the common expenses of the Portfolio, and certain Portfolio-level expense reductions, if any, are allocated on a pro rata basis to each class based on the relative net assets of each class to the net assets of the Portfolio. Each class of shares differs in its respective distribution plan and such distribution expenses are allocated to the corresponding class of shares.
2. Significant Accounting Policies
The preparation of financial statements in conformity with accounting principles generally accepted in the United States of America (“GAAP”) requires management to make estimates and assumptions that affect the reported amounts of assets and liabilities and disclosure of contingent assets and liabilities as of the date of the financial statements and the reported amounts of income and expenses during the reporting period. Actual results could differ from those estimates. In the preparation of these financial statements, management has evaluated events and transactions subsequent to December 31, 2023 through the date the financial statements were issued.
The Portfolio is an investment company and follows the accounting and reporting guidance of the Financial Accounting Standards Board (“FASB”) Accounting Standards Codification Topic 946- Financial Services- Investment Companies. The following is a summary of significant accounting policies consistently followed by the Portfolio in the preparation of its financial statements.
Investment Valuation and Fair Value Measurements - The Portfolio values its investments for purposes of calculating its net asset value (“NAV”) using procedures that allow for a variety of methodologies to be used to value the Portfolio’s investments. The specific methodology used for an investment may vary based on the market data available for a specific investment at the time the Portfolio calculates its NAV or based on other considerations. The procedures also permit a level of judgment to be used in the valuation process.
Debt securities, including corporate, convertible and municipal bonds and notes; obligations of the U.S. Treasury and U.S. government agencies; foreign sovereign issues; and non-U.S. bonds, are generally valued based upon evaluated or composite bid quotations obtained from third-party pricing services and/or brokers and dealers selected by the Adviser (each a “pricing service”). Such pricing services may use matrix pricing, which considers observable inputs including, among other things, issuer details, maturity dates, interest rates, yield curves, rates of prepayment, credit risks/spreads, default rates, reported trades, broker-dealer quotes and quoted prices for similar assets. Short-term obligations with a remaining maturity of sixty days or less may be valued at amortized cost in the absence of market quotes, so long as the amortized cost value of such short-term debt instrument is approximately the same as the fair value of the instrument as determined without the use of amortized cost valuation. Floating rate loans are generally valued based upon an evaluated or composite average of aggregate bid and ask quotations supplied by brokers or dealers, as obtained from the pricing service. Securities that use similar valuation techniques and inputs as described above are generally categorized as Level 2 within the fair value hierarchy.
Mortgage- and asset-backed securities are generally valued based upon evaluated or composite bid quotations obtained from pricing services selected by the Adviser. These securities are usually issued as separate tranches, or classes, of securities within each deal. The pricing models for these securities usually consider tranche-level attributes, current market data, estimated cash flows and market-based yield spreads for each tranche and incorporate deal collateral performance, as available. Mortgage- and asset-backed securities that use similar valuation techniques and inputs as described above are generally categorized as Level 2 within the fair value hierarchy.
Domestic and foreign equity securities, such as common stock, exchange-traded funds, rights, warrants, and preferred stock, that are traded on a securities exchange on a valuation date are generally valued at their last quoted sale price or official closing price on the primary exchange for such security, or, if no sales occurred on that day, at the last reported bid price. Equity securities traded over-the-counter (“OTC”) are generally valued at the last reported bid price. In the event of a major exchange closing during the trading day, the Adviser may use other market information obtained from quotation reporting systems, established market makers, or pricing services in valuing the securities. Valuation adjustments may be applied to certain foreign equity securities that are traded
BHFTII-18
Brighthouse Funds Trust II
Western Asset Management U.S. Government Portfolio
Notes to Financial Statements—December 31, 2023—(Continued)
solely on foreign exchanges that close before the time as of which the Portfolio determines its NAV to account for the market movement between the close of the foreign exchanges and the time as of which the Portfolio determines its NAV. The Portfolio may use a systematic fair valuation model provided by a pricing service to value securities principally traded in these foreign markets to adjust for possible market movements or other changes that may occur between the close of the foreign exchanges and the time as of which the Portfolio determines its NAV. Foreign equity securities valued using these valuation adjustments are generally categorized as Level 2 within the fair value hierarchy. Equity securities that are actively traded, and have no valuation adjustments applied, are categorized as Level 1 within the fair value hierarchy. Other equity securities traded on inactive markets or valued in reference to similar instruments traded on active markets are generally categorized as Level 2 within the fair value hierarchy.
Investments in registered open-end management investment companies are valued at reported NAV per share on the valuation date and are categorized as Level 1 within the fair value hierarchy.
Futures contracts that are traded on commodity exchanges are valued at their closing prices as of the close of such exchanges and are categorized as Level 1 within the fair value hierarchy.
If no current market quotation is readily available or market value quotations are deemed to be unreliable for an investment, the fair value of the investment will be determined in accordance with procedures. A market quotation is readily available only when that quotation is a quoted price (unadjusted) in active markets for identical investments that the Portfolio can access at the measurement date, provided that a quotation will not be readily available if it is not reliable.
Pursuant to Rule 2a-5 under the 1940 Act, the Board of Trustees (the “Board” or “Trustees”) of the Trust has designated Brighthouse Investment Advisers, acting through its Valuation Committee (“Committee”), as the Portfolio’s “valuation designee” to perform the Portfolio’s fair value determinations. The Board oversees Brighthouse Investment Advisers in its role as the Valuation Designee and receives reports from Brighthouse Investment Advisers regarding its process and the valuation of the Portfolio’s investments to assist with such oversight.
No single standard for determining the fair value of an investment can be set forth because fair value depends upon the facts and circumstances with respect to each investment. Information relating to any relevant factors may be obtained by the Committee from any appropriate source, including the subadviser of the Portfolio, the Custodian, a pricing service, market maker and/or broker for such security or the issuer. Appropriate methodologies for determining fair value under particular circumstances may include: matrix pricing, a discounted cash flow analysis, comparisons of securities with comparable characteristics, value based on multiples of earnings, discount from market price of similar marketable securities, or a combination of these and other methods.
Foreign Currency Translation - The books and records of the Portfolio are maintained in U.S. dollars. The values of securities, currencies, and other assets and liabilities denominated in currencies other than the U.S. dollar are translated into U.S. dollars based upon foreign exchange rates prevailing at the end of the period. Purchases and sales of investment securities, income, and expenses are translated on the respective dates of such transactions. Because the values of investment securities are translated at the foreign exchange rates prevailing at the end of the period, that portion of the results of operations arising from changes in exchange rates and that portion of the results of operations reflecting fluctuations arising from changes in market prices of the investment securities are not separated. Such fluctuations are included in the net realized and unrealized gain or loss on investments.
Net realized foreign exchange gains or losses arise from activity in forward foreign currency exchange contracts, sales of foreign currency, currency gains or losses realized between the trade and settlement dates on securities transactions, and the difference between the amounts of dividends, interest, and foreign withholding taxes recorded by the Portfolio and the U.S. dollar-equivalent of the amounts actually received or paid by the Portfolio. Net unrealized foreign exchange gains and losses arise from changes in the value of assets and liabilities, other than investment securities, resulting from changes in foreign exchange rates.
Investment Transactions and Related Investment Income - Portfolio security transactions are recorded on the trade date. Dividend income is recorded on the ex-dividend date or, for certain foreign securities, when notified. Interest income, which includes amortization of premium and accretion of discount on debt securities, is recorded on the accrual basis. Realized gains and losses on investments are determined on the identified cost basis, which is the same basis used for federal income tax purposes. Foreign income and foreign capital gains on some foreign securities may be subject to foreign taxes, which are accrued as applicable. These foreign taxes have been provided for in accordance with the Portfolio’s understanding of the applicable countries’ tax rules and rates.
Dividends and Distributions to Shareholders - The Portfolio records dividends and distributions on the ex-dividend date. Net realized gains from securities transactions (if any) are generally distributed annually to shareholders. The timing and characterization of certain income and capital gains distributions are determined in accordance with federal tax regulations that may differ from GAAP. Permanent book and tax basis differences relating to shareholder distributions will result in reclassification between distributable earnings (accumulated losses) and paid in surplus. These adjustments have no impact on net assets or the results of operations.
Income Taxes - It is the Portfolio’s policy to comply with the requirements of the Internal Revenue Code of 1986, as amended, and regulations thereunder, applicable to regulated investment companies, and to distribute, with respect to each taxable year, all of its taxable income to shareholders. Therefore, no federal income tax provision is required. The Portfolio files U.S. federal tax returns. No
BHFTII-19
Brighthouse Funds Trust II
Western Asset Management U.S. Government Portfolio
Notes to Financial Statements—December 31, 2023—(Continued)
income tax returns are currently under examination. The Portfolio’s federal tax returns remain subject to examination by the Internal Revenue Service for three fiscal years after the returns are filed. As of December 31, 2023, the Portfolio had no uncertain tax positions that would require financial statement recognition, derecognition or disclosure.
Inflation-Indexed Bonds - The Portfolio may invest in inflation-indexed bonds. Inflation-indexed bonds are fixed income securities whose principal value is periodically adjusted according to the rate of inflation. The interest rate on these bonds is generally fixed at issuance at a rate lower than typical bonds. Over the life of an inflation-indexed bond, however, interest will be paid based on a principal value that is adjusted for inflation. Any increase or decrease in the principal amount of an inflation-indexed bond will be included as interest income on the Statement of Operations, even though investors do not receive their principal until maturity. Repayment of the original bond principal upon maturity (as adjusted for inflation) is guaranteed in the case of U.S. Treasury Inflation-Protected Securities (“TIPS”). For bonds that do not provide a similar guarantee, the adjusted principal value of the bond repaid at maturity may be less than the original principal.
Stripped Securities - The Portfolio may invest in “stripped securities,” a term used collectively for certain structured fixed income securities. Stripped securities can be principal only securities (“POs”), which are debt obligations that have been stripped of unmatured interest coupons or interest only securities (“IOs”), which are unmatured interest coupons that have been stripped from debt obligations. Stripped securities do not make periodic payments of interest prior to maturity. As is the case with all securities, the market value of stripped securities will fluctuate in response to changes in economic conditions, interest rates and the market’s perception of the securities. However, fluctuations in response to interest rates may be greater in stripped securities than for debt obligations of comparable maturities that currently pay interest. The amount of fluctuation increases with a longer period of maturity.
The yield to maturity on IOs is sensitive to the rate of principal repayments (including prepayments) on the related underlying debt obligation and principal payments may have a material effect on yield to maturity. If the underlying debt obligation experiences greater than anticipated prepayments of principal, the Portfolio may not fully recoup the initial investment in IOs.
Mortgage Dollar Rolls - The Portfolio may enter into mortgage “dollar rolls” in which a Portfolio sells to-be-announced (“TBA”) mortgage-backed securities for delivery in the current month and simultaneously contracts to repurchase substantially similar (same type, coupon, and maturity) securities on a specified future date. For the duration of the transaction, or roll period, the Portfolio foregoes principal (including prepayments of principal) and interest paid on the securities sold. Dollar rolls are accounted for as purchase and sale transactions; gain or loss is recognized at the commencement of the term of the dollar roll and each time the mortgage-backed security is rolled.
Mortgage dollar roll transactions involve the risk that the market value of the securities that the Portfolio is required to reacquire may be less than the agreed-upon repurchase price of those securities and that the investment performance of securities purchased with proceeds from these transactions does not exceed the income, capital appreciation and gain or loss that would have been realized on the securities transferred or sold, as applicable, as part of the treasury or mortgage dollar roll.
Mortgage-Related and Other Asset-Backed Securities - The Portfolio may invest in mortgage-related or other asset-backed securities. These securities may include mortgage pass-through securities, collateralized mortgage obligations (“CMOs”), commercial mortgage-backed securities, CMO residuals, stripped mortgage-backed securities (“SMBS”), and other securities that directly or indirectly represent a participation in, or are secured by or payable from, mortgage loans on real property or other receivables. The value of some mortgage- or asset-backed securities may be particularly sensitive to changes in prevailing interest rates. Early repayment of principal on some mortgage-related securities may expose the Portfolio to a lower rate of return upon reinvestment of principal. The value of these securities may fluctuate in response to the market’s perception of the creditworthiness of the issuers. Additionally, although mortgages and mortgage-related securities are generally supported by some form of government or private guarantee and/or insurance, there is no assurance that private guarantors or insurers will meet their obligations.
In one type of SMBS, one class receives all of the interest from the mortgage assets (the interest-only or “IO” class), while the other class will receive all of the principal (the principal-only or “PO” class). Because principal will not be received at the maturity of an IO, adjustments are made to the book value of the security until maturity. These adjustments are netted against payments received for the IOs and the net amount is included in interest income on the Statement of Operations of the Portfolio. Payments received for POs are treated as reductions to the cost and par value of the securities. Details of mortgage-related and other asset-backed securities held by the Portfolio are included in the Portfolio’s Schedule of Investments.
The Portfolio may invest a significant portion of its assets in securities of issuers that hold mortgage- and asset-backed securities and direct investments in securities backed by commercial and residential mortgage loans and other financial assets. The value and related income of these securities are sensitive to changes in economic conditions, including delinquencies and/or defaults, and may be negatively impacted by increased volatility of market prices and periods of illiquidity.
TBA Purchase and Forward Sale Commitments -The Portfolio may enter into TBA commitments to purchase or sell securities for a fixed price at a future date. TBA commitments are considered securities in themselves, and involve a risk of loss if the value of the security to be purchased or sold declines or increases prior to the settlement date, which is in addition to the risk of decline in the
BHFTII-20
Brighthouse Funds Trust II
Western Asset Management U.S. Government Portfolio
Notes to Financial Statements—December 31, 2023—(Continued)
value of the Portfolio’s other assets. TBA forward sale commitments are valued at the current market value of the underlying securities, according to the procedures described under “Investment Valuation and Fair Value Measurements”.
When-Issued and Delayed-Delivery Securities - The Portfolio may purchase securities on a when-issued or delayed-delivery basis. Settlement of such transactions will occur beyond the customary settlement period. The Portfolio may purchase securities under such conditions only with the intention of actually acquiring them, but may enter into a separate agreement to sell the securities before the settlement date. Since the value of securities purchased may fluctuate prior to settlement, the Portfolio may be required to pay more at settlement than the security is worth. In addition, the Portfolio is not entitled to any of the interest earned prior to settlement.
Repurchase Agreements - The Portfolio may enter into repurchase agreements, under the terms of a Master Repurchase Agreement (“MRA”), or Global Master Repurchase Agreement (“GMRA”), with selected commercial banks and broker-dealers, under which the Portfolio acquires securities as collateral and agrees to resell the securities at an agreed-upon time and at an agreed-upon price. The Portfolio, through the Custodian or a subcustodian, under a tri-party repurchase agreement, receives delivery of the underlying securities collateralizing any repurchase agreements. It is the Portfolio’s policy that the market value of the collateral be equal to at least 100% of the repurchase price in the case of a repurchase agreement of one-day duration and equal to at least 102% of the repurchase price in the case of all other repurchase agreements. In the event of default or failure by a party to perform an obligation in connection with any repurchase transaction, the MRA or GMRA gives the non-defaulting party the right to set-off claims and to apply property held by it in connection with any repurchase transaction against obligations owed to it under the agreement.
At December 31, 2023, the Portfolio had direct investments in repurchase agreements with a gross value of $20,342,579, which is included as part of investments at value on the Statement of Assets and Liabilities. The value of the related collateral exceeded the value of the repurchase agreements at December 31, 2023.
Securities Lending - The Portfolio may lend its portfolio securities to certain qualified brokers who borrow securities in order to complete certain securities transactions. By lending its portfolio securities, the Portfolio attempts to increase its net investment income through the receipt of income on collateral held from securities on loan. Any gain or loss in the market price of the loaned securities that might occur, any interest earned, and any dividends declared during the term of the loan, would accrue to the account of the Portfolio.
The Trust has entered into a Non-Custodial Securities Lending Agreement with JPMorgan Chase Bank, N.A. (the “Lending Agent”). Under the agreement, the Lending Agent is authorized to loan portfolio securities on the Portfolio’s behalf. In exchange, the Portfolio generally receives cash, U.S. Government securities, letters of credit, or other collateral deemed appropriate by the Adviser. The Portfolio receives collateral equal to at least 102% of the market value for loans secured by government securities or cash in the same currency as the loaned shares and 105% for all other loaned securities at each loan’s inception. Collateral representing at least 100% of the market value of the loaned securities is maintained for the duration of the loan. Any cash collateral received by the Portfolio is generally invested by the Lending Agent in short-term investments, which may include certificates of deposit, commercial paper, repurchase agreements, including repurchase agreements with respect to equity securities, time deposits, master demand notes and money market funds. The market value of investments made with cash collateral received are disclosed in the Schedule of Investments and the valuation techniques are described in Note 2. The value of the securities on loan may change each business day. If the market value of the collateral at the close of trading on a business day is less than 100% of the market value of the loaned securities at the close of trading on that day, the borrower is required to deliver, by the close of business on the following business day, an additional amount of collateral, so that the total amount of posted collateral is equal to at least 100% of the market value of all the loaned securities as of such preceding day. A portion of the income earned on the collateral is rebated to the borrower of the securities and the remainder is split between the Lending Agent and the Portfolio. On loans collateralized by U.S. government securities, a fee is received from the borrower and is allocated between the Portfolio and the Lending Agent.
Income received by the Portfolio in securities lending transactions during the year ended December 31, 2023 is reflected as securities lending income on the Statement of Operations. The values of any securities loaned by the Portfolio and the related collateral at December 31, 2023 are disclosed in the footnotes to the Schedule of Investments. The value of the related collateral received by the Portfolio exceeded the value of the securities out on loan at December 31, 2023.
The risks associated with lending portfolio securities include, but are not limited to, possible delays in receiving additional collateral or in the recovery of the loaned securities, possible loss of rights in the collateral should the borrower fail financially, as well as risk of loss in the value of the collateral or the value of the investments made with the collateral. To the extent the Portfolio uses cash collateral it receives to invest in repurchase agreements with respect to equity securities, it is subject to the risk of loss if the value of the equity securities declines and the counterparty defaults on its obligation to repurchase such securities. The Lending Agent shall indemnify the Portfolio in the case of default of any securities borrower, subject to the terms of the Non-Custodial Securities Lending Agreement.
All securities on loan are classified as Foreign Government in the Portfolio’s Schedule of Investments as of December 31, 2023. For all securities on loan, the remaining contractual maturity of the agreements is overnight and continuous.
BHFTII-21
Brighthouse Funds Trust II
Western Asset Management U.S. Government Portfolio
Notes to Financial Statements—December 31, 2023—(Continued)
3. Investments in Derivative Instruments
Futures Contracts - The Portfolio may buy and sell futures contracts as a hedge, to maintain investment exposure to a target asset class or to enhance return. The Portfolio may be subject to fluctuations in equity prices, interest rates, commodity prices, and foreign currency exchange rates in the normal course of pursuing its investment objective. Futures contracts are standardized agreements to buy or sell a security, or deliver a final cash settlement price in connection with an index, interest rate, currency, or other asset. The Portfolio must deposit an amount (“initial margin”) equal to a certain percentage of the face value of the futures contract. The initial margin may be in the form of cash or securities, which is returned when the Portfolio’s obligations under the contract have been satisfied. If cash is deposited as the initial margin, it is shown as cash collateral on the Statement of Assets and Liabilities. Futures contracts are marked-to-market daily and subsequent payments (“variation margin”) are made or received by the Portfolio depending on whether unrealized gains or losses are incurred. These amounts are reflected as receivables or payables on the Statement of Assets and Liabilities and as a component of net change in unrealized appreciation/depreciation on the Statement of Operations. When the contract is closed or expires, the Portfolio records a realized gain or loss equal to the difference between the value of the contract at the time it was opened and the value at the time it was closed. Risks of entering into futures contracts (and related options) include the possibility that the market for these instruments may be illiquid and that a change in the value of the futures contract or option may not correlate perfectly with changes in the value of the underlying asset. The exchange’s clearinghouse, as counterparty to all futures, guarantees the futures contracts against default.
The following table summarizes the fair value of derivatives held by the Portfolio at December 31, 2023 by category of risk exposure:
| Asset Derivatives |
||||||
| Risk Exposure |
Statement of Assets & |
Fair Value | ||||
| Interest Rate |
Unrealized appreciation on futures contracts (a) | $ | 965 | |||
|
|
|
|||||
| (a) | Includes cumulative appreciation/depreciation of futures contracts as reported in the Schedule of Investments. Only the current day’s variation margin is reported within the Statement of Assets and Liabilities. | |||
The following tables summarize the effect of derivative instruments on the Statement of Operations, classified by derivative type and category of risk exposure, for the year ended December 31, 2023:
| Statement of Operations Location-Net Realized Gain (Loss) |
Interest Rate | |||
| Futures contracts |
$ | (4,518,500 | ) | |
|
|
|
|||
| Statement of Operations Location-Net Change in Unrealized Appreciation (Depreciation) |
Interest Rate | |||
| Futures contracts |
$ | 241,462 | ||
|
|
|
|||
For the year ended December 31, 2023, the average notional par or face amount outstanding for each derivative type was as follows:
| Derivative Description |
Average Notional Par or Face Amount‡ |
|||
| Futures contracts long |
$ | 57,260,450 | ||
| Futures contracts short |
(22,900,332 | ) | ||
| ‡ | Averages are based on activity levels during the period for which the amounts are outstanding. | |||
4. Certain Risks
In the normal course of business, the Portfolio invests in securities and enters into transactions where risks exist. Those risks include:
Market Risk: The value of securities held by the Portfolio may decline in response to certain events, including those directly involving the issuers whose securities are owned by the Portfolio; conditions affecting the general economy; overall market changes; local, regional or global political, social or economic instability; currency, interest rate, and price fluctuations, or other factors including terrorism, war, natural disasters and the spread of infectious illness including epidemics or pandemics such as the COVID-19 pandemic. These events may also adversely affect the liquidity of securities held by the Portfolio.
Credit and Counterparty Risk: The Portfolio may be exposed to counterparty risk, or the risk that an entity with which the Portfolio has unsettled or open transactions may default. The potential loss could exceed the value of the financial assets and liabilities recorded in the financial statements. Financial assets that potentially expose the Portfolio to credit and counterparty risk consist
BHFTII-22
Brighthouse Funds Trust II
Western Asset Management U.S. Government Portfolio
Notes to Financial Statements—December 31, 2023—(Continued)
principally of cash due from counterparties and investments. The Portfolio manages counterparty risk by entering into agreements only with counterparties that it believes have the financial resources to honor their obligations and by monitoring the financial stability of those counterparties. The Subadviser may attempt to mitigate counterparty risk by (i) periodically assessing the creditworthiness of its trading partners, (ii) monitoring and/or limiting the amount of its net exposure to each individual counterparty based on its assessment, and (iii) requiring collateral from the counterparty for certain transactions. In order to preserve certain safeguards for non-standard settlement trades, the Portfolio restricts its exposure to credit and counterparty losses by entering into master netting agreements (“Master Agreements”) with counterparties (approved brokers) with whom it undertakes a significant volume of transactions. Master Agreements govern the terms of certain transactions and reduce the counterparty risk associated with relevant transactions by specifying credit protection mechanisms and providing standardization that improves legal certainty. Master Agreements can also help limit counterparty risk by specifying collateral posting arrangements at pre-arranged exposure levels.
Repurchase and reverse repurchase agreements are primarily executed under GMRAs or MRAs, which provide the right to set-off. Each repurchase and reverse repurchase agreement is initially collateralized at the transaction level. In the event of default, the total market value exposure will be offset against collateral exchanged to date, which would result in a net receivable/(payable) that would be due from/to the counterparty.
Master Securities Forward Transaction Agreements (“MSFTA”) govern the considerations and factors surrounding the settlement of certain forward settling transactions, such as TBA securities and delayed-delivery or secured borrowings transactions by and between the Portfolio and select counterparties. The MSFTA maintains provisions for, among other things, initiation and confirmation, payment and transfer, events of default, termination, and maintenance of collateral.
Customer Account Agreements and related addenda govern cleared derivatives transactions such as futures, options on futures, and cleared OTC derivatives. Cleared derivative transactions require posting of initial margin as determined by each relevant clearinghouse. The Portfolio’s clearing broker may also require additional initial margin. Clearinghouse-related initial margin is held by the clearinghouse and additional initial margin is held by the Portfolio’s clearing broker. In a cleared derivative transaction, the Portfolio’s counterparty is a clearinghouse rather than a bank or broker. The clearinghouse stands between the buyer and the seller of the contract; therefore, credit risk is limited to failure of or default by the clearinghouse. While offset rights may exist under applicable law, the Portfolio does not have a contractual right of offset against a clearing broker or clearinghouse in the event of a default (including the bankruptcy or insolvency). Additionally, credit risk exists in cleared derivative transactions with respect to initial and variation margin that is held in a clearing broker’s customer accounts. While clearing brokers are required to segregate, by account class, customer margin from their own assets, in the event that a clearing broker becomes insolvent or goes into bankruptcy and at that time there is a shortfall in the aggregate amount of margin held by the clearing broker for all its clients, typically the shortfall would be allocated on a pro-rata basis across all the clearing broker’s customers, for the relevant account class, potentially resulting in losses to the Portfolio. Variation margin, which accounts for changes in market value, is exchanged daily, but may not be netted between futures and cleared OTC derivatives.
LIBOR Replacement Risk: LIBOR was the offered rate at which major international banks could obtain wholesale, unsecured funding. The terms of investments, financings or other transactions (including certain derivatives transactions) to which the Portfolio may be a party have historically been tied to LIBOR. In connection with the global transition away from LIBOR led by regulators and market participants, LIBOR was last published on a representative basis at the end of June 2023. The United Kingdom’s Financial Conduct Authority, which regulates LIBOR, has ceased publishing all LIBOR settings, but some USD LIBOR settings will continue to be published under a synthetic methodology until September 30, 2024 for certain legacy contracts. Alternative reference rates to LIBOR have been established in most major currencies (e.g., the Secured Overnight Financing Rate for U.S. dollar LIBOR and the Sterling Overnight Index Average for GBP LIBOR) and the transition to new reference rates continues. The full impact of the transition on the Portfolio, the financial instruments in which the Portfolio invests and financial markets more generally cannot yet be fully determined.
Additional risks associated with each type of investment are described above within the respective security type notes. The Portfolio’s prospectus includes a discussion of the principal risks of investing in the Portfolio.
5. Investment Transactions
Aggregate cost of purchases and proceeds of sales of investment securities, including mortgage dollar roll and TBA transactions but excluding short-term securities, for the year ended December 31, 2023 were as follows:
| Purchases |
Sales | |||||||||||
| U.S. Government |
Non-U.S. Government | U.S. Government | Non-U.S. Government | |||||||||
| $1,170,422,967 | $ | 58,764,427 | $ | 1,313,967,240 | $ | 45,554,607 | ||||||
BHFTII-23
Brighthouse Funds Trust II
Western Asset Management U.S. Government Portfolio
Notes to Financial Statements—December 31, 2023—(Continued)
Purchases and sales of mortgage dollar rolls and TBA transactions for the year ended December 31, 2023 were as follows:
| Purchases |
Sales | |||
| $683,813,398 | $ | 697,664,622 | ||
6. Investment Management Fees and Other Transactions with Affiliates
Investment Management Agreement - Brighthouse Investment Advisers is the investment adviser to the Portfolio. The Trust has entered into an investment management agreement with Brighthouse Investment Advisers with respect to the Portfolio. For providing investment management services to the Portfolio, Brighthouse Investment Advisers receives monthly compensation at the following annual rates:
|
Management |
% per annum | Average Daily Net Assets | ||||
| $6,967,244 | 0.550 | % | Of the first $500 million | |||
| 0.450 | % | On amounts in excess of $500 million | ||||
Brighthouse Investment Advisers has entered into an investment subadvisory agreement with respect to managing the Portfolio. Western Asset Management Company, LLC (the “Subadviser”) is compensated by Brighthouse Investment Advisers to provide subadvisory services for the Portfolio.
The subadvisory fee the Adviser pays to the Subadviser in connection with the investment management of the Portfolio is calculated based on the aggregate average daily net assets of the Portfolio and certain other portfolios of the Brighthouse Funds Trust I that are managed by the Subadviser.
Management Fee Waiver - Pursuant to a management fee waiver agreement, the Adviser has agreed, for the period May 1, 2023 to April 30, 2024, to reduce its advisory fees set out above under “Investment Management Agreement” for each class of the Portfolio as follows:
| % per annum reduction |
Average Daily Net Assets | |
| 0.030% | Of the first $100 million | |
| 0.050% | On amounts over $200 million and under $500 million | |
| 0.010% | On amounts over $1 billion and under $2 billion | |
| 0.030% | On amounts in excess of $2 billion |
An identical agreement was in place for the period April 29, 2022 to April 30, 2023. Amounts waived for the year ended December 31, 2023 are included in the amount shown as a management fee waiver in the Statement of Operations.
Additionally, for the period May 1, 2023 to April 30, 2024, Brighthouse Investment Advisers has contractually agreed to waive a portion of its management fee in an amount equal to the difference, if any, between (a) the subadvisory fee payable by the Adviser to the Subadviser calculated based solely on the assets of the Portfolio and (b) the subadvisory fee payable by the Adviser to the Subadviser calculated using the fee rate that would apply to the combined net assets of the Portfolio and those of Western Asset Management Government Income Portfolio, a series of Brighthouse Funds Trust I also advised by the Subadviser. An identical agreement was in place for the period April 29, 2022 to April 30, 2023. Amounts waived for the year ended December 31, 2023 are included in the amount shown as a management fee waiver in the Statement of Operations.
Certain officers and trustees of the Trust may also be officers of the Adviser; however, such officers and trustees receive no compensation from the Trust.
Transfer Agency Agreement - Brighthouse Life Insurance Company serves as the transfer agent for the Trust. Brighthouse Life Insurance Company receives no fees for its services to the Trust.
Distribution and Service Fees - The Trust has a distribution agreement with Brighthouse Securities, LLC (the “Distributor”) pursuant to which the Distributor serves as the general distributor of shares of each class (each a “Class”) of each Portfolio. The Distributor is an affiliate of the Trust. The Trust has adopted a Distribution and Services Plan (the “D&S Plan”) relating to Class B, Class D, Class E, Class F and Class G shares of each Portfolio, under Rule 12b-1 under the 1940 Act, pursuant to which the Trust may pay the Distributor a fee (the “Service Fee”) at an annual rate not to exceed 0.25% of each such Portfolio’s average daily net assets attributable to the Class B, Class D, Class E, Class F and Class G shares of the Trust. Each Portfolio may not offer shares of each Class. The D&S Plan also authorizes the Trust, on behalf of each of its Portfolios, to pay to the Distributor a distribution fee (the “Distribution Fee” and together
BHFTII-24
Brighthouse Funds Trust II
Western Asset Management U.S. Government Portfolio
Notes to Financial Statements—December 31, 2023—(Continued)
with the Service Fee, the “Fees”) at an annual rate of up to 0.25% of each Portfolio’s average daily net assets attributable to the Class B, Class D, Class E, Class F, and Class G shares in consideration of the services rendered in connection with the sale of such shares by the Distributor. Under the Distribution Agreement with respect to the Trust, Fees are currently paid at an annual rate of 0.25% of average daily net assets in the case of Class B shares, 0.10% of average daily net assets in the case of Class D shares, 0.15% of average daily net assets in the case of Class E shares, 0.20% of average daily net assets in the case of Class F shares and 0.30% of average daily net assets in the case of Class G shares. The D&S Plan is known as a “compensation plan” because the Trust makes payments to the Distributor for services rendered regardless of the actual level of expenditures by the Distributor. Amounts incurred by the Portfolio for the year ended December 31, 2023 are shown as Distribution and service fees in the Statement of Operations.
Deferred Trustee Compensation - Each Trustee who is not currently an employee of the Adviser or any of its affiliates receives compensation from the Trust for his or her service to the Trust. A deferred compensation plan (the “Plan”) is available to the Trustees on a voluntary basis. Deferred amounts remain in the Trust until distributed in accordance with the provisions of the Plan. The value of a participating Trustee’s deferral account is based on theoretical investments of deferred amounts on the normal payment dates in certain portfolios of the Trust or Brighthouse Funds Trust I, an affiliate of the Trust, as designated by the participating Trustee. Changes in the value of participants’ deferral accounts are reflected as a component of Trustees’ fees and expenses in the Statement of Operations. The portion of the accrued obligations allocated to the Portfolio under the Plan is reflected as Deferred trustees’ fees in the Statement of Assets and Liabilities.
7. Contractual Obligations
Under the Trust’s organizational documents, its officers and Trustees may be indemnified against certain liabilities and expenses arising out of the performance of their duties to the Trust. Additionally, the Trust has a variety of indemnification obligations under contracts with its service providers. The Trust’s maximum exposure under these arrangements is unknown, as this would involve future claims that may be made against the Trust that have not yet occurred.
8. Income Tax Information
The cost basis of investments for federal income tax purposes at December 31, 2023 was as follows:
| Cost basis of investments |
$ | 1,529,674,699 | ||
|
|
|
|||
| Gross unrealized appreciation |
10,703,507 | |||
| Gross unrealized (depreciation) |
(99,913,005 | ) | ||
|
|
|
|||
| Net unrealized appreciation (depreciation) |
$ | (89,209,498 | ) | |
|
|
|
The tax character of distributions paid for the years ended December 31, 2023 and 2022 were as follows:
| Ordinary Income |
Long-Term Capital Gain | Total | ||||||||||||||||||
| 2023 |
2022 | 2023 | 2022 | 2023 | 2022 | |||||||||||||||
| $32,823,339 | $ | 36,933,798 | $ | — | $ | — | $ | 32,823,339 | $ | 36,933,798 | ||||||||||
As of December 31, 2023, the components of distributable earnings (accumulated losses) on a federal income tax basis were as follows:
| Undistributed |
Undistributed Long-Term Capital Gain |
Net Unrealized Appreciation (Depreciation) |
Accumulated Capital Losses |
Total | ||||||||||||
| $41,782,122 | $ | — | $ | (89,209,498 | ) | $ | (205,943,414 | ) | $ | (253,370,790 | ) | |||||
The Portfolio utilizes the provisions of the federal income tax laws that provide for the carryforward of capital losses for prior years, offsetting such losses against any future realized capital gains. Net capital losses may be carried forward indefinitely and their character is retained as short-term and/or long-term losses.
As of December 31, 2023, the Portfolio had accumulated short-term capital losses of $34,128,316 and accumulated long-term capital losses of $171,815,098.
BHFTII-25
Brighthouse Funds Trust II
Western Asset Management U.S. Government Portfolio
Notes to Financial Statements—December 31, 2023—(Continued)
9. Recent Accounting Pronouncement & Regulatory Updates
In June 2022, FASB issued Accounting Standards Update 2022-03 — Fair Value Measurement (Topic 820) — Fair Value Measurement of Equity Securities Subject to Contractual Sale Restrictions (“ASU 2022-03”). ASU 2022-03 clarifies the guidance in Topic 820 to indicate that a contractual sale restriction should not be considered in the fair value of an equity security subject to such a restriction, and requires entities with investments in equity securities subject to contractual sale restrictions to disclose certain qualitative and quantitative information about such securities. ASU 2022-03 is effective for fiscal years, and interim periods within those fiscal years, beginning after December 15, 2023. ASU 2022-03 is only applicable to an equity security in which the contractual arrangement that restricts its sale is executed or modified on or after the adoption date.
Effective January 24, 2023, the Securities and Exchange Commission adopted rule and form amendments that require open-end management investment companies to transmit concise and visually engaging annual and semiannual reports to shareholders that highlight certain information deemed by the SEC to be particularly important for investors. Certain other information, including financial statements, will no longer appear in shareholder reports but will, as required, be available online, delivered free of charge upon request, and filed on a semiannual basis on Form N-CSR. The rule and form amendments have a compliance date of July 24, 2024. Accordingly, the rule and form amendments will not impact the Portfolio until its 2024 semiannual shareholder report.
BHFTII-26
Brighthouse Funds Trust II
Western Asset Management U.S. Government Portfolio
Report of Independent Registered Public Accounting Firm
To the Board of Trustees of Brighthouse Funds Trust II and Shareholders of the Western Asset Management U.S. Government Portfolio:
Opinion on the Financial Statements and Financial Highlights
We have audited the accompanying statement of assets and liabilities, including the schedule of investments, of the Western Asset Management U.S. Government Portfolio (the “Fund”) (one of the funds constituting the Brighthouse Funds Trust II), as of December 31, 2023, the related statement of operations for the year then ended, the statements of changes in net assets for each of the two years in the period then ended, the financial highlights for each of the five years in the period then ended, and the related notes. In our opinion, the financial statements and financial highlights present fairly, in all material respects, the financial position of the Fund as of December 31, 2023, and the results of its operations for the year then ended, the changes in its net assets for each of the two years in the period then ended, and the financial highlights for each of the five years in the period then ended in conformity with accounting principles generally accepted in the United States of America.
Basis for Opinion
These financial statements and financial highlights are the responsibility of the Fund’s management. Our responsibility is to express an opinion on the Fund’s financial statements and financial highlights based on our audits. We are a public accounting firm registered with the Public Company Accounting Oversight Board (United States) (PCAOB) and are required to be independent with respect to the Fund in accordance with the U.S. federal securities laws and the applicable rules and regulations of the Securities and Exchange Commission and the PCAOB.
We conducted our audits in accordance with the standards of the PCAOB. Those standards require that we plan and perform the audit to obtain reasonable assurance about whether the financial statements and financial highlights are free of material misstatement, whether due to error or fraud. The Fund is not required to have, nor were we engaged to perform, an audit of its internal control over financial reporting. As part of our audits we are required to obtain an understanding of internal control over financial reporting but not for the purpose of expressing an opinion on the effectiveness of the Fund’s internal control over financial reporting. Accordingly, we express no such opinion.
Our audits included performing procedures to assess the risks of material misstatement of the financial statements and financial highlights, whether due to error or fraud, and performing procedures that respond to those risks. Such procedures included examining, on a test basis, evidence regarding the amounts and disclosures in the financial statements and financial highlights. Our audits also included evaluating the accounting principles used and significant estimates made by management, as well as evaluating the overall presentation of the financial statements and financial highlights. Our procedures included confirmation of securities owned as of December 31, 2023, by correspondence with the custodian and brokers; when replies were not received from brokers, we performed other auditing procedures. We believe that our audits provide a reasonable basis for our opinion.
/s/ Deloitte & Touche LLP
Boston, Massachusetts
February 23, 2024
We have served as the auditor of one or more Brighthouse investment companies since 1983.
BHFTII-27
Brighthouse Funds Trust II
Trustees and Officers
MANAGEMENT OF THE TRUSTS
The Boards of Trustees (the “Board”) of Brighthouse Funds Trust I and Brighthouse Funds Trust II (“Trust I” and “Trust II”, respectively, and collectively the “Trusts”) supervise the Trusts and are responsible for representing the interests of shareholders. The Trustees, the Chairman of the Board and the Chairmen of each subcommittee are the same for both Trusts. The Trustees of each Trust meet periodically throughout the year to oversee the Portfolios’ activities, reviewing, among other things, each Portfolio’s performance and its contractual arrangements with various service providers. The Trustees of each Trust elect the officers of the Trust, who are responsible for administering the Trust’s day-to-day operations.
Trustees and Officers
The Trustees and executive officers of the Trusts, as well as their ages and their principal occupations during the past five years, are set forth below. Unless otherwise indicated, the business address of each is c/o Brighthouse Funds Trust I and Brighthouse Funds Trust II, 11225 N. Community House Rd., Charolette, North Carolina 28277. Each Trustee who is deemed an “interested person,” as such term is defined in the 1940 Act, is referred to as an “Interested Trustee.” Those Trustees who are not “interested persons,” as such term is defined in the 1940 Act, are referred to as “Independent Trustees.” There is no limit to the term a Trustee may serve, other than pursuant to the retirement policy adopted by the Independent Trustees. Trustees serve until their death, resignation, retirement or removal in accordance with Trust I’s and Trust II’s respective organizational documents and policies adopted by the Board of the Trust from time to time. Officers hold office at the pleasure of each Board and serve until their removal or resignation in accordance with the Trusts’ respective organizational documents and policies adopted by the Board of each Trust from time to time.
Trustees of the Trusts
| Name and Year of Birth |
Position(s) |
Term of Office |
Principal Occupation(s) During the Past |
Number of |
Other Directorships Held | |||||
| Interested Trustee | ||||||||||
| John Rosenthal* (1960) |
Trustee | Indefinite; From May 2016 (Trust I and Trust II) to present | Chief Investment Officer, Brighthouse Financial, Inc. (2016 to present). | 73 | None | |||||
| Independent Trustees | ||||||||||
| Dawn M. Vroegop (1966) |
Trustee and Chair of the Board | Indefinite; From December 2000 (Trust I)/May 2009 (Trust II) to present as Trustee; From May 2016 (Trust I and Trust II) until present as Chair | Retired; Private Investor. | 73 | Trustee, Driehaus Mutual Funds (8 portfolios).** | |||||
| Stephen M. Alderman (1959) |
Trustee | Indefinite; From December 2000 (Trust I)/April 2012 (Trust II) to present | Vice President and General Counsel, IHR Aerial Solutions, LLC; Until 2022, General Counsel, Illini Hi-Reach, Inc.; Until 2020, Shareholder in the law firm of Garfield & Merel, Ltd. | 73 | None | |||||
| Robert J. Boulware (1956) |
Trustee | Indefinite; From March 2008 (Trust I)/April 2012 (Trust II) to present | Managing Member, Pilgrim Funds, LLC (private equity fund). | 73 | Trustee, Vertical Capital Income Fund (closed-end fund);** Trustee, The Private Shares Fund (closed- end fund);** Until 2021, Director, Mid- Con Energy Partners, LP (energy);** Until 2020, Director, Gainsco, Inc. (auto insurance).** | |||||
BHFTII-28
Brighthouse Funds Trust II
Trustees and Officers—(Continued)
| Name and Year of Birth |
Position(s) |
Term of Office |
Principal Occupation(s) During the Past |
Number of |
Other Directorships Held | |||||
| Susan C. Gause (1952) |
Trustee | Indefinite; From March 2008 (Trust I)/April 2012 (Trust II) to present | Private Investor. | 73 | Trustee, HSBC Funds (4 portfolios).** | |||||
| Nancy Hawthorne (1951) |
Trustee | Indefinite; From May 2003 (Trust II)/April 2012 (Trust I) to present | Private Investor. | 73 | Trustee, First Eagle Credit Opportunities Fund;** Trustee and Chair of the Board of Trustees, First Eagle Global Opportunities Fund;** Director, Avid Technology, Inc;** Director, CRA International, Inc.** | |||||
Executive Officers of the Trusts
| Name and Year of Birth |
Position(s) |
Term of Office |
Principal Occupation(s) | |||
| Kristi Slavin (1973) | President and Chief Executive Officer, of Trust I and Trust II | From May 2016 (Trust I and Trust II) to present |
President, Brighthouse Investment Advisers, LLC (2016-present). | |||
| Alan R. Otis (1971) | Chief Financial Officer and Treasurer, of Trust I and Trust II | From November 2017 (Trust I and Trust II) to present |
Executive Vice President, Brighthouse Investment Advisers, LLC (2017-present); formerly, Vice President, Brighthouse Investment Advisers, LLC (2012-2017); Assistant Treasurer, Trust I and Trust II (2012-2017). | |||
| Thomas Watterson (1985) | Secretary, of Trust I and Trust II | From November 2023 (Trust I and Trust II) to present |
Executive Vice President, Chief Legal Officer and Secretary, Brighthouse Investment Advisers, LLC (2023-Present); Managing Corporate Counsel, Brighthouse Financial Inc. (2023-present); Managing Counsel and Director, The Bank of New York Mellon Corporation (2019-2023); Counsel and Vice President, The Bank of New York Mellon Corporation (2016-2019). | |||
| Katie Hellmann (1980) | Chief Compliance Officer (“CCO”), of Trust I and Trust II | From May 2023 (Trust I and Trust II) to present |
Chief Compliance Officer, Brighthouse Investment Advisers, LLC (2023-present) and Head of Funds and Investments Compliance (2023-present). Deputy Chief Compliance Officer, Transamerica Asset Management (2022-2023). Leader and Senior Compliance Counsel – Funds Compliance, Edward Jones (2017-2022). | |||
| Rosemary Morgan (1983) | Anti-Money Laundering Officer, of Trust I and Trust II | From May 2023 (Trust I and Trust II) to present |
Chief Privacy Officer, Leader of Compliance Programs and Assistant General Counsel, Brighthouse Financial, Inc. (2019-2022); Chief Privacy Officer, Head of Compliance Programs & Contracts Law, Brighthouse Financial, Inc. (2022-2023), Chief Compliance Officer and Associate General Counsel, Brighthouse Financial, Inc. (2023-present); Vice President and Chief Compliance Officer, Brighthouse Life Insurance Company (2023-present); Vice President and Chief Compliance Officer (2023-present), Brighthouse Life Insurance Company of NY; Vice President and Chief Compliance Officer (2023-present), New England Life Insurance Company. | |||
| Anna Koska (1981) | Vice President, of Trust I and Trust II | From June 2022 (Trust I and Trust II) to present |
Vice President, Investment and Advisory Services, Brighthouse Investment Advisers, LLC (2022-present); Director of Investment and Advisory Services, Brighthouse Investment Advisers, LLC (2019-2022); Senior Portfolio Analyst, Brighthouse Investment Advisers, LLC (2017-2019). | |||
| * | Mr. Rosenthal is an “interested person” of the Trusts because of his position with Brighthouse Financial, Inc. (“Brighthouse Financial”), an affiliate of BIA. |
| ** | Indicates a directorship with a registered investment company or a company subject to the reporting requirements of the Securities Exchange Act of 1934, as amended. |
| (1) | Previous positions during the past five years with the Trusts, MetLife, Inc. or the Adviser are omitted if not materially different. |
| (2) | The Fund Complex includes 44 Trust I Portfolios and 29 Trust II Portfolios. |
BHFTII-29
Brighthouse Funds Trust II
Western Asset Management U.S. Government Portfolio
Board of Trustees’ Consideration of Advisory and Sub-Advisory Agreements
At a meeting held on November 13-14, 2023 (the “November Meeting”), the Boards of Trustees (the “Board”) of Brighthouse Funds Trust I and Brighthouse Funds Trust II (“BFT I” and “BFT II,” respectively, and collectively, the “Trusts”), including a majority of the Trustees who are not “interested persons” of the Trusts (the “Independent Trustees”) under the Investment Company Act of 1940 (the “1940 Act”), approved the continuation of the Trusts’ advisory agreements (each an “Advisory Agreement”) with Brighthouse Investment Advisers, LLC (the “Adviser”) and the applicable sub-advisory and sub-sub-advisory agreements (each a “Sub-Advisory Agreement” and collectively with the Advisory Agreement, the “Agreements”) between the Adviser and the investment sub-advisers and sub-sub-adviser (each a “Sub-Adviser,” and collectively, the “Sub-Advisers”) for the series of the Trusts (each a “Portfolio,” and collectively, the “Portfolios”) for the annual contract renewal period from January 1, 2024 through December 31, 2024.
The Board met with personnel of the Adviser on September 28-29, 2023 (the “September Meeting”) for the specific purpose of giving preliminary consideration to the proposed continuation of the Agreements, including consideration to information that the Adviser and Sub-Advisers had provided for the Board’s review at the request of the Independent Trustees. At the September Meeting, the Adviser reviewed with the Board the performance and fees experienced by each Portfolio, as well as other information. During and after the September Meeting, the Independent Trustees requested additional information and clarifications that the Adviser addressed at the November Meeting (the September Meeting and the November Meeting are referred to collectively as, the “Meetings”). During the contract renewal process, and throughout the year, the Independent Trustees were advised by independent legal counsel, and they met with independent legal counsel in executive sessions outside of the presence of management on a number of occasions to discuss, among other things, the renewal of the Agreements.
In considering the continuation of the Agreements, the Board reviewed a variety of materials that were provided for the specific purpose of assisting the Board in the renewal process, along with various information and materials that were provided to and discussed with the Board throughout the year, at regularly scheduled meetings of the Board and its committees. In particular, information for each Portfolio included, but was not limited to, reports on investment performance, expenses, legal and compliance matters, and asset pricing. Information about the Adviser and each Sub-Adviser included, but was not limited to, reports on the business, operations, and performance of the Adviser and the Sub-Advisers and reports that the Adviser and Sub-Advisers had prepared specifically for the renewal process.
In considering the continuation of the Agreements, the Board also reviewed, among other things, a report for each Portfolio that was prepared by Broadridge (“Broadridge”), an independent organization, which set forth comparative performance and expense information for each Portfolio. In addition, the Independent Trustees reviewed a report that was prepared by JDL Consultants, LLC (“JDL”), an independent consultant to the Independent Trustees, which examined the Broadridge reports for each Portfolio (“JDL Report”). The Independent Trustees met in executive session with representatives of JDL during the September Meeting to review the JDL Report.
At the November Meeting, the Board, including a majority of the Independent Trustees, concluded that the nature, extent, and quality of services provided by the Adviser and each Sub-Adviser supported the renewal of the Agreements. The Board also concluded that the investment services provided to and the performance of each Portfolio was such that each Agreement should continue, and that the fees paid by each Portfolio to the Adviser appeared to be reasonable in light of the nature, extent, and quality of the services provided by the Adviser and each Sub-Adviser. Further, the Board concluded that the Adviser’s profitability in providing services under the Advisory Agreements did not appear unreasonable in light of the nature, extent, and quality of the services provided by the Adviser. The Board reviewed the extent to which the investment advisory fees paid by the Portfolios shared economies of scale with investors or entailed the potential to share economies of scale with investors and concluded that those considerations generally supported the renewal of each Agreement. Finally, the Board considered the Adviser’s recommendation that it approve the renewal of each Sub-Advisory Agreement.
In approving the continuation of each Agreement, the Board, including the Independent Trustees, gave attention to all of the information that was furnished, and each Trustee placed varying degrees of importance on the various pieces of information that were provided to them. The Board evaluated the information provided to it on a Portfolio-by-Portfolio basis, and its decision was made separately with respect to each Portfolio. The following paragraphs provide more information about some of the primary factors that were relevant to the Board’s decisions. The Board did not identify any single factor as determinative, and the Trustees generally attributed different weights to various factors for the various Portfolios.
Nature, extent and quality of services. The Board evaluated the nature, extent, and quality of the services that the Adviser and the Sub-Advisers, as relevant, provided to the Portfolios. The Board considered the Adviser’s services as investment manager to the Portfolios, including its services relating to the hiring and oversight of the Sub-Advisers and, in particular, their investment programs
BHFTII-30
Brighthouse Funds Trust II
Western Asset Management U.S. Government Portfolio
Board of Trustees’ Consideration of Advisory and Sub-Advisory Agreements—(Continued)
and personnel, succession management of key personnel, trading practices, compliance programs and personnel, and risk management programs, among other things. The Adviser’s services in coordinating and overseeing the activities of the Trusts’ other service providers were also considered. The Board also considered the systems and processes required by the Adviser to meet additional regulatory and compliance requirements resulting from U.S. Securities and Exchange Commission and other regulatory initiatives, including related to liquidity, valuation, and derivatives risk management. The Board considered information received from the Trusts’ Chief Compliance Officer regarding the Portfolios’ compliance policies and procedures that were established pursuant to Rule 38a-l under the 1940 Act, and relevant aspects of the Adviser’s and Sub-Advisers’ compliance policies and procedures. The Board also noted that it was the practice of the Adviser’s investment, compliance, and legal staff to conduct periodic meetings (through various media) with the Sub-Advisers throughout the year in order to review and assess the services that are provided to the Portfolios, and that personnel of the Adviser routinely prepare and present reports to the Board regarding those meetings. In addition, during the Meetings and throughout the year, the Board considered the expertise, experience, and performance of the personnel of the Adviser who performed the various services that are mentioned above.
With respect to the services provided by each of the Sub-Advisers, the Board considered a variety of information that the Adviser and each Sub-Adviser prepared for the Board’s review. The Board considered each Sub-Adviser’s investment process, each Sub-Adviser’s overall organization and business plans and the investment performance experienced by the Portfolio (as described in more detail below). The Board took into account that each Sub-Adviser’s responsibilities include, among other things, the development and maintenance of an investment program for the applicable Portfolio, the selection of investments and the placement of orders for the purchase and sale of such assets, and the implementation of compliance controls related to the performance of these services. The Board considered, based on the information provided, each Sub-Adviser’s staffing with respect to the management of the Portfolio and other information relating to the Sub-Adviser’s business and operations. The Board also considered the Sub-Adviser’s overall resources and information with respect to any recent turnover of key personnel at the Sub-Adviser. The Board reviewed each Sub-Adviser’s investment experience, as well as information provided regarding the Sub-Adviser’s personnel who provide services to the Portfolios. The Board also considered, among other things, information about each Sub-Adviser’s compliance program, including regarding any compliance matters involving a Sub-Adviser that had been brought to the Board’s attention during the year, as well as the Adviser’s assessment of the financial condition of each Sub-Adviser.
Performance. The Board placed emphasis on the performance of each Portfolio in the context of the performance of the relevant markets in which the Portfolio invests. The Board considered the Adviser’s quarterly presentations to the Board of detailed information about each Portfolio’s investment strategies and performance results and composition, including discussions regarding the relevant effects of market conditions. The Board reviewed and considered the reports prepared by Broadridge, which provided a statistical analysis comparing each Portfolio’s investment performance to that of comparable funds underlying variable insurance products (the “Performance Universe”), and the JDL Report. The Board also compared the performance of each Portfolio to that of comparable funds and other accounts that were managed by the relevant Sub-Adviser, to the extent such information was provided. The Board considered each Portfolio’s performance for periods subsequent to the performance period covered by the Broadridge reports and considered the Adviser’s assessment of the same. The Board also noted that while it found the data provided by Broadridge generally useful, it recognized the limitations of such data, including, in particular, that notable differences may exist between a Portfolio and the other funds in a Broadridge category (for example, with respect to investment strategies) and that the results of the performance comparisons may vary depending on (i) the end dates for the performance periods that were selected and (ii) the selection of the peer groups.
The Board focused particular attention on Portfolios with less favorable performance records. The Board noted the Adviser’s focus on each Sub-Adviser’s performance and that the Adviser had been active in monitoring and responding to any performance issues with respect to the Portfolios.
Fees and Expenses. The Board gave consideration to the level and method of computing the fees payable under the Agreements. The Board reviewed and considered the information in the JDL Report concerning fees and expenses. The Board also reviewed and considered the Broadridge report for each Portfolio, which included various comparisons of the Portfolio’s fees (at December 31, 2022 and various asset levels) and expenses with those of its peers, including, as applicable, a broad group of peer funds (“Expense Universe”), a narrower group of peer funds (“Expense Group”), a broad group of peer sub-advised funds (“Sub-advised Expense Universe”), and a narrower group of peer sub-advised funds (“Sub-advised Expense Group”). In particular, the Board reviewed comparisons of each Portfolio’s contractual management fees with its Expense Group and Sub-advised Expense Universe, contractual sub-adviser fees with its Sub-advised Expense Universe and Sub-advised Expense Group, and total expenses with its Expense Universe, Expense Group and Sub-advised Expense Universe. The Board considered that Broadridge selected the peer funds, which were funds
BHFTII-31
Brighthouse Funds Trust II
Western Asset Management U.S. Government Portfolio
Board of Trustees’ Consideration of Advisory and Sub-Advisory Agreements—(Continued)
underlying variable insurance products that Broadridge deemed to be comparable to the Portfolios. The Board considered that the fee and expense information in the Broadridge report for each Portfolio reflected information as of the Portfolio’s most recent fiscal year end at the time the Broadridge report was issued and that historical asset levels may differ from current asset levels, particularly in a period of market volatility. In addition, the Board compared the fee payable to a Sub-Adviser by the Adviser with respect to the Portfolio to the fee payable to the Sub-Adviser by other comparable funds and other accounts, to the extent such information was provided.
The Board noted that the sub-advisory fees for the Portfolios are negotiated at arm’s length by the Adviser and are paid by the Adviser out of its advisory fees. The Board also considered that the Adviser had entered into expense limitation or management fee waiver agreements with certain of the Portfolios pursuant to which the Adviser had agreed to waive a portion of its advisory fee and/or reimburse certain expenses as a means of limiting a Portfolio’s total annual operating expenses or passing through the benefit of a subadvisory fee concession to a Portfolio, as applicable.
Profitability. The Board examined the profitability to the Adviser of each Advisory Agreement, on a Portfolio-by-Portfolio basis. The Board also considered that an affiliate of the Adviser, Brighthouse Securities, LLC, serves as distributor for the Trusts, and, as such, receives Rule 12b-1 payments to support the distribution of the Portfolios. The Board considered the profitability to the Sub-Advisers and their affiliates of their relationships with the Portfolios, to the extent provided, and the Board considered the ability of the Adviser to negotiate with a Sub-Adviser at arm’s length. In reviewing the profitability information, the Board recognized that expense allocation methodologies are inherently subjective and various methodologies may be reasonable while producing different results.
Economies of scale. The Board considered each Portfolio’s fees in light of its size. The Board noted the fee schedules for the Portfolios that contain breakpoints that reduce the fee rate above specified asset levels, including breakpoints in the Advisory Agreements and any corresponding Sub-Advisory Agreement. The Board noted those Portfolios that did not have breakpoints in their advisory fees and considered management’s explanation of the same.
The Board considered the effective fees under the Advisory Agreement and Sub-Advisory Agreement for each Portfolio as a percentage of assets at different asset levels and possible economies of scale that may be realized if the assets of the Portfolio grow. The Board examined, among other data, the effect of a Portfolio’s growth in size, and reduction in size, on various fee schedules. The Board also generally noted that if a Portfolio’s assets increase over time, the Portfolio may realize economies of scale if assets increase proportionally more than certain other expenses.
Other factors. The Board considered other benefits that may be realized by the Adviser and its affiliates from their relationships with the Trusts. Among the benefits realized by the Adviser, the Board recognized that Brighthouse Securities, LLC, as the distributor for the Trusts, receives payments pursuant to Rule 12b-1 from the Portfolios to help compensate for the provision of shareholder services and distribution activities. The Board considered that a Sub-Adviser may engage in soft dollar transactions in managing a Portfolio. In addition, the Board considered that a Sub-Adviser may be affiliated with registered broker-dealers that may, from time to time, receive brokerage commissions from a Portfolio in connection with the sale of portfolio securities (subject to applicable best execution obligations). The Board also considered that a Sub-Adviser and its affiliates could benefit from the opportunity to provide advisory services to additional portfolios of the Trusts and overall reputational benefits.
The Board considered information from the Adviser and Sub-Advisers pertaining to potential conflicts of interest, and the manner in which any potential conflicts were mitigated. In its review, the Board considered information regarding various business relationships among the Adviser and its affiliates and various Sub-Advisers and their affiliates. The Board also considered information about services and/or payments provided to the Adviser by the Sub-Advisers in connection with marketing activities. The Board considered representations from the Adviser that such business relationships and any payments were not considered in the Adviser’s recommendation to renew any of the Sub-Advisory Agreements.
* * * * *
Western Asset Management U.S. Government Portfolio. The Board also considered the following information in relation to the Agreements with the Adviser and Western Asset Management Company, LLC regarding the Portfolio:
Among other data relating specifically to the Portfolio’s performance, the Board also considered that the Portfolio outperformed the median of its Performance Universe for the one-, three-, and five-year periods ended June 30, 2023. The Board also considered that the Portfolio outperformed the average of its Morningstar Category for the one-and five-year periods ended June 30, 2023 and underperformed the average of its Morningstar Category for the three-year period ended June 30, 2023. The Board further considered
BHFTII-32
Brighthouse Funds Trust II
Western Asset Management U.S. Government Portfolio
Board of Trustees’ Consideration of Advisory and Sub-Advisory Agreements—(Continued)
that the Portfolio underperformed its benchmark, the Bloomberg U.S. Intermediate Government Bond Index for the one-, three-, and five-year periods ended October 31, 2023. The Board also considered that the Portfolio underperformed its blended benchmark for the one-and five-year periods ended October 31, 2023 and performed equal to its blended benchmark for the three-year period ended October 31, 2023. The Board took into account management’s discussion of the Portfolio’s performance, including with respect to prevailing market conditions. The Board also noted the presence of certain management fee waivers in effect for the Portfolio.
The Board also considered that the Portfolio’s actual management fees and total expenses (exclusive of 12b-1 fees) were below the Expense Group median, the Expense Universe median, and the Sub-advised Expense Universe median. The Board noted that the Portfolio’s contractual management fees were below the asset-weighted average of the Investment Classification/Morningstar Category selected by Broadridge at the Portfolio’s current size. The Board also noted that the Portfolio’s contractual sub-advisory fees were below the averages of the Sub-advised Expense Group and the Sub-advised Expense Universe at the Portfolio’s current size.
BHFTII-33
(b) Not applicable.
Item 2. Code of Ethics.
As of the end of the period covered by this report, the registrant has adopted a code of ethics that applies to the registrant’s principal executive officer, principal financial officer, principal accounting officer, or persons performing similar functions (the “Code of Ethics”). During the period covered by this report, no material amendments were made to the provisions of the Code of Ethics, nor did the registrant grant any waivers, including any implicit waivers, from any provision of the Code of Ethics.
Item 3. Audit Committee Financial Expert.
The registrant’s Board of Trustees has determined that the registrant has at least one “audit committee financial expert” (as defined in Item 3 of Form N-CSR) serving on its audit committee. Robert J. Boulware, Susan C. Gause, Nancy Hawthorne, and Dawn M. Vroegop have each been determined to be an “audit committee financial expert” and each is “independent” (as each term is defined in Item 3 of Form N-CSR).
Item 4. Principal Accountant Fees and Services.
Information provided in response to Item 4 includes amounts billed during the applicable time period for services rendered by Deloitte & Touche LLP (“Deloitte”), the registrant’s principal accountant.
(a) Audit Fees
The aggregate fees billed for professional services rendered by Deloitte for the audit of the registrant’s annual financial statements and for services that are normally provided by Deloitte in connection with statutory and regulatory filings for the fiscal years ended December 31, 2022 and December 31, 2023 were $1,417,863 and $1,498,318, respectively.
(b) Audit-Related Fees
During the fiscal years ended December 31, 2022 and December 31, 2023, Deloitte billed $0 and $0, respectively, for assurance and related services that relate directly to the operations and financial reporting of the registrant, the registrant’s investment adviser or any other entity controlling, controlled by, or under common control with the registrant’s investment adviser that provides ongoing services to the registrant.
(c) Tax Fees
The aggregate fees billed for professional services rendered by Deloitte for tax compliance, tax advice and tax planning in the form of preparation of excise filings and income tax returns for the fiscal years ended December 31, 2022 and December 31, 2023 were $184,970 and $194,870, respectively. Represent fees for services rendered to the registrant for review of tax returns for the fiscal years ended December 31, 2022 and December 31, 2023.
During the fiscal years ended December 31, 2022 and December 31, 2023, no fees for tax compliance, tax advice or tax planning services that relate directly to the operations and financial reporting of the registrant were billed by Deloitte to the registrant’s investment adviser or any other entity controlling, controlled by, or under common control with the registrant’s investment adviser that provides ongoing services to the registrant.
(d) All Other Fees
The registrant was not billed for any other products or services provided by Deloitte for the fiscal years ended December 31, 2022 and December 31, 2023 other than the services reported in paragraphs (a) through (c) above.
During the fiscal years ended December 31, 2022 and December 31, 2023, no fees for other products or services that relate directly to the operations and financial reporting of the registrant, other than the services reported in paragraphs (a) through (c) above, were billed by Deloitte to the registrant’s investment adviser or any other entity controlling, controlled by, or under common control with the registrant’s investment adviser that provides ongoing services to the registrant.
(e)(1) The registrant’s Audit Committee has established pre-approval procedures pursuant to paragraph (c)(7)(i)(B) of Rule 2-01 of Regulation S-X, which include regular pre-approval procedures and interim pre-approval procedures. Under the regular pre-approval procedures, the Audit Committee pre-approves at its regularly scheduled meetings audit and non-audit services that are required to be pre-approved under paragraph (c)(7) of Rule 2-01 of Regulation S-X. Under the interim pre-approval procedures, any member of the Audit Committee who is an independent Trustee is authorized to pre-approve proposed services that arise between regularly scheduled Audit Committee meetings and that need to commence prior to the next regularly scheduled Audit Committee meeting. Such Audit Committee member must report to the Audit Committee at its next regularly scheduled meeting on the pre-approval decision.
(2) Not applicable.
(f) Not applicable.
(g) The aggregate fees billed for the most recent fiscal year and the preceding fiscal year by the registrant’s principal accountant for non-audit services rendered to the registrant, its investment adviser, and adviser affiliates that provide ongoing services to the registrant for 2022 and 2023 were $7,235 and $57,780, respectively.
(h) The Audit Committee of the registrant’s Board of Trustees considered the provision of non-audit services that were rendered to the registrant’s investment adviser (not including any subadviser whose role is primarily portfolio management and is subcontracted with or overseen by another investment adviser), and any entity controlling, controlled by or under common control with the investment adviser that provides ongoing services to the registrant that were not pre-approved pursuant to paragraph (c)(7)(ii) of Rule 2-01 of Regulation S-X and concluded that such services are compatible with maintaining the principal accountant’s independence.
(i) Not applicable.
(j) Not applicable.
Item 5. Audit Committee of Listed Registrants.
Not applicable.
Item 6. Investments.
(a) Schedule of Investments is included as a part of the report to shareholders included under Item 1 of this Form N-CSR.
(b) Not applicable.
Item 7. Disclosure of Proxy Voting Policies and Procedures for Closed-End Management Investment Companies.
Not applicable.
Item 8. Portfolio Managers of Closed-End Management Investment Companies.
Not applicable.
Item 9. Purchases of Equity Securities by Closed-End Management Investment Company and Affiliated Purchasers.
Not applicable.
Item 10. Submission of Matters to a Vote of Security Holders.
The registrant does not have procedures by which shareholders may recommend nominees to the registrant’s Board of Trustees.
Item 11. Controls and Procedures.
(a) The President and Treasurer of the registrant have concluded, based on their evaluation of the effectiveness of the registrant’s disclosure controls and procedures (as defined in Rule 30a-3(c) under the Act) as of a date within 90 days of the filing date of this report on Form N-CSR, that the design and operation of such procedures provide reasonable assurance that information required to be disclosed by the registrant in this report on Form N-CSR is recorded, processed, summarized, and reported within the time periods specified in the Securities and Exchange Commission’s rules and forms.
(b) There were no significant changes in the registrant’s internal control over financial reporting (as defined in Rule 30a-3(d) under the 1940 Act) that occurred during the period covered by this report that have materially affected, or are reasonably likely to materially affect, the registrant’s internal control over financial reporting.
Item 12. Disclosure of Securities Lending Activities for Closed-End Management Investment Companies.
(a) Not applicable.
(b) Not applicable.
Item 13. Exhibits
(a)(1) Code of Ethics is attached hereto.
(a)(2) The certifications required by Rule 30a-2(a) under the 1940 Act are attached hereto.
(a)(3) Not applicable.
(a)(4) Not applicable.
SIGNATURES
Pursuant to the requirements of the Securities Exchange Act of 1934 and the Investment Company Act of 1940, the registrant has duly caused this report to be signed on its behalf by the undersigned, thereunto duly authorized.
BRIGHTHOUSE FUNDS TRUST II
| By: | /s/ Kristi Slavin | |
| Kristi Slavin | ||
| President and Chief Executive Officer | ||
| Date: | March 6, 2024 | |
Pursuant to the requirements of the Securities Exchange Act of 1934 and the Investment Company Act of 1940, this report has been signed below by the following persons on behalf of the registrant and in the capacities and on the dates indicated.
| By: | /s/ Kristi Slavin | |
| Kristi Slavin | ||
| President and Chief Executive Officer | ||
| Date: | March 6, 2024 | |
| By: | /s/ Alan R. Otis | |
| Alan R. Otis | ||
| Chief Financial Officer and Treasurer | ||
| Date: | March 6, 2024 | |