UNITED STATES
SECURITIES AND EXCHANGE COMMISSION
WASHINGTON, D. C. 20549
FORM 10-K
ANNUAL REPORT PURSUANT TO SECTION 13 OR 15(d) OF THE SECURITIES EXCHANGE ACT OF 1934 | |
For the fiscal year ended December 31, 2019
OR
TRANSITION REPORT PURSUANT TO SECTION 13 OR 15(d) OF THE SECURITIES EXCHANGE ACT OF 1934 | |
For the transition period from _________________ to _________________
Commission file number 1-44
(Exact name of registrant as specified in its charter)
(State or other jurisdiction of incorporation or organization) | (I. R. S. Employer Identification No.) | ||
(Address of principal executive offices) | (Zip Code) | ||
(312 ) 634-8100
(Registrant’s telephone number, including area code)
Securities registered pursuant to Section 12(b) of the Act:
Title of each class | Trading Symbol(s) | Name of each exchange on which registered |
Securities registered pursuant to Section 12(g) of the Act: None
Indicate by check mark if the registrant is a well-known seasoned issuer, as defined in Rule 405 of the Securities Act. Yes x
No ¨
Indicate by check mark if the registrant is not required to file reports pursuant to Section 13 or 15(d) of the Act. Yes ¨ No x
Indicate by check mark whether the registrant (1) has filed all reports required to be filed by Section 13 or 15(d) of the Securities Exchange Act of 1934 during the preceding 12 months (or for such shorter period that the registrant was required to file such reports), and (2) has been subject to such filing requirements for the past 90 days. Yes x No ¨
1
Indicate by check mark whether the registrant has submitted electronically every Interactive Data File required to be submitted pursuant to Rule 405 of Regulation S-T (§232.405 of this chapter) during the preceding 12 months (or for such shorter period that the registrant was required to submit such files). Yes x No ¨
Indicate by check mark whether the registrant is a large accelerated filer, an accelerated filer, a non-accelerated filer, a smaller reporting company, or an emerging growth company. See the definitions of “large accelerated filer”, “accelerated filer”, “smaller reporting company”, and “emerging growth company” in Rule 12b-2 of the Exchange Act.
Non-accelerated filer ☐ Smaller reporting company ☐
Emerging growth company ☐
If an emerging growth company, indicate by check mark if the registrant has elected not to use the extended transition period for complying with any new or revised financial accounting standards provided pursuant to Section 13(a) of the Exchange Act. ☐
Indicate by check mark whether the registrant is a shell company (as defined in Rule 12b-2 of the Exchange Act). Yes ☐ No ☒
State the aggregate market value of the voting and non-voting common equity held by non-affiliates computed by reference to the price at which the common equity was last sold, or the average bid and asked price of such common equity, as of the last business day of the registrant’s most recently completed second fiscal quarter.
Common Stock, no par value—$22.7 billion
(Based on the closing sale price of Common Stock as reported on the New York Stock Exchange
as of June 28, 2019)
Indicate the number of shares outstanding of each of the registrant’s classes of common stock, as of the latest practicable date.
Common Stock, no par value—557,887,494 shares
(February 14, 2020)
DOCUMENTS INCORPORATED BY REFERENCE
Portions of the proxy statement for the annual meeting of stockholders to be held May 7, 2020, are incorporated by reference into Part III of this Form 10-K.
SAFE HARBOR STATEMENT
This Form 10-K contains forward-looking information within the meaning of the Private Securities Litigation Reform Act of 1995 that is subject to certain risks and uncertainties that could cause actual results to differ materially from those projected, expressed, or implied by such forward-looking information. Risks and uncertainties that could cause or contribute to such differences include, but are not limited to, those discussed in Item 1A, "Risk Factors" included in this Form 10-K, as may be updated in our subsequent Quarterly Reports on Form 10-Q. To the extent permitted under applicable law, the Company assumes no obligation to update any forward-looking statements as a result of new information or future events.
2
Table of Contents
Item No. | Description | Page No. | |
Part I | |||
1. | |||
1A. | |||
1B. | |||
2. | |||
3. | |||
4. | |||
Part II | |||
5. | |||
6. | |||
7. | |||
7A. | |||
8. | |||
9. | |||
9A. | |||
9B. | |||
Part III | |||
10. | |||
11. | |||
12. | |||
13. | |||
14. | |||
Part IV | |||
15. | |||
16. | Form 10-K Summary | ||
3
PART I
Item 1. | BUSINESS |
Company Overview
Archer-Daniels-Midland Company (the Company or ADM) unlocks the power of nature to provide access to nutrition worldwide. ADM is a global leader in human and animal nutrition and one of the world’s premier agricultural origination and processing companies. The Company's breadth, depth, insights, facilities, and logistical expertise give it exceptional capabilities to meet needs for food, beverages, health and wellness, and more. From the seed of the idea to the outcome of the solution, ADM enriches the quality of life the world over.
ADM was incorporated in Delaware in 1923, successor to the Daniels Linseed Co. founded in 1902. Today, it is one of the world’s leading producers of ingredients for human and animal nutrition, and other products made from nature. The Company works with customers to bring a wide array of natural products – including proteins, flavors, colors, flours, fibers, and more – together into unique and innovative solutions to meet consumer needs. In addition, ADM offers a deep portfolio of plant-based products for other uses, such as replacing petroleum-based plastics.
In order to meet consumer needs, ADM has an expansive origination, transportation, and production footprint. The Company operates an extensive global grain elevator and transportation network to procure, store, clean, and transport agricultural raw materials, such as oilseeds, corn, wheat, milo, oats, and barley, as well as products derived from those inputs. ADM’s production facilities around the globe produce a wide array of products, ingredients, and solutions. In addition, ADM has significant investments in joint ventures that aim to expand or enhance the market for its products or offer other benefits including, but not limited to, geographic or product-line expansion.
Segment Descriptions
Effective July 1, 2019, the Company changed its segment reporting to reflect the creation of the combined Ag Services and Oilseeds segment. The former Origination and Oilseeds businesses were merged into a combined Ag Services and Oilseeds segment which enables the Company to better respond to market changes by integrating the supply and value chains and risk management, while delivering significant simplification and efficiency to the day-to-day business. As part of the Company’s efforts for a streamlined management structure, the combined segment is led by the former President of Oilseeds expanding his role to President of Ag Services and Oilseeds.
The Company’s operations are organized, managed, and classified into three reportable business segments: Ag Services and Oilseeds, Carbohydrate Solutions, and Nutrition. Each of these segments is organized based upon the nature of products and services offered. The Company’s remaining operations are not reportable business segments, as defined by the applicable accounting standard, and are classified as Other. Financial information with respect to the Company’s reportable business segments is set forth in Note 17 of “Notes to Consolidated Financial Statements” included in Item 8 herein, “Financial Statements and Supplementary Data” (Item 8).
4
Item 1. | BUSINESS (Continued) |
Ag Services and Oilseeds
The Ag Services and Oilseeds segment includes global activities related to the origination, merchandising, transportation, and storage of agricultural raw materials, and the crushing and further processing of oilseeds such as soybeans and soft seeds (cottonseed, sunflower seed, canola, rapeseed, and flaxseed) into vegetable oils and protein meals. Oilseeds products produced and marketed by the segment include ingredients for food, feed, energy, and industrial customers. Crude vegetable oils produced by the segment’s crushing activities are sold “as is” or are further processed by refining, blending, bleaching, and deodorizing into salad oils. Salad oils are sold “as is” or are further processed by hydrogenating and/or interesterifying into margarine, shortening, and other food products. Partially refined oils are used to produce biodiesel and glycols or are sold to other manufacturers for use in chemicals, paints, and other industrial products. Oilseed protein meals are principally sold to third parties to be used as ingredients in commercial livestock and poultry feeds. The Ag Services and Oilseeds segment is also a major supplier of peanuts, tree nuts, and peanut-derived ingredients to both the U.S. and export markets. In North America, cotton cellulose pulp is manufactured and sold to the chemical, paper, and other industrial markets. The Ag Services and Oilseeds segment's grain sourcing, handling, and transportation network (including barge, ocean-going vessel, truck, rail, and container freight services) provides reliable and efficient services to the Company's customers and agricultural processing operations. The Ag Services and Oilseeds segment also includes agricultural commodity and feed product import, export, and global distribution, and structured trade finance activities. In February 2019, the Company purchased the remaining 50% interest owned by InVivo Group in the Gleadell Agriculture Ltd. joint venture located in the United Kingdom.
The Company has a 32.2% interest in Pacificor (formerly Kalama Export Company LLC). Pacificor owns and operates a grain export elevator in Kalama, Washington and a grain export elevator in Portland, Oregon.
The Company has a 24.8% equity interest in Wilmar International Limited (Wilmar), a Singapore publicly listed company. Wilmar is a leading global agribusiness group headquartered in Asia engaged in the businesses of oil palm cultivation, oilseeds crushing, edible oils refining, packaged oils and foods, sugar milling and refining, specialty fats, oleo chemicals, biodiesel and fertilizers manufacturing, and grains processing.
The Company has a 50% interest in Stratas Foods LLC, a joint venture between ADM and ACH Jupiter, LLC, a subsidiary of Associated British Foods, that procures, packages, and sells edible oils in North America.
The Company has a 50% interest in Edible Oils Limited, a joint venture between ADM and Princes Limited to procure, package, and sell edible oils in the United Kingdom. The Company also formed a joint venture with Princes Limited in Poland to procure, package, and sell edible oils in Poland, the Czech Republic, Slovakia, Hungary, and Austria.
The Company has a 37.5% ownership interest in Olenex Sarl (Olenex), a joint venture between ADM and Wilmar, that produces and sells a comprehensive portfolio of edible oils and fats to customers around the globe. In addition, Olenex markets refined oils and fats from the Company's plants in the Czech Republic, Germany, the Netherlands, Poland, and the U.K.
The Company has a 50% interest in SoyVen, a joint venture between ADM and Cargill to provide soybean meal and oil for customers in Egypt.
The Company is a major supplier of raw materials to Wilmar, Stratas Foods LLC, Edible Oils Limited, SoyVen, and Olenex.
5
Item 1. | BUSINESS (Continued) |
Carbohydrate Solutions
The Carbohydrate Solutions segment is engaged in corn and wheat wet and dry milling and other activities. The Carbohydrate Solutions segment converts corn and wheat into products and ingredients used in the food and beverage industry including sweeteners, corn and wheat starches, syrup, glucose, wheat flour, and dextrose. Dextrose and starch are used by the Carbohydrate Solutions segment as feedstocks for its bioproducts operations. By fermentation of dextrose, the Carbohydrate Solutions segment produces alcohol and other food and animal feed ingredients. Ethyl alcohol is produced by the Company for industrial use as ethanol or as beverage grade. Ethanol, in gasoline, increases octane and is used as an extender and oxygenate. Corn gluten feed and meal, as well as distillers’ grains, are produced for use as animal feed ingredients. Corn germ, a by-product of the wet milling process, is further processed into vegetable oil and protein meal. Other Carbohydrate Solutions products include citric acids which are used in various food and industrial products.
Hungrana Ltd., in which ADM owns a 50% interest, operates a wet corn milling plant in Hungary.
Almidones Mexicanos S.A., in which ADM has a 50% interest, operates a wet corn milling plant in Mexico.
Red Star Yeast Company, LLC, a joint venture in which ADM has a 40% interest, produces and sells fresh and dry yeast in the United States and Canada.
Aston Foods and Food Ingredients, in which ADM owns a 50% interest, is a Russian-based sweeteners and starches business.
Nutrition
The Nutrition segment serves customer needs for food, beverages, health and wellness, and more. The segment engages in the manufacturing, sale, and distribution of a wide array of products from nature including plant-based proteins, natural flavor ingredients, flavor systems, natural colors, emulsifiers, soluble fiber, polyols, hydrocolloids, natural health and nutrition products including probiotics, prebiotics, enzymes, and botanical extracts, and other specialty food and feed ingredients. The Nutrition segment includes the activities related to the procurement, processing, and distribution of edible beans. The Nutrition segment also includes activities related to the processing and distribution of formula feeds and animal health and nutrition products and the manufacture of contract and private label pet treats and foods. In 2019, ADM completed the acquisitions of Neovia, a French-based global provider of value-added animal nutrition solutions, with 72 production facilities and a presence in 25 countries; Florida Chemical Company (FCC), one of the world’s largest producers of citrus oils and ingredients; and The Ziegler Group (Ziegler), a leading European provider of natural citrus flavor ingredients. In January 2020, ADM acquired Yerbalatina Phytoactives (Yerbalatina), a natural plant-based extracts and ingredients manufacturer.
Other
Other includes the Company’s remaining operations as described below.
ADM Investor Services, Inc., a wholly owned subsidiary of the Company, is a registered futures commission merchant and a clearing member of all principal commodities exchanges in the U.S. ADM Investor Services International, Limited, a member of several derivative and commodity exchanges and clearing houses in Europe, ADMIS Singapore Pte. Limited, a clearing member of the Singapore exchange, and ADMIS Hong Kong Limited, are wholly owned subsidiaries of ADM offering brokerage services in Europe and Asia.
Insurance activities include Agrinational Insurance Company (Agrinational) and its subsidiaries. Agrinational, a wholly owned subsidiary of ADM, provides insurance coverage for certain property, casualty, marine, credit, and other miscellaneous risks of the Company. Agrinational also participates in certain third-party reinsurance arrangements. ADM Crop Risk Services, a wholly owned subsidiary engaged in the selling and servicing of crop insurance policies to farmers, was sold on May 1, 2017 to Validus Holdings, a global group of insurance and reinsurance companies.
Corporate
In December 2019, the Company sold its 43.7% interest in Compagnie Industrielle et Financiere des Produits Amylaces SA (Luxembourg) and affiliates (CIP), a joint venture that targets investments in food, feed ingredients, and bioproducts businesses.
6
Item 1. | BUSINESS (Continued) |
Methods of Distribution
The Company’s products are distributed mainly in bulk from processing plants or storage facilities directly to customers’ facilities. The Company has developed a comprehensive transportation capability to efficiently move both commodities and processed products virtually anywhere in the world. The Company owns or leases a significant portion of the trucks, trailers, railroad tank and hopper cars, river barges, towboats, and ocean-going vessels used to transport the Company’s products to its customers.
Concentration of Revenues by Product
The following products accounted for 10% or more of revenues for the following periods:
% of Revenues | |||||
Year Ended December 31 | |||||
2019 | 2018 | 2017 | |||
Soybeans | 16% | 16% | 17% | ||
Soybean Meal | 13% | 14% | 13% | ||
Corn | 12% | 12% | 10% | ||
Status of New Products
The Company continues to expand the size and global reach of its business through the development of new products. Acquisitions, especially in the Nutrition segment, expand the Company’s ability to unlock the potential of nature and serve customers’ evolving and expanding nutritional needs through its offering of natural flavor and ingredient products. The Company does not expect any individual new product to have a significant impact on the Company’s revenues in 2020.
Source and Availability of Raw Materials
A significant majority of the Company’s raw materials are agricultural commodities. In addition, the Company sources specific fruits, vegetables, and nuts for extracts to make flavors and colors. In any single year, the availability and price of these commodities are subject to factors such as changes in weather conditions, plantings, government programs and policies, competition, changes in global demand, changes in standards of living, and global production of similar and competitive crops. The Company’s raw materials are procured from thousands of growers, grain elevators, and wholesale merchants in North America, South America, Europe, Middle East, and Africa (EMEA), Asia, and Australia, pursuant primarily to short-term (less than one year) agreements or on a spot basis. The Company is not dependent upon any particular grower, elevator, or merchant as a source for its raw materials.
Trademarks, Brands, Recipes, and other Intellectual Property
The Company owns trademarks, brands, recipes, and other intellectual property including patents, with a net book value of $948 million as of December 31, 2019. The Company does not consider any segment of its business to be dependent upon any single or group of trademarks, brands, recipes, or other intellectual property.
Seasonality, Working Capital Needs, and Significant Customers
Since the Company is widely diversified in global agribusiness markets, there are no material seasonal fluctuations in overall global processing volumes and the sale and distribution of its products and services. There is a degree of seasonality in the growing cycles, procurement, and transportation of the Company’s principal raw materials: oilseeds, corn, wheat, and other grains.
7
Item 1. | BUSINESS (Continued) |
The prices of agricultural commodities, which may fluctuate significantly and change quickly, directly affect the Company’s working capital requirements. Because the Company has a higher portion of its operations in the northern hemisphere, principally North America and Europe, relative to the southern hemisphere, primarily South America, inventory levels typically peak after the northern hemisphere fall harvest and are generally lower during the northern hemisphere summer months. Working capital requirements have historically trended with inventory levels. No material part of the Company’s business is dependent upon a single customer or very few customers. The Company has seasonal financing arrangements with farmers in certain countries around the world. Typically, advances on these financing arrangements occur during the planting season and are repaid at harvest.
Competition
The Company has significant competition in the markets in which it operates based principally on price, foreign exchange rates, quality, global supply, and alternative products, some of which are made from different raw materials than those utilized by the Company. Given the commodity-based nature of many of its businesses, the Company, on an ongoing basis, focuses on managing unit costs and improving efficiency through technology improvements, productivity enhancements, and regular evaluation of the Company’s asset portfolio.
Research and Development
Research and development expense during the year ended December 31, 2019, net of reimbursements of government grants, was $154 million.
The Company’s laboratories and technical innovation centers around the world enhance its ability to interact with customers globally, not only to provide flavors, but also to support the sales of other food ingredients. The acquisition of Wild Flavors in October 2014 approximately doubled the number of scientists and technicians in research and development. Since that time, additional laboratories have been added, including food & beverages applications laboratories in Fort Collins, Colorado, and Bergamo, Italy as well as expanded laboratories in Decatur, Illinois and Shanghai, China.
The Company expanded its human health and nutrition portfolio in February 2017 with the acquisition of a controlling interest in Biopolis SL (Biopolis), a leading provider of probiotics and genomic services. Biopolis provides genomic sequencing capabilities for the Company's customers as well as for its internal use. Biopolis also has high through-put biological functionality testing capabilities that can be used to discover new probiotics and nutraceuticals. In January 2018, the Company announced a joint development agreement with Vland Biotech to develop and commercialize enzymes for animal feed. In April 2018, the Company opened its new enzyme development laboratory in Davis, California to advance the research and development of feed enzyme as well as enzymes for internal use. In August 2018, the Company further expanded its probiotics business with the acquisition of Probiotics International Limited. With the acquisition of Neovia in early 2019, ADM further expanded its R&D capabilities in Animal Nutrition, globally. In December 2019, the Company opened a new Animal Nutrition Technology Center in Decatur, Illinois, to further expand its animal nutrition capabilities to support customer innovation in pet and aqua food production in North America.
ADM Ventures, which was launched by the Company in 2016, continues to select high-potential, new product development projects from within its business units. The first internal venture funded project, a new sweetener, has been fully commercialized and is being sold in the United States by our Carbohydrate Solutions team. Through the acquisition of Neovia, ADM Ventures further expanded its equity investments in promising, early-stage start-up companies from three to six, and is looking at several others in which the Company may choose to invest.
The Company is continuing to invest in research to develop a broad range of sustainable materials with an objective to produce key intermediate materials that serve as a platform for producing a variety of sustainable packaging products. Conversion technologies include utilizing expertise in both fermentation and catalysis. The Company’s current portfolio includes products that are in the early development phase and those that are close to pilot plant demonstration. The Company’s project with DuPont to develop sustainable packaging solutions with improved barrier properties has progressed to a pilot production facility that opened in April 2018. This facility provides samples for customers as well as engineering data for a full-scale plant. In 2019, the Company announced a joint venture with LG Chem, Ltd. to develop biobased acrylic acid using ingredients from the Company's corn processing. Acrylic acid is a key element required in the manufacture of superabsorbent polymers used in a range of hygiene products, including diapers.
8
Item 1. | BUSINESS (Continued) |
Environmental Compliance
During the year ended December 31, 2019, the Company spent $48 million specifically to improve equipment, facilities, and programs for pollution control and compliance with the requirements of various environmental agencies.
There have been no material effects upon the earnings and competitive position of the Company resulting from compliance with applicable laws or regulations enacted or adopted relating to the protection of the environment.
A number of jurisdictions where the Company has operations have implemented or are in the process of implementing carbon pricing programs or regulations to reduce greenhouse gas emissions including, but not limited to, the U.S., Canada, Mexico, the E.U. and its member states, and China. The Company's operations located in countries with effective and applicable carbon pricing and regulatory programs currently meet their obligations in this regard with no significant impact on the earnings and competitive position of the Company. The Company’s business could be affected in the future by additional global, regional, national, and local regulation, pricing of greenhouse gas emissions or other climate change legislation, regulation or agreements. It is difficult at this time to estimate the likelihood of passage, or predict the potential impact, of any additional legislation, regulations or agreements. Potential consequences of new obligations could include increased energy, transportation, raw material, and administrative costs, and may require the Company to make additional investments in its facilities and equipment.
Number of Employees
The number of full-time employees of the Company was approximately 38,100 at December 31, 2019 and 31,600 at December 31, 2018. The net increase in the number of full-time employees is primarily related to acquisitions net of the early retirement and reorganization initiatives.
Available Information
The Company’s website is http://www.adm.com. ADM's annual reports on Form 10-K; quarterly reports on Form 10-Q; current reports on Form 8-K; directors’ and officers’ Forms 3, 4, and 5; and amendments to those reports, if any, are available, free of charge, through its website, as soon as reasonably practicable after electronically filing such materials with, or furnishing them to, the Securities and Exchange Commission (SEC).
The Company's Code of Conduct, Corporate Governance Guidelines, and the written charters of the Audit, Compensation/Succession, Nominating/Corporate Governance, Sustainability and Corporate Responsibility, and Executive Committees are also available through its website.
References to the Company's website address in this report are provided as a convenience and do not constitute, or should not be viewed as, an incorporation by reference of the information contained on, or available through, the website. Therefore, such information should not be considered part of this report.
The SEC maintains a website which contains reports, proxy and information statements, and other information regarding issuers that file information electronically with the SEC. The SEC’s website is http://www.sec.gov.
Item 1A. | RISK FACTORS |
The Company faces risks in the normal course of business and through global, regional, and local events that could have an adverse impact on its reputation, operations, and financial performance.
Management directs a Company-wide Enterprise Risk Management (ERM) Program, with oversight from the Company’s Board of Directors. The Company’s Audit Committee has the delegated risk management oversight responsibility and receives updates on the risk management processes and key risk factors on a quarterly basis.
The Company, through its business unit, functional, and corporate teams, continually updates, assesses, monitors, and mitigates these and other business and compliance risks in accordance with the ERM Program and as monitored by the ERM Program team and Chief Risk Officer.
9
Item 1A. | RISK FACTORS (Continued) |
The risk factors that follow are the main risks that the ERM Program focuses on to protect and enhance shareholder value through intentional risk mitigation plans based on management-defined risk limits.
The availability and prices of the agricultural commodities and agricultural commodity products the Company procures, transports, stores, processes, and merchandises can be affected by climate change, weather conditions, disease, government programs, competition, and various other factors beyond the Company’s control and could adversely affect the Company’s operating results.
The availability and prices of agricultural commodities are subject to wide fluctuations, including impacts from factors outside the Company's control such as changes in weather, climate, and rising sea levels, crop disease, plantings, government programs and policies, competition, and changes in global demand. The Company uses a global network of procurement, processing, and transportation assets, as well as robust communications between global commodity merchandiser teams, to continually assess price and basis opportunities. Management-established limits (including a corporate wide value-at-risk metric), with robust internal reporting, help to manage risks in pursuit of driving performance. Additionally, the Company depends globally on agricultural producers to ensure an adequate supply of the agricultural commodities.
Reduced supply of agricultural commodities could adversely affect the Company’s profitability by increasing the cost of raw materials and/or limiting the Company’s ability to procure, transport, store, process, and merchandise agricultural commodities in an efficient manner. High and volatile commodity prices can place more pressures on short-term working capital funding. Conversely, if supplies are abundant and crop production globally outpaces demand for more than one or two crop cycles, price volatility is somewhat diminished. This could result in reduced operating results due to the lack of supply chain dislocations and reduced market spread and basis opportunities.
Advances in technology, such as seed and crop protection, farming techniques, storage and logistics, and speed of information flow, may reduce the significance of dislocations and arbitrage opportunities in the agricultural global markets, which may reduce the earnings potential of agricultural merchandisers and processors such as the Company.
The Company has significant competition in the markets in which it operates.
The Company faces significant competition in each of its businesses and has numerous competitors, who can be different depending upon each of the business segments in which it participates. The Company competes for the acquisition of inputs such as agricultural commodities, transportation services, and other materials and supplies, as well as for workforce and talent. Competition impacts the Company’s ability to generate and increase its gross profit as a result of the following factors: Pricing of the Company’s products is partly dependent upon industry processing capacity, which is impacted by competitor actions to bring idled capacity on-line, build new production capacity or execute aggressive consolidation; many of the products bought and sold by the Company are global commodities or are derived from global commodities that are highly price competitive and, in many cases, subject to substitution; significant changes in exchange rates of foreign currencies versus the U.S. dollar, particularly the currencies of major crop growing countries, could also make goods and products of these countries more competitive than U.S. products; improved yields in different crop growing regions may reduce the reliance on origination territories in which the Company has a significant presence; and continued merger and acquisition activities resulting in further consolidations could result in greater cost competitiveness and global scale of certain players in the industry, especially when acquirers are state-owned and/or backed by public funds and have profit and return objectives that may differ from publicly traded enterprises. To compete effectively, the Company focuses on improving efficiency in its production and distribution operations, developing and maintaining appropriate market presence, maintaining a high level of product safety and quality, and working with customers to develop new products and tailored solutions.
In the case of the nutrition business, while maintaining efficient and cost-effective operations are important, the ability to drive innovation and come up with quality nutritional solutions for human and animal needs are key factors to remain competitive in the nutrition market.
10
Item 1A. | RISK FACTORS (Continued) |
Fluctuations in energy prices could adversely affect the Company’s operating results.
The Company’s operating costs and the selling prices of certain finished products are sensitive to changes in energy prices. The Company’s processing plants are powered principally by electricity, natural gas, and coal. The Company’s transportation operations are dependent upon diesel fuel and other petroleum-based products. Significant increases in the cost of these items, including any consequences of regulation or taxation of greenhouse gases, could adversely affect the Company’s production costs and operating results.
The Company has certain finished products, such as ethanol and biodiesel, which are closely related to, or may be substituted for, petroleum products, or in the case of ethanol, blended into gasoline to increase octane content. Therefore, the selling prices of ethanol and biodiesel can be impacted by the selling prices of gasoline, diesel fuel, and other octane enhancers. A significant decrease in the price of gasoline, diesel fuel, or other octane enhancers could result in a significant decrease in the selling price of the Company’s ethanol and biodiesel. The Company uses derivative contracts as anticipatory hedges for both purchases of commodity inputs and sales of energy-based products in order to protect itself in the near term against these price trends and to protect and maximize processing margins.
The Company is subject to economic downturns and regional economic volatilities, which could adversely affect the Company’s operating results.
The Company conducts its business and has substantial assets located in many countries and geographic areas. While 44 percent of the Company’s processing plants and 57 percent of its procurement facilities are located in the United States, the Company also has significant operations in both developed areas (such as Western Europe, Canada, and Brazil) and emerging market areas. One of the Company’s strategies is to expand the global reach of its core model, which may include expanding or developing its business in emerging market areas. Both developed and emerging market areas are subject to impacts of economic downturns, including decreased demand for the Company’s products, and reduced availability of credit, or declining credit quality of the Company’s suppliers, customers, and other counterparties. In addition, emerging market areas could be subject to more volatile operating conditions including, but not limited to, logistics limitations or delays, labor-related challenges, epidemic outbreaks, limitations or regulations affecting trade flows, local currency concerns, and other economic and political instability. Political fiscal instability could generate intrusive regulations in emerging markets, potentially creating unanticipated assessments of taxes, fees, increased risks of corruption, etc. Economic downturns and volatile market conditions could adversely affect the Company’s operating results and ability to execute its long-term business strategies, although the nature of many of the Company's products (i.e. food and feed ingredients) is less sensitive to demand reductions in any economic downcycles. The Company mitigates this risk in many ways, including country risk and exposure analysis, government relations and tax compliance activities, and robust ethics compliance training requirements.
The Company is subject to numerous laws, regulations, and mandates globally which could adversely affect the Company’s operating results and forward strategy.
The Company does business globally, connecting crops and markets in more than 190 countries, and is required to comply with laws and regulations administered by the United States federal government as well as state, local, and non-U.S. governmental authorities in areas including: Accounting and income taxes, anti-corruption, anti-bribery, global trade, trade sanctions, environmental, product safety, and handling and production of regulated substances. The Company frequently faces challenges from U.S. and foreign tax authorities regarding the amount of taxes due. These challenges include questions regarding the timing and amount of deductions and the allocation of income among various tax jurisdictions. Any failure to comply with applicable laws and regulations or appropriately resolve these challenges could subject the Company to administrative, civil, and criminal remedies, including fines, penalties, disgorgement, injunctions, and recalls of its products, and damage to its reputation. Resolution of some of these tax disputes could take many years and interest and penalties may be accruing in the meantime, thereby significantly increasing the notional amount of the exposures.
The production of the Company’s products uses materials which can create emissions of certain regulated substances, including greenhouse gas emissions. The Company has programs and policies in place (e.g., Corporate Sustainability Program, No-Deforestation Policy, Environmental Policy, etc.) to reduce its environmental footprint and to help ensure compliance with laws and regulations. Implementation of these programs and policies sometimes requires acquisition of technology at a cost to the Company. Failure to comply can have serious consequences, including civil, administrative, and criminal penalties as well as a negative impact on the Company’s reputation, business, cash flows, and results of operations.
11
Item 1A. | RISK FACTORS (Continued) |
In addition, changes to regulations or implementation of additional regulations - for example, the imposition of regulatory restrictions on greenhouse gases, the implementation of IMO 2020 low sulfur fuel oil requirements for ships or regulatory modernization of food safety laws - may require the Company to modify existing processing facilities and/or processes which could significantly increase operating costs and adversely affect operating results.
Government policies, mandates, and regulations specifically affecting the agricultural sector and related industries; regulatory policies or matters that affect a variety of businesses; taxation polices; and political instability could adversely affect the Company’s operating results.
Agricultural production and trade flows are subject to government policies, mandates, regulations, and trade agreements, including taxes, tariffs, duties, subsidies, incentives, foreign exchange rates, and import and export restrictions, including policies related to genetically modified organisms, traceability standards, product safety and labeling, renewable fuels, and low carbon fuel mandates. These policies can influence the planting of certain crops; the location and size of crop production; whether unprocessed or processed commodity products are traded; the volume and types of imports and exports; the availability and competitiveness of feedstocks as raw materials; the viability and volume of production of certain of the Company’s products; and industry profitability. For example, changes in government policies or regulations of ethanol and biodiesel including, but not limited to, changes in the Renewable Fuel Standard program under the Energy Independence and Security Act of 2007 in the United States, can have an impact on the Company’s operating results. International trade regulations can adversely affect agricultural commodity trade flows by limiting or disrupting trade between countries or regions. Regulations of financial markets and instruments, including the Dodd-Frank Act, Consumer Protection Act, and the European Market Infrastructure Regulation, create uncertainty and may lead to additional risks and costs, and could adversely affect the Company’s futures commission merchant business and its agricultural commodity risk management practices. Future government policies may adversely affect the supply of, demand for, and prices of the Company’s products; adversely affect the Company's ability to deploy adequate hedging programs; restrict the Company’s ability to do business in its existing and target markets; and adversely affect the Company’s revenues and operating results.
The Company’s operating results could be affected by political instability and by changes in monetary, fiscal, trade, and environmental policies, laws, regulations, and acquisition approvals, creating risks including, but not limited to: Changes in a country’s or region’s economic or political conditions (e.g. Brexit), local labor conditions and regulations, and safety and environmental regulations; reduced protection of intellectual property rights; changes in the regulatory or legal environment; restrictions on currency exchange activities; currency exchange fluctuations; burdensome taxes and tariffs; enforceability of legal agreements and judgments; adverse tax, administrative agency or judicial outcomes; and regulation or taxation of greenhouse gases. International risks and uncertainties, including changing social and economic conditions as well as terrorism, political hostilities, and war, could limit the Company’s ability to transact business in these markets. There has been a recent increase in populism and nationalism in various countries around the world and the concept and benefits of free trade are being challenged. The Company has benefited from the free flow of agricultural and food and feed ingredient products from the U.S. and other sources to markets around the world. Increases in tariff and restrictive trade activities around the world (e.g., the U.S.-China trade dispute, Iran sanctions) could negatively impact the Company's ability to enter certain markets or the price of products may become less competitive in those markets.
The Company’s strategy involves expanding the volume and diversity of crops it merchandises and processes, expanding the global reach of its core model, and expanding its value-added product portfolio. Government policies including, but not limited to, antitrust and competition law, trade restrictions, food safety regulations, sustainability requirements, and traceability, can impact the Company’s ability to execute this strategy successfully.
The Company is subject to industry-specific risks which could adversely affect the Company’s operating results.
The Company is subject to risks which include, but are not limited to, product safety or quality; launch of new products by other industries that can replace the functionalities of the Company's production; shifting consumer preferences; federal, state, and local regulations on manufacturing or labeling; socially acceptable farming practices; environmental, health, and safety regulations; and customer product liability claims. The liability which could result from certain of these risks may not always be covered by, or could exceed liability insurance related to product liability and food safety matters maintained by the Company. The Company has a particularly strong capability and culture around occupational health and safety and food safety; however, risks to the Company's reputation may exist due to potential negative publicity caused by product liability, food safety, occupational health and safety, and environmental matters.
12
Item 1A. | RISK FACTORS (Continued) |
Certain of the Company’s merchandised commodities and finished products are used as ingredients in livestock and poultry feed. The Company is subject to risks associated with economic, product quality, feed safety or other factors which may adversely affect the livestock and poultry businesses, including the outbreak of disease in livestock and poultry, for example African swine fever, which could adversely affect demand for the Company’s products used as ingredients in feed. In addition, as the Company increases its investment in flavors and ingredients businesses, it is exposed to increased risks related to rapidly changing consumer preferences and the impacts these changes could have on the success of certain of the Company's customers.
The Company is exposed to potential business disruption including, but not limited to, disruption of transportation services, supply of non-commodity raw materials used in its processing operations, and other impacts resulting from acts of terrorism or war, natural disasters, severe weather conditions, and accidents which could adversely affect the Company’s operating results.
The Company’s operations rely on dependable and efficient transportation services the disruption of which could result in difficulties supplying materials to the Company’s facilities and impair the Company’s ability to deliver products to its customers in a timely manner. The Company relies on access to navigable rivers and waterways in order to fulfill its transportation obligations more effectively. In addition, if certain non-agricultural commodity raw materials, such as water or certain chemicals used in the Company’s processing operations, are not available, the Company’s business could be disrupted. Any major lack of available water for use in certain of the Company’s processing operations could have a material adverse impact on operating results. Certain factors which may impact the availability of non-agricultural commodity raw materials are out of the Company’s control including, but not limited to, disruptions resulting from weather, high river water conditions, economic conditions, manufacturing delays or disruptions at suppliers, shortage of materials, interruption of energy supply, and unavailable or poor supplier credit conditions.
The assets and operations of the Company could be subject to extensive property damage and business disruption from various events which include, but are not limited to, acts of terrorism (for example, purposeful adulteration of the Company’s products), war, natural disasters, severe weather conditions, accidents, explosions, and fires. The Company is continuing to enhance and deploy additional food safety and security procedures and controls to appropriately mitigate the risks of any adulteration of the Company’s products in the supply chain and finished products in production and distribution networks. In addition, the Company conforms to management systems, such as International Organization for Standardization (ISO) or other recognized global standards.
The Company’s business is capital-intensive in nature and the Company relies on cash generated from its operations and external financing to fund its growth and ongoing capital needs. Limitations on access to external financing could adversely affect the Company’s operating results.
The Company requires significant capital, including continuing access to credit markets, to operate its current business and fund its growth strategy. The Company’s working capital requirements, including margin requirements on open positions on futures exchanges, are directly affected by the price of agricultural commodities, which may fluctuate significantly and change quickly. The Company also requires substantial capital to maintain and upgrade its extensive network of storage facilities, processing plants, refineries, mills, ports, transportation assets, and other facilities to keep pace with competitive developments, technological advances, regulations, and changing safety standards in the industry. Moreover, the expansion of the Company’s business and pursuit of acquisitions or other business opportunities may require significant amounts of capital. Access to credit markets and pricing of the Company’s capital is dependent upon maintaining sufficient credit ratings from credit rating agencies. Sufficient credit ratings allow the Company to access cost competitive tier one commercial paper markets. If the Company is unable to maintain sufficiently high credit ratings, access to these commercial paper and other debt markets and costs of borrowings could be adversely affected. If the Company is unable to generate sufficient cash flow or maintain access to adequate external financing, including as a result of significant disruptions in the global credit markets, it could restrict the Company’s current operations and its growth opportunities. The Company manages this risk with constant monitoring of credit/liquidity metrics, cash forecasting, and routine communications with credit rating agencies on risk management practices.
LIBOR (London Interbank Offered rate) has been the subject of recent proposals for international reform and it is anticipated LIBOR will be discontinued or modified by the end of 2021. The Company's variable rate debt, credit facilities, certain derivative agreements, and commercial agreements may use LIBOR as a benchmark for establishing interest rates. While it is not possible to predict the consequences of discontinuation or modification of LIBOR at this time, the Company's financing costs could be adversely or positively impacted. Although the Company does not expect that a transition from LIBOR will have a material adverse impact on its financing costs, the Company continues to monitor developments.
13
Item 1A. | RISK FACTORS (Continued) |
The Company’s risk management strategies may not be effective.
The Company has a Chief Risk Officer who oversees the ERM Program and regularly reports to the Board of Directors on the myriad of risks facing the Company and the Company's strategies for mitigating the risks. The Company’s business is affected by fluctuations in agricultural commodity cash prices and derivative prices, transportation costs, energy prices, interest rates, foreign currency exchange rates, and equity markets. The Company monitors position limits and counterparty risks and engages in other strategies and controls to manage these risks. The Company regularly reports its aggregate commodity risk exposures to the Board of Directors through the ERM process. The Company has an established commodity merchandising governance process that ensures proper position reporting and monitoring, limits approvals, and executes training on trade compliance, commodity regulatory reporting controls, and other policies. The Company’s risk monitoring efforts may not be successful at detecting a significant risk exposure. If these controls and strategies are not successful in mitigating the Company’s exposure to these fluctuations, it could adversely affect the Company’s operating results.
The Company has limited control over and may not realize the expected benefits of its equity investments and joint ventures.
The Company has $5.1 billion invested in or advanced to joint ventures and investments over which the Company has limited control as to the governance and management activities. Net sales to unconsolidated affiliates during the year ended December 31, 2019 was $4.9 billion. Risks related to these investments may include: The financial strength of the investment partner; loss of revenues and cash flows to the investment partner and related gross profit; the inability to implement beneficial management strategies, including risk management and compliance monitoring, with respect to the investment’s activities; and the risk that the Company may not be able to resolve disputes with the partners. The Company may encounter unanticipated operating issues, financial results, or compliance and reputational risks related to these investments. The Company mitigates this risk using controls and policies related to joint venture formation, governance (including board of directors’ representation), merger and acquisition integration management, and harmonization of joint venture policies with the Company’s policies and controls.
The Company’s information technology (IT) systems, processes, and sites may suffer interruptions, security breaches, or failures which may affect the Company’s ability to conduct its business.
The Company’s operations rely on certain key IT systems, some of which are dependent on services provided by third parties, to provide critical data connectivity, information, and services for internal and external users. These interactions include, but are not limited to: Ordering and managing materials from suppliers; risk management activities; converting raw materials to finished products; inventory management; shipping products to customers; processing transactions; summarizing and reporting results of operations; human resources benefits and payroll management; and complying with regulatory, legal or tax requirements. The Company is also in the process of implementing a new enterprise resource planning (ERP) system on a worldwide basis as part of its ongoing business transformation program, which is expected to improve the efficiency and effectiveness of certain financial and business transaction processes and the underlying systems environment. This will allow the Company to mitigate the risk of instability in aging legacy systems. Increased IT security and social engineering threats and more sophisticated computer crime, including advanced persistent threats, pose a potential risk to the security of the Company’s IT systems, networks, and services, as well as the confidentiality, availability, and integrity of the Company’s third party data. The Company is subject to a variety of laws and regulations in the United States and other jurisdictions regarding privacy, data protection, and data security, including those related to the collection, storage, handling, use, disclosure, transfer, and security of personal data. Compliance with and interpretation of data privacy regulations, including the European Union General Data Protection Regulation implemented in 2018, continues to evolve and any violation could subject the Company to legal claims, regulatory penalties, and damage to its reputation. The Company has put in place security measures to prevent, detect, and mitigate cyber-based attacks, and has instituted control procedures for cyber security incident responses and disaster recovery plans for its critical systems. In addition, the Company monitors this risk on an ongoing basis to detect and correct any breaches, and reports metrics on the quality of the Company’s data security efforts and control environment to the highest level of management and to the Board of Directors. However, if the Company’s IT systems are breached, damaged, or cease to function properly due to any number of causes, such as catastrophic events, power outages, security breaches, or cyber-based attacks, and the Company’s disaster recovery plans do not effectively mitigate the risks on a timely basis, the Company may suffer significant interruptions in its ability to manage its operations, loss of valuable data, actual or threatened legal actions, and damage to its reputation, which may adversely impact the Company’s revenues, operating results, and financial condition.
14
Item 1A. | RISK FACTORS (Continued) |
The Company may fail to realize the benefits or experience delays in the execution of its growth strategy, encompassing organic and inorganic initiatives, outside the U.S. and in businesses where the Company does not currently have a large presence.
As the Company executes its growth strategy, through both organic and inorganic growth, it may encounter risks which could result in increased costs, decreased revenues, and delayed synergies. Recent investments outside the U.S. include Neovia, certain assets of Brazil-based Algar Agro, Protexin, Ziegler, Rodelle, Inc., and Yerbalatina. Growth in new geographies outside the U.S. can expose the Company to volatile economic, political, and regulatory risks that may negatively impact its operations and ability to achieve its growth strategy. Expanding businesses where the Company has limited presence may expose the Company to risks related to the inability to identify an appropriate partner or target and favorable terms, inability to retain/hire strategic talent, or integration risks that may require significant management resources that would have otherwise been available for ongoing growth or operational initiatives. Acquisitions may involve unanticipated delays, costs, and other problems. Due diligence performed prior to the acquisition may not identify a material liability or issue that could impact the Company's reputation or adversely affect results of operations resulting in a reduction of the anticipated acquisition benefits. Additionally, acquisitions may involve integration risks such as: internal control effectiveness, system integration risks, the risk of impairment charges related to goodwill and other intangibles, ability to retain acquired employees, and other unanticipated risks.
Item 1B. | UNRESOLVED STAFF COMMENTS |
The Company has no unresolved staff comments.
Item 2. | PROPERTIES |
The Company owns or leases, under operating leases, the following processing plants and procurement facilities:
Processing Plants | Procurement Facilities | ||||||||||||||||
Owned | Leased | Total | Owned | Leased | Total | ||||||||||||
U.S. | 150 | 4 | 154 | 221 | 53 | 274 | |||||||||||
International | 169 | 24 | 193 | 92 | 116 | 208 | |||||||||||
319 | 28 | 347 | 313 | 169 | 482 | ||||||||||||
The Company’s operations are such that most products are efficiently processed near the source of raw materials. Consequently, the Company has many plants strategically located in agricultural commodity producing areas. The annual volume of commodities processed will vary depending upon availability of raw materials and demand for finished products. The Company also owns approximately 230 warehouses and terminals primarily used as bulk storage facilities and 55 innovation centers. Warehouses, terminals, corporate, and sales offices are not included in the tables above. Processing plants and procurement facilities owned or leased by unconsolidated joint ventures are also not included in the tables above.
To enhance the efficiency of transporting large quantities of raw materials and finished products between the Company’s procurement facilities and processing plants and also the final delivery of products to its customers around the world, the Company owns approximately 1,900 barges, 11,900 rail cars, 330 trucks, 1,300 trailers, 90 boats, and 7 oceangoing vessels; and leases, under operating leases, approximately 610 barges, 16,900 rail cars, 320 trucks, 280 trailers, 40 boats, and 19 oceangoing vessels.
15
Item 2. | PROPERTIES (Continued) |
Ag Services and Oilseeds Processing Facilities | |||||||||||||||||
Owned | Leased | ||||||||||||||||
Refined | Refined | ||||||||||||||||
Ag | Products | Ag | Products | ||||||||||||||
Services | Crushing | and Other | Total | Services | Crushing | and Other | Total | ||||||||||
North America | |||||||||||||||||
U.S.* | 1 | 24 | 33 | 58 | — | — | 2 | 2 | |||||||||
Canada | — | 3 | 4 | 7 | — | — | — | — | |||||||||
Mexico | — | 1 | — | 1 | — | — | — | — | |||||||||
Total | 1 | 28 | 37 | 66 | — | — | 2 | 2 | |||||||||
Daily/Storage capacity | |||||||||||||||||
Metric tons (in 1,000’s) | 1 | 63 | 24 | 88 | — | — | — | — | |||||||||
South America | |||||||||||||||||
Argentina | — | — | 1 | 1 | — | — | — | — | |||||||||
Brazil | — | 7 | 12 | 19 | — | 1 | — | 1 | |||||||||
Paraguay | — | 1 | — | 1 | — | — | — | — | |||||||||
Peru | — | — | 1 | 1 | — | — | — | — | |||||||||
Total | — | 8 | 14 | 22 | — | 1 | — | 1 | |||||||||
Daily/Storage capacity | |||||||||||||||||
Metric tons (in 1,000’s) | — | 19 | 9 | 28 | — | 1 | — | 1 | |||||||||
Europe | |||||||||||||||||
Belgium | — | — | 1 | 1 | — | — | — | — | |||||||||
Czech Republic | — | 1 | 1 | 2 | — | — | — | — | |||||||||
Germany | — | 4 | 8 | 12 | — | — | — | — | |||||||||
Netherlands | — | 1 | 1 | 2 | — | — | — | — | |||||||||
Poland | — | 2 | 5 | 7 | — | — | — | — | |||||||||
Ukraine | — | 1 | — | 1 | — | — | — | — | |||||||||
United Kingdom | — | 1 | 3 | 4 | — | — | — | — | |||||||||
Total | — | 10 | 19 | 29 | — | — | — | — | |||||||||
Daily/Storage capacity | |||||||||||||||||
Metric tons (in 1,000’s) | — | 36 | 14 | 50 | — | — | — | — | |||||||||
Australia | |||||||||||||||||
Australia | — | — | — | — | 1 | — | — | 1 | |||||||||
Total | — | — | — | — | 1 | — | — | 1 | |||||||||
Daily capacity | |||||||||||||||||
Metric tons (in 1,000's) | — | — | — | — | — | — | — | — | |||||||||
Asia | |||||||||||||||||
India | — | — | 2 | 2 | — | — | 1 | 1 | |||||||||
Total | — | — | 2 | 2 | — | — | 1 | 1 | |||||||||
Daily capacity | |||||||||||||||||
Metric tons (in 1,000's) | — | — | 1 | 1 | — | — | 1 | 1 | |||||||||
Africa | |||||||||||||||||
South Africa | — | — | 3 | 3 | — | — | 1 | 1 | |||||||||
Total | — | — | 3 | 3 | — | — | 1 | 1 | |||||||||
Daily capacity | |||||||||||||||||
Metric tons (in 1,000's) | — | — | 2 | 2 | — | — | — | — | |||||||||
Grand Total | 1 | 46 | 75 | 122 | 1 | 1 | 4 | 6 | |||||||||
Total daily/storage capacity | |||||||||||||||||
Metric tons (in 1,000’s) | 1 | 118 | 50 | 169 | — | 1 | 1 | 2 | |||||||||
*The U.S. processing plants are located in Alabama, California, Georgia, Illinois, Indiana, Iowa, Kansas, Minnesota, Missouri, Nebraska, North Dakota, Ohio, South Carolina, Tennessee, and Texas.
16
Item 2. | PROPERTIES (Continued) |
Ag Services and Oilseeds Procurement Facilities | |||||||||||||||||
Owned | Leased | ||||||||||||||||
Refined | Refined | ||||||||||||||||
Ag | Products | Ag | Products | ||||||||||||||
Services | Crushing | and Other | Total | Services | Crushing | and Other | Total | ||||||||||
North America | |||||||||||||||||
U.S.* | 137 | 3 | 58 | 198 | 17 | — | 34 | 51 | |||||||||
Canada | 1 | 5 | — | 6 | — | — | — | — | |||||||||
Dominican Republic | 1 | — | — | 1 | — | — | — | — | |||||||||
Total | 139 | 8 | 58 | 205 | 17 | — | 34 | 51 | |||||||||
Daily/Storage capacity | |||||||||||||||||
Metric tons (in 1,000’s) | 12,153 | 263 | 224 | 12,640 | 786 | — | 104 | 890 | |||||||||
South America | |||||||||||||||||
Argentina | 3 | — | — | 3 | 1 | — | — | 1 | |||||||||
Brazil | 39 | 1 | — | 40 | 1 | — | — | 1 | |||||||||
Colombia | — | — | — | — | 9 | — | — | 9 | |||||||||
Ecuador | — | — | — | — | 2 | — | — | 2 | |||||||||
Paraguay | 13 | — | — | 13 | 2 | — | — | 2 | |||||||||
Peru | — | — | — | — | 2 | — | — | 2 | |||||||||
Uruguay | 1 | — | — | 1 | 6 | — | — | 6 | |||||||||
Total | 56 | 1 | — | 57 | 23 | — | — | 23 | |||||||||
Daily/Storage capacity | |||||||||||||||||
Metric tons (in 1,000’s) | 2,471 | 60 | — | 2,531 | 851 | — | — | 851 | |||||||||
Europe | |||||||||||||||||
Germany | 2 | 1 | — | 3 | — | — | — | — | |||||||||
Hungary | — | — | — | — | 7 | — | — | 7 | |||||||||
Ireland | 1 | — | — | 1 | 2 | — | — | 2 | |||||||||
Netherlands | 1 | 1 | — | 2 | — | — | — | — | |||||||||
Poland | — | 4 | — | 4 | — | 3 | — | 3 | |||||||||
Romania | 11 | — | — | 11 | 3 | — | — | 3 | |||||||||
Russian Federation | — | — | — | — | 12 | — | — | 12 | |||||||||
Spain | — | — | — | — | 4 | — | — | 4 | |||||||||
Turkey | 1 | — | — | 1 | — | — | — | — | |||||||||
Ukraine | 6 | — | — | 6 | — | — | — | — | |||||||||
United Kingdom | — | — | — | — | — | 3 | — | 3 | |||||||||
Total | 22 | 6 | — | 28 | 28 | 6 | — | 34 | |||||||||
Daily/Storage capacity | |||||||||||||||||
Metric tons (in 1,000’s) | 1,265 | 428 | — | 1,693 | 353 | 14 | — | 367 | |||||||||
Asia | |||||||||||||||||
China | — | — | — | — | — | — | 1 | 1 | |||||||||
Korea | — | — | — | — | 1 | — | — | 1 | |||||||||
India | — | — | — | — | — | 51 | — | 51 | |||||||||
Total | — | — | — | — | 1 | 51 | 1 | 53 | |||||||||
Daily capacity | |||||||||||||||||
Metric tons (in 1,000's) | — | — | — | — | — | 80 | 35 | 115 | |||||||||
Grand Total | 217 | 15 | 58 | 290 | 69 | 57 | 35 | 161 | |||||||||
Total daily/storage capacity | |||||||||||||||||
Metric tons (in 1,000’s) | 15,889 | 751 | 224 | 16,864 | 1,990 | 94 | 139 | 2,223 | |||||||||
*The U.S. procurement facilities are located in Alabama, Arkansas, Florida, Georgia, Illinois, Indiana, Iowa, Kansas, Kentucky, Louisiana, Michigan, Minnesota, Mississippi, Missouri, Nebraska, North Carolina, North Dakota, Ohio, Oklahoma, South Carolina, South Dakota, Tennessee, and Texas.
17
Item 2. | PROPERTIES (Continued) |
Carbohydrate Solutions Processing Plants | |||||||||||
Owned | Leased | ||||||||||
Starches & Sweeteners | Bioproducts | Total | Starches & Sweeteners | ||||||||
North America | |||||||||||
U.S.* | 35 | 3 | 38 | — | |||||||
Canada | 8 | — | 8 | — | |||||||
Barbados | 1 | — | 1 | — | |||||||
Belize | 1 | — | 1 | 1 | |||||||
Grenada | 1 | — | 1 | — | |||||||
Jamaica | 2 | — | 2 | — | |||||||
Total | 48 | 3 | 51 | 1 | |||||||
Daily capacity | |||||||||||
Metric tons (in 1,000’s) | 69 | 24 | 93 | 3 | |||||||
Europe | |||||||||||
Bulgaria | 1 | — | 1 | — | |||||||
France | 1 | — | 1 | — | |||||||
Turkey | 1 | — | 1 | — | |||||||
United Kingdom | 3 | — | 3 | 4 | |||||||
Total | 6 | — | 6 | 4 | |||||||
Daily capacity | |||||||||||
Metric tons (in 1,000’s) | 5 | — | 5 | 1 | |||||||
Asia | |||||||||||
China | 1 | — | 1 | — | |||||||
Total | 1 | — | 1 | — | |||||||
Daily capacity | |||||||||||
Metric tons (in 1,000’s) | — | — | — | — | |||||||
Africa | |||||||||||
Morocco | 1 | — | 1 | — | |||||||
Total | 1 | — | 1 | — | |||||||
Daily capacity | |||||||||||
Metric tons (in 1,000’s) | — | — | — | — | |||||||
Grand Total | 56 | 3 | 59 | 5 | |||||||
Total daily capacity | |||||||||||
Metric tons (in 1,000’s) | 74 | 24 | 98 | 4 | |||||||
*The U.S. processing plants are located in California, Illinois, Indiana, Iowa, Kansas, Minnesota, Missouri, Nebraska, New York, North Carolina, Oklahoma, Pennsylvania, Tennessee, Texas, Washington, and Wisconsin.
18
Item 2. | PROPERTIES (Continued) |
Carbohydrate Solutions Procurement Facilities | |||||||||||||||||
Owned | Leased | ||||||||||||||||
Starches & Sweeteners | Bioproducts | Total | Starches & Sweeteners | Bioproducts | Total | ||||||||||||
North America | |||||||||||||||||
U.S.* | 4 | — | 4 | 1 | — | 1 | |||||||||||
Canada | — | — | — | 2 | — | 2 | |||||||||||
Total | 4 | — | 4 | 3 | — | 3 | |||||||||||
Daily/Storage capacity | |||||||||||||||||
Metric tons (in 1,000’s) | 362 | — | 362 | 154 | — | 154 | |||||||||||
Europe | |||||||||||||||||
United Kingdom | — | — | — | 4 | — | 4 | |||||||||||
Total | — | — | — | 4 | — | 4 | |||||||||||
Daily/Storage capacity | |||||||||||||||||
Metric tons (in 1,000’s) | — | — | — | 19 | — | 19 | |||||||||||
Grand Total | 4 | — | 4 | 7 | — | 7 | |||||||||||
Total daily/storage capacity | |||||||||||||||||
Metric tons (in 1,000’s) | 362 | — | 362 | 173 | — | 173 | |||||||||||
*The U.S. procurement facilities are located in Iowa, Minnesota, Oklahoma, and Texas.
Nutrition Processing Plants | |||||||||||||||||
Owned | Leased | ||||||||||||||||
WFSI | Animal Nutrition | Total | WFSI | Animal Nutrition | Total | ||||||||||||
North America | |||||||||||||||||
U.S.* | 27 | 27 | 54 | 1 | 1 | 2 | |||||||||||
Canada | 1 | 4 | 5 | — | — | — | |||||||||||
Mexico | — | 12 | 12 | — | — | — | |||||||||||
Puerto Rico | — | 2 | 2 | — | 1 | 1 | |||||||||||
Trinidad & Tobago | — | 1 | 1 | — | — | — | |||||||||||
Total | 28 | 46 | 74 | 1 | 2 | 3 | |||||||||||
Daily capacity | |||||||||||||||||
Metric tons (in 1,000’s) | 74 | 10 | 84 | — | 49 | 49 | |||||||||||
South America | |||||||||||||||||
Brazil | 1 | 11 | 12 | 1 | 3 | 4 | |||||||||||
Colombia | — | 1 | 1 | — | — | — | |||||||||||
Ecuador | — | 1 | 1 | — | — | — | |||||||||||
Total | 1 | 13 | 14 | 1 | 3 | 4 | |||||||||||
Daily capacity | |||||||||||||||||
Metric tons (in 1,000’s) | — | — | — | — | — | — | |||||||||||
19
Item 2. | PROPERTIES (Continued) |
Nutrition Processing Plants | |||||||||||||||||
Owned | Leased | ||||||||||||||||
WFSI | Animal Nutrition | Total | WFSI | Animal Nutrition | Total | ||||||||||||
Europe | |||||||||||||||||
Belgium | — | 1 | 1 | — | — | — | |||||||||||
Germany | 6 | — | 6 | 2 | — | 2 | |||||||||||
France | 1 | 12 | 13 | — | 1 | 1 | |||||||||||
Italy | — | 1 | 1 | — | — | — | |||||||||||
Netherlands | 1 | 1 | 2 | 1 | — | 1 | |||||||||||
Poland | 1 | 1 | 2 | — | — | — | |||||||||||
Portugal | — | 1 | 1 | — | — | — | |||||||||||
Spain | 2 | 1 | 3 | — | — | — | |||||||||||
Switzerland | — | 1 | 1 | — | — | — | |||||||||||
Turkey | — | — | — | 1 | — | 1 | |||||||||||
United Kingdom | 1 | — | 1 | — | — | — | |||||||||||
Total | 12 | 19 | 31 | 4 | 1 | 5 | |||||||||||
Daily capacity | |||||||||||||||||
Metric tons (in 1,000’s) | 1 | — | 1 | 2 | — | 2 | |||||||||||
Africa | |||||||||||||||||
Algeria | — | 1 | 1 | — | — | — | |||||||||||
Madagascar | — | — | — | 1 | — | 1 | |||||||||||
Nigeria | — | 1 | 1 | — | — | — | |||||||||||
South Africa | — | 2 | 2 | — | — | — | |||||||||||
Total | — | 4 | 4 | 1 | — | 1 | |||||||||||
Daily capacity | |||||||||||||||||
Metric tons (in 1,000’s) | — | — | — | — | — | — | |||||||||||
Asia | |||||||||||||||||
China | 1 | 7 | 8 | 1 | — | 1 | |||||||||||
India | — | 1 | 1 | 1 | — | 1 | |||||||||||
Indonesia | — | 2 | 2 | — | — | — | |||||||||||
Philippines | — | — | — | — | 2 | 2 | |||||||||||
Vietnam | — | 4 | 4 | — | — | — | |||||||||||
Total | 1 | 14 | 15 | 2 | 2 | 4 | |||||||||||
Daily capacity | |||||||||||||||||
Metric tons (in 1,000’s) | — | — | — | — | — | — | |||||||||||
Grand Total | 42 | 96 | 138 | 9 | 8 | 17 | |||||||||||
Total daily capacity | |||||||||||||||||
Metric tons (in 1,000’s) | 75 | 10 | 85 | 2 | 49 | 51 | |||||||||||
*The U.S. processing plants are located in Colorado, Florida, Georgia, Illinois, Indiana, Iowa, Kansas, Kentucky, Michigan, Minnesota, Missouri, Nebraska, New Jersey, North Dakota, Ohio, Pennsylvania, Texas, and Washington.
20
Item 2. | PROPERTIES (Continued) |
Nutrition Procurement Facilities | |||||||||||
Owned | Leased | ||||||||||
WFSI | Animal Nutrition | Total | WFSI | ||||||||
North America | |||||||||||
U.S.* | 19 | — | 19 | 1 | |||||||
Total | 19 | — | 19 | 1 | |||||||
Daily/Storage capacity | |||||||||||
Metric tons (in 1,000’s) | 316 | — | 316 | 2 | |||||||
Grand Total | 19 | — | 19 | 1 | |||||||
Total daily/storage capacity | |||||||||||
Metric tons (in 1,000’s) | 316 | — | 316 | 2 | |||||||
*The U.S. procurement facilities are located in Idaho, Illinois, Michigan, Minnesota, North Dakota, and Wyoming.
Item 3. | LEGAL PROCEEDINGS |
The Company is routinely involved in a number of actual or threatened legal actions, including those involving alleged personal injuries, employment law, product liability, intellectual property, environmental issues, alleged tax liability (see Note 13 in Item 8 for information on income tax matters), and class actions. The Company also routinely receives inquiries from regulators and other government authorities relating to various aspects of its business, and at any given time, the Company has matters at various stages of resolution. The outcomes of these matters are not within the Company's complete control and may not be known for prolonged periods of time. In some actions, claimants seek damages, as well as other relief, including injunctive relief, that could require significant expenditures or result in lost revenues. In accordance with applicable accounting standards, the Company records a liability in its consolidated financial statements for material loss contingencies when a loss is known or considered probable and the amount can be reasonably estimated. If the reasonable estimate of a known or probable loss is a range, and no amount within the range is a better estimate than any other, the minimum amount of the range is accrued. If a material loss contingency is reasonably possible but not known or probable, and can be reasonably estimated, the estimated loss or range of loss is disclosed in the notes to the consolidated financial statements. When determining the estimated loss or range of loss, significant judgment is required to estimate the amount and timing of a loss to be recorded. Estimates of probable losses resulting from litigation and governmental proceedings involving the Company are inherently difficult to predict, particularly when the matters are in early procedural stages, with incomplete facts or legal discovery; involve unsubstantiated or indeterminate claims for damages; potentially involve penalties, fines, disgorgement, or punitive damages; or could result in a change in business practice. See Note 20 in Item 8 for information on the Company’s legal proceedings.
Item 4. | MINE SAFETY DISCLOSURES |
None.
21
PART II
Item 5. | MARKET FOR REGISTRANT’S COMMON EQUITY, RELATED STOCKHOLDER MATTERS, AND ISSUER PURCHASES OF EQUITY SECURITIES |
Common Stock Market
The Company’s common stock is listed and traded on the New York Stock Exchange under the trading symbol “ADM”.
The number of registered stockholders of the Company’s common stock at December 31, 2019, was 9,148.
Issuer Purchases of Equity Securities
Period | Total Number of Shares Purchased (1) | Average Price Paid per Share | Total Number of Shares Purchased as Part of Publicly Announced Program (2) | Number of Shares Remaining to be Purchased Under the Program (2) | |||||||||
October 1, 2019 to October 31, 2019 | 194 | $ | 40.375 | 151 | 108,315,391 | ||||||||
November 1, 2019 to November 30, 2019 | 287 | 42.487 | 217 | 108,315,174 | |||||||||
December 1, 2019 to December 31, 2019 | 253 | 44.068 | 253 | 108,314,921 | |||||||||
Total | 734 | $ | 42.473 | 621 | 108,314,921 | ||||||||
(1) Total shares purchased represent those shares purchased in the open market as part of the Company’s publicly announced stock repurchase program described below, shares received as payment for the exercise price of stock option exercises, and shares received as payment for the withholding taxes on vested restricted stock awards. During the three-month period ended December 31, 2019, there were 113 shares received as payments for the exercise price of stock option exercises.
(2) On November 5, 2014, the Company’s Board of Directors approved a stock repurchase program authorizing the Company to repurchase up to 100,000,000 shares of the Company’s common stock during the period commencing January 1, 2015 and ending December 31, 2019. On August 7, 2019, the Company’s Board of Directors approved the extension of the stock repurchase program through December 31, 2024 and the repurchase of up to an additional 100,000,000 shares under the extended program.
22
Item 5. | MARKET FOR REGISTRANT’S COMMON EQUITY, RELATED STOCKHOLDER MATTERS, AND ISSUER PURCHASES OF EQUITY SECURITIES (Continued) |
Performance Graph
The graph below compares the Company’s common stock with those of the S&P 500 Index and the S&P Consumer Staples Index. The graph assumes an initial investment of $100 on December 31, 2014 and assumes all dividends have been reinvested through December 31, 2019.
COMPARISON OF 60 MONTH CUMULATIVE TOTAL RETURN
Among Archer Daniels Midland Company (ADM), the S&P 500 Index, and the S&P Consumer Staples Index
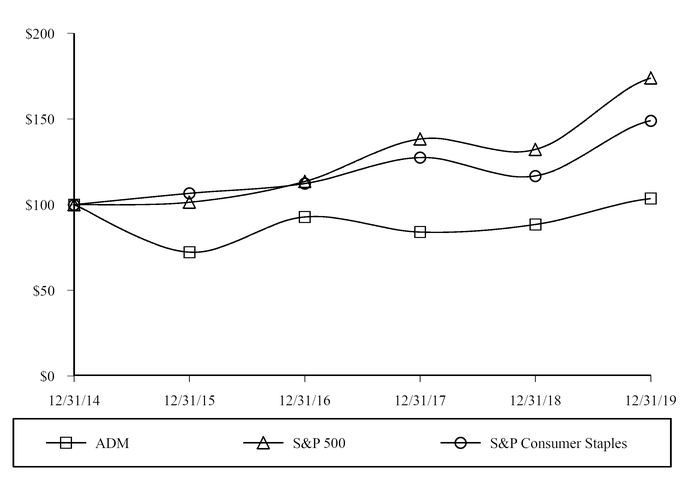
Index Data: Copyright© Standard and Poor's, Inc.
23
Item 6. | SELECTED FINANCIAL DATA |
Selected Financial Data
(In millions, except ratio and per share data)
Years Ended | |||||||||||||||||||
December 31 | |||||||||||||||||||
2019 | 2018 | 2017 | 2016 | 2015 | |||||||||||||||
Revenues | $ | 64,656 | $ | 64,341 | $ | 60,828 | $ | 62,346 | $ | 67,702 | |||||||||
Depreciation | 827 | 812 | 802 | 787 | 799 | ||||||||||||||
Net earnings attributable to controlling interests | 1,379 | 1,810 | 1,595 | 1,279 | 1,849 | ||||||||||||||
Basic earnings per common share | 2.45 | 3.21 | 2.80 | 2.18 | 2.99 | ||||||||||||||
Diluted earnings per common share | 2.44 | 3.19 | 2.79 | 2.16 | 2.98 | ||||||||||||||
Cash dividends | 789 | 758 | 730 | 701 | 687 | ||||||||||||||
Per common share | 1.40 | 1.34 | 1.28 | 1.20 | 1.12 | ||||||||||||||
Working capital | 7,613 | 8,812 | 7,355 | 7,872 | 8,324 | ||||||||||||||
Current ratio | 1.6 | 1.7 | 1.6 | 1.6 | 1.6 | ||||||||||||||
Inventories | 9,170 | 8,813 | 9,173 | 8,831 | 8,243 | ||||||||||||||
Net property, plant, and equipment | 10,106 | 9,953 | 10,138 | 9,758 | 9,853 | ||||||||||||||
Gross additions to property, plant, and equipment | 817 | 845 | 1,100 | 882 | 1,350 | ||||||||||||||
Total assets | 43,997 | 40,833 | 39,963 | 39,769 | 40,157 | ||||||||||||||
Long-term debt, excluding current maturities | 7,672 | 7,698 | 6,623 | 6,504 | 5,779 | ||||||||||||||
Shareholders’ equity | 19,225 | 18,996 | 18,322 | 17,181 | 17,915 | ||||||||||||||
Per common share | 34.52 | 33.98 | 32.89 | 29.98 | 30.11 | ||||||||||||||
Weighted average shares outstanding-basic | 563 | 564 | 569 | 588 | 618 | ||||||||||||||
Weighted average shares outstanding-diluted | 565 | 567 | 572 | 591 | 621 | ||||||||||||||
Significant items affecting the comparability of the financial data shown above are as follows:
• | Net earnings attributable to controlling interests for the year ended December 31, 2019 included a net loss of $89 million ($124 million after tax, equal to $0.22 per share) related to the loss on sale of an equity investment partially offset by gains on sale of certain assets and a step-up gain on an equity investment; charges of $305 million ($249 million after tax, equal to $0.44 per share) consisting of restructuring and pension settlement and remeasurement charges primarily related to early retirement and reorganization initiatives in Corporate and impairments related to certain long-lived assets; expenses of $17 million ($11 million after tax, equal to $0.02 per share) primarily related to the Neovia acquisition; and tax expense adjustments related to certain discrete items totaling $39 million (equal to $0.07 per share). |
24
Item 6. | SELECTED FINANCIAL DATA (Continued) |
• | Net earnings attributable to controlling interests for the year ended December 31, 2018 included net gains totaling $13 million ($13 million after tax, equal to $0.02 per share) related to the sale of businesses and assets; charges of $292 million ($226 million after tax, equal to $0.40 per share) consisting of a non-cash pension settlement charge related to the purchase of a group annuity contract that irrevocably transferred the future benefit obligations and annuity administration for certain retirees under the Company's ADM Retirement Plan, charges related to a discontinued software project, a long-term receivable, an equity investment, certain long-lived assets, and several individually insignificant asset impairment charges, restructuring charges in Corporate primarily related to the reorganization of IT services and several individually insignificant restructuring charges, and other settlement charges; charges of $8 million ($6 million after tax, equal to $0.01 per share) related to acquisition expenses and net losses on foreign currency derivative contracts to economically hedge certain acquisitions; and net tax benefits due to changes in the provisional transition tax amount related to the enactment of the Tax Cuts and Jobs Act and certain discrete items totaling $33 million (equal to $0.06 per share). |
• | Net earnings attributable to controlling interests for the year ended December 31, 2017 included gains totaling $22 million ($10 million after tax loss, equal to $0.02 per share) primarily related to the sale of the crop risk services business partially offset by an adjustment of the proceeds of the 2015 sale of the cocoa business; charges of $214 million ($144 million after tax, equal to $0.25 per share) consisting of asset impairments related to the reconfiguration of the Company’s Peoria, Illinois ethanol complex, restructuring charges related to the reduction of certain positions within the Company’s global workforce, several individually insignificant asset impairments and restructuring charges, and provisions for contingent losses related to certain settlement items; a debt extinguishment charge of $11 million ($7 million after tax, equal to $0.01 per share) related to the early redemption of the Company’s $559 million notes due on March 15, 2018; and net tax benefits related to the Tax Cuts and Jobs Act and certain discrete tax adjustments totaling $366 million (equal to $0.64 per share). |
• | Net earnings attributable to controlling interests for the year ended December 31, 2016 included gains totaling $119 million ($100 million after tax, equal to $0.17 per share) primarily related to recovery of loss provisions and gains related to the sale of the Company’s Brazilian sugar ethanol facilities, realized contingent consideration on the sale of the Company’s equity investment in Gruma S.A. de C.V. in December 2012, and revaluation of the remaining interest to settlement value in conjunction with the acquisition of Amazon Flavors; a gain of $38 million ($24 million after tax, equal to $0.04 per share) related to a U.S. retiree medical benefit plan curtailment; charges of $117 million ($77 million after tax, equal to $0.13 per share) primarily related to legal fees and settlement, impairment of software, investments, and certain long-lived assets; a $10 million ($8 million after tax, equal to $0.02 per share) loss on sale of individually immaterial assets; and certain discrete tax adjustments totaling $24 million (equal to $0.04 per share) related to valuation allowances, deferred tax re-rates, and changes in assertion. |
• | Net earnings attributable to controlling interests for the year ended December 31, 2015 included gains totaling $530 million ($515 million after tax, equal to $0.83 per share) related primarily to the sale of the cocoa, chocolate, and lactic businesses, revaluation of the Company’s previously held investments in North Star Shipping, Minmetal, and Eaststarch C.V. in conjunction with the acquisition of the remaining interests, and the sale of a 50% interest in the Barcarena export terminal facility in Brazil to Glencore plc; long-lived asset impairment charges of $129 million ($109 million after tax, equal to $0.18 per share) related primarily to certain international Oilseeds Processing facilities, sugar ethanol facilities in Brazil, and goodwill, intangible, and property, plant, and equipment asset impairments; restructuring and exit charges of $71 million ($63 million after tax, equal to $0.10 per share) related to an international pension plan settlement, sugar ethanol facilities in Brazil, and other restructuring charges; loss provisions, settlements, and inventory writedown of $67 million ($58 million after tax, equal to $0.09 per share); certain discrete tax adjustments totaling $60 million (equal to $0.10 per share) related to valuation allowances and deferred tax re-rates; and loss on debt extinguishment of $189 million ($118 million after tax, equal to $0.19 per share) related to the cash tender offers and redemption of certain of the Company’s outstanding debentures. |
25
Item 7. | MANAGEMENT’S DISCUSSION AND ANALYSIS OF FINANCIAL CONDITION AND RESULTS OF OPERATIONS |
Company Overview
This MD&A should be read in conjunction with the accompanying consolidated financial statements.
ADM is a global leader in human and animal nutrition and one of the world’s premier agricultural origination and processing company. It is one of the world’s leading producers of ingredients for human and animal nutrition, and other products made from nature. The Company uses its significant global asset base to originate and transport agricultural commodities, connecting to markets in more than 190 countries. The Company also processes corn, oilseeds, and wheat into products for food, animal feed, chemical and energy uses. The Company also engages in the manufacturing, sale, and distribution of specialty products including natural flavor ingredients, flavor systems, natural colors, proteins, emulsifiers, soluble fiber, polyols, hydrocolloids, natural health and nutrition products, and other specialty food and feed ingredients. The Company uses its global asset network, business acumen, and its relationships with suppliers and customers to efficiently connect the harvest to the home thereby generating returns for our shareholders, principally from margins earned on these activities.
Effective July 1, 2019, the Company changed its segment reporting to reflect the creation of the combined Ag Services and Oilseeds segment. The former Origination and Oilseeds businesses were merged into a combined Ag Services and Oilseeds segment which enables the Company to better respond to market changes by integrating the supply and value chains and risk management, while delivering significant simplification and efficiency to the day-to-day business. As part of the Company’s efforts for a streamlined management structure, the combined segment is led by the former President of Oilseeds expanding his role to President of Ag Services and Oilseeds.
Prior period results have been reclassified to conform to the current period segment presentation.
The Company’s operations are organized, managed, and classified into three reportable business segments: Ag Services and Oilseeds, Carbohydrate Solutions, and Nutrition. Each of these segments is organized based upon the nature of products and services offered. The Company’s remaining operations are not reportable business segments, as defined by the applicable accounting standard, and are classified as Other. Financial information with respect to the Company’s reportable business segments is set forth in Note 17 of “Notes to Consolidated Financial Statements” included in Item 8 herein, “Financial Statements and Supplementary Data” (Item 8).
The Company’s recent significant portfolio actions and announcements include:
• | the acquisition in February 2019 of Neovia, a French-based global provider of value-added animal nutrition solutions, with 72 production facilities and a presence in 25 countries; |
• | the purchase in February 2019 of the remaining 50% interest owned by InVivo Group in the Gleadell Agriculture Ltd. joint venture in the United Kingdom; |
• | the acquisition in March 2019 of FCC, one of the world’s largest producers of citrus oils and ingredients; |
• | the formal launch in March 2019 of GrainBridge LLC, a 50% joint venture with Cargill that will develop digital tools to help North American farmers consolidate information on production economics and grain marketing activities into a single digital platform; |
• | the acquisition in May 2019 of Ziegler, a leading European provider of natural citrus flavor ingredients; |
• | the sale in December 2019 of its equity investment in CIP; and |
• | the acquisition in January 2020 of Yerbalatina, a natural plant-based extracts and ingredients manufacturer in Brazil. |
The Company executes its strategic vision through three pillars: Optimize the Core, Drive Efficiencies, and Expand Strategically, all supported by its Readiness effort. During 2018, the Company launched Readiness to drive new efficiencies and improve the customer experience in the Company’s existing businesses through a combination of data and analytics, process simplification and standardization, and behavioral and cultural change, building upon its earlier 1ADM and operational excellence programs. Readiness will also support the execution of the Company's growth strategies across its five key growth platforms: Taste, Nutrition, Animal Nutrition, Health and Wellness, and Carbohydrates.
26
Item 7. | MANAGEMENT’S DISCUSSION AND ANALYSIS OF FINANCIAL CONDITION AND RESULTS OF OPERATIONS (Continued) |
Operating Performance Indicators
The Company’s Ag Services and Oilseeds operations are principally agricultural commodity-based businesses where changes in selling prices move in relationship to changes in prices of the commodity-based agricultural raw materials. As a result, changes in agricultural commodity prices have relatively equal impacts on both revenues and cost of products sold. Therefore, changes in revenues of these businesses do not necessarily correspond to the changes in margins or gross profit. Thus, gross margins per volume or metric ton are more meaningful than gross margins as percentage of revenues.
The Company’s Carbohydrate Solutions operations and Nutrition businesses also utilize agricultural commodities (or products derived from agricultural commodities) as raw materials. However, in these operations, agricultural commodity market price changes do not necessarily correlate to changes in cost of products sold. Therefore, changes in revenues of these businesses may correspond to changes in margins or gross profit. Thus, gross margin rates are more meaningful as a performance indicator in these businesses.
The Company has consolidated subsidiaries in more than 70 countries. For the majority of the Company’s subsidiaries located outside the United States, the local currency is the functional currency except certain significant subsidiaries in Switzerland where Euro is the functional currency, and Brazil and Argentina where U.S. dollar is the functional currency. Revenues and expenses denominated in foreign currencies are translated into U.S. dollars at the weighted average exchange rates for the applicable periods. For the majority of the Company’s business activities in Brazil and Argentina, the functional currency is the U.S. dollar; however, certain transactions, including taxes, occur in local currency and require remeasurement to the functional currency. Changes in revenues are expected to be correlated to changes in expenses reported by the Company caused by fluctuations in the exchange rates of foreign currencies, primarily the Euro, British pound, Canadian dollar, and Brazilian real, as compared to the U.S. dollar.
The Company measures its performance using key financial metrics including net earnings, gross margins, segment operating profit, return on invested capital, EBITDA, economic value added, manufacturing expenses, and selling, general, and administrative expenses. The Company’s financial results can vary significantly due to changes in factors such as fluctuations in energy prices, weather conditions, crop plantings, government programs and policies, trade policies, changes in global demand, general global economic conditions, changes in standards of living, and global production of similar and competitive crops. Due to these unpredictable factors, the Company undertakes no responsibility for updating any forward-looking information contained within “Management’s Discussion and Analysis of Financial Condition and Results of Operations.”
27
Item 7. | MANAGEMENT’S DISCUSSION AND ANALYSIS OF FINANCIAL CONDITION AND RESULTS OF OPERATIONS (Continued) |
Market Factors Influencing Operations or Results in the Twelve Months Ended December 31, 2019
The Company is subject to a variety of market factors which affect the Company's operating results. In Ag Services and Oilseeds, sales volumes and margins were negatively impacted by challenging North American weather conditions, in particular high water in the Mississippi river system in the first half of the year, and the continuing global trade tensions with China. Handling volumes in North America were impacted by the late harvest as planting was delayed due to spring flooding. Continued good global meal demand resulted in strong global crushing volumes and solid margins. South American origination volumes benefited from the U.S.-China trade dispute but were also impacted by softer Chinese demand due to the African swine fever impact on local feed demand and intermittent farmer selling. Global demand and margins for refined oil and biodiesel remained solid. In Carbohydrate Solutions, demand and prices for sweeteners and starches remained solid in North America while co-product prices were stable. Although ethanol demand remained steady in North America, margins were severely pressured as U.S. industry ethanol production and stocks remained at high levels and U.S. exports to China ceased during the trade dispute. The severe weather conditions in North America also adversely impacted operations in the Carbohydrate Solutions business unit. Nutrition benefited from growing demand for flavors, flavors systems, human and pet health and wellness products, and plant-based proteins but was negatively impacted by the African swine fever in Asia Pacific, which also resulted in pricing pressures in the global lysine market.
Year Ended December 31, 2019 Compared to Year Ended December 31, 2018
Net earnings attributable to controlling interests decreased 24% or $0.4 billion, to $1.4 billion. Segment operating profit decreased 10% or $0.3 billion, to $2.9 billion, and included a net charge of $134 million consisting of asset impairment, restructuring, and settlement charges, gains on sale of certain assets, and a step-up gain on an equity investment. Included in segment operating profit in the prior year was a net charge of $89 million consisting of asset impairment, restructuring, and settlement charges and a net gain on sales of assets and businesses. Adjusted segment operating profit decreased $0.3 billion to $3.1 billion due to lower results in Ag Services, Crushing, and Carbohydrate Solutions, and lower equity earnings from Wilmar, partially offset by higher results in Refined Products and Other and Nutrition. Refined Products and Other in the current year included $270 million related to the biodiesel tax credit for 2018 and 2019 compared to $120 million for 2017 recorded in the prior year. Corporate results were a net charge of $1.4 billion in the current year, and included restructuring and pension settlement and remeasurement charges of $159 million primarily related to early retirement and reorganization initiatives, a loss on sale of the Company's equity investment in CIP of $101 million, and a charge of $37 million from the effect of changes in agricultural commodity prices on last-in, first-out (LIFO) inventory valuation reserves, compared to a credit of $18 million in the prior year. Corporate results in the prior year of $1.2 billion included a pension settlement charge of $117 million, a $49 million charge related to a discontinued software project, and restructuring charges of $24 million primarily related to the reorganization of IT services.
Income taxes of $209 million decreased $36 million. The Company’s effective tax rate for 2019 was 13.2% compared to 11.9% for 2018. The low 2019 tax rate was primarily due to the impact of U.S. tax credits, including the 2018 and 2019 biodiesel tax credit and the railroad maintenance tax credit, signed into law in December 2019. The effective tax rate for 2018 included the 2017 biodiesel tax credit recorded in the first quarter of 2018 and the additional true-up adjustments related to the 2017 U.S. tax reform, along with certain favorable discrete tax items netting to a favorable $74 million.
Analysis of Statements of Earnings
Processed volumes by product for the years ended December 31, 2019 and 2018 are as follows (in metric tons):
(In thousands) | 2019 | 2018 | Change | |||||
Oilseeds | 36,271 | 36,308 | — | % | ||||
Corn | 22,079 | 22,343 | (1 | )% | ||||
Total | 58,350 | 58,651 | (1 | )% | ||||
The Company generally operates its production facilities, on an overall basis, at or near capacity, adjusting facilities individually, as needed, to react to local supply and demand conditions. Processed volumes of Corn decreased slightly from the prior year levels primarily related to the production disruptions in the Columbus, Nebraska corn processing plant due to flooding and production issues in the Decatur, Illinois corn complex.
28
Item 7. | MANAGEMENT’S DISCUSSION AND ANALYSIS OF FINANCIAL CONDITION AND RESULTS OF OPERATIONS (Continued) |
Revenues by segment for the years ended December 31, 2019 and 2018 are as follows:
(In millions) | 2019 | 2018 | Change | ||||||||
Ag Services and Oilseeds | |||||||||||
Ag Services | $ | 31,705 | $ | 31,766 | $ | (61 | ) | ||||
Crushing | 9,479 | 10,319 | (840 | ) | |||||||
Refined Products and Other | 7,557 | 7,806 | (249 | ) | |||||||
Total Ag Services and Oilseeds | 48,741 | 49,891 | (1,150 | ) | |||||||
Carbohydrate Solutions | |||||||||||
Starches and Sweeteners | 6,692 | 6,696 | (4 | ) | |||||||
Bioproducts | 3,194 | 3,583 | (389 | ) | |||||||
Total Carbohydrate Solutions | 9,886 | 10,279 | (393 | ) | |||||||
Nutrition | |||||||||||
Wild Flavors and Specialty Ingredients | 2,745 | 2,571 | 174 | ||||||||
Animal Nutrition | 2,932 | 1,219 | 1,713 | ||||||||
Total Nutrition | 5,677 | 3,790 | 1,887 | ||||||||
Other | 352 | 381 | (29 | ) | |||||||
Total Other | 352 | 381 | (29 | ) | |||||||
Total | $ | 64,656 | $ | 64,341 | $ | 315 | |||||
Revenues and cost of products sold in agricultural merchandising and processing businesses are significantly correlated to the underlying commodity prices and volumes. In periods of significant changes in market prices, the underlying performance of the Company is better evaluated by looking at margins since both revenues and cost of products sold, particularly in Ag Services and Oilseeds, generally have a relatively equal impact from market price changes which generally result in an insignificant impact to gross profit.
Revenues increased $315 million to $64.7 billion due to overall higher sales volumes ($3.2 billion), partially offset by lower sales prices ($2.9 billion). The increase in sales volumes was due principally to soybeans, wheat, cotton, and higher sales volumes of feed ingredients related to acquisitions. The decrease in sales prices was due principally to soybeans, meal, and wheat. Ag Services and Oilseeds revenues decreased 2% to $48.7 billion due to lower sales prices ($3.0 billion), partially offset by higher sales volumes ($1.8 billion). Carbohydrate Solutions revenues decreased 4% to $9.9 billion due to lower sales volumes ($0.4 billion). Nutrition revenues increased 50% to $5.7 billion due to higher sales volumes ($1.8 billion), primarily related to acquisitions and higher sales prices ($0.1 billion).
Cost of products sold increased $0.3 billion to $60.5 billion due to overall higher sales volumes, partially offset by lower prices of commodities. Included in cost of products sold in the current year was a charge of $37 million from the effect of changes in agricultural commodity prices on LIFO inventory valuation reserves compared to a credit of $18 million in the prior year. Manufacturing expenses increased $0.3 billion to $5.7 billion due principally to new acquisitions.
Foreign currency translation impacts decreased both revenues and cost of products sold by $0.8 billion.
Gross profit decreased $34 million or 1%, to $4.1 billion. Lower results in Ag Services and Oilseeds ($40 million), Carbohydrate Solutions ($301 million), and Other ($6 million) were offset by higher results in Nutrition ($400 million). These factors are explained in the discussions of segment operating profit on page 32 and selling, general, and administrative expenses below. The effect of changes in agricultural commodity prices on LIFO inventory valuation reserves had a negative impact on gross profit of $37 million compared to a positive impact of $18 million in the prior year.
29
Item 7. | MANAGEMENT’S DISCUSSION AND ANALYSIS OF FINANCIAL CONDITION AND RESULTS OF OPERATIONS (Continued) |
Selling, general, and administrative expenses increased 15% to $2.5 billion due principally to new acquisitions, primarily in the Nutrition segment, and higher spending on IT, business transformation, growth-related investments, and Readiness-related projects, partially offset by lower variable performance-related and stock compensation expenses.
Asset impairment, exit, and restructuring costs increased $132 million to $303 million. Current year charges consisted of asset impairments of $131 million related to certain facilities, vessels, and other long-lived assets and $11 million related to goodwill and other intangible assets presented as specified items within segment operating profit and $159 million of restructuring and pension settlement and remeasurement charges in Corporate primarily related to early retirement and reorganization initiatives and several individually insignificant restructuring charges presented as specified items within segment operating profit. Prior year charges totaling $171 million consisted of $56 million of impairment of certain long-lived assets, a $12 million impairment of an equity investment, a $21 million impairment related to a long-term financing receivable, and $9 million of other individually insignificant impairment and restructuring charges presented as specified items within segment operating profit, and a $49 million charge related to a discontinued software project, $18 million of restructuring charges related to the reorganization of IT services and $6 million individually insignificant restructuring charges in Corporate.
Interest expense increased $38 million to $402 million due to higher borrowings to fund recent acquisitions, partially offset by lower interest rates.
Equity in earnings of unconsolidated affiliates decreased $64 million to $454 million due to lower earnings from the Company’s investments in Wilmar and CIP, partially offset by higher earnings from the Company’s investments in Olenex and other equity investees.
Other expense - net of $7 million decreased $94 million. Current year expense included a loss on sale of the Company's equity investment in CIP and foreign exchange loss, partially offset by gains on the sale of certain assets, step-up gains on equity investments, gains on disposals of individually insignificant assets in the ordinary course of business, and other income. Prior year expense included foreign exchange losses and a non-cash pension settlement charge of $117 million related to the purchase of a group annuity contract that irrevocably transferred the future benefit obligations and annuity administration for certain U.S. salaried retirees under the Company's ADM Retirement Plan. These expenses were partially offset by gains on disposals of businesses, an equity investment, and individually insignificant assets in the ordinary course of business, and other income.
30
Item 7. | MANAGEMENT’S DISCUSSION AND ANALYSIS OF FINANCIAL CONDITION AND RESULTS OF OPERATIONS (Continued) |
Segment operating profit, adjusted segment operating profit (a non-GAAP measure), and earnings before income taxes for the years ended December 31, 2019 and 2018 are as follows:
Segment Operating Profit | 2019 | 2018 | Change | ||||||||
(In millions) | |||||||||||
Ag Services and Oilseeds | |||||||||||
Ag Services | $ | 502 | $ | 657 | $ | (155 | ) | ||||
Crushing | 580 | 650 | (70 | ) | |||||||
Refined Products and Other | 586 | 370 | 216 | ||||||||
Wilmar | 267 | 343 | (76 | ) | |||||||
Total Ag Services and Oilseeds | 1,935 | 2,020 | (85 | ) | |||||||
Carbohydrate Solutions | |||||||||||
Starches and Sweeteners | 803 | 894 | (91 | ) | |||||||
Bioproducts | (159 | ) | 51 | (210 | ) | ||||||
Total Carbohydrate Solutions | 644 | 945 | (301 | ) | |||||||
Nutrition | |||||||||||
Wild Flavors and Specialty Ingredients | 376 | 318 | 58 | ||||||||
Animal Nutrition | 42 | 21 | 21 | ||||||||
Total Nutrition | 418 | 339 | 79 | ||||||||
Other | 85 | 58 | 27 | ||||||||
Total Other | 85 | 58 | 27 | ||||||||
Specified Items: | |||||||||||
Gains on sales of assets and businesses | 12 | 13 | (1 | ) | |||||||
Impairment, restructuring, and settlement charges | (146 | ) | (102 | ) | (44 | ) | |||||
Total Specified Items | (134 | ) | (89 | ) | (45 | ) | |||||
Total Segment Operating Profit | $ | 2,948 | $ | 3,273 | $ | (325 | ) | ||||
Adjusted Segment Operating Profit(1) | $ | 3,082 | $ | 3,362 | $ | (280 | ) | ||||
Segment Operating Profit | $ | 2,948 | $ | 3,273 | $ | (325 | ) | ||||
Corporate | (1,360 | ) | (1,213 | ) | (147 | ) | |||||
Earnings Before Income Taxes | $ | 1,588 | $ | 2,060 | $ | (472 | ) | ||||
(1) Adjusted segment operating profit is segment operating profit excluding the listed specified items.
31
Item 7. | MANAGEMENT’S DISCUSSION AND ANALYSIS OF FINANCIAL CONDITION AND RESULTS OF OPERATIONS (Continued) |
Ag Services and Oilseeds operating profit decreased 4%. Ag Services results were lower due to weaker North American grain margins and lower volumes, in part due to challenging weather conditions and the U.S.-China trade tensions. Results in the current period were negatively impacted by high water conditions in the first half of the year, which limited grain movement and sales in North America. Slow farmer selling and lower Chinese demand of South American origination, in part due to African swine fever, also impacted results. Crushing results were strong but down compared to the prior year. Lower executed crush margins around the globe drove lower results, partially offset by favorable timing effects of approximately $102 million from hedges entered in the prior year. Refined Products and Other results were up compared to the prior period primarily due to the retroactive biodiesel tax credit of $270 million for 2018 and 2019 recorded in the current year compared to $120 million for 2017 recorded in the prior year, strong demand, and higher results from equity investments. Wilmar results were lower year over year.
Carbohydrate Solutions operating profit decreased 32%. Starches and Sweeteners results were down primarily due to lower results in EMEA where margins were pressured due to low sugar prices and the Turkish quota on starch-based sweeteners. Higher manufacturing costs at the Decatur, IL complex and weaker margins in flour milling also contributed to the decrease. Bioproducts results were down due to significantly lower ethanol margins amid a continued unfavorable ethanol industry environment, exacerbated by the lack of Chinese demand for ethanol due to the U.S.-China trade dispute.
Nutrition operating profit increased 23%. Wild Flavors and Specialty Ingredients results were higher year over year on strong sales and margin growth in North America and Europe, Middle East, Africa, and India (EMEAI) and contributions from acquisitions. Animal Nutrition results were up driven largely by contributions from the acquisition of Neovia, partially offset by additional expenses related to inventory valuation of newly-acquired Neovia and weaker lysine results.
Other operating profit increased 47% primarily due to improved results from the Company's futures commission brokerage business and captive insurance underwriting performance.
Corporate results are as follows:
(In millions) | 2019 | 2018 | Change | ||||||||
LIFO credit (charge) | $ | (37 | ) | $ | 18 | $ | (55 | ) | |||
Interest expense - net | (348 | ) | (321 | ) | (27 | ) | |||||
Unallocated corporate costs | (647 | ) | (660 | ) | 13 | ||||||
Loss on sale of asset | (101 | ) | — | (101 | ) | ||||||
Expenses related to acquisitions | (17 | ) | (8 | ) | (9 | ) | |||||
Impairment, restructuring, and settlement charges | (159 | ) | (190 | ) | 31 | ||||||
Other charges | (51 | ) | (52 | ) | 1 | ||||||
Total Corporate | $ | (1,360 | ) | $ | (1,213 | ) | $ | (147 | ) | ||
Corporate results were a net charge of $1.4 billion in the current year compared to $1.2 billion in the prior year. The effect of changes in agricultural commodity prices on LIFO inventory valuation reserves resulted in a charge of $37 million in the current year compared to a credit of $18 million in the prior year. Interest expense - net increased $27 million due to higher borrowings to fund recent acquisitions, partially offset by interest savings from cross-currency swaps. Unallocated corporate costs decreased $13 million due principally to decreased performance-related compensation accruals partially offset by higher spending on IT, business transformation, growth-related investments, and Readiness-related projects. Loss on sale of asset related to the sale of the Company's equity investment in CIP. Expenses related to acquisitions in the current year consisted of expenses primarily related to the Neovia acquisition compared to prior year’s expenses and losses on foreign currency derivative contracts entered into to economically hedge certain acquisitions. Impairment, restructuring, and settlement charges in the current year included restructuring and pension settlement and remeasurement charges related to early retirement and reorganization initiatives. Impairment, restructuring, and settlement charges in the prior year included pension settlement charge of $117 million related to the purchase of a group annuity contract that irrevocably transferred the future benefit obligations and annuity administration for certain U.S. salaried retirees under the Company's ADM Retirement Plan, a $49 million charge related to a discontinued software project, and restructuring charges of $24 million primarily related to the reorganization of IT services. Other charges in the current year included railroad maintenance expenses of $51 million. Other charges in the prior year included foreign exchange losses which were partially offset by earnings from the Company's equity investment in CIP.
32
Item 7. | MANAGEMENT’S DISCUSSION AND ANALYSIS OF FINANCIAL CONDITION AND RESULTS OF OPERATIONS (Continued) |
Non-GAAP Financial Measures
The Company uses adjusted earnings per share (EPS), adjusted earnings before taxes, interest, and depreciation and amortization (EBITDA), and adjusted segment operating profit, non-GAAP financial measures as defined by the SEC, to evaluate the Company’s financial performance. These performance measures are not defined by accounting principles generally accepted in the United States and should be considered in addition to, and not in lieu of, GAAP financial measures.
Adjusted EPS is defined as diluted EPS adjusted for the effects on reported diluted EPS of specified items. Adjusted EBITDA is defined as earnings before taxes, interest, and depreciation and amortization, adjusted for specified items. The Company calculates adjusted EBITDA by removing the impact of specified items and adding back the amounts of interest expense and depreciation and amortization to earnings before income taxes. Adjusted segment operating profit is segment operating profit adjusted, where applicable, for specified items.
Management believes that adjusted EPS, adjusted EBITDA, and adjusted segment operating profit are useful measures of the Company’s performance because they provide investors additional information about the Company's operations allowing better evaluation of underlying business performance and better period-to-period comparability. Adjusted EPS, adjusted EBITDA, and adjusted segment operating profit are not intended to replace or be an alternative to diluted EPS, earnings before income taxes, and segment operating profit, respectively, the most directly comparable amounts reported under GAAP.
The table below provides a reconciliation of diluted EPS to adjusted EPS for the years ended December 31, 2019 and 2018.
2019 | 2018 | ||||||||||||
In millions | Per share | In millions | Per share | ||||||||||
Average number of shares outstanding - diluted | 565 | 567 | |||||||||||
Net earnings and reported EPS (fully diluted) | $ | 1,379 | $ | 2.44 | $ | 1,810 | $ | 3.19 | |||||
Adjustments: | |||||||||||||
LIFO charge (credit) (net of tax of $9 million in 2019 and $4 million in 2018) (1) | 28 | 0.05 | (14 | ) | (0.02 | ) | |||||||
(Gains) Losses on sales of assets and businesses (after tax of $35 million in 2019 and $0 million in 2018) (2) | 124 | 0.22 | (13 | ) | (0.02 | ) | |||||||
Asset impairment, restructuring, and settlement charges (net of tax of $56 million in 2019 and $66 million in 2018) (2) | 249 | 0.44 | 226 | 0.40 | |||||||||
Expenses related to acquisitions (net of tax of $6 million in 2019 and $2 million in 2018) (2) | 11 | 0.02 | 6 | 0.01 | |||||||||
Tax adjustments (3) | 39 | 0.07 | (33 | ) | (0.06 | ) | |||||||
Adjusted net earnings and adjusted EPS | $ | 1,830 | $ | 3.24 | $ | 1,982 | $ | 3.50 | |||||
(1) Tax effected using the Company’s U.S. tax rate.
(2) Tax effected using the applicable tax rates.
(3) Includes tax adjustments related to the U.S. Tax Cuts and Jobs Act and other discrete items.
33
Item 7. | MANAGEMENT’S DISCUSSION AND ANALYSIS OF FINANCIAL CONDITION AND RESULTS OF OPERATIONS (Continued) |
The tables below provide a reconciliation of earnings before income taxes to adjusted EBITDA and adjusted EBITDA by segment for the years ended December 31, 2019 and 2018.
(In millions) | 2019 | 2018 | Change | ||||||||
Earnings before income taxes | $ | 1,588 | $ | 2,060 | $ | (472 | ) | ||||
Interest expense | 402 | 364 | 38 | ||||||||
Depreciation and amortization | 993 | 941 | 52 | ||||||||
LIFO charge (credit) | 37 | (18 | ) | 55 | |||||||
(Gains) Losses on sales of assets and businesses | 89 | (13 | ) | 102 | |||||||
Asset impairment, restructuring, and settlement charges | 305 | 292 | 13 | ||||||||
Railroad maintenance expense | 51 | — | 51 | ||||||||
Expenses related to acquisitions | 17 | 8 | 9 | ||||||||
Adjusted EBITDA | $ | 3,482 | $ | 3,634 | $ | (152 | ) | ||||
(In millions) | 2019 | 2018 | Change | ||||||||
Ag Services and Oilseeds | $ | 2,311 | $ | 2,410 | (99 | ) | |||||
Carbohydrate Solutions | 974 | 1,282 | (308 | ) | |||||||
Nutrition | 642 | 486 | 156 | ||||||||
Other | 117 | 92 | 25 | ||||||||
Corporate | (562 | ) | (636 | ) | 74 | ||||||
Adjusted EBITDA | $ | 3,482 | $ | 3,634 | $ | (152 | ) | ||||
34
Item 7. | MANAGEMENT’S DISCUSSION AND ANALYSIS OF FINANCIAL CONDITION AND RESULTS OF OPERATIONS (Continued) |
Market Factors Influencing Operations or Results in the Twelve Months Ended December 31, 2018
The Company is subject to a variety of market factors which affect the Company's operating results. In 2018, markets were volatile amid escalating global trade tensions including the announcement of tariffs on Chinese imports of U.S. soybeans. In Ag Services and Oilseeds, strong demand for feedstuffs in light of weather conditions in Northern Europe resulted in higher sales volumes and margins in destination markets, and strong basis positions across commodities resulted in higher margins. South American origination volumes and margins benefited from stronger farmer selling. Dry conditions in Argentina resulted in a smaller soybean crop, which combined with continued good global meal demand, resulted in strong global crushing margins and volumes. Demand and margins for refined oil remained solid, and biodiesel margins improved. Excess global peanut supply resulted in weak peanut margins. In Carbohydrate Solutions, global demand and prices for starches and sweeteners remained solid in North America while co-product prices were stable. U.S. ethanol industry production remained at high levels. Although ethanol demand remained strong both in North America and export markets due to favorable gasoline blending economics and ethanol's continuing status as a competitive octane enhancer, margins continued to remain under pressure. Nutrition benefited from strong demand for flavor ingredients and flavor systems and from strong demand for and favorable margin development in certain non-flavor food businesses.
Year Ended December 31, 2018 Compared to Year Ended December 31, 2017
Net earnings attributable to controlling interests increased 13% or $0.2 billion, to $1.8 billion. Segment operating profit increased 29% or $0.7 billion, to $3.3 billion. Included in segment operating profit in 2018 was a net charge of $89 million consisting of asset impairment, restructuring, and settlement charges and a net gain on sales of assets and businesses. Included in segment operating profit in 2017 was a net charge of $134 million consisting of asset impairment and restructuring charges, a net gain on sales of assets and businesses, and corn hedge timing effects. Adjusted segment operating profit increased $0.7 billion to $3.4 billion due to an increase in sales prices and volumes of corn and meal, improved margins in Ag Services and Oilseeds and Nutrition, and the benefits of the 2017 biodiesel tax credit which was approved and received in the first quarter of 2018, partially offset by lower ethanol margins. Corporate results were a net charge of $1.2 billion in 2018 compared to $0.9 billion in 2017. Corporate results in 2018 included a pension settlement charge of $117 million, a $49 million charge related to a discontinued software project, restructuring charges of $24 million primarily related to the reorganization of IT services, and a credit of $18 million from the effect of changes in agricultural commodity prices on LIFO inventory valuation reserves, compared to a credit of $2 million in 2017. Corporate results in 2017 also included $54 million of restructuring charges primarily related to the reduction of certain positions within the Company's global workforce.
Income taxes of $245 million increased $238 million due to a higher effective tax rate and higher earnings before income taxes. The Company’s effective tax rate for 2018 increased to 11.9% compared to 0.4% for 2017 due primarily to the low rate in 2017 that was impacted by favorable tax adjustments related to the Tax Cuts and Jobs Act of 2017 totaling $379 million. The effective tax rate for 2018 also included the final effects of the U.S. tax reform and the 2017 biodiesel tax credit recorded in the first quarter of 2018, along with certain favorable discrete tax items netting to a favorable $74 million.
Analysis of Statements of Earnings
Processed volumes by product for the years ended December 31, 2018 and 2017 are as follows (in metric tons):
(In thousands) | 2018 | 2017 | Change | |||||
Oilseeds | 36,308 | 34,733 | 5 | % | ||||
Corn | 22,343 | 22,700 | (2 | )% | ||||
Total | 58,651 | 57,433 | 2 | % | ||||
The Company generally operates its production facilities, on an overall basis, at or near capacity, adjusting facilities individually, as needed, to react to local supply and demand conditions. Processed volumes of oilseeds increased due to increasing global demand for oilseed products, particularly meal, and higher crushing volumes in North America due to the reduced soybean crop in Argentina. The overall decrease in corn is primarily related to decreased current year processing after the reconfiguration of the Company’s Peoria, Illinois ethanol complex in the third quarter of fiscal 2017 and production issues in the Decatur, Illinois corn complex in 2018.
35
Item 7. | MANAGEMENT’S DISCUSSION AND ANALYSIS OF FINANCIAL CONDITION AND RESULTS OF OPERATIONS (Continued) |
Revenues by segment for the years ended December 31, 2018 and 2017 are as follows:
(In millions) | 2018 | 2017 | Change | ||||||||
Ag Services and Oilseeds | |||||||||||
Ag Services | $ | 31,766 | $ | 29,124 | $ | 2,642 | |||||
Crushing | 10,319 | 9,265 | 1,054 | ||||||||
Refined Products and Other | 7,806 | 8,123 | (317 | ) | |||||||
Total Ag Services and Oilseeds | 49,891 | 46,512 | 3,379 | ||||||||
Carbohydrate Solutions | |||||||||||
Starches and Sweeteners | 6,696 | 6,565 | 131 | ||||||||
Bioproducts | 3,583 | 3,841 | (258 | ) | |||||||
Total Carbohydrate Solutions | 10,279 | 10,406 | (127 | ) | |||||||
Nutrition | |||||||||||
Wild Flavors and Specialty Ingredients | 2,571 | 2,367 | 204 | ||||||||
Animal Nutrition | 1,219 | 1,156 | 63 | ||||||||
Total Nutrition | 3,790 | 3,523 | 267 | ||||||||
Other | 381 | 387 | (6 | ) | |||||||
Total Other | 381 | 387 | (6 | ) | |||||||
Total | $ | 64,341 | $ | 60,828 | $ | 3,513 | |||||
Revenues and cost of products sold in commodity merchandising and processing businesses are significantly correlated to the underlying commodity prices and volumes. In periods of significant changes in commodity prices, the underlying performance of the Company is better evaluated by looking at margins since both revenues and cost of products sold, particularly in Ag Services and Oilseeds, generally have a relatively equal impact from commodity price changes which generally result in an insignificant impact to gross profit.
Revenues increased $3.5 billion or 6%, to $64.3 billion due principally to higher sales prices ($2.3 billion) and higher sales volumes ($1.2 billion). The increase in sales prices and volumes was due primarily to increases in corn and soybean meal. Ag Services and Oilseeds revenues increased 7% to $49.9 billion due to higher sales prices ($2.5 billion) and higher sales volumes ($0.8 billion). Carbohydrate Solutions revenues decreased 1% to $10.3 billion due to lower sales prices ($0.2 billion), partially offset by higher sales volumes ($0.1 billion). Nutrition revenues increased 8% to $3.8 billion due to higher sales volumes ($0.3 billion).
Cost of products sold increased $2.9 billion to $60.2 billion due principally to higher sales volumes and higher prices for commodities. Included in cost of products sold in 2018 was a credit of $18 million from the effect of changes in agricultural commodity prices on LIFO inventory valuation reserves compared to $2 million in 2017. Manufacturing expenses increased $0.2 billion to $5.4 billion due principally to increased energy cost, railroad maintenance expense that has an offsetting benefit in income tax expense, and other individually insignificant increases in certain expense categories.
Foreign currency translation impacts increased both revenues and cost of products sold by $0.4 billion.
Gross profit increased $0.7 billion or 19%, to $4.2 billion. Higher results in Ag Services and Oilseeds ($815 million) and Nutrition ($58 million) were partially offset by lower results in Carbohydrate Solutions ($126 million) and Other ($36 million). These factors are explained in the segment operating profit discussion on page 39. The effect of changes in agricultural commodity prices on LIFO inventory valuation reserves had a positive impact on gross profit of $18 million in 2018 compared to $2 million in 2017.
36
Item 7. | MANAGEMENT’S DISCUSSION AND ANALYSIS OF FINANCIAL CONDITION AND RESULTS OF OPERATIONS (Continued) |
Selling, general, and administrative expenses increased 9% to $2.2 billion due principally to higher performance-related compensation accruals and increased pension and project-related expenses.
Asset impairment, exit, and restructuring costs decreased $2 million to $171 million. Charges in 2018 consisted of $56 million of impairment of certain long-lived assets, a $12 million impairment of an equity investment, a $21 million impairment related to a long-term financing receivable, and $9 million of other individually insignificant impairment and restructuring charges (presented as specified items within segment operating profit), and a $49 million charge related to a discontinued software project, $18 million of restructuring charges related to the reorganization of IT services and $6 million of individually insignificant restructuring charges in Corporate. Charges in 2017 consisted of $63 million of asset impairments related to the reconfiguration of the Company's Peoria, Illinois ethanol complex, $20 million of asset impairments related to the closure of a facility, and $36 million of several individually insignificant asset impairments and restructuring charges presented as specified items within segment operating profit, and $54 million of restructuring charges in Corporate primarily related to the reduction of certain positions within the Company's global workforce.
Interest expense increased $34 million to $364 million primarily due to higher interest rates on short-term debt and higher borrowings.
Equity in earnings of unconsolidated affiliates increased $62 million to $518 million due to earnings from a new equity investment and higher earnings from the Company’s equity investments in CIP and Olenex, partially offset by lower earnings from other equity investments.
Other expense - net of $101 million increased $111 million from net income of $10 million. Expense in 2018 included foreign exchange losses and a non-cash pension settlement charge of $117 million related to the purchase of a group annuity contract that irrevocably transferred the future benefit obligations and annuity administration for certain U.S. salaried retirees under the Company's ADM Retirement Plan. These expenses were partially offset by gains on disposals of businesses, an equity investment, and individually insignificant assets in the ordinary course of business, and other income. Income in 2017 included gains related to the sale of the crop risk services business and disposals of other individually insignificant assets in the ordinary course of business, partially offset by an adjustment of the proceeds of the 2015 sale of the cocoa business, changes in contingent settlement provisions, a charge related to the early redemption of the Company's $559 million notes due March 15, 2018, and foreign exchange losses.
37
Item 7. | MANAGEMENT’S DISCUSSION AND ANALYSIS OF FINANCIAL CONDITION AND RESULTS OF OPERATIONS (Continued) |
Operating profit by segment and earnings before income taxes for the years ended December 31, 2018 and 2017 are as follows:
Segment Operating Profit | 2018 | 2017 | Change | ||||||||
(In millions) | |||||||||||
Ag Services and Oilseeds | |||||||||||
Ag Services | $ | 657 | $ | 453 | $ | 204 | |||||
Crushing | 650 | 203 | 447 | ||||||||
Refined Products and Other | 370 | 244 | 126 | ||||||||
Wilmar | 343 | 329 | 14 | ||||||||
Total Ag Services and Oilseeds | 2,020 | 1,229 | 791 | ||||||||
Carbohydrate Solutions | |||||||||||
Sweeteners and Starches | 894 | 930 | (36 | ) | |||||||
Bioproducts | 51 | 148 | (97 | ) | |||||||
Total Carbohydrate Solutions | 945 | 1,078 | (133 | ) | |||||||
Nutrition | |||||||||||
Wild Flavors and Specialty Ingredients | 318 | 279 | 39 | ||||||||
Animal Nutrition | 21 | 33 | (12 | ) | |||||||
Total Nutrition | 339 | 312 | 27 | ||||||||
Other | 58 | 51 | 7 | ||||||||
Total Other | 58 | 51 | 7 | ||||||||
Specified Items: | |||||||||||
Gains on sales of assets and businesses | 13 | 22 | (9 | ) | |||||||
Impairment, restructuring, and exit charges | (102 | ) | (160 | ) | 58 | ||||||
Hedge timing effects | — | 4 | (4 | ) | |||||||
Total Specified Items | (89 | ) | (134 | ) | 45 | ||||||
Total Segment Operating Profit | 3,273 | 2,536 | 737 | ||||||||
Adjusted Segment Operating Profit(1) | 3,362 | 2,670 | 692 | ||||||||
Segment Operating Profit | 3,273 | 2,536 | 737 | ||||||||
Corporate | (1,213 | ) | (927 | ) | (286 | ) | |||||
Earnings Before Income Taxes | $ | 2,060 | $ | 1,609 | $ | 451 | |||||
(1) Adjusted segment operating profit is segment operating profit excluding the above specified items.
38
Item 7. | MANAGEMENT’S DISCUSSION AND ANALYSIS OF FINANCIAL CONDITION AND RESULTS OF OPERATIONS (Continued) |
Ag Services and Oilseeds operating profit increased 64%. Ag Services was up significantly year-over-year. Global trade delivered strong results due to increased volumes, strong margins, and improved opportunities in the soybean and feedstuff value chain. North American grain was up due to improved margins and higher volumes. South America saw strong origination volumes and improving margins as farmer selling accelerated. Crushing results increased due to a strong global demand and margin environment. The reduced soybean crop in Argentina combined with continued good global meal demand resulted in strong crushing margins and volumes. Refined Products and Other results were higher mainly due to the 2017 biodiesel tax credit of approximately $120 million which was approved and received in the first quarter of 2018, solid biodiesel results, and higher earnings from the Company’s investment in Olenex, partially offset by weaker peanut shelling margins primarily caused by large peanut inventories and difficult market conditions. Wilmar results were higher year over year.
Carbohydrate Solutions operating profit decreased 12%. Starches and Sweeteners results decreased due to lower margins and volumes in liquid sweeteners mainly due to production issues in the Decatur, Illinois corn complex partially offset by improved results from starches and dry sweeteners. Bioproducts results were down as near record industry fuel ethanol inventories pressured margins and production issues in the Decatur, IL corn complex increased costs, partially offset by effective ethanol risk management.
Nutrition operating profit increased 9%. Wild Flavors and Specialty Ingredients results were up due to improved earnings across the segment and higher sales volumes related to contributions from new acquisitions and organic growth. In Wild Flavors, an improved portfolio mix boosted sales and margins. Health and Wellness improved driven largely by increased contributions from bioactives. Specialty Ingredients was up due to improved volumes and margins in proteins and increased sales in fibers partially offset by lower results in polyols. Animal Nutrition was down due to operational issues in Decatur, IL that constrained lysine production volumes and increased manufacturing costs partially offset by improved premix and commercial feed margins.
Other operating profit increased 14% primarily due to stronger results from its futures commission brokerage business due to higher short-term interest rates, partially offset by lower underwriting results from the Company’s captive insurance operations during the first half of 2018.
Corporate results are as follows:
(In millions) | 2018 | 2017 | Change | ||||||||
LIFO credit (charge) | $ | 18 | $ | 2 | $ | 16 | |||||
Interest expense - net | (321 | ) | (310 | ) | (11 | ) | |||||
Unallocated corporate costs | (660 | ) | (470 | ) | (190 | ) | |||||
Expenses related to acquisitions | (8 | ) | — | (8 | ) | ||||||
Loss on debt extinguishment | — | (11 | ) | 11 | |||||||
Asset impairment, restructuring, and settlement charges | (190 | ) | (54 | ) | (136 | ) | |||||
Other charges | (52 | ) | (84 | ) | 32 | ||||||
Total Corporate | $ | (1,213 | ) | $ | (927 | ) | $ | (286 | ) | ||
Corporate results were a net charge of $1.2 billion in 2018 compared to $0.9 billion in 2017. The effect of changes in agricultural commodity prices on LIFO inventory valuation reserves resulted in a credit of $18 million in 2018 compared to a credit of $2 million in 2017. Interest expense - net increased $11 million due to higher interest rates on short-term debt and higher borrowings, partially offset by interest income related to a tax credit and lower-tax related expense. Unallocated corporate costs increased $190 million due principally to higher performance-related compensation accruals, increased pension and project-related expenses, and railroad maintenance expense that has an offsetting benefit in income tax expense. Adjustments related to acquisitions in 2018 related to expenses and losses on foreign currency derivative contracts entered into to economically hedge certain acquisitions. Loss on debt extinguishment in 2017 related to the early redemption of the $559 million aggregate principal amount of 5.45% notes due on March 15, 2018. Impairment, restructuring, and settlement charges in 2018 included a pension settlement charge of $117 million, a $49 million charge related to a discontinued software project, and restructuring charges of $24 million primarily related to the reorganization of IT services compared to restructuring charges related to the reduction of certain positions within the Company’s global workforce of $54 million in 2017. Other charges decreased $32 million primarily due to improved results in the Company’s investment in CIP and lower non-service cost related pension expenses.
39
Item 7. | MANAGEMENT’S DISCUSSION AND ANALYSIS OF FINANCIAL CONDITION AND RESULTS OF OPERATIONS (Continued) |
Non-GAAP Financial Measures
The Company uses adjusted earnings per share (EPS), adjusted earnings before taxes, interest, and depreciation and amortization (EBITDA), and adjusted segment operating profit, non-GAAP financial measures as defined by the SEC, to evaluate the Company’s financial performance. These performance measures are not defined by accounting principles generally accepted in the United States and should be considered in addition to, and not in lieu of, GAAP financial measures.
Adjusted EPS is defined as diluted EPS adjusted for the effects on reported diluted EPS of specified items. Adjusted EBITDA is defined as earnings before taxes, interest, and depreciation and amortization, adjusted for specified items. The Company calculates adjusted EBITDA by removing the impact of specified items and adding back the amounts of interest expense and depreciation and amortization to earnings before income taxes. Adjusted segment operating profit is segment operating profit adjusted, where applicable, for specified items.
Management believes that adjusted EPS, adjusted EBITDA, and adjusted segment operating profit are useful measures of the Company’s performance because they provide investors additional information about the Company's operations allowing better evaluation of underlying business performance and better period-to-period comparability. Adjusted EPS, adjusted EBITDA, and adjusted segment operating profit are not intended to replace or be an alternative to diluted EPS, earnings before income taxes, and segment operating profit, respectively, the most directly comparable amounts reported under GAAP.
The table below provides a reconciliation of diluted EPS to adjusted EPS for the years ended December 31, 2018 and 2017.
2018 | 2017 | ||||||||||||
In millions | Per share | In millions | Per share | ||||||||||
Average number of shares outstanding - diluted | 567 | 572 | |||||||||||
Net earnings and reported EPS (fully diluted) | $ | 1,810 | $ | 3.19 | $ | 1,595 | $ | 2.79 | |||||
Adjustments: | |||||||||||||
LIFO charge (credit) (net of tax of $4 million in 2018 and $1 million in 2017(1) | (14 | ) | (0.02 | ) | (1 | ) | — | ||||||
(Gains) Losses on sales of assets and businesses (net of tax of $0 million in 2018 and $32 million in 2017) (2) | (13 | ) | (0.02 | ) | 10 | 0.02 | |||||||
Asset impairment, restructuring, and settlement charges (net of tax of $66 million in 2018 and $70 million in 2017) (2) | 226 | 0.40 | 144 | 0.25 | |||||||||
Expenses related to acquisitions (net of tax of $2 million) (2) | 6 | 0.01 | — | — | |||||||||
Loss on debt extinguishment (net of tax of $4 million) (1) | — | — | 7 | 0.01 | |||||||||
Tax adjustments (3) | (33 | ) | (0.06 | ) | (366 | ) | (0.64 | ) | |||||
Adjusted net earnings and and adjusted EPS | $ | 1,982 | $ | 3.50 | $ | 1,389 | $ | 2.43 | |||||
(1) Tax effected using the Company’s U.S. effective tax rate.
(2) Tax effected using the U.S. and other applicable tax rates.
(3) Includes tax adjustments related to the U.S. Tax Cuts and Jobs Act of 2017.
40
Item 7. | MANAGEMENT’S DISCUSSION AND ANALYSIS OF FINANCIAL CONDITION AND RESULTS OF OPERATIONS (Continued) |
The tables below provide a reconciliation of earnings before income taxes to adjusted EBITDA and adjusted EBITDA by segment for the years ended December 31, 2018 and 2017.
(In millions) | 2018 | 2017 | Change | ||||||||
Earnings before income taxes | $ | 2,060 | $ | 1,609 | $ | 451 | |||||
Interest expense | 364 | 330 | 34 | ||||||||
Depreciation and amortization | 941 | 924 | 17 | ||||||||
LIFO charge (credit) | (18 | ) | (2 | ) | (16 | ) | |||||
Gains (Losses) on sales of assets and businesses | (13 | ) | (22 | ) | 9 | ||||||
Asset impairment, restructuring, and settlement charges | 292 | 214 | 78 | ||||||||
Expenses related to acquisitions | 8 | — | 8 | ||||||||
Loss on debt extinguishment | — | 11 | (11 | ) | |||||||
Adjusted EBITDA | $ | 3,634 | $ | 3,064 | $ | 570 | |||||
(In millions) | 2018 | 2017 | Change | ||||||||
Ag Services and Oilseeds | $ | 2,410 | $ | 1,620 | 790 | ||||||
Carbohydrate Solutions | 1,282 | 1,415 | (133 | ) | |||||||
Nutrition | 486 | 450 | 36 | ||||||||
Other - Financial | 92 | 69 | 23 | ||||||||
Corporate | (636 | ) | (490 | ) | (146 | ) | |||||
Adjusted EBITDA | $ | 3,634 | $ | 3,064 | $ | 570 | |||||
41
Item 7. | MANAGEMENT’S DISCUSSION AND ANALYSIS OF FINANCIAL CONDITION AND RESULTS OF OPERATIONS (Continued) |
Liquidity and Capital Resources
A Company objective is to have sufficient liquidity, balance sheet strength, and financial flexibility to fund the operating and capital requirements of a capital intensive agricultural commodity-based business. The Company depends on access to credit markets, which can be impacted by its credit rating and factors outside of ADM’s control, to fund its working capital needs and capital expenditures. The primary source of funds to finance ADM’s operations, capital expenditures, and advancement of its growth strategy is cash generated by operations and lines of credit, including a commercial paper borrowing facility and accounts receivable securitization programs. In addition, the Company believes it has access to funds from public and private equity and debt capital markets in both U.S. and international markets.
Cash used in operating activities was $5.5 billion for 2019 compared to $4.8 billion in 2018. Working capital changes, including the increase in deferred consideration, decreased cash by $7.7 billion in the current year compared to $7.5 billion in the prior year. Trade receivables decreased $0.3 billion due to lower revenues, net of acquisitions.
Deferred consideration in securitized receivables of $7.7 billion and $7.8 billion in 2019 and 2018, respectively, was offset by the same amounts of net consideration received for beneficial interest obtained for selling trade receivables.
Cash provided by investing activities was $5.3 billion this year compared to $6.6 billion last year. Capital expenditures and net assets of businesses acquired were $0.8 billion and $1.9 billion, respectively, this year compared to $0.8 billion and $0.5 billion, respectively, last year. Proceeds from the sale of businesses and assets were $0.3 billion in the current year were compared to $0.2 billion in the prior year. There were sales of marketable securities, net of purchases, of $0.1 billion in the current year compared to immaterial marketable securities sales transactions in the prior year. Investments in and advances to affiliates were immaterial in the current year compared to $0.2 billion in the prior year. Net consideration received for beneficial interest obtained for selling trade receivables was $7.7 billion and $7.8 billion in 2019 and 2018, respectively.
Cash used in financing activities was $0.7 billion this year compared to cash provided of $0.2 billion last year. Long-term debt borrowings in the current year were $8 million. Long-term debt borrowings in the prior year of $1.8 billion consisted of the €650 million ($744 million as of December 31, 2018) aggregate principal amount of 1.000% Notes issued on September 12, 2018 and the December 3, 2018 issuance of $600 million and $400 million aggregate principal amounts of 4.5% and 3.375% Notes, respectively. Long-term debt payments in the current year of $626 million primarily related to the €500 million Floating Rate Notes that matured in June 2019 compared to $30 million in the prior year. Commercial paper borrowings in the current year of $0.9 billion were used to fund acquisitions and general corporate expenses compared to payments of $0.7 billion in the prior year. Share repurchases in the current year were $0.2 billion compared to $0.1 billion in the prior year.
At December 31, 2019, ADM had $0.9 billion of cash, cash equivalents, and short-term marketable securities and a current ratio, defined as current assets divided by current liabilities, of 1.6 to 1. Included in working capital is $5.7 billion of readily marketable commodity inventories. At December 31, 2019, the Company’s capital resources included shareholders’ equity of $19.2 billion and lines of credit, including the accounts receivable securitization programs described below, totaling $9.0 billion, of which $6.4 billion was unused. ADM’s ratio of long-term debt to total capital (the sum of long-term debt and shareholders’ equity) was 29% at December 31, 2019 and December 31, 2018. The Company uses this ratio as a measure of ADM’s long-term indebtedness and an indicator of financial flexibility. The Company’s ratio of net debt (the sum of short-term debt, current maturities of long-term debt, and long-term debt less the sum of cash and cash equivalents and short-term marketable securities) to capital (the sum of net debt and shareholders’ equity) increased from 25% at December 31, 2018 to 29% at December 31, 2019 due to acquisitions. Of the Company’s total lines of credit, $5.0 billion supported the combined U.S. and European commercial paper borrowing programs, against which there was $1.0 billion of U.S. and European commercial paper outstanding at December 31, 2019.
As of December 31, 2019, the Company had $0.9 billion of cash and cash equivalents, $0.3 billion of which is cash held by foreign subsidiaries whose undistributed earnings are considered indefinitely reinvested. Based on the Company’s historical ability to generate sufficient cash flows from its U.S. operations and unused and available U.S. credit capacity of $4.3 billion, the Company has asserted that these funds are indefinitely reinvested outside the U.S.
42
Item 7. | MANAGEMENT’S DISCUSSION AND ANALYSIS OF FINANCIAL CONDITION AND RESULTS OF OPERATIONS (Continued) |
The Company has accounts receivable securitization programs (the “Programs”) with certain commercial paper conduit purchasers and committed purchasers. The Programs provide the Company with up to $1.9 billion in funding against accounts receivable transferred into the Programs and expands the Company’s access to liquidity through efficient use of its balance sheet assets (see Note 19 in Item 8 for more information and disclosures on the Programs). As of December 31, 2019, the Company utilized $1.4 billion of its facility under the Programs. The Programs are due to terminate during the first half of 2020. However, the Company currently expects to extend these Programs upon termination.
On November 5, 2014, the Company’s Board of Directors approved a stock repurchase program authorizing the Company to repurchase up to 100,000,000 shares of the Company’s common stock during the period commencing January 1, 2015 and ending December 31, 2019. On August 7, 2019, the Company’s Board of Directors approved the extension of the stock repurchase program through December 31, 2024 and the repurchase of up to an additional 100,000,000 shares under the extended program. The Company has acquired approximately 91.7 million shares under this program as of December 31, 2019.
In 2020, the Company expects capital expenditures of $0.9 billion to $1.0 billion and additional cash outlays of approximately $0.8 billion in dividends and $0.1 billion in share repurchases.
The Company’s credit facilities and certain debentures require the Company to comply with specified financial and non-financial covenants including maintenance of minimum tangible net worth as well as limitations related to incurring liens, secured debt, and certain other financing arrangements. The Company was in compliance with these covenants as of December 31, 2019.
The three major credit rating agencies have maintained the Company’s credit ratings at solid investment grade levels with stable outlooks.
Contractual Obligations
In the normal course of business, the Company enters into contracts and commitments which obligate the Company to make payments in the future. The following table sets forth the Company’s significant future obligations by time period. Purchases include commodity-based contracts entered into in the normal course of business, which are further described in Item 7A, “Quantitative and Qualitative Disclosures About Market Risk,” energy-related purchase contracts entered into in the normal course of business, and other purchase obligations related to the Company’s normal business activities. The following table does not include unrecognized income tax benefits of $130 million as of December 31, 2019 as the Company is unable to reasonably estimate the timing of settlement. Where applicable, information included in the Company’s consolidated financial statements and notes is cross-referenced in this table.
Payments Due by Period | ||||||||||||||||||||
Item 8 | ||||||||||||||||||||
Contractual Obligations and | Note | Less than | 1 - 3 | 3 - 5 | More than | |||||||||||||||
Other Commitments | Reference | Total | 1 Year | Years | Years | 5 Years | ||||||||||||||
(In millions) | ||||||||||||||||||||
Purchases | ||||||||||||||||||||
Inventories | $ | 10,488 | $ | 10,242 | $ | 238 | $ | 8 | $ | — | ||||||||||
Energy | 319 | 260 | 59 | — | — | |||||||||||||||
Other | 1,386 | 938 | 223 | 27 | 198 | |||||||||||||||
Total purchases | 12,193 | 11,440 | 520 | 35 | 198 | |||||||||||||||
Short-term debt | 1,202 | 1,202 | — | — | — | |||||||||||||||
Long-term debt | Note 10 | 7,679 | 7 | 1,081 | 726 | 5,865 | ||||||||||||||
Estimated interest payments | 5,380 | 324 | 581 | 533 | 3,942 | |||||||||||||||
One-time transition tax | Note 13 | 183 | 20 | 40 | 87 | 36 | ||||||||||||||
Operating leases | Note 14 | 1,177 | 251 | 403 | 231 | 292 | ||||||||||||||
Estimated pension and other postretirement plan contributions (1) | Note 15 | 149 | 43 | 29 | 26 | 51 | ||||||||||||||
Total | $ | 27,963 | $ | 13,287 | $ | 2,654 | $ | 1,638 | $ | 10,384 | ||||||||||
43
Item 7. | MANAGEMENT’S DISCUSSION AND ANALYSIS OF FINANCIAL CONDITION AND RESULTS OF OPERATIONS (Continued) |
(1) Includes pension contributions of $27 million for fiscal 2020. The Company is unable to estimate the amount of pension contributions beyond fiscal year 2020. For more information concerning the Company’s pension and other postretirement plans, see Note 15 in Item 8.
At December 31, 2019, the Company estimates it will spend approximately $1.1 billion through fiscal year 2024 to complete currently approved capital projects which are not included in the table above.
The Company also has outstanding letters of credit and surety bonds of $1.4 billion at December 31, 2019 which are not included in the table above.
The Company has entered into agreements, primarily debt guarantee agreements related to equity-method investees, which could obligate the Company to make future payments. The Company’s liability under these agreements arises only if the primary entity fails to perform its contractual obligation. The Company has collateral for a portion of these contingent obligations.
Off Balance Sheet Arrangements
Accounts Receivable Securitization Programs
In September 2019, the Company amended its accounts receivable securitization program (the “Program”) with certain commercial paper conduit purchasers and committed purchasers (collectively, the “First Purchasers”) and increased its facility from $1.2 billion to $1.3 billion. The program terminates on June 18, 2020 unless extended (see Note 19 of “Notes to Consolidated Financial Statements” included in Item 8 herein, “Financial Statements and Supplementary Data” for more information and disclosures on the Programs).
There were no other material changes in the Company’s off balance sheet arrangements during the year.
Critical Accounting Policies
The process of preparing financial statements requires management to make estimates and judgments that affect the carrying values of the Company’s assets and liabilities as well as the recognition of revenues and expenses. These estimates and judgments are based on the Company’s historical experience and management’s knowledge and understanding of current facts and circumstances. Certain of the Company’s accounting policies are considered critical, as these policies are important to the depiction of the Company’s financial statements and require significant or complex judgment by management. Management has discussed with the Company’s Audit Committee the development, selection, disclosure, and application of these critical accounting policies. Following are the accounting policies management considers critical to the Company’s financial statements.
Fair Value Measurements - Inventories and Commodity Derivatives
Certain of the Company’s inventory and commodity derivative assets and liabilities as of December 31, 2019 are valued at estimated fair values, including $4.7 billion of merchandisable agricultural commodity inventories, $0.5 billion of commodity derivative assets, $0.6 billion of commodity derivative liabilities, and $0.7 billion of inventory-related payables. Commodity derivative assets and liabilities include forward fixed-price purchase and sale contracts for agricultural commodities. Merchandisable agricultural commodities are freely traded, have quoted market prices, and may be sold without significant additional processing. Management estimates fair value for its commodity-related assets and liabilities based on exchange-quoted prices, adjusted for differences in local markets. The Company’s inventory and derivative commodity fair value measurements are mainly based on observable market quotations without significant adjustments and are therefore reported as Level 2 within the fair value hierarchy. Level 3 fair value measurements of approximately $1.7 billion of assets and $0.2 billion of liabilities represent fair value estimates where unobservable price components represent 10% or more of the total fair value price. For more information concerning amounts reported as Level 3, see Note 4 in Item 8. Changes in the market values of these inventories and commodity contracts are recognized in the statement of earnings as a component of cost of products sold. If management used different methods or factors to estimate market value, amounts reported as inventories and cost of products sold could differ materially. Additionally, if market conditions change subsequent to year-end, amounts reported in future periods as inventories and cost of products sold could differ materially.
44
Item 7. | MANAGEMENT’S DISCUSSION AND ANALYSIS OF FINANCIAL CONDITION AND RESULTS OF OPERATIONS (Continued) |
Derivatives – Designated Hedging Activities
The Company, from time to time, uses derivative contracts designated as cash flow hedges to hedge the purchase or sales price of anticipated volumes of commodities to be purchased and processed in a future month. Assuming normal market conditions, the change in the market value of such derivative contracts has historically been, and is expected to continue to be, highly effective at offsetting changes in price movements of the hedged item. Gains and losses arising from open and closed hedging transactions are deferred in accumulated other comprehensive income, net of applicable income taxes, and recognized as a component of cost of products sold and revenues in the statement of earnings when the hedged item is recognized in earnings. If it is determined that the derivative instruments used are no longer effective at offsetting changes in the price of the hedged item, then the changes in the market value of these exchange-traded futures and exchange-traded and over-the-counter option contracts would be recorded immediately in the statement of earnings as a component of revenues and/or cost of products sold. See Note 5 in Item 8 for additional information.
Investments in Affiliates
The Company applies the equity method of accounting for investments over which the Company has the ability to exercise significant influence. These investments are carried at cost plus equity in undistributed earnings and are adjusted, where appropriate, for amortizable basis differences between the investment balance and the underlying net assets of the investee. Generally, the minimum ownership threshold for asserting significant influence is 20% ownership of the investee. However, the Company considers all relevant factors in determining its ability to assert significant influence including, but not limited to, ownership percentage, board membership, customer and vendor relationships, and other arrangements. If management used a different accounting method for these investments, then the amount of earnings from affiliates the Company recognizes may materially differ.
Income Taxes
The Company accounts for income taxes in accordance with the applicable accounting standards. These standards prescribe a minimum threshold a tax position is required to meet before being recognized in the consolidated financial statements. The Company recognizes in its consolidated financial statements tax positions determined more likely than not to be sustained upon examination, based on the technical merits of the position. The Company faces challenges from U.S. and foreign tax authorities regarding the amount of taxes due. These challenges include questions regarding the timing and amount of deductions and the allocation of income among various tax jurisdictions. In evaluating the exposure associated with various tax filing positions, the Company records reserves for estimates of potential additional tax owed by the Company. For example, the Company has received tax assessments from tax authorities in Brazil, Argentina, and the Netherlands, challenging income tax positions taken by subsidiaries of the Company. The Company evaluated its tax positions for these matters and concluded, based in part upon advice from legal counsel, that it was appropriate to recognize the tax benefits of these positions (see Note 13 in Item 8 for additional information).
Deferred tax assets represent items to be used as tax deductions or credits in future tax returns where the related tax benefit has already been recognized in the Company’s income statement. The realization of the Company’s deferred tax assets is dependent upon future taxable income in specific tax jurisdictions, the timing and amount of which are uncertain. The Company evaluates all available positive and negative evidence including estimated future reversals of existing temporary differences, projected future taxable income, tax planning strategies, and recent financial results. Valuation allowances related to these deferred tax assets have been established to the extent the realization of the tax benefit is not likely. During 2019, the Company increased valuation allowances by approximately $20 million primarily related to newly-generated foreign tax loss carryforwards. To the extent the Company were to favorably resolve matters for which valuation allowances have been established or be required to pay amounts in excess of the aforementioned valuation allowances, the Company’s effective tax rate in a given financial statement period may be impacted.
Undistributed earnings of the Company’s foreign subsidiaries amounting to approximately $11.6 billion at December 31, 2019, are considered to be indefinitely reinvested.
45
Item 7. | MANAGEMENT’S DISCUSSION AND ANALYSIS OF FINANCIAL CONDITION AND RESULTS OF OPERATIONS (Continued) |
The Tax Cuts and Jobs Act (the “Act”), which was enacted on December 22, 2017, included a one-time transition tax on accumulated foreign earnings. As a result, the Company recorded a $369 million provisional impact of the transition tax and a $220 million beneficial impact on reserves previously established under Accounting Standards Codification Subtopic 740-30, Income Taxes - Other Considerations or Special Areas, or a net provisional impact of $149 million in 2017. The Company performed a quarterly review of the provisional tax liability recorded in 2017 as new guidance on the Act was issued in 2018. The Company finalized its calculation of the transition tax and recorded an immaterial expense in 2019 and a benefit of $29 million in 2018. The Company elected to pay the one-time transition tax over eight years. Because the Company’s undistributed foreign earnings and outside basis differences inherent in foreign entities continue to be indefinitely reinvested in foreign operations, no income taxes have been provided. It is not practicable to determine the amount of unrecognized deferred tax liability related to any remaining undistributed foreign earnings not subject to the transition tax and additional outside basis difference in these entities.
The Act also contains new provisions related to Global Intangible Low Taxed Income (GILTI) and Foreign Derived Intangible Income (FDII) which were effective for fiscal year 2018. The Company made an accounting policy election to treat GILTI as a period cost. During 2018, U.S. tax authorities issued proposed Treasury Regulations addressing some of the tax reform items that were effective in 2018. The Company has recorded and will continue to record the impact of tax reform items as U.S. tax authorities issue Treasury Regulations and other guidance addressing tax reform-related changes. It is also reasonable to expect that global taxing authorities will be reviewing their current legislation for potential modifications in reaction to the implementation of the Act. The additional guidance in the U.S., along with the potential for additional global tax legislation changes, may affect significant deductions and income inclusions and could have a material adverse effect on the Company's net income or cash flow.
Property, Plant, and Equipment and Asset Abandonments and Write-Downs
The Company is principally engaged in the business of procuring, transporting, storing, processing, and merchandising agricultural commodities and products. This business is global in nature and is highly capital-intensive. Both the availability of the Company’s raw materials and the demand for the Company’s finished products are driven by factors such as weather, plantings, government programs and policies, changes in global demand, changes in standards of living, and global production of similar and competitive crops. These aforementioned factors may cause a shift in the supply/demand dynamics for the Company’s raw materials and finished products. Any such shift will cause management to evaluate the efficiency and cash flows of the Company’s assets in terms of geographic location, size, and age of its facilities. The Company, from time to time, will also invest in equipment, technology, and companies related to new, value-added products produced from agricultural commodities and products. These new products are not always successful from either a commercial production or marketing perspective. Management evaluates the Company’s property, plant, and equipment for impairment whenever indicators of impairment exist. Assets are written down to fair value after consideration of the ability to utilize the assets for their intended purpose or to employ the assets in alternative uses or sell the assets to recover the carrying value. If management used different estimates and assumptions in its evaluation of these assets, then the Company could recognize different amounts of expense over future periods. During the years ended December 31, 2019, 2018, and 2017, impairment charges for property, plant, and equipment were $131 million, $100 million, and $101 million, respectively.
Business Combinations
The Company’s acquisitions are accounted for in accordance with Accounting Standards Codification (ASC) Topic 805, Business Combinations, as amended. The consideration transferred is allocated to various assets acquired and liabilities assumed at their estimated fair values as of the acquisition date with the residual allocated to goodwill. Fair values allocated to assets acquired and liabilities assumed in business combinations require management to make significant judgments, estimates, and assumptions, especially with respect to intangible assets. Management makes estimates of fair values based upon assumptions it believes to be reasonable. These are estimates are based upon historical experience and information obtained from the management of the acquired companies and are inherently uncertain. The estimated fair values related to intangible assets primarily consist of customer relationships, trademarks, and developed technology which are determined primarily using discounted cash flow models. Estimates in the discounted cash flow models include, but are not limited to, certain assumptions that form the basis of the forecasted results (e.g. revenue growth rates, customer attrition rates, and royalty rates). These significant assumptions are forward looking and could be affected by future economic and market conditions. During the measurement period, which may take up to one year from the acquisition date, adjustments due to changes in the estimated fair value of assets acquired and liabilities assumed may be recorded as adjustments to the consideration transferred and related allocations. Upon the conclusion of the measurement period or the final determination of the values of assets acquired and liabilities assumed, whichever comes first, any such adjustments are charged to the consolidated statements of earnings.
46
Item 7. | MANAGEMENT’S DISCUSSION AND ANALYSIS OF FINANCIAL CONDITION AND RESULTS OF OPERATIONS (Continued) |
Goodwill and Other Intangible Assets
Goodwill and intangible assets deemed to have indefinite lives are not amortized but are subject to annual impairment tests. The Company evaluates goodwill for impairment at the reporting unit level annually on October 1 or whenever there are indicators that the carrying value may not be fully recoverable. The Company adopted the provisions of ASC 350, Intangibles - Goodwill and Other, which permits, but does not require, a company to qualitatively assess indicators of a reporting unit's fair value. If after completing the qualitative assessment, a company believes it is likely that a reporting unit is impaired, a discounted cash flow analysis is prepared to estimate fair value. Critical estimates in the determination of the fair value of each reporting unit include, but are not limited to, future expected cash flows and discount rates. Definite-lived intangible assets, including capitalized expenses related to the Company's 1ADM program, are amortized over their estimated useful lives of 2 to 50 years and are reviewed for impairment whenever there are indicators that the carrying values may not be fully recoverable. The Company recorded impairment charges totaling $11 million related to goodwill and intangibles, and $9 million related to customer lists during the years ended December 31, 2019 and 2018, respectively. There were no impairment charges recorded for goodwill and intangible assets during the year ended December 31, 2017 (see Note 18 in Item 8 for more information). If management used different estimates and assumptions in its impairment tests, then the Company could recognize different amounts of expense over future periods.
Employee Benefit Plans
The Company provides substantially all U.S. employees and employees at certain international subsidiaries with retirement benefits including defined benefit pension plans and defined contribution plans. The Company provides certain eligible U.S. employees who retire under qualifying conditions with subsidized postretirement health care coverage or Health Care Reimbursement Accounts.
In order to measure the expense and funded status of these employee benefit plans, management makes several estimates and assumptions, including interest rates used to discount certain liabilities, rates of return on assets set aside to fund these plans, rates of compensation increases, employee turnover rates, anticipated mortality rates, and anticipated future health care costs. These estimates and assumptions are based on the Company’s historical experience combined with management’s knowledge and understanding of current facts and circumstances. Management also uses third-party actuaries to assist in measuring the expense and funded status of these employee benefit plans. If management used different estimates and assumptions regarding these plans, the funded status of the plans could vary significantly, and the Company could recognize different amounts of expense over future periods.
The Company uses the corridor approach when amortizing actuarial losses. Under the corridor approach, net unrecognized actuarial losses in excess of 10% of the greater of the projected benefit obligation or the market related value of plan assets are amortized over future periods. For plans with little to no active participants, the amortization period is the remaining average life expectancy of the participants. For plans with active participants, the amortization period is the remaining average service period of the active participants. The amortization periods range from 3 to 38 years for the Company's defined benefit pension plans and from 6 to 22 years for the Company's postretirement benefit plans.
Item 7A. | QUANTITATIVE AND QUALITATIVE DISCLOSURES ABOUT MARKET RISK |
The market risk inherent in the Company’s market risk sensitive instruments and positions is the potential loss arising from adverse changes in: commodity market prices as they relate to the Company’s net commodity position, foreign currency exchange rates, and interest rates as described below.
Commodities
The availability and prices of agricultural commodities are subject to wide fluctuations due to factors such as changes in weather conditions, crop disease, plantings, government programs and policies, competition, changes in global demand, changes in customer preferences and standards of living, and global production of similar and competitive crops.
47
Item 7A. | QUANTITATIVE AND QUALITATIVE DISCLOSURES ABOUT MARKET RISK (Continued) |
The Company manages its exposure to adverse price movements of agricultural commodities used for, and produced in, its business operations, by entering into derivative and non-derivative contracts which reduce the Company’s overall short or long commodity position. Additionally, the Company uses exchange-traded futures and exchange-traded and over-the-counter option contracts as components of merchandising strategies designed to enhance margins. The results of these strategies can be significantly impacted by factors such as the correlation between the value of exchange-traded commodities futures contracts and the cash prices of the underlying commodities, counterparty contract defaults, and volatility of freight markets. In addition, the Company, from time-to-time, enters into derivative contracts which are designated as hedges of specific volumes of commodities that will be purchased and processed, or sold, in a future month. The changes in the market value of such futures contracts have historically been, and are expected to continue to be, highly effective at offsetting changes in price movements of the hedged item. Gains and losses arising from open and closed designated hedging transactions are deferred in other comprehensive income, net of applicable taxes, and recognized as a component of cost of products sold or revenues in the statement of earnings when the hedged item is recognized.
The Company’s commodity position consists of merchandisable agricultural commodity inventories, related purchase and sales contracts, energy and freight contracts, and exchange-traded futures and exchange-traded and over-the-counter option contracts including contracts used to hedge portions of production requirements, net of sales.
The fair value of the Company’s commodity position is a summation of the fair values calculated for each commodity by valuing all of the commodity positions at quoted market prices for the period, where available, or utilizing a close proxy. The Company has established metrics to monitor the amount of market risk exposure, which consist of volumetric limits, and value-at-risk (VaR) limits. VaR measures the potential loss, at a 95% confidence level, that could be incurred over a one year period. Volumetric limits are monitored daily and VaR calculations and sensitivity analysis are monitored weekly.
In addition to measuring the hypothetical loss resulting from an adverse two standard deviation move in market prices (assuming no correlations) over a one year period using VaR, sensitivity analysis is performed measuring the potential loss in fair value resulting from a hypothetical 10% adverse change in market prices. The highest, lowest, and average weekly position for the years ended December 31, 2019 and 2018 together with the market risk from a hypothetical 10% adverse price change is as follows:
December 31, 2019 | December 31, 2018 | |||||||||||||||
Long/(Short) | Fair Value | Market Risk | Fair Value | Market Risk | ||||||||||||
(In millions) | ||||||||||||||||
Highest position | $ | 576 | $ | 58 | $ | 434 | $ | 43 | ||||||||
Lowest position | (83 | ) | (8 | ) | 25 | 2 | ||||||||||
Average position | 280 | 28 | 237 | 24 | ||||||||||||
The change in fair value of the average position was principally the result of an increase in prices underlying the weekly commodity position.
Currencies
The Company has consolidated subsidiaries in more than 70 countries. For the majority of the Company’s subsidiaries located outside the United States, the local currency is the functional currency except certain significant subsidiaries in Switzerland where Euro is the functional currency, and Brazil and Argentina where U.S. dollar is the functional currency. To reduce the risks associated with foreign currency exchange rate fluctuations, the Company enters into currency exchange contracts to minimize its foreign currency position related to transactions denominated primarily in Euro, British pound, Canadian dollar, and Brazilian real currencies. These currencies represent the major functional or local currencies in which recurring business transactions occur. The Company also uses currency exchange contracts as hedges against amounts indefinitely invested in foreign subsidiaries and affiliates. The currency exchange contracts used are forward contracts, swaps with banks, exchange-traded futures contracts, and over-the-counter options. The changes in market value of such contracts have a high correlation to the price changes in the currency of the related transactions. The potential loss in fair value for such net currency position resulting from a hypothetical 10% adverse change in foreign currency exchange rates is not material.
48
Item 7A. | QUANTITATIVE AND QUALITATIVE DISCLOSURES ABOUT MARKET RISK (Continued) |
The amount the Company considers indefinitely invested in foreign subsidiaries translated into dollars using the year-end exchange rates is $9.6 billion and $8.7 billion ($11.6 billion and $10.5 billion at historical rates) at December 31, 2019 and 2018, respectively. The increase is due to the increase in retained earnings of the foreign subsidiaries and affiliates of $1.1 billion partially offset by the depreciation of foreign currencies versus the U.S. dollar of $0.2 billion. The potential loss in fair value, which would principally be recognized in Other Comprehensive Income, resulting from a hypothetical 10% adverse change in quoted foreign currency exchange rates is $957 million and $870 million for December 31, 2019 and 2018, respectively. Actual results may differ.
Interest
The fair value of the Company’s long-term debt is estimated using quoted market prices, where available, and discounted future cash flows based on the Company’s current incremental borrowing rates for similar types of borrowing arrangements. Such fair value exceeded the long-term debt carrying value. Market risk is estimated as the potential increase in fair value resulting from a hypothetical 50 basis points decrease in interest rates. Actual results may differ.
December 31, 2019 | December 31, 2018 | ||||||
(In millions) | |||||||
Fair value of long-term debt | $ | 9,211 | $ | 8,434 | |||
Excess of fair value over carrying value | 1,540 | 736 | |||||
Market risk | 420 | 405 | |||||
The increase in fair value of long-term debt at December 31, 2019 is primarily due to decreased interest rates.
49
Item 8. | FINANCIAL STATEMENTS AND SUPPLEMENTARY DATA |
Financial Statements | Page No. |
Consolidated Statements of Earnings | |
Consolidated Statements of Comprehensive Income (Loss) | |
Consolidated Balance Sheets | |
Consolidated Statements of Cash Flows | |
Consolidated Statements of Shareholders’ Equity | |
Notes to Consolidated Financial Statements | |
Reports of Independent Registered Public Accounting Firm | |
50
Archer-Daniels-Midland Company
Consolidated Statements of Earnings
Year Ended | |||||||||||
(In millions, except per share amounts) | December 31 | ||||||||||
2019 | 2018 | 2017 | |||||||||
Revenues | $ | $ | $ | ||||||||
Cost of products sold | |||||||||||
Gross Profit | |||||||||||
Selling, general and administrative expenses | |||||||||||
Asset impairment, exit, and restructuring costs | |||||||||||
Interest expense | |||||||||||
Equity in earnings of unconsolidated affiliates | ( | ) | ( | ) | ( | ) | |||||
Interest income | ( | ) | ( | ) | ( | ) | |||||
Other (income) expense - net | ( | ) | |||||||||
Earnings Before Income Taxes | |||||||||||
Income tax expense | |||||||||||
Net Earnings Including Noncontrolling Interests | |||||||||||
Less: Net earnings (losses) attributable to noncontrolling interests | |||||||||||
Net Earnings Attributable to Controlling Interests | $ | $ | $ | ||||||||
Average number of shares outstanding – basic | |||||||||||
Average number of shares outstanding – diluted | |||||||||||
Basic earnings per common share | $ | $ | $ | ||||||||
Diluted earnings per common share | $ | $ | $ | ||||||||
See notes to consolidated financial statements.
51
Archer-Daniels-Midland Company
Consolidated Statements of Comprehensive Income (Loss)
Year Ended | |||||||||||
(In millions) | December 31 | ||||||||||
2019 | 2018 | 2017 | |||||||||
Net earnings including noncontrolling interests | $ | $ | $ | ||||||||
Other comprehensive income (loss): | |||||||||||
Foreign currency translation adjustment | ( | ) | ( | ) | |||||||
Tax effect | ( | ) | ( | ) | |||||||
Net of tax amount | ( | ) | ( | ) | |||||||
Pension and other postretirement benefit liabilities adjustment | ( | ) | |||||||||
Tax effect | ( | ) | ( | ) | |||||||
Net of tax amount | ( | ) | |||||||||
Deferred gain (loss) on hedging activities | ( | ) | |||||||||
Tax effect | ( | ) | ( | ) | |||||||
Net of tax effect | ( | ) | |||||||||
Unrealized gain (loss) on investments | ( | ) | ( | ) | |||||||
Tax effect | ( | ) | ( | ) | |||||||
Net of tax effect | ( | ) | |||||||||
Other comprehensive income (loss) | ( | ) | ( | ) | |||||||
Comprehensive income (loss) | |||||||||||
Less: Comprehensive income (loss) attributable to noncontrolling interests | |||||||||||
Comprehensive income (loss) attributable to controlling interests | $ | $ | $ | ||||||||
See notes to consolidated financial statements.
52
Archer-Daniels-Midland Company
Consolidated Balance Sheets
(In millions) | December 31, 2019 | December 31, 2018 | |||||
Assets | |||||||
Current Assets | |||||||
Cash and cash equivalents | $ | $ | |||||
Segregated cash and investments | |||||||
Trade receivables - net | |||||||
Inventories | |||||||
Other current assets | |||||||
Total Current Assets | |||||||
Investments and Other Assets | |||||||
Investments in and advances to affiliates | |||||||
Goodwill and other intangible assets | |||||||
Other assets | |||||||
Total Investments and Other Assets | |||||||
Property, Plant, and Equipment | |||||||
Land and land improvements | |||||||
Buildings | |||||||
Machinery and equipment | |||||||
Construction in progress | |||||||
Accumulated depreciation | ( | ) | ( | ) | |||
Net Property, Plant, and Equipment | |||||||
Total Assets | $ | $ | |||||
Liabilities, Temporary Equity, and Shareholders’ Equity | |||||||
Current Liabilities | |||||||
Short-term debt | $ | $ | |||||
Trade payables | |||||||
Payables to brokerage customers | |||||||
Accrued expenses and other payables | |||||||
Current maturities of long-term debt | |||||||
Total Current Liabilities | |||||||
Long-Term Liabilities | |||||||
Long-term debt | |||||||
Deferred income taxes | |||||||
Other | |||||||
Total Long-Term Liabilities | |||||||
Temporary Equity - Redeemable noncontrolling interest | |||||||
Shareholders’ Equity | |||||||
Common stock | |||||||
Reinvested earnings | |||||||
Accumulated other comprehensive income (loss) | ( | ) | ( | ) | |||
Noncontrolling interests | |||||||
Total Shareholders’ Equity | |||||||
Total Liabilities, Temporary Equity, and Shareholders’ Equity | $ | $ | |||||
See notes to consolidated financial statements.
53
Archer-Daniels-Midland Company
Consolidated Statements of Cash Flows
(In millions) | Year Ended December 31 | ||||||||||
2019 | 2018 | 2017 | |||||||||
Operating Activities | |||||||||||
Net earnings including noncontrolling interests | $ | $ | $ | ||||||||
Adjustments to reconcile net earnings to net cash provided by (used in) operating results | |||||||||||
Depreciation and amortization | |||||||||||
Asset impairment charges | |||||||||||
Deferred income taxes | ( | ) | ( | ) | |||||||
Equity in earnings of affiliates, net of dividends | ( | ) | ( | ) | ( | ) | |||||
Stock compensation expense | |||||||||||
Pension and postretirement accruals (contributions), net | ( | ) | |||||||||
Loss (gain) on sale or revaluation of assets | ( | ) | ( | ) | |||||||
Other – net | ( | ) | ( | ) | |||||||
Changes in operating assets and liabilities, net of acquisitions and dispositions | |||||||||||
Segregated investments | |||||||||||
Trade receivables | ( | ) | |||||||||
Inventories | ( | ) | ( | ) | |||||||
Deferred consideration in securitized receivables | ( | ) | ( | ) | ( | ) | |||||
Other current assets | ( | ) | ( | ) | |||||||
Trade payables | ( | ) | ( | ) | |||||||
Payables to brokerage customers | ( | ) | ( | ) | |||||||
Accrued expenses and other payables | ( | ) | |||||||||
Total Operating Activities | ( | ) | ( | ) | ( | ) | |||||
Investing Activities | |||||||||||
Purchases of property, plant, and equipment | ( | ) | ( | ) | ( | ) | |||||
Net assets of businesses acquired | ( | ) | ( | ) | ( | ) | |||||
Proceeds from sale of business and assets | |||||||||||
Investments in and advances to affiliates | ( | ) | ( | ) | ( | ) | |||||
Investments in retained interest in securitized receivables | ( | ) | ( | ) | ( | ) | |||||
Proceeds from retained interest in securitized receivables | |||||||||||
Purchases of marketable securities | ( | ) | ( | ) | |||||||
Proceeds from sales of marketable securities | |||||||||||
Other – net | ( | ) | ( | ) | |||||||
Total Investing Activities | |||||||||||
Financing Activities | |||||||||||
Long-term debt borrowings | |||||||||||
Long-term debt payments | ( | ) | ( | ) | ( | ) | |||||
Net borrowings (payments) under lines of credit agreements | ( | ) | |||||||||
Share repurchases | ( | ) | ( | ) | ( | ) | |||||
Cash dividends | ( | ) | ( | ) | ( | ) | |||||
Other – net | ( | ) | |||||||||
Total Financing Activities | ( | ) | ( | ) | |||||||
Increase (decrease) in cash, cash equivalents, restricted cash, and restricted cash equivalents | ( | ) | |||||||||
Cash, cash equivalents, restricted cash, and restricted cash equivalents – beginning of year | |||||||||||
Cash, cash equivalents, restricted cash, and restricted cash equivalents – end of year | $ | $ | $ | ||||||||
Reconciliation of cash, cash equivalents, restricted cash, and restricted cash equivalents to the consolidated balance sheets | |||||||||||
Cash and cash equivalents | $ | $ | $ | ||||||||
Restricted cash and restricted cash equivalents included in segregated cash and investments | |||||||||||
Total cash, cash equivalents, restricted cash, and restricted cash equivalents | $ | $ | $ | ||||||||
Cash paid for interest and income taxes were as follows: | |||||||||||
Interest | $ | $ | $ | ||||||||
Income taxes | $ | $ | $ | ||||||||
Supplemental Disclosure of Noncash Investing Activity: | |||||||||||
Retained interest in securitized receivables | $ | $ | $ | ||||||||
See notes to consolidated financial statements.
54
Archer-Daniels-Midland Company
Consolidated Statements of Shareholders’ Equity
Accumulated Other | Total | |||||||||||||||||||||
Common Stock | Reinvested | Comprehensive | Noncontrolling | Shareholders’ | ||||||||||||||||||
Shares | Amount | Earnings | Income (Loss) | Interests | Equity | |||||||||||||||||
(In millions) | ||||||||||||||||||||||
Balance, December 31, 2016 | $ | $ | $ | ( | ) | $ | $ | |||||||||||||||
Impact of ASU 2016-16 | ( | ) | ( | ) | ||||||||||||||||||
Balance, January 1, 2017 | ( | ) | ||||||||||||||||||||
Comprehensive income | ||||||||||||||||||||||
Net earnings | ||||||||||||||||||||||
Other comprehensive income (loss) | ||||||||||||||||||||||
Total comprehensive income | ||||||||||||||||||||||
Cash dividends paid-$ | ( | ) | ( | ) | ||||||||||||||||||
Treasury stock purchases | ( | ) | ( | ) | ( | ) | ||||||||||||||||
Stock compensation expense | ||||||||||||||||||||||
Other | ( | ) | ( | ) | ||||||||||||||||||
Balance, December 31, 2017 | $ | $ | $ | ( | ) | $ | $ | |||||||||||||||
Comprehensive income | ||||||||||||||||||||||
Net earnings | ||||||||||||||||||||||
Other comprehensive income (loss) | ( | ) | ||||||||||||||||||||
Total comprehensive income | ||||||||||||||||||||||
Cash dividends paid-$ | ( | ) | ( | ) | ||||||||||||||||||
Share repurchases | ( | ) | ( | ) | ( | ) | ||||||||||||||||
Stock compensation expense | ||||||||||||||||||||||
Other | ||||||||||||||||||||||
Balance, December 31, 2018 | $ | $ | $ | ( | ) | $ | $ | |||||||||||||||
Comprehensive income | ||||||||||||||||||||||
Net earnings | ||||||||||||||||||||||
Other comprehensive income (loss) | ( | ) | ||||||||||||||||||||
Total comprehensive income | ||||||||||||||||||||||
Cash dividends paid-$ | ( | ) | ( | ) | ||||||||||||||||||
Share repurchases | ( | ) | ( | ) | ( | ) | ||||||||||||||||
Stock compensation expense | ||||||||||||||||||||||
Other | ( | ) | ( | ) | ||||||||||||||||||
Balance, December 31, 2019 | $ | $ | $ | ( | ) | $ | $ | |||||||||||||||
See notes to consolidated financial statements.
55
Archer-Daniels-Midland Company
Notes to Consolidated Financial Statements
Note 1. Summary of Significant Accounting Policies
Nature of Business
ADM is a global leader in human and animal nutrition and one of the world’s premier agricultural origination and processing company. It is one of the world’s leading producers of ingredients for human and animal nutrition, and other products made from nature.
Principles of Consolidation
The consolidated financial statements include the accounts of the Company and its subsidiaries. All significant intercompany accounts and transactions have been eliminated. The Company consolidates all entities, including variable interest entities (VIEs), in which it has a controlling financial interest. For VIEs, the Company assesses whether it is the primary beneficiary as defined under the applicable accounting standard. Investments in affiliates, including VIEs through which the Company exercises significant influence but does not control the investee and is not the primary beneficiary of the investee’s activities, are carried at cost plus equity in undistributed earnings since acquisition and are adjusted, where appropriate, for basis differences between the investment balance and the underlying net assets of the investee. The Company’s portion of the results of certain affiliates and results of certain VIEs are included using the most recent available financial statements. In each case, the financial statements are within 93 days of the Company’s year-end and are consistent from period to period.
The preparation of consolidated financial statements in conformity with generally accepted accounting principles (GAAP) requires management to make estimates and assumptions that affect amounts reported in its consolidated financial statements and accompanying notes. Actual results could differ from those estimates.
Reclassifications
Effective July 1, 2019, the Company changed its segment reporting to reflect the creation of the combined Ag Services and Oilseeds segment. The former Origination and Oilseeds businesses were merged into a combined Ag Services and Oilseeds segment which enables the Company to better respond to market changes by integrating the supply and value chains and risk management, while delivering significant simplification and efficiency to the day-to-day business. As part of the Company’s efforts for a streamlined management structure, the combined segment is led by the former President of Oilseeds expanding his role to President of Ag Services and Oilseeds.
Prior period results have been reclassified to conform to the current period segment presentation.
Cash Equivalents
The Company considers all non-segregated, highly-liquid investments with a maturity of three months or less at the time of purchase to be cash equivalents.
Segregated Cash and Investments
The Company segregates certain cash, cash equivalents, and investment balances in accordance with regulatory requirements, commodity exchange requirements, and insurance arrangements. These balances represent deposits received from customers of the Company’s registered futures commission merchant and commodity brokerage services, cash margins and securities pledged to commodity exchange clearinghouses, and cash pledged as security under certain insurance arrangements. Segregated cash and investments also include restricted cash collateral for the various insurance programs of the Company’s captive insurance business. To the degree these segregated balances are comprised of cash and cash equivalents, they are considered restricted cash and cash equivalents on the statement of cash flows.
56
Archer-Daniels-Midland Company
Notes to Consolidated Financial Statements (Continued)
Note 1. Summary of Significant Accounting Policies (Continued)
Receivables
The Company records accounts receivable at net realizable value. This value includes an allowance for estimated uncollectible accounts of $110 million and $84 million at December 31, 2019 and 2018, respectively, to reflect any loss anticipated on the accounts receivable balances. The Company estimates this allowance based on its history of write-offs, level of past-due accounts, and its relationships with, and the economic status of, its customers. Portions of the allowance for uncollectible accounts are recorded in trade receivables, other current assets, and other assets.
Credit risk on receivables is minimized as a result of the large and diversified nature of the Company’s worldwide customer base. The Company manages its exposure to counter-party credit risk through credit analysis and approvals, credit limits, and monitoring procedures. Collateral is generally not required for the Company’s receivables.
Accounts receivable due from unconsolidated affiliates as of December 31, 2019 and 2018 was $156 million and $146 million, respectively.
Inventories of certain merchandisable agricultural commodities, which include inventories acquired under deferred pricing contracts, are stated at market value. In addition, the Company values certain inventories using the lower of cost, determined by either the first-in, first-out (FIFO) or last-in, first-out (LIFO) methods, or net realizable value.
The following table sets forth the Company’s inventories as of December 31, 2019 and 2018.
December 31, 2019 | December 31, 2018 | ||||||
(In millions) | |||||||
LIFO inventories | |||||||
FIFO value | $ | $ | |||||
LIFO valuation reserve | ( | ) | ( | ) | |||
LIFO inventories carrying value | |||||||
FIFO inventories | |||||||
Market inventories | |||||||
Supplies and other inventories | |||||||
Total inventories | $ | $ | |||||
57
Archer-Daniels-Midland Company
Notes to Consolidated Financial Statements (Continued)
Note 1. Summary of Significant Accounting Policies (Continued)
Fair Value Measurements
The Company determines fair value based on the price that would be received to sell an asset or paid to transfer a liability in an orderly transaction between market participants at the measurement date. The Company uses the market approach valuation technique to measure the majority of its assets and liabilities carried at fair value. Three levels are established within the fair value hierarchy that may be used to report fair value: Level 1: Quoted prices (unadjusted) in active markets for identical assets or liabilities. Level 2: Observable inputs, including Level 1 prices that have been adjusted; quoted prices for similar assets or liabilities; quoted prices in markets that are less active than traded exchanges; and other inputs that are observable or can be substantially corroborated by observable market data. Level 3: Unobservable inputs that are supported by little or no market activity and that are a significant component of the fair value of the assets or liabilities. In evaluating the significance of fair value inputs, the Company generally classifies assets or liabilities as Level 3 when their fair value is determined using unobservable inputs that individually or when aggregated with other unobservable inputs, represent more than 10% of the fair value of the assets or liabilities. Judgment is required in evaluating both quantitative and qualitative factors in the determination of significance for purposes of fair value level classification. Level 3 amounts can include assets and liabilities whose value is determined using pricing models, discounted cash flow methodologies, or similar techniques, as well as assets and liabilities for which the determination of fair value requires significant management judgment or estimation.
Based on historical experience with the Company’s suppliers and customers, the Company’s own credit risk and knowledge of current market conditions, the Company does not view nonperformance risk to be a significant input to fair value for the majority of its forward commodity purchase and sale contracts. However, in certain cases, if the Company believes the nonperformance risk to be a significant input, the Company records estimated fair value adjustments, and classifies the measurement in Level 3.
In many cases, a valuation technique used to measure fair value includes inputs from multiple levels of the fair value hierarchy. The lowest level of input that is a significant component of the fair value measurement determines the placement of the entire fair value measurement in the hierarchy. The Company’s assessment of the significance of a particular input to the fair value measurement requires judgment, and may affect the classification of fair value assets and liabilities within the fair value hierarchy levels.
The Company’s policy regarding the timing of transfers between levels, including both transfers into and transfers out of Level 3, is to measure and record the transfers at the end of the reporting period.
Derivatives
The Company recognizes all of its derivative instruments as either assets or liabilities at fair value in its consolidated balance sheet. Unrealized gains are reported as other current assets and unrealized losses are reported as accrued expenses and other payables. The accounting for changes in the fair value (i.e., gains or losses) of a derivative instrument depends on whether it has been designated and qualifies as part of a hedging relationship and on the type of hedging relationship. The majority of the Company’s derivatives have not been designated as hedging instruments, and as such, changes in fair value of these derivatives are recognized in earnings immediately. For those derivative instruments that are designated and qualify as hedging instruments, the Company designates the hedging instrument, based upon the exposure being hedged, as a fair value hedge, a cash flow hedge, or a net investment hedge.
For derivative instruments that are designated and qualify as highly-effective cash flow hedges (i.e., hedging the exposure to variability in expected future cash flows that is attributable to a particular risk), the gain or loss on the derivative instrument is reported as a component of accumulated other comprehensive income (loss) (AOCI) and as an operating activity in the statement of cash flows and reclassified into earnings in the same line item affected by the hedged transaction and in the same period or periods during which the hedged transaction affects earnings. Hedge components excluded from the assessment of effectiveness and gains and losses related to discontinued hedges are recognized in the consolidated statement of earnings during the current period.
For derivative instruments that are designated and qualify as fair value hedges, changes in the fair value of the hedging instrument and changes in the fair value of the hedged item are recognized in the consolidated statement of earnings during the current period.
58
Archer-Daniels-Midland Company
Notes to Consolidated Financial Statements (Continued)
Note 1. Summary of Significant Accounting Policies (Continued)
For derivative instruments that are designated and qualify as net investment hedges, foreign exchange gains and losses related to changes in foreign currency exchange rates are deferred in AOCI until the underlying investment is divested.
Property, Plant, and Equipment
Property, plant, and equipment is recorded at cost. Repair and maintenance costs are expensed as incurred. The Company generally uses the straight-line method in computing depreciation for financial reporting purposes and generally uses accelerated methods for income tax purposes. The annual provisions for depreciation have been computed principally in accordance with the following ranges of asset lives: buildings - 15 to 40 years; machinery and equipment - 3 to 40 years. The Company capitalized interest on major construction projects in progress of $15 million, $21 million, and $17 million for the years ended December 31, 2019, 2018, and 2017, respectively.
Income Taxes
The Company accounts for income taxes in accordance with the liability method. Deferred tax assets and liabilities are recorded for temporary differences between the tax basis of assets and liabilities and reported amounts in the consolidated financial statements using statutory rates in effect for the year in which the differences are expected to reverse. The effect on deferred tax assets and liabilities of a change in tax rates is recorded in the results of operations in the period that includes the enactment date under the law. Applicable accounting standards prescribe a minimum threshold a tax position is required to meet before being recognized in the consolidated financial statements. The Company recognizes in its consolidated financial statements tax positions determined more likely than not to be sustained upon examination, based on the technical merits of the position.
The Company classifies interest on income tax-related balances as interest expense and classifies tax-related penalties as selling, general, and administrative expenses.
Goodwill and other intangible assets
Goodwill and other intangible assets deemed to have indefinite lives are not amortized but are subject to annual impairment tests. Definite-lived intangible assets, including capitalized expenses related to the Company's 1ADM program, are amortized over their estimated useful lives of 2 to 50 years and are reviewed for impairment whenever there are indicators that the carrying value of the assets may not be fully recoverable. The Company’s accounting policy is to evaluate goodwill and other intangible assets with indefinite lives for impairment on October 1 of each fiscal year or whenever there are indicators that the carrying value of the assets may not be fully recoverable. The Company recorded impairment charges of $11 million related to goodwill and intangibles, and $9 million related to customer lists during the years ended December 31, 2019 and 2018, respectively. There were no impairment charges recorded for goodwill and intangible assets during the year ended December 31, 2017 (see Note 9 for additional information).
The Company evaluates long-lived assets for impairment whenever indicators of impairment exist. Assets are written down to fair value after consideration of the Company’s ability to utilize the assets for their intended purpose, employ the assets in alternative uses, or sell the assets to recover the carrying value. Fair value is generally based on discounted cash flow analysis which relies on management’s estimate of market participant assumptions or estimated selling price for assets considered held for sale (a Level 3 measurement under applicable accounting standards). During the years ended December 31, 2019, 2018, and 2017, impairment charges were $131 million, $100 million, and $101 million, respectively.
59
Archer-Daniels-Midland Company
Notes to Consolidated Financial Statements (Continued)
Note 1. Summary of Significant Accounting Policies (Continued)
Payables to Brokerage Customers
Payables to brokerage customers represent the total of customer accounts at the Company’s futures commission merchant with credit or positive balances. Customer accounts are used primarily in connection with commodity transactions and include gains and losses on open commodity trades as well as securities and other deposits made for margins or other purposes as required by the Company or the exchange-clearing organizations or counterparties. Payables to brokerage customers have a corresponding balance in segregated cash and investments and customer omnibus receivable in other current assets.
Revenues
The Company follows a policy of recognizing revenue at a single point in time when it satisfies its performance obligation by transferring control over a product or service to a customer. For transportation service contracts, the Company recognizes revenue over time as the barge, ocean-going vessel, truck, rail, or container freight moves towards its destination in accordance with the transfer of control guidance of ASC Topic 606, Revenue from Contracts with Customers (Topic 606). For physically settled derivative sales contracts that are outside the scope of Topic 606, the Company recognizes revenue when control of the inventory is transferred within the meaning of Topic 606 as required by ASC 610-20, Gains and Losses from the Derecognition of Nonfinancial Assets (Topic 610-20).
Net sales to unconsolidated affiliates during the years ended December 31, 2019, 2018, and 2017 were $4.9 billion, $5.6 billion, and $5.2 billion, respectively.
Stock Compensation
The Company recognizes expense for its stock compensation based on the fair value of the awards that are granted. The Company’s stock compensation plans provide for the granting of restricted stock, restricted stock units, performance stock units, and stock options. The fair values of stock options and performance stock units are estimated at the date of grant using the Black-Scholes option valuation model and a lattice valuation model, respectively. These valuation models require the input of subjective assumptions. Measured compensation cost, net of forfeitures, is recognized ratably over the vesting period of the related stock compensation award.
Research and Development
Costs associated with research and development are expensed as incurred. Such costs incurred, net of expenditures subsequently reimbursed by government grants, were $154 million, $141 million, and $129 million for the years ended December 31, 2019, 2018, and 2017, respectively.
Per Share Data
Basic earnings per common share are determined by dividing net earnings attributable to controlling interests by the weighted average number of common shares outstanding. In computing diluted earnings per share, average number of common shares outstanding is increased by common stock options outstanding with exercise prices lower than the average market price of common shares using the treasury share method.
60
Archer-Daniels-Midland Company
Notes to Consolidated Financial Statements (Continued)
Note 1. Summary of Significant Accounting Policies (Continued)
Business Combinations
The Company’s acquisitions are accounted for in accordance with ASC Topic 805, Business Combinations, as amended. The consideration transferred is allocated to various assets acquired and liabilities assumed at their estimated fair values as of the acquisition date with the residual allocated to goodwill. Fair values allocated to assets acquired and liabilities assumed in business combinations require management to make significant judgments, estimates, and assumptions, especially with respect to intangible assets. Management makes estimates of fair values based upon assumptions it believes to be reasonable. These are estimates are based upon historical experience and information obtained from the management of the acquired companies and are inherently uncertain. The estimated fair values related to intangible assets primarily consist of customer relationships, trademarks, and developed technology which are determined primarily using discounted cash flow models. Estimates in the discounted cash flow models include, but are not limited to, certain assumptions that form the basis of the forecasted results (e.g. revenue growth rates, customer attrition rates, and royalty rates). These significant assumptions are forward looking and could be affected by future economic and market conditions. During the measurement period, which may take up to one year from the acquisition date, adjustments due to changes in the estimated fair value of assets acquired and liabilities assumed may be recorded as adjustments to the consideration transferred and the related allocations. Upon the conclusion of the measurement period or the final determination of the values of assets acquired and liabilities assumed, whichever comes first, any such adjustments are charged to the consolidated statements of earnings.
Adoption of New Accounting Standards
Effective January 1, 2019, the Company adopted the new guidance of Accounting Standards Codification (ASC) Topic 842, Leases (Topic 842), which superseded ASC Topic 840, Leases. Topic 842 requires lessees to recognize assets and liabilities for all leases. The Company adopted Topic 842 using the optional transition method that allows entities to forgo the comparative reporting requirements under the modified retrospective transition method. In addition, the Company elected to apply the package of practical expedients that allows entities to forgo reassessing at the transition date: (1) whether any expired or existing contracts are or contain leases; (2) lease classification for any expired or existing leases; and (3) whether unamortized initial direct costs for existing leases meet the definition of initial direct costs under the new guidance. The Company also elected to use the practical expedient that allows the combination of lease and non-lease contract components in all of its underlying asset categories, as well as the optional transition practical expedient that permits entities to continue applying current accounting policy for land easements that existed as of or expired before January 1, 2019. The adoption of Topic 842 resulted in the recording of right-of-use assets and lease liabilities of $793 million and $795 million, respectively, at January 1, 2019. The new guidance did not have a material impact on the Company’s consolidated statement of earnings and had no impact on the consolidated statement of cash flows. For more information about the adoption of Topic 842, see Note 14.
Effective January 1, 2019, the Company adopted the amended guidance of ASC Topic 220, Income Statement - Reporting Comprehensive Income (Topic 220), which allows the reclassification from accumulated other comprehensive income (AOCI) to retained earnings for stranded tax effects resulting from the Tax Cuts and Jobs Act (the Act), eliminating the stranded tax effects resulting from the Act and improving the usefulness of information reported to financial statement users. In addition, the Company is required to disclose: (1) a description of its accounting policy for releasing income tax effects from AOCI; (2) whether it elects to reclassify the stranded income tax effects from the Act; and (3) information about other income tax effects related to the application of the Act that are reclassified from AOCI to retained earnings, if any. The Company’s accounting policy is to release income tax effects from AOCI when individual units of account are sold, terminated, or extinguished. However, the Company has elected to not release from AOCI the stranded income tax effects resulting from the Act.
61
Archer-Daniels-Midland Company
Notes to Consolidated Financial Statements (Continued)
Note 1. Summary of Significant Accounting Policies (Continued)
Pending Accounting Standards
Effective January 1, 2020, the Company will be required to adopt the amended guidance of ASC Topic 326, Financial Instruments - Credit Losses, which is intended to improve financial reporting by requiring more timely recording of credit losses on loans and other financial instruments held by financial institutions and other organizations. The amended guidance replaces today’s “incurred loss” approach with an “expected loss” model and requires the measurement of all expected credit losses for financial assets held at the reporting date based on historical experience, current conditions, and reasonable and supportable forecasts. The Company will be required to adopt the amended guidance on a modified retrospective basis through a cumulative effect adjustment to retained earnings as of the beginning of the period of adoption. The Company evaluated its current methodology of estimating allowance for doubtful accounts and the risk profile of its receivable portfolio and developed a model that includes the qualitative and forecasting aspects of the “expected loss” model under the amended guidance. The Company finalized its assessment of the impact of the amended guidance and expects to record an immaterial cumulative effect adjustment to retained earnings at January 1, 2020.
Effective January 1, 2020, the Company will be required to adopt the amended guidance of ASC Topic 820, Fair Value Measurement, which modifies the disclosure requirements on fair value measurements. Early adoption is permitted. The adoption of this amended guidance will not impact the Company’s financial results.
Effective December 31, 2020, the Company will be required to adopt the amended guidance of ASC Subtopic 715-20, Compensation - Retirement Benefits - Defined Benefit Plans - General, which modifies the disclosure requirements for employers that sponsor defined benefit pension or other postretirement plans. Early adoption is permitted. The adoption of this amended guidance will not impact the Company’s financial results.
Effective January 1, 2021, the Company will be required to adopt the amended guidance of ASC Topic 740, Income Taxes (Topic 740), which simplifies the accounting for income taxes by removing certain exceptions to the general principles in Topic 740. The amendments also improve consistent application of and simplify GAAP for other areas of Topic 740 by clarifying and amending existing guidance. Early adoption is permitted. The Company has not yet completed its assessment of the impact of the amended guidance on the consolidated financial statements but does not expect the adoption of the amendments to have a significant impact on its financial results.
Note 2. Revenues
Revenue Recognition
The Company principally generates revenue from merchandising and transporting agricultural commodities and manufactured products used as ingredients in food, feed, energy, and industrial products. Revenue is measured based on the consideration specified in the contract with a customer, and excludes any sales incentives and amounts collected on behalf of third parties. The Company follows a policy of recognizing revenue at a single point in time when it satisfies its performance obligation by transferring control over a product or service to a customer. The majority of the Company’s contracts with customers have one performance obligation and a contract duration of one year or less. The Company applies the practical expedient in paragraph 10-50-14 of ASC 606, Revenue from Contracts with Customers (“Topic 606”) and does not disclose information about remaining performance obligations that have original expected durations of one year or less. For transportation service contracts, the Company recognizes revenue over time as the barge, ocean-going vessel, truck, rail, or container freight moves towards its destination in accordance with the transfer of control guidance of Topic 606. The Company recognized revenue from transportation service contracts of $515 million and $481 million for the years ended December 31, 2019 and 2018, respectively. For physically settled derivative sales contracts that are outside the scope of Topic 606, the Company recognizes revenue when control of the inventory is transferred within the meaning of Topic 606 as required by ASC 610-20, Gains and Losses from the Derecognition of Nonfinancial Assets (“Topic 610-20”).
Shipping and Handling Costs
Shipping and handling costs related to contracts with customers for the sale of goods are accounted for as a fulfillment activity and are included in cost of products sold. Accordingly, amounts billed to customers for such costs are included as a component of revenues.
62
Archer-Daniels-Midland Company
Notes to Consolidated Financial Statements (Continued)
Note 2. Revenues (Continued)
Taxes Collected from Customers and Remitted to Governmental Authorities
The Company does not include taxes assessed by governmental authorities that are (i) imposed on and concurrent with a specific revenue-producing transaction and (ii) collected from customers, in the measurement of transactions prices or as a component of revenues and cost of products sold.
Contract Liabilities
Contract liabilities relate to advance payments from customers for goods and services that the Company has yet to provide. Contract liabilities of $604 million and $501 million as of December 31, 2019 and 2018, respectively, were recorded in accrued expenses and other payables in the consolidated balance sheet. Contract liabilities recognized as revenues for the years ended December 31, 2019 and 2018 were $575 million and $647 million, respectively.
Disaggregation of Revenues
The following tables present revenue disaggregated by timing of recognition and major product lines for the years ended December 31, 2019 and 2018.
Year Ended December 31, 2019 | |||||||||||||||
Topic 606 Revenue | Topic 815(1) | Total | |||||||||||||
Point in Time | Over Time | Total | Revenue | Revenues | |||||||||||
(In millions) | |||||||||||||||
Ag Services and Oilseeds | |||||||||||||||
Ag Services | $ | $ | $ | $ | $ | ||||||||||
Crushing | — | ||||||||||||||
Refined Products and Other | — | ||||||||||||||
Total Ag Services and Oilseeds | |||||||||||||||
Carbohydrate Solutions | |||||||||||||||
Starches and Sweeteners | — | ||||||||||||||
Bioproducts | — | — | |||||||||||||
Total Carbohydrate Solutions | — | ||||||||||||||
Nutrition | |||||||||||||||
Wild Flavors and Specialty Ingredients | — | — | |||||||||||||
Animal Nutrition | — | — | |||||||||||||
Total Nutrition | — | — | |||||||||||||
Other | — | — | |||||||||||||
Total Revenues | $ | $ | $ | $ | $ | ||||||||||
63
Archer-Daniels-Midland Company
Notes to Consolidated Financial Statements (Continued)
Note 2. Revenues (Continued)
Year Ended December 31, 2018 | |||||||||||||||
Topic 606 Revenue | Topic 815(1) | Total | |||||||||||||
Point in Time | Over Time | Total | Revenue | Revenues | |||||||||||
(In millions) | |||||||||||||||
Ag Services and Oilseeds | |||||||||||||||
Ag Services | $ | $ | $ | $ | $ | ||||||||||
Crushing | — | ||||||||||||||
Refined Products and Other | — | ||||||||||||||
Total Ag Services and Oilseeds | |||||||||||||||
Carbohydrate Solutions | |||||||||||||||
Starches and Sweeteners | — | ||||||||||||||
Bioproducts | — | — | |||||||||||||
Total Carbohydrate Solutions | — | ||||||||||||||
Nutrition | |||||||||||||||
Wild Flavors and Specialty Ingredients | — | — | |||||||||||||
Animal Nutrition | — | — | |||||||||||||
Total Nutrition | — | — | |||||||||||||
Other | — | — | |||||||||||||
Total Revenues | $ | $ | $ | $ | $ | ||||||||||
(1) Topic 815 revenue relates to the physical delivery or the settlement of the Company’s sales contracts that are accounted for as derivatives and are outside the scope of Topic 606.
Ag Services and Oilseeds
The Ag Services and Oilseeds segment generates revenue from the sale of commodities, from service fees for the transportation of goods, and from the sale of products manufactured in its global processing facilities. Revenue is measured based on the consideration specified in the contract and excludes any sales incentives and amounts collected on behalf of third parties. Revenue is recognized when a performance obligation is satisfied by transferring control over a product or providing service to a customer. For transportation service contracts, the Company recognizes revenue over time as the barge, ocean-going vessel, truck, rail, or container freight moves towards its destination in accordance with the transfer of control guidance of Topic 606. The amount of revenue recognized follows the contractually specified price which may include freight or other contractually specified cost components. For physically settled derivative sales contracts that are outside the scope of Topic 606, the Company recognizes revenue when control of the inventory is transferred within the meaning of Topic 606 as required by Topic 610-20.
Carbohydrate Solutions
The Carbohydrate Solutions segment generates revenue from the sale of products manufactured at the Company’s global corn and wheat milling facilities around the world. Revenue is recognized when control over products is transferred to the customer. Products are shipped to customers from the Company’s various facilities and from its network of storage terminals. The amount of revenue recognized is based on the consideration specified in the contract which could include freight and other costs depending on the specific shipping terms of each contract. For physically settled derivative sales contracts that are outside the scope of Topic 606, the Company recognizes revenue when control of the inventory is transferred within the meaning of Topic 606 as required by Topic 610-20.
64
Archer-Daniels-Midland Company
Notes to Consolidated Financial Statements (Continued)
Note 2. Revenues (Continued)
Nutrition
The Nutrition segment sells specialty products including natural flavor ingredients, flavor systems, natural colors, animal nutrition products, and other specialty food and feed ingredients. Revenue is recognized when control over products is transferred to the customer. The amount of revenue recognized follows the contracted price or the mutually agreed price of the product. Freight and shipping are recognized as a component of revenue at the same time control transfers to the customer.
Other
Other includes the Company’s futures commission business whose primary sources of revenue are commissions and brokerage income generated from executing orders and clearing futures contracts and options on futures contracts on behalf of its customers. Commissions and brokerage revenue are recognized on the date the transaction is executed. Other also includes the Company’s captive insurance business which generates third party revenue through its proportionate share of premiums from third-party reinsurance pools. Reinsurance premiums are recognized on a straight-line basis over the period underlying the policy.
Note 3. Acquisitions
Operating results of acquisitions are included in the Company’s financial statements from the date of acquisition and were not significant for the year ended December 31, 2019. Goodwill allocated in connection with the acquisitions is primarily attributable to synergies expected to arise after the Company’s acquisition of the businesses.
Fiscal year 2019 acquisitions
During the year ended December 31, 2019, the Company acquired Neovia SAS (“Neovia”), Florida Chemical Company (“FCC”), The Ziegler Group (“Ziegler”), and the remaining 50 % interest in Gleadell Agriculture Ltd (“Gleadell”), for an aggregate consideration of $2.0 billion in cash. The aggregate consideration of these acquisitions, net of $95 million in cash acquired, plus the $15 million acquisition-date value of the Company’s previously held equity interest in Gleadell, were allocated as follows, subject to final adjustments related to Neovia:
(In millions) | Neovia | FCC | Ziegler | Gleadell | Total | ||||||||||
Working capital | $ | $ | $ | $ | ( | ) | $ | ||||||||
Property, plant, and equipment | |||||||||||||||
Goodwill | |||||||||||||||
Other intangible assets | |||||||||||||||
Other long-term assets | |||||||||||||||
Long-term liabilities | ( | ) | ( | ) | ( | ) | ( | ) | ( | ) | |||||
Aggregate cash consideration, net of cash acquired, plus acquisition-date fair value of previously held equity interest | $ | $ | $ | $ | $ | ||||||||||
Of the $900 million allocated to goodwill, $94 million is expected to be deductible for tax purposes.
The Company recognized pre-tax gains of $4 million on the Gleadell transaction, representing the difference between the carrying value and acquisition-date fair value of the Company’s previously held equity interest. The acquisition-date fair value was determined based on a discounted cash flow analysis using market participant assumptions (a Level 3 measurement under applicable accounting standards).
65
Archer-Daniels-Midland Company
Notes to Consolidated Financial Statements (Continued)
Note 3. Acquisitions (Continued)
The following table sets forth the fair values and the useful lives of the other intangible assets acquired.
Useful Lives | Neovia | FCC | Ziegler | Total | |||||||||||
(In years) | (In millions) | ||||||||||||||
Intangible assets with indefinite lives: | |||||||||||||||
Trademarks/brands | $ | $ | — | $ | — | $ | |||||||||
Intangible assets with finite lives: | |||||||||||||||
Trademarks/brands | to | ||||||||||||||
Customer lists | to | ||||||||||||||
Other intellectual property | to | ||||||||||||||
Total other intangible assets acquired | $ | $ | $ | $ | |||||||||||
The Neovia, FCC, and Ziegler acquisitions are in line with the Company’s strategy to become one of the world’s leading nutrition companies. The post-acquisition financial results of these acquisitions are reported in the Nutrition segment.
Fiscal year 2018 acquisitions
During the year ended December 31, 2018, the Company acquired Probiotics International Limited (also known as Protexin), a British-based provider of probiotic supplements for human, pet, and production-animal uses, Rodelle Inc., a premium originator, processor and supplier of vanilla products, and certain soybean origination, crushing, refining, and bottling assets of Brazil-based Algar Agro, for an aggregate consideration of $506 million in cash. The aggregate consideration of these acquisitions, net of $42 million in cash acquired, was allocated as follows:
(In millions) | |||
Working capital | $ | ||
Property, plant, and equipment | |||
Goodwill | |||
Other intangible assets | |||
Other long-term assets | |||
Deferred tax liabilities | ( | ) | |
Noncontrolling interest | ( | ) | |
Aggregate cash consideration, net of cash acquired | $ | ||
The acquisitions of Protexin and Rodelle Inc. expand the Company's wide portfolio of health and wellness offerings for both human and animal nutrition consumers.
Fiscal year 2017 acquisitions
66
Archer-Daniels-Midland Company
Notes to Consolidated Financial Statements (Continued)
Note 4. Fair Value Measurements
The following tables set forth, by level, the Company’s assets and liabilities that were accounted for at fair value on a recurring basis as of December 31, 2019 and 2018.
Fair Value Measurements at December 31, 2019 | |||||||||||||||
Quoted Prices in Active Markets for Identical Assets (Level 1) | Significant Other Observable Inputs (Level 2) | Significant Unobservable Inputs (Level 3) | Total | ||||||||||||
(In millions) | |||||||||||||||
Assets: | |||||||||||||||
Inventories carried at market | $ | $ | $ | $ | |||||||||||
Unrealized derivative gains: | |||||||||||||||
Commodity contracts | |||||||||||||||
Foreign exchange contracts | |||||||||||||||
Interest rate contracts | |||||||||||||||
Cash equivalents | — | — | |||||||||||||
Marketable securities | |||||||||||||||
Segregated investments | — | ||||||||||||||
Deferred consideration | |||||||||||||||
Total Assets | $ | $ | $ | $ | |||||||||||
Liabilities: | |||||||||||||||
Unrealized derivative losses: | |||||||||||||||
Commodity contracts | $ | $ | $ | $ | |||||||||||
Foreign exchange contracts | |||||||||||||||
Interest rate contracts | |||||||||||||||
Inventory-related payables | |||||||||||||||
Total Liabilities | $ | $ | $ | $ | |||||||||||
67
Archer-Daniels-Midland Company
Notes to Consolidated Financial Statements (Continued)
Note 4. Fair Value Measurements (Continued)
Fair Value Measurements at December 31, 2018 | |||||||||||||||
Quoted Prices in Active Markets for Identical Assets (Level 1) | Significant Other Observable Inputs (Level 2) | Significant Unobservable Inputs (Level 3) | Total | ||||||||||||
(In millions) | |||||||||||||||
Assets: | |||||||||||||||
Inventories carried at market | $ | $ | $ | $ | |||||||||||
Unrealized derivative gains: | |||||||||||||||
Commodity contracts | |||||||||||||||
Foreign currency contracts | |||||||||||||||
Cash equivalents | — | — | |||||||||||||
Marketable securities | |||||||||||||||
Segregated investments | — | — | |||||||||||||
Deferred consideration | |||||||||||||||
Total Assets | $ | $ | $ | $ | |||||||||||
Liabilities: | |||||||||||||||
Unrealized derivative losses: | |||||||||||||||
Commodity contracts | $ | $ | $ | $ | |||||||||||
Foreign currency contracts | |||||||||||||||
Interest rate contracts | |||||||||||||||
Inventory-related payables | |||||||||||||||
Total Liabilities | $ | $ | $ | $ | |||||||||||
Estimated fair values for inventories carried at market are based on exchange-quoted prices, adjusted for differences in local markets and quality, referred to as basis. Market valuations for the Company’s inventories are adjusted for location and quality (basis) because the exchange-quoted prices represent contracts that have standardized terms for commodity, quantity, future delivery period, delivery location, and commodity quality or grade. The basis adjustments are generally determined using inputs from broker or dealer quotations or market transactions in either the listed or over the counter (OTC) markets and are considered observable. In some cases, the basis adjustments are unobservable because they are supported by little to no market activity. When unobservable inputs have a significant impact on the measurement of fair value, the inventory is classified in Level 3. Changes in the fair value of inventories are recognized in the consolidated statements of earnings as a component of cost of products sold.
68
Archer-Daniels-Midland Company
Notes to Consolidated Financial Statements (Continued)
Note 4. Fair Value Measurements (Continued)
Derivative contracts include exchange-traded commodity futures and options contracts, forward commodity purchase and sale contracts, and OTC instruments related primarily to agricultural commodities, energy, interest rates, and foreign currencies. Exchange-traded futures and options contracts are valued based on unadjusted quoted prices in active markets and are classified in Level 1. The majority of the Company’s exchange-traded futures and options contracts are cash-settled on a daily basis and, therefore, are not included in these tables. Fair value for forward commodity purchase and sale contracts is estimated based on exchange-quoted prices adjusted for differences in local markets. Market valuations for the Company's forward commodity purchase and sale contracts are adjusted for location (basis) because the exchange-quoted prices represent contracts that have standardized terms for commodity, quantity, future delivery period, delivery location, and commodity quality or grade. The basis adjustments are generally determined using inputs from broker or dealer quotations or market transactions in either the listed or OTC markets and are considered observable. In some cases, the basis adjustments are unobservable because they are supported by little to no market activity. When observable inputs are available for substantially the full term of the contract, it is classified in Level 2. When unobservable inputs have a significant impact (more than 10%) on the measurement of fair value, the contract is classified in Level 3. Except for certain derivatives designated as cash flow hedges, changes in the fair value of commodity-related derivatives are recognized in the consolidated statements of earnings as a component of cost of products sold. Changes in the fair value of foreign currency-related derivatives are recognized in the consolidated statements of earnings as a component of revenues, cost of products sold, and other (income) expense - net, depending upon the purpose of the contract. The changes in the fair value of derivatives designated as effective cash flow hedges are recognized in the consolidated balance sheets as a component of accumulated other comprehensive income (loss) (AOCI) until the hedged items are recorded in earnings or it is probable the hedged transaction will no longer occur.
The Company’s cash equivalents are comprised of money market funds valued using quoted market prices and are classified as Level 1.
The Company’s marketable securities are comprised of U.S. Treasury securities and corporate debt securities. U.S. Treasury securities are valued using quoted market prices and are classified in Level 1. Corporate debt securities are valued using third-party pricing services and substantially all are classified in Level 2. Unrealized changes in the fair value of available-for-sale marketable debt securities are recognized in the consolidated balance sheets as a component of AOCI unless a decline in value is deemed to be other-than-temporary at which point the decline is recorded in earnings.
The Company’s segregated investments are comprised of U.S. Treasury securities. U.S. Treasury securities are valued using quoted market prices and are classified in Level 1.
The Company has deferred consideration under its accounts receivable securitization programs (the “Programs”) which represents notes receivable from the purchasers under the Programs (see Note 19). This amount is reflected in other current assets on the consolidated balance sheet (see Note 6). The Company carries the deferred consideration at fair value determined by calculating the expected amount of cash to be received. The fair value is principally based on observable inputs (a Level 2 measurement) consisting mainly of the face amount of the receivables adjusted for anticipated credit losses and discounted at the appropriate market rate. Receipt of deferred consideration is not subject to significant risks other than delinquencies and credit losses on accounts receivable transferred under the Programs which have historically been insignificant.
69
Archer-Daniels-Midland Company
Notes to Consolidated Financial Statements (Continued)
Note 4. Fair Value Measurements (Continued)
The following tables present a rollforward of the activity of all assets and liabilities measured at fair value on a recurring basis using significant unobservable inputs (Level 3) during the years ended December 31, 2019 and 2018.
Level 3 Fair Value Assets Measurements at December 31, 2019 | |||||||||||
Inventories Carried at Market | Commodity Derivative Contracts Gains | Total | |||||||||
(In millions) | |||||||||||
Balance, December 31, 2018 | $ | $ | $ | ||||||||
Total increase (decrease) in net realized/unrealized gains included in cost of products sold(1) | |||||||||||
Purchases | — | ||||||||||
Sales | ( | ) | — | ( | ) | ||||||
Settlements | — | ( | ) | ( | ) | ||||||
Transfers into Level 3 | |||||||||||
Transfers out of Level 3 | ( | ) | ( | ) | ( | ) | |||||
Ending balance, December 31, 2019 | $ | $ | $ | ||||||||
(1) Includes increase in unrealized gains of $900 million relating to Level 3 assets still held at December 31, 2019.
Level 3 Fair Value Liabilities Measurements at December 31, 2019 | |||||||||||
Inventory- related Payables | Commodity Derivative Contracts Losses | Total | |||||||||
(In millions) | |||||||||||
Balance, December 31, 2018 | $ | $ | $ | ||||||||
Total increase (decrease) in net realized/unrealized losses included in cost of products sold(1) | ( | ) | |||||||||
Purchases | |||||||||||
Sales | ( | ) | ( | ) | |||||||
Settlements | ( | ) | ( | ) | |||||||
Transfers into Level 3 | |||||||||||
Transfers out of Level 3 | ( | ) | ( | ) | |||||||
Ending balance, December 31, 2019 | $ | $ | $ | ||||||||
(1) Includes increase in unrealized losses of $7 million relating to Level 3 liabilities still held at December 31, 2019.
70
Archer-Daniels-Midland Company
Notes to Consolidated Financial Statements (Continued)
Note 4. Fair Value Measurements (Continued)
Level 3 Fair Value Assets Measurements at December 31, 2018 | |||||||||||
Inventories Carried at Market | Commodity Derivative Contracts Gains | Total | |||||||||
(In millions) | |||||||||||
Balance, December 31, 2017 | $ | $ | $ | ||||||||
Total increase (decrease) in net realized/unrealized gains included in cost of products sold(1) | |||||||||||
Purchases | — | ||||||||||
Sales | ( | ) | — | ( | ) | ||||||
Settlements | — | ( | ) | ( | ) | ||||||
Transfers into Level 3 | |||||||||||
Transfers out of Level 3 | ( | ) | ( | ) | ( | ) | |||||
Ending balance, December 31, 2018 | $ | $ | $ | ||||||||
(1) Includes increase in unrealized gains of $669 million relating to Level 3 assets still held at December 31, 2018.
Level 3 Fair Value Liabilities Measurements at December 31, 2018 | |||||||||||
Inventory- related Payables | Commodity Derivative Contracts Losses | Total | |||||||||
(In millions) | |||||||||||
Balance, December 31, 2017 | $ | $ | $ | ||||||||
Total increase (decrease) in net realized/unrealized losses included in cost of products sold(1) | |||||||||||
Purchases | |||||||||||
Sales | ( | ) | ( | ) | |||||||
Settlements | ( | ) | ( | ) | |||||||
Transfers into Level 3 | |||||||||||
Transfers out of Level 3 | ( | ) | ( | ) | |||||||
Ending balance, December 31, 2018 | $ | $ | $ | ||||||||
(1) Includes increase in unrealized losses of $532 million relating to Level 3 liabilities still held at December 31, 2018.
For all periods presented, the Company had no transfers between Levels 1 and 2. Transfers into Level 3 of assets and liabilities previously classified in Level 2 were due to the relative value of unobservable inputs to the total fair value measurement of certain products and derivative contracts rising above the 10% threshold. Transfers out of Level 3 were primarily due to the relative value of unobservable inputs to the total fair value measurement of certain products and derivative contracts falling below the 10% threshold and thus permitting reclassification to Level 2.
71
Archer-Daniels-Midland Company
Notes to Consolidated Financial Statements (Continued)
Note 4. Fair Value Measurements (Continued)
In some cases, the price components that result in differences between exchange-traded prices and local prices for inventories and commodity purchase and sale contracts are observable based upon available quotations for these pricing components, and in some cases, the differences are unobservable. These price components primarily include transportation costs and other adjustments required due to location, quality, or other contract terms. In the table below, these other adjustments are referred to as basis. The changes in unobservable price components are impacted by specific local supply and demand characteristics at each facility and the overall market. Factors such as substitute products, weather, fuel costs, contract terms, and futures prices also impact the movement of these unobservable price components.
The following table sets forth the weighted average percentage of the unobservable price components included in the Company’s Level 3 valuations as of December 31, 2019 and 2018. The Company’s Level 3 measurements may include basis only, transportation cost only, or both price components. As an example, for Level 3 inventories with basis, the unobservable component as of December 31, 2019 is a weighted average 28.2 % of the total price for assets and 14.7 % of the total price for liabilities.
Weighted Average % of Total Price | ||||||||
December 31, 2019 | December 31, 2018 | |||||||
Component Type | Assets | Liabilities | Assets | Liabilities | ||||
Inventories and Related Payables | ||||||||
Basis | ||||||||
Transportation cost | ||||||||
Commodity Derivative Contracts | ||||||||
Basis | ||||||||
Transportation cost | ||||||||
In certain of the Company’s principal markets, the Company relies on price quotes from third parties to value its inventories and physical commodity purchase and sale contracts. These price quotes are generally not further adjusted by the Company in determining the applicable market price. In some cases, availability of third-party quotes is limited to only one or two independent sources. In these situations, absent other corroborating evidence, the Company considers these price quotes as 100% unobservable and, therefore, the fair value of these items is reported in Level 3.
Note 5. Derivative Instruments & Hedging Activities
Derivatives Not Designated as Hedging Instruments
The majority of the Company’s derivative instruments have not been designated as hedging instruments. The Company uses exchange-traded futures and exchange-traded and OTC options contracts to manage its net position of merchandisable agricultural product inventories and forward cash purchase and sales contracts to reduce price risk caused by market fluctuations in agricultural commodities and foreign currencies. The Company also uses exchange-traded futures and exchange-traded and OTC options contracts as components of merchandising strategies designed to enhance margins. The results of these strategies can be significantly impacted by factors such as the correlation between the value of exchange-traded commodities futures contracts and the value of the underlying commodities, counterparty contract defaults, and volatility of freight markets. Derivatives, including exchange traded contracts and physical purchase or sale contracts, and inventories of certain merchandisable agricultural products, which include amounts acquired under deferred pricing contracts, are stated at market value. Inventory is not a derivative and therefore fair values of and changes in fair values of inventories are not included in the tables below.
72
Archer-Daniels-Midland Company
Notes to Consolidated Financial Statements (Continued)
Note 5. Derivative Instruments & Hedging Activities (Continued)
The following table sets forth the fair value of derivatives not designated as hedging instruments as of December 31, 2019 and 2018.
December 31, 2019 | December 31, 2018 | ||||||||||||||
Assets | Liabilities | Assets | Liabilities | ||||||||||||
(In millions) | |||||||||||||||
Foreign Currency Contracts | $ | $ | $ | $ | |||||||||||
Commodity Contracts | |||||||||||||||
Total | $ | $ | $ | $ | |||||||||||
The following table sets forth the pre-tax gains (losses) on derivatives not designated as hedging instruments that have been included in the consolidated statements of earnings for the years ended December 31, 2019, 2018, and 2017.
Cost of | Other expense (income) - net | ||||||||||||||
products | |||||||||||||||
(In millions) | Revenues | sold | |||||||||||||
For the Year Ended December 31, 2019 | |||||||||||||||
Consolidated Statement of Earnings | $ | $ | $ | ||||||||||||
Pre-tax gains (losses) on: | |||||||||||||||
Foreign Currency Contracts | $ | $ | $ | ( | ) | ||||||||||
Commodity Contracts | — | — | |||||||||||||
Total gain (loss) recognized in earnings | $ | $ | $ | ( | ) | $ | |||||||||
For the Year Ended December 31, 2018 | |||||||||||||||
Consolidated Statement of Earnings | $ | $ | $ | ||||||||||||
Pre-tax gains (losses) on: | |||||||||||||||
Foreign Currency Contracts | $ | $ | ( | ) | $ | ( | ) | ||||||||
Commodity Contracts | — | — | |||||||||||||
Total gain (loss) recognized in earnings | $ | $ | $ | ( | ) | $ | ( | ) | |||||||
For the Year Ended December 31, 2017 | |||||||||||||||
Consolidated Statement of Earnings | $ | $ | $ | ( | ) | ||||||||||
Pre-tax gains (losses) on: | |||||||||||||||
Foreign Currency Contracts | $ | ( | ) | $ | $ | ||||||||||
Commodity Contracts | — | — | |||||||||||||
Total gain (loss) recognized in earnings | $ | ( | ) | $ | $ | $ | |||||||||
Changes in the market value of inventories of certain merchandisable agricultural commodities, forward cash purchase and sales contracts, exchange-traded futures, and exchange-traded and OTC options contracts are recognized in earnings immediately as a component of cost of products sold.
73
Archer-Daniels-Midland Company
Notes to Consolidated Financial Statements (Continued)
Note 5. Derivative Instruments & Hedging Activities (Continued)
Derivatives Designated as Cash Flow, Fair Value or Net Investment Hedging Strategies
The Company had certain derivatives designated as cash flow, fair value, and net investment hedges as of December 31, 2019 and certain derivatives designated as cash flow and fair value hedges as of December 31, 2018.
The Company uses interest rate swaps designated as fair value hedges to protect the fair value of $496 million in fixed-rate debt due to changes in interest rates. The terms of the interest rate swaps match the terms of the underlying debt. At December 31, 2019 and 2018, the Company had $3 million in other current assets and $4 million in other current liabilities, respectively, representing the fair value of the interest rate swaps and a corresponding increase or decrease in the underlying debt for the same amount with no net impact to earnings.
The Company uses cross-currency swaps designated as net investment hedges to protect the Company’s investment in a foreign subsidiary against changes in foreign currency exchange rates. During the year ended December 31, 2019, the Company executed USD-fixed to Euro-fixed cross-currency swaps maturing on various dates with an aggregate notional amount of $1.2 billion. As of December 31, 2019, the Company had after-tax gains of $6 million in AOCI related to foreign exchange gains and losses from the net investment hedge transactions. The amount is deferred in AOCI until the underlying investment is divested.
The Company uses interest rate swaps designated as cash flow hedges to hedge the forecasted interest payments on certain letters of credit from banks. The terms of the interest rate swaps match the terms of the forecasted interest payments. The deferred gains and losses are recognized in other (income) expense - net over the period in which the related interest payments are paid to the banks. At December 31, 2019, the Company had $43 million of losses in AOCI related to these interest rate swaps. The Company expects to recognize this amount in its consolidated statement of earnings during the life of the instruments.
For each of the hedge programs described below, the derivatives are designated as cash flow hedges. Assuming normal market conditions, the changes in the market value of such derivative contracts have historically been, and are expected to continue to be, highly effective at offsetting changes in price movements of the hedged item. Once the hedged item is recognized in earnings, the gains/losses arising from the hedge are reclassified from AOCI to either revenues or cost of products sold, as applicable. As of December 31, 2019 and 2018, the Company had $5 million of after-tax losses and $31 million of after-tax gains in AOCI, respectively, related to gains and losses from cash flow hedge transactions. The Company expects to recognize $5 million of the 2019 after-tax losses in its consolidated statement of earnings during the next 12 months.
ADM uses futures or options contracts to hedge the purchase price of anticipated volumes of corn to be purchased and processed in a future month. The objective of this hedging program is to reduce the variability of cash flows associated with the Company’s forecasted purchases of corn. The Company’s corn processing plants currently grind approximately 72 million bushels of corn per month. During the past 12 months, the Company hedged between 19 % and 60 % of its monthly anticipated grind. At December 31, 2019, the Company had designated hedges representing between 4 % to 38 % of its anticipated monthly grind of corn for the next 12 months.
ADM, from time to time, also uses futures, options, and swaps to hedge the sales price of certain ethanol sales contracts. The Company has established hedging programs for ethanol sales contracts that are indexed to unleaded gasoline prices and to various exchange-traded ethanol contracts. The objective of these hedging programs is to reduce the variability of cash flows associated with the Company’s sales of ethanol. During the past 12 months, the Company hedged between 0 million and 108 million gallons of ethanol sales per month under these programs. At December 31, 2019, the Company had designated hedges representing between 1 million to 28 million gallons of ethanol sales per month over the next 12 months.
ADM uses futures and options contracts to hedge the purchase price of anticipated volumes of soybeans to be purchased and processed in a future month for certain of its U.S. soybean crush facilities. The Company also uses futures or options contracts to hedge the sales prices of anticipated soybean meal and soybean oil sales proportionate to the soybean crushing process at these facilities. During the past 12 months, the Company hedged between 79 % and 100 % of the anticipated monthly soybean crush for soybean purchases and soybean meal and oil sales at the designated facilities. The Company has designated hedges representing between 0 % and 100 % of the anticipated monthly soybean crush for soybean purchases and soybean meal and oil sales at the designated facilities over the next 12 months.
74
Archer-Daniels-Midland Company
Notes to Consolidated Financial Statements (Continued)
Note 5. Derivative Instruments & Hedging Activities (Continued)
The following table sets forth the fair value of derivatives designated as hedging instruments as of December 31, 2019 and 2018.
December 31, 2019 | December 31, 2018 | ||||||||||||||
Assets | Liabilities | Assets | Liabilities | ||||||||||||
(In millions) | |||||||||||||||
Foreign Currency Contracts | $ | $ | $ | $ | |||||||||||
Interest Rate Contracts | |||||||||||||||
Total | $ | $ | $ | $ | |||||||||||
The following table sets forth the pre-tax gains (losses) on derivatives designated as hedging instruments that have been included in the consolidated statement of earnings for the years ended December 31, 2019, 2018, and 2017.
Cost of products sold | Interest expense | Other expense (income) - net | |||||||||||||||||
(In millions) | Revenues | ||||||||||||||||||
For the Year Ended December 31, 2019 | |||||||||||||||||||
Consolidated Statement of Earnings | $ | $ | $ | $ | |||||||||||||||
Effective amounts recognized in earnings | |||||||||||||||||||
Pre-tax gains (losses) on: | |||||||||||||||||||
Interest Contracts | $ | — | $ | — | $ | $ | ( | ) | |||||||||||
Commodity Contracts | ( | ) | ( | ) | — | — | |||||||||||||
Total gain (loss) recognized in earnings | $ | ( | ) | $ | ( | ) | $ | $ | ( | ) | $ | ( | ) | ||||||
For the Year Ended December 31, 2018 | |||||||||||||||||||
Consolidated Statement of Earnings | $ | $ | $ | ||||||||||||||||
Effective amounts recognized in earnings | |||||||||||||||||||
Pre-tax gains (losses) on: | |||||||||||||||||||
Interest Rate Contracts | $ | — | $ | — | $ | $ | — | ||||||||||||
Commodity Contracts | ( | ) | — | — | |||||||||||||||
Total gain (loss) recognized in earnings | $ | $ | ( | ) | $ | $ | $ | ( | ) | ||||||||||
For the Year Ended December 31, 2017 | |||||||||||||||||||
Consolidated Statement of Earnings | $ | $ | $ | $ | ( | ) | |||||||||||||
Effective amounts recognized in earnings | |||||||||||||||||||
Pre-tax gains (losses) on: | |||||||||||||||||||
Foreign Currency Contracts | $ | — | $ | — | $ | — | $ | ( | ) | ||||||||||
Interest Rate Contracts | — | — | — | ||||||||||||||||
Commodity Contracts | ( | ) | ( | ) | — | — | |||||||||||||
Total gain (loss) recognized in earnings | $ | ( | ) | $ | ( | ) | $ | $ | ( | ) | $ | ( | ) | ||||||
75
Archer-Daniels-Midland Company
Notes to Consolidated Financial Statements (Continued)
Note 5. Derivative Instruments & Hedging Activities (Continued)
Other Net Investment Hedging Strategies
The Company has designated €1.7 billion of its outstanding long-term debt and commercial paper borrowings and €1.1 billion of its outstanding long-term debt at December 31, 2019 and 2018, respectively, as hedges of its net investment in a foreign subsidiary. As of December 31, 2019 and 2018, the Company had after-tax gains of $7 million and losses of $26 million, respectively, in AOCI related to foreign exchange gains and losses from the net investment hedge transactions. The amount is deferred in AOCI until the underlying investment is divested.
Note 6. Other Current Assets
The following table sets forth the items in other current assets:
December 31, 2019 | December 31, 2018 | ||||||
(In millions) | |||||||
Unrealized gains on derivative contracts | $ | $ | |||||
Deferred receivables consideration | |||||||
Customer omnibus receivable | |||||||
Financing receivables - net (1) | |||||||
Insurance premiums receivable | |||||||
Prepaid expenses | |||||||
Biodiesel tax credit | |||||||
Tax receivables | |||||||
Non-trade receivables (2) | |||||||
Other current assets | |||||||
$ | $ | ||||||
(1) The Company provides financing to suppliers, primarily Brazilian farmers, to finance a portion of the suppliers’ production costs. The amounts are reported net of allowances of $3 million at December 31, 2019 and 2018. Interest earned on financing receivables of $27 million, $26 million, and $25 million for the years ended December 31, 2019, 2018, and 2017, respectively, is included in interest income in the consolidated statements of earnings.
(2) Non-trade receivables included $81 million and $84 million of reinsurance recoverables as of December 31, 2019 and 2018, respectively.
76
Archer-Daniels-Midland Company
Notes to Consolidated Financial Statements (Continued)
Note 7. Accrued Expenses and Other Payables
The following table sets forth the items in accrued expenses and other payables:
December 31, 2019 | December 31, 2018 | ||||||
(In millions) | |||||||
Unrealized losses on derivative contracts | $ | $ | |||||
Accrued compensation | |||||||
Income tax payable | |||||||
Other taxes payable | |||||||
Biodiesel tax credit payable | |||||||
Insurance claims payable | |||||||
Contract liability | |||||||
Operating leases - current maturities | |||||||
Other accruals and payables | |||||||
$ | $ | ||||||
Note 8. Investments in and Advances to Affiliates
The Company applies the equity method of accounting for investments in investees over which ADM has the ability to exercise significant influence, including the Company’s 24.8 % and 24.9 % share ownership in Wilmar as of December 31, 2019 and 2018, respectively. The Company had 63 and 56 unconsolidated domestic and foreign affiliates as of December 31, 2019 and 2018, respectively. The following table summarizes the combined balance sheets as of December 31, 2019 and 2018, and the combined statements of earnings of the Company’s unconsolidated affiliates for the years ended December 31, 2019, 2018, and 2017.
December 31 | |||||||
(In millions) | 2019 | 2018 | |||||
Current assets | $ | $ | |||||
Non-current assets | |||||||
Current liabilities | ( | ) | ( | ) | |||
Non-current liabilities | ( | ) | ( | ) | |||
Noncontrolling interests | ( | ) | ( | ) | |||
Net assets | $ | $ | |||||
Year Ended December 31 | |||||||||||
(In millions) | 2019 | 2018 | 2017 | ||||||||
Revenues | $ | $ | $ | ||||||||
Gross profit | |||||||||||
Net income | |||||||||||
The Company’s share of the undistributed earnings of its unconsolidated affiliates as of December 31, 2019 is $2.3 billion. The Company's investment in Wilmar has a carrying value of $3.9 billion as of December 31, 2019, and a market value of $4.8 billion based on quoted market price converted to U.S. dollars at the applicable exchange rate at December 31, 2019.
The Company provides credit facilities totaling $106 million to five unconsolidated affiliates. Two facilities that bear interest between 0.00 % and 4.41 % have a total outstanding balance of $31 million. The other three facilities have no outstanding balance as of December 31, 2019. The outstanding balance is included in other current assets in the accompanying consolidated balance sheet.
77
Archer-Daniels-Midland Company
Notes to Consolidated Financial Statements (Continued)
Note 9. Goodwill and Other Intangible Assets
Goodwill balances attributable to consolidated businesses, by segment, are set forth in the following table.
December 31, 2019 | December 31, 2018 | ||||||
(In millions) | |||||||
Ag Services and Oilseeds | $ | $ | |||||
Carbohydrate Solutions | |||||||
Nutrition | |||||||
Other | |||||||
Total | $ | $ | |||||
The changes in goodwill during the year ended December 31, 2019 primarily related to acquisitions of $900 million (see Note 3).
The following table sets forth the other intangible assets:
December 31, 2019 | December 31, 2018 | ||||||||||||||||||||||||||
Useful | Gross | Accumulated | Gross | Accumulated | |||||||||||||||||||||||
Life | Amount | Amortization | Net | Amount | Amortization | Net | |||||||||||||||||||||
(In years) | (In millions) | ||||||||||||||||||||||||||
Intangible assets with indefinite lives: | |||||||||||||||||||||||||||
Trademarks/brands | $ | $ | — | $ | $ | $ | — | $ | |||||||||||||||||||
Other | — | — | |||||||||||||||||||||||||
Intangible assets with definite lives: | |||||||||||||||||||||||||||
Trademarks/brands | to | ( | ) | ( | ) | ||||||||||||||||||||||
Customer lists | to | ( | ) | ( | ) | ||||||||||||||||||||||
Computer software | to | ( | ) | ( | ) | ||||||||||||||||||||||
Land rights | to | ( | ) | ( | ) | ||||||||||||||||||||||
Other intellectual property | to | ( | ) | ( | ) | ||||||||||||||||||||||
Recipes and other | to | ( | ) | ( | ) | ||||||||||||||||||||||
Total | $ | $ | ( | ) | $ | $ | $ | ( | ) | $ | |||||||||||||||||
The changes in the gross carrying amounts of other intangible assets during the year ended December 31, 2019 primarily related to acquisitions of $733 million (see Note 3).
Aggregate amortization expense was $165 million, $129 million, and $122 million for the years ended December 31, 2019, 2018, and 2017, respectively. The estimated future aggregate amortization expense for the next five years is $180 million, $180 million, $178 million, $168 million, and $161 million, respectively.
78
Archer-Daniels-Midland Company
Notes to Consolidated Financial Statements (Continued)
Note 10. Debt Financing Arrangements
The Company’s long-term debt consisted of the following:
Debt Instrument | |||||||||
Interest Rate | Face Amount | Due Date | December 31, 2019 | December 31, 2018 | |||||
(In millions) | |||||||||
$ | $ | $ | |||||||
€ | |||||||||
€ | |||||||||
$ | |||||||||
$ | |||||||||
$ | |||||||||
$ | |||||||||
$ | |||||||||
$ | |||||||||
$ | |||||||||
$ | |||||||||
$ | |||||||||
$ | |||||||||
$ | |||||||||
$ | |||||||||
$ | |||||||||
$ | |||||||||
$ | |||||||||
Floating Rate | € | ||||||||
Other | |||||||||
Total long-term debt including current maturities | |||||||||
Current maturities | ( | ) | ( | ) | |||||
Total long-term debt | $ | $ | |||||||
On December 3, 2018 , the Company issued $600 million and $400 million aggregate principal amounts of 4.5 % Notes due in 2049 and 3.375 % Notes due in 2022 , respectively. Net proceeds before expenses for the 4.5 % and 3.375 % Notes were $588 million and $399 million, respectively.
On September 12, 2018 , the Company issued €650 million ($744 million as of December 31, 2018) aggregate principal amount of 1.000 % Notes due in 2025 . Net proceeds before expenses were $747 million.
Discount amortization expense, net of premium amortization, of $12 million, $10 million, and $11 million for the years ended December 31, 2019, 2018, and 2017, respectively, are included in interest expense related to the Company’s long-term debt.
79
Archer-Daniels-Midland Company
Notes to Consolidated Financial Statements (Continued)
Note 10. Debt Financing Arrangements (Continued)
At December 31, 2019, the fair value of the Company’s long-term debt exceeded the carrying value by $1.5 billion, as estimated using quoted market prices (a Level 2 measurement under applicable accounting standards).
The aggregate maturities of long-term debt for the five years after December 31, 2019, are $7 million, $672 million, $409 million, $678 million, and $48 million, respectively.
At December 31, 2019, the Company had lines of credit, including the accounts receivable securitization programs described below, totaling $9.0 billion, of which $6.4 billion was unused. The weighted average interest rates on short-term borrowings outstanding at December 31, 2019 and 2018, were 1.23 % and 7.95 %, respectively. Of the Company’s total lines of credit, $5.0 billion supported the combined U.S. and European commercial paper borrowing programs, against which there was $1.0 billion of commercial paper outstanding at December 31, 2019.
The Company’s credit facilities and certain debentures require the Company to comply with specified financial and non-financial covenants including maintenance of minimum tangible net worth as well as limitations related to incurring liens, secured debt, and certain other financing arrangements. The Company is in compliance with these covenants as of December 31, 2019.
The Company had outstanding standby letters of credit and surety bonds at December 31, 2019 and 2018, totaling $1.4 billion and $1.7 billion, respectively.
The Company has accounts receivable securitization programs (the “Programs”). The Programs provide the Company with up to $1.9 billion in funding resulting from the sale of accounts receivable. As of December 31, 2019, the Company utilized $1.4 billion of its facility under the Programs (see Note 19 for more information on the Programs).
Note 11. Stock Compensation
The Company’s employee stock compensation plans provide for the granting of options to employees to purchase common stock of the Company pursuant to the Company’s 2009 Incentive Compensation Plan. These options are issued at market value on the date of grant, vest incrementally over one year to five years , and expire ten years after the date of grant.
The fair value of each option grant is estimated as of the date of grant using the Black-Scholes single option pricing model. The volatility assumption used in the Black-Scholes single option pricing model is based on the historical volatility of the Company’s stock. The volatility of the Company’s stock was calculated based upon the monthly closing price of the Company’s stock for the period immediately prior to the date of grant corresponding to the average expected life of the grant. The average expected life represents the period of time that option grants are expected to be outstanding. The risk-free rate is based on the rate of U.S. Treasury zero-coupon issues with a remaining term equal to the expected life of option grants. The assumptions used in the Black-Scholes single option pricing model are as follows.
Year Ended December 31 | |||||
2019 | 2018 | 2017 | |||
Dividend yield | |||||
Risk-free interest rate | |||||
Stock volatility | |||||
Average expected life (years) | |||||
80
Archer-Daniels-Midland Company
Notes to Consolidated Financial Statements (Continued)
Note 11. Stock Compensation (Continued)
A summary of option activity during 2019 is presented below:
Shares | Weighted-Average Exercise Price | |||
(In thousands, except per share amounts) | ||||
Shares under option at December 31, 2018 | $ | |||
Granted | ||||
Exercised | ( | ) | ||
Forfeited or expired | ( | ) | ||
Shares under option at December 31, 2019 | $ | |||
Exercisable at December 31, 2019 | $ | |||
The weighted-average remaining contractual term of options outstanding and exercisable at December 31, 2019, is 4 years and 4 years, respectively. The aggregate intrinsic value of options outstanding and exercisable at December 31, 2019, is $78 million and $68 million, respectively. The weighted-average grant-date fair values of options granted during the years ended December 31, 2019, 2018, and 2017, were $7.88 , $6.95 , and $7.90 , respectively. The total intrinsic values of options exercised during the years ended December 31, 2019, 2018, and 2017, were $15 million, $36 million, and $11 million, respectively. Cash proceeds received from options exercised during the years ended December 31, 2019, 2018, and 2017, were $27 million, $55 million, and $27 million, respectively.
At December 31, 2019, there was $3 million of total unrecognized compensation expense related to option grants. Amounts to be recognized as compensation expense during the next two years are $2 million and $1 million, respectively.
The Company’s 2009 Incentive Compensation Plan provides for the granting of restricted stock and restricted stock units (Restricted Stock Awards) at no cost to certain officers and key employees. In addition, the Company’s 2009 Incentive Compensation Plan also provides for the granting of performance stock units (PSUs) at no cost to certain officers and key employees. Restricted Stock Awards are made in common stock or stock units with equivalent rights and vest at the end of a restriction period of three years . The awards for PSUs are made in common stock units and vest at the end of a vesting period of three years subject to the attainment of certain future service and performance criteria based on the Company’s adjusted return on invested capital (ROIC), adjusted earnings before taxes, interest, and depreciation and amortization (EBITDA), and total shareholder return (TSR). During the years ended December 31, 2019, 2018, and 2017, 2.6 million, 2.5 million, and 2.2 million common stock or stock units, respectively, were granted as Restricted Stock Awards and PSUs. At December 31, 2019, there were 5.2 million shares available for future grants pursuant to the 2009 plan.
The fair value of Restricted Stock Awards is determined based on the market value of the Company’s shares on the grant date. The fair value of PSUs is based on the weighted-average values of adjusted ROIC, adjusted EBITDA, and TSR. The adjusted ROIC and adjusted EBITDA fair value is determined based on the market value of the Company's shares on the grant date while the TSR fair value is determined using the Monte Carlo simulation. The weighted-average grant-date fair values of awards granted during the years ended December 31, 2019, 2018, and 2017 were $42.11 , $42.72 , and $44.38 , respectively.
81
Archer-Daniels-Midland Company
Notes to Consolidated Financial Statements (Continued)
Note 11. Stock Compensation (Continued)
A summary of Restricted Stock Awards and PSUs activity during 2019 is presented below:
Restricted Stock Awards and PSUs | Weighted Average Grant-Date Fair Value | |||
(In thousands, except per share amounts) | ||||
Non-vested at December 31, 2018 | $ | |||
Granted | ||||
Vested | ( | ) | ||
Forfeited | ( | ) | ||
Non-vested at December 31, 2019 | $ | |||
At December 31, 2019, there was $102 million of total unrecognized compensation expense related to Restricted Stock Awards and PSUs. Amounts to be recognized as compensation expense during the next three years are $71 million, $28 million, and $3 million, respectively. The total grant-date fair value of Restricted Stock Awards that vested during the year ended December 31, 2019 was $54 million.
Compensation expense for option grants, Restricted Stock Awards, and PSUs granted to employees is generally recognized on a straight-line basis during the service period of the respective grant. Certain of the Company’s option grants, Restricted Stock Awards, and PSUs continue to vest upon the recipient’s retirement from the Company and compensation expense related to option grants and Restricted Stock Awards granted to retirement-eligible employees is recognized in earnings on the date of grant. Compensation expense for PSUs is based on the probability of meeting the performance criteria.
Note 12. Other (Income) Expense – Net
The following table sets forth the items in other (income) expense:
(In millions) | Year Ended December 31 | ||||||||||
2019 | 2018 | 2017 | |||||||||
(Gains) loss on sales of assets and businesses | $ | $ | ( | ) | $ | ( | ) | ||||
Pension settlement | |||||||||||
Loss on debt extinguishment | |||||||||||
Other – net | ( | ) | |||||||||
$ | $ | $ | ( | ) | |||||||
Individually significant items included in the table above are:
Gains (loss) on sales of assets for the year ended December 31, 2019 included a loss on sale of the Company's equity investment in CIP partially offset by gains on the sale of certain assets, step-up gains on equity investments, and gains on disposals of individually insignificant assets in the ordinary course of business. Gains on sales of assets and businesses for the year ended December 31, 2018 included gains on the sale of the Company's oilseeds operations in Bolivia and an equity investment, and individually insignificant assets in the ordinary course of business. Gains on sales of assets and businesses for the year ended December 31, 2017 included gains related to the sale of the crop risk services business and disposals of other individually insignificant assets in the ordinary course of business, partially offset by an adjustment of the proceeds of the 2015 sale of the cocoa business.
82
Archer-Daniels-Midland Company
Notes to Consolidated Financial Statements (Continued)
Note 12. Other (Income) Expense – Net (Continued)
Pension settlement for the year ended December 31, 2018 related to the purchase of a group annuity contract that irrevocably transferred the future benefit obligations and annuity administration for certain retirees under the Company's ADM Retirement Plan.
Loss on debt extinguishment for the year ended December 31, 2017 related to the early redemption of the Company’s $559 million notes due on March 15, 2018.
Realized gains and losses on sales of available-for-sale marketable securities were immaterial for all periods presented.
Other - net for the year ended December 31, 2019 included other income and the non-service components of net pension benefit income of $15 million, partially offset by foreign exchange losses. Other - net for the year ended December 31, 2018 included foreign exchange losses partially offset by other income and the non-service components of net benefit income of $10 million. Other - net for the year ended December 31, 2017 included provisions for contingent losses related to certain legal settlement items in the Oilseeds and Nutrition segments, foreign exchange losses, and the non-service components of net benefit cost of $27 million, partially offset by other income.
Note 13. Income Taxes
The following table sets forth the geographic split of earnings before income taxes:
Year Ended | |||||||||||
(In millions) | December 31 | ||||||||||
2019 | 2018 | 2017 | |||||||||
United States | $ | $ | $ | ||||||||
Foreign | |||||||||||
$ | $ | $ | |||||||||
Significant components of income taxes are as follows:
(In millions) | Year Ended December 31 | |||||||||||||
2019 | 2018 | 2017 | ||||||||||||
Current | ||||||||||||||
Federal | $ | $ | 1 | $ | 1 | |||||||||
State | ||||||||||||||
Foreign | ||||||||||||||
Deferred | ||||||||||||||
Federal | ( | ) | ( | ) | 1 | |||||||||
State | ( | ) | ( | ) | ||||||||||
Foreign | ( | ) | ( | ) | ||||||||||
$ | $ | $ | ||||||||||||
1 Includes the impact of the Tax Cuts and Jobs Act as discussed on page 85.
83
Archer-Daniels-Midland Company
Notes to Consolidated Financial Statements (Continued)
Note 13. Income Taxes (Continued)
Significant components of deferred tax liabilities and assets are as follows:
December 31, 2019 | December 31, 2018 | ||||||
(In millions) | |||||||
Deferred tax liabilities | |||||||
Property, plant, and equipment | $ | $ | |||||
Intangibles | |||||||
Right of use assets | |||||||
Equity in earnings of affiliates | |||||||
Inventory reserves | |||||||
Debt exchange | |||||||
Reserves and other accruals | |||||||
Other | |||||||
$ | $ | ||||||
Deferred tax assets | |||||||
Pension and postretirement benefits | $ | $ | |||||
Lease liabilities | |||||||
Stock compensation | |||||||
Foreign tax loss carryforwards | |||||||
Capital loss carryforwards | |||||||
State tax attributes | |||||||
Unrealized foreign currency losses | |||||||
Reserves and other accruals | |||||||
Other | |||||||
Gross deferred tax assets | |||||||
Valuation allowances | ( | ) | ( | ) | |||
Net deferred tax assets | $ | $ | |||||
Net deferred tax liabilities | $ | $ | |||||
The net deferred tax liabilities are classified as follows: | |||||||
Noncurrent assets (foreign) | $ | $ | |||||
Noncurrent liabilities | ( | ) | ( | ) | |||
Noncurrent liabilities (foreign) | ( | ) | ( | ) | |||
$ | ( | ) | $ | ( | ) | ||
84
Archer-Daniels-Midland Company
Notes to Consolidated Financial Statements (Continued)
Note 13. Income Taxes (Continued)
Reconciliation of the statutory federal income tax rate to the Company’s effective income tax rate on earnings is as follows:
Year Ended | ||||||||
December 31 | ||||||||
2019 | 2018 | 2017 | ||||||
Statutory rate | % | % | % | |||||
State income taxes, net of federal tax benefit | ||||||||
Foreign earnings taxed at rates other than the U.S. statutory rate | ( | ) | ( | ) | ( | ) | ||
Foreign currency effects/remeasurement | ( | ) | ( | ) | ||||
Income tax adjustment to filed returns | ( | ) | ( | ) | ||||
Tax benefit on U.S. biodiesel credits | ( | ) | ( | ) | ||||
Tax benefit on U.S. railroad credits | ( | ) | ||||||
Tax benefit on U.S. qualified production activity deduction | ( | ) | ||||||
Tax on global intangible low-taxed income | ||||||||
Tax benefit on foreign derived intangible income deduction | ( | ) | ||||||
Valuation allowances | ||||||||
U.S. tax reform impacts | ( | ) | ( | ) | ||||
Other | ( | ) | ( | ) | ||||
Effective income tax rate | % | % | % | |||||
The low 2019 effective tax rate was primarily due to the impact of U.S. tax credits, including the 2018 and 2019 biodiesel tax credit and the railroad maintenance tax credit, signed into law in December 2019. The effective tax rate for 2018 included the 2017 biodiesel tax credit recorded in the first quarter of 2018 and the additional true-up adjustments related to the 2017 U.S. tax reform, along with certain favorable discrete tax items.
The foreign rate differential was primarily due to lower tax rates from the Company's operations in Switzerland, Asia, and the Caribbean. The Company’s foreign earnings, which were taxed at rates lower than the U.S. rate and were generated from these jurisdictions, were 61 %, 56 %, and 59 % of its foreign earnings before taxes in fiscal years 2019, 2018, and 2017, respectively.
Undistributed earnings of the Company’s foreign subsidiaries were approximately $11.6 billion at December 31, 2019 . Because the Company’s undistributed foreign subsidiaries earnings continue to be indefinitely reinvested in foreign operations, no income taxes, other than the transition tax, the U.S. tax on undistributed Subpart F, and the minimum tax on Global Intangible Low Taxed Income (GILTI), have been provided. It is not practicable to determine the amount of unrecognized deferred tax liability related to any remaining undistributed foreign subsidiaries earnings not subject to the transition tax in these entities.
The Tax Cuts and Jobs Act (the “Act”) was enacted on December 22, 2017. The income tax effects of changes in tax laws are recognized in the period when enacted. The Act provides for numerous significant tax law changes and modifications with varying effective dates, which include reducing the U.S. federal corporate income tax rate from 35 % to 21 %, creating a territorial tax system (with a one-time transition tax on previously deferred foreign earnings), broadening the tax base, and allowing for immediate capital expensing of certain qualified property. As a result, the Company made a reasonable estimate of the effects on existing deferred tax balances and the one-time transition tax, and recognized a net provisional benefit of $379 million, which is included as a component of income tax expense in the year ended December 31, 2017. The net provisional benefit consisted of a net tax benefit of $528 million related to the remeasurement of deferred tax balance and a beneficial impact of $220 million on reserves previously established under ASC Subtopic 740-30, Income Taxes - Other Considerations or Special Areas, partially offset by the $369 million provisional impact of the transition tax. The Company performed a quarterly review of the provisional tax liability recorded in 2017 as new guidance on the Act was issued. The Company updated its calculation of the transition tax and recorded an immaterial expense in 2019 and a benefit of $29 million in 2018. The Company has elected to pay the one-time transition tax over eight years. As of December 31, 2019, the Company's remaining transition tax liability was $183 million, which will be paid in installments through 2025.
85
Archer-Daniels-Midland Company
Notes to Consolidated Financial Statements (Continued)
Note 13. Income Taxes (Continued)
The Act also contains new provisions related to GILTI and Foreign Derived Intangible Income (FDII) which are effective for fiscal year 2018. The Company incurred additional U.S. taxable income of $105 million and $101 million related to GILTI and deducted $1 million and $101 million related to FDII in fiscal years 2019 and 2018, respectively. The Company made an accounting policy election to treat GILTI as a period cost. During 2018, U.S. tax authorities issued proposed Treasury Regulations addressing some of the tax reform items that were effective in 2018. The Company has recorded and will continue to record the impact of tax reform items as U.S. tax authorities issue Treasury Regulations and other guidance addressing tax reform-related changes. It is also reasonable to expect that global taxing authorities will be reviewing their current legislation for potential modifications in reaction to the implementation of the Act. The additional guidance, along with the potential for additional global tax legislation changes, may affect significant deductions and income inclusions and could have a material adverse effect on the Company's net income or cash flow.
The Company had $411 million and $313 million of tax assets related to net operating loss carry-forwards of certain international subsidiaries at December 31, 2019 and 2018, respectively. As of December 31, 2019 , approximately $312 million of these assets have no expiration date, and the remaining $99 million expire at various times through fiscal 2028. The annual usage of certain of these assets is limited to a percentage of taxable income of the respective foreign subsidiary for the year. The Company has recorded a valuation allowance of $193 million and $166 million against these tax assets at December 31, 2019 and 2018, respectively, due to the uncertainty of their realization.
The Company had $62 million and $55 million of tax assets related to foreign and domestic capital loss carryforwards at December 31, 2019 and 2018, respectively. The Company has recorded a valuation allowance of $62 million and $55 million against these tax assets at December 31, 2019 and 2018, respectively.
The Company had $74 million of tax assets related to state income tax attributes (incentive credits and net operating loss carryforwards), net of federal tax benefit, at December 31, 2019 and 2018, which will expire at various times through fiscal 2038. Due to the uncertainty of realization, the Company recorded a valuation allowance of $70 million and $68 million related to state income tax assets net of federal tax benefit as of December 31, 2019 and 2018, respectively.
The Company remains subject to federal examination in the U.S. for the calendar tax years 2016, 2017, 2018, and 2019.
The following table sets forth a rollforward of activity of unrecognized tax benefits for the year ended December 31, 2019 and 2018 as follows:
Unrecognized Tax Benefits | |||||||
December 31, 2018 | |||||||
(In millions) | |||||||
Beginning balance | $ | $ | |||||
Additions related to current year’s tax positions | |||||||
Additions related to prior years’ tax positions | |||||||
Additions related to acquisitions | |||||||
Reductions related to prior years’ tax positions | ( | ) | |||||
Reductions related to lapse of statute of limitations | ( | ) | ( | ) | |||
Settlements with tax authorities | ( | ) | ( | ) | |||
Ending balance | $ | $ | |||||
The additions and reductions in unrecognized tax benefits shown in the table included effects related to net income and shareholders’ equity. The changes in unrecognized tax benefits did not have a material effect on the Company’s net income or cash flow. At December 31, 2019 and 2018, the Company had accrued interest and penalties on unrecognized tax benefits of $26 million and $24 million, respectively.
86
Archer-Daniels-Midland Company
Notes to Consolidated Financial Statements (Continued)
Note 13. Income Taxes (Continued)
The Company is subject to income taxation and routine examinations in many jurisdictions around the world and frequently faces challenges regarding the amount of taxes due. These challenges include positions taken by the Company related to the timing, nature, and amount of deductions and the allocation of income among various jurisdictions. In its routine evaluations of the exposure associated with various tax filing positions, the Company recognizes a liability, when necessary, for estimated potential tax owed by the Company in accordance with applicable accounting standards. Resolution of the related tax positions, through negotiations with relevant tax authorities or through litigation, may take years to complete. Therefore, it is difficult to predict the timing for resolution of tax positions and the Company cannot predict or provide assurance as to the ultimate outcome of these ongoing or future examinations. However, the Company does not anticipate that the total amount of unrecognized tax benefits will increase or decrease significantly in the next twelve months. Given the long periods of time involved in resolving tax positions, the Company does not expect that the recognition of unrecognized tax benefits will have a material impact on the Company’s effective income tax rate in any given period. If the total amount of unrecognized tax benefits were recognized by the Company at one time, there would be a reduction of $130 million on the tax expense for that period.
The Company’s wholly-owned subsidiary, ADM do Brasil Ltda. (ADM do Brasil), has received three separate tax assessments from the Brazilian Federal Revenue Service (BFRS) challenging the tax deductibility of commodity hedging losses and related expenses for the tax years 2004, 2006, and 2007. These assessments totaled approximately $104 million in tax and $307 million in interest and penalties as of December 31, 2019 (adjusted for variation in currency exchange rates). The statute of limitations for tax years 2005 and 2008-2011 has expired. The Company does not expect to receive any additional tax assessments with respect to this issue.
ADM do Brasil enters into commodity hedging transactions that can result in gains, which are included in ADM do Brasil’s calculation of taxable income in Brazil, and losses, which ADM do Brasil deducts from its taxable income in Brazil. The Company has evaluated its tax position regarding these hedging transactions and concluded, based upon advice from Brazilian legal counsel, that it was appropriate to recognize both gains and losses resulting from hedging transactions when determining its Brazilian income tax expense. Therefore, the Company has continued to recognize the tax benefit from hedging losses in its financial statements and has not recorded any tax liability for the amounts assessed by the BFRS.
ADM do Brasil filed an administrative appeal for each of the assessments. In January 2020, the second-level administrative appeal panel found in favor of ADM do Brasil and cancelled the assessments. While it is unclear if the BFRS will appeal, the Company intends to vigorously defend its position against any appeal which could be made to the administrative panel or to a superior tax chamber. The Company expects to know if the ruling will be appealed during the first half of 2020. Based upon the view of external counsel, it is unlikely that the BFRS will be successful in appealing the matter. While the Company believes its consolidated financial statements properly reflect the tax deductibility of these hedging losses, the ultimate resolution of this matter could result in the future recognition of additional payments of, and expense for, income tax and the associated interest and penalties.
The Company’s subsidiaries in Argentina, ADM Agro SRL (formerly ADM Argentina SA and Alfred C. Toepfer Argentina SRL), received tax assessments challenging transfer prices used to price grain exports for the tax years 1999 through 2011. As of December 31, 2019 , these assessments totaled $14 million in tax and up to $53 million in interest (adjusted for variation in currency exchange rates). The Argentine tax authorities conducted a review of income and other taxes paid by large exporters and processors of cereals and other agricultural commodities resulting in allegations of income tax evasion. The Company strongly believes that it has complied with all Argentine tax laws. To date, the Company has not received assessments for closed years subsequent to 2011, considering that the statute of limitation for tax years 2012 and 2013 has expired. However, it cannot rule out receiving additional assessments challenging transfer prices used to price grain exports for years subsequent to 2014, and estimates that these potential assessments could be approximately $43 million in tax and up to $22 million in interest (adjusted for variation in currency exchange rates as of December 31, 2019). The Company believes that it has appropriately evaluated the transactions underlying these assessments, and has concluded, based on Argentine tax law, that its tax position would be sustained, and accordingly, has not recorded a tax liability for these assessments. The Company intends to vigorously defend its position against the current assessments and any similar assessments that may be issued for years subsequent to 2011.
87
Archer-Daniels-Midland Company
Notes to Consolidated Financial Statements (Continued)
Note 13. Income Taxes (Continued)
In accordance with the accounting requirements for uncertain tax positions, the Company has not recorded an uncertain tax liability for these assessments because it has concluded that it is more likely than not to prevail on the Brazil and Argentina matters based upon their technical merits and because the taxing jurisdictions’ processes do not provide a mechanism for settling at less than the full amount of the assessment. The Company’s consideration of these tax assessments requires judgments about the application of income tax regulations to specific facts and circumstances. The final outcome of these matters cannot reliably be predicted, may take many years to resolve, and could result in financial impacts of up to the entire amount of these assessments.
In 2014, the Company’s wholly-owned subsidiary in the Netherlands, ADM Europe B.V., received a tax assessment from the Netherlands tax authority challenging the transfer pricing aspects of a 2009 business reorganization, which involved two of its subsidiary companies in the Netherlands. As of December 31, 2019 , this assessment was $91 million in tax and $34 million in interest (adjusted for variation in currency exchange rates). In September 2019, the Company received an interim decision on its appeal which directed the parties to work toward a settlement. As of December 31, 2019, an agreement has not been reached and the Company is awaiting additional guidance from the court, which could include assigning the matter to a third party expert to establish a valuation. Subsequent appeals may take an extended period of time and could result in additional financial impacts of up to the entire amount of the assessment. The Company has carefully evaluated the underlying transactions and has concluded that the amount of the gain recognized on the reorganization for tax purposes was appropriate. The Company has accrued its best estimate of what it believes will be the likely outcome of the litigation and will vigorously defend its position against the assessment.
Note 14. Leases
Lessee Accounting
The Company leases certain transportation equipment, plant equipment, office equipment, land, buildings, and storage facilities. Most leases include options to renew, with renewal terms that can extend the lease term from 1 month to 49 years. Certain leases also include index and non-index escalation clauses and options to purchase the leased property. Leases accounted for as finance leases were immaterial at December 31, 2019.
As an accounting policy election, the Company does not apply the recognition requirements of Topic 842 to short-term leases in all of its underlying asset categories. The Company recognizes short-term lease payments in earnings on a straight-line basis over the lease term, and variable lease payments in the period in which the obligation for those payments is incurred.
The following table sets forth the amounts relating to the Company’s total lease cost and other information.
Year Ended | |||
December 31, 2019 | |||
(In millions) | |||
Lease cost: | |||
Operating lease cost | $ | ||
Short-term lease cost | |||
Total lease cost | $ | ||
Other information: | |||
Operating lease liability principal payments | $ | ||
Right-of-use assets obtained in exchange for new operating lease liabilities | $ | ||
December 31, 2019 | |||
Weighted-average remaining lease term - operating leases (in years) | |||
Weighted average discount rate - operating leases | % | ||
88
Archer-Daniels-Midland Company
Notes to Consolidated Financial Statements (Continued)
Note 14. Leases (Continued)
Below is a tabular disclosure of the future annual undiscounted cash flows for operating lease liabilities as of December 31, 2019.
Undiscounted | |||
Cash Flows | |||
(In millions) | |||
2020 | $ | ||
2021 | |||
2022 | |||
2023 | |||
2024 | |||
Thereafter | |||
Total | |||
Less interest (1) | ( | ) | |
Lease liability | $ | ||
(1) Calculated using the implicit rate of the lease, if available, or the incremental borrowing rate that is appropriate for the tenor and geography of the lease.
As of December 31, 2019, the Company had $971 million of right-of-use assets included in Other assets, $215 million of current lease liabilities included in Accrued expenses and other payables, and $781 million of non-current lease liabilities included in Other long-term liabilities in its consolidated balance sheet.
Below is a tabular disclosure of the future minimum lease payments for non-cancellable operating leases, including time charters of ocean going vessels, with initial or remaining terms in excess of one year as of December 31, 2018:
Minimum | |||
Lease Payments | |||
(In millions) | |||
2019 | $ | ||
2020 | |||
2021 | |||
2022 | |||
2023 | |||
Thereafter | |||
Total minimum lease payments | $ | ||
Note 15. Employee Benefit Plans
The Company provides substantially all U.S. employees and employees at certain foreign subsidiaries with retirement benefits including defined benefit pension plans and defined contribution plans. The Company provides certain eligible U.S. employees who retire under qualifying conditions with subsidized postretirement health care coverage or Health Care Reimbursement Accounts.
In April 2019, the Company announced an enhanced early retirement for some eligible employees in the U.S. and Canada. As a result, the Company recognized a pension remeasurement charge of $48 million in the second quarter of 2019. Employees electing to retire early were also given the option to receive their benefit in the form of a lump sum payment which resulted in a pension settlement charge of $51 million during the second half of the year.
89
Archer-Daniels-Midland Company
Notes to Consolidated Financial Statements (Continued)
Note 15. Employee Benefit Plans (Continued)
In October 2018, the Company amended the ADM Retirement Plan (the “Plan”) and entered into a binding agreement to purchase a group annuity contract from The Prudential Insurance Company of America (“Prudential”), irrevocably transferring the future benefit obligations and annuity administration for approximately 3,800 retirees from the Plan to Prudential. The purchase of the group annuity contract, which was funded directed by the Plan’s assets, was completed on November 2, 2018 and reduced the Company's pension obligations by approximately $528 million. As a result of the transaction, the Company recognized a non-cash pension settlement charge of approximately $117 million in the fourth quarter of 2018.
In July 2017, the Company announced that all participants in the Company’s U.S. salaried pension plan and the Supplemental Executive Retirement Plan (SERP) will begin accruing benefits under the cash balance formula effective January 1, 2022. Benefits for participants who were accruing under the final average pay formula will be frozen as of December 31, 2021, including pay and service through that date. This change, along with other changes in participation associated with divestitures and restructuring, triggered a remeasurement of the salaried pension plan and the SERP resulting in decreases in the fiscal 2017 pension expense, accumulated other comprehensive loss, and underfunded status by $18 million, $164 million, and $182 million, respectively.
In 2017, the Company also changed the method used to estimate the service and interest cost components of the net periodic pension and postretirement benefit costs for its plans. The new method uses the spot rate yield curve approach to estimate the service and interest costs. Previously, those costs were determined using a single weighted-average discount rate applied to all future cash outflows. The change does not affect the measurement of the Company’s benefit obligations and was accounted for as a change in accounting estimate in accordance with the guidance of ASC Topic 250, Accounting Estimates and Error Corrections, thereby impacting the current and future periods. The impact of this change on after-tax earnings and diluted earnings per share for the year ended December 31, 2017 was immaterial.
The Company maintains 401(k) plans covering substantially all U.S. employees. The Company contributes cash to the plans to match qualifying employee contributions, and also provides a non-matching employer contribution of 1 % of pay to eligible participants. Under an employee stock ownership component of the 401(k) plans, employees may choose to invest in the Company's stock as part of their own investment elections. The employer contributions are expensed when paid. Assets of the Company’s 401(k) plans consist primarily of listed common stocks and pooled funds. The Company’s 401(k) plans held 8 million shares of Company common stock at December 31, 2019, with a market value of $384 million. Cash dividends received on shares of Company common stock by these plans during the year ended December 31, 2019 were $12 million.
The following table sets forth the components of retirement plan expense for the years ended December 31, 2019, 2018, and 2017:
Pension Benefits | Postretirement Benefits | ||||||||||||||||||
(In millions) | Year Ended December 31 | Year Ended December 31 | |||||||||||||||||
2019 | 2018 | 2017 | 2019 | 2018 | 2017 | ||||||||||||||
Retirement plan expense | |||||||||||||||||||
Defined benefit plans: | |||||||||||||||||||
Service cost (benefits earned during the period) | $ | $ | $ | $ | $ | $ | |||||||||||||
Interest cost | |||||||||||||||||||
Expected return on plan assets | ( | ) | ( | ) | ( | ) | — | — | — | ||||||||||
Settlement charges | — | — | |||||||||||||||||
Curtailments | ( | ) | |||||||||||||||||
Amortization of actuarial loss | |||||||||||||||||||
Amortization of prior service cost (credit) | ( | ) | ( | ) | ( | ) | ( | ) | ( | ) | ( | ) | |||||||
Net periodic defined benefit plan expense | ( | ) | ( | ) | ( | ) | |||||||||||||
Defined contribution plans | — | — | — | ||||||||||||||||
Total retirement plan expense | $ | $ | $ | $ | ( | ) | $ | ( | ) | $ | ( | ) | |||||||
90
Archer-Daniels-Midland Company
Notes to Consolidated Financial Statements (Continued)
Note 15. Employee Benefit Plans (Continued)
The following tables set forth changes in the defined benefit obligation and the fair value of defined benefit plan assets for the years ended December 31, 2019 and 2018:
Pension Benefits | Postretirement Benefits | ||||||||||||||
December 31 2019 | December 31 2018 | December 31 2019 | December 31 2018 | ||||||||||||
(In millions) | (In millions) | ||||||||||||||
Benefit obligation, beginning | $ | $ | $ | $ | |||||||||||
Service cost | |||||||||||||||
Interest cost | |||||||||||||||
Actuarial loss (gain) | ( | ) | ( | ) | |||||||||||
Employee contributions | — | — | |||||||||||||
Curtailments | ( | ) | |||||||||||||
Acquisitions | — | ||||||||||||||
Settlements | ( | ) | — | ||||||||||||
Benefits paid | ( | ) | ( | ) | ( | ) | ( | ) | |||||||
Plan amendments | ( | ) | |||||||||||||
Foreign currency effects | ( | ) | |||||||||||||
Benefit obligation, ending | $ | $ | $ | $ | |||||||||||
Fair value of plan assets, beginning | $ | $ | $ | — | $ | — | |||||||||
Actual return on plan assets | ( | ) | — | — | |||||||||||
Employer contributions | |||||||||||||||
Employee contributions | — | — | |||||||||||||
Settlements | ( | ) | ( | ) | — | — | |||||||||
Business combinations | |||||||||||||||
Benefits paid | ( | ) | ( | ) | ( | ) | ( | ) | |||||||
Foreign currency effects | ( | ) | — | — | |||||||||||
Fair value of plan assets, ending | $ | $ | $ | $ | |||||||||||
Funded status | $ | ( | ) | $ | ( | ) | $ | ( | ) | $ | ( | ) | |||
Prepaid benefit cost | $ | $ | $ | — | $ | — | |||||||||
Accrued benefit liability – current | ( | ) | ( | ) | ( | ) | ( | ) | |||||||
Accrued benefit liability – long-term | ( | ) | ( | ) | ( | ) | ( | ) | |||||||
Net amount recognized in the balance sheet | $ | ( | ) | $ | ( | ) | $ | ( | ) | $ | ( | ) | |||
Included in AOCI for pension benefits at December 31, 2019, are the following amounts that have not yet been recognized in net periodic pension cost: unrecognized prior service credit of $133 million and unrecognized actuarial loss of $572 million. The prior service credit and actuarial loss included in AOCI expected to be recognized in net periodic pension cost during 2020 is $20 million and $37 million, respectively.
Included in AOCI for postretirement benefits at December 31, 2019, are the following amounts that have not yet been recognized in net periodic postretirement benefit cost: unrecognized prior service credit of $15 million and unrecognized actuarial loss of $47 million. Prior service credit of $14 million and actuarial loss of $5 million included in AOCI are expected to be recognized in net periodic benefit cost during 2020.
91
Archer-Daniels-Midland Company
Notes to Consolidated Financial Statements (Continued)
Note 15. Employee Benefit Plans (Continued)
The following table sets forth the principal assumptions used in developing net periodic benefit cost:
Pension Benefits | Postretirement Benefits | ||||||
December 31 2019 | December 31 2018 | December 31 2019 | December 31 2018 | ||||
Discount rate | |||||||
Expected return on plan assets | N/A | N/A | |||||
Rate of compensation increase | N/A | N/A | |||||
The following table sets forth the principal assumptions used in developing the year-end actuarial present value of the projected benefit obligations:
Pension Benefits | Postretirement Benefits | ||||||||
December 31 2019 | December 31 2018 | December 31 2019 | December 31 2018 | ||||||
Discount rate | % | % | |||||||
Rate of compensation increase | % | % | N/A | N/A | |||||
The projected benefit obligation, accumulated benefit obligation, and fair value of plan assets for the pension plans with projected benefit obligations in excess of plan assets were $2.3 billion, $2.2 billion, and $1.6 billion, respectively as of December 31, 2019, and $2.0 billion, $1.9 billion, and $1.4 billion, respectively, as of December 31, 2018. The projected benefit obligation, accumulated benefit obligation, and fair value of plan assets for the pension plans with accumulated benefit obligations in excess of plan assets were $2.2 billion, $2.1 billion, and $1.5 billion, respectively, as of December 31, 2019 and $1.9 billion, $1.8 billion, and $1.3 billion, respectively, as of December 31, 2018. The accumulated benefit obligation for all pension plans as of December 31, 2019 and 2018, was $2.6 billion and $2.2 billion, respectively.
For postretirement benefit measurement purposes, a 6.9 % annual rate of increase in the per capita cost of covered health care benefits was assumed for the year ended December 31, 2019. The rate was assumed to decrease gradually to 4.5 % by 2026 and remain at that level thereafter.
A 1% change in assumed health care cost trend rates would have the following effects:
1% Increase | 1% Decrease | ||||||
(In millions) | |||||||
Effect on accumulated postretirement benefit obligations | $ | $ | ( | ) | |||
The effect on combined service and interest cost components is immaterial.
92
Archer-Daniels-Midland Company
Notes to Consolidated Financial Statements (Continued)
Note 15. Employee Benefit Plans (Continued)
Plan Assets
The Company’s employee benefit plan assets are principally comprised of the following types of investments:
Common stock:
Equity securities are valued based on quoted exchange prices and are classified within Level 1 of the valuation hierarchy.
Mutual funds:
Mutual funds are valued at the closing price reported on the active market on which they are traded and are classified within Level 1 of the valuation hierarchy.
Common collective trust (CCT) funds:
The fair values of the CCTs are valued using net asset value (NAV). The investments in CCTs are comprised of international equity and short-term investments. The investments are valued at NAV provided by administrators of the funds.
Corporate debt instruments:
Corporate debt instruments are valued using third-party pricing services and are classified within Level 2 of the valuation hierarchy.
U.S. Treasury instruments:
U.S. Treasury instruments are valued at the closing price reported on the active market on which they are traded and are classified within Level 1 of the valuation hierarchy.
U.S. government agency, state, and local government bonds:
U.S. government agency obligations and state and municipal debt securities are valued using third-party pricing services and are classified within Level 2 of the valuation hierarchy.
The methods described above may produce a fair value calculation that may not be indicative of net realizable value or reflective of future fair values. Furthermore, while the Company believes its valuation methods are appropriate and consistent with other market participants’ methods, the use of different methodologies or assumptions to determine the fair value of certain financial instruments could result in a different fair value measurement at the reporting date.
93
Archer-Daniels-Midland Company
Notes to Consolidated Financial Statements (Continued)
Note 15. Employee Benefit Plans (Continued)
The following tables set forth, by level within the fair value hierarchy, the fair value of plan assets as of December 31, 2019 and 2018.
Fair Value Measurements at December 31, 2019 | |||||||||||||||
Quoted Prices in Active Markets for Identical Assets (Level 1) | Significant Other Observable Inputs (Level 2) | Significant Unobservable Inputs (Level 3) | Total | ||||||||||||
(In millions) | |||||||||||||||
Common stock | $ | $ | — | $ | — | $ | |||||||||
Mutual funds | — | — | |||||||||||||
Corporate bonds | — | — | |||||||||||||
U.S. Treasury instruments | — | — | |||||||||||||
U.S. government agency, state and local government bonds | — | — | |||||||||||||
Other | — | — | |||||||||||||
Total assets | $ | $ | $ | — | $ | ||||||||||
Common collective trust funds at NAV | |||||||||||||||
U.S. equity | |||||||||||||||
International equity | |||||||||||||||
Total assets at fair value | $ | ||||||||||||||
Fair Value Measurements at December 31, 2018 | |||||||||||||||
Quoted Prices in Active Markets for Identical Assets (Level 1) | Significant Other Observable Inputs (Level 2) | Significant Unobservable Inputs (Level 3) | Total | ||||||||||||
(In millions) | |||||||||||||||
Common stock | $ | $ | — | $ | — | $ | |||||||||
Mutual funds | — | — | |||||||||||||
Corporate bonds | — | — | |||||||||||||
U.S. Treasury instruments | — | — | |||||||||||||
U.S. government agency, state and local government bonds | — | — | |||||||||||||
Other | — | — | |||||||||||||
Total assets | $ | $ | $ | — | $ | ||||||||||
Common collective trust funds at NAV | |||||||||||||||
U.S. equity | |||||||||||||||
International equity | |||||||||||||||
Total assets at fair value | $ | ||||||||||||||
Level 3 Gains and Losses:
There are no Plan assets classified as Level 3 in the fair value hierarchy; therefore there are no gains or losses associated with Level 3 assets.
94
Archer-Daniels-Midland Company
Notes to Consolidated Financial Statements (Continued)
Note 15. Employee Benefit Plans (Continued)
The following table sets forth the actual asset allocation for the Company’s global pension plan assets as of the measurement date:
December 31 2019(1)(2) | December 31 2018(2) | ||
Equity securities | |||
Debt securities | |||
Other | |||
Total | |||
(1) | The Company’s U.S. pension plans contain approximately |
(2) | The Company’s pension plans did not directly hold any shares of Company common stock as of the December 31, 2019 and 2018 measurement dates. |
Investment objectives for the Company’s plan assets are to:
• | Optimize the long-term return on plan assets at an acceptable level of risk. |
• | Maintain a broad diversification across asset classes and among investment managers. |
• | Maintain careful control of the risk level within each asset class. |
Asset allocation targets promote optimal expected return and volatility characteristics given the long-term time horizon for fulfilling the obligations of the pension plans. Selection of the targeted asset allocation for plan assets was based upon a review of the expected return and risk characteristics of each asset class, as well as the correlation of returns among asset classes. The U.S. pension plans target asset allocation is also based on an asset and liability study that is updated periodically.
Investment guidelines are established with each investment manager. These guidelines provide the parameters within which the investment managers agree to operate, including criteria that determine eligible and ineligible securities, diversification requirements, and credit quality standards, where applicable. In some countries, derivatives may be used to gain market exposure in an efficient and timely manner; however, derivatives may not be used to leverage the portfolio beyond the market value of underlying investments.
The Company uses external consultants to assist in monitoring the investment strategy and asset mix for the Company’s plan assets. To develop the Company’s expected long-term rate of return assumption on plan assets, the Company generally uses long-term historical return information for the targeted asset mix identified in asset and liability studies. Adjustments are made to the expected long-term rate of return assumption when deemed necessary based upon revised expectations of future investment performance of the overall investment markets.
Contributions and Expected Future Benefit Payments
Based on actuarial calculations, the Company expects to contribute $27 million to the pension plans and $16 million to the postretirement benefit plan during 2020. The Company may elect to make additional discretionary contributions during this period.
95
Archer-Daniels-Midland Company
Notes to Consolidated Financial Statements (Continued)
Note 15. Employee Benefit Plans (Continued)
The following benefit payments, which reflect expected future service, are expected to be paid by the benefit plans:
Pension Benefits | Postretirement Benefits | ||||||
(In millions) | |||||||
2020 | $ | $ | |||||
2021 | |||||||
2022 | |||||||
2023 | |||||||
2024 | |||||||
2025-2029 | |||||||
Note 16. Shareholders’ Equity
The Company has authorized one billion shares of common stock and 500,000 shares of preferred stock, each with zero par value. No preferred stock has been issued. At December 31, 2019 and 2018, the Company had approximately 158.8 million shares and 157.1 million shares, respectively, of its common shares in treasury. Treasury stock of $5.4 billion and $5.3 billion at December 31, 2019 and 2018, respectively, is recorded at cost as a reduction of common stock.
The following tables set forth the changes in AOCI by component and the reclassifications out of AOCI for the years ended December 31, 2019 and 2018:
Foreign Currency Translation Adjustment | Deferred Gain (Loss) on Hedging Activities | Pension and Other Postretirement Benefit Liabilities Adjustment | Unrealized Gain (Loss) on Investments | Accumulated Other Comprehensive Income (Loss) | |||||||||||||||
(In millions) | |||||||||||||||||||
Balance at December 31, 2017 | $ | ( | ) | $ | $ | ( | ) | $ | $ | ( | ) | ||||||||
Other comprehensive income before reclassifications | ( | ) | ( | ) | ( | ) | ( | ) | |||||||||||
Amounts reclassified from AOCI | ( | ) | ( | ) | |||||||||||||||
Tax effect | ( | ) | ( | ) | ( | ) | ( | ) | ( | ) | |||||||||
Net of tax amount | ( | ) | ( | ) | ( | ) | |||||||||||||
Balance at December 31, 2018 | $ | ( | ) | $ | $ | ( | ) | $ | $ | ( | ) | ||||||||
Other comprehensive income before reclassifications | ( | ) | ( | ) | ( | ) | ( | ) | |||||||||||
Amounts reclassified from AOCI | ( | ) | ( | ) | |||||||||||||||
Tax effect | ( | ) | ( | ) | |||||||||||||||
Net of tax amount | ( | ) | ( | ) | ( | ) | ( | ) | |||||||||||
Balance at December 31, 2019 | $ | ( | ) | $ | ( | ) | $ | ( | ) | $ | $ | ( | ) | ||||||
The change in foreign currency translation adjustment in 2019 is primarily due to the U.S. dollar appreciation, impacting the Euro-denominated equities of the Company's foreign subsidiaries while the change in 2018 is primarily due to the US. dollar appreciation, impacting the Euro and British Pound-denominated equities of the Company’s foreign subsidiaries.
96
Archer-Daniels-Midland Company
Notes to Consolidated Financial Statements (Continued)
Note 16. Shareholders’ Equity (Continued)
Amounts reclassified from AOCI Year Ended December 31 | Affected line item in the consolidated statement of | |||||||||
Details about AOCI components | 2019 | 2018 | 2017 | earnings | ||||||
(In millions) | ||||||||||
Foreign currency translation adjustment | ||||||||||
$ | $ | ( | ) | $ | Other income/expense | |||||
Tax | ||||||||||
$ | $ | ( | ) | $ | Net of tax | |||||
Deferred loss (gain) on hedging activities | ||||||||||
$ | $ | $ | Cost of products sold | |||||||
( | ) | Other income/expense | ||||||||
( | ) | ( | ) | ( | ) | Interest expense | ||||
Revenues | ||||||||||
Total before tax | ||||||||||
( | ) | ( | ) | ( | ) | Tax on reclassifications | ||||
$ | $ | $ | Net of tax | |||||||
Pension liability adjustment | ||||||||||
Amortization of defined benefit pension items: | ||||||||||
Prior service losses (credit) | $ | ( | ) | $ | ( | ) | $ | ( | ) | Other (income) expense - net |
Actuarial losses | Other (income) expense - net | |||||||||
( | ) | Total before tax | ||||||||
( | ) | ( | ) | Tax on reclassifications | ||||||
$ | $ | $ | Net of tax | |||||||
Unrealized loss (gain) on investments | ||||||||||
$ | ( | ) | $ | ( | ) | $ | ( | ) | Other income/expense | |
Tax on reclassifications | ||||||||||
$ | ( | ) | $ | ( | ) | $ | ( | ) | Net of tax | |
97
Archer-Daniels-Midland Company
Notes to Consolidated Financial Statements (Continued)
Note 17. Segment and Geographic Information
Effective July 1, 2019, the Company changed its segment reporting to reflect the creation of the combined Ag Services and Oilseeds segment. The former Origination and Oilseeds businesses were merged into a combined Ag Services and Oilseeds segment which enables the Company to better respond to market changes by integrating the supply and value chains and risk management, while delivering significant simplification and efficiency to the day-to-day business. As part of the Company’s efforts for a streamlined management structure, the combined segment is led by the former President of Oilseeds expanding his role to President of Ag Services and Oilseeds.
Prior period results have been reclassified to conform to the current period segment presentation.
The Company’s operations are organized, managed, and classified into three reportable business segments: Ag Services and Oilseeds, Carbohydrate Solutions, and Nutrition. Each of these segments is organized based upon the nature of products and services offered. The Company’s remaining operations are not reportable segments, as defined by the applicable accounting standard, and are classified as Other.
The Ag Services and Oilseeds segment includes global activities related to the origination, merchandising, transportation, and storage of agricultural raw materials, and the crushing and further processing of oilseeds such as soybeans and soft seeds (cottonseed, sunflower seed, canola, rapeseed, and flaxseed) into vegetable oils and protein meals. Oilseeds products produced and marketed by the segment include ingredients for food, feed, energy, and industrial customers. Crude vegetable oils produced by the segment’s crushing activities are sold “as is” or are further processed by refining, blending, bleaching, and deodorizing into salad oils. Salad oils are sold “as is” or are further processed by hydrogenating and/or interesterifying into margarine, shortening, and other food products. Partially refined oils are used to produce biodiesel and glycols or are sold to other manufacturers for use in chemicals, paints, and other industrial products. Oilseed protein meals are principally sold to third parties to be used as ingredients in commercial livestock and poultry feeds. The Ag Services and Oilseeds segment is also a major supplier of peanuts, tree nuts, and peanut-derived ingredients to both the U.S. and export markets. In North America, cotton cellulose pulp is manufactured and sold to the chemical, paper, and other industrial markets. The Ag Services and Oilseeds segment's grain sourcing, handling, and transportation network (including barge, ocean-going vessel, truck, rail, and container freight services) provides reliable and efficient services to the Company's customers and agricultural processing operations. The Ag Services and Oilseeds segment also includes agricultural commodity and feed product import, export, and global distribution, and structured trade finance activities. This segment also includes the Company's share of the results of its equity investment in Wilmar and its share of the results of its Pacificor, Stratas Foods LLC, Edible Beans Oils Limited, Olenex, and SoyVen joint ventures. In February 2019, the Company purchased the remaining 50 % interest owned by InVivo Group in the Gleadell Agriculture Ltd. joint venture located in the United Kingdom.
The Carbohydrate Solutions segment is engaged in corn and wheat wet and dry milling and other activities. The Carbohydrate Solutions segment converts corn and wheat into products and ingredients used in the food and beverage industry including sweeteners, corn and wheat starches, syrup, glucose, wheat flour, and dextrose. Dextrose and starch are used by the Carbohydrate Solutions segment as feedstocks for its bioproducts operations. By fermentation of dextrose, the Carbohydrate Solutions segment produces alcohol and other food and animal feed ingredients. Ethyl alcohol is produced by the Company for industrial use as ethanol or as beverage grade. Ethanol, in gasoline, increases octane and is used as an extender and oxygenate. Corn gluten feed and meal, as well as distillers’ grains, are produced for use as animal feed ingredients. Corn germ, a by-product of the wet milling process, is further processed into vegetable oil and protein meal. Other Carbohydrate Solutions products include citric acids which are used in various food and industrial products. This segment also includes the Company’s share of the results of its equity investments in Hungrana Ltd., Almidones Mexicanos S.A., Red Star Yeast Company, LLC, and Aston Foods and Food Ingredients.
98
Archer-Daniels-Midland Company
Notes to Consolidated Financial Statements (Continued)
Note 17. Segment and Geographic Information (Continued)
The Nutrition segment serves customer needs for food, beverages, health and wellness, and more. The segment engages in the manufacturing, sale, and distribution of a wide array of products from nature including plant-based proteins, natural flavor ingredients, flavor systems, natural colors, emulsifiers, soluble fiber, polyols, hydrocolloids, natural health and nutrition products including probiotics, prebiotics, enzymes, and botanical extracts, and other specialty food and feed ingredients. The Nutrition segment includes the activities related to the procurement, processing, and distribution of edible beans. The Nutrition segment also includes activities related to the processing and distribution of formula feeds and animal health and nutrition products and the manufacture of contract and private label pet treats and foods. In 2019, ADM completed the acquisitions of Neovia, a French-based global provider of value-added animal nutrition solutions, with 72 production facilities and a presence in 25 countries; FCC, one of the world’s largest producers of citrus oils and ingredients; and Ziegler, a leading European provider of natural citrus flavor ingredients.
Other includes the Company’s financial business units related to futures commission and insurance activities. On May 1, 2017, the Company completed the sale of its crop risk services business to Validus Holdings, a global group of insurance and reinsurance companies.
Intersegment sales have been recorded at amounts approximating market. Operating profit for each segment is based on net sales less identifiable operating expenses. Also included in operating profit for each segment is equity in earnings of affiliates based on the equity method of accounting. Specified items included in total segment operating profit and certain corporate items are not allocated to the Company’s individual business segments because operating performance of each business segment is evaluated by management exclusive of these items. Corporate results principally include the impact of LIFO-related adjustments, unallocated corporate expenses, interest cost net of investment income, and the Company’s share of the results of its equity investment in CIP, which was sold in December 2019.
99
Archer-Daniels-Midland Company
Notes to Consolidated Financial Statements (Continued)
Note 17. Segment and Geographic Information (Continued)
Segment Information
Year Ended | |||||||||||
(In millions) | December 31 | ||||||||||
2019 | 2018 | 2017 | |||||||||
Gross revenues | |||||||||||
Ag Services and Oilseeds | $ | $ | $ | ||||||||
Carbohydrate Solutions | |||||||||||
Nutrition | |||||||||||
Other | |||||||||||
Intersegment elimination | ( | ) | ( | ) | ( | ) | |||||
Total | $ | $ | $ | ||||||||
Intersegment revenues | |||||||||||
Ag Services and Oilseeds | $ | $ | $ | ||||||||
Carbohydrate Solutions | |||||||||||
Nutrition | |||||||||||
Total | $ | $ | $ | ||||||||
Revenues from external customers | |||||||||||
Ag Services and Oilseeds | |||||||||||
Ag Services | $ | $ | $ | ||||||||
Crushing | |||||||||||
Refined Products and Other | |||||||||||
Total Ag Services and Oilseeds | |||||||||||
Carbohydrate Solutions | |||||||||||
Starches and Sweeteners | |||||||||||
Bioproducts | |||||||||||
Total Carbohydrate Solutions | |||||||||||
Nutrition | |||||||||||
Wild Flavors and Specialty Ingredients | |||||||||||
Animal Nutrition | |||||||||||
Total Nutrition | |||||||||||
Other | |||||||||||
Total | $ | $ | $ | ||||||||
100
Archer-Daniels-Midland Company
Notes to Consolidated Financial Statements (Continued)
Note 17. Segment and Geographic Information (Continued)
Year Ended | |||||||||||
(In millions) | December 31 | ||||||||||
2019 | 2018 | 2017 | |||||||||
Depreciation | |||||||||||
Ag Services and Oilseeds | $ | $ | $ | ||||||||
Carbohydrate Solutions | |||||||||||
Nutrition | |||||||||||
Other | |||||||||||
Corporate | |||||||||||
Total | $ | $ | $ | ||||||||
Long-lived asset abandonments and write-downs(1) | |||||||||||
Ag Services and Oilseeds | $ | $ | $ | ||||||||
Carbohydrate Solutions | |||||||||||
Nutrition | |||||||||||
Corporate | |||||||||||
Total | $ | $ | $ | ||||||||
Interest income | |||||||||||
Ag Services and Oilseeds | $ | $ | $ | ||||||||
Carbohydrate Solutions | |||||||||||
Nutrition | |||||||||||
Other | |||||||||||
Corporate | |||||||||||
Total | $ | $ | $ | ||||||||
Equity in earnings of affiliates | |||||||||||
Ag Services and Oilseeds | $ | $ | $ | ||||||||
Carbohydrate Solutions | |||||||||||
Nutrition | |||||||||||
Corporate | ( | ) | ( | ) | |||||||
Total | $ | $ | $ | ||||||||
(1) See Note 18 for total asset impairment, exit, and restructuring costs. | |||||||||||
101
Archer-Daniels-Midland Company
Notes to Consolidated Financial Statements (Continued)
Note 17. Segment and Geographic Information (Continued)
Year Ended | |||||||||||
(In millions) | December 31 | ||||||||||
2019 | 2018 | 2017 | |||||||||
Segment Operating Profit | |||||||||||
Ag Services and Oilseeds | $ | $ | $ | ||||||||
Carbohydrate Solutions | |||||||||||
Nutrition | |||||||||||
Other | |||||||||||
Specified Items: | |||||||||||
Gains on sales of assets and businesses(1) | |||||||||||
Impairment, restructuring, exit, and settlement charges(2) | ( | ) | ( | ) | ( | ) | |||||
Hedge timing effects(3) | |||||||||||
Total segment operating profit | |||||||||||
Corporate | ( | ) | ( | ) | ( | ) | |||||
Earnings before income taxes | $ | $ | $ | ||||||||
(1) The gains in 2019 consisted of a gain on the sale of certain assets and a step-up gain on an equity investment.The gains in 2018 related to the sale of businesses and assets. The gains in 2017 related to the sale of the crop risk services business and disposals of other individually insignificant assets in the ordinary course of business, partially offset by an adjustment of the proceeds of the 2015 sale of the cocoa business.
(2) The charges in 2019 primarily related to the impairment of certain long-lived assets.The charges in 2018 consisted of impairment of certain assets, restructuring, and settlement charges. The charges in 2017 consisted of asset impairments related to the closure of a facility and the reconfiguration of the Company’s Peoria, Illinois ethanol complex, settlement charges, and several individually insignificant asset impairments and restructuring charges.
(3) Hedge timing effects relate to hedge ineffectiveness associated with documented hedge programs.
102
Archer-Daniels-Midland Company
Notes to Consolidated Financial Statements (Continued)
Note 17. Segment and Geographic Information (Continued)
(In millions) | December 31 | ||||||
2019 | 2018 | ||||||
Investments in and advances to affiliates | |||||||
Ag Services and Oilseeds | $ | $ | |||||
Carbohydrate Solutions | |||||||
Nutrition | |||||||
Corporate | |||||||
Total | $ | $ | |||||
Identifiable assets | |||||||
Ag Services and Oilseeds | $ | $ | |||||
Carbohydrate Solutions | |||||||
Nutrition | |||||||
Other | |||||||
Corporate | |||||||
Total | $ | $ | |||||
(In millions) | December 31 | ||||||
2019 | 2018 | ||||||
Gross additions to property, plant, and equipment | |||||||
Ag Services and Oilseeds | $ | $ | |||||
Carbohydrate Solutions | |||||||
Nutrition | |||||||
Other | |||||||
Corporate | |||||||
Total | $ | $ | |||||
103
Archer-Daniels-Midland Company
Notes to Consolidated Financial Statements (Continued)
Note 17. Segment and Geographic Information (Continued)
Geographic information: The following geographic data include revenues attributed to the countries based on the location of the subsidiary making the sale and long-lived assets based on physical location. Long-lived assets represent the net book value of property, plant, and equipment.
Year Ended | |||||||||||
(In millions) | December 31 | ||||||||||
2019 | 2018 | 2017 | |||||||||
Revenues | |||||||||||
United States | $ | $ | $ | ||||||||
Switzerland | |||||||||||
Cayman Islands | |||||||||||
Brazil | |||||||||||
Germany | |||||||||||
Other Foreign | |||||||||||
$ | $ | $ | |||||||||
(In millions) | December 31 | ||||||
2019 | 2018 | ||||||
Long-lived assets | |||||||
United States | $ | $ | |||||
Brazil | |||||||
Other Foreign | |||||||
$ | $ | ||||||
104
Archer-Daniels-Midland Company
Notes to Consolidated Financial Statements (Continued)
Note 18. Asset Impairment, Exit, and Restructuring Costs
The following table sets forth the charges included in asset impairment, exit, and restructuring costs.
(In millions) | Year Ended December 31 | ||||||||||
2019 | 2018 | 2017 | |||||||||
Restructuring and exit costs (1) | $ | $ | $ | ||||||||
Impairment charge - equity method investment(2) | |||||||||||
Impairment charge - goodwill and other intangible assets (3) | |||||||||||
Impairment charge - other long-lived assets (4) | |||||||||||
Total asset impairment, exit, and restructuring costs | $ | $ | $ | ||||||||
(1) | Restructuring and exit costs for the year ended December 31, 2019 consisted of restructuring and pension settlement and remeasurement charges of $ |
(2) | Impairment charge - equity method investment consisted of an impairment charge on an equity investment presented as a specified item within segment operating profit. |
(3) | Impairment charge - goodwill and other intangible assets for the year ended December 31, 2019 consisted of goodwill and other intangible asset impairments in Ag Services and Oilseeds presented as specified items within segment operating profit. Impairment charge - goodwill and other intangible assets for the year ended December 31, 2018 consisted of an intangible asset impairment in Ag Services and Oilseeds presented as specified items within segment operating profit. |
(4) |
105
Archer-Daniels-Midland Company
Notes to Consolidated Financial Statements (Continued)
Note 19. Sale of Accounts Receivable
The Company has an accounts receivable securitization program (the “Program”) with certain commercial paper conduit purchasers and committed purchasers (collectively, the “Purchasers”). Under the Program, certain U.S.-originated trade accounts receivable are sold to a wholly-owned bankruptcy-remote entity, ADM Receivables, LLC (“ADM Receivables”). ADM Receivables in turn transfers such purchased accounts receivable in their entirety to the Purchasers pursuant to a receivables purchase agreement. In exchange for the transfer of the accounts receivable, ADM Receivables receives a cash payment of up to $1.3 billion and an additional amount upon the collection of the accounts receivable (deferred consideration). The Program terminates on June 18, 2020, unless extended.
The Company also has an accounts receivable securitization program (the “Second Program”) with certain commercial paper conduit purchasers and committed purchasers (collectively, the “Second Purchasers”). Under the Second Program, certain non-U.S.-originated trade accounts receivable are sold to a wholly-owned bankruptcy-remote entity, ADM Ireland Receivables Company (“ADM Ireland Receivables”). ADM Ireland Receivables in turn transfers such purchased accounts receivable in their entirety to the Second Purchasers pursuant to a receivables purchase agreement. In exchange for the transfer of the accounts receivable, ADM Ireland Receivables receives a cash payment of up to $0.6 billion (€0.5 billion) and an additional amount upon the collection of the accounts receivable (deferred consideration). The Second Program terminates on March 13, 2020, unless extended.
Under the Program and Second Program (collectively, the “Programs”), ADM Receivables and ADM Ireland Receivables use the cash proceeds from the transfer of receivables to the Purchasers and Second Purchasers (collectively, the "Purchasers") and other consideration to finance the purchase of receivables from the Company and the ADM subsidiaries originating the receivables.
The Company accounts for these transfers as sales. The Company has no retained interests in the transferred receivables, other than collection and administrative responsibilities and its right to the deferred consideration. At December 31, 2019 and 2018, the Company did not record a servicing asset or liability related to its retained responsibility, based on its assessment of the servicing fee, market values for similar transactions, and its cost of servicing the receivables sold.
As of December 31, 2019 and 2018, the fair value of trade receivables transferred to the Purchasers under the Programs and derecognized from the Company’s consolidated balance sheet was $1.9 billion. In exchange for the transfer as of December 31, 2019 and 2018, the Company received cash of $1.4 billion and $1.5 billion and recorded a receivable for deferred consideration included in other current assets of $446 million and $379 million, respectively. Cash collections from customers on receivables sold were $33.8 billion, $34.8 billion, and $33.5 billion for the years ended December 31, 2019, 2018, and 2017, respectively. Of this amount, $13.1 billion, $14.8 billion, and $12.5 billion were cash collections on the deferred consideration reflected as cash inflows from investing activities for the years ended December 31, 2019, 2018, and 2017, respectively. Deferred consideration is paid to the Company in cash on behalf of the Purchasers as receivables are collected; however, as this is a revolving facility, cash collected from the Company’s customers is reinvested by the Purchasers daily in new receivable purchases under the Programs.
The Company’s risk of loss following the transfer of accounts receivable under the Programs is limited to the deferred consideration outstanding. The Company carries the deferred consideration at fair value determined by calculating the expected amount of cash to be received and is principally based on observable inputs (a Level 2 measurement under the applicable accounting standards) consisting mainly of the face amount of the receivables adjusted for anticipated credit losses and discounted at the appropriate market rate. Receipt of deferred consideration is not subject to significant risks other than delinquencies and credit losses on accounts receivable transferred under the Programs which have historically been insignificant.
Transfers of receivables under the Programs during the years ended December 31, 2019, 2018, and 2017 resulted in an expense for the loss on sale of $18 million, $18 million, and $10 million, respectively, which is classified as selling, general, and administrative expenses in the consolidated statements of earnings.
The Company reflects all cash flows related to the Programs as operating activities in its consolidated statements of cash flows because the cash received from the Purchasers upon both the sale and collection of the receivables is not subject to significant interest rate risk given the short-term nature of the Company’s trade receivables.
106
Archer-Daniels-Midland Company
Notes to Consolidated Financial Statements (Continued)
Note 20. Legal Proceedings
The Company is routinely involved in a number of actual or threatened legal actions, including those involving alleged personal injuries, employment law, product liability, intellectual property, environmental issues, alleged tax liability (see Note 13 for information on income tax matters), and class actions. The Company also routinely receives inquiries from regulators and other government authorities relating to various aspects of our business, and at any given time, the Company has matters at various stages of resolution. The outcomes of these matters are not within our complete control and may not be known for prolonged periods of time. In some actions, claimants seek damages, as well as other relief including injunctive relief, that could require significant expenditures or result in lost revenues. In accordance with applicable accounting standards, the Company records a liability in its consolidated financial statements for material loss contingencies when a loss is known or considered probable and the amount can be reasonably estimated. If the reasonable estimate of a known or probable loss is a range, and no amount within the range is a better estimate than any other, the minimum amount of the range is accrued. If a material loss contingency is reasonably possible but not known or probable, and can be reasonably estimated, the estimated loss or range of loss is disclosed in the notes to the consolidated financial statements. When determining the estimated loss or range of loss, significant judgment is required to estimate the amount and timing of a loss to be recorded. Estimates of probable losses resulting from litigation and governmental proceedings involving the Company are inherently difficult to predict, particularly when the matters are in early procedural stages, with incomplete facts or legal discovery; involve unsubstantiated or indeterminate claims for damages; potentially involve penalties, fines, disgorgement, or punitive damages; or could result in a change in business practice.
The Company has been a party to numerous lawsuits pending in various U.S. state and federal courts arising out of Syngenta Corporation’s (“Syngenta”) marketing and distribution of genetically modified corn products in the U.S. First, the Company brought a state court action in Louisiana against Syngenta in 2014, alleging Syngenta was negligent in commercializing its products before the products were approved in China. In December 2017, the Company and Syngenta reached a confidential settlement of this action. Second, Syngenta brought third-party claims against the Company in 2015 in a federal multidistrict litigation (“MDL”) in Kansas City, Kansas, consolidated state court litigation in Minneapolis, Minnesota, and other courts, seeking contribution in the event Syngenta is held liable in class actions by farmers and other parties. In the December 2017 settlement, Syngenta agreed to dismiss all of these third-party claims against the Company. Third, farmers and other parties have sued the Company and other grain companies in numerous individual and purported class action suits in Illinois state and federal courts beginning in the fourth quarter of 2015, alleging the Company and other grain companies were negligent in failing to screen for genetically modified corn. All of these claims were dismissed, subject to appeal, in several orders entered on August 17, 2016 by the federal court in Minneapolis on January 4, 2017 by the federal court in the Southern District of Illinois, and on August 18, 2017 by a state court in Illinois. Subsequently in 2019, a number of additional plaintiffs filed substantially similar claims against the Company and other grain companies in the same Illinois state court. The Company has filed a motion to apply the court's prior dismissal order to these additional complaints, which motion the court has indicated it will grant upon submission of a proposed order from the parties. Thus, pending the anticipated application of the prior dismissal order to the additional Illinois state court complaints and subject to appeals, the Company will not be a defendant in any remaining actions. The Company denies liability in all of the actions in which it has been named as a defendant or third-party defendant and will vigorously defend itself on appeal in these cases. At this time, the Company is unable to predict the final outcome of this matter with any reasonable degree of certainty, but believes the outcome will not have a material adverse effect on its financial condition, results of operations, or cash flows.
On September 4, 2019, AOT Holding AG (“AOT”) filed a putative class action under the U.S. Commodities Exchange Act in federal district court in Urbana, Illinois, alleging that the Company sought to manipulate the benchmark price used to price and settle ethanol derivatives traded on futures exchanges. AOT alleges that members of the putative class suffered “hundreds of millions of dollars in damages” as a result of the Company’s alleged actions. The Company filed a motion to dismiss this suit in November 2019, and that motion is awaiting decision by the court. The Company denies liability, and is vigorously defending itself, in this action. As this action is in pretrial proceedings, the Company is unable at this time to predict the final outcome with any reasonable degree of certainty, but believes the outcome will not have a material adverse effect on its financial condition, results of operations, or cash flows.
107
Archer-Daniels-Midland Company
Notes to Consolidated Financial Statements (Continued)
Note 20. Legal Proceedings, Guarantees, and Commitments (Continued)
On September 5, 2019, D&M Farms, Mark Hasty, and Dustin Land filed a putative class action on behalf of a purported class of peanut farmers under the U.S. federal antitrust laws in federal court in Norfolk, Virginia, alleging that the Company’s subsidiary, Golden Peanut, and another peanut shelling company, conspired to fix the price they paid to farmers for raw peanuts. The Company filed a motion to dismiss this suit in October 2019, and that motion is awaiting decision by the court. The Company denies liability, and is vigorously defending itself, in this action. As this action is in pretrial proceedings, the Company is unable at this time to predict the final outcome with any reasonable degree of certainty, but believes the outcome will not have a material adverse effect on its financial condition, results of operations, or cash flows.
Note 21. Quarterly Financial Data (Unaudited)
Quarter Ended | |||||||||||||||||||
March 31 | June 30 | September 30 | December 31 | Year | |||||||||||||||
(In millions, except per share amounts) | |||||||||||||||||||
Fiscal Year Ended December 31, 2019 | |||||||||||||||||||
Revenues | $ | $ | $ | $ | $ | ||||||||||||||
Gross Profit | |||||||||||||||||||
Net Earnings Attributable to Controlling Interests | |||||||||||||||||||
Basic Earnings Per Common Share | |||||||||||||||||||
Diluted Earnings Per Common Share | |||||||||||||||||||
Quarter Ended | |||||||||||||||||||
March 31 | June 30 | September 30 | December 31 | Year | |||||||||||||||
(In millions, except per share amounts) | |||||||||||||||||||
Fiscal Year Ended December 31, 2018 | |||||||||||||||||||
Revenues | $ | $ | $ | $ | $ | ||||||||||||||
Gross Profit | |||||||||||||||||||
Net Earnings Attributable to Controlling Interests | |||||||||||||||||||
Basic Earnings Per Common Share | |||||||||||||||||||
Diluted Earnings Per Common Share | |||||||||||||||||||
Net earnings attributable to controlling interest for the first quarter of the year ended December 31, 2019 included after-tax gains of $9 million (equal to $0.02 per share) related to the sale of certain assets and a step-up gain on an equity investment; after-tax charges of $10 million (equal to $0.02 per share) related to the impairment of certain assets and restructuring; after-tax charges of $9 million (equal to $0.02 per share) related to the Neovia acquisition; and a tax expense adjustment of $17 million (equal to $0.03 per share) related to the U.S. tax reform and certain discrete items.
Net earnings attributable to controlling interest for the second quarter of the year ended December 31, 2019 included after-tax charges of $105 million (equal to $0.18 per share) related to the impairment of certain assets, restructuring, and pension remeasurement, and a tax benefit adjustment of $19 million (equal to $0.03 per share) related to the U.S. tax reform and certain discrete items.
Net earnings attributable to controlling interest for the third quarter of the year ended December 31, 2019 included included after-tax charges of $41 million (equal to $0.08 per share) related to the impairment of certain assets, restructuring, and pension settlement, and a tax benefit adjustment of $5 million (equal to $0.01 per share) related to the U.S. tax reform and certain discrete items.
108
Archer-Daniels-Midland Company
Notes to Consolidated Financial Statements (Continued)
Note 21. Quarterly Financial Data (Unaudited) (Continued)
Net earnings attributable to controlling interest for the fourth quarter of the year ended December 31, 2019 included an after-tax loss of $133 million (equal to $0.24 per share) related to the sale of an equity investment; after-tax charges of $93 million (equal to $0.16 per share) related to impairment of certain assets, restructuring, and pension settlement; after-tax charges of $2 million (equal to $0.00 per share) related to certain acquisitions; and a tax expense adjustment of $46 million (equal to $0.08 per share) related to the U.S. tax reform and certain discrete items.
Net earnings attributable to controlling interests for the first quarter of the year ended December 31, 2018 included after-tax charges of $12 million (equal to $0.02 per share), primarily related to the impairment of an equity investment and several individually insignificant asset impairments and restructuring charges and a $14 million (equal to $0.03 per share) provisional tax benefit adjustment related to the enactment of the Act.
Net earnings attributable to controlling interests for the second quarter of the year ended December 31, 2018 included after-tax charges of $16 million (equal to $0.03 per share), primarily related to the impairment of a long-term financing receivable and several individually insignificant restructuring charges and a $7 million (equal to $0.01 per share) provisional tax expense adjustment related to the enactment of the Act and certain discrete items.
Net earnings attributable to controlling interests for the third quarter of the year ended December 31, 2018 included after-tax gains of $20 million (equal to $0.04 per share) related to the sale of a business and an equity investment and a $3 million (equal to $0.01 per share) provisional tax expense adjustment related to the enactment of the Act.
Net earnings attributable to controlling interests for the fourth quarter of the year ended December 31, 2018 included after-tax losses of $7 million (equal to $0.02 per share), primarily related to the sale of an asset and a business; after-tax charges of $196 million (equal to 0.35 per share), consisting of a non-cash pension settlement charge related to the transfer of future benefit obligations and annuity administration for certain retirees under the Company's ADM Retirement Plan, a charge related to a discontinued software project in Corporate, asset impairments related to certain long-lived assets, restructuring charges primarily related to the reorganization of IT services in Corporate, and other settlement charges; after-tax charges of $9 million (equal to $0.01 per share) related to acquisition expenses and net losses on foreign currency derivative contracts to economically hedge certain acquisitions; and a $29 million (equal to $0.05 per share) provisional tax benefit adjustment related to the enactment of the Act and certain discrete items.
Note 22. Subsequent Events
On January 7, 2020, the Company announced that it acquired Yerbalatina Phytoactives, a natural plant-based extracts and ingredients manufacturer.
109
Report of Independent Registered Public Accounting Firm
The Board of Directors and Shareholders
Archer-Daniels-Midland Company
Opinion on the Financial Statements
We have audited the accompanying consolidated balance sheets of Archer-Daniels-Midland Company (the Company) as of December 31, 2019 and 2018, and the related consolidated statements of income, comprehensive income (loss), shareholders’ equity, and cash flows, for each of the three years in the period ended December 31, 2019, and the related notes and financial statement schedule listed in the Index at Item 15(a)(2) (collectively referred to as the “financial statements”). In our opinion, the financial statements present fairly, in all material respects, the financial position of the Company at December 31, 2019 and 2018, and the results of its operations and its cash flows for each of the three years in the period ended December 31, 2019, in conformity with U.S. generally accepted accounting principles.
We also have audited, in accordance with the standards of the Public Company Accounting Oversight Board (United States) (PCAOB), the Company's internal control over financial reporting as of December 31, 2019, based on criteria established in Internal Control-Integrated Framework issued by the Committee of Sponsoring Organizations of the Treadway Commission (2013 Framework) and our report dated February 18, 2020, expressed an unqualified opinion thereon.
Basis for Opinion
These financial statements are the responsibility of the Company’s management. Our responsibility is to express an opinion on the Company’s financial statements based on our audits. We are a public accounting firm registered with the PCAOB and are required to be independent with respect to the Company in accordance with the U.S. federal securities laws and the applicable rules and regulations of the Securities and Exchange Commission and the PCAOB.
We conducted our audits in accordance with the standards of the PCAOB. Those standards require that we plan and perform the audit to obtain reasonable assurance about whether the financial statements are free of material misstatement, whether due to error or fraud. Our audits included performing procedures to assess the risks of material misstatement of the financial statements, whether due to error or fraud, and performing procedures that respond to those risks. Such procedures include examining, on a test basis, evidence regarding the amounts and disclosures in the financial statements. Our audits also included evaluating the accounting principles used and significant estimates made by management, as well as evaluating the overall presentation of the financial statements. We believe that our audits provide a reasonable basis for our opinion.
Critical Audit Matters
The critical audit matters communicated below are matters arising from the current period audit of the financial statements that were communicated or required to be communicated to the audit committee and that: (1) relate to accounts or disclosures that are material to the financial statements and (2) involved our especially challenging, subjective or complex judgments. The communication of critical audit matters does not alter in any way our opinion on the financial statements, taken as a whole, and we are not, by communicating the critical audit matters below, providing separate opinions on the critical audit matters or on the accounts or disclosures to which they relate.
110
Fair Value Basis Adjustments - Inventories Carried at Market and Forward Commodity Contracts | ||
Description of the matter | As explained in Notes 1 and 4 to the financial statements, the estimated fair values for inventories carried at market and forward commodity purchase and sale contracts are based on exchange-quoted prices adjusted for differences in local markets and/or quality, referred to as basis. Market valuations for inventories or fair values for forward commodity purchase and sales contracts are adjusted for location and quality differences (basis) because the exchange-quoted prices represent contracts that have standardized terms for commodity, quantity, future delivery period, delivery location, and commodity quality or grade. The stated fair values as of December 31, 2019 for inventories, commodity contracts in an asset position, and commodity contracts in a liability position were $4,704 million, $478 million and $574 million, respectively. Auditing the estimated fair values for inventories carried at market and forward commodity purchase and sale contracts is complex due to the judgment involved in determining market prices, specifically related to determining the estimated basis adjustment. The basis adjustment is impacted by specific local supply and demand characteristics at each facility and the overall market. Factors such as substitute products, weather, fuel costs, contract terms, and futures prices also impact the basis adjustment. | |
How we addressed the matter in our audit | We obtained an understanding, evaluated the design and tested the operating effectiveness of controls over the Company’s determination of the estimated fair values for inventories carried at market and forward commodity purchase and sale contracts. Our tests included controls over the estimation process supporting the basis adjustments. To test the estimated fair values of inventories carried at market and forward commodity purchase and sale contracts, our audit procedures included, among others, evaluating (i) the Company's selection of the principal market, (ii) the inputs for the basis adjustments, and (iii) the completeness and accuracy of the underlying data supporting the basis adjustments. For example, we evaluated management’s methodology for determining the basis adjustment such as assessing the principal market identified and sources utilized by management to support the basis adjustment. Specifically, we compared the basis adjustments used by management to broker quotes, trade publications, and/or recent trade prices, including recently executed transactions. Further, we investigated, to the extent necessary, basis adjustments that were inconsistent with third party, available information. Finally, we evaluated the adequacy of the Company’s financial statement disclosures related to the estimated fair value of inventories carried at market and forward commodity purchase and sale contracts. | |
111
Valuation of Acquired Intangible Assets of Neovia S.A.S. (Neovia) | ||
Description of the matter | On February 1, 2019, the Company completed its acquisition of Neovia for net consideration of $1,692 million, as disclosed in Note 3 to the financial statements. The consideration transferred was allocated to the various assets acquired and liabilities assumed at their estimated fair values as of the acquisition date with the residual of the consideration allocated to goodwill. Auditing the Company's accounting for its acquisition of Neovia was complex due to the significant judgments, estimates and assumptions made by management with respect to intangible assets. Intangible assets related to Neovia were approximately $669 million at December 31, 2019, which principally consisted of trademarks/brands, customer lists, and other intellectual property and were determined primarily using discounted cash flow models. Estimates in the discounted cash flow models include, but are not limited to, certain assumptions that form the basis of the forecasted results (e.g., revenue growth rates, customer attrition rates and royalty rates). | |
How we addressed the matter in our audit | We obtained an understanding, evaluated the design and tested the operating effectiveness of controls over the Company’s accounting for the acquisition. Our tests included controls over the estimation process supporting the recognition and measurement of the intangible assets. We also tested management’s review of assumptions used in the valuation models. To test the estimated fair values of the intangible assets, we performed audit procedures that included, among others, evaluating (i) the Company's selection of the valuation methodology, (ii) the methods and significant assumptions used by the Company, and (iii) the completeness and accuracy of the underlying data supporting the significant assumptions and estimates. For example, we compared the significant assumptions to historical data and other comparable market data. | |
/s/ Ernst & Young LLP
We have served as the Company's auditor since 1930.
Saint Louis, Missouri
February 18, 2020
112
Report of Independent Registered Public Accounting Firm
The Board of Directors and Shareholders
Archer-Daniels-Midland Company
Opinion on Internal Control over Financial Reporting
We have audited Archer-Daniels-Midland Company’s internal control over financial reporting as of December 31, 2019, based on criteria established in Internal Control - Integrated Framework issued by the Committee of Sponsoring Organizations of the Treadway Commission (2013 Framework) (the COSO criteria). In our opinion, Archer-Daniels-Midland Company (the Company) maintained, in all material respects, effective internal control over financial reporting as of December 31, 2019, based on the COSO criteria.
As indicated in the accompanying Management’s Report on Internal Control over Financial Reporting, management’s assessment of and conclusion on the effectiveness of internal control over financial reporting did not include the internal controls of Neovia SAS (Neovia), which is included in the 2019 consolidated financial statements of the Company and constituted approximately 5.3% and 4.3% of total and net assets, respectively, as of December 31, 2019 and 2.8% and 0.1% of revenues and net income, respectively, for the year then ended. Our audit of internal control over financial reporting of the Company also did not include an evaluation of the internal control over financial reporting of Neovia.
We also have audited, in accordance with the standards of the Public Company Accounting Oversight Board (United States) (PCAOB), the consolidated balance sheets of Archer-Daniels-Midland Company as of December 31, 2019 and 2018, and the related consolidated statements of earnings, comprehensive income (loss), shareholders’ equity, and cash flows for each of the three years in the period ended December 31, 2019, and the related notes and financial statement schedule listed in the Index at Item 15(a)(2), and our report dated February 18, 2020, expressed an unqualified opinion thereon.
Basis for Opinion
The Company's management is responsible for maintaining effective internal control over financial reporting and for its assessment of the effectiveness of internal control over financial reporting included in the accompanying Management’s Report on Internal Control Over Financial Reporting. Our responsibility is to express an opinion on the Company’s internal control over financial reporting based on our audit. We are a public accounting firm registered with the PCAOB and are required to be independent with respect to the Company in accordance with the U.S. federal securities laws and the applicable rules and regulations of the Securities and Exchange Commission and the PCAOB.
We conducted our audit in accordance with the standards of the PCAOB. Those standards require that we plan and perform the audit to obtain reasonable assurance about whether effective internal control over financial reporting was maintained in all material respects.
Our audit included obtaining an understanding of internal control over financial reporting, assessing the risk that a material weakness exists, testing and evaluating the design and operating effectiveness of internal control based on the assessed risk, and performing such other procedures as we considered necessary in the circumstances. We believe that our audit provides a reasonable basis for our opinion.
Definition and Limitations of Internal Control Over Financial Reporting
A company’s internal control over financial reporting is a process designed to provide reasonable assurance regarding the reliability of financial reporting and the preparation of financial statements for external purposes in accordance with generally accepted accounting principles. A company’s internal control over financial reporting includes those policies and procedures that (1) pertain to the maintenance of records that, in reasonable detail, accurately and fairly reflect the transactions and dispositions of the assets of the company; (2) provide reasonable assurance that transactions are recorded as necessary to permit preparation of financial statements in accordance with generally accepted accounting principles, and that receipts and expenditures of the company are being made only in accordance with authorizations of management and directors of the company; and (3) provide reasonable assurance regarding prevention or timely detection of unauthorized acquisition, use, or disposition of the company’s assets that could have a material effect on the financial statements.
113
Because of its inherent limitations, internal control over financial reporting may not prevent or detect misstatements. Also, projections of any evaluation of effectiveness to future periods are subject to the risk that controls may become inadequate because of changes in conditions, or that the degree of compliance with the policies or procedures may deteriorate.
/s/ Ernst & Young LLP
Saint Louis, Missouri
February 18, 2020
114
Item 9. | CHANGES IN AND DISAGREEMENTS WITH ACCOUNTANTS ON ACCOUNTING AND FINANCIAL DISCLOSURE |
None.
Item 9A. | CONTROLS AND PROCEDURES |
As of December 31, 2019, an evaluation was performed under the supervision and with the participation of the Company’s management, including the Chief Executive Officer and Chief Financial Officer, of the effectiveness of the design and operation of the Company’s “disclosure controls and procedures” (as defined in Rules 13a-15(e) and 15d-15(e) under the Securities Exchange Act of 1934 (the “Exchange Act”)). Based on that evaluation, the Company’s management, including the Chief Executive Officer and Chief Financial Officer, concluded the Company’s disclosure controls and procedures were effective to ensure that information required to be disclosed by the Company in reports that it files or submits under the Exchange Act is (i) recorded, processed, summarized and reported within the time periods specified in Securities and Exchange Commission rules and forms and (ii) accumulated and communicated to the Company's management, including the Chief Executive Officer and Chief Financial Officer, to allow timely decisions regarding required disclosure.
During 2018, the Company launched Readiness to drive new efficiencies and improve the customer experience in the Company’s existing businesses through a combination of data analytics, process simplification and standardization, and behavioral and cultural change, building upon its earlier 1ADM and operational excellence programs. As part of this transformation, the Company is implementing a new enterprise resource planning (“ERP”) system on a worldwide basis, which is expected to occur in phases over the next several years. The Company continues to consider these changes in its design of and testing for effectiveness of internal controls over financial reporting and concluded, as part of the evaluation described in the above paragraph, that the implementation of the new ERP in these circumstances has not materially affected its internal control over financial reporting.
MANAGEMENT’S REPORT ON INTERNAL CONTROL OVER FINANCIAL REPORTING
Archer-Daniels-Midland Company’s management is responsible for establishing and maintaining adequate internal control over financial reporting, as such term is defined in Exchange Act Rules 13a-15(f). The Company's internal control system is designed to provide reasonable assurance regarding the reliability of financial reporting and the preparation of financial statements in accordance with generally accepted accounting principles.
Under the supervision and with the participation of management, including its Chief Executive Officer and Chief Financial Officer, the Company's management assessed the design and operating effectiveness of internal control over financial reporting as of December 31, 2019 based on the framework set forth in Internal Control-Integrated Framework issued by the Committee of Sponsoring Organizations of the Treadway Commission (2013 Framework). Based on this assessment, management concluded that the Company's internal control over financial reporting was effective as of December 31, 2019.
Management’s assessment of the effectiveness of the Company's internal control over financial reporting did not include the internal controls of Neovia, which was acquired in the first quarter of 2019. In accordance with the SEC guidance regarding the reporting of internal control over financial reporting in connection with an acquisition, management may omit an assessment of an acquired business’ internal control over financial reporting from management’s assessment of internal control over financial reporting for a period not to exceed one year from the date of acquisition. Neovia is included in the Company's consolidated financial statements and constituted 5.3% and 4.3% of total and net assets, respectively, as of December 31, 2019, and 2.8% and 0.1% of revenues and net earnings, respectively, for the year then ended.
Ernst & Young LLP, an independent registered public accounting firm, has issued an attestation report on the Company’s internal control over financial reporting as of December 31, 2019. That report is included herein.
/s/ Juan R. Luciano Juan R. Luciano Chairman, Chief Executive Officer, and President | /s/ Ray G. Young Ray G. Young Executive Vice President and Chief Financial Officer |
Item 9B. | OTHER INFORMATION |
None.
115
PART III
Item 10. | DIRECTORS, EXECUTIVE OFFICERS AND CORPORATE GOVERNANCE |
Information with respect to directors, code of conduct, audit committee and audit committee financial experts of the Company, and Section 16(a) beneficial ownership reporting compliance is set forth in “Proposal No. 1 - Election of Directors for a One-Year Term,” “Director Experiences, Qualifications, Attributes, and Skills; Board Diversity,” “Code of Conduct,” “Information Concerning Committees and Meetings – Audit Committee,” and “Report of the Audit Committee,” of the definitive proxy statement for the Company’s annual meeting of stockholders to be held on May 7, 2020 and is incorporated herein by reference.
Officers of the Company are elected by the Board of Directors for terms of one year and until their successors are duly elected and qualified.
Information with respect to executive officers and certain significant employees of the Company is set forth below. Except as otherwise indicated, all positions are with the Company.
Name | Titles | Age | ||||
Benjamin I. Bard | Global Chief Compliance Officer since January 2014. | 46 | ||||
Camille Batiste | President, Global Supply Chain since January 2020. President, Nutrition Optimization since June 2019. Vice President, Global Procurement from March 2017 to June 2019. Vice President, Sourcing Operations & Compliance at Honeywell Aerospace from March 2015 to March 2017. Senior Director, Indirect Sourcing at Honeywell Aerospace from May 2013 to March 2015. | 48 | ||||
Veronica L. Braker | Senior Vice President, Global Operations since April 2019. Executive Champion of Global Safety since January 2020. Vice President of Operations - Performance Materials at BASF from April 2017 to March 2019. Head of Operations for North America - Performance Materials at BASF from January 2014 to April 2017. | 52 | ||||
Christopher M. Cuddy | Senior Vice President of the Company since May 2015. President, Carbohydrate Solutions business unit since March 2015. President, Corn Sweeteners and Starches from December 2012 to February 2015. | 46 | ||||
Michael D’Ambrose | Senior Vice President, Human Resources since October 2006. | 62 | ||||
Pierre-Christophe Duprat | President, Animal Nutrition since August 2018. President, ADM Europe, Middle East, and Africa (EMEA) from June 2016 to August 2018. President, ADM Corn EMEA and Asia since November 2015. Director, International Business Development - Corn from February 2014 to November 2015. | 52 | ||||
D. Cameron Findlay | Senior Vice President, General Counsel, and Secretary since July 2013. | 60 | ||||
Kristy Folkwein | Senior Vice President of the Company since March 2018. Chief Technology Officer since January 2020. Chief Information Officer from March 2018 to January 2020. Vice President and Chief Information Officer from June 2016 to March 2018. Senior Vice President and Chief Information Officer, Global Business Services at Dow Corning from June 2010 to June 2016. | 57 | ||||
Leticia Goncalves | President, Global Specialty Ingredients since January 2020. Senior Vice President and U.S. Division Head at Bayer from September 2018 to January 2020. President, Europe and Middle East at Monsanto from August 2014 to August 2018. | 45 | ||||
Shannon Herzfeld | Vice President of the Company since February 2005, with responsibility for the Company’s Government Affairs function. | 67 | ||||
Domingo Lastra | President, South America since July 2017. Vice President, Integration and Strategy from March 2016 to July 2017. Managing Director, Agricultural Services International from June 2014 to February 2016. | 51 | ||||
Patricia L. Logan | Chief Audit Executive since August 2014. | 60 | ||||
Juan R. Luciano | Chairman of the Board of Directors since January 2016. Chief Executive Officer and President since January 2015. | 58 | ||||
116
Item 10. | DIRECTORS, EXECUTIVE OFFICERS AND CORPORATE GOVERNANCE (Continued) |
Vikram Luthar | Senior Vice President of the Company since March 2015. Chief Financial Officer, Nutrition since January 2020. President, Health & Wellness from March 2018 to January 2020. President, Bioactives from February 2017 to March 2018. President, Enzymes from December 2015 to February 2017. CFO, Corn Processing business unit from March 2014 to February 2017. Senior Vice President, Strategy from March 2015 to December 2015. Group Vice President, Finance from January 2012 to March 2015. | 53 | ||||
Vincent F. Macciocchi | Senior Vice President of the Company and President, Nutrition business unit since May 2015. Chief Sales and Marketing Officer since January 2020. Global President, WILD Flavors from October 2014 until May 2015. | 54 | ||||
Gregory A. Morris | Senior Vice President of the Company since November 2014. President, Ag Services & Oilseeds business unit since July 2019. President, Global Oilseeds Processing business unit from May 2015 to June 2019. President, WILD Flavors and Specialty Ingredients business unit from October 2014 to May 2015. | 48 | ||||
Ian Pinner | Senior Vice President of the Company since January 2020. Chief Strategy and Innovation Officer and President, Health and Wellness since January 2020. Vice President, Growth and Strategy from August 2018 to January 2020. Chief Growth Officer from July 2017 to August 2018. President, Southeast Asia and Global Destination Marketing from December 2015 to July 2017. President, Global Cocoa from June 2014 to December 2015. | 47 | ||||
Ismael Roig | Senior Vice President of the Company since December 2015. President, ADM Europe, Middle East, and Africa (EMEA) since August 2018. Chief Strategy Officer from December 2015 to August 2018. Chief Sustainability Officer since May 2015. Vice President of the Company from December 2004 until December 2015. President, Asia Pacific from August 2011 to December 2015. | 52 | ||||
John P. Stott | Group Vice President, Finance and Corporate Controller since August 2014. | 52 | ||||
Joseph D. Taets | Senior Vice President of the Company since August 2011. Executive Champion for Quality and Food Safety since January 2020. President, Global Business Readiness since March 2018. President, Agricultural business unit from August 2011 to March 2018. President, ADM Europe, Middle East, and Africa (EMEA) from August 2013 to June 2016. | 54 | ||||
Thuy-Nga T. Vo | Chief Counsel, Corporate, Securities, and Mergers and Acquisitions and Assistant Secretary since January 2017. Chief Counsel, Mergers and Acquisitions from May 2013 to January 2017. | 55 | ||||
Todd Werpy | Senior Vice President and Chief Science Officer since January 2020. Senior Vice President and Chief Technology Officer from March 2015 to January 2020. | 57 | ||||
Ray G. Young | Executive Vice President of the Company since March 2015. Senior Vice President of the Company from November 2010 to March 2015. Chief Financial Officer since December 2010. | 58 | ||||
117
Item 11. | EXECUTIVE COMPENSATION |
Information responsive to this Item is set forth in “Compensation Discussion and Analysis,” “Compensation/Succession Committee Report,” “Compensation/Succession Committee Interlocks and Insider Participation,” “Summary Compensation Table,” “Grants of Plan-Based Awards During Fiscal Year 2019,” “Outstanding Equity Awards at Fiscal Year 2019 Year-End,” “Option Exercises and Stock Vested During Fiscal Year 2019,” “Pension Benefits,” “Nonqualified Deferred Compensation,” “Termination of Employment and Change-in-Control Arrangements,” “CEO Pay Ratio,” and “Director Compensation” of the definitive proxy statement for the Company’s annual meeting of stockholders to be held on May 7, 2020, and is incorporated herein by reference.
Item 12. | SECURITY OWNERSHIP OF CERTAIN BENEFICIAL OWNERS AND MANAGEMENT AND RELATED STOCKHOLDER MATTERS |
Information responsive to this Item is set forth in “Principal Holders of Voting Securities,” “Proposal No. 1 - Election of Directors for a One-Year Term,” “Executive Officer Stock Ownership,” and “Equity Compensation Plan Information at December 31, 2019” of the definitive proxy statement for the Company’s annual meeting of stockholders to be held on May 7, 2020, and is incorporated herein by reference.
Item 13. | CERTAIN RELATIONSHIPS AND RELATED TRANSACTIONS, AND DIRECTOR INDEPENDENCE |
Information responsive to this Item is set forth in “Certain Relationships and Related Transactions,” “Review and Approval of Certain Relationships and Related Transactions,” and “Independence of Directors” of the definitive proxy statement for the Company’s annual meeting of stockholders to be held on May 7, 2020, and is incorporated herein by reference.
Item 14. | PRINCIPAL ACCOUNTING FEES AND SERVICES |
Information responsive to this Item is set forth in “Fees Paid to Independent Auditors” and “Audit Committee Pre-Approval Policies” of the definitive proxy statement for the Company’s annual meeting of stockholders to be held on May 7, 2020, and is incorporated herein by reference.
118
PART IV
Item 15. | EXHIBITS AND FINANCIAL STATEMENT SCHEDULES |
(a)(1) | See Item 8, “Financial Statements and Supplementary Data,” for a list of financial statements. |
(a)(2) | Financial statement schedules |
SCHEDULE II - VALUATION AND QUALIFYING ACCOUNTS AND RESERVES | ||||||||||||||||
Beginning of | End of | |||||||||||||||
(In millions) | Year Balance | Additions | Deductions (1) | Other (2) | Year Balance | |||||||||||
Allowance for doubtful accounts | ||||||||||||||||
December 31, 2017 | $ | ( | ) | $ | ||||||||||||
December 31, 2018 | $ | ( | ) | ( | ) | $ | ||||||||||
December 31, 2019 | $ | ( | ) | $ | ||||||||||||
(1) Uncollectible accounts written off | ||||||||||||||||
(2) Impact of reclassifications, foreign exchange translation, and other adjustments | ||||||||||||||||
All other schedules are either not required, not applicable, or the information is otherwise included.
(a)(3) | List of exhibits |
(3) |
(ii) |
(4) | Instruments defining the rights of security holders, including: |
(i) |
(ii) | Indenture, dated as of June 1, 1986, by and between the Company and The Bank of New York Mellon (successor to JPMorgan Chase, The Chase Manhattan Bank, Chemical Bank, and Manufacturers Hanover Trust Company), as Trustee (incorporated by reference to Exhibit 4(a) to the Company's Registration Statement on Form S-3 (File No. 33-6721)), as amended and supplemented by Supplemental Indenture, dated as of August 1, 1989, by and between the Company and The Bank of New York Mellon (successor to JPMorgan Chase, The Chase Manhattan Bank, Chemical Bank and Manufacturers Hanover Trust Company), as Trustee (incorporated by reference to Exhibit 4(c) to Post Effective Amendment No. 3 to the Company's Registration Statement on Form S-3 (No. 33-6721)), relating to: |
the $350,000,000 – 7 1/2% Debentures due March 15, 2027,
the $200,000,000 – 6 3/4% Debentures due December 15, 2027,
the $300,000,000 – 6 5/8% Debentures due May 1, 2029,
the $400,000,000 – 7% Debentures due February 1, 2031,
the $500,000,000 – 5.935% Debentures due October 1, 2032,
the $600,000,000 – 5.375% Debentures due September 15, 2035, and
the $250,000,000 – 6.95% Debentures due December 15, 2097.
119
Item 15. | EXHIBITS AND FINANCIAL STATEMENT SCHEDULES (Continued) |
reference to Exhibit 4.6 to the Company's Current Report on Form 8-K filed on June 3, 2008 (File No. 1-44)), Second Supplemental Indenture, dated as of November 29, 2010, by and between the Company and The Bank of New York Mellon (incorporated by reference to Exhibit 4.3 to the Company's Current Report on Form 8-K filed on November 30, 2010 (File No. 1-44)), and Third Supplemental Indenture, dated as of April 4, 2011, between the Company and The Bank of New York Mellon (incorporated by reference to Exhibit 4.4 to the Company's Current Report on Form 8-K filed on April 8, 2011 (File No. 1-44)), relating to:
the $500,000,000 – 6.45% Debentures due January 15, 2038,
the $750,000,000 – 4.479% Notes due March 1, 2021,
the $1,000,000,000 – 5.765% Debentures due March 1, 2041, and
the $527,688,000 – 4.535% Debentures due March 26, 2042.
(iv) |
the $570,425,000 – 4.016% Debentures due April 16, 2043,
the €600,000,000 – 1.750% Notes due June 23, 2023,
the $1,000,000,000 – 2.500% Notes due August 11, 2026,
the $500,000,000 – 3.750% Notes due September 15, 2047,
the €650,000,000 – 1.00% Notes due September 12, 2025,
the $400,000,000 – 3.375% Notes due March 15, 2022, and
the $600,000,000 – 4.500% Notes due March 15, 2049.
(v) | Copies of constituent instruments defining rights of holders of long-term debt of the Company and its Subsidiaries, other than the indentures specified herein, are not filed herewith, pursuant to Instruction (b)(4)(iii)(A) to Item 601 of Regulation S-K, because the total amount of securities authorized under any such instrument does not exceed 10% of the total assets of the Company and Subsidiaries on a consolidated basis. The Company hereby agrees that it will, upon request by the SEC, furnish to the SEC a copy of each such instrument. |
(10) | Copies of the Company’s equity compensation plans, deferred compensation plans and agreements with executive officers are incorporated herein by reference pursuant to Instruction (b)(10)(iii)(A) to Item 601 of Regulation S-K, each of which is a management contract or compensation plan or arrangement required to be filed as an exhibit pursuant to Item 15(b) of Form 10-K, as follows: |
(i) |
(ii) |
(iii) |
(iv) |
(v) |
120
Item 15. | EXHIBITS AND FINANCIAL STATEMENT SCHEDULES (Continued) |
(vi) |
(vii) |
(viii) |
(ix) |
(x) |
(xi) |
(xii) |
(xiii) |
(xiv) |
(xv) |
(xvi) |
(xvii) |
(xviii) |
(xix) |
121
Item 15. | EXHIBITS AND FINANCIAL STATEMENT SCHEDULES (Continued) |
(xx) |
(xxi) |
(xxii) |
(xxiii) |
(xxiv) |
(xxv) |
(xxvi) |
(21) |
(23) |
(24) |
(31.1) |
(31.2) |
(32.1) |
(32.2) |
(101) | Interactive Data File. |
(104) | Cover Page Interactive Data File (formatted as Inline XBRL and incorporated by reference to Exhibit 101) |
Item 16. | Form 10-K Summary |
Not Applicable.
122
SIGNATURES
Pursuant to the requirements of Section 13 of the Securities Exchange Act of 1934, the Registrant has duly caused this report to be signed on its behalf by the undersigned, thereunto duly authorized.
Date: February 18, 2020
ARCHER-DANIELS-MIDLAND COMPANY
By: /s/ D. C. Findlay
D. C. Findlay
Senior Vice President, General Counsel
and Secretary
Pursuant to the requirements of the Securities Exchange Act of 1934, this report has been signed below on February 18, 2020, by the following persons on behalf of the Registrant and in the capacities indicated.
/s/ J. R. Luciano | /s/ D. E. Felsinger | /s/ D. C. Findlay |
J. R. Luciano*, | D. E. Felsinger*, | D. C. Findlay |
Chairman, Chief Executive Officer, | Director | Attorney-in-Fact |
President, and Director | ||
(Principal Executive Officer) | /s/ S. F. Harrison | |
S. F. Harrison*, | ||
/s/ R. G. Young | Director | |
R. G. Young | ||
Executive Vice President and | /s/ P. J. Moore | |
Chief Financial Officer | P. J. Moore*, | |
(Principal Financial Officer) | Director | |
/s/ J. P. Stott | /s/ F. J. Sanchez | |
J. P. Stott | F. J. Sanchez*, | |
Group Vice President, Finance and | Director | |
Corporate Controller | ||
(Principal Accounting Officer) | /s/ D. A. Sandler | |
D. A. Sandler*, | ||
/s/ M.S. Burke | Director | |
M. S. Burke*, | ||
Director | /s/ L. Z. Schlitz | |
L. Z. Schlitz*, | ||
/s/ T. K. Crews | Director | |
T. K. Crews*, | ||
Director | /s/ K. R. Westbrook | |
K. R. Westbrook*, | ||
/s/ P. Dufour | Director | |
P. Dufour*, | ||
Director | ||
*Powers of Attorney authorizing R. G. Young, J. P. Stott, and D. C. Findlay, and each of them, to sign the Form 10-K on behalf of the above-named officers and directors of the Company, copies of which are being filed with the Securities and Exchange Commission.
123