00007054322020FYFALSEus-gaap:AccountingStandardsUpdate201613Memberus-gaap:AccountingStandardsUpdate201708MemberP5YP3YP3Y00007054322020-01-012020-12-31iso4217:USD00007054322020-06-30xbrli:shares00007054322021-02-2300007054322020-12-3100007054322019-12-31iso4217:USDxbrli:shares00007054322019-01-012019-12-3100007054322018-01-012018-12-310000705432us-gaap:CommonStockMember2017-12-310000705432us-gaap:AdditionalPaidInCapitalMember2017-12-310000705432us-gaap:RetainedEarningsMember2017-12-310000705432us-gaap:TreasuryStockMember2017-12-310000705432us-gaap:AccumulatedOtherComprehensiveIncomeMember2017-12-3100007054322017-12-310000705432us-gaap:RetainedEarningsMembersrt:CumulativeEffectPeriodOfAdoptionAdjustmentMember2017-12-310000705432srt:CumulativeEffectPeriodOfAdoptionAdjustmentMemberus-gaap:AccumulatedOtherComprehensiveIncomeMember2017-12-310000705432srt:CumulativeEffectPeriodOfAdoptionAdjustmentMember2017-12-310000705432srt:CumulativeEffectPeriodOfAdoptionAdjustedBalanceMemberus-gaap:CommonStockMember2017-12-310000705432us-gaap:AdditionalPaidInCapitalMembersrt:CumulativeEffectPeriodOfAdoptionAdjustedBalanceMember2017-12-310000705432us-gaap:RetainedEarningsMembersrt:CumulativeEffectPeriodOfAdoptionAdjustedBalanceMember2017-12-310000705432us-gaap:TreasuryStockMembersrt:CumulativeEffectPeriodOfAdoptionAdjustedBalanceMember2017-12-310000705432srt:CumulativeEffectPeriodOfAdoptionAdjustedBalanceMemberus-gaap:AccumulatedOtherComprehensiveIncomeMember2017-12-310000705432srt:CumulativeEffectPeriodOfAdoptionAdjustedBalanceMember2017-12-310000705432us-gaap:RetainedEarningsMember2018-01-012018-12-310000705432us-gaap:AccumulatedOtherComprehensiveIncomeMember2018-01-012018-12-310000705432us-gaap:CommonStockMember2018-01-012018-12-310000705432us-gaap:AdditionalPaidInCapitalMember2018-01-012018-12-310000705432us-gaap:TreasuryStockMember2018-01-012018-12-310000705432us-gaap:CommonStockMember2018-12-310000705432us-gaap:AdditionalPaidInCapitalMember2018-12-310000705432us-gaap:RetainedEarningsMember2018-12-310000705432us-gaap:TreasuryStockMember2018-12-310000705432us-gaap:AccumulatedOtherComprehensiveIncomeMember2018-12-3100007054322018-12-310000705432us-gaap:RetainedEarningsMembersrt:CumulativeEffectPeriodOfAdoptionAdjustmentMember2018-12-310000705432srt:CumulativeEffectPeriodOfAdoptionAdjustmentMember2018-12-310000705432srt:CumulativeEffectPeriodOfAdoptionAdjustedBalanceMemberus-gaap:CommonStockMember2018-12-310000705432us-gaap:AdditionalPaidInCapitalMembersrt:CumulativeEffectPeriodOfAdoptionAdjustedBalanceMember2018-12-310000705432us-gaap:RetainedEarningsMembersrt:CumulativeEffectPeriodOfAdoptionAdjustedBalanceMember2018-12-310000705432us-gaap:TreasuryStockMembersrt:CumulativeEffectPeriodOfAdoptionAdjustedBalanceMember2018-12-310000705432srt:CumulativeEffectPeriodOfAdoptionAdjustedBalanceMemberus-gaap:AccumulatedOtherComprehensiveIncomeMember2018-12-310000705432srt:CumulativeEffectPeriodOfAdoptionAdjustedBalanceMember2018-12-310000705432us-gaap:RetainedEarningsMember2019-01-012019-12-310000705432us-gaap:AccumulatedOtherComprehensiveIncomeMember2019-01-012019-12-310000705432us-gaap:CommonStockMember2019-01-012019-12-310000705432us-gaap:AdditionalPaidInCapitalMember2019-01-012019-12-310000705432us-gaap:TreasuryStockMember2019-01-012019-12-310000705432us-gaap:CommonStockMember2019-12-310000705432us-gaap:AdditionalPaidInCapitalMember2019-12-310000705432us-gaap:RetainedEarningsMember2019-12-310000705432us-gaap:TreasuryStockMember2019-12-310000705432us-gaap:AccumulatedOtherComprehensiveIncomeMember2019-12-310000705432us-gaap:RetainedEarningsMembersrt:CumulativeEffectPeriodOfAdoptionAdjustmentMember2019-12-310000705432srt:CumulativeEffectPeriodOfAdoptionAdjustmentMember2019-12-310000705432srt:CumulativeEffectPeriodOfAdoptionAdjustedBalanceMemberus-gaap:CommonStockMember2019-12-310000705432us-gaap:AdditionalPaidInCapitalMembersrt:CumulativeEffectPeriodOfAdoptionAdjustedBalanceMember2019-12-310000705432us-gaap:RetainedEarningsMembersrt:CumulativeEffectPeriodOfAdoptionAdjustedBalanceMember2019-12-310000705432us-gaap:TreasuryStockMembersrt:CumulativeEffectPeriodOfAdoptionAdjustedBalanceMember2019-12-310000705432srt:CumulativeEffectPeriodOfAdoptionAdjustedBalanceMemberus-gaap:AccumulatedOtherComprehensiveIncomeMember2019-12-310000705432srt:CumulativeEffectPeriodOfAdoptionAdjustedBalanceMember2019-12-310000705432us-gaap:RetainedEarningsMember2020-01-012020-12-310000705432us-gaap:AccumulatedOtherComprehensiveIncomeMember2020-01-012020-12-310000705432us-gaap:CommonStockMember2020-01-012020-12-310000705432us-gaap:AdditionalPaidInCapitalMember2020-01-012020-12-310000705432us-gaap:TreasuryStockMember2020-01-012020-12-310000705432us-gaap:CommonStockMember2020-12-310000705432us-gaap:AdditionalPaidInCapitalMember2020-12-310000705432us-gaap:RetainedEarningsMember2020-12-310000705432us-gaap:TreasuryStockMember2020-12-310000705432us-gaap:AccumulatedOtherComprehensiveIncomeMember2020-12-31sbsi:banking_offices0000705432us-gaap:AccountingStandardsUpdate201613Member2019-01-012019-12-310000705432us-gaap:AccountingStandardsUpdate201613Member2020-01-012020-01-010000705432us-gaap:ConstructionLoansMember2020-01-010000705432us-gaap:ConstructionLoansMembersrt:CumulativeEffectPeriodOfAdoptionAdjustmentMember2020-01-010000705432us-gaap:ConstructionLoansMembersrt:CumulativeEffectPeriodOfAdoptionAdjustedBalanceMember2020-01-010000705432us-gaap:ResidentialRealEstateMember2020-01-010000705432us-gaap:ResidentialRealEstateMembersrt:CumulativeEffectPeriodOfAdoptionAdjustmentMember2020-01-010000705432srt:CumulativeEffectPeriodOfAdoptionAdjustedBalanceMemberus-gaap:ResidentialRealEstateMember2020-01-010000705432us-gaap:CommercialRealEstatePortfolioSegmentMember2020-01-010000705432us-gaap:CommercialRealEstatePortfolioSegmentMembersrt:CumulativeEffectPeriodOfAdoptionAdjustmentMember2020-01-010000705432srt:CumulativeEffectPeriodOfAdoptionAdjustedBalanceMemberus-gaap:CommercialRealEstatePortfolioSegmentMember2020-01-010000705432us-gaap:CommercialLoanMember2020-01-010000705432us-gaap:CommercialLoanMembersrt:CumulativeEffectPeriodOfAdoptionAdjustmentMember2020-01-010000705432srt:CumulativeEffectPeriodOfAdoptionAdjustedBalanceMemberus-gaap:CommercialLoanMember2020-01-010000705432sbsi:MunicipalLoansMember2020-01-010000705432sbsi:MunicipalLoansMembersrt:CumulativeEffectPeriodOfAdoptionAdjustmentMember2020-01-010000705432srt:CumulativeEffectPeriodOfAdoptionAdjustedBalanceMembersbsi:MunicipalLoansMember2020-01-010000705432us-gaap:ConsumerLoanMember2020-01-010000705432srt:CumulativeEffectPeriodOfAdoptionAdjustmentMemberus-gaap:ConsumerLoanMember2020-01-010000705432srt:CumulativeEffectPeriodOfAdoptionAdjustedBalanceMemberus-gaap:ConsumerLoanMember2020-01-0100007054322020-01-010000705432srt:CumulativeEffectPeriodOfAdoptionAdjustmentMember2020-01-010000705432srt:CumulativeEffectPeriodOfAdoptionAdjustedBalanceMember2020-01-01sbsi:segment0000705432us-gaap:AccountingStandardsUpdate201708Member2018-01-012018-12-310000705432us-gaap:BuildingMembersrt:MinimumMember2020-01-012020-12-310000705432us-gaap:BuildingMembersrt:MaximumMember2020-01-012020-12-310000705432us-gaap:EquipmentMembersrt:MinimumMember2020-01-012020-12-310000705432us-gaap:EquipmentMembersrt:MaximumMember2020-01-012020-12-310000705432us-gaap:CoreDepositsMember2020-12-310000705432us-gaap:CustomerRelationshipsMember2020-12-310000705432sbsi:CoreDepositIntangibleandTrustRelationshipIntangibleMember2020-01-012020-12-310000705432sbsi:CoreDepositIntangibleandTrustRelationshipIntangibleMember2019-01-012019-12-310000705432sbsi:CoreDepositIntangibleandTrustRelationshipIntangibleMember2018-01-012018-12-310000705432us-gaap:AccumulatedNetUnrealizedInvestmentGainLossMember2019-12-310000705432us-gaap:AccumulatedGainLossNetCashFlowHedgeParentMember2019-12-310000705432us-gaap:PensionPlansDefinedBenefitMemberus-gaap:AccumulatedDefinedBenefitPlansAdjustmentNetPriorServiceCostCreditMember2019-12-310000705432us-gaap:AccumulatedDefinedBenefitPlansAdjustmentNetUnamortizedGainLossMemberus-gaap:PensionPlansDefinedBenefitMember2019-12-310000705432us-gaap:AccumulatedNetUnrealizedInvestmentGainLossMember2020-01-012020-12-310000705432us-gaap:AccumulatedGainLossNetCashFlowHedgeParentMember2020-01-012020-12-310000705432us-gaap:PensionPlansDefinedBenefitMemberus-gaap:AccumulatedDefinedBenefitPlansAdjustmentNetPriorServiceCostCreditMember2020-01-012020-12-310000705432us-gaap:AccumulatedDefinedBenefitPlansAdjustmentNetUnamortizedGainLossMemberus-gaap:PensionPlansDefinedBenefitMember2020-01-012020-12-310000705432us-gaap:AccumulatedNetUnrealizedInvestmentGainLossMember2020-12-310000705432us-gaap:AccumulatedGainLossNetCashFlowHedgeParentMember2020-12-310000705432us-gaap:PensionPlansDefinedBenefitMemberus-gaap:AccumulatedDefinedBenefitPlansAdjustmentNetPriorServiceCostCreditMember2020-12-310000705432us-gaap:AccumulatedDefinedBenefitPlansAdjustmentNetUnamortizedGainLossMemberus-gaap:PensionPlansDefinedBenefitMember2020-12-310000705432us-gaap:AccumulatedNetUnrealizedInvestmentGainLossMember2018-12-310000705432us-gaap:AccumulatedGainLossNetCashFlowHedgeParentMember2018-12-310000705432us-gaap:PensionPlansDefinedBenefitMemberus-gaap:AccumulatedDefinedBenefitPlansAdjustmentNetPriorServiceCostCreditMember2018-12-310000705432us-gaap:AccumulatedDefinedBenefitPlansAdjustmentNetUnamortizedGainLossMemberus-gaap:PensionPlansDefinedBenefitMember2018-12-310000705432us-gaap:AccumulatedNetUnrealizedInvestmentGainLossMember2019-01-012019-12-310000705432us-gaap:AccumulatedGainLossNetCashFlowHedgeParentMember2019-01-012019-12-310000705432us-gaap:PensionPlansDefinedBenefitMemberus-gaap:AccumulatedDefinedBenefitPlansAdjustmentNetPriorServiceCostCreditMember2019-01-012019-12-310000705432us-gaap:AccumulatedDefinedBenefitPlansAdjustmentNetUnamortizedGainLossMemberus-gaap:PensionPlansDefinedBenefitMember2019-01-012019-12-310000705432us-gaap:AccumulatedNetUnrealizedInvestmentGainLossMember2017-12-310000705432us-gaap:AccumulatedGainLossNetCashFlowHedgeParentMember2017-12-310000705432us-gaap:PensionPlansDefinedBenefitMemberus-gaap:AccumulatedDefinedBenefitPlansAdjustmentNetPriorServiceCostCreditMember2017-12-310000705432us-gaap:AccumulatedDefinedBenefitPlansAdjustmentNetUnamortizedGainLossMemberus-gaap:PensionPlansDefinedBenefitMember2017-12-310000705432us-gaap:AccountingStandardsUpdate201601Memberus-gaap:AccumulatedNetUnrealizedInvestmentGainLossMembersrt:CumulativeEffectPeriodOfAdoptionAdjustmentMember2017-12-310000705432us-gaap:AccumulatedGainLossNetCashFlowHedgeParentMemberus-gaap:AccountingStandardsUpdate201601Membersrt:CumulativeEffectPeriodOfAdoptionAdjustmentMember2017-12-310000705432us-gaap:AccountingStandardsUpdate201601Memberus-gaap:PensionPlansDefinedBenefitMemberus-gaap:AccumulatedDefinedBenefitPlansAdjustmentNetPriorServiceCostCreditMembersrt:CumulativeEffectPeriodOfAdoptionAdjustmentMember2017-12-310000705432us-gaap:AccumulatedDefinedBenefitPlansAdjustmentNetUnamortizedGainLossMemberus-gaap:AccountingStandardsUpdate201601Memberus-gaap:PensionPlansDefinedBenefitMembersrt:CumulativeEffectPeriodOfAdoptionAdjustmentMember2017-12-310000705432us-gaap:AccountingStandardsUpdate201601Membersrt:CumulativeEffectPeriodOfAdoptionAdjustmentMember2017-12-310000705432srt:CumulativeEffectPeriodOfAdoptionAdjustedBalanceMemberus-gaap:AccumulatedNetUnrealizedInvestmentGainLossMember2017-12-310000705432us-gaap:AccumulatedGainLossNetCashFlowHedgeParentMembersrt:CumulativeEffectPeriodOfAdoptionAdjustedBalanceMember2017-12-310000705432srt:CumulativeEffectPeriodOfAdoptionAdjustedBalanceMemberus-gaap:PensionPlansDefinedBenefitMemberus-gaap:AccumulatedDefinedBenefitPlansAdjustmentNetPriorServiceCostCreditMember2017-12-310000705432us-gaap:AccumulatedDefinedBenefitPlansAdjustmentNetUnamortizedGainLossMembersrt:CumulativeEffectPeriodOfAdoptionAdjustedBalanceMemberus-gaap:PensionPlansDefinedBenefitMember2017-12-310000705432us-gaap:AccumulatedNetUnrealizedInvestmentGainLossMember2018-01-012018-12-310000705432us-gaap:AccumulatedGainLossNetCashFlowHedgeParentMember2018-01-012018-12-310000705432us-gaap:PensionPlansDefinedBenefitMemberus-gaap:AccumulatedDefinedBenefitPlansAdjustmentNetPriorServiceCostCreditMember2018-01-012018-12-310000705432us-gaap:AccumulatedDefinedBenefitPlansAdjustmentNetUnamortizedGainLossMemberus-gaap:PensionPlansDefinedBenefitMember2018-01-012018-12-310000705432us-gaap:RetainedEarningsMemberus-gaap:AccountingStandardsUpdate201601Membersrt:CumulativeEffectPeriodOfAdoptionAdjustmentMember2017-12-310000705432us-gaap:RetainedEarningsMemberus-gaap:AccountingStandardsUpdate201601Membersbsi:NetOfTaxAdjustmentMembersrt:CumulativeEffectPeriodOfAdoptionAdjustmentMember2017-12-310000705432us-gaap:AccumulatedNetUnrealizedInvestmentGainLossMembersbsi:SecuritiesTransferredBetweenHeldtoMaturityAndAvailableforSaleSecuritiesMemberus-gaap:ReclassificationOutOfAccumulatedOtherComprehensiveIncomeMember2020-01-012020-12-310000705432us-gaap:AccumulatedNetUnrealizedInvestmentGainLossMembersbsi:SecuritiesTransferredBetweenHeldtoMaturityAndAvailableforSaleSecuritiesMemberus-gaap:ReclassificationOutOfAccumulatedOtherComprehensiveIncomeMember2019-01-012019-12-310000705432us-gaap:AccumulatedNetUnrealizedInvestmentGainLossMembersbsi:SecuritiesTransferredBetweenHeldtoMaturityAndAvailableforSaleSecuritiesMemberus-gaap:ReclassificationOutOfAccumulatedOtherComprehensiveIncomeMember2018-01-012018-12-310000705432us-gaap:AvailableforsaleSecuritiesMemberus-gaap:AccumulatedNetUnrealizedInvestmentGainLossMemberus-gaap:ReclassificationOutOfAccumulatedOtherComprehensiveIncomeMember2020-01-012020-12-310000705432us-gaap:AvailableforsaleSecuritiesMemberus-gaap:AccumulatedNetUnrealizedInvestmentGainLossMemberus-gaap:ReclassificationOutOfAccumulatedOtherComprehensiveIncomeMember2019-01-012019-12-310000705432us-gaap:AvailableforsaleSecuritiesMemberus-gaap:AccumulatedNetUnrealizedInvestmentGainLossMemberus-gaap:ReclassificationOutOfAccumulatedOtherComprehensiveIncomeMember2018-01-012018-12-310000705432us-gaap:AccumulatedGainLossNetCashFlowHedgeParentMemberus-gaap:InterestRateSwapMemberus-gaap:ReclassificationOutOfAccumulatedOtherComprehensiveIncomeMember2020-01-012020-12-310000705432us-gaap:AccumulatedGainLossNetCashFlowHedgeParentMemberus-gaap:InterestRateSwapMemberus-gaap:ReclassificationOutOfAccumulatedOtherComprehensiveIncomeMember2019-01-012019-12-310000705432us-gaap:AccumulatedGainLossNetCashFlowHedgeParentMemberus-gaap:InterestRateSwapMemberus-gaap:ReclassificationOutOfAccumulatedOtherComprehensiveIncomeMember2018-01-012018-12-310000705432sbsi:AccumulatedNetGainLossFromTerminatedInterestRateSwapDerivativesMemberus-gaap:InterestRateSwapMemberus-gaap:ReclassificationOutOfAccumulatedOtherComprehensiveIncomeMember2020-01-012020-12-310000705432sbsi:AccumulatedNetGainLossFromTerminatedInterestRateSwapDerivativesMemberus-gaap:InterestRateSwapMemberus-gaap:ReclassificationOutOfAccumulatedOtherComprehensiveIncomeMember2019-01-012019-12-310000705432sbsi:AccumulatedNetGainLossFromTerminatedInterestRateSwapDerivativesMemberus-gaap:InterestRateSwapMemberus-gaap:ReclassificationOutOfAccumulatedOtherComprehensiveIncomeMember2018-01-012018-12-310000705432us-gaap:AccumulatedDefinedBenefitPlansAdjustmentNetUnamortizedGainLossMember2020-01-012020-12-310000705432us-gaap:AccumulatedDefinedBenefitPlansAdjustmentNetUnamortizedGainLossMember2019-01-012019-12-310000705432us-gaap:AccumulatedDefinedBenefitPlansAdjustmentNetUnamortizedGainLossMember2018-01-012018-12-310000705432us-gaap:AccumulatedDefinedBenefitPlansAdjustmentNetPriorServiceCostCreditMember2020-01-012020-12-310000705432us-gaap:AccumulatedDefinedBenefitPlansAdjustmentNetPriorServiceCostCreditMember2019-01-012019-12-310000705432us-gaap:AccumulatedDefinedBenefitPlansAdjustmentNetPriorServiceCostCreditMember2018-01-012018-12-310000705432us-gaap:AccumulatedDefinedBenefitPlansAdjustmentMember2020-01-012020-12-310000705432us-gaap:AccumulatedDefinedBenefitPlansAdjustmentMember2019-01-012019-12-310000705432us-gaap:AccumulatedDefinedBenefitPlansAdjustmentMember2018-01-012018-12-310000705432us-gaap:USStatesAndPoliticalSubdivisionsMember2020-12-310000705432sbsi:OtherStocksAndBondsMember2020-12-310000705432us-gaap:ResidentialMortgageBackedSecuritiesMember2020-12-310000705432us-gaap:CommercialMortgageBackedSecuritiesMember2020-12-310000705432us-gaap:USStatesAndPoliticalSubdivisionsMember2019-12-310000705432sbsi:OtherStocksAndBondsMember2019-12-310000705432us-gaap:ResidentialMortgageBackedSecuritiesMember2019-12-310000705432us-gaap:CommercialMortgageBackedSecuritiesMember2019-12-310000705432us-gaap:AvailableforsaleSecuritiesMember2020-12-310000705432us-gaap:HeldtomaturitySecuritiesMember2020-12-310000705432us-gaap:ConstructionLoansMember2020-12-310000705432us-gaap:ConstructionLoansMember2019-12-310000705432us-gaap:ResidentialRealEstateMember2020-12-310000705432us-gaap:ResidentialRealEstateMember2019-12-310000705432us-gaap:CommercialRealEstatePortfolioSegmentMember2020-12-310000705432us-gaap:CommercialRealEstatePortfolioSegmentMember2019-12-310000705432us-gaap:CommercialLoanMember2020-12-310000705432us-gaap:CommercialLoanMember2019-12-310000705432sbsi:MunicipalLoansMember2020-12-310000705432sbsi:MunicipalLoansMember2019-12-310000705432us-gaap:ConsumerLoanMember2020-12-310000705432us-gaap:ConsumerLoanMember2019-12-31utr:Rate0000705432sbsi:PaycheckProtectionProgramMember2020-12-310000705432us-gaap:ResidentialRealEstateMembersrt:MinimumMember2020-01-012020-12-310000705432srt:MaximumMemberus-gaap:ResidentialRealEstateMember2020-01-012020-12-310000705432us-gaap:CommercialRealEstatePortfolioSegmentMember2020-01-012020-12-310000705432us-gaap:PassMemberus-gaap:ConstructionLoansMember2020-12-310000705432us-gaap:ConstructionLoansMembersbsi:PassWatchMember2020-12-310000705432us-gaap:ConstructionLoansMemberus-gaap:SpecialMentionMember2020-12-310000705432us-gaap:ConstructionLoansMemberus-gaap:SubstandardMember2020-12-310000705432us-gaap:ConstructionLoansMemberus-gaap:DoubtfulMember2020-12-310000705432us-gaap:PassMemberus-gaap:ResidentialRealEstateMember2020-12-310000705432us-gaap:ResidentialRealEstateMembersbsi:PassWatchMember2020-12-310000705432us-gaap:ResidentialRealEstateMemberus-gaap:SpecialMentionMember2020-12-310000705432us-gaap:ResidentialRealEstateMemberus-gaap:SubstandardMember2020-12-310000705432us-gaap:DoubtfulMemberus-gaap:ResidentialRealEstateMember2020-12-310000705432us-gaap:PassMemberus-gaap:CommercialRealEstatePortfolioSegmentMember2020-12-310000705432us-gaap:CommercialRealEstatePortfolioSegmentMembersbsi:PassWatchMember2020-12-310000705432us-gaap:CommercialRealEstatePortfolioSegmentMemberus-gaap:SpecialMentionMember2020-12-310000705432us-gaap:CommercialRealEstatePortfolioSegmentMemberus-gaap:SubstandardMember2020-12-310000705432us-gaap:DoubtfulMemberus-gaap:CommercialRealEstatePortfolioSegmentMember2020-12-310000705432us-gaap:PassMemberus-gaap:CommercialLoanMember2020-12-310000705432us-gaap:CommercialLoanMembersbsi:PassWatchMember2020-12-310000705432us-gaap:CommercialLoanMemberus-gaap:SpecialMentionMember2020-12-310000705432us-gaap:CommercialLoanMemberus-gaap:SubstandardMember2020-12-310000705432us-gaap:DoubtfulMemberus-gaap:CommercialLoanMember2020-12-310000705432us-gaap:PassMembersbsi:MunicipalLoansMember2020-12-310000705432sbsi:MunicipalLoansMembersbsi:PassWatchMember2020-12-310000705432us-gaap:SpecialMentionMembersbsi:MunicipalLoansMember2020-12-310000705432sbsi:MunicipalLoansMemberus-gaap:SubstandardMember2020-12-310000705432us-gaap:DoubtfulMembersbsi:MunicipalLoansMember2020-12-310000705432us-gaap:PassMemberus-gaap:ConsumerLoanMember2020-12-310000705432sbsi:PassWatchMemberus-gaap:ConsumerLoanMember2020-12-310000705432us-gaap:SpecialMentionMemberus-gaap:ConsumerLoanMember2020-12-310000705432us-gaap:SubstandardMemberus-gaap:ConsumerLoanMember2020-12-310000705432us-gaap:DoubtfulMemberus-gaap:ConsumerLoanMember2020-12-310000705432us-gaap:ConstructionLoansMemberus-gaap:FinancingReceivables30To59DaysPastDueMember2020-12-310000705432us-gaap:ConstructionLoansMemberus-gaap:FinancingReceivables60To89DaysPastDueMember2020-12-310000705432us-gaap:ConstructionLoansMemberus-gaap:FinancingReceivablesEqualToGreaterThan90DaysPastDueMember2020-12-310000705432us-gaap:ResidentialRealEstateMemberus-gaap:FinancingReceivables30To59DaysPastDueMember2020-12-310000705432us-gaap:ResidentialRealEstateMemberus-gaap:FinancingReceivables60To89DaysPastDueMember2020-12-310000705432us-gaap:ResidentialRealEstateMemberus-gaap:FinancingReceivablesEqualToGreaterThan90DaysPastDueMember2020-12-310000705432us-gaap:CommercialRealEstatePortfolioSegmentMemberus-gaap:FinancingReceivables30To59DaysPastDueMember2020-12-310000705432us-gaap:CommercialRealEstatePortfolioSegmentMemberus-gaap:FinancingReceivables60To89DaysPastDueMember2020-12-310000705432us-gaap:CommercialRealEstatePortfolioSegmentMemberus-gaap:FinancingReceivablesEqualToGreaterThan90DaysPastDueMember2020-12-310000705432us-gaap:CommercialLoanMemberus-gaap:FinancingReceivables30To59DaysPastDueMember2020-12-310000705432us-gaap:CommercialLoanMemberus-gaap:FinancingReceivables60To89DaysPastDueMember2020-12-310000705432us-gaap:CommercialLoanMemberus-gaap:FinancingReceivablesEqualToGreaterThan90DaysPastDueMember2020-12-310000705432sbsi:MunicipalLoansMemberus-gaap:FinancingReceivables30To59DaysPastDueMember2020-12-310000705432sbsi:MunicipalLoansMemberus-gaap:FinancingReceivables60To89DaysPastDueMember2020-12-310000705432sbsi:MunicipalLoansMemberus-gaap:FinancingReceivablesEqualToGreaterThan90DaysPastDueMember2020-12-310000705432us-gaap:FinancingReceivables30To59DaysPastDueMemberus-gaap:ConsumerLoanMember2020-12-310000705432us-gaap:FinancingReceivables60To89DaysPastDueMemberus-gaap:ConsumerLoanMember2020-12-310000705432us-gaap:FinancingReceivablesEqualToGreaterThan90DaysPastDueMemberus-gaap:ConsumerLoanMember2020-12-310000705432us-gaap:FinancingReceivables30To59DaysPastDueMember2020-12-310000705432us-gaap:FinancingReceivables60To89DaysPastDueMember2020-12-310000705432us-gaap:FinancingReceivablesEqualToGreaterThan90DaysPastDueMember2020-12-310000705432us-gaap:ConstructionLoansMemberus-gaap:FinancingReceivables30To59DaysPastDueMember2019-12-310000705432us-gaap:ConstructionLoansMemberus-gaap:FinancingReceivables60To89DaysPastDueMember2019-12-310000705432us-gaap:ConstructionLoansMemberus-gaap:FinancingReceivablesEqualToGreaterThan90DaysPastDueMember2019-12-310000705432us-gaap:ResidentialRealEstateMemberus-gaap:FinancingReceivables30To59DaysPastDueMember2019-12-310000705432us-gaap:ResidentialRealEstateMemberus-gaap:FinancingReceivables60To89DaysPastDueMember2019-12-310000705432us-gaap:ResidentialRealEstateMemberus-gaap:FinancingReceivablesEqualToGreaterThan90DaysPastDueMember2019-12-310000705432us-gaap:CommercialRealEstatePortfolioSegmentMemberus-gaap:FinancingReceivables30To59DaysPastDueMember2019-12-310000705432us-gaap:CommercialRealEstatePortfolioSegmentMemberus-gaap:FinancingReceivables60To89DaysPastDueMember2019-12-310000705432us-gaap:CommercialRealEstatePortfolioSegmentMemberus-gaap:FinancingReceivablesEqualToGreaterThan90DaysPastDueMember2019-12-310000705432us-gaap:CommercialLoanMemberus-gaap:FinancingReceivables30To59DaysPastDueMember2019-12-310000705432us-gaap:CommercialLoanMemberus-gaap:FinancingReceivables60To89DaysPastDueMember2019-12-310000705432us-gaap:CommercialLoanMemberus-gaap:FinancingReceivablesEqualToGreaterThan90DaysPastDueMember2019-12-310000705432sbsi:MunicipalLoansMemberus-gaap:FinancingReceivables30To59DaysPastDueMember2019-12-310000705432sbsi:MunicipalLoansMemberus-gaap:FinancingReceivables60To89DaysPastDueMember2019-12-310000705432sbsi:MunicipalLoansMemberus-gaap:FinancingReceivablesEqualToGreaterThan90DaysPastDueMember2019-12-310000705432us-gaap:FinancingReceivables30To59DaysPastDueMemberus-gaap:ConsumerLoanMember2019-12-310000705432us-gaap:FinancingReceivables60To89DaysPastDueMemberus-gaap:ConsumerLoanMember2019-12-310000705432us-gaap:FinancingReceivablesEqualToGreaterThan90DaysPastDueMemberus-gaap:ConsumerLoanMember2019-12-310000705432us-gaap:FinancingReceivables30To59DaysPastDueMember2019-12-310000705432us-gaap:FinancingReceivables60To89DaysPastDueMember2019-12-310000705432us-gaap:FinancingReceivablesEqualToGreaterThan90DaysPastDueMember2019-12-310000705432us-gaap:ConstructionLoansMemberus-gaap:NonperformingFinancingReceivableMember2020-12-310000705432us-gaap:ConstructionLoansMemberus-gaap:NonperformingFinancingReceivableMember2019-12-310000705432us-gaap:NonperformingFinancingReceivableMemberus-gaap:ResidentialRealEstateMember2020-12-310000705432us-gaap:NonperformingFinancingReceivableMemberus-gaap:ResidentialRealEstateMember2019-12-310000705432us-gaap:CommercialRealEstatePortfolioSegmentMemberus-gaap:NonperformingFinancingReceivableMember2020-12-310000705432us-gaap:CommercialRealEstatePortfolioSegmentMemberus-gaap:NonperformingFinancingReceivableMember2019-12-310000705432us-gaap:CommercialLoanMemberus-gaap:NonperformingFinancingReceivableMember2020-12-310000705432us-gaap:CommercialLoanMemberus-gaap:NonperformingFinancingReceivableMember2019-12-310000705432us-gaap:NonperformingFinancingReceivableMemberus-gaap:ConsumerLoanMember2020-12-310000705432us-gaap:NonperformingFinancingReceivableMemberus-gaap:ConsumerLoanMember2019-12-310000705432us-gaap:NonperformingFinancingReceivableMember2020-12-310000705432us-gaap:NonperformingFinancingReceivableMember2019-12-310000705432sbsi:COVID19PaymentDeferralMember2020-12-310000705432us-gaap:ExtendedMaturityMemberus-gaap:CommercialRealEstatePortfolioSegmentMember2020-01-012020-12-310000705432us-gaap:CommercialRealEstatePortfolioSegmentMemberus-gaap:ContractualInterestRateReductionMember2020-01-012020-12-310000705432us-gaap:CommercialRealEstatePortfolioSegmentMembersbsi:CombinationofConcessionsGrantedinLoanRestructuringModificationMember2020-01-012020-12-31sbsi:contract0000705432us-gaap:ExtendedMaturityMemberus-gaap:CommercialLoanMember2020-01-012020-12-310000705432us-gaap:CommercialLoanMemberus-gaap:ContractualInterestRateReductionMember2020-01-012020-12-310000705432us-gaap:CommercialLoanMembersbsi:CombinationofConcessionsGrantedinLoanRestructuringModificationMember2020-01-012020-12-310000705432us-gaap:CommercialLoanMember2020-01-012020-12-310000705432us-gaap:ExtendedMaturityMemberus-gaap:ConsumerLoanMember2020-01-012020-12-310000705432us-gaap:ContractualInterestRateReductionMemberus-gaap:ConsumerLoanMember2020-01-012020-12-310000705432sbsi:CombinationofConcessionsGrantedinLoanRestructuringModificationMemberus-gaap:ConsumerLoanMember2020-01-012020-12-310000705432us-gaap:ConsumerLoanMember2020-01-012020-12-310000705432us-gaap:ExtendedMaturityMember2020-01-012020-12-310000705432us-gaap:ContractualInterestRateReductionMember2020-01-012020-12-310000705432sbsi:CombinationofConcessionsGrantedinLoanRestructuringModificationMember2020-01-012020-12-310000705432us-gaap:ExtendedMaturityMemberus-gaap:ResidentialRealEstateMember2019-01-012019-12-310000705432us-gaap:ResidentialRealEstateMemberus-gaap:ContractualInterestRateReductionMember2019-01-012019-12-310000705432us-gaap:ResidentialRealEstateMembersbsi:CombinationofConcessionsGrantedinLoanRestructuringModificationMember2019-01-012019-12-310000705432us-gaap:ResidentialRealEstateMember2019-01-012019-12-310000705432us-gaap:ExtendedMaturityMemberus-gaap:CommercialRealEstatePortfolioSegmentMember2019-01-012019-12-310000705432us-gaap:CommercialRealEstatePortfolioSegmentMemberus-gaap:ContractualInterestRateReductionMember2019-01-012019-12-310000705432us-gaap:CommercialRealEstatePortfolioSegmentMembersbsi:CombinationofConcessionsGrantedinLoanRestructuringModificationMember2019-01-012019-12-310000705432us-gaap:CommercialRealEstatePortfolioSegmentMember2019-01-012019-12-310000705432us-gaap:ExtendedMaturityMemberus-gaap:CommercialLoanMember2019-01-012019-12-310000705432us-gaap:CommercialLoanMemberus-gaap:ContractualInterestRateReductionMember2019-01-012019-12-310000705432us-gaap:CommercialLoanMembersbsi:CombinationofConcessionsGrantedinLoanRestructuringModificationMember2019-01-012019-12-310000705432us-gaap:CommercialLoanMember2019-01-012019-12-310000705432us-gaap:ExtendedMaturityMemberus-gaap:ConsumerLoanMember2019-01-012019-12-310000705432us-gaap:ContractualInterestRateReductionMemberus-gaap:ConsumerLoanMember2019-01-012019-12-310000705432sbsi:CombinationofConcessionsGrantedinLoanRestructuringModificationMemberus-gaap:ConsumerLoanMember2019-01-012019-12-310000705432us-gaap:ConsumerLoanMember2019-01-012019-12-310000705432us-gaap:ExtendedMaturityMember2019-01-012019-12-310000705432us-gaap:ContractualInterestRateReductionMember2019-01-012019-12-310000705432sbsi:CombinationofConcessionsGrantedinLoanRestructuringModificationMember2019-01-012019-12-310000705432us-gaap:ExtendedMaturityMemberus-gaap:ResidentialRealEstateMember2018-01-012018-12-310000705432us-gaap:ResidentialRealEstateMemberus-gaap:ContractualInterestRateReductionMember2018-01-012018-12-310000705432us-gaap:ResidentialRealEstateMembersbsi:CombinationofConcessionsGrantedinLoanRestructuringModificationMember2018-01-012018-12-310000705432us-gaap:ResidentialRealEstateMember2018-01-012018-12-310000705432us-gaap:ExtendedMaturityMemberus-gaap:CommercialRealEstatePortfolioSegmentMember2018-01-012018-12-310000705432us-gaap:CommercialRealEstatePortfolioSegmentMemberus-gaap:ContractualInterestRateReductionMember2018-01-012018-12-310000705432us-gaap:CommercialRealEstatePortfolioSegmentMembersbsi:CombinationofConcessionsGrantedinLoanRestructuringModificationMember2018-01-012018-12-310000705432us-gaap:CommercialRealEstatePortfolioSegmentMember2018-01-012018-12-310000705432us-gaap:ExtendedMaturityMemberus-gaap:CommercialLoanMember2018-01-012018-12-310000705432us-gaap:CommercialLoanMemberus-gaap:ContractualInterestRateReductionMember2018-01-012018-12-310000705432us-gaap:CommercialLoanMembersbsi:CombinationofConcessionsGrantedinLoanRestructuringModificationMember2018-01-012018-12-310000705432us-gaap:CommercialLoanMember2018-01-012018-12-310000705432us-gaap:ExtendedMaturityMemberus-gaap:ConsumerLoanMember2018-01-012018-12-310000705432us-gaap:ContractualInterestRateReductionMemberus-gaap:ConsumerLoanMember2018-01-012018-12-310000705432sbsi:CombinationofConcessionsGrantedinLoanRestructuringModificationMemberus-gaap:ConsumerLoanMember2018-01-012018-12-310000705432us-gaap:ConsumerLoanMember2018-01-012018-12-310000705432us-gaap:ExtendedMaturityMember2018-01-012018-12-310000705432us-gaap:ContractualInterestRateReductionMember2018-01-012018-12-310000705432sbsi:CombinationofConcessionsGrantedinLoanRestructuringModificationMember2018-01-012018-12-310000705432us-gaap:ConstructionLoansMembersrt:CumulativeEffectPeriodOfAdoptionAdjustmentMember2020-01-012020-01-010000705432us-gaap:ResidentialRealEstateMembersrt:CumulativeEffectPeriodOfAdoptionAdjustmentMember2020-01-012020-01-010000705432us-gaap:CommercialRealEstatePortfolioSegmentMembersrt:CumulativeEffectPeriodOfAdoptionAdjustmentMember2020-01-012020-01-010000705432us-gaap:CommercialLoanMembersrt:CumulativeEffectPeriodOfAdoptionAdjustmentMember2020-01-012020-01-010000705432sbsi:MunicipalLoansMembersrt:CumulativeEffectPeriodOfAdoptionAdjustmentMember2020-01-012020-01-010000705432srt:CumulativeEffectPeriodOfAdoptionAdjustmentMemberus-gaap:ConsumerLoanMember2020-01-012020-01-010000705432srt:CumulativeEffectPeriodOfAdoptionAdjustmentMember2020-01-012020-01-010000705432us-gaap:ConstructionLoansMember2020-01-012020-12-310000705432us-gaap:ResidentialRealEstateMember2020-01-012020-12-310000705432sbsi:MunicipalLoansMember2020-01-012020-12-310000705432us-gaap:ConstructionLoansMember2018-12-310000705432us-gaap:ResidentialRealEstateMember2018-12-310000705432us-gaap:CommercialRealEstatePortfolioSegmentMember2018-12-310000705432us-gaap:CommercialLoanMember2018-12-310000705432sbsi:MunicipalLoansMember2018-12-310000705432us-gaap:ConsumerLoanMember2018-12-310000705432us-gaap:ConstructionLoansMember2019-01-012019-12-310000705432sbsi:MunicipalLoansMember2019-01-012019-12-310000705432us-gaap:ConstructionLoansMember2017-12-310000705432us-gaap:ResidentialRealEstateMember2017-12-310000705432us-gaap:CommercialRealEstatePortfolioSegmentMember2017-12-310000705432us-gaap:CommercialLoanMember2017-12-310000705432sbsi:MunicipalLoansMember2017-12-310000705432us-gaap:ConsumerLoanMember2017-12-310000705432us-gaap:ConstructionLoansMember2018-01-012018-12-310000705432sbsi:MunicipalLoansMember2018-01-012018-12-310000705432us-gaap:LoansReceivableMember2020-12-310000705432us-gaap:LoansReceivableMember2019-12-310000705432sbsi:PrivateAccountsMember2020-12-310000705432sbsi:PrivateAccountsMember2019-12-310000705432sbsi:PublicAccountsMember2020-12-310000705432sbsi:PublicAccountsMember2019-12-310000705432us-gaap:CertificatesOfDepositMember2020-12-310000705432us-gaap:CertificatesOfDepositMember2020-01-012020-12-310000705432us-gaap:CertificatesOfDepositMember2019-12-310000705432us-gaap:FederalFundsPurchasedAndSecuritiesSoldUnderAgreementsToRepurchaseMember2020-12-310000705432us-gaap:FederalFundsPurchasedAndSecuritiesSoldUnderAgreementsToRepurchaseMember2019-12-310000705432us-gaap:FederalFundsPurchasedAndSecuritiesSoldUnderAgreementsToRepurchaseMember2020-01-012020-12-310000705432us-gaap:FederalFundsPurchasedAndSecuritiesSoldUnderAgreementsToRepurchaseMember2019-01-012019-12-310000705432us-gaap:FederalHomeLoanBankAdvancesMember2020-12-310000705432us-gaap:FederalHomeLoanBankAdvancesMember2019-12-310000705432us-gaap:FederalHomeLoanBankAdvancesMember2020-01-012020-12-310000705432us-gaap:FederalHomeLoanBankAdvancesMember2019-01-012019-12-31sbsi:credit_line0000705432sbsi:FrostBankMember2020-12-310000705432sbsi:TibIndependentBankersBankMember2020-12-310000705432sbsi:ComericaBankMember2020-12-310000705432sbsi:FederalReserveDiscountWindowMember2020-12-310000705432sbsi:FederalReserveDiscountWindowMember2020-12-31xbrli:pure0000705432srt:MinimumMember2020-12-310000705432srt:MaximumMember2020-12-310000705432srt:MinimumMember2020-01-012020-12-310000705432srt:MaximumMember2020-01-012020-12-310000705432sbsi:VariableRateAgreementsMember2020-12-310000705432sbsi:VariableRateAgreementsMember2019-12-31sbsi:agreement0000705432sbsi:VariableRateAgreementsandFixedShorttermPayAgreementsMembersrt:MaximumMembersbsi:ThreeMonthLondonInterbankOfferedRateLIBORMember2020-12-310000705432sbsi:VariableRateAgreementsandFixedShorttermPayAgreementsMembersbsi:ThreeMonthLondonInterbankOfferedRateLIBORMember2020-01-012020-12-310000705432sbsi:VariableRateAgreementsandFixedShorttermPayAgreementsMembersbsi:OneMonthLondonInterbankOfferedRateLIBORMember2020-01-012020-12-310000705432us-gaap:CashFlowHedgingMembersbsi:VariableRateAgreementsandFixedShorttermPayAgreementsMember2020-01-012020-12-310000705432sbsi:A3875SubordinatedNotesDue2030Member2020-12-310000705432sbsi:A3875SubordinatedNotesDue2030Member2019-12-310000705432sbsi:A5.50SubordinatedNotesDue2026Member2020-12-310000705432sbsi:A5.50SubordinatedNotesDue2026Member2019-12-310000705432sbsi:SouthsideStatutoryTrustIIInetofunamortizeddebtissuancecostsMember2020-12-310000705432sbsi:SouthsideStatutoryTrustIIInetofunamortizeddebtissuancecostsMember2019-12-310000705432sbsi:SouthsideStatutoryTrustIvMember2020-12-310000705432sbsi:SouthsideStatutoryTrustIvMember2019-12-310000705432sbsi:SouthsideStatutoryTrustVMember2020-12-310000705432sbsi:SouthsideStatutoryTrustVMember2019-12-310000705432sbsi:MagnoliaTrustCompanyIMember2020-12-310000705432sbsi:MagnoliaTrustCompanyIMember2019-12-310000705432sbsi:A5.50SubordinatedNotesDue2026Membersrt:MinimumMember2020-01-012020-12-310000705432sbsi:A3875SubordinatedNotesDue2030Member2020-11-062020-11-060000705432sbsi:A5.50SubordinatedNotesDue2026Member2016-09-192016-09-190000705432sbsi:SouthsideStatutoryTrustIIInetofunamortizeddebtissuancecostsMember2003-09-040000705432sbsi:ThreeMonthLondonInterbankOfferedRateLIBORMembersbsi:SouthsideStatutoryTrustIIInetofunamortizeddebtissuancecostsMember2003-09-042003-09-040000705432sbsi:SouthsideStatutoryTrustIvMember2007-08-080000705432sbsi:ThreeMonthLondonInterbankOfferedRateLIBORMembersbsi:SouthsideStatutoryTrustIvMember2007-08-082007-08-080000705432sbsi:SouthsideStatutoryTrustVMember2007-08-100000705432sbsi:ThreeMonthLondonInterbankOfferedRateLIBORMembersbsi:SouthsideStatutoryTrustVMember2007-08-102007-08-100000705432sbsi:MagnoliaTrustCompanyIMember2007-10-100000705432sbsi:ThreeMonthLondonInterbankOfferedRateLIBORMembersbsi:MagnoliaTrustCompanyIMember2007-10-102007-10-100000705432sbsi:A5.50SubordinatedNotesDue2026Membersbsi:ThreeMonthLondonInterbankOfferedRateLIBORMembersrt:ScenarioForecastMember2021-09-302021-09-300000705432srt:ScenarioForecastMembersbsi:A3875SubordinatedNotesDue2030Memberus-gaap:SecuredOvernightFinancingRateSofrOvernightIndexSwapRateMember2025-11-142025-11-14sbsi:executive_officer0000705432srt:ExecutiveOfficerMember2020-12-310000705432srt:ExecutiveOfficerMember2020-01-012020-12-310000705432srt:ExecutiveOfficerMember2019-01-012019-12-310000705432srt:ExecutiveOfficerMember2018-01-012018-12-310000705432srt:ExecutiveOfficerMember2019-12-310000705432srt:MinimumMembersrt:ExecutiveOfficerMember2020-01-012020-12-310000705432srt:MaximumMembersrt:ExecutiveOfficerMember2020-01-012020-12-310000705432srt:ExecutiveOfficerMember2013-01-012013-12-310000705432us-gaap:PensionPlansDefinedBenefitMember2020-01-012020-12-3100007054322020-01-012020-06-300000705432us-gaap:OtherPensionPlansPostretirementOrSupplementalPlansDefinedBenefitMember2020-06-290000705432us-gaap:PensionPlansDefinedBenefitMember2020-06-290000705432us-gaap:OtherPensionPlansPostretirementOrSupplementalPlansDefinedBenefitMember2020-06-300000705432us-gaap:PensionPlansDefinedBenefitMember2020-06-300000705432us-gaap:PensionPlansDefinedBenefitMember2020-12-310000705432us-gaap:PensionPlansDefinedBenefitMember2019-12-310000705432us-gaap:OtherPensionPlansDefinedBenefitMember2020-12-310000705432us-gaap:OtherPensionPlansDefinedBenefitMember2019-12-310000705432us-gaap:OtherPensionPlansPostretirementOrSupplementalPlansDefinedBenefitMember2019-12-310000705432us-gaap:PensionPlansDefinedBenefitMember2018-12-310000705432us-gaap:OtherPensionPlansDefinedBenefitMember2018-12-310000705432us-gaap:OtherPensionPlansPostretirementOrSupplementalPlansDefinedBenefitMember2018-12-310000705432us-gaap:PensionPlansDefinedBenefitMember2017-12-310000705432us-gaap:OtherPensionPlansDefinedBenefitMember2017-12-310000705432us-gaap:OtherPensionPlansPostretirementOrSupplementalPlansDefinedBenefitMember2017-12-310000705432us-gaap:OtherPensionPlansDefinedBenefitMember2020-01-012020-12-310000705432us-gaap:OtherPensionPlansPostretirementOrSupplementalPlansDefinedBenefitMember2020-01-012020-12-310000705432us-gaap:PensionPlansDefinedBenefitMember2019-01-012019-12-310000705432us-gaap:OtherPensionPlansDefinedBenefitMember2019-01-012019-12-310000705432us-gaap:OtherPensionPlansPostretirementOrSupplementalPlansDefinedBenefitMember2019-01-012019-12-310000705432us-gaap:PensionPlansDefinedBenefitMember2018-01-012018-12-310000705432us-gaap:OtherPensionPlansDefinedBenefitMember2018-01-012018-12-310000705432us-gaap:OtherPensionPlansPostretirementOrSupplementalPlansDefinedBenefitMember2018-01-012018-12-310000705432us-gaap:OtherPensionPlansPostretirementOrSupplementalPlansDefinedBenefitMember2020-12-310000705432us-gaap:PensionPlansDefinedBenefitMember2020-01-012020-03-310000705432us-gaap:OtherPensionPlansDefinedBenefitMember2020-01-012020-03-310000705432us-gaap:PensionPlansDefinedBenefitMember2020-04-012020-06-300000705432us-gaap:OtherPensionPlansDefinedBenefitMember2020-04-012020-06-300000705432us-gaap:PensionPlansDefinedBenefitMemberus-gaap:FairValueInputsLevel1Memberus-gaap:CashMember2020-12-310000705432us-gaap:OtherPensionPlansDefinedBenefitMemberus-gaap:FairValueInputsLevel1Memberus-gaap:CashMember2020-12-310000705432us-gaap:PensionPlansDefinedBenefitMemberus-gaap:FairValueInputsLevel1Memberus-gaap:CashMember2019-12-310000705432us-gaap:OtherPensionPlansDefinedBenefitMemberus-gaap:FairValueInputsLevel1Memberus-gaap:CashMember2019-12-310000705432us-gaap:PensionPlansDefinedBenefitMembersbsi:UnitedStatesLargeCapEquitiesMemberus-gaap:FairValueInputsLevel1Member2020-12-310000705432us-gaap:OtherPensionPlansDefinedBenefitMembersbsi:UnitedStatesLargeCapEquitiesMemberus-gaap:FairValueInputsLevel1Member2020-12-310000705432us-gaap:PensionPlansDefinedBenefitMembersbsi:UnitedStatesLargeCapEquitiesMemberus-gaap:FairValueInputsLevel1Member2019-12-310000705432us-gaap:OtherPensionPlansDefinedBenefitMembersbsi:UnitedStatesLargeCapEquitiesMemberus-gaap:FairValueInputsLevel1Member2019-12-310000705432sbsi:UnitedStatesMidCapEquitiesMemberus-gaap:PensionPlansDefinedBenefitMemberus-gaap:FairValueInputsLevel1Member2020-12-310000705432sbsi:UnitedStatesMidCapEquitiesMemberus-gaap:OtherPensionPlansDefinedBenefitMemberus-gaap:FairValueInputsLevel1Member2020-12-310000705432sbsi:UnitedStatesMidCapEquitiesMemberus-gaap:PensionPlansDefinedBenefitMemberus-gaap:FairValueInputsLevel1Member2019-12-310000705432sbsi:UnitedStatesMidCapEquitiesMemberus-gaap:OtherPensionPlansDefinedBenefitMemberus-gaap:FairValueInputsLevel1Member2019-12-310000705432sbsi:UnitedStatesSmallCapEquitiesMemberus-gaap:PensionPlansDefinedBenefitMemberus-gaap:FairValueInputsLevel1Member2020-12-310000705432us-gaap:OtherPensionPlansDefinedBenefitMembersbsi:UnitedStatesSmallCapEquitiesMemberus-gaap:FairValueInputsLevel1Member2020-12-310000705432sbsi:UnitedStatesSmallCapEquitiesMemberus-gaap:PensionPlansDefinedBenefitMemberus-gaap:FairValueInputsLevel1Member2019-12-310000705432us-gaap:OtherPensionPlansDefinedBenefitMembersbsi:UnitedStatesSmallCapEquitiesMemberus-gaap:FairValueInputsLevel1Member2019-12-310000705432us-gaap:PensionPlansDefinedBenefitMembersbsi:InternationalDevelopedEquitiesMemberus-gaap:FairValueInputsLevel1Member2020-12-310000705432us-gaap:OtherPensionPlansDefinedBenefitMembersbsi:InternationalDevelopedEquitiesMemberus-gaap:FairValueInputsLevel1Member2020-12-310000705432us-gaap:PensionPlansDefinedBenefitMembersbsi:InternationalDevelopedEquitiesMemberus-gaap:FairValueInputsLevel1Member2019-12-310000705432us-gaap:OtherPensionPlansDefinedBenefitMembersbsi:InternationalDevelopedEquitiesMemberus-gaap:FairValueInputsLevel1Member2019-12-310000705432sbsi:InternationalEmergingEquitiesMemberus-gaap:PensionPlansDefinedBenefitMemberus-gaap:FairValueInputsLevel1Member2020-12-310000705432sbsi:InternationalEmergingEquitiesMemberus-gaap:OtherPensionPlansDefinedBenefitMemberus-gaap:FairValueInputsLevel1Member2020-12-310000705432sbsi:InternationalEmergingEquitiesMemberus-gaap:PensionPlansDefinedBenefitMemberus-gaap:FairValueInputsLevel1Member2019-12-310000705432sbsi:InternationalEmergingEquitiesMemberus-gaap:OtherPensionPlansDefinedBenefitMemberus-gaap:FairValueInputsLevel1Member2019-12-310000705432us-gaap:PensionPlansDefinedBenefitMembersbsi:InternationalMemberus-gaap:FairValueInputsLevel1Member2020-12-310000705432us-gaap:OtherPensionPlansDefinedBenefitMembersbsi:InternationalMemberus-gaap:FairValueInputsLevel1Member2020-12-310000705432us-gaap:PensionPlansDefinedBenefitMembersbsi:InternationalMemberus-gaap:FairValueInputsLevel1Member2019-12-310000705432us-gaap:OtherPensionPlansDefinedBenefitMembersbsi:InternationalMemberus-gaap:FairValueInputsLevel1Member2019-12-310000705432us-gaap:PensionPlansDefinedBenefitMemberus-gaap:FairValueInputsLevel1Memberus-gaap:CorporateBondSecuritiesMember2020-12-310000705432us-gaap:OtherPensionPlansDefinedBenefitMemberus-gaap:FairValueInputsLevel1Memberus-gaap:CorporateBondSecuritiesMember2020-12-310000705432us-gaap:PensionPlansDefinedBenefitMemberus-gaap:FairValueInputsLevel1Memberus-gaap:CorporateBondSecuritiesMember2019-12-310000705432us-gaap:OtherPensionPlansDefinedBenefitMemberus-gaap:FairValueInputsLevel1Memberus-gaap:CorporateBondSecuritiesMember2019-12-310000705432us-gaap:PensionPlansDefinedBenefitMemberus-gaap:RealEstateFundsMemberus-gaap:FairValueInputsLevel1Member2020-12-310000705432us-gaap:OtherPensionPlansDefinedBenefitMemberus-gaap:RealEstateFundsMemberus-gaap:FairValueInputsLevel1Member2020-12-310000705432us-gaap:PensionPlansDefinedBenefitMemberus-gaap:RealEstateFundsMemberus-gaap:FairValueInputsLevel1Member2019-12-310000705432us-gaap:OtherPensionPlansDefinedBenefitMemberus-gaap:RealEstateFundsMemberus-gaap:FairValueInputsLevel1Member2019-12-310000705432sbsi:BalancedAssetAllocationMemberus-gaap:PensionPlansDefinedBenefitMemberus-gaap:FairValueInputsLevel1Member2020-12-310000705432sbsi:BalancedAssetAllocationMemberus-gaap:OtherPensionPlansDefinedBenefitMemberus-gaap:FairValueInputsLevel1Member2020-12-310000705432sbsi:BalancedAssetAllocationMemberus-gaap:PensionPlansDefinedBenefitMemberus-gaap:FairValueInputsLevel1Member2019-12-310000705432sbsi:BalancedAssetAllocationMemberus-gaap:OtherPensionPlansDefinedBenefitMemberus-gaap:FairValueInputsLevel1Member2019-12-310000705432us-gaap:CashEquivalentsMemberus-gaap:PensionPlansDefinedBenefitMemberus-gaap:FairValueInputsLevel2Member2020-12-310000705432us-gaap:OtherPensionPlansDefinedBenefitMemberus-gaap:CashEquivalentsMemberus-gaap:FairValueInputsLevel2Member2020-12-310000705432us-gaap:CashEquivalentsMemberus-gaap:PensionPlansDefinedBenefitMemberus-gaap:FairValueInputsLevel2Member2019-12-310000705432us-gaap:OtherPensionPlansDefinedBenefitMemberus-gaap:CashEquivalentsMemberus-gaap:FairValueInputsLevel2Member2019-12-310000705432us-gaap:PensionPlansDefinedBenefitMemberus-gaap:FairValueInputsLevel2Memberus-gaap:CorporateBondSecuritiesMember2020-12-310000705432us-gaap:OtherPensionPlansDefinedBenefitMemberus-gaap:FairValueInputsLevel2Memberus-gaap:CorporateBondSecuritiesMember2020-12-310000705432us-gaap:PensionPlansDefinedBenefitMemberus-gaap:FairValueInputsLevel2Memberus-gaap:CorporateBondSecuritiesMember2019-12-310000705432us-gaap:OtherPensionPlansDefinedBenefitMemberus-gaap:FairValueInputsLevel2Memberus-gaap:CorporateBondSecuritiesMember2019-12-310000705432us-gaap:USGovernmentAgenciesDebtSecuritiesMemberus-gaap:PensionPlansDefinedBenefitMemberus-gaap:FairValueInputsLevel2Member2020-12-310000705432us-gaap:OtherPensionPlansDefinedBenefitMemberus-gaap:USGovernmentAgenciesDebtSecuritiesMemberus-gaap:FairValueInputsLevel2Member2020-12-310000705432us-gaap:USGovernmentAgenciesDebtSecuritiesMemberus-gaap:PensionPlansDefinedBenefitMemberus-gaap:FairValueInputsLevel2Member2019-12-310000705432us-gaap:OtherPensionPlansDefinedBenefitMemberus-gaap:USGovernmentAgenciesDebtSecuritiesMemberus-gaap:FairValueInputsLevel2Member2019-12-310000705432us-gaap:PensionPlansDefinedBenefitMemberus-gaap:FairValueInputsLevel2Memberus-gaap:MunicipalBondsMember2020-12-310000705432us-gaap:OtherPensionPlansDefinedBenefitMemberus-gaap:FairValueInputsLevel2Memberus-gaap:MunicipalBondsMember2020-12-310000705432us-gaap:PensionPlansDefinedBenefitMemberus-gaap:FairValueInputsLevel2Memberus-gaap:MunicipalBondsMember2019-12-310000705432us-gaap:OtherPensionPlansDefinedBenefitMemberus-gaap:FairValueInputsLevel2Memberus-gaap:MunicipalBondsMember2019-12-310000705432us-gaap:PensionPlansDefinedBenefitMemberus-gaap:FairValueInputsLevel2Memberus-gaap:MortgageBackedSecuritiesIssuedByUSGovernmentSponsoredEnterprisesMember2020-12-310000705432us-gaap:OtherPensionPlansDefinedBenefitMemberus-gaap:FairValueInputsLevel2Memberus-gaap:MortgageBackedSecuritiesIssuedByUSGovernmentSponsoredEnterprisesMember2020-12-310000705432us-gaap:PensionPlansDefinedBenefitMemberus-gaap:FairValueInputsLevel2Memberus-gaap:MortgageBackedSecuritiesIssuedByUSGovernmentSponsoredEnterprisesMember2019-12-310000705432us-gaap:OtherPensionPlansDefinedBenefitMemberus-gaap:FairValueInputsLevel2Memberus-gaap:MortgageBackedSecuritiesIssuedByUSGovernmentSponsoredEnterprisesMember2019-12-310000705432us-gaap:PensionPlansDefinedBenefitMemberus-gaap:EquitySecuritiesMember2020-12-310000705432us-gaap:PensionPlansDefinedBenefitMemberus-gaap:FixedIncomeSecuritiesMember2020-12-310000705432us-gaap:CashEquivalentsMemberus-gaap:PensionPlansDefinedBenefitMember2020-12-310000705432sbsi:IncentivePlan2017Member2020-12-310000705432sbsi:IncentivePlan2009Member2020-12-310000705432sbsi:IncentivePlanMember2020-12-310000705432sbsi:IncentivePlanMember2019-12-310000705432sbsi:IncentivePlanMember2018-12-310000705432sbsi:IncentivePlanMember2020-01-012020-12-310000705432sbsi:IncentivePlanMember2019-01-012019-12-310000705432sbsi:IncentivePlanMember2018-01-012018-12-310000705432sbsi:IncentivePlanMemberus-gaap:EmployeeStockOptionMember2020-01-012020-12-310000705432sbsi:IncentivePlanMemberus-gaap:EmployeeStockOptionMembersrt:MinimumMember2020-01-012020-12-310000705432srt:MaximumMembersbsi:IncentivePlanMemberus-gaap:EmployeeStockOptionMember2020-01-012020-12-310000705432sbsi:IncentivePlanMembersrt:MinimumMemberus-gaap:RestrictedStockUnitsRSUMember2020-01-012020-12-310000705432srt:MaximumMembersbsi:IncentivePlanMemberus-gaap:RestrictedStockUnitsRSUMember2020-01-012020-12-310000705432us-gaap:TreasuryStockMember2020-01-012020-12-310000705432us-gaap:TreasuryStockMember2019-01-012019-12-310000705432us-gaap:TreasuryStockMember2018-01-012018-12-310000705432sbsi:IncentivePlanMemberus-gaap:EmployeeStockOptionMember2019-01-012019-12-310000705432sbsi:IncentivePlanMemberus-gaap:EmployeeStockOptionMember2018-01-012018-12-310000705432us-gaap:EmployeeStockOptionMember2019-12-310000705432us-gaap:EmployeeStockOptionMember2018-12-310000705432us-gaap:EmployeeStockOptionMember2019-01-012019-12-310000705432us-gaap:EmployeeStockOptionMember2018-01-012018-12-310000705432us-gaap:RestrictedStockUnitsRSUMember2019-12-310000705432us-gaap:RestrictedStockUnitsRSUMember2020-01-012020-12-310000705432us-gaap:EmployeeStockOptionMember2020-01-012020-12-310000705432us-gaap:RestrictedStockUnitsRSUMember2020-12-310000705432us-gaap:EmployeeStockOptionMember2020-12-310000705432sbsi:RangeOneMember2020-01-012020-12-310000705432sbsi:RangeOneMember2020-12-310000705432sbsi:RangeTwoMember2020-01-012020-12-310000705432sbsi:RangeTwoMember2020-12-310000705432sbsi:RangeThreeMember2020-01-012020-12-310000705432sbsi:RangeThreeMember2020-12-310000705432sbsi:RangeFourMember2020-01-012020-12-310000705432sbsi:RangeFourMember2020-12-310000705432sbsi:RangeFiveMember2020-01-012020-12-310000705432sbsi:RangeFiveMember2020-12-310000705432sbsi:IncentivePlanMemberus-gaap:EmployeeStockOptionMember2020-12-310000705432us-gaap:DesignatedAsHedgingInstrumentMemberus-gaap:CashFlowHedgingMembersbsi:FinancialInstitutionCounterpartiesMemberus-gaap:InterestRateSwapMember2020-12-310000705432us-gaap:DesignatedAsHedgingInstrumentMemberus-gaap:CashFlowHedgingMembersbsi:FinancialInstitutionCounterpartiesMemberus-gaap:InterestRateSwapMember2019-12-310000705432us-gaap:NondesignatedMembersbsi:FinancialInstitutionCounterpartiesMemberus-gaap:InterestRateSwapMember2020-12-310000705432us-gaap:NondesignatedMembersbsi:FinancialInstitutionCounterpartiesMemberus-gaap:InterestRateSwapMember2019-12-310000705432us-gaap:NondesignatedMembersbsi:CustomerCounterpartiesMemberus-gaap:InterestRateSwapMember2020-12-310000705432us-gaap:NondesignatedMembersbsi:CustomerCounterpartiesMemberus-gaap:InterestRateSwapMember2019-12-310000705432sbsi:FinancialInstitutionCounterpartiesMember2020-12-310000705432sbsi:CustomerCounterpartiesMember2020-12-310000705432sbsi:FinancialInstitutionCounterpartiesMember2019-12-310000705432sbsi:CustomerCounterpartiesMember2019-12-310000705432us-gaap:DesignatedAsHedgingInstrumentMemberus-gaap:CashFlowHedgingMembersbsi:FinancialInstitutionCounterpartiesMemberus-gaap:InterestRateSwapMember2020-01-012020-12-310000705432us-gaap:DesignatedAsHedgingInstrumentMemberus-gaap:CashFlowHedgingMembersbsi:FinancialInstitutionCounterpartiesMemberus-gaap:InterestRateSwapMember2019-01-012019-12-310000705432us-gaap:NondesignatedMembersbsi:FinancialInstitutionCounterpartiesMemberus-gaap:InterestRateSwapMember2020-01-012020-12-310000705432us-gaap:NondesignatedMembersbsi:FinancialInstitutionCounterpartiesMemberus-gaap:InterestRateSwapMember2019-01-012019-12-310000705432us-gaap:NondesignatedMembersbsi:CustomerCounterpartiesMemberus-gaap:InterestRateSwapMember2020-01-012020-12-310000705432us-gaap:NondesignatedMembersbsi:CustomerCounterpartiesMemberus-gaap:InterestRateSwapMember2019-01-012019-12-31sbsi:source0000705432us-gaap:AvailableforsaleSecuritiesMember2020-01-012020-12-310000705432us-gaap:DerivativeMember2020-01-012020-12-310000705432us-gaap:FairValueMeasurementsRecurringMemberus-gaap:USStatesAndPoliticalSubdivisionsMember2020-12-310000705432us-gaap:FairValueMeasurementsRecurringMemberus-gaap:USStatesAndPoliticalSubdivisionsMemberus-gaap:FairValueInputsLevel1Member2020-12-310000705432us-gaap:FairValueMeasurementsRecurringMemberus-gaap:FairValueInputsLevel2Memberus-gaap:USStatesAndPoliticalSubdivisionsMember2020-12-310000705432us-gaap:FairValueMeasurementsRecurringMemberus-gaap:USStatesAndPoliticalSubdivisionsMemberus-gaap:FairValueInputsLevel3Member2020-12-310000705432us-gaap:FairValueMeasurementsRecurringMembersbsi:OtherStocksAndBondsMember2020-12-310000705432us-gaap:FairValueMeasurementsRecurringMembersbsi:OtherStocksAndBondsMemberus-gaap:FairValueInputsLevel1Member2020-12-310000705432us-gaap:FairValueMeasurementsRecurringMembersbsi:OtherStocksAndBondsMemberus-gaap:FairValueInputsLevel2Member2020-12-310000705432us-gaap:FairValueMeasurementsRecurringMembersbsi:OtherStocksAndBondsMemberus-gaap:FairValueInputsLevel3Member2020-12-310000705432us-gaap:ResidentialMortgageBackedSecuritiesMemberus-gaap:FairValueMeasurementsRecurringMember2020-12-310000705432us-gaap:ResidentialMortgageBackedSecuritiesMemberus-gaap:FairValueMeasurementsRecurringMemberus-gaap:FairValueInputsLevel1Member2020-12-310000705432us-gaap:ResidentialMortgageBackedSecuritiesMemberus-gaap:FairValueMeasurementsRecurringMemberus-gaap:FairValueInputsLevel2Member2020-12-310000705432us-gaap:ResidentialMortgageBackedSecuritiesMemberus-gaap:FairValueMeasurementsRecurringMemberus-gaap:FairValueInputsLevel3Member2020-12-310000705432us-gaap:FairValueMeasurementsRecurringMemberus-gaap:CommercialMortgageBackedSecuritiesMember2020-12-310000705432us-gaap:FairValueMeasurementsRecurringMemberus-gaap:FairValueInputsLevel1Memberus-gaap:CommercialMortgageBackedSecuritiesMember2020-12-310000705432us-gaap:FairValueMeasurementsRecurringMemberus-gaap:FairValueInputsLevel2Memberus-gaap:CommercialMortgageBackedSecuritiesMember2020-12-310000705432us-gaap:FairValueMeasurementsRecurringMemberus-gaap:FairValueInputsLevel3Memberus-gaap:CommercialMortgageBackedSecuritiesMember2020-12-310000705432us-gaap:FairValueMeasurementsRecurringMember2020-12-310000705432us-gaap:FairValueMeasurementsRecurringMemberus-gaap:FairValueInputsLevel1Member2020-12-310000705432us-gaap:FairValueMeasurementsRecurringMemberus-gaap:FairValueInputsLevel2Member2020-12-310000705432us-gaap:FairValueMeasurementsRecurringMemberus-gaap:FairValueInputsLevel3Member2020-12-310000705432us-gaap:FairValueMeasurementsRecurringMemberus-gaap:InterestRateSwapMember2020-12-310000705432us-gaap:FairValueMeasurementsRecurringMemberus-gaap:InterestRateSwapMemberus-gaap:FairValueInputsLevel1Member2020-12-310000705432us-gaap:FairValueMeasurementsRecurringMemberus-gaap:FairValueInputsLevel2Memberus-gaap:InterestRateSwapMember2020-12-310000705432us-gaap:FairValueMeasurementsRecurringMemberus-gaap:InterestRateSwapMemberus-gaap:FairValueInputsLevel3Member2020-12-310000705432us-gaap:FairValueMeasurementsNonrecurringMember2020-12-310000705432us-gaap:FairValueMeasurementsNonrecurringMemberus-gaap:FairValueInputsLevel1Member2020-12-310000705432us-gaap:FairValueMeasurementsNonrecurringMemberus-gaap:FairValueInputsLevel2Member2020-12-310000705432us-gaap:FairValueMeasurementsNonrecurringMemberus-gaap:FairValueInputsLevel3Member2020-12-310000705432us-gaap:FairValueMeasurementsNonrecurringMembersbsi:CollateralDependentLoansMember2020-12-310000705432us-gaap:FairValueMeasurementsNonrecurringMemberus-gaap:FairValueInputsLevel1Membersbsi:CollateralDependentLoansMember2020-12-310000705432us-gaap:FairValueMeasurementsNonrecurringMemberus-gaap:FairValueInputsLevel2Membersbsi:CollateralDependentLoansMember2020-12-310000705432us-gaap:FairValueMeasurementsNonrecurringMembersbsi:CollateralDependentLoansMemberus-gaap:FairValueInputsLevel3Member2020-12-310000705432us-gaap:FairValueMeasurementsRecurringMemberus-gaap:USStatesAndPoliticalSubdivisionsMember2019-12-310000705432us-gaap:FairValueMeasurementsRecurringMemberus-gaap:USStatesAndPoliticalSubdivisionsMemberus-gaap:FairValueInputsLevel1Member2019-12-310000705432us-gaap:FairValueMeasurementsRecurringMemberus-gaap:FairValueInputsLevel2Memberus-gaap:USStatesAndPoliticalSubdivisionsMember2019-12-310000705432us-gaap:FairValueMeasurementsRecurringMemberus-gaap:USStatesAndPoliticalSubdivisionsMemberus-gaap:FairValueInputsLevel3Member2019-12-310000705432us-gaap:FairValueMeasurementsRecurringMembersbsi:OtherStocksAndBondsMember2019-12-310000705432us-gaap:FairValueMeasurementsRecurringMembersbsi:OtherStocksAndBondsMemberus-gaap:FairValueInputsLevel1Member2019-12-310000705432us-gaap:FairValueMeasurementsRecurringMembersbsi:OtherStocksAndBondsMemberus-gaap:FairValueInputsLevel2Member2019-12-310000705432us-gaap:FairValueMeasurementsRecurringMembersbsi:OtherStocksAndBondsMemberus-gaap:FairValueInputsLevel3Member2019-12-310000705432us-gaap:ResidentialMortgageBackedSecuritiesMemberus-gaap:FairValueMeasurementsRecurringMember2019-12-310000705432us-gaap:ResidentialMortgageBackedSecuritiesMemberus-gaap:FairValueMeasurementsRecurringMemberus-gaap:FairValueInputsLevel1Member2019-12-310000705432us-gaap:ResidentialMortgageBackedSecuritiesMemberus-gaap:FairValueMeasurementsRecurringMemberus-gaap:FairValueInputsLevel2Member2019-12-310000705432us-gaap:ResidentialMortgageBackedSecuritiesMemberus-gaap:FairValueMeasurementsRecurringMemberus-gaap:FairValueInputsLevel3Member2019-12-310000705432us-gaap:FairValueMeasurementsRecurringMemberus-gaap:CommercialMortgageBackedSecuritiesMember2019-12-310000705432us-gaap:FairValueMeasurementsRecurringMemberus-gaap:FairValueInputsLevel1Memberus-gaap:CommercialMortgageBackedSecuritiesMember2019-12-310000705432us-gaap:FairValueMeasurementsRecurringMemberus-gaap:FairValueInputsLevel2Memberus-gaap:CommercialMortgageBackedSecuritiesMember2019-12-310000705432us-gaap:FairValueMeasurementsRecurringMemberus-gaap:FairValueInputsLevel3Memberus-gaap:CommercialMortgageBackedSecuritiesMember2019-12-310000705432us-gaap:FairValueMeasurementsRecurringMember2019-12-310000705432us-gaap:FairValueMeasurementsRecurringMemberus-gaap:FairValueInputsLevel1Member2019-12-310000705432us-gaap:FairValueMeasurementsRecurringMemberus-gaap:FairValueInputsLevel2Member2019-12-310000705432us-gaap:FairValueMeasurementsRecurringMemberus-gaap:FairValueInputsLevel3Member2019-12-310000705432us-gaap:FairValueMeasurementsRecurringMemberus-gaap:InterestRateSwapMember2019-12-310000705432us-gaap:FairValueMeasurementsRecurringMemberus-gaap:InterestRateSwapMemberus-gaap:FairValueInputsLevel1Member2019-12-310000705432us-gaap:FairValueMeasurementsRecurringMemberus-gaap:FairValueInputsLevel2Memberus-gaap:InterestRateSwapMember2019-12-310000705432us-gaap:FairValueMeasurementsRecurringMemberus-gaap:InterestRateSwapMemberus-gaap:FairValueInputsLevel3Member2019-12-310000705432us-gaap:FairValueMeasurementsNonrecurringMember2019-12-310000705432us-gaap:FairValueMeasurementsNonrecurringMemberus-gaap:FairValueInputsLevel1Member2019-12-310000705432us-gaap:FairValueMeasurementsNonrecurringMemberus-gaap:FairValueInputsLevel2Member2019-12-310000705432us-gaap:FairValueMeasurementsNonrecurringMemberus-gaap:FairValueInputsLevel3Member2019-12-310000705432us-gaap:CarryingReportedAmountFairValueDisclosureMember2020-12-310000705432us-gaap:EstimateOfFairValueFairValueDisclosureMember2020-12-310000705432us-gaap:EstimateOfFairValueFairValueDisclosureMemberus-gaap:FairValueInputsLevel1Member2020-12-310000705432us-gaap:EstimateOfFairValueFairValueDisclosureMemberus-gaap:FairValueInputsLevel2Member2020-12-310000705432us-gaap:EstimateOfFairValueFairValueDisclosureMemberus-gaap:FairValueInputsLevel3Member2020-12-310000705432us-gaap:CarryingReportedAmountFairValueDisclosureMember2019-12-310000705432us-gaap:EstimateOfFairValueFairValueDisclosureMember2019-12-310000705432us-gaap:EstimateOfFairValueFairValueDisclosureMemberus-gaap:FairValueInputsLevel1Member2019-12-310000705432us-gaap:EstimateOfFairValueFairValueDisclosureMemberus-gaap:FairValueInputsLevel2Member2019-12-310000705432us-gaap:EstimateOfFairValueFairValueDisclosureMemberus-gaap:FairValueInputsLevel3Member2019-12-310000705432us-gaap:ConsolidatedEntitiesMember2020-12-310000705432sbsi:BankSubsidiariesMember2020-12-310000705432us-gaap:ConsolidatedEntitiesMember2019-12-310000705432sbsi:BankSubsidiariesMember2019-12-3100007054322020-05-012020-05-3100007054322020-05-31utr:sqft0000705432srt:CumulativeEffectPeriodOfAdoptionAdjustmentMember2020-12-310000705432us-gaap:CommitmentsToExtendCreditMember2020-12-310000705432us-gaap:CommitmentsToExtendCreditMember2019-12-310000705432us-gaap:StandbyLettersOfCreditMember2020-12-310000705432us-gaap:StandbyLettersOfCreditMember2019-12-310000705432us-gaap:ResidentialRealEstateMemberus-gaap:CreditConcentrationRiskMember2020-01-012020-12-310000705432srt:ParentCompanyMember2020-12-310000705432srt:ParentCompanyMember2019-12-310000705432srt:ParentCompanyMembersbsi:BankSubsidiariesMember2020-12-310000705432srt:ParentCompanyMembersbsi:BankSubsidiariesMember2019-12-310000705432srt:ParentCompanyMembersbsi:NonbankSubsidiariesMember2020-12-310000705432srt:ParentCompanyMembersbsi:NonbankSubsidiariesMember2019-12-310000705432srt:ParentCompanyMember2020-01-012020-12-310000705432srt:ParentCompanyMember2019-01-012019-12-310000705432srt:ParentCompanyMember2018-01-012018-12-310000705432srt:ParentCompanyMember2018-12-310000705432srt:ParentCompanyMember2017-12-3100007054322020-10-012020-12-3100007054322020-07-012020-09-3000007054322020-04-012020-06-3000007054322020-01-012020-03-3100007054322019-10-012019-12-3100007054322019-07-012019-09-3000007054322019-04-012019-06-3000007054322019-01-012019-03-31
UNITED STATES
SECURITIES AND EXCHANGE COMMISSION
Washington, D.C. 20549
Form 10-K
(Mark One)
| | | | | |
| ☒ | ANNUAL REPORT PURSUANT TO SECTION 13 OR 15(d) OF THE SECURITIES EXCHANGE ACT OF 1934 |
For the fiscal year ended December 31, 2020
or
| | | | | |
| ☐ | TRANSITION REPORT PURSUANT TO SECTION 13 OR 15(d) OF THE SECURITIES EXCHANGE ACT OF 1934 |
For the Transition Period From _______ to _______
Commission file number 000-12247
SOUTHSIDE BANCSHARES, INC.
(Exact name of registrant as specified in its charter)
| | | | | | | | | | | | | | |
| Texas | | 75-1848732 |
(State or Other Jurisdiction of
Incorporation or Organization) | | (I.R.S. Employer
Identification No.) |
| | | | |
| 1201 S. Beckham Avenue, | Tyler, | Texas | | 75701 |
| (Address of Principal Executive Offices) | | (Zip Code) |
Registrant’s telephone number, including area code: (903) 531-7111
Securities registered pursuant to Section 12(b) of the Act:
| | | | | | | | | | | | | | |
| Title of each class | | Trading Symbol | | Name of each exchange on which registered |
| Common Stock, $1.25 par value | | SBSI | | NASDAQ Global Select Market |
Securities registered pursuant to Section 12(g) of the Act: NONE
Indicate by check mark if the registrant is a well-known seasoned issuer, as defined in Rule 405 of the Securities Act. Yes ☒ No ☐
Indicate by check mark if the registrant is not required to file reports pursuant to Section 13 or Section 15(d) of the Act. Yes ☐ No ☒
Indicate by check mark whether the registrant (1) has filed all reports required to be filed by Section 13 or 15(d) of the Securities Exchange Act of 1934 during the preceding 12 months (or for such shorter period that the registrant was required to file such reports), and (2) has been subject to such filing requirements for the past 90 days. Yes ☒ No ☐
Indicate by check mark whether the registrant has submitted electronically every Interactive Data File required to be submitted pursuant to Rule 405 of Regulation S-T (§ 232.405 of this chapter) during the preceding 12 months (or for such shorter period that the registrant was required to submit such files). Yes ☒ No ☐
Indicate by check mark whether the registrant is a large accelerated filer, an accelerated filer, a non-accelerated filer, a smaller reporting company, or emerging growth company. See the definitions of “large accelerated filer,” “accelerated filer,” “smaller reporting company,” and “emerging growth company” in Rule 12b-2 of the Exchange Act:
| | | | | | | | | | | | | | |
| Large Accelerated Filer | ☒ | | Accelerated filer | ☐ |
| Non-accelerated filer | ☐ | | Smaller reporting company | ☐ |
| | | Emerging growth company | ☐ |
If an emerging growth company, indicate by check mark if the registrant has elected not to use the extended transition period for complying with any new or revised financial accounting standards provided pursuant to Section 13(a) of the Exchange Act. ☐ |
Indicate by check mark whether the registrant has filed a report on and attestation to its management’s assessment of the effectiveness of its internal control over financial reporting under Section 404(b) of the Sarbanes-Oxley Act (15 U.S.C. 7262(b)) by the registered public accounting firm that prepared or issued its audit report. ☒
Indicate by check mark whether the registrant is a shell company (as defined in Rule 12b-2 of the Act). Yes ☐ No ☒
The aggregate market value of the common stock held by non-affiliates of the registrant as of June 30, 2020, was approximately $860.5 million (based upon the closing price of $27.72 per share as reported by the NASDAQ Global Select Market on June 30, 2020, the last business day of the registrant’s most recently completed second fiscal quarter).
As of February 23, 2021, there were 32,757,551 shares of the registrant’s common stock outstanding.
DOCUMENTS INCORPORATED BY REFERENCE
Certain portions of the Registrant’s Proxy statement to be filed for the Annual Meeting of Shareholders to be held May 12, 2021 are incorporated by reference into Part III of this Annual Report on Form 10-K. Other than those portions of the proxy statement specifically incorporated by reference pursuant to Items 10-14 of Part III hereof, no other portions of the proxy statement shall be deemed so incorporated.
SOUTHSIDE BANCSHARES, INC.
Form 10-K
For the Fiscal Year Ended December 31, 2020
TABLE OF CONTENTS
| | | | | | | | | | | |
| | | |
| | | |
| | | |
| PART I | |
| | Item 1. | | |
| | Item 1A. | | |
| | Item 1B. | | |
| | Item 2. | | |
| | Item 3. | | |
| | Item 4. | | |
| PART II | |
| | Item 5. | | |
| | Item 6. | | |
| | Item 7. | | |
| | Item 7A. | | |
| | Item 8. | | |
| | | |
| | | |
| | | |
| | Item 9. | | |
| | Item 9A. | | |
| | Item 9B. | | |
| PART III | |
| | Item 10. | | |
| | Item 11. | | |
| | Item 12. | | |
| | Item 13. | | |
| | Item 14. | | |
| PART IV | |
| | Item 15. | | |
| Item 16. | | |
| | | |
| | | |
SOUTHSIDE BANCSHARES, INC.
Glossary of Acronyms, Abbreviations and Terms
The acronyms, abbreviations and terms listed below are used in various sections of this Form 10-K, including "Item 7. Management's Discussion and Analysis of Financial Condition and Results of Operations" and "Item 8. Financial Statements and Supplementary Data."
| | | | | | | | |
| Entities: | | |
| Southside Bancshares, Inc. | | Bank holding company for Southside Bank |
| Southside Bank | | Texas state bank and wholly owned subsidiary of Southside Bancshares, Inc. |
| Company | | Combined entities of Southside Bancshares, Inc. and its subsidiaries, including Southside Bank |
| Bank | | Southside Bank |
| Omni | | OmniAmerican Bancorp, Inc., a bank holding company, and its wholly-owned subsidiary, OmniAmerican Bank, acquired by Southside on December 17, 2014 |
| Diboll | | Diboll State Bancshares, Inc., a bank holding company, and its wholly-owned subsidiary, First Bank & Trust East Texas, acquired by Southside on November 30, 2017. |
| Southside | | Southside Bancshares, Inc. |
| | |
| Other Acronyms, Abbreviations and Terms: | | |
| 2015 Capital Rules | | Risk-based and leverage capital guidelines applicable to banking organizations issued by federal banking agencies that imposed higher minimum capital requirements effective January 1, 2015. |
| 2017 Incentive Plan | | Southside Bancshares, Inc. 2017 Incentive Plan |
| 2018 Capital Rules | | On December 21, 2018, federal banking agencies issued a joint final rule to revise their regulatory capital rules to (i) address the upcoming implementation of the CECL accounting standard under GAAP; (ii) provide an optional three-year phase-in period for the day-one adverse regulatory capital effects that banking organizations are expected to experience upon adopting CECL; and (iii) require the use of CECL in stress tests beginning with the 2020 capital planning and stress testing cycle for banking organizations. |
| 401(k) Plan | | 401(k) Defined Contribution Plan |
| AFS | | Available for sale |
| ALCO | | Asset/Liability Committee |
| AML | | Anti-money laundering |
| AOCI | | Accumulated other comprehensive income or loss |
| ASC | | Accounting Standards Codification |
| ASU | | Accounting Standards Update issued by the FASB |
| ATM | | Automated teller machines |
| Basel Committee | | Basel Committee on Banking Supervision |
| BHCA | | Bank Holding Company Act of 1956 |
| BOLI | | Bank owned life insurance |
| Bureau | | Bureau of Consumer Financial Protection |
| CARES Act | | Coronavirus Aid, Relief, and Economic Security Act |
| CBCA | | Change in Bank Control Act |
| CBLR | | Community Bank Leverage Ratio framework |
| CDs | | Certificates of deposit |
| CECL | | ASU No. 2016-13, Financial Instruments- Credit Losses, also known as Current Expected Credit Losses |
| | | | | | | | |
| CET1 | | Common Equity Tier 1 |
| CMOs | | Collateralized mortgage obligations |
| COVID-19 | | Novel strain of coronavirus |
| CRA | | Community Reinvestment Act |
| DIF | | FDIC’s Deposit Insurance Fund |
| Dodd-Frank Act | | Dodd-Frank Wall Street Reform and Consumer Protection Act of 2010 |
| DRIP | | Dividend Reinvestment Plan |
| DRR | | Designated reserve ratio established by the Dodd-Frank Act |
| Economic Aid Act | | Economic Aid to Hard-Hit Small Business, Nonprofits and Venues Act |
| ESOP | | Employee Stock Ownership Plan |
| ETR | | Effective tax rate |
| Fannie Mae | | Federal National Mortgage Association |
| FASB | | Financial Accounting Standards Board |
| FDIA | | Federal Deposit Insurance Act |
| FDIC | | Federal Deposit Insurance Corporation |
| FDICIA | | Federal Deposit Insurance Corporation Improvement Act |
| Federal Reserve | | The Board of Governors of the Federal Reserve System |
| FHLB | | Federal Home Loan Bank |
| FinCEN | | Financial Crimes Enforcement Network |
| Fintech | | Financial technology |
| FRA | | Federal Reserve Act |
| FRBNY | | Federal Reserve Bank of New York |
| FRDW | | Federal Reserve Discount Window |
| Freddie Mac | | Federal Home Loan Mortgage Corporation |
| FTE | | Fully-taxable equivalents measurements |
| GAAP | | Generally accepted accounting principles |
| GLBA | | Gramm-Leach-Bliley Act |
| GNMA | | Government National Mortgage Association |
| GSEs | | U.S. government-sponsored enterprises |
| Guidelines | | Interagency Guidelines Prescribing Standards for Safety and Soundness adopted by federal banking agencies |
| HTM | | Held to maturity |
| IBA | | ICE Benchmark Administration, the administrator of LIBOR |
| ITM | | Interactive teller machines |
| LIBOR | | London Interbank Offered Rate |
| MBS | | Mortgage-backed securities |
| MVPE | | Market value of portfolio equity |
| NQSO | | Nonqualified stock options |
| OFAC | | The U.S. Department of the Treasury’s Office of Foreign Assets Control |
| OPEC | | Organization of the Petroleum Exporting Countries |
| OREO | | Other real estate owned |
| PCD | | Purchased financial assets with credit deterioration under CECL |
| PCI | | Financial assets purchased credit impaired under ASC 310-30 prior to CECL |
| Plan | | Defined benefit pension plan |
| PPP | | Paycheck Protection Program |
| | | | | | | | |
| REIT | | Real estate investment trust |
| REMICs | | Real estate mortgage investment conduits |
| Repurchase agreements | | Securities sold under agreements to repurchase |
| RESPA | | Real Estate Settlement Procedures Act |
| Restoration Plan | | Nonfunded supplemental retirement plan |
| ROU | | Right-of-use |
| RSU | | Restricted stock units |
| SBA | | Small Business Administration |
| SEC | | Securities and Exchange Commission |
| SOFR | | Secured Overnight Financing Rate provided by the Federal Reserve Bank of New York |
| Tax Act | | Tax Cuts and Jobs Act enacted by Congress on December 22, 2017 |
| TDB | | Texas Department of Banking |
| TDR | | Troubled debt restructurings |
| TILA | | Truth in Lending Act |
| U.S. | | United States |
| USA PATRIOT Act | | Uniting and Strengthening America by Providing Appropriate Tools Required to Intercept and Obstruct Terrorism Act of 2001 |
| VIE | | Variable interest entity |
IMPORTANT INFORMATION ABOUT THIS REPORT
In this report, the words “the Company,” “we,” “us,” and “our” refer to the combined entities of Southside Bancshares, Inc. and its subsidiaries, including Southside Bank. The words “Southside” and “Southside Bancshares” refer to Southside Bancshares, Inc. The words “Southside Bank” and “the Bank” refer to Southside Bank.
PART I
ITEM 1. BUSINESS
FORWARD-LOOKING INFORMATION
The disclosures set forth in this item are qualified by the section captioned “Cautionary Notice Regarding Forward-Looking Statements” in “Item 7. Management’s Discussion and Analysis of Financial Condition and Results of Operations” of this Annual Report on Form 10-K and other cautionary statements set forth elsewhere in this report.
GENERAL
Southside Bancshares, Inc., incorporated in Texas in 1982, is a bank holding company for Southside Bank, a Texas state bank headquartered in Tyler, Texas that was formed in 1960. We operate through 57 branches, 15 of which are located in grocery stores, in addition to wealth management and trust services, and/or loan production, brokerage or other financial services offices.
At December 31, 2020, our total assets were $7.01 billion, total loans were $3.66 billion, total deposits were $4.93 billion and total equity was $875.3 million. For the years ended December 31, 2020 and 2019, our net income was $82.2 million and $74.6 million, respectively. For the years ended December 31, 2020 and 2019, diluted earnings per common share was $2.47 and $2.20, respectively. We have paid a cash dividend to shareholders every year since 1970 (including dividends paid by Southside Bank prior to the incorporation of Southside Bancshares).
We are a community-focused financial institution that offers a full range of financial services to individuals, businesses, municipal entities and nonprofit organizations in the communities that we serve. These services include consumer and commercial loans, deposit accounts, wealth management and trust services, brokerage services and safe deposit services.
Our consumer loan services include 1-4 family residential loans, home equity loans, home improvement loans, automobile loans and other consumer related loans. Commercial loan services include short-term working capital loans for inventory and accounts receivable, short- and medium-term loans for equipment or other business capital expansion, commercial real estate loans and municipal loans. We also offer construction loans for 1-4 family residential and commercial real estate.
We offer a variety of deposit accounts with a wide range of interest rates and terms, including savings, money market, interest and noninterest bearing checking accounts and CDs.
Our trust and wealth management services include investment management, administration of irrevocable, revocable and testamentary trusts, estate administration, and custodian services, primarily for individuals and, to a lesser extent, partnerships and corporations. Additionally, we offer retirement and employee benefit accounts, including but not limited to, IRAs, 401(k) plans and profit sharing plans. At December 31, 2020, our wealth management and trust assets under management were approximately $1.58 billion.
Our business strategy includes evaluating expansion opportunities through acquisitions of financial institutions in market areas that could complement our existing franchise. We generally seek merger partners that are culturally similar, have experienced management teams and possess either significant market presence or have potential for improved profitability through financial management, economies of scale or expanded services.
We and our subsidiaries are subject to comprehensive regulation, examination and supervision by the Federal Reserve, the TDB and the FDIC and are subject to numerous laws and regulations relating to internal controls, the extension of credit, making of loans to individuals, deposits and all other facets of our operations.
Our primary executive offices are located at 1201 South Beckham Avenue, Tyler, Texas 75701 and our telephone number is 903-531-7111. Our website can be found at www.southside.com. Our public filings with the SEC may be obtained free of charge on either our website, https://investors.southside.com/ under the topic Filings and Financials, or the SEC’s website, www.sec.gov, as soon as reasonably practicable after filing with the SEC.
MARKET AREA
We are headquartered in Tyler, Texas. The Tyler metropolitan area has an estimated population of 230,000 and is located approximately 90 miles east of Dallas, Texas and 90 miles west of Shreveport, Louisiana.
We consider our primary market areas to be East Texas, Southeast Texas, as well as the greater Fort Worth, Austin and Houston, Texas areas. Our expectation is that our presence in all of the market areas we serve should grow in the future. In addition, we continue to explore new markets in which we believe we can expand successfully.
The principal economic activities in our market areas include medical services, retail, education, financial services, technology, distribution, manufacturing, government and to a lesser extent, oil and gas industries. Additionally, the industry base includes conventions and tourism, as well as retirement relocation. These economic activities support a growing regional system of medical service, retail and education centers. Tyler, Fort Worth, Austin and Houston are home to several nationally recognized health care systems that represent all major specialties.
Our 57 branches and 39 motor bank facilities are located in and around Arlington, Austin, Bullard, Chandler, Cleburne, Cleveland, Diboll, Euless, Flower Mound, Fort Worth, Frisco, Granbury, Grapevine, Gresham, Gun Barrel City, Hawkins, Hemphill, Irving, Jacksonville, Jasper, Kingwood, Lindale, Longview, Lufkin, Nacogdoches, Palestine, Pineland, San Augustine, Splendora, Tyler, Watauga, Weatherford and Whitehouse. Our advertising is designed to target the market areas we serve. The type and amount of advertising in each location is directly attributable to our market share in that area, combined with overall cost.
Additionally, our customers may access various banking services through a wide network of ATMs, ITMs and through automated telephone, internet and mobile banking products. These products allow our customers to apply for loans, open deposit accounts, access account information and conduct various other transactions online from their smart phones or computers.
RECENT DEVELOPMENTS
During the year ended December 31, 2020, we closed one of our retail branch locations in Palestine, due to the close proximity of an acquired Diboll traditional branch location. We also closed an acquired Diboll traditional branch location in Longview, due to the close proximity to one of our traditional branch locations. Additionally, due to pandemic-related access restrictions implemented in nursing homes, we closed the Pinecrest Nursing Home branch which provided very limited operations on a weekly basis for residents located in Lufkin.
In December 2020, we announced our plans to close two retail branch locations in Longview and Tyler, that are in close proximity to other Southside branches, and a traditional branch location in Flower Mound, all on March 19, 2021. These closures are also driven by a shift in customer preferences and their transition from in-branch banking to digital.
During the fourth quarter of 2020, we entered into a lease for a loan production office in Harris County, in Houston’s Uptown District. We anticipate this office to open during the second quarter of 2021.
THE BANKING INDUSTRY IN TEXAS
The banking industry is affected by general economic conditions such as interest rates, inflation, recession, unemployment and other factors beyond our control, including COVID-19. During the last 30 years the Texas economy has continued to diversify, decreasing the overall impact of fluctuations in oil and gas prices; however, the oil and gas industry is still a significant component of the Texas economy. Economic conditions were significantly impacted by the COVID-19 pandemic in 2020; however, Texas still outperformed the nation in 2020, and our Fort Worth and Austin market areas have continued to perform generally better than many other parts of the country. We cannot predict whether or when current economic conditions will improve, remain the same or decline. The adverse impact of COVID-19 on the markets in which we operate is expected to remain elevated until the pandemic subsides.
COMPETITION
The activities we are engaged in are highly competitive. Financial institutions such as credit unions, fintech companies, consumer finance companies, insurance companies, brokerage companies and other financial institutions with varying degrees of regulatory restrictions compete vigorously for a share of the financial services market. Brokerage and insurance companies continue to become more competitive in the financial services arena and pose an ever-increasing challenge to banks. Legislative changes also greatly affect the level of competition we face. Federal legislation allows credit unions to use their expanded membership capabilities, combined with tax-free status, to compete more openly for traditional bank business. The tax-free status granted to credit unions provides them with a significant competitive advantage. Many of the largest banks operating in Texas, including some of the largest banks in the country, have offices in our market areas with capital resources, broader geographic markets and legal lending limits substantially in excess of those available to us. We face competition from institutions that offer products and services we do not or cannot currently offer. Some institutions we compete with offer interest rate levels on loan and deposit products that we are unwilling to offer due to interest rate risk and overall profitability concerns. We expect the level of competition to continue to increase.
HUMAN CAPITAL RESOURCES
At February 12, 2021, we employed approximately 832 full time equivalent persons. None of our employees are represented by any unions or similar groups, and we have not experienced any type of strike or labor dispute. We consider the relationship with our employees to be good which we believe to be reflected in the average tenure of our employees exceeding eight years with 34% of our employees having a tenure that exceeds 10 years.
Throughout COVID-19, we have and continue to prioritize the safety of our employees and customers, while continuing to support the needs of our customers and communities as an essential business. In response to COVID-19, we quickly implemented extensive safety measures to protect our employees, including heightened sanitary precautions, protective supplies, suspended non-essential business travel, directed employees to work remotely when possible and limited in-person meetings. We also implemented flexible scheduling and compensation arrangements for employees affected by COVID-19.
We value diversity and are committed to creating a diverse and inclusive workforce. As of December 31, 2020, women and ethnic minorities represented approximately 70% and 36% of our workforce, respectively.
We believe employees to be our greatest asset and that our future success depends on our ability to attract, retain and develop employees. Professional development is a key priority, which is facilitated through our many corporate initiatives including extensive training programs, corporate mentoring, leadership programs, educational reimbursement and corporate and personal development coaching.
As part of our effort to attract and retain employees, we offer a broad range of benefits, including, but not limited to, 15-30 days of annual paid time off based on length of employment, participation in our ESOP and up to 20 hours of paid time off annually to volunteer. We believe our compensation package and benefits are competitive with others in our industry. For additional information regarding our employee benefit plans, see “Note 10 - Employee Benefits” to our consolidated financial statements included in this report.
SUPERVISION AND REGULATION
General
Banking is a complex, highly regulated industry. As a bank holding company under federal law, the Company is subject to regulation, supervision and examination by the Federal Reserve. In addition, under state law, as the parent company of a Texas-chartered state bank that is not a member of the Federal Reserve, the Company is subject to supervision and examination by the TDB. As a Texas-chartered state bank, Southside Bank is subject to regulation, supervision and examination by the TDB, as its chartering authority, and by the FDIC, as its primary federal regulator and deposit insurer. This system of regulation and supervision applicable to us establishes a comprehensive framework for our operations and is intended primarily for the protection of bank depositors, the FDIC’s DIF and the public, rather than our shareholders and creditors.
In addition to the system of regulation and supervision outlined above, the Dodd-Frank Act created the Bureau of Consumer Financial Protection, a federal regulatory body with broad authority to regulate the offering and provision of consumer financial products and services. The Bureau officially came into being on July 21, 2011, and rulemaking authority for a range of consumer financial protection laws (such as the TILA), the Electronic Fund Transfer Act and the RESPA, among others) transferred from the federal prudential banking regulators to the Bureau on that date. The Dodd-Frank Act gives the Bureau authority to supervise and examine depository institutions with more than $10 billion in assets for compliance with these federal consumer laws. The authority to supervise and examine depository institutions with $10 billion or less in assets (such as Southside Bank) for compliance with federal consumer laws remains largely with those institutions’ primary regulators. However, the Bureau may participate in examinations of these smaller institutions on a “sampling basis” and may
refer potential enforcement actions against such institutions to their primary regulators. Accordingly, the Bureau may participate in examinations of Southside Bank, and could supervise and examine other direct or indirect subsidiaries of the Company that offer consumer financial products or services.
The earnings of Southside Bank and, therefore, the earnings of the Company, are affected by general economic conditions, changes in federal and state laws and regulations and actions of various regulatory authorities, including those referenced above.
Significant changes to federal and state laws, or changes in the interpretation or application of such laws by federal and state regulators, could materially impact the profitability of our business, the value of assets we hold or the collateral available for our loans, require changes to business practices, or force us to discontinue businesses and expose us to additional costs, taxes, liabilities, enforcement actions and reputational risk.
The likelihood, timing and scope of any such change and the impact any such change may have on us are impossible to determine with any certainty. Similarly, we cannot predict whether new legislation or regulations will be enacted and, if enacted, the effect that such laws would have on our business, financial condition or results of operations. Set forth below is a brief description of the significant federal and state laws and regulations to which we are currently subject. These descriptions do not purport to be complete and are qualified in their entirety by reference to the particular statutory or regulatory provision.
Holding Company Regulation
As a bank holding company regulated under the BHCA, as amended, the Company is registered with and subject to regulation, supervision and examination by the Federal Reserve. The Company is required to file annual and other reports with, and furnish information to, the Federal Reserve, which makes periodic inspections of the Company. The Federal Reserve may also examine our nonbank subsidiaries.
Permitted Activities. Under the BHCA, a bank holding company is generally permitted to engage in, or acquire direct or indirect control of more than five percent of the voting shares of any company engaged in, the following activities:
•banking or managing or controlling banks;
•furnishing services to or performing services for its subsidiaries; and
•any activity that the Federal Reserve determines to be so closely related to banking as to be a proper incident to the business of banking, including:
◦factoring accounts receivable;
◦making, acquiring, brokering or servicing loans and usual related activities;
◦leasing personal or real property;
◦operating a nonbank depository institution, such as a savings association;
◦performing trust company functions;
◦conducting financial and investment advisory activities;
◦conducting discount securities brokerage activities;
◦underwriting and dealing in government obligations and money market instruments;
◦providing specified management consulting and counseling activities;
◦performing selected data processing services and support services;
◦acting as agent or broker in selling credit life insurance and other types of insurance in connection with credit transactions;
◦performing selected insurance underwriting activities;
◦providing certain community development activities (such as making investments in projects designed primarily to promote community welfare); and
◦issuing and selling money orders and similar consumer-type payment instruments.
The Federal Reserve has the authority to order a bank holding company or its subsidiaries to terminate any of these activities or to terminate its ownership or control of any subsidiary when the Federal Reserve has reasonable cause to believe that the bank holding company’s continued ownership, activity or control constitutes a serious risk to the financial safety, soundness or stability of it or any of its bank subsidiaries.
Under the BHCA, a bank holding company meeting certain eligibility requirements may elect to become a “financial holding company,” which is a form of bank holding company with authority to engage in additional activities. Specifically, a financial holding company and companies under its control may engage in activities that are “financial in nature,” as defined by the GLBA and Federal Reserve interpretations, and therefore may engage in a broader range of activities than those permitted for bank holding companies and their subsidiaries. Financial activities specifically include insurance brokerage and underwriting, securities underwriting and dealing, merchant banking, investment advisory and lending activities. Financial holding companies and their subsidiaries also may engage in additional activities that are determined by the Federal Reserve, in consultation with the U.S. Department of the Treasury, to be “financial in nature or incidental to” a financial activity or are determined by the Federal Reserve unilaterally to be “complementary” to financial activities.
On February 8, 2011, we filed with the Federal Reserve Bank of Dallas, a declaration of financial holding company status and were granted financial holding company status on March 22, 2011. Election of financial holding company status is not automatic, and it was granted based upon consideration of a number of factors, including that all of our depository institution subsidiaries satisfy the Federal Reserve’s “well capitalized” and “well managed” standards and have at least a satisfactory rating under the CRA (discussed below). We do not currently engage in financial activities beyond those permissible for a bank holding company. However, if we undertake expanded financial activities (i.e., those that are not permissible for a bank holding company) and we fail to continue to meet any of the prerequisites for “financial holding company” status, including those described above, we would be required to enter into an agreement with the Federal Reserve to comply with all applicable capital and management requirements. If we do not return to compliance within 180 days, the Federal Reserve may order the financial holding company to divest its Bank or the Company may discontinue or divest investments in companies engaged in activities permissible only for a bank holding company that has elected to be treated as a financial holding company.
Capital Adequacy. Each of the federal banking agencies, including the Federal Reserve and the FDIC, has issued substantially similar risk-based and leverage capital guidelines applicable to the banking organizations they supervise. As a result of the regulations, we were required to begin complying with higher minimum capital requirements as of January 1, 2015. The 2015 Capital Rules, which are discussed below, implemented certain provisions of the Dodd-Frank Act and a separate, international regulatory capital initiative known as “Basel III.” These 2015 Capital Rules also make important changes to the “prompt corrective action” framework discussed below in Bank Regulation - Prompt Corrective Action and Undercapitalization.
The agencies’ prior risk-based guidelines, applicable to the Company before January 1, 2015, defined a three-tier capital framework. Risk-based capital ratios were calculated by dividing, as appropriate, total capital and Tier 1 capital by risk-weighted assets. Assets and off-balance-sheet exposures were assigned to one of four categories of risk weights, based primarily on relative credit risk. Under these prior risk-based capital requirements, the Company and Southside Bank were each generally required to maintain a minimum ratio of total capital to risk-weighted assets of at least 8% and a minimum ratio of Tier 1 capital to risk-weighted assets of at least 4%. To the extent we engaged in trading activities, we were required to adjust our risk-based capital ratios to take into consideration market risks that may result from movements in market prices of covered trading positions in trading accounts, or from foreign exchange or commodity positions, whether or not in trading accounts, including changes in interest rates, equity prices, foreign exchange rates or commodity prices.
Each of the federal bank regulatory agencies, including the Federal Reserve and the FDIC, also had established minimum leverage capital requirements for the banking organizations they supervise. These requirements provided that banking organizations that met certain criteria, including excellent asset quality, high liquidity, low interest rate exposure and good earnings, and that had received the highest regulatory rating must maintain a ratio of Tier 1 capital to total adjusted average assets of at least 3%. Institutions not meeting these criteria, as well as institutions with supervisory, financial or operational weaknesses, were expected to maintain a minimum Tier 1 capital to total adjusted average assets ratio equal to 100 to 200 basis points above this stated minimum. Holding companies experiencing internal growth or making acquisitions were expected to maintain strong capital positions substantially above the minimum supervisory levels without significant reliance on intangible assets. The Federal Reserve also considered a “tangible Tier 1 capital leverage ratio” (deducting all intangibles) and other indicators of capital strength in evaluating proposals for expansion or new activity.
The 2015 Capital Rules, which became applicable to the Company and the Bank on January 1, 2015, made substantial changes to these previous standards. Among other things, the regulations (i) introduced a capital requirement known as CET1, (ii) stated that Tier 1 capital consists of CET1 and “Additional Tier 1 capital” instruments meeting certain requirements, (iii) defined CET1 to require that most deductions and adjustments to regulatory capital measures be made to CET1 and not to the other components of capital and (iv) revised the scope of the deductions and adjustments from capital as compared to regulations that previously applied to the Company and other banking organizations.
The 2015 Capital Rules also established the following minimum capital ratios: 4.5 percent CET1 to risk-weighted assets; 6.0 percent Tier 1 capital to risk-weighted assets; 8.0 percent total capital to risk-weighted assets; and 4.0 percent Tier 1
leverage ratio to average consolidated assets. In addition, the 2015 Capital Rules also introduced a minimum “capital conservation buffer” equal to 2.5% of an organization’s total risk-weighted assets, which exists in addition to these required minimum CET1, Tier 1 and total capital ratios. The “capital conservation buffer,” which must consist entirely of CET1, is designed to absorb losses during periods of economic stress. The 2015 Capital Rules provide for a number of deductions from and adjustments to CET1, which include the requirement that mortgage servicing rights, deferred tax assets arising from temporary differences that could not be realized through net operating loss carrybacks and significant investments in non-consolidated financial entities be deducted from CET1 to the extent that any one such category exceeds 10% of CET1 or all such categories in the aggregate exceed 15% of CET1.
Certain regulatory capital ratios of the Company and Southside Bank, as of December 31, 2020, are shown in the following table.
| | | | | | | | | | | | | | | | | | | | | | | |
| Capital Adequacy Ratios |
| Regulatory
Minimums | | Regulatory
Minimums
to be Well
Capitalized | | Southside
Bancshares,
Inc. | | Southside
Bank |
| Common equity tier 1 risk-based capital ratio | 4.50 | % | | 6.50 | % | | 14.68 | % | | 18.41 | % |
| Tier 1 risk-based capital ratio | 6.00 | % | | 8.00 | % | | 16.08 | % | | 18.41 | % |
| Total risk-based capital ratio | 8.00 | % | | 10.00 | % | | 21.78 | % | | 19.38 | % |
| Leverage ratio | 4.00 | % | | 5.00 | % | | 9.81 | % | | 11.24 | % |
Under the previous capital framework, the effects of AOCI items included in shareholders’ equity under U.S. GAAP were excluded for the purposes of determining capital ratios. However, the effects of certain AOCI items are not excluded under the 2015 Capital Rules. The 2015 Capital Rules permitted most banking organizations, including the Company and Southside Bank, to make a one-time permanent election on the institution’s first call report filed after January 1, 2015 to continue to exclude these items, which Southside Bank did in its March 31, 2015 call report.
Under the 2015 Capital Rules, certain hybrid securities, such as trust preferred securities, do not qualify as Tier 1 capital. However, for bank holding companies like Southside that had assets of less than $15 billion as of December 31, 2009, trust preferred securities issued prior to May 19, 2010 can be treated as Tier 1 capital to the extent that they do not exceed 25% of Tier 1 capital after the application of capital deductions and adjustments.
On December 21, 2018, federal banking agencies issued a joint final rule to revise their regulatory capital rules to (i) address the upcoming implementation of the CECL accounting standard under GAAP; (ii) provide an optional three-year phase-in period for the day-one adverse regulatory capital effects that banking organizations are expected to experience upon adopting CECL; and (iii) require the use of CECL in stress tests beginning with the 2020 capital planning and stress testing cycle for banking organizations (except for those non-SEC reporting companies that have not then adopted CECL). In June 2016, the FASB issued ASU 2016-13, “Financial Instruments - Credit Losses (Topic 326): Measurement of Credit Losses on Financial Instruments,” which introduced CECL as the methodology to replace the current “incurred loss” methodology for financial assets measured at amortized cost and changed the approaches for recognizing and recording credit losses on AFS debt securities and PCI financial assets. Under the incurred loss methodology, credit losses are recognized only when the losses are probable or have been incurred; under CECL, companies are required to recognize the full amount of expected credit losses for the lifetime of the financial assets, based on historical experience, current conditions and reasonable and supportable forecasts. This change will result in earlier recognition of credit losses that the Company deems expected but not yet probable. The 2018 Capital Rules became effective on April 1, 2019; for SEC reporting companies with December 31 fiscal-year ends, the CECL standard became effective as of January 1, 2020, and was required to be applied to financial statements and regulatory reports (i.e., Call Reports) beginning with the quarter that ended March 31, 2020. However, on March 27, 2020 the federal bank agencies announced a final rule that permits banks that have adopted the CECL standard to defer recognition of the estimated impact of credit losses on regulatory capital by permitting a three-year “phase-in” approach commencing in 2022.
On November 13, 2019, the federal banking agencies jointly issued a final rule to simplify the regulatory capital requirements for eligible community banks and holding companies with less than $10 billion in consolidated assets that opt into the CBLR framework, as required by Section 201 of the Economic Growth, Relief and Consumer Protection Act (the “Regulatory Relief Act”). Under the final rule, effective January 1, 2020, a “qualifying community banking organization” is one that has (i) less than $10 billion in total consolidated assets; (ii) a leverage ratio greater than 9%; (iii) off-balance sheet exposures of 25% or less of total consolidated assets; and (iv) trading assets and liabilities of 5% or less of total consolidated assets. Qualifying banks that meet these thresholds, and elect the CBLR framework, would be exempt from the agencies’ current capital framework, including the risk-based capital requirements and capital conservation buffer imposed under Basel III, and would be deemed well-capitalized under the agencies’ prompt corrective action regulations. The CBLR rules were
subsequently amended by the federal banking agencies in April 2020, and again in October 2020, in response to the COVID-19 pandemic, to require a qualifying community banking organization to maintain a leverage ratio equal to or greater than 8% beginning in the second quarter of 2020, 8.5% throughout 2021, and greater than 9% thereafter.
In addition, reflecting the importance that regulators place on managing capital and other risks, in May 2012 the banking agencies also issued guidance on stress testing for banking organizations with more than $10 billion in total consolidated assets. This guidance outlines four “high-level” principles for stress testing practices that should be a part of a banking organization’s stress-testing framework. Specifically, the guidance calls for the framework to (i) include activities and exercises that are tailored to and sufficiently capture the banking organization’s exposures, activities and risks; (ii) employ multiple conceptually sound stress testing activities and approaches; (iii) be forward-looking and flexible; and (iv) be clear, actionable, well-supported and used in the decision-making process. Moreover, the federal bank regulators have issued a series of guidance and rulemakings applicable to “large banks.” While many of these do not currently apply to us due to our asset size, these issuances could impact industry capital standards and practices in many, potentially unforeseeable, ways. For example, as a result of the 2020 stress tests conducted by the Federal Reserve on large banks (i.e., those with total assets greater than $50 billion) during the COVID-19 pandemic, the agency imposed temporary restrictions on the ability of large banks to issue shareholder dividends or engage in share repurchases.
Source of Strength. Federal Reserve policy and regulation require a bank holding company to act as a source of financial and managerial strength to its subsidiary banks. As a result, a bank holding company may be required to contribute additional capital to its subsidiaries in the form of capital notes or other instruments which qualify as capital under regulatory rules. Any loans from the holding company to its subsidiary banks likely will be unsecured and subordinated to the bank’s depositors and perhaps to other creditors of the bank. Notably, the Dodd-Frank Act codified the Federal Reserve’s “source of strength” policy; this statutory change became effective July 21, 2011. In addition to the foregoing requirements, the Dodd-Frank Act’s provisions authorize the Federal Reserve and other federal banking regulators to require a company that directly or indirectly controls a bank to submit reports that are designed both to assess the ability of such company to comply with its “source of strength” obligations and to enforce the company’s compliance with these obligations. As of December 31, 2020, the Federal Reserve and other federal banking regulators have not issued rules implementing this requirement.
In addition, if a bank holding company enters into bankruptcy or becomes subject to the orderly liquidation process established by the Dodd-Frank Act, any commitment by the bank holding company to a federal bank regulatory agency to maintain the capital of a subsidiary bank would be assumed by the bankruptcy trustee or the FDIC, as appropriate, and entitled to a priority of payment. Furthermore, the FDIC provides that any insured depository institution generally will be liable for any loss incurred by the FDIC in connection with the default of, or any assistance provided by the FDIC to, a commonly controlled insured depository institution. Southside Bank is an FDIC-insured depository institution and thus subject to these requirements. See also Bank Regulation - Prompt Corrective Action and Undercapitalization.
Dividends. The principal source of our liquidity at the parent company level is dividends from Southside Bank. Southside Bank is subject to federal and state restrictions on its ability to pay dividends to the Company. We must pay essentially all of our operating expenses from funds we receive from Southside Bank. Therefore, shareholders may receive dividends from us only to the extent that funds are available after payment of our operating expenses. Consistent with its “source of strength” policy, the Federal Reserve discourages bank holding companies from paying dividends except out of operating earnings and prefers that dividends be paid only if, after the payment, the prospective rate of earnings retention appears consistent with the bank holding company’s capital needs, asset quality and overall financial condition.
The ability of the Company or Southside Bank to pay dividends, and the contents of their respective dividend policies, is subject to changes of law, as well as possible supervisory restrictions imposed by the TDB, FDIC or Federal Reserve. See also Bank Regulation - Dividends for additional information.
Change in Control. Subject to certain exceptions, under the BHCA and the CBCA, and the regulations promulgated thereunder, persons who intend to acquire direct or indirect control of a depository institution or a bank holding company are required to obtain the approval of the Federal Reserve prior to acquiring control. With respect to the Company, “control” is conclusively presumed to exist where an acquiring party directly or indirectly owns, controls or has the power to vote at least 25% of our voting securities. Under the Federal Reserve’s CBCA regulations, a rebuttable presumption of control would arise with respect to an acquisition where, after the transaction, the acquiring party owns, controls or has the power to vote at least 10% (but less than 25%) of our voting securities. Under its new “Tiered Presumptions” framework, the Federal Reserve will consider the nature and extent of “controlling influences” that exist between a party and a banking organization at different levels of voting security ownership (i.e., between 0% and 4.99%, or between 5% and 9.99%). The Federal Reserve will presume that no control exists when a company owns 9.99% or less of another company, and no other indicators of control exists.
Acquisitions. The BHCA provides that a bank holding company must obtain the prior approval of the Federal Reserve (i) for the acquisition of more than five percent of the voting stock in any bank or bank holding company, (ii) for the acquisition
of substantially all the assets of any bank or bank holding company, or (iii) in order to merge or consolidate with another bank holding company.
Regulatory Examination. Federal and state banking agencies require the Company and Southside Bank to prepare annual reports on financial condition and to conduct an annual audit of financial affairs in compliance with minimum standards and procedures. Southside Bank, and in some cases the Company and any nonbank affiliates, must undergo regular on-site examinations by the appropriate regulatory agency, which will examine for adherence to a range of legal and regulatory compliance responsibilities. A bank regulator conducting an examination has complete access to the books and records of the examined institution, and the results of the examination are confidential. The cost of examinations may be assessed against the examined organization as the agency deems necessary or appropriate. The FDIC has developed a method for insured depository institutions to provide supplemental disclosure of the estimated fair value of assets and liabilities, to the extent feasible and practicable, in any balance sheet, financial statement, report of condition or any other report. On December 22, 2017, Congress enacted the Tax Act which had immediate accounting and reporting implications for the Company and Southside Bank. Specifically, the lower corporate tax rate was accompanied by changes to how the Company and the Bank are required to calculate their deferred tax assets and deferred tax liabilities which are disclosed on their financial statements and regulatory reports, and also impacted their respective capital calculations under the Basel III Capital Rules, which are discussed above in “Holding Company Regulation - Capital Adequacy.”
Enforcement Authority. The Federal Reserve has broad enforcement powers over bank holding companies and their nonbank subsidiaries, as well as “institution-affiliated parties,” including management, employees, agents, independent contractors and consultants, such as attorneys and accountants and others who participate in the conduct of the institution’s affairs, and has authority to prohibit activities that represent unsafe or unsound banking practices or constitute knowing or reckless violations of laws or regulations. These powers may be exercised through the issuance of cease and desist orders, civil money penalties or other actions. Civil money penalties can be as high as $1,000,000 for each day the activity continues and criminal penalties for some financial institution crimes may include imprisonment for 20 years. Regulators have flexibility to commence enforcement actions against institutions and institution-affiliated parties, and the FDIC has the authority to terminate deposit insurance. When issued by a banking agency, cease and desist and similar orders may, among other things, require affirmative action to correct any harm resulting from a violation or practice, including restitution, reimbursement, indemnifications or guarantees against loss. A financial institution may also be ordered to restrict its growth, dispose of certain assets, rescind agreements or contracts, or take other actions determined to be appropriate by the ordering agency. The federal banking agencies also may remove a director or officer from an insured depository institution (or bar them from the industry) if a violation is willful or reckless.
Bank Regulation
Southside Bank is a Texas-chartered commercial bank, the deposits of which are insured up to the applicable limits by the DIF of the FDIC. Southside Bank is not a member of the Federal Reserve. The Bank is subject to extensive regulation, examination and supervision by the TDB, as its chartering authority, and by the FDIC, as its primary federal regulator and deposit insurer. In addition, the Bureau could participate in examinations of the Bank (as described above) regarding the Bank’s offering of consumer financial products and services. The federal and state laws applicable to banks regulate, among other things, the scope of their business and investments, lending and deposit-taking activities, borrowings, maintenance of retained earnings and reserve accounts, distribution of earnings and payment of dividends.
Permitted Activities and Investments. Under the FDIA, the activities and investments of state nonmember banks are generally limited to those permissible for national banks, notwithstanding state law. With FDIC approval, a state nonmember bank may engage in activities not permissible for a national bank if the FDIC determines that the activity does not pose a significant risk to the DIF and that the bank meets its minimum capital requirements. Similarly, under Texas law, a state bank may engage in those activities permissible for national banks domiciled in Texas. The TDB may permit a Texas state bank to engage in additional activities so long as the performance of the activity by the bank would not adversely affect the safety and soundness of the bank.
On December 10, 2013, federal regulators, including the Federal Reserve and the FDIC, issued final rules to implement Section 619 of the Dodd-Frank Act, known as the “Volcker Rule,” to prohibit insured depository institutions, such as Southside Bank, and their affiliates, such as the Company, from proprietary trading and acquiring certain interests in hedge or private equity funds. The final rules contain certain exemptions from the prohibition and permit the retention of certain ownership interests.
Insured depository institutions were generally required to conform their activities and investments to the requirements by July 21, 2015. The Federal Reserve extended the conformance deadline twice (first to July 21, 2016, and again to July 21, 2017) for certain legacy “covered funds” activities and investments in place before December 31, 2013. On July 22, 2019, the federal banking agencies amended the Volcker Rule to exempt from coverage those banks with (i) total consolidated assets equal to $10 billion or less; and (ii) total trading assets and liabilities equal to 5 percent or less of total consolidated assets. On August 20, 2019, the federal regulators approved additional amendments to the Volcker Rule intended to simplify compliance with the Volcker Rule, and further limit the scope of the Rule’s applicability. These new amendments include: (i) more limited definition of “trading account”; (ii) additional exclusions from the definition of “proprietary trading”; and (iii) streamlining the existing exclusions and exemptions for various banking entities. These amendments became effective on January 1, 2020, with compliance required by January 1, 2021. Most recently, on July 31, 2020, the federal banking agencies, along with the U.S. Commodity Futures Trading Commission and the U.S. SEC amended the Volker Rule further by, among other changes, creating new exclusions from the definition of “covered fund” for (i) credit funds; (ii) certain venture capital funds; and (iii) family wealth management vehicles. These changes became effective on October 1, 2020.
Brokered Deposits. Southside Bank also may be restricted in its ability to accept, renew or roll over brokered deposits, depending on its capital classification. Only “well-capitalized” banks are permitted to accept, renew or roll over brokered deposits. The FDIC may, on a case-by-case basis, permit banks that are adequately capitalized to accept brokered deposits if the FDIC determines that acceptance of such deposits would not constitute an unsafe or unsound banking practice with respect to the bank. Undercapitalized banks generally may not accept, renew or roll over brokered deposits. On December 15, 2020, the FDIC approved a final rule, effective April 1, 2021, setting forth a new framework for determining when deposits accepted by an insured depository institution qualify as “brokered deposits.” The new rule also clarifies when a third party may qualify as a “deposit broker,” and identifies several business relationships between banks and third parties that are exempt from the brokered deposit restrictions.
Loans to One Borrower. Under Texas law, without the approval of the TDB and subject to certain limited exceptions for loans secured by livestock, stored agricultural products, or readily marketable collateral, the maximum aggregate amount of loans that Southside Bank is permitted to make to any one borrower is 25% of Tier 1 capital.
Insider Loans. Under Regulation O of the Federal Reserve, as made applicable to state nonmember banks by section 18(j)(2) of the FDIA, Southside Bank is subject to quantitative restrictions on extensions of credit to its executive officers and directors, the executive officers and directors of the Company, any owner of 10% or more of its stock or the stock of Southside Bancshares, Inc. and certain entities affiliated with any such persons. In general, any such extensions of credit must (i) not exceed certain dollar limitations, (ii) be made on substantially the same terms, including interest rates and collateral, as those prevailing at the time for comparable transactions with third parties and (iii) not involve more than the normal risk of repayment or present other unfavorable features. Additional restrictions are imposed on extensions of credit to executive officers. Certain extensions of credit also require the approval of a bank’s board of directors. As a result of the 2018 Capital Rules, on November 13, 2019, the Federal Reserve adopted conforming changes to its definition of “unimpaired capital and impaired surplus” under Regulation O, which impact the calculation of dollar limits on loans subject to the regulation. Furthermore, on
December 22, 2020, the federal banking agencies issued an Interagency Statement clarifying that they will not apply the quantitative and qualitative restrictions of Regulation O to investors in large funds (e.g., mutual funds) that may hold an investment position in banks, and therefore could qualify as an “insider” under current Regulation O definitions.
Deposit Insurance and Assessments. The deposits of Southside Bank are insured by the DIF of the FDIC, up to the applicable limits established by law and are subject to the deposit insurance premium assessments of the DIF. The Dodd-Frank Act amended the statutory regime governing the DIF. Among other things, the Dodd-Frank Act established a minimum DRR of 1.35 percent of estimated insured deposits (which the FDIC has set at 2.0 percent each year since 2010), required that the fund reserve ratio reach 1.35 percent by September 30, 2020 and directed the FDIC to amend its regulations to redefine the assessment base used for calculating deposit insurance assessments. Specifically, the Dodd-Frank Act requires the assessment base to be an amount equal to the average consolidated total assets of the insured depository institution during the assessment period, minus the sum of the average tangible equity of the insured depository institution during the assessment period and an amount the FDIC determines is necessary to establish assessments consistent with the risk-based assessment system found in the FDIA.
On September 30, 2019, the FDIC announced that the DRR reached 1.41 percent, exceeding the required 1.35 percent imposed by the Dodd-Frank Act. As mandated by the Dodd-Frank Act, as a result of the DRR exceeding 1.38 percent, small banks like Southside Bank (i.e., banks with less than $10 billion in total consolidated assets) began receiving credits against their quarterly deposit insurance assessments commencing with the second quarterly assessment period of 2019 (ending June 30, 2019). Small banks were to receive these credits for a total of four quarterly assessment periods. On June 30, 2020, the DRR fell to 1.30% as a result of significantly increased deposit growth caused by an inflow to insured banks of more than $1 trillion in deposits (considered by the FDIC to be the result of the COVID-19 pandemic). On September 15, 2020, the FDIC waived the requirement that the DRR be at least 1.35% for the agency to remit remaining assessment credits, and on September 30, 2020, all such remaining small bank credits were refunded.
Furthermore, on February 7, 2011, the FDIC issued a final rule changing its assessment system from one based on domestic deposits to one based on the average consolidated total assets of a bank minus its average tangible equity during each quarter. This rule modified two adjustments added to the risk-based pricing system in 2009 (an unsecured debt adjustment and a brokered deposit adjustment), discontinued a third adjustment added in 2009 (the secured liability adjustment), and added an adjustment for long-term debt held by an insured depository institution where the debt is issued by another insured depository institution. Under these revisions to the DIF rules, the total base assessment rates will vary depending on the DIF reserve ratio. On April 26, 2016, the FDIC issued a final rule to refine the deposit insurance assessment system for small insured depository institutions that have been federally insured for at least five years. The rule, which became effective on July 1, 2016, revised the financial ratios method, updated the financial measures used and eliminated risk categories for such banks.
Capital Adequacy.
See Holding Company Regulation - Capital Adequacy.
Prompt Corrective Action and Undercapitalization. The FDICIA established a system of prompt corrective action to resolve the problems of undercapitalized insured depository institutions. Under this system, the federal banking regulators are required to rate insured depository institutions based on five capital categories as described below. The federal banking regulators are also required to take mandatory supervisory actions and are authorized to take other discretionary actions, with respect to insured depository institutions in the three undercapitalized categories, the severity of which will depend upon the capital category in which the insured depository institution is assigned. Generally, subject to a narrow exception, the FDICIA requires the banking regulator to appoint a receiver or conservator for an insured depository institution that is critically undercapitalized. The federal banking agencies have specified by regulation the relevant capital level for each category. The thresholds for each of these categories were revised pursuant to the Basel III Capital Rules, which are discussed above in “Holding Company Regulation - Capital Adequacy.” These revised categories started to apply to Southside Bank on January 1, 2015.
Under the regulations, all insured depository institutions are assigned to one of the following capital categories:
•Well Capitalized - The insured depository institution exceeds the required minimum level for each relevant capital measure. Under the 2015 Capital Rules, a well-capitalized insured depository institution is one (1) having a total risk-based capital ratio of 10 percent or greater, (2) having a Tier 1 risk-based capital ratio of 8 percent or greater, (3) having a CET1 capital ratio of 6.5 percent or greater, (4) having a leverage capital ratio of 5 percent or greater and (5) that is not subject to any order or written directive to meet and maintain a specific capital level for any capital measure.
•Adequately Capitalized - The insured depository institution meets the required minimum level for each relevant capital measure. Under the 2015 Capital Rules, an adequately-capitalized depository institution is one having (1) a
total risk based capital ratio of 8 percent or more, (2) a Tier 1 capital ratio of 6 percent or more, (3) a CET1 capital ratio of 4.5 percent or more and (4) a leverage ratio of 4 percent or more.
•Undercapitalized - The insured depository institution fails to meet the required minimum level for any relevant capital measure. Under the 2015 Capital Rules, an undercapitalized depository institution is one having (1) a total capital ratio of less than 8 percent, (2) a Tier 1 capital ratio of less than 6 percent, (3) a CET1 capital ratio of less than 4.5 percent or (4) a leverage ratio of less than 4 percent.
•Significantly Undercapitalized - The insured depository institution is significantly below the required minimum level for any relevant capital measure. Under the 2015 Capital Rules, a significantly undercapitalized institution is one having (1) a total risk-based capital ratio of less than 6 percent (2) a Tier 1 capital ratio of less than 4 percent, (3) a CET1 ratio of less than 3 percent or (4) a leverage capital ratio of less than 3 percent.
•Critically Undercapitalized - The insured depository institution fails to meet a critical capital level set by the appropriate federal banking agency. A critically undercapitalized institution is one having a ratio of tangible equity to total assets that is equal to or less than 2 percent.
The prompt corrective action regulations permit the appropriate federal banking regulator to downgrade an institution to the next lower category if the regulator determines after notice and opportunity for hearing or response that (1) the institution is in an unsafe or unsound condition or (2) that the institution has received and not corrected a less-than-satisfactory rating for any of the categories of asset quality, management, earnings or liquidity in its most recent examination. Supervisory actions by the appropriate federal banking regulator depend upon an institution’s classification within the five categories. Our management believes that we and our Bank subsidiary have the requisite capital levels to qualify as well-capitalized institutions under the FDICIA regulations.
If an institution fails to remain well capitalized, it will be subject to a variety of enforcement remedies that increase as the capital condition worsens. For instance, the FDICIA generally prohibits a depository institution from making any capital distribution, including payment of a dividend, or paying any management fee to its holding company if the depository institution would thereafter be undercapitalized as a result. Undercapitalized depository institutions are subject to restrictions on borrowing from the Federal Reserve System. In addition, adequately capitalized depository institutions may not accept brokered deposits absent a waiver from the FDIC and undercapitalized depository institutions may not accept brokered deposits, are subject to growth limitations and are required to submit capital restoration plans for regulatory approval. A depository institution’s holding company must guarantee any required capital restoration plan, up to an amount equal to the lesser of 5 percent of the depository institution’s assets at the time it becomes undercapitalized or the amount of the capital deficiency when the institution fails to comply with the plan. Federal banking agencies may not accept a capital plan without determining, among other things, that the plan is based on realistic assumptions and is likely to succeed in restoring the depository institution’s capital. If a depository institution fails to submit an acceptable plan, it is treated as if it is significantly undercapitalized.
Significantly undercapitalized depository institutions may be subject to a number of requirements and restrictions, including orders to sell sufficient voting stock to become adequately capitalized, requirements to reduce total assets and cessation of receipt of deposits from correspondent banks. Critically undercapitalized depository institutions are subject to appointment of a receiver or conservator.
In addition to the “prompt corrective action” directives, failure to meet capital guidelines may subject a banking organization to a variety of other enforcement remedies, including additional substantial restrictions on its operations and activities, termination of deposit insurance by the FDIC and, under certain conditions, the appointment of a conservator or receiver.
Standards for Safety and Soundness. The FDIA also requires the federal banking regulatory agencies to prescribe, by regulation or guideline, operational and managerial standards for all insured depository institutions relating to: (i) internal controls; (ii) information systems and internal audit systems; (iii) loan documentation; (iv) credit underwriting; (v) interest rate risk exposure; and (vi) asset quality. The agencies also must prescribe standards for asset quality, earnings and stock valuation, as well as standards for compensation, fees and benefits. The federal banking agencies have adopted regulations and Guidelines to implement these required standards. The Guidelines set forth the safety and soundness standards that the federal banking agencies use to identify and address problems at insured depository institutions before capital becomes impaired. Under the regulations, if the FDIC determines that Southside Bank fails to meet any standards prescribed by the Guidelines, it may require Southside Bank to submit an acceptable plan to achieve compliance, consistent with deadlines for the submission and review of such safety and soundness compliance plans. Notably, in June 2020, the federal financial regulators issued the Interagency Examiner Guidance for Assessing Safety and Soundness Considering the Effect of the COVID-19 Pandemic on Institutions. The guidance directs bank examiners to focus specifically on how challenges created by the COVID-19 pandemic are being addressed by the institution, particularly with respect to credit risk and asset quality.
The Dodd-Frank Act requires federal banking regulators to issue regulations or guidelines to prohibit incentive-based compensation arrangements that encourage inappropriate risk taking by providing excessive compensation or that may lead to material loss at certain financial institutions with $1 billion or more in assets. A joint proposed rule was published in the Federal Register on April 14, 2011, and a second joint proposed rule was published on June 10, 2016; however, as of December 31, 2020, regulators have yet to issue a final rule (or further guidance) on the topic.
In addition, on May 8, 2020, the federal banking regulators published Interagency Guidance on Risk Systems, applicable to all regulated depository institutions regardless of asset size, to be used in creating an appropriate “credit risk review system” consistent with the existing Guidelines. The new guidance encourages banks to consider (i) the qualification of the bank’s reviewing personnel; (ii) the frequency, scope and depth of credit reviews; and (iii) appropriate internal distribution of credit review results.
Dividends. All dividends paid by Southside Bank are paid to the Company, as the sole shareholder of Southside Bank. The ability of Southside Bank, as a Texas state bank, to pay dividends is restricted under federal and state law and regulations. As an initial matter, the FDICIA and the regulations of the FDIC generally prohibit an insured depository institution from making a capital distribution (including payment of dividend) if, thereafter, the institution would not be at least adequately capitalized. Under Texas law, Southside Bank generally may not pay a dividend reducing its capital and surplus without the prior approval of the Texas Banking Commissioner. All dividends must be paid out of net profits then on hand, after deducting expenses, including losses and provisions for loan losses.
Southside Bank’s general dividend policy is to pay dividends at levels consistent with maintaining liquidity and preserving applicable capital ratios and servicing obligations. Southside Bank’s dividend policies are subject to the discretion of its board of directors and will depend upon such factors as future earnings, financial conditions, cash needs, capital adequacy, compliance with applicable statutory and regulatory requirements and general business conditions. The exact amount of future dividends paid by Southside Bank will be a function of its general profitability (which cannot be accurately estimated or assured), applicable tax rates in effect from year to year and the discretion of its board of directors.
Transactions with Affiliates. Southside Bank is subject to sections 23A and 23B of the FRA and the Federal Reserve’s Regulation W, as made applicable to state nonmember banks by section 18(j) of the FDIA. Sections 23A and 23B of the FRA restrict a bank’s ability to engage in certain transactions with its affiliates. An affiliate of a bank is any company or entity that controls, is controlled by or is under common control with the bank. In a holding company context, the parent bank holding company and any companies controlled by such parent bank holding company are generally affiliates of the bank.
Specifically, section 23A places limits on the amount of “covered transactions,” between a bank and its affiliates, including loans or extensions of credit to, investments in or certain other transactions with, affiliates. It also limits the amount of any advances to third parties that are collateralized by the securities or obligations of affiliates. The aggregate of all covered transactions is limited to 10 percent of the bank’s capital and surplus for any one affiliate and 20 percent for all affiliates. Additionally, within the foregoing limitations, each covered transaction must meet specified collateral requirements ranging from 100 to 130 percent of the loan amount, depending on the type of collateral. Further, banks are prohibited from purchasing low quality assets from an affiliate. Section 608 of the Dodd-Frank Act broadened the definition of “covered transactions” to include derivative transactions and the borrowing or lending of securities if the transaction will cause a bank to have credit exposure to an affiliate. The revised definition also includes the acceptance of debt obligations of an affiliate as collateral for a loan or extension of credit to a third party. Furthermore, reverse repurchase transactions are viewed as extensions of credit (instead of asset purchases) and thus become subject to collateral requirements.
Section 23B, among other things, prohibits a bank from engaging in certain transactions with affiliates unless the transactions are on terms substantially the same, or at least as favorable to the bank, as those prevailing at the time for comparable transactions with non-affiliated companies. Except for limitations on low quality asset purchases and transactions that are deemed to be unsafe or unsound, Regulation W generally excludes affiliated depository institutions from treatment as affiliates.
Anti-Tying Regulations. Under the BHCA and the Federal Reserve’s regulations, a bank is prohibited from engaging in certain tying or reciprocity arrangements with its customers. In general, a bank may not extend credit, lease, sell property, or furnish any services or fix or vary the consideration for these products or services on the condition that either: (i) the customer obtain or provide some additional credit, property, or services from or to the bank, the bank holding company or subsidiaries thereof or (ii) the customer not obtain credit, property, or service from a competitor, except to the extent reasonable conditions are imposed to assure the soundness of the credit extended. A bank may, however, offer combined-balance products and may otherwise offer more favorable terms if a customer obtains two or more traditional bank products. Also, certain foreign transactions are exempt from the general rule.
Community Reinvestment Act. Under the CRA, Southside Bank has a continuing and affirmative obligation, consistent with safe and sound banking practices, to help meet the needs of our entire community, including low- and moderate-income
neighborhoods. The CRA does not establish specific lending requirements or programs for banks nor does it limit a bank’s discretion to develop the types of products and services that it believes are best suited to its particular community.
On a periodic basis, the FDIC is charged with preparing a written evaluation of our record of meeting the credit needs of the entire community and assigning a rating - outstanding, satisfactory, needs to improve or substantial noncompliance. Banks are rated based on their actual performance in meeting community credit needs. The FDIC will take that rating into account in its evaluation of any application made by the bank for, among other things, approval of the acquisition or establishment of a branch or other deposit facility, an office relocation, a merger or the acquisition of shares of capital stock of another financial institution. A bank’s CRA rating may be used as the basis to deny or condition an application. In addition, as discussed above, a bank holding company may not become a financial holding company unless each of its subsidiary banks has a CRA rating of at least “satisfactory.” As of August 6, 2018, the most recent exam date, Southside Bank has a CRA rating of “outstanding.”
On March 19, 2020, the federal banking agencies issued a Joint Statement on CRA Considerations for Activities in Response to COVID-19 stressing that the agencies will give favorable consideration to financial institutions offering retail banking and lending activities tailored to the pandemic, both within a financial institution’s CRA assessment area, as well as broader statewide areas.
Branch Banking. Pursuant to the Texas Finance Code, all banks located in Texas are authorized to branch statewide. Accordingly, a bank located anywhere in Texas has the ability, subject to regulatory approval, to establish branch facilities near any of our facilities and within our market area. If other banks were to establish branch facilities near our facilities, it is uncertain whether these branch facilities would have a material adverse effect on our business.
The Dodd-Frank Act substantially amended the legal framework that had previously governed interstate branching activities. Formerly, under the Riegle-Neal Interstate Banking and Branching Efficiency Act of 1994, a bank’s ability to branch into a particular state was largely dependent upon whether the state “opted in” to de novo interstate branching. Many states did not “opt in,” which resulted in branching restrictions in those states. The Dodd-Frank Act removed the “opt-in” requirement, and banks are now permitted to engage in de novo branching outside of their home states, provided that the laws of the target state permit banks chartered in that state to branch within that state. Accordingly, de novo interstate branching by Southside Bank is subject to these standards. All branching in which Southside Bank may engage remains subject to regulatory approval and adherence to applicable legal and regulatory requirements.
Consumer Protection Regulation. The activities of Southside Bank are subject to a variety of statutes and regulations designed to protect consumers. Interest and other charges collected or contracted for by the banks are subject to state usury laws and federal laws concerning interest rates. Loan operations are also subject to federal laws and regulations applicable to credit transactions, such as:
•the Truth in Lending Act and Regulation Z, governing disclosures of credit terms to consumer borrowers;
•the Home Mortgage Disclosure Act and Regulation C, requiring financial institutions to provide information to enable the public and public officials to determine whether a financial institution is fulfilling its obligation to help meet the housing needs of the community it serves;
•the Equal Credit Opportunity Act and Regulation B, prohibiting discrimination on the basis of race, creed or other prohibited factors in extending credit;
•the Fair Credit Reporting Act and Regulation V, governing the use and provision of information to consumer reporting agencies;
•the Fair Debt Collection Act, governing the manner in which consumer debts may be collected by collection agencies; and
•the guidance of the various federal agencies charged with the responsibility of implementing such federal laws.
Deposit and other operations also are subject to:
•the Truth in Savings Act and Regulation DD, governing disclosure of deposit account terms to consumers;
•the Right to Financial Privacy Act, which imposes a duty to maintain confidentiality of consumer financial records and prescribes procedures for complying with administrative subpoenas of financial records; and
•the Electronic Fund Transfer Act and Regulation E, which governs automatic deposits to and withdrawals from deposit accounts and customers’ rights and liabilities arising from the use of ATMs and other electronic banking services, which the Bureau has expanded to include a new compliance regime that governs consumer-initiated cross border electronic transfers.
The foregoing laws and regulations are amended periodically, and several have recently changed as a result of the COVID-19 pandemic. For example: (i) on October 26, 2020, the Bureau issued a final rule that amended the definition of “qualified mortgage loan” to expand the number of mortgage loans that will be exempted from the “ability to repay” consideration; (ii) on December 22, 2020, the Bureau amended the asset-size threshold under Regulation Z for purposes of determining when a creditor can be exempted from the requirement to establish an escrow account for higher-price mortgages; and (iii) on July 21, 2020, amended various provisions under Regulation E related to disclosure requirements for international money transfers.
In addition, in direct response to the COVID-19 pandemic, the federal banking agencies have published numerous statements intended to encourage the continued availability of bank products and services. For example, on March 26, 2020, the federal agencies issued a joint statement encouraging banks (i) to offer small dollar loans in response to the pandemic; and (ii) work with borrowers who may have difficulty repaying debt obligations as a result of COVID-19. In addition, the Bureau has delayed the required filing by banks of reports on consumer lending activities and has stated it will take into account during examinations any “good faith” efforts of banks to assist distressed consumers during the pandemic. Most notably, on March 27, 2020, the CARES Act was enacted which, among other relief measures, provides a forbearance option for borrowers with federally-backed mortgage loans. The federal agencies and state financial regulators issued a joint policy statement on April 3, 2020, providing “regulatory flexibility” to mortgage lenders and servicers working with consumers adversely affected by COVID-19. A similar statement was issued on April 7, 2020, by the federal agencies encouraging banks to work with consumers on possible loan modification arrangements. The Bureau also issued an interpretive rule on April 29, 2020, clarifying that consumers can waive required waiting periods under TILA/RESPA, and Regulation Z rescission rules, so as to enable consumers to obtain mortgage credit more quickly.
The Bureau has also established a series of mechanisms to collect, track and make public consumer complaints, including complaints against individual financial institutions and is using this, and other information it has gathered, in connection with a variety of initiatives to address issues in markets for consumer financial products and services. The Bureau also has broad authority to prohibit unfair, deceptive and abusive acts and practices and to investigate and penalize financial institutions that violate this prohibition. In January 2020, the Bureau issued a policy statement clarifying how it will determine “abusiveness” in bank practices during examinations and enforcement actions.
We cannot predict the extent to which new or modified regulations focused on consumer financial protection, whether adopted by the TDB, the Bureau, or the federal banking agencies will have on our businesses. We are particularly unable to predict the duration of the COVID-19 pandemic, its long term impact on the Company, Southside Bank, or its customers, or whether the federal or state legislatures, federal banking agencies, or the TDB will adopt new laws intended to provide relief to borrowers adversely affected by the pandemic. Any such new laws may materially adversely affect our business, financial condition or results of operations.
Commercial Real Estate Lending. Lending operations that involve concentration of commercial real estate loans are subject to enhanced scrutiny by federal banking regulators. The regulators have issued guidance with respect to the risks posed by commercial real estate lending concentrations. Real estate loans generally include land development, construction loans, land and lot loans to individuals, loans secured by multi-family property and nonfarm nonresidential real property where the primary source of repayment is derived from rental income associated with the property. The guidance prescribes the following guidelines for examiners to help identify institutions that are potentially exposed to concentration risk and may warrant greater supervisory scrutiny:
•total reported loans for construction, land development and other land represent 100 percent or more of the institution’s total capital, or
•total commercial real estate loans represent 300 percent or more of the institution’s total capital and the outstanding balance of the institution’s commercial real estate loan portfolio has increased by 50 percent or more during the prior 36 months.
In October 2009, the federal banking agencies issued additional guidance on real estate lending that emphasizes these considerations.
In addition, the Dodd-Frank Act contains provisions that may impact our business by reducing the amount of our commercial real estate lending and increasing the cost of borrowing, including rules relating to risk retention of securitized assets. Section 941 of the Dodd-Frank Act requires, among other things, a loan originator or a securitizer of asset-backed securities to retain a percentage of the credit risk of securitized assets. The banking agencies have jointly issued a final rule to implement these requirements, which became effective on December 24, 2016 for classes of asset-backed securities other than residential mortgage-backed securitizations.
Anti-Money Laundering. Southside Bank is subject to the regulations of the FinCEN, a bureau of the U.S. Department of the Treasury, which implements the Bank Secrecy Act, as amended by the USA PATRIOT Act. The USA PATRIOT Act gives
the federal government the power to address terrorist threats through enhanced domestic security measures, expanded surveillance powers, increased information sharing and broadened anti-money laundering requirements. Title III of the USA PATRIOT Act includes measures intended to encourage information sharing among banks, regulatory agencies and law enforcement bodies. Further, certain provisions of Title III impose affirmative obligations on a broad range of financial institutions, including state-chartered banks like Southside Bank.
The USA PATRIOT Act and the related FinCEN regulations impose certain requirements with respect to financial institutions, including the following:
•establishment of AML programs, including adoption of written procedures and an ongoing employee training program, designation of a compliance officer and auditing of the program;
•establishment of a program specifying procedures for obtaining information from customers seeking to open new accounts, including verifying the identity of customers within a reasonable period of time;
•establishment of enhanced due diligence policies, procedures and controls designed to detect and report money laundering, for financial institutions that administer, maintain or manage private bank accounts or correspondent accounts for non-U.S. persons;
•prohibitions on correspondent accounts for foreign shell banks and compliance with recordkeeping obligations with respect to correspondent accounts of foreign banks;
•filing of suspicious activities reports if a bank believes a customer may be violating U.S. laws and regulations; and
•requirements that bank regulators consider bank holding company or bank compliance in connection with merger or acquisition transactions.
In addition, FinCEN issued a final rule, which became effective on May 11, 2018, that requires covered financial institutions subject to certain exclusions and exemptions to identify and verify the identity of beneficial owners of legal entity customers. On August 13, 2020, the federal banking agencies issued a joint statement addressing the circumstances under which an agency will issue a mandatory “cease-and-desist” order to a regulated financial institution for failure to comply with its AML obligations, emphasizing that the “effectiveness” of a bank’s AML program will be the key factor in the agency's decision.
Bank regulators routinely examine institutions for compliance with these obligations and have been active in imposing cease and desist and other regulatory orders and money penalty sanctions against institutions found to be violating these obligations. In addition, the Federal Bureau of Investigation can send bank regulatory agencies lists of the names of persons suspected of involvement in terrorist activities. Southside Bank can be requested to search its records for any relationships or transactions with persons on those lists and be required to report any identified relationships or transactions.
OFAC. OFAC is responsible for helping to ensure that U.S. entities do not engage in transactions with certain prohibited parties, as defined by various Executive Orders and Acts of Congress. OFAC publishes, and routinely updates, lists of names of persons and organizations suspected of aiding, harboring or engaging in terrorist acts, including the Specially Designated Nationals List. If we find a name on any transaction, account or wire transfer that is on an OFAC list, we must undertake certain specified activities, which could include blocking or freezing the account or transaction requested, and we must notify the appropriate authorities.
Privacy and Data Security. Under federal law, financial institutions are generally prohibited from disclosing consumer information to non-affiliated third parties unless the consumer has been given the opportunity to object and has not objected to such disclosure. Financial institutions are further required to disclose their privacy policies to customers annually.
Accordingly, Southside Bank must disclose its privacy policy for collecting and protecting confidential customer information to consumers, permit consumers to “opt out” of having nonpublic customer information disclosed to non-affiliated third parties, with some exceptions, and allow customers to opt out of receiving marketing solicitations based on information about the customer received from another subsidiary. On October 28, 2014, the Bureau amended the annual privacy notice requirement to permit a financial institution to provide the annual privacy notice through posting the annual notice on its website if the financial institution meets certain conditions. On December 4, 2015, the GLBA was amended to provide additional circumstances under which a financial institution is not required to provide an annual notice. This amendment was incorporated by the Bureau into its implementing regulation, Regulation P, on August 10, 2018. To the extent state laws are more protective of consumer privacy, financial institutions must also comply with such state law privacy requirements.
In addition, federal and state banking agencies have prescribed standards for maintaining the security and confidentiality of consumer information. Southside Bank is subject to such standards, as well as standards for notifying consumers in the event of a security breach. Southside Bank is similarly required to have an information security program to safeguard the
confidentiality and security of customer information and to ensure proper disposal. Customers must be notified when unauthorized disclosure involves sensitive customer information that may be misused. Effective January 2, 2020, Texas state banks are required to notify the TDB of “cybersecurity incidents” within specified timeframes. On October 13, 2020, the TDB released an Industry Notice containing a mandatory “self-assessment” tool for mitigating the risks posed to bank systems by ransomware.
Regulatory Examination.
See Holding Company Regulation - Regulatory Examination.
Enforcement Authority. Southside Bank and its “institution-affiliated parties,” including management, employees, agents, independent contractors and consultants, such as attorneys and accountants and others who participate in the conduct of the institution’s affairs, are subject to potential civil and criminal penalties for violations of law, regulations or written orders of a government agency. Violations can include failure to timely file required reports, filing false or misleading information or submitting inaccurate reports. Civil penalties may be as high as $1,000,000 a day for such violations, and criminal penalties for some financial institution crimes may include imprisonment for 20 years. Regulators have flexibility to commence enforcement actions against institutions and institution-affiliated parties, and the FDIC has the authority to terminate deposit insurance. When issued by a banking agency, cease and desist orders may, among other things, require affirmative action to correct any harm resulting from a violation or practice, including restitution, reimbursement, indemnifications or guarantees against loss. A financial institution may also be ordered to restrict its growth, dispose of certain assets, rescind agreements or contracts, or take other actions determined to be appropriate by the ordering agency. The federal banking agencies also may remove a director or officer from an insured depository institution (or bar them from the industry) if a violation is willful or reckless.
Governmental Monetary Policies. The commercial banking business is affected not only by general economic conditions but also by the monetary policies of the Federal Reserve. Changes in the discount rate on member bank borrowings, control of borrowings, open market operations, the imposition of and changes in reserve requirements against member banks, deposits and assets of foreign branches, the imposition of and changes in reserve requirements against certain borrowings by banks and their affiliates and the placing of limits on interest rates which member banks may pay on time and savings deposits are some of the instruments of monetary policy available to the Federal Reserve. These monetary policies influence to a significant extent the overall growth of all bank loans, investments and deposits and the interest rates charged on loans or paid on time and savings deposits. In response to the financial crisis, the Federal Reserve established several innovative programs to stabilize certain financial institutions and to ensure the availability of credit, which the Federal Reserve has begun to modify as a result of improving economic conditions. The nature of future monetary policies and the effect of such policies on Southside Bank’s future business and earnings, therefore, cannot be predicted accurately.
Evolving Legislation and Regulatory Action. Proposals for new statutes and regulations are frequently circulated at both the federal and state levels, and may include wide-ranging changes to the structures, regulations and competitive relationships of financial institutions. During 2020, multiple new laws were enacted to address the impact of COVID-19 on the economy, financial institutions, businesses and consumers. The federal banking agencies also adopted many new rules, and published multiple statements, directed at managing the threats posed by the pandemic. We cannot predict whether new legislation or regulations will be enacted and, if enacted, the effect that it, or any regulations, would have on our business, financial condition or results of operations.
Other Regulatory Matters. The Company and its affiliates are subject to oversight by the SEC, the NASDAQ Stock Market, various state securities regulators and other regulatory authorities. The Company and its subsidiaries have from time to time received requests for information from regulatory authorities in various states, including state attorneys general, securities regulators and other regulatory authorities, concerning their business practices. Such requests are considered incidental to the normal conduct of business.
ITEM 1A. RISK FACTORS
In addition to the other information contained in this Form 10-K, you should carefully consider the risks described below, as well as the risk factors and uncertainties discussed in our other public filings with the SEC under the caption “Risk Factors” in evaluating us and our business and making or continuing an investment in our stock. Set forth below are the material risks and uncertainties that, if they were to occur, could materially and adversely affect our business, financial condition, results of operations and the trading price of our common stock. Additional risks and uncertainties that management is not aware of or focused on or that management currently deems immaterial may also impair our financial condition and business operations. The trading price of our securities could decline due to the materialization of any of these risks, and our shareholders may lose all or part of their investment. This Form 10-K also contains forward-looking statements that may not be realized as a result of certain factors, including, but not limited to, the risks described herein and in our other public filings with the SEC. Please refer to the section in this Form 10-K entitled “Special Cautionary Notice Regarding Forward-Looking Statements” for additional information regarding forward-looking statements.
RISKS RELATED TO OUR BUSINESS
The novel coronavirus, COVID-19, has adversely affected our business, financial condition, results of operations and our liquidity and will likely continue to for the foreseeable future.
The COVID-19 pandemic significantly impacted financial markets both globally and within the United States and has resulted in a global recession. The preventive measures taken to halt the spread of COVID-19 have significantly reduced commercial and consumer activity, financial transactions, increased unemployment and market instability and resulted in material decreases in oil and gas prices. The disruption of COVID-19 and the associated preventive measures is expected to disrupt the activities and business operations of our customers, as well as our own business operations, until the pandemic subsides.
The Federal Reserve lowered the primary credit rate by 50 and 100 basis points on March 3 and March 15, 2020, respectively, for a total of 150 basis points to 0.25 percent to mitigate the effects of the COVID-19 pandemic and to support the liquidity and stability of banking institutions as they serve the increased demand for credit. A long duration of reduced interest rates could negatively impact our net interest income, margin, cost of borrowing and future profitability and have a material adverse effect on our financial results. The continued spread of COVID-19, prolonged orders to social distance, prolonged closures of workplaces and other businesses and an increase in the unemployment rate within the communities we serve, may also impair the ability of our borrowers to make their monthly loan payments, which would result in increases in delinquencies, declining collateral values, defaults, foreclosures and other losses on our loans as well as impact our operations and business. A protracted COVID-19 pandemic could further negatively affect the carrying amount of our goodwill, indefinite-lived intangibles and long-lived assets and result in realized losses on our financial assets. In addition, a decline in consumer confidence also could result in lower loan originations and decreases in deposits. It is not possible to predict the extent, severity or duration of these conditions or when normal economic and operating conditions will resume.
In order to protect the health of our customers and employees, and to comply with applicable government restrictions, we have modified our business practices, including restricting employee travel, directing employees to work remotely, cancelling in-person meetings and implementing our business continuity plans and protocols to the extent necessary. In compliance with social distancing guidelines issued by federal, state and local governments, we initially closed all of our grocery store branches. As stay-at-home orders were issued by local governments in our market areas to combat the spread of the virus, we closed all traditional lobbies and wealth management and trust offices to walk-in customers, however, most of these traditional locations were offering certain services by appointment only. All other banking services were available to customers through our drive-thrus, ATMs/ITMs and automated telephone, internet and mobile banking products. After careful consideration and implementation of additional precautions, all locations were reopened on June 1, 2020. We have since adjusted select branch hours and openings, and we continue to closely monitor the COVID-19 situation. We may take further such actions that we determine are in the best interest of our employees, customers and communities or as may be required by government order. There is no assurance that these actions will be sufficient to successfully mitigate the risks presented by the pandemic or that our ability to operate will not be materially affected.
Additionally, COVID-19 could negatively affect our internal controls over financial reporting as many of our employees are required to work from home and therefore new processes, procedures, and controls could be required to respond to changes in our business environment. The increased reliance on remote access to information systems increases our exposure to potential cybersecurity breaches as well as the information systems of our vendors or business partners. Further, should any key employees become ill from the coronavirus and unable to work, the attention of the management team could be diverted.
Federal, state and local governments have mandated or encouraged financial services companies to make accommodations to borrowers and other customers affected by the COVID-19 pandemic. Legal and regulatory responses to concerns about the COVID-19 pandemic could result in additional regulation or restrictions affecting the conduct of our
business in the future. In addition to the potential effects from negative economic conditions noted above, we instituted a program to help customers financially impacted by COVID-19. This program includes waiving certain fees and monthly service charges and offering payment deferment and other loan relief, as appropriate, for customers impacted by COVID-19. Our liquidity could be negatively impacted if a significant number of customers apply and are approved for the deferral of payments. In addition, if these deferrals are not effective in mitigating the financial effect of COVID-19 on our customers, it may adversely affect our business and results of operations more substantially over a longer period of time. In addition, a significant amount of the loan growth we experienced during the second quarter of 2020 was a direct result of PPP loans. This loan growth is likely to end in the near-term. Furthermore, there has been litigation against banks related to their participation in the PPP and other government stimulus programs, the costs and effects of which could be material to us.
The potential effects of COVID-19 also could impact and heighten many of our risk factors noted below, including, but not limited to: risks associated with information technology and systems, including service interruptions or security breaches; disruptions in services provided by third parties; projections related to U.S. agency MBS prepayments; changes in our management team or other key personnel and our ability to hire or retain key personnel; the analytical and forecasting models we use to estimate our credit losses and to measure the fair value of our financial instruments; our balance sheet strategy; our processes for managing risk; general political or economic conditions in the U.S.; economic conditions in the State of Texas; funding to provide liquidity; the failure to maintain an effective system of disclosure controls and procedures, including internal control over financial reporting; the value of our goodwill and other intangible assets; declining crude oil prices; the impact of governmental regulation and supervision; the soundness of other financial institutions; and volatility in our stock price. However, as the COVID-19 pandemic persists and continues to evolve, the potential impacts to our risk factors that are further described below, remain uncertain.
We are subject to credit quality risks and our credit policies may not be sufficient to avoid losses.
We are subject to the risk of losses resulting from the failure of borrowers, guarantors and related parties to pay us the interest and principal amounts due on their loans. Although we maintain well-defined credit policies and credit underwriting and monitoring and collection procedures, these policies and procedures may not prevent losses, particularly during periods in which the local, regional or national economy suffers a general decline. The future effects of COVID-19 on economic activity could negatively affect the collateral values associated with our existing loans, the ability to liquidate the real estate collateral securing our residential and commercial real estate loans, our ability to maintain loan origination volume and to obtain additional financing, the future demand for or profitability of our lending and services, and the financial condition and credit risk of our customers. Further, in the event of delinquencies, regulatory changes and policies designed to protect borrowers may slow or prevent us from making our business decisions or may result in a delay in our taking certain remediation actions, such as foreclosure. If borrowers fail to repay their loans, our financial condition and results of operations would be adversely affected.
We have a high concentration of loans secured by real estate and a decline in the real estate market, for any reason, could result in losses and materially and adversely affect our business, financial condition, results of operations and future prospects.
A significant portion of our loan portfolio is dependent on real estate. In addition to the importance of the financial strength and cash flow characteristics of the borrower, loans are also often secured with real estate collateral. At December 31, 2020, approximately 71.0% of our loans have real estate as a primary or secondary component of collateral. The real estate in each case provides an alternate source of repayment in the event of default by the borrower and may deteriorate in value during the time the credit is extended. Beginning in the third quarter of 2007 and continuing until 2010, there was significant deterioration in the credit markets, beginning with a decline in the sub-prime mortgage lending market, which later extended to the markets for CMOs, MBS and the lending markets generally. This decline resulted in restrictions in the resale markets during 2011 and 2012 for non-conforming loans and had an adverse effect on retail mortgage lending operations in many markets. A decline in the credit markets generally could adversely affect our financial condition and results of operations if we are unable to extend credit or sell loans in the secondary market. An adverse change in the economy affecting real estate values generally or in our primary markets specifically could significantly impair the value of collateral underlying certain of our loans and our ability to sell the collateral at a profit or at all upon foreclosure. Furthermore, it is likely that, in a declining real estate market, we would be required to further increase our allowance for loan losses. If we are required to liquidate the collateral securing a loan to satisfy the debt during a period of reduced real estate values or to increase our allowance for loan losses, our profitability and financial condition could be adversely impacted.
Our information systems may experience an interruption or breach in security.
We rely heavily on communications and information systems to conduct our business. Our communications and information systems remain vulnerable to unexpected disruptions and failures. Any failure, interruption or breach in security of these systems could result in failures or disruptions in our customer relationship management, general ledger, deposit, loan and other systems. While we have policies and procedures designed to prevent or limit the effect of a failure, interruption or security breach of our information systems, there can be no assurance that we can prevent any such failures, interruptions, cyber
security breaches or other security breaches or, if they do occur, that they will be adequately addressed. The occurrence of any failures, interruptions or security breaches of our information systems could damage our reputation, result in a loss of customer business, subject us to additional regulatory scrutiny or expose us to civil litigation and possible financial liability, any of which could have a material adverse effect on our financial condition and results of operations.
In our ordinary course of business, we rely on electronic communications and information systems to conduct our businesses and to collect and store sensitive data, including financial information regarding our customers and personally identifiable information of our customers and employees. The integrity of information systems of financial institutions is under significant threat from cyber-attacks by third parties, including through coordinated attacks sponsored by foreign nations and criminal organizations to disrupt business operations and other compromises to data and systems for political or criminal purposes. We employ an in-depth, layered, defense approach that leverages people, processes and technology to manage and maintain cyber security controls.
Notwithstanding the strength of our defensive measures, the threat from cyber-attacks is severe, attacks are sophisticated, and attackers respond rapidly to changes in defensive measures. Cyber security risks may also occur with our third-party service providers, and may interfere with their ability to fulfill their contractual obligations to us, with potential for financial loss or liability that could adversely affect our financial condition or results of operations. We offer our customers the ability to bank remotely and provide other technology-based products and services, which services include the secure transmission of confidential information over the Internet and other remote channels. To the extent that our customers’ systems are not secure or are otherwise compromised, our network could be vulnerable to unauthorized access, malicious software, phishing schemes and other security breaches. To the extent that our activities or the activities of our customers or third-party service providers involve the storage and transmission of confidential information, security breaches and malicious software could expose us to claims, regulatory scrutiny, litigation and other possible liabilities.
In addition, in response to COVID-19, we have modified our business practices with a portion of our employees working remotely from their homes to have our operations uninterrupted as much as possible. Further, consumer technology in employees’ homes may not provide similar performance as commercial-grade technology in our offices. This along with reliance on employees’ residential internet could cause network, system, application, and communication limitations or instability, affecting customer experience for some departments. The continuation of these work-from-home measures also introduces additional operational risk, including increased cybersecurity risk. These cyber risks include greater phishing, malware, and other social engineering attacks targeted at employees working from home. Increased risk of unauthorized dissemination of confidential information, greater risk of privacy breach due to screen/voice/video conversation outside private office space, limited ability to restore the systems in the event of a system failure or interruption, greater risk of a security breach resulting in destruction or misuse of valuable information, and potential impairment of our ability to perform critical functions, including wiring funds, all of which could expose us to risks of data or financial loss, litigation and liability and could seriously disrupt our operations and the operations of any impacted customers.
While to date we have not experienced a significant compromise, significant data loss or material financial losses related to cyber security attacks, our systems and those of our customers and third-party service providers are under constant threat, and it is possible that we could experience a significant event in the future. We may suffer material financial losses related to these risks in the future or we may be subject to liability for compromises to our customer or third-party service provider systems. Any such losses or liabilities could adversely affect our financial condition or results of operations and could expose us to reputation risk, the loss of customer business, increased operational costs, as well as additional regulatory scrutiny, possible litigation and related financial liability. These risks also include possible business interruption, including the inability to access critical information and systems.
We rely on other companies to provide key components of our business infrastructure.
Third parties provide key components of our business infrastructure, such as banking services, core processing and internet connections and network access. Any disruption in such services provided by these third parties or any failure of these third parties to handle current or higher volumes of use could adversely affect our ability to deliver products and services to our customers and otherwise to conduct business. Technological or financial difficulties of one of our third-party service providers or their subcontractors could adversely affect our business to the extent those difficulties result in the interruption or discontinuation of services provided by that party. In addition, one or more of our third-party service providers may become subject to cyber-attacks or information security breaches that could result in the unauthorized release, gathering, monitoring, misuse, loss or destruction of our or our customers’ confidential, proprietary and other information, or otherwise disrupt our or our customers’ or other third parties’ business operations. While we have processes in place to monitor our third-party service providers’ data and information security safeguards, we do not control such service providers’ day to day operations, and a successful attack or security breach at one or more of such third-party service providers is not within our control. The occurrence of any such breaches or failures could damage our reputation, result in a loss of customer business and expose us to additional regulatory scrutiny, civil litigation and possible financial liability, any of which could have a material adverse effect
on our financial condition and results of operations. Further, in some instances we may be held responsible for the failure of such third parties to comply with government regulations. We may not be insured against all types of losses as a result of third-party failures, and our insurance coverage may not be adequate to cover all losses resulting from system failures, third-party breaches or other disruptions. Failures in our business structure or in the structure of one or more of our third-party service providers could interrupt the operations or increase the cost of doing business.
We continually encounter technological change.
The financial services industry is continually undergoing rapid technological change with frequent introductions of new technology-driven products and services. The effective use of technology increases efficiency and enables financial institutions to better serve customers and reduce costs. Our future success depends, in part, upon our ability to address the needs of our customers by using technology to provide products and services that will satisfy customer demands, as well as to create additional efficiencies in our operations. Many of our competitors have substantially greater resources to invest in technological improvements. We may not be able to effectively implement new technology-driven products and services or be successful in marketing these products and services to our customers, and even if we implement such products and services, we may incur substantial costs in doing so. Failure to successfully keep pace with technological change affecting the financial services industry could have a material adverse impact on our business, financial condition and results of operations.
Our earnings are subject to interest rate risk.
Our earnings and cash flows are largely dependent upon our net interest income. Net interest income is the difference between interest income earned on interest earning assets such as loans and securities and interest expense paid on interest bearing liabilities such as deposits and borrowed funds. Interest rates are highly sensitive to many factors that are beyond our control, including general economic conditions and policies of various governmental and regulatory agencies and, in particular, the Federal Reserve. Changes in monetary policy, interest rates, the yield curve, or market risk spreads, or a prolonged, flat or inverted yield curve could influence not only the interest we receive on loans and securities and the amount of interest we pay on deposits and borrowings, but such changes could also affect:
•our ability to originate loans and obtain deposits;
•our ability to retain deposits in a rising rate environment;
•net interest rate spreads and net interest rate margins;
•our ability to enter into instruments to hedge against interest rate risk;
•the fair value of our financial assets and liabilities; and
•the average duration of our loan and MBS portfolio.
If the interest rates paid on deposits and other borrowings increase at a faster rate than the interest rates received on loans and other investments, our net interest income, and therefore earnings, could be adversely affected. Earnings could also be adversely affected if the interest rates received on loans and other investments fall more quickly than the interest rates paid on deposits and other borrowings.
Any substantial, unexpected or prolonged change in market interest rates could have a material adverse effect on our financial condition and results of operations. See the section captioned “Net Interest Income” in “Item 7. Management’s Discussion and Analysis of Financial Condition and Results of Operations” in this report for further discussion related to our management of interest rate risk.
We are subject to the risk that our U.S. agency MBS could prepay faster than we have projected.
We have and may continue to purchase MBS at premiums due to the low interest rate environment. Our prepayment assumptions take into account market consensus speeds, current trends and past experience. If actual prepayments exceed our projections, the amortization expense associated with these MBS will increase, thereby decreasing our net income. The increase in amortization expense and the corresponding decrease in net income could have a material adverse effect on our financial condition and results of operations.
We rely on dividends from our bank subsidiary for most of our revenue.
Southside Bancshares, Inc. is a separate and distinct legal entity from its subsidiaries. We receive substantially all of our revenue from dividends from our subsidiary Southside Bank. These dividends are the principal source of funds to pay dividends on our common stock to our shareholders and interest and principal on our debt. Various federal and/or state laws and regulations limit the amount of dividends that Southside Bank and certain of our nonbank subsidiaries may pay to us. In addition, Southside Bancshares, Inc.’s right to participate in a distribution of assets upon a subsidiary’s liquidation or reorganization is subject to the prior claims of the subsidiary’s creditors. In the event Southside Bank is unable to pay dividends to Southside Bancshares, Inc., we may not be able to service debt, pay obligations or pay dividends to our
shareholders. The inability to receive dividends from Southside Bank could have a material adverse effect on Southside Bancshares, Inc.’s business, financial condition and results of operations. See the section captioned “Supervision and Regulation” in “Item 1. Business” and “Note 13 – Shareholders’ Equity” to our consolidated financial statements included in this report.
You may not receive dividends on our common stock.
Although we have historically declared quarterly cash dividends on our common stock, we are not required to do so and may reduce or cease to pay common stock dividends in the future. If we reduce or cease to pay common stock dividends, the market price of our common stock could be adversely affected.
As noted above, our ability to pay dividends depends primarily upon the receipt of dividends or other capital distributions from Southside Bank. Southside Bank’s ability to pay dividends to us is subject to, among other things, its earnings, financial condition and need for funds, as well as federal and state governmental policies and regulations applicable to us and Southside Bank, including the statutory requirement that we serve as a source of financial strength for Southside Bank, which limit the amount that may be paid as dividends without prior regulatory approval. Notably, in 2020, in direct response to potential adverse financial impacts caused by COVID-19, the Federal Reserve capped dividend payments and suspended share repurchases by several large banks (i.e., those with more than $50 billion in total assets). Though temporary (and not applicable to the Company or Southside Bank), these measures highlight the sensitivity of the bank regulators to the potential financial impacts of COVID-19. Additionally, if Southside Bank’s earnings are not sufficient to pay dividends to us while maintaining adequate capital levels, we may not be able to pay dividends to our shareholders. See “Supervision and Regulation — Holding Company Regulation — Dividends” included in this report.
We may not be able to attract and retain skilled personnel.
Our success depends, in large part, on our ability to attract and retain key personnel. Competition for the best personnel in most activities we engage in can be intense, and we may not be able to hire personnel or to retain them. The unexpected loss of services of one or more of our key personnel could have a material adverse impact on our business because of their skills, knowledge of our market, relationships in the communities we serve, years of industry experience and the difficulty of promptly finding qualified replacement personnel. Although we have employment agreements with certain of our executive officers, there is no guarantee that these officers and other key personnel will remain employed with the Company.
We operate in a highly competitive industry and market area.
We face substantial competition in all areas of our operations from a variety of different competitors, many of which are larger and may have more financial resources. Such competitors primarily include national, regional and community banks within the various markets we operate. Additionally, various out-of-state banks have entered or have announced plans to enter the market areas in which we currently operate. We also face competition from many other types of financial institutions, including, without limitation, credit unions, finance companies, brokerage firms, insurance companies, factoring companies and other financial intermediaries. The financial services industry could become even more competitive as a result of legislative, regulatory and technological changes, continued consolidation and recent trends in the credit and mortgage lending markets. Banks, securities firms and insurance companies can be affiliated under the umbrella of a financial holding company, which can offer virtually any type of financial service, including banking, securities underwriting, insurance (both agency and underwriting) and merchant banking. Also, technology has lowered barriers to entry and made it possible for nonbanks to offer certain products and services traditionally provided by banks, such as automatic transfer and automatic payment systems. Our competitors may have fewer regulatory constraints and may have lower cost structures. Additionally, due to their size, many competitors may be able to achieve economies of scale and, as a result, may offer a broader range of products and services as well as better pricing for those products and services than we can.
Our ability to compete successfully depends on a number of factors, including:
•the ability to develop, maintain and build upon long-term customer relationships based on top quality service, high ethical standards and safe, sound assets;
•the ability to expand our market position;
•the scope, relevance and pricing of products and services offered to meet customer needs and demands;
•the rate at which we introduce new products and services relative to our competitors;
•our ability to invest in or partner with technology providers offering banking solutions and delivery channels at a level equal to our competitors;
•customer satisfaction with our level of service; and
•industry and general economic trends.
Failure to perform in any of these areas could significantly weaken our competitive position, which could adversely affect our growth and profitability, which, in turn, could have a material adverse effect on our financial condition and results of operations.
Our accounting estimates and risk management processes rely on analytical and forecasting models.
The process we use to estimate our loan losses and to measure our pension plan liabilities and the fair value of our financial instruments, as well as the processes used to estimate the effects of changing interest rates and other market measures on our financial condition and results of operations, depend upon the use of analytical and forecasting models. These models reflect assumptions that may not be accurate, particularly in times of market stress or other unforeseen circumstances, as we have experienced and expect to continue to experience as a result of the COVID-19 pandemic. The adoption of CECL in 2020 increased the complexity of these analytical and forecasting models. Even if these assumptions are adequate, the models may prove to be inadequate or inaccurate because of other flaws in their design or their implementation. If the models we use for interest rate risk and asset-liability management are inadequate, we may incur increased or unexpected losses upon changes in market interest rates or other market measures. If the methodology we use for determining our loan losses are inadequate, our allowance for loan losses may not be sufficient to support future charge-offs. If the models we use to measure the fair value of financial instruments are inadequate, the fair value of such financial instruments may fluctuate unexpectedly or may not accurately reflect what we could realize upon sale or settlement of such financial instruments. If the key assumptions and models used to measure the defined benefit pension plan liabilities and expense are inadequate, the liability may not accurately reflect the amount required to fund the benefit obligation. Any such failure in our analytical or forecasting models could have a material adverse effect on our business, financial condition and results of operations.
Our allowance for loan losses may be insufficient.
We maintain an allowance for loan losses, which is a reserve established through a provision for loan losses charged to expense. This allowance represents management’s best estimate of expected losses that may occur over the contractual life of our current loan portfolio. The allowance, in the judgment of management, is necessary to reserve for estimated loan losses and risks expected in the loan portfolio considering historical losses, current conditions and reasonable and supportable forecasts. The level of the allowance reflects management’s continuing evaluation of industry concentrations; specific credit risks; loan loss experience; current loan portfolio quality; present and forecasted economic, political and regulatory conditions, including the impact of COVID-19 and the recent election; and unidentified losses expected in the current loan portfolio. The determination of the appropriate level of the allowance for loan losses inherently involves a high degree of subjectivity and requires management to make significant estimates and assumptions regarding current credit risks and future trends, all of which may undergo material changes. Changes in economic conditions affecting the value of properties used as collateral for loans, problems affecting the credit of borrowers, new information regarding existing loans, identification of additional problem loans and other factors, both within and outside of our control, may require an increase in the allowance for loan losses. Business and consumer customers of Southside Bank may be currently experiencing varying degrees of financial distress, which may continue over the coming months and may adversely affect their ability to timely pay interest and principal on their loans and the value of the collateral securing their obligations. This in turn may influence the recognition of credit losses in our loan portfolios and may increase our allowance for credit losses, particularly should businesses remain closed and should more customers draw on their lines of credit or seek additional loans to help finance their businesses. In addition, bank regulatory agencies periodically review our allowance for loan losses and may require an increase in the provision for loan losses or the recognition of further loan charge-offs (in accordance with GAAP), based on judgments different than those of management. If charge-offs in future periods exceed the allowance for loan losses, we may need additional provisions to increase the allowance for loan losses. Any increases in the allowance for loan losses will result in a decrease in net income and capital, and may have a material adverse effect on our financial condition and results of operations.
Changes in accounting standards, including the implementation of CECL methodology, could materially affect how we report our financial results.
The Financial Accounting Standards Board adopted a new accounting standard for determining the amount of our allowance for CECL (ASU 2016-13 Financial Instruments - Credit Losses (Topic 326)) that became effective for us on January 1, 2020. Implementation of CECL requires that we determine periodic estimates of lifetime expected future credit losses on loans in the provision for loan losses in the period when the loans are booked. Although currently immaterial, securities classified as HTM are handled similarly. The ongoing impact of CECL will be significantly influenced by the composition, characteristics and quality of our loan portfolio, as well as the prevailing economic conditions and forecasts. Should these factors materially change, we may be required to increase our allowance for loan losses, decreasing our reported income and introducing additional volatility into our reported earnings.
ASU 2016-13 also changes the impairment model for investment securities classified as AFS. Under the new impairment model, an AFS investment security is considered impaired when it experiences a decline in fair value below its amortized cost basis. At each measurement date, we determine how much of the decline in fair value below amortized cost
basis is due to credit-related factors and how much of the decline is due to noncredit-related factors. Credit-related impairment is recognized as an allowance on our balance sheet with a corresponding adjustment to earnings. Any impairment that is not credit related is recognized in other comprehensive income, net of applicable taxes.
The process for determining whether or not an AFS investment security’s decline in fair value below its amortized cost basis is credit-related will require complex, subjective judgments including, but not limited to, the extent to which the fair value is less than the amortized cost basis, any adverse conditions specifically related to the investment security (including changes to its industry and geographic area), the payment structure of the investment security, failure of the issuer of the investment security to make scheduled payments of principal and interest, and any changes to the rating of the investment security by a rating agency.
Our interest rate risk, liquidity, fair value of securities and profitability are dependent upon the successful management of our balance sheet strategy.
We implemented a balance sheet strategy for the purpose of enhancing overall profitability by maximizing the use of our capital. The effectiveness of our balance sheet strategy, and therefore our profitability, may be adversely affected by a number of factors, including reduced net interest margin and spread, adverse changes in the market liquidity and fair value of our investment securities and U.S. agency MBS, incorrect modeling results due to the unpredictable nature of MBS prepayments, the length of interest rate cycles and the slope of the interest rate yield curve. In addition, we may not be able to obtain wholesale funding to profitably and properly fund our balance sheet strategy. If our balance sheet strategy is flawed or poorly implemented, we may incur significant losses. See the section captioned “Balance Sheet Strategy” in “Item 7. Management’s Discussion and Analysis of Financial Condition and Results of Operations” in this report for further discussion related to our balance sheet strategy.
Our process for managing risk may not be effective in mitigating risk or losses to us.
The objectives of our risk management processes are to mitigate risk and loss to our organization. We have established procedures that are intended to identify, measure, monitor, report and analyze the types of risks to which we are subject, including liquidity risk, credit risk, market risk, interest rate risk, operational risk, cybersecurity risk, legal and compliance risk and reputational risk, among others. However, as with any risk management processes, there are inherent limitations to our risk management strategies as there may exist, or develop in the future, risks that we have not appropriately anticipated or identified. The ongoing developments in the financial institutions industry continue to highlight both the importance and some of the limitations of managing unanticipated risks. If our risk management processes prove ineffective, we could suffer unexpected losses and could be materially adversely affected.
New lines of business or new products and services may subject us to additional risks.
From time to time, we may implement new delivery systems, such as internet banking, or offer new products and services within existing lines of business. In developing and marketing new delivery systems and/or new products and services, we may invest significant time and resources. Initial timetables for the introduction and development of new lines of business and/or new products or services may not be achieved, and price and profitability targets may not prove feasible. External factors, such as compliance with regulations, competitive alternatives and shifting market preferences, may also impact the successful implementation of a new line of business or a new product or service. Furthermore, any new line of business and/or new product or service could have a significant impact on the effectiveness of our system of internal controls. Failure to successfully manage these risks in the development and implementation of new lines of business or new products or services could have a material adverse effect on our business, results of operations and financial condition.
Acquisitions and potential acquisitions may disrupt our business and dilute shareholder value.
We occasionally evaluate merger and acquisition opportunities and conduct due diligence activities related to possible transactions with other financial institutions and financial services companies. As a result, merger or acquisition discussions and, in some cases, negotiations may take place, and future mergers or acquisitions involving cash, debt or equity securities may occur at any time. Acquisitions typically involve the payment of a premium over book and fair values, and, therefore, some dilution of our tangible book value and net income per common share may occur in connection with any future transaction. Furthermore, failure to realize expected revenue increases, cost savings, increases in geographic or product presence and/or other projected benefits and synergies from an acquisition could have a material adverse effect on our financial condition and results of operations.
General political or economic conditions in the United States could adversely affect our financial condition and results of operations.
The state of the economy and various economic, social and political factors, including inflation, recession, pandemics, unemployment, interest rates, declining oil prices and the level of U.S. debt, as well as governmental action and uncertainty
resulting from U.S. and global political trends, including weakness in foreign sovereign debt and currencies, the United Kingdom’s exit from the European Union and the economic impact of COVID-19, may directly and indirectly have a destabilizing effect on our financial condition and results of operations. Unfavorable or uncertain international, national or regional political or economic environments could drive losses beyond those which are provided for in our allowance for loan losses and result in the following consequences:
•increases in loan delinquencies;
•increases in nonperforming assets and foreclosures;
•decreases in demand for our products and services, which could adversely affect our liquidity position;
•decreases in the value of the collateral securing our loans, especially real estate, which could reduce customers’ borrowing power;
•decreases in the credit quality of our non-U.S. Government and non-U.S. agency investment securities, corporate and municipal securities;
•an adverse or unfavorable resolution of the Fannie Mae or Freddie Mac receivership; and
•decreases in the real estate values subject to ad-valorem taxes by municipalities that impact such municipalities’ ability to repay their debt, which could adversely affect our municipal loans or debt securities.
Any of the foregoing could adversely affect our financial condition and results of operation.
Our profitability depends significantly on economic conditions in the State of Texas.
Our success depends primarily on the general economic conditions of the State of Texas and the specific local markets within Texas in which we operate. Unlike larger national or other regional banks that are more geographically diversified, we provide banking and financial services to customers primarily in the State of Texas and the local markets in which we operate within Texas. The local economic conditions in these areas have a significant impact on the demand for our products and services, as well as the ability of our customers to repay loans, the value of the collateral securing our loans and the stability of our deposit funding sources. Moreover, substantially all of the securities in our municipal bond portfolio were issued by political subdivisions and agencies within the State of Texas. A significant decline in general economic conditions, caused by inflation, recession, crude oil prices, acts of terrorism, pandemics, outbreak of hostilities or other international or domestic occurrences, unemployment, plant or business closings or downsizing, changes in securities markets or other factors could impact these local economic conditions and, in turn, have a material adverse effect on our financial condition and results of operations.
Funding to provide liquidity may not be available to us on favorable terms or at all.
Liquidity is the ability to meet cash flow needs on a timely basis at a reasonable cost. The liquidity of Southside Bank is necessary to make loans and leases and to repay deposit liabilities as they become due or are demanded by customers. Liquidity policies and limits are established by our board of directors. Management and our asset liability committee regularly monitor the overall liquidity position of Southside Bank and the Company to ensure that various alternative strategies exist to cover unanticipated events that could affect liquidity. Management and our asset liability committee also establish policies and monitor guidelines to diversify Southside Bank’s funding sources to avoid concentrations in excess of board-approved policies from any one market source. Funding sources include federal funds purchased, repurchase agreements, noncore deposits and short- and long-term debt. Southside Bank is also a member of the FHLB System, which provides funding through advance agreements to members that are collateralized with U.S. Treasury securities, MBS, commercial MBS and loans.
We maintain a portfolio of securities that can be used as a secondary source of liquidity. Other sources of liquidity include sales or securitizations of loans, our ability to acquire additional national market, noncore deposits, additional collateralized borrowings such as FHLB advance agreements, the issuance and sale of debt securities and the issuance and sale of preferred or common securities in public or private transactions. Southside Bank also can borrow from the FRDW.
We have historically had access to a number of alternative sources of liquidity, but if there is an increase in volatility in the credit and liquidity markets similar to 2008, there is no assurance that we will be able to obtain such liquidity on terms that are favorable to us, or at all. The cost of out-of-market deposits may exceed the cost of deposits of similar maturity in our local market area, making such deposits unattractive sources of funding; financial institutions may be unwilling to extend credit to banks because of concerns about the banking industry and the economy in general, and there may not be a viable market for raising equity capital.
If we were unable to access any of these funding sources when needed, we might be unable to meet customers’ needs, which could adversely impact our financial condition, results of operations, cash flows and liquidity and level of regulatory-qualifying capital.
If we fail to maintain an effective system of disclosure controls and procedures, including internal control over financial reporting, we may not be able to accurately report our financial results or prevent fraud, which could have a material adverse effect on our business, results of operation and financial condition. In addition, current and potential shareholders could lose confidence in our financial reporting, which could harm the trading price of our common stock.
Management regularly monitors, reviews and updates our disclosure controls and procedures, including our internal control over financial reporting. Any system of controls, however well designed and operated, is based in part on certain assumptions and can provide only reasonable assurances that the controls will be effective. Any failure or circumvention of our controls and procedures or failure to comply with regulations related to controls and procedures could have a material adverse effect on our business, results of operations and financial condition.
Failure to achieve and maintain an effective internal control environment could prevent us from accurately reporting our financial results, preventing or detecting fraud or providing timely and reliable financial information pursuant to our reporting obligations, which could result in a material weakness in our internal controls over financial reporting and the restatement of previously filed financial statements and could have a material adverse effect on our business, financial condition and results of operations. Further, ineffective internal controls could cause our investors to lose confidence in our financial information, which could affect the trading price of our common stock.
The value of our goodwill and other intangible assets may decline in the future.
As of December 31, 2020, we had $210.9 million of goodwill and other intangible assets. A significant decline in our expected future cash flows, a significant adverse change in the business climate, slower growth rates or a significant and sustained decline in the price of our common stock may necessitate taking charges in the future related to the impairment of our goodwill and other intangible assets. If we were to conclude that a future write-down of goodwill and other intangible assets is necessary, we would record the appropriate charge, which could have a material adverse effect on our business, financial condition and results of operations.
Increased regulatory oversight, uncertainty relating to the LIBOR calculation process and potential phasing out of LIBOR after 2021 may adversely affect the results of our operations.
On July 27, 2017, the United Kingdom’s Financial Conduct Authority, which regulates LIBOR, announced that it intends to stop persuading or compelling banks to submit rates for the calculation of LIBOR after 2021. The IBA, the administrator of LIBOR, announced on November 30, 2020, that it would cease publishing the one-week and two-month LIBOR rates on December 31, 2021, but would continue publishing the one-, three-, six-, and twelve-month LIBOR rates until June 30, 2023. Regardless, the federal banking agencies also issued guidance on November 30, 2020, encouraging banks to (i) stop using LIBOR in new financial contracts no later than December 31, 2021; and (ii) either use a rate other than LIBOR or include clear language defining the alternative rate that will be applicable after LIBOR’s discontinuation. At this time, it is impossible to predict whether and to what extent banks will continue to provide LIBOR submissions for the calculation of LIBOR. Similarly, it is not possible to predict whether LIBOR will continue to be viewed as an acceptable market benchmark prior to its 2023 retirement, what rate or rates may become accepted alternatives to LIBOR, or the effect of any such changes in views or alternatives may be on the markets for LIBOR-indexed financial instruments.
In particular, regulators, industry groups and certain committees (e.g., the Alternative Reference Rates Committee) have, among other things, published recommended fallback language for LIBOR-linked financial instruments, identified recommended alternatives for certain LIBOR rates (e.g., the Secured Overnight Financing Rate as the recommended alternative to U.S. Dollar LIBOR), and proposed implementations of the recommended alternatives in floating rate instruments. At this time, it is not possible to predict whether these specific recommendations and proposals will be broadly accepted, whether they will continue to evolve, and what the effect of their implementation may be on the markets for floating-rate financial instruments.
We have a significant number of loans, derivative contracts, borrowings and other financial instruments with attributes that are either directly or indirectly dependent on LIBOR. The transition from LIBOR could create considerable costs and additional risk. Since proposed alternative rates are calculated differently, payments under contracts referencing new rates will differ from those referencing LIBOR. The transition will change our market risk profiles, requiring changes to risk and pricing models, valuation tools, product design and hedging strategies.
Although we are currently unable to assess what the ultimate impact of the transition from LIBOR will be, failure to adequately manage the transition could have a material adverse effect on our business, financial condition and results of
operations. Any failure to adequately manage this transition process with our customers could also adversely impact our reputation.
We are subject to environmental liability as a result of certain lending activities.
A significant portion of our loan portfolio is secured by real property. During the ordinary course of business, we may foreclose on and take title to properties securing certain loans. There is a risk that hazardous or toxic substances could be found on these properties. If hazardous or toxic substances are found, we may be liable for remediation costs, as well as for personal injury and property damage. Environmental remediation may require us to incur substantial expenses and may materially reduce the affected property’s value or limit our ability to use or sell the affected property. In addition, future laws or more stringent interpretations or enforcement policies with respect to existing laws may increase our exposure to environmental liability. Although we have policies and procedures that require us to perform an environmental review before initiating any foreclosure action on nonresidential real property, these reviews may not be sufficient to detect all potential environmental hazards. The remediation costs and any other financial liabilities associated with an environmental hazard could have a material adverse effect on our financial condition and results of operations.
We may be adversely affected by declining crude oil prices.
At one point during 2014, the price per barrel of crude oil traded above $100. Since 2015 the market price of a barrel of crude oil has been extremely volatile. To partially mitigate this volatility, oil producers have found ways to reduce production costs. During 2020, as the pandemic unfolded and worldwide economic activity slowed dramatically, demand for crude oil immediately declined as did the price per barrel of crude oil, which at one point went negative. As of December 31, 2020, the price per barrel of crude oil was approximately $48. Decreased market oil prices compressed margins for many U.S. and Texas-based oil producers, as well as oilfield service providers, energy equipment manufacturers and transportation suppliers, among others. As of December 31, 2020, energy loans comprised approximately 2.86% of our loan portfolio. Energy production and related industries represent a significant part of the economies in our primary markets. If oil prices remain at these low levels, or move lower, for an extended period, we could experience weaker loan demand from the energy industry and increased losses within our energy portfolio. A prolonged period of low oil prices could also have a negative impact on the U.S. economy and, in particular, the economies of energy-dominant states such as Texas, which in turn could have a material adverse effect on our business, financial condition and results of operations.
Severe weather, natural disasters, climate change, acts of war or terrorism, health emergencies, epidemics or pandemics and other external events could significantly impact our business.
Severe weather, natural disasters, climate change, acts of war or terrorism, health emergencies, epidemics or pandemics and other adverse external events could have a significant impact on our ability to conduct business. Such events could affect the stability of our deposit base, impair the ability of borrowers to repay outstanding loans, impair the value of collateral securing loans, cause significant property damage, result in loss of revenue and/or cause us to incur additional expenses. For example, because of our location and the location of the market areas we serve, severe weather is more likely than in other areas of the country. Although management has established disaster recovery policies and procedures, there can be no assurance of the effectiveness of such policies and procedures, and the occurrence of any such event could have a material adverse effect on our business, financial condition and results of operations.
RISKS ASSOCIATED WITH THE BANKING INDUSTRY
We are subject or may become subject to extensive government regulation and supervision.
Southside Bancshares, Inc., primarily through Southside Bank, and certain of its nonbank subsidiaries, is subject to extensive federal and state regulation and supervision. Banking regulations are primarily intended to protect depositors’ funds, federal deposit insurance funds and the banking system as a whole, not shareholders. These regulations affect our lending practices, capital structure, investment practices and dividend policy and growth, among other things. The statutory and regulatory framework under which we operate has changed substantially as the result of the enactment of the Dodd-Frank Act, the Basel III Capital Rules, the European Union’s General Data Protection Regulations and the California Consumer Privacy Act. The Dodd-Frank Act represents a significant overhaul of many aspects of the regulation of the financial services industry, addressing, among other things, systemic risk, capital adequacy, deposit insurance assessments, consumer financial protection, as implemented through the Bureau, interchange fees, derivatives, lending limits, mortgage lending practices, registration of investment advisors and changes among bank regulatory authorities. In addition, Congress and federal and state regulatory agencies continually review banking laws, regulations and policies for possible changes. Changes to statutes, regulations or regulatory policies, including changes in interpretation or implementation of statutes, regulations or policies, could affect us in substantial and unpredictable ways. Such changes could subject us to additional costs, limit deposit fees and other types of fees we charge, limit the types of financial services and products we may offer and/or increase the ability of nonbanks to offer competing financial services and products, among other things. While we cannot predict the impact of regulatory changes that may arise out of the current financial and economic environment, any regulatory changes or increased regulatory scrutiny could increase costs directly related to complying with new regulatory requirements. Failure to comply with laws, regulations or policies could result in sanctions by regulatory agencies, civil money penalties and/or reputational damage, which could have a material adverse effect on our business, financial condition and results of operations. While our policies and procedures are designed to prevent any such violations, there can be no assurance that such violations will not occur. See the section captioned “Supervision and Regulation” in “Item 1. Business” and “Note 13 – Shareholders’ Equity” to our consolidated financial statements included in this report.
We may become subject to increased regulatory capital requirements.
The capital requirements applicable to Southside Bancshares, Inc. and Southside Bank are subject to change as a result of the Dodd-Frank Act, the international regulatory capital initiative known as Basel III and any other future government actions. In particular, the Dodd-Frank Act eliminates the Tier 1 capital treatment for most trust preferred securities after a three-year phase-in period that began January 1, 2013 for institutions that exceed $15 billion in assets. Furthermore, each of the federal banking agencies, including the Federal Reserve and the FDIC, has issued substantially similar risk-based and leverage capital guidelines applicable to the banking organizations they supervise. As a result of new regulations, we were required to begin complying with higher minimum capital requirements as of January 1, 2015. The 2015 Capital Rules implemented certain provisions of the Dodd-Frank Act and Basel III. These 2015 Capital Rules also make important changes to the prompt corrective action framework. Similarly, the 2018 Capital Rules issued by the federal banking agencies will impact our capital calculations by changing the methodology for calculating and reporting incurred losses on certain assets. For additional discussion relating to capital adequacy refer to “Item 1. Business - Supervision and Regulation - Capital Adequacy” in this report. The Company believes it will continue to meet the new capital guidelines, however complying with any higher 2015 Capital Rules mandated by the Dodd-Frank Act or Basel III, and/or the 2018 Capital Rules mandated by the federal banking agencies, may affect our operations, including our asset portfolios and financial performance.
Changes in accounting and tax rules applicable to banks could adversely affect our financial condition and results of operations.
From time to time, the FASB and the SEC change the financial accounting and reporting standards that govern the preparation of our financial statements. These changes can be hard to predict and can materially impact how we record and report our financial condition and results of operations. In some cases, we could be required to apply a new or revised standard retroactively, resulting in us restating prior period financial statements. For a discussion of the reporting and accounting implications to the Company and Southside Bank resulting from recent changes to the tax laws, refer to “Item 1. Business - Supervision and Regulation - Regulatory Examination” in this report.
Financial services companies depend on the accuracy and completeness of information about customers and counterparties and inaccuracies in such information, including as a result of fraud, could adversely impact our business, financial condition and results of operations.
In deciding whether to extend credit or enter into other transactions with third parties, we rely on information furnished by or on behalf of customers and counterparties, including financial statements, credit reports and other financial information. We may also rely on representations of those customers, counterparties or other third parties, such as independent auditors or property appraisers, as to the accuracy and completeness of that information. Such information could turn out to be
inaccurate, including as a result of fraud on behalf of our customers, counterparties or other third parties. In times of increased economic stress, we are at an increased risk of fraud losses. We cannot assure you that our underwriting and operational controls will prevent or detect such fraud or that we will not experience fraud losses or incur costs or other damages related to such fraud. Our customers may also experience fraud in their businesses which could adversely affect their ability to repay their loans or make use of our services. Our exposure and the exposure of our customers to fraud may increase our financial risk and reputation risk as it may result in unexpected loan losses that exceed those that have been provided for in our allowance for loan losses. Reliance on inaccurate or misleading information from our customers, counterparties and other third parties, including as a result of fraud, could have a material adverse impact on our business, financial condition and results of operations.
Consumers may decide not to use banks to complete their financial transactions.
Technology and other changes are allowing parties to complete financial transactions that historically have involved banks through alternative methods. For example, consumers can now maintain funds that would have historically been held as bank deposits in brokerage accounts or mutual funds. Consumers can also complete transactions such as paying bills and/or transferring funds directly without the assistance of banks. The process of eliminating banks as intermediaries could result in the loss of fee income, as well as the loss of customer deposits and the related income generated from those deposits. The loss of these revenue streams and the lower cost deposits as a source of funds could have a material adverse effect on our financial condition and results of operations.
The soundness of other financial institutions could adversely affect us.
Financial services institutions are interrelated as a result of trading, clearing, counterparty or other relationships. We have exposure to many different industries and counterparties, and we routinely execute transactions with counterparties in the financial services industry, including brokers and dealers, commercial banks, investment banks, mutual and hedge funds and other institutional customers. Many of these transactions expose us to credit risk in the event of default of our counterparty or customer. In addition, our credit risk may be exacerbated when the collateral held by us cannot be realized or is liquidated at prices insufficient to recover the full amount of the loan or derivative exposure due to us. There is no assurance that any such losses would not materially and adversely affect our results of operations or earnings.
We are subject to claims and litigation pertaining to fiduciary responsibility.
From time to time, customers make claims and take legal action pertaining to our performance of our fiduciary responsibilities. Whether customer claims and legal actions related to our performance of our fiduciary responsibilities are merited, defending claims is costly and diverts management’s attention, and if such claims and legal actions are not resolved in a manner favorable to us, they may result in significant financial liability and/or adversely affect our market perception and products and services as well as impact customer demand for those products and services. Any financial liability or reputational damage resulting from claims and legal actions could have a material adverse effect on our business, financial condition and results of operations.
GENERAL RISK FACTORS
Our stock price can be volatile.
Stock price volatility may make it more difficult for you to resell your common stock when you want and at prices you find attractive. Our stock price can fluctuate significantly in response to a variety of factors including, among other things:
•actual or anticipated variations in our results of operations, financial conditions or asset quality;
•changes in recommendations by securities analysts;
•operating and stock price performance of other companies that investors deem comparable to us;
•news reports relating to trends, concerns and other issues in the financial services industry, including regulatory actions against other financial institutions;
•perceptions in the marketplace regarding us and/or our competitors;
•perceptions in the marketplace regarding the impact of changes in price per barrel of crude oil, real estate values and interest rates on the Texas economy;
•new technology used or services offered by competitors;
•significant acquisitions or business combinations, strategic partnerships, joint ventures or capital commitments by or involving us or our competitors;
•failure to integrate acquisitions or realize anticipated benefits from acquisitions;
•future issuances of our common stock or other securities;
•additions or departures of key personnel;
•changes in government regulations; and
•geopolitical conditions such as acts or threats of terrorism or military conflicts, health emergencies, epidemics or pandemics.
General market fluctuations, industry factors and general economic and political conditions and events, such as economic slowdowns or recessions including as a result of the economic impact of COVID-19, interest rate changes or credit loss trends, could also cause our stock price to decrease regardless of operating results.
The holders of our subordinated notes and junior subordinated debentures have rights that are senior to those of our common stock shareholders.
On November 6, 2020, we issued $100.0 million of 3.875% fixed-to-floating rate subordinated notes, which mature in November 2030. On September 19, 2016, we issued $100.0 million of 5.50% fixed-to-floating subordinated notes, which mature in September 2026. On September 4, 2003, we issued $20.6 million of floating rate junior subordinated debentures in connection with a $20.0 million trust preferred securities issuance by our subsidiary Southside Statutory Trust III. These junior subordinated debentures mature in September 2033. On August 8 and 10, 2007, we issued $23.2 million and $12.9 million, respectively, of fixed-to-floating rate junior subordinated debentures in connection with $22.5 million and $12.5 million, respectively, trust preferred securities issuances by our subsidiaries Southside Statutory Trust IV and V, respectively. Trust IV matures October 2037 and Trust V matures September 2037. On October 10, 2007, as part of an acquisition, we assumed $3.6 million of floating rate junior subordinated debentures to Magnolia Trust Company I in connection with $3.5 million of trust preferred securities issued in 2005 that mature in 2035.
We conditionally guarantee payments of the principal and interest on the trust preferred securities. Our subordinated notes and the junior subordinated debentures are senior to our shares of common stock. We must make payments on the junior subordinated debentures (and the related trust preferred securities) before any dividends can be paid on our common stock, and in the event of bankruptcy, dissolution or liquidation, the holders of the debentures must be satisfied before any distributions can be made to the holders of common stock. We have the right to defer distributions on our debentures (and the related trust preferred securities) for up to five years, during which time no dividends may be paid to holders of common stock.
The trading volume in our common stock is less than that of other larger financial services companies.
Although our common stock is listed for trading on the NASDAQ Global Select Market, the trading volume for our common stock is low relative to other larger financial services companies, and you are not assured liquidity with respect to transactions in our common stock. A public trading market having the desired characteristics of depth, liquidity and orderliness depends on the presence in the marketplace of willing buyers and sellers of our common stock at any given time. This presence depends on the individual decisions of investors and general economic and market conditions over which we have no
control. Given the lower trading volume of our common stock, significant sales of our common stock or the expectation of these sales, could cause our stock price to fall.
We may issue additional securities, which could dilute your ownership percentage.
In certain situations, our board of directors has the authority, without any vote of our shareholders, to issue shares of our authorized but unissued stock. In the future, we may issue additional securities, through public or private offerings, to raise additional capital or finance acquisitions. Any such issuance would dilute the ownership of current holders of our common stock.
Securities analyst might not continue coverage on our common stock, which could adversely affect the market for our common stock.
The trading price of our common stock depends in part on the research and reports that securities analysts publish about us and our business. We do not have any control over these analysts and they may not continue to cover our common stock. If securities analysts do not continue to cover our common stock, the lack of research coverage may adversely affect its market price. If securities analysts continue to cover our common stock and our common stock is the subject of an unfavorable report, the price of our common stock may decline. If one or more of these analysts cease to cover us or fail to publish regular reports on us, we could lose visibility in the financial markets, which could cause the price or trading volume of our common stock to decline.
Provisions of our certificate of formation and bylaws, as well as state and federal banking regulations, could delay or prevent a takeover of us by a third party.
Our certificate of formation and bylaws could delay, defer or prevent a third party from acquiring us, despite the possible benefit to our shareholders, or otherwise adversely affect the price of our common stock. These provisions include, among others, requiring advance notice for raising business matters or nominating directors at shareholders’ meetings and staggered board elections.
Any individual, acting alone or with other individuals, who are seeking to acquire, directly or indirectly, 10.0% or more of our outstanding common stock must comply with the CBCA, which requires prior notice to the Federal Reserve for any acquisition. Additionally, any entity that wants to acquire 5.0% or more of our outstanding common stock, or otherwise control us, may need to obtain the prior approval of the Federal Reserve under the BHCA of 1956, as amended. As a result, prospective investors in our common stock need to be aware of and comply with those requirements, to the extent applicable. These provisions may discourage potential acquisition proposals and could delay or prevent a change in control, including under circumstances in which our shareholders might otherwise receive a premium over the market price of our share.
An investment in our common stock is not an insured deposit.
Our common stock is not a bank deposit and, therefore, is not insured against loss by the FDIC, any other deposit insurance fund or by any other public or private entity. Investment in our common stock is inherently risky for the reasons described in this “Risk Factors” section and elsewhere in this report and is subject to the same market forces that affect the price of common stock in any company. As a result, if you acquire our common stock, you may lose some or all of your investment.
ITEM 1B. UNRESOLVED STAFF COMMENTS
None
ITEM 2. PROPERTIES
The primary executive offices of Southside are located at 1201 South Beckham Avenue, Tyler, Texas 75701. This site also houses a banking center, a technology center, back office support areas and wealth management and trust services. Additional executive offices are located at 1320 South University Drive, Fort Worth, Texas 76107 in University Center II and at 104 N. Temple, Diboll, Texas 75941. Additional wealth management and trust services are located at 2510 West Frank Street, Lufkin, Texas 75904. All of these locations are owned by Southside. As of December 31, 2020, Southside operated 57 branches which includes traditional full service branches and full service branches within grocery stores. These branches are located in the state of Texas in the Dallas/Fort Worth, East Texas, Southeast Texas and Austin regions. Of the 57 branches, 36 are owned and 21 are leased. In addition to our branches, Southside also operates motor banks, wealth management and trust services and/or loan production or other financial services offices which Southside owns except for one loan production office that is leased. Southside also owns 79 ATMs/ITMs located throughout our market areas.
For additional information concerning our properties, refer to “Note 6 – Premises and Equipment” and “Note 16 – Leases” to our consolidated financial statements included in this report.
ITEM 3. LEGAL PROCEEDINGS
We are party to legal proceedings arising in the normal conduct of business. Management believes that such litigation is not material to our financial position, results of operations or cash flows.
ITEM 4. MINE SAFETY DISCLOSURES
Not applicable.
PART II
ITEM 5. MARKET FOR REGISTRANT’S COMMON EQUITY, RELATED STOCKHOLDER MATTERS
AND ISSUER PURCHASES OF EQUITY SECURITIES
MARKET INFORMATION
Our common stock trades on the NASDAQ Global Select Market under the symbol “SBSI.”
SHAREHOLDERS
There were approximately 1,500 holders of record of our common stock, the only class of equity securities currently issued and outstanding, as of February 23, 2021.
DIVIDENDS
See the section captioned “Item 8. Financial Statements and Supplementary Data - Note 20 – Quarterly Financial Information of Registrant” in our consolidated financial statements included in this report for the frequency and amount of cash dividends we paid. Also, see “Item 1 - Business - Supervision and Regulation - Dividends” and “Item 7 - Management's Discussion and Analysis of the Financial Condition and Results of Operations - Capital Resources” for restrictions on our present or future ability to pay dividends, particularly those restrictions arising under federal and state banking laws.
ISSUER SECURITY REPURCHASES
On September 5, 2019, our board of directors authorized the repurchase of up to 1.0 million shares of common stock under the Stock Repurchase Plan. On March 12, 2020, our board of directors increased the authorization under the Stock Repurchase Plan by an additional 1.0 million shares, for a total authorization to repurchase up to 2.0 million shares. During 2020, we repurchased a total of 1,035,901 shares at an average price per share of $29.92.
The following table provides information with respect to purchases made by or on behalf of any “affiliated purchaser” (as defined in Rule 10b-18(a)(3) under the Exchange Act), of our common stock during the three months ended December 31, 2020:
| | | | | | | | | | | | | | | | | | | | | | | | | | |
| Period | | Total Number of
Shares
Purchased | | Average Price Paid
Per Share | | Total Number of Shares Purchased as Part of Publicly Announced Plan | | Maximum Number of Shares That May Yet Be Purchased Under the Stock Repurchase Plan at the End of the Period |
| October 1, 2020 - October 31, 2020 | | — | | | $ | — | | | — | | | 1,104,662 | |
| November 1, 2020 - November 30, 2020 | | 39,202 | | | 30.63 | | | 39,202 | | | 1,065,460 | |
| December 1, 2020 - December 31, 2020 | | 126,976 | | | 31.08 | | | 126,976 | | | 938,484 | |
| Total | | 166,178 | | | $ | 30.97 | | | 166,178 | | | |
Subsequent to December 31, 2020 and through February 23, 2021, we purchased 221,501 additional shares under the Stock Repurchase Plan at an average price per share of $33.42.
RECENT SALES OF UNREGISTERED SECURITIES
There were no equity securities sold by us during the years ended December 31, 2020, 2019 or 2018 that were not registered under the Securities Act of 1933.
FINANCIAL PERFORMANCE
The following performance graph compares the returns for the indexes indicated assuming that $100 was invested on December 31, 2015 and that all dividends are reinvested. The performance graph does not constitute soliciting material and should not be deemed filed or incorporated by reference into any other Company filing under the Securities Act of 1933 or the Securities Exchange Act of 1934, except to the extent the Company specifically incorporates the performance graph by reference therein.
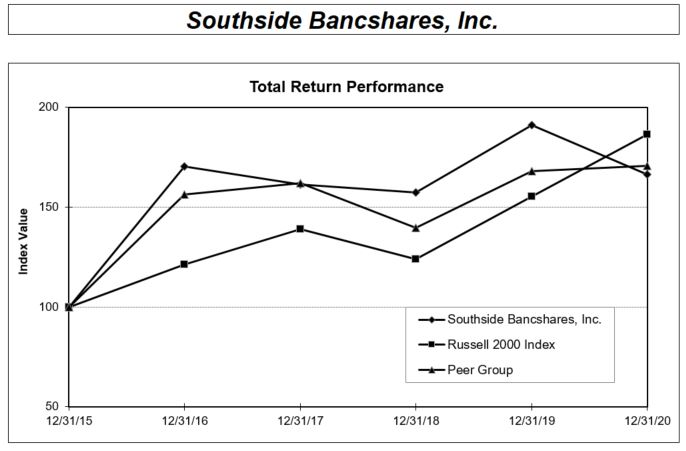
| | | | | | | | | | | | | | | | | | | | |
| | Period Ending | |
| Index | 12/31/15 | 12/31/16 | 12/31/17 | 12/31/18 | 12/31/19 | 12/31/20 |
| Southside Bancshares, Inc. | 100.00 | | 170.37 | | 161.24 | | 157.41 | | 190.97 | | 166.49 | |
| Russell 2000 | 100.00 | | 121.31 | | 139.08 | | 123.76 | | 155.35 | | 186.36 | |
| SBSI Peer Group Index* | 100.00 | | 156.16 | | 161.96 | | 139.62 | | 168.01 | | 170.75 | |
| | | | | | |
| | | | | | |
| *Peer group index includes Cullen/Frost Bankers, Inc.(CFR), First Financial Bankshares, Inc.(FFIN), Hilltop Holdings (HTH), Independent Bank Group, Inc. (IBTX), Prosperity Bancshares, Inc. (PB), Texas Capital Bancshares, Inc. (TCBI) and Veritex Holdings, Inc. (VBTX). |
| | |
| Source : S&P Global Market Intelligence | | | | | | |
| © 2021 | | | | | | |
| | | | | | |
ITEM 6. SELECTED FINANCIAL DATA
The following table sets forth selected financial data regarding our results of operations and financial position for, and as of the end of, each of the fiscal years in the five-year period ended December 31, 2020. This information should be read in conjunction with “Item 7. Management’s Discussion and Analysis of Financial Condition and Results of Operations” and “Item 8. Financial Statements and Supplementary Data,” as set forth in this report (in thousands, except per share data):
| | | | | | | | | | | | | | | | | | | | | | | | | | | | | | | | |
| | | As of and for the Years Ended December 31, |
| | | 2020 | | 2019 | | 2018 | | 2017 (1) | | 2016 |
| Summary Balance Sheet Data | | | | | | | | | | |
Securities AFS, at estimated fair value (2) | | $ | 2,587,305 | | | $ | 2,358,597 | | | $ | 1,989,436 | | | $ | 1,538,755 | | | $ | 1,479,600 | |
| Securities HTM, at carrying value | | 108,998 | | | 134,863 | | | 162,931 | | | 909,506 | | | 937,487 | |
| Loans | | 3,657,779 | | | 3,568,204 | | | 3,312,799 | | | 3,294,356 | | | 2,556,537 | |
Total assets (2) | | 7,008,227 | | | 6,748,913 | | | 6,123,494 | | | 6,498,097 | | | 5,563,767 | |
| Noninterest bearing deposits | | 1,354,815 | | | 1,040,112 | | | 994,680 | | | 1,037,401 | | | 704,013 | |
| Interest bearing deposits | | 3,577,507 | | | 3,662,657 | | | 3,430,350 | | | 3,478,046 | | | 2,829,063 | |
| Total deposits | | 4,932,322 | | | 4,702,769 | | | 4,425,030 | | | 4,515,447 | | | 3,533,076 | |
| FHLB borrowings | | 832,527 | | | 972,744 | | | 719,065 | | | 1,017,361 | | | 1,309,646 | |
| Subordinated notes, net of unamortized debt issuance costs | | 197,251 | | | 98,576 | | | 98,407 | | | 98,248 | | | 98,100 | |
| Trust preferred subordinated debentures, net of unamortized debt issuance costs | | 60,255 | | | 60,250 | | | 60,246 | | | 60,241 | | | 60,236 | |
| Shareholders’ equity | | 875,297 | | | 804,580 | | | 731,291 | | | 754,140 | | | 518,274 | |
| Summary Income Statement Data | | | | | | | | | | |
| Interest income | | $ | 231,828 | | | $ | 240,787 | | | $ | 229,165 | | | $ | 187,474 | | | $ | 168,913 | |
| Interest expense | | 44,563 | | | 70,982 | | | 57,101 | | | 43,504 | | | 29,348 | |
Provision for credit losses (3) | | 20,201 | | | 5,101 | | | 8,437 | | | 4,675 | | | 9,780 | |
Deposit services (2) | | 24,359 | | | 26,038 | | | 25,082 | | | 21,785 | | | 20,702 | |
| Net gain (loss) on sale of securities AFS | | 8,257 | | | 756 | | | (1,839) | | | 625 | | | 2,836 | |
Noninterest income (2) | | 49,732 | | | 42,368 | | | 40,773 | | | 37,473 | | | 39,411 | |
Noninterest expense (2) | | 123,307 | | | 119,297 | | | 120,099 | | | 106,335 | | | 109,522 | |
Net income (2) | | 82,153 | | | 74,554 | | | 74,138 | | | 54,312 | | | 49,349 | |
| Per Common Share Data | | | | | | | | | | |
| Earnings-basic | | $ | 2.47 | | | $ | 2.21 | | | $ | 2.12 | | | $ | 1.82 | | | $ | 1.82 | |
| Earnings-diluted | | 2.47 | | | 2.20 | | | 2.11 | | | 1.81 | | | 1.81 | |
| Cash dividends declared and paid | | 1.30 | | | 1.26 | | | 1.20 | | | 1.11 | | | 1.01 | |
| Book value | | 26.56 | | | 23.79 | | | 21.68 | | | 21.55 | | | 17.71 | |
| Asset Quality | | | | | | | | | | |
| Allowance for loan losses | | $ | 49,006 | | | $ | 24,797 | | | $ | 27,019 | | | $ | 20,781 | | | $ | 17,911 | |
| Allowance for loan losses to total loans | | 1.34 | % | | 0.69 | % | | 0.82 | % | | 0.63 | % | | 0.70 | % |
| Net loan charge-offs | | $ | 1,204 | | | $ | 7,323 | | | $ | 2,199 | | | $ | 1,805 | | | $ | 11,605 | |
| Net loan charge-offs to average loans | | 0.03 | % | | 0.21 | % | | 0.07 | % | | 0.07 | % | | 0.47 | % |
| Nonperforming assets | | $ | 17,480 | | | $ | 17,449 | | | $ | 42,906 | | | $ | 10,472 | | | $ | 15,105 | |
| Nonperforming assets to: | | | | | | | | | | |
| Total loans | | 0.48 | % | | 0.49 | % | | 1.30 | % | | 0.32 | % | | 0.59 | % |
| Total assets | | 0.25 | % | | 0.26 | % | | 0.70 | % | | 0.16 | % | | 0.27 | % |
| Consolidated Capital Ratios | | | | | | | | | | |
| Common equity tier 1 capital | | 14.68 | % | | 14.07 | % | | 14.77 | % | | 14.65 | % | | 14.64 | % |
| Tier 1 risk-based capital | | 16.08 | % | | 15.46 | % | | 16.29 | % | | 16.12 | % | | 16.37 | % |
| Total risk-based capital | | 21.78 | % | | 18.43 | % | | 19.59 | % | | 19.22 | % | | 20.10 | % |
| Tier 1 leverage capital | | 9.81 | % | | 10.18 | % | | 10.64 | % | | 11.16 | % | | 9.46 | % |
| Average shareholders’ equity to average total assets | | 11.55 | % | | 12.23 | % | | 12.06 | % | | 9.95 | % | | 8.95 | % |
(1)We completed the acquisition of Diboll on November 30, 2017. Accordingly, our balance sheet data as of December 31, 2017 reflects the effects of the acquisition of Diboll. Income statement data with respect to Diboll includes only the results of Diboll’s operations subsequent to the closing of the acquisition of Diboll on November 30 through December 31, 2017.
(2)Due to the adoption of certain regulatory guidance adopted under the modified retrospective approach, prior periods may not be comparative. Additionally, the Tax Act was enacted on December 22, 2017. See “Note 1 – Summary of Significant Accounting and Reporting Policies – Accounting Changes and Reclassifications” for further information.
(3)Upon adoption of CECL on January 1, 2020, the provision for credit losses is the sum of the provision for loan losses and the provision for off-balance-sheet credit exposures. Prior to the adoption of CECL, the provision for off-balance-sheet credit exposures was included in other noninterest expense.
ITEM 7. MANAGEMENT’S DISCUSSION AND ANALYSIS OF FINANCIAL CONDITION AND RESULTS
OF OPERATIONS
The following discussion and analysis provides a comparison of our results of operations for the years ended December 31, 2020, 2019 and 2018 and financial condition as of December 31, 2020 and 2019. This discussion should be read in conjunction with the financial statements and related notes included elsewhere in this report. All share data has been adjusted to give retroactive recognition to any applicable stock splits and stock dividends.
CAUTIONARY NOTICE REGARDING FORWARD-LOOKING STATEMENTS
Certain statements of other than historical fact that are contained in this report may be considered to be “forward-looking statements” within the meaning of and subject to the safe harbor protections of the Private Securities Litigation Reform Act of 1995. These forward-looking statements are not guarantees of future performance, nor should they be relied upon as representing management’s views as of any subsequent date. These statements may include words such as “expect,” “estimate,” “project,” “anticipate,” “appear,” “believe,” “could,” “should,” “may,” “might,” “will,” “would,” “seek,” “intend,” “probability,” “risk,” “goal,” “target,” “objective,” “plans,” “potential,” and similar expressions. Forward-looking statements are statements with respect to our beliefs, plans, expectations, objectives, goals, anticipations, assumptions, estimates, intentions and future performance and are subject to significant known and unknown risks and uncertainties, which could cause our actual results to differ materially from the results discussed in the forward-looking statements. For example, discussions of the effect of our expansion, benefits of the Share Repurchase Plan, trends in asset quality and earnings from growth, and certain market risk disclosures are based upon information presently available to management and are dependent on choices about key model characteristics and assumptions and are subject to various limitations. By their nature, certain of the market risk disclosures are only estimates and could be materially different from what actually occurs in the future. Accordingly, our results could materially differ from those that have been estimated. The most recent factor that could cause future results to differ materially from those anticipated by our forward-looking statements include the negative impact of the COVID-19 pandemic on our business, financial position, operations and prospects, including our ability to continue our business activities in certain communities we serve, the duration of the pandemic and its continued effects on financial markets, a reduction in financial transaction and business activities resulting in decreased deposits and reduced loan originations, increases in unemployment rates impacting our borrowers’ ability to repay their loans, our ability to manage liquidity in a rapidly changing and unpredictable market, additional interest rate changes by the Federal Reserve and other government actions in response to the pandemic including additional quarantines, regulations or laws enacted to counter the effects of the COVID-19 pandemic on the economy. Other factors that could cause actual results to differ materially from those indicated by forward-looking statements include, but are not limited to, the following:
•the impact of the COVID-19 pandemic on our future consolidated financial condition and results of operations;
•general (i) political conditions, including, without limitation, governmental action and uncertainty resulting from U.S. and global political trends and (ii) economic conditions, either globally, nationally, in the State of Texas, or in the specific markets in which we operate, including, without limitation, the deterioration of the commercial real estate, residential real estate, construction and development, energy, oil and gas, credit or liquidity markets, which could cause an adverse change in our net interest margin, or a decline in the value of our assets, which could result in realized losses;
•current or future legislation, regulatory changes or changes in monetary or fiscal policy that adversely affect the businesses in which we or our customers or our borrowers are engaged, including the impact of the Dodd-Frank Act, the Federal Reserve’s actions with respect to interest rates, the capital requirements promulgated by the Basel Committee, the CARES Act, uncertainty relating to calculation of LIBOR and other regulatory responses to economic conditions;
•adverse changes in the status or financial condition of the GSEs which impact the GSEs’ guarantees or ability to pay or issue debt;
•adverse changes in the credit portfolios of other U.S. financial institutions relative to the performance of certain of our investment securities;
•economic or other disruptions caused by acts of terrorism in the United States, Europe or other areas;
•technological changes, including potential cyber-security incidents and other disruptions, or innovations to the financial services industry, including as a result of the increased telework environment;
•our ability to identify and address cyber-security risks such as data security breaches, malware, “denial of service” attacks, “hacking” and identity theft, which could disrupt our business and result in the disclosure of and/or misuse or misappropriation of confidential or proprietary information, disruption or damage of our systems, increased costs, significant losses, or adverse effects to our reputation;
•the risk that our enterprise risk management framework, compliance program or our corporate governance and supervisory oversight functions may not identify or address risks adequately, which may result in unexpected losses;
•changes in the interest rate yield curve such as flat, inverted or steep yield curves, or changes in the interest rate environment that impact net interest margins and may impact prepayments on our MBS portfolio;
•increases in our nonperforming assets;
•our ability to maintain adequate liquidity to fund operations and growth;
•any applicable regulatory limits or other restrictions on the Bank and its ability to pay dividends to us;
•the failure of our assumptions underlying our allowance for credit losses and other estimates;
•the failure to maintain an effective system of controls and procedures, including internal control over financial reporting;
•the effectiveness of our derivative financial instruments and hedging activities to manage risk;
•unexpected outcomes of, and the costs associated with, existing or new litigation involving us, including the costs and effects of litigation related to our participation in government stimulus programs associated with the COVID-19 pandemic;
•changes impacting our balance sheet and leverage strategy;
•risks related to actual mortgage prepayments diverging from projections;
•risks related to actual U.S. agency MBS prepayments exceeding projected prepayment levels;
•risks related to U.S. agency MBS prepayments increasing due to U.S. government programs designed to assist homeowners to refinance their mortgage that might not otherwise have qualified;
•our ability to monitor interest rate risk;
•risks related to fluctuations in the price per barrel of crude oil;
•significant increases in competition in the banking and financial services industry;
•changes in consumer spending, borrowing and saving habits, including as a result of the economic impact of COVID-19;
•execution of future acquisitions, reorganization or disposition transactions, including the risk that the anticipated benefits of such transactions are not realized;
•our ability to increase market share and control expenses;
•our ability to develop competitive new products and services in a timely manner and the acceptance of such products and services by our customers;
•the effect of changes in federal or state tax laws;
•the effect of compliance with legislation or regulatory changes;
•the effect of changes in accounting policies and practices, including the implementation of the CECL model;
•credit risks of borrowers, including any increase in those risks due to changing economic conditions;
•risks related to loans secured by real estate, including the risk that the value and marketability of collateral could decline;
•risks related to environmental liability as a result of certain lending activity;
•risks associated with our common stock and our other securities, including fluctuations in our stock price and general volatility in the stock market; and
•the risks identified in “Part I - Item 1A. Risk Factors – Risks Related to Our Business” in this report.
All written or oral forward-looking statements made by us or attributable to us are expressly qualified by this cautionary notice. We disclaim any obligation to update any factors or to announce publicly the result of revisions to any of the forward-looking statements included herein to reflect future events or developments, unless otherwise required by law.
CRITICAL ACCOUNTING ESTIMATES
Our accounting and reporting estimates conform with U.S. GAAP and general practices within the financial services industry. The preparation of financial statements in conformity with GAAP requires management to make estimates and
assumptions that affect the amounts reported in the financial statements and accompanying notes. Actual results could differ from those estimates. We consider our critical accounting policies to include the following:
Allowance for Losses on Loans. With the adoption of ASU 2016-13 on January 1, 2020, the allowance for credit losses on loans is estimated and recognized upon origination of the loan based on expected credit losses. ASU 2016-13 replaced the previous incurred loss model which incorporated only known information as of the balance sheet date. The CECL model uses historical experience and current conditions for homogeneous pools of loans, and reasonable and supportable forecasts about future events. When determining the appropriate allowance for credit losses on our loan portfolio, our commercial construction and real estate loans, commercial loans and municipal loans utilize the probability of default/loss given default discounted cash flow approach. These loans are assigned to pools based upon risk factors including the loan type and structure, collateral type, leverage ratio, refinancing risk and origination quality, among others. Our consumer construction real estate loans, 1-4 family residential loans and our loans to individuals use a loss rate approach and are assigned to pools based upon risk factors including loan types, origination year and credit scores. Loans evaluated collectively in a pool are monitored to ensure they continue to exhibit similar risk characteristics with other loans in a pool. If a loan does not share similar risk characteristics with other loans, expected credit losses for that loan are evaluated individually.
We have purchased certain loans that as of the date of purchase have experienced more-than-insignificant deterioration in credit quality since origination. Management evaluates these loans against a probability threshold to determine if substantially all of the contractually required payments will be received. With the adoption of ASU 2016-13, PCD loans are recorded at the purchase price plus an allowance for credit losses which becomes the PCD loan's initial amortized cost. The non-credit related discount or premium, the difference between the initial amortized cost and the par value, will be amortized into interest income over the life of the loan. Any further changes to the allowance for credit losses are recorded through provision expense. All PCD loans are evaluated based upon product type within the underlying segment.
Acquired loans that are not deemed credit deteriorated at acquisition are initially measured at fair value as of the acquisition date. Additionally, an allowance is recorded with a corresponding charge to credit loss expense as of the reporting date. The difference between the acquisition date fair value and the contractual amounts due at the acquisition date represents the fair value adjustment. Fair value adjustments may be discounts (or premiums) to a loan’s cost basis and are accreted (or amortized) to interest income over the loan’s remaining contractual life using the level yield method.
Refer to “Part II - Item 7. Management’s Discussion and Analysis of Financial Condition and Results of Operations - Allowance for Credit Losses - Loans”, “Note 1 – Summary of Significant Accounting and Reporting Policies” and “Note 5 – Loans and Allowance for Loan Losses” to our consolidated financial statements included in this report for a detailed description of our estimation process and methodology related to the allowance for loan losses.
Allowance for Credit Losses - AFS Securities. With the adoption of ASU 2016-13 on January 1, 2020, for AFS debt securities in an unrealized loss position where management (i) has the intent to sell or (ii) where it will more-likely-than-not be required to sell the security before the recovery of its amortized cost basis, we write the security down to fair value through income. For those AFS debt securities that do not meet either of these criteria, management assesses whether the decline in fair value has resulted from credit losses or other factors. Management assesses the financial condition and near-term prospects of the issuer, industry and/or geographic conditions, credit ratings as well as other indicators at the individual security level. If a credit loss is determined to exist, the present value of discounted cash flows expected to be collected from the security are compared to the amortized cost basis of the security. If the present value of discounted cash flows expected to be collected is less than the amortized cost basis, a credit loss exists and an allowance for credit loss is recorded, limited by the amount that the fair value is less than the amortized cost. Any impairment that is not recorded through an allowance for credit losses is recognized in comprehensive income. Any future changes in the allowance for credit losses is recorded as provision for (reversal of) credit losses.
Allowance for Credit Losses - HTM Securities. With the adoption of ASU 2016-13 on January 1, 2020, expected credit losses on HTM securities are measured on a collective basis by major security type, when similar risk characteristics exist. Risk characteristics for segmenting HTM debt securities include issuer, maturity, coupon rate, yield, payment frequency, source of repayment, bond payment structure, and embedded options. Upon assignment of the risk characteristics to the major security types, management may further evaluate the qualitative factors associated with these securities to determine the expectation of credit losses, if any.
Refer to “Note 1 – Summary of Significant Accounting and Reporting Policies” and “Note 4 – Securities” to our consolidated financial statements included in this report for a detailed description of our estimation process and methodology related to the allowance for credit losses on securities.
Estimation of Fair Value. The estimation of fair value is significant to a number of our assets and liabilities. In addition, GAAP requires disclosure of the fair value of financial instruments as a part of the notes to the consolidated financial statements. Fair values for securities are volatile and may be influenced by a number of factors, including market interest rates, prepayment speeds, discount rates and the shape of yield curves. Fair values for most investments and MBS are based on
quoted market prices, where available. If quoted market prices are not available, fair values are based on the quoted prices of similar instruments or estimates from independent pricing services. Where there are price variances outside certain ranges from different pricing services for specific securities, those pricing variances are reviewed with other market data to determine which of the price estimates is appropriate for that period. Fair values for our derivatives are based on measurements that consider observable data that may include dealer quotes, market spreads, the U.S. Treasury yield curve, live trading levels, trade execution data, credit information and the derivatives’ terms and conditions, among other things. We validate prices supplied by such sources by comparison to one another.
Defined Benefit Pension Plan. The obligations and related assets, if applicable, of our defined benefit pension plans and our nonfunded supplemental retirement plan are presented in “Note 10 – Employee Benefits” to our consolidated financial statements included in this report. Entry into the Plan by new employees was frozen effective December 31, 2005. On June 18, 2020, the Company’s Board of Directors approved changes to the Plan and Restoration Plan to freeze all future benefit accruals and accrual of benefit service, including consideration of compensation increases, effective December 31, 2020. Effective December 31, 2006, employee benefits under the Acquired Plan were frozen by Omni. In addition, no new participants may be added to the Acquired Plan. Assets in the Plan and Acquired Plan, which consist primarily of marketable equity and debt instruments, are valued using observable market quotations. Obligations and the annual pension expense are determined by independent actuaries and through the use of a number of assumptions that are reviewed by management. Key assumptions in measuring the obligations of the plans include the discount rate and the estimated future return on assets in the Plan and Acquired Plan. The rate of salary increases is another key assumption used in measuring the Plan and Restoration Plan obligations but will no longer be applicable after December 31, 2020, due to the freeze of benefits. The rate of salary increases is not required to measure the obligations of the Acquired Plan since the benefits are frozen.
In determining the discount rate, we utilized a cash flow matching analysis to determine a range of appropriate discount rates for our defined benefit pension and restoration plans. In developing the cash flow matching analysis, we constructed a portfolio of high quality noncallable bonds (rated AA- or better) to match as close as possible the timing of future benefit payments of the plans at December 31, 2020. Based on this cash flow matching analysis, we were able to determine an appropriate discount rate.
The expected long-term rate of return assumption reflects the average return expected based on the investment strategies and asset allocation of the assets invested to provide for the liabilities of the Plan and the Acquired Plan. We considered broad equity and bond indices, long-term return projections, and actual long-term historical performance when evaluating the expected long-term rate of return assumption. Material changes in pension benefit costs may occur in the future due to changes in these assumptions. Future annual amounts could be impacted by changes in the number of participants in the plans, changes in the level of benefits provided, changes in the discount rates, changes in the expected long-term rate of return, changes in the level of contributions to the plans and other factors.
NON-GAAP FINANCIAL MEASURES
Certain non-GAAP measures are used by management to supplement the evaluation of our performance. These include the following fully taxable-equivalent measures: Net interest income (FTE), net interest margin (FTE) and net interest spread (FTE), which include the effects of taxable-equivalent adjustments using a federal income tax rate of 21% for the years ended December 31, 2020, 2019 and 2018, to increase tax-exempt interest income to a tax-equivalent basis. Interest income earned on certain assets is completely or partially exempt from federal income tax. As such, these tax-exempt instruments typically yield lower returns than taxable investments.
Net interest income (FTE), net interest margin (FTE) and net interest spread (FTE). Net interest income (FTE) is a non-GAAP measure that adjusts for the tax-favored status of net interest income from certain loans and investments and is not permitted under GAAP in the consolidated statements of income. We believe this measure to be the preferred industry measurement of net interest income, and that it enhances comparability of net interest income arising from taxable and tax-exempt sources. The most directly comparable financial measure calculated in accordance with GAAP is our net interest income. Net interest margin (FTE) is the ratio of net interest income (FTE) to average earning assets. The most directly comparable financial measure calculated in accordance with GAAP is our net interest margin. Net interest spread (FTE) is the difference in the average yield on average earning assets on a tax-equivalent basis and the average rate paid on average interest bearing liabilities. The most directly comparable financial measure calculated in accordance with GAAP is our net interest spread.
These non-GAAP financial measures should not be considered alternatives to GAAP-basis financial statements and other bank holding companies may define or calculate these non-GAAP measures or similar measures differently. Whenever we present a non-GAAP financial measure in an SEC filing, we are also required to present the most directly comparable financial measure calculated and presented in accordance with GAAP and reconcile the differences between the non-GAAP financial measure and such comparable GAAP measure.
In the following table we present the reconciliation of net interest income to net interest income adjusted to a fully taxable-equivalent basis assuming a 21% marginal tax rate for the years ended December 31, 2020, 2019 and 2018, for interest earned on tax-exempt assets such as municipal loans and investment securities (dollars in thousands), along with the calculation of net interest margin (FTE) and net interest spread (FTE).
| | | | | | | | | | | | | | | | | | | | |
| | Years Ended December 31, |
| | 2020 | | 2019 | | 2018 |
| Net interest income (GAAP) | | $ | 187,265 | | | $ | 169,805 | | | $ | 172,064 | |
| Tax-equivalent adjustments: | | | | | | |
Loans | | 2,752 | | | 2,490 | | | 2,354 | |
Tax-exempt investment securities | | 8,812 | | | 5,148 | | | 7,004 | |
Net interest income (FTE) (1) | | $ | 198,829 | | | $ | 177,443 | | | $ | 181,422 | |
| | | | | | |
| Average earning assets | | $ | 6,486,444 | | | $ | 5,800,648 | | | $ | 5,699,985 | |
| | | | | | |
| Net interest margin | | 2.89 | % | | 2.93 | % | | 3.02 | % |
Net interest margin (FTE) (1) | | 3.07 | % | | 3.06 | % | | 3.18 | % |
| | | | | | |
| Net interest spread | | 2.68 | % | | 2.58 | % | | 2.72 | % |
Net interest spread (FTE) (1) | | 2.86 | % | | 2.71 | % | | 2.88 | % |
(1) These amounts are presented on a fully taxable-equivalent basis and are non-GAAP measures.
Management believes adjusting net interest income, net interest margin and net interest spread to a fully taxable-equivalent basis is a standard practice in the banking industry as these measures provide useful information to make peer comparisons. Tax-equivalent adjustments are reported in the respective earning asset categories as listed in the “Average Balances with Average Yields and Rates” tables under Results of Operations.
OVERVIEW
COVID-19
During March 2020, the World Health Organization declared the COVID-19 a global pandemic in response to the rapidly growing outbreak of the virus. COVID-19 significantly impacted local, national and global economies due to stay-at-home orders and social distancing guidelines. In compliance with social distancing guidelines issued by federal, state and local governments, we initially closed all of our grocery store branches. As stay-at-home orders were issued by local governments in our market areas to combat the spread of the virus, we closed all traditional lobbies and wealth management and trust offices to walk-in customers, however, most of these traditional locations were offering certain services by appointment only. All other banking services were available to customers through our drive-thrus, ATMs/ITMs and automated telephone, internet and mobile banking products. After careful consideration and implementation of additional safety precautions, all locations were reopened on June 1, 2020. We have since made adjustments to select branch hours and openings, and we continue to closely monitor the COVID-19 situation. Approximately 45% of our workforce has remote working capabilities.
COVID-19 significantly disrupted supply chains, business activity and the overall economic and financial markets. These disruptions have and are likely to continue to result in a decline in demand for banking products or services, including loans and deposits which could impact our future financial condition, results of operations and liquidity. The extent to which the COVID-19 pandemic affects our business, operations and financial condition, as well as our regulatory capital and liquidity ratios and credit ratings, is highly uncertain and unpredictable and depends on, among other things, new information that may emerge concerning the scope, duration and severity of the COVID-19 pandemic, actions taken by governmental authorities and other parties in responses to the pandemic, the scale of the distribution and public acceptance of any vaccines for COVID-19 and the effectiveness of such vaccines in stemming or stopping the spread of COVID-19. The adverse impact on the markets in which we operate and on our business, operations and financial condition is expected to remain elevated until the pandemic subsides.
In response to the COVID-19 pandemic, the CARES Act was signed into law on March 27, 2020. The CARES Act provided an estimated $2.2 trillion to address the economic impact of the COVID-19 pandemic and stimulate the economy by supporting individuals and businesses through loans, grants, tax changes, and other types of relief. The CARES Act also included provisions to encourage financial institutions to work prudently with borrowers. As an SBA lender, we were well positioned to assist business customers in accessing funds available through the PPP implemented in April. At December 31, 2020, we had $214.8 million of approved PPP loans outstanding. On December 27, 2020, the Economic Aid Act was signed into law. This second coronavirus relief package granted additional funds for a new round of PPP loans. Additionally, it expands the eligibility for loans and allows certain businesses to request a second loan. The SBA began accepting applications for the second round of PPP loans on January 13, 2021. As of February 23, 2021, we had funded $55 million of additional PPP loans under this second round of PPP loans.
Additionally, we are assisting both our consumer and commercial borrowers that may be experiencing financial hardship due to COVID-19 related challenges. As of December 31, 2020, we had outstanding loans with payment deferrals, generally for up to three months, totaling $47.2 million, a decrease from $326.0 million reported in our second quarter earnings release in July 2020. As of February 23, 2021, we had outstanding loans with payment deferrals totaling $2.5 million. The decrease in the COVID-19 modified loans are the result of the loans coming out of the deferral periods and resuming performance. The largest category of remaining deferrals include 1-4 family residential loans.
OPERATING RESULTS
During the year ended December 31, 2020, our net income increased $7.6 million, or 10.2%, to $82.2 million, from $74.6 million for the same period in 2019. The increase was primarily driven by the $17.5 million increase in net interest income, the $7.4 million increase in noninterest income, partially offset by the $15.1 million increase in the provision for credit losses after adopting CECL and the $4.0 million increase in noninterest expense. Earnings per diluted common share increased $0.27, or 12.3%, to $2.47 for the year ended December 31, 2020, from $2.20 for the same period in 2019. The increase in the provision for credit losses for the year ended December 31, 2020 was primarily due to the economic environment related to COVID-19 and the resulting impact on the economic assumptions used in the CECL model.
During the year ended December 31, 2019, our net income increased $0.4 million, or 0.6%, to $74.6 million, from $74.1 million for the same period in 2018. The increase was largely driven by increases in interest income of $11.6 million and net gain on the sale of AFS securities of $2.6 million, as well as the decrease in provision for loan losses of $3.3 million, partially offset by a $13.9 million increase in interest expense and a $3.1 million increase in income tax expense. Earnings per diluted common share increased $0.09, or 4.3%, to $2.20 for year ended December 31, 2019, from $2.11 for the same period in 2018.
FINANCIAL CONDITION
Our total assets increased $259.3 million, or 3.8%, to $7.01 billion at December 31, 2020 from $6.75 billion at December 31, 2019. Our securities portfolio increased by $202.8 million, or 8.1%, to $2.70 billion, compared to $2.49 billion at December 31, 2019. The increase in our securities portfolio was comprised of an increase of $843.9 million in investment securities, partially offset by a decrease of $641.1 million in MBS as we realigned our portfolio in response to the impact of COVID-19 on the financial markets. The decrease in MBS was partially due to increased prepayments resulting from the lower interest rate environment. Our FHLB stock decreased $24.8 million, or 49.6%, to $25.3 million from $50.1 million at December 31, 2019, primarily due to decreases in the amount of FHLB stock we were required to hold in relation to our FHLB borrowings.
Loans increased $89.6 million, or 2.5%, to $3.66 billion at December 31, 2020 from $3.57 billion at December 31, 2019. The net increase in our loan portfolio was comprised of increases of $155.6 million of commercial loans, $45.5 million of commercial real estate loans and $25.1 million of municipal loans, partially offset by decreases of $67.6 million of 1-4 family residential loans, $63.0 million of construction loans, and $6.0 million of loans to individuals. The increase in commercial loans is due entirely to $214.8 million of PPP loans as of December 31, 2020. Loans held for sale increased $3.3 million, or 864.8%, to $3.7 million at December 31, 2020 from $383,000 at December 31, 2019.
Our nonperforming assets at December 31, 2020 increased $31,000, or 0.2%, to $17.5 million and represented 0.25% of total assets, compared to $17.4 million, or 0.26% of total assets, at December 31, 2019. Nonaccruing loans increased $2.8 million, or 55.4%, to $7.7 million, and the ratio of nonaccruing loans to total loans increased to 0.21% at December 31, 2020, compared to 0.14% at December 31, 2019. Restructured loans were $9.6 million at December 31, 2020, a decrease of 19.7%, from $12.0 million at December 31, 2019. OREO decreased to $106,000 at December 31, 2020 from $472,000 at December 31, 2019.
Our deposits increased $229.6 million, or 4.9%, to $4.93 billion at December 31, 2020 from $4.70 billion at December 31, 2019, which was comprised of an increase of $314.7 million in noninterest bearing deposits, partially offset by a decrease of $85.1 million in interest bearing deposits. The increase was largely driven by PPP loan disbursements and stimulus checks deposited during the second quarter of 2020. Brokered deposits decreased $232.8 million, or 62.8%, for the year ended December 31, 2020.
Total FHLB borrowings decreased $140.2 million, or 14.4%, to $832.5 million at December 31, 2020 from $972.7 million at December 31, 2019.
Our total shareholders’ equity at December 31, 2020 increased 8.8%, or $70.7 million, to $875.3 million, or 12.5% of total assets, compared to $804.6 million, or 11.9% of total assets, at December 31, 2019. The increase in shareholders’ equity was the result of net income of $82.2 million, other comprehensive income of $64.8 million, stock compensation expense of $3.0 million, common stock issued under our dividend reinvestment plan of $1.4 million and net issuance of common stock under employee stock plans of $1.3 million. These increases were partially offset by cash dividends paid of $43.2 million, the repurchase of $31.0 million of our common stock and a reduction to beginning retained earnings of $7.8 million for a cumulative-effect adjustment related to the adoption of CECL.
Economic conditions were significantly impacted by the COVID-19 pandemic in 2020; however, Texas still outperformed the nation in 2020, and our Fort Worth and Austin market areas have continued to perform generally better than many other parts of the country. Texas continues to experience economic growth due to in-migration from other states and company relocation from other states. Economists predict vaccines will drive strong economic growth in the second half of 2021.
Key financial indicators management follows include, but are not limited to, numerous interest rate sensitivity and interest rate risk indicators, credit risk, operations risk, liquidity risk, capital risk, regulatory risk, competition risk, yield curve risk, U.S. agency MBS prepayment risk and economic risk indicators.
BALANCE SHEET STRATEGY
We utilize wholesale funding and securities to enhance our profitability and balance sheet composition by determining acceptable levels of credit, interest rate and liquidity risk consistent with prudent capital management. This balance sheet strategy consists of borrowing a combination of long- and short-term funds from the FHLB or the brokered funds market. These funds are invested primarily in U.S. agency MBS and long-term municipal securities. Although U.S. agency MBS often carry lower yields than traditional mortgage loans and other types of loans we make, these securities generally (i) increase the overall quality of our assets because of either the implicit or explicit guarantees of the U.S. Government, (ii) are more liquid than individual loans and (iii) may be used to collateralize our borrowings or other obligations. While the strategy of investing a portion of our assets in U.S. Agency MBS and municipal securities has historically resulted in lower interest rate spreads and margins, we believe the lower operating expenses and reduced credit risk, combined with the managed interest rate risk of this strategy, have enhanced our overall profitability for many years. At this time, we utilize this balance sheet strategy with the goal of enhancing overall profitability by maximizing the use of our capital.
Risks associated with the asset structure we maintain include a lower net interest rate spread and margin when compared to our peers, changes in the slope of the yield curve, which can reduce our net interest rate spread and margin, increased interest rate risk, the length of interest rate cycles, changes in volatility or spreads associated with the MBS and municipal securities, the unpredictable nature of MBS prepayments and credit risks associated with the municipal securities. See “Part I - Item 1A. Risk Factors – Risks Related to Our Business” in this report for a discussion of risks related to interest rates. Our asset structure, net interest spread and net interest margin require us to closely monitor our interest rate risk. An additional risk is the change in fair value of the AFS securities portfolio as a result of changes in interest rates. Significant increases in interest rates, especially long-term interest rates, could adversely impact the fair value of the AFS securities portfolio, which could also significantly impact our equity capital. Due to the unpredictable nature of MBS prepayments, the length of interest rate cycles and the slope of the interest rate yield curve, net interest income could fluctuate more than simulated under the scenarios modeled by our ALCO and described under “Item 7A. Quantitative and Qualitative Disclosures about Market Risk” in this report.
Determining the appropriate size of the balance sheet is one of the critical decisions any bank makes. Our balance sheet is not merely the result of a series of micro-decisions, but rather the size is controlled based on the economics of assets compared to the economics of funding. The low interest rate environment and economic landscape requires that we monitor the interest rate sensitivity of the assets driving our growth and closely align ALCO objectives accordingly.
The management of our securities portfolio as a percentage of earning assets is guided by the current economics associated with the securities portfolio, changes in our overall loan and deposit levels and changes in our wholesale funding levels. Our balance sheet strategy is designed such that our securities portfolio should help mitigate financial performance associated with potential business and economic cycles that include slower loan growth and higher credit costs.
Our investment securities and U.S. Agency MBS increased from $2.49 billion at December 31, 2019 to $2.70 billion at December 31, 2020. The increase in the securities portfolio was in conjunction with our balance sheet strategy and ALCO objectives.
During 2020, the composition of the securities portfolio changed significantly as municipal and, to a lesser extent, corporate bonds increased while MBS decreased. The decrease in MBS was attributable to higher MBS prepayment speeds and the sale of lower yielding MBS due to the significantly lower interest rate environment that was partially offset by MBS purchases. During January and February, prior to COVID-19, we purchased approximately $168 million of Texas municipal securities, of which approximately $58 million were taxable municipals. During March, the municipal bond market experienced a significant sell-off associated with illiquidity resulting from the COVID-19 financial shock to both the stock and bond markets. When this occurred, we purchased approximately $483 million tax free municipal securities, largely AAA rated, and approximately $8 million of taxable municipals. The decision to purchase large amounts of municipal securities was partially due to heightened COVID-19 related credit quality concerns and its likely impact on 2020 loan growth opportunities. During the remainder of 2020, we found fewer opportunities to purchase bonds meeting our risk reward metrics, therefore the overall book value of the securities portfolio declined as MBS prepayments and security sales exceeded purchases of securities. Purchases during the last three quarters of 2020 included $130 million in highly rated Texas municipal securities, $100 million of which were taxable, $78.4 million in investment grade subordinated debt and $5.8 million in U.S. Agency MBS. Sales included approximately $50 million of lower yielding fixed rate AFS MBS, $45 million low yielding AFS tax free municipals, $10 million of lower yielding taxable municipal securities and $6 million of corporate bonds. Sales of AFS securities for the year ended December 31, 2020 resulted in a net realized gain of $8.3 million.
At December 31, 2020, securities as a percentage of assets totaled 38.5%, compared to 36.9% at December 31, 2019, due to the $202.8 million, or 8.1%, increase in the securities portfolio which exceeded our loan growth of 2.5%, or $89.6 million. If loan growth, net of PPP loans, materializes, we may modify the strategy of our securities portfolio. Our balance sheet management strategy is dynamic and is continually evaluated as market conditions warrant. As interest rates, yield curves, MBS prepayments, funding costs, security spreads and loan and deposit portfolios change, our determination of the proper
types, amount and maturities of securities to invest in, as well as funding needs and funding sources, will continue to be evaluated. Should the economics of purchasing securities decrease, we may allow the securities portfolio to shrink through run-off or security sales. However, should the economics become more attractive, we may strategically increase the securities portfolio and the balance sheet.
With respect to liabilities, we continue to primarily utilize a combination of deposits and FHLB borrowings to achieve our strategy of minimizing cost while achieving overall interest rate risk objectives as well as the liability management objectives of the ALCO. Our primary wholesale funding source is FHLB borrowings and to a lesser extent we utilize federal funds purchased, the FRDW and brokered deposits. Our FHLB borrowings decreased 14.4%, or $140.2 million, to $832.5 million at December 31, 2020 from $972.7 million at December 31, 2019.
In connection with our borrowings, the Bank has entered into various variable rate agreements and fixed rate short-term pay agreements. These agreements totaled $670.0 million and $310.0 million at December 31, 2020 and 2019, respectively. Six of the agreements have an interest rate tied to three-month LIBOR and the remaining agreements have interest rates tied to one-month LIBOR. In connection with all agreements outstanding on December 31, 2020, Southside Bank also entered into various interest rate swap contracts that are treated as cash flow hedges under ASC Topic 815, “Derivatives and Hedging” that are expected to be effective in hedging the variability in future cash flows attributable to fluctuations in the underlying LIBOR interest rate. The interest rate swap contracts had an average interest rate of 1.12% with an average weighted maturity of 3.8 years at December 31, 2020. These transactions are reevaluated on a monthly basis to determine if the hedged forecasted transactions are still probable of occurring. If at a subsequent evaluation, it is determined that the transactions will not occur, any related gains or losses recorded in AOCI are immediately recognized in earnings. Refer to “Note 11 – Derivative Financial Instruments and Hedging Activities” in our consolidated financial statements included in this report for a detailed description of our hedging policy and methodology related to derivative instruments.
On November 6, 2020, the Company issued $100.0 million in aggregate principal amount of fixed-to-floating rate subordinated notes that mature on November 15, 2030. This debt initially bears interest at a fixed rate of 3.875% per year through November 14, 2025 and thereafter, adjusts quarterly at a floating rate equal to the then current three-month SOFR, as published by the FRBNY, plus 366 basis points. The proceeds from the sale of the subordinated notes were used for general corporate purposes. The unamortized discount and debt issuance costs deducted from the subordinated notes totaled approximately $1.5 million at December 31, 2020.
Our brokered CDs decreased $262.9 million, or 71.9%, from $365.7 million at December 31, 2019 to $102.8 million at December 31, 2020. At December 31, 2020, our brokered CDs had a weighted average cost of 18 basis points and remaining maturities of less than two years. To provide management flexibility in managing the interest rate risk of wholesale funding, the ALCO has approved up to $50.0 million to issue brokered deposits to replace those maturing within 30 days. Our wholesale funding policy allows for maximum brokered deposits of $450 million. This brokered deposit maximum limit could increase or decrease depending on changes in ALCO objectives. Potential higher interest expense and lack of customer loyalty are risks associated with the use of brokered CDs.
During the year ended December 31, 2020, the increase in our deposits resulted in a decrease in our total wholesale funding as a percentage of deposits, not including brokered deposits, to 20.2% at December 31, 2020 from 31.0% at December 31, 2019.
RESULTS OF OPERATIONS
Our results of operations are dependent primarily on net interest income, which is the difference between the interest income earned on assets (loans and investments) and interest expense due on our funding sources (deposits and borrowings) during a particular period. Results of operations are also affected by our noninterest income, provision for credit losses, noninterest expenses and income tax expense. General economic and competitive conditions, particularly changes in interest rates, changes in interest rate yield curves, prepayment rates of MBS and loans, repricing of loan relationships, government policies and actions of regulatory authorities also significantly affect our results of operations. Future changes in applicable law, regulations or government policies may also have a material impact on us. The adoption of CECL and the COVID-19 pandemic significantly impacted our results of operations in 2020 and is likely to continue to impact our results of operations into 2021.
The following table presents net interest income for the periods presented (in thousands):
| | | | | | | | | | | | | | | | | | | | |
| | | Years Ended December 31, |
| | | 2020 | | 2019 | | 2018 |
| Interest income: | | | | | | |
| Loans | | $ | 158,450 | | | $ | 170,288 | | | $ | 158,691 | |
| Taxable investment securities | | 4,172 | | | 167 | | | 417 | |
| Tax-exempt investment securities | | 33,416 | | | 16,856 | | | 24,960 | |
| MBS | | 34,319 | | | 50,486 | | | 41,584 | |
| FHLB stock and equity investments | | 1,233 | | | 1,654 | | | 1,595 | |
| Other interest earning assets | | 238 | | | 1,336 | | | 1,918 | |
| Total interest income | | 231,828 | | | 240,787 | | | 229,165 | |
| Interest expense: | | | | | | |
| Deposits | | 24,648 | | | 44,565 | | | 35,864 | |
| FHLB borrowings | | 11,397 | | | 17,719 | | | 12,813 | |
| Subordinated notes | | 6,301 | | | 5,661 | | | 5,659 | |
| Trust preferred subordinated debentures | | 1,829 | | | 2,775 | | | 2,610 | |
| Other borrowings | | 388 | | | 262 | | | 155 | |
| Total interest expense | | 44,563 | | | 70,982 | | | 57,101 | |
| Net interest income | | $ | 187,265 | | | $ | 169,805 | | | $ | 172,064 | |
NET INTEREST INCOME
Net interest income is one of the principal sources of a financial institution’s earnings stream and represents the difference or spread between interest and fee income generated from interest earning assets and the interest expense paid on interest bearing liabilities. Fluctuations in interest rates or interest rate yield curves, as well as repricing characteristics and volume and changes in the mix of interest earning assets and interest bearing liabilities, materially impact net interest income. During the first quarter of 2020, the Federal Reserve reduced target federal funds rate by 150 basis points. During the second half of 2019, the Federal Reserve decreased the federal funds rate by 75 basis points. Throughout the year ended December 31, 2018, the Federal Reserve increased the federal funds rate by a total of 100 basis points.
Net interest income for the year ended December 31, 2020 increased $17.5 million, or 10.3%, to $187.3 million, compared to $169.8 million for the same period in 2019. The increase in net interest income for the year ended December 31, 2020 was due to the decrease in interest expense on our interest bearing liabilities, a result of lower funding costs on our interest bearing liabilities that more than offset the decrease in interest income due to a lower yield on our interest earning assets. Total interest income decreased $9.0 million, or 3.7%, to $231.8 million for the year ended December 31, 2020, compared to $240.8 million for the same period in 2019. Total interest expense decreased $26.4 million, or 37.2%, to $44.6 million for the year ended December 31, 2020, compared to $71.0 million for the same period in 2019. Our net interest margin (FTE), a non-GAAP measure, increased to 3.07% for the year ended December 31, 2020, compared to 3.06% for the same period in 2019, and our net interest spread (FTE), also a non-GAAP measure, increased to 2.86%, compared to 2.71% for the same period in 2019. See “Non-GAAP Financial Measures” for more information and for a reconciliation to GAAP.
Net interest income for the year ended December 31, 2019, decreased $2.3 million, or 1.3%, to $169.8 million, compared to $172.1 million for the same period in 2018. The decrease in net interest income was due to an increase in interest expense, a result of the higher funding costs of our interest bearing liabilities and, to a lesser extent, an increase in the average balance of our interest bearing liabilities. Total interest income increased $11.6 million, or 5.1%, to $240.8 million for the year ended
December 31, 2019, compared to $229.2 million for the same period in 2018. Total interest expense increased $13.9 million, or 24.3%, to $71.0 million for the year ended December 31, 2019, compared to $57.1 million for the same period in 2018. The increase in interest expense was partially offset by the increase in interest income on our interest earning assets, a result of higher interest rates and a shift in the mix of earning assets. Our net interest margin (FTE) decreased to 3.06% for the year ended December 31, 2019, compared to 3.18% for the same period in 2018 and our net interest spread (FTE) decreased to 2.71%, compared to 2.88% for the same period in 2018. See “Non-GAAP Financial Measures” for more information, and for a reconciliation to GAAP.
ANALYSIS OF CHANGES IN INTEREST INCOME AND INTEREST EXPENSE
The following table presents on a fully taxable-equivalent basis, a non-GAAP measure, the net change in net interest income and sets forth the dollar amount of increase (decrease) in the average volume of interest earning assets and interest bearing liabilities and from changes in yields/rates. Volume/Yield/Rate variances (change in volume times change in yield/rate) have been allocated to amounts attributable to changes in volumes and to changes in yields/rates in proportion to the amounts directly attributable to those changes (in thousands):
| | | | | | | | | | | | | | | | | | | | | | | | | | | | | | | | | | | |
| | Years Ended December 31, 2020 Compared to 2019 | | Years Ended December 31, 2019 Compared to 2018 |
| Change Attributable to | | Total Change | | Change Attributable to | | Total Change |
| Fully Taxable-Equivalent Basis: | Average Volume | | Average Yield/Rate | | | Average Volume | | Average Yield/Rate | |
| Interest income on: | | | | | | | | | | | |
Loans (1) | $ | 15,413 | | | $ | (27,030) | | | $ | (11,617) | | | $ | 6,746 | | | $ | 4,987 | | | $ | 11,733 | |
| Loans held for sale | 57 | | | (16) | | | 41 | | | 4 | | | (4) | | | — | |
| Taxable investment securities | 4,025 | | | (20) | | | 4,005 | | | (355) | | | 105 | | | (250) | |
Tax-exempt investment securities (1) | 21,414 | | | (1,190) | | | 20,224 | | | (7,149) | | | (2,811) | | | (9,960) | |
| Mortgage-backed and related securities | (9,836) | | | (6,331) | | | (16,167) | | | 6,050 | | | 2,852 | | | 8,902 | |
| FHLB stock, at cost, and equity investments | 103 | | | (524) | | | (421) | | | 22 | | | 37 | | | 59 | |
| Interest earning deposits | (435) | | | (577) | | | (1,012) | | | (656) | | | 282 | | | (374) | |
| Federal funds sold | (86) | | | — | | | (86) | | | (334) | | | 126 | | | (208) | |
| Total earning assets | 30,655 | | | (35,688) | | | (5,033) | | | 4,328 | | | 5,574 | | | 9,902 | |
| Interest expense on: | | | | | | | | | | | |
| Savings accounts | 184 | | | (419) | | | (235) | | | 18 | | | 127 | | | 145 | |
| CDs | 679 | | | (7,369) | | | (6,690) | | | (177) | | | 5,806 | | | 5,629 | |
| Interest bearing demand accounts | 940 | | | (13,932) | | | (12,992) | | | (122) | | | 3,049 | | | 2,927 | |
| FHLB borrowings | 2,888 | | | (9,210) | | | (6,322) | | | 2,858 | | | 2,048 | | | 4,906 | |
| Subordinated notes, net of unamortized debt issuance costs | 851 | | | (211) | | | 640 | | | 9 | | | (7) | | | 2 | |
| Trust preferred subordinated debentures, net of unamortized debt issuance costs | — | | | (946) | | | (946) | | | — | | | 165 | | | 165 | |
| Other borrowings | 449 | | | (323) | | | 126 | | | 76 | | | 31 | | | 107 | |
| Total interest bearing liabilities | 5,991 | | | (32,410) | | | (26,419) | | | 2,662 | | | 11,219 | | | 13,881 | |
| Net change | $ | 24,664 | | | $ | (3,278) | | | $ | 21,386 | | | $ | 1,666 | | | $ | (5,645) | | | $ | (3,979) | |
(1)Interest yields on loans and securities that are nontaxable for federal income tax purposes are presented on a fully taxable-equivalent basis assuming a marginal tax rate of 21% for 2020, 2019 and 2018. See “Non-GAAP Financial Measures.”
The decrease in total interest income was attributable to the decrease in the average yield on earning assets to 3.75% for the year ended December 31, 2020 from 4.28% for the year ended December 31, 2019, partially offset by the increase in average earning assets of $685.8 million, or 11.8%. The decrease in the average yield on total earning assets during the year ended December 31, 2020 was a result of decreases across the entire interest rate yield curve during the first quarter of 2020 and the tightening credit spreads that occurred primarily during the last half of the year. The increase in average earning assets was primarily the result of the increases in the investment securities and the PPP loan portfolio, partially offset by a decrease in MBS.
The increase in total interest income for the year ended December 31, 2019 was attributable to the increase in the average yield on earning assets to 4.28%, from 4.18% for the year ended December 31, 2018 and the increase in average earning assets of $100.7 million, or 1.8%, to $5.80 billion for the year ended December 31, 2019, from $5.70 billion for the same period in 2018. The increase in the average yield on total earning assets during the year ended December 31, 2019 was a result of increases in the federal funds rate during 2018. The increase in average earning assets was primarily the result of the increases
in the loan portfolio and MBS, partially offset by the decreases in investment securities, interest earning deposits and federal funds sold.
The decrease in total interest expense for the year ended December 31, 2020 was attributable to an overall decline in interest rates during the first quarter and the resulting decrease in the average rates paid on total interest bearing liabilities to 0.89% for the year ended December 31, 2020 from 1.57% for the year ended December 31, 2019. This was partially offset by the increase in average interest bearing liabilities.
The increase in total interest expense for the year ended December 31, 2019, was attributable to the increase in the average rates paid on total interest bearing liabilities to 1.57% for the year ended December 31, 2019 from 1.30% for the year ended December 31, 2018, and to a lesser extent, an increase in average interest bearing liabilities of $134.6 million, or 3.1%, to $4.52 billion during the year ended December 31, 2019 from $4.39 billion during the year ended December 31, 2018. The increase in average rates paid on interest bearing liabilities was due to the increases in the federal funds rate during 2018. The increase in average interest bearing liabilities was primarily the result of the increases in average FHLB borrowings and other borrowings, partially offset by decreases in average CDs and interest bearing demand accounts.
Interest bearing demand, savings and noninterest bearing demand deposits are considered the lowest cost deposits and increased to 76.2% of total average deposits for the year ended December 31, 2020 from 74.4% for the years ended December 31, 2019 and 2018.
At December 31, 2020, our brokered CDs had remaining maturities of less than two years. At December 31, 2020, brokered CDs decreased to 2.1% of deposits compared to 7.8% of deposits at December 31, 2019, and 5.4% at December 31, 2018. Our wholesale funding policy currently allows maximum brokered CDs of $450 million; however, this amount could increase or decrease depending on changes in ALCO objectives. The potential higher interest expense and lack of customer loyalty are risks associated with the use of brokered CDs.
AVERAGE BALANCES WITH AVERAGE YIELDS AND RATES
The following table presents average earning assets and interest bearing liabilities together with the average yield on the earning assets and the average rate of the interest bearing liabilities for the years ended December 31, 2020, 2019 and 2018. The interest and related yields presented are on an FTE basis and are therefore, non-GAAP measures. See “Non-GAAP Financial Measures” for more information, and for a reconciliation to GAAP. The information should be reviewed in conjunction with the consolidated financial statements for the same years then ended (dollars in thousands):
| | | | | | | | | | | | | | | | | | | | | | | | | | | | | | | | | | | | | | | | | | | | | | | | | | | | | |
| Average Balances with Average Yields and Rates |
| Year Ended |
| December 31, 2020 | | December 31, 2019 | | December 31, 2018 |
| Average Balance | | Interest | | Avg Yield/Rate | | Average Balance | | Interest | | Avg Yield/Rate | | Average Balance | | Interest | | Avg Yield/Rate |
| ASSETS | | | | | | | | | | | | | | | | | |
Loans (1) | $ | 3,750,657 | | | $ | 161,098 | | | 4.30 | % | | $ | 3,426,171 | | | $ | 172,715 | | | 5.04 | % | | $ | 3,290,651 | | | $ | 160,982 | | | 4.89 | % |
| Loans held for sale | 3,254 | | | 104 | | | 3.20 | % | | 1,551 | | | 63 | | | 4.06 | % | | 1,451 | | | 63 | | | 4.34 | % |
| Securities: | | | | | | | | | | | | | | | | | |
Taxable investment securities (2) | 133,785 | | | 4,172 | | | 3.12 | % | | 4,785 | | | 167 | | | 3.49 | % | | 15,790 | | | 417 | | | 2.64 | % |
Tax-exempt investment securities (2) | 1,201,385 | | | 42,228 | | | 3.51 | % | | 593,729 | | | 22,004 | | | 3.71 | % | | 781,127 | | | 31,964 | | | 4.09 | % |
Mortgage-backed and related securities (2) | 1,311,722 | | | 34,319 | | | 2.62 | % | | 1,665,686 | | | 50,486 | | | 3.03 | % | | 1,462,055 | | | 41,584 | | | 2.84 | % |
| Total securities | 2,646,892 | | | 80,719 | | | 3.05 | % | | 2,264,200 | | | 72,657 | | | 3.21 | % | | 2,258,972 | | | 73,965 | | | 3.27 | % |
| FHLB stock, at cost, and equity investments | 59,439 | | | 1,233 | | | 2.07 | % | | 55,752 | | | 1,654 | | | 2.97 | % | | 54,998 | | | 1,595 | | | 2.90 | % |
| Interest earning deposits | 26,202 | | | 238 | | | 0.91 | % | | 50,252 | | | 1,250 | | | 2.49 | % | | 78,266 | | | 1,624 | | | 2.07 | % |
| Federal funds sold | — | | | — | | | — | | | 2,722 | | | 86 | | | 3.16 | % | | 15,647 | | | 294 | | | 1.88 | % |
| Total earning assets | 6,486,444 | | | 243,392 | | | 3.75 | % | | 5,800,648 | | | 248,425 | | | 4.28 | % | | 5,699,985 | | | 238,523 | | | 4.18 | % |
| Cash and due from banks | 79,677 | | | | | | | 76,895 | | | | | | | 77,946 | | | | | |
| Accrued interest and other assets | 664,511 | | | | | | | 547,241 | | | | | | | 473,639 | | | | | |
| Less: Allowance for loan losses | (50,807) | | | | | | | (25,608) | | | | | | | (24,378) | | | | | |
| Total assets | $ | 7,179,825 | | | | | | | $ | 6,399,176 | | | | | | | $ | 6,227,192 | | | | | |
| LIABILITIES AND SHAREHOLDERS’ EQUITY | | | | | | | | | | | | | | | | | |
| Savings accounts | $ | 440,346 | | | 817 | | | 0.19 | % | | $ | 366,606 | | | 1,052 | | | 0.29 | % | | $ | 359,509 | | | 907 | | | 0.25 | % |
| CDs | 1,182,938 | | | 17,051 | | | 1.44 | % | | 1,149,171 | | | 23,741 | | | 2.07 | % | | 1,160,423 | | | 18,112 | | | 1.56 | % |
| Interest bearing demand accounts | 2,061,805 | | | 6,780 | | | 0.33 | % | | 1,963,936 | | | 19,772 | | | 1.01 | % | | 1,978,140 | | | 16,845 | | | 0.85 | % |
| Total interest bearing deposits | 3,685,089 | | | 24,648 | | | 0.67 | % | | 3,479,713 | | | 44,565 | | | 1.28 | % | | 3,498,072 | | | 35,864 | | | 1.03 | % |
| FHLB borrowings | 1,032,269 | | | 11,397 | | | 1.10 | % | | 868,859 | | | 17,719 | | | 2.04 | % | | 720,785 | | | 12,813 | | | 1.78 | % |
| Subordinated notes, net of unamortized debt issuance costs | 113,736 | | | 6,301 | | | 5.54 | % | | 98,491 | | | 5,661 | | | 5.75 | % | | 98,327 | | | 5,659 | | | 5.76 | % |
| Trust preferred subordinated debentures, net of unamortized debt issuance costs | 60,252 | | | 1,829 | | | 3.04 | % | | 60,248 | | | 2,775 | | | 4.61 | % | | 60,243 | | | 2,610 | | | 4.33 | % |
| Other borrowings | 91,940 | | | 388 | | | 0.42 | % | | 15,645 | | | 262 | | | 1.67 | % | | 10,880 | | | 155 | | | 1.42 | % |
| Total interest bearing liabilities | 4,983,286 | | | 44,563 | | | 0.89 | % | | 4,522,956 | | | 70,982 | | | 1.57 | % | | 4,388,307 | | | 57,101 | | | 1.30 | % |
| Noninterest bearing deposits | 1,277,011 | | | | | | | 1,017,836 | | | | | | | 1,040,447 | | | | | |
| Accrued expenses and other liabilities | 90,548 | | | | | | | 76,017 | | | | | | | 47,176 | | | | | |
| Total liabilities | 6,350,845 | | | | | | | 5,616,809 | | | | | | | 5,475,930 | | | | | |
| Shareholders’ equity | 828,980 | | | | | | | 782,367 | | | | | | | 751,262 | | | | | |
| Total liabilities and shareholders’ equity | $ | 7,179,825 | | | | | | | $ | 6,399,176 | | | | | | | $ | 6,227,192 | | | | | |
| Net interest income (FTE) | | | $ | 198,829 | | | | | | | $ | 177,443 | | | | | | | $ | 181,422 | | | |
| Net interest margin (FTE) | | | | | 3.07 | % | | | | | | 3.06 | % | | | | | | 3.18 | % |
| Net interest spread (FTE) | | | | | 2.86 | % | | | | | | 2.71 | % | | | | | | 2.88 | % |
(1)Interest on loans includes net fees on loans that are not material in amount.
(2)For the purpose of calculating the average yield, the average balance of securities is presented at historical cost.
Note: As of December 31, 2020, 2019 and 2018, loans totaling $7.7 million, $5.0 million and $35.8 million, respectively, were on nonaccrual status. Our policy is to reverse previously accrued but unpaid interest on nonaccrual loans; thereafter, interest income is recorded to the extent received when appropriate.
PROVISION FOR LOAN LOSSES
The provision for loan losses was $20.1 million, $5.1 million and $8.4 million for the years ended December 31, 2020, 2019 and 2018, respectively. See the section captioned “Allowance for Credit Losses - Loans” elsewhere in this discussion for further analysis of the provision for loan losses.
As of December 31, 2020, and 2019, our reviews of the loan portfolio indicated that loan loss allowances of $49.0 million and $24.8 million, respectively, were appropriate to cover expected credit losses in 2020 and probable losses in 2019 in the portfolio.
NONINTEREST INCOME
Noninterest income consists of revenue generated from a broad range of financial services and activities and other fee generating services that we either provide or in which we participate.
The following table details the categories included in noninterest income for the years ended December 31, 2020, 2019 and 2018 (dollars in thousands):
| | | | | | | | | | | | | | | | | | | | | | | | | | | | | | | | | | | | | | | | | | | |
| 2020 | | | | Increase
(Decrease) | | 2019 | | Increase
(Decrease) | | 2018 |
| Deposit services | $ | 24,359 | | | | | $ | (1,679) | | | (6.4) | % | | $ | 26,038 | | | $ | 956 | | | 3.8 | % | | $ | 25,082 | |
| Net gain (loss) on sale of securities AFS | 8,257 | | | | | 7,501 | | | 992.2 | % | | 756 | | | 2,595 | | | (141.1) | % | | (1,839) | |
| Gain on sale of loans | 2,772 | | | | | 2,263 | | | 444.6 | % | | 509 | | | (183) | | | (26.4) | % | | 692 | |
| Trust fees | 5,133 | | | | | (1,136) | | | (18.1) | % | | 6,269 | | | (563) | | | (8.2) | % | | 6,832 | |
| BOLI | 2,554 | | | | | 247 | | | 10.7 | % | | 2,307 | | | (616) | | | (21.1) | % | | 2,923 | |
| Brokerage services | 2,271 | | | | | 191 | | | 9.2 | % | | 2,080 | | | 93 | | | 4.7 | % | | 1,987 | |
| Other noninterest income | 4,386 | | | | | (23) | | | (0.5) | % | | 4,409 | | | (687) | | | (13.5) | % | | 5,096 | |
| Total noninterest income | $ | 49,732 | | | | | $ | 7,364 | | | 17.4 | % | | $ | 42,368 | | | $ | 1,595 | | | 3.9 | % | | $ | 40,773 | |
The 17.4% increase in noninterest income for the year ended December 31, 2020, when compared to the same period in 2019, was primarily due to the increases in net gain on sale of securities AFS and gain on sale of loans, partially offset by decreases in deposit services income and trust fees. The 3.9% increase in noninterest income for the year ended December 31, 2019, when compared to the same period in 2018, was primarily due to an increase in net gain on sale of securities AFS and deposit services income, partially offset by decreases in other noninterest income, BOLI, trust fees and gain on sale of loans.
The decrease in deposit services income for the year ended December 31, 2020, when compared to the same period in 2019, was primarily the result of a decrease in overdraft income due to a general decline in customer spending activity driven by the economic impact of COVID-19, as well as an increase in funds available to customers through government issued stimulus checks and additional unemployment benefits. The increase in deposit services income for the year ended December 31, 2019, when compared to the same period in 2018, is primarily a result of net increases in our debit card income and an increase in our overdraft income during the year ended December 31, 2019.
During the year ended December 31, 2020, we sold primarily MBS, municipal securities and corporate bonds that resulted in a net gain on sale of AFS securities of $8.3 million. During the year ended December 31, 2019, we sold Texas municipal securities and MBS that resulted in a net gain on sale of AFS securities of $756,000. During the year ended December 31, 2018, we primarily sold MBS, U.S. Treasury securities and Texas municipal securities that resulted in a net loss on sale of AFS securities of $1.8 million.
Gain on sale of loans increased for the year ended December 31, 2020, when compared to the same period in 2019, due to an increase in the volume of mortgage loans sold as overall mortgage loan production increased during 2020 as a result of lower interest rates. The decrease in gain on sale of loans for the year ended December 31, 2019, when compared to the same period in 2018, was due to a decrease in return on and volume of sold loans.
The decrease in trust fees for the year ended December 31, 2020, when compared to the same period in 2019, was primarily due to a decrease in assets under management. The market value of our wealth management and trust assets under management, which are not reflected in our consolidated balance sheets, decreased 8.4%, during 2020 and were approximately $1.58 billion at December 31, 2020, compared to $1.72 billion at December 31, 2019. The decrease in trust fees for the year ended December 31, 2019, when compared to the same period in 2018, was the result of the integration of the trust fee billing cycle during the first quarter of 2018 in connection with the Diboll acquisition and general market fluctuations.
The increase in BOLI income during the year ended December 31, 2020, was due to $12.5 million in additional BOLI purchased during the second quarter of 2020. The decrease in BOLI income during the year ended December 31, 2019 was primarily due to the death benefits realized in the second quarter of 2018 for a retired covered officer.
Other noninterest income decreased for the year ended December 31, 2019, compared to the same period in 2018, primarily due to a decrease in mortgage servicing fee income, a partial loss on fair value hedge interest rate swaps and a decrease in credit card fee income, partially offset by increases in swap fee income and investment income.
NONINTEREST EXPENSE
We incur certain types of noninterest expenses associated with the operation of our various business activities. The following table details the categories included in noninterest expense for the years ended December 31, 2020, 2019 and 2018 (dollars in thousands):
| | | | | | | | | | | | | | | | | | | | | | | | | | | | | | | | | | | | | | | | | | | |
| 2020 | | | | Increase
(Decrease) | | 2019 | | Increase
(Decrease) | | 2018 |
| Salaries and employee benefits | $ | 77,225 | | | | | $ | 3,494 | | | 4.7 | % | | $ | 73,731 | | | $ | 3,088 | | | 4.4 | % | | $ | 70,643 | |
| Net occupancy | 14,369 | | | | | 1,241 | | | 9.5 | % | | 13,128 | | | (686) | | | (5.0) | % | | 13,814 | |
| Acquisition expense | — | | | | | — | | | — | | | — | | | (2,413) | | | (100.0) | % | | 2,413 | |
| Advertising, travel & entertainment | 2,147 | | | | | (817) | | | (27.6) | % | | 2,964 | | | 70 | | | 2.4 | % | | 2,894 | |
| ATM expense | 1,018 | | | | | 124 | | | 13.9 | % | | 894 | | | (196) | | | (18.0) | % | | 1,090 | |
| Professional fees | 4,224 | | | | | (493) | | | (10.5) | % | | 4,717 | | | 682 | | | 16.9 | % | | 4,035 | |
| Software and data processing | 4,957 | | | | | 420 | | | 9.3 | % | | 4,537 | | | 541 | | | 13.5 | % | | 3,996 | |
| Communications | 1,984 | | | | | 43 | | | 2.2 | % | | 1,941 | | | 94 | | | 5.1 | % | | 1,847 | |
| FDIC insurance | 1,124 | | | | | 265 | | | 30.8 | % | | 859 | | | (1,012) | | | (54.1) | % | | 1,871 | |
| Amortization of intangibles | 3,617 | | | | | (801) | | | (18.1) | % | | 4,418 | | | (795) | | | (15.3) | % | | 5,213 | |
| Other noninterest expense | 12,642 | | | | | 534 | | | 4.4 | % | | 12,108 | | | (175) | | | (1.4) | % | | 12,283 | |
| Total noninterest expense | $ | 123,307 | | | | | $ | 4,010 | | | 3.4 | % | | $ | 119,297 | | | $ | (802) | | | (0.7) | % | | $ | 120,099 | |
The increase in noninterest expense for the year ended December 31, 2020, compared to the same period in 2019, was the result of increases in salaries and employee benefits, net occupancy expense, other noninterest expense, software and data processing expense and FDIC insurance, partially offset by decreases in advertising, travel and entertainment expense, amortization of intangibles and professional fees. The decrease in noninterest expense for the year ended December 31, 2019, compared to the same period in 2018, was the result of decreases in acquisition expense, ATM expense, FDIC insurance and amortization of intangibles, partially offset by increases in salaries and employee benefits, professional fees and software and data processing expense.
Salaries and employee benefits expense increased during the year ended December 31, 2020, compared to the same period in 2019, due to increases in direct salary expense and retirement expense, partially offset by a decline in health insurance expense. Salaries and employee benefits expense increased for the year ended December 31, 2019, compared to the same period in 2018, due to increases in insurance expense, direct salary expense and retirement expense.
Direct salary expense increased $2.5 million, or 4.0%, for the year ended December 31, 2020, compared to the same period in 2019, due to normal salary increases effective in the first quarter of 2020, and to a lesser extent, the addition of several new commercial lenders. Direct salary expense increased $1.1 million, or 1.8%, for the year ended December 31, 2019, compared to the same period in 2018, due to normal salary increases effective in the first quarter of 2019, partially offset by one-time bonus payments in the first quarter of 2018 of $744,000 to certain employees in response to the benefits received from the Tax Cuts and Jobs Act.
Retirement expense, included in salaries and employee benefits, increased $1.9 million, or 46.4%, for the year ended December 31, 2020, compared to the same period in 2019. The increase was due to increases in our deferred compensation plan expense, defined benefit expense, 401(k) plan matching expense, ESOP expense and split dollar agreement expense. The increase in deferred compensation expense was due to entry into additional deferred compensation agreements. The increase in the defined benefit expense is due primarily to the decrease in the discount rate associated with the re-measurement of the defined benefit plan at June 30, 2020 in connection with freezing the defined benefit plan to further benefit accruals as of December 31, 2020. The increase in 401(k) plan matching expense was related to an increase in eligible matching participants during the second quarter of 2020. Retirement expense increased $700,000, or 21.0%, for the year ended December 31, 2019, compared to the same period in 2018. The increase was primarily due to increases in our split dollar agreement expense. This
increase was primarily due to the nonrecurring reversal of a split dollar liability during the second quarter of 2018 related to the death of a retired covered officer.
Health and life insurance expense, included in salaries and employee benefits, decreased $833,000, or 10.4%, for the year ended December 31, 2020 compared to the same period in 2019. The decrease for 2020 was due to decreases in both health claims expense and health plan administrative costs. For the year ended December 31, 2019, health and life insurance expense increased $1.3 million, or 18.9%, compared to the same period in 2018, due to increased health claim expense. We have a self-insured health plan which is supplemented with a stop loss insurance policy. Health insurance costs are rising nationwide and these costs may continue to increase during 2021.
Net occupancy expense increased during the year ended December 31, 2020, compared to the same period in 2019, due to increased depreciation, rent expense and other occupancy related expense primarily associated with relocating a branch location and the early termination of three branch leases.
For the year ended December 31, 2018, acquisition expense consisted of $1.3 million in change in control payment accruals and severance payments, $1.1 million in additional professional fees and $44,000 in travel expenses, both of the latter related primarily to systems integration.
Advertising, travel and entertainment expense decreased during the year ended December 31, 2020, compared to the same period in 2019, primarily due to decreases in travel, meals and entertainment and media advertising as a result of COVID-19.
ATM expense increased for the year ended December 31, 2020, compared to the same period in 2019, due to higher ATM maintenance expense as new ATMs and ITMs were put into service. ATM expense decreased for the year ended December 31, 2019, compared to the same period in 2018, due to higher ATM expense recognized prior to full integration of the former Diboll locations in 2018.
Professional fees decreased for the year ended December 31, 2020, compared to the same period in 2019, due to lower legal expense and other professional fees. For the year ended December 31, 2019, professional fees increased compared to the same period in 2018, due to increases in legal, audit fees and consulting fees in 2019.
Software and data processing expense increased for the year ended December 31, 2020, compared to the same period in 2019, and increased for the year ended December 31, 2019, compared to the same period in 2018, due to entry into several new software contracts.
FDIC insurance increased for the year ended December 31, 2020, compared to the same period in 2019, and decreased for the year ended December 31, 2019, compared to the same period in 2018, primarily due to a small bank assessment credit issued by the FDIC and utilized in the second half of 2019 and the first half of 2020.
Amortization of intangibles decreased for the year ended December 31, 2020, compared to the same period in 2019, and decreased for the year ended December 31, 2019, compared to the same period in 2018, due primarily to a decrease in core deposit intangible amortization which is recognized on an accelerated method resulting in a decline in expense over time.
Other noninterest expense increased for the year ended December 31, 2020, compared to the same period in 2019, primarily due to retirement expense related to the Plan and Restoration Plan freeze and remeasurement during the second quarter of 2020 as well as a curtailment on the Acquired Plan.
INCOME TAXES
Pre-tax income for the year ended December 31, 2020 was $93.5 million compared to $87.8 million for the year ended December 31, 2019, and $84.3 million for the year ended December 31, 2018.
Income tax expense was $11.3 million for the year ended December 31, 2020 and represented a decrease of $1.9 million, or 14.3%, compared to the year ended December 31, 2019, and increased $3.1 million, or 30.1%, to $13.2 million for the year ended December 31, 2019, compared to $10.2 million for the year ended December 31, 2018. The ETR as a percentage of pre-tax income was 12.1% in 2020, 15.1% in 2019 and 12.1% in 2018. The decrease in the income tax expense and ETR for the year ended December 31, 2020, compared to the same period in 2019, was mainly due to an increase in tax-exempt income as a percentage of pre-tax income.
The increase in the income tax expense and ETR for the year ended December 31, 2019, compared to the same period in 2018, was mainly due to a decrease in tax-exempt income as a percentage of pre-tax income and a discrete tax benefit recorded in 2018 of $767,000 associated with the remeasurement of the net deferred tax asset.
The ETR differs from the statutory rate of 21% for the years ended December 31, 2020, 2019, and 2018, primarily due to the effect of tax-exempt income from municipal loans and securities, tax rate changes and BOLI. The net deferred tax liability totaled $15.5 million at December 31, 2020, compared to $4.8 million in 2019. The increase in the net deferred tax liability is primarily the result of the increase in unrealized gains in the AFS securities portfolio. See “Note 15 – Income Taxes” to our consolidated financial statements included in this report. No valuation allowance was recorded at December 31, 2020 or December 31, 2019, as management believes it is more likely than not that all of the deferred tax asset items will be realized in future years.
LENDING ACTIVITIES
One of our main objectives is to seek attractive lending opportunities in Texas, primarily in the market areas in which we operate. The majority of our loan originations are made to borrowers who live in and/or conduct business in the market areas of Texas in which we operate or adjoin.
Total loans as of December 31, 2020 increased $89.6 million, or 2.5%, and the average loan balance outstanding for the year increased $324.5 million, or 9.5%, compared to 2019.
From December 31, 2019 to December 31, 2020, commercial loans increased $155.6 million, or 38.8%, commercial real estate loans increased $45.5 million, or 3.6%, and municipal loans increased $25.1 million, or 6.5%, while 1-4 family residential loans decreased $67.6 million, or 8.6%, construction loans decreased $63.0 million, or 9.8%, and loans to individuals decreased $6.0 million, or 6.0%.
In April 2020, we began originating loans to qualified small businesses under the PPP administered by the SBA under the provisions of the CARES Act. During 2020, we originated over $310 million of PPP loans, included in our commercial loan portfolio with a remaining amortized cost basis at December 31, 2020 of $214.8 million.
Our greatest concentration of loans is in our real estate portfolio. Management does not consider there to be a concentration of risk in any one industry type. See “Item 1. Business – Market Area.”
The aggregate amount of loans that we are permitted to make under applicable bank regulations to any one borrower, including non-affiliate related entities is 25% of Tier 1 capital. Our legal lending limit at December 31, 2020, was approximately $192.1 million. Our largest loan relationship at December 31, 2020 was approximately $103.7 million.
The average yield on loans for the year ended December 31, 2020 decreased to 4.30%, compared to 5.04% for the year ended December 31, 2019. This decrease was due to changes in the mix of the loan portfolio and the lower interest rate environment during 2020.
LOAN PORTFOLIO COMPOSITION AND ASSOCIATED RISK
The following table sets forth loan totals for the years presented (in thousands):
| | | | | | | | | | | | | | | | | | | | | | | | | | | | | | | | |
| | | December 31, |
| | | 2020 | | 2019 | | 2018 | | 2017 | | 2016 |
| Real estate loans: | | |
| Construction | | $ | 581,941 | | | $ | 644,948 | | | $ | 507,732 | | | $ | 475,867 | | | $ | 380,175 | |
| 1-4 family residential | | 719,952 | | | 787,562 | | | 794,499 | | | 805,341 | | | 637,239 | |
| Commercial | | 1,295,746 | | | 1,250,208 | | | 1,194,118 | | | 1,265,159 | | | 945,978 | |
| Commercial loans | | 557,122 | | | 401,521 | | | 356,649 | | | 266,422 | | | 177,265 | |
| Municipal loans | | 409,028 | | | 383,960 | | | 353,370 | | | 345,798 | | | 298,583 | |
| Loans to individuals | | 93,990 | | | 100,005 | | | 106,431 | | | 135,769 | | | 117,297 | |
| Total loans | | $ | 3,657,779 | | | $ | 3,568,204 | | | $ | 3,312,799 | | | $ | 3,294,356 | | | $ | 2,556,537 | |
For purposes of this discussion, our loans are divided into real estate loans, commercial loans, municipal loans and loans to individuals.
REAL ESTATE LOANS
Our real estate loan portfolio consists of construction, 1-4 family residential and commercial real estate loans, and represents our greatest concentration of loans. We attempt to mitigate the amount of risk associated with this group of loans through the type of loans originated and geographic distribution. At December 31, 2020, the majority of our real estate loans were collateralized by properties located in our market areas. Of the $2.60 billion in real estate loans, $720.0 million, or 27.7%, represent loans collateralized by residential dwellings that are primarily owner occupied. Historically, the amount of losses suffered on this type of loan has been significantly less than those on other properties. Prior to funding any real estate loan, our loan policy requires an appraisal or evaluation of the property and also outlines the requirements for appraisals on renewals based on the size and complexity of the transaction.
We pursue an aggressive policy of reappraisal on any real estate loan that is in the process of foreclosure and potential exposures are recognized and reserved for or charged off as soon as they are identified. Our ability to liquidate certain types of properties that may be obtained through foreclosure could adversely affect the volume of our nonperforming real estate loans.
Construction Real Estate Loans
Our construction loans are collateralized by property located primarily in or near the market areas we serve. A number of our construction loans will be owner occupied upon completion. Construction loans for non-owner occupied projects are financed, but these typically have cash flows from leases with tenants, secondary sources of repayment, and in some cases, additional collateral. Our construction loans have both adjustable and fixed interest rates during the construction period. Construction loans to individuals are typically priced and made with the intention of granting the permanent loan on the property. Speculative and commercial construction loans are subject to underwriting standards similar to that of the commercial portfolio. Owner occupied 1-4 family residential construction loans are subject to the underwriting standards of the permanent loan.
1-4 Family Residential Real Estate Loans
Residential loan originations are generated by our loan officers, in-house origination staff, marketing efforts, present customers, walk-in customers and referrals from real estate agents and builders. We focus our lending efforts primarily on the origination of loans secured by first mortgages on owner occupied 1-4 family residences. Substantially all of our 1-4 family residential originations are secured by properties located in or near our market areas. Historically, we have originated a portion of our residential loans for sale into the secondary market. These loans are reflected on the balance sheet as loans held for sale. Secondary market investors, other than Fannie Mae, typically pay us a service release premium in addition to a predetermined price based on the interest rate of the loan originated. We retain liabilities related to early prepayments, defaults, failure to adhere to origination and processing guidelines and other issues. We have internal controls in place to mitigate many of these liabilities and historically our realized liability has been extremely low. In addition, many of the retained liabilities expire one year from the date a loan is sold. We warehouse these loans until they are transferred to the secondary market investor, which usually occurs within 45 days.
Our 1-4 family residential loans generally have maturities ranging from five to 30 years. These loans are typically fully amortizing with monthly payments sufficient to repay the total amount of the loan. Our 1-4 family residential loans are made at both fixed and adjustable interest rates.
Underwriting for 1-4 family residential loans includes debt-to-income analysis, credit history analysis, appraised value and down payment considerations. Changes in the market value of real estate can affect the potential losses in the portfolio.
We also make home equity loans, which are included as part of the 1-4 family residential loans, and at December 31, 2020, these loans totaled $111.2 million. Under Texas law, these loans, when combined with all other mortgage indebtedness for the property, are capped at 80% of appraised value.
Commercial Real Estate Loans
Commercial real estate loans primarily include loans collateralized by retail, commercial office buildings, multi-family residential buildings, medical facilities and offices, senior living, assisted living and skilled nursing facilities, warehouse facilities, hotels and churches. Management does not consider there to be a risk in any one industry type. In determining whether to originate commercial real estate loans, we generally consider such factors as the financial condition of the borrower and the debt service coverage of the property. Commercial real estate loans are made at both fixed and adjustable interest rates for terms generally up to 20 years. Most of our fixed rate commercial real estate loans adjust at least every five years. At December 31, 2020, commercial real estate loans consisted of $1.18 billion of owner and non-owner occupied real estate loans, $97.9 million of loans secured by multi-family properties and $15.0 million of loans secured by farmland.
COMMERCIAL LOANS
Our commercial loans are diversified loan types including short-term working capital loans for inventory and accounts receivable and short- and medium-term loans for equipment or other business capital expansion. Management does not consider there to be a concentration of risk in any one industry type. In our commercial loan underwriting, we assess the creditworthiness, ability to repay and the value and liquidity of the collateral being offered. Terms of commercial loans are generally commensurate with the useful life of the collateral offered. Commercial loans increased $155.6 million, to $557.1 million as of December 31, 2020. The increase in commercial loans is due entirely to $214.8 million of PPP loans as of December 31, 2020.
MUNICIPAL LOANS
We make loans to municipalities and school districts primarily throughout the state of Texas, with a small percentage originating outside of the state. The majority of the loans to municipalities and school districts have tax or revenue pledges and in some cases are additionally supported by collateral. Municipal loans made without a direct pledge of taxes or revenues are usually made based on some type of collateral that represents an essential service. Lending money directly to these municipalities allows us to earn a higher yield than we could if we purchased municipal securities for similar durations. Loans to municipalities and school districts increased $25.1 million, to $409.0 million as of December 31, 2020, when compared to 2019.
LOANS TO INDIVIDUALS
Substantially all originations of our loans to individuals are made to consumers in our market areas. At December 31, 2020, loans collateralized by titled equipment, which are primarily automobiles, accounted for approximately $58.6 million, or 62.3%, of total loans to individuals.
Home equity loans, which are included in 1-4 family residential loans, have replaced some of the traditional loans to individuals. In addition, we make loans for a full range of other consumer purposes, which may be secured or unsecured depending on the credit quality and purpose of the loan.
Consumer loan terms vary according to the type and value of collateral, length of contract and creditworthiness of the borrower. The underwriting standards we employ for consumer loans include an application, a determination of the applicant’s payment history on other debts, with the greatest weight being given to payment history with us and an assessment of the borrower’s ability to meet existing obligations and payments on the proposed loan. Although creditworthiness of the applicant is a primary consideration, the underwriting process also includes a comparison of the value of the collateral, if any, in relation to the proposed loan amount. Most of our loans to individuals are collateralized, which management believes assists in limiting our exposure.
LOAN PORTFOLIOS MOST AT RISK DUE TO ECONOMIC STRESS RESULTING FROM IMPACT OF COVID-19
The banking industry is affected by general economic conditions such as interest rates, inflation, recession, unemployment and other factors beyond our control, including the impact of the COVID-19 pandemic. During the last 30 years the Texas economy has continued to diversify, decreasing the overall impact of fluctuations in oil and gas prices; however, the oil and gas industry is still a significant component of the Texas economy. Oil prices have experienced a significant reduction primarily reflective of the economic impact of COVID-19. We cannot predict whether current economic conditions will improve, remain the same or decline.
As of December 31, 2020, the Company’s exposure to the oil and gas industry totaled $104.5 million, or 2.86% of gross loans, down $19.9 million from December 31, 2019 year-end levels, and consisted primarily of (i) support/service loans of 2.01%, (ii) upstream of 0.67%, (iii) midstream of 0.09%, and (iv) downstream of 0.09%. Expanded monitoring and analysis of these loans has been implemented to address the decline in oil and gas prices as needed.
The following table sets forth our oil and gas information for the periods presented (dollars in thousands):
| | | | | | | | | | | | | | | | | | |
| | December 31, | | |
| | 2020 | | 2019 | |
| Oil and gas related loans | | $ | 104,548 | | | $ | 124,417 | | | |
| Oil and gas related loans as a % of loans | | 2.86 | % | | 3.49 | % | | |
| Classified oil and gas related loans | | $ | 6,385 | | | $ | 1,085 | | | |
| Classified oil and gas related loans as a % of oil and gas related loans | | 6.11 | % | | 0.87 | % | | |
| Nonaccrual oil and gas related loans | | $ | 620 | | | $ | 7 | | | |
| Net charge-offs for oil and gas related loans | | $ | 7 | | | $ | — | | | |
| Allowance for oil and gas related loans as a % of oil and gas loans | | 1.36 | % | | 1.14 | % | | |
The COVID-19 pandemic negatively impacted the global economy, disrupted global supply chains and increased unemployment levels. The resulting temporary closure of many businesses and the implementation of social distancing and sheltering in place policies have impacted and could continue to impact many of our customers. Although certain business restrictions above have eased in some of our market areas, the ongoing pandemic and increased outbreaks of COVID-19 in various regions, has resulted, and may continue to result, in their reinstitution. In addition to the oil and gas industry, we consider the sectors set forth in the below table to be most vulnerable to financial risks from business disruptions caused by the
pandemic mitigation efforts. We recognize that these industries may take longer to recover as consumers may be hesitant to return to full social interaction or may change their spending habits on a more permanent basis as a result of the pandemic. We continue to monitor these customers closely.
The following table sets forth our sectors considered most vulnerable to financial risks from business disruptions caused by the pandemic mitigation efforts based on North American Industry Classification System categories as of December 31, 2020 (dollars in thousands):
| | | | | | | | | | | | | | | | | | | | |
| | December 31, 2020 |
| | Loans | | Percent of Total Loans | | Percent Classified (1) |
Retail commercial real estate (2) | | $ | 342,919 | | | 9.38 | % | | 0.02 | % |
| Retail goods and services | | 82,936 | | | 2.27 | % | | 9.12 | % |
| Hotels | | 69,578 | | | 1.90 | % | | — | |
| Food services | | 35,502 | | | 0.97 | % | | — | |
| Arts, entertainment and recreation | | 9,206 | | | 0.25 | % | | 3.80 | % |
| Total | | $ | 540,141 | | | 14.77 | % | | 1.48 | % |
(1) Sector classified loans as a percentage of sector total loans.
(2) Loans in the retail commercial real estate sector are included in our commercial real estate portfolio.
LOAN MATURITIES AND SENSITIVITY TO CHANGES IN INTEREST RATES
The following table represents loan maturities and sensitivity to changes in interest rates for our real estate construction, commercial and municipal loans (in thousands). The amounts of these loans outstanding at December 31, 2020, which, based on remaining scheduled repayments of principal, are due in (1) one year or less, (2) more than one year but less than five years and (3) more than five years, are shown in the following table. The amounts due after one year are classified according to the sensitivity to changes in interest rates:
| | | | | | | | | | | | | | | | | |
| | Due in One Year or Less(1) | | After One but
Within Five Years | | After Five Years (2) |
| Real estate loans – construction | $ | 148,024 | | | $ | 231,809 | | | $ | 202,108 | |
| Commercial loans | 125,261 | | | 396,792 | | | 35,069 | |
| Municipal loans | 30,276 | | | 299,262 | | | 79,490 | |
| Total | $ | 303,561 | | | $ | 927,863 | | | $ | 316,667 | |
| | | | | | | | |
| Loans with maturities after one year for which: | | |
| Interest rates are fixed or predetermined | $ | 543,013 | |
| | Interest rates are floating or adjustable | $ | 701,517 | |
(1) The volume of commercial loans due within one year reflects our general policy of attempting to limit these loans to a short-term maturity.
(2) Nonaccrual loans totaling $2.2 million are reflected in the due after five years column.
LOANS TO AFFILIATED PARTIES
In the normal course of business, we make loans to certain of our own executive officers and directors and their related interests. These loans totaled $32.2 million, $33.8 million and $37.7 million and represented 3.7%, 4.2% and 5.1% of shareholders’ equity as of December 31, 2020, 2019 and 2018, respectively.
ALLOWANCE FOR CREDIT LOSSES - LOANS
Our allowance for loan losses was $49.0 million at December 31, 2020, or 1.34% of loans, an increase of $24.2 million, or 97.6%, compared to $24.8 million at December 31, 2019. The increase is due to the adoption of CECL and the economic uncertainty related to the COVID-19 pandemic and the resulting impact on the economic assumptions used in the CECL model.
As discussed in “Note 1 – Summary of Significant Accounting and Reporting Policies” in our consolidated financial statements included in this report, our policies and procedures related to accounting for credit losses changed on January 1, 2020 in connection with the adoption of CECL. CECL is the estimated credit loss over the contractual life of a financial instrument measured upon origination or purchase of the instrument. The CECL model uses historical experience and current conditions for homogeneous pools of loans, and reasonable and supportable forecasts about future events. The impact of varying economic conditions and portfolio stress factors are now a component of the credit loss models applied to each portfolio. Reserve factors are specific to the loan segments that share similar risk characteristics based on the probability of default assumptions and loss given default assumptions, over the contractual term. The forecasted periods gradually mean-revert to the long-run trend based upon historical data. Management evaluates the economic data points used in the Moody’s forecasting scenarios on a quarterly basis to determine the most appropriate impact to the various portfolio characteristics based on management’s view and applies weighting to various forecasting scenarios as deemed appropriate based on known and expected economic activities. Management also considers and may apply relevant qualitative factors, not previously considered, to determine the appropriate allowance level. The use of the CECL model includes significant judgment by management and may differ from those of our peers due to different historical loss patterns, economic forecasts, and the length of time of the reasonable and supportable forecast period and reversion period.
We utilize Moody’s Analytics economic forecast scenarios and assign probability weighting to those scenarios which best reflect management’s views on the economic forecast. The probability weighting and scenarios utilized for the estimate of the allowance were generally reflective of an improved economic forecast based on known and knowable information as of December 31, 2020.
When determining the appropriate allowance for credit losses on our loan portfolio, our commercial construction and real estate loans, commercial loans and municipal loans utilize the probability of default/loss given default discounted cash flow approach. Reserves on these loans are based upon risk factors including the loan type and structure, collateral type, leverage ratio, refinancing risk and origination quality, among others. Our consumer construction real estate loans, 1-4 family residential loans and our loans to individuals use a loss rate dependence based upon risk factors including loan types, origination year and credit scores.
Loans evaluated collectively in a pool are monitored to ensure they continue to exhibit similar risk characteristics with other loans in a pool. If a loan does not share similar risk characteristics with other loans, expected credit losses for that loan are evaluated individually.
Our lenders have the primary responsibility for identifying problem loans based on customer financial stress and underlying collateral. These recommendations are reviewed by senior loan administration, the special assets department and the loan review department on a monthly basis. The loan review department independently reviews the portfolio on an annual basis in compliance with the board-approved annual loan review scope. The loan review scope encompasses a number of considerations including the size of the loan, the type of credit extended, the seasoning of the loan and the performance of the loan. The loan review scope, as it relates to size, focuses more on larger dollar loan relationships, typically aggregate debt of $500,000 or greater.
At each review, a subjective analysis methodology is used to grade the respective loan. Categories of grading vary in severity from loans that do not appear to have a significant probability of loss at the time of review to loans that indicate a probability that the entire balance of the loan will be uncollectible. If at the time of the review we determine it is probable we will not collect the principal and interest cash flows contractually due on the loan, estimates of future expected cash flows or appraisals of the collateral securing the debt are used to determine the necessary allowance. The internal loan review department maintains a list of all loans or loan relationships that are graded as having more than the normal degree of risk associated with them. In addition, a list of specifically reserved loans or loan relationships of $150,000 or more is updated on a quarterly basis in order to properly determine necessary allowances and keep management informed on the status of attempts to correct the deficiencies noted with respect to the loans.
As of December 31, 2020, our review of the loan portfolio indicated that an allowance for loan losses of $49.0 million was appropriate to cover expected losses in the portfolio. Changes in economic and other conditions, including the application of the CECL model and the economic uncertainty related to COVID-19, may require future adjustments to the allowance for loan losses.
Prior to the adoption of CECL on January 1, 2020, the allowance for loan losses was based on the incurred loss methodology that utilized historical net charge-off data adjusted through qualitative factors to establish general reserve amounts for each class of loans. Specific reserves were identified through the loan review process that is still currently in place. See “Note 6 - Loans and Allowance for Loan Losses” in the 2019 Form 10-K for allowance methodology under the incurred loss model prior to adoption of CECL on January 1, 2020.
Industry and our own experience indicates that a portion of our loans will become delinquent and a portion of our loans will require partial or full charge-off. Regardless of the underwriting criteria utilized, losses may occur as a result of various factors beyond our control, including, among other things, changes in market conditions affecting the value of properties used as collateral for loans and problems affecting the credit worthiness of the borrower and the ability of the borrower to make payments on the loan. Our determination of the appropriateness of the allowance for loan losses is based on various considerations, including an analysis of the risk characteristics of various classifications of loans, previous loan loss experience, specific loans which have loan loss potential, delinquency trends, estimated fair value of the underlying collateral, current economic conditions and geographic and industry loan concentration.
The following table presents information regarding the average amount of net loans outstanding, changes in the allowance for loan losses, selected asset quality ratios and an allocation of the allowance for loan losses (dollars in thousands):
| | | | | | | | | | | | | | | | | | | | | | | | | | | | | |
| | Years Ended December 31, |
| | 2020 | | 2019 | | 2018 | | 2017 | | 2016 |
Balance of allowance for loan losses at beginning of period (1) | $ | 24,797 | | | $ | 27,019 | | | $ | 20,781 | | | $ | 17,911 | | | $ | 19,736 | |
| Impact of CECL adoption - cumulative effect adjustment | 5,072 | | | — | | | — | | | — | | | — | |
| Impact of CECL adoption - purchased loans with credit deterioration | 231 | | | — | | | — | | | — | | | — | |
| Loan charge-offs: | | | | | | | | | |
| Real estate: | | | | | | | | | |
| Construction | (40) | | | — | | | (14) | | | (35) | | | — | |
| 1-4 family residential | (152) | | | (126) | | | (91) | | | (304) | | | (43) | |
| Commercial | (33) | | | (5,247) | | | (783) | | | — | | | — | |
Commercial loans (2) | (823) | | | (1,162) | | | (756) | | | (723) | | | (11,396) | |
| Municipal loans | — | | | — | | | — | | | — | | | — | |
| Loans to individuals | (1,806) | | | (2,398) | | | (2,602) | | | (2,391) | | | (2,948) | |
| Total loan charge-offs | (2,854) | | | (8,933) | | | (4,246) | | | (3,453) | | | (14,387) | |
| Recovery of loans previously charged-off: | | | | | | | | | |
| Real Estate: | | | | | | | | | |
| Construction | 28 | | | 12 | | | 7 | | | 1 | | | 269 | |
| 1-4 family residential | 32 | | | 68 | | | 356 | | | 19 | | | 141 | |
| Commercial | 102 | | | 113 | | | 36 | | | 13 | | | 23 | |
| Commercial loans | 310 | | | 250 | | | 244 | | | 312 | | | 666 | |
| Municipal loans | — | | | — | | | — | | | — | | | 249 | |
| Loans to individuals | 1,178 | | | 1,167 | | | 1,404 | | | 1,303 | | | 1,434 | |
| Total recovery of loans previously charged-off | 1,650 | | | 1,610 | | | 2,047 | | | 1,648 | | | 2,782 | |
| Net loan charge-offs | (1,204) | | | (7,323) | | | (2,199) | | | (1,805) | | | (11,605) | |
Provision for loan losses (3) | 20,110 | | | 5,101 | | | 8,437 | | | 4,675 | | | 9,780 | |
| Allowance for loan losses at end of period | $ | 49,006 | | | $ | 24,797 | | | $ | 27,019 | | | $ | 20,781 | | | $ | 17,911 | |
| | | | | | | | | |
| Net charge-offs to average loans outstanding | 0.03 | % | | 0.21 | % | | 0.07 | % | | 0.07 | % | | 0.47 | % |
| Ratio of allowance for loan losses to: | | | | | | | | | |
| Nonaccruing loans | 635.29 | % | | 499.64 | % | | 75.54 | % | | 707.56 | % | | 216.32 | % |
| Nonperforming assets | 280.35 | % | | 142.11 | % | | 62.97 | % | | 198.44 | % | | 118.58 | % |
| Total loans | 1.34 | % | | 0.69 | % | | 0.82 | % | | 0.63 | % | | 0.70 | % |
| Total loans, excluding PPP loans | 1.42 | % | | 0.69 | % | | 0.82 | % | | 0.63 | % | | 0.70 | % |
| | | | | | | | | |
Average loans outstanding (1) | $ | 3,750,657 | | | $ | 3,426,171 | | | $ | 3,290,651 | | | $ | 2,666,265 | | | $ | 2,452,803 | |
| Total loans | 3,657,779 | | | 3,568,204 | | | 3,312,799 | | | 3,294,356 | | | 2,556,537 | |
| Total nonaccrual loans | 7,714 | | | 4,963 | | | 35,770 | | | 2,937 | | | 8,280 | |
(1) Loans acquired with the Diboll acquisition were measured at fair value on November 30, 2017 with no carryover of allowance for loan losses.
(2) Of the $11.4 million in commercial charge-offs recorded for the year ended December 31, 2016, $10.9 million related to the charge-off of two large commercial borrowing relationships.
(3) The increase in the provision for credit losses during 2020 was primarily due to the economic impact of COVID-19 on macroeconomic factors used in the CECL methodology. Of the $5.1 million in provision for loan losses for the year ended December 31, 2019, $45,000 related to provision expense reversed on PCI loans. Of the $8.4 million recorded in provision for loan losses for the year ended December 31, 2018, $302,000 related to provision expense on PCI loans. Of the $4.7 million and $9.8 million recorded in provision for loan losses for the years ended December 31, 2017 and 2016, respectively, none related to provision expense on PCI loans.
The increase in provision expense for the year ended December 31, 2020, compared to 2019, was primarily due to the economic impact of COVID-19 on macroeconomic factors used in the CECL methodology, including the potential for credit deterioration. If the COVID-19 pandemic and economic impact is prolonged, it is likely that credit losses and nonperforming assets may increase. For the year ended December 31, 2020, net loan charge-offs decreased $6.1 million, to $1.2 million, compared to $7.3 million for the same period in 2019, primarily due to a decrease in net charge-offs of $5.2 million for commercial real estate loans.
The decrease in provision expense for 2019, compared to 2018, was primarily the result of a decrease in nonperforming assets, partially offset by an increase in net loan charge-offs and loan growth. Nonperforming assets decreased due to a decrease in commercial real estate nonaccrual loans. Three of the four large commercial real estate loans placed on nonaccrual status in 2018 were sold during the first quarter of 2019. The remaining commercial real estate loan was partially charged off in 2019 and subsequently paid off in the fourth quarter of 2019. For the year ended December 31, 2019, net loan charge-offs increased $5.1 million, to $7.3 million, compared to $2.2 million for the same period in 2018, due to an increase in net charge-offs of $4.4 million for commercial real estate loans.
The following table presents the allocation of allowance for loan losses for the years presented (dollars in thousands):
| | | | | | | | | | | | | | | | | | | | | | | | | | | | | | | | | | | | | | | | | | | | | | | | | | | | | | | | | | | | | | |
| | | December 31, |
| | | 2020 | | 2019 | | 2018 | | 2017 | | 2016 |
| | | Amount | | Percent
of Loans
To Total
Loans | | Amount | | Percent
of Loans
To Total
Loans | | Amount | | Percent
of Loans
To Total
Loans | | Amount | | Percent
of Loans
To Total
Loans | | Amount | | Percent
of Loans
To Total
Loans |
| Real estate loans: | | | | | | | | | | | | | | | | | | | | |
| Construction | | $ | 6,490 | | | 15.9 | % | | $ | 3,539 | | | 18.1 | % | | $ | 3,597 | | | 15.3 | % | | $ | 3,676 | | | 14.5 | % | | $ | 4,147 | | | 14.9 | % |
| 1-4 family residential | | 2,270 | | | 19.7 | % | | 3,833 | | | 22.1 | % | | 3,844 | | | 24.0 | % | | 2,445 | | | 24.4 | % | | 2,665 | | | 24.9 | % |
| Commercial | | 35,709 | | | 35.4 | % | | 9,572 | | | 35.0 | % | | 13,968 | | | 36.0 | % | | 10,821 | | | 38.4 | % | | 7,204 | | | 37.0 | % |
| Commercial loans | | 4,107 | | | 15.2 | % | | 6,351 | | | 11.2 | % | | 3,974 | | | 10.8 | % | | 2,094 | | | 8.1 | % | | 2,263 | | | 6.9 | % |
| Municipal loans | | 46 | | | 11.2 | % | | 570 | | | 10.8 | % | | 525 | | | 10.7 | % | | 860 | | | 10.5 | % | | 750 | | | 11.7 | % |
| Loans to individuals | | 384 | | | 2.6 | % | | 932 | | | 2.8 | % | | 1,111 | | | 3.2 | % | | 885 | | | 4.1 | % | | 882 | | | 4.6 | % |
| | | | | | | | | | | | | | | | | | | | |
| Ending balance | | $ | 49,006 | | | 100.0 | % | | $ | 24,797 | | | 100.0 | % | | $ | 27,019 | | | 100.0 | % | | $ | 20,781 | | | 100.0 | % | | $ | 17,911 | | | 100.0 | % |
See “Note 5 – Loans and Allowance for Loan Losses” in our consolidated financial statements included in this report.
PCD LOANS
We have purchased certain loans that as of the date of purchase have experienced more-than-insignificant deterioration in credit quality since origination. Management evaluates these loans against a probability threshold to determine if substantially all of the contractually required payments will be received. PCD loans are recorded at the purchase price plus an allowance for credit losses which becomes the PCD loan's initial amortized cost. The non-credit related discount or premium, the difference between the initial amortized cost and the par value, will be amortized into interest income over the life of the loan. Any further changes to the allowance for credit losses are recorded through provision expense. In accordance with the adoption of ASU 2016-13, management did not reassess whether PCI assets met the criteria of PCD assets and elected to not maintain pools of loans as of the date of adoption. All PCD loans are evaluated based upon product type within the underlying segment.
NONPERFORMING ASSETS
Nonperforming assets consist of delinquent loans 90 days or more past due, nonaccrual loans, OREO, repossessed assets and TDR loans. Nonaccrual loans are loans 90 days or more delinquent and collection in full of both the principal and interest is not expected. Additionally, some loans that are not delinquent or that are delinquent less than 90 days may be placed on nonaccrual status if it is probable that we will not receive contractual principal and interest payments in accordance with the terms of the respective loan agreements. When a loan is categorized as nonaccrual, the accrual of interest is discontinued and any accrued balance is reversed for financial statement purposes. OREO represents real estate taken in full or partial satisfaction of debts previously contracted. The dollar amount of OREO is based on a current evaluation of the OREO at the time it is recorded on our books, net of estimated selling costs. Updated valuations are obtained as needed and any additional impairments are recognized. Restructured loans represent loans that have been renegotiated to provide a below market interest rate or deferral of interest or principal because of deterioration in the financial position of the borrowers. The restructuring of a loan is considered a TDR if both (i) the borrower is experiencing financial difficulties and (ii) the creditor has granted a concession. Concessions may include interest rate reductions or below market interest rates, restructuring amortization schedules and other actions intended to minimize potential losses. Categorization of a loan as nonperforming is not in itself a reliable indicator of potential loan loss. Other factors, such as the value of collateral securing the loan and the financial condition of the borrower are considered in judgments as to potential loan loss.
Total nonperforming assets at December 31, 2020 were $17.5 million representing an increase of $31,000, or 0.2%, from $17.4 million at December 31, 2019. From December 31, 2019 to December 31, 2020, nonaccrual loans increased $2.8 million, or 55.4%, to $7.7 million due to increases in all of the loan categories, with the exception of loans to individuals, in nonaccrual status during the year. Restructured loans decreased $2.4 million, or 19.7%, to $9.6 million. OREO decreased $366,000, or 77.5%, to $106,000 from December 31, 2019 to December 31, 2020. We are actively marketing all OREO properties and none are being held for investment purposes. Repossessed assets were $14,000 at December 31, 2020. There were no repossessed assets at December 31, 2019. Included in total nonperforming assets are $10.6 million and $12.5 million of loans classified as TDRs at December 31, 2020 and 2019, respectively.
The following table sets forth nonperforming assets for the periods presented (dollars in thousands):
| | | | | | | | | | | | | | | | | | | | | | | | | | | | | |
| December 31, |
| | 2020 | | 2019 | | 2018 | | 2017 | | 2016 |
| Loans on nonaccrual: | | | | | | | | | |
| Real estate loans: | | | | | | | | | |
| Construction | $ | 640 | | | $ | 405 | | | $ | 12 | | | $ | 86 | | | $ | 105 | |
| 1-4 family residential | 3,922 | | | 2,611 | | | 2,202 | | | 1,098 | | | 1,067 | |
| Commercial | 1,269 | | | 704 | | | 32,599 | | | 595 | | | 808 | |
| Commercial loans | 1,592 | | | 944 | | | 639 | | | 903 | | | 5,477 | |
| Loans to individuals | 291 | | | 299 | | | 318 | | | 255 | | | 823 | |
Total nonaccrual loans (1) | 7,714 | | | 4,963 | | | 35,770 | | | 2,937 | | | 8,280 | |
| | | | | | | | | |
Accruing loans past due more than 90 days (1) | — | | | — | | | — | | | 1 | | | 6 | |
TDR loans(2) | 9,646 | | | 12,014 | | | 5,930 | | | 5,767 | | | 6,431 | |
| OREO | 106 | | | 472 | | | 1,206 | | | 1,613 | | | 339 | |
| Repossessed assets | 14 | | | — | | | — | | | 154 | | | 49 | |
| Total nonperforming assets | $ | 17,480 | | | $ | 17,449 | | | $ | 42,906 | | | $ | 10,472 | | | $ | 15,105 | |
| | | | | | | | | | | | | | | | | | | | | | | | | | | | | |
| Ratio of nonaccruing loans to: | | | | | | | | | |
| Total loans | 0.21 | % | | 0.14 | % | | 1.08 | % | | 0.09 | % | | 0.32 | % |
| Ratio of nonperforming assets to: | | | | | | | | | |
| Total assets | 0.25 | % | | 0.26 | % | | 0.70 | % | | 0.16 | % | | 0.27 | % |
| Total loans | 0.48 | % | | 0.49 | % | | 1.30 | % | | 0.32 | % | | 0.59 | % |
| Total loans and OREO | 0.48 | % | | 0.49 | % | | 1.29 | % | | 0.32 | % | | 0.59 | % |
| Total loans, excluding PPP loans, and OREO | 0.51 | % | | 0.49 | % | | 1.29 | % | | 0.32 | % | | 0.59 | % |
(1) Prior to the adoption of CECL, excluded PCI loans measured at fair value at acquisition if the timing and amount of cash flows expected to be collected from those sales could be reasonably estimated.
(2) Prior to the adoption of CECL, included $0.8 million, $3.1 million, $2.9 million, $3.1 million in PCI loans restructured as of December 31, 2019, 2018, 2017, and 2016, respectively.
Nonperforming assets hinder our ability to earn interest income. Decreases in earnings can result from both the loss of interest income and the costs associated with maintaining the OREO, for taxes, insurance and other operating expenses.
Potential problem loans consist of loans that are performing in accordance with contractual terms, but for which management has concerns about the ability of a borrower to continue to comply with repayment terms because of the borrower’s potential operating or financial difficulties. Management monitors these loans closely and reviews their performance on a regular basis. At December 31, 2020, we had $32.7 million in potential problem loans that were graded as substandard accruing, of which none are included in any one of the nonaccrual, restructured or 90 days past due loan categories.
We reversed $193,000 of interest income on nonaccrual loans during the year ended December 31, 2020. We had $2.2 million of loans on nonaccrual for which there was no related allowance for credit losses as of December 31, 2020.
The amount of interest recognized on loans that were nonaccruing or TDRs was $614,000, $937,000 and $831,000 for the years ended December 31, 2020, 2019 and 2018, respectively. If these loans had been accruing interest at their original contracted rates, related income would have been $1.1 million, $1.6 million and $2.6 million for the years ended December 31, 2020, 2019 and 2018, respectively.
.
SECURITIES ACTIVITY
Our securities portfolio plays a primary role in the management of our interest rate sensitivity and, therefore, is managed in the context of the overall balance sheet. The securities portfolio generates a substantial percentage of our interest income and serves as a necessary source of liquidity.
We account for debt and equity securities as follows:
•AFS. Debt securities that will be held for indefinite periods of time, including securities that may be sold in response to changes in market interest or prepayment rates, needs for liquidity and changes in the availability of and the yield of alternative investments are classified as AFS. These assets are carried at fair value with unrealized gains and losses reported as a separate component of AOCI, net of tax. Fair value is determined using quoted market prices as of the close of business on the balance sheet date. If quoted market prices are not available, fair values are based on quoted market prices for similar securities or estimates from independent pricing services. AFS securities hedged with qualifying derivatives are carried at fair value with the change in the fair value on both the hedged instrument and the securities recorded in interest income in the consolidated statements of income.
•HTM. Debt securities that management has the positive intent and ability to hold until maturity are classified as HTM and are carried at their amortized cost which includes the remaining unpaid principal balance, net of unamortized premiums or unaccreted discounts. Our HTM securities are presented on the consolidated balance sheet net of allowance for credit losses, if any. As of December 31, 2020, there was no allowance for credit losses on our HTM securities portfolio.
•Equity Investments. Equity investments with readily determinable fair values are stated at fair value with unrealized gains and losses reported in income. For periods prior to January 1, 2018, certain equity investments were classified as AFS and stated at fair value with unrealized gains and losses reported as a separate component of AOCI, net of tax. Equity investments without readily determinable fair values are recorded at cost less impairment, if any.
With the adoption of ASU 2016-13 on January 1, 2020, for those AFS debt securities in an unrealized loss position where management (i) has the intent to sell or (ii) where it will more-likely-than-not be required to sell the security before the recovery of its amortized cost basis, we write the security down to fair value with an adjustment to earnings. For those AFS debt securities in an unrealized loss position that do not meet either of these criteria, management assesses whether the decline in fair value has resulted from credit-related factors, using both qualitative and quantitative criteria. Determining the allowance under the credit loss method requires the use of a discounted cash flow method to assess the credit losses. Any credit-related impairment will be recognized in allowance for credit losses on the balance sheet with a corresponding adjustment to earnings. Noncredit-related impairment, the portion of the impairment relating to factors other than credit (such as changes in market interest rates), is recognized in other comprehensive income, net of tax.
Based on our consideration of the qualitative factors associated with each security type in our AFS portfolio, we did not recognize any unrealized losses in income on our AFS securities during the year ended December 31, 2020. Our state and political subdivisions are highly rated municipal securities with a long history of no credit losses. Our AFS MBS are highly rated securities which are either explicitly or implicitly backed by the U.S. Government through its agencies which are highly rated by major ratings agencies and also have a long history of no credit losses. Our other stocks and bonds as of December 31, 2020 consist of highly rated investment grade bonds. Management does not intend to sell and it is likely we will not be required to sell those securities in an unrealized loss position prior to the anticipated recovery of the amortized cost basis. These unrealized losses on our investment and MBS are largely due to changes in interest rates and spreads and other market conditions impacted by COVID-19. As of December 31, 2020, we did not have an allowance for credit losses on our AFS securities.
We assess the likelihood of default and the potential amount of default when assessing our HTM securities for credit losses. We utilize term structures and, due to no prior loss exposure on our state and political subdivision securities, we currently apply a third-party average loss given default rate to model our securities. Due to a small number of HTM municipal securities in our portfolio as of December 31, 2020, we elected to use the specific identification method to model these securities which aligns with our third-party fair value measurement process. The model determined the expected credit loss over the life of these securities to be remote. Management further evaluated the remote expectation of loss along with the qualitative factors associated with these securities and concluded that, due to the securities being highly rated municipals with a long history of no credit losses, no credit loss should be recognized for these securities for the year ended December 31, 2020. We recognize the change in the allowance for credit losses due to the passage of time for our HTM debt securities, if any, in provision for credit losses. As of December 31, 2020, we did not have an allowance for credit losses on our HTM securities.
Effective January 1, 2019, premium callable securities are amortized to the earliest call date and securities purchased at a discount are accreted to maturity. Prior to January 1, 2019, premiums were amortized and discounts were accreted to maturity,
or in the case of MBS, over the estimated life of the security, using the level yield interest method. Declines in the fair value of securities below their cost that are deemed to be other-than-temporary are reflected in earnings as realized losses. In estimating other-than-temporary impairment losses, management considers (1) the length of time and the extent to which the fair value has been less than cost, (2) the financial condition and near-term prospects of the issuer and (3) our intent and ability to retain our investment in the issuer for a period of time sufficient to allow for any anticipated recovery in fair value. Gains and losses on the sale of securities are recognized on the trade date and are determined using the specific identification method.
Securities with limited marketability, such as FHLB stock, are carried at cost, which is a reasonable estimate of the fair value of those assets and are assessed for other-than-temporary impairment.
Management attempts to deploy investable funds into instruments that are expected to provide a reasonable overall return on the portfolio given the current assessment of economic and financial conditions, while maintaining acceptable levels of capital, interest rate and liquidity risk. At December 31, 2020, the combined investment securities, MBS, FHLB stock and other investments as a percentage of total assets was 39.0% compared to loans, which were 52.2% of total assets. For a discussion of our strategy in relation to the securities portfolio, see “Item 7. Management’s Discussion and Analysis of Financial Condition and Results of Operations – Balance Sheet Strategy.”
The following tables set forth the carrying amount of AFS and HTM investment securities and MBS (in thousands):
| | | | | | | | | | | | | | | | | | | | |
| | | December 31, |
| Available for Sale: | | 2020 | | 2019 | | 2018 |
| Investment securities: | | | | | | |
| | | | | | |
| | | | | | |
| State and political subdivisions | | $ | 1,580,594 | | | $ | 802,802 | | | $ | 716,601 | |
| Other stocks and bonds | | 78,255 | | | 10,137 | | | 2,709 | |
| | | | | | |
MBS: (1) | | | | | | |
| Residential | | 810,010 | | | 1,310,642 | | | 732,972 | |
| Commercial | | 118,446 | | | 235,016 | | | 537,154 | |
| Total | | $ | 2,587,305 | | | $ | 2,358,597 | | | $ | 1,989,436 | |
| | | | | | | | | | | | | | | | | | | | |
| | | December 31, |
| Held to Maturity: | | 2020 | | 2019 | | 2018 |
| Investment securities: | | | | | | |
| State and political subdivisions | | $ | 907 | | | $ | 2,888 | | | $ | 3,083 | |
| | | | | | |
MBS: (1) | | | | | | |
| Residential | | 47,948 | | | 59,701 | | | 59,655 | |
| Commercial | | 60,143 | | | 72,274 | | | 100,193 | |
| Total | | $ | 108,998 | | | $ | 134,863 | | | $ | 162,931 | |
(1) All MBS are issued and/or guaranteed by U.S. government agencies or U.S. GSEs.
We invest in MBS, including mortgage participation certificates, which are insured or guaranteed by U.S. government agencies and GSEs, CMOs and REMICs. MBS (which also are known as mortgage participation certificates or pass-through certificates) represent a participation interest in a pool of single-family or multi-family mortgages, the principal and interest payments on which are passed from the mortgage originators, through intermediaries (generally U.S. government agencies and GSEs) that pool and re-package the participation interests in the form of securities, to investors such as ourselves. U.S. government agencies, primarily GNMA and GSEs, primarily Freddie Mac and Fannie Mae guarantee the payment of principal and interest to investors. GSEs are not backed by the full faith and credit of the U.S. government. Freddie Mac, Fannie Mae and FHLB are the primary GSEs from which we purchase securities. At December 31, 2020, all of our MBS were collateralized by U.S. Government agency or GSEs mortgages.
MBS typically are issued with stated principal amounts, and the securities are backed by pools of mortgages that have loans with varying maturities. The characteristics of the underlying pool of mortgages, such as fixed rate or adjustable rate, as well as prepayment risk, are passed on to the certificate holder. The term of a mortgage-backed pass-through security thus approximates the term of the underlying mortgages and can vary significantly due to prepayments.
Our MBS also include CMOs, which include securities issued by entities that have qualified under the Internal Revenue Code of 1986, as amended, as REMICs. CMOs and REMICs (collectively CMOs) were developed in response to investor concerns regarding the uncertainty of cash flows associated with the prepayment option of the underlying mortgages and are typically issued by governmental agencies, GSEs and special purpose entities, such as trusts, corporations or partnerships, established by financial institutions or other similar institutions. A CMO can be collateralized by loans or securities which are insured or guaranteed by Fannie Mae, Freddie Mac or GNMA. In contrast to pass-through MBS, in which cash flow is received pro rata by all security holders, the cash flow from the mortgages underlying a CMO is segmented and paid in accordance with
a predetermined priority to investors holding various CMO classes. By allocating the principal and interest cash flows from the underlying collateral among the separate CMO classes, different classes of bonds are created, each with its own stated maturity, estimated average life, coupon rate and prepayment characteristics.
Like most fixed income securities, MBS are subject to interest rate risk. However, unlike most other fixed income securities, the mortgage loans underlying a MBS generally may be prepaid at any time without penalty. The ability to prepay a mortgage loan generally results in significantly increased price and yield volatility (with respect to MBS) than is the case with noncallable fixed income securities. Most of our MBS were purchased at a premium. As these MBS prepay at a faster rate, our yield on these securities will decrease. Conversely, as prepayments slow, the yield on these MBS will increase. The total unamortized premium for our MBS decreased to $17.0 million at December 31, 2020 compared to $33.2 million at December 31, 2019.
During 2020, we primarily sold municipal securities, mortgage related securities and corporate bonds that resulted in an overall gain of $8.3 million. During 2019, the sale of AFS securities resulted in an overall gain of $756,000. During 2018, the sale of these AFS securities resulted in an overall loss of $1.8 million.
The combined investment securities, MBS, FHLB stock and other investments increased to $2.73 billion at December 31, 2020, compared to $2.56 billion at December 31, 2019, an increase of $177.6 million, or 6.9%. The increase is primarily a result of an increase in our investment securities portfolio of $843.9 million, or 103.4% combined with a decrease of our MBS of $641.1 million, or 38.2%, and a decrease in FHLB stock of $24.8 million, or 49.6%, as of December 31, 2020 when compared to December 31, 2019.
The combined fair value of the AFS and HTM securities portfolio at December 31, 2020 was $2.71 billion, which represented a net unrealized gain as of that date of $159.0 million. The net unrealized gain was comprised of $159.3 million in unrealized gains and $282,000 of unrealized losses. The fair value of the AFS securities portfolio at December 31, 2020 was $2.59 billion, which included a net unrealized gain of $149.8 million. The net unrealized gain was comprised of $150.1 million of unrealized gains and $282,000 of unrealized losses. The majority of the $282,000 of unrealized losses is reflected in our commercial and residential MBS and state and political subdivisions. Net unrealized gains and losses on AFS securities, which is also a component of shareholders’ equity on the consolidated balance sheet, can fluctuate significantly as a result of changes in interest rates. Since management cannot predict the future direction of interest rates, the effect on shareholders’ equity in the future cannot be determined; however, this risk is monitored through the use of shock tests on the AFS securities portfolio using an array of interest rate assumptions.
From time to time, we have transferred securities from AFS to HTM due to overall balance sheet strategies. Any net unrealized gain or loss on the transferred securities included in AOCI at the time of transfer will be amortized over the remaining life of the underlying security as an adjustment to the yield on those securities. Securities transferred with losses included in AOCI continue to be included in management’s assessment for impairment for each individual security. There were no securities transferred from AFS to HTM during the years ended December 31, 2020, 2019, or 2018.
On January 2, 2018, we adopted ASU 2017-12, “Derivatives and Hedging (Topic 815): Targeted Improvements to Accounting for Hedging Activities,” and in conjunction with the adoption took the one-time transition election to reclassify approximately $743.4 million book value of securities from HTM to AFS that qualified for hedging under the last-of-layer approach, as described in ASU 2017-12. The unrealized gain of $11.9 million ($9.4 million, net of tax) on the transferred securities was recognized in other comprehensive income on the date of transfer. There were no sales from the HTM portfolio during the years ended December 31, 2020, 2019 or 2018. There were $109.0 million and $134.9 million of securities classified as HTM at December 31, 2020 and 2019, respectively.
On January 1, 2019, we adopted ASU 2017-08, “Receivables - Nonrefundable Fees and Other Costs (Subtopic 310-20): Premium Amortization on Purchased Callable Debt Securities,” and in conjunction with the adoption recognized a cumulative adjustment to reduce retained earnings by $16.5 million, pre-tax.
The maturities classified according to the sensitivity to changes in interest rates of the December 31, 2020 AFS and HTM investment securities and MBS portfolio and the weighted yields are presented below (dollars in thousands). Tax-exempt obligations are shown on a taxable-equivalent basis which is a non-GAAP measure. See “Non-GAAP Financial Measures” for more information and a reconciliation to GAAP. MBS are included in maturity categories based on their stated maturity date. Expected maturities may differ from contractual maturities because issuers may have the right to call or prepay obligations.
| | | | | | | | | | | | | | | | | | | | | | | | | | | | | | | | | | | | | | | | | | | | | | | |
| | MATURING |
| | Within 1 Year | | After 1 But
Within 5 Years | | After 5 But
Within 10 Years | | After 10 Years |
| Available for Sale: | Amount | | Yield | | Amount | | Yield | | Amount | | Yield | | Amount | | Yield |
| Investment securities: | | | | | | | | | | | | | | | |
| | | | | | | | | | | | | | | |
| | | | | | | | | | | | | | | |
| State and political subdivisions | $ | 2,222 | | | 4.72 | % | | $ | 12,103 | | | 4.31 | % | | $ | 37,026 | | | 3.61 | % | | $ | 1,529,243 | | | 3.17 | % |
| Other stocks and bonds | — | | | — | | | 21,850 | | | 4.43 | % | | 56,405 | | | 4.05 | % | | — | | | — | |
| | | | | | | | | | | | | | | |
| MBS: | | | | | | | | | | | | | | | |
| Residential | 22 | | | 5.65 | % | | 2,023 | | | 4.52 | % | | 25,928 | | | 2.73 | % | | 782,037 | | | 2.35 | % |
| Commercial | 2,021 | | | 5.17 | % | | 102,960 | | | 2.66 | % | | 8,721 | | | 2.72 | % | | 4,744 | | | 0.77 | % |
| Total | $ | 4,265 | | | 4.93 | % | | $ | 138,936 | | | 3.11 | % | | $ | 128,080 | | | 3.57 | % | | $ | 2,316,024 | | | 2.89 | % |
| | | | | | | | | | | | | | | | | | | | | | | | | | | | | | | | | | | | | | | | | | | | | | | |
| | MATURING |
| | | | | | After 1 But | | After 5 But | | | | |
| | Within 1 Year | | Within 5 Years | | Within 10 Years | | After 10 Years |
| Held to Maturity: | Amount | | Yield | | Amount | | Yield | | Amount | | Yield | | Amount | | Yield |
| Investment securities: | | | | | | | | | | | | | | | |
| | | | | | | | | | | | | | | |
| State and political subdivisions | $ | 120 | | | 2.39 | % | | $ | 509 | | | 2.81 | % | | $ | 278 | | | 3.35 | % | | $ | — | | | — | |
| | | | | | | | | | | | | | | |
| MBS: | | | | | | | | | | | | | | | |
| Residential | — | | | — | | | 93 | | | 4.93 | % | | 40 | | | 5.88 | % | | 47,815 | | | 4.34 | % |
| Commercial | — | | | — | | | 23,527 | | | 2.86 | % | | 26,906 | | | 2.86 | % | | 9,710 | | | 2.75 | % |
| Total | $ | 120 | | | 2.39 | % | | $ | 24,129 | | | 2.87 | % | | $ | 27,224 | | | 2.87 | % | | $ | 57,525 | | | 4.07 | % |
At December 31, 2020, there were no holdings of any one issuer, other than the U.S. government, its agencies and its GSEs, in an amount greater than 10% of our shareholders’ equity.
DEPOSITS AND BORROWED FUNDS
We utilize deposits, FHLB borrowings, federal funds purchased and repurchase agreements to assist with our funding needs. Deposits provide us with our primary source of funds and the following table sets forth average deposits and rates paid by category (dollars in thousands):
| | | | | | | | | | | | | | | | | | | | | | | | | | | | | | | | | | | | | | |
| | Years Ended December 31, |
| | | 2020 | | 2019 | | 2018 |
| | | Average
Balance | | Average
Rate | | Average
Balance | | Average
Rate | | Average
Balance | | Average
Rate |
| | | |
| Interest bearing demand accounts | | $ | 2,061,805 | | | 0.33 | % | | $ | 1,963,936 | | | 1.01 | % | | $ | 1,978,140 | | | 0.85 | % |
| Savings accounts | | 440,346 | | | 0.19 | % | | 366,606 | | | 0.29 | % | | 359,509 | | | 0.25 | % |
| CDs | | 1,182,938 | | | 1.44 | % | | 1,149,171 | | | 2.07 | % | | 1,160,423 | | | 1.56 | % |
| Total interest bearing deposits | | 3,685,089 | | | 0.67 | % | | 3,479,713 | | | 1.28 | % | | 3,498,072 | | | 1.03 | % |
| Noninterest bearing demand deposits | | 1,277,011 | | | N/A | | 1,017,836 | | | N/A | | 1,040,447 | | | N/A |
| Total deposits | | $ | 4,962,100 | | | 0.50 | % | | $ | 4,497,549 | | | 0.99 | % | | $ | 4,538,519 | | | 0.79 | % |
The table below sets forth the maturity distribution of CDs of $100,000 or more (in thousands):
| | | | | | | | | | | | | | |
| | | December 31,
2020 | | December 31, 2019 |
| Three months or less | | $ | 224,166 | | | $ | 275,956 | |
| Over three to six months | | 98,760 | | | 155,799 | |
| Over six to twelve months | | 150,994 | | | 273,135 | |
| Over twelve months | | 69,205 | | | 111,057 | |
| Total CDs | | $ | 543,125 | | | $ | 815,947 | |
At December 31, 2020, we had $102.8 million in brokered CDs that represented 2.1% of our deposits. Our brokered CDs at December 31, 2020 have maturities of less than two years and are reflected in both CDs under and over $100,000 categories. At December 31, 2019, we had $365.7 million in brokered CDs, and at December 31, 2018, we had $238.1 million in brokered CDs. Our current policy allows for a maximum of $450 million in brokered CDs. The potential higher interest cost and lack of customer loyalty are risks associated with the use of brokered CDs.
Borrowing arrangements, consisting primarily of FHLB borrowings, federal funds purchased and repurchase agreements, decreased $145.4 million, or 14.5%, during 2020 compared to 2019, primarily due to the increase in deposits during 2020.
Borrowing arrangements are summarized as follows (dollars in thousands):
| | | | | | | | | | | | | | | | | | | | |
| | | Years Ended December 31, |
| | | 2020 | | 2019 | | 2018 |
| Other borrowings: | | |
| Balance at end of period | | $ | 23,172 | | | $ | 28,358 | | | $ | 36,810 | |
Average amount outstanding during the period (1) | | 91,940 | | | 15,645 | | | 10,880 | |
Maximum amount outstanding during the period (2) | | 219,259 | | | 28,358 | | | 36,810 | |
Weighted average interest rate during the period (3) | | 0.4 | % | | 1.7 | % | | 1.4 | % |
Interest rate at end of period (4) | | 0.1 | % | | 1.7 | % | | 2.1 | % |
| | | | | | |
| FHLB borrowings: | | | | | | |
| Balance at end of period | | $ | 832,527 | | | $ | 972,744 | | | $ | 719,065 | |
Average amount outstanding during the period (1) | | 1,032,269 | | | 868,859 | | | 720,785 | |
Maximum amount outstanding during the period (2) | | 1,274,370 | | | 1,077,883 | | | 957,231 | |
Weighted average interest rate during the period (3) | | 1.1 | % | | 2.0 | % | | 1.8 | % |
Interest rate at end of period (4) | | 1.0 | % | | 1.8 | % | | 2.3 | % |
(1)The average amount outstanding during the period was computed by dividing the total daily outstanding principal balances by the number of days in the period.
(2)The maximum amount outstanding at any month-end during the period.
(3)The weighted average interest rate during the period was computed by dividing the actual interest expense by the average balance outstanding during the period. The weighted average interest rate on the FHLB borrowings include the effect of interest rate swaps.
(4)Stated rate.
Other borrowings include federal funds purchased, repurchase agreements and borrowings from the FRDW. Southside Bank has three unsecured lines of credit for the purchase of overnight federal funds at prevailing rates with Frost Bank, TIB – The Independent Bankers Bank and Comerica Bank for $40.0 million, $15.0 million and $7.5 million, respectively. There were no federal funds purchased at December 31, 2020 or 2019. There were $28.0 million of federal funds purchased at December 31, 2018. To provide more liquidity in response to the COVID-19 pandemic, the Federal Reserve took steps to encourage broader use of the discount window. At December 31, 2020, the amount of additional funding the Bank could obtain from the FRDW, collateralized by securities and PPP loans, was approximately $722.3 million. There were no borrowings from the FRDW at December 31, 2020. Southside Bank has a $5.0 million line of credit with Frost Bank to be used to issue letters of credit, and at December 31, 2020, the line had one outstanding letter of credit for $1.0 million. Southside Bank currently has no outstanding letters of credit from FHLB held as collateral for its public fund deposits.
Southside Bank enters into sales of securities under repurchase agreements. These repurchase agreements totaled $23.2 million, $28.4 million, and $8.8 million at December 31, 2020, 2019 and 2018. At December 31, 2020 these repurchase agreements had maturities of less than one year. Repurchase agreements are secured by investment and MBS securities and are stated at the amount of cash received in connection with the transaction.
FHLB borrowings represent borrowings with fixed interest rates ranging from 0.10% to 4.799% and with remaining maturities of four days to 7.5 years at December 31, 2020. FHLB borrowings may be collateralized by FHLB stock, nonspecified loans and/or securities. At December 31, 2020, the amount of additional funding Southside Bank could obtain from FHLB, collateralized by securities, FHLB stock and nonspecified loans and securities, was approximately $1.15 billion, net of FHLB stock purchases required.
Southside Bank has entered into various variable rate agreements and fixed rate short-term pay agreements with third-party financial institutions with rates tied to LIBOR. These agreements totaled $670.0 million at December 31, 2020 and $310.0 million at December 31, 2019 and 2018. Six of the agreements have an interest rate tied to three-month LIBOR and the remaining agreements have interest rates tied to one-month LIBOR. In connection with all agreements outstanding on December 31, 2020, Southside Bank also entered into various interest rate swap contracts that are treated as cash flow hedges under ASC Topic 815, “Derivatives and Hedging” that are expected to be effective in hedging the variability in future cash flows attributable to fluctuations in the underlying LIBOR interest rate. The interest rate swap contracts had a weighted average rate of 1.12% with a weighted average maturity of 3.8 years at December 31, 2020. Refer to “Note 11 – Derivative Financial Instruments and Hedging Activities” in our consolidated financial statements included in this report for a detailed description of our hedging policy and methodology related to derivative instruments.
CAPITAL RESOURCES
Our total shareholders’ equity at December 31, 2020 increased 8.8%, or $70.7 million, to $875.3 million, or 12.5% of total assets, compared to $804.6 million, or 11.9% of total assets at December 31, 2019.
The increase in shareholders’ equity was the result of net income of $82.2 million, other comprehensive income of $64.8 million, stock compensation expense of $3.0 million, common stock issued under our dividend reinvestment plan of $1.4 million and net issuance of common stock under employee stock plans of $1.3 million. These increases were partially offset by cash dividends paid of $43.2 million, the repurchase of $31.0 million of our common stock and a reduction to beginning retained earnings of $7.8 million for a cumulative-effect adjustment related to the adoption of CECL.
As a result of regulations, which became applicable to the Company and the Bank on January 1, 2015, we are required to comply with higher minimum capital requirements. The 2015 Capital Rules made substantial changes to previous capital standards. Among other things, the regulations (i) introduced a new capital requirement known as CET1, (ii) stated that Tier 1 capital consists of CET1 and “Additional Tier 1 capital” instruments meeting certain requirements, (iii) defined CET1 to require that most deductions and adjustments to regulatory capital measures be made to CET1 and not to the other components of capital and (iv) revised the scope of the deductions and adjustments from capital as compared to regulations that previously applied to the Company and other banking organizations.
The 2015 Capital Rules also established the following minimum capital ratios: 4.5 percent CET1 to risk-weighted assets; 6.0 percent Tier 1 capital to risk-weighted assets; 8.0 percent total capital to risk-weighted assets; and 4.0 percent Tier 1 leverage ratio to average consolidated assets. In addition, the 2015 Capital Rules also introduced a minimum “capital conservation buffer” equal to 2.5% of an organization’s total risk-weighted assets, which exists in addition to the required minimum CET1, Tier 1 and total capital ratios. The “capital conservation buffer,” which must consist entirely of CET1, is designed to absorb losses during periods of economic stress. The 2015 Capital Rules provide for a number of deductions from and adjustments to CET1, which include the requirement that mortgage servicing rights, deferred tax assets arising from temporary differences that could not be realized through net operating loss carrybacks and significant investments in non-consolidated financial entities be deducted from CET1 to the extent that any one such category exceeds 10% of CET1 or all such categories in the aggregate exceed 15% of CET1.
Under the previous capital framework, the effects of AOCI items included in shareholders’ equity under U.S. GAAP were excluded for the purposes of determining capital ratios. Under the 2015 Capital Rules, the company has elected to permanently exclude capital in AOCI in Common Equity Tier 1 capital, Tier 1 capital, Total capital to risk-weighted assets and Tier 1 capital to adjusted quarterly average assets.
Under the 2015 Capital Rules, certain hybrid securities, such as trust preferred securities, do not qualify as Tier 1 capital. For bank holding companies that had assets of less than $15 billion as of December 31, 2009, which includes Southside, trust preferred securities issued prior to May 19, 2010 can be treated as Tier 1 capital to the extent that they do not exceed 25% of Tier 1 capital after the application of capital deductions and adjustments.
Failure to meet minimum capital requirements under the 2015 Capital Rules could result in certain mandatory and possibly additional discretionary actions by our regulators that, if undertaken, could have a direct material effect on our financial statements. Management believes that, as of December 31, 2020, we met all capital adequacy requirements to which we were subject.
At December 31, 2020, our Common Equity Tier 1 “CET1” capital ratio was 14.68% percent, an increase of 61 basis points compared to December 31, 2019. The higher CET1 capital ratio is primarily due to an increase in retained earnings at the end of the period ended December 31, 2020.
In April 2020, the FDIC, Federal Reserve, and the Office of the Comptroller of the Currency issued supplemental instructions allowing banking organizations that implement CECL before the end of 2020, the option to delay for two years an estimate of the CECL methodologies effect on regulatory capital, relative to the incurred loss methodologies effect on capital, followed by a three-year transition period. We elected to use this regulatory relief to defer the impact of adopting the CECL model for measuring credit losses on regulatory capital, which resulted in a 30 basis point benefit to the CET1 capital ratio at December 31, 2020.
The FDIA requires bank regulatory agencies to take “prompt corrective action” with respect to FDIC-insured depository institutions that do not meet minimum capital requirements. A depository institution’s treatment for purposes of the prompt corrective action provisions will depend on how its capital levels compare to various capital measures and certain other factors, as established by regulation. Prompt corrective action and other discretionary actions could have a direct material effect on our financial statements.
It is management’s intention to maintain our capital at a level acceptable to all regulatory authorities and future dividend payments will be determined accordingly. Regulatory authorities require that any dividend payments made by either us or the
Bank not exceed earnings for that year. Accordingly, shareholders should not anticipate a continuation of the cash dividend payments simply because of the existence of a dividend reinvestment program. The payment of dividends will depend upon future earnings, our financial condition and other related factors including the discretion of the board of directors.
To be categorized as well capitalized we must maintain minimum Common Equity Tier 1 risk-based, Tier 1 risk-based, Total capital risk-based and Tier 1 leverage ratios as set forth in the following table (dollars in thousands):
| | | | | | | | | | | | | | | | | | | | | | | | | | | | | | | | | | | | | | |
| | | Actual | | For Capital
Adequacy Purposes | | To Be Well Capitalized
Under Prompt
Corrective Action
Provisions |
| | | Amount | | Ratio | | Amount | | Ratio | | Amount | | Ratio |
| December 31, 2020 | | |
| Common Equity Tier 1 (to Risk Weighted Assets) | | | | | | | | | | | | |
| Consolidated | | $ | 612,703 | | | 14.68 | % | | $ | 187,814 | | | 4.50 | % | | N/A | | N/A |
| Bank Only | | $ | 768,200 | | | 18.41 | % | | $ | 187,801 | | | 4.50 | % | | $ | 271,268 | | | 6.50 | % |
| Tier 1 Capital (to Risk Weighted Assets) | | | | | | | | | | | | |
| Consolidated | | $ | 671,147 | | | 16.08 | % | | $ | 250,418 | | | 6.00 | % | | N/A | | N/A |
| Bank Only | | $ | 768,200 | | | 18.41 | % | | $ | 250,402 | | | 6.00 | % | | $ | 333,869 | | | 8.00 | % |
| Total Capital (to Risk Weighted Assets) | | | | | | | | | | | | |
| Consolidated | | $ | 908,873 | | | 21.78 | % | | $ | 333,891 | | | 8.00 | % | | N/A | | N/A |
| Bank Only | | $ | 808,675 | | | 19.38 | % | | $ | 333,869 | | | 8.00 | % | | $ | 417,336 | | | 10.00 | % |
Tier 1 Capital (to Average Assets) (1) | | | | | | | | | | | | |
| Consolidated | | $ | 671,147 | | | 9.81 | % | | $ | 273,558 | | | 4.00 | % | | N/A | | N/A |
| Bank Only | | $ | 768,200 | | | 11.24 | % | | $ | 273,432 | | | 4.00 | % | | $ | 341,790 | | | 5.00 | % |
| | | | | | | | | | | | |
| December 31, 2019 | | | | | | | | | | | | |
| Common Equity Tier 1 (to Risk Weighted Assets) | | | | | | | | | | | | |
| Consolidated | | $ | 591,026 | | | 14.07 | % | | $ | 189,055 | | | 4.50 | % | | N/A | | N/A |
| Bank Only | | $ | 738,311 | | | 17.58 | % | | $ | 188,992 | | | 4.50 | % | | $ | 272,989 | | | 6.50 | % |
| Tier 1 Capital (to Risk Weighted Assets) | | | | | | | | | | | | |
| Consolidated | | $ | 649,465 | | | 15.46 | % | | $ | 252,073 | | | 6.00 | % | | N/A | | N/A |
| Bank Only | | $ | 738,311 | | | 17.58 | % | | $ | 251,989 | | | 6.00 | % | | $ | 335,986 | | | 8.00 | % |
| Total Capital (to Risk Weighted Assets) | | | | | | | | | | | | |
| Consolidated | | $ | 774,293 | | | 18.43 | % | | $ | 336,098 | | | 8.00 | % | | N/A | | N/A |
| Bank Only | | $ | 764,563 | | | 18.20 | % | | $ | 335,986 | | | 8.00 | % | | $ | 419,982 | | | 10.00 | % |
Tier 1 Capital (to Average Assets) (1) | | | | | | | | | | | | |
| Consolidated | | $ | 649,465 | | | 10.18 | % | | $ | 255,304 | | | 4.00 | % | | N/A | | N/A |
| Bank Only | | $ | 738,311 | | | 11.57 | % | | $ | 255,204 | | | 4.00 | % | | $ | 319,004 | | | 5.00 | % |
(1) Refers to quarterly average assets as calculated in accordance with policies established by bank regulatory agencies.
As of December 31, 2020, Southside Bancshares and Southside Bank met all capital adequacy requirements under the Basel III Capital Rules that became fully phased-in as of January 1, 2019.
The table below summarizes our key equity ratios:
| | | | | | | | | | | | | | | | | | | | |
| | | Years Ended December 31, |
| | | 2020 | | 2019 | | 2018 |
| Return on average assets | | 1.14 | % | | 1.17 | % | | 1.19 | % |
| Return on average shareholders’ equity | | 9.91 | % | | 9.53 | % | | 9.87 | % |
| Dividend payout ratio – Basic | | 52.63 | % | | 57.01 | % | | 56.60 | % |
| Dividend payout ratio – Diluted | | 52.63 | % | | 57.27 | % | | 56.87 | % |
| Average shareholders’ equity to average total assets | | 11.55 | % | | 12.23 | % | | 12.06 | % |
EFFECTS OF INFLATION
Our consolidated financial statements and their related notes have been prepared in accordance with GAAP which requires the measurement of financial position and operating results in terms of historical dollars, without considering the change in the relative purchasing power of money over time and due to inflation. The impact of inflation is reflected in the increased cost of our operations. Unlike many industrial companies, nearly all of our assets and liabilities are monetary. As a result, interest rates have a greater impact on our performance than do the effects of general levels of inflation. Interest rates do not necessarily move in the same direction or to the same extent as the price of goods and services. Inflation can affect the amount of money customers have for deposits, as well as the ability to repay loans.
MANAGEMENT OF LIQUIDITY
Liquidity management involves our ability to convert assets to cash with minimum risk of loss while enabling us to meet our obligations to our customers at any time. This means addressing (1) the immediate cash withdrawal requirements of depositors and other fund providers; (2) the funding requirements of lines and letters of credit; and (3) the short-term credit needs of customers. Liquidity is provided by cash, interest earning deposits and short-term investments that can be readily liquidated with a minimum risk of loss. At December 31, 2020, these investments were 7.4% of total assets, as compared with 7.8% for December 31, 2019, and 4.0% for December 31, 2018. The decrease to 7.4% at December 31, 2020, is reflective of the increase in total assets while the increase as compared to December 31, 2018, is primarily reflective of an increase in the short-term investment portfolio, partially offset by the increase in total assets. Liquidity is further provided through the matching, by time period, of rate sensitive interest earning assets with rate sensitive interest bearing liabilities. The Bank has three unsecured lines of credit for the purchase of overnight federal funds at prevailing rates with Frost Bank, TIB-The Independent Bankers Bank and Comerica Bank for $40.0 million, $15.0 million and $7.5 million, respectively. There were no federal funds purchased at December 31, 2020 or 2019. There were $28.0 million of federal funds purchased at December 31, 2018. To provide more liquidity in response to the COVID-19 pandemic, the Federal Reserve took steps to encourage broader use of the discount window. At December 31, 2020, the amount of additional funding the Bank could obtain from the FRDW, collateralized by securities and PPP loans, was approximately $722.3 million. There were no borrowings from the FRDW at December 31, 2020. At December 31, 2020, the amount of additional funding Southside Bank could obtain from FHLB, collateralized by securities, FHLB stock and nonspecified loans and securities, was approximately $1.15 billion, net of FHLB stock purchases required. The Bank has a $5.0 million line of credit with Frost Bank to be used to issue letters of credit, and at December 31, 2020, the line had one outstanding letter of credit for $1.0 million. The Bank currently has no outstanding letters of credit from FHLB held as collateral for its public fund deposits.
Management continually evaluates our liquidity position and currently believes the Company has adequate funding to meet our financial needs. During March 2020, in response to COVID-19, the Federal Reserve lowered the primary credit rate by 150 basis points to 0.25 percent and extended terms to 90 days to enhance market liquidity and encourage use of the discount window. In addition, the Federal Reserve announced it would begin quantitative easing, or large-scale asset purchases, consisting primarily of U.S. Treasury securities and MBS to stem the effects of the pandemic on the financial markets. Failure to contain the COVID-19 pandemic could cause a widespread liquidity crisis, and the availability of these funds or the options to sell securities currently held could be hindered. The full impact and duration of COVID-19 on our business is unknown but if it continues to curtail economic activity, it could impact our ability to obtain funding and result in the reduction of or the cessation of dividends.
Interest rate sensitivity management seeks to avoid fluctuating net interest margins and to enhance consistent growth of net interest income through periods of changing interest rates. The ALCO closely monitors various liquidity ratios and interest rate spreads and margins. The ALCO utilizes a simulation model to perform interest rate simulation tests that apply various interest rate scenarios including immediate shocks and MVPE to assist in determining our overall interest rate risk and the adequacy of our liquidity position. In addition, the ALCO utilizes this simulation model to determine the impact on net interest income of various interest rate scenarios. By utilizing this technology, we can determine changes that need to be made to the asset and liability mix to minimize the change in net interest income under these various interest rate scenarios.
OFF-BALANCE-SHEET ARRANGEMENTS
Financial Instruments with Off-Balance-Sheet Risk. In the normal course of business, we are a party to certain financial instruments with off-balance-sheet risk to meet the financing needs of our customers. These off-balance-sheet instruments include commitments to extend credit and standby letters of credit. These instruments involve, to varying degrees, elements of credit and interest rate risk in excess of the amount reflected in the financial statements. The contract or notional amounts of these instruments reflect the extent of involvement and exposure to credit loss that we have in these particular classes of financial instruments. The allowance for credit losses on these off-balance-sheet credit exposures is calculated using the same methodology as loans including a conversion or usage factor to anticipate ultimate exposure and expected losses and is included in other liabilities on our consolidated balance sheet.
Allowance for off-balance-sheet credit exposures were as follows (in thousands):
| | | | | | | | | | | | | | | | | |
| Years Ended December 31, |
| 2020 | | 2019 | | 2018 |
| | | | | |
| Balance at beginning of period | $ | 1,455 | | | $ | 1,890 | | | $ | 1,971 | |
Impact of CECL adoption | 4,840 | | | — | | | — | |
| Provision for (reversal of) off-balance-sheet credit exposures | 91 | | | (435) | | | (81) | |
| Balance at end of period | $ | 6,386 | | | $ | 1,455 | | | $ | 1,890 | |
Commitments to extend credit are agreements to lend to a customer provided that the terms established in the contract are met. Commitments to extend credit generally have fixed expiration dates and may require the payment of fees. Since some commitments are expected to expire without being drawn upon, the total commitment amounts do not necessarily represent future cash requirements. Standby letters of credit are conditional commitments issued to guarantee the performance of a customer to a third party. These guarantees are primarily issued to support public and private borrowing arrangements. The credit risk involved in issuing letters of credit is essentially the same as that involved in commitments to extend credit and similarly do not necessarily represent future cash obligations.
Financial instruments with off-balance-sheet risk were as follows (in thousands):
| | | | | | | | | | | |
| | December 31, 2020 | | December 31, 2019 |
| | | |
| Commitments to extend credit | $ | 793,138 | | | $ | 925,671 | |
| Standby letters of credit | 13,658 | | | 17,211 | |
| Total | $ | 806,796 | | | $ | 942,882 | |
We apply the same credit policies in making commitments to extend credit and standby letters of credit as we do for on-balance-sheet instruments. We evaluate each customer’s creditworthiness on a case-by-case basis. The amount of collateral obtained, if deemed necessary, upon extension of credit is based on management’s credit evaluation of the borrower. Collateral held varies but may include cash or cash equivalents, negotiable instruments, real estate, accounts receivable, inventory, oil, gas and mineral interests, property, plant and equipment.
COMMITMENTS AND CONTRACTUAL OBLIGATIONS
The following summarizes our contractual cash obligations and commercial commitments at December 31, 2020 and the effect such obligations are expected to have on liquidity and cash flow in future periods (in thousands). Payments reflected in the table below do not include interest:
| | | | | | | | | | | | | | | | | | | | | | | | | | | | | | | | |
| | | Payments Due By Period |
| | | Less than 1 Year | | 1-3
Years | | 3-5
Years | | More than 5 Years | | Total |
| Contractual obligations: | | |
| FHLB borrowings | | $ | 828,489 | | | $ | 1,390 | | | $ | 1,512 | | | $ | 1,136 | | | $ | 832,527 | |
Subordinated notes (1) (2) | | 100,000 | | | — | | | — | | | 100,000 | | | 200,000 | |
Trust preferred subordinated debentures (1) | | — | | | — | | | — | | | 60,311 | | | 60,311 | |
Operating leases (3) | | 1,831 | | | 2,897 | | | 2,445 | | | 14,037 | | | 21,210 | |
Deferred compensation agreements (4) | | 386 | | | 1,004 | | | 825 | | | 8,784 | | | 10,999 | |
| CDs | | 651,898 | | | 114,249 | | | 24,832 | | | 118 | | | 791,097 | |
| | | | | | | | | | |
| | | | | | | | | | |
| | | | | | | | | | |
| | | | | | | | | | |
| Total contractual obligations | | $ | 1,582,604 | | | $ | 119,540 | | | $ | 29,614 | | | $ | 184,386 | | | $ | 1,916,144 | |
(1) Subordinated notes, net of unamortized debt issuance costs, were $197.3 million at December 31, 2020. Trust preferred subordinated debentures, net of unamortized debt issuance costs, were $60.3 million at December 31, 2020. See “Note 9 – Long-Term Debt” for further information.
(2) We currently expect to exercise our call option on our $100 million 5.50% subordinated notes based on the current interest rate environment.
(3) See “Note 16 – Leases” for further information.
(4) See “Note 10 – Employee Benefits” for further information.
We expect to contribute $918,000 to our Restoration Plan in 2021. We do not expect to contribute to our defined benefit plans during 2021. We do expect to contribute to our defined benefit plans in future years; however, those amounts are indeterminable at this time.
ITEM 7A. QUANTITATIVE AND QUALITATIVE DISCLOSURES ABOUT MARKET RISK
In the banking industry, a major risk exposure is changing interest rates. The primary objective of monitoring our interest rate sensitivity, or risk, is to provide management the tools necessary to manage the balance sheet to minimize adverse changes in net interest income as a result of changes in the direction and level of interest rates. Federal Reserve monetary control efforts, the effects of deregulation, economic uncertainty and legislative changes have been significant factors affecting the task of managing interest rate sensitivity positions in recent years.
In an attempt to manage our exposure to changes in interest rates, management closely monitors our exposure to interest rate risk through our ALCO. Our ALCO meets regularly and reviews our interest rate risk position and makes recommendations to our board for adjusting this position. In addition, our board reviews our asset/liability position on a monthly basis. We primarily use two methods for measuring and analyzing interest rate risk: net income simulation analysis and MVPE modeling. We utilize the net income simulation model as the primary quantitative tool in measuring the amount of interest rate risk associated with changing market rates. This model quantifies the effects of various interest rate scenarios on projected net interest income and net income over the next 12 months. The model is used to measure the impact on net interest income relative to a base case scenario of rates immediately increasing 100 and 200 basis points or decreasing 50 basis points over the next 12 months. These simulations incorporate assumptions regarding balance sheet growth and mix, pricing and the repricing and maturity characteristics of the existing and projected balance sheet. The impact of interest rate-related risks such as prepayment, basis and option risk are also considered. The model has interest rate floors, and no interest rates are assumed to go negative. The interest rate environment has declined during 2020 to a point where most treasury terms are under 100 basis points; therefore, we do not believe an analysis of an assumed decrease in interest rates beyond 50 basis points would provide meaningful results. We will continue to monitor interest rates, and we will resume the simulation of rates decreasing 100 and 200 basis points once rates begin to rise.
The following table reflects the noted increases and decreases in interest rates under the model simulations and the anticipated impact on net interest income relative to the base case over the next twelve months for the periods presented.
| | | | | | | | | | | |
| Anticipated impact over the next twelve months |
| December 31, |
| Rate projections: | 2020 | | 2019 |
| Increase: | | | |
| 100 basis points | 2.40 | % | | 1.20 | % |
| 200 basis points | 5.17 | % | | (1.76) | % |
| | | |
| Decrease: | | | |
| 50 basis points | (2.08) | % | | 1.18 | % |
| 100 basis points | N/A | | 0.51 | % |
| 200 basis points | N/A | | (1.79) | % |
As part of the overall assumptions, certain assets and liabilities are given reasonable floors. This type of simulation analysis requires numerous assumptions including but not limited to changes in balance sheet mix, prepayment rates on mortgage-related assets and fixed rate loans, cash flows and repricing of all financial instruments, changes in volumes and pricing, future shapes of the yield curve, relationship of market interest rates to each other (basis risk), credit spread and deposit sensitivity. Assumptions are based on management’s best estimates but may not accurately reflect actual results under certain changes in interest rates.
In addition to interest rate risk, the COVID-19 pandemic and the related stay-at-home and self-distancing mandates have exposed us and will likely continue to expose us to additional market value risk. Protracted closures, furloughs and lay-offs have curtailed economic activity, and will likely continue to curtail economic activity and could result in lower fair values for collateral in our commercial and 1-4 family portfolio segments.
The ALCO monitors various liquidity ratios to ensure a satisfactory liquidity position for us. Management continually evaluates the condition of the economy, the pattern of market interest rates and other economic data to determine the types of investments that should be made and at what maturities. Using this analysis, management from time to time assumes calculated interest sensitivity gap positions to maximize net interest income based upon anticipated movements in the general level of interest rates. Regulatory authorities also monitor our gap position along with other liquidity ratios. In addition, as described above, we utilize a simulation model to determine the impact of net interest income under several different interest rate
scenarios. By utilizing this model, we can determine changes that need to be made to the asset and liability mixes to mitigate the change in net interest income under these various interest rate scenarios.
ITEM 8. FINANCIAL STATEMENTS AND SUPPLEMENTARY DATA
| | | | | | | | |
| INDEX |
| | |
| Report of Independent Registered Public Accounting Firm | | |
| | |
| CONSOLIDATED FINANCIAL STATEMENTS | | |
Consolidated Balance Sheets as of December 31, 2020 and 2019 | | |
| Consolidated Statements of Income for the years ended December 31, 2020, 2019 and 2018 | | |
| Consolidated Statements of Comprehensive Income for the years ended December 31, 2020, 2019 and 2018 | | |
| Consolidated Statements of Changes in Shareholders’ Equity for the years ended December 31, 2020, 2019 and 2018 | | |
| Consolidated Statements of Cash Flows for the years ended December 31, 2020, 2019 and 2018 | | |
| Notes to Consolidated Financial Statements | | |
| | |
Report of Independent Registered Public Accounting Firm
To the Shareholders and the Board of Directors of Southside Bancshares, Inc. and Subsidiaries
Opinion on the Financial Statements
We have audited the accompanying consolidated balance sheets of Southside Bancshares, Inc. and Subsidiaries (the Company) as of December 31, 2020 and 2019, the related consolidated statements of income, comprehensive income, changes in shareholders’ equity and cash flows for each of the three years in the period ended December 31, 2020, and the related notes (collectively referred to as the “consolidated financial statements”). In our opinion, the consolidated financial statements present fairly, in all material respects, the financial position of the Company at December 31, 2020 and 2019, and the results of its operations and its cash flows for each of the three years in the period ended December 31, 2020, in conformity with U.S. generally accepted accounting principles.
We also have audited, in accordance with the standards of the Public Company Accounting Oversight Board (United States) (PCAOB), the Company’s internal control over financial reporting as of December 31, 2020, based on the criteria established in Internal Control-Integrated Framework issued by the Committee of Sponsoring Organizations of the Treadway Commission (2013 framework), and our report dated February 26, 2021 expressed an unqualified opinion thereon.
Adoption of ASU 2016-13
As discussed in Note 1 to the consolidated financial statements, the Company changed its method of accounting for credit losses in 2020 due to the adoption of Accounting Standards Update (ASU) No. 2016-13, Financial Instruments — Credit Losses (Topic 326): Measurement of Credit Losses on Financial Instruments, and the related amendments.
Basis for Opinion
These financial statements are the responsibility of the Company’s management. Our responsibility is to express an opinion on the Company’s financial statements based on our audits. We are a public accounting firm registered with the PCAOB and are required to be independent with respect to the Company in accordance with the U.S. federal securities laws and the applicable rules and regulations of the Securities and Exchange Commission and the PCAOB.
We conducted our audits in accordance with the standards of the PCAOB. Those standards require that we plan and perform the audit to obtain reasonable assurance about whether the financial statements are free of material misstatement, whether due to error or fraud. Our audits included performing procedures to assess the risks of material misstatement of the financial statements, whether due to error or fraud, and performing procedures that respond to those risks. Such procedures included examining, on a test basis, evidence regarding the amounts and disclosures in the financial statements. Our audits also included evaluating the accounting principles used and significant estimates made by management, as well as evaluating the overall presentation of the financial statements. We believe that our audits provide a reasonable basis for our opinion.
Critical Audit Matter
The critical audit matter communicated below is a matter arising from the current period audit of the financial statements that was communicated or required to be communicated to the audit committee and that: (1) relates to accounts or disclosures that are material to the financial statements and (2) involved our especially challenging, subjective or complex judgments. The communication of the critical audit matter does not alter in any way our opinion on the consolidated financial statements, taken as a whole, and we are not, by communicating the critical audit matter below, providing a separate opinion on the critical audit matter or on the account or disclosures to which it relates.
| | | | | |
| Allowance for Credit Losses - Loans |
| Description of the Matter | On January 1, 2020, the Company adopted ASU No. 2016-13, Financial Instruments- Credit Losses, also known as Current Expected Credit Losses (“CECL”). With the adoption of ASU 2016-13 on January 1, 2020, the allowance for credit losses on loans is estimated and recognized upon origination of the loan based on expected credit losses. Upon adoption, the Company recorded a cumulative-effect transition adjustment increasing the allowance for credit losses on loans and reducing retained earnings by $5.3 million (pre-tax). The Company’s loan portfolio totaled $3.6 billion as of December 31, 2020, and the allowance for credit losses (ACL) was $49.0 million. As discussed in Note 1 and Note 5 to the consolidated financial statements, the ACL is an amount which represents management’s estimate of credit losses over the contractual life of the loans. The ACL is estimated based on historical and expected credit loss patterns within reasonable and supportable forecast periods. Management applies judgement in the assignment of probabilities to economic scenarios included within the modeled forecast periods to estimate the ACL.
Auditing management’s estimate of the ACL involved a high degree of subjectivity due to the judgement involved in management’s determination of the probabilities assigned to the economic scenarios utilized within the reasonable and supportable forecast periods to estimate the future credit losses within the loan portfolio. Management’s estimate of the future economic conditions could have a significant impact on the ACL. |
| |
| How We Addressed the Matter in Our Audit | Our considerations and procedures performed were reflective of the implementation and re-occurring CECL process for the year and included evaluation of the process utilized by management to challenge the model results and determine the best estimate of the ACL as of the balance sheet date. We obtained an understanding of the Company’s process for establishing the ACL, including determination of the probabilities assigned to the economic scenarios utilized within the reasonable and supportable forecast periods. We evaluated the design and tested the operating effectiveness of the controls associated with the ACL process, including controls around the reliability and accuracy of data used in the model, management’s review and approval of the probabilities assigned to the economic scenarios utilized within the reasonable and supportable forecast periods, the governance of the credit loss methodology, and management’s review and approval of the ACL.
We tested the completeness and accuracy of data used by the Company within the model to estimate the ACL and involved an internal specialist to assess the conceptual soundness of the model and replicate the model calculation. We tested the probabilities assigned to the economic scenarios utilized within the model for the reasonable and supportable forecast periods by evaluating the probabilities and the model results. Within the testing performed, we considered the assumptions included within each economic scenario and probabilities assigned and how those assumptions and probabilities compared to key economic variables available through external sources. Alternative sources and scenarios were also considered. In addition, we evaluated the Company’s estimate of the overall ACL giving consideration to the Company’s borrowers, loan portfolio, and macroeconomic trends, compared such information to comparable financial institutions and considered whether new or contrary information existed. |
/s/ Ernst & Young LLP
We have served as the Company’s auditor since 2012.
Dallas, Texas
February 26, 2021
SOUTHSIDE BANCSHARES, INC. AND SUBSIDIARIES
CONSOLIDATED BALANCE SHEETS
(in thousands, except share amounts)
| | | | | | | | | | | | | | |
| | December 31, 2020 | | December 31, 2019 |
| | |
| ASSETS | | | | |
| Cash and due from banks | | $ | 87,357 | | | $ | 66,949 | |
| Interest earning deposits | | 21,051 | | | 43,748 | |
| | | | |
| Total cash and cash equivalents | | 108,408 | | | 110,697 | |
| Securities: | | | | |
Securities AFS, at estimated fair value (amortized cost of $2,437,513 and $2,306,741, respectively) | | 2,587,305 | | | 2,358,597 | |
Securities HTM (estimated fair value of $118,198 and $138,879, respectively) | | 108,998 | | | 134,863 | |
| FHLB stock, at cost | | 25,259 | | | 50,087 | |
| Equity investments | | 11,905 | | | 12,331 | |
| Loans held for sale | | 3,695 | | | 383 | |
| Loans: | | | | |
| Loans | | 3,657,779 | | | 3,568,204 | |
| Less: Allowance for loan losses | | (49,006) | | | (24,797) | |
| Net loans | | 3,608,773 | | | 3,543,407 | |
| Premises and equipment, net | | 144,576 | | | 143,912 | |
| Operating lease ROU assets | | 15,063 | | | 9,755 | |
| Goodwill | | 201,116 | | | 201,116 | |
| Other intangible assets, net | | 9,744 | | | 13,361 | |
| Interest receivable | | 38,708 | | | 28,452 | |
| | | | |
| | | | |
| Unsettled issuances of brokered CDs | | — | | | 20,000 | |
| BOLI | | 115,583 | | | 100,498 | |
| Other assets | | 29,094 | | | 21,454 | |
| Total assets | | $ | 7,008,227 | | | $ | 6,748,913 | |
| | | | | |
| LIABILITIES AND SHAREHOLDERS’ EQUITY | | | | |
| Deposits: | | | | |
| Noninterest bearing | | $ | 1,354,815 | | | $ | 1,040,112 | |
| Interest bearing | | 3,577,507 | | | 3,662,657 | |
| Total deposits | | 4,932,322 | | | 4,702,769 | |
| Other borrowings | | 23,172 | | | 28,358 | |
| FHLB borrowings | | 832,527 | | | 972,744 | |
| Subordinated notes, net of unamortized debt issuance costs | | 197,251 | | | 98,576 | |
| Trust preferred subordinated debentures, net of unamortized debt issuance costs | | 60,255 | | | 60,250 | |
| Deferred tax liability, net | | 15,549 | | | 4,823 | |
| Unsettled trades to purchase securities | | — | | | 17,538 | |
| Operating lease liabilities | | 16,734 | | | 10,174 | |
| Other liabilities | | 55,120 | | | 49,101 | |
| Total liabilities | | 6,132,930 | | | 5,944,333 | |
| | | | | |
| Off-balance-sheet arrangements, commitments and contingencies (Note 17) | | | | |
| | | | | |
| Shareholders’ equity: | | | | |
Common stock: ($1.25 par value, 80,000,000 shares authorized, 37,934,819 shares issued at December 31, 2020 and 37,887,662 shares issued at December 31, 2019) | | 47,419 | | | 47,360 | |
| Paid-in capital | | 771,511 | | | 766,718 | |
| Retained earnings | | 111,208 | | | 80,274 | |
Treasury stock: (shares at cost, 4,983,645 at December 31, 2020 and 4,064,405 at December 31, 2019) | | (123,921) | | | (94,008) | |
| AOCI | | 69,080 | | | 4,236 | |
| Total shareholders’ equity | | 875,297 | | | 804,580 | |
| Total liabilities and shareholders’ equity | | $ | 7,008,227 | | | $ | 6,748,913 | |
The accompanying notes are an integral part of these consolidated financial statements.
SOUTHSIDE BANCSHARES, INC. AND SUBSIDIARIES
CONSOLIDATED STATEMENTS OF INCOME
(in thousands, except per share data)
| | | | | | | | | | | | | | | | | | | | |
| | Years Ended December 31, |
| | | 2020 | | 2019 | | 2018 |
| Interest income: | | | | | | |
| Loans | | $ | 158,450 | | | $ | 170,288 | | | $ | 158,691 | |
| Taxable investment securities | | 4,172 | | | 167 | | | 417 | |
| Tax-exempt investment securities | | 33,416 | | | 16,856 | | | 24,960 | |
| MBS | | 34,319 | | | 50,486 | | | 41,584 | |
| FHLB stock and equity investments | | 1,233 | | | 1,654 | | | 1,595 | |
| Other interest earning assets | | 238 | | | 1,336 | | | 1,918 | |
| Total interest income | | 231,828 | | | 240,787 | | | 229,165 | |
| Interest expense: | | | | | | |
| Deposits | | 24,648 | | | 44,565 | | | 35,864 | |
| FHLB borrowings | | 11,397 | | | 17,719 | | | 12,813 | |
| Subordinated notes | | 6,301 | | | 5,661 | | | 5,659 | |
| Trust preferred subordinated debentures | | 1,829 | | | 2,775 | | | 2,610 | |
| Other borrowings | | 388 | | | 262 | | | 155 | |
| Total interest expense | | 44,563 | | | 70,982 | | | 57,101 | |
| Net interest income | | 187,265 | | | 169,805 | | | 172,064 | |
| Provision for credit losses | | 20,201 | | | 5,101 | | | 8,437 | |
| Net interest income after provision for credit losses | | 167,064 | | | 164,704 | | | 163,627 | |
| Noninterest income: | | | | | | |
| Deposit services | | 24,359 | | | 26,038 | | | 25,082 | |
| Net gain (loss) on sale of securities AFS | | 8,257 | | | 756 | | | (1,839) | |
| | | | | | |
| | | | | | |
| | | | | | |
| Gain on sale of loans | | 2,772 | | | 509 | | | 692 | |
| Trust fees | | 5,133 | | | 6,269 | | | 6,832 | |
| BOLI | | 2,554 | | | 2,307 | | | 2,923 | |
| Brokerage services | | 2,271 | | | 2,080 | | | 1,987 | |
| Other | | 4,386 | | | 4,409 | | | 5,096 | |
| Total noninterest income | | 49,732 | | | 42,368 | | | 40,773 | |
| Noninterest expense: | | | | | | |
| Salaries and employee benefits | | 77,225 | | | 73,731 | | | 70,643 | |
| Net occupancy | | 14,369 | | | 13,128 | | | 13,814 | |
| Acquisition expense | | — | | | — | | | 2,413 | |
| Advertising, travel & entertainment | | 2,147 | | | 2,964 | | | 2,894 | |
| ATM expense | | 1,018 | | | 894 | | | 1,090 | |
| Professional fees | | 4,224 | | | 4,717 | | | 4,035 | |
| Software and data processing | | 4,957 | | | 4,537 | | | 3,996 | |
| Communications | | 1,984 | | | 1,941 | | | 1,847 | |
| FDIC insurance | | 1,124 | | | 859 | | | 1,871 | |
| Amortization of intangibles | | 3,617 | | | 4,418 | | | 5,213 | |
| Other | | 12,642 | | | 12,108 | | | 12,283 | |
| Total noninterest expense | | 123,307 | | | 119,297 | | | 120,099 | |
| Income before income tax expense | | 93,489 | | | 87,775 | | | 84,301 | |
| Income tax expense | | 11,336 | | | 13,221 | | | 10,163 | |
| Net income | | $ | 82,153 | | | $ | 74,554 | | | $ | 74,138 | |
| | | | | | |
| Earnings per common share – basic | | $ | 2.47 | | | $ | 2.21 | | | $ | 2.12 | |
| Earnings per common share – diluted | | $ | 2.47 | | | $ | 2.20 | | | $ | 2.11 | |
| Cash dividends paid per common share | | $ | 1.30 | | | $ | 1.26 | | | $ | 1.20 | |
The accompanying notes are an integral part of these consolidated financial statements.
SOUTHSIDE BANCSHARES, INC. AND SUBSIDIARIES
CONSOLIDATED STATEMENTS OF COMPREHENSIVE INCOME
(in thousands)
| | | | | | | | | | | | | | | | | |
| Years Ended December 31, |
| 2020 | | 2019 | | 2018 |
| Net income | $ | 82,153 | | | $ | 74,554 | | | $ | 74,138 | |
| Other comprehensive income (loss): | | | | | |
| Securities AFS and transferred securities: | | | | | |
| Change in unrealized holding gain (loss) on AFS securities during the period | 105,845 | | | 87,481 | | | (34,238) | |
| Unrealized net gain on securities transferred from HTM to AFS under the transition guidance enumerated in ASU 2017-12 | — | | | — | | | 11,881 | |
| Change in net unrealized loss on securities transferred from HTM to AFS | — | | | — | | | 401 | |
| | | | | |
| | | | | |
| Reclassification adjustment for amortization related to AFS and HTM debt securities | 1,197 | | | 816 | | | 1,244 | |
| | | | | |
| Reclassification adjustment for net (gain) loss on sale of AFS securities, included in net income | (8,257) | | | (756) | | | 1,839 | |
| | | | | |
| Derivatives: | | | | | |
| Change in net unrealized (loss) gain on effective cash flow hedge interest rate swap derivatives | (23,462) | | | (9,118) | | | 2,351 | |
| | | | | |
| Reclassification adjustment of net loss (gain) related to derivatives designated as cash flow hedges | 3,945 | | | (2,043) | | | (1,406) | |
| | | | | |
| Pension plans: | | | | | |
| Amortization of net actuarial loss and prior service credit, included in net periodic benefit cost | 3,028 | | | 2,378 | | | 2,182 | |
| Effect of settlement recognition | 215 | | | — | | | — | |
| Prior service cost adjustment due to plan amendments | 163 | | | — | | | — | |
| Change in net actuarial loss | (593) | | | (9,816) | | | (1,994) | |
| Other comprehensive income (loss), before tax | 82,081 | | | 68,942 | | | (17,740) | |
| Income tax (expense) benefit related to items of other comprehensive income (loss) | (17,237) | | | (14,478) | | | 3,725 | |
| Other comprehensive income (loss), net of tax | 64,844 | | | 54,464 | | | (14,015) | |
| Comprehensive income | $ | 146,997 | | | $ | 129,018 | | | $ | 60,123 | |
The accompanying notes are an integral part of these consolidated financial statements.
SOUTHSIDE BANCSHARES, INC. AND SUBSIDIARIES
CONSOLIDATED STATEMENTS OF CHANGES IN SHAREHOLDERS’ EQUITY
(in thousands, except share amounts)
| | | | | | | | | | | | | | | | | | | | | | | | | | | | | | | | | | | | | | |
| | | Common
Stock | | Paid In
Capital | | Retained
Earnings | | Treasury
Stock | | Accumulated
Other
Comprehensive
Income (Loss) | | Total Shareholders’
Equity |
| Balance at December 31, 2017 | | $ | 47,253 | | | $ | 757,439 | | | $ | 32,851 | | | $ | (47,105) | | | $ | (36,298) | | | $ | 754,140 | |
| Cumulative effect of accounting change | | — | | | — | | | (85) | | | — | | | 85 | | | — | |
| Adjusted beginning balance | | 47,253 | | | 757,439 | | | 32,766 | | | (47,105) | | | (36,213) | | | 754,140 | |
| Net income | | — | | | — | | | 74,138 | | | — | | | — | | | 74,138 | |
| Other comprehensive loss | | — | | | — | | | — | | | — | | | (14,015) | | | (14,015) | |
Issuance of common stock for dividend reinvestment plan (42,872 shares) | | 54 | | | 1,424 | | | — | | | — | | | — | | | 1,478 | |
| | | | | | | | | | | | |
Purchase of common stock (1,459,148 shares) | | — | | | — | | | — | | | (47,193) | | | — | | | (47,193) | |
| Stock compensation expense | | — | | | 2,317 | | | — | | | — | | | — | | | 2,317 | |
| | | | | | | | | | | | |
Net issuance of common stock under employee stock plans (140,692 shares) | | — | | | 1,290 | | | (128) | | | 1,243 | | | — | | | 2,405 | |
Cash dividends paid on common stock ($1.20 per share) | | — | | | — | | | (41,979) | | | — | | | — | | | (41,979) | |
| | | | | | | | | | | | |
| | | | | | | | | | | | |
| Balance at December 31, 2018 | | 47,307 | | | 762,470 | | | 64,797 | | | (93,055) | | | (50,228) | | | 731,291 | |
| Cumulative effect of accounting change | | — | | | — | | | (16,452) | | | — | | | — | | | (16,452) | |
| Adjusted beginning balance | | 47,307 | | | 762,470 | | | 48,345 | | | (93,055) | | | (50,228) | | | 714,839 | |
| Net income | | — | | | — | | | 74,554 | | | — | | | — | | | 74,554 | |
| Other comprehensive income | | — | | | — | | | — | | | — | | | 54,464 | | | 54,464 | |
Issuance of common stock for dividend reinvestment plan (42,438 shares) | | 53 | | | 1,392 | | | — | | | — | | | — | | | 1,445 | |
| | | | | | | | | | | | |
Purchase of common stock (66,467 shares) | | — | | | — | | | — | | | (2,181) | | | — | | | (2,181) | |
| Stock compensation expense | | — | | | 2,388 | | | — | | | — | | | — | | | 2,388 | |
| | | | | | | | | | | | |
Net issuance of common stock under employee stock plans (122,537 shares) | | — | | | 468 | | | (104) | | | 1,228 | | | — | | | 1,592 | |
Cash dividends paid on common stock ($1.26 per share) | | — | | | — | | | (42,521) | | | — | | | — | | | (42,521) | |
| | | | | | | | | | | | |
| | | | | | | | | | | | |
| Balance at December 31, 2019 | | 47,360 | | | 766,718 | | | 80,274 | | | (94,008) | | | 4,236 | | | 804,580 | |
| Cumulative effect of accounting change | | — | | | — | | | (7,830) | | | — | | | — | | | (7,830) | |
| Adjusted beginning balance | | 47,360 | | | 766,718 | | | 72,444 | | | (94,008) | | | 4,236 | | | 796,750 | |
| Net income | | — | | | — | | | 82,153 | | | — | | | — | | | 82,153 | |
| Other comprehensive income | | — | | | — | | | — | | | — | | | 64,844 | | | 64,844 | |
Issuance of common stock for dividend reinvestment plan (47,157 shares) | | 59 | | | 1,365 | | | — | | | — | | | — | | | 1,424 | |
| | | | | | | | | | | | |
Purchase of common stock (1,035,901 shares) | | — | | | — | | | — | | | (30,989) | | | — | | | (30,989) | |
| | | | | | | | | | | | |
| Stock compensation expense | | — | | | 3,020 | | | — | | | — | | | — | | | 3,020 | |
Net issuance of common stock under employee stock plans (116,661 shares) | | — | | | 408 | | | (185) | | | 1,076 | | | — | | | 1,299 | |
Cash dividends paid on common stock ($1.30 per share) | | — | | | — | | | (43,204) | | | — | | | — | | | (43,204) | |
| | | | | | | | | | | | |
| | | | | | | | | | | | |
| Balance at December 31, 2020 | | $ | 47,419 | | | $ | 771,511 | | | $ | 111,208 | | | $ | (123,921) | | | $ | 69,080 | | | $ | 875,297 | |
The accompanying notes are an integral part of these consolidated financial statements.
SOUTHSIDE BANCSHARES, INC. AND SUBSIDIARIES
CONSOLIDATED STATEMENTS OF CASH FLOWS
(in thousands)
| | | | | | | | | | | | | | | | | | | | |
| | | Years Ended December 31, |
| | | 2020 | | 2019 | | 2018 |
| OPERATING ACTIVITIES: | | | | | | |
| Net income | | $ | 82,153 | | | $ | 74,554 | | | $ | 74,138 | |
| Adjustments to reconcile net income to net cash provided by operations: | | | | | | |
| Depreciation and net amortization | | 12,084 | | | 12,111 | | | 14,045 | |
| Securities premium amortization (discount accretion), net | | 24,291 | | | 13,874 | | | 13,675 | |
| Loan (discount accretion) premium amortization, net | | (1,107) | | | (1,211) | | | (2,333) | |
| Provision for credit losses | | 20,201 | | | 5,101 | | | 8,437 | |
| Stock compensation expense | | 3,020 | | | 2,388 | | | 2,317 | |
| Deferred tax (benefit) expense | | (4,430) | | | 122 | | | 6,154 | |
| | | | | | |
| Net (gain) loss on sale of AFS securities | | (8,257) | | | (756) | | | 1,839 | |
| Net loss on premises and equipment | | 877 | | | 592 | | | 768 | |
| Gross proceeds from sales of loans held for sale | | 74,814 | | | 22,041 | | | 24,092 | |
| Gross originations of loans held for sale | | (78,126) | | | (21,823) | | | (22,692) | |
| Net loss (gain) on OREO | | 151 | | | (100) | | | 433 | |
| Retirement plan curtailment expense | | 163 | | | — | | | — | |
| Retirement plan settlement expense | | 215 | | | — | | | — | |
| Net gain on sale of customer receivables | | — | | | — | | | (124) | |
| Net change in: | | | | | | |
| Interest receivable | | (10,256) | | | (1,165) | | | 1,204 | |
| Other assets | | (6,445) | | | (12,275) | | | (2,166) | |
| Interest payable | | (3,234) | | | 530 | | | 1,257 | |
| Other liabilities | | (15,594) | | | (13,377) | | | 1,358 | |
| Net cash provided by operating activities | | 90,520 | | | 80,606 | | | 122,402 | |
| | | | | | |
| INVESTING ACTIVITIES: | | | | | | |
| Securities AFS: | | | | | | |
| Purchases | | (916,873) | | | (1,253,139) | | | (306,867) | |
| Sales | | 316,043 | | | 751,116 | | | 428,518 | |
| Maturities, calls and principal repayments | | 437,098 | | | 201,529 | | | 137,883 | |
| Securities HTM: | | | | | | |
| | | | | | |
| Maturities, calls and principal repayments | | 26,044 | | | 27,833 | | | 3,064 | |
| Proceeds from redemption of FHLB stock and equity investments | | 31,000 | | | 8,788 | | | 24,360 | |
| Purchases of FHLB stock and equity investments | | (5,689) | | | (26,483) | | | (1,518) | |
| Net loan originations | | (90,206) | | | (262,137) | | | (24,491) | |
| Proceeds from sales of customer receivables | | — | | | — | | | 4,300 | |
| | | | | | |
| | | | | | |
| Purchases of premises and equipment | | (11,435) | | | (15,883) | | | (13,444) | |
| (Purchases for) proceeds of BOLI | | (12,500) | | | — | | | 5,956 | |
| Proceeds from sales of premises and equipment | | 1,846 | | | 96 | | | 1,943 | |
| Proceeds from sales of OREO | | 766 | | | 1,122 | | | 1,717 | |
| Proceeds from sales of repossessed assets | | 171 | | | 328 | | | 483 | |
| Net cash (used in) provided by investing activities | | (223,735) | | | (566,830) | | | 261,904 | |
| | | | | | |
| (continued) | | | | | | |
SOUTHSIDE BANCSHARES, INC. AND SUBSIDIARIES
CONSOLIDATED STATEMENTS OF CASH FLOWS (continued)
(in thousands)
| | | | | | | | | | | | | | | | | | | | |
| | | Years Ended December 31, |
| | | 2020 | | 2019 | | 2018 |
| FINANCING ACTIVITIES: | | | | | | |
| Net change in deposits | | $ | 249,321 | | | $ | 272,638 | | | $ | (106,014) | |
| Net change in other borrowings | | (5,186) | | | (8,452) | | | 27,312 | |
| Proceeds from FHLB | | 21,797,280 | | | 6,914,800 | | | 4,201,500 | |
| Repayment of FHLB | | (21,937,497) | | | (6,661,119) | | | (4,499,788) | |
| Net proceeds from issuance of subordinated long-term debt | | 98,478 | | | — | | | — | |
| | | | | | |
| Proceeds from stock option exercises | | 1,692 | | | 1,986 | | | 2,653 | |
| Cash paid to tax authority related to tax withholding on share-based awards | | (393) | | | (394) | | | (248) | |
| Purchase of common stock | | (30,989) | | | (2,181) | | | (47,193) | |
| Proceeds from the issuance of common stock for dividend reinvestment plan | | 1,424 | | | 1,445 | | | 1,478 | |
| | | | | | |
| Cash dividends paid | | (43,204) | | | (42,521) | | | (41,979) | |
| | | | | | |
| Net cash provided by (used in) financing activities | | 130,926 | | | 476,202 | | | (462,279) | |
| | | | | | |
| Net (decrease) increase in cash and cash equivalents | | (2,289) | | | (10,022) | | | (77,973) | |
| Cash and cash equivalents at beginning of period | | 110,697 | | | 120,719 | | | 198,692 | |
| Cash and cash equivalents at end of period | | $ | 108,408 | | | $ | 110,697 | | | $ | 120,719 | |
| | | | | | |
| | | | | | |
| SUPPLEMENTAL DISCLOSURES FOR CASH FLOW INFORMATION: | | | | | | |
| | | | | | |
| Interest paid | | $ | 47,201 | | | $ | 70,452 | | | $ | 55,844 | |
| Income taxes paid | | $ | 12,000 | | | $ | 10,500 | | | $ | 2,000 | |
| | | | | | |
| SUPPLEMENTAL DISCLOSURES OF NONCASH INVESTING AND FINANCING ACTIVITIES: | | | | | | |
| | | | | | |
| Loans transferred to other repossessed assets and real estate through foreclosure | | $ | 749 | | | $ | 649 | | | $ | 2,128 | |
| Loans transferred from portfolio to held for sale | | $ | — | | | $ | — | | | $ | 3,984 | |
| Transfer of HTM securities to AFS securities | | $ | — | | | $ | — | | | $ | 743,421 | |
| | | | | | |
| | | | | | |
| | | | | | |
| Unsettled trades to purchase securities | | $ | — | | | $ | (17,538) | | | $ | (6,378) | |
| | | | | | |
| Unsettled issuances of brokered CDs | | $ | — | | | $ | 20,000 | | | $ | 15,236 | |
| | | | | | |
The accompanying notes are an integral part of these consolidated financial statements.
| | | | | |
| NOTES TO CONSOLIDATED FINANCIAL STATEMENTS | Southside Bancshares, Inc. and Subsidiaries |
1. SUMMARY OF SIGNIFICANT ACCOUNTING AND REPORTING POLICIES
Organization. Southside Bancshares, Inc., incorporated in Texas in 1982, is a bank holding company for Southside Bank, a Texas state bank headquartered in Tyler, Texas that was formed in 1960. We operate through 57 branches, 15 of which are located in grocery stores. We consider our primary market areas to be East Texas, Southeast Texas, as well as the greater Fort Worth, Austin and Houston, Texas areas. We are a community-focused financial institution that offers a full range of financial services to individuals, businesses, municipal entities and nonprofit organizations in the communities that we serve. These services include consumer and commercial loans, deposit accounts, wealth management and trust services, brokerage services and safe deposit services.
Basis of Presentation and Consolidation. The consolidated financial statements are prepared in conformity with U.S. GAAP and include the accounts of Southside Bancshares, Inc., and its wholly-owned subsidiary, Southside Bank and the nonbank subsidiaries. All significant intercompany accounts and transactions are eliminated in consolidation.
“Omni” refers to OmniAmerican Bancorp, Inc., a bank holding company acquired by Southside on December 17, 2014. On November 30, 2017, we acquired Diboll State Bancshares, Inc., a Texas corporation and the holding company for First Bank & Trust East Texas, a Texas banking association based in Diboll, Texas.
We determine if we have a controlling financial interest in an entity by first evaluating whether the entity is a voting interest entity or a VIE under GAAP. Voting interest entities are entities in which the total equity investment at risk is sufficient to enable the entity to finance itself independently and provides the equity holders with the obligation to absorb losses, the right to receive residual returns and the right to make decisions about the entity’s activities. We consolidate voting interest entities in which we have all, or at least a majority of, the voting interest. As defined in applicable accounting standards, VIEs are entities that lack one or more of the characteristics of a voting interest entity. A controlling financial interest in a VIE is present when an enterprise has both the power to direct the activities of the VIE that most significantly impact the VIE’s economic performance and an obligation to absorb losses or the right to receive benefits that could potentially be significant to the VIE. The enterprise with a controlling financial interest, known as the primary beneficiary, consolidates the VIE.
Accounting Changes and Reclassifications. Certain prior period amounts may be reclassified to conform to current period presentation.
Current Expected Credit Losses
We adopted ASU 2016-13, “Financial Instruments - Credit Losses (Topic 326): Measurement of Credit Losses on Financial Instruments” on January 1, 2020, the effective date of the guidance. ASU 2016-13 replaced the incurred loss model with an expected loss methodology that is referred to as CECL. The CECL model is used to estimate credit losses on certain off-balance-sheet credit exposures and certain types of financial instruments measured at amortized cost including loan receivables and HTM debt securities. ASU 2016-13 also modified the impairment model on AFS debt securities, whereby credit losses are recognized as an allowance rather than a direct write-down of the AFS debt security. In addition, ASU 2016-13 modified the accounting model for PCD financial assets since their origination.
We adopted ASU 2016-13 using the modified retrospective approach for all financial assets measured at amortized cost and off-balance-sheet credit exposures. Adoption of this guidance on January 1, 2020, resulted in a cumulative-effect adjustment to reduce retained earnings by $7.8 million, net of tax. Due to the implementation of the guidance under the modified retrospective approach, prior periods have not been adjusted and are reported in accordance with previously applicable GAAP. See “Note 6 - Loans and Allowance for Loan Losses” in the 2019 Form 10-K for allowance methodology under the incurred loss model prior to adoption of CECL on January 1, 2020. The impairment model for AFS securities will be applied using a prospective approach.
We adopted ASU 2016-13 using the prospective transition approach for financial assets purchased with credit deterioration since their origination that were previously classified as PCI and accounted for under ASC 310-30. On the date of adoption, the amortized cost basis of the PCD assets was adjusted by an allowance for credit losses of $231,000. The remaining noncredit discount based upon the adjusted amortized cost basis will be accreted into interest income at the effective interest rate as of the date of adoption.
CECL. Current expected credit losses is the estimated credit loss over the contractual life of a financial instrument measured upon origination or purchase of the instrument. The measurement of the credit loss is based upon the historical or expected credit loss patterns adjusted for current conditions and reasonable and supportable forecast periods adjusted for prepayments and significant reserve factors. The impact of varying economic conditions and portfolio stress factors are now a component of the credit loss models applied to each portfolio. Reserve factors are specific to the financial instrument segments that share
similar risk characteristics based on the probability of default assumptions and loss given default assumptions, over the contractual term. The forecasted periods gradually mean-revert to the long-run trend based upon historical data. Management evaluates the economic data points used in the Moody’s forecasting scenarios on a quarterly basis to determine the most appropriate impact to the various portfolio characteristics based on management’s view and applies weighting to various forecasting scenarios as deemed appropriate based on known and expected economic activities. Management also considers and may apply relevant qualitative factors, not previously considered, to determine the appropriate allowance level. The use of the CECL model includes significant judgment by management and may differ from those of our peers due to different historical loss patterns, economic forecasts and the length of time of the reasonable and supportable forecast period and reversion period.
When assessing for credit losses from period to period, the change may be indicative of changes in the estimates of timing or the amount of future cash flows, based on the probability of economic forecast scenarios applied, as well as the passage of time. We have elected to report the entire change in present value as provision for credit losses.
When using the discounted cash flow method to determine the allowance for credit losses, management does not adjust the effective interest rate used to discount expected cash flows to incorporate expected prepayments, but rather applies separate prepayment factors.
The following table reflects the impact of ASU 2016-13 on our allowances for credit losses as of January 1, 2020, the date of adoption:
| | | | | | | | | | | | | | | | | | | | |
| | January 1, 2020 |
| | Pre-Adoption | | Impact of Adoption | | Post-Adoption |
| ASSETS | | | | | | |
| Allowance for loan losses | | | | | | |
| Loans: | | | | | | |
| Real estate loans: | | | | | | |
| Construction | | $ | 3,539 | | | $ | 2,953 | | | $ | 6,492 | |
| 1-4 family residential | | 3,833 | | | (1,453) | | | 2,380 | |
| Commercial | | 9,572 | | | 8,063 | | | 17,635 | |
| Commercial loans | | 6,351 | | | (3,554) | | | 2,797 | |
| Municipal loans | | 570 | | | (522) | | | 48 | |
| Loans to individuals | | 932 | | | (184) | | | 748 | |
| Allowance for loan losses | | $ | 24,797 | | | $ | 5,303 | | | $ | 30,100 | |
| | | | | | |
| LIABILITIES | | | | | | |
| Allowance for off-balance-sheet credit exposures | | $ | 1,455 | | | $ | 4,840 | | | $ | 6,295 | |
Use of Estimates. In preparing consolidated financial statements in conformity with GAAP, management is required to make estimates and assumptions that affect the reported amounts of assets and liabilities as of the date of the balance sheet and reported amounts of revenues and expenses during the reporting period. These estimates are subjective in nature and involve matters of judgment. Actual results could differ from these estimates. Material estimates that are particularly susceptible to significant change in the near term relate to the determination of the allowance for credit losses, assumptions used in the defined benefit plan and the fair values of financial instruments. The status of contingencies are particularly subject to change and significant assumptions used in periodic evaluation of securities for other-than-temporary impairment.
Segment Information. Operating segments are components of a business about which separate financial information is available and that are evaluated regularly by the chief operating decision-maker in deciding how to allocate resources and assess performance. Our chief operating decision-maker uses consolidated results to make operating and strategic decisions. Therefore, we have determined that our business is conducted in one reportable segment.
Cash Equivalents. Cash equivalents, for purposes of reporting cash flow, include cash, amounts due from banks and federal funds sold that have an initial maturity of less than 90 days. We maintain deposits with other institutions in amounts that exceed federal deposit insurance coverage. Management regularly evaluates the credit risk associated with the counterparties to these transactions and believes that we are not exposed to any significant credit risks on cash and cash equivalents.
There was no cash required to be on hand or on deposit with the Federal Reserve Bank to meet regulatory reserves or clearing requirements at December 31, 2020. Cash on hand or on deposit with the Federal Reserve Bank of $33.8 million was required to meet regulatory reserves and clearing requirements at December 31, 2019.
Basic and Diluted Earnings per Common Share. Basic earnings per common share is based on net income divided by the weighted-average number of common shares outstanding during the period. Diluted earnings per common share include the dilutive effect of stock awards granted using the treasury stock method. A reconciliation of the weighted-average shares used in calculating basic earnings per common share and the weighted average common shares used in calculating diluted earnings per common share for the reported periods is provided in “Note 2 – Earnings Per Share.”
Comprehensive Income. Comprehensive income includes all changes in shareholders’ equity during a period, except those resulting from transactions with shareholders. Besides net income, other components of comprehensive income include the after tax effect of changes in the fair value of AFS securities, changes in the net unrealized loss on securities transferred to/from HTM, changes in the accumulated gain or loss on effective cash flow hedging instruments and changes in the funded status of defined benefit retirement plans. Comprehensive income is reported in the accompanying consolidated statements of comprehensive income and in “Note 3 – Accumulated Other Comprehensive Income (Loss).”
Loans. Loans that management has the intent and ability to hold for the foreseeable future or until maturity or pay-off are reported at amortized cost. Amortized cost consists of the outstanding principal balance adjusted for any charge-offs and any unamortized origination fees and unamortized premiums or discounts on purchased loans. Loan origination fees, net of certain direct origination costs, are deferred and recognized in interest income over the life of the loan. A loan is considered impaired, based on current information and events, if it is probable that we will be unable to collect the scheduled payments of principal or interest when due according to the contractual terms of the loan agreement. Substantially all of our impaired loans are collateral-dependent, and as such, are measured for impairment based on the fair value of the collateral.
Loans Held For Sale. Loans originated and intended for sale in the secondary market are carried at the lower of aggregate cost or fair value, as determined by aggregate outstanding commitments from investors or current investor yield requirements. Net unrealized losses are recognized through a valuation allowance by charges to income. Gains or losses on sales of mortgage loans are recognized based on the difference between the selling price and the carrying value of the related mortgage loans sold.
Loan Fees. We treat loan fees, net of direct costs, as an adjustment to the yield of the related loan over its term.
Allowance for Credit Losses - Loans. With the adoption of ASU 2016-13 on January 1, 2020, the allowance for credit losses on loans is estimated and recognized upon origination of the loan based on expected credit losses. ASU 2016-13 replaced the previous incurred loss model which incorporated only known information as of the balance sheet date. The CECL model uses historical experience and current conditions for homogeneous pools of loans, and reasonable and supportable forecasts about future events. We utilize Moody’s Analytics economic forecast scenarios and assign probability weighting to those scenarios which best reflect management’s views on the economic forecast. The probability weighting and scenarios utilized for the last two quarters of the 2020 estimate of the allowance, were generally reflective of an improved economic forecast as compared to prior quarters.
When determining the appropriate allowance for credit losses on our loan portfolio, our commercial construction and real estate loans, commercial loans and municipal loans utilize the probability of default/loss given default discounted cash flow approach. These loans are assigned to pools based upon risk factors including the loan type and structure, collateral type, leverage ratio, refinancing risk and origination quality, among others. Our consumer construction real estate loans, 1-4 family residential loans and our loans to individuals use a loss rate approach and are assigned to pools based upon risk factors including loan types, origination year and credit scores.
Loans evaluated collectively in a pool are monitored to ensure they continue to exhibit similar risk characteristics with other loans in a pool. If a loan does not share similar risk characteristics with other loans, expected credit losses for that loan are evaluated individually.
Accrued Interest. Accrued interest for our loans and debt securities, included in interest receivable on our consolidated balance sheets, is excluded from the estimate of allowance for credit losses.
Nonaccrual Assets and Loan Charge-offs. Nonaccrual assets include financial assets 90 days or more delinquent and full collection of both principal and interest is not expected. Financial instruments that are not delinquent or that are delinquent less than 90 days may be placed on nonaccrual status if it is probable that we will not receive contractual principal or interest. When an asset is categorized as nonaccrual, the accrual of interest is discontinued and any accrued balance is reversed for financial statement purposes. Payments received on nonaccrual assets are applied to the outstanding principal balance. Payments of contractual interest are recognized as income only to the extent that full recovery of the principal balance is reasonably certain. Assets are returned to accrual status when all payments contractually due are brought current and future payments are reasonably assured.
Industry and our own experience indicates that a portion of our loans will become delinquent and a portion of our loans will require partial or full charge-off. Regardless of the underwriting criteria utilized, losses may occur as a result of various factors beyond our control, including, among other things, changes in market conditions affecting the value of properties used as collateral for loans and problems affecting the credit worthiness of the borrower and the ability of the borrower to make
payments on the loan. We charge-off loans when deemed uncollectible. Our policy is to charge-off or partially charge-off a retail credit after it is 120 days past due. Charge-offs on commercial credits are determined on a case-by-case basis when a credit loss has been confirmed.
PCD Loans. We have purchased certain loans that as of the date of purchase have experienced more-than-insignificant deterioration in credit quality since origination. Management evaluates these loans against a probability threshold to determine if substantially all of the contractually required payments will be received. With the adoption of ASU 2016-13, PCD loans are recorded at the purchase price plus an allowance for credit losses which becomes the PCD loan's initial amortized cost. The non-credit related discount or premium, the difference between the initial amortized cost and the par value, will be amortized into interest income over the life of the loan. Any further changes to the allowance for credit losses are recorded through provision expense. Prior to the adoption of ASU 2016-13, acquired loans considered PCI were measured at fair value at acquisition date. The difference in expected cash flows at the acquisition date in excess of the fair value was recorded as interest income over the life of the loan. In accordance with the adoption of ASU 2016-13, management did not reassess whether PCI assets met the criteria of PCD assets and elected to not maintain pools of loans as of the date of adoption. All PCD loans are evaluated based upon product type within the underlying segment.
TDRs. A loan is considered a TDR if the original terms of a loan are modified and concessions are made to accommodate a borrower experiencing financial duress. The modification or concession may include reduction of interest rates, reduced payment amounts, and/or extension of terms, among others. The likelihood of initiating a TDR is evaluated at each reporting date for each loan. This evaluation is based on qualitative judgments made by management on a case-by-case basis. If a reasonable expectation of a TDR exists, the expected credit loss is adjusted for any potential delays and/or modifications and disclosed as a reasonably expected TDR.
In response to the COVID-19 pandemic, in March 2020, the CARES Act was signed into law. Under the CARES Act, banks may elect to deem that loan modifications do not result in TDRs if they are (1) related to COVID-19; (2) executed on a loan that was not more than 30 days past due as of December 31, 2019; and (3) executed between March 1, 2020, and the earlier of (A) 60 days after the date of termination of the national emergency declaration or (B) December 31, 2020. Additionally, in accordance with the Interagency Statement on Loan Modifications and Reporting for Financial Institutions Working with Customers Affected by the Coronavirus (Revised), other short-term modifications made on a good faith basis in response to COVID-19 to borrowers who were current prior to any relief are not TDRs under ASC Subtopic 310-40. This includes short-term (e.g., up to six months) modifications such as payment deferrals, fee waivers, extensions of repayment terms, or delays in payments that are insignificant. Borrowers considered current are those that are less than 30 days past due on their contractual payments at the time a modification program is implemented.
OREO and Foreclosed Assets. OREO includes real estate acquired in full or partial settlement of loan obligations. OREO is initially carried at the fair value of the collateral net of estimated selling costs. Prior to foreclosure, the recorded amount of the loan is written down, if necessary, to the appraised fair value of the real estate to be acquired, less selling costs, by charging the allowance for loan losses. Any subsequent reduction in fair value net of estimated selling costs is charged to noninterest expense. Costs of maintaining and operating foreclosed properties are expensed as incurred and included in other expense in our income statement. Expenditures to complete or improve foreclosed properties are capitalized only if expected to be recovered; otherwise, they are expensed.
Other foreclosed assets are held for sale and are initially recorded at fair value less estimated selling costs at the date of foreclosure, by charging the allowance for loan losses. Subsequent to foreclosure, valuations are periodically performed by management and the assets are carried at the lower of carrying amount or fair value less costs to sell. Foreclosed assets are included in other assets in the accompanying consolidated balance sheets. Expenses from operations and changes in the valuation allowance are included in noninterest expense.
Securities. AFS. Debt securities that will be held for indefinite periods of time, including securities that may be sold in response to changes in market interest or prepayment rates, needs for liquidity and changes in the availability of and the yield on alternative investments are classified as AFS. These assets are carried at fair value with unrealized gains and losses, not related to credit losses, reported as a separate component of AOCI, net of tax. Fair value is determined using quoted market prices as of the close of business on the balance sheet date. If quoted market prices are not available, fair values are based on quoted market prices for similar securities or estimates from independent pricing services.
Gains and losses on the sale of securities are recorded in the month of the trade date and are determined using the specific identification method.
HTM. Debt securities that management has the positive intent and ability to hold until maturity are classified as HTM and are carried at their amortized cost which includes the remaining unpaid principal balance, net of unamortized premiums or unaccreted discounts. Our HTM securities are presented on the consolidated balance sheet net of allowance for credit losses, if any. As of December 31, 2020, there was no allowance for credit losses on our HTM securities portfolio.
Premiums and Discounts. Premiums and discounts on debt securities are generally amortized over the contractual life of the security, except for MBS where prepayments are anticipated and for callable debt securities whose premiums are amortized to the earliest call date in accordance with ASC 310. The amortization of purchased premium or discount is included in interest income on our consolidated statements of income. Gains and losses on the sale of securities are recorded in the month of the trade date and are determined using the specific identification method. On January 1, 2019, we adopted ASU 2017-08, “Receivables - Nonrefundable Fees and Other Costs (Subtopic 310-20): Premium Amortization on Purchased Callable Debt Securities,” and in conjunction with the adoption recognized a cumulative effect adjustment to reduce retained earnings by $16.5 million, before tax, related to premiums on callable debt securities. With the adoption of ASU 2017-08, premiums on debt securities will be amortized to the earliest call date. Prior to January 1, 2019, premiums were amortized and discounts were accreted to maturity, or in the case of MBS, over the estimated life of the security, using the level yield interest method.
Allowance for Credit Losses - AFS Securities. With the adoption of ASU 2016-13, AFS debt securities in an unrealized loss position where management (i) has the intent to sell or (ii) where it will more-likely-than-not be required to sell the security before the recovery of its amortized cost basis, we write the security down to fair value through income. For those AFS debt securities that do not meet either of these criteria, management assesses whether the decline in fair value has resulted from credit losses or other factors. Management assesses the financial condition and near-term prospects of the issuer, industry and/or geographic conditions, credit ratings as well as other indicators at the individual security level. If a credit loss is determined to exist, the present value of discounted cash flows expected to be collected from the security are compared to the amortized cost basis of the security. If the present value of discounted cash flows expected to be collected is less than the amortized cost basis, a credit loss exists and an allowance for credit loss is recorded, limited by the amount that the fair value is less than the amortized cost. Any impairment that is not recorded through an allowance for credit losses is recognized in comprehensive income. Any future changes in the allowance for credit losses is recorded as provision for (reversal of) credit losses. Prior to the adoption of ASU 2016-13, the credit related portion of an other-than-temporary impairment was recognized as a direct write-down of the AFS debt security.
Allowance for Credit Losses - HTM Securities. With the adoption of ASU 2016-13, expected credit losses on HTM securities are measured on a collective basis by major security type, when similar risk characteristics exist. Risk characteristics for segmenting HTM debt securities include issuer, maturity, coupon rate, yield, payment frequency, source of repayment, bond payment structure, and embedded options. Upon assignment of the risk characteristics to the major security types, management may further evaluate the qualitative factors associated with these securities to determine the expectation of credit losses, if any.
The major security types within our HTM portfolio include residential and commercial MBS and state and political subdivisions.
Our state and political subdivisions include highly-rated municipal securities with a long history of no credit losses. Our investment policy prohibits bond purchases with a rating less than BAA and limits our entity concentration. We utilize term structures and due to no prior loss exposure on our state and political subdivision securities, we apply third-party average data to model our securities to represent the portion of the asset that would be lost if the issuer were to default. These third-party estimates of recoveries and defaults, adjusted for constant probability over the securities expected life, are used to evaluate the expected loss of the securities. Due to the limited number and the nature of the HTM state and political subdivisions we hold, we do not model these securities as a pool, but on the specific identification method in conjunction with the application of our third-party fair value measurement.
Our residential and commercial MBS are issued and/or guaranteed by U.S. government agencies or GSEs and are collateralized by pools of single- or multi-family mortgages. Our MBS are highly rated securities with a long history of no credit losses which are either explicitly or implicitly backed by the U.S. government agencies, primarily the GNMA and GSEs, primarily Freddie Mac and Fannie Mae which guarantee the payment of principal and interest to investors. Management has collectively evaluated the characteristics of these securities and has assumed an expectation of zero credit loss. Prior to the adoption of ASU 2016-13, the credit related portion of an other-than-temporary impairment was recognized as a direct write-down of the HTM debt security.
We reevaluate the characteristics of our major security types at every reporting period and reassess the considerations to continue to support our expectation of credit loss.
Equity Investments. Equity investments with readily determinable fair values are stated at fair value with the unrealized gains and losses reported in other noninterest income in the consolidated statements of income. Equity investments without readily determinable fair values are recorded at cost less impairment, if any.
Securities with Limited Marketability. Securities with limited marketability, such as stock in the FHLB, are carried at cost and assessed for other-than-temporary impairment.
Premises and Equipment. Land is carried at cost. Bank premises and equipment are stated at cost, net of accumulated depreciation. Depreciation is computed on a straight line basis over the estimated useful lives of the related assets. Useful lives
are estimated to be 15 to 40 years for premises and 3 to 10 years for equipment. Leasehold improvements are generally depreciated over the lesser of the term of the respective leases or the estimated useful lives of the improvements. Maintenance and repairs are charged to expense as incurred while major improvements and replacements are capitalized.
Leases. We evaluate our contracts at inception to determine if an arrangement is or contains a lease. Operating leases are included in operating lease ROU assets and operating lease liabilities in our consolidated balance sheets. Our operating leases relate primarily to bank branches and office space. The Company has no finance leases. Short-term leases, leases with an initial term of 12 months or less and do not contain a purchase option that is likely to be exercised, are not recorded on the balance sheet.
ROU assets represent our right to use an underlying asset for the lease term, and lease liabilities represent our obligation to make lease payments arising from the lease. Operating lease ROU assets and liabilities are recognized at commencement date based on the present value of the future lease payments over the lease term. Our leases do not provide an implicit rate, so we use our incremental borrowing rate based on the information available at commencement date in determining the present value of lease payments. The incremental borrowing rate is reevaluated upon lease modification. The operating lease ROU asset also includes any initial direct costs and prepaid lease payments made less any lease incentives. Our lease terms may include options to extend or terminate the lease when it is reasonably certain that we will exercise that option.
BOLI. The Company has purchased life insurance policies on certain key executives. BOLI is recorded at the amount that can be realized under the insurance contract at the balance sheet date, which is the cash surrender value adjusted for other charges or other amounts due that are probable at settlement. Changes in the net cash surrender value of the policies, as well as insurance proceeds received are reflected in noninterest income on the consolidated statements of income and are not subject to income taxes.
Goodwill and Other Intangibles. Other intangible assets consist primarily of core deposits and trust relationship intangibles. Intangible assets with definite useful lives are amortized on an accelerated basis over their estimated life. Goodwill and intangible assets that have indefinite useful lives are subject to at least an annual impairment test and more frequently if a triggering event occurs. If any such impairment is determined, a write-down is recorded.
We have selected October 1 of each year as the measurement date on which we will complete our annual goodwill impairment assessment. As of October 1, 2020 and 2019, the fair value of the reporting unit was greater than the carrying value of the reporting unit. As a result, we did not record any goodwill impairment for the years ended December 31, 2020 or 2019, and we had no cumulative goodwill impairment.
At December 31, 2020, core deposit intangible and trust relationship intangible was $6.6 million and $3.1 million, respectively. For the years ended December 31, 2020, 2019 and 2018, amortization expense related to our core deposit intangible and trust relationship intangible was $3.5 million, $4.3 million and $5.1 million, respectively.
Repurchase Agreements. We sell certain securities under agreements to repurchase. The agreements are treated as collateralized financing transactions and the obligations to repurchase securities sold are reflected as a liability in the accompanying consolidated balance sheets. The dollar amount of the securities underlying the agreements remains in the asset account. We determine the type of debt securities to pledge which may include investment securities and U.S. agency MBS.
Derivative Financial Instruments and Hedging Activities. Derivative financial instruments are carried on the consolidated balance sheets as other assets or other liabilities, as applicable, at estimated fair value. The accounting for changes in the fair value (i.e., gains or losses) of a derivative financial instrument is determined by whether it has been designated and qualifies as part of a hedging relationship and, further, by the type of hedging relationship. We present derivative financial instruments at fair value in the consolidated balance sheets on a net basis when a right of offset exists, based on transactions with a single counterparty and any cash collateral paid to and/or received from that counterparty for derivative contracts that are subject to legally enforceable master netting arrangements.
For derivative instruments that are designated and qualify as cash flow hedges (i.e., hedging the exposure to variability in expected future cash flows that is attributable to a particular risk), the effective portion of the gain or loss on the derivative instrument is reported as a component of AOCI and reclassified into earnings in the same period or periods during which the hedged transaction affects earnings. The remaining gain or loss on the derivative instrument in excess of the cumulative change in the present value of future cash flows of the hedged item (i.e., the ineffective portion), if any, is recognized in current earnings during the period of change. Gains and losses on derivative instruments designated as fair value hedges, as well as the change in the fair value on the hedged item, are recorded in interest income in the consolidated statements of income. Gains and losses due to changes in the fair value of the interest rate swap agreements completely offset changes in the fair value of the hedged portion of the hedged item. For derivative instruments not designated as hedging instruments, the gain or loss is recognized in current earnings during the period of change.
During the first quarter of 2019, our partial-term fair value hedges for certain of our fixed rate callable AFS municipal securities were ineffective due to the sale of the hedged items. These partial-term hedges of selected cash flows covering the time periods
to the call dates of the hedged securities were expected to be effective in offsetting changes in the fair value of the hedged securities. Interest rate swaps designated as partial-term fair value hedges are utilized to mitigate the effect of changing interest rates on the hedged securities. The hedging strategy converted a portion of the fixed interest rates on the securities to LIBOR-based variable interest rates. As a result of the sale, the cumulative adjustments to the carrying amount was a fair value loss recognized in earnings and recorded in interest income. The remaining fair value loss from the date of the sale of the hedged items through March 31, 2019, was recognized in earnings and recorded in noninterest income. Due to the sale of the hedged items, the interest rate swaps were considered non-hedging instruments and were subsequently terminated on April 12, 2019.
For derivatives designated as hedging instruments at inception, statistical regression analysis is used at inception and for each reporting period thereafter to assess whether the derivative used has been and is expected to be highly effective in offsetting changes in the fair value or cash flows of the hedged item. All components of each derivative instrument’s gain or loss are included in the assessment of hedge effectiveness. Net hedge ineffectiveness is recorded in other noninterest income on the consolidated statements of income.
Terminated Derivative Financial Instruments. In accordance with ASC Topic 815, if a hedging item is terminated prior to maturity for a cash settlement, the existing gain or loss within AOCI will continue to be reclassified into earnings during the period or periods in which the hedged forecasted transaction affects earnings unless it is probable the forecasted transaction will not occur by the end of the originally specified time period. These transactions are reevaluated on a monthly basis to determine if the hedged forecasted transactions are still probable of occurring. If at a subsequent evaluation, it is determined that the transactions will not occur, any related gains or losses recorded in AOCI are immediately recognized in earnings.
Further information on our derivative instruments and hedging activities is included in “Note 11 – Derivative Financial Instruments and Hedging Activities.”
Allowance for Credit Losses - Off-Balance-Sheet Credit Exposures. Our off-balance-sheet credit exposures include contractual commitments to extend credit and standby letters of credit. For these credit exposures we evaluate the expected credit losses using usage given defaults and credit conversion factors depending on the type of commitment and based upon historical usage rates. These assumptions are reevaluated on an annual basis and adjusted if necessary. In accordance with Topic 326, credit losses are not recognized for those credit exposures that are unconditionally cancellable by the Company.
The allowance for credit losses for these off-balance-sheet credit exposures is included in other liabilities on our consolidated balance sheets and is adjusted with a corresponding adjustment to provision for credit losses on our consolidated statements of income. Prior to the adoption of CECL on January 1, 2020, the provision for off-balance-sheet credit exposures was included in other noninterest expense.
Revenue Recognition. Our revenue consists of net interest income on financial assets and financial liabilities and noninterest income. The classifications of our revenue are presented in the consolidated statements of income.
In accordance with ASC Topic 606, revenue is recognized when obligations under the terms of a contract with our customer are satisfied; generally this occurs with the transfer of control of goods or services. We recognize revenue equal to the amounts for which we have a right to invoice, revenue is measured as the amount of consideration we expect to receive in exchange for the transfer of those goods or services. We generally expense sales commissions when incurred because the amortization period is within one year or less. These costs are recorded within salaries and employee benefits on the consolidated statements of income.
The following summarizes our revenue recognition policies as they relate to revenue from contracts with customers:
•Deposit services. Service charges on deposit accounts include fees for banking services provided, overdrafts and non-sufficient funds. Revenue is generally recognized in accordance with published deposit account agreements for retail accounts or contractual agreements for commercial accounts. Our deposit services also include our ATM and debit card interchange revenue that is presented net of the associated costs. Interchange revenue is generated by our deposit customers’ usage and volume of activity. Interchange rates are not controlled by the Company, which effectively acts as processor that collects and remits payments associated with customer debit card transactions.
•Trust income. Trust income includes fees and commissions from investment management, administrative and advisory services primarily for individuals, and to a lesser extent, partnerships and corporations. Revenue is recognized on an accrual basis at the time the services are performed and when we have a right to invoice and are based on either the market value of the assets managed or the services provided.
•Brokerage services. Brokerage services income includes fees and commissions charged when we arrange for another party to transfer brokerage services to a customer. The fees and commissions under this agent relationship are based upon stated fee schedules based upon the type of transaction, volume and value of the services provided.
•Other noninterest income. Other noninterest income includes among other things, merchant services income. Merchant services revenue is derived from third-party vendors that process credit card transactions on behalf of our
merchant customers. Merchant services revenue is primarily comprised of residual fee income based on the referred merchant’s processing volumes and/or margin.
Income Taxes. We file a consolidated federal income tax return. Income tax expense represents the taxes expected to be paid or returned for current year taxes adjusted for the change in deferred tax assets and liabilities. Deferred tax assets and liabilities are recognized for the future tax consequences attributable to differences between the financial statement carrying amounts of existing assets and liabilities and their respective tax bases. Deferred tax assets and liabilities are measured using enacted tax rates expected to apply to taxable income in the years in which those temporary differences are expected to be recovered or settled. The effect on deferred tax assets and liabilities of changes in tax rates is recognized in income in the period the change occurs. Uncertain tax positions arise when it is more likely than not that the tax position taken will be sustained upon examination by the appropriate tax authority. Any income tax benefit as well as penalties and interest related to income tax expense are recorded as a component of income tax expense. Unrecognized tax benefits were not material as of December 31, 2020 or 2019.
Fair Value of Financial Instruments. Fair values of financial instruments are estimated using relevant market information and other assumptions. Fair value estimates involve uncertainties and matters of significant judgment. In cases where quoted market prices are not available, fair values are based on estimates using present value or other estimation techniques. Those techniques are significantly affected by the assumptions used, including the discount rate and estimates of future cash flows.
Defined Benefit Pension Plan. Defined benefit pension obligations and the annual pension costs are determined by independent actuaries and through the use of a number of assumptions that are reviewed by management. These assumptions include a compensation rate increase, a discount rate used to determine the current benefit obligation and a long-term expected rate of return on plan assets. Net periodic defined benefit pension expense includes service cost, interest cost based on the assumed discount rate, an expected return on plan assets, amortization of prior service cost and amortization of net actuarial gains or losses. Prior service costs include the impact of plan amendments on the liabilities and are amortized over the future service periods of active employees expected to receive benefits under the plan. Actuarial gains and losses result from experience different from that assumed and from changes in assumptions. Amortization of actuarial gains and losses is included as a component of net periodic defined benefit pension cost. The service cost component is recorded on our consolidated income statement as salaries and employee benefits in noninterest expense while all other components other than service cost are recorded in other noninterest expense.
The plan obligations, related assets and net periodic benefit costs of our defined benefit pension plan are presented in “Note 10 – Employee Benefits.”
Share-Based Awards. Share-based compensation transactions are recognized as compensation cost in the consolidated statements of income based on the fair value on the date of the grant and is recorded over the grant’s vesting period.
Loss Contingencies. Loss contingencies, including claims and legal actions arising in the ordinary course of business are recorded as liabilities when the likelihood of loss is probable and an amount or range of loss can be reasonably estimated.
Wealth Management and Trust Assets. Our wealth management and trust assets, other than cash on deposit at Southside Bank, are not included in the accompanying financial statements, because they are not our assets.
Accounting Pronouncements.
In March 2020, the FASB issued ASU 2020-04, “Reference Rate Reform (Topic 848): Facilitation of the Effects of Reference Rate Reform on Financial Reporting.” ASU 2020-04 is intended to provide relief for companies preparing for discontinuation of interest rates based on LIBOR. The ASU provides optional expedients and exceptions for applying GAAP to contract modifications and hedging relationships, subject to meeting certain criteria, that reference LIBOR or other reference rates expected to be discontinued. ASU 2020-04 also provides for a one-time sale and/or transfer to AFS or trading to be made for HTM debt securities that both reference an eligible reference rate and were classified as HTM before January 1, 2020. ASU 2020-04 was effective for all entities as of March 12, 2020 and through December 31, 2022. Companies can apply the ASU as of the beginning of the interim period that includes March 12, 2020 or any date thereafter. The guidance requires companies to apply the guidance prospectively to contract modifications and hedging relationships while the one-time election to sell and/or transfer debt securities classified as HTM may be made any time after March 12, 2020. We have not adopted ASU 2020-04. The ASU is not expected to have a material impact on our consolidated financial statements.
2. EARNINGS PER SHARE
Earnings per share on a basic and diluted basis are calculated as follows (in thousands, except per share amounts):
| | | | | | | | | | | | | | | | | | | | |
| | | Years Ended December 31, |
| | | 2020 | | 2019 | | 2018 |
| Basic and Diluted Earnings: | | | | | | |
| Net income | | $ | 82,153 | | | $ | 74,554 | | | $ | 74,138 | |
| Basic weighted-average shares outstanding | | 33,201 | | | 33,747 | | | 34,951 | |
| Add: Stock awards | | 80 | | | 148 | | | 165 | |
| Diluted weighted-average shares outstanding | | 33,281 | | | 33,895 | | | 35,116 | |
| Basic earnings per share: | | | | | | |
| Net income | | $ | 2.47 | | | $ | 2.21 | | | $ | 2.12 | |
| Diluted earnings per share: | | | | | | |
| Net income | | $ | 2.47 | | | $ | 2.20 | | | $ | 2.11 | |
For the year ended December 31, 2020, there were approximately 808,000 anti-dilutive shares. For the years ended December 31, 2019 and 2018 there were approximately 521,000 and 356,000 anti-dilutive shares, respectively.
3. ACCUMULATED OTHER COMPREHENSIVE INCOME (LOSS)
The changes in accumulated other comprehensive income (loss) by component are as follows for the years presented (in thousands):
| | | | | | | | | | | | | | | | | | | | | | | | | | | | | | |
| Year Ended December 31, 2020 |
| | | | | | Pension Plans | | |
| Unrealized Gains (Losses) on Securities | | | Unrealized Gains (Losses) on Derivatives | | Net Prior
Service
(Cost)
Credit | | Net Gain (Loss) | | Total |
| Beginning balance, net of tax | $ | 38,038 | | | | $ | (1,672) | | | $ | (145) | | | $ | (31,985) | | | $ | 4,236 | |
| Other comprehensive income (loss): | | | | | | | | | | |
| Other comprehensive income (loss) before reclassifications | 105,845 | | | | (23,462) | | | 378 | | | (593) | | | 82,168 | |
| Reclassification adjustments included in net income | (7,060) | | | | 3,945 | | | (7) | | | 3,035 | | | (87) | |
| Income tax (expense) benefit | (20,745) | | | | 4,098 | | | (77) | | | (513) | | | (17,237) | |
| Net current-period other comprehensive income (loss), net of tax | 78,040 | | | | (15,419) | | | 294 | | | 1,929 | | | 64,844 | |
| | | | | | | | | | |
| Ending balance, net of tax | $ | 116,078 | | | | $ | (17,091) | | | $ | 149 | | | $ | (30,056) | | | $ | 69,080 | |
| | | | | | | | | | | | | | | | | | | | | | | | | | | | | | |
| Year Ended December 31, 2019 |
| | | | | | Pension Plans | | |
| Unrealized Gains (Losses) on Securities | | | Unrealized Gains (Losses) on Derivatives | | Net Prior
Service
(Cost)
Credit | | Net Gain (Loss) | | Total |
| Beginning balance, net of tax | $ | (31,120) | | | | $ | 7,146 | | | $ | (139) | | | $ | (26,115) | | | $ | (50,228) | |
| | | | | | | | | | |
| | | | | | | | | | |
| Other comprehensive income (loss): | | | | | | | | | | |
| Other comprehensive income (loss) before reclassifications | 87,481 | | | | (9,118) | | | — | | | (9,816) | | | 68,547 | |
| Reclassification adjustments included in net income | 60 | | | | (2,043) | | | (8) | | | 2,386 | | | 395 | |
| Income tax (expense) benefit | (18,383) | | | | 2,343 | | | 2 | | | 1,560 | | | (14,478) | |
| Net current-period other comprehensive income (loss), net of tax | 69,158 | | | | (8,818) | | | (6) | | | (5,870) | | | 54,464 | |
| | | | | | | | | | |
| Ending balance, net of tax | $ | 38,038 | | | | $ | (1,672) | | | $ | (145) | | | $ | (31,985) | | | $ | 4,236 | |
| | | | | | | | | | | | | | | | | | | | | | | | | | | | | | |
| Year Ended December 31, 2018 |
| | | | | | Pension Plans | | |
| Unrealized Gains (Losses) on Securities | | | Unrealized Gains (Losses) on Derivatives | | Net Prior
Service
(Cost)
Credit | | Net Gain (Loss) | | Total |
| Beginning balance, net of tax | $ | (16,295) | | | | $ | 6,399 | | | $ | (133) | | | $ | (26,269) | | | $ | (36,298) | |
Cumulative effect of ASU 2016-01 (1) | 85 | | | | — | | | — | | | — | | | 85 | |
| Adjusted beginning balance, net of tax | (16,210) | | | | 6,399 | | | (133) | | | (26,269) | | | (36,213) | |
| Other comprehensive income (loss): | | | | | | | | | | |
| Other comprehensive (loss) income before reclassifications | (21,956) | | | | 2,351 | | | — | | | (1,994) | | | (21,599) | |
| Reclassification adjustments included in net income | 3,083 | | | | (1,406) | | | (7) | | | 2,189 | | | 3,859 | |
| Income tax benefit (expense) | 3,963 | | | | (198) | | | 1 | | | (41) | | | 3,725 | |
| Net current-period other comprehensive (loss) income, net of tax | (14,910) | | | | 747 | | | (6) | | | 154 | | | (14,015) | |
| | | | | | | | | | |
| Ending balance, net of tax | $ | (31,120) | | | | $ | 7,146 | | | $ | (139) | | | $ | (26,115) | | | $ | (50,228) | |
(1) The Company adopted ASU 2016-01 on January 1, 2018. This amount includes a reclassification for the cumulative adjustment to retained earnings of $107,000 ($85,000, net of tax).
The reclassification adjustments out of accumulated other comprehensive income (loss) included in net income are presented below (in thousands):
| | | | | | | | | | | | | | | | | | | | |
| | Years Ended December 31, |
| | 2020 | | 2019 | | 2018 |
| Unrealized gains and losses on securities transferred: | | | | | | |
Amortization of unrealized gains and losses (1) | | $ | (1,197) | | | $ | (816) | | | $ | (1,244) | |
| Tax benefit | | 251 | | | 171 | | | 261 | |
| Net of tax | | $ | (946) | | | $ | (645) | | | $ | (983) | |
| | | | | | |
| Unrealized gains and losses on AFS securities: | | | | | | |
Realized net gain (loss) on sale of securities (2) | | $ | 8,257 | | | $ | 756 | | | $ | (1,839) | |
| | | | | | |
| | | | | | |
| Tax (expense) benefit | | (1,734) | | | (159) | | | 386 | |
| Net of tax | | $ | 6,523 | | | $ | 597 | | | $ | (1,453) | |
| | | | | | |
| Derivatives: | | | | | | |
Realized net (loss) gain on interest rate swap derivatives (3) | | $ | (3,970) | | | $ | 1,956 | | | $ | 1,319 | |
| Tax benefit (expense) | | 834 | | | (411) | | | (277) | |
| Net of tax | | $ | (3,136) | | | $ | 1,545 | | | $ | 1,042 | |
| | | | | | |
Amortization of unrealized gains on terminated interest rate swap derivatives (3) | | $ | 25 | | | $ | 87 | | | $ | 87 | |
| Tax expense | | (5) | | | (18) | | | (18) | |
| Net of tax | | $ | 20 | | | $ | 69 | | | $ | 69 | |
| | | | | | |
| Amortization of pension plan: | | | | | | |
Net actuarial loss (4) | | $ | (3,035) | | | $ | (2,386) | | | $ | (2,189) | |
Prior service credit (4) | | 7 | | | 8 | | | 7 | |
| Total before tax | | (3,028) | | | (2,378) | | | (2,182) | |
| Tax benefit | | 636 | | | 499 | | | 459 | |
| Net of tax | | $ | (2,392) | | | $ | (1,879) | | | $ | (1,723) | |
| Total reclassifications for the period, net of tax | | $ | 69 | | | $ | (313) | | | $ | (3,048) | |
(1) Included in interest income on the consolidated statements of income.
(2) Listed as net gain (loss) on sale of securities AFS on the consolidated statements of income.
(3) Included in interest expense for FHLB borrowings on the consolidated statements of income.
(4) These AOCI components are included in the computation of net periodic pension cost (income) presented in “Note 10 – Employee Benefits.”
4. SECURITIES
Debt securities
The amortized cost, gross unrealized gains and losses and estimated fair value of investment and mortgage-backed AFS and HTM securities as of December 31, 2020 and 2019 are reflected in the tables below (in thousands):
| | | | | | | | | | | | | | | | | | | | | | | | | | |
| | | December 31, 2020 |
| | Amortized | | Gross
Unrealized | | Gross Unrealized | | Estimated |
| | Cost | | Gains | | Losses | | Fair Value |
| AVAILABLE FOR SALE | | | | | | | | |
| Investment securities: | | | | | | | | |
| | | | | | | | |
| | | | | | | | |
| State and political subdivisions | | $ | 1,475,030 | | | $ | 105,601 | | | $ | 37 | | | $ | 1,580,594 | |
| Other stocks and bonds | | 77,224 | | | 1,053 | | | 22 | | | 78,255 | |
| | | | | | | | |
MBS: (1) | | | | | | | | |
| Residential | | 771,409 | | | 38,674 | | | 73 | | | 810,010 | |
| Commercial | | 113,850 | | | 4,746 | | | 150 | | | 118,446 | |
| Total | | $ | 2,437,513 | | | $ | 150,074 | | | $ | 282 | | | $ | 2,587,305 | |
| | | | | | | | |
| HELD TO MATURITY | | | | | | | | |
| Investment securities: | | | | | | | | |
| State and political subdivisions | | $ | 907 | | | $ | 13 | | | $ | — | | | $ | 920 | |
MBS: (1) | | | | | | | | |
| Residential | | 47,948 | | | 4,187 | | | — | | | 52,135 | |
| Commercial | | 60,143 | | | 5,000 | | | — | | | 65,143 | |
| Total | | $ | 108,998 | | | $ | 9,200 | | | $ | — | | | $ | 118,198 | |
| | | | | | | | |
| | | | | | | | | | | | | | | | | | | | | | | | | | |
| | | December 31, 2019 |
| | Amortized | | Gross
Unrealized | | Gross Unrealized | | Estimated |
| | Cost | | Gains | | Losses | | Fair Value |
| AVAILABLE FOR SALE | | | | | | | | |
| Investment securities: | | | | | | | | |
| | | | | | | | |
| | | | | | | | |
| State and political subdivisions | | $ | 780,376 | | | $ | 23,832 | | | $ | 1,406 | | | $ | 802,802 | |
| Other stocks and bonds | | 10,000 | | | 137 | | | — | | | 10,137 | |
| | | | | | | | |
MBS: (1) | | | | | | | | |
Residential | | 1,286,110 | | | 25,662 | | | 1,130 | | | 1,310,642 | |
Commercial | | 230,255 | | | 4,795 | | | 34 | | | 235,016 | |
| Total | | $ | 2,306,741 | | | $ | 54,426 | | | $ | 2,570 | | | $ | 2,358,597 | |
| | | | | | | | |
| | | | | | | | |
| HELD TO MATURITY | | | | | | | | |
| Investment securities: | | | | | | | | |
| State and political subdivisions | | $ | 2,888 | | | $ | 30 | | | $ | — | | | $ | 2,918 | |
MBS: (1) | | | | | | | | |
| Residential | | 59,701 | | | 2,586 | | | 139 | | | 62,148 | |
| Commercial | | 72,274 | | | 1,622 | | | 83 | | | $ | 73,813 | |
| Total | | $ | 134,863 | | | $ | 4,238 | | | $ | 222 | | | $ | 138,879 | |
(1) All MBS issued and/or guaranteed by U.S. government agencies or U.S. GSEs.
Investment securities and MBS with carrying values of $1.56 billion and $1.12 billion were pledged as of December 31, 2020 and December 31, 2019, respectively, to collateralize FHLB borrowings, borrowings from the FRDW, repurchase agreements and public fund deposits, for potential liquidity needs or other purposes as required by law.
The following tables represent the fair value and unrealized losses on AFS investment and MBS for which an allowance for credit losses has not been recorded as of December 31, 2020 and AFS and HTM investment and MBS as of December 31, 2019, segregated by major security type and length of time in a continuous loss position (in thousands):
| | | | | | | | | | | | | | | | | | | | | | | | | | | | | | | | | | | |
| December 31, 2020 |
| | Less Than 12 Months | | More Than 12 Months | | Total |
| Fair Value | | Unrealized
Loss | | Fair Value | | Unrealized
Loss | | Fair Value | | Unrealized
Loss |
| AVAILABLE FOR SALE | | | | | | | | | | | |
| Investment securities: | | | | | | | | | | | |
| | | | | | | | | | | |
| | | | | | | | | | | |
| State and political subdivisions | $ | 17,305 | | | $ | 37 | | | $ | — | | | $ | — | | | $ | 17,305 | | | $ | 37 | |
| Other stocks and bonds | 11,562 | | | 22 | | | — | | | — | | | 11,562 | | | 22 | |
| | | | | | | | | | | |
| MBS: | | | | | | | | | | | |
| Residential | 6,287 | | | 73 | | | — | | | — | | | 6,287 | | | 73 | |
| Commercial | 4,744 | | | 150 | | | — | | | — | | | 4,744 | | | 150 | |
| Total | $ | 39,898 | | | $ | 282 | | | $ | — | | | $ | — | | | $ | 39,898 | | | $ | 282 | |
| | | | | | | | | | | |
| | | | | | | | | | | |
| | | | | | | | | | | |
| | | | | | | | | | | |
| | | | | | | | | | | |
| | | | | | | | | | | |
| | | | | | | | | | | |
| | | | | | | | | | | |
| | | | | | | | | | | |
| December 31, 2019 |
| Less Than 12 Months | | More Than 12 Months | | Total |
| Fair Value | | Unrealized Loss | | Fair Value | | Unrealized Loss | | Fair Value | | Unrealized Loss |
| AVAILABLE FOR SALE | | | | | | | | | | | |
| Investment securities: | | | | | | | | | | | |
| | | | | | | | | | | |
| | | | | | | | | | | |
| State and political subdivisions | $ | 158,629 | | | $ | 1,270 | | | $ | 7,555 | | | $ | 136 | | | $ | 166,184 | | | $ | 1,406 | |
| | | | | | | | | | | |
| | | | | | | | | | | |
| MBS: | | | | | | | | | | | |
| Residential | 101,779 | | | 980 | | | 21,696 | | | 150 | | | 123,475 | | | 1,130 | |
| Commercial | 13,555 | | | 32 | | | 1,446 | | | 2 | | | 15,001 | | | 34 | |
| Total | $ | 273,963 | | | $ | 2,282 | | | $ | 30,697 | | | $ | 288 | | | $ | 304,660 | | | $ | 2,570 | |
| | | | | | | | | | | |
| HELD TO MATURITY | | | | | | | | | | | |
| | | | | | | | | | | |
| | | | | | | | | | | |
| MBS: | | | | | | | | | | | |
| Residential | $ | 272 | | | $ | 9 | | | $ | 2,304 | | | $ | 130 | | | $ | 2,576 | | | $ | 139 | |
| Commercial | 12,781 | | | 67 | | | 1,788 | | | 16 | | | 14,569 | | | 83 | |
| Total | $ | 13,053 | | | $ | 76 | | | $ | 4,092 | | | $ | 146 | | | $ | 17,145 | | | $ | 222 | |
With the adoption of ASU 2016-13, for those AFS debt securities in an unrealized loss position where management (i) has the intent to sell or (ii) where it will more-likely-than-not be required to sell the security before the recovery of its amortized cost basis, we write the security down to fair value with an adjustment to earnings. For those AFS debt securities in an unrealized loss position that do not meet either of these criteria, management assesses whether the decline in fair value has resulted from credit-related factors, using both qualitative and quantitative criteria. Determining the allowance under the credit loss method requires the use of a discounted cash flow method to assess the credit losses. Any credit-related impairment will be recognized in allowance for credit losses on the balance sheet with a corresponding adjustment to earnings. Noncredit-related impairment, the portion of the impairment relating to factors other than credit (such as changes in market interest rates), is recognized in other comprehensive income, net of tax.
Based on our consideration of the qualitative factors associated with each security type in our AFS portfolio, we did not recognize any unrealized losses in income on our AFS securities during the year ended December 31, 2020. Our state and political subdivisions are highly rated municipal securities with a long history of no credit losses. Our AFS MBS are highly rated securities which are either explicitly or implicitly backed by the U.S. Government through its agencies which are highly rated by major ratings agencies and also have a long history of no credit losses. Our other stocks and bonds as of December 31, 2020 consist of highly rated investment grade bonds. Management does not intend to sell and it is likely we will not be required to sell those securities in an unrealized loss position prior to the anticipated recovery of the amortized cost basis. These unrealized losses on our investment and MBS are largely due to changes in interest rates and spreads and other market conditions impacted by COVID-19. As of December 31, 2020, we did not have an allowance for credit losses on our AFS securities. There were no impairment charges on our AFS securities during the year ended December 31, 2019.
We assess the likelihood of default and the potential amount of default when assessing our HTM securities for credit losses. We utilize term structures and, due to no prior loss exposure on our state and political subdivision securities, we currently apply a third-party average loss given default rate to model our securities. Due to a small number of HTM municipal securities in our portfolio as of December 31, 2020, we elected to use the specific identification method to model these securities which aligns with our third-party fair value measurement process. The model determined any expected credit loss over the life of these securities to be remote. Management further evaluated the remote expectation of loss along with the qualitative factors associated with these securities and concluded that, due to the securities being highly rated municipals with a long history of no credit losses, no credit loss should be recognized for these securities for the year ended December 31, 2020.
From time to time, we have transferred securities from AFS to HTM due to overall balance sheet strategies. The remaining net unamortized, unrealized loss on the transferred securities included in AOCI in the accompanying balance sheets totaled $2.9 million ($2.3 million, net of tax) at December 31, 2020 and $3.7 million ($2.9 million, net of tax) at December 31, 2019. Any net unrealized gain or loss on the transferred securities included in AOCI at the time of transfer will be amortized over the remaining life of the underlying security as an adjustment to the yield on those securities. Securities transferred with losses included in AOCI continue to be included in management’s assessment for impairment for each individual security. There were no securities transferred from AFS to HTM during the years ended December 31, 2020 or 2019.
The accrued interest receivable on our debt securities is excluded from the credit loss estimate and is included in interest receivable on our consolidated balance sheets. As of December 31, 2020, accrued interest receivable on AFS and HTM debt securities totaled $22.0 million and $298,000, respectively. No HTM debt securities were past-due or on nonaccrual status as of December 31, 2020.
The following table reflects interest income recognized on securities for the periods presented (in thousands):
| | | | | | | | | | | | | | | | | |
| | Years Ended December 31, |
| | 2020 | | 2019 | | 2018 |
| U.S. Treasury | $ | — | | | $ | — | | | $ | 218 | |
| U.S. government agency debentures | — | | | — | | | 89 | |
| State and political subdivisions | 36,393 | | | 16,885 | | | 24,960 | |
| Other stocks and bonds | 1,195 | | | 138 | | | 110 | |
| | | | | |
| MBS | 34,319 | | | 50,486 | | | 41,584 | |
| Total interest income on securities | $ | 71,907 | | | $ | 67,509 | | | $ | 66,961 | |
There was a $8.3 million net realized gain from the AFS securities portfolio for the year ended December 31, 2020, which consisted of $8.4 million in realized gains and $129,000 in realized losses. There was a $756,000 net realized gain from the AFS securities portfolio for the year ended December 31, 2019, which consisted of $5.7 million in realized gains and $4.9 million in realized losses. There was a $1.8 million net realized loss from the AFS securities portfolio for the year ended December 31, 2018, which consisted of $3.8 million in realized losses and $2.0 million in realized gains. There were no sales from the HTM portfolio during the years ended December 31, 2020, 2019 or 2018. We calculate realized gains and losses on sales of securities under the specific identification method.
Expected maturities on our securities may differ from contractual maturities because issuers may have the right to call or prepay obligations. MBS are presented in total by category since MBS are typically issued with stated principal amounts and are backed by pools of mortgages that have loans with varying maturities. The characteristics of the underlying pool of mortgages, such as fixed rate or adjustable rate, as well as prepayment risk, are passed on to the security holder. The term of a mortgage-backed pass-through security thus approximates the term of the underlying mortgages and can vary significantly due to prepayments.
The amortized cost and estimated fair value of AFS and HTM securities at December 31, 2020, are presented below by contractual maturity (in thousands).
| | | | | | | | | | | |
| | December 31, 2020 |
| | Amortized Cost | | Fair Value |
| AVAILABLE FOR SALE | |
| Investment securities: | | | |
| Due in one year or less | $ | 2,185 | | | $ | 2,223 | |
| Due after one year through five years | 32,972 | | | 33,953 | |
| Due after five years through ten years | 90,751 | | | 93,430 | |
| Due after ten years | 1,426,346 | | | 1,529,243 | |
| | 1,552,254 | | | 1,658,849 | |
| MBS: | 885,259 | | | 928,456 | |
| Total | $ | 2,437,513 | | | $ | 2,587,305 | |
| | | | | | | | | | | |
| | December 31, 2020 |
| | Amortized Cost | | Fair Value |
| HELD TO MATURITY | |
| Investment securities: | | | |
| Due in one year or less | $ | 120 | | | $ | 121 | |
| Due after one year through five years | 509 | | | 516 | |
| Due after five years through ten years | 278 | | | 283 | |
| Due after ten years | — | | | — | |
| | 907 | | | 920 | |
| MBS: | 108,091 | | | 117,278 | |
| Total | $ | 108,998 | | | $ | 118,198 | |
Equity Investments
Equity investments on our consolidated balance sheets include CRA funds with a readily determinable fair value as well as equity investments without readily determinable fair values. At December 31, 2020 and 2019, we had equity investments recorded in our consolidated balance sheets of $11.9 million and $12.3 million, respectively.
Any realized and unrealized gains and losses on equity investments are reported in income. Equity investments without readily determinable fair values are recorded at cost less impairment, if any.
The following is a summary of unrealized and realized gains and losses on equity investments recognized in other noninterest income in the consolidated statements of income during the periods presented (in thousands):
| | | | | | | | | | | | | | |
| | | Years Ended December 31, |
| | | 2020 | | 2019 |
| Net (loss) gain recognized during the period on equity investments | | $ | (427) | | | $ | 66 | |
| Less: Net (loss) gain recognized during the period on equity investments sold during the period | | — | | | — | |
| Unrealized (loss) gain recognized during the reporting period on equity investments still held at the reporting date | | $ | (427) | | | $ | 66 | |
Equity investments are assessed quarterly for other-than-temporary impairment. Based upon that evaluation, management does not consider any of our equity investments to be other-than-temporarily impaired at December 31, 2020.
FHLB Stock
Our FHLB stock, which has limited marketability, is carried at cost and is assessed quarterly for other-than-temporary impairment. Based upon evaluation by management at December 31, 2020, our FHLB stock was not impaired and thus was not considered to be other-than-temporarily impaired.
5. LOANS AND ALLOWANCE FOR LOAN LOSSES
Loans in the accompanying consolidated balance sheets are classified as follows (in thousands):
| | | | | | | | | | | | | | |
| | December 31, 2020 | | December 31, 2019 |
| Real estate loans: | | | | |
| Construction | | $ | 581,941 | | | $ | 644,948 | |
| 1-4 family residential | | 719,952 | | | 787,562 | |
| Commercial | | 1,295,746 | | | 1,250,208 | |
| Commercial loans | | 557,122 | | | 401,521 | |
| Municipal loans | | 409,028 | | | 383,960 | |
| Loans to individuals | | 93,990 | | | 100,005 | |
| Total loans | | 3,657,779 | | | 3,568,204 | |
| Less: Allowance for loan losses | | 49,006 | | | 24,797 | |
| Net loans | | $ | 3,608,773 | | | $ | 3,543,407 | |
Loans to Affiliated Parties
In the normal course of business, we make loans to certain of our executive officers and directors and their related interests. As of December 31, 2020 and 2019, these loans totaled $32.2 million and $33.8 million, respectively. These loans represented 3.7% and 4.2% of shareholders’ equity as of December 31, 2020 and 2019, respectively.
Paycheck Protection Program Loans
In April 2020, we began originating loans to qualified small businesses under the PPP administered by the SBA under the provisions of the CARES Act. Loans covered by the PPP may be eligible for loan forgiveness for certain costs incurred related to payroll, group health care benefit costs and qualifying mortgage, rent and utility payments. The remaining loan balance after forgiveness of any amounts is still fully guaranteed by the SBA. Terms of the PPP loans include the following (i) maximum amount limited to the lesser of $10.0 million or an amount calculated using a payroll-based formula, (ii) maximum loan term of five years, (iii) interest rate of 1.00%, (iv) no collateral or personal guarantees are required, (v) no payments are required until the date on which the forgiveness amount relating to the loan is remitted to the lender and (vi) loan forgiveness up to the full principal amount of the loan and any accrued interest, subject to certain requirements including that no more than 40% of the loan forgiveness amount may be attributable to non-payroll costs. In return for processing and booking a PPP loan, the SBA paid lenders a processing fee tiered by the size of the loan. These loans are included in commercial loans with an amortized cost basis at December 31, 2020 of $214.8 million.
Construction Real Estate Loans
Our construction loans are collateralized by property located primarily in or near the market areas we serve. A number of our construction loans will be owner occupied upon completion. Construction loans for non-owner occupied projects are financed, but these typically have cash flows from leases with tenants, secondary sources of repayment, and in some cases, additional collateral. Our construction loans have both adjustable and fixed interest rates during the construction period. Construction loans to individuals are typically priced and made with the intention of granting the permanent loan on the completed property. Speculative and commercial construction loans are subject to underwriting standards similar to that of the commercial portfolio. Owner occupied 1-4 family residential construction loans are subject to the underwriting standards of the permanent loan.
1-4 Family Residential Real Estate Loans
Residential loan originations are generated by our loan officers, in-house origination staff, marketing efforts, present customers, walk-in customers and referrals from real estate agents and builders. We focus our lending efforts primarily on the origination of loans secured by first mortgages on owner occupied 1-4 family residences. Substantially all of our 1-4 family residential originations are secured by properties located in or near our market areas.
Our 1-4 family residential loans generally have maturities ranging from five to 30 years. These loans are typically fully amortizing with monthly payments sufficient to repay the total amount of the loan. Our 1-4 family residential loans are made at both fixed and adjustable interest rates.
Underwriting for 1-4 family residential loans includes debt-to-income analysis, credit history analysis, appraised value and down payment considerations. Changes in the market value of real estate can affect the potential losses in the portfolio.
Commercial Real Estate Loans
Commercial real estate loans as of December 31, 2020 consisted of $1.18 billion of owner and non-owner occupied real estate, $97.9 million of loans secured by multi-family properties and $15.0 million of loans secured by farmland. Commercial real estate loans primarily include loans collateralized by retail, commercial office buildings, multi-family residential buildings, medical facilities and offices, senior living, assisted living and skilled nursing facilities, warehouse facilities, hotels and churches. In determining whether to originate commercial real estate loans, we generally consider such factors as the financial condition of the borrower and the debt service coverage of the property. Commercial real estate loans are made at both fixed and adjustable interest rates for terms generally up to 20 years.
Commercial Loans
Our commercial loans are diversified loan types including short-term working capital loans for inventory and accounts receivable and short- and medium-term loans for equipment or other business capital expansion. In our commercial loan underwriting, we assess the creditworthiness, ability to repay and the value and liquidity of the collateral being offered. Terms of commercial loans are generally commensurate with the useful life of the collateral offered.
Municipal Loans
We make loans to municipalities and school districts primarily throughout the state of Texas, with a small percentage originating outside of the state. The majority of the loans to municipalities and school districts have tax or revenue pledges and in some cases are additionally supported by collateral. Municipal loans made without a direct pledge of taxes or revenues are usually made based on some type of collateral that represents an essential service. Lending money directly to these municipalities allows us to earn a higher yield than we could if we purchased municipal securities for similar durations.
Loans to Individuals
Substantially all originations of our loans to individuals are made to consumers in our market areas. The majority of loans to individuals are collateralized by titled equipment, which are primarily automobiles. Loan terms vary according to the type and value of collateral, length of contract and creditworthiness of the borrower. The underwriting standards we employ for consumer loans include an application, a determination of the applicant’s payment history on other debts, with the greatest weight being given to payment history with us and an assessment of the borrower’s ability to meet existing obligations and payments on the proposed loan. Although creditworthiness of the applicant is a primary consideration, the underwriting process also includes a comparison of the value of the collateral, if any, in relation to the proposed loan amount. Most of our loans to individuals are collateralized, which management believes assists in limiting our exposure.
Credit Quality Indicators
We categorize loans into risk categories on an ongoing basis based on relevant information about the ability of borrowers to service their debt such as: current financial information, historical payment experience, credit documentation, public information and current economic trends, among other factors. We use the following definitions for risk ratings:
•Pass (Rating 1 – 4) – This rating is assigned to all satisfactory loans. This category, by definition, consists of acceptable credit. Credit and collateral exceptions should not be present, although their presence would not necessarily prohibit a loan from being rated Pass, if deficiencies are in the process of correction. These loans are not included in the Watch List.
•Pass Watch (Rating 5) – These loans require some degree of special treatment, but not due to credit quality. This category does not include loans specially mentioned or adversely classified; however, particular attention is warranted to characteristics such as:
▪A lack of, or abnormally extended payment program;
▪A heavy degree of concentration of collateral without sufficient margin;
▪A vulnerability to competition through lesser or extensive financial leverage; and
▪A dependence on a single or few customers or sources of supply and materials without suitable substitutes or alternatives.
•Special Mention (Rating 6) – A Special Mention loan has potential weaknesses that deserve management’s close attention. If left uncorrected, these potential weaknesses may result in deterioration of the repayment prospects for the loan or in our credit position at some future date. Special Mention loans are not adversely classified and do not expose us to sufficient risk to warrant adverse classification.
•Substandard (Rating 7) – Substandard loans are inadequately protected by the current sound worth and paying capacity of the obligor or of the collateral pledged, if any. Loans so classified must have a well-defined weakness or
weaknesses that jeopardize the liquidation of the debt. They are characterized by the distinct possibility that the Bank will sustain some loss if the deficiencies are not corrected.
•Doubtful (Rating 8) – Loans classified as Doubtful have all the weaknesses inherent in those classified Substandard with the added characteristic that the weaknesses make collection or liquidation, in full, on the basis of currently known facts, conditions and values, highly questionable and improbable.
The following table sets forth the amortized cost basis by class of financing receivable and credit quality indicator for the periods presented (in thousands):
| | | | | | | | | | | | | | | | | | | | | | | | | | | | | | | | | | | | | | | | | | | | | | | |
| Term Loans Amortized Cost Basis by Origination Year | | Revolving Loans Amortized Cost Basis | | Total |
| 2020 | | 2019 | | 2018 | | 2017 | | 2016 | | Prior | | | | |
| Construction real estate: | | | | | | | | | | | | | | | |
| Pass | $ | 155,693 | | | $ | 180,536 | | | $ | 76,090 | | | $ | 55,636 | | | $ | 3,191 | | | $ | 8,297 | | | $ | 101,793 | | | $ | 581,236 | |
| Pass watch | — | | | — | | | — | | | — | | | 23 | | | — | | | — | | | 23 | |
| Special mention | — | | | — | | | — | | | — | | | — | | | — | | | — | | | — | |
| Substandard | — | | | 382 | | | 62 | | | — | | | — | | | 58 | | | — | | | 502 | |
| Doubtful | — | | | — | | | — | | | — | | | — | | | 180 | | | — | | | 180 | |
| Total construction real estate | $ | 155,693 | | | $ | 180,918 | | | $ | 76,152 | | | $ | 55,636 | | | $ | 3,214 | | | $ | 8,535 | | | $ | 101,793 | | | $ | 581,941 | |
| | | | | | | | | | | | | | | |
| 1-4 family residential real estate: | | | | | | | | | | | | | | | |
| Pass | $ | 154,003 | | | $ | 114,063 | | | $ | 70,621 | | | $ | 55,557 | | | $ | 57,680 | | | $ | 255,003 | | | $ | 2,833 | | | $ | 709,760 | |
| Pass watch | — | | | — | | | — | | | — | | | 267 | | | 564 | | | — | | | 831 | |
| Special mention | — | | | — | | | — | | | — | | | — | | | 10 | | | — | | | 10 | |
| Substandard | 1,473 | | | — | | | 135 | | | 427 | | | 1,588 | | | 5,134 | | | 96 | | | 8,853 | |
| Doubtful | — | | | — | | | — | | | 36 | | | 103 | | | 359 | | | — | | | 498 | |
| Total 1-4 family residential real estate | $ | 155,476 | | | $ | 114,063 | | | $ | 70,756 | | | $ | 56,020 | | | $ | 59,638 | | | $ | 261,070 | | | $ | 2,929 | | | $ | 719,952 | |
| | | | | | | | | | | | | | | |
| Commercial real estate: | | | | | | | | | | | | | | | |
| Pass | $ | 270,087 | | | $ | 307,161 | | | $ | 143,177 | | | $ | 162,180 | | | $ | 98,828 | | | $ | 179,919 | | | $ | 6,957 | | | $ | 1,168,309 | |
| Pass watch | — | | | — | | | 3,153 | | | 40,125 | | | 1,696 | | | 2,582 | | | — | | | 47,556 | |
| Special mention | 4,555 | | | 33,020 | | | 7,041 | | | 140 | | | 4,531 | | | 7,850 | | | — | | | 57,137 | |
| Substandard | 7,542 | | | — | | | 2,097 | | | 65 | | | 704 | | | 12,282 | | | — | | | 22,690 | |
| Doubtful | — | | | — | | | — | | | — | | | — | | | 54 | | | — | | | 54 | |
| Total commercial real estate | $ | 282,184 | | | $ | 340,181 | | | $ | 155,468 | | | $ | 202,510 | | | $ | 105,759 | | | $ | 202,687 | | | $ | 6,957 | | | $ | 1,295,746 | |
| | | | | | | | | | | | | | | |
| Commercial loans: | | | | | | | | | | | | | | | |
| Pass | $ | 313,688 | | | $ | 47,446 | | | $ | 20,386 | | | $ | 7,505 | | | $ | 3,392 | | | $ | 6,142 | | | $ | 140,018 | | | $ | 538,577 | |
| Pass watch | 2,599 | | | 1,318 | | | 2,410 | | | 1,981 | | | — | | | — | | | 370 | | | 8,678 | |
| Special mention | 304 | | | 809 | | | 433 | | | 39 | | | 286 | | | 265 | | | 455 | | | 2,591 | |
| Substandard | 405 | | | 1,081 | | | 473 | | | 7 | | | — | | | — | | | 4,417 | | | 6,383 | |
| Doubtful | 310 | | | 53 | | | 475 | | | 54 | | | 1 | | | — | | | — | | | 893 | |
| Total commercial loans | $ | 317,306 | | | $ | 50,707 | | | $ | 24,177 | | | $ | 9,586 | | | $ | 3,679 | | | $ | 6,407 | | | $ | 145,260 | | | $ | 557,122 | |
| | | | | | | | | | | | | | | |
| Municipal loans: | | | | | | | | | | | | | | | |
| Pass | $ | 72,542 | | | $ | 68,132 | | | $ | 33,735 | | | $ | 61,170 | | | $ | 25,387 | | | $ | 148,062 | | | $ | — | | | $ | 409,028 | |
| Pass watch | — | | | — | | | — | | | — | | | — | | | — | | | — | | | — | |
| Special mention | — | | | — | | | — | | | — | | | — | | | — | | | — | | | — | |
| Substandard | — | | | — | | | — | | | — | | | — | | | — | | | — | | | — | |
| Doubtful | — | | | — | | | — | | | — | | | — | | | — | | | — | | | — | |
| Total municipal loans | $ | 72,542 | | | $ | 68,132 | | | $ | 33,735 | | | $ | 61,170 | | | $ | 25,387 | | | $ | 148,062 | | | $ | — | | | $ | 409,028 | |
| | | | | | | | | | | | | | | |
| Loans to individuals: | | | | | | | | | | | | | | | |
| Pass | $ | 46,722 | | | $ | 25,302 | | | $ | 10,132 | | | $ | 4,716 | | | $ | 1,867 | | | $ | 917 | | | $ | 3,900 | | | $ | 93,556 | |
| Pass watch | — | | | — | | | — | | | — | | | — | | | — | | | — | | | — | |
| Special mention | — | | | — | | | 51 | | | — | | | — | | | — | | | 4 | | | 55 | |
| Substandard | 6 | | | 35 | | | 28 | | | 30 | | | 9 | | | 11 | | | 1 | | | 120 | |
| Doubtful | 73 | | | 20 | | | 6 | | | 55 | | | 81 | | | 24 | | | — | | | 259 | |
| Total loans to individuals | $ | 46,801 | | | $ | 25,357 | | | $ | 10,217 | | | $ | 4,801 | | | $ | 1,957 | | | $ | 952 | | | $ | 3,905 | | | $ | 93,990 | |
| Total loans | $ | 1,030,002 | | | $ | 779,358 | | | $ | 370,505 | | | $ | 389,723 | | | $ | 199,634 | | | $ | 627,713 | | | $ | 260,844 | | | $ | 3,657,779 | |
The following tables present the aging of the amortized cost basis in past due loans by class of loans (in thousands):
| | | | | | | | | | | | | | | | | | | | | | | | | | | | | | | | | | | | | | |
| | | December 31, 2020 |
| | | 30-59 Days
Past Due | | 60-89 Days
Past Due | | Greater than
90 Days
Past Due | | Total Past
Due | | Current | | Total |
| Real estate loans: | | | | | | | | | | | | |
| Construction | | $ | 95 | | | $ | 14 | | | $ | 444 | | | $ | 553 | | | $ | 581,388 | | | $ | 581,941 | |
| 1-4 family residential | | 7,872 | | | 2,469 | | | 2,830 | | | 13,171 | | | 706,781 | | | 719,952 | |
| Commercial | | 467 | | | 315 | | | 86 | | | 868 | | | 1,294,878 | | | 1,295,746 | |
| Commercial loans | | 1,423 | | | 4,516 | | | 323 | | | 6,262 | | | 550,860 | | | 557,122 | |
| Municipal loans | | 64 | | | — | | | — | | | 64 | | | 408,964 | | | 409,028 | |
| Loans to individuals | | 519 | | | 123 | | | 27 | | | 669 | | | 93,321 | | | 93,990 | |
| Total | | $ | 10,440 | | | $ | 7,437 | | | $ | 3,710 | | | $ | 21,587 | | | $ | 3,636,192 | | | $ | 3,657,779 | |
| | | | | | | | | | | | | | | | | | | | | | | | | | | | | | | | | | | | | | |
| | | December 31, 2019 |
| | | 30-59 Days
Past Due | | 60-89 Days
Past Due | | Greater than
90 Days
Past Due | | Total Past
Due | | Current (1) | | Total |
| Real estate loans: | | | | | | | | | | | | |
| Construction | | $ | 1,236 | | | $ | 229 | | | $ | 337 | | | $ | 1,802 | | | $ | 643,146 | | | $ | 644,948 | |
| 1-4 family residential | | 8,788 | | | 1,077 | | | 1,607 | | | 11,472 | | | 776,090 | | | 787,562 | |
| Commercial | | 795 | | | 259 | | | 536 | | | 1,590 | | | 1,248,618 | | | 1,250,208 | |
| Commercial loans | | 1,917 | | | 722 | | | 651 | | | 3,290 | | | 398,231 | | | 401,521 | |
| Municipal loans | | — | | | — | | | — | | | — | | | 383,960 | | | 383,960 | |
| Loans to individuals | | 660 | | | 261 | | | 128 | | | 1,049 | | | 98,956 | | | 100,005 | |
| Total | | $ | 13,396 | | | $ | 2,548 | | | $ | 3,259 | | | $ | 19,203 | | | $ | 3,549,001 | | | $ | 3,568,204 | |
(1) Prior to the adoption of CECL, PCI loans were measured at fair value at acquisition if the timing and amount of cash flows expected to be collected from those sales could be reasonably estimated.
The following table sets forth the amortized cost basis of nonperforming assets for the periods presented (in thousands):
| | | | | | | | | | | |
| | December 31, 2020 | | December 31, 2019 |
| Nonaccrual loans: | | | |
| Real estate loans: | | | |
| Construction | $ | 640 | | | $ | 405 | |
| 1-4 family residential | 3,922 | | | 2,611 | |
| Commercial | 1,269 | | | 704 | |
| Commercial loans | 1,592 | | | 944 | |
| | | |
| Loans to individuals | 291 | | | 299 | |
Total nonaccrual loans (1) | 7,714 | | | 4,963 | |
| | | |
| Accruing loans past due more than 90 days | — | | | — | |
TDR loans(2) | 9,646 | | | 12,014 | |
| OREO | 106 | | | 472 | |
| Repossessed assets | 14 | | | — | |
| Total nonperforming assets | $ | 17,480 | | | $ | 17,449 | |
(1) Prior to the adoption of CECL, excluded PCI loans measured at fair value at acquisition if the timing and amount of cash flows expected to be collected from those sales could be reasonably estimated. Includes $976,000 and $469,000 of restructured loans as of December 31, 2020 and December 31, 2019, respectively.
(2) As of December 31, 2019, prior to the adoption of CECL, included $755,000 in PCI loans restructured.
We reversed $193,000 of interest income on nonaccrual loans during the year ended December 31, 2020. We had $2.2 million of loans on nonaccrual for which there was no related allowance for credit losses as of December 31, 2020.
Collateral-dependent loans are loans that we expect the repayment to be provided substantially through the operation or sale of the collateral of the loan and we have determined that the borrower is experiencing financial difficulty. In such cases, expected credit losses are based on the fair value of the collateral at the measurement date, adjusted for selling costs. As of December 31, 2020, we had $11.5 million of collateral-dependent loans, secured mainly by real estate and equipment. There have been no significant changes to the collateral that secures the collateral-dependent assets. Foreclosed assets include OREO and repossessed assets. For 1-4 family residential real estate properties, a loan is recognized as a foreclosed property once legal title to the real estate property has been received upon completion of foreclosure or the borrower has conveyed all interest in the residential property through a deed in lieu of foreclosure. There were $1.2 million and $992,000 in loans secured by 1-4 family residential properties for which formal foreclosure proceedings were in process as of December 31, 2020 and December 31, 2019, respectively.
Troubled Debt Restructurings
The restructuring of a loan is considered a TDR if both (i) the borrower is experiencing financial difficulties and (ii) the creditor has granted a concession. Concessions may include interest rate reductions or below market interest rates, restructuring amortization schedules and other actions intended to minimize potential losses. We may provide a combination of concessions which may include an extension of the amortization period, interest rate reduction and/or converting the loan to interest-only for a limited period of time.
In response to the COVID-19 pandemic, the CARES Act was signed into law. Under the CARES Act, banks may elect to deem that loan modifications do not result in TDRs if they are (1) related to COVID-19; (2) executed on a loan that was not more than 30 days past due as of December 31, 2019; and (3) executed between March 1, 2020, and the earlier of (A) 60 days after the date of termination of the national emergency declaration or (B) December 31, 2020. Additionally, in accordance with the Interagency Statement on Loan Modifications and Reporting for Financial Institutions Working with Customers Affected by the Coronavirus (Revised), other short-term modifications made on a good faith basis in response to COVID-19 to borrowers who were current prior to any relief are not TDRs under ASC Subtopic 310-40. This includes short-term (e.g., up to six months) modifications such as payment deferrals, fee waivers, extensions of repayment terms, or delays in payment that are insignificant. Borrowers considered current are those that are less than 30 days past due on their contractual payments at the time a modification program is implemented. Loans modified under this guidance are not considered TDRs and as such are not identified in the table below. At December 31, 2020, we had outstanding loans with payment deferrals, generally for up to three months, totaling $47.2 million.
The following tables set forth the recorded balance of loans considered to be TDRs that were restructured and the type of concession by class of loans during the periods presented (dollars in thousands):
| | | | | | | | | | | | | | | | | | | | | | | | | | | | | | | | |
| | December 31, 2020 |
| | Extend Amortization
Period | | Interest Rate Reductions | | Combination | | Total Modifications | | Number of Loans |
| Real estate loans: | | | | | | | | | | |
| | | | | | | | | | |
| | | | | | | | | | |
| Commercial | | $ | — | | | $ | — | | | $ | 58 | | | $ | 58 | | | 1 |
| Commercial loans | | 51 | | | — | | | 390 | | | 441 | | | 6 |
| Loans to individuals | | — | | | — | | | 22 | | | 22 | | | 1 |
| Total | | $ | 51 | | | $ | — | | | $ | 470 | | | $ | 521 | | | 8 |
| | | | | | | | | | | | | | | | | | | | | | | | | | | | | | | | |
| | December 31, 2019 |
| | Extend Amortization
Period | | Interest Rate Reductions | | Combination | | Total Modifications | | Number of Loans |
| Real estate loans: | | | | | | | | | | |
| | | | | | | | | | |
| 1-4 family residential | | $ | — | | | $ | — | | | $ | 121 | | | $ | 121 | | | 2 |
| Commercial | | 7,518 | | | — | | | 93 | | | 7,611 | | | 2 |
| Commercial loans | | 52 | | | — | | | 1,143 | | | 1,195 | | | 9 |
| Loans to individuals | | 4 | | | — | | | 24 | | | 28 | | | 5 |
| Total | | $ | 7,574 | | | $ | — | | | $ | 1,381 | | | $ | 8,955 | | | 18 |
| | | | | | | | | | | | | | | | | | | | | | | | | | | | | | | | |
| | December 31, 2018 |
| | Extend Amortization
Period | | Interest Rate Reductions | | Combination | | Total Modifications | | Number of Loans |
| Real estate loans: | | | | | | | | | | |
| | | | | | | | | | |
| 1-4 family residential | | $ | — | | | $ | 79 | | | $ | — | | | $ | 79 | | | 1 | |
| Commercial | | 10,398 | | | — | | | 274 | | | 10,672 | | | 3 | |
| Commercial loans | | 211 | | | — | | | 215 | | | 426 | | | 13 |
| Loans to individuals | | 8 | | | 33 | | | 51 | | | 92 | | | 5 | |
| Total | | $ | 10,617 | | | $ | 112 | | | $ | 540 | | | $ | 11,269 | | | 22 |
Interest continues to be charged on principal balances outstanding during the extended term. Therefore, the financial effects of the recorded investment of loans restructured as TDRs during the years ended December 31, 2020 and 2019 were not significant. Generally, the loans identified as TDRs were previously reported as impaired loans prior to restructuring, and therefore, the modification did not impact our determination of the allowance for loans losses.
On an ongoing basis, the performance of the TDRs is monitored for subsequent payment default. Payment default for TDRs is recognized when the borrower is 90 days or more past due. For the year ended December 31, 2020, and 2019 the amount of TDRs in default was not significant. Payment defaults for TDRs did not significantly impact the determination of the allowance for loan losses in the periods presented.
At December 31, 2020, 2019 and 2018, there were no commitments to lend additional funds to borrowers whose terms had been modified in TDRs.
Allowance for Loan Losses
The following tables detail activity in the allowance for loan losses by portfolio segment for the periods presented (in thousands):
| | | | | | | | | | | | | | | | | | | | | | | | | | | | | | | | | | | | | | | | | | | |
| | | | | | | | | | | | | | | |
| | Year Ended December 31, 2020 |
| | Real Estate | | | | | | | | | | |
| | Construction | | 1-4 Family Residential | | Commercial | | Commercial Loans | | Municipal Loans | | Loans to Individuals | | | | Total |
| Balance at beginning of period | $ | 3,539 | | | $ | 3,833 | | | $ | 9,572 | | | $ | 6,351 | | | $ | 570 | | | $ | 932 | | | | | $ | 24,797 | |
| Impact of CECL adoption - cumulative effect adjustment | 2,968 | | | (1,447) | | | 7,730 | | | (3,532) | | | (522) | | | (125) | | | | | 5,072 | |
| Impact of CECL adoption - purchased loans with credit deterioration | (15) | | | (6) | | | 333 | | | (22) | | | — | | | (59) | | | | | 231 | |
| Loans charged-off | (40) | | | (152) | | | (33) | | | (823) | | | — | | | (1,806) | | | | | (2,854) | |
| Recoveries of loans charged-off | 28 | | | 32 | | | 102 | | | 310 | | | — | | | 1,178 | | | | | 1,650 | |
| Net loans (charged-off) recovered | (12) | | | (120) | | | 69 | | | (513) | | | — | | | (628) | | | | | (1,204) | |
Provision for (reversal of) loan losses(1) | 10 | | | 10 | | | 18,005 | | | 1,823 | | | (2) | | | 264 | | | | | 20,110 | |
| Balance at end of period | $ | 6,490 | | | $ | 2,270 | | | $ | 35,709 | | | $ | 4,107 | | | $ | 46 | | | $ | 384 | | | | | $ | 49,006 | |
| | | | | | | | | | | | | | | | | | | | | | | | | | | | | | | | | | | | | | | | | | | |
| Year Ended December 31, 2019 |
| Real Estate | | | | | | | | | | |
| Construction | | 1-4 Family Residential | | Commercial | | Commercial Loans | | Municipal Loans | | Loans to Individuals | | | | Total |
| Balance at beginning of period | $ | 3,597 | | | $ | 3,844 | | | $ | 13,968 | | | $ | 3,974 | | | $ | 525 | | | $ | 1,111 | | | | | $ | 27,019 | |
| Loans charged-off | — | | | (126) | | | (5,247) | | | (1,162) | | | — | | | (2,398) | | | | | (8,933) | |
| Recoveries of loans charged-off | 12 | | | 68 | | | 113 | | | 250 | | | — | | | 1,167 | | | | | 1,610 | |
| Net loans (charged-off) recovered | 12 | | | (58) | | | (5,134) | | | (912) | | | — | | | (1,231) | | | | | (7,323) | |
| Provision for (reversal of) loan losses | (70) | | | 47 | | | 738 | | | 3,289 | | | 45 | | | 1,052 | | | | | 5,101 | |
| Balance at end of period | $ | 3,539 | | | $ | 3,833 | | | $ | 9,572 | | | $ | 6,351 | | | $ | 570 | | | $ | 932 | | | | | $ | 24,797 | |
| | | | | | | | | | | | | | | | | | | | | | | | | | | | | | | | | | | | | | | | | | | |
| Year Ended December 31, 2018 |
| Real Estate | | | | | | | | | | |
| Construction | | 1-4 Family Residential | | Commercial | | Commercial Loans | | Municipal Loans | | Loans to Individuals | | | | Total |
| Balance at beginning of period | $ | 3,676 | | | $ | 2,445 | | | $ | 10,821 | | | $ | 2,094 | | | $ | 860 | | | $ | 885 | | | | | $ | 20,781 | |
| Loans charged-off | (14) | | | (91) | | | (783) | | | (756) | | | — | | | (2,602) | | | | | (4,246) | |
| Recoveries of loans charged-off | 7 | | | 356 | | | 36 | | | 244 | | | — | | | 1,404 | | | | | 2,047 | |
| Net loans (charged-off) recovered | (7) | | | 265 | | | (747) | | | (512) | | | — | | | (1,198) | | | | | (2,199) | |
| Provision for (reversal of) loan losses | (72) | | | 1,134 | | | 3,894 | | | 2,392 | | | (335) | | | 1,424 | | | | | 8,437 | |
| Balance at end of period | $ | 3,597 | | | $ | 3,844 | | | $ | 13,968 | | | $ | 3,974 | | | $ | 525 | | | $ | 1,111 | | | | | $ | 27,019 | |
(1) The increase in the provision for credit losses during 2020 was primarily due to the economic impact of COVID-19 on macroeconomic factors used in the CECL methodology.
The accrued interest receivable on our loan receivables is excluded from the allowance for credit loss estimate and is included in interest receivable on our consolidated balance sheets. As of December 31, 2020 and December 31, 2019, the accrued interest on our loan portfolio was $16.4 million and $14.2 million, respectively.
6. PREMISES AND EQUIPMENT
Premises and equipment at December 31, 2020 and 2019 are summarized as follows (in thousands):
| | | | | | | | | | | | | | |
| | December 31, |
| | 2020 | | 2019 |
| Premises | | $ | 180,025 | | | $ | 176,949 | |
| Furniture and equipment | | 39,842 | | | 44,647 | |
| | | 219,867 | | | 221,596 | |
| Less: Accumulated depreciation | | 75,291 | | | 77,684 | |
| Total | | $ | 144,576 | | | $ | 143,912 | |
Assets with accumulated depreciation of $10.4 million and $1.5 million were written off for the years ended December 31, 2020 and 2019, respectively.
Depreciation expense was $8.0 million, $7.3 million and $8.4 million for the years ended December 31, 2020, 2019 and 2018, respectively.
7. DEPOSITS
Deposits in the accompanying consolidated balance sheets are classified as follows (in thousands):
| | | | | | | | | | | | | | |
| | | December 31, 2020 | | December 31, 2019 |
| Noninterest bearing demand deposits: | | | | |
| Private accounts | | $ | 1,309,380 | | | $ | 1,002,864 | |
| Public accounts | | 45,435 | | | 37,248 | |
| Total noninterest bearing demand deposits | | 1,354,815 | | | 1,040,112 | |
| Interest bearing deposits: | | | | |
| Private accounts: | | | | |
| Savings accounts | | 495,641 | | | 384,625 | |
| Money market demand accounts | | 429,687 | | | 407,461 | |
| Platinum money market accounts | | 381,877 | | | 353,374 | |
| Interest bearing checking accounts | | 835,489 | | | 699,681 | |
| NOW demand accounts | | 17,377 | | | 22,005 | |
| CDs of $250,000 or more | | 77,819 | | | 91,836 | |
| CDs under $250,000 | | 474,503 | | | 790,053 | |
| Total private accounts | | 2,712,393 | | | 2,749,035 | |
| Public accounts: | | | | |
| Savings accounts | | 347 | | | 337 | |
| Money market demand accounts | | 19,080 | | | 18,377 | |
| Platinum money market accounts | | 321,601 | | | 266,957 | |
| Interest bearing checking accounts | | 81,673 | | | 57,368 | |
| NOW demand accounts | | 203,638 | | | 158,804 | |
| CDs of $250,000 or more | | 227,201 | | | 368,351 | |
| CDs under $250,000 | | 11,574 | | | 43,428 | |
| Total public accounts | | 865,114 | | | 913,622 | |
| Total interest bearing deposits | | 3,577,507 | | | 3,662,657 | |
| Total deposits | | $ | 4,932,322 | | | $ | 4,702,769 | |
For the years ended December 31, 2020, 2019 and 2018, interest expense on CDs of $250,000 or more was $7.4 million, $7.6 million and $8.5 million, respectively.
At December 31, 2020, the scheduled maturities of CDs, including public accounts, were as follows (in thousands):
| | | | | |
| 2021 | $ | 651,898 | |
| 2022 | 88,465 | |
| 2023 | 25,784 | |
| 2024 | 10,307 | |
| 2025 | 14,525 | |
| 2026 and thereafter | 118 | |
| $ | 791,097 | |
At December 31, 2020, we had $102.8 million in brokered CDs that represented 2.1% of our deposits. Our brokered CDs had a weighted average cost of 18 basis points with maturities of less than two years. These brokered CDs are reflected in the CDs under $250,000 category. At December 31, 2019, we had $365.7 million in brokered CDs. We utilized brokered CDs, because they better matched overall ALCO objectives at the time of issuance. Our current policy allows for a maximum of $450 million in brokered CDs.
At December 31, 2020 and 2019, we had approximately $10.4 million and $9.9 million, respectively, in deposits from related parties, including directors and named executive officers.
The aggregate amount of demand deposit overdrafts that have been reclassified as loans were $933,000 and $1.7 million at December 31, 2020 and 2019, respectively.
8. BORROWING ARRANGEMENTS
Information related to borrowings is provided in the table below (dollars in thousands):
| | | | | | | | | | | | | | |
| | December 31, 2020 | | December 31, 2019 |
| Other borrowings: | | | | |
| Balance at end of period | | $ | 23,172 | | | $ | 28,358 | |
Average amount outstanding during the period (1) | | 91,940 | | | 15,645 | |
Maximum amount outstanding during the period (2) | | 219,259 | | | 28,358 | |
Weighted average interest rate during the period (3) | | 0.4 | % | | 1.7 | % |
Interest rate at end of period (4) | | 0.1 | % | | 1.7 | % |
| | | | |
| FHLB borrowings: | | | | |
| Balance at end of period | | $ | 832,527 | | | $ | 972,744 | |
Average amount outstanding during the period (1) | | 1,032,269 | | | 868,859 | |
Maximum amount outstanding during the period (2) | | 1,274,370 | | | 1,077,883 | |
Weighted average interest rate during the period (3) | | 1.1 | % | | 2.0 | % |
Interest rate at end of period (4) | | 1.0 | % | | 1.8 | % |
(1)The average amount outstanding during the period was computed by dividing the total daily outstanding principal balances by the number of days in the period.
(2)The maximum amount outstanding at any month-end during the period.
(3)The weighted average interest rate during the period was computed by dividing the actual interest expense by the average amount outstanding during the period. The weighted average interest rate on the FHLB borrowings includes the effect of interest rate swaps.
(4)Stated rate.
Maturities of the obligations associated with our borrowing arrangements based on scheduled repayments at December 31, 2020 are as follows (in thousands):
| | | | | | | | | | | | | | | | | | | | | | | | | | | | | | | | | | | | | | | | | | | | |
| | Payments Due by Period |
| | | Less than
1 Year | | 1-2 Years | | 2-3 Years | | 3-4 Years | | 4-5 Years | | Thereafter | | Total |
| Other borrowings | | $ | 23,172 | | | $ | — | | | $ | — | | | $ | — | | | $ | — | | | $ | — | | | $ | 23,172 | |
| FHLB borrowings | | 828,489 | | | 680 | | | 710 | | | 740 | | | 772 | | | 1,136 | | | 832,527 | |
| Total obligations | | $ | 851,661 | | | $ | 680 | | | $ | 710 | | | $ | 740 | | | $ | 772 | | | $ | 1,136 | | | $ | 855,699 | |
Other borrowings include federal funds purchased, repurchase agreements and borrowings from the FRDW. Southside Bank has three unsecured lines of credit for the purchase of overnight federal funds at prevailing rates with Frost Bank, TIB – The Independent Bankers Bank and Comerica Bank for $40.0 million, $15.0 million and $7.5 million, respectively. There were no federal funds purchased at December 31, 2020 or 2019. To provide more liquidity in response to the COVID-19 pandemic, the Federal Reserve took steps to encourage broader use of the discount window. At December 31, 2020, the amount of additional funding the Bank could obtain from the FRDW, collateralized by securities and PPP loans, was approximately $722.3 million. There were no borrowings from the FRDW at December 31, 2020. Southside Bank has a $5.0 million line of credit with Frost Bank to be used to issue letters of credit, and at December 31, 2020, the line had one outstanding letter of credit for $1.0 million. Southside Bank currently has no outstanding letters of credit from FHLB held as collateral for its public fund deposits.
Southside Bank enters into sales of securities under repurchase agreements. These repurchase agreements totaled $23.2 million and $28.4 million at December 31, 2020 and 2019, respectively, and had maturities of less than one year. Repurchase agreements are secured by investment and MBS securities and are stated at the amount of cash received in connection with the transaction.
FHLB borrowings represent borrowings with fixed interest rates ranging from 0.10% to 4.799% and with remaining maturities of four days to 7.5 years at December 31, 2020. FHLB borrowings may be collateralized by FHLB stock, nonspecified loans and/or securities. At December 31, 2020, the amount of additional funding Southside Bank could obtain from FHLB, collateralized by securities, FHLB stock and nonspecified loans and securities, was approximately $1.15 billion, net of FHLB stock purchases required.
Southside Bank has entered into various variable rate agreements and fixed rate short-term pay agreements with third-party financial institutions with rates tied to LIBOR. These agreements totaled $670.0 million at December 31, 2020 and $310.0 million at December 31, 2019. Six of the agreements have an interest rate tied to three-month LIBOR and the remaining agreements have interest rates tied to one-month LIBOR. In connection with all agreements outstanding on December 31, 2020, Southside Bank also entered into various interest rate swap contracts that are treated as cash flow hedges under ASC Topic 815, “Derivatives and Hedging” that are expected to be effective in hedging the variability in future cash flows attributable to fluctuations in the underlying LIBOR interest rate. The interest rate swap contracts had a weighted average rate of 1.12% with a weighted average maturity of 3.8 years at December 31, 2020. Refer to “Note 11 – Derivative Financial Instruments and Hedging Activities” in our consolidated financial statements included in this report for a detailed description of our hedging policy and methodology related to derivative instruments.
9. LONG-TERM DEBT
Information related to our long-term debt is summarized as follows for the periods presented (in thousands):
| | | | | | | | | | | |
| December 31, 2020 | | December 31, 2019 |
| | | |
Subordinated notes: (1) | | | |
3.875% Subordinated notes, net of unamortized debt issuance costs (2) | $ | 98,497 | | | $ | — | |
5.50% Subordinated notes, net of unamortized debt issuance costs (3) | 98,754 | | | 98,576 | |
| Total Subordinated notes | 197,251 | | | 98,576 | |
Trust preferred subordinated debentures: (4) | | | |
Southside Statutory Trust III, net of unamortized debt issuance costs (5) | 20,563 | | | 20,558 | |
| Southside Statutory Trust IV | 23,196 | | | 23,196 | |
| Southside Statutory Trust V | 12,887 | | | 12,887 | |
| Magnolia Trust Company I | 3,609 | | | 3,609 | |
| Total Trust preferred subordinated debentures | 60,255 | | | 60,250 | |
| | | |
| | | |
| | | |
| | | |
| Total Long-term debt | $ | 257,506 | | | $ | 158,826 | |
(1)This debt consists of subordinated notes with a remaining maturity greater than one year that qualify under the risk-based capital guidelines as Tier 2 capital, subject to certain limitations.
(2)The unamortized discount and debt issuance costs reflected in the carrying amount of the subordinated notes totaled approximately $1.5 million at December 31, 2020.
(3)The unamortized discount and debt issuance costs reflected in the carrying amount of the subordinated notes totaled approximately $1.2 million at December 31, 2020 and $1.4 million at December 31, 2019.
(4)This debt consists of trust preferred securities that qualify under the risk-based capital guidelines as Tier 1 capital, subject to certain limitations.
(5)The unamortized debt issuance costs reflected in the carrying amount of the Southside Statutory Trust III junior subordinated debentures totaled $56,000 at December 31, 2020 and $61,000 at December 31, 2019.
As of December 31, 2020, the details of the subordinated notes and the trust preferred subordinated debentures are summarized below (dollars in thousands):
| | | | | | | | | | | | | | | | | | | | | | | | | | | | | |
| Date Issued | | Amount Issued | | Fixed or Floating Rate | | Interest Rate | | Maturity Date |
3.875% Subordinated Notes | November 6, 2020 | | $ | 100,000 | | | Fixed-to-Floating | | 3.875% | | November 15, 2030 |
5.50% Subordinated Notes | September 19, 2016 | | $ | 100,000 | | | Fixed-to-Floating | | 5.50% | | September 30, 2026 |
| Southside Statutory Trust III | September 4, 2003 | | $ | 20,619 | | | Floating | | 3 month LIBOR + 2.94% | | September 4, 2033 |
| Southside Statutory Trust IV | August 8, 2007 | | $ | 23,196 | | | Floating | | 3 month LIBOR + 1.30% | | October 30, 2037 |
| Southside Statutory Trust V | August 10, 2007 | | $ | 12,887 | | | Floating | | 3 month LIBOR + 2.25% | | September 15, 2037 |
Magnolia Trust Company I (1) | October 10, 2007 | | $ | 3,609 | | | Floating | | 3 month LIBOR + 1.80% | | November 23, 2035 |
(1)On October 10, 2007, as part of an acquisition we assumed $3.6 million of floating rate junior subordinated debentures issued in 2005 to Magnolia Trust Company I.
On September 19, 2016, the Company issued $100.0 million in aggregate principal amount of fixed-to-floating rate subordinated notes that mature on September 30, 2026. This debt initially bears interest at a fixed rate of 5.50% through September 29, 2021 and thereafter, adjusts quarterly at a floating rate equal to three-month LIBOR plus 429.7 basis points. The
proceeds from the sale of the subordinated notes were used for general corporate purposes, which included advances to the Bank to finance its activities.
On November 6, 2020, the Company issued $100.0 million in aggregate principal amount of fixed-to-floating rate subordinated notes that mature on November 15, 2030. This debt initially bears interest at a fixed rate of 3.875% per year through November 14, 2025 and thereafter, adjusts quarterly at a floating rate equal to the then current three-month term SOFR, as published by the FRBNY, plus 366 basis points. The proceeds from the sale of the subordinated notes were used for general corporate purposes.
10. EMPLOYEE BENEFITS
Deferred Compensation Agreements
Southside Bank has deferred compensation agreements with 33 of its executive officers, which generally provide for payment of an aggregate amount of $11.0 million over a maximum period of 15 years after retirement or death. Of the 33 executives included in the agreements, payments have commenced to ten former executives and/or their beneficiaries. Deferred compensation expense was $667,000, $173,000 and $201,000 for the years ended December 31, 2020, 2019 and 2018, respectively. At December 31, 2020 and 2019, the deferred compensation plan liability totaled $3.5 million and $3.2 million, respectively.
Health Insurance
We provide accident and health insurance for substantially all employees through a self-funded insurance program. The cost of health care benefits was $7.0 million, $7.9 million and $6.5 million for the years ended December 31, 2020, 2019 and 2018, respectively. Our healthcare plan provides health insurance coverage for any retiree having 50 years of service with the Company. In addition, the eligible retiree must have Medicare coverage, including part A, part B and part D. There was one retiree participating in the health insurance plan as of December 31, 2020, 2019 and 2018.
Employee Stock Ownership Plan
We have an ESOP which covers substantially all employees. Contributions to the ESOP are at the sole discretion of the board of directors. We contributed $1.0 million to the ESOP for the year ended December 31, 2020 and $700,000 for the years ended December 31, 2019, and 2018. At December 31, 2020 and 2019, the ESOP owned 323,606 and 283,097 shares of common stock, respectively. These shares are treated as externally held shares for dividend and earnings per share calculations.
Long-term Disability
We have an officer’s long-term disability income policy which provides coverage in the event they become disabled as defined under its terms. Individuals are automatically covered under the policy if they (a) have been elected as an officer, (b) have been an employee of Southside Bank for three years and (c) receive earnings of $50,000 or more on an annual basis. The policy provides, among other things, that should a covered individual become totally disabled he would receive two-thirds of his current salary, not to exceed $15,000 per month. The benefits paid out of the policy are limited by the benefits paid to the individual under the terms of our other Company-sponsored benefit plans.
Split Dollar Agreements
We originally entered into split dollar agreements with eight of our executive officers. The agreements provide we will be the beneficiary of BOLI insuring the executives’ lives. The agreements provide the executives the right to designate the beneficiaries of the death benefits guaranteed in each agreement. The agreements originally provided for death benefits of an initial aggregate amount of $4.5 million. Prior to an executive’s retirement, his individual amount is increased annually on the anniversary date of the agreement by inflation adjustment factors of either 3% or 5%. As of December 31, 2020, three of the executives remained actively employed with us. Death benefits under this agreement were paid during 2018 for one retired covered officer and during 2013 for one active covered officer. As of December 31, 2020, the estimated death benefits for the six executives total $4.5 million. The agreements also state that after the executive’s retirement, we shall also pay an annual gross-up bonus to the executive in an amount sufficient to enable the executive to pay federal income tax on both the economic benefit and on the gross-up bonus. The expense required to record the post retirement liability associated with the split dollar post retirement bonuses was $35,000 for the year ended December 31, 2020, and a credit to expense of $12,000 and $250,000, for the years ended December 31, 2019 and 2018, respectively. For the years ended December 31, 2020 and 2019, the split dollar liability totaled $1.5 million and $1.3 million, respectively.
401(k) Plan
We have a 401(k) Plan covering substantially all employees that permits each participant to make before- or after-tax contributions subject to certain limits imposed by the Internal Revenue Code. Beginning January 1, 2017, eligible employees may participate in the 401(k) Plan after they have worked at least 30 days with the Company. For the years ended December 31, 2020, 2019 and 2018, expense attributable to the 401(k) Plan totaled $1.9 million, $1.6 million and $1.5 million, respectively. The increase in 401(k) Plan expense was related to an increase in eligible matching participants during the second quarter of 2020.
Pension Plans
We have a defined benefit pension plan pursuant to which participants are entitled to benefits based on final average monthly compensation and years of credited service determined in accordance with plan provisions.
We have a nonfunded supplemental retirement plan for our employees whose benefits under the principal retirement plan are reduced because of compensation deferral elections or limitations under federal tax laws.
Entrance into the Plan by new employees was frozen effective December 31, 2005. Employees hired after December 31, 2005 are not eligible to participate in the Plan. All remaining participants in the Plan are fully vested. Benefits are payable monthly commencing on the later of age 65 or the participant’s date of retirement. Eligible participants may retire at reduced benefit levels after reaching age 55. We contribute amounts to the pension fund sufficient to satisfy funding requirements of the Employee Retirement Income Security Act.
On June 18, 2020, our Board of Directors approved changes to the Plan and Restoration Plan to freeze all future benefit accruals and accrual of benefit service, including consideration of compensation increases, effective December 31, 2020. As a result of these changes, the Plan liability was remeasured as of June 30, 2020. We recognized the Plan freeze as a curtailment since it eliminates the accrual of defined benefits for future services for participants. The impact of the curtailment included a one-time accelerated recognition of outstanding unamortized prior service costs of $163,000 and a decrease to accumulated other comprehensive income, included in shareholders’ equity, of approximately $6.0 million due primarily to the decrease in the discount rate from 3.41% to 2.78%.
Plan assets included 240,666 shares of our stock at December 31, 2020 and 2019. Our stock included in the Plan assets was purchased at fair value. During 2020, our funded status declined, and at December 31, 2020, we had an unfunded status of $6.4 million compared to an unfunded status of $6.2 million at December 31, 2019. The decline in the funded status was a result of a decrease in the discount rate at December 31, 2020 compared to December 31, 2019, and a less than expected return on the fair value of plan assets, partially offset by the updated mortality assumption at December 31, 2020, compared to December 31, 2019, a gain to the plan resulting from lump sum payments and the plan amendment that froze benefit accruals.
In connection with the acquisition of Omni, we acquired the OmniAmerican Bank Defined Benefit Plan which was remeasured at fair value. The Acquired Plan originally called for benefits to be paid to eligible employees at retirement based primarily upon years of service and the compensation levels at retirement. As of December 31, 2006, the benefits under the Acquired Plan were frozen by Omni. No further benefits have been or will be earned by employees since that date. In addition, no new participants may be added to the Acquired Plan after December 31, 2006. During 2020, our funded status improved and at December 31, 2020, we had an unfunded status of $91,000 compared to an unfunded status of $107,000 at December 31, 2019. The improvement was a result of a greater than expected return on the fair value of plan assets since December 31, 2019, an updated mortality assumption, and lump sum payments resulting in a gain to the plan, partially offset by a decrease in the discount rate to better reflect the current market conditions at December 31, 2020, compared to December 31, 2019.
We use a measurement date of December 31 for our plans.
| | | | | | | | | | | | | | | | | | | | | | | | | | | | | | | | | | | | | | | | | | | | | | | | | | | | | | | | |
| | Years Ended December 31, |
| | | 2020 | | 2019 | | 2018 |
| | | Defined Benefit
Pension
Plan | | Defined
Benefit
Pension
Plan Acquired | | Restoration
Plan | | Defined
Benefit
Pension
Plan | | Defined
Benefit
Pension
Plan Acquired | | Restoration
Plan | | Defined
Benefit
Pension
Plan | | Defined
Benefit
Pension
Plan Acquired | | Restoration
Plan |
| | | (in thousands) |
| Change in Projected Benefit Obligation: | | | | | | | | | | | | | | | | | | |
| Benefit obligation at end of prior year | | $ | 100,012 | | | $ | 4,870 | | | $ | 19,098 | | | $ | 85,992 | | | $ | 3,873 | | | $ | 15,300 | | | $ | 94,276 | | | $ | 4,392 | | | $ | 14,642 | |
| Service cost | | 1,793 | | | — | | | 429 | | | 1,420 | | | — | | | 339 | | | 1,548 | | | — | | | 293 | |
| Interest cost | | 3,031 | | | 162 | | | 568 | | | 3,654 | | | 169 | | | 713 | | | 3,392 | | | 163 | | | 597 | |
| Actuarial loss (gain) | | 11,892 | | | 437 | | | 1,344 | | | 12,763 | | | 943 | | | 3,319 | | | (9,399) | | | (480) | | | 344 | |
| Benefits paid | | (6,596) | | | (51) | | | (688) | | | (3,703) | | | (68) | | | (573) | | | (3,622) | | | (183) | | | (576) | |
| Expenses paid | | (202) | | | (113) | | | — | | | (114) | | | (47) | | | — | | | (203) | | | (19) | | | — | |
| | | | | | | | | | | | | | | | | | |
| Curtailments | | (13,082) | | | — | | | (1,962) | | | — | | | — | | | — | | | — | | | — | | | — | |
| | | | | | | | | | | | | | | | | | |
| Settlements | | — | | | (1,601) | | | — | | | — | | | — | | | — | | | — | | | — | | | — | |
| | | | | | | | | | | | | | | | | | |
| Benefit obligation at end of year | | 96,848 | | | 3,704 | | | 18,789 | | | 100,012 | | | 4,870 | | | 19,098 | | | 85,992 | | | 3,873 | | | 15,300 | |
| Change in Plan Assets: | | | | | | | | | | | | | | | | | | |
| Fair value of plan assets at end of prior year | | 93,818 | | | 4,763 | | | — | | | 84,911 | | | 4,070 | | | — | | | 91,233 | | | 4,031 | | | — | |
| Actual return | | 3,399 | | | 615 | | | — | | | 12,724 | | | 808 | | | — | | | (4,497) | | | (259) | | | — | |
| Employer contributions | | — | | | — | | | 688 | | | — | | | — | | | 573 | | | 2,000 | | | 500 | | | 576 | |
| Benefits paid | | (6,596) | | | (51) | | | (688) | | | (3,703) | | | (68) | | | (573) | | | (3,622) | | | (183) | | | (576) | |
| Expenses paid | | (202) | | | (113) | | | — | | | (114) | | | (47) | | | — | | | (203) | | | (19) | | | — | |
| Settlements | | — | | | (1,601) | | | — | | | — | | | — | | | — | | | — | | | — | | | — | |
| | | | | | | | | | | | | | | | | | |
| Fair value of plan assets at end of year | | 90,419 | | | 3,613 | | | — | | | 93,818 | | | 4,763 | | | — | | | 84,911 | | | 4,070 | | | — | |
| (Un)Funded status at end of year | | (6,429) | | | (91) | | | (18,789) | | | (6,194) | | | (107) | | | (19,098) | | | (1,081) | | | 197 | | | (15,300) | |
| Accrued benefit (liability) asset recognized | | $ | (6,429) | | | $ | (91) | | | $ | (18,789) | | | $ | (6,194) | | | $ | (107) | | | $ | (19,098) | | | $ | (1,081) | | | $ | 197 | | | $ | (15,300) | |
| Accumulated benefit obligation at end of year | | $ | 96,848 | | | $ | 3,704 | | | $ | 18,789 | | | $ | 88,247 | | | $ | 4,870 | | | $ | 16,258 | | | $ | 77,888 | | | $ | 3,873 | | | $ | 13,403 | |
Amounts related to our defined benefit pension plans and restoration plan recognized as a component of other comprehensive income (loss) were as follows (in thousands):
| | | | | | | | | | | | | | | | | | | | | | | | | | | | | | | | | | | | | | | | | | | | | | | | | | | | | | | | |
| | Years Ended December 31, |
| | | 2020 | | 2019 | | 2018 |
| | | Defined
Benefit
Pension
Plan | | Defined
Benefit
Pension
Plan Acquired | | Restoration
Plan | | Defined
Benefit
Pension
Plan | | Defined
Benefit
Pension
Plan Acquired | | Restoration
Plan | | Defined
Benefit
Pension
Plan | | Defined
Benefit
Pension
Plan Acquired | | Restoration
Plan |
| Recognition of net loss | | $ | 2,474 | | | $ | 10 | | | $ | 551 | | | $ | 1,827 | | | $ | — | | | $ | 559 | | | $ | 1,512 | | | $ | — | | | $ | 677 | |
| Recognition of prior service (credit) cost | | (14) | | | — | | | 7 | | | (14) | | | — | | | 6 | | | (14) | | | — | | | 7 | |
| | | | | | | | | | | | | | | | | | |
| Recognition of loss due to settlement | | — | | | 215 | | | — | | | — | | | — | | | — | | | — | | | — | | | — | |
| Net loss occurring during the year | | (1,086) | | | (124) | | | 617 | | | (6,070) | | | (427) | | | (3,319) | | | (1,581) | | | (69) | | | (344) | |
| Net prior service cost occurring during the year | | 151 | | | — | | | 12 | | | — | | | — | | | — | | | — | | | — | | | — | |
| | | 1,525 | | | 101 | | | 1,187 | | | (4,257) | | | (427) | | | (2,754) | | | (83) | | | (69) | | | 340 | |
| Deferred tax (expense) benefit | | (320) | | | (21) | | | (249) | | | 894 | | | 90 | | | 578 | | | 17 | | | 14 | | | (71) | |
| Other comprehensive income (loss), net of tax | | $ | 1,205 | | | $ | 80 | | | $ | 938 | | | $ | (3,363) | | | $ | (337) | | | $ | (2,176) | | | $ | (66) | | | $ | (55) | | | $ | 269 | |
The noncash adjustment to the Plan liabilities, consisting of changes in prior service cost and net loss, was $2.8 million for the year ended December 31, 2020.
Net amounts recognized in net periodic benefit cost and other comprehensive income (loss) were as follows (in thousands):
| | | | | | | | | | | | | | | | | | | | | | | | | | | | | | | | | | | | | | |
| | | December 31, 2020 | | December 31, 2019 |
| | | Defined
Benefit
Pension
Plan | | Defined
Benefit
Pension
Plan Acquired | | Restoration
Plan | | Defined
Benefit
Pension
Plan | | Defined
Benefit
Pension
Plan Acquired | | Restoration
Plan |
| Net loss | | $ | 2,474 | | | $ | 10 | | | $ | 551 | | | $ | 1,827 | | | $ | — | | | $ | 559 | |
| Prior service (credit) cost | | (14) | | | — | | | 7 | | | (14) | | | — | | | 6 | |
| Loss recognized due to curtailment | | 151 | | | — | | | 12 | | | — | | | — | | | — | |
| Loss recognized due to settlement | | — | | | 215 | | | — | | | — | | | — | | | — | |
| | | 2,611 | | | 225 | | | 570 | | | 1,813 | | | — | | | 565 | |
| Deferred tax expense | | (548) | | | (47) | | | (120) | | | (381) | | | — | | | (118) | |
| Accumulated other comprehensive income (loss), net of tax | | $ | 2,063 | | | $ | 178 | | | $ | 450 | | | $ | 1,432 | | | $ | — | | | $ | 447 | |
Amounts recognized as a component of accumulated other comprehensive income (loss) were as follows (in thousands):
| | | | | | | | | | | | | | | | | | | | | | | | | | | | | | | | | | | | | | |
| | | December 31, 2020 | | December 31, 2019 |
| | | Defined
Benefit
Pension
Plan | | Defined
Benefit
Pension
Plan Acquired | | Restoration
Plan | | Defined
Benefit
Pension
Plan | | Defined
Benefit
Pension
Plan Acquired | | Restoration
Plan |
| Net loss | | $ | (31,783) | | | $ | (498) | | | $ | (5,575) | | | $ | (33,171) | | | $ | (598) | | | $ | (6,744) | |
| Prior service cost | | — | | | — | | | — | | | (137) | | | — | | | (18) | |
| | | (31,783) | | | (498) | | | (5,575) | | | (33,308) | | | (598) | | | (6,762) | |
| Deferred tax benefit | | 6,674 | | | 104 | | | 1,171 | | | 6,994 | | | 125 | | | 1,419 | |
| | | | | | | | | | | | |
| Accumulated other comprehensive (loss) income, net of tax | | $ | (25,109) | | | $ | (394) | | | $ | (4,404) | | | $ | (26,314) | | | $ | (473) | | | $ | (5,343) | |
Net periodic pension cost and postretirement benefit cost included the following components (in thousands):
| | | | | | | | | | | | | | | | | | | | |
| | Years Ended December 31, |
| | | 2020 | | 2019 | | 2018 |
| Defined Benefit Pension Plan: | | |
| Service cost | | $ | 1,793 | | | $ | 1,420 | | | $ | 1,548 | |
| Interest cost | | 3,031 | | | 3,654 | | | 3,392 | |
| Expected return on assets | | (5,676) | | | (6,030) | | | (6,483) | |
| Net loss amortization | | 2,474 | | | 1,827 | | | 1,512 | |
| Prior service credit amortization | | (14) | | | (14) | | | (14) | |
| Loss due to curtailment | | 151 | | | — | | | — | |
| Net periodic benefit cost | | $ | 1,759 | | | $ | 857 | | | $ | (45) | |
| Defined Benefit Pension Plan Acquired: | | | | | | |
| Service cost | | $ | — | | | $ | — | | | $ | — | |
| Interest cost | | 162 | | | 169 | | | 163 | |
| Expected return on assets | | (301) | | | (293) | | | (290) | |
| Net loss amortization | | 10 | | | — | | | — | |
| Prior service credit amortization | | — | | | — | | | — | |
| Loss recognized due to settlement | | 215 | | | — | | | — | |
| Net periodic benefit cost | | $ | 86 | | | $ | (124) | | | $ | (127) | |
| Restoration Plan: | | | | | | |
| Service cost | | $ | 429 | | | $ | 339 | | | $ | 293 | |
| Interest cost | | 568 | | | 713 | | | 597 | |
| Net loss amortization | | 551 | | | 559 | | | 677 | |
| Prior service cost amortization | | 7 | | | 6 | | | 7 | |
| Loss due to curtailment | | 12 | | | — | | | — | |
| Net periodic benefit cost | | $ | 1,567 | | | $ | 1,617 | | | $ | 1,574 | |
The Plan and Acquired Plan assets, which consist primarily of marketable equity and debt instruments, are valued using market quotations in active markets for identical assets, market quotations for similar assets in active or non-active markets or the net asset value provided by the plan administrator. The Plans’ obligations and the annual pension expense are determined by independent actuaries and through the use of a number of assumptions. Key assumptions in measuring the Plans’ obligations include the discount rate, the rate of salary increases and the estimated future return on plan assets.
In determining the discount rate, we utilized a cash flow matching analysis to determine a range of appropriate discount rates for the defined benefit pension plans and restoration plan. In developing the cash flow matching analysis, we had our actuaries construct a portfolio of high quality noncallable bonds to match as closely as possible the timing of future benefit payments of the Plans at December 31, 2020. We utilized a bond selection-settlement approach that selects a portfolio of bonds from a universe of high quality corporate bonds rated AA by at least half of the rating agencies available. Based on the results of this cash flow matching analysis, we were able to determine an appropriate discount rate.
Salary increase assumptions were based upon historical experience and anticipated future management actions. As a result of the freeze of future benefit accruals and benefit service, the compensation rate is no longer applicable at December 31, 2020.
The expected long-term rate of return assumption reflects the average return expected based on the investment strategies and asset allocation of the assets invested to provide for the Plans’ liabilities. We considered broad equity and bond indices, long-term return projections and actual long-term historical Plan performance when evaluating the expected long-term rate of return assumption.
The assumptions used to determine the benefit obligation were as follows:
| | | | | | | | | | | | | | | | | | | | | | | | | | | | | | | | | | | | | | |
| | | December 31, 2020 | | December 31, 2019 |
| | | Defined Benefit
Pension
Plan | | Defined
Benefit
Pension
Plan Acquired | | Restoration
Plan | | Defined
Benefit
Pension
Plan | | Defined
Benefit
Pension
Plan Acquired | | Restoration
Plan |
| Discount rate | | 2.65 | % | | 2.65 | % | | 2.65 | % | | 3.41 | % | | 3.41 | % | | 3.41 | % |
| Compensation increase rate | | — | | | — | | | — | | | 3.50 | % | | — | | | 3.50 | % |
The assumptions used to determine net periodic pension cost and postretirement benefit cost were as follows:
| | | | | | | | | | | | | | | | | | | | |
| | Years Ended December 31, |
| | | 2020 | | 2019 | | 2018 |
| Defined Benefit Pension Plan: | | | | | | |
| Discount rate | | 2.78 | % | | 4.32 | % | | 3.71 | % |
| Expected long-term rate of return on plan assets | | 6.50 | % | | 7.25 | % | | 7.25 | % |
| Compensation increase rate | | 3.50 | % | | 3.50 | % | | 3.50 | % |
| Defined Benefit Pension Plan Acquired | | | | | | |
| Discount rate | | 3.41 | % | | 4.32 | % | | 3.71 | % |
| Expected long-term rate of return on plan assets | | 6.50 | % | | 7.25 | % | | 7.25 | % |
| Compensation increase rate | | — | | | — | | | — | |
| Restoration Plan: | | | | | | |
| Discount rate | | 2.78 | % | | 4.32 | % | | 3.71 | % |
| Compensation increase rate | | 3.50 | % | | 3.50 | % | | 3.50 | % |
In connection with the remeasurement of the Plan and the Restoration Plan at June 30, 2020, we updated our discount rate from 3.41% to 2.78%.
During the three months ended June 30, 2020, we updated our expected long-term rate of return on plan assets for the Plan and the Acquired Plan from 7.25% to 6.50%.
Material changes in pension benefit costs may occur in the future due to changes in these assumptions. Future annual amounts could be impacted by changes in the number of Plan participants, changes in the level of benefits provided, changes in the discount rates, changes in the expected long-term rate of return, changes in the level of contributions to the Plan and other factors.
The major categories of assets in the Plan and the Acquired Plan are presented in the following table (in thousands). Assets are segregated by the level of the valuation inputs within the fair value hierarchy established by ASC Topic 820 “Fair Value Measurements and Disclosures,” utilized to measure fair value (see “Note 12 – Fair Value Measurement”). Our Restoration Plan is unfunded.
| | | | | | | | | | | | | | | | | | | | | | | | | | |
| | December 31, 2020 | | December 31, 2019 |
| | Defined
Benefit
Pension
Plan | | Defined
Benefit
Pension
Plan Acquired | | Defined
Benefit
Pension
Plan | | Defined
Benefit
Pension
Plan Acquired |
| Level 1: | | |
| Cash | | $ | 1,593 | | | $ | — | | | $ | 791 | | | $ | — | |
| Equity securities: | | | | | | | | |
U.S. large cap (1) | | 22,455 | | | 1,199 | | | 11,482 | | | 1,548 | |
U.S. mid cap (2) | | 10,165 | | | 136 | | | 11,081 | | | 183 | |
U.S. small cap (3) | | 12,934 | | | 64 | | | 17,846 | | | 87 | |
International developed (4) | | 10,344 | | | — | | | 8,771 | | | — | |
International emerging (2) | | 2,359 | | | — | | | 4,383 | | | — | |
International (5) | | — | | | 708 | | | — | | | 992 | |
| Fixed income securities: | | | | | | | | |
Corporate bonds (6) | | — | | | 1,226 | | | — | | | 1,580 | |
Real estate (8) | | — | | | 280 | | | — | | | 278 | |
Balanced asset allocation (9) | | — | | | — | | | — | | | 95 | |
| Level 2: | | | | | | | | |
| Cash Equivalents | | 16,689 | | | — | | | 16,007 | | | — | |
| | | | | | | | |
| | | | | | | | |
| | | | | | | | |
| | | | | | | | |
| | | | | | | | |
| Fixed income securities: | | | | | | | | |
Corporate bonds (6) | | 1,537 | | | — | | | 965 | | | — | |
U.S. government agencies (6) | | 4,677 | | | — | | | 17,732 | | | — | |
Municipal bonds (6) | | 7,458 | | | — | | | 4,508 | | | — | |
U.S. agency MBS (7) | | 208 | | | — | | | 252 | | | — | |
| | | | | | | | |
| | | | | | | | |
| | | | | | | | |
| | | | | | | | |
| Total fair value of plan assets | | $ | 90,419 | | | $ | 3,613 | | | $ | 93,818 | | | $ | 4,763 | |
(1)For the Plan, this category is comprised of broadly diversified “passive” and “active” mutual funds. The Acquired Plan assets in this category consist of pooled separate accounts invested in mutual funds and domestic stocks.
(2)For the Plan, this category is comprised of broadly diversified “passive” mutual funds. The Acquired Plan assets in this category consist of pooled separate accounts invested in mutual funds and domestic stocks.
(3)For the Plan, this category is comprised of broadly diversified “passive” mutual funds and shares of Southside Bancshares stock. The Acquired Plan assets in this category consist of pooled separate accounts invested in mutual funds and domestic stocks.
(4)This category is comprised of a broadly diversified “passive” and “active” mutual funds.
(5)This category is comprised of pooled separate accounts invested in mutual funds and international stocks.
(6)For the Plan, this category is comprised of individual investment grade securities that are generally HTM. The Acquired Plan assets in this category consist of pooled separate accounts invested in mutual funds, investment grade and below investment grade bonds.
(7)This category is comprised of individual securities that are generally not HTM.
(8)This category is comprised of a pooled separate account invested in commercial real estate and includes mortgage loans which are backed by the associated properties.
(9)This category is comprised of a pooled separate account invested in a single mutual fund invested in a combination of fixed income and equity investment options.
We did not have any plan assets with Level 3 input fair value measurements at December 31, 2020 or 2019.
Our overall investment strategy is to realize long-term growth of the Plan within acceptable risk parameters, while funding benefit payments from dividend and interest income, to the extent possible. The target allocations for plan assets are 55.0% equities, 44.5% fixed income and 0.5% cash equivalents. Equity securities are diversified among U.S. and international (both developed and emerging), large, mid and small caps, value and growth securities and REITs. The investment objective of equity funds is long-term capital appreciation with current income. Fixed income securities include government agencies, CDs, corporate bonds,
municipal bonds and MBS. The investment objective of fixed income funds is to maximize investment return while preserving investment principal. Mutual funds are primarily used for equity and REITs because of the superior diversification they provide.
As of December 31, 2020, expected future benefit payments related to the Plan, the Acquired Plan and the Restoration Plan were as follows (in thousands):
| | | | | | | | | | | | | | | | | |
| | Defined Benefit
Pension Plan | | Defined Benefit
Pension Plan Acquired | | Restoration
Plan |
| 2021 | $ | 3,926 | | | $ | 143 | | | $ | 918 | |
| 2022 | 4,135 | | | 72 | | | 1,074 | |
| 2023 | 4,342 | | | 74 | | | 1,044 | |
| 2024 | 4,491 | | | 78 | | | 1,010 | |
| 2025 | 4,591 | | | 84 | | | 1,045 | |
| 2026 through 2030 | 24,301 | | | 804 | | | 5,792 | |
| | $ | 45,786 | | | $ | 1,255 | | | $ | 10,883 | |
We expect to contribute $918,000 to our Restoration Plan in 2021. We do not expect to make additional contributions to the Plan or the Acquired Plan in 2021.
Share-based Incentive Plans
2017 Incentive Plan
On May 10, 2017, our shareholders approved the 2017 Incentive Plan, which is a stock-based incentive compensation plan. A total of 2,460,000 shares of our common stock were reserved and available for issuance pursuant to awards granted under the 2017 Incentive Plan. This amount includes a number of additional shares (not to exceed 410,000) underlying awards outstanding as of May 10, 2017 under the Company’s 2009 Incentive Plan that thereafter terminate or expire unexercised, or are cancelled, forfeited or lapse for any reason. Under the 2017 Incentive Plan, we are authorized to grant stock options, stock appreciation rights, restricted stock, restricted stock units, performance awards and qualified performance-based awards or any combination thereof to selected employees, officers, directors and consultants of the Company and its affiliates. As of December 31, 2020, there were 1,302,958 shares remaining available for grant for future awards.
All share data has been adjusted to give retroactive recognition to stock dividends, where applicable. Reference to incentive plans refers to the 2017 Incentive Plan and predecessor incentive plans.
As of December 31, 2020, 2019 and 2018, there were 492,274, 737,434 and 612,740 unvested awards outstanding, respectively. For the years ended December 31, 2020, 2019 and 2018, there was $2.8 million, $2.4 million and $2.3 million of share-based compensation expense related to the incentive plans, respectively, and $593,000, $501,000 and $487,000 of income tax benefit related to the stock compensation expense, respectively.
As of December 31, 2020, 2019 and 2018, there was $5.4 million, $7.7 million and $5.8 million of unrecognized compensation cost related to the incentive plans, respectively. The remaining cost at December 31, 2020 is expected to be recognized over a weighted-average period of 2.3 years.
The NQSOs have contractual terms of 10 years and vest in equal annual installments over either a three- or four-year period.
The fair value of each RSU is the ending stock price on the date of grant. The RSUs vest in equal annual installments over a three- or four-year period.
Each award is evidenced by an award agreement that specifies the option price, if applicable, the duration of the award, the number of shares to which the award pertains and such other provisions as the board of directors determines. Historically, shares issued in connection with stock compensation awards have been issued from available authorized shares. Beginning in the second quarter of 2017, shares were issued from available treasury shares.
Shares issued in connection with stock compensation awards along with other related information are presented in the following table without the retroactive recognition of stock dividends (in thousands, except share amounts):
| | | | | | | | | | | | | | | | | |
| Years Ended December 31, |
| 2020 | | 2019 | | 2018 |
| New shares issued from available treasury shares | 116,661 | | | 122,537 | | | 140,692 | |
| Proceeds from stock option exercises | $ | 1,692 | | | $ | 1,986 | | | $ | 2,653 | |
| Intrinsic value of stock options exercised | 881 | | | 1,106 | | | 1,384 | |
The estimated weighted-average grant-date fair value per option and the underlying Black-Scholes option-pricing model assumptions are summarized in the following table for years in which we granted NQSOs pursuant to the incentive plans:
| | | | | | | | | | | | | | | | | | | | |
| | Years Ended December 31, |
| | 2020 | | 2019 | | 2018 |
| Weighted-average grant date fair value per option | | — | | $5.89 | | $6.78 |
| Weighted-average assumptions: | | | | | | |
| Risk-free interest rates | | — | | 1.63% | | 2.81% |
| Expected dividend yield | | — | | 3.50% | | 1.10% |
| Expected volatility factors of the market price of Southside Bancshares common stock | | — | | 25.80% | | 25.41% |
| Expected option life (in years) | | — | | 6.2 | | 6.2 |
A combined summary of activity in our share-based plans as of December 31, 2020 is presented below:
| | | | | | | | | | | | | | | | | | | | | | | | | | | | | | | | |
| | | Restricted Stock Units
Outstanding | | Stock Options
Outstanding |
| | | Number
of Shares | | Weighted-
Average
Grant-Date
Fair
Value | | Number
of Shares | | Weighted-
Average
Exercise
Price | | Weighted-
Average
Grant-Date
Fair
Value |
| Balance, January 1, 2020 | | 143,291 | | | $ | 34.48 | | | 1,109,559 | | | $ | 31.55 | | | $ | 6.38 | |
| Granted | | 38,140 | | | 29.43 | | | — | | | — | | | — | |
| Stock options exercised | | — | | | — | | | (77,003) | | | 21.98 | | | 5.40 | |
| Stock awards vested | | (49,068) | | | 34.38 | | | — | | | — | | | — | |
| Forfeited | | (8,669) | | | 32.38 | | | (21,461) | | | 34.77 | | | 6.38 | |
| Canceled/expired | | — | | | — | | | (9,056) | | | 36.61 | | | 7.88 | |
| Balance, December 31, 2020 | | 123,694 | | | $ | 33.11 | | | 1,002,039 | | | $ | 32.17 | | | $ | 6.44 | |
Other information regarding options outstanding and exercisable as of December 31, 2020 is as follows:
| | | | | | | | | | | | | | | | | | | | | | | | | | | | | | | | | | | | | | |
| | | Options Outstanding | | Options Exercisable |
| Range of Exercise Prices | | Number
of Shares | | Weighted-
Average
Exercise
Price | | Weighted-
Average
Remaining
Contractual
Life in Years | | Number
of Shares | | Weighted-
Average
Exercise
Price |
| $ | 14.67 | | - | $ | 20.00 | | | 55,690 | | | $ | 16.48 | | | 1.41 | | 55,690 | | | $ | 16.48 | |
| 20.01 | | - | 25.00 | | | 58,305 | | | 22.99 | | | 3.08 | | 58,305 | | | 22.99 | |
| 25.01 | | - | 30.00 | | | 142,668 | | | 26.63 | | | 4.52 | | 142,668 | | | 26.63 | |
| 30.01 | | - | 35.00 | | | 615,005 | | | 34.67 | | | 8.11 | | 246,425 | | | 34.62 | |
| 35.01 | | - | 37.28 | | | 130,371 | | | 37.28 | | | 5.63 | | 130,371 | | | 37.28 | |
| Total | | 1,002,039 | | | $ | 32.17 | | | 6.61 | | 633,459 | | | $ | 30.70 | |
The total intrinsic value of outstanding in-the-money stock options and outstanding in-the-money exercisable stock options was $1.9 million for both at December 31, 2020. The weighted-average remaining contractual life of options exercisable at December 31, 2020 was 5.6 years.
11. DERIVATIVE FINANCIAL INSTRUMENTS AND HEDGING ACTIVITIES
Our hedging policy allows the use of interest rate derivative instruments to manage our exposure to interest rate risk or hedge specified assets and liabilities. These instruments may include interest rate swaps and interest rate caps and floors. All derivative instruments are carried on the balance sheet at their estimated fair value and are recorded in other assets or other liabilities, as appropriate.
Derivative instruments may be designated as cash flow hedges of variable rate assets or liabilities, cash flow hedges of forecasted transactions, fair value hedges of a recognized asset or liability or as non-hedging instruments. Gains and losses on derivative instruments designated as cash flow hedges are recorded in AOCI to the extent they are effective. If the hedge is effective, the amount recorded in other comprehensive income is reclassified to earnings in the same periods that the hedged cash flows impact earnings. The ineffective portion of changes in fair value is reported in current earnings. Gains and losses on derivative instruments designated as fair value hedges, as well as the change in fair value on the hedged item, are recorded in interest income in the consolidated statements of income. Gains and losses due to changes in fair value of the interest rate swap agreements completely offset changes in the fair value of the hedged portion of the hedged item. For derivative instruments not designated as hedging instruments, the gain or loss is recognized in current earnings during the period of change.
We have entered into certain interest rate swap contracts on specific variable rate agreements and fixed rate short-term pay agreements with third-party financial institutions. These interest rate swap contracts were designated as hedging instruments in cash flow hedges under ASC Topic 815. The objective of the interest rate swap contracts is to manage the expected future cash flows on $670.0 million of debt. The cash flows from the swap contracts are expected to be effective in hedging the variability in future cash flows attributable to fluctuations in the underlying LIBOR interest rate.
During the first quarter of 2019, our partial-term fair value hedges for certain of our fixed rate callable AFS municipal securities were ineffective due to the sale of the hedged items. These partial-term hedges of selected cash flows covering the time periods to the call dates of the hedged securities were expected to be effective in offsetting changes in the fair value of the hedged securities. Interest rate swaps designated as partial-term fair value hedges are utilized to mitigate the effect of changing interest rates on the hedged securities. The hedging strategy converted a portion of the fixed interest rates on the securities to LIBOR-based variable interest rates. As a result of the sale, the cumulative adjustments to the carrying amount was a fair value loss recognized in earnings and recorded in interest income. The remaining fair value loss from the date of the sale of the hedged items through March 31, 2019, was recognized in earnings and recorded in noninterest income. Due to the sale of the hedged items, the interest rate swaps were considered non-hedging instruments and were subsequently terminated on April 12, 2019.
In accordance with ASC Topic 815, if a hedging item is terminated prior to maturity for a cash settlement, the existing gain or loss within AOCI will continue to be reclassified into earnings during the period or periods in which the hedged forecasted transaction affects earnings unless it is probable the forecasted transaction will not occur by the end of the originally specified time period. These transactions are reevaluated on a monthly basis to determine if the hedged forecasted transactions are still probable of occurring. If at a subsequent evaluation, it is determined that the transactions will not occur, any related gains or losses recorded in AOCI are immediately recognized in earnings.
From time to time, we may enter into certain interest rate swaps, cap and floor contracts that are not designated as hedging instruments. These interest rate derivative contracts relate to transactions in which we enter into an interest rate swap, cap or floor with a customer while concurrently entering into an offsetting interest rate swap, cap or floor with a third-party financial institution. We agree to pay interest to the customer on a notional amount at a variable rate and receive interest from the customer on a similar notional amount at a fixed interest rate. At the same time, we agree to pay a third-party financial institution the same fixed interest rate on the same notional amount and receive the same variable interest rate on the same notional amount. These interest rate derivative contracts allow our customers to effectively convert a variable rate loan to a fixed rate loan. The changes in the fair value of the underlying derivative contracts primarily offset each other and do not significantly impact our results of operations. We recognized swap fee income associated with these derivative contracts immediately based upon the difference in the bid/ask spread of the underlying transactions with the customer and the third-party financial institution. The swap fee income is included in other noninterest income in our consolidated statements of income.
At December 31, 2020 and 2019, net derivative liabilities included $39.3 million and $10.1 million of cash collateral held by counterparties subject to master netting agreements. At December 31, 2019, net derivative liabilities included $883,000 of cash collateral receivable that was not offset against derivative liabilities.
The notional amounts of the derivative instruments represent the contractual cash flows pertaining to the underlying agreements. These amounts are not exchanged and are not reflected in the consolidated balance sheets. The fair value of the interest rate swaps are presented at net in other assets and other liabilities when a right of offset exists, based on transactions with a single counterparty that are subject to a legally enforceable master netting agreement.
The following tables present the notional and estimated fair value amount of derivative positions outstanding (in thousands):
| | | | | | | | | | | | | | | | | | | | | | | | | | | | | | | | | | | | | | |
| | December 31, 2020 | | December 31, 2019 |
| | Estimated Fair Value | | Estimated Fair Value |
| | Notional Amount (1) | | Asset Derivative | | Liability Derivative | | Notional
Amount (1) | | Asset Derivative | | Liability Derivative |
| Derivatives designated as hedging instruments | | | | | | | | | | |
| Interest rate contracts: | | | | | | | | | | | | |
| Swaps-Cash Flow Hedge-Financial institution counterparties | | $ | 670,000 | | | $ | — | | | $ | 21,635 | | | $ | 270,000 | | | $ | 1,513 | | | $ | 3,655 | |
| | | | | | | | | | | | |
| Derivatives designated as non-hedging instruments | | | | | | | | | | |
| Interest rate contracts: | | | | | | | | | | | | |
| Swaps-Financial institution counterparties | | 152,280 | | | — | | | 18,537 | | | 131,685 | | | 56 | | | 8,031 | |
| Swaps-Customer counterparties | | 152,280 | | | 18,537 | | | — | | | 131,685 | | | 8,031 | | | 56 | |
| Gross derivatives | | | | 18,537 | | | 40,172 | | | | | 9,600 | | | 11,742 | |
| Offsetting derivative assets/liabilities | | | | — | | | — | | | | | (1,569) | | | (1,569) | |
| Cash collateral received/posted | | | | — | | | (39,270) | | | | | — | | | (10,117) | |
Net derivatives included in the consolidated balance sheets (2) | | | | $ | 18,537 | | | $ | 902 | | | | | $ | 8,031 | | | $ | 56 | |
(1) Notional amounts, which represent the extent of involvement in the derivatives market, are used to determine the contractual cash flows required in accordance with the terms of the agreement. These amounts are typically not exchanged, significantly exceed amounts subject to credit or market risk and are not reflected in the consolidated balance sheets.
(2) Net derivative assets are included in other assets and net derivative liabilities are included in other liabilities on the consolidated balance sheets. Included in the fair value of net derivative assets and net derivative liabilities are credit valuation adjustments reflecting counterparty credit risk and our credit risk. At December 31, 2020, we had no credit exposure related to interest rate swaps with financial institutions and $18.5 million related to interest rate swaps with customers. At December 31, 2019, our credit exposure related to interest rate swaps with financial institutions and interest rate swaps with customers was $883,000 and $8.0 million, respectively. The credit risk associated with customer transactions is partially mitigated as these are generally secured by the non-cash collateral securing the underlying transaction being hedged.
The summarized expected weighted average remaining maturity of the notional amount of interest rate swaps and the weighted average interest rates associated with the amounts expected to be received or paid on interest rate swap agreements are presented below (dollars in thousands). Variable rates received on fixed pay swaps are based on one-month or three-month LIBOR rates in effect at December 31, 2020 and December 31, 2019:
| | | | | | | | | | | | | | | | | | | | | | | | | | | | | | | | | | | | | | | | | | | | | | | | | | |
| | December 31, 2020 | | December 31, 2019 |
| | | | Weighted Average | | | | Weighted Average |
| | Notional Amount | | Remaining Maturity
(in years) | | Receive Rate | | Pay Rate | | Notional Amount | | Remaining Maturity
(in years) | | Receive Rate | | Pay
Rate |
| Swaps-Cash Flow hedge | | | | | | | | | | | | | | | | |
| Financial institution counterparties | | $ | 670,000 | | | 3.8 | | 0.17 | % | | 1.12 | % | | $ | 270,000 | | | 3.8 | | 1.77 | % | | 1.58 | % |
| | | | | | | | | | | | | | | | |
| | | | | | | | | | | | | | | | |
| Swaps-Non-hedging | | | | | | | | | | | | | | | | |
| Financial institution counterparties | | 152,280 | | | 9.8 | | 0.50 | % | | 2.57 | % | | 131,685 | | | 10.6 | | 1.71 | % | | 2.47 | % |
| Customer counterparties | | 152,280 | | | 9.8 | | 2.57 | % | | 0.50 | % | | 131,685 | | | 10.6 | | 2.47 | % | | 1.71 | % |
12. FAIR VALUE MEASUREMENT
Fair value is the price that would be received upon the sale of an asset or paid to transfer a liability (exit price) in an orderly transaction between market participants. A fair value measurement assumes the transaction to sell the asset or transfer the liability occurs in the principal market for the asset or liability or, in the absence of a principal market, the most advantageous market for the asset or liability. The price in the principal (or most advantageous) market used to measure the fair value of the asset or liability is not adjusted for transaction costs. An orderly transaction is a transaction that assumes exposure to the market for a period prior to the measurement date to allow for marketing activities that are usual and customary for transactions involving such assets and liabilities; it is not a forced transaction. Market participants are buyers and sellers in the principal market that are (i) independent, (ii) knowledgeable, (iii) able to transact and (iv) willing to transact.
Valuation techniques including the market approach, the income approach and/or the cost approach are utilized to determine fair value. Inputs to valuation techniques refer to the assumptions market participants would use in pricing the asset or liability. Valuation policies and procedures are determined by our investment department and reported to our ALCO for review. An entity must consider all aspects of nonperforming risk, including the entity’s own credit standing, when measuring fair value of a liability. Inputs may be observable, meaning those that reflect the assumptions market participants would use in pricing the asset or liability developed based on market data obtained from independent sources, or unobservable, meaning those that reflect the reporting entity’s own assumptions about the assumptions market participants would use in pricing the asset or liability developed based on the best information available in the circumstances. A fair value hierarchy for valuation inputs gives the highest priority to quoted prices in active markets for identical assets or liabilities and the lowest priority to unobservable inputs. The fair value hierarchy is as follows:
Level 1 Inputs - Unadjusted quoted prices in active markets for identical assets or liabilities that the reporting entity has the ability to access at the measurement date.
Level 2 Inputs - Inputs other than quoted prices included in Level 1 that are observable for the asset or liability, either directly or indirectly. These might include quoted prices for similar assets or liabilities in active markets, quoted prices for identical or similar assets or liabilities in markets that are not active, inputs other than quoted prices that are observable for the asset or liability (such as interest rates, volatilities, prepayment speeds, credit risks, etc.) or inputs that are derived principally from or corroborated by market data by correlation or other means.
Level 3 Inputs - Unobservable inputs for determining the fair values of assets or liabilities that reflect an entity’s own assumptions about the assumptions that market participants would use in pricing the assets or liabilities.
Certain financial assets are measured at fair value in accordance with GAAP. Adjustments to the fair value of these assets usually result from the application of fair value accounting or write-downs of individual assets. A description of the valuation methodologies used for assets and liabilities measured at fair value, as well as the general classification of such instruments pursuant to the valuation hierarchy, is set forth below.
Securities AFS and Equity Investments with readily determinable fair values – U.S. Treasury securities and equity investments with readily determinable fair values are reported at fair value utilizing Level 1 inputs. Other securities classified as AFS are reported at fair value utilizing Level 2 inputs. For these securities, we obtain fair value measurements from independent pricing services and obtain an understanding of the pricing methodologies used by these independent pricing services. The fair value measurements consider observable data that may include dealer quotes, market spreads, cash flows, the U.S. Treasury yield curve, live trading levels, trade execution data, market consensus prepayment speeds, credit information and the bond’s terms and conditions, among other things, as stated in the pricing methodologies of the independent pricing services.
We review and validate the prices supplied by the independent pricing services for reasonableness by comparison to prices obtained from, in some cases, two additional third-party sources. For securities where prices are outside a reasonable range, we further review those securities, based on internal ALCO approved procedures, to determine what a reasonable fair value measurement is for those securities, given available data.
Derivatives – Derivatives are reported at fair value utilizing Level 2 inputs. We obtain fair value measurements from two sources including an independent pricing service and the counterparty to the derivatives designated as hedges. The fair value measurements consider observable data that may include dealer quotes, market spreads, the U.S. Treasury yield curve, live trading levels, trade execution data, credit information and the derivatives’ terms and conditions, among other things. We review the prices supplied by the sources for reasonableness. In addition, we obtain a basic understanding of their underlying pricing methodology. We validate prices supplied by the sources by comparison to one another.
Certain nonfinancial assets and nonfinancial liabilities measured at fair value on a recurring basis include reporting units measured at fair value and tested for goodwill impairment.
Certain financial assets and financial liabilities are measured at fair value on a nonrecurring basis, which means that the instruments are not measured at fair value on an ongoing basis but are subject to fair value adjustments in certain circumstances (for example, when there is evidence of impairment). Financial assets and financial liabilities measured at fair value on a nonrecurring basis included foreclosed assets and collateral-dependent loans at December 31, 2020 and 2019.
Foreclosed Assets – Foreclosed assets are initially recorded at fair value less costs to sell. The fair value measurements of foreclosed assets can include Level 2 measurement inputs such as real estate appraisals and comparable real estate sales information, in conjunction with Level 3 measurement inputs such as cash flow projections, qualitative adjustments and sales cost estimates. As a result, the categorization of foreclosed assets is Level 3 of the fair value hierarchy. In connection with the measurement and initial recognition of certain foreclosed assets, we may recognize charge-offs through the allowance for credit losses.
Collateral-Dependent Loans (Impaired loans prior to the adoption of ASU 2016-13) – Certain loans may be reported at the fair value of the underlying collateral if repayment is expected substantially from the operation or sale of the collateral. Collateral values are estimated using Level 3 inputs based on customized discounting criteria or appraisals. At December 31, 2020 and 2019, the impact of the fair value of collateral-dependent loans was reflected in our allowance for loan losses.
The fair value estimate of financial instruments for which quoted market prices are unavailable is dependent upon the assumptions used. Consequently, those estimates cannot be substantiated by comparison to independent markets and, in many cases, could not be realized in immediate settlement of the instruments. Accordingly, the aggregate fair value amounts presented in the fair value tables do not necessarily represent their underlying value.
The following tables summarize assets measured at fair value on a recurring and nonrecurring basis segregated by the level of the valuation inputs within the fair value hierarchy utilized to measure fair value (in thousands):
| | | | | | | | | | | | | | | | | | | | | | | |
| December 31, 2020 |
| | | | Fair Value Measurements at the End of the Reporting Period Using |
| | Carrying
Amount | | Quoted Prices in Active Markets for Identical Assets
(Level 1) | | Significant Other Observable Inputs
(Level 2) | | Significant Unobservable Inputs
(Level 3) |
| Recurring fair value measurements | | | | | | | |
| Investment securities: | | | | | | | |
| | | | | | | |
| | | | | | | |
| State and political subdivisions | $ | 1,580,594 | | | $ | — | | | $ | 1,580,594 | | | $ | — | |
| Other stocks and bonds | 78,255 | | | — | | | 78,255 | | | — | |
| | | | | | | |
MBS: (1) | | | | | | | |
| Residential | 810,010 | | | — | | | 810,010 | | | — | |
| Commercial | 118,446 | | | — | | | 118,446 | | | — | |
| Equity investments: | | | | | | | |
| Equity investments | 6,094 | | | 6,094 | | | — | | | — | |
| Derivative assets: | | | | | | | |
| Interest rate swaps | 18,537 | | | — | | | 18,537 | | | — | |
| Total asset recurring fair value measurements | $ | 2,611,936 | | | $ | 6,094 | | | $ | 2,605,842 | | | $ | — | |
| | | | | | | |
| Derivative liabilities: | | | | | | | |
| Interest rate swaps | $ | 40,172 | | | $ | — | | | $ | 40,172 | | | $ | — | |
| Total liability recurring fair value measurements | $ | 40,172 | | | $ | — | | | $ | 40,172 | | | $ | — | |
| | | | | | | |
| Nonrecurring fair value measurements | | | | | | | |
| Foreclosed assets | $ | 120 | | | $ | — | | | $ | — | | | $ | 120 | |
Collateral-dependent loans (2) | 10,653 | | | — | | | — | | | 10,653 | |
| Total asset nonrecurring fair value measurements | $ | 10,773 | | | $ | — | | | $ | — | | | $ | 10,773 | |
| | | | | | | | | | | | | | | | | | | | | | | |
| December 31, 2019 |
| | | | Fair Value Measurements at the End of the Reporting Period Using |
| | Carrying
Amount | | Quoted Prices in Active Markets for Identical Assets
(Level 1) | | Significant Other Observable Inputs
(Level 2) | | Significant Unobservable Inputs
(Level 3) |
| Recurring fair value measurements | | | | | | | |
| Investment securities: | | | | | | | |
| | | | | | | |
| | | | | | | |
| State and political subdivisions | $ | 802,802 | | | $ | — | | | $ | 802,802 | | | $ | — | |
| Other stocks and bonds | 10,137 | | | — | | | 10,137 | | | — | |
MBS: (1) | | | | | | | |
| Residential | 1,310,642 | | | — | | | 1,310,642 | | | — | |
| Commercial | 235,016 | | | — | | | 235,016 | | | — | |
| Equity investments: | | | | | | | |
| Equity investments | 5,965 | | | 5,965 | | | — | | | — | |
| Derivative assets: | | | | | | | |
| Interest rate swaps | 9,600 | | | — | | | 9,600 | | | — | |
| Total asset recurring fair value measurements | $ | 2,374,162 | | | $ | 5,965 | | | $ | 2,368,197 | | | $ | — | |
| | | | | | | |
| Derivative liabilities: | | | | | | | |
| Interest rate swaps | $ | 11,742 | | | $ | — | | | $ | 11,742 | | | $ | — | |
| Total liability recurring fair value measurements | $ | 11,742 | | | $ | — | | | $ | 11,742 | | | $ | — | |
| | | | | | | |
| Nonrecurring fair value measurements | | | | | | | |
| Foreclosed assets | $ | 472 | | | $ | — | | | $ | — | | | $ | 472 | |
Impaired loans (2) | 18,586 | | | — | | | — | | | 18,586 | |
| Total asset nonrecurring fair value measurements | $ | 19,058 | | | $ | — | | | $ | — | | | $ | 19,058 | |
(1)All MBS are issued and/or guaranteed by U.S. government agencies or U.S. GSEs.
(2)Consists of individually evaluated loans. Loans for which the fair value of the collateral and commercial real estate fair value of the properties is less than cost basis are presented net of allowance. Losses on these loans represent charge-offs which are netted against the allowance for loan losses.
Disclosure of fair value information about financial instruments, whether or not recognized in the balance sheet, is required when it is practicable to estimate that value. In cases where quoted market prices are not available, fair values are based on estimates using present value or other estimation techniques. Those techniques are significantly affected by the assumptions used, including the discount rate and estimates of future cash flows. Such techniques and assumptions, as they apply to individual categories of our financial instruments, are as follows:
Cash and cash equivalents – The carrying amount for cash and cash equivalents is a reasonable estimate of those assets’ fair value.
Investment and MBS HTM – Fair values for these securities are based on quoted market prices, where available. If quoted market prices are not available, fair values are based on quoted market prices for similar securities or estimates from independent pricing services.
FHLB stock – The carrying amount of FHLB stock is a reasonable estimate of the fair value of those assets.
Equity investments – The carrying value of equity investments without readily determinable fair values are measured at cost less impairment, if any, adjusted for observable price changes for an identical or similar investment of the same issuer. This carrying value is a reasonable estimate of the fair value of those assets.
Loans receivable – We estimate the fair value of our loan portfolio to an exit price notion with adjustments for liquidity, credit and prepayment factors. Nonperforming loans continue to be estimated using discounted cash flow analyses or the underlying value of the collateral where applicable.
Loans held for sale – The fair value of loans held for sale is determined based on expected proceeds, which are based on sales contracts and commitments.
Deposit liabilities – The fair value of demand deposits, savings accounts and certain money market deposits is the amount on demand at the reporting date, which is the carrying value. Fair values for fixed rate CDs are estimated using a discounted cash flow calculation that applies interest rates currently being offered for deposits of similar remaining maturities.
Other borrowings – Federal funds purchased generally have original terms to maturity of one day and repurchase agreements generally have terms of less than one year, and therefore both are considered short-term borrowings. Consequently, their carrying value is a reasonable estimate of fair value.
FHLB borrowings – The fair value of these borrowings is estimated by discounting the future cash flows using rates at which borrowings would be made to borrowers with similar credit ratings and for the same remaining maturities.
Subordinated notes – The fair value of the subordinated notes is estimated by discounting future cash flows using estimated rates at which long-term debt would be made to borrowers with similar credit ratings and for the remaining maturities.
Trust preferred subordinated debentures – The fair value of the long-term debt is estimated by discounting future cash flows using estimated rates at which long-term debt would be made to borrowers with similar credit ratings and for the remaining maturities.
The following tables present our financial assets and financial liabilities measured on a nonrecurring basis at both their respective carrying amounts and estimated fair value (in thousands):
| | | | | | | | | | | | | | | | | | | | | | | | | | | | | |
| | | | Estimated Fair Value |
| December 31, 2020 | Carrying
Amount | | Total | | Level 1 | | Level 2 | | Level 3 |
| Financial Assets: | | | | | | | | | |
| Cash and cash equivalents | $ | 108,408 | | | $ | 108,408 | | | $ | 108,408 | | | $ | — | | | $ | — | |
| Investment securities: | | | | | | | | | |
| HTM, at carrying value | 907 | | | 920 | | | — | | | 920 | | | — | |
| MBS: | | | | | | | | | |
| HTM, at carrying value | 108,091 | | | 117,278 | | | — | | | 117,278 | | | — | |
| FHLB stock, at cost | 25,259 | | | 25,259 | | | — | | | 25,259 | | | — | |
| Equity investments | 5,811 | | | 5,811 | | | — | | | 5,811 | | | — | |
| Loans, net of allowance for loan losses | 3,608,773 | | | 3,784,291 | | | — | | | — | | | 3,784,291 | |
| Loans held for sale | 3,695 | | | 3,695 | | | — | | | 3,695 | | | — | |
| Financial Liabilities: | | | | | | | | | |
| Deposits | $ | 4,932,322 | | | $ | 4,936,188 | | | $ | — | | | $ | 4,936,188 | | | $ | — | |
| Other borrowings | 23,172 | | | 23,172 | | | — | | | 23,172 | | | — | |
| FHLB borrowings | 832,527 | | | 854,865 | | | — | | | 854,865 | | | — | |
| Subordinated notes, net of unamortized debt issuance costs | 197,251 | | | 198,391 | | | — | | | 198,391 | | | — | |
| Trust preferred subordinated debentures, net of unamortized debt issuance costs | 60,255 | | | 51,993 | | | — | | | 51,993 | | | — | |
| | | | | | | | | | | | | | | | | | | | | | | | | | | | | |
| | | | Estimated Fair Value |
| December 31, 2019 | Carrying
Amount | | Total | | Level 1 | | Level 2 | | Level 3 |
| Financial assets: | | | | | | | | | |
| Cash and cash equivalents | $ | 110,697 | | | $ | 110,697 | | | $ | 110,697 | | | $ | — | | | $ | — | |
| Investment securities: | | | | | | | | | |
| HTM, at carrying value | 2,888 | | | 2,918 | | | — | | | 2,918 | | | — | |
| MBS: | | | | | | | | | |
| HTM, at carrying value | 131,975 | | | 135,961 | | | — | | | 135,961 | | | — | |
| FHLB stock, at cost | 50,087 | | | 50,087 | | | — | | | 50,087 | | | — | |
| Equity investments | 6,366 | | | 6,366 | | | — | | | 6,366 | | | — | |
| Loans, net of allowance for loan losses | 3,543,407 | | | 3,610,591 | | | — | | | — | | | 3,610,591 | |
| Loans held for sale | 383 | | | 383 | | | — | | | 383 | | | — | |
| Financial liabilities: | | | | | | | | | |
| Deposits | $ | 4,702,769 | | | $ | 4,703,914 | | | $ | — | | | $ | 4,703,914 | | | $ | — | |
| Other borrowings | 28,358 | | | 28,358 | | | — | | | 28,358 | | | — | |
| FHLB borrowings | 972,744 | | | 975,606 | | | — | | | 975,606 | | | — | |
| Subordinated notes, net of unamortized debt issuance costs | 98,576 | | | 98,346 | | | — | | | 98,346 | | | — | |
| Trust preferred subordinated debentures, net of unamortized debt issuance costs | 60,250 | | | 55,937 | | | — | | | 55,937 | | | — | |
13. SHAREHOLDERS’ EQUITY
Cash dividends declared and paid were $1.30, $1.26 and $1.20 per share for the years ended December 31, 2020, 2019 and 2018, respectively. Future dividends will depend on our earnings, financial condition and other factors which the board of directors considers to be relevant. Our dividend policy requires that any cash dividend payments made may not exceed consolidated earnings for that year.
We are subject to various regulatory capital requirements administered by the federal banking agencies. Failure to meet minimum capital requirements can initiate certain mandatory and possibly additional discretionary actions by regulators that, if undertaken, could have a direct material effect on our financial statements. Under capital adequacy guidelines and the regulatory framework for prompt corrective action, we must meet specific capital guidelines that involve quantitative measures of our assets, liabilities and certain off-balance-sheet items as calculated under regulatory accounting practices. Our capital amounts and classification are also subject to qualitative judgments by the regulators regarding components, risk weightings and other factors.
Quantitative measures established by regulation to ensure capital adequacy require us to maintain minimum amounts and ratios (set forth in the table below) of Common Equity Tier 1, Tier 1 and Total Capital (as defined in the regulations) to risk-weighted assets (as defined) and of Tier 1 Capital (as defined) to average assets (as defined). At December 31, 2020, we exceeded all regulatory minimum capital requirements.
As of December 31, 2020, the most recent notification from the FDIC categorized us as well capitalized under the regulatory framework for prompt corrective action. To be categorized as well capitalized we must maintain minimum Common Equity Tier 1 risk-based, Tier 1 risk-based, Total risk-based and Tier 1 leverage ratios as set forth in the following table (dollars in thousands). There are no conditions or events since that notification that management believes have changed our category.
| | | | | | | | | | | | | | | | | | | | | | | | | | | | | | | | | | | | | | |
| | | Actual | | For Capital
Adequacy Purposes | | To Be Well Capitalized
Under Prompt
Corrective Action
Provisions |
| | | Amount | | Ratio | | Amount | | Ratio | | Amount | | Ratio |
| December 31, 2020 | | |
| Common Equity Tier 1 (to Risk Weighted Assets) | | | | | | | | | | | | |
| Consolidated | | $ | 612,703 | | | 14.68 | % | | $ | 187,814 | | | 4.50 | % | | N/A | | N/A |
| Bank Only | | $ | 768,200 | | | 18.41 | % | | $ | 187,801 | | | 4.50 | % | | $ | 271,268 | | | 6.50 | % |
| Tier 1 Capital (to Risk Weighted Assets) | | | | | | | | | | | | |
| Consolidated | | $ | 671,147 | | | 16.08 | % | | $ | 250,418 | | | 6.00 | % | | N/A | | N/A |
| Bank Only | | $ | 768,200 | | | 18.41 | % | | $ | 250,402 | | | 6.00 | % | | $ | 333,869 | | | 8.00 | % |
| Total Capital (to Risk Weighted Assets) | | | | | | | | | | | | |
| Consolidated | | $ | 908,873 | | | 21.78 | % | | $ | 333,891 | | | 8.00 | % | | N/A | | N/A |
| Bank Only | | $ | 808,675 | | | 19.38 | % | | $ | 333,869 | | | 8.00 | % | | $ | 417,336 | | | 10.00 | % |
Tier 1 Capital (to Average Assets) (1) | | | | | | | | | | | | |
| Consolidated | | $ | 671,147 | | | 9.81 | % | | $ | 273,558 | | | 4.00 | % | | N/A | | N/A |
| Bank Only | | $ | 768,200 | | | 11.24 | % | | $ | 273,432 | | | 4.00 | % | | $ | 341,790 | | | 5.00 | % |
| December 31, 2019 | | | | | | | | | | | | |
| Common Equity Tier 1 (to Risk Weighted Assets) | | | | | | | | | | | | |
| Consolidated | | $ | 591,026 | | | 14.07 | % | | $ | 189,055 | | | 4.50 | % | | N/A | | N/A |
| Bank Only | | $ | 738,311 | | | 17.58 | % | | $ | 188,992 | | | 4.50 | % | | $ | 272,989 | | | 6.50 | % |
| Tier 1 Capital (to Risk Weighted Assets) | | | | | | | | | | | | |
| Consolidated | | $ | 649,465 | | | 15.46 | % | | $ | 252,073 | | | 6.00 | % | | N/A | | N/A |
| Bank Only | | $ | 738,311 | | | 17.58 | % | | $ | 251,989 | | | 6.00 | % | | $ | 335,986 | | | 8.00 | % |
| Total Capital (to Risk Weighted Assets) | | | | | | | | | | | | |
| Consolidated | | $ | 774,293 | | | 18.43 | % | | $ | 336,098 | | | 8.00 | % | | N/A | | N/A |
| Bank Only | | $ | 764,563 | | | 18.20 | % | | $ | 335,986 | | | 8.00 | % | | $ | 419,982 | | | 10.00 | % |
Tier 1 Capital (to Average Assets) (1) | | | | | | | | | | | | |
| Consolidated | | $ | 649,465 | | | 10.18 | % | | $ | 255,304 | | | 4.00 | % | | N/A | | N/A |
| Bank Only | | $ | 738,311 | | | 11.57 | % | | $ | 255,204 | | | 4.00 | % | | $ | 319,004 | | | 5.00 | % |
(1) Refers to quarterly average assets as calculated in accordance with policies established by bank regulatory agencies.
Our payment of dividends is limited under regulation. The amount that can be paid in any calendar year without prior approval of our regulatory agencies cannot exceed the lesser of net profits (as defined) for that year plus the net profits for the preceding two calendar years or retained earnings.
14. DIVIDEND REINVESTMENT AND COMMON STOCK REPURCHASE PLAN
We have in effect a DRIP which allows enrolled shareholders to reinvest dividends paid to them by the Company into new shares of our stock. The DRIP is funded by stock authorized but not yet issued. For the year ended December 31, 2020, 47,157 shares were issued under this plan at an average price of $30.21 per share, reflective of other trades at the time of each sale. For the year ended December 31, 2019, 42,438 shares were issued under this plan at an average price of $34.04 per share, reflective of other trades at the time of each sale.
We repurchased 1,035,901 shares of our common stock at a cost of $31.0 million during the year ended December 31, 2020, 66,467 shares of common stock at a cost of $2.2 million during the year ended December 31, 2019, and 1,459,148 shares of common stock at a cost of $47.2 million during the year ended December 31, 2018. Repurchased shares are designated as treasury shares and are available for general corporate purposes, which may include possible use in connection with our share-based incentive plans and other distributions. Our board of directors continually evaluates the Company's capital needs and those of the Bank and may, at its discretion, initiate, modify or discontinue an authorized repurchase plan without notice.
15. INCOME TAXES
The income tax expense included in the accompanying consolidated statements of income consists of the following (in thousands):
| | | | | | | | | | | | | | | | | | | | |
| | | Years Ended December 31, |
| | | 2020 | | 2019 | | 2018 |
| Current income tax expense | | $ | 15,766 | | | $ | 13,099 | | | $ | 4,009 | |
| Deferred income tax (benefit) expense | | (4,430) | | | 122 | | | 6,154 | |
| Income tax expense | | $ | 11,336 | | | $ | 13,221 | | | $ | 10,163 | |
The components of the net deferred tax liability as of December 31, 2020 and 2019 are summarized below (in thousands):
| | | | | | | | | | | | | | |
| | | Assets | | Liabilities |
| Allowance for loan losses | | $ | 10,291 | | | $ |
| Retirement and other benefit plans | | | | 1,582 | |
| Premises and equipment | | | | 9,057 | |
| Operating lease liabilities | | 3,514 | | | |
| Operating lease ROU assets | | | | 3,163 | |
| Core deposit intangible | | | | 1,385 | |
| Unrealized gains on securities AFS | | | | 30,940 | |
| Effective hedging derivatives | | 4,543 | | | |
| Fair value adjustment on loans | | 1,037 | | | |
| | | | |
| Unfunded status of defined benefit plan | | 7,950 | | | |
| State business tax credit | | 362 | | | |
| Stock-based compensation | | 1,105 | | | |
| Other | | 1,776 | | | |
| Gross deferred tax assets/liabilities | | 30,578 | | | 46,127 | |
| Net deferred tax liability at December 31, 2020 | | | | $ | 15,549 | |
| | | | |
| Allowance for loan losses | | $ | 5,207 | | | $ |
| Retirement and other benefit plans | | | | 2,179 | |
| Premises and equipment | | | | 6,842 | |
| Operating lease liabilities | | 2,137 | | | |
| Operating lease ROU assets | | | | 2,049 | |
| Core deposit intangible | | | | 1,990 | |
| Unrealized gains on securities AFS | | | | 10,278 | |
| Effective hedging derivatives | | 445 | | | |
| Fair value adjustment on loans | | 1,478 | | | |
| | | | |
| Unfunded status of defined benefit plan | | 8,540 | | | |
| State business tax credit | | 423 | | | |
| Stock-based compensation | | 914 | | | |
| Other | | | | 629 | |
| Gross deferred tax assets/liabilities | | 19,144 | | | 23,967 | |
| Net deferred tax liability at December 31, 2019 | | | | $ | 4,823 | |
A reconciliation of tax at statutory rates and total tax expense is as follows (dollars in thousands):
| | | | | | | | | | | | | | | | | | | | | | | | | | | | | | | | | | | | | | |
| | | Years Ended December 31, |
| | | 2020 | | 2019 | | 2018 |
| | | Amount | | Percent of Pre-Tax Income | | Amount | | Percent of Pre-Tax Income | | Amount | | Percent of Pre-Tax Income |
| Statutory tax expense | | $ | 19,633 | | | 21.0 | % | | $ | 18,433 | | | 21.0 | % | | $ | 17,703 | | | 21.0 | % |
| Increase (decrease) in taxes from: | | | | | | | | | | | | |
| Tax rate changes | | — | | | — | | | — | | | — | | | (767) | | | (0.9) | % |
| Tax exempt interest | | (8,137) | | | (8.7) | % | | (4,875) | | | (5.5) | % | | (6,257) | | | (7.4) | % |
| BOLI | | (536) | | | (0.6) | % | | (484) | | | (0.5) | % | | (613) | | | (0.7) | % |
| Share-based compensation | | (70) | | | (0.1) | % | | (167) | | | (0.2) | % | | (191) | | | (0.2) | % |
| State business tax | | 329 | | | 0.4 | % | | 217 | | | 0.2 | % | | 297 | | | 0.3 | % |
| Other, net | | 117 | | | 0.1 | % | | 97 | | | 0.1 | % | | (9) | | | — | |
| Income tax expense | | $ | 11,336 | | | 12.1 | % | | $ | 13,221 | | | 15.1 | % | | $ | 10,163 | | | 12.1 | % |
We file income tax returns in the U.S. federal jurisdiction and in certain states. We are no longer subject to U.S. federal income tax examinations by tax authorities for years before 2017 or Texas state tax examinations by tax authorities for years before 2016. No valuation allowance was recorded at December 31, 2020 or 2019 as management believes it is more likely than not that all of the deferred tax asset items will be realized in future years. Unrecognized tax benefits were not material at December 31, 2020 or 2019.
16. LEASES
We lease certain retail- and full-service branch locations, ATM locations, certain equipment and a loan production office. Short-term leases, leases with an initial term of 12 months or less and do not contain a purchase option that is likely to be exercised, are not recorded on the balance sheet. Operating lease cost, which is comprised of the amortization of the ROU asset and the implicit interest accreted on the operating lease liability, is recognized on a straight-line basis over the lease term and is included in net occupancy expense on our consolidated statements of income. We evaluate the lease term by assuming the exercise of options to extend that are reasonably assured and those option periods covered by an option to terminate the lease, if deemed not reasonably certain to be exercised. The lease term is used to determine the straight-line expense and limits the depreciable life of any related leasehold improvements. Certain leases require us to pay real estate taxes, insurance, maintenance and other operating expenses associated with the leased premises. These expenses are classified in net occupancy expense on our consolidated statements of income, consistent with similar costs for owned locations, but is not included in operating lease cost below.
Our leases have remaining lease terms ranging from three months to 19.7 years, some of which include options to extend for up to 10 years, and some of which include options to terminate within 90 days. We calculate the lease liability using a discount rate that represents our incremental borrowing rate at the lease commencement date.
Balance sheet information related to leases was as follows (in thousands):
| | | | | | | | | | | | | | | | |
| | | December 31, 2020 | | December 31, 2019 | | |
| Operating leases: | | | | | | |
| Operating lease ROU assets | | $ | 15,063 | | | $ | 9,755 | | | |
| Operating lease liabilities | | $ | 16,734 | | | $ | 10,174 | | | |
The components of lease cost were as follows (in thousands):
| | | | | | | | | | | | | | | | | | | | | | |
| | Years Ended December 31, | | |
| | 2020 | | 2019 | | 2018 | | |
Operating lease cost (1) | | $ | 2,193 | | | $ | 1,595 | | | $ | 1,764 | | | |
| | | | | | | | |
| | | | | | | | |
(1)Operating lease cost for the year ended December 31, 2018 was prior to the adoption of ASU 2016-02, and was therefore in accordance with ASC Topic 840.
Supplemental cash flow information related to leases was as follows (in thousands):
| | | | | | | | | | | | | | |
| | | Years Ended December 31, |
| | 2020 | | 2019 |
| Cash paid for amounts included in the measurement of the lease liabilities: | | | | |
| Operating cash flows for operating leases | | $ | 1,479 | | | $ | 1,465 | |
ROU assets obtained in exchange for new operating lease liabilities (1) | | $ | 7,912 | | | $ | 1,205 | |
(1)Primarily due to one lease that commenced in May 2020 with an initial ROU asset of $6.6 million.
Additional information related to leases was as follows:
| | | | | | | | | | | | | |
| | December 31, 2020 | | December 31, 2019 | | |
| Weighted average remaining lease term (in years) | 15.8 | | 12.2 | | |
| Weighted average discount rate | 3.01 | % | | 3.82 | % | | |
Future minimum rental commitments due under non-cancelable operating leases at December 31, 2020 were as follows (in thousands):
| | | | | |
| Year ending December 31, | |
| 2021 | $ | 1,831 | |
| 2022 | 1,518 | |
| 2023 | 1,379 | |
| 2024 | 1,225 | |
| 2025 | 1,220 | |
| 2026 and thereafter | 14,037 | |
Total lease payments (1) | 21,210 | |
| Less: Interest | (4,476) | |
| Present value of lease liabilities | $ | 16,734 | |
(1)Excludes $1.4 million of lease payments for a lease executed but not yet commenced. Lease will commence in 2021 with a lease term of 13.0 years.
We also lease certain of our owned facilities or portions thereof to third parties. Our primary leased facility is a 202,000 square-foot office building in Fort Worth, Texas that is used for a branch location and certain bank operations. We occupy approximately 39,000 square feet of the building and lease the remaining space to various tenants. Some of these leases contain options to extend and options to terminate at the discretion of the tenant.
Operating lease income received from tenants who rent our properties is reported as a reduction to occupancy expense on our consolidated statements of income. The underlying assets associated with these operating leases are included in premises and equipment on our consolidated balance sheets.
Gross rental income from these leases were as follows (in thousands):
| | | | | | | | | | | | | | | | | | | | |
| | | Years Ended December 31, |
| | 2020 | | 2019 | | 2018 |
| Gross rental income | | $ | 3,277 | | | $ | 2,991 | | | $ | 2,987 | |
At December 31, 2020, non-cancelable operating leases with future minimum lease payments are as follows (in thousands):
| | | | | |
| Year ending December 31, | |
| 2021 | $ | 3,021 | |
| 2022 | 2,064 | |
| 2023 | 1,718 | |
| 2024 | 1,415 | |
| 2025 | 1,148 | |
| 2026 and thereafter | 1,741 | |
| Total lease payments | $ | 11,107 | |
17. OFF-BALANCE-SHEET ARRANGEMENTS, COMMITMENTS AND CONTINGENCIES
Financial Instruments with Off-Balance-Sheet Risk. In the normal course of business, we are a party to certain financial instruments with off-balance-sheet risk to meet the financing needs of our customers. These off-balance-sheet instruments include commitments to extend credit and standby letters of credit. These instruments involve, to varying degrees, elements of credit and interest rate risk in excess of the amount reflected in the financial statements. The contract or notional amounts of these instruments reflect the extent of involvement and exposure to credit loss that we have in these particular classes of financial instruments. The allowance for credit losses on these off-balance-sheet credit exposures is calculated using the same methodology as loans including a conversion or usage factor to anticipate ultimate exposure and expected losses and is included in other liabilities on our consolidated balance sheets.
Allowance for off-balance-sheet credit exposures were as follows (in thousands):
| | | | | | | | | | | | | | | | | |
| Years Ended December 31, |
| 2020 | | 2019 | | 2018 |
| | | | | |
| Balance at beginning of period | $ | 1,455 | | | $ | 1,890 | | | $ | 1,971 | |
Impact of CECL adoption | 4,840 | | | — | | | — | |
| Provision for (reversal of) off-balance-sheet credit exposures | 91 | | | (435) | | | (81) | |
| Balance at end of period | $ | 6,386 | | | $ | 1,455 | | | $ | 1,890 | |
Contractual commitments to extend credit are agreements to lend to a customer provided the terms established in the contract are met. Commitments to extend credit generally have fixed expiration dates and may require the payment of fees. Since some commitments are expected to expire without being drawn upon, the total commitment amounts do not necessarily represent future cash requirements. Standby letters of credit are conditional commitments issued to guarantee the performance of a customer to a third party. These guarantees are primarily issued to support public and private borrowing arrangements. The credit risk involved in issuing letters of credit is essentially the same as that involved in commitments to extend credit and similarly do not necessarily represent future cash obligations.
Financial instruments with off-balance-sheet risk were as follows (in thousands):
| | | | | | | | | | | |
| | December 31, 2020 | | December 31, 2019 |
| | | |
| Commitments to extend credit | $ | 793,138 | | | $ | 925,671 | |
| Standby letters of credit | 13,658 | | | 17,211 | |
| Total | $ | 806,796 | | | $ | 942,882 | |
We apply the same credit policies in making commitments to extend credit and standby letters of credit as we do for on-balance-sheet instruments. We evaluate each customer’s creditworthiness on a case-by-case basis. The amount of collateral obtained, if deemed necessary, upon extension of credit is based on management’s credit evaluation of the borrower. Collateral held varies but may include cash or cash equivalents, negotiable instruments, real estate, accounts receivable, inventory, oil, gas and mineral interests, property, plant and equipment.
Securities. In the normal course of business we buy and sell securities. At December 31, 2020, there were no unsettled trades to purchase securities and no unsettled trades to sell securities. At December 31, 2019, there were $17.5 million unsettled trades to purchase securities and no unsettled trades to sell securities.
Deposits. There were no unsettled issuances of brokered CDs at December 31, 2020. There were $20.0 million of unsettled issuances of brokered CDs at December 31, 2019.
Litigation. We are involved with various litigation in the normal course of business. Management, after consulting with our legal counsel, believes that any liability resulting from litigation will not have a material effect on our financial position, results of operations or liquidity.
18. SIGNIFICANT GROUP CONCENTRATIONS OF CREDIT RISK
Although we have a diversified loan portfolio, a significant portion of our loans are collateralized by real estate. Repayment of these loans is in part dependent upon the economic conditions in the market area. Our market areas primarily include East and Southeast Texas, as well as the greater Fort Worth, Austin and Houston, Texas areas. Part of the risk associated with real estate loans has been mitigated since 27.7% of this group represents loans collateralized by residential dwellings that are primarily owner occupied. Losses on this type of loan have historically been less than those on speculative properties. Many of the remaining real estate loans are collateralized primarily with non-owner occupied commercial real estate.
The MBS we hold consist exclusively of U.S. agency securities which are either directly or indirectly backed by the full faith and credit of the U.S. Government or guaranteed by GSEs. The GNMA MBS are backed by the full faith and credit of the U.S. Government. The Fannie Mae and Freddie Mac U.S. agency GSE guaranteed MBS are not backed by the full faith and credit of the U.S. government.
19. PARENT COMPANY FINANCIAL INFORMATION
Condensed financial information for Southside Bancshares, Inc. (parent company only) was as follows (in thousands, except share amounts):
| | | | | | | | | | | | | | |
| CONDENSED BALANCE SHEETS | | December 31, |
| | | 2020 | | 2019 |
| ASSETS | | | | |
| Cash and due from banks | | $ | 100,016 | | | $ | 10,152 | |
| Investment in bank subsidiaries at equity in underlying net assets | | 1,028,609 | | | 949,680 | |
| Investment in nonbank subsidiaries at equity in underlying net assets | | 1,826 | | | 1,826 | |
| Other assets | | 4,732 | | | 4,186 | |
| Total assets | | $ | 1,135,183 | | | $ | 965,844 | |
| LIABILITIES AND SHAREHOLDERS’ EQUITY | | | | |
| Subordinated notes, net of unamortized debt issuance costs | | $ | 197,251 | | | $ | 98,576 | |
| Trust preferred subordinated debentures, net of unamortized debt issuance costs | | 60,255 | | | 60,250 | |
| Other liabilities | | 2,380 | | | 2,438 | |
| Total liabilities | | 259,886 | | | 161,264 | |
| Shareholders’ equity: | | | | |
Common stock: ($1.25 par value, 80,000,000 shares authorized, 37,934,819 shares issued at December 31, 2020 and 37,887,662 shares issued at December 31, 2019) | | 47,419 | | | 47,360 | |
| Paid-in capital | | 771,511 | | | 766,718 | |
| Retained earnings | | 111,208 | | | 80,274 | |
Treasury stock: (shares at cost, 4,983,645 at December 31, 2020 and 4,064,405 at December 31, 2019) | | (123,921) | | | (94,008) | |
| AOCI | | 69,080 | | | 4,236 | |
| Total shareholders’ equity | | 875,297 | | | 804,580 | |
| Total liabilities and shareholders’ equity | | $ | 1,135,183 | | | $ | 965,844 | |
CONDENSED STATEMENTS OF INCOME
| | | | | | | | | | | | | | | | | | | | |
| | | Years Ended December 31, |
| | | 2020 | | 2019 | | 2018 |
| Income | | |
| Dividends from subsidiary | | $ | 72,000 | | | $ | 50,000 | | | $ | 90,000 | |
| Interest income | | 55 | | | 83 | | | 78 | |
| Total income | | 72,055 | | | 50,083 | | | 90,078 | |
| Expense | | | | | | |
| Interest expense | | 8,129 | | | 8,436 | | | 8,269 | |
| Other | | 3,240 | | | 2,927 | | | 3,662 | |
| Total expense | | 11,369 | | | 11,363 | | | 11,931 | |
| Income before income tax expense | | 60,686 | | | 38,720 | | | 78,147 | |
| Income tax benefit | | 2,375 | | | 2,368 | | | 2,489 | |
| Income before equity in undistributed earnings of subsidiaries | | 63,061 | | | 41,088 | | | 80,636 | |
| Equity in undistributed earnings of subsidiaries | | 19,092 | | | 33,466 | | | (6,498) | |
| Net income | | $ | 82,153 | | | $ | 74,554 | | | $ | 74,138 | |
CONDENSED STATEMENTS OF CASH FLOWS
| | | | | | | | | | | | | | | | | | | | |
| | | Years Ended December 31, |
| | | 2020 | | 2019 | | 2018 |
| | | |
| OPERATING ACTIVITIES: | | | | | | |
| Net Income | | $ | 82,153 | | | $ | 74,554 | | | $ | 74,138 | |
| Adjustments to reconcile net income to net cash provided by operations: | | | | | | |
| Amortization | | 202 | | | 173 | | | 164 | |
| Stock compensation expense | | 197 | | | — | | | — | |
| Equity in undistributed earnings of subsidiaries | | (19,092) | | | (33,466) | | | 6,498 | |
| Net change in other assets | | (546) | | | 104 | | | 6,060 | |
| Net change in other liabilities | | (58) | | | (979) | | | 1,377 | |
| Net cash provided by operating activities | | 62,856 | | | 40,386 | | | 88,237 | |
| INVESTING ACTIVITIES: | | | | | | |
| | | | | | |
| | | | | | |
| Net cash used in investing activities | | — | | | — | | | — | |
| FINANCING ACTIVITIES: | | | | | | |
| Net proceeds from issuance of subordinated long-term debt | | 98,478 | | | — | | | — | |
| Purchase of common stock | | (30,989) | | | (2,181) | | | (47,193) | |
| Proceeds from issuance of common stock | | 2,723 | | | 3,037 | | | 3,883 | |
| Cash dividends paid | | (43,204) | | | (42,521) | | | (41,979) | |
| | | | | | |
| Net cash provided by (used) in financing activities | | 27,008 | | | (41,665) | | | (85,289) | |
| | | | | | |
| Net increase (decrease) in cash and cash equivalents | | 89,864 | | | (1,279) | | | 2,948 | |
| Cash and cash equivalents at beginning of period | | 10,152 | | | 11,431 | | | 8,483 | |
| Cash and cash equivalents at end of period | | $ | 100,016 | | | $ | 10,152 | | | $ | 11,431 | |
20. QUARTERLY FINANCIAL INFORMATION OF REGISTRANT
(UNAUDITED)
The following tables set forth unaudited consolidated selected quarterly statements of income data for the years ended December 31, 2020 and 2019 (in thousands, except share amounts):
| | | | | | | | | | | | | | | | | | | | | | | | | | |
| | | 2020 |
| | | Fourth
Quarter | | Third
Quarter | | Second
Quarter | | First
Quarter |
| Summary Income Statement Information: | | | | | | | | |
| Interest income | | $ | 56,904 | | | $ | 55,677 | | | $ | 58,495 | | | $ | 60,752 | |
| Interest expense | | 8,197 | | | 9,091 | | | 11,224 | | | 16,051 | |
| Net interest income | | 48,707 | | | 46,586 | | | 47,271 | | | 44,701 | |
Provision for credit losses (1) | | (5,545) | | | (4,746) | | | 5,245 | | | 25,247 | |
| Net interest income after provision for credit losses | | 54,252 | | | 51,332 | | | 42,026 | | | 19,454 | |
| Noninterest income excluding net gain (loss) on sale of securities | | 10,924 | | | 11,063 | | | 9,531 | | | 9,957 | |
| Net (loss) gain on sale of securities AFS | | (24) | | | 78 | | | 2,662 | | | 5,541 | |
| Noninterest expense | | 31,315 | | | 31,616 | | | 29,856 | | | 30,520 | |
| Income before income tax expense | | 33,837 | | | 30,857 | | | 24,363 | | | 4,432 | |
| Income tax expense | | 4,265 | | | 3,783 | | | 2,809 | | | 479 | |
| Net income | | $ | 29,572 | | | $ | 27,074 | | | $ | 21,554 | | | $ | 3,953 | |
| Per Share Data: | | | | | | | | |
| Earnings per common share – basic | | $ | 0.89 | | | $ | 0.82 | | | $ | 0.65 | | | $ | 0.12 | |
| Earnings per common share – diluted | | $ | 0.89 | | | $ | 0.82 | | | $ | 0.65 | | | $ | 0.12 | |
| Cash dividends paid per common share | | $ | 0.37 | | | $ | 0.31 | | | $ | 0.31 | | | $ | 0.31 | |
| Book value per common share | | $ | 26.56 | | | $ | 25.37 | | | $ | 24.75 | | | $ | 24.11 | |
| | | | | | | | | | | | | | | | | | | | | | | | | | |
| | | | | | | | |
| | | 2019 |
| | | Fourth
Quarter | | Third
Quarter | | Second
Quarter | | First
Quarter |
| Summary Income Statement Information: | | | | | | | | |
| Interest income | | $ | 60,533 | | | $ | 60,555 | | | $ | 60,672 | | | $ | 59,027 | |
| Interest expense | | 17,357 | | | 18,182 | | | 17,541 | | | 17,902 | |
| Net interest income | | 43,176 | | | 42,373 | | | 43,131 | | | 41,125 | |
Provision for credit losses (1) | | 2,508 | | | 1,005 | | | 2,506 | | | (918) | |
| Net interest income after provision for credit losses | | 40,668 | | | 41,368 | | | 40,625 | | | 42,043 | |
| Noninterest income excluding net gain (loss) on sale of securities | | 10,423 | | | 11,069 | | | 10,838 | | | 9,282 | |
| Net gain (loss) on sale of securities AFS | | 42 | | | 42 | | | 416 | | | 256 | |
| Noninterest expense | | 30,944 | | | 29,026 | | | 29,700 | | | 29,627 | |
| Income before income tax | | 20,189 | | | 23,453 | | | 22,179 | | | 21,954 | |
| Income tax expense | | 2,854 | | | 3,661 | | | 3,569 | | | 3,137 | |
| Net income | | $ | 17,335 | | | $ | 19,792 | | | $ | 18,610 | | | $ | 18,817 | |
| Per Share Data: | | | | | | | | |
| Earnings per common share – basic | | $ | 0.51 | | | $ | 0.59 | | | $ | 0.55 | | | $ | 0.56 | |
| Earnings per common share – diluted | | $ | 0.51 | | | $ | 0.58 | | | $ | 0.55 | | | $ | 0.56 | |
| Cash dividends paid per common share | | $ | 0.34 | | | $ | 0.31 | | | $ | 0.31 | | | $ | 0.30 | |
| Book value per common share | | $ | 23.79 | | | $ | 23.98 | | | $ | 23.34 | | | $ | 22.48 | |
(1)Upon adoption of CECL on January 1, 2020, the provision for credit losses is the sum of the provision for loan losses and the provision for off-balance-sheet credit exposures. Prior to the adoption of CECL, the provision for off-balance-sheet credit exposures was included in other noninterest expense.
ITEM 9. CHANGES IN AND DISAGREEMENTS WITH ACCOUNTANTS ON ACCOUNTING AND FINANCIAL DISCLOSURE
None.
ITEM 9A. CONTROLS AND PROCEDURES
Evaluation of Disclosure Controls and Procedures
Management, including our Chief Executive Officer (“CEO”) and our Chief Financial Officer (“CFO”), undertook an evaluation of our disclosure controls and procedures as of December 31, 2020. The term "disclosure controls and procedures," as defined in Rules 13a-15(e) and 15d-15(e) of the Exchange Act of 1934, as amended (the “Exchange Act”), means controls and other procedures of a company that are designed to ensure that information required to be disclosed by a company in the reports that it files or submits under the Exchange Act, is recorded, processed, summarized and reported, within the time periods specified in the SEC's rules and forms. Management recognizes that any controls and procedures, no matter how well designed and operated, can provide only reasonable, not absolute, assurance that the objectives of the disclosure controls and procedures are met. Additionally, in designing disclosure controls and procedures, our management necessarily applies its judgment in evaluating the cost-benefit relationship of possible controls and procedures. Disclosure controls and procedures include, without limitation, controls and procedures designed to ensure that information required to be disclosed by a company in the reports that it files or submits under the Exchange Act is accumulated and communicated to the company's management, including our CEO and CFO, as appropriate to allow timely decisions regarding required disclosure. The design of any disclosure controls and procedures also is based in part upon certain assumptions about the likelihood of future events, and there can be no assurance that any design will succeed in achieving its stated goals under all potential future conditions.
The Company’s CEO and CFO concluded that the Company’s disclosure controls and procedures were effective as of December 31, 2020.
Changes in Internal Control Over Financial Reporting
No changes were made to our internal control over financial reporting (as defined in Rule 13a-15(f) under the Exchange Act) during the last fiscal quarter of the period covered by this report that materially affected, or are reasonably likely to materially affect, our internal control over financial reporting.
Management’s Report on Internal Control Over Financial Reporting
Management is responsible for establishing and maintaining adequate internal control over financial reporting. Internal control over financial reporting is defined in Rules 13a-15(f) and 15d-15(f) under the Securities Exchange Act of 1934, as amended, is a process designed by, or under the supervision of, our CEO and CFO and effected by our board of directors, management and other personnel to provide reasonable assurance regarding the reliability of financial reporting and the preparation of financial statements for external purposes in accordance with generally accepted accounting principles and includes those policies and procedures that:
•pertain to the maintenance of records that in reasonable detail accurately and fairly reflect the transactions and dispositions of our assets;
•provide reasonable assurance that transactions are recorded as necessary to permit preparation of financial statements in accordance with generally accepted accounting principles, and that our receipts and expenditures are being made only in accordance with authorizations of our management and directors; and
•provide reasonable assurance regarding prevention or timely detection of unauthorized acquisition, use or disposition of our assets that could have a material effect on the financial statements.
Because of its inherent limitations, internal control over financial reporting may not prevent or detect misstatements. Also, projections of any evaluation of effectiveness to future periods are subject to the risks that controls may become inadequate because of changes in conditions, or that the degree of compliance with the policies or procedures may deteriorate. Management assessed the effectiveness of our internal control over financial reporting as of December 31, 2020. In making this assessment, management used the criteria set forth by the Committee of Sponsoring Organizations of the Treadway Commission (“COSO”) in Internal Control-Integrated Framework (“2013 framework”).
Based on this assessment, management concluded that we maintained effective internal control over financial reporting as of December 31, 2020.
The effectiveness of our internal control over financial reporting as of December 31, 2020 has been audited by Ernst & Young LLP, an independent registered public accounting firm, as stated in their report which appears in this Item under the heading “Attestation Report of Independent Registered Public Accounting Firm.”
Southside Bancshares, Inc.
February 26, 2021
Attestation Report of Independent Registered Public Accounting Firm
Report of Independent Registered Public Accounting Firm
To the Shareholders and the Board of Directors of Southside Bancshares, Inc. and Subsidiaries
Opinion on Internal Control over Financial Reporting
We have audited Southside Bancshares, Inc. and subsidiaries’ internal control over financial reporting as of December 31, 2020, based on the criteria established in Internal Control-Integrated Framework issued by the Committee of Sponsoring Organizations of the Treadway Commission (2013 framework) (the COSO criteria). In our opinion, Southside Bancshares, Inc. and subsidiaries (the Company) maintained, in all material respects, effective internal control over financial reporting as of December 31, 2020, based on the COSO criteria.
We also have audited, in accordance with the standards of the Public Company Accounting Oversight Board (United States) (PCAOB), the consolidated balance sheets of the Company as of December 31, 2020 and 2019, the related consolidated statements of income, comprehensive income, changes in shareholders’ equity and cash flows for each of the three years in the period ended December 31, 2020, and the related notes and our report dated February 26, 2021 expressed an unqualified opinion thereon.
Basis for Opinion
The Company’s management is responsible for maintaining effective internal control over financial reporting and for its assessment of the effectiveness of internal control over financial reporting included in the accompanying Management’s Report on Internal Control over Financial Reporting. Our responsibility is to express an opinion on the Company’s internal control over financial reporting based on our audit. We are a public accounting firm registered with the PCAOB and are required to be independent with respect to the Company in accordance with the U.S. federal securities laws and the applicable rules and regulations of the Securities and Exchange Commission and the PCAOB.
We conducted our audit in accordance with the standards of the PCAOB. Those standards require that we plan and perform the audit to obtain reasonable assurance about whether effective internal control over financial reporting was maintained in all material respects.
Our audit included obtaining an understanding of internal control over financial reporting, assessing the risk that a material weakness exists, testing and evaluating the design and operating effectiveness of internal control based on the assessed risk, and performing such other procedures as we considered necessary in the circumstances. We believe that our audit provides a reasonable basis for our opinion.
Definition and Limitations of Internal Control over Financial Reporting
A company’s internal control over financial reporting is a process designed to provide reasonable assurance regarding the reliability of financial reporting and the preparation of financial statements for external purposes in accordance with generally accepted accounting principles. A company’s internal control over financial reporting includes those policies and procedures that (1) pertain to the maintenance of records that, in reasonable detail, accurately and fairly reflect the transactions and dispositions of the assets of the company; (2) provide reasonable assurance that transactions are recorded as necessary to permit preparation of financial statements in accordance with generally accepted accounting principles, and that receipts and expenditures of the company are being made only in accordance with authorizations of management and directors of the company; and (3) provide reasonable assurance regarding prevention or timely detection of unauthorized acquisition, use, or disposition of the company’s assets that could have a material effect on the financial statements.
Because of its inherent limitations, internal control over financial reporting may not prevent or detect misstatements. Also, projections of any evaluation of effectiveness to future periods are subject to the risk that controls may become inadequate because of changes in conditions, or that the degree of compliance with the policies or procedures may deteriorate.
/s/ Ernst & Young LLP
Dallas, Texas
February 26, 2021
ITEM 9B. OTHER INFORMATION
Effective as of February 25, 2021, Southside Bank amended its deferred compensation agreement with Julie N. Shamburger, the Company’s Chief Financial Officer, to increase the amounts payable to Ms. Shamburger to $500,000.00, payable in 120 equal consecutive monthly installments, commencing on the first day of the month following the termination of Ms. Shamburger’s employment with the Company under certain circumstances.
In addition, effective as of February 25, 2021, Southside Bank entered into a split dollar life insurance agreement with Ms. Shamburger (the “Split Dollar Agreement”). The Split Dollar Agreement provides that the Bank will be the owner and beneficiary of certain life insurance policies ensuring the life of Ms. Shamburger, and will be entitled to receive an amount equal to the cash surrender value of such policies, plus any portion of the net death benefits in excess of the amounts that Ms. Shamburger’s beneficiary is entitled to receive. If Ms. Shamburger dies while employed by the Bank, her beneficiary will receive a benefit of $1,200,000 (which amount will be increased annually by an inflation adjustment factor). If Ms. Shamburger dies after termination of her employment with the Bank and after satisfying certain vesting conditions, her beneficiary will be entitled to receive a benefit equal to two times Ms. Shamburger’s base salary for her final year of employment, provided the total benefit may not exceed the net death proceeds. After Ms. Shamburger’s retirement, the Bank will pay an annual gross-up bonus to Ms. Shamburger in an amount sufficient to enable her to pay the federal income tax on both the economic benefit and on the gross-up bonus. The Split Dollar Agreement is filed as Exhibit 10.9 to this Annual Report on Form 10-K.
PART III
ITEM 10. DIRECTORS, EXECUTIVE OFFICERS AND CORPORATE GOVERNANCE
The information required by this Item is incorporated herein by reference to our Proxy Statement (Schedule 14A) for our 2021 Annual Meeting of Shareholders to be filed with the SEC within 120 days of our fiscal year-end.
ITEM 11. EXECUTIVE COMPENSATION
The information required by this Item is incorporated herein by reference to our Proxy Statement (Schedule 14A) for our 2021 Annual Meeting of Shareholders to be filed with the SEC within 120 days of our fiscal year-end.
ITEM 12. SECURITY OWNERSHIP OF CERTAIN BENEFICIAL OWNERS AND MANAGEMENT AND RELATED STOCKHOLDER MATTERS
The information required by this Item is incorporated herein by reference to our Proxy Statement (Schedule 14A) for our 2021 Annual Meeting of Shareholders to be filed with the SEC within 120 days of our fiscal year-end.
ITEM 13. CERTAIN RELATIONSHIPS AND RELATED TRANSACTIONS AND DIRECTOR INDEPENDENCE
The information required by this Item is incorporated herein by reference to our Proxy Statement (Schedule 14A) for our 2021 Annual Meeting of Shareholders to be filed with the SEC within 120 days of our fiscal year-end.
ITEM 14. PRINCIPAL ACCOUNTING FEES AND SERVICES
The information required by this Item is incorporated herein by reference to our Proxy Statement (Schedule 14A) for our 2021 Annual Meeting of Shareholders to be filed with the SEC within 120 days of our fiscal year-end.
PART IV
ITEM 15. EXHIBITS, FINANCIAL STATEMENT SCHEDULES
1. Financial Statements
The information required by this item is set forth in Part II. See Part II—Item 8. Financial Statements and Supplementary Data.
2. Financial Statement Schedules
All schedules are omitted because they are not applicable or not required, or because the required information is included in the consolidated financial statements or notes thereto.
3. Exhibits
The following exhibits listed in the Exhibit Index (following ITEM 16 in this report) are filed with, or incorporated by reference in, this report.
ITEM 16. FORM 10-K SUMMARY
Not applicable.
INDEX TO EXHIBITS
| | | | | | | | | | | | | | | | | | | | | | | | | | | | | | | | | | | | | | |
| | | | | | Incorporated by Reference |
| Exhibit Number | | Exhibit Description | | Filed Herewith | | Exhibit | | Form | | Filing Date | | File No. |
| (2) | | Plan of acquisition, reorganization, arrangement, liquidation or succession | | | | | | | | | | |
| 2.1 | | Agreement and Plan of Merger, dated April 28, 2014, by and among Southside Bancshares, Inc., Omega Merger Sub, Inc. and OmniAmerican Bancorp, Inc. | | | | 2 | | 10-Q | | 05/09/2014 | | 0-12247 |
| | | | | | | | | | | | |
| 2.2 | | Agreement and Plan of Merger, dated June 12, 2017, by and among Southside Bancshares, Inc., Rocket Merger Sub, Inc. and Diboll State Bancshares, Inc. | | | | 2.1 | | 10-Q | | 07/28/2017 | | 0-12247 |
| | | | | | | | | | | | |
| (3) | | Articles of Incorporation and Bylaws | | | | | | | | | | |
| 3.1 | | | | | | 3.1 | | 8-K | | 05/14/2018 | | 0-12247 |
| | | | | | | | | | | | | |
| 3.2 | | | | | | 3.1 | | 8-K | | 02/22/2018 | | 0-12247 |
| | | | | | | | | | | | |
| (4) | | Instruments defining the rights of security holders, including indentures | | | | | | | | | | |
| 4.1 | | | | | | 4.1 | | 10-K | | 02/28/2020 | | 0-12247 |
| | | | | | | | | | | | |
| 4.2 | | Subordinated Indenture, dated as of September 19, 2016, by and between the Company and Wilmington Trust, National Association, as Trustee. | | | | 4.1 | | 8-K | | 09/19/2016 | | 0-12247 |
| | | | | | | | | | | | |
| 4.3 | | First Supplemental Indenture, dated as of September 19, 2016 by and between the Company and Wilmington Trust, National Association, as Trustee, including the form of the Notes attached as Exhibit A thereto. | | | | 4.2 | | 8-K | | 09/19/2016 | | 0-12247 |
| | | | | | | | | | | | |
| 4.4 | | Indenture, dated as of November 6, 2020, by and between the Company and UMB Bank, National Association, as Trustee, including the form of the Notes attached as Exhibit A-2 thereto. | | | | 4.1 | | 8-K | | 11/9/2020 | | 0-12247 |
| | | | | | | | | | | | |
| 4.5 | | Management agrees to furnish to the Securities and Exchange Commission, upon request, a copy of any other agreements or instruments of Southside Bancshares, Inc. and its subsidiaries defining the rights of holders of any long-term debt whose authorization does not exceed 10% of total assets. | | | | | | | | | | |
| | | | | | | | | | | | | |
| (10) | | Material Contracts | | | | | | | | | | |
| 10.1 | | Officers Long-term Disability Income Plan effective June 25, 1990 (as filed with the Registrant’s Form 10-K for the year ended June 30, 1990). | | | | **10 (b) | | 10-K | | 1991 | | |
| | | | | | | | | | | | | |
| 10.2 | | Retirement Restoration Plan for the subsidiaries of SoBank, Inc. (now named Southside Bancshares, Inc.). | | | | **10 (c) | | 10-K | | 1993 | | |
| | | | | | | | | | | | | |
| 10.3 | | | | | | **10 (f) | | 10-K | | 03/30/1998 | | 0-12247 |
| | | | | | | | | | | | | |
| | | | | | | | | | | | | | | | | | | | | | | | | | | | | | | | | | | | | | |
| 10.4 | | | | **X | | | | | | | | |
| | | | | | | | | | | | |
| 10.5 | | | | **X | | | | | | | | |
| | | | | | | | | | | | |
| 10.6 | | | | | | **10.2 | | 10-Q | | 04/28/2017 | | 0-12247 |
| | | | | | | | | | | | |
| 10.7 | | | | | | **10.7 | | 10-K | | 02/28/2018 | | 0-12247 |
| | | | | | | | | | | | |
| 10.8 | | | | | | **10 (i) | | 8-K | | 10/19/2004 | | 3-17203 |
| | | | | | | | | | | | |
| 10.9 | | | | **X | | | | | | | | |
| | | | | | | | | | | | |
| 10.10 | | | | | | **10 (l) | | 8-K | | 10/26/2007 | | 3-17203 |
| | | | | | | | | | | | |
| 10.11 | | | | | | **10.1 | | 10-Q | | 04/28/2017 | | 0-12247 |
| | | | | | | | | | | | |
| 10.12 | | Employment Agreement dated April 28, 2014, by and between Southside Bank, Southside Bancshares, Inc., and Tim Carter. | | | | **10.2 | | S-4 | | 07/18/2014 | | 3-196817 |
| | | | | | | | | | | | |
| 10.13 | | | | | | **10.14 | | 10-K | | 02/28/2018 | | 0-12247 |
| | | | | | | | | | | | |
| 10.14 | | | | | | **10.1 | | 10-Q | | 10/27/2017 | | 0-12247 |
| | | | | | | | | | | | |
| 10.15 | | | | | | **10.1 | | 10-Q | | 10/26/2018 | | 0-12247 |
| | | | | | | | | | | | |
| 10.16 | | | | | | **99.1 | | 8-K | | 04/20/2009 | | 3-17203 |
| | | | | | | | | | | | |
| 10.17 | | | | | | **10.1 | | 10-Q | | 08/08/2011 | | 3-17203 |
| | | | | | | | | | | | |
| 10.18 | | | | | | **10.1 | | 8-K | | 05/12/2017 | | 0-12247 |
| | | | | | | | | | | | |
| 10.19 | | | | | | **10.2 | | 10-Q | | 10/27/2017 | | 0-12247 |
| | | | | | | | | | | | |
| 10.20 | | | | | | **10.3 | | 10-Q | | 10/27/2017 | | 0-12247 |
| | | | | | | | | | | | |
| | | | | | | | | | | | | | | | | | | | | | | | | | | | | | | | | | | | | | |
| 10.21 | | | | | | 10.1 | | 8-K | | 11/9/2020 | | 0-12247 |
| | | | | | | | | | | | |
| 10.22 | | | | | | 10.2 | | 8-K | | 11/9/2020 | | 0-12247 |
| | | | | | | | | | | | | | | | | | | | | | | | | | | | | | | | | | | | | | |
| (21) | | Subsidiaries of the registrant | | | | | | | | | | |
| 21 | | | | X | | | | | | | | |
| | | | | | | | | | | | |
| (23) | | Consents of experts and counsel | | | | | | | | | | |
| 23.1 | | | | X | | | | | | | | |
| | | | | | | | | | | | |
| (31) | | Rule 13a-14(a)/15d-14(a) Certifications | | | | | | | | | | |
| 31.1 | | | | X | | | | | | | | |
| | | | | | | | | | | | | |
| 31.2 | | | | X | | | | | | | | |
| | | | | | | | | | | | |
| (32) | | Section 1350 Certification | | | | | | | | | | |
| 32 | | | | X | | | | | | | | |
| | | | | | | | | | | | | |
| (101) | | Interactive Date File | | | | | | | | | | |
| 101.INS | | XBRL Instance Document - the instance document does not appear in the interactive data file because its XBRL tags are embedded within the Inline XBRL document. | | X | | | | | | | | |
| | | | | | | | | | | | |
| 101.SCH | | XBRL Taxonomy Extension Schema Document. | | X | | | | | | | | |
| | | | | | | | | | | | |
| 101.CAL | | XBRL Taxonomy Extension Calculation Linkbase Document. | | X | | | | | | | | |
| | | | | | | | | | | | | |
| 101.LAB | | XBRL Taxonomy Extension Label Linkbase Document. | | X | | | | | | | | |
| | | | | | | | | | | | | |
| 101.PRE | | XBRL Taxonomy Extension Presentation Linkbase Document. | | X | | | | | | | | |
| | | | | | | | | | | | | |
| 101.DEF | | XBRL Taxonomy Extension Definition Linkbase Document. | | X | | | | | | | | |
| | | | | | | | | | | | |
| 104 | | Cover Page Interactive Data File (embedded within the Inline XBRL document). | | X | | | | | | | | |
| | | | | | | | | | | | |
| **Compensation plan, benefit plan or employment contract or arrangement. | | | | | | | | | | |
SIGNATURES
Pursuant to the requirements of Section 13 or 15(d) of the Securities Exchange Act of 1934, the registrant has duly caused this report to be signed on its behalf by the undersigned, thereunto duly authorized.
| | | | | | | | | | | |
| | SOUTHSIDE BANCSHARES, INC. |
| | |
| | |
| DATE: | February 26, 2021 | BY: | /s/ Lee R. Gibson |
| | | Lee R. Gibson, CPA |
| | | President and Chief Executive Officer |
| | | (Principal Executive Officer) |
| | |
| | |
| | |
| | |
| DATE: | February 26, 2021 | BY: | /s/ Julie N. Shamburger |
| | | Julie N. Shamburger, CPA |
| | | Chief Financial Officer |
| | | (Principal Financial and Accounting Officer) |
Pursuant to the requirements of the Securities Exchange Act of 1934, this report has been signed below by the following persons on behalf of the registrant and in the capacities and on the date indicated.
| | | | | | | | | | | | | | | | | |
| | Signature | | Title | | Date |
| | | | | | |
| /s/ | John R. (Bob) Garrett | | Chairman of the Board | | February 26, 2021 |
| | John R. (Bob) Garrett | | and Director | | |
| | | | | |
| /s/ | Donald W. Thedford | | Vice Chairman of the Board | | February 26, 2021 |
| | Donald W. Thedford | | and Director | | |
| | | | | |
| /s/ | Lee R. Gibson | | President, Chief Executive Officer | | February 26, 2021 |
| | Lee R. Gibson | | and Director | | |
| | | | | |
| /s/ | Lawrence Anderson | | Director | | February 26, 2021 |
| | Lawrence Anderson | | | | |
| | | | | |
| /s/ | S. Elaine Anderson | | Director | | February 26, 2021 |
| | S. Elaine Anderson | | | | |
| | | | | |
| /s/ | Michael J. Bosworth | | Director | | February 26, 2021 |
| Michael J. Bosworth | | | | |
| | | | | |
| /s/ | Herbert C. Buie | | Director | | February 26, 2021 |
| | Herbert C. Buie | | | | |
| | | | | |
| /s/ | Patricia A. Callan | | Director | | February 26, 2021 |
| | Patricia A. Callan | | | | |
| | | | | |
| /s/ | Shannon Dacus | | Director | | February 26, 2021 |
| Shannon Dacus | | | | |
| | | | | |
| /s/ | George H. (Trey) Henderson, III | | Director | | February 26, 2021 |
| | George H. (Trey) Henderson, III | | | | |
| | | | | | |
| /s/ | Melvin B. Lovelady | | Director | | February 26, 2021 |
| Melvin B. Lovelady | | | | |
| | | | | |
| /s/ | Tony K. Morgan | | Director | | February 26, 2021 |
| Tony K. Morgan | | | | |
| | | | | |
| /s/ | John F. Sammons, Jr. | | Director | | February 26, 2021 |
| John F. Sammons, Jr. | | | | |
| | | | | |
| /s/ | H. J. Shands, III | | Director | | February 26, 2021 |
| | H. J. Shands, III | | | | |
| | | | | | |
| /s/ | William Sheehy | | Director | | February 26, 2021 |
| | William Sheehy | | | | |
| | | | | | |
| /s/ | Preston L. Smith | | Director | | February 26, 2021 |
| | Preston L. Smith | | | | |