Exhibit 99.1
KINROSS GOLD CORPORATION

ANNUAL INFORMATION FORM
FOR THE YEAR ENDED DECEMBER 31, 2015
Dated March 30, 2016
TABLE OF CONTENTS
|
|
Page |
|
CAUTIONARY STATEMENT |
3 |
|
CORPORATE STRUCTURE |
5 |
|
GENERAL DEVELOPMENT OF THE BUSINESS |
10 |
|
OVERVIEW |
10 |
|
THREE YEAR HISTORY |
10 |
|
DESCRIPTION OF THE BUSINESS |
12 |
|
COMPETITIVE CONDITIONS |
12 |
|
ENVIRONMENTAL PROTECTION |
13 |
|
OPERATIONS |
14 |
|
GOLD EQUIVALENT PRODUCTION AND SALES |
15 |
|
MARKETING |
16 |
|
KINROSS MINERAL RESERVES AND MINERAL RESOURCES |
17 |
|
KINROSS MATERIAL PROPERTIES |
25 |
|
Paracatu, Brazil |
25 |
|
Kupol, Russian Federation |
31 |
|
Tasiast, Mauritania |
43 |
|
OTHER KINROSS PROPERTIES |
50 |
|
Fort Knox and Area, Alaska, United States |
50 |
|
Round Mountain, Nye County, Nevada, United States |
51 |
|
Bald Mountain, White Pine Country, Nevada, United States |
52 |
|
La Coipa, Chile |
53 |
|
Kettle River – Buckhorn, Washington State, United States |
54 |
|
Lobo-Marte, Chile |
56 |
|
Cerro Casale, Chile |
57 |
|
Maricunga, Chile |
58 |
|
Chirano, Ghana |
59 |
|
RISK FACTORS |
61 |
|
DIVIDEND PAYMENTS AND DIVIDEND POLICY |
77 |
|
LEGAL PROCEEDINGS AND REGULATORY ACTIONS |
78 |
|
DESCRIPTION OF CAPITAL STRUCTURE |
79 |
|
MARKET PRICE FOR KINROSS SECURITIES |
80 |
|
RATINGS |
81 |
|
DIRECTORS AND OFFICERS |
82 |
|
CEASE TRADE ORDERS, BANKRUPTCIES, PENALTIES OR SANCTIONS |
86 |
|
CONFLICT OF INTEREST |
87 |
|
INTEREST OF MANAGEMENT AND OTHERS IN MATERIAL TRANSACTIONS |
87 |
|
TRANSFER AGENT AND REGISTRAR |
87 |
|
MATERIAL CONTRACTS |
88 |
|
INTERESTS OF EXPERTS |
88 |
|
AUDIT AND RISK COMMITTEE |
88 |
|
ADDITIONAL INFORMATION |
90 |
|
GLOSSARY OF TECHNICAL TERMS |
90 |
|
SCHEDULE “A” - CHARTER OF THE AUDIT AND RISK COMMITTEE |
97 |
IMPORTANT NOTICE
ABOUT INFORMATION IN THIS ANNUAL INFORMATION FORM
Unless specifically stated otherwise in this Annual Information Form:
· all dollar amounts are in United States dollars unless expressly stated otherwise;
· information is presented as of December 31, 2015; and
· references to “Kinross”, the “Company”, “its”, “our” and “we”, or related terms, refer to Kinross Gold Corporation or Kinross Gold Corporation and/or one or more or all of its subsidiaries, as may be applicable in the context.
CAUTIONARY STATEMENT
All statements, other than statements of historical fact, contained or incorporated by reference in this Annual Information Form (“AIF”) including, but not limited to, any information as to the future financial or operating performance of Kinross, constitute ‘‘forward-looking information’’ or ‘‘forward-looking statements’’ within the meaning of certain securities laws, including the provisions of the Securities Act (Ontario) and the provisions for ‘‘safe harbor’’ under the United States Private Securities Litigation Reform Act of 1995 and are based on expectations, estimates and projections as of the date of this AIF. Forward-looking statements contained in this AIF, include, without limitation, statements with respect to our guidance for production; production costs of sales, all-in sustaining cost and capital expenditures; mineral reserve and mineral resource estimates as well as references to other possible events, the future price of gold and silver, the estimation of mineral reserves and mineral resources, the realization of mineral reserve and mineral resource estimates, the timing and amount of estimated future production, costs of production, capital expenditures, costs and timing of the development of projects and new deposits, success of exploration, development and mining activities, permitting timelines, government regulation of mining operations, environmental risks, currency fluctuations, capital requirements, project studies, mine life extensions, continuous improvement initiatives, and resolution of pending litigation. The words “anticipate”, “assumption”, “believe”, “budget”, “contemplate”, “consideration”, “contingent”, “estimates”, ‘‘expects’’, “explore”, “feasibility”, “forecast”, “focus”, “forward”, “guidance”, “indicate”, “intend”, “initiative”, “measures”, “model”, “objective”, “optimize”, “opportunity”, “options”, “plan”, “possible”, “planned” “potential”, “pre-feasibility”, “prospect”, “priority”, “project”, “prospect”, “pursue”, “schedule”, “seek”, “strategy”, “study”, “target”, “timeline” or “trend”, or variations of or similar such words and phrases or statements that certain actions, events or results may, could, should, would, might or will be achieved, received or taken, or will occur or result and similar such expressions identify forward-looking statements. Forward-looking statements are necessarily based upon a number of estimates and assumptions that, while considered reasonable by Kinross as of the date of such statements, are inherently subject to significant business, economic and competitive uncertainties and contingencies. The estimates, models and assumptions of Kinross referenced, contained or incorporated by reference in this AIF, which may prove to be incorrect, include, but are not limited to, the various assumptions set forth herein and in our Management’s Discussion and Analysis (“MD&A”) for the year-ended 2015 as well as: (1) there being no significant disruptions affecting the operations of the Company whether due to extreme weather events (including, without limitation, excessive or lack of rainfall) and other or related natural disasters, labour disruptions (including but not limited to following workforce reductions), supply disruptions, power disruptions, damage to equipment or otherwise; (2) permitting, development, operations and production from the Company’s operations being consistent with Kinross’ current expectations including, without limitation, water and power supply, and operation of the tailings reprocessing facility at Paracatu; (3) political and legal developments in any jurisdiction in which the Company operates being consistent with its current expectations including, without limitation, the impact of political tensions and uncertainty in the Russian Federation and Ukraine or any related sanctions and any other similar restrictions or penalties imposed, or actions taken, by any government, including but not limited to potential power rationing, tailings facility regulation and amendments to mining laws in Brazil, potential amendments to water laws and/or other water use restrictions and regulatory actions in Chile, potential amendments to minerals and mining laws and dam safety regulation in Ghana, potential amendments to customs and mining laws (including but not limited amendments to the VAT) in Mauritania, and potential amendments to and enforcement of tax laws in Russia (including, but not limited to, the interpretation, implementation, application and enforcement of any such laws and amendments thereto), being consistent with Kinross’ current expectations; (4) the exchange rate between the Canadian dollar, Brazilian real, Chilean peso, Russian rouble, Mauritanian ouguiya, Ghanaian cedi and the U.S. dollar being approximately consistent with current levels; (5) certain price assumptions for gold and silver; (6) prices for diesel, natural gas, fuel oil, electricity and other key supplies being
approximately consistent with current levels; (7) production and cost of sales forecasts for the Company meeting expectations; (8) the accuracy of the current mineral reserve and mineral resource estimates of the Company (including but not limited to ore tonnage and ore grade estimates); (9) labour and materials costs increasing on a basis consistent with Kinross’ current expectations; (10) the terms and conditions of the legal and fiscal stability agreements for the Tasiast and Chirano operations being interpreted and applied in a manner consistent with their intent and Kinross’ expectations; (11) goodwill and/or asset impairment potential; and (12) access to capital markets, including but not limited to credit ratings being consistent with the Company’s current expectations. Known and unknown factors could cause actual results to differ materially from those projected in the forward-looking statements. Such factors include, but are not limited to those set out in the Risk Factors section hereof as well as: sanctions (or any other similar restrictions or penalties) now or subsequently imposed, or other actions taken, by, against, in respect of or otherwise impacting any jurisdiction in which the Company is domiciled or operates (including but not limited to the Russian Federation, Canada, the European Union and the United States), or any government or citizens of, persons or companies domiciled in, or the Company’s business, operations or other activities in, any such jurisdiction; litigation commenced, or other claims or actions brought, against the Company (and/or any of its directors, officers or employees) in respect of the cessation by the Company of investment in and development of Fruta del Norte and its sale, or any of the Company’s prior activities on or in respect thereof or otherwise in Ecuador; fluctuations in the currency markets; fluctuations in the spot and forward price of gold or certain other commodities (such as fuel and electricity); changes in the discount rates applied to calculate the present value of net future cash flows based on country-specific real weighted average cost of capital; changes in the market valuations of peer group gold producers and the Company, and the resulting impact on market price to net asset value multiples; changes in various market variables, such as interest rates, foreign exchange rates, gold or silver prices and lease rates, or global fuel prices, that could impact the mark-to-market value of outstanding derivative instruments and ongoing payments/receipts under any financial obligations; risks arising from holding derivative instruments (such as credit risk, market liquidity risk and mark-to-market risk); changes in national and local government legislation, taxation (including but not limited to income tax, advance income tax, stamp tax, withholding tax, capital tax, tariffs, value-added or sales tax, capital outflow tax, capital gains tax, windfall or windfall profits tax, royalty, excise tax, customs/import or export taxes/duties, asset taxes, asset transfer tax, property use or other real estate tax, together with any related fine, penalty, surcharge, or interest imposed in connection with such taxes), controls, policies and regulations; the security of personnel and assets; political or economic developments in Brazil, Chile, Canada, Ghana, Mauritania, Russia, the United States, or other countries in which Kinross does business or may carry on business; business opportunities that may be presented to, or pursued by, us; our ability to successfully integrate acquisitions and complete divestitures; operating or technical difficulties in connection with mining or development activities; employee relations; litigation or other claims against, or regulatory investigations and/or any enforcement actions or sanctions in respect of the Company (and/or its directors, officers, or employees) including, but not limited to, securities class action litigation in Canada and/or the United States, or any investigations, enforcement actions and/or sanctions under any applicable anti-corruption, international sanctions and/or anti-money laundering laws and regulations in Canada, the United States or any other applicable jurisdiction; the speculative nature of gold exploration and development including, but not limited to, the risks of obtaining necessary licenses and permits; diminishing quantities or grades of mineral reserves; adverse changes in our credit rating; and contests over title to properties. In addition, there are risks and hazards associated with the business of gold exploration, development and mining, including environmental hazards, industrial accidents, unusual or unexpected formations, pressures, cave-ins, flooding and gold bullion losses (and the risk of inadequate insurance, or the inability to obtain insurance, to cover these risks). Many of these uncertainties and contingencies can directly or indirectly affect, and could cause, Kinross’ actual results to differ materially from those expressed or implied in any forward-looking statements made by, or on behalf of, Kinross, including but not limited to resulting in an impairment charge on goodwill and/or assets. There can be no assurance that forward-looking statements will prove to be accurate, as actual results and future events could differ materially from those anticipated in such statements. Forward-looking statements are provided for the purpose of providing information about management’s expectations and plans relating to the future. All of the forward-looking statements made in this AIF are qualified by these cautionary statements, including but not limited to the “Risk Factors” section hereof, and those made in our other filings with the securities regulators of Canada and the United States including, but not limited to, the cautionary statements made in the ‘‘Risk Analysis’’ section of our MD&A for the year-ended 2015. These factors are not intended to represent a complete list of the factors that could affect Kinross. Kinross disclaims any intention or obligation to update or revise any forward-looking statements or to explain any material difference between subsequent actual events and such forward-looking statements, except to the extent required by applicable law.
CORPORATE STRUCTURE
Kinross Gold Corporation was initially created in May 1993 by the amalgamation of CMP Resources Ltd., Plexus Resources Corporation, and 1021105 Ontario Corp. In December 2000, Kinross amalgamated with LT Acquisition Inc.; in January 2005, Kinross amalgamated with its wholly-owned subsidiary, TVX Gold Inc. (“TVX”); in January 2006, it amalgamated with its wholly-owned subsidiary, Echo Bay Mines Ltd. (“Echo Bay”); and in January 2011, it amalgamated with Underworld Resources Inc. Kinross is the continuing entity resulting from these amalgamations. Kinross is governed by the Business Corporations Act (Ontario) and its registered and principal offices are located at 25 York Street, 17th Floor, Toronto, Ontario, M5J 2V5.
Each of Kinross’ mining operations is a separate business unit. Regional operations are overseen by a Regional Vice-President, who reports to the Executive Vice-President and Chief Operating Officer. Exploration strategies, corporate financing, tax planning, additional technical support services, hedging and acquisition strategies are managed centrally. Execution of site/regional operations and exploration strategies is managed locally. Kinross’ risk management programs are subject to overview by its Audit and Risk Committee and the Board of Directors.
A significant portion of Kinross’ business is carried on through subsidiaries. A chart showing the names of the significant subsidiaries of Kinross and their respective jurisdictions of incorporation is set out below as of January 11, 2016. All subsidiaries are 100% owned unless otherwise noted.
Subsidiary Governance and Internal Controls
Kinross has a system of governance, internal controls over financial reporting, and disclosure controls and procedures that apply at all levels of the Company and its subsidiaries, including those that operate in emerging markets. These systems are overseen by the Company’s board of directors and are implemented by the Company’s senior management, and the senior management of its subsidiaries. The relevant features of these systems include:
Control over Subsidiaries. All of the Company’s subsidiaries are wholly-owned or controlled unless otherwise noted. Regional operations are overseen by a Regional Vice-President employed by the applicable foreign subsidiary, who reports to the Company’s Executive Vice-President and Chief Operating Officer. The mind and management of Kinross’ subsidiaries, including those subsidiaries in emerging markets, is located in the applicable jurisdictions, each of the subsidiaries legally or beneficially owns or controls its operating assets and the subsidiaries’ operational decisions are localized. Kinross, as the ultimate sole shareholder, has internal policies and systems in place which provide it with visibility into the operations of its subsidiaries, including its subsidiaries operating in emerging markets, and the Company’s management team is responsible for monitoring the activities of the subsidiaries.
Further, the board of directors (or similar governing body) of each subsidiary is appointed by the shareholders of such subsidiary. Directors (or those holding similar positions) may be replaced at any time by a written resolution of the shareholders (or equivalent corporate action under applicable law). Through its corporate structure, Kinross has the power to directly or indirectly appoint and replace the board members of each subsidiary, including those operating in emerging markets, and therefore the boards of directors (or similar governing bodies under applicable law) of Kinross’ subsidiaries (including those operating in emerging markets), subject to their respective fiduciary duties and in accordance with applicable corporate procedures, are accountable to Kinross and its board of directors and senior management, as the ultimate shareholder.
With respect to the bank accounts of subsidiaries, certain jurisdictions require authorized signatories to be residents of such jurisdictions; however, Kinross has internal controls that require each of the Company’s subsidiaries to notify the Company’s treasury team before opening or closing any bank accounts. Kinross’ treasury team is also responsible for generally monitoring the activity within all such bank accounts on an ongoing basis via a web-based global treasury management system and/or web-based account access provided by the applicable financial institution to the extent available.
Strategic Direction. While the mining operations of each of the Company’s subsidiaries are managed locally, exploration strategies, external corporate financing, tax governance, additional technical support services, hedging and acquisition strategies are established centrally by the Company’s management, and, on consideration, implemented accordingly by senior management of applicable subsidiaries under the oversight of their respective boards of directors. Each subsidiary is responsible for the development and execution of its own risk management programs based on the enterprise risk management process established by the Company. The subsidiaries report a summary of their respective risk registers to the Company’s management on a quarterly basis which is then reported to the Audit and Risk Committee.
Financial Reporting. Kinross prepares its consolidated financial statements and Management Discussion & Analysis (“MD&A”) on a quarterly and annual basis, using IFRS as issued by the International Accounting Standards Board, which includes financial information and disclosure from its subsidiaries. The Company has internal controls over the preparation of its financial statements and other financial disclosures to provide assurance that its financial reporting is reliable and that the quarterly and annual financial statements and MD&A are being prepared in accordance with IFRS and applicable securities laws. These internal controls include the following:
(a) As part of the quarterly results and reporting process, the Company holds quarterly business review meetings (each, a “QBR”) for each of the Company’s operating regions. The QBRs are hosted by the Chief Operating Officer, attended by senior finance and operations management of the Company and its subsidiaries and information is presented
by regional and site management of the applicable subsidiaries. The QBRs include a review of operational performance as well as key financial information pertaining to the quarter.
(b) The Company receives quarterly reporting packages from its key operating subsidiaries including financial information and disclosures required to complete the Company’s consolidated financial statements and MD&A. Those responsible for the finance function of the Company’s subsidiaries report to the Company’s management, and the Company’s management has direct access to relevant financial information and finance personnel of the subsidiaries.
(c) All public disclosure documents and financial statements relating to the Company and its subsidiaries containing material information are reviewed by senior management and approved by the Company’s disclosure committee before such material is disclosed. The disclosure committee is comprised of the Chief Financial Officer, the Chief Operating Officer and the Chief Legal Officer. With respect to quarterly reporting including consolidated financial statements and MD&A, the disclosure committee meets to review and discuss all information prior to public disclosure. A summary of such meeting is provided to the Audit and Risk Committee by the Chief Financial Officer. The disclosure committee also receives a report on quarterly and annual sub-certifications received from senior management responsible for direct oversight of the operations of each operating subsidiary.
(d) The primary responsibility of the Audit and Risk Committee is to oversee the Company’s financial reporting process on behalf of the board of directors of Kinross and to report the results of its activities to the board of directors.
(e) The Audit and Risk Committee reviews the Company’s quarterly and annual financial statements and MD&A and meets with senior management to discuss quarterly results, including accounting, disclosure and control matters. The Audit and Risk Committee recommends the quarterly and annual consolidated financial statements to the Company’s board of directors for approval.
(f) The Audit and Risk Committee receives confirmation from the Chief Executive Officer and Chief Financial Officer as to the matters addressed in the quarterly and annual certifications required under National Instrument 52-109 – Certification of Disclosure in Issuer’s Annual and Interim Filings. This confirmation is obtained from the quarterly CFO report which provides a summary of management’s assessment and evaluation of internal control over financial reporting and disclosure control and procedures.
(g) The Audit and Risk Committee periodically assesses and evaluates the adequacy of the procedures in place for the review of the Company’s public disclosure of financial information extracted or derived from the Company’s financial statements, other than the annual and interim financial statements and related notes, MD&A, earnings releases and the annual information form.
Pursuant to regulations adopted by the U.S. Securities and Exchange Commission, under the Sarbanes-Oxley Act of 2002 and those of the Canadian Securities Administrators, Kinross’ management evaluates the effectiveness of the design and operation of the Company’s disclosure controls and procedures and internal controls over financial reporting. This evaluation is done under the supervision of, and with the participation of, the Company’s Chief Executive Officer and Chief Financial Officer.
These systems of corporate governance, internal controls over financial reporting and disclosure controls and procedures are designed to enable, among other things, Kinross to have access to all material information about its subsidiaries, including those operating in emerging markets.
Fund Transfers from the Corporation’s Subsidiaries
Kinross has sufficient cash flow from the operations of its various subsidiaries. Certain of the Company’s subsidiaries have a long history of operating in emerging markets and Kinross has not had any material issues with respect to transferring funds from, to or within emerging markets. Funds are transferred to, from or among Kinross’ subsidiaries pursuant to a variety of methods which include the following: chargeback of costs undertaken on behalf of the subsidiaries via intercompany invoices; advances and repayment of intercompany loans and related interest expense; equity purchases; returns of capital and dividend declaration/payment by the subsidiaries. The method of transfer is dependent on the financing or other arrangement established amongst Kinross and/or its applicable subsidiaries. All fund transfers from Kinross’ subsidiaries are in compliance with applicable law.
Records Management of the Corporation’s Subsidiaries
As required by applicable law, original copies of all corporate records are required to be maintained in the language of, and stored at the offices of, each subsidiary in the jurisdiction of incorporation. However, where practical, a duplicate set of corporate records for certain subsidiaries are maintained at Kinross’ head office in Toronto. Kinross also maintains a web-based global entity management system for recording such corporate information and documents which is regularly monitored and updated by Kinross’ corporate secretarial team and/or the regional legal teams.
GENERAL DEVELOPMENT OF THE BUSINESS
Overview
Kinross is principally engaged in the mining and processing of gold and, as a by-product, silver ore and the exploration for, and the acquisition of, gold bearing properties in the Americas, the Russian Federation, West Africa and worldwide. The principal products of Kinross are gold and silver produced in the form of doré that is shipped to refineries for final processing.
Kinross’ strategy is to increase shareholder value through increases in precious metal reserves, net asset value, production, long-term cash flow and earnings per share. Kinross’ strategy also consists of optimizing the performance, and therefore, the value, of existing operations, investing in quality exploration and development projects and acquiring new potentially accretive properties and projects.
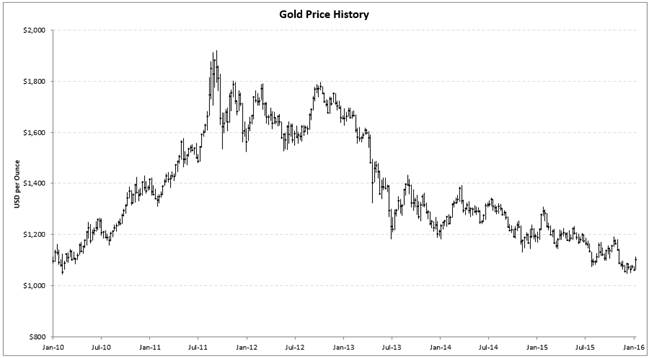
Kinross’ operations and mineral reserves are impacted by, among other things, changes in metal prices. The average gold price during 2015 was approximately $1,160 ($1,266 during 2014). Kinross used a gold price of $1,200 per ounce at the end of 2015 to estimate mineral reserves.
Kinross’ attributable estimated proven and probable mineral reserves as at December 31, 2015, was 34.0 million ounces of gold, 41.0 million ounces of silver and 1.4 billion pounds of copper, which includes estimated gold reserves from the January 2016 acquisition of the Bald Mountain gold mine and the remaining 50% interest in the Round Mountain gold mine.
Three Year History
In January 2008, Kinross completed a $460 million offering of convertible senior notes due March 15, 2028 (the “convertible senior notes”). Holders of the convertible senior notes had the right to require Kinross to repurchase the convertible senior notes at a purchase price equal to par plus accrued and unpaid interest, if any, to the repurchase date, on March 15, 2013, March 15, 2018 and March 15, 2023. On March 15, 2013, the Company repurchased $454.6 million of convertible senior notes in cash. On April 30, 2013, Kinross redeemed, in cash, the remaining convertible senior notes in the amount of $5.4 million.
On August 22, 2011, Kinross closed a $1 billion offering of debt securities, consisting of $250 million principal amount of its 3.625% Senior Notes due 2016, $500 million principal amount of its 5.125% Senior Notes due 2021 and $250 million principal amount of its 6.875% Senior Notes due 2041 (the “2011 notes”). The 2011 notes are unsecured, senior obligations of Kinross and are guaranteed by certain of Kinross’ wholly-owned subsidiaries that are also guarantors under Kinross’ senior unsecured credit facility.
On June 10, 2013, Kinross amended its $1.5 billion revolving credit facility and $1 billion term loan to extend the respective maturity dates and remove the minimum tangible net worth covenant. The revolving credit facility’s term was extended by one year to August 10, 2018 from August 10, 2017, and the term loan was extended by two years to August 10, 2017 from August 10, 2015. On March 10, 2014, the Company repaid $500.0 million of the term loan, leaving a balance of $500.0 million outstanding. On July 28, 2014, the Company amended its $500 million term loan and $1.5 billion revolving credit facility to extend the maturity dates by one year to August 10, 2018 and August 10, 2019, respectively. On July 24, 2015, the Company extended the maturity dates of its $500 million term loan and $1.5 billion revolving credit facility by one year, to 2019 and 2020 respectively.
On October 9, 2013, Kinross began commercial production at its Dvoinoye underground gold mine located in Russia’s Chukotka region.
At the end of October 2013, the Company suspended mining of the existing ore body at La Coipa and placed the mine on care and maintenance.
On March 6, 2014, Kinross completed a $500 million offering of debt securities, consisting of $500 million principal amount of 5.95% Senior Notes due 2024 (the “2014 notes”). The 2014 notes are unsecured, senior obligations of Kinross and are wholly and unconditionally guaranteed by certain of Kinross’ wholly-owned subsidiaries that are also guarantors under Kinross’ revolving credit facility. Kinross used the net proceeds, as well as an additional $7 million in cash, to repay $500 million of the term loan.
On July 17, 2014, the Company entered into an amendment to increase the amount of its Letter of Credit guarantee facility with Export Development Canada from $200 million to $250 million.
On October 21, 2014, Kinross announced that it entered into an agreement with Fortress Minerals Corp. (subsequently renamed Lundin Gold Inc., “Lundin Gold”), a member of the Lundin Group of Companies, to sell all of its interest in Aurelian Resources Inc. and the FDN project in Ecuador for $240 million in cash and shares. On December 17, 2014, the Company completed the sale for gross cash proceeds of $150 million and $90 million of Lundin Gold common shares.
On November 17, 2014, the Company withdrew its permit application and stopped the permitting process at its Lobo-Marte mine. Any future project would require the re-initiation of the permitting process. As a result of the withdrawal of the permit application, the Company reclassified the project’s estimated proven and probable mineral reserves as measured and indicated mineral resources.
On November 12, 2015, Kinross announced that it had entered into a definitive asset purchase agreement to acquire 100% of the Bald Mountain (“Bald Mountain”) gold mine, which includes a large associated land package, and the remaining 50% of the Round Mountain gold mine in Nevada from Barrick Gold Corporation (“Barrick”) for $610 million in cash. In addition, Barrick received a contingent 2% net smelter return royalty on future gold production from Kinross’ 100%-owned Bald Mountain lands that will come into effect following the post-closing production of 10 million ounces from such lands. Barrick also retained a 50% interest in an exploration joint venture partnership with Kinross over 40% of the land package outside the current core mining area. The transaction was completed on January 11, 2016.
On March 4, 2016, Kinross completed a bought deal public equity offering of 83,400,000 common shares at a price of $3.00 per common share for gross proceeds of approximately $250 million. Kinross sold the common shares to a syndicate of underwriters led by TD Securities Inc. and Scotiabank pursuant to an underwriting agreement dated February 24, 2016. Kinross intends to use the net proceeds of the offering to strengthen its balance sheet and improve its long-term liquidity position by using approximately $175 million of the net proceeds to repay the credit facilities that were utilized to purchase assets from Barrick, with the balance being used to repay debt maturing in 2016 and for general corporate purposes. On March 18, 2016, Kinross completed the offering of an additional 12,510,000 common shares at a price of $3.00 per common share for an additional gross proceeds of $37,530,000 pursuant to the exercise of the over-allotment option by the syndicate of underwriters.
On March 30, 2016, the Company filed an updated NI 43-101 Technical Report in respect of its Tasiast project and announced that it would proceed with a phase one expansion of its Tasiast mine as outlined in the Technical Report. The Company is proposing a two-phased expansion of the Tasiast project that leverages the existing mill infrastructure. Phase one of the expansion will increase the mill throughput from the current 8,000 tonnes per day to 12,000 tonnes per day. If Kinross decides to proceed, phase two would then further increase the mill throughput from 12,000 tonnes per day to 30,000 tonnes per day with the installation of additional milling, leaching, thickening and refinery capacity. Kinross had initiated a feasibility study in 2015 to assess the economic viability of the first phase and a pre-feasibility to assess the economic viability of the second phase. The studies concluded with a recommendation to progress with the first phase into execution and advance the second phase into a feasibility study.
DESCRIPTION OF THE BUSINESS
Kinross is principally engaged in the exploration for, and acquisition, development and operation of, gold-bearing properties. The material properties of Kinross as of December 31, 2015 were as follows:
|
Property |
|
Location |
|
Property |
|
|
Paracatu |
|
Brazil |
|
100 |
% |
|
Kupol-Dvoinoye |
|
Russian Federation |
|
100 |
% |
|
Tasiast |
|
Mauritania |
|
100 |
% |
(1) The Paracatu and Tasiast properties are subject to various royalties (see “Kinross Material Properties” —“Paracatu, Brazil” and “Tasiast, Mauritania”).
In addition, as of December 31, 2015, Kinross held a 100% interest in the Fort Knox property in Alaska, United States, 100% interest in the Kettle River-Buckhorn properties in Washington, United States, which includes the Kettle River mill and the Buckhorn mine, a 50%1 interest in the Round Mountain mine in Nevada, United States, a 100% interest in the La Coipa mine in Chile, a 90% interest in the Chirano mine in Ghana, a 100% interest in the Lobo-Marte property in Chile, a 25% interest in the Cerro Casale property in Chile, a 100% interest in the Maricunga mine in Chile and other mining properties in various stages of exploration, development, reclamation, and closure. The Company’s principal product is gold and it also produces silver as a by-product.
Employees
At December 31, 2015, Kinross and its subsidiaries employed approximately 9,1702 employees. In Brazil, the Paracatu collective agreement expired on January 31, 2016. Negotiations in respect of a new collective agreement are currently under way. In Chile, both of the La Coipa collective agreements expire on July 31, 2016 and both of the Maricunga collective agreements expire on February 28, 2017. In West Africa, employees at the Chirano and Tasiast mines are represented by unions. The collective agreement for Tasiast employees expired in December 2015. Negotiations for a new collective agreement commenced in March 2016. Employees at Chirano are governed by two collective agreements covering senior staff and junior staff, respectively. The senior staff association agreement expires in May 2018 and the junior staff union agreement expires in August 2018. At Chirano, compensation and related benefits for both groups are negotiated annually. In Russia, a union was registered at Kupol in February of 2012; however, as of March 2016 there were no union members. At Dvoinoye, a new union was registered last year with 16 potential members, however the proper legal filing processes have not yet been completed and collective bargaining is not required until a majority of employees have joined the union. All of Kinross’ employees in the United States and Canada are non-unionized.
Competitive Conditions
The precious metal mineral exploration and mining business is a competitive business. Kinross competes with numerous other companies and individuals in the search for and the acquisition of attractive precious metal mineral properties. The ability of Kinross to replace or increase its mineral reserves and mineral resources in the future will depend not only on its ability to develop its present properties, but also
1 On January 11, 2016, Kinross acquired the remaining 50% interest in the Round Mountain mine and the Bald Mountain mine in Nevada, United States, from affiliates of Barrick. As a result of this acquisition, Kinross held a 100% interest in the Round Mountain mine in Nevada, United States and a 100% interest in the Bald Mountain mine in Nevada, United States as of January 11, 2016.
2 A further 441 employees are employed by Kinross and its subsidiaries as of January 11, 2016 as a result of the acquisition of the Bald Mountain mine.
on its ability to select and acquire suitable producing properties or prospects for precious metal development or mineral exploration.
Environmental Protection
Kinross’ exploration activities and mining and processing operations are subject to the federal, state, provincial, regional and local environmental laws and regulations in the jurisdictions in which Kinross’ activities and facilities are located. For example, in the United States, Kinross is subject to a number of such laws and regulations including, without limitation: the Clean Air Act; the Clean Water Act; the Comprehensive Environmental Response, Compensation and Liability Act; the Emergency Planning and Community Right to Know Act; the Endangered Species Act; the Federal Land Policy and Management Act; the National Environmental Policy Act; the Resource Conservation and Recovery Act; and related state laws.
Kinross is subject to similar laws in other jurisdictions in which it operates. In all jurisdictions in which Kinross operates, environmental licences, permits and other regulatory approvals are required in order to engage in exploration, mining and processing, and mine closure activities. Regulatory approval of a detailed plan of operations and a comprehensive environmental impact assessment is required prior to initiating mining or processing activities or for any substantive change to previously approved plans. In all jurisdictions in which Kinross operates, specific statutory and regulatory requirements and standards must be met throughout the life of the mining or processing operations in regard to air quality, water quality, fisheries, wildlife and biodiversity protection, archaeological and cultural resources, solid and hazardous waste management and disposal, the management and transportation of hazardous chemicals, toxic substances, noise, community right-to-know, land use, and reclamation. Except as may be otherwise disclosed herein, Kinross is currently in compliance, in all material respects, with all material applicable environmental laws and regulations. Details and quantification of the Company’s reclamation and remediation obligations are set out in Note 13 to the audited consolidated financial statements of the Company for the year ended December 31, 2015.
As part of Kinross’ Corporate Responsibility Management System, Kinross has implemented corporate environmental governance programs including:
STANDARDS — Corporate environmental management standards provide a clear bottom line for all Kinross activities in all jurisdictions in which we carry on business. Where legal requirements are unclear, Kinross’ environmental management standards provide clear direction regarding performance expectations and minimum design and operating requirements.
An example of this is Kinross’ adoption of the standards outlined in the International Cyanide Management Code for the Manufacture, Transport and Use of Cyanide in the Production of Gold (the “Cyanide Code”). Kinross is a signatory to the Cyanide Code, which is administered by the International Cyanide Management Institute (the “ICMI”). The ICMI is an independent body that was established by a multi-stakeholder group under the guidance of the United Nations Environmental Program. The ICMI established operating standards for cyanide manufacturers, transporters and mines and provides for third party certification of facilities’ compliance with the Cyanide Code. All Kinross operations have either already been certified as compliant with the Cyanide Code or are in the process of being certified.
AUDITS - Comprehensive environmental compliance audits are conducted at all operations and at selected residual properties on a biennial basis. The audit program assesses compliance with applicable legal requirements, measures effectiveness of management systems, and includes procedures to ensure timely follow-up on audit findings.
METRICS - Kinross has identified operational parameters that are key indicators of environmental performance, and measures these indicators on a regular basis. The Company tracks an index of these key performance indicators and sets performance targets to encourage continuous environmental improvement.
ENGINEERING - To effectively manage environmental risk, programs are in place to assess the management and stability of tailings and other engineered facilities. They include detailed water balance accounting, to assure sufficient storage capacity, and effective operational procedures. Every Kinross operation has a tailings or heap management plan in place. In addition, Kinross performs periodic assessments of engineered systems to assure adequate systems are in place to minimize or eliminate environmental risks.
RECLAMATION - Kinross recognizes its responsibility to manage the environmental change associated with its operations, and requires all sites to develop and maintain reclamation and closure plans to address the Company’s reclamation and closure obligations in accordance with applicable local regulations and Kinross’ corporate environmental management standards.
The results of these programs have been recognized by others within and outside the mining industry. Examples of significant recognition of Kinross’ efforts are listed on Kinross’ website at www.kinross.com.
Operations
Kinross’ total attributable production in 2015 was derived from the mines in the Americas (54%), West Africa (17%) and the Russian Federation (29%). The following shows the location of Kinross’ properties as of the date hereof.
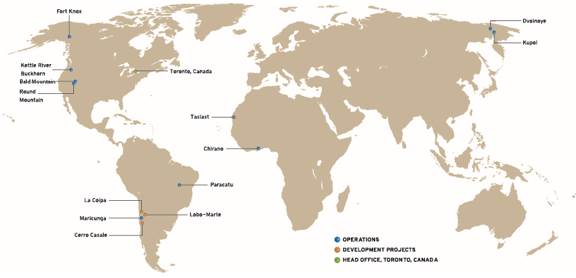
Gold Equivalent Production and Sales
The following table summarizes total attributable production and sales from continuing operations by Kinross in the last three years:
|
|
|
Years ended December 31, |
| ||||
|
|
|
2015 |
|
2014 |
|
2013 |
|
|
|
|
|
|
|
|
|
|
|
Gold equivalent production – ounces |
|
2,594,652 |
|
2,710,390 |
|
2,631,092 |
|
|
|
|
|
|
|
|
|
|
|
Gold equivalent sales – ounces |
|
2,608,870 |
|
2,715,358 |
|
2,669,276 |
|
Included in gold equivalent production and sales is silver production and sales, as applicable, converted into gold production using a ratio of the average spot market prices of gold and silver for the three comparative years. The ratios were 73:92:1 in 2015, 66.29:1 in 2014 and 59.23:1 in 2013.
The following table sets forth the total attributable gold equivalent production (in ounces) reflective of Kinross’ interest in each of its operating assets during the last three years:
|
|
|
2015 |
|
2014 |
|
2013 |
|
|
Americas: |
|
|
|
|
|
|
|
|
Fort Knox |
|
401,553 |
|
379,453 |
|
421,641 |
|
|
Round Mountain (1) |
|
197,818 |
|
169,839 |
|
162,826 |
|
|
Kettle River-Buckhorn |
|
97,368 |
|
123,382 |
|
150,157 |
|
|
Paracatu |
|
477,662 |
|
521,026 |
|
500,380 |
|
|
Maricunga |
|
212,155 |
|
247,216 |
|
187,815 |
|
|
Total |
|
1,386,556 |
|
1,440,916 |
|
1,422,819 |
|
|
|
|
|
|
|
|
|
|
|
West Africa: |
|
|
|
|
|
|
|
|
Tasiast |
|
219,045 |
|
260,485 |
|
247,818 |
|
|
Chirano(2) |
|
230,488 |
|
257,888 |
|
247,862 |
|
|
Total |
|
449,533 |
|
518,373 |
|
495,680 |
|
|
|
|
|
|
|
|
|
|
|
Russian Federation: |
|
|
|
|
|
|
|
|
Kupol-Dvoinoye |
|
758,563 |
|
751,101 |
|
550,188 |
|
(1) Represents Kinross’ 50% ownership interest. On January 11, 2016, Kinross acquired the remaining 50% interest.
(2) Represents Kinross’ 90% ownership interest.
Marketing
Gold is a metal that is traded on world markets, with benchmark prices generally based on the London market. Gold has two principal uses: product fabrication and bullion investment. Fabricated gold has a wide variety of end uses, including jewelry manufacture (the largest fabrication component), electronics, dentistry, industrial and decorative uses, medals, medallions, and official coins. Gold bullion is held primarily as a store of value and a safeguard against devaluation of paper assets denominated in fiat currencies. Kinross sells all of its refined gold to banks, bullion dealers, and refiners. In 2015, sales from operations to its top three customers totaled $677.7 million, $599.6 million, and $349.4 million respectively, for an aggregate of $1,626.7 million. In 2014, sales from operations to its top three customers totaled $1,083.1 million, $517.4 million, and $423.9 million respectively, for an aggregate of $2,024.4 million. Due to the size of the bullion market and the above ground inventory of bullion, activities by Kinross will generally not influence gold prices. Kinross believes that the loss of any of these customers would have no material adverse impact on Kinross because of the active worldwide market for gold.
The following table sets forth for the years indicated the high and low London Bullion Market afternoon fix prices for gold:
|
Year |
|
High |
|
Low |
|
Average |
| |||
|
2005 |
|
$ |
536.50 |
|
$ |
411.10 |
|
$ |
444.45 |
|
|
2006 |
|
$ |
725.00 |
|
$ |
524.25 |
|
$ |
603.77 |
|
|
2007 |
|
$ |
841.10 |
|
$ |
608.40 |
|
$ |
695.39 |
|
|
2008 |
|
$ |
1,011.25 |
|
$ |
712.50 |
|
$ |
871.96 |
|
|
2009 |
|
$ |
1,212.50 |
|
$ |
810.00 |
|
$ |
972.35 |
|
|
2010 |
|
$ |
1,421.00 |
|
$ |
1,058.00 |
|
$ |
1,224.52 |
|
|
2011 |
|
$ |
1,895.00 |
|
$ |
1,319.00 |
|
$ |
1,570.25 |
|
|
2012 |
|
$ |
1,791.75 |
|
$ |
1,540.00 |
|
$ |
1,668.98 |
|
|
2013 |
|
$ |
1,693.75 |
|
$ |
1,192.00 |
|
$ |
1,411.23 |
|
|
2014 |
|
$ |
1,385.00 |
|
$ |
1,142.00 |
|
$ |
1,266.40 |
|
|
2015 |
|
$ |
1,295.75 |
|
$ |
1,049.40 |
|
$ |
1,160.06 |
|
Kinross Mineral Reserves and Mineral Resources
Definitions
The estimated mineral reserves and mineral resources for Kinross’ properties have been calculated in accordance with the Canadian Institute of Mining, Metallurgy and Petroleum (“CIM”) — Definitions Adopted by CIM Council on May 10, 2014 (the “CIM Standards”) which were adopted by the Canadian Securities Administrators’ National Instrument 43-101 Standards of Disclosure for Mineral Projects (the “Instrument”). The following definitions are reproduced from the CIM Standards:
A Mineral Resource is a concentration or occurrence of solid material of economic interest in or on the Earth’s crust in such form, grade or quality that there are reasonable prospects for eventual economic extraction. The location, quantity, grade or quality, continuity and other geological characteristics of a Mineral Resource are known, estimated or interpreted from specific geological evidence and knowledge, including sampling. Material of economic interest refers to diamonds, natural solid inorganic material, or natural solid fossilized organic material including base and precious metals, coal, and industrial minerals.
An Inferred Mineral Resource is that part of a Mineral Resource for which quantity and grade or quality are estimated on the basis of limited geological evidence and sampling. Geological evidence is sufficient to imply but not verify geological and grade or quality continuity. The estimate is based on limited information and sampling gathered through appropriate sampling techniques from locations such as outcrops, trenches, pits, workings and drillholes.
An Indicated Mineral Resource is that part of a Mineral Resource for which quantity, grade or quality, densities, shape and physical characteristics are estimated with sufficient confidence to allow the appropriate application of technical and economic parameters in sufficient detail to support mine planning and evaluation of the economic viability of the deposit. Geological evidence is derived from adequately detailed and reliable exploration, sampling and testing and is sufficient to assume geological and grade or quality continuity between points of observation.
A Measured Mineral Resource is that part of a Mineral Resource for which quantity, grade or quality, densities, shape, and physical characteristics are established with confidence sufficient to allow the appropriate application of technical and economic parameters to support detailed mine planning and final evaluation of the economic viability of the deposit. Geological evidence is derived from detailed and reliable exploration, sampling and testing and is sufficient to assume geological and grade or quality continuity between points of observation.
A Mineral Reserve is the economically mineable part of a Measured and/or Indicated Mineral Resource. A Mineral Reserve includes diluting materials and allowances for losses, which may occur when the material is mined or extracted and is defined by studies at Pre-Feasibility or Feasibility level as appropriate that include application of technical and economic parameters. Such studies demonstrate that, at the time of reporting, extraction could reasonably be justified. The public disclosure of a Mineral Reserve must be demonstrated by a Pre-Feasibility Study or Feasibility Study.
A Probable Mineral Reserve is the economically mineable part of an Indicated, and in some circumstances, a Measured Mineral Resource demonstrated by at least a Preliminary Feasibility Study. This study must include adequate information on mining, processing, metallurgical, economic, and other relevant factors that demonstrate, at the time of reporting, that economic extraction can be justified.
A Proven Mineral Reserve is the economically mineable part of a Measured Mineral Resource demonstrated by at least a Preliminary Feasibility Study. This study must include adequate information on mining, processing, metallurgical, economic, and other relevant factors that demonstrate, at the time of reporting, that economic extraction is justified.
Mineral Reserve and Mineral Resource Estimates
The following tables set forth the estimated mineral reserves and mineral resources attributable to interests held by Kinross for each of its properties:
|
MINERAL RESERVE AND MINERAL RESOURCE STATEMENT |
|
GOLD |
|
PROVEN AND PROBABLE MINERAL RESERVES (1),(3),(4),(5),(6),(8),(9),(11) | ||
|
Kinross Gold Corporation’s Share at December 31, 2015 | ||
|
|
|
|
|
Kinross |
|
Proven |
|
Probable |
|
Proven and Probable |
| ||||||||||||
|
Property |
|
Location |
|
Interest |
|
Tonnes |
|
Grade |
|
Ounces |
|
Tonnes |
|
Grade |
|
Ounces |
|
Tonnes |
|
Grade |
|
Ounces |
|
|
|
|
|
|
(%) |
|
(kt) |
|
(g/t) |
|
(koz) |
|
(kt) |
|
(g/t) |
|
(koz) |
|
(kt) |
|
(g/t) |
|
(koz) |
|
|
NORTH AMERICA |
|
|
|
|
|
|
|
|
|
|
|
|
|
|
|
|
|
|
|
|
|
|
|
|
Bald Mountain 8 |
|
USA |
|
100.0 |
% |
14,647 |
|
0.8 |
|
372 |
|
39,980 |
|
0.6 |
|
745 |
|
54,627 |
|
0.6 |
|
1,117 |
|
|
Fort Knox Area |
|
USA |
|
100.0 |
% |
47,740 |
|
0.4 |
|
628 |
|
99,578 |
|
0.4 |
|
1,394 |
|
147,318 |
|
0.4 |
|
2,022 |
|
|
Kettle River |
|
USA |
|
100.0 |
% |
— |
|
— |
|
— |
|
166 |
|
8.7 |
|
47 |
|
166 |
|
8.7 |
|
47 |
|
|
Round Mountain Area 8 |
|
USA |
|
100.0 |
% |
39,062 |
|
0.7 |
|
907 |
|
27,083 |
|
0.6 |
|
563 |
|
66,145 |
|
0.7 |
|
1,470 |
|
|
SUBTOTAL |
|
|
|
|
|
101,449 |
|
0.6 |
|
1,907 |
|
166,807 |
|
0.5 |
|
2,749 |
|
268,256 |
|
0.5 |
|
4,656 |
|
|
|
|
|
|
|
|
|
|
|
|
|
|
|
|
|
|
|
|
|
|
|
|
|
|
|
SOUTH AMERICA |
|
|
|
|
|
|
|
|
|
|
|
|
|
|
|
|
|
|
|
|
|
|
|
|
Cerro Casale 9 |
|
Chile |
|
25.0 |
% |
57,425 |
|
0.6 |
|
1,195 |
|
241,975 |
|
0.6 |
|
4,616 |
|
299,400 |
|
0.6 |
|
5,811 |
|
|
Maricunga |
|
Chile |
|
100.0 |
% |
15,209 |
|
0.9 |
|
428 |
|
25,432 |
|
0.8 |
|
614 |
|
40,641 |
|
0.8 |
|
1,042 |
|
|
Paracatu |
|
Brazil |
|
100.0 |
% |
427,432 |
|
0.4 |
|
5,653 |
|
260,558 |
|
0.5 |
|
3,992 |
|
687,990 |
|
0.4 |
|
9,645 |
|
|
SUBTOTAL |
|
|
|
|
|
500,066 |
|
0.5 |
|
7,276 |
|
527,965 |
|
0.5 |
|
9,222 |
|
1,028,031 |
|
0.5 |
|
16,498 |
|
|
|
|
|
|
|
|
|
|
|
|
|
|
|
|
|
|
|
|
|
|
|
|
|
|
|
AFRICA |
|
|
|
|
|
|
|
|
|
|
|
|
|
|
|
|
|
|
|
|
|
|
|
|
Chirano |
|
Ghana |
|
90.0 |
% |
7,275 |
|
1.2 |
|
287 |
|
7,394 |
|
3.6 |
|
848 |
|
14,669 |
|
2.4 |
|
1,135 |
|
|
Tasiast 11 |
|
Mauritania |
|
100.0 |
% |
30,467 |
|
1.4 |
|
1,406 |
|
101,711 |
|
2.1 |
|
6,813 |
|
132,178 |
|
1.9 |
|
8,219 |
|
|
SUBTOTAL |
|
|
|
|
|
37,742 |
|
1.4 |
|
1,693 |
|
109,105 |
|
2.2 |
|
7,661 |
|
146,847 |
|
2.0 |
|
9,354 |
|
|
|
|
|
|
|
|
|
|
|
|
|
|
|
|
|
|
|
|
|
|
|
|
|
|
|
RUSSIA |
|
|
|
|
|
|
|
|
|
|
|
|
|
|
|
|
|
|
|
|
|
|
|
|
Dvoinoye |
|
Russia |
|
100.0 |
% |
634 |
|
10.2 |
|
209 |
|
1,631 |
|
11.6 |
|
606 |
|
2,265 |
|
11.2 |
|
815 |
|
|
Kupol |
|
Russia |
|
100.0 |
% |
1,253 |
|
8.8 |
|
355 |
|
5,904 |
|
8.1 |
|
1,544 |
|
7,157 |
|
8.3 |
|
1,899 |
|
|
SUBTOTAL |
|
|
|
|
|
1,887 |
|
9.3 |
|
564 |
|
7,535 |
|
8.9 |
|
2,150 |
|
9,422 |
|
9.0 |
|
2,714 |
|
|
|
|
|
|
|
|
|
|
|
|
|
|
|
|
|
|
|
|
|
|
|
|
|
|
|
TOTAL GOLD |
|
|
|
|
|
641,144 |
|
0.6 |
|
11,440 |
|
811,412 |
|
0.8 |
|
21,782 |
|
1,452,556 |
|
0.7 |
|
33,222 |
|
|
MINERAL RESERVE AND MINERAL RESOURCE STATEMENT |
|
SILVER |
|
PROVEN AND PROBABLE MINERAL RESERVES (1),(3),(4),(5),(6),(8),(9) |
|
|
|
Kinross Gold Corporation’s Share at December 31, 2015 |
|
|
|
|
|
|
|
Kinross |
|
Proven |
|
Probable |
|
Proven and Probable |
| ||||||||||||
|
Property |
|
Location |
|
Interest |
|
Tonnes |
|
Grade |
|
Ounces |
|
Tonnes |
|
Grade |
|
Ounces |
|
Tonnes |
|
Grade |
|
Ounces |
|
|
|
|
|
|
(%) |
|
(kt) |
|
(g/t) |
|
(koz) |
|
(kt) |
|
(g/t) |
|
(koz) |
|
(kt) |
|
(g/t) |
|
(koz) |
|
|
NORTH AMERICA |
|
|
|
|
|
|
|
|
|
|
|
|
|
|
|
|
|
|
|
|
|
|
|
|
Round Mountain Area 8 |
|
USA |
|
100.0 |
% |
462 |
|
13.1 |
|
195 |
|
1,908 |
|
11.0 |
|
675 |
|
2,370 |
|
11.4 |
|
870 |
|
|
SUBTOTAL |
|
|
|
|
|
462 |
|
13.1 |
|
195 |
|
1,908 |
|
11.0 |
|
675 |
|
2,370 |
|
11.4 |
|
870 |
|
|
|
|
|
|
|
|
|
|
|
|
|
|
|
|
|
|
|
|
|
|
|
|
|
|
|
SOUTH AMERICA |
|
|
|
|
|
|
|
|
|
|
|
|
|
|
|
|
|
|
|
|
|
|
|
|
Cerro Casale 9 |
|
Chile |
|
25.0 |
% |
57,425 |
|
1.9 |
|
3,522 |
|
241,975 |
|
1.4 |
|
11,150 |
|
299,400 |
|
1.5 |
|
14,672 |
|
|
SUBTOTAL |
|
|
|
|
|
57,425 |
|
1.9 |
|
3,522 |
|
241,975 |
|
1.4 |
|
11,150 |
|
299,400 |
|
1.5 |
|
14,672 |
|
|
|
|
|
|
|
|
|
|
|
|
|
|
|
|
|
|
|
|
|
|
|
|
|
|
|
RUSSIA |
|
|
|
|
|
|
|
|
|
|
|
|
|
|
|
|
|
|
|
|
|
|
|
|
Dvoinoye |
|
Russia |
|
100.0 |
% |
634 |
|
16.6 |
|
338 |
|
1,631 |
|
18.7 |
|
979 |
|
2,265 |
|
18.1 |
|
1,317 |
|
|
Kupol |
|
Russia |
|
100.0 |
% |
1,253 |
|
124.4 |
|
5,011 |
|
5,904 |
|
100.7 |
|
19,112 |
|
7,157 |
|
104.8 |
|
24,123 |
|
|
SUBTOTAL |
|
|
|
|
|
1,887 |
|
88.2 |
|
5,349 |
|
7,535 |
|
82.9 |
|
20,091 |
|
9,422 |
|
84.0 |
|
25,440 |
|
|
|
|
|
|
|
|
|
|
|
|
|
|
|
|
|
|
|
|
|
|
|
|
|
|
|
TOTAL SILVER |
|
|
|
|
|
59,774 |
|
4.7 |
|
9,066 |
|
251,418 |
|
3.9 |
|
31,916 |
|
311,192 |
|
4.1 |
|
40,982 |
|
|
MINERAL RESERVE AND MINERAL RESOURCE STATEMENT |
|
COPPER |
|
PROVEN AND PROBABLE MINERAL RESERVES (1),(3),(4),(5),(6),(9) |
|
|
|
Kinross Gold Corporation’s Share at December 31, 2015 |
|
|
|
|
|
|
|
Kinross |
|
Proven |
|
Probable |
|
Proven and Probable |
| ||||||||||||
|
Property |
|
Location |
|
Interest |
|
Tonnes |
|
Grade |
|
Pounds |
|
Tonnes |
|
Grade |
|
Pounds |
|
Tonnes |
|
Grade |
|
Pounds |
|
|
|
|
|
|
(%) |
|
(kt) |
|
(%) |
|
(Mlb) |
|
(kt) |
|
(%) |
|
(Mlb) |
|
(kt) |
|
(%) |
|
(Mlb) |
|
|
SOUTH AMERICA |
|
|
|
|
|
|
|
|
|
|
|
|
|
|
|
|
|
|
|
|
|
|
|
|
Cerro Casale 9 |
|
Chile |
|
25.0 |
% |
57,425 |
|
0.19 |
|
240 |
|
241,975 |
|
0.23 |
|
1,204 |
|
299,400 |
|
0.22 |
|
1,444 |
|
|
SUBTOTAL |
|
|
|
|
|
57,425 |
|
0.19 |
|
240 |
|
241,975 |
|
0.23 |
|
1,204 |
|
299,400 |
|
0.22 |
|
1,444 |
|
|
|
|
|
|
|
|
|
|
|
|
|
|
|
|
|
|
|
|
|
|
|
|
|
|
|
TOTAL COPPER |
|
|
|
|
|
57,425 |
|
0.19 |
|
240 |
|
241,975 |
|
0.23 |
|
1,204 |
|
299,400 |
|
0.22 |
|
1,444 |
|
Measured and Indicated Mineral Resources
Cautionary Note to United States Investors Concerning Estimates of Measured and Indicated Mineral Resources
This section uses the terms “Measured” and “Indicated” mineral resources. United States investors are advised that while those terms are recognized and required by Canadian regulations, the United States Securities and Exchange Commission
does not recognize them. United States investors are cautioned not to assume that all or any part of mineral deposits in these categories will ever be converted into proven and probable mineral reserves or recovered.
|
MINERAL RESERVE AND MINERAL RESOURCE STATEMENT |
GOLD |
|
MEASURED AND INDICATED MINERAL RESOURCES (EXCLUDES PROVEN AND PROBABLE MINERAL RESERVES) (2),(3),(4),(5),(6),(7),(8),(9),(10),(11) |
|
|
Kinross Gold Corporation’s Share at December 31, 2015 |
|
|
|
|
|
|
Kinross |
|
Measured |
|
Indicated |
|
Measured and Indicated |
| ||||||||||||
|
Property |
|
Location |
|
Interest |
|
Tonnes |
|
Grade |
|
Ounces |
|
Tonnes |
|
Grade |
|
Ounces |
|
Tonnes |
|
Grade |
|
Ounces |
|
|
|
|
|
|
(%) |
|
(kt) |
|
(g/t) |
|
(koz) |
|
(kt) |
|
(g/t) |
|
(koz) |
|
(kt) |
|
(g/t) |
|
(koz) |
|
|
NORTH AMERICA |
|
|
|
|
|
|
|
|
|
|
|
|
|
|
|
|
|
|
|
|
|
|
|
|
Bald Mountain 8 |
|
USA |
|
100.0 |
% |
36,337 |
|
0.8 |
|
951 |
|
152,634 |
|
0.6 |
|
2,982 |
|
188,971 |
|
0.6 |
|
3,933 |
|
|
Fort Knox Area |
|
USA |
|
100.0 |
% |
7,077 |
|
0.5 |
|
103 |
|
88,745 |
|
0.5 |
|
1,320 |
|
95,822 |
|
0.5 |
|
1,423 |
|
|
Kettle River |
|
USA |
|
100.0 |
% |
— |
|
— |
|
— |
|
72 |
|
5.1 |
|
12 |
|
72 |
|
5.1 |
|
12 |
|
|
Round Mountain Area 8 |
|
USA |
|
100.0 |
% |
14,624 |
|
0.5 |
|
258 |
|
27,534 |
|
0.5 |
|
425 |
|
42,158 |
|
0.5 |
|
683 |
|
|
White Gold |
|
Yukon |
|
100.0 |
% |
— |
|
— |
|
— |
|
9,788 |
|
2.7 |
|
840 |
|
9,788 |
|
2.7 |
|
840 |
|
|
SUBTOTAL |
|
|
|
|
|
58,038 |
|
0.7 |
|
1,312 |
|
278,773 |
|
0.6 |
|
5,579 |
|
336,811 |
|
0.6 |
|
6,891 |
|
|
|
|
|
|
|
|
|
|
|
|
|
|
|
|
|
|
|
|
|
|
|
|
|
|
|
SOUTH AMERICA |
|
|
|
|
|
|
|
|
|
|
|
|
|
|
|
|
|
|
|
|
|
|
|
|
Cerro Casale 9 |
|
Chile |
|
25.0 |
% |
5,739 |
|
0.3 |
|
56 |
|
68,423 |
|
0.4 |
|
787 |
|
74,162 |
|
0.4 |
|
843 |
|
|
La Coipa 10 |
|
Chile |
|
100.0 |
% |
5,364 |
|
1.8 |
|
307 |
|
25,452 |
|
1.8 |
|
1,440 |
|
30,816 |
|
1.8 |
|
1,747 |
|
|
Lobo Marte |
|
Chile |
|
100.0 |
% |
96,646 |
|
1.1 |
|
3,525 |
|
88,720 |
|
1.2 |
|
3,489 |
|
185,366 |
|
1.2 |
|
7,014 |
|
|
Maricunga |
|
Chile |
|
100.0 |
% |
17,860 |
|
0.8 |
|
445 |
|
180,224 |
|
0.7 |
|
3,830 |
|
198,084 |
|
0.7 |
|
4,275 |
|
|
Paracatu |
|
Brazil |
|
100.0 |
% |
137,307 |
|
0.3 |
|
1,264 |
|
178,201 |
|
0.3 |
|
2,003 |
|
315,508 |
|
0.3 |
|
3,267 |
|
|
SUBTOTAL |
|
|
|
|
|
262,916 |
|
0.7 |
|
5,597 |
|
541,020 |
|
0.7 |
|
11,549 |
|
803,936 |
|
0.7 |
|
17,146 |
|
|
|
|
|
|
|
|
|
|
|
|
|
|
|
|
|
|
|
|
|
|
|
|
|
|
|
AFRICA |
|
|
|
|
|
|
|
|
|
|
|
|
|
|
|
|
|
|
|
|
|
|
|
|
Chirano |
|
Ghana |
|
90.0 |
% |
3,378 |
|
1.5 |
|
161 |
|
7,585 |
|
2.4 |
|
578 |
|
10,963 |
|
2.1 |
|
739 |
|
|
Tasiast 11 |
|
Mauritania |
|
100.0 |
% |
8,611 |
|
0.8 |
|
230 |
|
66,236 |
|
1.4 |
|
2,980 |
|
74,847 |
|
1.3 |
|
3,210 |
|
|
SUBTOTAL |
|
|
|
|
|
11,989 |
|
1.0 |
|
391 |
|
73,821 |
|
1.5 |
|
3,558 |
|
85,810 |
|
1.4 |
|
3,949 |
|
|
|
|
|
|
|
|
|
|
|
|
|
|
|
|
|
|
|
|
|
|
|
|
|
|
|
RUSSIA |
|
|
|
|
|
|
|
|
|
|
|
|
|
|
|
|
|
|
|
|
|
|
|
|
Dvoinoye |
|
Russia |
|
100.0 |
% |
4 |
|
8.0 |
|
1 |
|
132 |
|
18.2 |
|
77 |
|
136 |
|
17.9 |
|
78 |
|
|
Kupol |
|
Russia |
|
100.0 |
% |
146 |
|
6.5 |
|
31 |
|
1,018 |
|
7.3 |
|
240 |
|
1,164 |
|
7.2 |
|
271 |
|
|
SUBTOTAL |
|
|
|
|
|
150 |
|
6.6 |
|
32 |
|
1,150 |
|
8.6 |
|
317 |
|
1,300 |
|
8.4 |
|
349 |
|
|
|
|
|
|
|
|
|
|
|
|
|
|
|
|
|
|
|
|
|
|
|
|
|
|
|
TOTAL GOLD |
|
|
|
|
|
333,093 |
|
0.7 |
|
7,332 |
|
894,764 |
|
0.7 |
|
21,003 |
|
1,227,857 |
|
0.7 |
|
28,335 |
|
|
MINERAL RESERVE AND MINERAL RESOURCE STATEMENT |
SILVER |
|
MEASURED AND INDICATED MINERAL RESOURCES (EXCLUDES PROVEN AND PROBABLE MINERAL RESERVES) (2),(3),(4),(5),(6),(7),(8),(9),(10) |
|
|
Kinross Gold Corporation’s Share at December 31, 2015 |
|
|
|
|
|
|
Kinross |
|
Measured |
|
Indicated |
|
Measured and Indicated |
| ||||||||||||
|
Property |
|
Location |
|
Interest |
|
Tonnes |
|
Grade |
|
Ounces |
|
Tonnes |
|
Grade |
|
Ounces |
|
Tonnes |
|
Grade |
|
Ounces |
|
|
|
|
|
|
(%) |
|
(kt) |
|
(g/t) |
|
(koz) |
|
(kt) |
|
(g/t) |
|
(koz) |
|
(kt) |
|
(g/t) |
|
(koz) |
|
|
NORTH AMERICA |
|
|
|
|
|
|
|
|
|
|
|
|
|
|
|
|
|
|
|
|
|
|
|
|
Round Mountain Area 8 |
|
USA |
|
100.0 |
% |
1,214 |
|
9.3 |
|
362 |
|
10,025 |
|
7.2 |
|
2,325 |
|
11,239 |
|
7.4 |
|
2,687 |
|
|
SUBTOTAL |
|
|
|
|
|
1,214 |
|
9.3 |
|
362 |
|
10,025 |
|
7.2 |
|
2,325 |
|
11,239 |
|
7.4 |
|
2,687 |
|
|
|
|
|
|
|
|
|
|
|
|
|
|
|
|
|
|
|
|
|
|
|
|
|
|
|
SOUTH AMERICA |
|
|
|
|
|
|
|
|
|
|
|
|
|
|
|
|
|
|
|
|
|
|
|
|
Cerro Casale 9 |
|
Chile |
|
25.0 |
% |
5,739 |
|
1.2 |
|
220 |
|
68,423 |
|
1.1 |
|
2,328 |
|
74,162 |
|
1.1 |
|
2,548 |
|
|
La Coipa 10 |
|
Chile |
|
100.0 |
% |
5,364 |
|
40.0 |
|
6,893 |
|
25,452 |
|
70.1 |
|
57,341 |
|
30,816 |
|
64.8 |
|
64,234 |
|
|
SUBTOTAL |
|
|
|
|
|
11,103 |
|
19.9 |
|
7,113 |
|
93,875 |
|
19.8 |
|
59,669 |
|
104,978 |
|
19.8 |
|
66,782 |
|
|
|
|
|
|
|
|
|
|
|
|
|
|
|
|
|
|
|
|
|
|
|
|
|
|
|
RUSSIA |
|
|
|
|
|
|
|
|
|
|
|
|
|
|
|
|
|
|
|
|
|
|
|
|
Dvoinoye |
|
Russia |
|
100.0 |
% |
4 |
|
6.6 |
|
1 |
|
132 |
|
15.9 |
|
68 |
|
136 |
|
15.7 |
|
69 |
|
|
Kupol |
|
Russia |
|
100.0 |
% |
146 |
|
82.4 |
|
387 |
|
1,018 |
|
98.8 |
|
3,234 |
|
1,164 |
|
96.8 |
|
3,621 |
|
|
SUBTOTAL |
|
|
|
|
|
150 |
|
80.3 |
|
388 |
|
1,150 |
|
89.3 |
|
3,302 |
|
1,300 |
|
88.3 |
|
3,690 |
|
|
|
|
|
|
|
|
|
|
|
|
|
|
|
|
|
|
|
|
|
|
|
|
|
|
|
TOTAL SILVER |
|
|
|
|
|
12,467 |
|
19.6 |
|
7,863 |
|
105,050 |
|
19.3 |
|
65,296 |
|
117,517 |
|
19.4 |
|
73,159 |
|
|
MINERAL RESERVE AND MINERAL RESOURCE STATEMENT |
COPPER |
|
MEASURED AND INDICATED MINERAL RESOURCES (EXCLUDES PROVEN AND PROBABLE MINERAL RESERVES) (2),(3),(4),(5),(6),(7),(9) |
|
|
Kinross Gold Corporation’s Share at December 31, 2015 |
|
|
|
|
|
|
Kinross |
|
Measured |
|
Indicated |
|
Measured and Indicated |
| ||||||||||||
|
Property |
|
Location |
|
Interest |
|
Tonnes |
|
Grade |
|
Pounds |
|
Tonnes |
|
Grade |
|
Pounds |
|
Tonnes |
|
Grade |
|
Pounds |
|
|
|
|
|
|
(%) |
|
(kt) |
|
(%) |
|
(Mlb) |
|
(kt) |
|
(%) |
|
(Mlb) |
|
(kt) |
|
(%) |
|
(Mlb) |
|
|
SOUTH AMERICA |
|
|
|
|
|
|
|
|
|
|
|
|
|
|
|
|
|
|
|
|
|
|
|
|
Cerro Casale 9 |
|
Chile |
|
25.0 |
% |
5,739 |
|
0.13 |
|
17 |
|
68,423 |
|
0.16 |
|
248 |
|
74,162 |
|
0.16 |
|
265 |
|
|
SUBTOTAL |
|
|
|
|
|
5,739 |
|
0.13 |
|
17 |
|
68,423 |
|
0.16 |
|
248 |
|
74,162 |
|
0.16 |
|
265 |
|
|
|
|
|
|
|
|
|
|
|
|
|
|
|
|
|
|
|
|
|
|
|
|
|
|
|
TOTAL COPPER |
|
|
|
|
|
5,739 |
|
0.13 |
|
17 |
|
68,423 |
|
0.16 |
|
248 |
|
74,162 |
|
0.16 |
|
265 |
|
Inferred Mineral Resources
Cautionary Note to United States Investors Concerning Estimates of Inferred Mineral Resources
This section uses the term “Inferred” mineral resources. United States investors are advised that while those terms are recognized and required by Canadian regulations, the United States Securities and Exchange Commission does not
recognize them. United States investors are cautioned not to assume that all or any part of mineral deposits in these categories will ever be converted into proven and probable mineral reserves or recovered.
|
MINERAL RESERVE AND MINERAL RESOURCE STATEMENT |
GOLD | |||||||||||||
|
INFERRED MINERAL RESOURCES (2),(3),(4),(5),(6),(7),(8),(9),(10),(11) |
| |||||||||||||
|
Kinross Gold Corporation’s Share at December 31, 2015 |
| |||||||||||||
|
|
| |||||||||||||
|
|
|
|
|
Kinross |
|
Inferred |
| |||||||
|
Property |
|
Location |
|
Interest |
|
Tonnes |
|
Grade |
|
Ounces |
| |||
|
|
|
|
|
(%) |
|
(kt) |
|
(g/t) |
|
(koz) |
| |||
|
NORTH AMERICA |
|
|
|
|
|
|
|
|
|
|
| |||
|
Bald Mountain 8 |
|
USA |
|
100.0 |
% |
24,396 |
|
0.5 |
|
378 |
| |||
|
Fort Knox Area |
|
USA |
|
100.0 |
% |
14,824 |
|
0.5 |
|
221 |
| |||
|
Kettle River |
|
USA |
|
100.0 |
% |
36 |
|
6.7 |
|
8 |
| |||
|
Round Mountain Area 8 |
|
USA |
|
100.0 |
% |
16,205 |
|
0.4 |
|
233 |
| |||
|
White Gold |
|
Yukon |
|
100.0 |
% |
2,166 |
|
1.8 |
|
125 |
| |||
|
SUBTOTAL |
|
|
|
|
|
57,627 |
|
0.5 |
|
965 |
| |||
|
|
|
|
|
|
|
|
|
|
|
|
| |||
|
SOUTH AMERICA |
|
|
|
|
|
|
|
|
|
|
| |||
|
Cerro Casale 9 |
|
Chile |
|
25.0 |
% |
123,860 |
|
0.4 |
|
1,498 |
| |||
|
La Coipa 10 |
|
Chile |
|
100.0 |
% |
2,121 |
|
1.5 |
|
101 |
| |||
|
Lobo Marte |
|
Chile |
|
100.0 |
% |
2,003 |
|
1.1 |
|
69 |
| |||
|
Maricunga |
|
Chile |
|
100.0 |
% |
53,942 |
|
0.6 |
|
1,053 |
| |||
|
Paracatu |
|
Brazil |
|
100.0 |
% |
10,515 |
|
0.4 |
|
143 |
| |||
|
SUBTOTAL |
|
|
|
|
|
192,441 |
|
0.5 |
|
2,864 |
| |||
|
|
|
|
|
|
|
|
|
|
|
|
| |||
|
AFRICA |
|
|
|
|
|
|
|
|
|
|
| |||
|
Chirano |
|
Ghana |
|
90.0 |
% |
1,602 |
|
2.9 |
|
149 |
| |||
|
Tasiast 11 |
|
Mauritania |
|
100.0 |
% |
5,596 |
|
1.9 |
|
346 |
| |||
|
SUBTOTAL |
|
|
|
|
|
7,198 |
|
2.1 |
|
495 |
| |||
|
|
|
|
|
|
|
|
|
|
|
|
| |||
|
RUSSIA |
|
|
|
|
|
|
|
|
|
|
| |||
|
Dvoinoye |
|
Russia |
|
100.0 |
% |
78 |
|
9.8 |
|
25 |
| |||
|
Kupol |
|
Russia |
|
100.0 |
% |
404 |
|
8.3 |
|
108 |
| |||
|
SUBTOTAL |
|
|
|
|
|
482 |
|
8.6 |
|
133 |
| |||
|
|
|
|
|
|
|
|
|
|
|
|
| |||
|
TOTAL GOLD |
|
|
|
|
|
257,748 |
|
0.5 |
|
4,457 |
| |||
|
|
| |||||||||||||
|
MINERAL RESERVE AND MINERAL RESOURCE STATEMENT |
SILVER | |||||||||||||
|
INFERRED MINERAL RESOURCES (2),(3),(4),(5),(6),(7),(8),(9),(10) |
| |||||||||||||
|
Kinross Gold Corporation’s Share at December 31, 2015 |
| |||||||||||||
|
|
| |||||||||||||
|
|
|
|
|
Kinross |
|
Inferred |
| |||||||
|
Property |
|
Location |
|
Interest |
|
Tonnes |
|
Grade |
|
Ounces |
| |||
|
|
|
|
|
(%) |
|
(kt) |
|
(g/t) |
|
(koz) |
| |||
|
NORTH AMERICA |
|
|
|
|
|
|
|
|
|
|
| |||
|
Round Mountain Area 8 |
|
USA |
|
100.0 |
% |
2,377 |
|
5.9 |
|
454 |
| |||
|
SUBTOTAL |
|
|
|
|
|
2,377 |
|
5.9 |
|
454 |
| |||
|
|
|
|
|
|
|
|
|
|
|
|
| |||
|
SOUTH AMERICA |
|
|
|
|
|
|
|
|
|
|
| |||
|
Cerro Casale 9 |
|
Chile |
|
25.0 |
% |
123,860 |
|
1.0 |
|
4,126 |
| |||
|
La Coipa 10 |
|
Chile |
|
100.0 |
% |
2,121 |
|
45.2 |
|
3,081 |
| |||
|
SUBTOTAL |
|
|
|
|
|
125,981 |
|
1.8 |
|
7,207 |
| |||
|
|
|
|
|
|
|
|
|
|
|
|
| |||
|
RUSSIA |
|
|
|
|
|
|
|
|
|
|
| |||
|
Dvoinoye |
|
Russia |
|
100.0 |
% |
78 |
|
13.7 |
|
34 |
| |||
|
Kupol |
|
Russia |
|
100.0 |
% |
404 |
|
125.2 |
|
1,626 |
| |||
|
SUBTOTAL |
|
|
|
|
|
482 |
|
107.2 |
|
1,660 |
| |||
|
|
|
|
|
|
|
|
|
|
|
|
| |||
|
TOTAL SILVER |
|
|
|
|
|
128,840 |
|
2.3 |
|
9,321 |
| |||
|
|
| |||||||||||||
|
MINERAL RESERVE AND MINERAL RESOURCE STATEMENT |
COPPER | |||||||||||||
|
INFERRED MINERAL RESOURCES (2),(3),(4),(5),(6),(7),(9) |
| |||||||||||||
|
Kinross Gold Corporation’s Share at December 31, 2015 |
| |||||||||||||
|
|
| |||||||||||||
|
|
|
|
|
Kinross |
|
Inferred |
| |||||||
|
Property |
|
Location |
|
Interest |
|
Tonnes |
|
Grade |
|
Pounds |
| |||
|
|
|
|
|
(%) |
|
(kt) |
|
(%) |
|
(Mlb) |
| |||
|
SOUTH AMERICA |
|
|
|
|
|
|
|
|
|
|
| |||
|
Cerro Casale9 |
|
Chile |
|
25.0 |
% |
123,860 |
|
0.19 |
|
523 |
| |||
|
SUBTOTAL |
|
|
|
|
|
123,860 |
|
0.19 |
|
523 |
| |||
|
|
|
|
|
|
|
|
|
|
|
|
| |||
|
TOTAL COPPER |
|
|
|
|
|
123,860 |
|
0.19 |
|
523 |
| |||
Stockpiles
The following table reflects proven mineral reserves and measured resources attributable to Kinross’ ownership interest in stockpiles at the identified properties:
MINERAL RESERVE AND MINERAL RESOURCE STATEMENT
STOCKPILE INVENTORY (INCLUDED IN PROVEN AND PROBABLE MINERAL RESERVES) (8)
Kinross Gold Corporation’s Share at December 31, 2015
|
|
|
|
|
Kinross |
|
Proven |
|
Probable |
|
Proven and Probable |
| ||||||||||||
|
Property |
|
Location |
|
Interest |
|
Tonnes |
|
Grade |
|
Ounces |
|
Tonnes |
|
Grade |
|
Ounces |
|
Tonnes |
|
Grade |
|
Ounces |
|
|
|
|
|
|
(%) |
|
(kt) |
|
(g/t) |
|
(koz) |
|
(kt) |
|
(g/t) |
|
(koz) |
|
(kt) |
|
(g/t) |
|
(koz) |
|
|
GOLD |
|
|
|
|
|
|
|
|
|
|
|
|
|
|
|
|
|
|
|
|
|
|
|
|
Chirano Stockpile |
|
Ghana |
|
90.0 |
% |
4,837 |
|
1.0 |
|
148 |
|
— |
|
— |
|
— |
|
4,837 |
|
1.0 |
|
148 |
|
|
Dvoinoye Stockpile |
|
Russia |
|
100.0 |
% |
372 |
|
11.1 |
|
132 |
|
— |
|
— |
|
— |
|
372 |
|
11.1 |
|
132 |
|
|
Fort Knox Stockpile |
|
USA |
|
100.0 |
% |
21,738 |
|
0.3 |
|
212 |
|
— |
|
— |
|
— |
|
21,738 |
|
0.3 |
|
212 |
|
|
Kettle River Stockpile |
|
USA |
|
100.0 |
% |
— |
|
— |
|
— |
|
— |
|
— |
|
— |
|
— |
|
— |
|
— |
|
|
Kupol Stockpile |
|
Russia |
|
100.0 |
% |
289 |
|
7.0 |
|
65 |
|
— |
|
— |
|
— |
|
289 |
|
7.0 |
|
65 |
|
|
Maricunga Stockpile |
|
Chile |
|
100.0 |
% |
— |
|
— |
|
— |
|
— |
|
— |
|
— |
|
— |
|
— |
|
— |
|
|
Paracatu Stockpile |
|
Brazil |
|
100.0 |
% |
7,666 |
|
0.3 |
|
75 |
|
— |
|
— |
|
— |
|
7,666 |
|
0.3 |
|
75 |
|
|
Round Mountain Stockpile 8 |
|
USA |
|
100.0 |
% |
8,222 |
|
0.5 |
|
143 |
|
— |
|
— |
|
— |
|
8,222 |
|
0.5 |
|
143 |
|
|
Tasiast Stockpile |
|
Mauritania |
|
100.0 |
% |
8,045 |
|
1.0 |
|
264 |
|
— |
|
— |
|
— |
|
8,045 |
|
1.0 |
|
264 |
|
|
TOTAL |
|
|
|
|
|
51,169 |
|
0.6 |
|
1,039 |
|
— |
|
— |
|
— |
|
51,169 |
|
0.6 |
|
1,039 |
|
|
|
|
|
|
|
|
|
|
|
|
|
|
|
|
|
|
|
|
|
|
|
|
|
|
|
SILVER |
|
|
|
|
|
|
|
|
|
|
|
|
|
|
|
|
|
|
|
|
|
|
|
|
Dvoinoye Stockpile |
|
Russia |
|
100.0 |
% |
372 |
|
17.4 |
|
208 |
|
— |
|
— |
|
— |
|
372 |
|
17.4 |
|
208 |
|
|
Kupol Stockpile |
|
Russia |
|
100.0 |
% |
289 |
|
130.7 |
|
1,215 |
|
— |
|
— |
|
— |
|
289 |
|
130.7 |
|
1,215 |
|
|
TOTAL |
|
|
|
|
|
661 |
|
67.0 |
|
1,423 |
|
— |
|
— |
|
— |
|
661 |
|
67.0 |
|
1,423 |
|
MINERAL RESERVE AND MINERAL RESOURCE STATEMENT
STOCKPILE INVENTORY (INCLUDED IN MEASURED AND INDICATED MINERAL RESOURCES)
Kinross Gold Corporation’s Share at December 31, 2015
|
|
|
|
|
Kinross |
|
Measured |
|
Indicated |
|
Measured and Indicated |
| ||||||||||||
|
Property |
|
Location |
|
Interest |
|
Tonnes |
|
Grade |
|
Ounces |
|
Tonnes |
|
Grade |
|
Ounces |
|
Tonnes |
|
Grade |
|
Ounces |
|
|
|
|
|
|
(%) |
|
(kt) |
|
(g/t) |
|
(koz) |
|
(kt) |
|
(g/t) |
|
(koz) |
|
(kt) |
|
(g/t) |
|
(koz) |
|
|
GOLD |
|
|
|
|
|
|
|
|
|
|
|
|
|
|
|
|
|
|
|
|
|
|
|
|
Tasiast Stockpile |
|
Mauritania |
|
100.0 |
% |
293 |
|
0.6 |
|
6 |
|
— |
|
— |
|
— |
|
293 |
|
0.6 |
|
6 |
|
|
TOTAL |
|
|
|
|
|
293 |
|
0.6 |
|
6 |
|
— |
|
— |
|
— |
|
293 |
|
0.6 |
|
6 |
|
MINERAL RESERVE AND MINERAL RESOURCE STATEMENT
STOCKPILE INVENTORY (INCLUDED IN INFERRED MINERAL RESOURCES)
Kinross Gold Corporation’s Share at December 31, 2015
|
|
|
|
|
Kinross |
|
Measured |
| ||||
|
Property |
|
Location |
|
Interest |
|
Tonnes |
|
Grade |
|
Ounces |
|
|
|
|
|
|
(%) |
|
(kt) |
|
(g/t) |
|
(koz) |
|
|
GOLD |
|
|
|
|
|
|
|
|
|
|
|
|
Maricunga Stockpile |
|
Chile |
|
100.0 |
% |
7,065 |
|
0.4 |
|
97 |
|
|
Paracatu Stockpile |
|
Brazil |
|
100.0 |
% |
3,679 |
|
0.4 |
|
46 |
|
|
TOTAL |
|
|
|
|
|
10,744 |
|
0.4 |
|
143 |
|
Notes – 2015 Kinross Mineral Reserve & Resource Statements
MINERAL RESERVE AND MINERAL RESOURCE STATEMENT NOTES
(1) Unless otherwise noted, the Company’s mineral reserves are estimated using appropriate cut-off grades based on an assumed gold price of $US 1,200 per ounce, a silver price of $US 17.00 per ounce and a copper price of $US $3.00 per pound. Mineral reserves are estimated using appropriate process recoveries, operating costs and mine plans that are unique to each property and include estimated allowances for dilution and mining recovery. Mineral reserve estimates are reported in contained units and are estimated based on the following foreign exchange rates:
Russian Ruble to $US 50
Chilean Peso to $US 600
Brazilian Real to $US 3.0
Ghanaian Cedi to $US 3.5
Mauritanian Ouguiya to $US 300
(2) Unless otherwise noted, the Company’s mineral resources are estimated using appropriate cut-off grades based on a gold price of $US 1,400 per ounce, a silver price of $US 20.00 per ounce, a copper price of $US $3.00 per pound. Foreign exchange rates for estimating mineral resources were the same as for mineral reserves.
(3) The Company’s mineral reserve and mineral resource estimates as at December 31, 2015 are classified in accordance with the Canadian Institute of Mining, Metallurgy and Petroleum (“CIM”) “CIM Definition Standards - For Mineral Resources and Mineral Reserves” adopted by the CIM Council (as amended, the “CIM Definition Standards”) in accordance with the requirements of National Instrument 43-101 “Standards of Disclosure for Mineral Projects” (“NI 43-101”). Mineral reserve and mineral resource estimates reflect the Company’s reasonable expectation that all necessary permits and approvals will be obtained and maintained.
(4) Cautionary note to U.S. Investors concerning estimates of mineral reserves and mineral resources. These estimates have been prepared in accordance with the requirements of Canadian securities laws, which differ from the requirements of United States’ securities laws. The terms “mineral reserve”, “proven mineral reserve and “probable mineral reserve” are Canadian mining terms as defined in accordance with NI 43-101 and the CIM Definition Standards. The CIM Definition Standards differ from the definitions in the United States Securities and Exchange Commission (“SEC”) Guide 7 (“SEC Guide 7”) under the United States Securities Act of 1933, as amended. Under SEC Guide 7, a “final” or “bankable” feasibility study is required to report mineral reserves, the three-year historical average price is used in any mineral reserve or cash flow analysis to designate mineral reserves and the primary environmental analysis or report must be filed with the appropriate governmental authority. In addition, the terms “mineral resource”, “measured mineral resource”, “indicated mineral resource” and “inferred mineral resource” are defined in NI 43-101 and recognized by Canadian securities laws but are not defined terms under SEC Guide 7 or recognized under U.S. securities laws. U.S. investors are cautioned not to assume that any part or all of mineral deposits in these categories will ever be upgraded to mineral reserves. “Inferred mineral resources” have a great amount of uncertainty as to their existence, and great uncertainty as to their economic and legal feasibility. It cannot be assumed that all or any part of an “inferred mineral resource” will ever by upgraded to a higher category. Under Canadian securities laws, estimates of “inferred mineral resources” may not form the basis of feasibility or pre-feasibility studies, except in rare cases. U.S. investors are cautioned not to assume that all or any part of an inferred mineral resource exists or is economically or legally mineable. Accordingly, these mineral reserve and mineral resource estimates and related information may not be comparable to similar information made public by U.S. companies subject to the reporting and disclosure requirements under the United States federal laws and the rules and regulations thereunder, including SEC Guide 7.
(5) Except as provided in Note (9), the Company’s mineral resource and mineral reserve estimates were prepared under the supervision of and verified by Mr. John Sims, an officer of Kinross, who is a qualified person as defined by NI 43-101.
(6) The Company’s normal data verification procedures have been used in collecting, compiling, interpreting and processing the data used to estimate mineral reserves and mineral resources. Independent data verification has not been performed.
(7) Mineral resources that are not mineral reserves do not have to demonstrate economic viability. Mineral resources are subject to infill drilling, permitting, mine planning, mining dilution and recovery losses, among other things, to be converted into mineral reserves. Due to the uncertainty associated with inferred mineral resources, it cannot be assumed that all or any part of an inferred mineral resource will ever be upgraded to indicated or measured mineral resources, including as a result of continued exploration.
(8) Bald Mountain and the remaining 50% interest of Round Mountain were were acquired by Kinross effective January 11, 2016.
(9) Estimates for the Cerro Casale project are based on a project update completed by Barrick Gold Corporation in the first half of 2011 and have been updated to reflect current guidance. Mineral reserves and mineral resources are estimated using appropriate cut-off grades based on the following commodity prices and foreign exchange rates:
Mineral reserves - Gold price of $US 1,000 per ounce, Silver price of $US 16.00 per ounce, Copper price of $US 2.00 per pound, Chilean Peso to $US 525
Mineral resources - Gold price of $US 1,400 per ounce, Silver price of $US 19.00 per ounce, Copper price of $US 3.50 per pound, Chilean Peso to $US 585
The mineral reserve and mineral resource estimates for Cerro Casale were prepared under the supervision of Mr. Rick Sims, who is a qualified person as defined by NI 43-101.
(10) Includes mineral resources from the Puren deposit in which the Company holds a 65% interest. Mineral resources for the Phase 7 project are reported at 100% ownership, however Kinross has a 75% interest in the Phase 7 project.
(11) The Tasiast proven and probable mineral reserve, and measured, indicated and inferred mineral resource estimates in this table, as at December 31, 2015, are based on the results of the pre-feasibility study assessing the 30,000 tonnes per day CIL mill expansion. For further information, please see the Company’s news release dated March 30, 2016 and the National Instrument 43-101 Technical Report for Tasiast dated March 30, 2016, both available at www.kinross.com and under the Company’s profile on SEDAR (www.sedar.com).
The following table summarizes the assumptions used in estimating mineral reserves, including average process recovery, cut-off grade assumptions, the foreign exchange rate into U.S. dollars, unit cost per tonne, and reserve drill spacing.
|
|
|
Average |
|
2015 |
|
Unit |
|
|
|
|
Process |
|
Cutoff Grade(s) |
|
Cost |
|
|
Property |
|
Recovery (%) |
|
(g/t Au) |
|
(U.S. $/tonne) |
|
|
Bald Mountain |
|
59% to 76% |
|
0.23 to 0.33 |
|
$4.83 to $5.13 |
|
|
Fort Knox and Area |
|
65% to 82% |
|
0.11 to 0.33 |
|
$2.43 to $9.39 |
|
|
Kettle River - Buckhorn |
|
92% |
|
6.52 to 7.06 |
|
$199.35 to $231.72 |
|
|
Round Mountain and Area |
|
6% to 66% |
|
0.20 to 2.38 |
|
$4.77 to $11.92 |
|
|
Cerro Casale |
|
50% to 95% |
|
0.18 to 0.41 |
|
$2.9 to $7.7 |
|
|
Maricunga |
|
53 to 77% |
|
0.44 to 0.56 |
|
$10.54 to $10.60 |
|
|
Paracatu |
|
77% |
|
0.27 |
|
$7.90 |
|
|
Chirano |
|
92% |
|
0.88 to 2.56 |
|
$26.80 to $66.52 |
|
|
Tasiast |
|
60 to 93% |
|
0.4 to 0.7 |
|
$10.90 to $23.35 |
|
|
Dvoinoye |
|
93% |
|
3.67 to 7.73 |
|
$97.44 to $206.76 |
|
|
Kupol |
|
87% to 90% |
|
6 g/t AuEq* |
|
$90.58 to $181.05 |
|
|
|
|
|
|
(g/t Ag) |
|
|
|
|
SILVER |
|
|
|
|
|
|
|
|
Round Mountain and Area |
|
5 to 32% (Gold Hill) |
|
Included as AuEq* |
|
$4.77 to $11.92 |
|
|
Cerro Casale |
|
n/a |
|
n/a |
|
$2.9 to $7.7 |
|
|
Dvoinoye |
|
83% |
|
n/a |
|
$97.44 to $206.76 |
|
|
Kupol |
|
77% |
|
Included as AuEq* |
|
$90.58 to $181.05 |
|
|
|
|
|
|
(% Cu) |
|
|
|
|
COPPER |
|
|
|
|
|
|
|
|
Cerro Casale |
|
75% to 95% |
|
0.20 to 0.30% |
|
$2.9 to $7.7 |
|
* The cut-off grade at Round Mountain and Kupol is applied on a gold equivalent basis, using a silver to gold price ratio of 0.0142. The ratio of silver to gold recovery is also used at Round Mountain, and varies by ore type.
Reserve reconciliation is shown in the following tables:
2014 - 2015 Reserve Reconciliation
Gold Reserves (Proven and Probable)
|
|
|
Kinross |
|
2014 |
|
Production |
|
Exploration/ |
|
M&A/Divestiture |
|
Reserve Growth |
|
2015 |
|
|
Mining Operation/Project |
|
Interest |
|
Reserves |
|
Depletion |
|
Engineering Change |
|
Change |
|
or Depletion |
|
Reserves |
|
|
|
|
(%) |
|
(koz) |
|
(koz) |
|
(koz) |
|
(koz) |
|
(koz) |
|
(koz) |
|
|
|
|
|
|
|
|
|
|
|
|
|
|
|
|
|
|
|
NORTH AMERICA |
|
|
|
|
|
|
|
|
|
|
|
|
|
|
|
|
Bald Mountain |
|
100 |
% |
— |
|
— |
|
— |
|
1,117 |
|
1,117 |
|
1,117 |
|
|
Fort Knox |
|
100 |
% |
2,398 |
|
(504 |
) |
128 |
|
— |
|
(376 |
) |
2,022 |
|
|
Kettle River - Buckhorn |
|
100 |
% |
101 |
|
(99 |
) |
45 |
|
— |
|
(54 |
) |
47 |
|
|
Round Mountain Area |
|
100 |
% |
690 |
|
(349 |
) |
440 |
|
690 |
|
780 |
|
1,470 |
|
|
SUBTOTAL |
|
|
|
3,189 |
|
(952 |
) |
613 |
|
1,807 |
|
1,467 |
|
4,656 |
|
|
|
|
|
|
|
|
|
|
|
|
|
|
|
|
|
|
|
SOUTH AMERICA |
|
|
|
|
|
|
|
|
|
|
|
|
|
|
|
|
Cerro Casale |
|
25 |
% |
5,811 |
|
— |
|
— |
|
— |
|
— |
|
5,811 |
|
|
Maricunga Area |
|
100 |
% |
1,670 |
|
(304 |
) |
(323 |
) |
— |
|
(628 |
) |
1,042 |
|
|
Paracatu |
|
100 |
% |
10,510 |
|
(822 |
) |
(43 |
) |
— |
|
(865 |
) |
9,645 |
|
|
SUBTOTAL |
|
|
|
17,991 |
|
(1,126 |
) |
(366 |
) |
— |
|
(1,493 |
) |
16,498 |
|
|
|
|
|
|
|
|
|
|
|
|
|
|
|
|
|
|
|
AFRICA |
|
|
|
|
|
|
|
|
|
|
|
|
|
|
|
|
Chirano |
|
90 |
% |
924 |
|
(245 |
) |
457 |
|
— |
|
211 |
|
1,135 |
|
|
Tasiast |
|
100 |
% |
9,196 |
|
(244 |
) |
(733 |
) |
— |
|
(977 |
) |
8,219 |
|
|
SUBTOTAL |
|
|
|
10,120 |
|
(489 |
) |
(276 |
) |
— |
|
(766 |
) |
9,354 |
|
|
|
|
|
|
|
|
|
|
|
|
|
|
|
|
|
|
|
RUSSIA |
|
|
|
|
|
|
|
|
|
|
|
|
|
|
|
|
Dvoinoye |
|
100 |
% |
1,028 |
|
(353 |
) |
139 |
|
— |
|
(213 |
) |
815 |
|
|
Kupol |
|
100 |
% |
2,089 |
|
(375 |
) |
186 |
|
— |
|
(190 |
) |
1,899 |
|
|
SUBTOTAL |
|
|
|
3,117 |
|
(728 |
) |
325 |
|
— |
|
(403 |
) |
2,714 |
|
|
TOTAL GOLD |
|
|
|
34,417 |
|
(3,295 |
) |
296 |
|
1,807 |
|
(1,195 |
) |
33,222 |
|
Silver Reserves (Proven and Probable)
|
|
|
Kinross |
|
2014 |
|
Production |
|
Exploration/ |
|
M&A/Divestiture |
|
Reserve Growth |
|
2015 |
|
|
Mining Operation/Project |
|
Interest |
|
Reserves |
|
Depletion |
|
Engineering Change |
|
Change |
|
or Depletion |
|
Reserves |
|
|
|
|
(%) |
|
(koz) |
|
(koz) |
|
(koz) |
|
(koz) |
|
(koz) |
|
(koz) |
|
|
NORTH AMERICA |
|
|
|
|
|
|
|
|
|
|
|
|
|
|
|
|
Round Mountain Area |
|
100 |
% |
935 |
|
(997 |
) |
(3 |
) |
935 |
|
(65 |
) |
870 |
|
|
SUBTOTAL |
|
|
|
935 |
|
(997 |
) |
(3 |
) |
935 |
|
(65 |
) |
870 |
|
|
|
|
|
|
|
|
|
|
|
|
|
|
|
|
|
|
|
SOUTH AMERICA |
|
|
|
|
|
|
|
|
|
|
|
|
|
|
|
|
Cerro Casale |
|
25 |
% |
14,672 |
|
— |
|
— |
|
— |
|
— |
|
14,672 |
|
|
SUBTOTAL |
|
|
|
14,672 |
|
— |
|
— |
|
— |
|
— |
|
14,672 |
|
|
|
|
|
|
|
|
|
|
|
|
|
|
|
|
|
|
|
RUSSIA |
|
|
|
|
|
|
|
|
|
|
|
|
|
|
|
|
Dvoinoye |
|
100 |
% |
1,588 |
|
(558 |
) |
288 |
|
— |
|
(271 |
) |
1,317 |
|
|
Kupol |
|
100 |
% |
26,843 |
|
(4,857 |
) |
2,136 |
|
— |
|
(2,720 |
) |
24,123 |
|
|
SUBTOTAL |
|
|
|
28,431 |
|
(5,415 |
) |
2,424 |
|
— |
|
(2,991 |
) |
25,440 |
|
|
TOTAL SILVER |
|
|
|
44,038 |
|
(6,412 |
) |
2,421 |
|
935 |
|
(3,056 |
) |
40,982 |
|
Copper Reserves (Proven and Probable)
|
|
|
Kinross |
|
2014 |
|
Production |
|
Exploration/ |
|
M&A/Divestiture |
|
Reserve Growth |
|
2015 |
|
|
Mining Operation/Project |
|
Interest |
|
Reserves |
|
Depletion |
|
Engineering Change |
|
Change |
|
or Depletion |
|
Reserves |
|
|
|
|
(%) |
|
(Mlbs) |
|
(Mlbs) |
|
(Mlbs) |
|
(Mlbs) |
|
(Mlbs) |
|
(Mlbs) |
|
|
SOUTH AMERICA |
|
|
|
|
|
|
|
|
|
|
|
|
|
|
|
|
Cerro Casale |
|
25 |
% |
1,444 |
|
— |
|
— |
|
— |
|
— |
|
1,444 |
|
|
SUBTOTAL |
|
|
|
1,444 |
|
— |
|
— |
|
— |
|
— |
|
1,444 |
|
|
TOTAL COPPER |
|
|
|
1,444 |
|
— |
|
— |
|
— |
|
— |
|
1,444 |
|
Note: Mineral reserves are inclusive of stockpile material.
Footnotes from Reserve statement apply.
Kinross Material Properties
The technical information in this Annual Information Form, has been prepared under the supervision of, or reviewed by, Mr. John Sims, a qualified person under NI 43-101, who is an officer of the Company.
Paracatu, Brazil
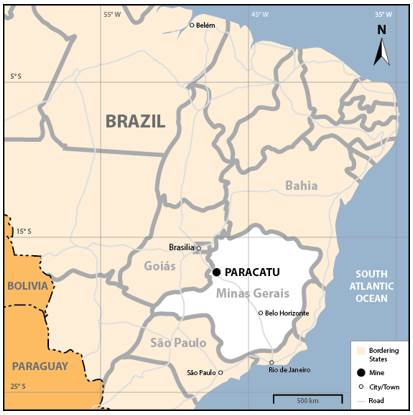
General
Kinross is the owner of the Paracatu mine located in the northwestern portion of the Minas Gerais State in Brazil. The Paracatu mine includes an open pit mine, two process plants (“Plant I” and “Plant II”), two tailings facilities areas, Santo Antônio and Eustáquio, and related surface infrastructure.
The Paracatu mine is 100% owned and operated by Kinross’ wholly-owned subsidiary Kinross Brasil Mineração S.A. (“KBM”). The site is known locally as “Morro do Ouro”.
Detailed financial, production and operational information for the Paracatu mine is available in Kinross’ MD&A for the year ended December 31, 2015. In addition, please see the Company’s National Instrument 43-101 Technical Report dated March 31, 2014 in respect of Paracatu, available at www.kinross.com and under the Company’s profile on SEDAR (www.sedar.com).
Property Description and Location
The Paracatu mine is a large scale open pit mine located adjacent to the city of Paracatu, situated in the northwestern portion of Minas Gerais State, 230 kilometres southeast of the national capital Brasília and 480 kilometres northwest of the state capital Belo Horizonte.
In Brazil, mining licences (known as decrees) are issued by the Departamento Nacional de Produção Mineral (“DNPM”). Once certain obligations have been satisfied, DNPM issues a mining decree that is renewable annually, and has no set expiry date. KBM currently holds its title by way of five mining licences (Grupamento Mineiro) totalling 1,916 hectares. The mine and most of the surface infrastructure lie within the mining licences and the new tailings facility is situated over a mining easement. The remaining infrastructure is built on lands controlled by KBM under exploration concessions. KBM holds title to 14 exploration permits (11,325 hectares) and has applied for title to an additional 12 exploration permits (12,860 hectares) and three mining applications (1,187 hectares) in the area surrounding the mine.
KBM must pay to DNPM a royalty equivalent to 1% of net sales. Another 0.5% has to be paid to the holders of surface rights in the mine area not already owned by KBM.
Kinross is in compliance with the Paracatu permits in all material respects.
Accessibility, Climate, Local Resources, Infrastructure, and Physiography
Access to the site is provided by paved federal highways or by charter aircraft that can land at a small paved airstrip on the outskirts of Paracatu. The mine is the largest employer in Paracatu, directly employing approximately 1,380 Kinross employees and approximately 2,850 employees of contractors in 2015. Paracatu is a predominantly agricultural town (dairy and beef cattle as well as grain crops, soy beans, corn, coffee, etc.) located in Brazil’s tropical cerrado. Average temperatures range from 17 to 28 degrees Celsius.
The mine draws power from the Brazilian national power grid. The mine is dependent on rainfall as the primary source of process water. During the rainy season, the mine channels surface runoff water to temporary storage ponds from where it is pumped to the process plants. Similarly, surface runoff and rain water is stored in the tailings impoundment, which constitutes the main water reservoir for the process plants. The objective is to capture and store as much water as possible during the rainy season to ensure adequate water supply during the dry season. The mine is permitted to draw makeup water from three local rivers that also provide water for agricultural purposes. Recently, Southcentral Brazil has experienced a prolonged dry spell with two consecutive years of lower than normal rainfall. Due to the decline in avergae rainfall, on November 2, 2015, the Company temporarily suspended operation of Paracatu’s Plant 1 facility and one ball mill in Plant 2. Mining operations continued as normal and ore was stockpiled in the pit. On November 20, 2015, both Plants 1 and 2 resumed full operations. However, rainfall levels have recently fallen again and there is a risk of further shutdowns in the future.
The area topography consists of gently rolling hills. Vegetation in the area of Paracatu is known as cerrado, which is similar to savannah, with dispersed cover of trees and shrubs. The elevation at the site is approximately 780 metres above sea level.
Environmental Considerations
Paracatu operates in material compliance with applicable environmental laws and regulations and with Kinross’ policies on environment, health and safety. There are no known material environmental concerns at Paracatu. Kinross estimates the net present value of future cash outflows for site restoration costs at Paracatu under International Financial Reporting Standards (“IFRS”), International Accounting Standard 37 (“IAS 37”) and International Financial Reporting Interpretations Committee 1 (“IFRIC 1”) for the year ended December 31, 2015, at approximately $84.0 million. There are currently no laws in Brazil requiring the posting of a reclamation bond or other financial assurance.
Kinross voluntarily initiated and entered into an agreement with the State Public Attorney to assume the obligation to submit financial security through annual contributions (in bank deposit, bank investment or letter of credit) in the amount of one million reais each year, until the execution of the mine closure plan and deactivation of dams, the rehabilitation of mined areas and the recovery plan for degraded areas. All contributions have been made up to and including 2016.
History
Gold mining has been associated with the Paracatu area since 1722 when placer gold was discovered in the creeks and rivers of the Paracatu region. Alluvial mining peaked in the mid-1800s and until the 1980s, was largely restricted to garimpeiro (artisanal) miners. In 1984, Rio Tinto Zinc (“Rio Tinto”) explored the property using modern exploration methods, and by 1987, the Rio Paracatu Mineração (now known as KBM) joint venture was formed between Rio Tinto and Autram Mineração e Participações (the latter being part of the TVX group of companies). Production commenced in 1987 and the mine has operated continuously since then.
In 2003, TVX’s 49% share in KBM was acquired by Kinross as part of the business combination between Kinross, TVX and Echo Bay. Kinross purchased the remaining 51% from Rio Tinto in December 2004.
In January 2005, Kinross and KBM commenced the exploration drill program west of Rico Creek and became aware of the potential for a significant reserve increase. A Plant Capacity Scope Study was completed in June 2005, which evaluated several alternatives to increase plant throughput. All options considered in this study assumed the installation of an in-pit crushing and conveying system (“IPCC”) and a 38-foot diameter SAG mill, which were the cornerstone assumptions in the original feasibility study carried out at the property.
In 2006, an expansion project (Plant II) was approved by Kinross’ Board of Directors, and in 2007, construction of a new 41 million tonnes per year (“Mtpa”) plant began. The new plant began operations in September 2008 and completion of ramp-up was achieved in the fourth quarter of 2009, stabilizing plant operation and increasing recovery to an average of 77.5% in 2010.
In 2009, the Company approved plans to undertake a new expansion project at Paracatu, which consisted of the implementation of a third ball mill to increase the grinding capacity needed to process harder ore from the Paracatu orebody. That 15 megawatt ball mill was delivered in 2010, and installation and commissioning was completed in the third quarter of 2011.
With a view to adding processing and grinding capacity, in 2010 the Company approved the addition of a fourth ball mill. Start-up of the fourth ball mill occurred in the third quarter of 2012.
Geological Setting
The mineralization at Paracatu is hosted by a thick sequence of phyllites belonging to the basal part of the Upper Proterozoic Paracatu Formation, in the Morro do Ouro Member. The sequence crops out in a northerly trend in the eastern Brasilia Belt, which, in turn, forms the western edge of the São Fransisco-Congo Craton. The Brasilia Belt predominantly consists of clastic sediments, which have undergone lower greenschist grade metamorphism along with significant tectonic deformation.
The phyllites at Paracatu lie within a broader series of regional phyllites. The Paracatu phyllites exhibit extensive deformation and feature well-developed quartz boudins and associated sulphide mineralization. Sericite minerals are common, likely as a result of extensive metamorphic alteration of the host rocks. Sulphide mineralization is dominantly arsenopyrite and pyrite, with pyrrhotite and lesser amounts of chalcopyrite, sphalerite and galena.
Exploration
Since Kinross acquired its initial share in KBM in 2003, exploration efforts have been focused primarily on the main mining area. Exploration outside of the immediate mine area was initiated in 2006.
In the licensed exploration areas immediately bordering the mine leases, exploration activities were concentrated on soil and termite-mound geochemical sampling and interpretation of airborne magnetic survey data to look for nearby features similar to Paracatu. Some target areas were generated, mostly located west and west-northwest of the mine. Follow-up exploration returned no significant results.
Mineralization
Gold is closely associated with arsenopyrite and pyrite and appears predominantly as fine-grained free gold along the arsenopyrite and pyrite grain boundaries or as inclusions in the individual arsenopyrite and pyrite grains.
The mineralization appears to be truncated to the north by a major normal fault trending east-northeast. The displacement along this fault is currently unknown. The current interpretation is that the fault has displaced the mineralization upwards and erosion has removed the mineralization in the up thrown block.
Drilling
The dominant sample collection method used to delineate the Paracatu resource and reserve model is by diamond core drilling. Since acquiring the project in early 2003, Kinross has completed 1,358 drillholes for a total of 109,105 metres.
All drill cores are logged geologically and litho-structural mineralization and physical data are recorded in detailed logging sheets. Diamond core is also photographed and a permanent record is maintained in the on-site electronic filing system. The information collected in the on-site electronic filing system is stored in a secure industry standard database management system.
In 2006, Kinross drilled 36 holes (3,786 metres) in the Albernaz area to the northwest of the pit and five holes (574 metres) west of Rico Creek.
The nominal drill spacing east-northeast of Rico Creek is 100 x 100 metres. An Optimum Drill Spacing Study commissioned by Kinross established that a 200 x 200 metre five spot pattern (a 200 x 200 metre grid plus one hole in the middle) would satisfactorily define indicated mineral resources. This pattern results in nominal 140 metre hole spacing and represents a departure from historical KBM practices.
In 2009, an infill drilling program was commenced to improve the local estimation inside the areas included in the Paracatu mine plan, including approximately 14,000 metres between 2009 and 2011. An additional 16,774 metres were drilled in 2012, 6,022 metres were drilled in 2013, 6,030 metres drilled in 2014, and 4,333 metres drilled in 2015. The infill drill spacing is designed for 70 x 70 metres overall spacing to further define the mine’s measured resource.
Sample Analysis and Security
Physical core recovery from the exploration and infill core drilling programs averages 99%. KBM employs a systematic sampling approach where the drilling is sampled using standard one metre sample lengths.
Samples are prepared by crushing to 95% passing 2.0 millimetres to 3.5 millimetres. Two kilogram splits of crushed material are then pulverized to 95% passing 100 to 150 mesh. The remaining coarse reject is stored.
Core samples for analysis are stored in a secure warehouse at site prior to sample preparation. The warehouse is either locked or under direct supervision of the geological staff. Prior to shipping, drill core samples are placed in large rice bags and sealed. A sample transmittal form that identifies each batch of samples is prepared. The samples are transported directly to the on-site laboratory for sample preparation and analyses.
All core boxes are transported by KBM personnel from the KBM rigs to the logging facility located inside the fenced mine gates. After photographing, logging and marking one metre sample intervals, the whole core is placed in heavy gauge plastic bags with a unique sample tag. The sample tag number is also written in indelible marker on the outside of each sample bag.
Samples are analyzed at the KBM laboratory and loaded by KBM personnel onto pickup trucks and transported to the on-site preparation laboratory where samples are rotary split. Approximately six kilograms are stored as coarse rejects and two kilograms are transported by pickup truck to the assay laboratory for pulverization and analysis.
Mineral Resource and Mineral Reserve Estimates
Refer to Kinross Mineral Reserves and Mineral Resources on pages 18 — 21 for quantity, grades and category. Assumptions are outlined in the Notes – 2015 Kinross Mineral Reserve and Mineral Resource Statements section commencing on page 21.
Mining and Milling Operations
The Paracatu mine is a traditional open pit truck/shovel operation that has been in continuous operation since 1987. The plants at Paracatu have processed approximately 644 million tonnes of material and produced 6.93 million ounces of gold through 2015.
Mining is planned at an average rate of approximately 72 Mtpa over the next three years, followed by 88 Mtpa from 2019 to 2029, then declining to an average of 50 Mtpa in 2030 and 2031, due to the low strip ratio from the last pushback located under the “in pit” conveyor belt area in the center region of the pit.
Plant I at Paracatu has operated continuously since 1987, with expansion upgrades completed in 1997 and 1999. Plant I consists of primary and secondary crushing, ball milling to 80% passing 75 microns, rougher and cleaner flotation, concentrate regrinding, and cyanide leaching (hydromet plant). Final gold bullion is produced from the dedicated carbon adsorption, desorption and electrowinning circuit.
Plant II started production in September 2008, and achieved commercial production in December 2008. Currently, Plant II includes an in pit crusher, a 1.8 kilometre conveyor to a covered stockpile area, a 38 foot SAG mill, and four ball mills. The recovery process uses flotation to produce concentrate, which is then leached in a carbon-in-leach (“CIL”) circuit in the hydromet plant. Gold is recovered by a carbon elution and electrowinning process and refined to gold bars.
During 2014 crushing at Plant I was interconnected with crushing at Plant II. Plant I feed is pre crushed through the Plant II crusher and then fed to the Plant I crusher. This allowed for more efficient processing of harder ores in Plant I.
There are two tailings facilities at site. Historically, rougher tailings generated from Plant I and Plant II were discharged into the Santo Antônio tailings facility. However, a new tailings facility was required as part of the initial Plant II expansion and construction of the Eustáquio tailings storage facility began in 2009 and tailings have been discharged into the new basin since 2012. In 2015, the Santo Antônio facility capacity augmentation was finalized and a pumping system was implemented to place Plant I tailings into the Eustáquio tailings storage facility. Through a rigorous pre-closure sampling project, areas of the Santo Antônio facility were found to have recoverable mineralized zones. In late 2015, a mining plan was developed using hydraulic mining and pumping along with truck and shovel methods in coarser materials.
Life of Mine and Capital Expenditures
Based on the 2015 mineral reserves, Paracatu is expected to continue production until 2030.
In 2015, KBM incurred approximately $112.7 million in capital expenditures mainly related to tailings facility construction, mine fleet spare parts and optimization.
Exploration and Development
The only exploration drilling planned in 2016 is the continuation of the infill and short-range drilling program interior to the existing mining area.
Kupol and Dvoinoye, Russian Federation
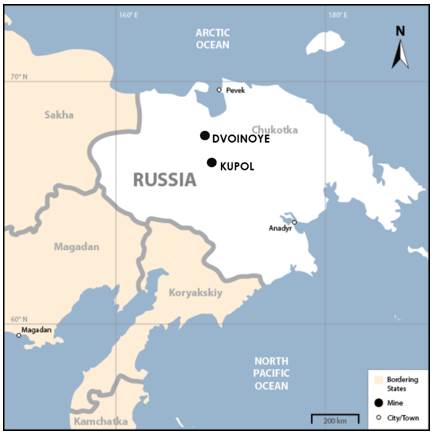
General
Kupol
Development and construction of the Kupol mine commenced in 2005 by Bema Gold Corporation (“Bema”), which was acquired by Kinross in 2007. As part of the Bema acquisition, Kinross acquired a 75% interest in Chukotka Mining & Geological Company (“CMGC”).
On April 27, 2011, Kinross completed its acquisition of the remaining 25% of CMGC from the State Unitary Enterprise of the Chukotka Autonomous Okrug which is owned by the Government of Chukotka Autonomous District, an autonomous Okrug (region) in the northeast region of the Russian Federation. This transaction gave Kinross 100% ownership of the Kupol mine and the Kupol East and Kupol West exploration licences.
Dvoinoye
In 2010, Kinross acquired a 100% interest in the Dvoinoye underground gold mine through the acquisition of Northern Gold LLC and Regionruda LLC. The Dvoinoye mine is owned and operated by Northern Gold LLC, a wholly-owned subsidiary of Kinross. On October 1, 2013, Kinross began commercial production at the Dvoinoye underground gold mine. Ore from Dvoinoye is processed at the Kupol mill, which is owned by CMGC.
The Dvoinoye mine is a high grade epithermal gold deposit located approximately 100 kilometres north of Kinross’ Kupol operation within the remote, undeveloped, mountainous area of the Chukotka Autonomous Okrug. The Dvoinoye reserve is being mined using underground mechanised mining equipment, similar to Kinross’ Kupol operation.
A scoping study on the Dvoinoye project was completed in January 2011 and a feasibility study was completed in March 2012. The Russian equivalent of a feasibility study (a Tekhniko-Ekonomicheskoye Obosnivaniye) was concluded in December 2012. The feasibility study was based on developing Dvoinoye as an underground mine with an output of up to 1,000 tonnes per day and a mine life from 2013 through 2020.
The Dvoinoye mine site features a modern 400 person camp, an administration building, a power station with 6.5 megawatts of generating capacity, a truck shop and a fuel farm with a capacity of 9,000 cubic metres of fuel.
The Company’s ordinary course application to renew the Dvoinoye subsoil licence was approved in September 2013 and the licence is valid until January 1, 2023. Fees for the use of the Dvoinoye subsoil licence, for the purpose of prospecting, exploration and mining, are paid on a regular basis to the authorities. An environmental impact assessment was completed for the Dvoinoye mine in 2013.
Commercial production at Dvoinoye began in October 2013 with the official opening of the mine. The Dvoinoye ore is being transported to the Kupol mill for processing via an all-season road. The Kupol mill has been expanded from 3,500 to 4,500 tonnes per day to handle the additional Dvoinoye ore. In 2015, 432,258 tonnes of Dvoinoye ore was processed at the Kupol mill with 337,749 ounces of gold and 487,683 ounces of silver being produced.
Detailed financial, production and operational information for the Kupol and Dvoinoye mines are available in Kinross’ MD&A for the year ended December 31, 2015. In addition, please see the Company’s National Instrument 43-101 Technical Report dated March 31, 2015 in respect of Kupol and Dvoinoye, available at www.kinross.com and under the Company’s profile on SEDAR (www.sedar.com).
Property Description and Location
Kupol
The Kupol property comprises a 17.5 square kilometre licence for subsoil use for geological study and production of gold and silver. This licence was issued by the Ministry of Natural Resource of the Russian Federation on October 4, 2002, and is held by CMGC.
There are no royalties payable in respect of the Kupol mine. However, Kupol is subject to a mineral extraction tax at a rate of 6% for gold and 6.5% for silver from a tax base which is calculated as the average of pure gold and silver sales (price per gram) multiplied by the amount of doré sold.
In 2006, CMGC acquired two new exploration licences surrounding, and adjacent to, the Kupol project. With the acquisition of these two licences, known as Kupol West and Kupol East, CMGC increased its overall land position in the Kupol project area from approximately 17.5 square kilometres to a combined total of approximately 443 square kilometres. On August 27, 2010, Kinross, certain subsidiaries, and B2Gold Corporation (“B2Gold”) completed an Assignment, Settlement and Release Agreement pursuant to which B2Gold released Kinross and the applicable subsidiaries from certain joint venture obligations that had existed among Kinross, the applicable subsidiaries and B2Gold pursuant to a purchase and sale agreement with respect to the Kupol West and Kupol East licences. In 2014, in accordance with the terms of the Kupol East license, a final report was submitted that concluded that no potential economic resources had been found after five years of exploration work. The Kupol East property will therefore be returned to the sub-soil authorities after completion of the environmental requirements stated in the licence agreement. In December of the same year, following an application by CMGC, the Company obtained two new licences in the Kupol
region at auction, Kupol North and Leva Mechkereva, totalling together 1,458 square kilometres thus substantially increasing the overall land position of Kinross in the Chukotka Okrug. In first half of 2015, another two licences (Shumnaya and Kitepvaamskaya), totalling together approximately 200 square kilometres were acquired pursuant to new Russian legislation. The duration of both the Shumnaya and Kitepvaamskaya licences is seven years.
Dvoinoye
The Dvoinoye mine is located 98 kilometres north of the Kupol mine.
The Dvoinoye exploration and mining licence, which covers an area of 5.76 square kilometres including mine operations and associated facilities, is located within the Vodorazdelnaya licence. The Vodorazdelnaya licence is a combined reconnaissance and mining claim. It was issued in 2008 and covers a total area of 916.4 square kilometres. The Dvoinoye licence was first issued in 2007, and was renewed in 2013. Its life now extends to 2023. Both the Dvoinoye and Vodorazdelnaya licences were acquired by Kinross in 2010 when it completed its acquisition of Northern Gold and Regionruda LLC, respectively, owners of the Dvoinoye licence and the Vodorazdelnaya licence. Due to the merger of Regionruda LLC with Northern Gold in 2015, Northern Gold is now the owner of both licences.
There are no royalties payable in respect of the Dvoinoye mine. However, a mineral extraction tax is applied to production at Dvoinoye (6% for gold and 6.5% for silver). Unlike Kupol, the Dvoinoye extraction tax is applied based on the amount of gold and silver produced (and not necessarily the amount of gold and silver sold).
Accessibility, Climate, Local Resources, Infrastructure, and Physiography
Kupol
The Kupol deposit is located in the northwest part of the Anadyr foothills on the boundary between the Anadyr and Bilibino Regions in the Chukotka Autonomous Okrug. The total distance between the Kupol property and Bilibino is approximately 200 kilometres.
A regional airport serving Bilibino is located 35 kilometres south of Bilibino in Keperveem. Keperveem airport is the closest public airport to Kupol. In 2009 the airstrip at Kupol was certified as an airport and direct daily flights from Magadan to Kupol commenced. The main access point for land freight to Kupol is from the port facilities at Pevek, approximately 400 kilometres north of Kupol. Pevek and Kupol are connected by a combined all-season and winter road for a total distance of approximately 450 kilometres. Freight is transported from the port and stored at a storage yard and shop 21 kilometres from Pevek. From there, a winter road, constructed from November to January of every year, follows the contour of Chaunskii Bay for 133 kilometres then travels due south to Yarakvaam camp (formerly Dvoinoye camp) and onwards to join the Kupol-Dvoinoye all-season road 85 kilometres from Kupol. The winter road is serviced by three temporary camps and one permanent 60-person, containerized camp and is passable between early to mid-January and late April.
During the spring thaw, summer and fall, Kupol is only accessible by helicopter or fixed wing aircraft via a two to three hour flight from Magadan, a one hour flight from Keperveem or a two hour flight from Anadyr. Magadan is serviced by an all-season paved airstrip. Keperveem is serviced by a gravel airstrip capable of handling IL76 aircraft. Anadyr is serviced by an all-season paved airstrip. A 1,800 metre gravel airstrip at the Kupol site is currently in use.
The Chukotka region around the Kupol site belongs to the continental climatic region of the subarctic climate belt with extremely severe weather consisting of long and cold winters (8-8.5 months), overcast weather, and short summer periods (2.5 months). The average annual temperature at the Kupol site is -13 degrees Celsius, ranging from -58 degrees Celsius to 33 degrees Celsius.
The overall region is sparsely populated, with approximately 65,000 inhabitants. Of this population, approximately one half of the people live in the two districts where the Kupol deposit is located (Bilibino and Anadyr).
The Kupol property is situated on a height of land adjacent to the divide between the Arctic Ocean and Bering Sea drainages. The Straichnaya River drains north to the Anui River and the Sredniy Kaiemraveem River drains into the Mechkereva River to the south. Topography is moderate, characterized by low rolling hills and occasional flat midland areas. The Sredniy Kaiemraveem River bisects the eastern portion of the property. The elevation ranges from 450 to 755 metres.
Permafrost is distributed throughout the Kupol property area. Depending on geomorphology, the thickness of the permafrost layer ranges from surface to a depth of 200 to 320 metres and reaches its maximum depth under riverbeds.
The Kupol property is located approximately 40 kilometres north of the tree line and is covered with tundra, rock outcrop and felsenmeer. The vegetation is limited to lichen, grass and arctic shrubs and flowers.
Dvoinoye
The Dvoinoye site is isolated and can only be accessed by air (helicopter), by winter roads, or by an all-season road from Kupol. There is a network of winter roads that is passable between mid-January and mid-April.
An all-season road connecting the Dvoinoye site and Kupol was completed in 2013. The road is a two lane gravel road with a camp located at the approximate mid-point. The road includes a 110 metre long bridge across the Anui River. The road is used for the movement of ore to Kupol and for the transportation of crews and materials between Kupol and Dvoinoye. The responsibility for the road maintenance rests with Kupol.
By air, the Dvoinoye site can be accessed by helicopter from Pevek airport (about 1.5 hours), from the Kupol mine (about 40 minutes), or Bilibino airport (about 45 minutes). Personnel access to the site is by air to the Kupol airport and then by vehicle to Dvoinoye.
Dvoinoye is located in a mountainous region north of the Arctic Circle. The area is subject to extremely severe weather consisting of long and cold winters that persist for approximately nine months of the year. The climatic conditions for the area are characterized by an extreme continental subarctic climate and falls under Region 1 in the Russian regulatory ice and snow formation and loading categories. On average, there is snow cover for 246 days per year and the snow depth averages 1.8 metres. The average annual air temperature is -13.5 degrees Celsius and the average daily air temperature from December to February is -30 degrees Celsius. The summer is cool with regular fog, rain, and frosts.
The Dvoinoye terrain comprises strongly dissected alpine-type hilly terrain with clear traces of glacial activities. Elevations above sea level reach 1,385 metres, the relevant difference in elevations with valley bottoms being 300 metres to 500 metres.
The Dvoinoye area is drained by the Dvoynaya River and its tributaries with a total catchment area of 220 square kilometres. Water flow depends to a considerable extent on the season and precipitation. The Dvoynaya River freezes by the end of September and breaks up in the beginning of June. The Dvoinoye mine is in a zone of continuous permafrost (lower boundary varies from 200 metres to more than 500 metres below the surface). The depth of seasonal thawing varies from 0.02 metres to 2.4 metres in the river valleys to 2.4 metres to 3.0 metres on those watershed boundaries composed of hard and semi- hard rocks.
Environmental Considerations
Kupol
Kinross is in compliance with the Kupol permits in all material respects. Kupol operates in material compliance with applicable environmental laws and regulations and with Kinross’ policies on environment, health and safety. There are no known material environmental concerns at Kupol. Kinross estimates the net present value of future cash outflows for site restoration costs at Kupol under IFRS, IAS 37 and IFRIC 1 for the year ended December 31, 2015, at approximately $58.2 million. There are currently no regulatory requirements for the posting of security for the estimated site restoration costs.
Dvoinoye
Permits for Dvoinoye have been received for the exploration and mining, air emissions, water usage and wastewater discharge as well as the waste storage and disposal, landfill operation earth works, explosive storage and usage, site roads and fuel tank operation. Kinross is in compliance with the Dvoinoye permits in all material respects. Kinross estimates the net present value of future cash outflows for site restoration costs at Dvoinoye under IFRS, IAS 37 and IFRIC 1 for the year ended December 31, 2015, at approximately $5.6 million. There are currently no regulatory requirements for the posting of security for the estimated site restoration costs.
History
Kupol
Quartz vein float was originally located in the Kupol area in 1966 during a governmental regional mapping program. These float boulders assayed up to 3.0 grams per tonne gold and 660 grams per tonne silver and the find was designated as the “Oranzheviy Occurrence”. The main Kupol deposit was discovered by the Bilibino-based, state-funded Anyusk State Mining and Geological Enterprise (“Anyusk”) in 1995, through prospecting in the region of the “Oranzheviy Occurrence”. Prospecting was aided by the identification of gold, silver, arsenic, and antimony anomalies in a 1:200,000 stream sediment geochemical sampling program. During 1996 and 1997, Anyusk completed mapping, prospecting, magnetic and resistivity surveys, and lithogeochemical and soil surveys.
During 1998, two drillholes were drilled and four trenches were excavated. In 1999, Metall, a Chukotka-based, Russian mining cartel, acquired the rights to the deposit and contracted Anyusk to conduct the exploration work. From 1999 through 2001, an additional 31 trenches and 24 drillholes were completed. In 2000 and 2001, 450 metres of the central portion of the vein system was stripped, mapped and channel sampled in detail. By the end of 2001, the work completed included 3,004 metres of drilling in 26 drillholes, 5,034.1 metres of trenching and 3,110.8 metres of channel sampling. Additionally, the majority of the licence area was surveyed, and a frame for a small mill was constructed immediately south of Bolotnoye Lake, where the 2004-2006 camp was located.
The original Kupol Licence was issued to Metall on March 16, 1999. On October 4, 2002, this Kupol Licence was re-issued to CMGC, a newly established subsidiary of Metall. In December 2002, Bema entered into an agreement to acquire up to a 75% interest in the property.
Dvoinoye
The Dvoinoye deposit was discovered in 1984 through a program of regional soil sampling, geophysical surveys and geological mapping. The Dvoinoye site includes an inactive open pit mine which previously operated six months per year, with throughput of approximately 250 tonnes per day. Open pit operations were initiated in 1996 by Northern Gold, which was originally a subsidiary of Anyusk. Operations continued under the ownership of the deposit by Millhouse Capital and its subsidiary Regionruda LLC and were terminated before acquisition by Kinross.
Geological Setting
Kupol
Gold and silver mineralization at Kupol is hosted by low sulphidation epithermal quartz-adularia veins within a north-south fault zone in Cretaceous andesite flows and pyroclastic units. Gold-bearing banded chalcedonic quartz-adularia veins and breccias are associated with silicification, argillization and rhyolite dykes for 4.1 kilometres along strike. The main vein zone is up to 50 metres wide and has been drilled to a maximum vertical depth of approximately 725 metres. The vein dips range from vertical to 75 degrees to the east. The deposit has been divided into six contiguous zones; from north to south these are North Extension, North, Central, Big Bend, South and South Extension. Mineralization, with widths up to 22 metres, has been defined along 3.9 kilometres of strike.
In 2005, a series of polymetallic veins were discovered starting 350 metres west of the main Kupol structure. These veins strike northwest and dip 55 to 75 degrees to the west.
Dvoinoye
Host rocks at Dvoinoye are Late Cretaceous intermediate-felsic volcanics of the Tytylveyem Suite, which is divided into three units. The main host rock here is porphyritic dacite lava, containing 20% to 30% phenocrysts (plagioclase, pyroxene and potassium feldspar), in a siliceous aphanitic matrix. Other components of the local geology include cross-cutting pyritic hydrothermal breccias that may mainly affect the tuff units. Their distribution and geometry are unclear but at least part of the Dvoinoye vein is hosted by narrow siliceous pyritic milled breccias that may be related to larger volume hydrothermal breccias.
Exploration
Kupol
During 2003, Bema completed 22,257 metres of drilling, extensive trenching, metallurgical test work, a site survey, hydrology studies and acquisition of environmental baseline information for Kupol. In addition, Bema conducted initial engineering work and studies toward a scoping or preliminary economic assessment, which was successfully completed in 2004, and on procurement of equipment and supplies for the 2004 exploration and development program. Drill campaigns conducted by Bema between 2003 and 2006 completed a total of 762 holes for 151,154 metres.
From 2007 to 2011, drill campaigns conducted by Kinross at Kupol completed a total of 1,824 holes for 215,966 metres.
In 2012, a total of 38,884 metres of core drilling was completed for the year at Kupol.
In 2013, drilling continued on the Kupol mining lease as well as on Kupol West and Moroshka Project. A total of 45,697 metres of core drilling were completed for the year.
In 2014, drilling continued on the Kupol mining lease as well as on Kupol West. A total of 31,071 metres of core drilling were completed for the year, which included 21,037 metres of infill drilling at Moroshka for resource estimation. The rest of the drilling consisted of prospecting drillholes within both licences.
In 2015, an extensive exploration work was completed over the four new licenses including approximately 1,500 square kilometres covered by soil and litho-geochemical sampling and more than 2,000 square kilometres of magnetic and gamma-spectrometry airborne survey for initial target identification. Also a pioneer helicopter-supported drilling program was successfully completed, drilling seven holes (1,292 metres) at three remote targets located up to 50 kilometres from Kupol. A number of proximal targets within Kupol West and Kupol North licenses were tested by diamond drilling (36,078 metres) and some of them were degraded although further work is planned for the next year. 16,482 metres out of the total were drilled
at Moroshka-Providence ore zones for ore body delineation, additional resources and geotechnical studies.
In first half of 2016 the exploration team will be focused on rigorous target check within the Kupol West, Kupol North and Leva Mechkereva licences.
Dvoinoye
The drilling programme conducted by Northern Gold between 2000 and 2009 completed a total of 200 drillholes for 44,335 metres. Northern Gold prepared initial engineering work and studies toward a scoping of preliminary economic assessment that was successfully accomplished in 2009.
From 2010 to 2012, the drill campaigns conducted by Kinross at Dvoinoye completed a total of 298 holes for 76,804 metres, including exploration, engineering and condemnation holes.
The focus of exploration work from 2012 to 2014 was on testing the mineralization along the vein system to expand the current resources and to identify new targets. During these years, a total of 69,886 metres of core drilling was completed within the Vodorazdelnaya licence.
By the end of 2015 an extensive exploration programme was completed over the Vodorazdelnaya licence. More than 300 square kilometres were covered by soil and litho-geochemical sampling. Airborne magnetic survey was done over the entire licence area.
In 2015, a total of 24,667 metres were drilled. This drilling included infill drilling at Sentyabrskoe NE and Zone 1 on the Dvoinoye mining licence, as well as exploration drilling at numerous other targets. A number of additional studies were completed for Sentyabrskoe NE, including detailed ground geophysics, environmental field works, geotechnical drilling and engineering studies, resource estimate, mine design and economic assessment.
During 2016, the work will be focused on the targets identified during the 2015-2016 target evaluation sessions.
Mineralization
Kupol
Gold and silver at Kupol occur as native gold, gold-silver alloy electrum, in acanthite and silver-rich sulphosalts (stephanite and pyrargyrite dominant). Gold and these minerals occur with pyrite and minor amounts of arsenopyrite, chalcopyrite, galena and sphalerite predominantly in bands within chalcedonic quartz, quartz and quartz-adularia colloform and crustiform veins and breccias.
Dvoinoye
Dvoinoye is a low sulphidation epithermal gold-silver vein deposit, characterized by low total sulphide content, generally less than one percent, by variable but low gold:silver ratios (average 1:1), and by the presence of considerable free gold in parts of the deposit. The main ore minerals and related sulphides in the vein are native gold, freibergite, pyrite, chalcopyrite, galena, and sphalerite, with minor acanthite. Ore minerals are generally fine grained. Gold occurs inter-grown with sulphides, free in quartz-illite aggregates, and in places as rare dendritic growth bands.
Drilling
Kupol
In 2007, a 105-hole underground diamond drillhole definition program produced 5,606 metres of NQ and BQ-sized core from drill stations. The geologists laid out the drill fans in Micromine software, and then distributed the layouts to the mine surveyors, who then painted backsights and frontsights in the drill stations for hole alignment. Drill fans were spaced ten metres apart with four or five holes per fan, designed to penetrate the vein every 15 metres vertically on dip, or in the centre of each stope panel. Drill recovery was >90% overall, with very few instances of poor vein recovery. In instances of bad ground, e.g., in shear zones in the footwall of the vein, the standard NQ rods served as casing and the drillers completed the holes with BQ tools. A REFLEX E-Z Shot downhole digital magnetic recorder measured uncorrected azimuth, dip, temperature and local magnetic field. The readings were transcribed by hand in the field and given to a data entry clerk to enter in the drillhole database. To convert to local north, the azimuth reading was adjusted by -1.8 degrees, based on USGS model WMM 2000 projected to 2007. The mine surveyors also surveyed the collar coordinates in local coordinates, azimuth, and dip of each hole after it was drilled. The surveyors were under the direction of the Russian Chief Mine Engineer.
In 2008, the South Extension (650) zone surface core drilling program comprised 12,325 metres of HQ- and NQ-sized core in 56 holes performed by Russian and Canadian drilling companies under Kinross’ supervision. The program infilled the existing pattern of holes from previous campaigns and resulted in a significant conversion of inferred resources to probable mineral reserves. The underground definition drilling was completed for a total of 15,568 metres.
In 2012, underground definition drilling was completed for a total of 25,118 metres (N- and B-sized core). In 2010 and 2011, underground definition drilling continued with NQ- and BQ-sized core for a total of 28,430 metres in 2010 and 30,116 metres in 2011. Termite core drilling was conducted to test the limits of mineralization in the development headings and to optimize slashing operations and panel extraction, and 2,559.5 metres were drilled in 2012, 4,148 metres were drilled in 2011, and 3,200 metres were drilled in 2010. The average sample length was one metre.
An RC drill rig was used for grade control in the open pit, completing 7,961.5 metres in 2009, 3,694 metres in 2010, and 2,067 metres in 2011. The RC drill results supplemented, and to some extent replaced, grade control trenching activities.
In 2013, the underground definition drilling consisted of NQ- and BQ-sized core for a total of 22,538 metres. The Termite core drilling consisted of 641 metres.
In 2014, underground definition drilling was completed with NQ- and BQ-sized core for a total of 23,426 metres. The Termite core drill was replaced by an on-site Sandvik Solo drill to test the limits of mineralization in the development headings and to optimize slashing operations and panel extraction, and 6,059 metres were drilled. The average sample length was one metre.
In 2015, the underground definition drilling continued with NQ- and BQ-sized core for a total of 24,437 metres. The average sample length was one metre. An additional 8,470 metres were drilled with Sandvik Solo in order to define the horizontal extension of mineralization.
Geological core drill logs included header, survey, recovery, rock quality designation (“RQD”), structural, mineralogical, and lithological information. The logging scheme was similar, but condensed from the exploration scheme described in the previous technical reports on Kupol. All information was logged directly into a data recording laptop with online validation parameters. The data logger downloaded to the Kupol server into the GBIS SQL database manager and the contents migrated to database tables. The first sampling task for the geologist was a log of recovery; RQD; and for selected core drillholes, full geotechnical logging of fractures and rock quality. This required some reconstruction of the core in the boxes such as sorting out jumbled sections and fitting broken core together before taking measurements. Next, sampling intervals were determined, marked up, and tagged by the Russian geologists using preprinted sample ticket
books. Sample intervals were based on geology (lithology or vein types, mineralogy, and structure). The geologist could sample across contacts if the vein width was less than the minimum sample width (30 centimetres). The maximum sample length was one metre and mineralized zones were bracketed by a minimum of one to three metres of sampling into the footwall and hanging wall. Geologists sampled all vein zones and alteration types; each major zone was continuously sampled. Definition drillhole sampling was whole core, with no sawing or splitting.
Chip channel sampling was the basis for all 2007-2015 underground production grade control and reporting. Geologists followed written procedures for each face, including mapping geologic and sample intervals graphically, and listing the sample information on a form. The form included a face sketch, depiction of painted instructions, temporal, spatial, and other information adequate to form a complete record of the face.
Four hundred and two faces were mapped in 2007 which cover 2,591 metres and 3,259 chip channel samples were collected. In 2008 underground face sampling consisted of 4,222 metres and 5,053 samples collected. During 2009 and 2010 the number of mapped and sampled faces was 1,131 and 1,058, respectively. The number of chip samples taken for these two years was 6,812 and 5,837, respectively.
In 2011, mine geologists and samplers documented 791 sublevel faces from which 4,653 samples were collected. Chip sampling, along with underground delineation drilling provided the underground production grade control and reporting in 2012. There were 8,233 chip samples taken in the underground mine in 2012. In 2013, 1,297 faces were documented and there were 7,551 chip samples taken. In 2014, chip samples consisted of 1,146 faces and 6,503 chip samples taken. In 2015 mine geologists documented 1,332 sublevel faces and took 7,859 channel samples.
Dvoinoye
There was no exploration drilling on the Dvoinoye licence in 2014, and only the limited resource estimation drilling referred to earlier on Zone 1 of the Dvoinoye mining licence during 2015. All other drilling was on the Vodorazdelnaya licence. Drill campaigns on Dvoinoye completed between 2000 and 2015 included 416 surface and underground core drillholes, totaling 108,387 metres.
Detailed logging was conducted by professional geologists. Information is hand written onto graphical log forms and then key data is entered manually into spreadsheet templates. Pre-2010 graphical drill logs are simpler and much less information is recorded on the drill logs. The Kinross drill logs are much more detailed and include lithology, colour, grain size, structures, core axis angles, oxidation type and intensity, mineralization, alteration, vein texture, core recovery, RQD, predominant fracture orientations, fault attitudes, fault gouge zones, and other information.
The core recovery is generally very good. RPA, Inc. previously reviewed the 2012YE database, which has 14,110 core recovery values that average 98.3% for 2010 and 2011 drillholes. There are 381 core recovery records representing 1,120.7 metres of vein intersections that average 99.4%. There is no electronic core recovery data for the pre-2010 drillholes. Micromine (2009) includes a table that summarizes the core recovery for each hole and the core recovery for the mineralized interval in each hole. Micromine (2009) notes that core recoveries for each run were not available. Overall, 100% of the core was recovered from most of the mineralized intervals with only a small number of exceptions.
Sampling and Analysis
Kupol
Underground chip sampling was a team effort conducted by a crew of one or two samplers, supervised and/or assisted by the geologist. The geologist inserted a sample ticket from preprinted books into each bag and the bags were laid on the ground in order. Sampling always occurred from the footwall to the hanging wall. The geologist painted a level sample line on the face at one metre above the ground and the objective was to make the line disappear during sampling. This approximated a five by five centimetre
channel. The geologist also painted sample numbers on the face, and photos were taken as a record of the sampling after it was complete. Geologists broke samples based on the same criteria as for the core sampling, and at the same maximum and minimum lengths.
Core sample minimum length was 0.25 metres for HQ diameter core and 0.30 metres for NQ diameter core. Generally, the maximum sample length was one metre. Mineralized zones were bracketed by a minimum of one to three metres of sampling into the footwall and hanging wall. All vein zones and alteration types of interest were sampled and each major zone was continuously sampled.
Samples containing visible gold or abundant sulphosalt mineralization were indicated by a sample bag at the start of the sample interval, so sampling technicians would employ contamination minimization protocols during cutting and laboratory preparation. Field duplicate samples were marked with flagging tape.
Core to be sampled during the initial Bema Kupol exploration program was delivered to the splitting shack and either taken inside or dead-stacked on the pallets outside. Core was 2/3 split using a diamond saw; the remaining third was returned to the core box as a permanent record. The rock saw core jig was calibrated to ensure that an even 2/3 split was taken of the core for both HQ and NQ sized samples.
Trench sampling followed a simple protocol that was similar to Core sampling. The protocol was to attempt to cut intervals that were five to six centimetres wide by five centimetres deep to approximate a core sample. The geologist wrote up a submittal sheet, picked up standards and blind pulp reruns at the office, and drove the samples to the lab the same day or to the ovens if they were wet and needed pre-drying.
RC drilling was dry; samples were collected in a cyclone, passed through a Gilson splitter at the end of the drilling interval, and a split transferred to a labelled bag. The hole was blown clean after each one metre sample interval and the cyclone and splitter cleaned with brushes and compressed air.
All samples and gold-silver analyses were performed on-site by a Russian-certified laboratory. Geology modified the on-site quality control program for 2007 to comprise: (a) insertion of standard reference material (standards) to monitor accuracy; (b) coarse blank material (blanks) to monitor contamination and sample mix-ups; and (c) field duplicates (duplicates) and prep duplicate split reruns to monitor precision. All quality control samples were blind to the Kupol laboratory. The Kupol lab also maintained its own internal quality control program. All lab results were electronically imported to a secure, server-based SQL database maintained by a database administrator. Russian regulations require periodic submittal of a certain percentage of pulp duplicates to an outside Russian-certified laboratory as an outside check.
Dvoinoye
For exploration core samples, sampling intervals were determined, marked up, and tagged by the geologists. The intervals were based on geology (lithology, mineralogy, texture, and structure). Sampling across contacts was only permitted if the vein width was less than the minimum sample width. The core was manually oriented to ensure that the core was consistently split and that there was no sample bias. The minimum sample length was approximately 0.2 metre. Most of the drillholes recovered HQ diameter core and some drillholes recovered NQ diameter core. Generally, the maximum sample length was one metre in mineralization and up to three metres in waste. Mineralized zones were bracketed by a minimum of one metre to three metres of sampling into the footwall and hanging wall. All vein zones and alteration types of interest were sampled and each major zone was continuously sampled. The whole core was sampled in the oldest drillholes and split at an undefined point in time using a hammer and chisel. Fresh water is used to protect against re-circulation contamination.
From 2010 onwards, most exploration samples have been sent to the Kupol mine laboratory for gold and silver fire assay. The first on-site sample preparation facility was commissioned in 2012 at the old camp and then moved to the new camp in 2014 but the samples continued to be assayed at Kupol lab to keep the consistency of the geochemical results.
Security of Samples
The geologists arranged and personally conducted transport of drill core from the drills in covered wooden boxes. The core was laid out in a secure core logging hall by the responsible geologist and photographed immediately after logging was complete.
Samples were bagged and field blanks/reference standards were inserted into the sample stream by the geologists. The samples were assembled into batches of twenty, in the order they were sampled, and submitted to the laboratory two to three times per day. Well-mineralized or visible gold-bearing samples were indicated on the submission form to ensure that contamination reduction protocols were followed by the laboratory.
Core containing veining is stored in racks in locked rooms. Non-mineralized core from the 2005 program is stored either in open racks, or, if it is from areas of condemnation drilling, dead-stacked by hole.
Kinross implemented external analytical quality control measures on all sampling consisting of using control samples in all sample batches submitted for assaying including field blanks, certified standards, and field duplicates.
Mineral Resource and Mineral Reserve Estimates
Refer to Kinross Mineral Reserves and Mineral Resources on pages 18 — 21 for quantity, grades and category. Assumptions are outlined in the Notes — 2015 Kinross Mineral Reserve and Mineral Resource Statements section commencing on page 21.
Mining and Milling Operations
Kupol
The Kupol deposit is mined by underground mining. The underground mining methods utilize mechanized sublevel mining methods to mine ore on a two shift per day, 365 days per year schedule. The first gold pour at Kupol occurred during the second quarter of 2008 and the mill reached a production rate of approximately 3,000 tonnes per day in October 2008. In 2013, the mill reached a production rate of approximately 4,500 tonnes per day.
The milling process consists of primary crushing and a SAG/ball mill grinding circuit, and includes conventional gravity technology with intensive leaching of gravity concentrate followed by whole ore leaching. Merrill-Crowe precipitation is used to produce gold and silver doré bars. Counter-current decantation wash thickeners recover soluble gold and silver values and a cyanide destruction system is used to reduce cyanide concentrations to an acceptable level for disposal. Tailings are pumped through a pipeline to a conventional tailings impoundment.
Dvoinoye
Dvoinoye underground mining operations have used two different mining methods, transverse longhole stoping and longitudinal longhole stoping. Transverse longhole stoping has accounted for more than 90% of the historical production, but the remaining reserves will predominantly be extracted using longitudinal longhole stoping.
Dvoinoye ore is transported by truck to the Kupol mill for processing.
Life of Mine and Capital Expenditures
Based on the 2015 mineral reserves, Kupol is expected to continue mine production until 2020 and Dvoinoye is expected to continue mine production until 2018. While the feasibility study conducted in 2012
estimated a mine life to 2020, an increased production rate at Dvoinoye explains the revised mine life to 2018. Kinross spent approximately $55.9 million on capital expenditures at Kupol and Dvoinoye in 2015.
Financing
On December 22, 2011, the Company announced that it had completed a $200.0 million non-recourse loan issued to CMGC by a group of international financial institutions. The non-recourse loan carried a term of five years with a maturity date of September 30, 2016 and had an annual interest rate of LIBOR plus 2.5%. On September 30, 2015, the Company repaid the loan in full, which included a prepayment of $20.0 million that would have otherwise been due in 2016.
Tasiast, Mauritania
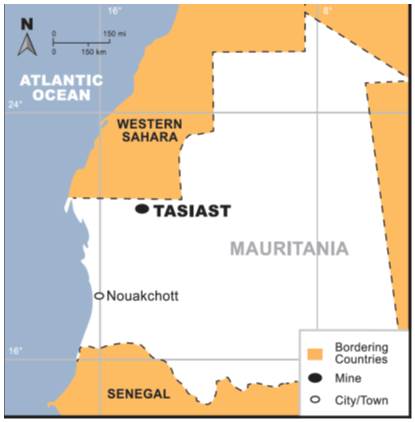
General
The Tasiast mine is currently a conventional open pit gold mine with a combined carbon-in-leach (“CIL”), dump leach operation and Adsorption Desorption Recovery (“ADR”) plant producing doré. Commercial production at the mine commenced in 2008. The Tasiast mine and the existing exploitation permit are owned by Tasiast Mauritanie Limited S.A. (“TMLSA”). Affiliates of TMLSA currently hold two recently issued exploitation permits and two exploration permits whose underlying lands are contiguous to the Tasiast mining exploitation lands (collectively, the “Tasiast Lands”). The two exploitation permits were receipted in December 2014, as a result of the conversion of two exploration permits, and expire in November 2044. The two exploration permits expire in October 2017. Kinross currently expects to convert one of these exploration permits into an exploitation permit in accordance with the applicable permitting regime in Mauritania, including obtaining necessary government approvals.
As part of the conversion process of two exploration permits, Kinross has undertaken to transfer to the Government of Mauritania a 10% carried interest in Société d’Extraction du Nord de l’Inchiri S.A. (“SENISA”), the Kinross affiliate holding the two exploitation permits receipted in December 2014. Other than SENISA, all permit-holding affiliates of Kinross, including TMLSA, are wholly-owned indirect subsidiaries of Kinross. Kinross acquired TMLSA, including the Tasiast operation and exploitation and exploration permits and lands, through its acquisition of Red Back in September 2010.
In March 2014, Kinross completed a feasibility study to expand the Tasiast operation to 38,000 tonnes per day. As a result of lower gold prices in 2015, Kinross suspended the expansion of the Tasiast operation to 38,000 tonnes per day and initiated a Tasiast optimization study to explore alternatives for Tasiast’s growth potential in the current gold price environment. The Tasiast optimization study identified the possibility of a two-phase expansion. Kinross also initiated a feasibility study to assess the economic viability of this potential two-phased approach.
On March 30, 2016, the Kinross board of directors approved proceeding with the phase one expansion, which is designed to increase the mill throughput from the current 8,000 tonnes per day to 12,000 tonnes per day
by installing incremental crushing and grinding capacity to the existing CIL circuit. Phase one will begin immediately and is expected to be completed in the first quarter of 2018, with a total estimated capital expenditure of approximately $300 million. If Kinross decides to proceed with phase two, it would increase the mill throughput from 12,000 tonnes per day to 30,000 tonnes per day with the installation of additional milling, leaching, thickening and refinery capacity. A feasibility study of phase two is expected to be initiated in the second half of 2016.
Kinross filed an updated NI 43-101 Technical Report for Tasiast and released details of the feasibility study for phase one and pre-feasibility study for phase two. The studies concluded with a recommendation to progress with phase one into execution and advance phase two into a feasibility study. The current mine plan, production schedule and reserves statement are based on the 30,000 tonnes per day (phase two) pre-feasibility study.
Detailed study results for a combined phase one and potential phase two 30,000 tonnes per day expansion can be found in the NI 43-101 Technical Report for Tasiast dated March 30, 2016 available on the Company website at www.kinross.com com, and under the Company’s profile on SEDAR (www.sedar.com).
Property Description and Location
The Tasiast mine is located in northwestern Mauritania, approximately 300 kilometres north of the capital city of Nouakchott and 250 kilometres east of the city of Nouadhibou. The mine and infrastructure are located entirely within the Tasiast Lands. These lands total approximately 312 square kilometres in area and fall within the administrative purview of the Inchiri District. The lands comprising the SENISA exploitation permits (Imkebdene and Tmeimichat), together with the land comprising the Tasiast exploration permits (Tasiast Sud and N’Daouas Est), total approximately 3,118 square kilometres in area and fall within the administrative purview of the Inchiri and Dakhlet Nouadhibou Districts.
Except for the 10% carried interest in SENISA that Kinross has undertaken to transfer to the Government of Mauritania, TMLSA and its affiliates, collectively, hold a 100% interest in the Tasiast mine, the Tasiast Lands, the existing exploitation permits and the exploration permits.
A royalty equal to 3% of the selling price of the product resulting from the final ore processing stage in Mauritania is payable to the Mauritanian government. This rate was established in the 1999 Mining Code and, subsequently, protected from the rate changes in the 2008 Code (as amended) by means of the Tasiast Mining Convention. This 3% royalty rate is also expected to apply to SENISA’s eventual production. Tasiast is also subject to a 2% royalty payable to a subsidiary of Franco-Nevada Corporation on life of mine gold production in excess of 600,000 ounces. Production at Tasiast reached 600,000 ounces in July 2011, and the first royalty payment to Franco-Nevada was made in October 2011. Such 2% royalty shall also apply to SENISA’s eventual production from the first ounce produced.
Accessibility, Climate, Local Resources, Infrastructure, and Physiography
The Tasiast mine is accessed from Nouakchott by using the paved highway from Nouakchott to Nouadhibou for 370 kilometres and then via 66 kilometres of graded mine access road which is maintained by TMLSA. An airstrip has been constructed at the Tasiast mine and is used for light aircraft from Nouakchott or Nouadhibou. The principal ports of entry for goods and consumables are either Nouakchott or Nouadhibou. Materials are transported by road to the mine.
The mine is located in a remote area where there is no electrical utility grid. The present power supply is comprised of: phase 1 plant — eight high-speed generators and three medium-speed generators providing capacity of 12.7 megawatts; phase 1A plant — four high-speed generators providing capacity of 4.8 megawatts; phase 1B plant — four medium-speed generators providing capacity of 18 megawatts; and the Tasiast camp plant — five high-speed generators providing capacity of 8.6 megawatts. The phase 1B plant operates as base load, with the phase 1 plant providing capacity reserve as required.
The current source of mine water supply is located 64 kilometres west of the mine and consists of a bore field of 47 wells in a semi-saline aquifer. There are an additional 18 wells used to monitor the aquifer and nearby aquifers. Water is pumped to the raw water storage facility at the mine site through two high-density polyethylene pipelines and one reinforced fibreglass pipeline. Based on a recent study, it is likely that the bore field is capable of providing the water required for the 30kt/d expansion. Potential water supply issues would be identified through monitoring, and providing a lead time of approximately three years to design and implement remedial measures. Tasiast will be required to apply for an extension of its water abstraction permit in order to continue abstraction from the field beyond 2020 by substantiating the field’s capacity with a technical evaluation.
The topography of the Tasiast Lands consists mainly of flat, barren plains which are primarily covered by regolith and locally by sand dunes, or eroded paleo-lateritic profiles. Locally, the drainage pattern within and outside of the Tasiast Lands consists of several intermittent dendritic first and second order streams that generally flow southwesterly. Vegetation found on the Tasiast Lands is sparse and consists primarily of grasses and the occasional acacia trees.
The climate is hot most of the year and characterized by low rainfall and strong prevailing northeast to Southwest winds. Temperatures can exceed 45 degrees Celsius and reach lows of approximately 10 degrees Celsius.
The average elevation is approximately 130 metres above sea level. Current third party land use in the Tasiast Lands area consists of limited nomadic livestock farmers. There are no villages, agricultural farms, or artisanal mining activity within or around the mine area. The nearest permanent settlements are located some 100 kilometres north of the mine area, on the Société Nationale Industrielle et Minière rail line at the railway maintenance station PK22.
Environmental Considerations
An environmental impact statement (“EIS”) was completed for Tasiast in 2004 and subsequently approved by the Director of Mines and Geology on April 12, 2005. To meet revised legislation, additional reporting was requested, which was completed in 2008. In 2009, an additional environment assessment was conducted for a second tailings storage facility, a dump leach facility and an expansion of the water bore field. The West Branch expansion was assessed in 2010, and subsequently approved in 2011.
Since acquiring Tasiast, TMLSA has completed significant permitting activities in support of the expansion project including Phase 1 (two Environmental Impact Notices (“EINs”) and one Environmental Impact Assessment (“EIA”)) in 2011 and Phase 2 (EIA for all on-site proposed expansion activities) in 2012. A Phase 3 EIA for “off-site” sea water supply was approved following submission of a Phase 3 addendum. A subsequent EIA was approved to allow receipt of pre-assembled equipment at a beach landing and transportation to site. In addition, following discussion with the government, an addendum to the Phase 2 EIA was submitted and approved that described the project optimization through incremental increases in production and relocation of certain infrastructure. This addendum was approved by the Ministry of Environment in February 2016, and subsequent approval by the Ministry of Mines is pending.
Current environmental liabilities are those that would be expected from a mining operation, and include the mine, crushing and CIL processing plant, dump leach facilities, power plant, tailings and waste rock facilities, power grids, roads, accommodation camp, ancillary facilities and drill pads established to support mining and exploration activities.
History
In 1996, the Office Mauritanien de Recherches Géologiques completed a regional reconnaissance exploration program within and around the Tasiast area. The results of this program were made available to third parties. As a result, Normandy LaSource Development Ltd. (“NLSD”), a subsidiary of Normandy Mining Ltd. of Australia, acquired the Tasiast area.
In 2001, NLSD was acquired by Newmont Mining Corporation creating Newmont LaSource. Midas Gold plc (“Midas”) was incorporated in England and Wales in 2002 for the purpose of acquiring Newmont LaSource’s assets in Mauritania, including exploration permits over lands hosting the Tasiast deposit, as well as various other permit areas. Midas completed its acquisition of the Tasiast deposit from Newmont LaSource on April 1, 2003, and in April 2003, Geomaque Explorations Inc. (“Geomaque”) announced the acquisition of Midas. The merger of Geomaque and Midas ultimately created a new entity; Defiance Mining Corporation (“Defiance”). In June 2004, Rio Narcea Gold Mines Ltd. (“Rio Narcea”) acquired Defiance and took ownership of the Tasiast deposit.
Red Back acquired the Tasiast project from Lundin Mining Corporation (“Lundin”) in August 2007, following Lundin’s acquisition of Rio Narcea.
Kinross acquired the Tasiast gold mine on September 17, 2010 through its acquisition of Red Back. As required by Mauritanian law, the operation is carried out by TMLSA, which is incorporated under the laws of Mauritania.
Mining at Tasiast commenced in April 2007 and the mine was officially opened by the President of Mauritania on July 18, 2007. Commissioning of the Tasiast plant continued through 2007 with commercial production declared in January 2008.
Geological Setting
The Tasiast Lands consist of three main Precambrian greenstone belts located in the western compartment of the Reguibat Shield. The Reguibat Shield consists of a series of west to east accreted, north-south trending Archaean and Lower Proterozoic metavolcano-sedimentary belts and domal basement gneiss complexes.
The Tasiast Lands are underlain by the Aouéouat greenstone belt, a north-south trending belt that is continuous along a 75 kilometre strike length on the Tasiast Lands and that may continue further to the north and south. The mine geology is characterized by a mafic to felsic metavolcano-sedimentary succession that is overlain by an iron stone formation and epiclastic units. The rocks have undergone deformation, were metamorphosed to greenschist and lower amphibolite grades and were cut by volumetrically minor younger mafic dikes. Three main prospective trends are recognized at the property with all known deposits spatially associated with the Tasiast trend. Other trends also contain gold occurrences but have been significantly underexplored relative to the Tasiast trend.
Known deposits are aligned along a north-trending corridor with a strike length greater than 10 kilometres, with the Piment deposits at the northern half of the mine area and West Branch deposits at the southern half. At West Branch, first-order structural controls on mineralization include several subparallel anastomosing faults and several generations of veins developed predominantly in altered mafic meta-igneous and metavolcanic units locally called the Greenschist Zone. Mineralization at Piment is principally controlled by several anastomosing faults developed within the hanging wall block of iron formation, felsic metavolcanic and epiclastic rocks. Vein zones are spatially associated with mineralization over horizontal widths of up to 20 metres.
Exploration
The Tasiast deposit lies within an extensive gold system that is largely under-explored. Tasiast is the first mine in the highly prospective Aouéouat greenstone belt, which is geologically similar to other Archean greenstone belts in the world that host major gold deposits.
Early phases of exploration in the Tasiast area were largely empirical in nature with the known deposits discovered through routine soil geochemistry followed up by trenching and later drilling. Prior to 2010, detailed exploration drilling focused on delineating the known deposits. In 2010 and 2011, TMLSA expanded resources by extending drilling on the known structures based on a combination of soil geochemistry, airborne geophysics and geological mapping. Recent exploration activities have largely focused outside the eight kilometre footprint of the Tasiast deposit and continued on both the exploitation permits (mainly focused on near mine exploration) and on the exploration licenses.
Mineralization
Gold mineralization has been defined over a strike length of greater than 10 kilometres and to vertical depths of at least 740 metres. All of the significant mineralized bodies defined to date dip moderately (45º to 60º) to the east and have a south-southeasterly plunge. Most of the gold mineralization at West Branch
is hosted in hydrothermally altered meta-igneous rocks (Greenschist zone) containing quartz-carbonate veins. The meta-igneous rocks are enveloped by felsic units known as felsites that occur on the footwall and hanging wall sides of the Greenschist zone. The Greenschist zone is characterized by consistently thick intervals of mineralization averaging 40 metres to 100 metres thick. Individual shoots are continuous over a strike length of at least 1,000 metres. Mineralogy within the Greenschist package is dominated by pyrrhotite, pyrite and native gold that occur as vein infill or alteration spots commonly in and around the foliation. Pyrrhotite and pyrite occur together in many places but in variable ratios. Zones of pyrite-only and pyrrhotite-only sulphide facies are rare.
Piment mineralization is largely hosted along fault splays and within the adjacent altered and veined iron formation and epiclastic units. Individual mineralized shoots are continuous over 300 metres and to vertical depths of at least 260 metres. The minerals associated with gold at Piment are pyrrhotite and pyrite.
Drilling
The Tasiast mine property has been the subject of numerous drill campaigns since its discovery. The total number of drillholes completed on the project totals 16,600 holes with an aggregate total of 1,739,350 metres.
During 1999 and 2000 NLSD completed 459 holes totalling 37,919 metres. Between March 2003 and October 2004, Defiance completed approximately 448 holes for 39,085 metres. Rio Narcea resumed drilling from 2006 to 2008, completing 147 holes for 16,966 metres. Red Back drilled from 10 of August of 2007 until the completion of the acquisition in September 2010 and completed 6,132 RC holes for 504,407 metres and 132 core holes totalling 29,243 metres.
Since the acquisition of Tasiast by Kinross, TMLSA has completed 9,608 holes for 1,123,550 metres. In 2010, TMLSA drill campaigns completed 922 holes for 111,105 metres. In 2011, TMLSA drill campaigns completed 3,086 holes for 445,469 metres. In 2012, TMLSA drill campaigns completed 2,992 holes for 335,396 metres. In 2013, TMLSA drill campaigns completed 757 holes for 80,047 metres. In 2014, 861 holes for 58,584 metres were drilled across the Tasiast mineral licenses. In 2015, 990 holes were completed for 82,949 metres.
Sampling and Analysis
Sampling of drill core and RC cuttings was done in accordance with standard industry practices. Samples from the exploration program at Tasiast have been analysed at both the onsite SGS Mineral Services (“SGS”) facility and at the SGS laboratories at Kayes and Morila in Mali and Ouagadougou in Burkina Faso.
TMLSA sample pulps were analysed for gold using a 50 gram fire assay with an AAS finish with a detection limit of 0.01 grams per ton.
In 2010 a total of 22,863 quality assurance and quality control (“QA/QC”) samples including standards, blanks and duplicates were submitted routinely and blind to three different SGS laboratories, namely Kayes and Morila in Mali, and Tasiast in Mauritania. In 2011 a total of 34,130 QA/QC samples including standards, blank and field duplicates were submitted routinely and blind to five different labs. In 2012, a total of 42,706 QA/QC samples including standards, blanks and field duplicates were submitted routinely and blind to 12 labs. Additional crush and pulverised duplicate samples were analysed at various labs. Subsequent to the assay report directly imported into the database, QA/QC charts were routinely generated and reviewed by on-site geologists to determine the jobs that passed, accepted or failed QA/QC control. In 2013, a total of 12,123 QA/QC samples including standards, blank and field duplicates were inserted routinely and blind to the laboratory. The samples were sent to numerous laboratories including: SGS Laboratory at Kayes and Tasiast, ALS Laboratory in Johannesburg, Kumasi, Nouakchott, Romenia and Tasiast. Since July 2013 ALS Laboratory took over the facilities at the Tasiast mine, and operated the laboratory. Since then, exploration samples are prepared and analysed at site by ALS Laboratory.
An independent consultant provided a QA/QC report throughout 2013 following a review of the sampling process, laboratory visits and review of the QA/QC data. The available data indicated that the analytical accuracy of the assaying for the exploration program is within the industry accepted standards.
Security of Samples
Closely following Red Back’s acquisition of the project in August 2007, the on-site SGS assay facility became operational. Prior to that time, samples had been prepared on site by staff of TMLSA under supervision of senior geological staff. Since that time, samples have been prepared and analysed under contract by SGS on site, SGS Kayes and Morila, Mali, and SGS Ouagadougou, Burkina Faso. Samples, including duplicates, blanks and certified reference materials were delivered daily from the drill rig to a secure storage area within the Tasiast office complex.
Following Kinross’ acquisition of Red Back in September 2010, all drill samples collected are under direct supervision of project staff of the operator at the time, up to the moment they are delivered to laboratory staff or placed on contracted trucks for delivery to the Mali laboratory. Samples, including duplicates, blanks and certified reference materials are delivered daily from the drill rig to a secure storage area within the fenced Tasiast core facility. Chain of custody procedures consist of filling out sample submittal forms that are sent to the laboratory with sample shipments to make certain that all samples are received by the laboratory.
Since July 2013 when ALS Laboratory took over the facilities at the Tasiast mine, exploration samples are prepared and analysed at site by ALS Laboratory.
Mineral Resource and Mineral Reserve Estimates
Refer to Kinross Mineral Reserves and Mineral Resources on pages 18 — 21 for quantity, grades and category. Assumptions are outlined in the Notes — 2015 Kinross Mineral Reserve and Mineral Resource Statements section commencing on page 21.
Mining and Milling Operations
Ore and waste rock is currently mined by conventional open pit methods. Drilling and blasting is required for the majority of material going forward. The mining fleet on site is made up of hydraulic excavators loading 90 ton and 230 ton haul trucks. A high level of grade control is currently performed using RC drill rigs.
Currently, ore is hauled to the mill with an approximate current annual capacity of a nominal 2.6 million tonnes. In accordance with the 2015 mine plan, ore comes solely from the West Branch deposit. This material is harder than the ore from the Piment deposits and the weathered portion of the West Branch deposit resulting in a decrease in mill capacity relative to previous years. Crushing of the ore takes place in three stages; a primary jaw crusher that reduces ore to less than 150 millimetres; a secondary cone crusher and two tertiary cone crushers producing a final product size of nominally minus 10 millimetres. Crushed ore is fed to two 2.2 megawatt ball mills in closed circuit with hydro cyclones and gravity concentration. The grinding circuit produces a product size of 80% passing 90 microns which is processed in a conventional CIL circuit and ADR plant to produce doré bullion. Gold recovery varies from 91% to 93%.
Kinross will transition from the existing Tasiast 8 kt/d CIL plant to a potential 30 kt/d CIL plant by means of a potential two-phase expansion.
In phase one, a new front end gyratory crusher and a 40ft x 25ft, 26.5 MW gearless mill drive (“GMD”) SAG mill will be incorporated with additional leaching capacity to the existing 8 kt/d plant in order to increase capacity to 12 kt/d.
Phase two would consist of the addition of: a third ball mill, larger pebble crusher, pre-leach and tailings thickeners, leach tanks, CIL (carbon in leach) tanks, gravity circuit consisting of centrifugal concentrators and intensive leach cyanidation, elution circuit, gold room, cyanide destruction system, and reagent mixing storage and distribution. Phase two would include the necessary upgrades to consumable storage and utilities to facilitate full operation. The plant design life is 15 years.
Metallurgical test work has been performed to establish the gold recovery that could be achieved from oxide ore using a conventional run-of-mine dump leaching method. The test work focused on lower-grade material which was below the economic cut-off grade for CIL milling, and which had to be mined. The dump leach material constitutes a low-grade “halo” that typically is located adjacent to, or in association with, the higher grade oxide ore zones that are being mined to feed the CIL mill.
Tailings slurry from the CIL process is pumped to the tailings storage facility (“TSF”). The TSF is a specifically engineered facility, currently comprising one lined paddock dam, and designed to be impervious, located one kilometre southwest of the processing plant. After settling of the solids, process solution is recovered and pumped to the plant for re-use.
Life of Mine and Capital Expenditures
On March 30, 2016, Kinross announced a decision to execute the phase one expansion to 12,000 tonnes per day and advance the phase two, 30,000 tonnes per day option into a feasibility study. The current mine plan, production schedule and reserves statement are based on the 30,000 tonnes per day (phase two) pre-feasibility study, with mine life to continue through to 2030 (including mill production from stockpile following completion of mining).
Capital expenditures for 2015 at Tasiast were approximately $161.2 million.
Exploration and Development
The goal for the 2016 exploration program is to continue exploration along the main trend and to identify satellite deposits as well as delineate known targets. The exploration program consists of reconnaissance mapping, trenching and approximately 38,000 metres of drilling. Near pit exploration for oxide ores are in progress.
Other Kinross Properties
Fort Knox and Area, Alaska, United States
The Fort Knox mine is owned and operated by Kinross’ wholly-owned subsidiary Fairbanks Gold Mining Inc. (“FGMI”). The Fort Knox property is located in Fairbanks North Star Borough, Alaska and includes the main Fort Knox open pit mine, mill, tailings storage facility, heap leach facility, the Gil project, and the True North open pit mine (which is under post-closure monitoring). Detailed financial production and operational information for the Fort Knox mine is available in Kinross’ MD&A for the year ended December 31, 2015. In addition, please see the Company’s National Instrument 43-101 Technical Report dated March 31, 2015 in respect of Fort Knox, available at www.kinross.com and under the Company’s profile on SEDAR (www.sedar.com).
Fort Knox is located 42 kilometres by road northeast of the city of Fairbanks, in Alaska, United States of America. The Fort Knox property includes the main Fort Knox open pit mine, mill, heap leach, tailings storage facility, True North open pit and the Gil property, and encompasses 30,917 hectares. FGMI controls a large and diverse group of properties that comprise its mineral holdings in the Fairbanks Mining District. These properties include State of Alaska mining claims, patented and unpatented federal lode and placer mining claims, and private land. Some of the claims are owned outright, while others are controlled through leases. Mineral reserves at the Fort Knox mine are situated on 505 hectares of land that are covered by a State of Alaska Millsite Lease and the Fort Knox Upland Mining Lease.
The State of Alaska Upland Lease carries a 3% production royalty, based on net income and recovery of initial capital investment. Mineral production from State mining claims is subject to a mine license tax, following a three-year grace period after production commences. There has been no production from State claims situated outside the boundaries of the Upland Lease at the Fort Knox Mine. Fort Knox royalties and production taxes are estimated to be $6 million for 2016, based on a gold selling price of $1,100 per ounce.
All requisite permits have been obtained for mining of the existing Fort Knox open pit mine and are in good standing in all material respects. Current expansion projects for waste rock and heap leach were approved by the applicable agencies in 2014.
Mining at the True North open pit is complete. Reclamation was substantially completed in 2012 and it is now under post-closure maintenance and monitoring.
Power is provided to the mine by Golden Valley Electric Association’s power grid, serving the area over a distribution line paid for by Kinross.
Access to the Fort Knox mine from Fairbanks is by 34 kilometres of paved highway and eight kilometres of unpaved road. The True North mine is located 18 kilometres west of the Fort Knox property and is accessible by an unpaved road. The area has a subarctic climate, with long, cold winters and short summers.
Fort Knox operates in material compliance with applicable environmental laws and regulations and with Kinross’ policies on environment, health and safety. There are no known material environmental concerns at Fort Knox. Kinross estimates the net present value of future cash outflows for site restoration costs at Fort Knox and True North under IFRS, IAS 37 and IFRIC 1 for the year ended December 31, 2015, at approximately $85.1 million. As at December 31, 2015, Kinross has posted approximately $96.8 million of letters of credit to various regulatory agencies in connection with its closure obligations at Fort Knox and True North. The financial assurance for Fort Knox and True North is $96.8 million.
Kinross’ mining and exploration properties are located within the Fairbanks mining district, which is located within the northwestern part of the Yukon—Tanana terrane (YTT). The Fort Knox gold deposit is hosted by a granitic body that intruded the Fairbanks Schist. The surface exposure of the intrusive body is approximately 1,100 metres in the east-west direction and 600 metres north-south.
The Fort Knox deposit is mined by conventional open pit methods. Higher grade ore from the Fort Knox mine is processed at Kinross’ carbon-in-pulp mill located near the Fort Knox mine. The mill processes ore 24 hours per day, year-round. Lower grade ore is processed on a dedicated leach pad that was commissioned in 2009. The Fort Knox mill has a daily capacity of between 33,000 and 45,000 tonnes.
The Fort Knox heap leach facility is located in the upper end of the Walter Creek drainage, immediately upstream of the tailings storage facility. Construction began in 2008 and is separated into a total of seven stages covering approximately 196 hectares with a total capacity of 278 million tonnes. The first stage of the heap leach facility went into operation in the fall of 2009. The facility includes a valley fill leach pad and two carbon-in-column (“CIC”) plants with a capacity of 61,000 litres per minute. Run of mine ore is hauled from the pit and from existing stockpiles and loaded onto the leach pad in 15 metre lifts. Leach solution flows through the loaded ore into a 416 million litre in-heap storage reservoir. The pregnant solution is pumped to the CIC plants located adjacent to the existing mill. After the pregnant solution has been processed through the CIC plants, barren solution is pumped back to the heap leach to recirculate.
The final year for ore processed through the Fort Knox mill is 2018, after which the tailings storage facility will be at full capacity. After 2018, all of the run of mine ore and ore stockpiles will be stacked on the Walter Creek Heap Leach. Fort Knox pit production is expected to continue until 2020. Capital expenditures for 2015 at the Fort Knox operations were $140.8 million.
Fort Knox continues to evaluate the potential to expand the existing operation within the available land package through exploration evaluation of projected gold mineralization.
Round Mountain, Nye County, Nevada, United States
The Round Mountain mine is owned and operated by Kinross’ wholly-owned subsidiary Round Mountain Gold Corporation (“RMGC”). On January 11, 2016, Kinross acquired the remaining 50% interest from two affiliates of Barrick Gold Corporation (“Barrick”). Prior to this acquisition, Kinross owned an undivided 50% interest in the joint venture common operation known as the Smoky Valley Common Operation (“SVCO”). Kinross acquired its initial interest in Round Mountain in January 2003. Detailed financial, production and operations information for Round Mountain is available in Kinross’ MD&A for the year ended December 31, 2015.
The Round Mountain mine is located approximately 90 kilometres north of Tonopah in Nye County, Nevada. The SVCO controls the mineral and surface rights covering approximately 22,907 hectares through ownership or lease of patented and unpatented mining claims.
Mine production at the Round Mountain pit is subject to two net smelter return royalties, one ranging from 3.53% at gold prices of $320 per ounce to 6.35% at gold prices of $440 or more per ounce and the other at a flat 1.5% rate3. During 2014, a total of $24.1 million in royalties was paid (with Kinross paying $12.1 million). During 2015, a total of $21.1 million in royalties was paid (with Kinross paying $10.6 million). Round Mountain is also currently subject to the state of Nevada Net Proceeds Tax at a 5% rate whereby gross proceeds from the sale of minerals are adjusted for certain allowable deductions. The 2015 Net Proceeds Tax was $6.9 million compared with $4.9 million in 2014 (with Kinross’ portion being $3.5 million and $2.5 million, respectively).
The first gold production from the Round Mountain district occurred in 1906. The original SVCO was formed in 1975 to operate the mine and commercial production commenced in 1977. SVCO has produced approximately 13.93 million ounces of gold since inception. A total of 535,974 ounces was produced prior to the SVCO partnership. A series of ownership changes occurred which eventually led to the 50-50 ownership by Barrick and Kinross that was in place until the acquisition that closed in early 2016.
3 This 1.5% royalty was previously paid to Barrick, but was acquired by Kinross as part of the acquisition from Barrick of the remaining 50% interest in Round Mountain on January 11, 2016.
The Round Mountain mine currently operates a conventional open pit that is approximately 10,700 feet long in the north-west, south-east direction and 8,800 feet wide. The operation uses conventional open-pit mining methods and recovers gold using four independent processing operations. These include crushed ore heap leaching (reusable pad), run-of-mine ore heap leaching (dedicated pad), milling and the gravity concentration circuit. Heap leachable material is being displaced by millable material as the pit becomes deeper. Many areas of the pit are mining material below the oxidation-sulphide boundary. The higher grade oxidized ores are crushed and placed on the reusable pad. This material is typically leached for 60-90 days and then relocated to the dedicated pad. Lower grade oxide ore is placed on the dedicated pad.
The Gold Hill mine is a small deposit located near the Round Mountain mine. Gold Hill is approximately 3,000 feet long in the east-west direction and up to 2,600 feet in the north-south direction. The mine is operated as an independent operation also using conventional open-pit mining methods. The ore consists of oxide material that is placed directly on a dedicated heap leach pad. Originally the higher grade material was to be crushed to minus eight inches then placed on the dedicated pad and the lower grade material was to be placed directly on the dedicated pad. Presently none of the material is being crushed because adequate fragmentation is obtained through proper blasting.
Mining and ore processing operations at Round Mountain and Gold Hill have been conducted as approved in the 2010 Record of Decision and in the February 2015 Amendment to the Plan of Operations. Annual reviews of the operations have been made by relevant government authorities. The comprehensive reclamation plan and bond cost was $147.2 million prior to the recent Plan of Operation approval. Based on the 2015 reclamation cost estimate, the required bond is $161.2 million. We anticipate that the bond will increase by some amount in 2016. Prior to the acquisition, Kinross’ share was covered by a letter of credit posted with the Bureau of Land Management (“BLM”). As it is now required to cover the entire reclamation bond, the Company is in the process of obtaining and posting security with the BLM for the full amount. The reclamation plan and bond cost estimate has been reviewed annually, but we anticipate that the regulatory agencies will review this obligation every three years starting in 2017. Adjustments are made to the estimate with documented increases in reclamation costs, concurrent reclamation, and approved minor changes to the plan of operations.
Based upon the current mineral reserve estimates, production from Round Mountain and Gold Hill is expected to end in 2019 and 2016, respectively, with mill stockpile and heap leach processing continuing through 2022 and 2027, respectively. Exploration around the mine area will continue in 2016 with the primary emphasis on the area of mineralization to the west, and below the Round Mountain pit.
Bald Mountain, White Pine County, Nevada, United States
The Bald Mountain mine is owned and operated by Kinross’ wholly-owned subsidiary KG Mining (Bald Mountain) Inc. (“KGBMI”). On November 12, 2015, Kinross announced that it had entered into a definitive asset purchase agreement to acquire 100% of the Bald Mountain mine and an associated land package from an affiliate of Barrick, and acquired its interest on January 11, 2016.
The Bald Mountain mining district is located at the southern end of the Ruby Mountains in east-central Nevada, White Pine County, at the southeastern end of the Carlin Gold Trend. The property encompasses 240 square miles of patented and unpatented lode claims.
Pursuant to the terms of the acquisition, Barrick obtained a right to receive a 2% net smelter return royalty on future gold production from Kinross’ 100% owned Bald Mountain lands following the post-closing production of 10 million ounces from such lands. In addition, mine production at Bald Mountain is subject to eleven additional royalties on various land packages. The most significant royalties include two sliding scale net smelter return royalties, one ranging from 0% at gold prices under $400 per ounce to 5% at gold prices of $480 or more per ounce, and the other ranging from 3.5% at gold prices under $375 per ounce to 5% at gold prices of $425 or more per ounce, with only 50% of the royalty amount being payable to this third party. Another significant royalty is divided between three arm’s length parties, one receiving a 2.418% net smelter royalty, another a 0.5% net smelter royalty, while the third party retains 10% of net proceeds.
Bald Mountain will be subject to the state of Nevada Net Proceeds Tax at a 5% rate whereby gross proceeds from the sale of minerals will be adjusted for certain allowable deductions.
Placer gold (with minor copper, silver, and antimony), was initially mined in the Bald Mountain area from the 1870s to 1890s. Modern exploration for bulk disseminated gold deposits commenced in the late 1970s. Since 1977, gold exploration has mainly focused on defining the outcropping, oxide gold deposits. In 1981, Amselco Minerals began modern open pit mining and cyanide gold recovery via a mill in the Alligator Ridge-Vantage area in the southern portion of the district. Numerous small ore bodies were mined and heap leached by USMX Inc. from 1988 to 1993 in the southern and eastern areas of the district. Placer Dome Inc. mined several pits in the northwest area from 1983 to 2005, including Top, Sage Flats, Rat, LJ, and Numbers. Placer Dome Inc. acquired the USMX properties in 1993 and consolidated the district into one claim block. Barrick acquired Placer Dome in January 2006 to become 100% owner and operator of Bald Mountain, until the recent acquisition by KGBMI. Both the North and South areas are 100% Kinross-owned.
The Bald Mountain operation is an open pit mining operation with production from a number of different pits. The three main deposits are Top, Red Bird and Saga, with Top and Red Bird representing more than 66% of the known reserves. Bald Mountain includes several deposits scattered over the property, and two run of mine (“ROM”) leach pads (Bald Mountain and Mooney).
The processing method for the Bald Mountain Mine operation is a heap leach ROM ore and gold recovery in and carbon ADR plants. There is no comminution after the material is blasted in the pit. All blasted pit run ore is sent directly to heap leach pads for processing. The mining recovery is high because the ore blocks are large compared to the selective mining unit, and close to all of the material outlined as ore in the grade control process is mined. Selectivity of the ore mining is minimal due to the low cut-off grade and the fact that the grade control outlines large blocks of ore-grade material for mining.
Kinross has allocated approximately $6 million to exploring Bald Mountain in 2016, with the majority dedicated to the North and South mine operations, areas wholly-owned by the Company. Resource-conversion drilling commenced on the North mine area immediately after the acquisition was finalized. Drilling in the South area is expected to commence in mid-2016.
Approximately 40% of the Bald Mountain land package in the less-explored ground located between the 100% Kinross-owned North and South mine operations areas is subject to a 50-50 exploration joint venture partnership between Kinross and Barrick. Kinross operates the joint venture, and in 2016, plans to compile and review geoscience data, followed by targeted field work to develop geological models and new drill targets. The Company will consider drilling some of the drill targets in 2016.
La Coipa, Chile
Kinross acquired its initial 50% interest in the La Coipa mine in January 2003. Kinross now owns a 100% interest following the completion of an asset swap transaction with Goldcorp Inc. (“Goldcorp”) on December 21, 2007 pursuant to which Kinross acquired the 50% interest previously owned by Goldcorp. The mine and plant began partial temporary suspension of activities in October of 2013, while evaluation of several nearby mineralized zones is pursued.
The La Coipa mine, located approximately 1,000 kilometres north of Santiago in Chile’s Region 3 (Atacama), consists of five deposits (notable deposits being Ladera-Farellon, Coipa Norte, Brecha Norte, Can Can, and Puren), which are owned by Compania Minera Mantos de Oro (“MDO”), a Chilean subsidiary of Kinross, except for Puren which is owned through a joint venture between MDO and Codelco-Chile, with participation interests of 65% and 35%, respectively. The La Coipa mine consists of approximately 19,874 hectares of exploitation concessions (including Puren). In addition, Kinross holds a 50% interest in Minera La Coipa which has claims covering approximately 10,541 hectares in the area surrounding the La Coipa mine.
No royalties are payable on gold and silver produced from the La Coipa mine properties. A 35% withholding tax is applicable on all dividends disbursed to foreign shareholders, less the corporate income tax already paid. In addition, a mining tax is applicable, the specific applicable tax rate being based on a progressive scale that ranges from 0.5% to 4.5% based on the volume of sales made converted into metric tonnes of copper.
The La Coipa area was identified as a potential precious metals prospect almost a century ago, but did not receive much attention until the 1970s, when several companies began to actively explore the area. MDO began drilling in the La Coipa area in 1989 and has completed 442,576 metres of drilling since then, consisting of 2,097 RC holes and 337 Core holes.
The La Coipa mine received an ISO 14001 certification in July 2002. This certification must be renewed every 3 years. The last recertification was made in 2013. In 2012, La Coipa received a certification of full compliance under the Cyanide Code. The most significant environmental issue relates to the mercury contained in ore, which after processing and placement in the tailings facility resulted in mercury contamination of the Quebrada La Coipa Aquifer. In the mid-1990s, mercury and cyanide (Hg/CN) from tailings seepage were detected in control wells. MDO made appropriate notifications to responsible authorities and took remedial measures including installation of a groundwater treatment plant at the leading edge of the groundwater management area in 2000. During 2005 and 2006, geochemical investigations in the tailings were completed to characterize the source of the mercury and groundwater hydro chemical and hydrological models were updated for the Quebrada La Coipa Aquifer. The recommendation resulting from a workshop held in 2005 with various consultants and experts was to construct two concrete cut-off walls in the valley at the toe of the tailings areas to isolate the contaminated water and control the Hg/CN migration downstream in the valley. Construction of both cut-off walls was completed in 2007. Water treatment pilot plant tests, to treat water isolated between the concrete walls, were initiated in 2008. A seepage model for the tailings facility was developed that indicated tailings pore water will drain for about 80 years after the operation closes. MDO voluntarily provided a remediation project to the regional regulatory authority with a Declaration of Environmental Impact (“DIA”), which DIA was approved on August 31, 2007. During 2015, a DIA for a second water treatment plant was approved and sectorial permitting is now under way. On March 17, 2016 Chile’s Superintendencia del Medio Ambiente (“SMA”), a national environmental agency, filed charges against MDO over a series of alleged breaches at La Coipa. The charges were filed following a planned inspection of the facilities. A total of seven charges were filed against MDO relating to alleged breaches of environmental permits and/or failure to properly permit certain activities at its facilities, including capturing water at an undesignated reservoir, deficiencies in the capturing system of mercury, deficiencies in the monitoring system, and concentrations of mercury above permitted levels in some effluent. MDO faces a fine of up to 10,000 annual tax units with an approximate value of $8 million, the temporary or definitive suspension of operations, or even the revocation of its environmental permit. The Company only recently received the SMA’s charges and is in the process of assessing them.
Beginning in 2009 and up until July 2012, recovered mercury was moved offshore and sold in accordance with the approved Environmental Impact Statement for the Transport of Mercury of La Coipa, adopted on August 20, 2007. Sales of the remaining mercury (from production and small quantities generated by the water remediation activities) are being arranged.
Until October 2013, La Coipa operated two pits (Ladera-Farellon and Can Can). Mining was carried out with front-end loaders, diesel rotary drills and 150-tonne trucks. Ore was crushed and then ground in a circuit incorporating a SAG mill with a pebble crusher and two ball mills with a throughput of 15,000 tonnes per day. The ground ore was leached, then filtered and washed to separate out the tailings, and the solution was passed through a Merrill-Crowe plant to extract the leached gold and silver. The precipitate was then sent to the refinery.
Current activities undertaken at La Coipa are the operation of the water remediation plant, permitting to re-open La Coipa and studies to optimize the mine-life extension project.
Kettle River — Buckhorn, Washington State, United States
Kinross owns a 100% interest in the Buckhorn Mine following its acquisition of Crown Resources Corporation (“Crown”) in August 2006. Crown is a wholly-owned subsidiary of Kinross and is the operator
of the Buckhorn Mine. Echo Bay Minerals Company (“Echo Bay”) is a wholly-owned subsidiary of Kinross and is the operator of the Kettle River Mill. Both Crown and Echo Bay also hold mineral rights in northern Washington State. Detailed financial, production, and operational information for the Buckhorn Mine is available in Kinross’ MD&A for the year ended December 31, 2015.
The Buckhorn Mine is located in the Myers Creek Mining District of northeastern Okanogan County, Washington, approximately 77 kilometres by road from the town of Republic, Washington. Kinross controls mineral and surface rights covering approximately 190 hectares in the immediate mine area, through ownership of patented mining claims, and has access to an additional 5,300 hectares of mineral rights surrounding the mine through ownership or lease of unpatented mining claims, state mineral prospecting leases, and private mineral leases.
No royalties are payable on gold and silver produced from the mine. In 2006 Kinross exercised its right to buy-out the royalties on gold and silver production that had been retained by Newmont Mining Corporation.
Exploration occurred sporadically in the Buckhorn area beginning in the early twentieth century. There were concerted campaigns by large companies in the 1960s and 1970s, focused mostly on copper. Systematic gold exploration began on the current property in the mid-1980s, culminating in the discovery of significant gold mineralization in 1988. Since then, over 3,200 drillholes totalling over 270,000 metres have been completed in the area.
The Buckhorn Mine is a three-portal access underground mine that produces material from two separate areas, the Southwest and Gold Bowl zones. Both cut and fill and longhole stoping mining methods are employed and the current average production rate is 1,000 tonnes per day. The Buckhorn Mine ore is trucked 77 kilometres to the Kettle River Mill where the ore is processed using conventional crushing and grinding before entering a flotation circuit followed by CIL. The mill is capable of processing 2,100 tonnes per day. With excess capacity, the Kettle River Mill occasionally processes material from other mining companies in the western United States and Canada.
The environmental aspects of the project have been studied extensively since 1991, and on September 25, 2006 the Washington Department of Ecology (the “DOE”) issued a Final Supplemental Environmental Impact Statement, and construction commenced. All permits necessary to commence commercial mining operations were issued by the end of 2007. On February 27, 2014, the DOE renewed Buckhorn Mine’s National Pollution Discharge Elimination System Permit (the “Renewed Permit”), with an effective date of March 1, 2014. The Renewed Permit contained conditions that were more restrictive than the original discharge permit. In addition, the Company felt that the Renewed Permit was internally inconsistent, technically unworkable and inconsistent with existing agreements in place with the DOE, including a settlement agreement previously entered into by Crown and the DOE in June 2013 (“Settlement Agreement”). On February 28, 2014, Crown filed an appeal of the Renewed Permit with the Washington Pollution Control Hearings Board (“PCHB”). In addition, on January 15, 2015, Crown filed a lawsuit against the DOE in Ferry County Superior Court, Washington, claiming that the DOE breached the Settlement Agreement by including various unworkable compliance terms in the Renewed Permit. On July 30, 2015, the PCHB upheld the Renewed Permit. Crown filed a Petition for Review in Ferry County Superior Court, Washington, on August 27, 2015, seeking to have the PCHB decision overturned.
In 2008, the Buckhorn mine commenced gold production, reaching design capacity of 900 tonnes per day in July 2009 and 1,100 tonnes per day in July 2010.
Based on the existing proven and probable mineral reserves at Buckhorn, the mine is scheduled to continue production until late 2016. The planned exploration program for 2016 consists of mine mapping, sampling, and approximately 500 metres of drilling.
Lobo-Marte, Chile
The Lobo-Marte project is owned by Compañía Minera Maricunga (“CMM”), a Chilean company that is 100%-owned by Kinross. Kinross holds a 100% interest in the Lobo-Marte project, having acquired a 40% interest in the project from Anglo American Plc (“Anglo”) in 2008, and the remaining 60% interest from Teck Cominco Limited (“Teck”) in early 2009.
Kinross completed a prefeasibility study at the Lobo-Marte project in 2009 and updated the prefeasibility study in 2010. In 2011, Kinross submitted the environmental and social impact study (“ESIA”) for the project to the Chilean authorities. In 2012, Kinross decided to extend the project timeline as part of its capital optimization process. In 2013, the permitting process was suspended pending further assessment of the project. On November 17, 2014, the Company withdrew its permit application and stopped the permitting process at Lobo-Marte due to substantial changes in the plan of operations, the footprint of the project, project economics, and stringent requirements associated with the permit application. As a result of the permit withdrawal, approximately 6 million estimated gold ounces at Lobo-Marte have been reclassified as measured and indicated mineral resources. Any future development or operations at Lobo-Marte would require the re-initiation of the permitting process.
The Lobo-Marte project currently comprises two open-pit minable gold ore deposits, located approximately seven kilometres apart, in Region III of Northern Chile, approximately 650 kilometres north of Santiago and 100 kilometres east of Copiapó. The project lies approximately 65 kilometres south of Kinross’ La Coipa operation and 60 kilometres north of the Maricunga mine.
The Lobo-Marte project includes 123 concessions that are either granted (65) or in the process of receiving a final registered grant (58) covering a total of 50,355 hectares in a single contiguous block. Concessions are held in the name of CMM. Kinross has two established easements for the construction of roads, stockpiles, process facilities, camp, support facilities, water extraction and associated pipelines. Additional rights will be required to support project development.
The project has a 1.75% net smelter return royalty on 60% of future production, payable when the gold price is $760 per ounce or more. Kinross’ obligation to make royalty payments will cease when an aggregate amount of $40 million has been paid.
The Lobo deposit was discovered through regional geochemical surveys in 1981-1982. The Marte deposit was discovered in 1982 through a program of regional soil sampling, geophysical surveys and geological mapping. The Marte deposit was mined by a joint venture of Anglo American and Cominco from 1988 to 1992; a total of 3.78 million tonnes of ore grading 1.51 grams per tonne of gold, 0.3 million tonnes of low-grade mineralization and 4.7 million tonnes of waste were mined.
Prior to 2009, a total of 153 Core and RC drillholes (34,649 metres) were completed at Lobo, with an additional 211 Core and RC drillholes (26,658 metres) at Marte. During 2010 a total of 24,148 metres of Core drilling and 4,614 metres of RC drilling were completed at Lobo and Marte. During 2011 a total of 9,289 metres of Core drilling and 4,909 metres of RC drilling were completed at Lobo and Marte. In 2012, approximately 5,274 metres of Core drilling was completed at Lobo. The 2013 exploration plan consisted of surface exploration works including: rock chip samples, soil samples, trenching and mapping. No exploration work was performed in 2014 and 2015.
The project is located within a biological corridor established between two sectors of the Nevado Tres Cruces National Park, created to preserve and protect the vegetation of the desert steppes and the Andean salars (salt lakes). Kinross has completed the biophysical and socioeconomic baseline study to support the preparation of an ESIA. Because of the recognized environmental importance of these areas, the baseline study for the ESIA is critical to the development of the project. Areas which were addressed include proper management of water extraction, disposition of waste material, heap leach facilities and other installations that interact with the environment.
Cerro Casale, Chile
On March 31, 2010, Kinross sold one-half of its then 50% interest in the porphyry copper deposit known as Cerro Casale to Barrick. As a result, Kinross holds a 25% interest and Barrick holds a 75% interest. In July 2012, Barrick, as operator of the project, decided to delay making a construction decision after concluding that the project did not meet its required investment criteria. To date, no further decisions have been made in respect of Cerro Casale.
The Cerro Casale project is located in the Maricunga District of Region III of northern Chile. The city of Copiapó is 145 kilometres northwest of the deposit. The international border separating Chile and Argentina is located approximately 20 kilometres to the east.
The Cerro Casale project is owned by Compañía Minera Casale (“CMC”), a contractual mining company formed under the laws of the Republic of Chile. CMC owns 410 claim groups totalling 72,757 hectares. Of these, the mine-plant complex is protected by 56 claims, covering a total of 23,573 hectares, the balance, is mainly dedicated to protect the linear works and infrastructure.
Water rights are held in three areas: Piedra Pomez, Pedernales and Rio Gallina. Piedra Pomez and Pedernales are located 120 kilometres and 210 kilometres, respectively, north of Cerro Casale, while Rio Gallina is in very close proximity to Cerro Casale. Currently, extraction of 52 litres per second is permitted from Rio Gallina for project construction purposes only for a period of 5 years and extraction of 785 litres per second is permitted from Piedra Pomez for the 20 year operations phase.
Minera Anglo American Chile Limitada and its affiliates are owed a royalty from production from the Cachito and Nevado mining concessions, which cover all of the Cerro Casale deposit. The royalty is capped at $3 million and is based on a gold trigger price, and varies from 1% to 3% of net smelter returns. At the gold prices used to constrain mineral resources and mineral reserves, a 3% NSR royalty is applicable.
Environmental studies for the Cerro Casale project were initiated by CMC in 1998 and led to the preparation of the first environmental impact study (“EIS”) presented to the Government of Chile’s responsible authority on March 12, 2001. Following a documented review process, approval for this EIS was granted on February 1, 2002.
Since the approval was granted in 2002, there have been changes to the project plan, including new components (for example, the valley heap leach facility) and changes to the original plan (for example, a change in the proposed alignment of the concentrate pipeline). CMC submitted a new EIS in 2011 covering all changes made since the approval of the 2001 EIS. The 2011 EIS was approved on January 3, 2013.
The Cerro Casale deposit is located in the Aldebarán sub-district of the Maricunga Volcanic Belt. The Maricunga Volcanic Belt is made up of a series of coalescing composite, Miocene andesitic to rhyolitic volcanic centres that extend for 200 kilometres along the western crest of the Andes. The volcanic rocks are host to multiple epithermal gold and porphyry-hosted gold-copper deposits, including Cerro Casale, Maricunga, Lobo-Marte and La Coipa, as well as numerous other smaller mineral prospects. The volcanic rocks overlie older sedimentary and volcanic rocks of Mesozoic and Paleozoic age.
Gold-copper mineralization occurs in quartz-sulphide and quartz-magnetite-specularite veinlet stockworks developed in the dioritic to granodioritic intrusives and adjacent volcanic wall rocks. Stockworks are most common in two dioritic intrusive phases, particularly where intrusive and hydrothermal breccias are developed.
Mineralization extends at least 1,450 metres vertically and 850 metres along strike. The strike of mineralization follows west-northwest fault and fracture zones. The main zone of mineralization pinches and swells from 250 to 700 metres along strike and down dip steeply to the southwest. The highest grade mineralization is coincident with well-developed quartz-sulphide stockworks in strongly potassic-altered intrusive rocks.
Exploration programs have been undertaken by a number of companies, including AngloGold, Bema, Arizona Star Resource Group, Placer Dome Inc., Kinross and Barrick. Work completed during 1989-
2009 was comprised of property-wide geological mapping, interpretation of Landsat imagery, ground and airborne geophysical surveys, rock-chip and geochemical sampling, including bulk leach extractable gold and -80 mesh stream sediment, soil, talus, road-cut and grab sampling, trenching, RC and Core drilling, metallurgical testwork, and studies to support pre-feasibility and feasibility-level project assessment.
Maricunga, Chile
The Maricunga heap leach mine, formerly known as the Refugio mine, is owned and operated by CMM. Previously, each of Kinross and Bema held a 50% interest in the Maricunga property and Kinross acquired the remaining 50% when it acquired Bema in 2007. Detailed financial, production and operations information for Maricunga is available in Kinross’ MD&A for the year ended December 31, 2015.
The Maricunga property is located in the Maricunga District of the Region III of Chile, 120 kilometres east of the town of Copiapó.
All surface and mineral claims, surface rights and water rights are maintained in good standing. Mining claims total 9,380 hectares. In addition to the mineral claim rights, CMM also holds title to surface rights at Maricunga, providing the land required for the leach pads, waste dumps, camp and other facilities. Water extraction rights, totalling 258 litres per second, have been secured by CMM.
Maricunga pays a royalty to Compañía Minera Refugio on the Pancho and Verde pits. The royalty varies from 1.25% to 2.5% of net smelter returns (depending on the applicable net operating margin), which will be paid until December 31, 2040.
The Verde and Pancho gold deposits at Maricunga occur in the Maricunga Gold Belt of the high Andes in northern Chile. Since 1980, a total of 40 million ounces of gold have been defined in the belt.
Gold mineralization at Maricunga is hosted in the Refugio volcanic-intrusive complex of Early Miocene age. These rocks are largely of intermediate composition. The Refugio volcanic-intrusive complex is exposed over an area of 12 square kilometres and consists of andesitic to dacitic domes, flows, and breccias that are intruded by subvolcanic porphyries and breccias.
Most of the structural trends affecting the Verde and Pancho deposits are related to fracture systems rather than fault zones. One of the main structural features influencing the Pancho deposit is the Falla Guatita fault zone. Field mapping suggests that there may be significant vertical displacement on this structure. Another major fault affecting the Pancho deposit is the Falla Moreno. This structure trends roughly east—west and forms an approximate northern boundary for the mineralization at Pancho.
Production at Maricunga reopened in October 2005 and achieved its targeted rate of 14 Mtpa (40,000 tonnes per day) in late 2005. The mine operates two 12-hour shifts per day for 352 days annually allowing for inclement weather interruptions. Final pit design for Verde and Pancho assumed ten metre bench heights, bench face angles of 65 to 70 degrees, berm widths between 8 to 11 metres, berm interval of 20 metres, inter-ramp angles of 38 to 53 degrees and haul road gradient at 10% with a 25 metre road width.
The Maricunga gold recovery process consists of a single-line primary crushing, fine crushing (secondary and tertiary), heap leaching using cyanide solution, followed by carbon adsorption and regeneration plant operation. The plant can process 48,000 tonnes per day of dry Maricunga ore. The crushing plant product is approximately 80% passing 12 millimetres. Crushed ore is hauled to the heap leach pads by haul trucks.
Construction of a sulfidization, acidification, recycling and thickening (“SART”) plant was completed in late 2012, commissioned during 2013 and has been in continuous operation since 2013.
Based on the recovery estimates by ore type, gold recovery over the mine life is expected to average 56.3% of contained gold in the plant feed. Life of mine annual gold production is expected to range from 120,000 to 225,000 ounces in situ on a 100% basis. Based on the expected processing rates and mineral
reserves, mining at Maricunga is expected to continue until mid-2018 with heap leach processing continuing until 2020.
CMM spent approximately $24.5 million of expenditures on capital projects in 2015 primarily related to infrastructure upgrades, stripping of Phase 4 of West Verde and power line reconstruction.
No exploration activities were performed in 2015.
A wetland (bofedal) located near the Pantanillo groundwater extraction and supply area has experienced a reduction in surface and groundwater levels. Beginning in March of 2010, an irrigation program was implemented on the bofedal, but was unsuccessful. A more robust action plan to rehabilitate the bofedal was developed and presented to the applicable environmental agency (the Servicio de Evaluacion Ambiental (“SEA”)) in 2012. In late 2013, Kinross was fined approximately $40,000 in connection with this matter. Additionally, Kinross was required to submit a more detailed description of its rehabilitation plan and additional information to the authorities relating to its rehabilitation plan. In 2014 and 2015, numerous regulatory agencies visited the site and requested additional information from CMM. CMM responded to all such requests. In 2015, the SMA, a national environmental agency, issued a resolution alleging that CMM’s groundwater extraction has irreparably harmed the Pantanillo wetland, and portions of two other downstream wetlands, and that its water extraction poses an imminent risk to these and other area wetlands. CMM submitted various technical and legal defenses to the SMA. On March 18, 2016, the SMA issued a sanction seeking to require CMM to close the Maricunga mine’s water pumping wells located in the Pantanillo area. The Maricunga mine continues to operate normally but relies solely on water from Pantanillo wells to support its operations. The SMA has also publicly stated an intention to seek an expedited injunction to close the pumping wells. CMM intends to file an appeal of the resolution and oppose any injunction request with the appropriate environmental tribunal as permitted by law.
In September of 2013, the SMA issued a Notice of Violation (“NOV”) for certain violations that had been previously identified to the authorities by the Company. Certain of the violations dealt with deviations from the permitted configurations of the mine’s newest camp. The SMA rejected certain of the Company’s defenses to the NOV and, in the first quarter of 2014, fined the Company $4.6 million in relation to the NOV. The Company appealed the sanction and in June 2014, Chile’s Environmental Court issued a ruling in favour of CMM, vacated the sanction and ordered the SMA to issue a new resolution taking into account the evidence and other information submitted by CMM. In October 2014, the sanctioning process was reopened and additional evidence and information was subsequently submitted by CMM. A new resolution has not yet been issued by the SMA.
In August 2015, the Company obtained an Approval Resolution for the CMM Closure Plan under the transitory regime before the Servicio Nacional de Geologia y Mineria (Sernageomin). A new closure plan is being developed in order to modify the approved closure measures in the environmental permits.
In 2013, CMM was recertified by the ICMI (International Cyanide Management Institute) in full compliance under the Cyanide Code. In the November 2015 recertification audit, CMM was found to be in “substantial compliance”. CMM has submitted the required corrective action plans to ICMI with the goal of achieving “full compliance” by May 2016.
Chirano, Ghana
Kinross acquired the Chirano gold mine as part of the September 17, 2010 acquisition of Red Back. Chirano Gold Mines Limited (“CGML”) is 90% owned by Kinross with the remaining 10% owned as a carried interest by the Government of Ghana. Detailed financial, production and operations information for Chirano is available in Kinross’ MD&A for the year ended December 31, 2015.
The project is located in southwest Ghana primarily in the Bibiani-Anhwiaso-Bekwai District with the remainder located in the Sefwi Wiawso District of the Western Region of Ghana. The mine is located approximately 100 kilometres southwest of Kumasi, which is Ghana’s second largest city. Access to the gold
mine from the capital Accra is via a sealed highway to Kumasi and then running southwest towards Bibiani and onwards to Sefwi-Bekwai.
Geologically, the project area lies within the Paleoproterozoic terrain of south-west Ghana, located within the Sefwi Gold Belt, very close to its margin against the Kumasi Basin to the east. Both the belt and basin consist of rocks of Birimian age, with the belt dominated by mafic volcanics and the basin typified by fine grained, deep-water sediments. Both are intruded by granites. Gold mineralization of economic importance at Chirano is located along a 10 kilometre shear zone known as the Chirano Shear, which hosts the majority of the gold mineralization, although additional splay shears can host gold mineralization of economic importance.
The Chirano gold mine commenced production in October 2005 with a surface mining operation from three open pits. Surface mining operations are currently conducted in one pit, which supplements gold production from two underground mining operations. Approximately 65% of gold production is sourced from the underground mines. Underground mining and open pit mining operations as well as tailings construction were performed by CGML in 2015.
Processing capacity is 3.5 Mtpa using a conventional three stage crushing circuit, followed by primary and secondary ball mills for fine grinding. After grinding and 24 hours of cyanide leaching, a CIL circuit extracts gold in solution to activated carbon. A conventional carbon elution and electro-winning circuit recovers gold which is then smelted to gold doré for shipment to international gold refiners. Gold recovery using the above described process is typically 91 to 92%. Annual gold production was approximately 255,000 ounces in 2015.
Based on the 2015 mineral reserves, Chirano is expected to continue production up to 2021.
CGML employs approximately 1,100 permanent employees and 75 trainees and short-term employees. In addition there are approximately 700 contractor employees, many of whom are associated with the camp services, employee transport, exploration and site security services. CGML and the Company are committed to a health and safety program that protects the safety and well-being of staff, clients, contractors and the general public in all aspects of its business operations.
During 2015 exploration activities continued on the Chirano mining lease and on several district targets. In addition to the completion of 47,000 metres of drilling in 165 drillholes, exploration work included expansion of surface geochemical grids, trenching, and geophysical surveys. Drill programs beneath the existing pits continued to extend the limits of the known mineralization. In 2016 planned exploration activities include approximately 25,000 metres of drilling to continue testing resources on the mining lease and adjacent prospecting licenses in support of engineering scoping studies.
The operations are guided by the Guidelines for Mining in Productive Forest Reserves in Ghana. Strategic efforts are being made to limit the impact of mine operations on the forest reserves. There is a closure plan in place to return disturbed areas to a functional, viable and self-sustaining ecosystem where feasible.
RISK FACTORS
The business and operations of Kinross are subject to risks. In addition to considering the other information in this Annual Information Form, you should consider carefully the following factors in deciding whether to invest in securities of Kinross. If any of these risks occur, or if other risks not currently anticipated or fully appreciated occur, the business and prospects of Kinross could be materially adversely affected, which could have a material adverse effect on Kinross’ valuation and the trading price for its shares.
The financial and operational performance of Kinross is dependent on gold and silver prices.
The profitability of Kinross’ operations is significantly affected by changes in the market price of gold and silver. Gold and silver prices fluctuate on a daily basis and are affected by numerous factors beyond the control of Kinross. The price of gold and/or silver can be subject to volatile price movements and future serious price declines could cause continued commercial production to be impractical. Depending on the prices of gold and silver, cash flow from mining operations may not be sufficient to cover costs of production and capital expenditures. If, as a result of a decline in gold and/or silver prices, revenues from metal sales were to fall below cash operating costs, production may be discontinued. The factors that may affect the price of gold and silver include industry factors such as: industrial and jewelry demand; the level of demand for the metal as an investment; central bank lending, sales and purchases of the metal; speculative trading; and costs of and levels of global production by producers of the metal. Gold and silver prices may also be affected by macroeconomic factors, including: expectations of the future rate of inflation; the strength of, and confidence in, the US dollar, the currency in which the price of the metal is generally quoted, and other currencies; interest rates; and global or regional political or economic uncertainties.
If the world market price of gold and/or silver continued to drop and the prices realized by Kinross on gold and/or silver sales were to decrease further and remain at such a level for any substantial period, Kinross’ profitability and cash flow would be negatively affected. In such circumstances, Kinross may determine that it is not economically feasible to continue commercial production at some or all of its operations or the development of some or all of its current projects, which could have an adverse impact on Kinross’ financial performance and results of operations. Kinross may curtail or suspend some or all of its exploration activities, with the result that depleted reserves are not replaced. In addition, the market value of Kinross’ gold and/or silver inventory may be reduced and existing reserves may be reduced to the extent that ore cannot be mined and processed economically at the prevailing prices. Furthermore, certain of Kinross’ mineral projects include copper which is similarly subject to price volatility based on factors beyond Kinross’ control.
Kinross’ operations and profitability are affected by shortages and price volatility of other commodities and equipment.
Kinross is dependent on various input commodities (such as diesel fuel, electricity, natural gas, steel, concrete and cyanide) and equipment (including parts) to conduct its mining operations and development projects. A shortage of such input commodities or equipment or a significant increase in their cost could have a material adverse effect on the Company’s ability to carry out its operations and therefore limit, or increase the cost of, production. The Company is also dependent on access to and supply of water and electricity to carry out its mining operations, and such access and supply may not be readily available, especially at the Company’s operations in Chile, Brazil and Ghana. Market prices of input commodities can be subject to volatile price movements which can be material, occur over short periods of time and are affected by factors that are beyond the Company’s control. An increase in the cost, or decrease in the availability, of input commodities or equipment may affect the timely conduct and cost of Kinross’ operations and development projects. If the costs of certain input commodities consumed or otherwise used in connection with Kinross’ operations and development projects were to increase significantly, and remain at such levels for a substantial period, the Company may determine that it is not economically feasible to continue commercial production at some or all of its operations or the development of some or all of its
current projects, which could have an adverse impact on the Company’s financial performance and results of operations.
Paracatu water supply and use
Operations at Paracatu are dependent on rainfall as the primary source of process water. Accordingly, prolonged periods without adequate rainfall may adversely impact operations at Paracatu. Recent rainfall levels have fallen below the historical average. As a result, operations maybe partially or fully curtailed in the near future, and production may fall below historic or forecast levels and Kinross may incur significant costs or experience significant delays that could have a material effect on Kinross’ financial performance, liquidity and results of operations.
Changes to the extensive regulatory and environmental rules and regulations to which Kinross is subject could have a material adverse effect on Kinross’ future operations.
Kinross’ mining and processing operations and exploration activities are subject to various laws and regulations governing the protection of the environment, exploration, development, production, exports, taxes, labour standards, occupational health, waste disposal, toxic substances, mine safety, and other matters. The legal and political circumstances outside of North America cause these risks to be different from, and in many cases, greater than, comparable risks associated with operations within North America. New laws and regulations, amendments to existing laws and regulations, or more stringent enforcement of existing laws and regulations could have a material adverse impact on Kinross, increase costs, cause a reduction in levels of production and/or delay or prevent the development of new mining properties. For example, proposed legislation in Ghana may make it difficult for the Company to obtain authorization for a planned tailings facility. The inability to complete such tailings facility may impact production at Chirano. Compliance with these laws and regulations is part of the business and requires significant expenditures. Changes in regulations and laws, including those pertaining to the rights of leaseholders or the payment of royalties, net profit interest or similar amounts, could adversely affect Kinross’ operations or substantially increase the costs associated with those operations. Kinross is unable to predict what legislation or revisions may be proposed that might affect its business or when any such proposals, if enacted, might become effective.
The operations of Kinross require licences and permits from various governmental authorities to develop and exploit its properties, and the process for obtaining licences and permits from governmental authorities often takes an extended period of time and is subject to numerous delays and uncertainties. Such licences and permits are subject to change in various circumstances. Applicable governmental authorities may revoke or refuse to issue, amend or renew necessary permits. The loss of such permits may hinder Kinross’ ability to operate and could have a material effect on Kinross’ financial performance and results of operations. Failure to comply with applicable laws and regulations may result in injunctions, fines, criminal liability, suspensions or revocation of permits and licences and other penalties. There can be no assurance that Kinross has been or will be at all times in compliance with all such laws and regulations and with its licences and permits or that Kinross has all required licences and permits in connection with its operations. Kinross may be unable to obtain on a timely basis or maintain in the future all necessary licences and permits that may be required to explore and develop its properties, commence construction or operation of mining facilities and properties under exploration or development or to maintain continued operations that economically justify the cost. For example, the Company may not always be able to secure the necessary water access rights. In addition, third parties may, from time to time, challenge Kinross’ permits and licences and/or applications for permits and licences which could lead to delays and/or suspension of development projects and/or current operations.
In February 2014, the Company’s subsidiary, Crown, was issued a revised National Pollution Discharge Elimination System Permit (the “Renewed Permit”) which is required for its operations at its Kettle River-Buckhorn mine. The revised permit came into effect on March 1, 2014, and contained conditions that were more restrictive than the original discharge permit. In addition, the Company felt that the Renewed Permit was internally inconsistent, technically unworkable and inconsistent with existing agreements in place with the DOE, including a settlement agreement previously entered into by Crown and DOE in June 2013 (“Settlement Agreement”). On February 28, 2014, Crown filed an appeal of the Renewed Permit with the Washington Pollution Control Hearings Board (“PCHB”). On July 30, 2015, the PCHB upheld the Renewed Permit. In addition, on January 15, 2015, Crown filed a lawsuit against the DOE in Ferry County Superior Court, Washington, claiming that DOE breached the Settlement Agreement by including various unworkable
compliance terms in the Renewed Permit. Crown filed a Petition for Review in Ferry County Superior Court, Washington, on August 27, 2015, seeking to have the PCHB decision overturned. If the Renewed Permit is not amended, operations at the Kettle River-Buckhorn mine may be adversely affected.
Kinross’ exploration programs are subject to federal, state, and local environmental regulations. For example, in the U.S., some of Kinross’ mining claims are on United States public lands and federal regulatory authorities extensively regulate mining operations conducted on public lands. Most operations involving the exploration for minerals are subject to laws and regulations relating to exploration procedures, safety precautions, employee health and safety, air quality standards, pollution of stream and fresh water sources, odour, noise, dust, and other environmental protection controls adopted by federal, state, and local governmental authorities as well as the rights of adjoining property owners. In addition, in order to conduct mining operations, Kinross is required to obtain performance bonds related to environmental permit compliance. These bonds may take the form of cash deposits, letters of credit provided through the banking syndicate line of credit, or, if available, provided by outside insurance policies. Kinross will be required to prepare and present to federal, state, or local authorities data pertaining to the effect or impact that any proposed exploration or mining activity may have upon the environment and propose mitigation to decrease environmental impacts. All requirements imposed by any such authorities may be costly and time-consuming and may delay commencement or continuation of exploration, mine development or production operations.
The Company has been subject to ongoing environmental review of its operations in Chile. In late 2013, Kinross was fined approximately $40,000 in respect of the degradation of the Pantanillo wetland (bofedal) located near the Maricunga mine, and was required to submit a more detailed description and additional information to the authorities relating to its rehabilitation plan. In 2015, the SMA issued a resolution alleging that Kinross had irreparably harmed the Pantanillo wetland and portions of two other downstream wetlands, and water use poses an imminent risk to these and other area wetlands. Kinross has submitted various technical and legal defenses in its defense, was notified by the SMA on March 18, 2016 that it was seeking as a sanction to require CMM to close the Maricunga mine’s water pumping wells located in the Pantanillo area. The Maricunga mine continues to operate normally but relies solely on water from Pantanillo wells to support its operations. The SMA has also publicly stated an intention to seek an expedited injunction to close the pumping wells. CMM intends to file an appeal of the resolution and to oppose any injunction request with the appropriate environmental tribunal as allowed by law. In addition, certain camp configurations at Maricunga deviate from permitted configurations. In 2014, the Company was sanctioned $4.6 million in relation to such deviations. The Company appealed the sanction and in June 2014 the Environmental Court issued a ruling in favour of CMM, vacated the sanction and ordered the SMA to issue a new resolution taking into account the evidence and other information submitted by CMM. In October 2014, the sanctioning process was reopened and additional evidence and information was subsequently submitted by CMM. A new resolution has not yet been issued by the SMA. These matters are subject to ongoing regulatory review and evaluation by Chilean authorities and may result in additional actions against Kinross. Ongoing regulatory review and investigations by Chilean authorities may have an adverse effect on the future operations or financial condition of the Maricunga mine.
On March 17, 2016 the SMA, filed charges against MDO over a series of alleged breaches at La Coipa. The charges were filed following a planned inspection of the facilities. A total of seven charges were filed against MDO relating to alleged breaches of environmental permits of its facilities and/or failure to properly permit certain activities, including capturing water at an undesignated reservoir, deficiencies in the capturing system of mercury, deficiencies in the monitoring system, and concentrations of mercury above permitted levels in some effluent. MDO faces a fine of up to 10,000 annual tax units with an approximate value of $8 million, the temporary or definitive suspension of operations, or even the revocation of its environmental permit. Ongoing regulatory review and investigations by Chilean authorities may have an adverse effect on the future operations or financial condition of the La Coipa mine.
Kinross is subject to various laws and regulations which, if the Company is alleged to, or does, violate, could result in regulatory or government investigations and/or sanctions, which could adversely impact the Company’s operations. These include anti-bribery laws (including without limitation the U.S. Foreign Corrupt Practices Act, the Canadian Corruption of Foreign Public Officials Act and anti-bribery laws in other jurisdictions in which the Company operates), international trade sanctions (including without
limitation, in respect of Russia and Ukraine), and anti-money laundering laws and regulations. Kinross has internal policies and procedures to mandate compliance with such laws and regulations; however, there can be no assurance that such policies and procedures will be effective in revealing or preventing violations thereof. Various regulatory and government agencies review transactions and practices of Kinross in connection with the enforcement of applicable laws and regulations, and Kinross regularly cooperates in producing documents and other information sought by such authorities. Consequences of violations could range from cost and expense to remediate, increased operating costs or changes to operations, fines or penalties for violations, expenses of investigations and defense, and potentially cessation of operations.
In August 2013, Kinross received information regarding allegations of improper payments made to government officials and certain internal control deficiencies at its West Africa mining operations. External legal counsel was immediately retained to conduct an objective internal investigation into the allegations. In March and December 2014, and July 2015, Kinross received subpoenas from the United States Securities and Exchange Commission seeking information and documents on substantially the same subjects as had previously been raised. In December 2014, Kinross received similar requests for information from the United States Department of Justice. The internal investigation is ongoing, and additional issues or facts could become known as the investigation continues. On December 10, 2015, the NGOs MiningWatch Canada and the French anti-corruption association Sherpa announced that they had filed a report with the Royal Canadian Mounted Police (“RCMP”) calling for an investigation of the Company for alleged breaches of Canada’s anti-corruption laws at the Company’s Tasiast mine in Mauritania and its Chirano mine in Ghana. The Company has not received a copy of the report and as of the date hereof is not aware of any resulting RCMP investigation or other actions by any Canadian authorities. Consequences of violations could include fines or penalties, de-listing of securities from US stock exchanges and restrictions on export licenses.
Kinross’ future plans rely on mine development projects, which involve significant uncertainties.
The Company’s ability to increase or maintain present gold and silver production levels is dependent in part on the successful development of new mines and/or expansion of existing mining operations. Kinross is dependent on future growth from development projects. Current potential development projects include potential development opportunities at Fort Knox, Round Mountain Phase W, Bald Mountain South Zone and Tasiast (Phase 1 and Phase 2). Development projects rely on the accuracy of predicted factors including: capital and operating costs; metallurgical recoveries; mineral reserve estimates; and future metal prices. Development projects are also subject to accurate feasibility studies, the acquisition of surface or land rights and the issuance of necessary governmental permits. Unforeseen circumstances, including those related to the amount and nature of the mineralization at the development site, technological impediments to extraction and processing, legal restrictions or governmental intervention, infrastructure limitations, environmental issues, disputes with local communities or other events, could result in one or more of our planned developments becoming impractical or uneconomic to complete. Any such occurrence could have an adverse impact on Kinross’ financial condition and results of operations.
In addition, as a result of the substantial expenditures involved in development projects, developments are prone to material cost overruns versus budget. The capital expenditures and time required to develop new mines are considerable and changes in cost or construction schedules can significantly increase both the time and capital required to build the project. The project development schedules are also dependent on obtaining the governmental approvals necessary for the operation of a project. The timeline to obtain these government approvals is often beyond the control of Kinross. It is not unusual in the mining industry for new mining operations to experience unexpected problems during the start-up phase, resulting in delays and requiring more capital than anticipated.
Actual production and cost outcomes may differ significantly from production and cost estimates
The Company prepares estimates of future production, operating costs and capital costs for its operations. Despite the Company’s best efforts to budget and estimate such costs, as a result of the substantial expenditures involved in the development of mineral projects and the fluctuation and increase of costs over time, development projects may be prone to material cost overruns. Kinross’ actual production and costs may vary from estimates for a variety of reasons, including: increased competition for resources and development
inputs; cost inflation affecting the mining industry in general; actual ore mined varying from estimates of grade, tonnage, dilution and metallurgical and other characteristics; short-term operating factors relating to the ore reserves, such as the need for sequential development of ore bodies and the processing of new or different ore grades; revisions to mine plans; difficulties with supply chain management, including the implementation and management of enterprise resource planning software; risks and hazards associated with mining; natural phenomena, such as inclement weather conditions, water availability, floods, and earthquakes; and unexpected labour shortages or strikes. Operating costs may also be affected by a variety of factors, including: changing waste-to-ore ratios, ore grade metallurgy, labour costs, cost of commodities and other inputs, general inflationary pressures and currency exchange rates. Many of these factors are beyond Kinross’ control. No assurance can be given that Kinross’ cost estimates will be achieved. Failure to achieve production or cost estimates or material increases in costs could have an adverse impact on Kinross’ future cash flows, profitability, results of operations and financial condition.
The mineral reserve and mineral resource figures of Kinross are only estimates and are subject to revision based on developing information.
The figures for mineral reserves and mineral resources presented herein, including the anticipated tonnages and grades that will be achieved or the indicated level of recovery that will be realized, are estimates and no assurances can be given as to their accuracy. Such estimates are, in large part, based on interpretations of geological data obtained from drillholes and other sampling techniques. Actual mineralization or formations may be different from those predicted. It may also take many years from the initial phase of drilling before production is possible, and during that time the economic feasibility of exploiting a deposit may change. Reserve and resource estimates are materially dependent on prevailing gold and silver prices and the cost of recovering and processing minerals at the individual mine sites. Market fluctuations in the price of gold or silver, or increases in recovery costs, as well as various short-term operating factors, may cause a mining operation to be unprofitable in any particular accounting period.
Prolonged declines in the market price of gold and/or silver may render reserves containing relatively lower grades of gold and/or silver mineralization uneconomic to exploit and could reduce materially Kinross’ mineral reserves and mineral resources. Should such reductions occur, material write downs of Kinross’ investment in mining properties or the discontinuation of development or production might be required, and there could be material delays in the development of new projects, increased net losses and reduced cash flow. There is no assurance that Kinross will achieve indicated levels of gold or silver recovery or obtain the prices assumed in determining the mineral reserves. The estimates of mineral reserves and mineral resources attributable to a specific property are based on accepted engineering and evaluation principles. The estimated amount of contained gold and silver in proven and probable mineral reserves does not necessarily represent an estimate of a fair market value of the evaluated properties.
There are numerous uncertainties inherent in estimating quantities of mineral reserves and mineral resources. The estimates in this Annual Information Form are based on various assumptions relating to gold prices and exchange rates during the expected life of production, mineralization of the area to be mined, the projected cost of mining, and the results of additional planned development work. Actual future production rates and amounts, revenues, taxes, operating expenses, environmental and regulatory compliance expenditures, development expenditures, and recovery rates may vary substantially from those assumed in the estimates. Any significant change in these assumptions, including changes that result from variances between projected and actual results, could result in material downward revision to current estimates.
Kinross’ operations may be adversely affected by changing political, legal and economic conditions.
The Company has mining and exploration operations in various regions of the world, including the United States, Canada, Brazil, Chile, the Russian Federation, Mauritania and Ghana, and such operations are exposed to various levels of political, economic, and other risks and uncertainties. These risks and uncertainties vary from country to country and include, but are not limited to: terrorism; hostage taking; thefts and illegal incursions on property (such as those which have occurred at Paracatu); extreme fluctuations in currency exchange rates; high rates of inflation; labour unrest; the risks of civil unrest; expropriation and nationalization; renegotiation or nullification of existing concessions, licences, permits and contracts; illegal
mining; changes to policies and regulations impacting the mining sector; restrictions on foreign exchange and repatriation; and changing political conditions, currency controls, and governmental regulations that favour or require the awarding of contracts to local contractors or require foreign contractors to employ citizens of, or purchase supplies from, a particular jurisdiction.
Future political and economic conditions in these countries may result in these governments adopting different policies with respect to foreign investment, and development and ownership of mineral resources. Any changes in such policies may result in changes in laws affecting ownership of assets, foreign investment, mining exploration and development, taxation, royalties, currency exchange rates, gold sales, environmental protection, labour relations, price controls, repatriation of income, and return of capital, which may affect both the ability of Kinross to undertake exploration and development activities in respect of future properties in the manner currently contemplated, as well as its ability to continue to explore, develop, and operate those properties to which it has rights relating to exploration, development, and operation. Future governments in these countries may adopt substantially different policies, which might extend to, as an example, expropriation of assets.
The tax regimes in these countries may be subject to differing interpretations and are subject to change from time to time. Kinross’ interpretation of taxation law as applied to its transactions and activities may not coincide with that of the tax authorities in a given country. As a result, transactions may be challenged by tax authorities and Kinross’ operations may be assessed, which could result in significant additional taxes, penalties and interest. In addition, in certain jurisdictions (such as Brazil and Mauritania) Kinross may be required to pay refundable value added tax (“VAT”) on certain purchases. There can be no assurance that the Company will be able to collect all, or part, of the amount of VAT refunds which are owed to the Company.
The Company is subject to the considerations and risks of operating in the Russian Federation. Certain currency conversion risks exist in the Russian economy. Russian legislation currently permits the conversion of rouble revenues into foreign currency. Any delay or other difficulty in converting roubles into a foreign currency to make a payment or delay in or restriction on the transfer of foreign currency could limit our ability to meet our payment and debt obligations, which could result in the loss of suppliers, acceleration of debt obligations, etc.
Kinross is subject to hazards and risks associated with exploration and mining activities and insurance may be insufficient to cover these risks.
The operations of Kinross are subject to the hazards and risks normally incidental to exploration, development, and production activities of precious metals mining properties, any of which could result in damage to life or property, environmental damage and possible legal liability for such damage. The activities of Kinross may be subject to prolonged disruptions due to weather conditions depending on the location of operations in which Kinross has interests. Hazards and risks, such as unusual or unexpected formations, faults and other geologic structures, rock bursts, pressures, cave-ins, flooding, pit wall failures, ground and slope failures and inventory theft, could have an adverse impact on Kinross’ operations. Severe weather conditions, including those resulting from global climate change, may adversely impact Kinross’ operations. As a result, production may fall below historic or estimated levels and Kinross may incur significant costs or experience significant delays that could have a material effect on Kinross’ financial performance, liquidity and results of operations. For example, at the Paracatu mine, a significant increase in rainfall could result in flooding, or a prolonged and significant lack of rainfall may disrupt mining operations.
Further, few mining properties that are explored are ultimately developed into producing mines. Major costs are required to establish reserves by drilling and to construct mining and processing facilities. Large amounts of capital are frequently required to purchase necessary equipment. Delays due to equipment malfunction or inadequacy may adversely affect Kinross’ results of operations. It is impossible to ensure that the current or proposed exploration programs on properties in which Kinross has an interest will result in profitable commercial mining operations.
Mining, processing, development, and exploration activities depend, to one degree or another, on adequate infrastructure. Reliable roads, bridges, power sources, and water supply are important determinants which affect capital and operating costs. Lack of such infrastructure or unusual or infrequent weather phenomena, sabotage, terrorism, government, or other interference in the maintenance or provision of such infrastructure could adversely affect Kinross’ operations, financial condition, and results of operations.
Available insurance does not cover all the potential risks associated with a mining company’s operations. Kinross may also be unable to maintain insurance to cover insurable risks at economically feasible premiums, and insurance coverage may not be available in the future or may not be adequate to cover any resulting loss. The Company’s existing insurance policies contain certain exceptions where coverage may not be available (including bullion losses not attributable to theft).
Moreover, insurance against risks such as the validity and ownership of unpatented mining claims and mill sites and environmental pollution or other hazards as a result of exploration and production is not generally available to Kinross or to other companies in the mining industry on acceptable terms. As a result, Kinross might become subject to liability for environmental damage or other hazards for which it is completely or partially uninsured or for which it elects not to insure because of premium costs or other reasons. Losses from these events may cause Kinross to incur significant costs that could have a material adverse effect upon its financial condition and results of operations.
If Kinross does not develop additional mineral reserves, it may not be able to sustain future operations.
Because mines have limited lives, Kinross must continually replace and expand its mineral reserves as they are depleted by production at its operations in order to maintain or grow its total mineral reserve base. The life of mine estimates included in this Annual Information Form for each of Kinross’ material properties are based on a number of factors and assumptions and may prove to be incorrect. Kinross’ ability to maintain or increase its annual production of gold and silver will significantly depend on its ability to bring new mines into production and to expand mineral reserves at existing mines. Once a site with mineralization is discovered, it may take several years from the initial phases of drilling until production is possible, during which time the economic feasibility of production may change. Substantial expenditures are required to establish mineral reserves and to construct mining and processing facilities. As a result of these uncertainties, there is no assurance that current or future exploration programs will be successful. There is a risk that depletion of reserves will not be offset by discoveries. As a result, the reserve base of Kinross may decline if reserves are mined without adequate replacement and Kinross may not be able to sustain production beyond the current mine lives, based on current production rates.
The mineral resources of Kinross may not be economically developable, in which case Kinross may never recover its expenditures for exploration and/or development.
Mineral resources that are not mineral reserves do not have demonstrated economic viability. Due to the uncertainty of measured, indicated or inferred mineral resources, these mineral resources may never be upgraded to proven and probable mineral reserves. Measured, indicated and inferred mineral resources are not recognized by the U.S. Securities and Exchange Commission and U.S. investors are cautioned not to assume that any part of mineral deposits in these categories will ever be converted into reserves or recovered.
Kinross is subject to risks related to environmental liability, including liability for environmental damages caused by mining activities prior to ownership by Kinross and reclamation costs and related liabilities.
Mining, like many other extractive natural resource industries, is subject to potential risks and liabilities associated with the effects on the environment resulting from mineral exploration and production. The Company may be held responsible for the costs of addressing contamination at, or arising from, current or former activities. Environmental liability may result from mining activities conducted by others prior to the ownership of a property by Kinross. In addition, Kinross may be liable to third parties for exposure to hazardous materials. The costs associated with such responsibilities and liabilities may be substantial. The payment of such liabilities would reduce funds otherwise available and could have a material adverse effect
on Kinross. Should Kinross be unable to fully fund the cost of remedying an environmental problem, Kinross might be required to suspend operations or enter into interim compliance measures pending completion of the required remedy, which could have a material adverse effect on the operations and business of Kinross.
In the United States, certain mining wastes from extraction and beneficiation of ores that would otherwise be considered hazardous waste under the Resource Conservation and Recovery Act (“RCRA”) and state law equivalents, are currently exempt from certain Environmental Protection Agency (the “EPA”) regulations governing hazardous waste. If the Company’s mine wastes at its U.S. mines are not exempt, and are treated as hazardous waste under RCRA, or if the presence of mine wastes results in a release of hazardous substances which has required or will require remediation under the Comprehensive Environmental Response, Compensation, and Liability Act (“CERCLA”) or state law equivalents for cleanup, material expenditures could be required for the construction of additional waste disposal facilities, for other remediation expenditures, or for natural resource damages. Under CERCLA, subject to certain defenses, any present or past owners or operators of a CERCLA site, and any parties that disposed or arranged for the disposal of hazardous substances at such a site, may generally be held jointly and severally liable for response costs and may be forced to undertake remedial cleanup actions or to pay for the government’s cleanup efforts. Such parties may also be liable to governmental entities for the cost of damages to natural resources, which may be substantial. Additional regulations or requirements may also be imposed upon the Company’s operations, tailings, and waste disposal areas as well as upon mine closure under federal and state environmental laws and regulations, including, without limitation, the Clean Water Act (“CWA”) and state law equivalents. Air emissions in the U.S. are subject to the Clean Air Act and its state equivalents as well. Additionally, the Company is subject to other federal and state environmental laws, and potential claims existing under common law, relating to the operation and closure of the Company’s U.S. mine sites.
The Sunnyside Mine is an inactive mine situated in the Bonita Peak Mining District near Silverton, Colorado. A subsidiary of Kinross, Sunnyside Gold Corporation (“SGC”), operated the mine for a period in the late-1980s to early 1990s and subsequently conducted various reclamation and closure activities at the mine and in the surrounding area. The EPA is actively investigating the district and has indicated that it is considering proposing that portions of the district, including areas impacted by SGC’s operations and closure activities, be listed on the Superfund National Priorities List (“NPL”). There is a substantial probability the EPA and others will assert that the Company is a potentially responsible party under CERCLA and is jointly and severally liable for CERCLA response costs incurred in the district. In addition, EPA may seek to require SGC to conduct investigative and remedial activities. On August 5, 2015, while working in another mine in the district known as the Gold King, EPA caused a release of approximately three million gallons of contaminated water into a tributary of the Animas River. The Company has received a “notice of intent to sue” letter from the state of New Mexico indicating that it intends to sue a number of parties, including the EPA, and the Company, for, among other things, injunctive relief, future costs and attorneys’ fees under the RCRA to address endangerments allegedly arising out of releases of contaminated water from the Gold King, Sunnyside and other historic mines in the area. The Company received a similar letter from the State of Utah indicating that it intends to sue a number of parties, including the EPA and the Company for, among other things, injunctive relief, costs, damages and attorneys’ fees under RCRA, the CWA and the Utah Water Quality Act.
Kinross is generally required to submit for government approval a reclamation plan and to pay for the reclamation of its mine sites upon the completion of mining activities. Kinross estimates the net present value of future cash outflows for reclamation costs under IFRS, IAS 37 and IFRIC 1 at $720.3 million as at December 31, 2015 based on information available as of that date. Any significant increases over the current estimates of these costs could have a material adverse effect on Kinross.
Regulatory authorities in certain jurisdictions require that security be provided to cover the estimated reclamation and remediation costs. As of December 31, 2015, letters of credit or other acceptable security totalling $249.5 million had been issued to various regulatory agencies to satisfy financial assurance requirements for this purpose. The letters of credit were issued against the Company’s Letter of Credit guarantee facility and the Company believes it is in material compliance with these reclamation and remediation security requirements. The Company may incur significant costs in connection with these reclamation activities, which may exceed the provisions the Company has made in respect of its reclamation
obligations. In some jurisdictions, reclamation bonds, letters of credit or other forms of financial assurance are required as security for these reclamation obligations. The amount and nature of financial assurance are dependent upon a number of factors, including the Company’s financial condition and reclamation cost estimates. Kinross may be required to replace or supplement the existing financial assurance, or source new financial assurance with more expensive forms, which might include cash deposits, which would reduce its cash available for operations and financing activities. There can be no assurance that Kinross will be able to maintain or add to its current level of financial assurance. To the extent that Kinross is or becomes unable to post and maintain sufficient financial assurance for reclamation costs, where required it could potentially result in closure of one or more of the Company’s operations, which could have a material adverse effect on the financial condition of the Company.
Developments in Russia may have adverse effects on Kinross’ operations in Russia.
On May 7, 2008, the Russian federal laws “On the Procedure for Foreign Investment in Companies of Strategic Significance for State Defence and Security” (as amended, the “Strategic Investments Law”) and “On Amendments to the Subsoil Law” (as amended, the “Subsoil Law”) came into effect. A number of important amendments to the Strategic Investments Law became effective on December 6, 2014.
The Strategic Investments Law sets forth the criteria whereby certain transactions entered into by a foreign investor require prior approval from the Russian Federation (“RF”) authorities. Such approval will be required if: (a) a Russian company (“RusCo”) is engaged in activities which are defined as strategic for the purposes of national security and defence, and (b) a RusCo holds rights to a “strategic deposit” (such as Kupol and Dvoinoye) and a potential foreign investor directly or indirectly obtains 25% (formerly 10%) or more of the voting shares of the RusCo, or there exists some other mechanism for control over (such as a management agreement) the RusCo including any actions as a result of which a foreign investor or group of persons acquires the right to determine the decisions of the management of a company of strategic importance (such as terms of its business activities). This approval requirement applies in respect of number of transactions, including direct or indirect acquisitions of equity interests, such that a third party, non-Russian purchaser of 25% or more of Kinross’ ownership interest, will be required to obtain applicable governmental approvals. Any transactions involving the acquisition of ownership, possession or use of basic production assets, the value of which is 25% or more of the balance value, shall also be subject to the prior approval of the competent state bodies.
The Strategic Investments Law also provides for cases when no prior approval is required in respect of the companies holding the rights to a “strategic deposit”.
The Strategic Investments Law designates geological study and/or mining work in subsoil areas of federal significance as strategic activity. According to the Subsoil Law, subsoil areas of federal significance, among other things, include those that contain according to the records of the state balance of mineral reserves as of January 1, 2006, gold reserves of 50 tonnes (or 1,763,698 ounces) or more and/or 500,000 tonnes or more of copper.
Kinross has successfully obtained Strategic Investments Law approval from the RF authorities respecting the acquisition of Dvoinoye and the acquisition of the remaining 25% of Kupol.
Under the Strategic Investments Law, the Subsoil Law and RF Government Resolution no. 697 dated September 16, 2008, combined licence holders (such as CMGC with respect to the Kupol East and Kupol West licences) are required to seek approval from the RF government prior to the commencement of mining operations on a strategic deposit under a combined licence. The RF government has the right to terminate the combined licence after completion of geological surveys, if a strategic deposit is discovered during the exploration stage with respect to these deposits. If such approval is not obtained or the licence is terminated, CMGC will not be able to mine under the Kupol East and Kupol West combined exploration and mining licences or the Vodorazdelnaya property after completion of geological surveys. Although the RF Government has granted such approval to other foreign parties (including Kinross, as noted above), there can be no assurance that such approval to mine will be granted to the licence holder by the RF Government or what the terms of such approval might be. In the case of a withdrawal of a licence, the RF Government is
required to reimburse the expenses (including finance expenses, but subject to a cap on interest) incurred in respect of the geological study of the subsoil plot and any tender fee amount paid by the licence holder plus a termination fee (in the case of a gold deposit, the termination fee is equal to 30% of the amount of reimbursable expenses). In addition, the licence holder may be paid a finder’s fee by the RF Government in its discretion.
Ongoing political tensions and uncertainties as a result of the Russian Federation’s foreign policy decisions and actions in respect of Ukraine have resulted in the imposition of economic sanctions and increased the risk that certain governments may impose further economic, or other, sanctions or penalties on, or may take other actions against, the Russian Federation or persons and/or companies conducting business in the Russian Federation, or may otherwise act in support of Ukraine. There can be no assurance that sanctions or other penalties will not be imposed, or other actions will not be taken, by the Russian Federation, including in response to existing or threatened sanctions or other penalties or actions by Canada, the United States, the European Union and/or other governments against the Russian Federation or persons and/or companies conducting business in the Russian Federation. The Company derives a significant portion of its cash flows from its operations in the Russian Federation. The imposition of economic sanctions or other penalties, or such other actions by the Russian Federation and/or other governments, could have a material adverse effect on the Company’s assets and operations. Debt markets and ratings agencies may take the view that the Company is exposed to concentration risk with respect to the Russian Federation, given its significant operations and cash flows coming from that jurisdiction.
Developments in Mauritania may have adverse effects on Kinross’ operations and development projects in Mauritania.
Kinross is subject to political, economic and security risks which, should they materialize, may adversely affect the Company’s ability to operate its Tasiast mine in Mauritania.
These risks include but are not limited to the following: (1) the potential that the government may attempt to renegotiate current mining conventions or to revoke existing stability provisions in those conventions; (2) the security situation in the country may deteriorate; (3) a number of public policy issues material to the economic viability of the current operation or any possible expansion may not be positively resolved; (4) a lack of transparency in the operation of the government and development of new laws; and (5) the potential for laws and regulations to be inconsistently applied. These issues include, but are not limited to, a process and timetable for payment or offset of VAT refunds owed by the government to the Company, the long-term stability in the Company’s relationship with the workers’ union, the application of a clear, comprehensive, legally certain and enforceable VAT exemption for the mining industry, labor force management and flexible labor practices and the timely issuance of work permits for the non-national workforce.
While the Company has no reason to believe that all or any of the above mentioned issues are likely to transpire there can be no assurance that these or other, unforeseeable, events will not occur.
Title and access to Kinross’ properties may be uncertain and subject to risks.
The validity of mining claims which constitute most of Kinross’ property holdings may, in certain cases, be uncertain and is subject to being contested. Kinross’ titles, including title to undeveloped properties, may be defective.
Certain of Kinross’ United States mineral rights consist of unpatented mining claims. Unpatented mining claims are unique property interests, and are generally considered to be subject to greater title risk than other real property interests because the validity of the multiple types of unpatented mining claims is often uncertain and is always subject to challenges of third parties or contests by the United States government. The validity of an unpatented mining claim, in terms of both its location and its maintenance, is dependent on strict compliance with a complex body of United States federal and state statutory and case law. The necessity for, and rights associated with, various types of unpatented mining claims is also subject to uncertainties, as illustrated by the claims made by plaintiffs in Earthworks, et. Al vs. U.S. Department of
the Interior, which is pending in the United States District Court for the District of Columbia, and in which Kinross has intervened.
Certain of Kinross’ mining properties are subject to various royalty and land payment agreements. Failure by Kinross to meet its payment obligations under these agreements could result in the loss of related property interests.
Certain of Kinross’ properties may be subject to the rights or the asserted rights of various community stakeholders, including indigenous peoples. The presence of community stakeholders may also impact the Company’s ability to develop or operate its mining properties. In certain circumstances, consultation with such stakeholders may be required and the outcome may affect the Company’s ability to develop or operate its mining properties. While Kinross strives to develop excellent relationships with local stakeholders, there can be no assurance that such relations will remain amicable. If a dispute were to arise, it might result in reduced access to properties or a delay in operations.
For example, in Brazil, there is legislation requiring the government to grant title to the Quilombola people who either still occupy their traditional lands or who are found, through a process administered by the Instituto Nacional de Colonizacao e Reforma Agraria (“INCRA”), to have rights to certain lands. There are five Quilombola communities which have been registered and certified in the Paracatu area. An INCRA report issued on March 6, 2009 indicated that the Machadinho Quilombola community has rights to 2,217.52 hectares of land in the area, a portion of which (900 hectares) would be affected by the operation of the new Eustaquio tailings facility at Paracatu.
The Federal Public Attorney (“FPA”) in Brazil filed a lawsuit relating to the alleged rights of the Quilombola peoples in connection with certain lands being used to construct the Eustaquio tailings facility at Paracatu. As part of the lawsuit, the FPA had applied for an injunction seeking to enjoin the issuance by the state authority of the permit to operate the Eustaquio tailings facility. The FPA’s injunction was denied, the permit to operate was issued and the Eustaquio tailings facility has been operating since July 2012. In December, 2013 and January of 2014, the trial court judge issued decisions denying the FPA’s claim. In the fourth quarter of 2014, the FPA filed appeals challenging the decisions of the trial court. Kinross has filed its response to the appeals and will continue to vigorously oppose the lawsuit. The Company believes that the lawsuit by the FPA should not be successful.
Numerous other companies compete in the mining industry, some of which may have greater resources and technical capacity than Kinross and, as a result, Kinross may be unable to effectively compete, which could have a material adverse effect on Kinross’ future operations.
The mineral exploration and mining business is competitive in all of its phases. In the search for and the acquisition of attractive mineral properties, Kinross competes with numerous other companies and individuals, including competitors with greater financial, technical and other resources than Kinross. The ability of Kinross to operate successfully in the future will depend not only on its ability to develop its present properties, but also on its ability to select and acquire suitable producing properties or prospects for mineral exploration. Kinross may be unable to compete successfully with its competitors in acquiring such properties or prospects on terms it considers acceptable, if at all.
Internal controls provide no absolute assurances as to reliability of financial reporting and statement preparation, and ongoing evaluation may identify areas in need of improvement.
Kinross has invested resources to document and assess its system of internal controls over financial reporting and it is continuing its evaluation of such internal controls. Internal controls over financial reporting are procedures designed to provide reasonable assurance that transactions are properly authorized, assets are safeguarded against unauthorized or improper use, and transactions are properly recorded and reported. A control system, no matter how well designed and operated, can provide only reasonable, not absolute, assurance with respect to the reliability of financial reporting and financial statement preparation.
Kinross is required to satisfy the requirement of Section 404 of the Sarbanes-Oxley Act of 2002 (the “Sarbanes-Oxley Act”), which requires an annual assessment by management of the effectiveness of Kinross’
internal control over financial reporting and an attestation report by Kinross’ independent auditors addressing the effectiveness of Kinross’ internal control over financial reporting.
If Kinross fails to maintain the adequacy of its internal control over financial reporting, as such standards are modified, supplemented, or amended from time to time, Kinross may not be able to ensure that it can conclude on an ongoing basis that it has effective internal controls over financial reporting in accordance with Section 404 of the Sarbanes-Oxley Act. Kinross’ failure to satisfy the requirement of Section 404 of the Sarbanes-Oxley Act on an ongoing, timely basis could result in the loss of investor confidence in the reliability of its financial statements, which in turn could harm Kinross’ business and negatively impact the trading price of its common shares. In addition, any failure to implement required new or improved controls, or difficulties encountered in their implementation, could harm Kinross’ operating results or cause it to fail to meet its reporting obligations.
Although Kinross is committed to ensure ongoing compliance, Kinross cannot be certain that it will be successful in complying with Section 404 of the Sarbanes-Oxley Act.
To operate successfully, Kinross is reliant on finding and retaining qualified personnel, including key executives.
In order to operate successfully, Kinross must find and retain qualified employees. Kinross and other companies in the mining industry compete for personnel and Kinross is not always able to fill positions in a timely manner. One factor that has contributed to an increased turnover rate is the ageing workforce and it is expected that this factor will further increase the turnover rate in upcoming years. If Kinross is unable to attract and retain qualified personnel or fails to establish adequate succession planning strategies, Kinross’ operations could be adversely affected.
In addition, Kinross has a relatively small executive management team and in the event that the services of a number of these executives are no longer available, Kinross and its business could be adversely affected. Kinross does not carry key-man life insurance with respect to its executives.
Kinross may require additional capital that may not be available.
The mining, processing, development, and exploration of Kinross’ properties may require substantial additional financing. Failure to obtain sufficient financing may result in the delay or indefinite postponement of exploration, development or production on any or all of Kinross’ properties, or even a loss of property interest. Additional capital or other types of financing may not be available if needed or, if available, the terms of such financing may be unfavourable to Kinross.
The Company’s ability to access debt markets and the related cost of debt financing is dependent upon its credit ratings. The Company has an investment grade credit rating from Fitch Ratings as set out in the “Ratings” section of this Annual Information Form. There is no assurance that this credit rating will remain in effect for any given period of time or that such rating will not be revised or withdrawn entirely by the rating agency. On March 16, 2015, Moody’s announced a downgrade of the Company’s senior unsecured ratings from Baa3 to Ba1 in light of the Moody’s downgrade of the Russian Federation’s sovereign rating to Ba1 and the Company’s concentration of cash flows from its operations in the Russian Federation. On January 21, 2016, Moody’s announced plans to conduct a review of its ratings on a number of mining companies globally, including Kinross, in light of the recent downturn in the commodities markets. On February 18, 2016, Standard & Poor’s announced a downgrade of the Company’s rating from BBB- to BB+ in light of Kinross’ continued concentration of cash flows from its operations in the Russian Federation and comparatively high cost structure. On March 17, 2016 Moody’s completed the review of Kinross’ rating noted above and announced the rating was confirmed at Ba1. Real or anticipated changes in credit ratings can affect the price of the Company’s existing debt as well as the Company’s ability to access the capital markets and the cost of such debt financing.
If the Company is unable to maintain its indebtedness and financial ratios at levels acceptable to its credit rating agencies, or should the Company’s business prospects deteriorate, the ratings currently assigned to the Company by the rating agencies could be downgraded, which could adversely affect the value of the
Company’s outstanding securities and existing debt, its ability to obtain new financing on favourable terms, and increase the Company’s borrowing costs.
In particular, the availability of debt financing on economically feasible terms will be essential to the continuing development of our various new and expansion projects, and any lack of such availability may adversely affect our ability to complete those projects or the long-term economic viability of such projects.
Kinross’ level of indebtedness and an inability to satisfy repayment obligations could have a significant impact on its operations and financial performance.
Although Kinross has been successful in repaying debt in the past, there can be no assurance that it can continue to do so. Kinross’ level of indebtedness could have important consequences for its operations and the value of its common shares including: (a) limiting Kinross’ ability to borrow additional amounts for working capital, capital expenditures, debt service requirements, execution of Kinross’ growth strategy or other purposes; (b) limiting Kinross’ ability to use operating cash flow in other areas because of its obligations to service debt; (c) increasing Kinross’ vulnerability to general adverse economic and industry conditions, including increases in interest rates; (d) limiting Kinross’ ability to capitalize on business opportunities and to react to competitive pressures and adverse changes in government regulation; and (e) limiting Kinross’ ability or increasing the costs to refinance indebtedness.
Kinross expects to obtain the funds to pay its expenses and to pay principal and interest on its debt by utilizing cash flow from operations. Kinross’ ability to meet these payment obligations will depend on its future financial performance, which will be affected by financial, business, economic and other factors. Kinross will not be able to control many of these factors, such as economic conditions in the markets in which it operates. Kinross cannot be certain that its future cash flow from operations will be sufficient to allow it to pay principal and interest on Kinross’ debt and meet its other obligations. If cash flow from operations is insufficient or if there is a contravention of its debt covenants, Kinross may be required to refinance all or part of its existing debt, sell assets, borrow more money or issue additional equity. There can be no assurance that Kinross will be able to refinance all or part of its existing debt on terms that are commercially reasonable.
The operations of Kinross in various countries are subject to currency risk.
Currency fluctuations may affect the revenues which Kinross will realize from its operations since gold is sold in the world market in United States dollars. The costs of Kinross are incurred principally in Canadian dollars, United States dollars, Chilean pesos, Brazilian reais, Ghanaian cedis, Mauritanian ouguiyas and Russian roubles. The appreciation of non-U.S. dollar currencies against the U.S. dollar increases the cost of gold production in U.S. dollar terms. From time to time, Kinross transacts currency hedging to reduce the risk associated with currency fluctuations. Currency hedging involves risks and may require margin activities. Sudden fluctuations in currencies could result in margin calls that could have an adverse effect on Kinross’ financial position. While the Chilean peso, Brazilian real, Ghanaian cedi, Mauritanian ouguiya and Russian rouble are currently convertible into Canadian and United States dollars, they may not always be convertible in the future.
Kinross has a practice of “no gold hedging”, although the Company may from time to time acquire gold and/or silver hedge (or derivative product) obligations through acquisitions and/or employ hedge/derivative products in respect of other commodities, interest rates and/or currencies.
While Kinross does not hedge gold in the ordinary course, the Company has from time to time through acquisitions acquired gold and/or silver hedge (or derivative product) obligations and may do so in the future. Kinross has also from time to time employed hedge/derivative products in respect of other commodities, interest rates and/or currencies, and may do so in the future. Hedge (or derivative) products are used to manage the risks associated with gold or silver price volatility, changes in commodity prices, interest rates, foreign currency exchange rates and energy prices. Where Kinross holds such derivative positions, the Company will deliver into such arrangements in the prescribed manner. The use of derivative instruments involves certain inherent risks including: (a) credit risk - the risk of default on amounts owing to Kinross by the counterparties with which Kinross has entered into such transactions; (b) market liquidity risk — the risk
that Kinross has entered into a derivative position that cannot be closed out quickly, by either liquidating such derivative instrument or by establishing an offsetting position; and (c) unrealized mark-to-market risk — the risk that, in respect of certain derivative products, an adverse change in market prices for commodities, currencies or interest rates will result in Kinross incurring an unrealized mark-to-market loss in respect of such derivative products.
In the case of a gold or silver forward sales program, if the metal price rises above the price at which future production has been committed under a forward sales hedge program, Kinross may have an opportunity loss. However, if the metal price falls below that committed price, revenues will be protected to the extent of such committed production. There can be no assurance that Kinross will be able to achieve future realized prices for gold that exceed the spot price as a result of any forward sales hedge program.
The business of Kinross is dependent on good labour and employment relations.
Production at Kinross’ mines is dependent upon the efforts of, and maintaining good relationships with, employees of Kinross. Relations between Kinross and its employees may be impacted by changes in labour relations which may be introduced by, among others, employee groups, unions, and the relevant governmental authorities in whose jurisdictions Kinross carries on business. Adverse changes in such legislation or in the relationship between Kinross and its employees may have a material adverse effect on Kinross’ business, results of operations, and financial condition.
The results of Kinross’ operations could be adversely affected by its acquisition strategy and Kinross may not realize the anticipated benefits of recent acquisitions.
As part of Kinross’ business strategy, it has sought, and may continue to seek, to acquire new mining and development opportunities in the mining industry. Any acquisition that Kinross may choose to complete which may be of a significant size, may change the scale of Kinross’ business and operations, and may expose Kinross to new geographical, political, operational, financial and geological risks. Kinross’ success depends on its ability to identify appropriate acquisition candidates, negotiate acceptable arrangements, including arrangements to finance acquisitions, and to integrate the acquired businesses and their personnel. Kinross may be unable to complete any acquisition or business arrangement that it pursues on favourable terms. Any acquisitions or business arrangements completed may not ultimately benefit Kinross’ business and could impair its results of operations, profitability and financial results. Acquisitions and business arrangements are accompanied by risks including, without limitation: a significant change in commodity prices after Kinross has committed to complete the transaction and established the purchase price or exchange ratio; an acquired material ore body may prove to be below expectations; Kinross may have difficulty integrating and assimilating the operations, technologies and personnel of any acquired companies, realizing anticipated synergies and maximizing the financial and strategic position of the combined enterprise, and maintaining uniform standards, policies and controls across the organization to support the expansion of Kinross’ operations resulting from these acquisitions; the integration of the acquired business or assets may divert management’s attention and disrupt Kinross’ ongoing business and its relationships with employees, customers, suppliers and contractors; and the acquired business or assets may have unknown liabilities which may be significant. Should these or other risks develop, Kinross may suffer significant financial losses or be required to write-down the value of the assets acquired (See Risk Factors related to impairment, below).
In addition, in the event that Kinross chooses to raise debt capital to finance any such acquisition, Kinross’ leverage will be increased. If Kinross chooses to use equity as consideration for such acquisition, existing shareholders may suffer dilution. Alternatively, Kinross may choose to finance any such acquisition with its existing resources. There can be no assurance that Kinross would be successful in overcoming these risks or any other problems encountered in connection with such acquisitions.
Kinross is subject to credit and counterparty risks of third parties with which it contracts.
Credit risk relates to cash and cash equivalents, accounts receivable, and derivative contracts and arises from the possibility that a counterparty to an instrument fails to perform. Counterparty risk is the risk
that a third party might fail to fulfill its performance obligations under the terms of a financial instrument. The Company is subject to counterparty risk and may be adversely affected in the event that a counterparty becomes insolvent. To manage both counterparty and credit risk, the Company proactively manages its exposure to individual counterparties. The Company only transacts with highly-rated counterparties. A limit on contingent exposure has been established for each counterparty based on the counterparty’s credit rating, and the Company monitors the financial condition of each counterparty.
The Company has not experienced any difficulties to date relating to the counterparties with which it transacts. The counterparties continue to be highly rated, and as noted above, the Company has employed measures to reduce the impact of counterparty risk.
Liquidity risk is the risk that the Company may not have sufficient cash resources available to meet its payment obligations. To manage liquidity risk, the Company maintains cash positions and has financing in place that the Company expects will be sufficient to meet its operating and capital expenditure requirements. Potential sources for liquidity could include, but are not limited to: the Company’s current cash position, existing credit facilities, future operating cash flow, and potential private and public financing. Additionally, the Company reviews its short-term operational forecasts regularly and long-term budgets to determine its cash requirements.
Kinross may be adversely affected by global financial conditions.
The volatility and challenges that economies continue to experience around the world continues to affect the profitability and liquidity of businesses in many industries, which in turn has resulted in the following conditions that may have an effect on the profitability and cash flows of the Company:
· Volatility in commodity prices and foreign exchange rates;
· Tightening of credit markets;
· Increased counterparty risk; and
· Volatility in the prices of publicly traded entities.
The volatility in commodity prices and foreign exchange rates directly impact the Company’s revenues, earnings and cash flows, as noted above in the Risk Factors related to the gold price and foreign currency exchange risk.
Although the tighter credit markets have restricted the ability of certain companies to access capital, to date this has not affected the Company’s liquidity.
The Company re-negotiated its term loan and revolving credit facility in 2015 to extend their terms to August 2019 and August 2020, respectively while also amending the leverage ratio covenant. As at December 31, 2015, the Company had $1,506.0 million available under its credit facility arrangements. However, continued tightening of credit markets may affect the ability of the Company to obtain equity or debt financing in the future on terms favourable to the Company.
The Company has not experienced any difficulties to date relating to the counterparties it transacts with. The counterparties continue to be highly rated, and as noted above, the Company has employed measures to reduce the impact of counterparty risk.
Continued volatility in equity markets may affect the value of publicly listed companies in Kinross’ equity portfolio. Should declines in the equity values continue and are deemed to be other than temporary, impairment losses may result.
Kinross is subject to certain legal proceedings and may be subject to additional litigation in the future.
Legal proceedings may be brought against Kinross, for example, litigation based on its business activities, environmental laws, tax matters, volatility in its stock price or failure to comply with its disclosure obligations, which could have a material adverse effect on Kinross’ financial condition or prospects. Regulatory and government agencies may bring legal proceedings in connection with the enforcement of applicable laws and regulations, and as a result Kinross may be subject to expenses of investigations and defense, fines or penalties for violations if proven, and potentially cost and expense to remediate, increased operating costs or changes to operations, and cessation of operations if ordered to do so or required in order to resolve such proceedings.
In the event of a dispute arising at Kinross’ foreign operations, Kinross may be subject to the exclusive jurisdiction of foreign courts or may not be successful in subjecting foreign persons to the jurisdiction of courts in Canada. Kinross’ inability to enforce its rights could have an adverse effect on its future cash flows, earnings, results of operations and financial condition.
Kinross and certain of its executives were previously named as defendants in two putative securities class action suits filed in Canadian and U.S. courts in 2012. These suits have now been settled. See “Legal Proceedings And Regulatory Actions—Legal Proceedings”.
Kinross may not be able to control the decisions and strategy of joint arrangements to which it is a party.
Some of the mines and projects in which Kinross owns interests are operated through joint arrangements with other mining companies and are subject to the risks normally associated with the conduct of joint arrangements. The existence or occurrence of one or more of the following circumstances and events could have a material adverse impact on Kinross’ profitability or the viability of its interests held through joint arrangements, which could have a material adverse impact on Kinross’ results of operations and financial condition: (a) inability to exert influence over certain strategic decisions made in respect of joint arrangement properties; (b) disagreement with partners on how to develop and operate mines efficiently; (c) inability of partners to meet their obligations to the joint arrangements or third parties; and (d) litigation between partners regarding joint arrangement matters.
Kinross may be negatively affected by market price volatility.
Kinross’ common shares are listed on the Toronto Stock Exchange (“TSX”) and the New York Stock Exchange (“NYSE”). The price of Kinross’ common shares is likely to be significantly affected by short-term changes in the gold price or in its financial condition or results of operations as reflected in its quarterly earnings reports. Other factors unrelated to the performance of Kinross that may have an effect on the price of Kinross’ common shares include the following: a reduction in analytical coverage of Kinross by investment banks with research capabilities; a drop in trading volume and general market interest in the securities of Kinross may adversely affect an investor’s ability to liquidate an investment and consequently an investor’s interest in acquiring a significant stake in Kinross; a failure of Kinross to meet the reporting and other obligations under Canadian and U.S. securities laws or imposed by the exchanges could result in a delisting of Kinross’ common shares; and a substantial decline in the price of Kinross’ common shares that persists for a significant period of time could cause Kinross’ common shares to be delisted from the TSX or NYSE further reducing market liquidity.
As a result of any of these factors, the market price of Kinross’ common shares at any given point in time may not accurately reflect Kinross’ long-term value. Securities class action litigation has been brought against companies, including Kinross, following periods of volatility or significant decline in the market price of their securities. Securities litigation could result in substantial costs and damages and divert management’s attention and resources. Any decision resulting from any such litigation that is adverse to the Company could have a negative impact on the Company’s financial position.
Kinross may record impairment charges which may adversely affect financial results.
Kinross assesses, on at least an annual basis, the carrying amount of its cash generating units (“CGUs”) to determine whether current events and circumstances indicate that such carrying amount may no longer be recoverable. Goodwill is required to be tested annually for impairment and Kinross performs this annual test at the end of the fourth quarter. In addition, at each reporting period end, Kinross assesses whether there is any indication that any of its CGUs’ carrying amounts exceed their recoverable amounts, and if there is such an indication, the Company would test for potential impairment at that time. The recoverable amounts, or fair values, of its CGUs are based, in part, on certain factors that may be partially or totally outside of Kinross’ control. Kinross’ fair value estimates are based on numerous assumptions, some of which may be subjective, and it is possible that actual fair value could be significantly different than those estimates.
As at December 31, 2015, Kinross recorded an after-tax impairment charge of $430.2 million related to property, plant and equipment impairment. In the absence of any mitigating valuation factors, Kinross’ failure to achieve its valuation assumptions or declines in the fair values of its CGUs may, over time, result in further impairment charges.
A significant delay or disruption in sales of doré as a result of the unexpected discontinuation of services provided by refineries or a failure by refineries to meet outstanding delivery obligations could have a material adverse effect on operations.
The Company currently engages third-party refineries to refine doré into good delivery gold and silver bars, which are in turn sold into open markets. The refineries are located in Canada, Switzerland, South Africa, Russia, Brazil, and the United States. The loss of any one refiner could have a material adverse effect on the Company if alternative refineries are unavailable. There can be no guarantee that alternative refineries would be available if the need for them were to arise or that it would not experience delays or disruptions in sales that would materially and adversely affect results of operations. In addition, the Company has doré inventory at refineries and could incur a loss arising from the refineries’ failure to fulfill their contractual obligations. The Company has legally binding agreements in place for gold and silver sales transactions and bullion insurance, but there is a risk that a refinery will not satisfy its delivery obligations. In such a case, the Company may pursue all remedies available, as appropriate, to enforce any outstanding delivery obligations. If such delivery obligations are not fulfilled by the refinery, remedied by a court in a specific performance or damages judgment or insurance proceeds are not received, the Company will incur a one-time non-cash charge related to the carrying value of the inventory.
DIVIDEND PAYMENTS AND DIVIDEND POLICY
On February 13, 2013, the board of directors declared a dividend of $0.08 per common share to shareholders of record on March 21, 2013.
On July 31, 2013, the board of directors suspended the payment of semi-annual dividends.
Kinross is under no obligation to declare or pay dividends on its common shares. Payment of any future dividends will be at the discretion of Kinross’ Board of Directors, after taking into account many factors, including Kinross’ operating results, financial condition, and current and anticipated cash requirements. Further, pursuant to Kinross’ syndicated credit facility, Kinross may be required to obtain consent from the lenders prior to declaring any common share dividend.
LEGAL PROCEEDINGS AND REGULATORY ACTIONS
Legal Proceedings
A putative securities class action complaint was filed on February 16, 2012 (the “U.S. Complaint”), entitled Bo Young Cha v. Kinross Gold Corporation et al., in the United States District Court for the Southern District of New York (the “Court”). The U.S. Complaint named as defendants the Company, Tye Burt, former President and CEO, Paul Barry, former Executive Vice President and Chief Financial Officer, Glen Masterman, former Senior Vice President, Exploration and Kenneth Thomas, former Senior Vice President, Projects. On May 31, 2012, the Court selected the City of Austin Police Retirement System (“City of Austin”) to be lead plaintiff. Pursuant to an order of the Court, City of Austin filed an amended Complaint on July 23, 2012 (the “Amended U.S. Complaint”). On March 26, 2015, the parties filed settlement papers with the Court, and asked it to grant an order preliminarily approving the settlement. The action was settled for $33 million, without admission of liability by the defendants and with the Company’s insurance carriers directly funding the full settlement. On October 15, 2015, the Court granted final approval of the settlement. Having received final Court approval of the settlement agreement, without any valid objections, all class members (excepting only the six opting out, amounting to only 1,633 shares) were bound by the settlement and deemed to have released Kinross and the other defendants from any claims related to the Amended U.S. Complaint, with all further proceedings in the action being forever stayed. The time to appeal the final Court approval has passed.
A notice of action in a proposed class proceeding under Ontario’s Class Proceedings Act, 1992, was filed in the Ontario Superior Court of Justice (the “Ontario Court”) on March 12, 2012, entitled Trustees of the Musicians’ Pension Fund of Canada v. Kinross Gold Corporation et al. (the “Ontario Action”). A statement of claim in the Ontario Action was subsequently served on April 11, 2012. The Ontario Action named as defendants the Company, Tye Burt, former President and CEO, Paul Barry, former Executive Vice President and Chief Financial Officer, Glen Masterman, former Senior Vice President, Exploration, and Kenneth Thomas, former Senior Vice President, Projects. On April 22, 2015, the parties advised the Ontario Court that they had agreed to a settlement of all claims in the Ontario Action. On June 17, 2015, the Ontario Court approved the settlement. All of the claims in the Ontario Action were settled for CDN$12.5 million, without any admission of liability by the defendants and with the Company’s insurance carriers directly funding the full settlement. Pursuant to the settlement, the Ontario Action has been dismissed in its entirety. All class members are bound by the settlement and are deemed to have released Kinross and the other defendants from all claims that were raised in the Ontario Action or could have been raised in the Ontario Action.
On January 16, 2015, a notice of action in a proposed class proceeding under Ontario’s Class Proceedings Act, 1992 was filed in the Ontario Court, entitled Frankfurt-Trust Invest Luxemburg AG v. Kinross Gold Corporation (the “Frankfurt Action”). Pursuant to the settlement of the Ontario Action, the Frankfurt Action was dismissed in its entirety and all of the proposed class members are bound by the releases granted in the Ontario action.
Taxes
The Company operates in numerous countries around the world and accordingly is subject to, and pays taxes under the various regimes in countries in which it operates. These tax regimes are determined under tax laws of the country. The Company has historically filed, and continues to file, all required tax returns and filings and to pay the taxes reasonably determined to be due. The tax rules and regulations in many countries are complex and subject to interpretation. From time to time the Company will undergo a review of its historic tax returns and in connection with such reviews, disputes can arise with the taxing authorities over the Company’s interpretation of the country’s tax rules.
Regulatory Actions
In 2015, the Company was not subject to any regulatory actions.
DESCRIPTION OF CAPITAL STRUCTURE
KINROSS COMMON SHARES
Kinross has an unlimited number of common shares authorized and 1,244,137,896 common shares issued and outstanding as of March 28, 2016. There are no limitations contained in the articles or bylaws of Kinross on the ability of a person who is not a Canadian resident to hold Kinross common shares or exercise the voting rights associated with Kinross common shares. A summary of the rights of the Kinross common shares is set forth below.
Dividends
Holders of Kinross common shares are entitled to receive dividends when, as and if declared by the board of directors of Kinross out of funds legally available therefor, provided that if any Kinross preferred shares are at the time outstanding, the payment of dividends on common shares or other distributions (including repurchases of common shares by Kinross) will be subject to the declaration and payment of all cumulative dividends on outstanding Kinross preferred shares and any other preferred shares which are then outstanding. The Business Corporations Act (Ontario) provides that a corporation may not declare or pay a dividend if there are reasonable grounds for believing that the corporation is, or would after the payment of the dividend, be unable to pay its liabilities as they fall due or the realizable value of its assets would thereby be less than the aggregate of its liabilities and stated capital of all classes of shares of its capital.
Liquidation
In the event of the dissolution, liquidation, or winding up of Kinross, holders of Kinross common shares are entitled to share rateably in any assets remaining after the satisfaction in full of the prior rights of creditors, including holders of Kinross’ indebtedness, and the payment of the aggregate liquidation preference of the Kinross preferred shares, and any other preferred shares then outstanding.
Voting
Holders of Kinross common shares are entitled to one vote for each share on all matters voted on by shareholders, including the election of directors.
MARKET PRICE FOR KINROSS SECURITIES
In Canada, the Kinross common shares trade on the TSX under the symbol “K.” In the United States, the Kinross common shares trade on the NYSE under the symbol “KGC.” The Kinross common shares began trading on the NYSE on February 3, 2003. The following table sets forth, for the periods indicated, the high and low sales prices of the Kinross common shares on the TSX and the NYSE and the trading volume.
|
|
|
Kinross Common Shares on the TSX |
|
Kinross Common Shares on the NYSE |
| ||||||||
|
|
|
High |
|
Low |
|
Trading |
|
High |
|
Low |
|
Trading |
|
|
|
|
(CDN Dollars) |
|
(CDN Dollars) |
|
|
|
(US Dollars) |
|
(US Dollars) |
|
|
|
|
Fiscal Year Ending December 31, 2015 |
|
|
|
|
|
|
|
|
|
|
|
|
|
|
January |
|
4.48 |
|
3.20 |
|
133.3 |
|
3.71 |
|
2.73 |
|
286.1 |
|
|
February |
|
4.33 |
|
3.28 |
|
99.6 |
|
3.47 |
|
2.64 |
|
174.3 |
|
|
March |
|
3.60 |
|
2.80 |
|
114.4 |
|
3.05 |
|
2.20 |
|
253.8 |
|
|
April |
|
3.05 |
|
2.75 |
|
107.9 |
|
2.47 |
|
2.19 |
|
226.3 |
|
|
May |
|
3.13 |
|
2.81 |
|
106.3 |
|
2.62 |
|
2.24 |
|
141.3 |
|
|
June |
|
3.19 |
|
2.74 |
|
108.9 |
|
2.59 |
|
2.20 |
|
183.7 |
|
|
July |
|
2.98 |
|
2.10 |
|
105.4 |
|
2.36 |
|
1.60 |
|
234.4 |
|
|
August |
|
2.85 |
|
2.15 |
|
117.6 |
|
2.19 |
|
1.62 |
|
232.7 |
|
|
September |
|
2.46 |
|
1.79 |
|
113.9 |
|
1.87 |
|
1.35 |
|
236.6 |
|
|
October |
|
3.16 |
|
2.23 |
|
119.1 |
|
2.40 |
|
1.68 |
|
261.2 |
|
|
November |
|
2.74 |
|
2.26 |
|
101.8 |
|
2.10 |
|
1.71 |
|
160.5 |
|
|
December |
|
2.86 |
|
2.46 |
|
119.8 |
|
2.14 |
|
1.75 |
|
178.8 |
|
|
|
|
Kinross Common Shares on the TSX |
|
Kinross Common Shares on the NYSE |
| ||||||||
|
|
|
High |
|
Low |
|
Trading |
|
High |
|
Low |
|
Trading |
|
|
|
|
(CDN Dollars) |
|
(CDN Dollars) |
|
|
|
(US Dollars) |
|
(US Dollars) |
|
|
|
|
Fiscal Year Ending December 31, 2014 |
|
|
|
|
|
|
|
|
|
|
|
|
|
|
January |
|
5.33 |
|
4.70 |
|
142.3 |
|
4.86 |
|
4.41 |
|
198.2 |
|
|
February |
|
5.98 |
|
5.00 |
|
143.6 |
|
5.44 |
|
4.51 |
|
206.4 |
|
|
March |
|
5.99 |
|
4.42 |
|
190.6 |
|
5.40 |
|
4.01 |
|
278.8 |
|
|
April |
|
4.82 |
|
4.38 |
|
115.3 |
|
4.39 |
|
3.98 |
|
213.4 |
|
|
May |
|
4.59 |
|
3.97 |
|
89.2 |
|
4.18 |
|
3.66 |
|
138.4 |
|
|
June |
|
4.81 |
|
4.04 |
|
90.5 |
|
4.45 |
|
3.71 |
|
169.7 |
|
|
July |
|
4.78 |
|
4.30 |
|
98.6 |
|
4.47 |
|
3.98 |
|
181.9 |
|
|
August |
|
4.54 |
|
4.21 |
|
67.8 |
|
4.16 |
|
3.83 |
|
159.4 |
|
|
September |
|
4.27 |
|
3.62 |
|
85.0 |
|
3.92 |
|
3.23 |
|
227.1 |
|
|
October |
|
3.78 |
|
2.34 |
|
126.7 |
|
3.38 |
|
2.07 |
|
347.6 |
|
|
November |
|
3.53 |
|
2.27 |
|
149.5 |
|
3.13 |
|
2.00 |
|
324.4 |
|
|
December |
|
3.80 |
|
2.94 |
|
119.8 |
|
3.34 |
|
2.52 |
|
348.9 |
|
As of March 28, 2016 there were 7,574 registered holders of Kinross common shares.
RATINGS
The following table sets out the ratings of Kinross’ corporate debt by the rating agencies indicated as at March 28, 2016:
|
|
|
Standard & |
|
Moody’s |
|
Fitch Ratings |
|
|
US $500 million term loan due 2019 |
|
BB+ |
|
Not rated |
|
BBB- |
|
|
US $250 million, 3.625% notes due 2016 |
|
BB+ |
|
Ba1 |
|
BBB- |
|
|
US $500 million, 5.125% notes due 2021 |
|
BB+ |
|
Ba1 |
|
BBB- |
|
|
US $250 million, 6.875% notes due 2041 |
|
BB+ |
|
Ba1 |
|
BBB- |
|
|
US $500 million, 5.95% notes due 2024 |
|
BB+ |
|
Ba1 |
|
BBB- |
|
Standard & Poor’s Ratings Services credit ratings for long-term debt are on a rating scale that ranges from AAA to D, which represents the range from highest to lowest quality of such securities rated. The ratings from AA to CCC may be modified by the addition of a plus (+) or minus (–) sign to show relative standing within the major rating categories.
Moody’s Investors Service (“Moody’s”) credit ratings for long-term debt are on a rating scale that ranges from Aaa to C, which represents the range from highest to lowest quality of such securities rated. For ratings of Aa through Caa, Moody’s may apply numerical modifiers of 1, 2 or 3 in each generic rating classification to indicate relatively higher, middle or lower ranking.
Fitch Ratings Ltd. credit ratings are on a rating scale that ranges from AAA to D, which represents the range from highest to lowest quality. The ratings from AA to B may be modified by the addition of a plus (+) or minus (–) sign to show relative standing within the major rating categories.
A definition and description of the categories of the credit ratings described above which have been assigned to the Company’s debt are publicly available from the website of each of the individual rating agencies.
Kinross understands that the ratings are based on, among other things, information furnished to the above rating agencies by Kinross and information obtained by the rating agencies from publicly available sources. The credit ratings given to Kinross’ debt instruments by the rating agencies are not recommendations to buy, hold or sell such debt instruments since such ratings do not comment as to market price or suitability for a particular investor. There is no assurance that any rating will remain in effect for any given period of time or that any rating will not be revised or withdrawn entirely by a rating agency in the future if, in its judgment, circumstances so warrant. Credit ratings accorded to Kinross’ debt instruments may not reflect the potential impact of all risks on the value of such instruments, including risks related to market or other factors discussed in this Annual Information Form (See “Risk Factors”, above).
DIRECTORS AND OFFICERS
DIRECTORS(1)
Set forth below is information regarding the directors of Kinross as of March 28, 2016.
|
Name and Place |
|
Principal |
|
Director Since |
|
Current |
|
Ian Atkinson |
|
Corporate Director |
|
February 10, 2016 |
|
CGN, CR |
|
|
|
|
|
|
|
|
|
John A. Brough |
|
Corporate Director |
|
January 19, 1994 |
|
A, H |
|
|
|
|
|
|
|
|
|
John K. Carrington(3) |
|
Corporate Director |
|
October 26, 2005 |
|
CR, CGN |
|
|
|
|
|
|
|
|
|
John M. H. Huxley |
|
Corporate Director |
|
May 31, 1993 |
|
A, H, CGN |
|
|
|
|
|
|
|
|
|
Ave G. Lethbridge |
|
EVP and Chief Human Resources, Toronto Hydro Corporation |
|
May 6, 2015 |
|
A, H |
|
|
|
|
|
|
|
|
|
Catherine McLeod-Seltzer |
|
Non-Executive Chairman and Director, Bear Creek Mining |
|
October 26, 2005 |
|
CGN, CR |
|
|
|
|
|
|
|
|
|
John E. Oliver |
|
Corporate Director |
|
March 7, 1995 |
|
H |
|
|
|
|
|
|
|
|
|
Kelly J. Osborne |
|
Corporate Director |
|
May 6, 2015 |
|
CGN, CR |
|
|
|
|
|
|
|
|
|
Una M. Power |
|
CFO and SVP, Corporate Planning and Business Development, Nexen Inc. |
|
April 3, 2013 |
|
A, CR |
|
|
|
|
|
|
|
|
|
J. Paul Rollinson |
|
President and Chief Executive Officer of Kinross |
|
August 1, 2012 |
|
None |
(1) Please note that Ian Atkinson was voted onto the board of directors on February 10, 2016.
(2) Committees: A-Audit and Risk, CGN-Corporate Governance and Nominating, CR-Corporate Responsibility and Technical, H-Human Resources and Compensation,
(3) As noted in the Company’s management information circular filed April 6, 2015, John Carrington is scheduled to retire from the board of directors in 2016.
Each of the directors has held the principal occupation set forth opposite his or her name, or other executive offices with the same firm or its affiliates, for the past five years with the exception of Messrs. Ian Atkinson and J. Paul Rollinson.
Below is a biography of each of the directors of Kinross:
Ian Atkinson
Mr. Atkinson was previously President and Chief Executive Officer, and a Director, of Centerra Gold before retiring in 2015. He has more than 40 years of experience in the mining industry with extensive background in exploration, project development and mergers and acquisitions. Prior to his ten-year tenure at Centerra, Mr. Atkinson held various senior leadership positions with Hecla Mining Company, Battle Mountain Gold, Hemlo Gold Mines and the Noranda Group. Mr. Atkinson has contributed to the discovery of several major mineral deposits and been involved in a number of large global mining projects in his career. Mr. Atkinson holds a Bachelor of Science degree in geology from King’s College, University of London and a Masters degree in geophysics from the Royal School of Mines, University of London.
John A. Brough
Mr. Brough retired as President of both Torwest Inc. and Wittington Properties Limited, real estate companies on December 31, 2007, a position he had held since 1998. From 1996 to 1998, Mr. Brough was the Executive Vice President and Chief Financial Officer of iSTAR Internet, Inc. Between 1974 and 1996, he held a number of positions with Markborough Properties, Inc., his final position being Senior Vice President and Chief Financial Officer, which position he held from 1986 to 1996. Mr. Brough is an executive with over 30 years of experience in the real estate industry. Mr. Brough holds a Bachelor of Arts (Economics) from the University of Toronto and he is a Chartered Professional Accountant, Chartered Accountant. Mr. Brough has graduated from the Director’s Education Program at the University of Toronto, Rotman School of Management. Mr. Brough is a member of the Institute of Corporate Directors and the Institute of Chartered Professional Accountants of Ontario.
John K. Carrington
Mr. Carrington was the Vice-Chairman and a director of Barrick from 1999 through 2004. Prior to that, Mr. Carrington was the Chief Operating Officer of Barrick from 1996 until February 2004. He has also occupied the functions of President and Executive Vice President, Operations of Barrick in 1997 and 1995 respectively. Prior to that, Mr. Carrington occupied officerships in other mining companies, including Noranda Minerals Inc., Brunswick Mining & Smelting Inc. and Minnova Inc. Mr. Carrington holds a Bachelor of Applied Science (Mining Engineering) and a Masters of Engineering (Mining). He is a member of the Association of Professional Engineers of Ontario.
John M. H. Huxley
Mr. Huxley was most recently a Principal of Algonquin Management Inc., the manager of the Algonquin Power Income Fund, since 1997 until his retirement in 2006. Prior to that, he was the President of Algonquin Power Corporation, a builder, developer and operator of hydroelectric generating facilities in Canada and the United States. He holds a Bachelor of Laws degree from Osgoode Hall Law School. He is also a member of the Institute of Corporate Directors.
Ave G. Lethbridge
Ms. Lethbridge is currently Executive Vice-President and Chief Human Resources and Safety Officer of Toronto Hydro Corporation and serves on the Board of Governors of Georgian College. During her 17 years with Toronto Hydro, she has held various leadership positions in areas encompassing
environment, health and safety, corporate social responsibility, labour relations, workforce planning, talent management, succession planning and leadership development. Ms. Lethbridge holds a Master of Science degree in Organizational Development from Pepperdine University, California and has completed the Director’s Education Program from the Institute of Corporate Directors at the University of Toronto’s Rotman School of Management.
Catherine McLeod-Seltzer
Ms. McLeod-Seltzer has been the non-Executive Chairman and a director of Bear Creek Mining since 2003 and was the non-executive/independent Chairman and a director of Pacific Rim Mining Corp. until November, 2013. She had been an officer and director of Pacific Rim Mining Corp. since 1997. From 1994 to 1996, she was the President, Chief Executive Officer and a director of Arequipa Resources Ltd., a publicly traded company which she co-founded in 1992. From 1985 to 1993, she was employed by Yorkton Securities Inc. as an institutional trader and broker, and also as Operations Manager in Santiago, Chile (1991-92). She has a Bachelor’s degree in Business Administration from Trinity Western University.
John E. Oliver
Mr. Oliver retired after 41 years of working in retail, corporate and investment banking at the Bank of Nova Scotia. He was Executive Managing Director and Co-Head of Scotia Capital U.S., Bank of Nova Scotia leading specialists groups in oil and gas, technology, real estate, diversified industries and leisure and gaming. Mr. Oliver is Chair of the Canadian Museum of Immigration, a Federal Crown Corporation and Vice Chair of Autism Nova Scotia. He was appointed the Independent Chairman of the company in August 2002.
Kelly. J. Osborne.
Mr. Osborne is a 30-year veteran of the mining industry and was most recently President and Chief Executive Officer of Duluth Metals where he also held the position of Chief Operating Officer from 2012 to 2014. Prior to that, he held various leadership positions with Freeport McMoRan Copper & Gold, Indonesia, culminating as Senior Vice-President, Underground Mines. Mr. Osborne holds a Bachelor of Science Degree in Mine Engineering from the University of Arizona, Tucson, Arizona.
Una M. Power
Ms. Power is currently CFO and SVP, Corporate Planning and Business Development, of Nexen Inc., a former publicly-traded company that is a wholly-owned subsidiary of CNOOC Limited. During her career with Nexen Inc., spanning 24 years from 1992 to present, she has held various positions in areas covering financial reporting, financial management, investor relations, business development, strategic planning and investment. From 2009 to 2011, she was SVP, Corporate Planning and Business Development; from 2002 — 2009, Treasurer; from 1998 — 2002, Controller; and, from 1997 — 1998, Manager, Investor Relations. Prior to joining Nexen Inc., Ms. Power was Senior Auditor with Deloitte & Touche from 1989 to 1992, and was staff auditor with Peat Marwick from 1987 to 1989. Ms. Power is a Chartered Professional Accountant, Chartered Accountant and a Chartered Financial Analyst. She has completed the Advanced Management Program at the Wharton Business School, United States and INSEAD, France.
J. Paul Rollinson
Mr. Rollinson was appointed to the Kinross Board and as Chief Executive Officer on August 1, 2012. He was appointed Executive Vice-President, Corporate Development in September 2009 after having joined Kinross as Executive Vice-President, New Investments, in September 2008.
Prior to joining Kinross, Mr. Rollinson had a long career in investment banking spanning 17 years. From June 2001 to September 2008, he worked at Scotia Capital where his final position was Deputy Head of Investment Banking. During his time with Scotia, he was responsible for the mining, power/utilities, forestry and industrial sectors. From April 1988 to June 2001 he worked for Deutsche Bank AG, where his final position was Managing Director/Head of Americas for the mining group, and before that, from 1994 to
April 1998 he was a senior member of the mining team at BMO Nesbitt Burns. Mr. Rollinson has an Honours BSc in Geology from Laurentian University and an M. Eng. in Mining from McGill University.
CORPORATE GOVERNANCE
The corporate governance practices established by Kinross’ board of directors are described in Kinross’ latest management information circular for its annual meeting of shareholders available at www.sedar.com. Details of Kinross’ corporate governance practices compared to the corporate governance listing standards of the New York Stock Exchange are available for review on Kinross’ website at www.kinross.com under the corporate governance section of the website.
OFFICERS
The following table sets forth the names of each of the executive and certain other officers of Kinross and all offices held by each of them as of March 28, 2016.
|
Name |
|
Office Held |
|
|
|
|
|
TONY S. GIARDINI |
|
Executive Vice President and Chief Financial Officer |
|
|
|
|
|
GEOFFREY P. GOLD |
|
Executive Vice-President, Corporate Development, External Relations and Chief Legal Officer |
|
|
|
|
|
GINA JARDINE |
|
Senior Vice-President, Human Resources |
|
|
|
|
|
WARWICK MORLEY-JEPSON |
|
Executive Vice President and Chief Operating Officer |
|
|
|
|
|
JOHN E. OLIVER |
|
Independent Chairman |
|
|
|
|
|
SHELLEY M. RILEY |
|
Vice President, Office Services and Corporate Secretary |
|
|
|
|
|
J. PAUL ROLLINSON |
|
President and Chief Executive Officer |
The following sets forth biographical information for each of the above officers of Kinross who is not also a director of Kinross:
Tony S. Giardini was appointed as Executive Vice-President and Chief Financial Officer, effective December 1, 2012. Prior to joining Kinross, he was Senior Vice-President and Chief Financial Officer at Capstone Mining. From 2006 to 2012, Tony was Chief Financial Officer of Ivanhoe Mines, and also spent ten years at Placer Dome, where he held a series of positions, including Vice-President and Treasurer. Tony is a Chartered Professional Accountant, Chartered Accountant and a Certified Public Accountant and spent 12 years with the accounting firm KPMG, prior to joining Placer Dome.
Geoffrey P. Gold was appointed Executive Vice President and Chief Legal Officer in February of 2008. Effective August of 2012, he assumed the role of Executive Vice President, Corporate Development and from October of 2013 to April of 2015 he assumed the role of Executive Vice President, Human Resources. He assumed the role of Executive Vice President, Corporate Development, External Relations and Chief Legal Officer on January 1, 2016. Prior to February 2008, he had been Senior Vice President and Chief Legal Officer since May 2006. Prior to that, he was Vice President, Assistant Secretary and Associate General Counsel for Placer Dome Inc. from 2001 until 2006; Assistant Secretary and Associate General
Counsel for Placer Dome Inc. from 1999 to 2001; General Counsel and Secretary for Placer Dome North America from 1998 to 1999; and held other legal positions with Placer Dome from 1994 to 1998. Mr. Gold holds a Bachelor of Commerce (Honours) and a Bachelor of Laws from the University of British Columbia.
Gina Jardine was appointed as Senior Vice-President, Human Resources effective April 7, 2015. Prior to joining Kinross, she was most recently Vice-President, Human Resources for Rio Tinto’s Diamonds and Minerals group, based in London. During her eight years at Rio Tinto, she also served as global HR executive for Rio’s shared services group, supporting 65 countries and 57,000 employees. Ms. Jardine brings more than 20 years of experience to her role and has extensive experience in a range of HR functions, including integration, organizational design, and performance management and employee engagement. A native of Australia, she has a bachelor’s degree in Psychology and a MBA from Melbourne Business School.
Warwick Morley-Jepson was appointed Chief Operating Officer on October 1, 2014. He first joined Kinross as Regional Vice-President, Russia in October 2009. Mr. Morley-Jepson has held executive positions in regional and corporate structures of multinational gold mining companies, including Barrick and Placer Dome. A veteran of the deep underground gold and platinum mines in South Africa, Mr. Morley-Jepson began his 35-year career in mine operations before moving into mine development and project execution. Prior to joining Kinross, he was Chief Executive Officer of SUN Gold, a privately-held gold mining company with interests in Russia and Kazakhstan. Mr. Morley-Jepson graduated from the faculty of Mechanical Engineering (HNDT) at the Technicon Witwatersrand, now part of the University of Johannesburg.
John E. Oliver see biographical information on page 84.
Shelley M. Riley has been the Corporate Secretary of Kinross since June 1993 and was appointed Vice President, Office Services and Corporate Secretary in September 2005.
As at March 28, 2016, the directors and executive officers of Kinross, as a group owned, directly or indirectly, or exercised control or direction over 1,627,482 common shares of Kinross, representing less than one percent of the total number of common shares outstanding before giving effect to the exercise of options or other convertible securities held by such directors and officers. The statement as to the number of common shares beneficially owned directly or indirectly or over which control or direction is exercised by the directors and officers of Kinross as a group is based upon information provided by the directors and officers.
J. Paul Rollinson see biographical information on page 84.
CEASE TRADE ORDERS, BANKRUPTCIES, PENALTIES OR SANCTIONS
No director or executive officer of Kinross or a shareholder holding a sufficient number of securities to affect materially the control of Kinross is, or within the ten years prior to the date hereof has been, a director or executive officer of any company (including Kinross) that, while that person was acting in that capacity: (i) was the subject of a cease trade or similar order or an order that denied the relevant company access to any exemption under securities legislation, for a period of more than 30 consecutive days; (ii) was subject to an event that resulted, after the director or executive officer ceased to be a director or executive officer, in the company being the subject of a cease trade or similar order or an order that denied the relevant company access to any exemption under securities legislation for a period of more than 30 consecutive days; or (iii) within a year of that person ceasing to act in that capacity, became bankrupt, made a proposal under any legislation relating to bankruptcy or insolvency or was subject to or instituted any proceedings, arrangement or compromise with creditors or had a receiver, receiver manager or trustee appointed to hold its assets, except as follows:
On April 14, 2005, the Ontario Securities Commission issued a definitive management cease trade order which superseded a temporary management cease trade order dated April 1, 2005 against all the directors and officers of the Company in connection with the Company’s failure to file its audited financial
statements for the year ended December 31, 2004. The missed filings resulted from questions raised by the SEC about certain accounting practices related to the accounting for goodwill. The following current officers and directors of Kinross were the subject of the Ontario Securities Commission’s order: J. Brough, J. Huxley, J. Oliver and S. Riley. A similar order was issued by the Nova Scotia Securities Commission against Mr. John Oliver dated July 6, 2005. These management cease trade orders were lifted on February 22, 2006 when the Company completed the necessary filings following the SEC’s acceptance of Kinross’ accounting treatment for goodwill.
No director or executive officer of Kinross or a shareholder holding a sufficient number of securities of Kinross to affect materially the control of Kinross has, within the ten years prior to the date hereof, become bankrupt, made a proposal under any legislation relating to bankruptcy or insolvency, or become subject to or instituted any proceedings, arrangement or compromise with creditors, or had a receiver, receiver manager or trustee appointed to hold the assets of the director, officer or shareholder.
CONFLICT OF INTEREST
To the best of Kinross’ knowledge, and other than as disclosed in this Annual Information Form, in the notes to Kinross’ financial statements and its MD&A, there are no known existing or potential conflicts of interest between Kinross and any director or officer of Kinross, except as disclosed below and that certain of the directors and officers serve as directors and officers of other public companies and therefore it is possible that a conflict may arise between their duties as a director or officer of Kinross and their duties as a director or officer of such other companies.
The directors and officers of Kinross are aware of the existence of laws governing accountability of directors and officers for corporate opportunity and requiring disclosure by directors of conflicts of interest and Kinross will rely upon such laws in respect of any directors’ and officers’ conflicts of interest or in respect of any breaches of duty by any of its directors or officers. All such conflicts will be disclosed by such directors or officers in accordance with the Business Corporations Act (Ontario) and they will govern themselves in respect thereof to the best of their ability in accordance with the obligations imposed upon them by law.
INTEREST OF MANAGEMENT AND OTHERS IN MATERIAL TRANSACTIONS
Other than as described elsewhere in this Annual Information Form, the notes to the Company’s financial statements and its MD&A, since January 1, 2013, no director, executive officer or 10% shareholder of Kinross or any associate or affiliate of any such person or company, has or had any material interest, direct or indirect, in any transaction that has materially affected or will materially affect the Company or any of its subsidiaries.
TRANSFER AGENT AND REGISTRAR
The transfer agent and registrar for Kinross’ common shares is Computershare Investor Services Inc. at its principal office at 100 University Avenue, Toronto, Ontario, Canada M5J 2Y1, telephone 1-800-564-6253.
MATERIAL CONTRACTS
Kinross Material Contracts
On November 11, 2015, Kinross entered into a definitive asset purchase agreement with Barrick to acquire for $610 million in cash, 100% of the Bald Mountain gold mine and 50% of the Round Mountain gold mine that it did not already own. Kinross acquired a 50% interest in a large land package associated with the Bald Mountain mine and entered into a joint venture with Barrick to explore this property. Kinross funded the transaction (subject to customary adjustments) with cash on hand and available liquidity, and the transaction closed on January 11, 2016.
No other material contracts were entered into by the Corporation within the financial year ended December 31, 2015 or before such time that is still in effect, other than in the ordinary course of business.
INTERESTS OF EXPERTS
The Company’s independent auditors for fiscal 2015, KPMG LLP, have audited the consolidated financial statements of Kinross for the two years ended December 31, 2015. In connection with their audit, KPMG LLP has confirmed that they are independent within the meaning of the relevant rules and related interpretations prescribed by the relevant professional bodies in Canada and any applicable legislation or regulation and under all relevant US professional and regulatory standards.
Mr. John Sims is the qualified person who supervised the preparation of the property descriptions contained herein and the Company’s mineral reserve and mineral resource estimates as at December 31, 2015. Mr. Sims is an officer of the Company.
The expert named in this section beneficially owned, directly or indirectly, less than 1% of any class of shares of the Company’s outstanding shares at the time of the preparation of the reserve and resource estimates and the technical reports.
AUDIT AND RISK COMMITTEE
The Audit and Risk Committee’s charter sets out its responsibilities and duties, qualifications for membership and reporting to the Company’s board of directors. A copy of the charter is attached hereto as Schedule “A”.
As of the date of this Annual Information Form, the members of the Company’s Audit and Risk Committee are John Brough (Chairman), John Huxley, Ave Lethbridge and Una Power. Each of Messrs. Brough and Huxley and Mses. Lethbrige and Power are independent and financially literate within the meaning of Multilateral Instrument 52-110 Audit Committees (“MI 52-110”). In addition to being independent directors as described above, all members of the Company’s Audit Committee must meet an additional “independence” test under MI 52-110 in that their directors’ fees are the only compensation they, or their firms, receive from the Company and that they are not affiliated with the Company. Mr. Brough is a “financial expert” in accordance with SEC requirements.
Relevant Education and Experience
Set out below is a description of the education and experience of each Audit and Risk Committee member that is relevant to the performance of his responsibilities as an Audit and Risk Committee member.
|
John A. Brough |
Mr. Brough holds a Bachelor of Arts (Economics) degree from the University of Toronto and is a Chartered Professional Accountant, Chartered Accountant. Mr. Brough has graduated from the Director’s Education Program at the University of Toronto, Rotman School of Management and is a member of the Institute of Corporate Directors. Mr. Brough had been President of both Torwest Inc. and Wittington Properties Limited, real estate companies from 1998 until his retirement on December 31, 2007. Prior thereto, from 1996 to 1998, Mr. Brough was Executive Vice President and Chief Financial Officer of iSTAR Internet, Inc. Prior thereto, from 1974 to 1996, he held a number of positions with Markborough Properties, Inc., his final position being Senior Vice President and Chief Financial Officer which position he held from 1986 to 1996. Mr. Brough is an executive with over 30 years of experience in the real estate industry. He is currently Chairman of the Audit Committee of Silver Wheaton Corp., Lead Director and Chairman of the Audit Committee of First National Financial Corp. and a director and Chairman of the Audit Committee of CREIT. |
|
|
|
|
John M.H. Huxley |
Mr. Huxley has a Bachelor of Laws degree, and was most recently a principal of Algonquin Management Inc., the manager of Algonquin Power Income Fund, from 1997 to 2006. Prior to that Mr. Huxley was President of Algonquin Power Corporation. |
|
|
|
|
Ave G. Lethbridge |
Ms. Lethbridge holds a Master of Science degree in Organizational Development from Pepperdine University, California and has completed the Director’s Education Program from the Institute of Corporate Directors at the University of Toronto’s Rotman School of Management. Ms. Lethbridge is currently Executive Vice-President and Chief Human Resources and Safety Officer of Toronto Hydro Corporation and serves on the Board of Governors of Georgian College. During her 17 years with Toronto Hydro, she has held various leadership positions in areas encompassing environment, health and safety, corporate social responsibility, labour relations, workforce planning, talent management, succession planning and leadership development. |
|
|
|
|
Una M. Power |
Ms. Power is a Chartered Professional Accountant, Chartered Accountant and a Chartered Financial Analyst. She has completed the Advanced Management Program at the Wharton Business School, United States and INSEAD, France. Ms. Power is currently CFO and SVP, Corporate Planning and Business Development, of Nexen Inc., a former publicly-traded company that is a wholly-owned subsidiary of CNOOC Limited. During her career with Nexen Inc., spanning 24 years from 1992 to present, she has held various positions in areas covering financial reporting, financial management, investor relations, business development, strategic planning and investment. From 2009 to 2011, she was SVP, Corporate Planning and Business Development; from 2002 – 2009, Treasurer; from 1998 – 2002, Controller; and, from 1997 – 1998, Manager, Investor Relations. Prior to joining Nexen Inc., Ms. Power was Senior Auditor with Deloitte & Touche from 1989 to 1992, and was staff auditor with Peat Marwick from 1987 to 1989. |
Pre-Approval Policies and Procedures
The Audit and Risk Committee has formalized its approach to non-audit services by the external auditors in its charter, a copy of which is attached hereto as Schedule “A”.
External Auditor Service Fees
Audit Fees
The audit fees billed by the Company’s external auditors for the financial year ended December 31, 2015 were Cdn$3,914,000 (December 31, 2014 – Cdn$4,042,000).
Audit-Related Fees
The audit-related fees billed by the Company’s external auditors for the financial year ended December 31, 2015 were Cdn$160,000 (December 31, 2014 – Cdn$160,000) relating to translation services and pension plan audits.
Tax Fees
The tax fees in respect of tax compliance and tax advice billed by the Company’s external auditors for the financial year ended December 31, 2015 were Cdn$129,000 (December 31, 2014 – Cdn$57,000).
All Other Fees
Cdn$80,000 was paid to the Company’s external auditors in 2015 under this caption (December 31, 2014 – Cdn$149,000).
ADDITIONAL INFORMATION
Additional information relating to the Company can be found on SEDAR at www.sedar.com. Additional information, including directors’ and officers’ remuneration and indebtedness, principal holders of the Company’s securities and securities authorized for issuance under equity compensation plans is contained in the management information circular of the Company filed for its most recent annual meeting of shareholders. Additional financial information is provided in the Company’s audited consolidated financial statements and the MD&A for the financial year ended December 31, 2015.
GLOSSARY OF TECHNICAL TERMS
adsorption, desorption, recovery (ADR) plant
A type of processing plant used to recover gold from leaching solutions (e.g., from carbon-in-leach).
adularia
A variety of orthoclase, in the feldspar group of minerals. A common mineral in granitic rocks.
alluvial mining
A method of extracting minerals by dredging alluvial (placer) deposits.
arsenopyrite
The most common arsenic mineral and principal ore of arsenic; occurs in many sulfide ore deposits, particularly those containing lead, silver and gold.
assay
To determine the value of various elements within an ore sample, streambed sample, or valuable metal sample.
ball mill
A steel cylinder filled with steel balls into which crushed ore is fed. The ball mill is rotated, causing the balls to cascade and grind the ore.
belt
A series of mineral deposits occurring in close proximity to each other, often with a common origin.
boudins
Sausage-shaped segments of rock occurring in a boudinage structure. Boudinage occurs when tensional (stretching) forces act on layers of relatively hard rock surrounded by softer rock. The overall resulting appearance is that of a string of linked sausages when observed in section.
breccia
A coarse-grained clastic rock, composed of angular broken rock fragments held together by a mineral cement or in a fine-grained matrix; it differs from conglomerate in that the fragments have sharp edges and unworn corners.
carbon-in-leach or CIL
A process step wherein granular activated carbon particles much larger than the ground ore particles are introduced into the ore pulp. Cyanide leaching and precious metals adsorption onto the activated carbon occur simultaneously. The loaded activated carbon is mechanically screened to separate it from the barren ore pulp and processed to remove the precious metals and prepare it for reuse.
carbon-in-pulp
A process step wherein granular activated particles much larger than the ground ore particles are introduced into the ore pulp after primary leaching in cyanide. Precious metals adsorption occurs onto the activated carbon from the pregnant cyanide solution.
cathode
A rectangular plate of metal, produced by electrolytic refining, which is melted into commercial shapes such as wire-bars, billets, ingots, etc.
chalcopyrite
A copper mineral composed of copper, iron and sulphur. This mineral is very similar to marcasite in its characteristics; it tarnishes easily; going from bronze or brassy yellow to yellowish or grayish brown, has a dark streak, and is lighter in weight and harder than gold.
chlorite
A group of minerals with a flaky or scaly structure, green in colour and relatively soft.
core
A long cylindrical piece of rock, about an inch in diameter, brought to surface by diamond drilling.
cyanidation
A method of extracting exposed gold or silver grains from crushed or ground ore by dissolving the contained gold and silver in a weak cyanide solution. May be carried out in tanks inside a mill or in heaps of ore out of doors.
dedicated pad
An area of topography where gold ore will be placed in order to be leached. The ore will remain permanently upon this pad upon the completion of the gold extraction.
dilution
The effect of waste or low-grade ore being included unavoidably in the mine ore, lowering the recovered grade.
doré
Unrefined gold and silver bullion bars, which will be further refined to almost pure metal.
electrowinning
Recovery of a metal from a solution by means of electro-chemical processes.
epithermal
A hydrothermal mineral deposit formed within about 1 kilometre of the Earth’s surface and in the temperature range of 50 to 200 degrees Celsius, occurring mainly as veins.
fault
A fracture in the earth’s crust accompanied by a displacement of one side of the fracture with respect to the other and in a direction parallel to the fracture.
flocculent
A chemical used to promote the formation of denser slurries.
flotation
A separation process in which valuable mineral particles are induced to become attached to bubbles and float, while the non-valuable minerals sink.
fold
Any bending or wrinkling of rock layers.
foliation
Parallel orientation of play minerals or mineral banding in rocks.
formation
Unit of sedimentary rock of characteristic composition or genesis.
galena
A lead mineral, which occurs with sphalerite in hydrothermal veins, also in sedimentary rocks as replacement deposits; an important source of lead and silver.
gold equivalent production
Gold equivalent production represents gold production plus silver production computed into gold ounces using a market price ratio.
grade
The amount of valuable metal in each tonne of material, expressed as grams per tonne for precious metals.
Cut-off grade – is the minimum metal grade at which a tonne of rock can be processed on an economic basis.
Recovered grade – is actual metal grade realized by the metallurgical process and treatment of ore, based on actual experience or laboratory testing.
granite
A light coloured, coarse grained, igneous rock.
granodiorite
A coarse grained, igneous rock, consisting primarily of quartz and a mineral known as plagioclase feldspar.
gravity concentration circuit
Equipment used within a plant to recover gold from the ore using the difference in specific gravity between the gold and the host rock. Typically used are shaking tables, spirals, etc.
greenschist
A metamorphosed basic igneous rock, which owes its colour and foliation to abundant chlorite.
heap leaching
A process whereby gold is extracted by “heaping” broken ore on sloping impermeable pads and repeatedly spraying the heaps with a weak cyanide solution which dissolves the gold content. The gold-laden solution is collected for gold recovery.
hedging
Taking a buy or sell position in a futures market opposite to a position held in the cash market to minimize the risk of financial loss from an adverse price change.
HQ
A diamond drill core measuring 2.500 inches in diameter (6.35 centimetres).
igneous
A term applied to rock that formed by crystallizing from molten rock
intrusive
Rock which while molten, penetrated into or between other rocks but solidified before reaching the surface.
leach
A method of extracting gold from ore by a chemical solution usually containing cyanide.
lode
Vein of metal ore.
low-grade
A term applied to ores relatively poor in the metal they are mined for; lean ore.
mafic
Containing or relating to a group of dark-coloured minerals, composed chiefly of magnesium and iron, that occur in igneous rocks.
Mesozoic
Era of geologic time from approximately 65 to 250 million years before present.
metabasalt
A rock formed by metamorphism of dark volcanic rock known as basalt.
metamorphism
The process by which the form or structure of rocks is changed by heat and pressure.
mica
A group of minerals formed of elastic flakes and sheets, which can be colourless, white, yellow, green, brown, or black. Micas are common rock-forming minerals in igneous, metamorphic, and sedimentary rocks.
micaceous
Consisting of or containing mica.
mill
A plant where ore is ground fine and undergoes physical or chemical treatment to extract the valuable metals.
mineral claim
A mineral claim usually authorizes the holder to prospect and mine for minerals and to carry out works in connection with prospecting and mining.
mineralization
The process or processes by which a mineral or minerals are introduced into a rock, resulting in a valuable or potentially valuable deposit. It is a general term, incorporating various types; e.g., fissure filling, impregnation, and replacement.
net smelter return
A type of royalty payment where the royalty owner receives a fixed percentage of the revenues of a property or operation.
NQ
A diamond drill core measuring 1.875 inches in diameter (4.76 centimetres).
open pit
A mine that is entirely on surface. Also referred to as open-cut or open-cast mine.
oxidation
A reaction where a material is reacted with an oxidizer such as pure oxygen or air in order to alter the state of the material.
Paleozoic
Era of geologic time from approximately 250 to 540 million years before present.
pegmatite
Very coarse grained, igneous rock.
placer
A place where gold is obtained by the washing of materials: rocks, boulders, sand, clay, etc. containing gold or other valuable minerals by the elements. These are deposits of valuable minerals that are found in the form of dust, flakes, grains, and nuggets.
porphyry
An igneous rock in which relatively large crystals, called phenocrysts, are surrounded by fine mineral grains.
pyrite
A yellow iron sulphide mineral, normally of little value. It is sometimes referred to as “fool’s gold.”
pyroclastic
Produced by explosive or aerial ejection of ash, fragments, and glassy material from a volcanic vent. Applied to the rocks and rock layers as well as to the textures so formed.
qualified person
An individual who is an engineer or geoscientist with at least five years of experience in mineral exploration, mine development or operation or mineral project assessment, or any combination of these; has experience relevant to the subject matter of the mineral project and the technical report; and is a member or licensee in good standing of a professional association recognized under National Instrument 43-101.
quartz
Common rock-forming mineral consisting of silicon and oxygen.
quartzite
A metamorphic rock composed mainly of quartz and typically formed from sandstone, a type of sedimentary rock.
reclamation
The restoration of a site after mining or exploration activity is completed.
recovery
A term used in process metallurgy to indicate the proportion of valuable material obtained in the processing of an ore. It is generally stated as a percentage of valuable metal in the ore that is recovered compared to the total valuable metal present in the ore.
run-of-mine
Ore in its unprocessed state after it is mined.
reusable pad
An area where heap leaching takes place on ore material temporarily placed onto it. Upon completion of leaching, the ore is removed from the pad and sent to disposal. New material is then placed on the pad.
sample
A small portion of rock or a mineral deposit taken so that the metal content can be determined by assaying.
schist
A foliated metamorphic rock the grains of which have a roughly parallel arrangement; generally developed by shearing.
sedimentary rocks
Secondary rocks formed from material derived from other rocks and laid down under water. Examples are limestone, shale and sandstone.
semi-autogenous (SAG) mill
A steel cylinder with steel balls into which run-of-mine material is fed. The ore is ground in the action of large lumps of rock and steel balls.
sericite
A white, fine-grained potassium mica occurring in small scales as an alteration product of various minerals, having a silky luster, and found in various metamorphic rocks (especially in schists and phyllites) or in the wall rocks, fault gouge, and vein fillings of many ore deposits.
shear zone
A geological term used to describe a geological area in which shearing has occurred on a large scale.
slurry
Fine rock particles suspended in a stream of water.
sphalerite
A zinc mineral which is composed of zinc and sulphur. It has a specific gravity of 3.9 to 4.1.
stockpile
Broken ore heaped on surface, pending treatment or shipment.
stockwork
A mineral deposit consisting of a three-dimensional network of planar to irregular veinlets closely enough spaced that the whole mass can be mined.
tailings
The material that remains after all metals considered economic have been removed from ore during milling.
vein
A fissure, fault or crack in a rock filled by minerals that have traveled upwards from some deep source.
volcanic
A collective term for igneous rocks that formed from eruptions of liquid rock onto the surface or from particles of rock that were ejected into the atmosphere.
SCHEDULE “A”
KINROSS GOLD CORPORATION
(“KINROSS”)
CHARTER OF THE
AUDIT AND RISK COMMITTEE
I. Purpose
The Audit and Risk Committee shall provide assistance to the Board of Directors in fulfilling its financial reporting and risk oversight responsibilities to the shareholders of Kinross and the investment community. The Audit and Risk Committee’s primary duties and responsibilities are to:
· Oversee (i) the integrity of Kinross’ financial statements; (ii) Kinross’ compliance with legal and regulatory requirements regarding financial disclosure; (iii) the independent auditors’ qualifications and independence; and (iv) the performance of Kinross’ internal audit function.
· Serve as an independent and objective party to monitor Kinross’ financial reporting processes and internal control systems.
· Review and appraise the audit activities of Kinross’ independent auditors and the internal auditing functions.
· Annually evaluate the performance of the Audit and Risk Committee in light of the requirements of its Charter.
· Provide open lines of communication among the independent auditors, financial and senior management, and the Board of Directors for financial reporting and control matters. The Audit and Risk Committee will meet, periodically, with management, with the members of the internal audit function and with the independent auditors.
· Oversee the Kinross’ process for identifying and managing business risks.
· Review the use of derivative and hedging programs to manage operational, financial and currency risk.
· Review and approval of the Internal Audit Charter.
· Review Kinross’ overall tax plan and any material tax planning initiatives.
· Review, evaluate and oversee the periodic replacement of the lead audit partner of the independent auditors.
The primary responsibility of the Committee is to oversee Kinross’ financial reporting process on behalf of the Board of Directors and to report the results of its activities to the Board of Directors. While the Committee has the responsibilities and powers provided in this Charter, it is the responsibility of management and the external auditors, not the responsibility of the Committee, to plan and conduct audits and to prepare and determine that Kinross’ financial statements are complete and accurate and are in accordance with generally accepted accounting principles. It is also the responsibility of management to establish, document, maintain and review systems of internal control and maintain the appropriate accounting and financial reporting principles and policies designed to assure compliance with accounting standards and applicable laws. Absent
knowledge to the contrary (the details of which shall be promptly reported to the Board of Directors), each member of the Committee is entitled to rely on the accuracy of the financial and other information provided to the Committee by management and the external auditors and any representations made by management or the external auditors as to any non-audit services provided to Kinross or any of its subsidiaries.
II. Composition
The Audit and Risk Committee shall be comprised of at least three directors. Each Committee member shall be an “independent director” as determined in accordance with applicable legal requirements for audit committee service, including the requirements of National Instrument 52-110 of the Canadian Securities Administrators (“NI 52-110”) and the Corporate Governance Rules of the New York Stock Exchange (“NYSE Rules”), as such rules are revised, updated or replaced from time to time. A copy of such requirements is reproduced in Schedule “A” attached hereto.
All members shall, to the satisfaction of the Board of Directors, be “financially literate”, and at least one member shall have accounting or related financial management expertise to qualify as a “financial expert” in accordance with applicable legal requirements, including the requirements of NI 52-110 and the rules adopted by the United States Securities and Exchange Commission, as revised, updated or replaced from time to time. A copy of such requirements reproduced in Schedule “A” attached hereto.
No director may serve as a member of the Committee if such director serves on the audit committee of more than two other public companies unless the Board of Directors determines that such simultaneous service would not impair the ability of such director to effectively serve on the Audit and Risk Committee, and this determination is disclosed in the annual management information circular.
The Committee members will be appointed by the Board of Directors annually at the meeting of the Board of Directors held closest to the annual general meeting of shareholders.
The Board of Directors may remove a member of the Committee at any time in its sole discretion by resolution of the Board of Directors. Unless a Chair of the Committee is appointed by the full Board of Directors, the members of the Committee may designate a Chair of the Committee by majority vote of the full membership of the Committee.
III. Responsibilities and Powers
Responsibilities and powers of the Audit and Risk Committee include:
· Annually reviewing and recommending revisions to the Charter, as necessary, for consideration by the Board of Directors.
· Reviewing disclosure respecting the activities of the Audit and Risk Committee included in Kinross’ annual filings.
· Subject to the powers of the Board of Directors and the shareholders under Kinross’ articles and by-laws and under the Business Corporations Act (Ontario), the Audit and Risk Committee is responsible for the selection, appointment, oversight, evaluation, compensation, retention and, if necessary, the replacement of the independent auditors who prepare or issue an auditors’ report or perform other audit, review or attest services for Kinross.
· Overseeing procedures relating to the receipt, retention and treatment of complaints received by Kinross regarding accounting, internal accounting controls or auditing matters and the confidential anonymous submission by employees of the listed issuer of concerns regarding
questionable accounting of auditing matters, pursuant to Kinross’ whistleblower policy, or otherwise.
· Approving the appropriate audit engagement fees and the funding for payment of the independent auditors’ compensation and any advisors retained by the Audit and Risk Committee.
· Requiring that the auditors report directly to the Audit and Risk Committee and be accountable to the Board and the Audit and Risk Committee, as representatives of the shareholders to whom the auditors are ultimately responsible.
· Reviewing the independence of the auditors, which will require receipt from the auditors of a formal written statement delineating all relationships between the auditors and Kinross and any other factors that might affect the independence of the auditors and reviewing and discussing with the auditors any significant relationships and other factors identified in the statement. Reporting to the Board of Directors its conclusions on the independence of the auditors and the basis for these conclusions.
· Reviewing the objectivity and professional skepticism of the independent auditors, the sufficiency of resources provided by the independent auditors and the integrity and candour of communications with the independent auditors.
· Reviewing the performance of the independent auditors, including assessing their effectiveness and quality of service, annually and, every 5 years, performing a comprehensive review of the performance of the independent auditors over multiple years to provide further insight on the audit firm, its independence and application of professional skepticism.
· Requiring the external auditors to provide the Committee with all reports: (i) which the external auditors are required to provide to the Committee or the Board of Directors under rules, policies or practices of professional or regulatory bodies applicable to external auditors; or (ii) are otherwise issued by such bodies which contain material findings respecting the quality of audits conducted by the independent auditors.
· Prohibiting the independent auditors from providing the following non-audit services and determining which other non-audit services the independent auditors are prohibited from providing:
· bookkeeping or other services related to the accounting records or financial statements of Kinross;
· financial information systems design and implementation;
· appraisal or valuation services, fairness opinions, or contribution-in-kind reports;
· actuarial services;
· internal audit outsourcing services;
· management functions or human resources;
· broker or dealer, investment adviser or investment banking services;
· legal services and expert services unrelated to the audit;
· tax services to any person in a financial reporting oversight role, or an immediate family member of any such person, unless the person is in that role solely because he or she is a Kinross director;
· services related to marketing, planning or opinions in favour of the tax treatment of transactions that are confidential transactions under the United States or Canadian tax laws or transactions that would be considered aggressive tax position transactions; and
· any other services which the Public Company Accounting Oversight Board determines to be impermissible.
· Approving any permissible non-audit engagements of the independent auditors in accordance with applicable laws.
· Obtaining from the independent auditors in connection with any audit a timely report relating to the Kinross’ annual audited financial statements describing all critical accounting policies and practices used, all alternative treatments within generally accepted accounting principles for policies and practices related to material items that have been discussed with management, ramifications of the use of such alternative disclosures and treatments, and the treatment preferred by the independent auditors, and any material written communications between the independent auditors and management, such as any “management” letter or schedule of unadjusted differences.
· Meeting with the auditors and financial management of Kinross to review the scope of the proposed audit for the current year, and the audit procedures to be used.
· Reviewing with management and the independent auditors:
· Kinross’ annual and interim financial statements and related notes, management’s discussion and analysis, earnings releases and the annual information form, for the purpose of recommending approval by the Board of Directors prior to being released or filed with regulators, and:
· reviewing with management, significant judgments affecting the financial statements, including any disagreements between the external auditors and management
· discussing among the members of the Committee, without management or the independent auditors present, the information disclosed to the Committee
· receiving the assurance of both financial management and the independent auditors that Kinross’ financial statements are fairly presented in conformity with Canadian GAAP in all material respects
· discussing with management the use of “pro forma” or “non GAAP information” in Kinross’ continuous disclosure documents.
· discussing with management and counsel any matter, including any litigation, claim or other contingency (including tax assessments) that could have a material effect on the financial position or operating results of Kinross and the manner in which any such matter has been described in the financial statements.
· reviewing the effect of any regulatory and accounting initiatives, including any off balance sheet structures, on Kinross’ financial statements.
· The financial reporting of any transactions between Kinross and any officer, director or other “related party” (including any significant shareholder) or any entity in which any person has a financial interest and any potential conflicts of interest.
· Any significant changes in the independent auditors’ audit plan.
· Other matters related to the conduct of the audit that are to be communicated to the Committee under generally accepted auditing standards.
· Review and approve in advance any proposed related-party transactions and required disclosures of such in accordance with applicable securities laws and regulations, and report to the Board on any approved transactions.
· Reviewing the effects of regulatory and accounting initiatives, as well as off-balance sheet structures, on Kinross’ financial statements.
· With respect to the internal auditing department,
(i) reviewing the appointment and replacement of the director of the internal auditing department;
(ii) advising the director of the internal auditing department that he or she is expected to provide to the Audit and Risk Committee copies of significant reports to management prepared by the internal auditing department and management’s responses thereto; and
(iii) considering if the internal auditing department has the resources needed to carry out its responsibilities.
· With respect to accounting principles and policies, financial reporting and internal control over financial reporting,
(i) to advise management, the internal auditing department and the independent auditors that they are expected to provide to the Audit and Risk Committee a timely analysis of significant issues and practices relating to accounting principles and policies, financial reporting and internal control over financial reporting;
(ii) to consider any reports or communications (and management’s and/or the internal audit department’s responses thereto) submitted to the Audit and Risk Committee by the independent auditors required by or referred to in Auditing Standard No. 16 (Communications with Audit Committee), as it may be modified or supplemented or other professional standards, including reports and communications related to:
· deficiencies, including significant deficiencies or material weaknesses, in internal control identified during the audit or other matters relating to internal control over financial reporting;
· consideration of fraud in a financial statement audit;
· detection of illegal acts;
· the independent auditors’ responsibility under generally accepted auditing standards;
· any restriction on audit scope;
· significant accounting policies;
· significant issues discussed with the national office respecting auditing or accounting issues presented by the engagement;
· management judgments and accounting estimates;
· any accounting adjustments arising from the audit that were noted or proposed by the auditors but were passed (as immaterial or otherwise);
· the responsibility of the independent auditors for other information in documents containing audited financial statements;
· disagreements with management;
· consultation by management with other accountants;
· major issues discussed with management prior to retention of the independent auditors;
· difficulties encountered with management in performing the audit;
· the independent auditors’ judgments about the quality of the entity’s accounting principles;
· reviews of interim financial information conducted by the independent auditors; and
· the responsibilities, budget and staffing of the Company’s internal audit function.
· Satisfying itself that adequate procedures are in place for the review of Kinross’ public disclosure of financial information extracted or derived from Kinross’ financial statements, other than the annual and interim financial statements and related notes, management’s discussion and analysis, earnings releases and the annual information form and assessing the adequacy of such procedures periodically.
· Reviewing with the independent auditors and management the adequacy and effectiveness of the financial and accounting controls of Kinross.
· Reviewing the quality and appropriateness of Kinross’ accounting policies and the clarity of financial information and disclosure practices adopted by Kinross and considering the independent auditors’ judgments about the quality and appropriateness of Kinross’ accounting principles and financial disclosure practices as applied in its financial reporting and whether the accounting principles and underlying estimates are common or minority practices.
· Establishing procedures: (i) for receiving, handling and retaining of complaints received by Kinross regarding accounting, internal controls, or auditing matters, and (ii) for employees to submit confidential anonymous concerns regarding questionable accounting or auditing matters.
· Reviewing with the independent auditors any audit problems or difficulties and management’s response and resolving disagreements between management and the auditors.
· Making inquiries of management and the independent auditors to identify significant, financial and control risks and exposures and assess the steps management has taken to minimize such risk to Kinross.
· Reviewing the adequacy of Kinross’ disaster recovery plan to consider if operations can be resumed as quickly and efficiently as possible following the occurrence of any disaster.
· Reviewing reports of compliance with Kinross’ policies on internal controls.
· Discussing any earnings guidance provided to analysts and rating agencies.
· Reviewing any significant tax exposures and tax planning initiatives intended to promote compliance with applicable laws while minimizing tax costs.
· At least annually obtaining and reviewing a report prepared by the independent auditors describing (i) the independent auditors’ internal quality-control procedures; (ii) any material issues raised by the most recent internal quality-control review, or peer review, of the auditors, or by any inquiry of investigation by governmental or professional authorities, within the preceding five years, respecting one or more independent audits carried out by the auditors, and any steps taken to deal with any such issues; (iii) (to assess the auditors’ independence) all relationships between the independent auditors and Kinross, including each non-audit service provided to the Company and at least the matters set forth in Ethics and Independence Rule 3526 (Communication with Audit Committees Concerning Independence); and (iv) the independent auditors’ responsiveness and service levels.
· Setting clear hiring policies for partners, employees or former partners and former employees of the independent auditors.
· Engaging and compensating (for which Kinross will provide appropriate funding) independent counsel and other advisors if the Committee determines such advisors are necessary to assist the Committee in carrying out its duties.
· Reporting disclosure respecting the mandate of the Committee and the Committee’s activities included in Kinross’ Management Information Circular prepared for the annual and general meeting of shareholders and Kinross’ Annual Information Form.
IV. Risk Identification and Oversight
· Review of the principal risks of Kinross’ business and operations, and any other circumstances and events that could have a significant impact on Kinross’ assets and stakeholders. Discussing with management potential risks to Kinross’ business and operations, their likelihood and magnitude and the interrelationships and potential compounding effects of such risks. Assessing the steps management has taken to minimize such risks in light of Kinross’ risk tolerance.
· Assessing Kinross’ risk tolerance, the overall process for identifying Kinross’ principal business and operational risks and the implementation of appropriate measures to manage and disclose such risks.
· Reviewing with senior management annually, Kinross’ general liability, property and casualty insurance policies and considering the extent of any uninsured exposure and the adequacy of coverage.
· Reviewing disclosure respecting the oversight of management of Kinross’ principal business and operational risks.
· Review Kinross’ privacy and data security risk exposures and measures taken to protect the security and integrity of its management information systems and Company data.
V. Meetings and Other Matters
The Audit and Risk Committee will meet regularly at times necessary to perform the duties described above in a timely manner, but not less than four times a year. Meetings may be held at any time deemed appropriate by the Committee.
The Audit and Risk Committee will meet periodically with representatives of the independent auditors, appropriate members of management and personnel responsible for the internal audit function, all either individually or collectively as may be required by the Committee.
The Audit and Risk Committee will also meet periodically without management present.
The independent auditors will have direct access to the Committee at their own initiative.
The Chair of the Committee will report periodically the Committee’s findings and recommendations to the Board of Directors.
The Audit and Risk Committee shall have the resources and authority appropriate to discharge its duties and responsibilities, including the authority to select, retain, terminate, and approve the fees and other retention terms of special or independent counsel, accountants or other experts and advisors, as it deems necessary or appropriate, without seeking approval of the Board or management.
Kinross shall provide for appropriate funding, as determined by the Audit and Risk Committee, in its capacity as a committee of the Board, for payment of:
1. Compensation to the independent auditors and any other public accounting firm engaged for the purpose of preparing or issuing an audit report or performing other audit, review or attestation services for the Company;
2. Compensation of any advisers employed by the Audit and Risk Committee; and
3. Ordinary administrative expenses of the Audit and Risk Committee that are necessary or appropriate in carrying out its duties.
Schedule “A”
Independence Requirement of National Instrument 52-110
A member of the Audit and Risk Committee shall be considered “independent”, in accordance with National Instrument 52-110 - Audit and Risk Committees (“NI 52-110”), subject to the additional requirements or exceptions provided in NI 52-110, if that member has no direct or indirect relationship with the Company, which could reasonably interfere with the exercise of the member’s independent judgment. The following persons are considered to have a material relationship with the Company and, as such, cannot be a member of the Audit and Risk Committee:
(a) an individual who is, or has been within the last three years, an employee or executive officer of the Company;
(b) an individual whose immediate family member is, or has been within the last three years, an executive officer of the Company;
(c) an individual who:
(i) is a partner of a firm that is the Company’s internal or external auditor;
(ii) is an employee of that firm; or
(iii) was within the last three years a partner or employee of that firm and personally worked on the Company’s audit within that time;
(d) an individual whose spouse, minor child or stepchild, or child or stepchild who shares a home with the individual:
(i) is a partner of a firm that is the Company’s internal or external auditor;
(ii) is an employee of that firm and participates in its audit, assurance or tax compliance (but not tax planning) practice, or
(iii) was within the last three years a partner or employee of that firm and personally worked on the Company’s audit within that time;
(e) an individual who, or whose immediate family member, is or has been within the last three years, an executive officer of an entity if any of the Company’s current executive officers serves or served at the same time on the entity’s compensation committee; and
(f) an individual who received, or whose immediate family member who is employed as an executive officer of the Company received, more than $75,000 in direct compensation from the Company during any 12 month period within the last three years, other than as remuneration for acting in his or her capacity as a member of the Board of Directors or any Board committee, or the receipt of fixed amounts of compensation under a retirement plan (including deferred compensation) for prior service for the Company if the compensation is not contingent in any way on continued service.
In addition to the independence criteria discussed above, for Audit and Risk Committee purposes, any individual who:
(a) has a relationship with the Company pursuant to which the individual may accept, directly or indirectly, any consulting, advisory or other compensatory fee from the Company or any subsidiary entity of the Company, other than as remuneration for acting in his or her capacity as a member of the board of directors or any board committee; or as a part-time chair or vice-chair of the board or any board or committee, or
(b) is an affiliated entity of the Company or any of its subsidiary entities,
is deemed to have a material relationship with the Company, and therefore, is deemed not to be independent.
The indirect acceptance by an individual of any consulting, advisory or other compensatory fee includes acceptance of a fee by:
(a) an individual’s spouse, minor child or stepchild, or a child or stepchild who shares the individual’s home; or
(b) an entity in which such individual is a partner, member, an officer such as a managing director occupying a comparable position or executive officer, or occupies a similar position (except limited partners, non-managing members and those occupying similar positions who, in each case, have no active role in providing services to the entity) and which provides accounting, consulting, legal, investment banking or financial advisory services to the Company or any subsidiary entity of the Company.
Independence Requirement of NYSE Rules
A director shall be considered “independent” in accordance with NYSE Rules if that director has no material relationship with the Company (either directly or as a partner, shareholder or officer of an organization that has a relationship with the Company) that may interfere with the exercise of his/her independence from management and the Company.
In addition:
(a) A director who is an employee, or whose immediate family member is an executive officer, of the Company is not independent until three years after the end of such employment relationships.
(b) A director who receives, or whose immediate family member receives, more than $120,000 per year in direct compensation from the Company, other than director or committee fees and pension or other forms of deferred compensation for prior service (provided such compensation is not contingent in any way on continued service), is not independent until three years after he or she ceases to receive more than $120,000 per year in such compensation.
(c) A director who is (i) a current partner or employee of the Company’s internal or external auditor, (ii) was within the last three years a partner or employee of the auditor and personally worked on the Company’s audit during that time or (iii) whose immediate family member is a current partner of the Company’s auditor, a current employee of the auditor and personally works on the Company’s audit or was within the last three years a partner or employee of the auditor and personally worked on the Company’s audit during that time is not “independent”.
(d) A director who is employed, or whose immediate family member is employed, as an executive officer of another company where any of the Company’s present executives serve on that company’s compensation committee is not “independent” until three years after the end of such service or the employment relationship.
(e) A director who is an employee, or whose immediate family member is an executive officer, of a company that makes payments to, or receives payments from, the Company for property or services in an amount which, in any single fiscal year, exceeds the greater of $1 million, or 2% of such other company’s consolidated gross revenues, is not “independent” until three years after falling below such threshold.
A member of the Audit and Risk Committee must also satisfy the independence requirements of Rule 10A-3(b)(1) adopted under the Securities Exchange Act of 1934 as set out below:
In order to be considered to be independent, a member of an Audit and Risk Committee of a listed issuer that is not an investment company may not, other than in his or her capacity as a member of the Audit and Risk Committee, the board of directors, or any other board committee:
(a) Accept directly or indirectly any consulting, advisory, or other compensatory fee from the issuer or any subsidiary thereof, provided that, unless the rules of the national securities exchange or national securities association provide otherwise, compensatory fees do not include the receipt of fixed amounts of compensation under a retirement plan (including deferred compensation) for prior service with the listed issuer (provided that such compensation is not contingent in any way on continued service); or
(b) Be an affiliated person of the issuer or any subsidiary thereof.
An “affiliated person” means a person who directly or indirectly controls Kinross or a director who is an employee, executive officer, general partner or managing member of an entity that directly, or indirectly through one or more intermediaries, controls, or is controlled by, or is under common control with, Kinross.
Financial Literacy Under National Instrument 52-110
“Financially literate”, in accordance with NI 52-110, means that the director has the ability to read and understand a set of financial statements that present a breadth and level of complexity of accounting issues that are generally comparable to the breadth and complexity of the issues that can reasonably be expected to be raised by the Company’s financial statements.
Financial Expert under SEC Rules
An Audit and Risk Committee financial expert is defined as a person who has the following attributes:
(a) an understanding of generally accepted accounting principles and financial statements;
(b) the ability to assess the general application of such principles in connection with the accounting for estimates, accruals and reserves;
(c) experience preparing, auditing, analyzing or evaluating financial statements that present a breadth and level of complexity of accounting issues which are generally comparable to the breadth and complexity of issues that can reasonably be expected to be raised by the registrant’s financial statements, or experience actively supervising one or more persons engaged in such activities;
(d) an understanding of internal controls and procedures for financial reporting; and
(e) an understanding of Audit and Risk Committee functions.
An individual will be required to possess all of the attributes listed in the above definition to qualify as an Audit and Risk Committee financial expert and must have acquired such attributes through one or more of the following means:
(a) education and experience as a principal financial officer, principal accounting officer, controller, public accountant or auditor, or experience in one or more positions that involve the performance of similar function;
(b) experience actively supervising a principal financial officer, principal accounting officer, controller, public accountant, auditor or person performing similar functions;
(c) experience overseeing or assessing the performance of companies or public accountants with respect to the preparation, auditing or evaluation of financial statements; or
(d) other relevant experience.
Exceptions to Independence Requirements of NI 52-110 for Audit and Risk Committee Members
Every Audit and Risk Committee member must be independent, subject to certain exceptions relating to (i) controlled companies; (ii) events outside the control of the member; (iii) the death, disability or resignation of the member; and (iv) the occurrence of certain exceptional circumstances.