UNITED STATES
SECURITIES AND EXCHANGE COMMISSION
Washington, D.C. 20549
SECURITIES AND EXCHANGE COMMISSION
Washington, D.C. 20549
FORM N-CSR
CERTIFIED SHAREHOLDER REPORT OF REGISTERED
MANAGEMENT INVESTMENT COMPANIES
Investment Company Act file number 811-03445
The Merger Fund
(Exact name of registrant as specified in charter)
(Exact name of registrant as specified in charter)
100 Summit Lake Drive
Valhalla, New York 10595
(Address of principal executive offices) (Zip code)
Roy Behren and Michael T. Shannon
100 Summit Lake Drive
Valhalla, New York 10595
(Name and address of agent for service)
(Name and address of agent for service)
914-741-5600
Registrant's telephone number, including area code
Date of fiscal year end: December 31, 2019
Date of reporting period: December 31, 2019
Item 1. Reports to Stockholders.
December 31, 2019
Annual Report
THE MERGER FUND
WCM ALTERNATIVES:
EVENT-DRIVEN FUND
WCM ALTERNATIVES:
CREDIT EVENT FUND
Beginning on January 1, 2021, as permitted by regulations adopted by the U.S. Securities and Exchange Commission, paper copies of the Fund’s shareholder reports will no longer be sent by mail, unless you specifically request paper copies of the
reports from the Fund (or from your financial intermediary, such as a broker-dealer or bank). Instead, the reports will be made available free of charge on a website, and if you have not previously elected electronic delivery of your shareholder
reports, you will be notified by mail each time a report is posted and provided with a website link to access the report. If you already elected to receive shareholder reports electronically, you will not be affected by this change and you need not
take any action. You may elect to receive shareholder reports and other communications from the Fund (or your financial intermediary) electronically by calling 1-800-343-8959 (or by contacting your financial intermediary). You may elect to receive
all future reports in paper free of charge. You can inform the Fund (or your financial intermediary) that you wish to continue receiving paper copies of your shareholder reports by calling 1-800-343-8959 (or by contacting your financial
intermediary). Your election to receive reports in paper will apply to all funds held with Westchester Capital Funds if you invest directly with the Fund or all funds held in your account if you invest through your financial intermediary.
|
STANDARDIZED
|
Mutual Fund Assets:
|
|
|
PERFORMANCE SUMMARY
|
Merger Arbitrage1
|
$3.5 billion
|
|
As of December 31, 2019
|
Opportunistic Credit
|
$5.2 million
|
|
Multi-Event2
|
$526.8 million
|
|
Average Annual Total Return (%)
|
||||||
|
Merger Arbitrage4
|
QTD
|
YTD
|
1 YR
|
5 YR
|
10 YR
|
Life
|
|
The Merger Fund
|
||||||
|
(Institutional)
|
1.76
|
6.32
|
6.32
|
3.85
|
n/a
|
3.59
|
|
The Merger Fund
|
||||||
|
(Investor)
|
1.69
|
5.96
|
5.96
|
3.52
|
3.13
|
6.10
|
|
Insurance
|
||||||
|
Dedicated Funds4
|
||||||
|
The Merger Fund VL
|
1.69
|
6.17
|
6.17
|
3.43
|
3.10
|
4.80
|
|
Opportunistic Credit4
|
||||||
|
Credit Event Fund
|
||||||
|
(Institutional)
|
1.59
|
12.87
|
12.87
|
n/a
|
n/a
|
4.66
|
|
Credit Event Fund
|
||||||
|
(Investor)
|
1.53
|
12.60
|
12.60
|
n/a
|
n/a
|
4.37
|
|
Multi Event4
|
||||||
|
Event-Driven Fund
|
||||||
|
(Institutional)
|
2.72
|
11.13
|
11.13
|
4.29
|
n/a
|
4.22
|
|
Event-Driven Fund
|
||||||
|
(Investor)
|
2.62
|
10.73
|
10.73
|
n/a
|
n/a
|
6.97
|
|
Annual Operating Expense Ratio (%)3
|
|||||
|
Net Expenses
|
|||||
|
Gross
|
Net
|
excluding
|
|||
|
Expense
|
Expense
|
Investment-
|
Performance
|
||
|
Merger Arbitrage4
|
Ratio
|
Ratio3,4
|
Related Expenses4,5
|
Inception
|
Ticker
|
|
The Merger Fund
|
|||||
|
(Institutional)
|
1.74%
|
1.71%
|
1.20%
|
08/01/2013
|
MERIX
|
|
The Merger Fund
|
|||||
|
(Investor)
|
2.04%
|
2.01%
|
1.50%
|
01/31/1989
|
MERFX
|
|
Insurance
|
|||||
|
Dedicated Funds4
|
|||||
|
The Merger Fund VL
|
2.67%
|
1.94%
|
1.40%
|
05/26/2004
|
MERVX
|
|
Opportunistic Credit4
|
|||||
|
Credit Event Fund
|
|||||
|
(Institutional)
|
6.29%
|
1.78%
|
1.64%
|
12/29/2017
|
WCFIX
|
|
Credit Event Fund
|
|||||
|
(Investor)
|
6.61%
|
2.03%
|
1.89%
|
12/29/2017
|
WCFRX
|
|
Multi Event4
|
|||||
|
Event-Driven Fund
|
|||||
|
(Institutional)
|
2.31%
|
2.31%
|
1.74%
|
01/02/2014
|
WCEIX
|
|
Event-Driven Fund
|
|||||
|
(Investor)
|
2.56%
|
2.56%
|
1.99%
|
03/22/2017
|
WCERX
|
2
QTD and YTD performance is not annualized. Performance data quoted represent past performance; past performance does not guarantee future results. The performance results portrayed herein reflect the reinvestment of all
interest, dividends and distributions. The investment return and principal value of an investment will fluctuate so that an investor’s shares, when redeemed, may be worth more or less than their original cost. Current performance of the Funds may be
lower or higher than the performance quoted. Performance data included herein for periods prior to 2011 reflect that of Westchester Capital Management, Inc., the Funds’ prior investment advisor. Messrs. Behren and Shannon, The Merger Fund’s and The
Merger Fund VL’s current portfolio managers, have served as co-portfolio managers of The Merger Fund and The Merger Fund VL since 2007. Performance data current to the most recent month-end may be obtained by calling (800) 343-8959 or by visiting
www.westchestercapitalfunds.com.
1Includes USD 180 million in a sub-advised fund. 2Includes
USD 308 million in a sub-advised fund. 3Net expense ratios are as of a fund’s most recent prospectus. 4For The Merger Fund, the Adviser contractually agreed to reduce its management fee so that the management fee will be: (i) 1.00% of the first $2 billion in average daily net assets of the Fund; and (ii) 0.93% of the average daily
net assets of the Fund above $2 billion. This fee waiver arrangement will apply until April 30, 2020, unless it is terminated at an earlier time by the Board of Trustees. For The Merger Fund VL, the Adviser contractually agreed to reduce all or a
portion of its management fee and, if necessary, to bear certain other expenses (to the extent permitted by the Internal Revenue Code of 1986, as amended, but not including brokerage commissions, short dividends, interest expense, taxes, acquired
fund fees and expenses or extraordinary expenses) associated with operating the Fund to the extent necessary to limit the annualized expenses of the Fund to 1.40% of the Fund’s average daily net assets. This expense limitation agreement will apply
until April 30, 2020, unless it is terminated at an earlier time by the Board of Trustees. For WCM Alternatives: Credit Event Fund, the Adviser contractually agreed to waive its investment advisory fee and to reimburse the Fund for other ordinary
operating expenses to the extent necessary to limit ordinary operating expenses to an amount not to exceed 1.64% and 1.89% for Institutional Class shares and Investor Class shares, respectively. These expense limitations will apply through April 30,
2020, unless terminated by the Board of Trustees at an earlier date. Beginning January 1, 2020, the Adviser has agreed to waive its investment advisory fee and to reimburse the WCM Alternatives: Event-Driven Fund for other ordinary operating expenses
to the extent necessary to limit ordinary operating expenses to an amount not to exceed 1.57% and 1.82% for Institutional Class shares and Investor Class shares, respectively. This expense limitation will apply January 1, 2020 through December 31,
2020, unless it is terminated by the Board of Trustees at an earlier time. 5Investment related expenses include expenses related to short sales and interest on any
borrowing or interest on reverse repurchase agreements, as applicable, and acquired fund fees and expenses.
Trailing Returns
As of Date: 12/31/2019
|
QTD
|
YTD
|
1 Year
|
5 Years
|
10 Years
|
15 Years
|
|
|
Wilshire Liq Alt Event Driven
|
1.29%
|
6.11%
|
6.11%
|
1.66%
|
1.94%
|
2.91%
|
|
BBgBarc US Agg Bond
|
0.18%
|
8.72%
|
8.72%
|
3.05%
|
3.75%
|
4.15%
|
|
ICE B of AML
|
||||||
|
US 3M Trsy Bill
|
0.46%
|
2.28%
|
2.28%
|
1.07%
|
0.58%
|
1.39%
|
3
Fellow Shareholders,
By most measures, 2019 was a rewarding year for our fellow investors. The Merger Fund®, The Merger Fund VL, WCM Alternatives: Event-Driven Fund and WCM Alternatives:
Credit Event Fund all performed solidly in line with their performance targets. MERIX was up 6.32%, MERVX 6.17%, WCEIX 11.13%, and WCFIX 12.87% respectively for the year as a whole. And just as important (we believe), we achieved this goal with
less correlation and volatility than conventional equity funds and ETFs, and exhibited a fraction of the trailing three-year standard deviation of the S&P 500 Index at period end.1
A constructive environment for corporate mergers and acquisitions (“M&A”) contributed to both our fourth-quarter and full-year results. The value of M&A globally totaled about $3.9 trillion in 2019, the fourth highest total on record,
according to figures published by financial data provider Refinitiv. This is slightly lower than the $3.96 trillion in transactions recorded in 2018.2
Megadeals (>$10 billion) and strategic domestic transactions dominated the landscape as deals were facilitated by rising equity values and cheap financing. The number of mergers valued at more than $10 billion increased 8% year-over-year to 43
in 2019, the highest level since 2015 (the busiest-year ever for M&A), according to Refinitiv. 21 deals greater than $20 billion were inked, accounting for almost a quarter of 2019’s global volume.
The biggest deals in 2019 included U.S. drugmaker Bristol-Myers Squibb Company’s (BMY.N) $74 billion acquisition of Celgene Corporation; U.S. defense contractor Raytheon Company’s (RTN.N) merger with the aerospace business of United Technologies
Corp (UTX.N), creating a $135 billion giant; and U.S. pharmaceutical company AbbVie Inc’s (ABBV.N) $64 billion purchase of Botox maker Allergan Plc (AGN.N). Additional consolidation occurred in the fintech (financial technology) sector, with a trio
of large payments deals including Global Payments Inc.’s (GPN) $21.5 billion acquisition of Total System Services (TSS), Fiserv Inc.’s (FISV) $22 billion purchase of First Data Corporation, and Fidelity National Information Services Inc.’s (FIS) $35
billion merger with WorldPay Inc.
A Look Ahead
Companies have generated significant amounts of cash from operations over the last several years, which has been deployed not just on share
__________
|
1
|
3-year Standard deviation of: The Merger Fund (MERIX) 2.59%, The Merger Fund VL (MERVX) 2.58%, and WCM Alternatives: Event-Driven Fund (WCEIX) 3.78% versus the S&P 500 Index 12.12%. WCM Alternatives: Credit Event Fund does not yet
have a 3-year track record.
|
|
2
|
Dealmakers eye cross-border M&A recovery as mega mergers roll on, Reuters, December 31, 2019
|
4
buy-backs but externally on acquisitions. According to accounting firm PricewaterhouseCoopers, total cash spent on acquisitions has more than doubled during this latest M&A wave beginning 2010. The report speculated that total capital
available for business investment going into 2020 may be unprecedented.3
In addition, capital held or committed by US private equity (PE) firms, but not yet invested, continues to grow as well, standing at $1.5 trillion at the end of 2019, the highest on record and more than doubling in the last seven years, according
to data from Preqin.4 Considering that PE firms typically undertake levered transactions, assuming typical gearing of 4x debt to equity would create potential capacity
for $7.5 TRILLION worth of transactions. Last year saw roughly $450 billion worth of private equity transactions worldwide. One of the largest was the $14 billion buyout of fiber network company Zayo Group Holdings, Inc., in which we invested, by
Stockholm-based private equity firm EQT AB and Digital Colony Partners. Confidence in the market appears to be rising as evidenced by media coverage of potentially the biggest-ever leveraged buyout, between KKR & Co. and drugstore giant
Walgreens Boots Alliance Inc., to which the former made a $70 billion take-private offer in November.
We believe the environment remains favorable for high levels of corporate restructurings, mergers, and acquisitions. The bankers that we speak to report active deal pipelines with interest in both stock and cash transactions, as well as hybrid
stock/cash consideration. Financing remains cheap and plentiful, and with the major indices at record levels, equity consideration has become more valuable. Additionally, motivation for transactions remains strong both in the U.S. and abroad as
slowing economic growth incentivizes strategic transactions in order to realize economies of scale as well as distribution and administrative efficiencies.
MERGER ARBITRAGE
The Merger Fund® – Institutional and Investor share classes advanced by 1.76 % and 1.69% during the fourth quarter, bringing its year-to-date performance to 6.32% and
5.96%, respectively, and marking the Fund’s 98th gain in the 124 quarters since its 1989 inception. We held 144 investments during the quarter and experienced one terminated deal. Reflecting a nearly 5:1 ratio of winners to losers, 119 positions
posted positive gains while only 25 had negative marks-to-market. We invested in 34 new situations during the quarter and as of the end of December, we held 124 positions and were approximately 85% invested.
__________
|
3
|
Winning through M&A in the next recession, PwC, December 31, 2019
|
|
4
|
Private equity’s record $1.5 trillion cash pile comes with a new set of challenges, CNBC, January 3, 2020
|
5
|
Winners
|
Losers
|
||
|
•
|
Allergan PLC/
|
•
|
Macro Portfolio
|
|
|
AbbVie Inc (+0.29%)
|
|
Hedge (-0.12%)
|
|
•
|
Alibaba/Altaba (+0.21%)
|
•
|
Qiagen NV/Thermo
|
|
•
|
Celgene Corp/Bristol-Myers
|
Fisher Scientific (-0.08%)
|
|
|
Squibb Co (+0.15%)
|
|||
EVENT-DRIVEN
Strategy allocations result from our bottom-up process; our investment decisions are based on each opportunity’s unique characteristics. Every investment is based on public information rather than speculation, has a
defined timeline and a calculable expected return. The strategy is designed to “go where the events are.” We do not weight the portfolio according to pre-determined allocations to macro-factors such as strategy, sector or geography.
The WCM Alternatives: Event-Driven Fund returned 2.72% and 2.62% for the Institutional and Investor share classes respectively during the quarter, advancing 11.13% and 10.73% year-to-date. The Fund participated in 171 events, and 137 positions
posted gains versus 34 with negative marks-to-market. Winners outnumbered losers by 4:1, we entered 34 new positions and the Fund was fully invested at quarter-end.
Two of the top three winners for WCEIX were similar to The Merger Fund® due to a set of attractive merger arbitrage opportunities. The largest non-M&A
contributor was Apollo Global Management, Inc. (+0.20%). Like KKR & Co. Inc., Ares Management Corporation, and the Blackstone Group before it, the catalyst for Apollo’s outperformance was its conversion from a publicly traded partnership to a
typical “C-corporation” on September 5, 2019. Under this more straightforward structure, Apollo would have an increased tax burden because it would no longer be treated as a pass-through entity for tax purposes but investors, including funds and
institutions, would no longer receive a schedule K-1, and the stock would be more appropriate and investable for a much broader investor base. One of the rationales for the change was that its stock was not reflecting the value of the sum of its
parts, and therefore the simplified structure and expanded investor base would cause a re-rating of the stock.
Another winner of interest was Twenty-First Century Fox/Walt Disney Co (+0.14%). The new Fox security, resulting in a “stub” left over after the merger with Disney (and exchange of FOX for DIS shares) was completed,
6
is comprised of the sports and news assets that Fox Corp retained after selling its entertainment assets to Disney. We were able to create “stub-co” during the pending close of the Disney deal. These situations often present opportunities to buy
companies at inefficiently-priced levels because traditional institutional investors often must wait to buy stub-co until after the deal closes.
The biggest detractor was the Government-Sponsored Entities (GSEs), discussed further in the Credit Event section below (-0.28%). The second biggest detractor was Qiagen N.V./Thermo Fisher Scientific (-0.22%).
CREDIT EVENT
The WCM Alternatives: Credit Event Fund was 113% invested through quarter-end. Performance in Q4 added 1.59% for the Institutional share class and 1.53% for the Investor share class, finishing the year at 12.87% and 12.60%, respectively. Winners
outnumbered losers by almost 5:1. The Fund invested in 70 situations throughout the quarter, 7 of which were new situations, and as of December 31 had 65 credit-related event investments in the portfolio, including multiple SPAC positions.
In the winner column, contributing 0.66% was the continued presence of SPAC investments. The second largest winner was CEC Entertainment, Inc. (+0.23%) as the bond price increased from $95 to $99. We invested in the bonds because we believed the
deal to acquire CEC (Chuck E Cheese!) would allow the bonds to be redeemed. However, the transaction was canceled as the buyer’s shareholders did not support the transaction. Upon deal cancelation, the bond price traded down to $95, which we
determined was an overreaction, based upon our assessment of the issuer’s asset coverage, cash flow coverage and credit quality. We remained constructive about the improving fundamentals of CEC as the recapitalization and reinvestment in store
infrastructure began to play out over the next several quarters. Since September 2019, other fundamental investors began to agree with our thesis, and buyer demand pushed the bond price back up to $99. Avaya, Inc. credit was a contributor as well
(+0.17%), as the price of its term loan increased from $96 to $98 in the fourth quarter of 2019. As part of the company’s strategic review, Avaya announced a favorable joint venture with RingCentral. The joint venture is intended to increase
Avaya’s presence in cloud telephony. Additionally, Avaya received a $250 million up-front cash payment from RingCentral, which helped retire a portion of Avaya’s term loans.
As with the Event-Driven Fund, the Credit Event Fund’s largest detractor is its holdings in the GSE preferred securities (-0.24%), whose recent negative performance this quarter is a function both of a potential extended timeline as well as
increased volatility and timing of the end-of
7
quarter mark. For a refresher, recall that the GSEs (Freddie Mac and Fannie Mae) have remained in conservatorship more than 10 years after the financial crisis and they continue to be dominant players in America’s housing finance system.
Although they remain critical to the functioning of that system, they have not yet transitioned back into private entities and are therefore not subject to the typical net capital and other regulatory requirements of other private financial
institutions. On March 27, 2019, President Trump issued a Memorandum directing the Secretary of the Treasury to develop a plan for administrative and legislative reforms to (i) end the conservatorship of the GSEs upon the completion of specified
reforms, (ii) facilitate competition in the housing finance market, (iii) establish regulation of the GSEs in order to minimize potential risks posed to the U.S. financial system, and (iv) provide that the Federal Government is properly compensated
for any support it provides to the GSEs or the housing finance market. In early September 2019, The Federal Housing Finance Agency (FHFA) released a new Strategic Plan for the conservatorships of Fannie Mae and Freddie Mac addressing many of these
goals. In addition, an appellate court ruled the government’s net worth sweep of Fannie Mae and Freddie Mac to be unconstitutional, which the Trump administration may appeal further if there is no near-term resolution. Full implementation of the
plan will likely take place in Trump’s second term (if there is one). As we have discussed in the past, there may be bumps in the road, and as the capital requirements and other regulatory oversight are finalized, there may be volatility; however,
we believe that the securities of both Fannie Mae and Freddie Mac are significantly undervalued and we believe have a high likelihood of being successful investments. Accordingly, given the long timeline and potential for unanticipated developments,
we opted to construct a more conservative position by investing in the subordinated preferred securities rather than common stock, which puts us towards the front of the line, so to speak, in the event of an asset distribution or liquidation.
However, we have reduced the value-at-risk of this position into strength over the past two quarters, realizing some profits but retaining exposure. The second biggest detractor was EIG Investors Corp (-0.10%).
In all, we are pleased with our Funds’ performance in 2019, because we performed “as promised:” we did not stray in our strategy, nor did we chase performance or hot stocks or increase directional exposure, all of which may have aided our gross
returns, because that is not in keeping with our investment philosophy. We measure success by whether our performance provides attractive risk-adjusted returns in a variety of market environments, with minimal market correlation and minimal
volatility. That means that we accept that we may have notionally
8
excellent performance but nonetheless underperform equities in a year when the S&P 500 Index is up by 31%, as long as we properly hedge and diversify the portfolio. The flip side of the coin would be a year like 2018 where we provided similar
positive performance, even in the treacherous fourth quarter, while the S&P 500 Index was down 4.4% for the year.
We thank you for allowing us to safeguard your capital this year and you have our commitment that we will endeavor to do so in the years ahead. We hope you had a happy new year (even though Larry David claimed that it is too late for such wishes)
and we will be back with another report in three months.
As usual, quarterly statistical summaries for all of our vehicles are provided within two weeks of the end of the quarter – typically one month prior to the release of the quarterly letter. They are available electronically on our website, and we
would be happy to provide a scheduled email as soon as the data becomes available. For convenience, investors can arrange for e-alerts of important Fund communications. Through our website at www.westchestercapitalfunds.com, you can check direct
account balances, make purchases and sales, and sign up for notification of trade confirmations, statements, and shareholder communications via e-mail.
Please contact us with any questions or comments. We are always available and we enjoy speaking with our investors.
 |
 |
|
Roy Behren
|
Mike Shannon
|
9
IMPORTANT DISCLOSURES
Before investing in The Merger Fund®, WCM Alternatives: Event-Driven Fund, and/or WCM Alternatives: Credit Event Fund, carefully consider
the investment objectives, risks, charges, and expenses. For a prospectus or summary prospectus containing this and other information, please call (800) 343-8959. Please read the prospectus carefully before investing. The Merger Fund VL is
available through variable products offered by third-party insurance companies. For a prospectus containing information for any variable annuity or variable life product that invests in The Merger Fund VL, contact your financial advisor or the
offering insurance company for a contract prospectus and prospectus for the underlying funds. Please read it carefully before investing. Shares of the fund are not offered directly to the public. For a prospectus containing information for any
variable annuity or variable life product that invests in the Fund, contact your financial advisor or the offering insurance company for a contract prospectus and prospectus for the underlying funds. Please read it carefully before investing.
Variable annuities are long-term, tax-deferred investments designed for retirement, involve investment risks and may lose value. Earnings are taxable as ordinary income when distributed and may be subject to a 10% federal tax penalty if withdrawn
before age 59½. Optional benefit costs are added to the ongoing fees and expenses of the variable annuity.
Fund holdings and sector allocations are subject to change and should not be considered a recommendation to buy or sell any security. The Ten Largest Positions as a Percent of Net Assets for The Merger Fund® as of December 31, 2019, were: Allergan PLC (5.17%), Osram Licht AG (4.12%), Altaba Inc. (3.90%), Zayo Group Holdings, Inc. (3.25%), Cypress Semiconductor Corporation (3.08%), The Stars Group Inc.
(2.96%), Cobham PLC (2.90%), Tiffany & Co. (2.76%), Wright Medical Group N.V. (2.75%), Liberty Property Trust (2.52%). The Ten Largest Positions as a Percent of Net Assets for The Merger Fund VL as of December 31, 2019, were: Allergan PLC
(5.16%), Osram Licht AG (4.10%), Altaba Inc. (3.69%), Zayo Group Holdings, Inc. (3.25%), Cypress Semiconductor Corporation (3.06 %), The Stars Group Inc. (2.96%), Cobham PLC (2.91%), Wright Medical Group N.V. (2.78%), Tiffany & Co. (2.77%),
Liberty Property Trust (2.40%). The Ten Largest Positions as a Percent of Net Assets for WCM Alternatives: Event-Driven Fund as of December 31, 2019, were: Allergan PLC (5.95%), Osram Licht AG (4.58%), Zayo Group Holdings, Inc. (4.33%), Altaba Inc.
(4.00%), Cypress Semiconductor Corporation (3.57%), The Stars Group Inc. (3.40%), Cobham PLC (3.30%), Wright Medical Group N.V. (3.28%), Tiffany & Co. (3.09%), IAC/InterActiveCorp (2.79%). The Ten Largest Positions as a Percent of Net Assets for
WCM Alternatives: Credit Event Fund as of December 31, 2019, were: Refinitiv US Holdings Inc. (6.63%), Vertiv Group Corp (5.49%), NII Holdings Inc. (4.67%), GMAC Capital Trust (4.48%), Heritage Power (4.34%), Alberton Acquisition Corporation (4.01%),
Colony Capital, Inc. (3.98%), Nielsen Finance LLC (3.96%), SRC Energy Inc. (3.93%), Broadmark Realty Capital Inc. (3.64%).
Diversification does not assure a profit, nor does it protect against a loss in a declining market.
Mutual fund investing involves risk. Principal loss is possible. Merger-arbitrage and event-driven investing involve the risk that the adviser’s evaluation of the outcome of a proposed event, whether it be a merger,
reorganization, regulatory issue or other events, will prove incorrect and that the Funds’ return on the investment will be negative. Investments in foreign companies may entail political, cultural, regulatory, legal, and tax risks different from
those associated with comparable transactions in the United States. The frequency of the Fund’s transactions will vary from year to year, though merger arbitrage portfolios typically have higher turnover rates than portfolios of typical long-only
funds. Increased portfolio turnover may result in higher brokerage commissions, dealer mark-ups, and other transaction costs. The higher costs associated with increased portfolio turnover may offset gains in the Fund’s performance. The Funds’ may
enter into short sale transactions for, among other reasons, purposes of protecting against a decline in the market value of the acquiring company’s shares prior to the acquisition completion. If the price of a security sold short
10
increases between the time of the short sale and the time the Fund covers its short position, the Fund will incur a loss. The amount of a potential loss on an uncovered short sale transaction is theoretically
unlimited. Debt securities may fluctuate in value due to, among other things, changes in interest rates, general economic conditions, industry fundamentals, market sentiment and the financial condition of the issuer, including the issuer’s credit
rating or financial performance. Derivatives may create leverage which will amplify the effect of the performance of those instruments on the Funds and may produce significant losses. The Funds’ hedging strategy will be subject to the Funds’
investment adviser’s ability to assess correctly the degree of correlation between the performance of the instruments used in the hedging strategy and the performance of the investments in the portfolio being hedged. Investments in lower-rated and
non-rated securities present a great risk of loss to principal and interest than higher-rated securities.
The WCM Alternatives: Credit Event Fund is non-diversified and therefore has a greater potential to realize losses upon the occurrence of adverse events affecting an issuer in its portfolio.
Any tax or legal information provided is merely a summary of our understanding and interpretation of some of the current income tax regulations and is not exhaustive. Investors must consult their tax advisor or legal counsel for advice and
information concerning their particular situation. Neither the Funds nor any of their representatives may give legal or tax advice.
The views expressed are as of January 31, 2020, and are a general guide to the views of Westchester Capital Management, are subject to change, are not guaranteed and should not be considered recommendations to buy or sell any security.
Distributions are not guaranteed. This document does not replace portfolio and fund-specific materials.
The Morningstar Rating™ for funds, or “star rating”, is calculated for managed products (including mutual funds, variable annuity, and variable life subaccounts,
exchange-traded funds, closed-end funds, and separate accounts) with at least a three-year history. Exchange-traded funds and open-ended mutual funds are considered a single population for comparative purposes. It is calculated based on a
Morningstar Risk-Adjusted Return measure that accounts for variation in a managed product’s monthly excess performance, placing more emphasis on downward variations and rewarding consistent performance. The top 10% of products in each product
category receive 5 stars, the next 22.5% receive 4 stars, and the next 35% receive 3 stars, the next 22.5% receive 2 stars, and the bottom 10% receive 1 star. The Overall Morningstar Rating™ for a managed product is derived from a weighted average of the performance figures associated with its three-, five-, and 10-year (if applicable) Morningstar Rating™ metrics.
The weights are 100% three-year rating for 36-59 months of total returns, 60% five-year rating/40% three-year rating for 60-119 months of total returns and 50% 10-year rating/30% five-year rating/20% three-year rating for 120 or more months of
total returns. While the 10-year overall star rating formula seems to give the most weight to the 10-year period, the most recent three-year period actually has the greatest impact because it is included in all three rating periods. As of December
31, 2019, The Merger Fund® was rated against the following numbers of U.S.-domiciled Market Neutral funds over the following time periods: 109 funds in the last three
years, 88 funds in the last five years, and 30 funds in the last ten years. With respect to these Market Neutral funds, The Merger Fund® – Investor share class (MERFX)
received a Morningstar Rating of 5 stars, 4 stars and 5 stars for the three-, five- and ten-year periods, respectively. The Merger Fund® – Institutional share class
(MERIX) received a Morningstar rating of 5 stars, 5 stars and 5 stars for the three-, five- and ten-year periods, respectively. Ten-year ratings are Extended Performance Ratings computed by Morningstar using historical adjusted returns prior to the
8/1/2013 inception date of MERIX and reflect the historical performance of MERFX, (inception date 1/31/1989), adjusted to reflect the fees and expenses of the Institutional shares. As of December 31, 2019, WCM Alternatives: Event-Driven Fund was
rated against the
11
following numbers of U.S.-domiciled Multi Alternative funds over the following time periods: 237 funds in the last three years and 187 funds in the last five years. With respect to these Multi Alternative funds, WCM Alternatives: Event-Driven
Fund – Institutional share class (WCEIX) received a Morningstar Rating of 5 stars for both the three- and five-year periods. WCM Alternatives: Event-Driven Fund – Investor share class (WCERX) received a Morningstar Rating of 5 stars for both the
three- and five-year periods. Overall, 3-year and 5-year ratings are Extended Performance Ratings computed by Morningstar using historical adjusted returns prior to the 3/22/2017 inception date of WCERX and reflect the historical performance of
WCEIX, (inception date 1/2/2014), adjusted to reflect the fees and expenses of the Investor shares. © 2019 Morningstar, Inc. All Rights Reserved. The information
contained herein: (1) is proprietary to Morningstar; (2) may not be copied or distributed; and (3) is not warranted to be accurate, complete or timely. Neither Morningstar nor its content providers are responsible for any damages or losses arising
from any use of this information. Past performance is no guarantee of future results.
Absolute return strategies are not intended to outperform stocks and bonds during strong market rallies. An absolute return fund may not achieve its goals and may underperform during periods of strong positive market performance.
With respect to Envestnet’s 2019 Asset Manager Award, the award finalists and winners were chosen from hundreds of best-in-breed performers for each class, which includes alternatives as a new strategy category this year due to its growing
importance as market volatility rises. Envestnet | PMC analysts research and evaluate managers using a systematic, proprietary and multi-factor evaluation methodology that considers a number of metrics: performance, firm profile, customer service,
investment process and style, composite, tax efficiency and other quantitative and qualitative criteria. To be eligible for a Manager and Strategist of the Year Award, a manager must have at least $200 million in assets, be broadly available on the
Envestnet platform and be open to new investors. A minimum three-year tenure is also required by the lead manager.
A number of the comments in this document are based on current expectations and are considered “forward-looking statements”. Actual future results, however, may prove to be different from expectations. The opinions expressed are a reflection of
Westchester Capital Management’s best judgment at the time this document is compiled and any obligation to update or alter forward-looking statements as a result of new information, future events, or otherwise is disclaimed. Furthermore, these views
are not intended to predict or guarantee the future performance of any individual security, asset class, markets generally, nor are they intended to predict the future performance of any Westchester Capital Management account, portfolio or fund.
Definitions: The S&P 500 Index is a broad-based unmanaged index of 500 stocks, which is widely recognized as representative of the equity market in general; The
Bloomberg Barclays Aggregate Bond Index is an intermediate-term index comprised of investment-grade bonds. The Bloomberg Barclays US Corporate High Yield Bond Index measures the USD-denominated, high
yield, fixed-rate corporate bond market. Securities are classified as high yield if the middle rating of Moody’s, Fitch and S&P are Ba1/BB+/BB+ or below. The Morningstar Category: US Fund Market Neutral
is comprised of a universe of funds with similar investment objectives. The Morningstar Category: The US Fund MultiAlternative encompasses funds that have a majority of their assets exposed to alternative
strategies and include both funds with static allocations to alternative strategies and funds tactically allocating among alternative strategies and asset classes. The ICE BofA Merrill Lynch US 3-Month Treasury Bill
Index is comprised of a single issue purchased at the beginning of the month and held for a full month. Indices are unavailable for direct investment. The Dow Jones Industrial Average, or simply the
Dow, is a stock market index that shows how 30 large, publicly owned companies based in the United States have traded during a standard trading session in the stock market. Nasdaq is a global electronic
marketplace for buying and selling securities, as well as the benchmark index for U.S. technology stocks.
12
Indices are unavailable for direct investment. The Wilshire Liquid Alternative Event Driven IndexSM
measures the performance of the event-driven strategy component of The Wilshire Liquid Alternative IndexSM. Event-driven strategies predominantly invest in companies
involved in corporate transactions such as mergers, restructuring, distressed, buy-backs, or other capital structure changes. The Wilshire Liquid Alternative Event Driven Index (WLIQAED) is designed to provide a broad measure of the liquid
alternative event-driven market. HFRX Event Driven Index is comprised of investment Managers who maintain positions in companies currently or prospectively involved in corporate transactions of a wide variety
including but not limited to mergers, restructurings, financial distress, tender offers, shareholder buybacks, debt exchanges, security issuance or other capital structure adjustments. DOJ or The United
States Department of Justice Antitrust Division is a law enforcement agency responsible for enforcing the antitrust laws of the United States. Standard Deviation is the degree to which returns vary relative
to the average return: The higher the standard deviation, the greater the variability of the investment. Beta is a measure of the fund’s sensitivity to market movements. A portfolio with a beta greater than
1 is more volatile than the market and a portfolio with a beta less than 1 is less volatile than the market; Correlation is calculated using R-Squared; which is a measure that represents the percentage of a
fund’s movements that can be explained by movements in a benchmark index. A fund with low R-squared doesn’t act much like the index; A special purpose acquisition company (SPAC) is a corporation formed by
private individuals to facilitate investment through an initial public offering (IPO). The proceeds are used to buy one or more existing companies. Alpha is used in finance as a measure of performance,
indicating when a strategy, trader, or portfolio manager has managed to beat the market return over some period. Alpha, often considered the active return on an investment, gauges the performance of an investment against a market index or benchmark
that is considered to represent the market’s movement as a whole. A put option is an option contract giving the owner the right, but not the obligation, to sell a specified amount of an underlying security at
a specified price within a specified time frame. This is the opposite of a call option, which gives the holder the right to buy an underlying security at a specified price before the option expires. The
returns shown are based on net asset values calculated for shareholder transactions and may differ from the returns shown in the financial highlights of the annual report, which reflects adjustments made to the net asset values in accordance with
accounting principles generally accepted in the United States of America.
The Merger Fund®, WCM Alternatives: Event-Driven Fund and WCM Alternatives: Credit Event Fund are distributed by Compass Distributors, LLC. The Merger Fund VL is
available through variable products offered by third-party insurance companies and is not affiliated with Compass Distributors, LLC.
13
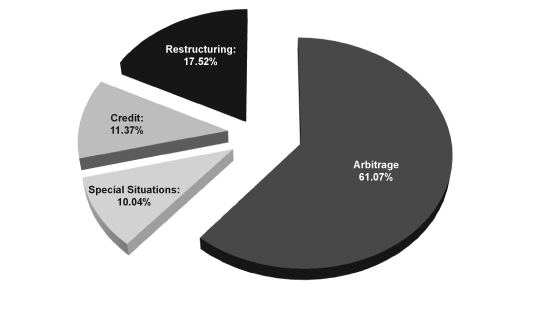
DEAL COMPOSITION
The Merger Fund (Unaudited)
|
Type of Buyer
|
Deal Terms*
|
|||||||||||
|
Strategic
|
90.8
|
%
|
Cash
|
57.9
|
%
|
|||||||
|
Financial
|
9.2
|
%
|
Stock and Stub(1)
|
14.9
|
%
|
|||||||
|
Stock with Fixed Exchange Ratio
|
14.3
|
%
|
||||||||||
|
By Deal Type
|
Cash & Stock
|
11.9
|
%
|
|||||||||
|
Friendly
|
100.0
|
%
|
Undetermined(2)
|
1.0
|
%
|
|||||||
|
Hostile
|
—
|
%
|
Stock with Flexible
|
|||||||||
|
Exchange Ratio (Collar)
|
—
|
%**
|
||||||||||
|
*
|
Data expressed as a percentage of long common stock, corporate bonds and swap contract positions as of December 31, 2019.
|
|
|
**
|
Less than 0.05%.
|
|
|
(1)
|
“Stub” includes assets other than cash and stock (e.g., escrow notes).
|
|
|
(2)
|
The compensation is undetermined because the compensation to be received (e.g., stock, cash, escrow notes, other) will be determined at a later date, potentially at the option of the Fund’s investment adviser.
|
14
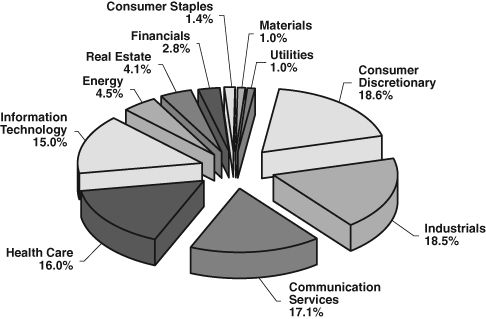
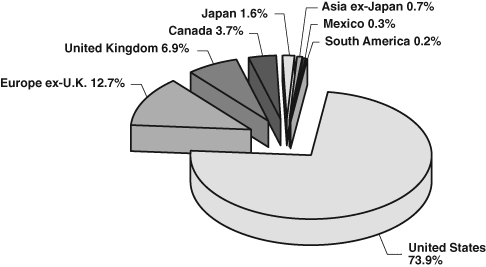
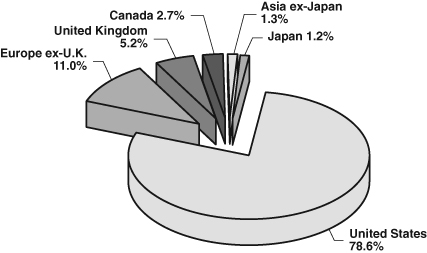
PORTFOLIO COMPOSITION*
The Merger Fund (Unaudited)
By Sector
By Region
|
*
|
Data expressed as a percentage of long common stocks, preferred stocks, contingent value rights, warrants, bank loans, corporate bonds and swap contract positions as of December 31, 2019. Data expressed excludes special purpose
acquisition companies, escrow notes, short-term investments, investments purchased with the cash proceeds from securities lending collateral, securities sold short, written and purchased options, forward currency exchange contracts and short
total return swap contracts. Please refer to the Schedule of Investments for more details on the Fund’s individual holdings.
|
15
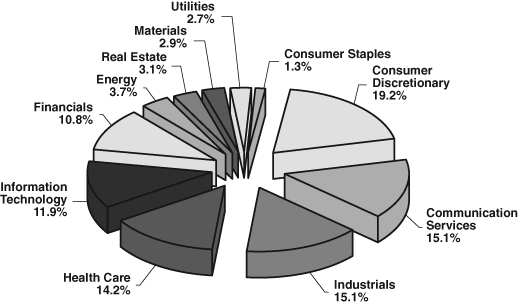
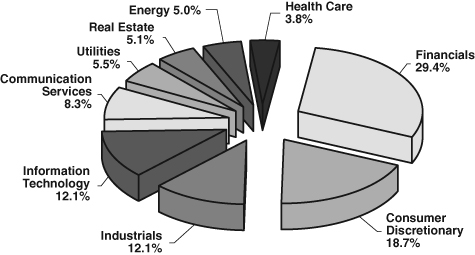
PORTFOLIO COMPOSITION*
WCM Alternatives: Event-Driven Fund (Unaudited)
By Sector
By Region
|
*
|
Data expressed as a percentage of long common stocks, closed-end funds, preferred stocks, contingent value rights, rights, warrants, bank loans, convertible bonds, corporate bonds and swap contract positions as of December 31, 2019. Data
expressed excludes special purpose acquisition companies, escrow notes, short-term investments, securities sold short, written and purchased options, forward currency exchange contracts and short total return swap contracts. Please refer to
the Schedule of Investments for more details on the Fund’s individual holdings.
|
16
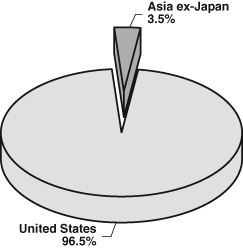
PORTFOLIO COMPOSITION*
WCM Alternatives: Credit Event Fund (Unaudited)
By Sector
By Region
|
*
|
Data expressed as a percentage of long common stocks, closed-end funds, preferred stocks, warrants, bank loans, convertible bonds, corporate bonds and swap contract positions as of December 31, 2019. Data expressed excludes special
purpose acquisition companies, short-term investments, securities sold short and short total return swap contracts. Please refer to the Schedule of Investments for more details on the Fund’s individual holdings.
|
The Global Industry Classification Standard (GICS®) was developed by and/or is the exclusive property of MSCI, Inc. and Standard & Poor’s Financial Services LLC
(“S&P”). GICS is a service mark of MSCI and S&P and has been licensed for use by U.S. Bancorp Fund Services, LLC, doing business as U.S. Bank Global Fund Services (“Fund Services”).
17
COMPARISON OF CHANGE IN VALUE OF $10,000 INVESTMENT
IN THE MERGER FUND AND THE ICE BofA INDEX (Unaudited)
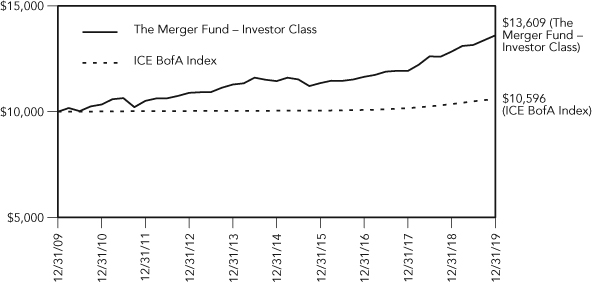
THE MERGER FUND
AVERAGE ANNUAL TOTAL RETURNS
as of December 31, 2019
|
1 Yr.
|
3 Yr.
|
5 Yr.
|
10 Yr.
|
|
|
Investor Class
|
5.96%
|
5.32%
|
3.52%
|
3.13%
|
|
ICE BofA Index
|
2.28%
|
1.67%
|
1.07%
|
0.58%
|
|
Since
|
||||
|
Inception
|
||||
|
1 Yr.
|
3 Yr.
|
5 Yr
|
(8/1/2013)
|
|
|
Institutional Class
|
6.32%
|
5.65%
|
3.85%
|
3.59%
|
|
ICE BofA Index
|
2.28%
|
1.67%
|
1.07%
|
0.85%
|
This chart assumes an initial gross investment of $10,000 made on December 31, 2009. Returns shown include the reinvestment of all dividends. Past performance is not predictive of future performance. The graph and table do not reflect the
deduction of taxes that a shareholder would pay on fund distributions or upon redemption of fund shares. Investment return and principal value will fluctuate, so that your shares, when redeemed, may be worth more or less than the original cost.
The ICE BofA Merrill Lynch 3-Month U.S. Treasury Bill Index (“ICE BofA Index”) is comprised of a single issue purchased at the beginning of the month and held for a full month. At the end of the month that
issue is sold and rolled into a newly selected issue. The issue selected at each month-end rebalancing is the outstanding U.S. Treasury Bill that matures closest to, but not beyond, three months from the rebalancing date. To qualify for selection, an
issue must have settled on or before the month-end rebalancing date. The index is unmanaged and does not include any expenses, fees or sales charges. It is not possible to invest directly in an index.
18
COMPARISON OF CHANGE IN VALUE OF $1,000,000 INVESTMENT
IN THE WCM ALTERNATIVES: EVENT-DRIVEN FUND AND
THE ICE BofA INDEX (Unaudited)
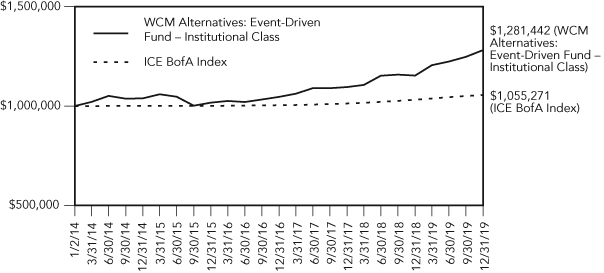
WCM ALTERNATIVES: EVENT-DRIVEN FUND
AVERAGE ANNUAL TOTAL RETURNS
as of December 31, 2019
|
Since
|
||||
|
Inception
|
||||
|
1 Yr.
|
3 Yr.
|
5 Yr.
|
(1/2/2014)
|
|
|
Institutional Class
|
11.13%
|
7.00%
|
4.29%
|
4.22%
|
|
ICE BofA Index
|
2.28%
|
1.67%
|
1.07%
|
0.90%
|
|
Since
|
||||
|
Inception
|
||||
|
1 Yr.
|
(3/22/2017)
|
|||
|
Investor Class
|
10.73%
|
6.97%
|
||
|
ICE BofA Index
|
2.28%
|
1.77%
|
This chart assumes an initial gross investment of $1,000,000 made on January 2, 2014. Returns shown include the reinvestment of all dividends. Past performance is not predictive of future performance. The graph and table do not reflect the
deduction of taxes that a shareholder would pay on fund distributions or upon redemptions of fund shares. Investment return and principal value will fluctuate, so that your shares, when redeemed, may be worth more or less than the original cost.
19
COMPARISON OF CHANGE IN VALUE OF $1,000,000 INVESTMENT
IN THE WCM ALTERNATIVES: CREDIT EVENT FUND AND
THE ICE BofA INDEX (Unaudited)
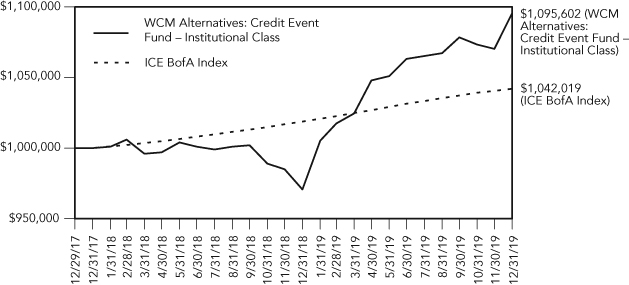
WCM ALTERNATIVES: CREDIT EVENT FUND
AVERAGE ANNUAL TOTAL RETURNS
as of December 31, 2019
|
Since Inception
|
||
|
1 Yr.
|
(12/29/2017)
|
|
|
Institutional Class
|
12.87%
|
4.66%
|
|
ICE BofA Index
|
2.28%
|
2.07%
|
|
Since Inception
|
||
|
1 Yr.
|
(12/29/2017)
|
|
|
Investor Class
|
12.60%
|
4.37%
|
|
ICE BofA Index
|
2.28%
|
2.07%
|
This chart assumes an initial gross investment of $1,000,000 made on December 29, 2017. Returns shown include the reinvestment of all dividends. Past performance is not predictive of future performance. The graph and table do not reflect the
deduction of taxes that a shareholder would pay on fund distributions or upon redemptions of fund shares. Investment return and principal value will fluctuate, so that your shares, when redeemed, may be worth more or less than the original cost.
20
The Merger Fund and Westchester Capital Funds
EXPENSE EXAMPLE
December 31, 2019 (Unaudited)
As a shareholder of The Merger Fund, WCM Alternatives: Event-Driven Fund and/or WCM Alternatives: Credit Event Fund (the “Funds”), you incur two types of costs: (1) transaction costs and (2) ongoing costs, including management fees, and other Fund
specific expenses. The expense example is intended to help a shareholder understand ongoing costs (in dollars) of investing in the Fund(s) and to compare these costs with the ongoing costs of investing in other mutual funds. The example is based on
an investment of $1,000 invested at the beginning of the period and held for the most recent six-month period.
The Actual Expenses comparison provides information about actual account values and actual expenses. A shareholder may use the information in this line, together with the amount invested, to estimate the expenses paid over the period. A
shareholder may divide his/her account value by $1,000 (e.g., an $8,600 account value divided by $1,000 = 8.6), then multiply the result by the number in the first line under the heading entitled “Expenses Paid During Period” to estimate the expenses
paid on his/her account during this period. The example below includes, among other fees, management fees, fund accounting, custody and transfer agent fees. However, the example does not include portfolio trading commissions and related expenses or
extraordinary expenses.
The Hypothetical Example for Comparison Purposes provides information about hypothetical account values and hypothetical expenses based on each Fund’s actual expense ratios and assumed rates of return of 5% per year before expenses, which are not
the Fund’s actual returns. The hypothetical account values and expenses may not be used to estimate the actual ending account balance or expenses paid for the period. A shareholder may use this information to compare the ongoing costs of investing in
the Funds and other funds. To do so, a shareholder would compare this 5% hypothetical example with the 5% hypothetical examples that appear in the shareholder reports of other funds.
The expenses shown in the table are meant to highlight your ongoing costs only and do not reflect any transactional costs, such as sales charges (loads), redemptions fees, or exchange fees. Therefore, the Hypothetical Example for Comparison
Purposes is useful in comparing ongoing costs only, and will not help to determine the relevant total costs of owning different funds. In addition, if these transactional costs were included, shareholder costs would have been higher.
21
The Merger Fund and Westchester Capital Funds
EXPENSE EXAMPLE (continued)
December 31, 2019 (Unaudited)
|
Annualized
|
Beginning
|
Ending
|
Expenses Paid
|
|
|
Net Expense
|
Account
|
Account
|
During Period
|
|
|
Ratio
|
Value
|
Value
|
7/1/19-
|
|
|
12/31/19
|
7/1/19
|
12/31/19
|
12/31/19(1)
|
|
|
The Merger Fund
|
||||
|
Investor Class
|
||||
|
Actual Expenses(2)(3)
|
1.91%
|
$1,000.00
|
$1,034.40
|
$9.79
|
|
Hypothetical Example for
|
||||
|
Comparison Purposes
|
||||
|
(5% return before
|
||||
|
expenses)(3)
|
1.91%
|
$1,000.00
|
$1,015.58
|
$9.70
|
|
Institutional Class
|
||||
|
Actual Expenses(2)(3)
|
1.65%
|
$1,000.00
|
$1,036.50
|
$8.47
|
|
Hypothetical Example for
|
||||
|
Comparison Purposes
|
||||
|
(5% return before
|
||||
|
expenses)(3)
|
1.65%
|
$1,000.00
|
$1,016.89
|
$8.39
|
|
Annualized
|
Beginning
|
Ending
|
Expenses Paid
|
|
|
Net Expense
|
Account
|
Account
|
During Period
|
|
|
Ratio
|
Value
|
Value
|
7/1/19-
|
|
|
12/31/19
|
7/1/19
|
12/31/19
|
12/31/19(1)
|
|
|
WCM Alternatives: Event-Driven Fund
|
||||
|
Investor Class
|
||||
|
Actual Expenses(2)(4)
|
2.23%
|
$1,000.00
|
$1,045.30
|
$11.50
|
|
Hypothetical Example for
|
||||
|
Comparison Purposes
|
||||
|
(5% return before
|
||||
|
expenses)(4)
|
2.23%
|
$1,000.00
|
$1,013.96
|
$11.32
|
|
Institutional Class
|
||||
|
Actual Expenses(2)(4)
|
1.97%
|
$1,000.00
|
$1,047.20
|
$10.17
|
|
Hypothetical Example for
|
||||
|
Comparison Purposes
|
||||
|
(5% return before
|
||||
|
expenses)(4)
|
1.97%
|
$1,000.00
|
$1,015.27
|
$10.01
|
22
The Merger Fund and Westchester Capital Funds
EXPENSE EXAMPLE (continued)
December 31, 2019 (Unaudited)
|
Annualized
|
Beginning
|
Ending
|
Expenses Paid
|
|
|
Net Expense
|
Account
|
Account
|
During Period
|
|
|
Ratio
|
Value
|
Value
|
7/1/19-
|
|
|
12/31/19
|
7/1/19
|
12/31/19
|
12/31/19(1)
|
|
|
WCM Alternatives: Credit Event Fund
|
||||
|
Investor Class
|
||||
|
Actual Expenses(2)(5)
|
2.12%
|
$1,000.00
|
$1,028.90
|
$10.84
|
|
Hypothetical Example for
|
||||
|
Comparison Purposes
|
||||
|
(5% return before
|
||||
|
expenses)(5)
|
2.12%
|
$1,000.00
|
$1,014.52
|
$10.76
|
|
Institutional Class
|
||||
|
Actual Expenses(2)(5)
|
1.82%
|
$1,000.00
|
$1,030.50
|
$9.31
|
|
Hypothetical Example for
|
||||
|
Comparison Purposes
|
||||
|
(5% return before
|
||||
|
expenses)(5)
|
1.82%
|
$1,000.00
|
$1,016.03
|
$9.25
|
|
(1)
|
Expenses are equal to the Fund’s annualized net expense ratio, multiplied by the average account value over the period, multiplied by 184/365 to reflect the one-half year period.
|
|
(2)
|
Based on the actual returns of 3.44%, 3.65%, 4.53%, 4.72%, 2.89% and 3.05% for the six-month period ended December 31, 2019 for The Merger Fund Investor and Institutional Classes, WCM Alternatives: Event-Driven Fund Investor and
Institutional Classes and WCM Alternatives: Credit Event Fund Investor and Institutional Classes, respectively.
|
|
(3)
|
Excluding dividends on securities sold short, borrowing expense on securities sold short and legal expenses related to the settlement of an appraisal right, your actual cost of investment and your hypothetical cost of investment would have
been $7.54 and $7.48, respectively in the The Merger Fund Investor Class and $6.11 and $6.06, respectively in The Merger Fund Institutional Class.
|
|
(4)
|
Excluding dividends and interest on securities sold short, borrowing expense on securities sold short and legal expenses related to the settlement of an appraisal right, your actual cost of investment and your hypothetical cost of
investment would have been $9.54 and $9.40, respectively in WCM Alternatives: Event-Driven Fund Investor Class and $8.26 and $8.13, respectively in WCM Alternatives: Event-Driven Fund Institutional Class.
|
|
(5)
|
Excluding interest on securities sold short, borrowing expense on securities sold short and interest on reverse repurchase agreements, your actual cost of investment and your hypothetical cost of investment would have been $9.67 and $9.60,
respectively in WCM Alternatives: Credit Event Fund Investor Class and $8.39 and $8.34, respectively in WCM Alternatives: Credit Event Fund Institutional Class.
|
23
The Merger Fund
SCHEDULE OF INVESTMENTS
December 31, 2019
|
Shares
|
Value
|
|||||||
|
LONG INVESTMENTS — 101.61%
|
||||||||
|
COMMON STOCKS — 47.36%
|
||||||||
|
AEROSPACE & DEFENSE — 2.09%
|
||||||||
|
Raytheon Company (e)(j)
|
145,800
|
$
|
32,038,092
|
|||||
|
United Technologies Corporation (j)
|
230,800
|
34,564,608
|
||||||
|
66,602,700
|
||||||||
|
ALTERNATIVE CARRIERS — 3.25%
|
||||||||
|
Zayo Group Holdings, Inc. (a)(e)
|
2,996,105
|
103,815,038
|
||||||
|
BIOTECHNOLOGY — 0.65%
|
||||||||
|
ArQule, Inc. (a)(j)
|
674,908
|
13,471,164
|
||||||
|
The Medicines Company (a)(j)
|
37,300
|
3,168,262
|
||||||
|
Ra Pharmaceuticals, Inc. (a)
|
84,228
|
3,952,820
|
||||||
|
20,592,246
|
||||||||
|
BROADCASTING — 1.53%
|
||||||||
|
Discovery, Inc. Class C (a)
|
133,231
|
4,062,213
|
||||||
|
Fox Corporation Class B (k)
|
343,866
|
12,516,723
|
||||||
|
ViacomCBS, Inc. Class B (j)
|
765,800
|
32,140,626
|
||||||
|
48,719,562
|
||||||||
|
BUILDING PRODUCTS — 1.08%
|
||||||||
|
Continental Building Products, Inc. (a)
|
40,639
|
1,480,479
|
||||||
|
Masco Corporation (j)(k)
|
689,800
|
33,103,502
|
||||||
|
34,583,981
|
||||||||
|
CASINOS & GAMING — 5.03%
|
||||||||
|
Caesars Entertainment
|
||||||||
|
Corporation (a)(e)(k)
|
4,854,118
|
66,016,005
|
||||||
|
The Stars Group, Inc. (a)(b)(e)(f)(k)
|
3,663,384
|
94,625,208
|
||||||
|
160,641,213
|
||||||||
|
CHEMICALS — 0.31%
|
||||||||
|
DuPont de Nemours, Inc. (e)(j)
|
155,735
|
9,998,187
|
||||||
|
CONSTRUCTION MACHINERY
|
||||||||
|
& HEAVY TRUCKS — 1.82%
|
||||||||
|
WABCO Holdings, Inc. (a)(e)
|
428,747
|
58,095,218
|
||||||
|
ELECTRONIC EQUIPMENT
|
||||||||
|
& INSTRUMENTS — 0.46%
|
||||||||
|
Fitbit, Inc. Class A (a)(j)(k)
|
2,225,272
|
14,620,037
|
||||||
|
ENVIRONMENTAL &
|
||||||||
|
FACILITIES SERVICES — 0.63%
|
||||||||
|
Advanced Disposal Services, Inc. (a)
|
605,687
|
19,908,932
|
||||||
The accompanying notes are an integral part of these financial statements.
24
The Merger Fund
SCHEDULE OF INVESTMENTS (continued)
December 31, 2019
|
Shares
|
Value
|
|||||||
|
HEALTH CARE EQUIPMENT — 2.75%
|
||||||||
|
Wright Medical Group N.V. (a)(b)(j)(k)
|
2,875,117
|
$
|
87,633,566
|
|||||
|
INTERACTIVE MEDIA & SERVICES — 2.19%
|
||||||||
|
IAC/InterActiveCorp (a)(j)(k)
|
280,300
|
69,825,533
|
||||||
|
INVESTMENT BANK
|
||||||||
|
& BROKERAGE — 1.62%
|
||||||||
|
TD Ameritrade Holdings Corporation
|
1,039,893
|
51,682,682
|
||||||
|
IT CONSULTING &
|
||||||||
|
OTHER SERVICES — 0.10%
|
||||||||
|
InterXion Holding N.V. (a)(b)
|
38,517
|
3,228,110
|
||||||
|
LIFE & HEALTH INSURANCE — 0.04%
|
||||||||
|
Genworth Financial, Inc. Class A (a)(k)
|
306,379
|
1,348,068
|
||||||
|
LIFE SCIENCES TOOLS & SERVICES — 0.33%
|
||||||||
|
Qiagen N.V. (a)(b)(j)
|
314,925
|
10,644,465
|
||||||
|
MANAGED HEALTH CARE — 2.12%
|
||||||||
|
WellCare Health Plans, Inc. (a)(e)
|
204,874
|
67,651,443
|
||||||
|
MOVIES & ENTERTAINMENT — 1.55%
|
||||||||
|
Akazoo S.A. (a)(b)(k)
|
47,770
|
251,748
|
||||||
|
The Madison Square Garden
|
||||||||
|
Company Class A (a)(j)
|
166,800
|
49,070,892
|
||||||
|
49,322,640
|
||||||||
|
OIL & GAS REFINING
|
||||||||
|
& MARKETING — 1.54%
|
||||||||
|
Marathon Petroleum Corporation (j)
|
816,500
|
49,194,125
|
||||||
|
OIL & GAS STORAGE
|
||||||||
|
& TRANSPORTATION — 1.42%
|
||||||||
|
Tallgrass Energy LP Class A
|
2,048,698
|
45,317,200
|
||||||
|
PHARMACEUTICALS — 5.17%
|
||||||||
|
Allergan plc (b)
|
863,686
|
165,110,853
|
||||||
|
REITs — 2.72%
|
||||||||
|
Broadmark Realty Capital, Inc. (k)
|
501,551
|
6,394,775
|
||||||
|
Liberty Property Trust
|
1,341,004
|
80,527,290
|
||||||
|
86,922,065
|
||||||||
|
SEMICONDUCTORS — 1.59%
|
||||||||
|
Mellanox Technologies Ltd. (a)(b)(e)
|
432,871
|
50,723,824
|
||||||
|
SEMICONDUCTORS &
|
||||||||
|
SEMICONDUCTOR EQUIPMENT — 3.08%
|
||||||||
|
Cypress Semiconductor Corporation (e)
|
4,217,278
|
98,389,096
|
||||||
The accompanying notes are an integral part of these financial statements.
25
The Merger Fund
SCHEDULE OF INVESTMENTS (continued)
December 31, 2019
|
Shares
|
Value
|
|||||||
|
SPECIALTY STORES — 2.76%
|
||||||||
|
Tiffany & Company (e)(j)(k)
|
660,038
|
$
|
88,214,079
|
|||||
|
TECHNOLOGY DISTRIBUTORS — 0.37%
|
||||||||
|
Anixter International, Inc. (a)
|
7,522
|
692,776
|
||||||
|
Tech Data Corporation (a)
|
77,357
|
11,108,465
|
||||||
|
11,801,241
|
||||||||
|
WIRELESS TELECOMMUNICATION
|
||||||||
|
SERVICES — 1.16%
|
||||||||
|
Sprint Corporation (a)(k)
|
342,725
|
1,785,597
|
||||||
|
T-Mobile USA, Inc. (a)(j)
|
450,629
|
35,338,326
|
||||||
|
37,123,923
|
||||||||
|
TOTAL COMMON STOCKS
|
||||||||
|
(Cost $1,420,082,805)
|
1,511,710,027
|
|||||||
|
SPECIAL PURPOSE ACQUISITION
|
||||||||
|
COMPANIES — 7.20% (a)
|
||||||||
|
Act II Global Acquisition
|
||||||||
|
Corporation Class A (b)
|
675,184
|
6,832,862
|
||||||
|
Alberton Acquisition Corporation (b)
|
541,885
|
5,608,510
|
||||||
|
Andina Acquisition Corporation III (b)
|
584,088
|
5,928,493
|
||||||
|
Apex Technology Acquisition
|
||||||||
|
Corporation Class A (f)
|
604,500
|
5,993,617
|
||||||
|
B. Riley Principal Merger
|
||||||||
|
Corporation Class A
|
74,287
|
743,613
|
||||||
|
CF Finance Acquisition
|
||||||||
|
Corporation Class A (f)
|
390,688
|
4,004,552
|
||||||
|
ChaSerg Technology Acquisition
|
||||||||
|
Corporation Class A
|
439,436
|
4,767,881
|
||||||
|
Churchill Capital Corporation II Class A
|
302,610
|
3,124,872
|
||||||
|
CIIG Merger Corporation (k)
|
315,662
|
3,207,126
|
||||||
|
Collier Creek Holdings Class A (b)(f)
|
195,000
|
2,006,550
|
||||||
|
Fellazo, Inc. (b)(k)
|
187,945
|
1,871,594
|
||||||
|
FinTech Acquisition
|
||||||||
|
Corporation III Class A
|
328,770
|
3,327,152
|
||||||
|
Forum Merger II Corporation Class A
|
334,654
|
3,416,817
|
||||||
|
Galileo Acquisition Corporation (b)(f)
|
112,274
|
1,153,615
|
||||||
|
Gordon Pointe Acquisition Corporation
|
424,801
|
4,498,643
|
||||||
|
Graf Industrial Corporation
|
1,034,606
|
10,542,635
|
||||||
|
Haymaker Acquisition
|
||||||||
|
Corporation II Class A
|
893,499
|
8,980,558
|
||||||
|
Hennessy Capital Acquisition
|
||||||||
|
Corporation IV Class A
|
175,540
|
1,783,486
|
||||||
The accompanying notes are an integral part of these financial statements.
26
The Merger Fund
SCHEDULE OF INVESTMENTS (continued)
December 31, 2019
|
Shares
|
Value
|
|||||||
|
Juniper Industrial Holdings, Inc. (f)
|
817,774
|
$
|
8,353,561
|
|||||
|
Legacy Acquisition Corporation Class A
|
1,293,025
|
13,279,367
|
||||||
|
Leisure Acquisition Corporation
|
578,466
|
6,027,616
|
||||||
|
Leo Holdings Corporation Class A (b)(f)
|
985,877
|
10,203,827
|
||||||
|
LF Capital Acquisition
|
||||||||
|
Corporation Class A (f)
|
89,230
|
922,638
|
||||||
|
LGL Systems Acquisition Corporation
|
15,818
|
161,344
|
||||||
|
Longevity Acquisition Corporation (b)(f)
|
262,500
|
2,743,125
|
||||||
|
Megalith Financial Acquisition
|
||||||||
|
Corporation Class A
|
260,768
|
2,675,480
|
||||||
|
Merida Merger Corporation I
|
240,205
|
2,339,597
|
||||||
|
Monocle Acquisition Corporation
|
204,085
|
2,077,585
|
||||||
|
Mosaic Acquisition Corporation Class A
|
1,040,046
|
10,696,873
|
||||||
|
Mudrick Capital Acquisition
|
||||||||
|
Corporation Class A (f)
|
428,413
|
4,423,364
|
||||||
|
Nebula Acquisition Corporation Class A
|
701,282
|
7,391,512
|
||||||
|
New Providence Acquisition
|
||||||||
|
Corporation Class A (f)
|
454,276
|
4,485,976
|
||||||
|
Opes Acquisition Corporation (f)
|
614,585
|
6,468,507
|
||||||
|
Orisun Acquisition Corporation
|
113,258
|
1,126,917
|
||||||
|
Pivotal Investment Corporation II Class A
|
121,848
|
1,211,169
|
||||||
|
PropTech Acquisition Corporation (f)
|
183,000
|
1,892,220
|
||||||
|
Pure Acquisition Corporation
|
1,413,170
|
14,654,573
|
||||||
|
Software Acquisition Group, Inc.
|
567,175
|
5,762,498
|
||||||
|
Spartan Energy Acquisition
|
||||||||
|
Corporation Class A
|
659,936
|
6,710,229
|
||||||
|
Thunder Bridge
|
||||||||
|
Acquisition II Ltd. Class A (b)
|
516,986
|
5,144,011
|
||||||
|
Tiberius Acquisition Corporation (f)(k)
|
311,172
|
3,259,527
|
||||||
|
TKK Symphony Acquisition
|
||||||||
|
Corporation (b)
|
728,623
|
7,461,100
|
||||||
|
Trident Acquisitions Corporation (f)
|
654,925
|
6,902,910
|
||||||
|
Tuscan Holdings Corporation (e)
|
610,840
|
6,083,966
|
||||||
|
Tuscan Holdings Corporation II
|
331,070
|
3,264,350
|
||||||
|
VectoIQ Acquisition Corporation
|
620,727
|
6,405,841
|
||||||
|
TOTAL SPECIAL PURPOSE ACQUISITION
|
||||||||
|
COMPANIES (Cost $220,853,098)
|
229,922,259
|
|||||||
|
PREFERRED STOCKS — 0.08%
|
||||||||
|
Colony Capital, Inc., 8.750%, Series E
|
97,704
|
2,471,911
|
||||||
|
TOTAL PREFERRED STOCKS
|
||||||||
|
(Cost $2,452,748)
|
2,471,911
|
|||||||
The accompanying notes are an integral part of these financial statements.
27
The Merger Fund
SCHEDULE OF INVESTMENTS (continued)
December 31, 2019
|
Shares
|
Value
|
|||||||
|
CONTINGENT VALUE RIGHTS — 0.07% (a)(f)
|
||||||||
|
Alder Biopharmaceuticals, Inc.
|
2,217,560
|
$
|
2,078,962
|
|||||
|
Media General, Inc. (e)
|
891,153
|
44,558
|
||||||
|
TOTAL CONTINGENT VALUE RIGHTS
|
||||||||
|
(Cost $0)
|
2,123,520
|
|||||||
|
WARRANTS — 0.17% (a)
|
||||||||
|
Act II Global Acquisition
|
||||||||
|
Corporation Class A
|
||||||||
|
Expiration: April 2024,
|
||||||||
|
Exercise Price: $11.50 (b)
|
337,592
|
337,592
|
||||||
|
Akazoo S.A.
|
||||||||
|
Expiration: December 2024,
|
||||||||
|
Exercise Price: $11.50 (b)
|
238,850
|
119,425
|
||||||
|
Apex Technology Acquisition
|
||||||||
|
Corporation Class A
|
||||||||
|
Expiration: September 2026,
|
||||||||
|
Exercise Price: $11.50
|
302,250
|
347,588
|
||||||
|
CF Finance Acquisition Corporation Class A
|
||||||||
|
Expiration: April 2025,
|
||||||||
|
Exercise Price: $11.50 (f)
|
293,016
|
259,319
|
||||||
|
ChaSerg Technology Acquisition
|
||||||||
|
Corporation Class A
|
||||||||
|
Expiration: September 2023,
|
||||||||
|
Exercise Price: $11.50
|
219,718
|
483,380
|
||||||
|
Churchill Capital Corporation II Class A
|
||||||||
|
Expiration: July 2024,
|
||||||||
|
Exercise Price: $11.50
|
100,870
|
143,558
|
||||||
|
Collier Creek Holdings Class A
|
||||||||
|
Expiration: November 2023,
|
||||||||
|
Exercise Price: $11.50 (b)(f)
|
65,000
|
89,050
|
||||||
|
FinTech Acquisition Corporation III Class A
|
||||||||
|
Expiration: December 2023,
|
||||||||
|
Exercise Price: $11.50
|
164,385
|
225,799
|
||||||
|
Graf Industrial Corporation
|
||||||||
|
Expiration: December 2025,
|
||||||||
|
Exercise Price: $11.50
|
434,606
|
190,357
|
||||||
|
Haymaker Acquisition
|
||||||||
|
Corporation II Class A
|
||||||||
|
Expiration: October 2026,
|
||||||||
|
Exercise Price: $11.50
|
297,833
|
419,945
|
||||||
The accompanying notes are an integral part of these financial statements.
28
The Merger Fund
SCHEDULE OF INVESTMENTS (continued)
December 31, 2019
|
Shares
|
Value
|
|||||||
|
Hennessy Capital Acquisition
|
||||||||
|
Corporation IV Class A
|
||||||||
|
Expiration: September 2025,
|
||||||||
|
Exercise Price: $11.50
|
131,655
|
$
|
105,324
|
|||||
|
Merida Merger Corporation I
|
||||||||
|
Expiration: November 2026,
|
||||||||
|
Exercise Price: $11.50
|
120,103
|
59,883
|
||||||
|
Monocle Acquisition Corporation
|
||||||||
|
Expiration: June 2024,
|
||||||||
|
Exercise Price: $11.50
|
204,085
|
153,064
|
||||||
|
Mudrick Capital Acquisition
|
||||||||
|
Corporation Class A
|
||||||||
|
Expiration: March 2025,
|
||||||||
|
Exercise Price: $11.50
|
428,413
|
209,922
|
||||||
|
New Providence Acquisition
|
||||||||
|
Corporation Class A
|
||||||||
|
Expiration: September 2024,
|
||||||||
|
Exercise Price: $11.50 (f)
|
227,138
|
193,067
|
||||||
|
Pivotal Acquisition Corporation
|
||||||||
|
Expiration: December 2025,
|
||||||||
|
Exercise Price: $11.50 (f)
|
677,651
|
406,591
|
||||||
|
Pivotal Investment Corporation II Class A
|
||||||||
|
Expiration: June 2025,
|
||||||||
|
Exercise Price: $11.50 (f)
|
40,616
|
32,493
|
||||||
|
Pure Acquisition Corporation
|
||||||||
|
Expiration: April 2023,
|
||||||||
|
Exercise Price: $11.50
|
342,226
|
337,435
|
||||||
|
Repay Holdings Corporation
|
||||||||
|
Expiration: July 2024,
|
||||||||
|
Exercise Price: $11.50
|
338,801
|
379,457
|
||||||
|
Thunder Bridge Acquisition II Ltd. Class A
|
||||||||
|
Expiration: November 2026,
|
||||||||
|
Exercise Price: $11.50 (b)
|
258,496
|
232,646
|
||||||
|
Tiberius Acquisition Corporation
|
||||||||
|
Expiration: April 2023,
|
||||||||
|
Exercise Price: $11.50
|
311,172
|
354,736
|
||||||
|
Tuscan Holdings Corporation
|
||||||||
|
Expiration: April 2026,
|
||||||||
|
Exercise Price: $11.50 (f)
|
610,840
|
351,233
|
||||||
|
Tuscan Holdings Corporation II
|
||||||||
|
Expiration: July 2025,
|
||||||||
|
Exercise Price: $11.50 (f)
|
165,535
|
74,491
|
||||||
|
TOTAL WARRANTS (Cost $4,572,599)
|
5,506,355
|
|||||||
The accompanying notes are an integral part of these financial statements.
29
The Merger Fund
SCHEDULE OF INVESTMENTS (continued)
December 31, 2019
|
Principal
|
||||||||
|
Amount
|
Value
|
|||||||
|
BANK LOANS — 2.96% (f)(i)
|
||||||||
|
Avaya Holdings Corporation
|
||||||||
|
5.990% (1 Month U.S.
|
||||||||
|
LIBOR + 4.250%), 12/16/2024
|
$
|
16,332,815
|
$
|
16,074,267
|
||||
|
Cengage Learning Holdings II, Inc.
|
||||||||
|
6.049% (1 Month U.S.
|
||||||||
|
LIBOR + 4.250%), 6/7/2023
|
10,841,633
|
10,353,759
|
||||||
|
McGraw-Hill Global
|
||||||||
|
Education Holdings LLC
|
||||||||
|
5.799% (1 Month U.S.
|
||||||||
|
LIBOR + 4.000%), 5/4/2022
|
11,596,736
|
11,147,363
|
||||||
|
Refinitiv U.S. Holdings, Inc.
|
||||||||
|
5.049% (1 Month U.S.
|
||||||||
|
LIBOR + 3.250%), 10/1/2025
|
30,141,271
|
30,412,091
|
||||||
|
Zayo Group LLC
|
||||||||
|
3.799% (1 Month U.S.
|
||||||||
|
LIBOR + 2.000%), 1/19/2021
|
26,191,104
|
26,322,190
|
||||||
|
TOTAL BANK LOANS (Cost $94,612,558)
|
94,309,670
|
|||||||
|
CORPORATE BONDS — 4.89% (f)
|
||||||||
|
Arconic, Inc.
|
||||||||
|
5.400%, 4/15/2021 (k)
|
7,553,000
|
7,789,301
|
||||||
|
CEC Entertainment, Inc.
|
||||||||
|
8.000%, 2/15/2022 (k)
|
11,217,000
|
11,080,287
|
||||||
|
Cincinnati Bell, Inc.
|
||||||||
|
7.000%, 7/15/2024 (h)
|
824,000
|
866,222
|
||||||
|
EIG Investors Corporation
|
||||||||
|
10.875%, 2/1/2024
|
8,231,000
|
8,234,416
|
||||||
|
Kinetic Concepts, Inc. / KCI USA, Inc.
|
||||||||
|
12.500%, 11/1/2021 (h)
|
15,253,000
|
15,735,757
|
||||||
|
Nationstar Mortgage LLC /
|
||||||||
|
Nationstar Capital Corporation
|
||||||||
|
6.500%, 7/1/2021 (k)
|
2,438,000
|
2,451,165
|
||||||
|
6.500%, 6/1/2022
|
1,939,000
|
1,943,936
|
||||||
|
Nielsen Finance LLC /
|
||||||||
|
Nielsen Finance Company
|
||||||||
|
5.000%, 4/15/2022 (h)
|
12,171,000
|
12,238,306
|
||||||
|
Refinitiv U.S. Holdings, Inc.
|
||||||||
|
8.250%, 11/15/2026 (h)(k)
|
26,960,000
|
30,413,576
|
||||||
|
SRC Energy, Inc.
|
||||||||
|
6.250%, 12/1/2025 (k)
|
10,218,000
|
10,320,078
|
||||||
The accompanying notes are an integral part of these financial statements.
30
The Merger Fund
SCHEDULE OF INVESTMENTS (continued)
December 31, 2019
|
Principal
|
||||||||||||
|
Amount
|
Value
|
|||||||||||
|
T-Mobile USA, Inc.
|
||||||||||||
|
6.500%, 1/15/2024
|
$
|
9,842,000
|
$
|
10,149,661
|
||||||||
|
6.375%, 3/1/2025
|
3,180,000
|
3,292,620
|
||||||||||
|
Vertiv Group Corporation
|
||||||||||||
|
9.250%, 10/15/2024 (h)
|
3,422,000
|
3,685,785
|
||||||||||
|
Vistra Energy Corporation
|
||||||||||||
|
5.875%, 6/1/2023
|
15,354,000
|
15,745,987
|
||||||||||
|
Zayo Group LLC / Zayo Capital, Inc.
|
||||||||||||
|
5.750%, 1/15/2027 (h)
|
21,763,000
|
22,178,619
|
||||||||||
|
TOTAL CORPORATE BONDS
|
||||||||||||
|
(Cost $156,670,936)
|
156,125,716
|
|||||||||||
|
Contracts
|
||||||||||||
|
(100 shares
|
Notional
|
|||||||||||
|
per contract)
|
Amount
|
|||||||||||
|
PURCHASED PUT OPTIONS — 0.08% (a)
|
||||||||||||
|
DuPont de Nemours, Inc.
|
||||||||||||
|
Expiration: April 2020,
|
||||||||||||
|
Exercise Price: $55.00
|
1,557
|
$
|
9,995,940
|
146,358
|
||||||||
|
IAC/InterActiveCorp
|
||||||||||||
|
Expiration: January 2020,
|
||||||||||||
|
Exercise Price: $175.00
|
2,803
|
69,825,533
|
21,022
|
|||||||||
|
The Madison Square Garden
|
||||||||||||
|
Company Class A
|
||||||||||||
|
Expiration: February 2020,
|
||||||||||||
|
Exercise Price: $230.00
|
1,668
|
49,070,892
|
66,720
|
|||||||||
|
Marathon Petroleum Corporation
|
||||||||||||
|
Expiration: January 2020,
|
||||||||||||
|
Exercise Price: $47.50
|
1,041
|
6,272,025
|
4,164
|
|||||||||
|
Expiration: January 2020,
|
||||||||||||
|
Exercise Price: $50.00
|
1,250
|
7,531,250
|
8,750
|
|||||||||
|
Expiration: January 2020,
|
||||||||||||
|
Exercise Price: $52.50
|
1,389
|
8,368,725
|
19,446
|
|||||||||
|
Expiration: January 2020,
|
||||||||||||
|
Exercise Price: $55.50
|
4,485
|
27,022,125
|
352,072
|
|||||||||
|
Masco Corporation
|
||||||||||||
|
Expiration: April 2020,
|
||||||||||||
|
Exercise Price: $41.00
|
6,898
|
33,103,502
|
379,390
|
|||||||||
|
Ra Pharmaceuticals, Inc.
|
||||||||||||
|
Expiration: April 2020,
|
||||||||||||
|
Exercise Price: $40.00
|
58
|
272,194
|
2,030
|
|||||||||
The accompanying notes are an integral part of these financial statements.
31
The Merger Fund
SCHEDULE OF INVESTMENTS (continued)
December 31, 2019
|
Contracts
|
||||||||||||
|
(100 shares
|
Notional
|
|||||||||||
|
per contract)
|
Amount
|
Value
|
||||||||||
|
Raytheon Company
|
||||||||||||
|
Expiration: January 2020,
|
||||||||||||
|
Exercise Price: $175.00
|
1,458
|
$
|
32,038,092
|
$
|
13,122
|
|||||||
|
SPDR S&P 500 ETF Trust
|
||||||||||||
|
Expiration: January 2020,
|
||||||||||||
|
Exercise Price: $316.00
|
2,093
|
67,365,298
|
277,323
|
|||||||||
|
Expiration: February 2020,
|
||||||||||||
|
Exercise Price: $320.00
|
837
|
26,939,682
|
390,879
|
|||||||||
|
T-Mobile USA, Inc.
|
||||||||||||
|
Expiration: January 2020,
|
||||||||||||
|
Exercise Price: $70.00
|
3,956
|
31,022,952
|
31,648
|
|||||||||
|
United Technologies Corporation
|
||||||||||||
|
Expiration: January 2020,
|
||||||||||||
|
Exercise Price: $110.00
|
2,458
|
36,811,008
|
17,206
|
|||||||||
|
VanEck Vectors Semiconductor ETF
|
||||||||||||
|
Expiration: February 2020,
|
||||||||||||
|
Exercise Price: $140.00
|
1,157
|
16,361,137
|
468,585
|
|||||||||
|
ViacomCBS, Inc. Class B
|
||||||||||||
|
Expiration: March 2020,
|
||||||||||||
|
Exercise Price: $35.00
|
7,658
|
32,140,626
|
291,004
|
|||||||||
|
TOTAL PURCHASED PUT OPTIONS
|
||||||||||||
|
(Cost $4,943,501)
|
2,489,719
|
|||||||||||
|
Shares
|
||||||||||||
|
ESCROW NOTES — 3.91% (a)
|
||||||||||||
|
Altaba, Inc. (f)
|
6,012,284
|
124,504,361
|
||||||||||
|
AMR Corporation (d)(g)
|
1,243,406
|
285,983
|
||||||||||
|
Sentinel Energy Services, Inc. Class B (f)
|
1,689,936
|
9,295
|
||||||||||
|
T-Mobile USA, Inc. (d)(g)
|
7,594,000
|
—
|
||||||||||
|
TOTAL ESCROW NOTES
|
||||||||||||
|
(Cost $67,047,988)
|
124,799,639
|
|||||||||||
|
SHORT-TERM INVESTMENTS — 34.89%
|
||||||||||||
|
MONEY MARKET FUNDS — 29.89% (c)
|
||||||||||||
|
Fidelity Institutional Government Portfolio,
|
||||||||||||
|
Institutional Share Class, 1.49%
|
142,776
|
142,776
|
||||||||||
|
First American Government Obligations
|
||||||||||||
|
Fund, Institutional Share Class, 1.47%
|
155,777,000
|
155,777,000
|
||||||||||
The accompanying notes are an integral part of these financial statements.
32
The Merger Fund
SCHEDULE OF INVESTMENTS (continued)
December 31, 2019
|
Shares
|
Value
|
|||||||
|
Goldman Sachs Government Fund,
|
||||||||
|
Institutional Share Class, 1.48%
|
19,530,815
|
$
|
19,530,815
|
|||||
|
The Government & Agency Portfolio,
|
||||||||
|
Institutional Share Class, 1.50%
|
155,777,000
|
155,777,000
|
||||||
|
JPMorgan Prime Money Market Fund,
|
||||||||
|
Institutional Share Class, 1.75%
|
155,730,910
|
155,768,080
|
||||||
|
JPMorgan U.S. Government Money Market
|
||||||||
|
Fund, Institutional Share Class, 1.51%
|
155,777,000
|
155,777,000
|
||||||
|
Morgan Stanley Institutional Liquidity
|
||||||||
|
Fund — Government Portfolio,
|
||||||||
|
Institutional Share Class, 1.51%
|
155,777,000
|
155,777,000
|
||||||
|
Morgan Stanley Institutional Liquidity
|
||||||||
|
Fund — Treasury Portfolio,
|
||||||||
|
Institutional Share Class, 1.50%
|
155,777,000
|
155,777,000
|
||||||
|
954,326,671
|
||||||||
|
Principal
|
||||||||
|
Amount
|
||||||||
|
U.S. TREASURY BILLS — 5.00% (e)(f)(l)
|
||||||||
|
United States Treasury Bills
|
||||||||
|
1.85%, 1/30/2020
|
$
|
860,000
|
859,030
|
|||||
|
1.78%, 2/13/2020
|
825,000
|
823,573
|
||||||
|
1.83%, 3/19/2020
|
4,617,000
|
4,602,418
|
||||||
|
1.75%, 3/26/2020
|
16,375,000
|
16,317,582
|
||||||
|
1.62%, 4/2/2020
|
2,150,000
|
2,141,739
|
||||||
|
1.58%, 4/9/2020
|
6,025,000
|
6,000,066
|
||||||
|
1.55%, 4/16/2020
|
5,590,000
|
5,565,337
|
||||||
|
1.53%, 4/23/2020
|
16,739,000
|
16,659,439
|
||||||
|
1.47%, 4/30/2020
|
6,721,000
|
6,687,197
|
||||||
|
1.49%, 5/7/2020
|
37,750,000
|
37,549,335
|
||||||
|
1.49%, 5/14/2020
|
7,578,000
|
7,535,368
|
||||||
|
1.50%, 5/21/2020
|
30,440,000
|
30,259,918
|
||||||
|
1.51%, 5/28/2020
|
6,820,000
|
6,777,385
|
||||||
|
1.47%, 6/4/2020
|
11,110,000
|
11,037,214
|
||||||
|
1.48%, 6/11/2020
|
585,000
|
580,994
|
||||||
|
1.48%, 6/18/2020
|
1,300,000
|
1,290,687
|
||||||
|
1.50%, 6/25/2020
|
4,989,000
|
4,951,870
|
||||||
|
159,639,152
|
||||||||
|
TOTAL SHORT-TERM INVESTMENTS
|
||||||||
|
(Cost $1,113,962,477)
|
1,113,965,823
|
|||||||
|
TOTAL LONG INVESTMENTS
|
||||||||
|
(Cost $3,085,198,710) — 101.61%
|
3,243,424,639
|
|||||||
The accompanying notes are an integral part of these financial statements.
33
The Merger Fund
SCHEDULE OF INVESTMENTS (continued)
December 31, 2019
|
Shares
|
Value
|
|||||||
|
INVESTMENT OF CASH COLLATERAL
|
||||||||
|
FROM SECURITIES LOANED — 3.28%
|
||||||||
|
SHORT-TERM FUND — 3.28% (c)
|
||||||||
|
Mount Vernon Liquid Asset
|
||||||||
|
Portfolio LLC, 1.80%
|
104,867,573
|
$
|
104,867,573
|
|||||
|
TOTAL SHORT-TERM FUND —
|
||||||||
|
(Cost $104,867,573)
|
104,867,573
|
|||||||
|
TOTAL INVESTMENT OF CASH COLLATERAL
|
||||||||
|
FROM SECURITIES LOANED —
|
||||||||
|
(Cost $104,867,573) — 3.28%
|
104,867,573
|
|||||||
|
SHORT INVESTMENTS — (0.38)%
|
||||||||
|
COMMON STOCKS — (0.38)%
|
||||||||
|
AIRLINES — (0.01)%
|
||||||||
|
American Airlines Group, Inc.
|
(11,395
|
)
|
(326,809
|
)
|
||||
|
BROADCASTING — (0.00)%
|
||||||||
|
Fox Corporation Class A
|
(1,900
|
)
|
(70,433
|
)
|
||||
|
CASINOS & GAMING — (0.03)%
|
||||||||
|
Eldorado Resorts, Inc.
|
(16,474
|
)
|
(982,509
|
)
|
||||
|
MANAGED HEALTH CARE — (0.26)%
|
||||||||
|
Centene Corporation
|
(131,699
|
)
|
(8,279,916
|
)
|
||||
|
PHARMACEUTICALS — (0.08)%
|
||||||||
|
AbbVie, Inc.
|
(27,196
|
)
|
(2,407,934
|
)
|
||||
|
TOTAL COMMON STOCKS
|
||||||||
|
(Proceeds $10,789,323)
|
(12,067,601
|
)
|
||||||
|
TOTAL SHORT INVESTMENTS
|
||||||||
|
(Proceeds $10,789,323) — (0.38)%
|
(12,067,601
|
)
|
||||||
|
TOTAL NET INVESTMENTS
|
||||||||
|
(Cost $3,179,276,960) — 104.51%
|
3,336,224,611
|
|||||||
|
OTHER LIABILITIES IN EXCESS OF ASSETS — (4.51)%
|
(143,865,898
|
)
|
||||||
|
TOTAL NET ASSETS — 100.00%
|
$
|
3,192,358,713
|
||||||
ETF – Exchange-Traded Fund
LIBOR – London Interbank Offered Rate
plc – Public Limited Company
REITs – Real Estate Investment Trusts
|
(a)
|
Non-income producing security.
|
|
(b)
|
Foreign security.
|
|
(c)
|
The rate quoted is the annualized seven-day yield as of December 31, 2019.
|
|
(d)
|
Security fair valued by the Valuation Group in good faith in accordance with the policies adopted by the Board of Trustees.
|
The accompanying notes are an integral part of these financial statements.
34
The Merger Fund
SCHEDULE OF INVESTMENTS (continued)
December 31, 2019
|
(e)
|
All or a portion of the shares have been committed as collateral for open securities sold short, written option contracts, swap contracts, and forward currency exchange contracts.
|
|
(f)
|
Level 2 Security. Please see Note 2 in the Notes to the Financial Statements for more information.
|
|
(g)
|
Level 3 Security. Please see Note 2 in the Notes to the Financial Statements for more information.
|
|
(h)
|
Security exempt from registration under Rule 144A of the Securities Act of 1933. These securities may be resold in transactions exempt from registration normally to qualified institutional buyers. As of December 31, 2019, these securities
represent 2.67% of total net assets.
|
|
(i)
|
The coupon rate shown on variable rate securities represents the rate as of December 31, 2019.
|
|
(j)
|
This security is held in connection with a written option contract.
|
|
(k)
|
All or a portion of the shares was out on loan at December 31, 2019. Total loaned securities had a value of $101,702,188 at December 31, 2019.
|
|
(l)
|
The rate shown represents yield to maturity.
|
The Global Industry Classification Standard (GICS®) was developed by and/or is the exclusive property of MSCI, Inc. and Standard & Poor’s Financial Services LLC
(“S&P”). GICS is a service mark of MSCI and S&P and has been licensed for use by Fund Services.
The accompanying notes are an integral part of these financial statements.
35
The Merger Fund
SCHEDULE OF INVESTMENTS (continued)
Open Written Options
December 31, 2019
|
Contracts
|
||||||||||||
|
(100 shares
|
Notional
|
|||||||||||
|
per contract)
|
Amount
|
Value
|
||||||||||
|
WRITTEN CALL OPTIONS
|
||||||||||||
|
ArQule, Inc.
|
||||||||||||
|
Expiration: January 2020,
|
||||||||||||
|
Exercise Price: $20.00
|
(5,209
|
)
|
$
|
(10,397,164
|
)
|
$
|
(78,135
|
)
|
||||
|
Expiration: April 2020,
|
||||||||||||
|
Exercise Price: $20.00
|
(1,523
|
)
|
(3,039,908
|
)
|
(30,460
|
)
|
||||||
|
DuPont de Nemours, Inc.
|
||||||||||||
|
Expiration: April 2020,
|
||||||||||||
|
Exercise Price: $60.00
|
(1,557
|
)
|
(9,995,940
|
)
|
(973,125
|
)
|
||||||
|
Fitbit, Inc. Class A
|
||||||||||||
|
Expiration: January 2020,
|
||||||||||||
|
Exercise Price: $7.00
|
(4,783
|
)
|
(3,142,431
|
)
|
(19,132
|
)
|
||||||
|
Expiration: February 2020,
|
||||||||||||
|
Exercise Price: $7.00
|
(17,139
|
)
|
(11,260,323
|
)
|
(154,251
|
)
|
||||||
|
Expiration: May 2020,
|
||||||||||||
|
Exercise Price: $8.00
|
(330
|
)
|
(216,810
|
)
|
(1,650
|
)
|
||||||
|
Fox Corporation Class A
|
||||||||||||
|
Expiration: April 2020,
|
||||||||||||
|
Exercise Price: $35.00
|
(841
|
)
|
(3,117,587
|
)
|
(252,300
|
)
|
||||||
|
IAC/InterActiveCorp
|
||||||||||||
|
Expiration: January 2020,
|
||||||||||||
|
Exercise Price: $190.00
|
(1,441
|
)
|
(35,896,751
|
)
|
(8,537,925
|
)
|
||||||
|
Expiration: January 2020,
|
||||||||||||
|
Exercise Price: $195.00
|
(1,362
|
)
|
(33,928,782
|
)
|
(7,402,470
|
)
|
||||||
|
The Madison Square Garden
|
||||||||||||
|
Company Class A
|
||||||||||||
|
Expiration: February 2020,
|
||||||||||||
|
Exercise Price: $260.00
|
(1,668
|
)
|
(49,070,892
|
)
|
(6,021,480
|
)
|
||||||
|
Marathon Petroleum Corporation
|
||||||||||||
|
Expiration: January 2020,
|
||||||||||||
|
Exercise Price: $55.00
|
(1,250
|
)
|
(7,531,250
|
)
|
(693,750
|
)
|
||||||
|
Expiration: January 2020,
|
||||||||||||
|
Exercise Price: $57.50
|
(2,430
|
)
|
(14,640,750
|
)
|
(838,350
|
)
|
||||||
|
Expiration: January 2020,
|
||||||||||||
|
Exercise Price: $58.50
|
(4,485
|
)
|
(27,022,125
|
)
|
(1,547,325
|
)
|
||||||
|
Masco Corporation
|
||||||||||||
|
Expiration: April 2020,
|
||||||||||||
|
Exercise Price: $45.00
|
(6,898
|
)
|
(33,103,502
|
)
|
(3,035,120
|
)
|
||||||
The accompanying notes are an integral part of these financial statements.
36
The Merger Fund
SCHEDULE OF INVESTMENTS (continued)
Open Written Options
December 31, 2019
|
Contracts
|
||||||||||||
|
(100 shares
|
Notional
|
|||||||||||
|
per contract)
|
Amount
|
Value
|
||||||||||
|
The Medicines Company
|
||||||||||||
|
Expiration: March 2020,
|
||||||||||||
|
Exercise Price: $85.00
|
(373
|
)
|
$
|
(3,168,262
|
)
|
$
|
(1,865
|
)
|
||||
|
Qiagen N.V.
|
||||||||||||
|
Expiration: January 2020,
|
||||||||||||
|
Exercise Price: $33.00
|
(396
|
)
|
(1,338,480
|
)
|
(93,060
|
)
|
||||||
|
Expiration: January 2020,
|
||||||||||||
|
Exercise Price: $35.00
|
(396
|
)
|
(1,338,480
|
)
|
(59,400
|
)
|
||||||
|
Expiration: February 2020,
|
||||||||||||
|
Exercise Price: $32.00
|
(1,386
|
)
|
(4,684,680
|
)
|
(457,380
|
)
|
||||||
|
Raytheon Company
|
||||||||||||
|
Expiration: January 2020,
|
||||||||||||
|
Exercise Price: $195.00
|
(1,458
|
)
|
(32,038,092
|
)
|
(3,607,092
|
)
|
||||||
|
SPDR S&P 500 ETF Trust
|
||||||||||||
|
Expiration: January 2020,
|
||||||||||||
|
Exercise Price: $322.00
|
(1,256
|
)
|
(40,425,616
|
)
|
(423,272
|
)
|
||||||
|
Tiffany & Company
|
||||||||||||
|
Expiration: May 2020,
|
||||||||||||
|
Exercise Price: $135.00
|
(1
|
)
|
(13,365
|
)
|
(18
|
)
|
||||||
|
T-Mobile USA, Inc.
|
||||||||||||
|
Expiration: January 2020,
|
||||||||||||
|
Exercise Price: $75.00
|
(229
|
)
|
(1,795,818
|
)
|
(88,623
|
)
|
||||||
|
Expiration: January 2020,
|
||||||||||||
|
Exercise Price: $77.50
|
(3,727
|
)
|
(29,227,134
|
)
|
(696,949
|
)
|
||||||
|
United Technologies Corporation
|
||||||||||||
|
Expiration: January 2020,
|
||||||||||||
|
Exercise Price: $125.00
|
(2,308
|
)
|
(34,564,608
|
)
|
(5,718,070
|
)
|
||||||
|
ViacomCBS, Inc. Class B
|
||||||||||||
|
Expiration: March 2020,
|
||||||||||||
|
Exercise Price: $40.00
|
(7,658
|
)
|
(32,140,626
|
)
|
(2,565,430
|
)
|
||||||
|
Wright Medical Group N.V.
|
||||||||||||
|
Expiration: January 2020,
|
||||||||||||
|
Exercise Price: $32.50
|
(493
|
)
|
(1,502,664
|
)
|
(7,395
|
)
|
||||||
|
Expiration: February 2020,
|
||||||||||||
|
Exercise Price: $32.50
|
(71
|
)
|
(216,408
|
)
|
(2,130
|
)
|
||||||
|
(43,306,157
|
)
|
|||||||||||
The accompanying notes are an integral part of these financial statements.
37
The Merger Fund
SCHEDULE OF INVESTMENTS (continued)
Open Written Options
December 31, 2019
|
Contracts
|
||||||||||||
|
(100 shares
|
Notional
|
|||||||||||
|
per contract)
|
Amount
|
Value
|
||||||||||
|
WRITTEN PUT OPTIONS
|
||||||||||||
|
SPDR S&P 500 ETF Trust
|
||||||||||||
|
Expiration: January 2020,
|
||||||||||||
|
Exercise Price: $303.00
|
(2,093
|
)
|
$
|
(67,365,298
|
)
|
$
|
(86,859
|
)
|
||||
|
Expiration: February 2020,
|
||||||||||||
|
Exercise Price: $310.00
|
(837
|
)
|
(26,939,682
|
)
|
(220,131
|
)
|
||||||
|
VanEck Vectors Semiconductor ETF
|
||||||||||||
|
Expiration: February 2020,
|
||||||||||||
|
Exercise Price: $130.00
|
(1,157
|
)
|
(16,361,137
|
)
|
(180,492
|
)
|
||||||
|
(487,482
|
)
|
|||||||||||
|
TOTAL WRITTEN OPTIONS
|
||||||||||||
|
(Premiums received $34,445,568)
|
$
|
(43,793,639
|
)
|
|||||||||
ETF – Exchange-Traded Fund
The accompanying notes are an integral part of these financial statements.
38
The Merger Fund
SCHEDULE OF INVESTMENTS (continued)
Forward Currency Exchange Contracts
December 31, 2019
|
USD Value at
|
USD Value at
|
Unrealized
|
||||||||||||||||||||||
|
Settlement
|
Currency to
|
December 31,
|
Currency to
|
December 31,
|
Appreciation
|
|||||||||||||||||||
|
Date
|
Counterparty
|
be Delivered
|
2019
|
be Received
|
2019
|
(Depreciation)*
|
||||||||||||||||||
|
1/15/20
|
GS
|
1,978,414
|
EUR
|
$
|
2,221,305
|
2,214,147
|
USD
|
$
|
2,214,147
|
$
|
(7,158
|
)
|
||||||||||||
|
1/15/20
|
JPM
|
141,199,621
|
EUR
|
158,534,740
|
157,273,927
|
USD
|
157,273,927
|
(1,260,813
|
)
|
|||||||||||||||
|
1/15/20
|
JPM
|
26,984,546
|
USD
|
26,984,546
|
24,470,666
|
EUR
|
27,474,937
|
490,391
|
||||||||||||||||
|
1/22/20
|
JPM
|
6,306,308
|
EUR
|
7,083,742
|
6,985,462
|
USD
|
6,985,462
|
(98,280
|
)
|
|||||||||||||||
|
4/22/20
|
JPM
|
15,931,552
|
EUR
|
17,998,145
|
17,914,270
|
USD
|
17,914,270
|
(83,875
|
)
|
|||||||||||||||
|
5/20/20
|
JPM
|
6,221,932
|
EUR
|
7,041,297
|
6,972,801
|
USD
|
6,972,801
|
(68,496
|
)
|
|||||||||||||||
|
2/6/20
|
JPM
|
8,078,469
|
GBP
|
10,712,220
|
10,043,544
|
USD
|
10,043,544
|
(668,676
|
)
|
|||||||||||||||
|
3/4/20
|
JPM
|
70,147,464
|
GBP
|
93,081,712
|
92,303,988
|
USD
|
92,303,988
|
(777,724
|
)
|
|||||||||||||||
|
1/16/20
|
JPM
|
77,746,005
|
HKD
|
9,975,239
|
9,914,740
|
USD
|
9,914,740
|
(60,499
|
)
|
|||||||||||||||
|
1/16/20
|
JPM
|
9,912,283
|
USD
|
9,912,283
|
77,746,005
|
HKD
|
9,975,239
|
62,956
|
||||||||||||||||
|
3/17/20
|
JPM
|
1,703,940
|
HKD
|
218,536
|
217,507
|
USD
|
217,507
|
(1,029
|
)
|
|||||||||||||||
|
2/4/20
|
JPM
|
1,246,465,000
|
JPY
|
11,494,502
|
11,491,987
|
USD
|
11,491,987
|
(2,515
|
)
|
|||||||||||||||
|
2/26/20
|
JPM
|
1,777,427,843
|
JPY
|
16,411,342
|
16,461,950
|
USD
|
16,461,950
|
50,608
|
||||||||||||||||
|
3/3/20
|
JPM
|
1,497,064,200
|
JPY
|
13,827,488
|
13,754,401
|
USD
|
13,754,401
|
(73,087
|
)
|
|||||||||||||||
|
$
|
385,497,097
|
$
|
382,998,900
|
$
|
(2,498,197
|
)
|
||||||||||||||||||
EUR – Euro
GBP – British Pound
GS – Goldman, Sachs & Co.
HKD – Hong Kong Dollar
JPM – JPMorgan Chase & Co., Inc.
JPY – Japanese Yen
USD – U.S. Dollar
|
*
|
Net unrealized appreciation (depreciation) is a receivable (payable).
|
The accompanying notes are an integral part of these financial statements.
39
The Merger Fund
SCHEDULE OF INVESTMENTS (continued)
Open Swap Contracts
December 31, 2019
|
Pay/Receive
|
Unrealized
|
|||||||||||||||
|
Counter-
|
Termination
|
on Financing
|
Payment
|
Notional
|
Appreciation
|
|||||||||||
|
party
|
Security
|
Date
|
Rate
|
Financing Rate
|
Frequency
|
Shares
|
Amount
|
(Depreciation)*
|
||||||||
|
LONG TOTAL RETURN SWAP CONTRACTS
|
||||||||||||||||
|
JPM
|
Altran Technologies S.A.
|
6/25/20
|
Pay
|
0.400% + 3 Month U.S. LIBOR
|
Quarterly
|
1,137,968
|
$
|
18,118,173
|
$
|
(61,907
|
)
|
|||||
|
BAML
|
Avon Products, Inc.
|
8/26/20
|
Pay
|
0.750% + 1 Month U.S. LIBOR
|
Monthly
|
3,824,286
|
16,563,689
|
5,224,206
|
||||||||
|
GS
|
Avon Products, Inc.
|
9/17/20
|
Pay
|
0.500% + 1 Month U.S. LIBOR
|
Monthly
|
1,925,894
|
8,184,067
|
2,787,737
|
||||||||
|
GS
|
Bolsas y Mercados
|
|||||||||||||||
|
Espanoles
|
11/19/20
|
Pay
|
0.500% + 1 Month U.S. LIBOR
|
Monthly
|
157,920
|
6,208,459
|
(122,691
|
)
|
||||||||
|
JPM
|
Bolsas y Mercados
|
|||||||||||||||
|
Espanoles
|
12/20/20
|
Pay
|
0.400% + 3 Month U.S. LIBOR
|
Quarterly
|
25,078
|
969,488
|
(2,501
|
)
|
||||||||
|
BAML
|
Bristol-Myers Squibb
|
|||||||||||||||
|
Company
|
11/21/20
|
Pay
|
0.000%(1)
|
Monthly
|
361,933
|
—
|
(1)
|
1,089,418
|
||||||||
|
JPM
|
China Agri-Industries
|
|||||||||||||||
|
Holdings, Ltd.
|
12/10/20
|
Pay
|
0.400% + 3 Month U.S. LIBOR
|
Quarterly
|
400,927
|
211,072
|
1,208
|
|||||||||
|
JPM
|
Cobham plc
|
9/10/20
|
Pay
|
0.300% + 3 Month U.S. LIBOR
|
Quarterly
|
38,722,696
|
77,177,973
|
6,994,937
|
||||||||
|
BAML
|
Cobham plc
|
12/11/20
|
Pay
|
0.750% + 1 Month U.S. LIBOR
|
Monthly
|
3,790,918
|
7,880,617
|
366,648
|
||||||||
|
BAML
|
EI Group plc
|
9/27/20
|
Pay
|
0.450% + 1 Month U.S. LIBOR
|
Monthly
|
2,834,550
|
9,859,093
|
791,127
|
||||||||
|
BAML
|
Faurecia S.E.
|
11/14/20
|
Pay
|
0.350% + 1 Month U.S. LIBOR
|
Monthly
|
34,152
|
1,772,793
|
66,212
|
||||||||
|
BAML
|
Fiat Chrysler
|
|||||||||||||||
|
Automobiles N.V.
|
11/15/20
|
Pay
|
0.350% + 1 Month U.S. LIBOR
|
Monthly
|
841,359
|
13,178,529
|
(733,671
|
)
|
||||||||
|
JPM
|
Hitachi Chemical
|
|||||||||||||||
|
Company, Ltd.
|
10/24/20
|
Pay
|
0.400% + 3 Month U.S. LIBOR
|
Quarterly
|
144,985
|
6,097,061
|
7,641
|
|||||||||
|
BAML
|
Hitachi Chemical
|
|||||||||||||||
|
Company, Ltd.
|
12/23/20
|
Pay
|
0.500% + 1 Month U.S. LIBOR
|
Monthly
|
178,355
|
7,463,160
|
45,149
|
|||||||||
|
JPM
|
Innogy S.E.
|
6/6/20
|
Pay
|
0.400% + 3 Month U.S. LIBOR
|
Quarterly
|
165,433
|
7,858,324
|
409,955
|
||||||||
|
JPM
|
Line Corporation
|
11/20/20
|
Pay
|
0.400% + 3 Month U.S. LIBOR
|
Quarterly
|
335,661
|
15,949,955
|
561,201
|
||||||||
|
JPM
|
Osram Licht AG
|
12/6/20
|
Pay
|
0.400% + 3 Month U.S. LIBOR
|
Quarterly
|
2,461,222
|
108,069,203
|
3,797,884
|
||||||||
|
BAML
|
Osram Licht AG
|
12/16/20
|
Pay
|
0.350% + 1 Month U.S. LIBOR
|
Monthly
|
76,365
|
3,455,413
|
16,414
|
||||||||
The accompanying notes are an integral part of these financial statements.
40
The Merger Fund
SCHEDULE OF INVESTMENTS (continued)
Open Swap Contracts
December 31, 2019
|
Pay/Receive
|
Unrealized
|
|||||||||||||||
|
Counter-
|
Termination
|
on Financing
|
Payment
|
Notional
|
Appreciation
|
|||||||||||
|
party
|
Security
|
Date
|
Rate
|
Financing Rate
|
Frequency
|
Shares
|
Amount
|
(Depreciation)*
|
||||||||
|
GS
|
Osram Licht AG
|
12/17/20
|
Pay
|
0.500% + 1 Month U.S. LIBOR
|
Monthly
|
356,329
|
$
|
16,132,237
|
$
|
66,412
|
||||||
|
BAML
|
Sophos Group plc
|
10/14/20
|
Pay
|
0.450% + 1 Month U.S. LIBOR
|
Monthly
|
9,972,324
|
72,849,383
|
534,061
|
||||||||
|
JPM
|
Unizo Holdings
|
|||||||||||||||
|
Company, Ltd.
|
11/8/20
|
Pay
|
0.400% + 3 Month U.S. LIBOR
|
Quarterly
|
249,293
|
11,427,741
|
307,703
|
|||||||||
|
SHORT TOTAL RETURN SWAP CONTRACTS
|
||||||||||||||||
|
BAML
|
AbbVie, Inc.
|
10/4/20
|
Receive
|
(0.175)% +1 Month U.S. LIBOR
|
Monthly
|
(720,854
|
)
|
(55,135,780
|
)
|
(8,668,414
|
)
|
|||||
|
JPM
|
Alibaba Group
|
|||||||||||||||
|
Holding Ltd. – ADR
|
10/25/20
|
Receive
|
(0.600)% +3 Month U.S. LIBOR
|
Quarterly
|
(17,432
|
)
|
(3,038,572
|
)
|
(657,008
|
)
|
||||||
|
GS
|
Centene Corporation
|
12/20/20
|
Receive
|
(0.350)% + U.S. Federal Funds
|
Monthly
|
(560,678
|
)
|
(34,722,788
|
)
|
(521,250
|
)
|
|||||
|
GS
|
The Charles Schwab
|
|||||||||||||||
|
Corporation
|
12/5/20
|
Receive
|
(0.350)% + U.S. Federal Funds
|
Monthly
|
(1,126,938
|
)
|
(54,722,225
|
)
|
1,119,992
|
|||||||
|
JPM
|
Digital Realty Trust, Inc.
|
10/25/20
|
Receive
|
(0.600)% +3 Month U.S. LIBOR
|
Quarterly
|
(27,220
|
)
|
(3,200,800
|
)
|
(56,683
|
)
|
|||||
|
JPM
|
Discovery, Inc. Class A
|
10/22/20
|
Receive
|
(0.600)% +3 Month U.S. LIBOR
|
Quarterly
|
(133,231
|
)
|
(3,702,489
|
)
|
(657,365
|
)
|
|||||
|
GS
|
Eldorado Resorts, Inc.
|
12/20/20
|
Receive
|
(0.420)% + U.S. Federal Funds
|
Monthly
|
(418,010
|
)
|
(24,098,276
|
)
|
(828,058
|
)
|
|||||
|
GS
|
Flutter Entertainment
|
10/2/20
|
Receive
|
(0.550)% + U.S. Federal Funds
|
Monthly
|
(547,875
|
)
|
(55,077,719
|
)
|
(11,546,080
|
)
|
|||||
|
JPM
|
Flutter Entertainment
|
10/22/20
|
Receive
|
(0.476)% +3 Month U.S. LIBOR
|
Quarterly
|
(277,710
|
)
|
(27,386,229
|
)
|
(6,374,825
|
)
|
|||||
|
BAML
|
Natura Cosmeticos S.A.
|
8/26/20
|
Pay
|
(4.000)% +1 Month U.S. LIBOR
|
Monthly
|
(2,296,550
|
)
|
(18,524,294
|
)
|
(3,562,954
|
)
|
|||||
|
GS
|
Natura Cosmeticos S.A.
|
9/17/20
|
Pay
|
(5.500)% + U.S. Federal Funds
|
Monthly
|
(1,155,221
|
)
|
(9,009,372
|
)
|
(2,099,719
|
)
|
|||||
The accompanying notes are an integral part of these financial statements.
41
The Merger Fund
SCHEDULE OF INVESTMENTS (continued)
Open Swap Contracts
December 31, 2019
|
Pay/Receive
|
Unrealized
|
||||||||||||||||
|
Counter-
|
Termination
|
on Financing
|
Payment
|
Notional
|
Appreciation
|
||||||||||||
|
party
|
Security
|
Date
|
Rate
|
Financing Rate
|
Frequency
|
Shares
|
Amount
|
(Depreciation)*
|
|||||||||
|
BAML
|
Peugeot S.A.
|
11/14/20
|
Receive
|
(0.350)% +1 Month U.S. LIBOR
|
Monthly
|
(475,895
|
)
|
$
|
(12,247,793
|
)
|
$
|
881,985
|
|||||
|
GS
|
Prologis, Inc.
|
10/31/20
|
Receive
|
(0.350)% + U.S. Federal Funds
|
Monthly
|
(903,553
|
)
|
(79,730,871
|
)
|
(782,583
|
)
|
||||||
|
$
|
(11,605,819
|
)
|
|||||||||||||||
ADR – American Depository Receipt
BAML – Bank of America Merrill Lynch & Co., Inc.
GS – Goldman, Sachs & Co.
JPM – JPMorgan Chase & Co., Inc.
LIBOR – London Interbank Offered Rate
plc – Public Limited Company
U.S. Federal Funds – U.S. Federal Funds Effective Rate
|
*
|
Based on the net swap value held at each counterparty, unrealized appreciation (depreciation) is a receivable (payable).
|
|
(1)
|
Security held is the direct result of a corporate action. There is no associated financing rate and the security is held with a zero cost basis.
|
The accompanying notes are an integral part of these financial statements.
42
WCM Alternatives: Event-Driven Fund
SCHEDULE OF INVESTMENTS
December 31, 2019
|
Shares
|
Value
|
|||||||
|
LONG INVESTMENTS — 102.13%
|
||||||||
|
COMMON STOCKS — 39.82%
|
||||||||
|
ALTERNATIVE CARRIERS — 0.64%
|
||||||||
|
Zayo Group Holdings, Inc. (a)
|
40,434
|
$
|
1,401,038
|
|||||
|
ASSET MANAGEMENT
|
||||||||
|
& CUSTODY BANKS — 1.20%
|
||||||||
|
Apollo Global Management, Inc. (e)(j)
|
55,181
|
2,632,686
|
||||||
|
AUTOMOTIVE RETAIL — 0.01%
|
||||||||
|
Kaixin Auto Holdings (a)(b)
|
9,742
|
18,412
|
||||||
|
BIOTECHNOLOGY — 0.93%
|
||||||||
|
ArQule, Inc. (a)(j)
|
68,860
|
1,374,446
|
||||||
|
The Medicines Company (a)(j)
|
3,700
|
314,278
|
||||||
|
Ra Pharmaceuticals, Inc. (a)
|
7,385
|
346,578
|
||||||
|
2,035,302
|
||||||||
|
BROADCASTING — 1.96%
|
||||||||
|
Fox Corporation Class B
|
58,706
|
2,136,898
|
||||||
|
ViacomCBS, Inc. Class B (j)
|
51,165
|
2,147,395
|
||||||
|
4,284,293
|
||||||||
|
BUILDING PRODUCTS — 2.01%
|
||||||||
|
Masco Corporation (j)
|
91,600
|
4,395,884
|
||||||
|
CASINOS & GAMING — 6.01%
|
||||||||
|
Caesars Entertainment Corporation (a)(e)
|
419,472
|
5,704,819
|
||||||
|
The Stars Group, Inc. (a)(b)(e)(f)
|
287,913
|
7,436,793
|
||||||
|
13,141,612
|
||||||||
|
CHEMICALS — 0.78%
|
||||||||
|
DuPont de Nemours, Inc. (e)(j)
|
26,553
|
1,704,703
|
||||||
|
CONSTRUCTION MACHINERY
|
||||||||
|
& HEAVY TRUCKS — 1.81%
|
||||||||
|
WABCO Holdings, Inc. (a)(e)
|
29,244
|
3,962,562
|
||||||
|
ELECTRONIC EQUIPMENT
|
||||||||
|
& INSTRUMENTS — 0.66%
|
||||||||
|
Fitbit, Inc. Class A (a)(j)
|
218,755
|
1,437,220
|
||||||
|
ENVIRONMENTAL &
|
||||||||
|
FACILITIES SERVICES — 0.83%
|
||||||||
|
Advanced Disposal Services, Inc. (a)
|
55,049
|
1,809,461
|
||||||
|
HEALTH CARE EQUIPMENT — 0.06%
|
||||||||
|
Wright Medical Group N.V. (a)(b)
|
4,494
|
136,977
|
||||||
The accompanying notes are an integral part of these financial statements.
43
WCM Alternatives: Event-Driven Fund
SCHEDULE OF INVESTMENTS (continued)
December 31, 2019
|
Shares
|
Value
|
|||||||
|
INTERACTIVE MEDIA & SERVICES — 1.08%
|
||||||||
|
IAC/InterActiveCorp (a)(j)
|
9,487
|
$
|
2,363,307
|
|||||
|
INTERNET & DIRECT
|
||||||||
|
MARKETING RETAIL — 0.85%
|
||||||||
|
eBay, Inc. (e)(j)
|
51,300
|
1,852,443
|
||||||
|
Reebonz Holdings Ltd. (a)(b)
|
597
|
698
|
||||||
|
1,853,141
|
||||||||
|
INVESTMENT BANK & BROKERAGE — 2.29%
|
||||||||
|
TD Ameritrade Holdings Corporation
|
100,826
|
5,011,052
|
||||||
|
IT CONSULTING &
|
||||||||
|
OTHER SERVICES — 0.10%
|
||||||||
|
InterXion Holding N.V. (a)(b)
|
2,565
|
214,973
|
||||||
|
LIFE & HEALTH INSURANCE — 0.03%
|
||||||||
|
Genworth Financial, Inc. Class A (a)
|
15,670
|
68,948
|
||||||
|
LIFE SCIENCES TOOLS
|
||||||||
|
& SERVICES — 0.89%
|
||||||||
|
Qiagen N.V. (a)(b)(j)
|
57,332
|
1,937,822
|
||||||
|
MANAGED HEALTH CARE — 2.28%
|
||||||||
|
WellCare Health Plans, Inc. (a)(e)
|
15,066
|
4,974,944
|
||||||
|
MOVIES & ENTERTAINMENT — 0.52%
|
||||||||
|
Akazoo S.A. (a)(b)(e)
|
7,150
|
37,680
|
||||||
|
The Madison Square Garden
|
||||||||
|
Company Class A (a)(e)(j)
|
3,700
|
1,088,503
|
||||||
|
1,126,183
|
||||||||
|
OIL & GAS EXPLORATION
|
||||||||
|
& PRODUCTION — 0.29%
|
||||||||
|
Callon Petroleum Company (a)
|
116,100
|
560,763
|
||||||
|
EnCana Corporation (b)
|
17,005
|
79,753
|
||||||
|
640,516
|
||||||||
|
OIL & GAS REFINING
|
||||||||
|
& MARKETING — 2.36%
|
||||||||
|
Marathon Petroleum Corporation (e)(j)
|
85,800
|
5,169,450
|
||||||
|
PHARMACEUTICALS — 5.95%
|
||||||||
|
Allergan plc (b)(e)
|
68,057
|
13,010,457
|
||||||
|
REITs — 0.77%
|
||||||||
|
Broadmark Realty Capital, Inc.
|
97,084
|
1,237,821
|
||||||
|
Liberty Property Trust
|
7,291
|
437,825
|
||||||
|
1,675,646
|
||||||||
The accompanying notes are an integral part of these financial statements.
44
WCM Alternatives: Event-Driven Fund
SCHEDULE OF INVESTMENTS (continued)
December 31, 2019
|
Shares
|
Value
|
|||||||
|
SEMICONDUCTORS — 0.30%
|
||||||||
|
Mellanox Technologies Ltd. (a)(b)
|
5,678
|
$
|
665,348
|
|||||
|
SEMICONDUCTORS &
|
||||||||
|
SEMICONDUCTOR EQUIPMENT — 0.45%
|
||||||||
|
Cypress Semiconductor Corporation
|
42,243
|
985,529
|
||||||
|
SPECIALTY STORES — 3.09%
|
||||||||
|
Tiffany & Company (e)
|
50,461
|
6,744,113
|
||||||
|
TECHNOLOGY DISTRIBUTORS — 0.47%
|
||||||||
|
Anixter International, Inc. (a)
|
1,027
|
94,587
|
||||||
|
Tech Data Corporation (a)
|
6,476
|
929,953
|
||||||
|
1,024,540
|
||||||||
|
WIRELESS TELECOMMUNICATION
|
||||||||
|
SERVICES — 1.20%
|
||||||||
|
Sprint Corporation (a)
|
41,506
|
216,246
|
||||||
|
T-Mobile USA, Inc. (a)(j)
|
30,748
|
2,411,258
|
||||||
|
2,627,504
|
||||||||
|
TOTAL COMMON STOCKS
|
||||||||
|
(Cost $81,819,783)
|
87,053,623
|
|||||||
|
SPECIAL PURPOSE ACQUISITION
|
||||||||
|
COMPANIES — 12.42% (a)
|
||||||||
|
Act II Global Acquisition
|
||||||||
|
Corporation Class A (b)
|
90,858
|
919,483
|
||||||
|
Alberton Acquisition Corporation (b)
|
242,664
|
2,511,572
|
||||||
|
Apex Technology Acquisition
|
||||||||
|
Corporation Class A (f)
|
58,964
|
584,628
|
||||||
|
CF Finance Acquisition Corporation Class A (f)
|
108,500
|
1,112,125
|
||||||
|
ChaSerg Technology Acquisition
|
||||||||
|
Corporation Class A
|
22,830
|
247,705
|
||||||
|
CHP Merger Corporation
|
40,120
|
408,020
|
||||||
|
CIIG Merger Corporation
|
159,548
|
1,621,008
|
||||||
|
Collier Creek Holdings Class A (b)(f)
|
42,300
|
435,267
|
||||||
|
FinTech Acquisition Corporation III Class A
|
168,874
|
1,709,005
|
||||||
|
Galileo Acquisition Corporation (b)(f)
|
126,337
|
1,298,113
|
||||||
|
GigCapital2, Inc. (f)
|
37,777
|
376,448
|
||||||
|
Gordon Pointe Acquisition Corporation
|
4,482
|
47,464
|
||||||
|
Graf Industrial Corporation (e)
|
197,624
|
2,013,788
|
||||||
|
Hennessy Capital Acquisition
|
||||||||
|
Corporation IV Class A
|
167,612
|
1,702,938
|
||||||
|
Juniper Industrial Holdings, Inc. (f)
|
165,386
|
1,689,418
|
||||||
|
Legacy Acquisition Corporation Class A
|
197,442
|
2,027,729
|
||||||
The accompanying notes are an integral part of these financial statements.
45
WCM Alternatives: Event-Driven Fund
SCHEDULE OF INVESTMENTS (continued)
December 31, 2019
|
Shares
|
Value
|
|||||||
|
Leisure Acquisition Corporation
|
5,160
|
$
|
53,767
|
|||||
|
LF Capital Acquisition Corporation Class A (f)
|
5,834
|
60,324
|
||||||
|
LGL Systems Acquisition Corporation
|
54,748
|
558,430
|
||||||
|
Monocle Acquisition Corporation
|
15,759
|
160,427
|
||||||
|
Mudrick Capital Acquisition
|
||||||||
|
Corporation Class A (f)
|
19,411
|
200,419
|
||||||
|
Orisun Acquisition Corporation
|
8,528
|
84,854
|
||||||
|
Pivotal Investment Corporation II Class A
|
97,371
|
967,868
|
||||||
|
PropTech Acquisition Corporation (f)
|
98,000
|
1,013,320
|
||||||
|
Pure Acquisition Corporation
|
57,469
|
595,953
|
||||||
|
Software Acquisition Group, Inc.
|
37,274
|
378,704
|
||||||
|
Trident Acquisitions Corporation (f)
|
93,712
|
987,724
|
||||||
|
Tuscan Holdings Corporation (e)
|
168,926
|
1,682,503
|
||||||
|
Tuscan Holdings Corporation II
|
146,060
|
1,440,152
|
||||||
|
VectoIQ Acquisition Corporation
|
25,000
|
257,997
|
||||||
|
TOTAL SPECIAL PURPOSE ACQUISITION
|
||||||||
|
COMPANIES (Cost $25,967,102)
|
27,147,153
|
|||||||
|
CLOSED-END FUNDS — 3.28%
|
||||||||
|
Apollo Senior Floating Rate Fund, Inc.
|
11,127
|
168,463
|
||||||
|
Apollo Tactical Income Fund, Inc.
|
11,139
|
168,199
|
||||||
|
Ares Dynamic Credit Allocation Fund
|
4,683
|
71,884
|
||||||
|
BlackRock Debt Strategies Fund, Inc.
|
35,063
|
392,706
|
||||||
|
BlackRock Floating Rate Income
|
||||||||
|
Strategies Fund, Inc.
|
9,611
|
129,172
|
||||||
|
BlackRock MuniYield Quality Fund III, Inc.
|
57,617
|
777,829
|
||||||
|
Eaton Vance Floating-Rate Income Trust
|
28,528
|
391,404
|
||||||
|
First Trust Senior Floating Rate Income Fund II
|
5,810
|
72,916
|
||||||
|
Invesco Dynamic Credit Opportunities Fund
|
18,617
|
211,303
|
||||||
|
Invesco Senior Income Trust
|
64,480
|
276,619
|
||||||
|
Nuveen AMT-Free Quality
|
||||||||
|
Municipal Income Fund
|
55,115
|
792,554
|
||||||
|
Nuveen Intermediate Duration
|
||||||||
|
Municipal Term Fund
|
57,365
|
797,947
|
||||||
|
Nuveen Municipal Credit Income Fund
|
48,255
|
789,934
|
||||||
|
Nuveen New York AMT-Free Quality
|
||||||||
|
Municipal Income Fund
|
58,257
|
790,547
|
||||||
|
Voya Prime Rate Trust
|
73,819
|
369,833
|
||||||
|
Western Asset High Income
|
||||||||
|
Opportunity Fund, Inc. (e)
|
191,266
|
969,719
|
||||||
|
TOTAL CLOSED-END FUNDS
|
||||||||
|
(Cost $7,067,141)
|
7,171,029
|
|||||||
The accompanying notes are an integral part of these financial statements.
46
WCM Alternatives: Event-Driven Fund
SCHEDULE OF INVESTMENTS (continued)
December 31, 2019
|
Shares
|
Value
|
|||||||
|
PREFERRED STOCKS — 3.57%
|
||||||||
|
Colony Capital, Inc., 8.750%, Series E (e)
|
56,929
|
$
|
1,440,304
|
|||||
|
Fannie Mae, 8.250%, Series S (a)
|
176,154
|
2,105,040
|
||||||
|
Freddie Mac, 8.375%, Series Z (a)
|
265,396
|
3,144,943
|
||||||
|
GMAC Capital Trust I, 7.695% (3 Month U.S.
|
||||||||
|
LIBOR + 5.785%), 2/15/2040 Series 2 (i)
|
39,471
|
1,028,219
|
||||||
|
Pebblebrook Hotel Trust, 6.375%, Series E
|
3,515
|
89,281
|
||||||
|
TOTAL PREFERRED STOCKS
|
||||||||
|
(Cost $7,774,835)
|
7,807,787
|
|||||||
|
CONTINGENT VALUE RIGHTS — 0.08% (a)(f)
|
||||||||
|
Alder Biopharmaceuticals, Inc.
|
194,778
|
182,604
|
||||||
|
Media General, Inc. (e)
|
42,852
|
2,143
|
||||||
|
TOTAL CONTINGENT VALUE RIGHTS (Cost $0)
|
184,747
|
|||||||
|
RIGHTS — 0.00% (a)(f)
|
||||||||
|
GigCapital2, Inc.
|
37,777
|
9,448
|
||||||
|
TOTAL RIGHTS (Cost $10,346)
|
9,448
|
|||||||
|
WARRANTS — 0.38% (a)
|
||||||||
|
Act II Global Acquisition Corporation Class A
|
||||||||
|
Expiration: April 2024,
|
||||||||
|
Exercise Price: $11.50 (b)
|
45,429
|
45,429
|
||||||
|
Akazoo S.A.
|
||||||||
|
Expiration: December 2024,
|
||||||||
|
Exercise Price: $11.50 (b)
|
35,748
|
17,874
|
||||||
|
Apex Technology Acquisition
|
||||||||
|
Corporation Class A
|
||||||||
|
Expiration: September 2026,
|
||||||||
|
Exercise Price: $11.50
|
29,482
|
33,904
|
||||||
|
CF Finance Acquisition Corporation Class A
|
||||||||
|
Expiration: April 2025,
|
||||||||
|
Exercise Price: $11.50 (f)
|
81,375
|
72,017
|
||||||
|
ChaSerg Technology Acquisition
|
||||||||
|
Corporation Class A
|
||||||||
|
Expiration: September 2023,
|
||||||||
|
Exercise Price: $11.50
|
11,415
|
25,113
|
||||||
|
Collier Creek Holdings Class A
|
||||||||
|
Expiration: November 2023,
|
||||||||
|
Exercise Price: $11.50 (b)(f)
|
14,100
|
19,317
|
||||||
|
FinTech Acquisition Corporation III Class A
|
||||||||
|
Expiration: December 2023,
|
||||||||
|
Exercise Price: $11.50
|
84,437
|
115,983
|
||||||
The accompanying notes are an integral part of these financial statements.
47
WCM Alternatives: Event-Driven Fund
SCHEDULE OF INVESTMENTS (continued)
December 31, 2019
|
Shares
|
Value
|
|||||||
|
GigCapital2, Inc.
|
||||||||
|
Expiration: July 2024,
|
||||||||
|
Exercise Price: $11.50 (f)
|
37,777
|
$
|
12,089
|
|||||
|
Graf Industrial Corporation
|
||||||||
|
Expiration: December 2025,
|
||||||||
|
Exercise Price: $11.50
|
197,624
|
86,559
|
||||||
|
Hennessy Capital Acquisition
|
||||||||
|
Corporation IV Class A
|
||||||||
|
Expiration: September 2025,
|
||||||||
|
Exercise Price: $11.50
|
125,709
|
100,567
|
||||||
|
Kaixin Auto Holdings
|
||||||||
|
Expiration: April 2024,
|
||||||||
|
Exercise Price: $11.50 (b)
|
48,712
|
974
|
||||||
|
Legacy Acquisition Corporation Class A
|
||||||||
|
Expiration: November 2022,
|
||||||||
|
Exercise Price: $11.50
|
144,392
|
77,625
|
||||||
|
Monocle Acquisition Corporation
|
||||||||
|
Expiration: June 2024,
|
||||||||
|
Exercise Price: $11.50
|
15,759
|
11,819
|
||||||
|
Mudrick Capital Acquisition Corporation Class A
|
||||||||
|
Expiration: March 2025,
|
||||||||
|
Exercise Price: $11.50
|
19,411
|
9,511
|
||||||
|
Pivotal Acquisition Corporation
|
||||||||
|
Expiration: December 2025,
|
||||||||
|
Exercise Price: $11.50 (f)
|
10,000
|
6,000
|
||||||
|
Pivotal Investment Corporation II Class A
|
||||||||
|
Expiration: June 2025,
|
||||||||
|
Exercise Price: $11.50 (f)
|
32,457
|
25,966
|
||||||
|
Pure Acquisition Corporation
|
||||||||
|
Expiration: April 2023,
|
||||||||
|
Exercise Price: $11.50
|
22,218
|
21,907
|
||||||
|
Reebonz Holdings Ltd.
|
||||||||
|
Expiration: December 2023,
|
||||||||
|
Exercise Price: $11.50 (b)(f)
|
23,859
|
155
|
||||||
|
Tiberius Acquisition Corporation
|
||||||||
|
Expiration: April 2023,
|
||||||||
|
Exercise Price: $11.50
|
20,975
|
23,912
|
||||||
|
Tuscan Holdings Corporation
|
||||||||
|
Expiration: April 2026,
|
||||||||
|
Exercise Price: $11.50 (e)(f)
|
168,926
|
97,132
|
||||||
|
Tuscan Holdings Corporation II
|
||||||||
|
Expiration: April 2025,
|
||||||||
|
Exercise Price: $11.50 (f)
|
73,030
|
32,864
|
||||||
|
TOTAL WARRANTS (Cost $691,183)
|
836,717
|
|||||||
The accompanying notes are an integral part of these financial statements.
48
WCM Alternatives: Event-Driven Fund
SCHEDULE OF INVESTMENTS (continued)
December 31, 2019
|
Principal
|
||||||||
|
Amount
|
Value
|
|||||||
|
BANK LOANS — 4.25% (f)(i)
|
||||||||
|
Avaya Holdings Corporation
|
||||||||
|
5.990% (1 Month U.S.
|
||||||||
|
LIBOR + 4.250%), 12/16/2024
|
$
|
869,585
|
$
|
855,819
|
||||
|
Cengage Learning Holdings II, Inc.
|
||||||||
|
6.049% (1 Month U.S.
|
||||||||
|
LIBOR + 4.250%), 6/7/2023
|
1,245,719
|
1,189,662
|
||||||
|
Heritage Power LLC
|
||||||||
|
8.205% (6 Month U.S.
|
||||||||
|
LIBOR + 6.000%), 7/30/2026
|
3,561,075
|
3,418,632
|
||||||
|
McGraw-Hill Global Education Holdings LLC
|
||||||||
|
5.799% (1 Month U.S.
|
||||||||
|
LIBOR + 4.000%), 5/4/2022
|
1,030,205
|
990,284
|
||||||
|
Refinitiv U.S. Holdings, Inc.
|
||||||||
|
5.049% (1 Month U.S.
|
||||||||
|
LIBOR + 3.250%), 10/1/2025
|
2,799,362
|
2,824,514
|
||||||
|
TOTAL BANK LOANS (Cost $9,379,816)
|
9,278,911
|
|||||||
|
CONVERTIBLE BONDS — 1.64% (f)
|
||||||||
|
Caesars Entertainment Corporation
|
||||||||
|
5.000%, 10/1/2024
|
251,397
|
484,253
|
||||||
|
NII Holdings, Inc.
|
||||||||
|
4.250%, 8/15/2023 (h)
|
2,923,000
|
3,105,688
|
||||||
|
TOTAL CONVERTIBLE BONDS (Cost $3,194,290)
|
3,589,941
|
|||||||
|
CORPORATE BONDS — 10.70% (f)
|
||||||||
|
APX Group, Inc.
|
||||||||
|
7.875%, 12/1/2022
|
2,416,000
|
2,443,164
|
||||||
|
Arconic, Inc.
|
||||||||
|
5.400%, 4/15/2021
|
795,000
|
819,872
|
||||||
|
CEC Entertainment, Inc.
|
||||||||
|
8.000%, 2/15/2022
|
3,440,000
|
3,398,073
|
||||||
|
Cincinnati Bell, Inc.
|
||||||||
|
7.000%, 7/15/2024 (h)
|
56,000
|
58,870
|
||||||
|
EIG Investors Corporation
|
||||||||
|
10.875%, 2/1/2024
|
1,025,000
|
1,025,425
|
||||||
|
Kinetic Concepts, Inc. / KCI USA, Inc.
|
||||||||
|
12.500%, 11/1/2021 (e)(h)
|
3,286,000
|
3,390,002
|
||||||
|
Nielsen Finance LLC / Nielsen Finance Company
|
||||||||
|
5.000%, 4/15/2022 (e)(h)
|
4,022,000
|
4,044,242
|
||||||
|
Refinitiv U.S. Holdings, Inc.
|
||||||||
|
8.250%, 11/15/2026 (h)
|
2,676,000
|
3,018,796
|
||||||
The accompanying notes are an integral part of these financial statements.
49
WCM Alternatives: Event-Driven Fund
SCHEDULE OF INVESTMENTS (continued)
December 31, 2019
|
Principal
|
||||||||||||
|
Amount
|
Value
|
|||||||||||
|
SRC Energy, Inc.
|
||||||||||||
|
6.250%, 12/1/2025
|
$
|
306,000
|
$
|
309,057
|
||||||||
|
T-Mobile USA, Inc.
|
||||||||||||
|
6.500%, 1/15/2024
|
217,000
|
223,783
|
||||||||||
|
6.375%, 3/1/2025
|
204,000
|
211,225
|
||||||||||
|
Vertiv Group Corporation
|
||||||||||||
|
9.250%, 10/15/2024 (h)
|
3,144,000
|
3,386,355
|
||||||||||
|
Vistra Energy Corporation
|
||||||||||||
|
5.875%, 6/1/2023
|
601,000
|
616,344
|
||||||||||
|
Zayo Group LLC / Zayo Capital, Inc.
|
||||||||||||
|
5.750%, 1/15/2027 (h)
|
440,000
|
448,403
|
||||||||||
|
TOTAL CORPORATE BONDS (Cost $23,495,521)
|
23,393,611
|
|||||||||||
|
Contracts
|
||||||||||||
|
(100 shares
|
Notional
|
|||||||||||
|
per contract)
|
Amount
|
|||||||||||
|
PURCHASED PUT OPTIONS — 0.18% (a)
|
||||||||||||
|
Apollo Global Management, Inc.
|
||||||||||||
|
Expiration: January 2020,
|
||||||||||||
|
Exercise Price: $44.00
|
109
|
$
|
520,039
|
1,635
|
||||||||
|
Expiration: March 2020,
|
||||||||||||
|
Exercise Price: $44.00
|
393
|
1,875,003
|
49,125
|
|||||||||
|
Axalta Coating Systems Ltd.
|
||||||||||||
|
Expiration: January 2020,
|
||||||||||||
|
Exercise Price: $26.00
|
1,247
|
3,790,880
|
3,117
|
|||||||||
|
Bayer AG
|
||||||||||||
|
Expiration: February 2020,
|
||||||||||||
|
Exercise Price: EUR 61.00 (b)(f)
|
848
|
6,932,308
|
18,073
|
|||||||||
|
DuPont de Nemours, Inc.
|
||||||||||||
|
Expiration: April 2020,
|
||||||||||||
|
Exercise Price: $55.00
|
288
|
1,848,960
|
27,072
|
|||||||||
|
eBay, Inc.
|
||||||||||||
|
Expiration: January 2020,
|
||||||||||||
|
Exercise Price: $31.00
|
344
|
1,242,184
|
1,548
|
|||||||||
|
Hilton Grand Vacations, Inc.
|
||||||||||||
|
Expiration: January 2020,
|
||||||||||||
|
Exercise Price: $28.00
|
90
|
309,510
|
1,125
|
|||||||||
|
Expiration: April 2020,
|
||||||||||||
|
Exercise Price: $29.00
|
1,304
|
4,484,456
|
81,500
|
|||||||||
The accompanying notes are an integral part of these financial statements.
50
WCM Alternatives: Event-Driven Fund
SCHEDULE OF INVESTMENTS (continued)
December 31, 2019
|
Contracts
|
||||||||||||
|
(100 shares
|
Notional
|
|||||||||||
|
per contract)
|
Amount
|
Value
|
||||||||||
|
IAC/InterActiveCorp
|
||||||||||||
|
Expiration: January 2020,
|
||||||||||||
|
Exercise Price: $175.00
|
47
|
$
|
1,170,817
|
$
|
352
|
|||||||
|
Expiration: January 2020,
|
||||||||||||
|
Exercise Price: $180.00
|
23
|
572,953
|
184
|
|||||||||
|
Expiration: January 2020,
|
||||||||||||
|
Exercise Price: $190.00
|
174
|
4,334,514
|
2,175
|
|||||||||
|
The Madison Square Garden Company Class A
|
||||||||||||
|
Expiration: February 2020,
|
||||||||||||
|
Exercise Price: $230.00
|
200
|
5,883,800
|
8,000
|
|||||||||
|
Marathon Petroleum Corporation
|
||||||||||||
|
Expiration: January 2020,
|
||||||||||||
|
Exercise Price: $50.00
|
403
|
2,428,075
|
2,821
|
|||||||||
|
Expiration: January 2020,
|
||||||||||||
|
Exercise Price: $52.50
|
83
|
500,075
|
1,162
|
|||||||||
|
Expiration: January 2020,
|
||||||||||||
|
Exercise Price: $55.00
|
92
|
554,300
|
2,760
|
|||||||||
|
Expiration: January 2020,
|
||||||||||||
|
Exercise Price: $55.50
|
280
|
1,687,000
|
21,980
|
|||||||||
|
Masco Corporation
|
||||||||||||
|
Expiration: April 2020,
|
||||||||||||
|
Exercise Price: $41.00
|
916
|
4,395,884
|
50,380
|
|||||||||
|
Mylan N.V.
|
||||||||||||
|
Expiration: January 2020,
|
||||||||||||
|
Exercise Price: $15.00
|
1,488
|
2,990,880
|
2,976
|
|||||||||
|
Ra Pharmaceuticals, Inc.
|
||||||||||||
|
Expiration: April 2020,
|
||||||||||||
|
Exercise Price: $40.00
|
8
|
37,544
|
280
|
|||||||||
|
SPDR S&P 500 ETF Trust
|
||||||||||||
|
Expiration: January 2020,
|
||||||||||||
|
Exercise Price: $316.00
|
140
|
4,506,040
|
18,550
|
|||||||||
|
Expiration: February 2020,
|
||||||||||||
|
Exercise Price: $320.00
|
56
|
1,802,416
|
26,152
|
|||||||||
|
T-Mobile USA, Inc.
|
||||||||||||
|
Expiration: January 2020,
|
||||||||||||
|
Exercise Price: $70.00
|
92
|
721,464
|
736
|
|||||||||
|
United Technologies Corporation
|
||||||||||||
|
Expiration: January 2020,
|
||||||||||||
|
Exercise Price: $115.00
|
153
|
2,291,328
|
995
|
|||||||||
|
VanEck Vectors Semiconductor ETF
|
||||||||||||
|
Expiration: February 2020,
|
||||||||||||
|
Exercise Price: $140.00
|
76
|
1,074,716
|
30,780
|
|||||||||
The accompanying notes are an integral part of these financial statements.
51
WCM Alternatives: Event-Driven Fund
SCHEDULE OF INVESTMENTS (continued)
December 31, 2019
|
Contracts
|
||||||||||||
|
(100 shares
|
Notional
|
|||||||||||
|
per contract)
|
Amount
|
Value
|
||||||||||
|
ViacomCBS, Inc. Class B
|
||||||||||||
|
Expiration: March 2020,
|
||||||||||||
|
Exercise Price: $35.00
|
852
|
$
|
3,575,844
|
$
|
32,376
|
|||||||
|
Vodafone Group plc
|
||||||||||||
|
Expiration: January 2020,
|
||||||||||||
|
Exercise Price: $15.00
|
515
|
995,495
|
515
|
|||||||||
|
TOTAL PURCHASED PUT OPTIONS
|
||||||||||||
|
(Cost $756,410)
|
386,369
|
|||||||||||
|
Shares
|
||||||||||||
|
ESCROW NOTES — 4.01% (a)
|
||||||||||||
|
Altaba, Inc. (f)
|
422,076
|
8,740,489
|
||||||||||
|
AMR Corporation (d)(g)
|
28,850
|
6,636
|
||||||||||
|
Sentinel Energy Services, Inc. Class B (f)
|
127,242
|
700
|
||||||||||
|
Winthrop Realty Trust (e)(d)
|
26,484
|
8,938
|
||||||||||
|
TOTAL ESCROW NOTES (Cost $8,361,344)
|
8,756,763
|
|||||||||||
|
SHORT-TERM INVESTMENTS — 21.80%
|
||||||||||||
|
MONEY MARKET FUNDS — 9.36% (c)
|
||||||||||||
|
Fidelity Institutional Government Portfolio,
|
||||||||||||
|
Institutional Share Class, 1.49%
|
203,810
|
203,810
|
||||||||||
|
The Government & Agency Portfolio,
|
||||||||||||
|
Institutional Share Class, 1.50%
|
6,570,542
|
6,570,542
|
||||||||||
|
JPMorgan Prime Money Market Fund,
|
||||||||||||
|
Institutional Share Class, 1.75%
|
3,088,727
|
3,089,651
|
||||||||||
|
JPMorgan U.S. Government Money Market
|
||||||||||||
|
Fund, Institutional Share Class, 1.51%
|
10,597,000
|
10,597,000
|
||||||||||
|
20,461,003
|
||||||||||||
|
Principal
|
||||||||||||
|
Amount
|
||||||||||||
|
U.S. TREASURY BILLS — 12.44% (e)(f)(k)
|
||||||||||||
|
United States Treasury Bills
|
||||||||||||
|
1.85%, 2/6/2020
|
$
|
475,000
|
474,314
|
|||||||||
|
1.78%, 2/13/2020
|
622,000
|
620,924
|
||||||||||
|
1.80%, 2/20/2020
|
940,000
|
938,068
|
||||||||||
|
1.78%, 2/27/2020
|
3,085,000
|
3,077,778
|
||||||||||
|
1.78%, 3/12/2020
|
1,490,000
|
1,485,662
|
||||||||||
|
1.82%, 3/19/2020
|
1,244,000
|
1,240,071
|
||||||||||
|
1.71%, 3/26/2020
|
1,545,000
|
1,539,583
|
||||||||||
The accompanying notes are an integral part of these financial statements.
52
WCM Alternatives: Event-Driven Fund
SCHEDULE OF INVESTMENTS (continued)
December 31, 2019
|
Principal
|
||||||||
|
Amount
|
Value
|
|||||||
|
1.58%, 4/2/2020
|
$
|
3,640,000
|
$
|
3,626,014
|
||||
|
1.58%, 4/9/2020
|
1,270,000
|
1,264,744
|
||||||
|
1.55%, 4/16/2020
|
990,000
|
985,632
|
||||||
|
1.54%, 4/23/2020
|
3,960,000
|
3,941,178
|
||||||
|
1.47%, 4/30/2020
|
906,000
|
901,443
|
||||||
|
1.49%, 5/7/2020
|
2,105,000
|
2,093,811
|
||||||
|
1.49%, 5/14/2020
|
865,000
|
860,134
|
||||||
|
1.49%, 5/21/2020
|
3,095,000
|
3,076,690
|
||||||
|
1.49%, 5/28/2020
|
675,000
|
670,782
|
||||||
|
1.46%, 6/4/2020
|
280,000
|
278,166
|
||||||
|
1.48%, 6/18/2020
|
120,000
|
119,140
|
||||||
|
27,194,134
|
||||||||
|
TOTAL SHORT-TERM INVESTMENTS
|
||||||||
|
(Cost $47,650,209)
|
47,655,137
|
|||||||
|
TOTAL LONG INVESTMENTS
|
||||||||
|
(Cost $216,167,980) — 102.13%
|
223,271,236
|
|||||||
|
Shares
|
||||||||
|
SHORT INVESTMENTS — (2.42)%
|
||||||||
|
COMMON STOCKS — (1.99)%
|
||||||||
|
AIRLINES — (0.00)%
|
||||||||
|
American Airlines Group, Inc.
|
(194
|
)
|
(5,564
|
)
|
||||
|
ASSET MANAGEMENT
|
||||||||
|
& CUSTODY BANKS — (1.25)%
|
||||||||
|
The Blackstone Group, Inc.
|
(48,800
|
)
|
(2,729,872
|
)
|
||||
|
CABLE & SATELLITE — (0.39)%
|
||||||||
|
Sirius XM Holdings, Inc.
|
(117,749
|
)
|
(841,905
|
)
|
||||
|
CASINOS & GAMING — (0.02)%
|
||||||||
|
Eldorado Resorts, Inc.
|
(785
|
)
|
(46,818
|
)
|
||||
|
MANAGED HEALTH CARE — (0.20)%
|
||||||||
|
Centene Corporation
|
(7,052
|
)
|
(443,359
|
)
|
||||
|
PHARMACEUTICALS — (0.13)%
|
||||||||
|
AbbVie, Inc.
|
(3,328
|
)
|
(294,661
|
)
|
||||
|
TOTAL COMMON STOCKS
|
||||||||
|
(Proceeds $3,968,821)
|
(4,362,179
|
)
|
||||||
The accompanying notes are an integral part of these financial statements.
53
WCM Alternatives: Event-Driven Fund
SCHEDULE OF INVESTMENTS (continued)
December 31, 2019
|
Principal
|
||||||||
|
Amount
|
Value
|
|||||||
|
CORPORATE BONDS — (0.43)% (f)
|
||||||||
|
APX Group, Inc.
|
||||||||
|
7.625%, 9/1/2023
|
$
|
(991,000
|
)
|
$
|
(934,429
|
)
|
||
|
TOTAL CORPORATE BONDS
|
||||||||
|
(Proceeds $893,387)
|
(934,429
|
)
|
||||||
|
TOTAL SHORT INVESTMENTS
|
||||||||
|
(Proceeds $4,862,208) — (2.42)%
|
(5,296,608
|
)
|
||||||
|
TOTAL NET INVESTMENTS
|
||||||||
|
(Cost $211,305,772) — 99.71%
|
217,974,628
|
|||||||
|
OTHER ASSETS IN EXCESS
|
||||||||
|
OF LIABILITIES — 0.29%
|
629,132
|
|||||||
|
TOTAL NET ASSETS — 100.00%
|
$
|
218,603,760
|
||||||
ETF – Exchange-Traded Fund
EUR – Euro
LIBOR – London Interbank Offered Rate
plc – Public Limited Company
REITs – Real Estate Investment Trusts
|
(a)
|
Non-income producing security.
|
|
(b)
|
Foreign security.
|
|
(c)
|
The rate quoted is the annualized seven-day yield as of December 31, 2019.
|
|
(d)
|
Security fair valued by the Valuation Group in good faith in accordance with the policies adopted by the Board of Trustees.
|
|
(e)
|
All or a portion of the shares have been committed as collateral for open securities sold short, written option contracts, swap contracts, and forward currency exchange contracts.
|
|
(f)
|
Level 2 Security. Please see Note 2 in the Notes to the financial statements for more information.
|
|
(g)
|
Level 3 Security. Please see Note 2 in the Notes to the financial statements for more information.
|
|
(h)
|
Security exempt from registration under Rule 144A of the Securities Act of 1933. These securities may be resold in transactions exempt from registration normally to qualified institutional buyers. As of December 31, 2019, these securities
represent 7.98% of total net assets.
|
|
(i)
|
The coupon rate shown on variable rate securities represents the rate as of December 31, 2019.
|
|
(j)
|
This security is held in connection with a written option contract.
|
|
(k)
|
The rate shown represents yield to maturity.
|
The Global Industry Classification Standard (GICS®) was developed by and/or is the exclusive property of MSCI, Inc. and Standard & Poor’s Financial Services LLC
(“S&P”). GICS is a service mark of MSCI and S&P and has been licensed for use by Fund Services.
The accompanying notes are an integral part of these financial statements.
54
WCM Alternatives: Event-Driven Fund
SCHEDULE OF INVESTMENTS (continued)
Open Written Options
December 31, 2019
|
Contracts
|
||||||||||||
|
(100 shares
|
Notional
|
|||||||||||
|
per contract)
|
Amount
|
Value
|
||||||||||
|
WRITTEN CALL OPTIONS
|
||||||||||||
|
Apollo Global Management, Inc.
|
||||||||||||
|
Expiration: January 2020,
|
||||||||||||
|
Exercise Price: $48.00
|
(109
|
)
|
$
|
(520,039
|
)
|
$
|
(9,538
|
)
|
||||
|
Expiration: March 2020,
|
||||||||||||
|
Exercise Price: $48.00
|
(393
|
)
|
(1,875,003
|
)
|
(86,460
|
)
|
||||||
|
ArQule, Inc.
|
||||||||||||
|
Expiration: January 2020,
|
||||||||||||
|
Exercise Price: $20.00
|
(380
|
)
|
(758,480
|
)
|
(5,700
|
)
|
||||||
|
Expiration: April 2020,
|
||||||||||||
|
Exercise Price: $20.00
|
(204
|
)
|
(407,184
|
)
|
(4,080
|
)
|
||||||
|
AT&T, Inc.
|
||||||||||||
|
Expiration: January 2020,
|
||||||||||||
|
Exercise Price: $37.00
|
(30
|
)
|
(117,240
|
)
|
(6,330
|
)
|
||||||
|
Axalta Coating Systems Ltd.
|
||||||||||||
|
Expiration: January 2020,
|
||||||||||||
|
Exercise Price: $29.00
|
(1,247
|
)
|
(3,790,880
|
)
|
(205,755
|
)
|
||||||
|
DuPont de Nemours, Inc.
|
||||||||||||
|
Expiration: April 2020,
|
||||||||||||
|
Exercise Price: $60.00
|
(288
|
)
|
(1,848,960
|
)
|
(180,000
|
)
|
||||||
|
eBay, Inc.
|
||||||||||||
|
Expiration: January 2020,
|
||||||||||||
|
Exercise Price: $34.00
|
(513
|
)
|
(1,852,443
|
)
|
(115,425
|
)
|
||||||
|
Fitbit, Inc. Class A
|
||||||||||||
|
Expiration: January 2020,
|
||||||||||||
|
Exercise Price: $7.00
|
(315
|
)
|
(206,955
|
)
|
(1,260
|
)
|
||||||
|
Expiration: February 2020,
|
||||||||||||
|
Exercise Price: $7.00
|
(1,850
|
)
|
(1,215,450
|
)
|
(16,650
|
)
|
||||||
|
Expiration: May 2020,
|
||||||||||||
|
Exercise Price: $8.00
|
(22
|
)
|
(14,454
|
)
|
(110
|
)
|
||||||
|
Fox Corporation Class A
|
||||||||||||
|
Expiration: April 2020,
|
||||||||||||
|
Exercise Price: $35.00
|
(147
|
)
|
(544,929
|
)
|
(44,100
|
)
|
||||||
|
Hilton Grand Vacations, Inc.
|
||||||||||||
|
Expiration: January 2020,
|
||||||||||||
|
Exercise Price: $33.00
|
(90
|
)
|
(309,510
|
)
|
(20,250
|
)
|
||||||
|
Expiration: April 2020,
|
||||||||||||
|
Exercise Price: $34.00
|
(1,304
|
)
|
(4,484,456
|
)
|
(335,780
|
)
|
||||||
The accompanying notes are an integral part of these financial statements.
55
WCM Alternatives: Event-Driven Fund
SCHEDULE OF INVESTMENTS (continued)
Open Written Options
December 31, 2019
|
Contracts
|
||||||||||||
|
(100 shares
|
Notional
|
|||||||||||
|
per contract)
|
Amount
|
Value
|
||||||||||
|
IAC/InterActiveCorp
|
||||||||||||
|
Expiration: January 2020,
|
||||||||||||
|
Exercise Price: $190.00
|
(47
|
)
|
$
|
(1,170,817
|
)
|
$
|
(278,475
|
)
|
||||
|
Expiration: January 2020,
|
||||||||||||
|
Exercise Price: $210.00
|
(23
|
)
|
(572,953
|
)
|
(91,333
|
)
|
||||||
|
Expiration: January 2020,
|
||||||||||||
|
Exercise Price: $220.00
|
(174
|
)
|
(4,334,514
|
)
|
(520,259
|
)
|
||||||
|
The Madison Square Garden Company Class A
|
||||||||||||
|
Expiration: February 2020,
|
||||||||||||
|
Exercise Price: $260.00
|
(37
|
)
|
(1,088,503
|
)
|
(133,570
|
)
|
||||||
|
Expiration: February 2020,
|
||||||||||||
|
Exercise Price: $270.00
|
(163
|
)
|
(4,795,297
|
)
|
(447,435
|
)
|
||||||
|
Marathon Petroleum Corporation
|
||||||||||||
|
Expiration: January 2020,
|
||||||||||||
|
Exercise Price: $57.50
|
(418
|
)
|
(2,518,450
|
)
|
(144,210
|
)
|
||||||
|
Expiration: January 2020,
|
||||||||||||
|
Exercise Price: $58.50
|
(280
|
)
|
(1,687,000
|
)
|
(96,600
|
)
|
||||||
|
Expiration: January 2020,
|
||||||||||||
|
Exercise Price: $60.00
|
(160
|
)
|
(964,000
|
)
|
(28,480
|
)
|
||||||
|
Masco Corporation
|
||||||||||||
|
Expiration: April 2020,
|
||||||||||||
|
Exercise Price: $46.00
|
(916
|
)
|
(4,395,884
|
)
|
(338,920
|
)
|
||||||
|
The Medicines Company
|
||||||||||||
|
Expiration: March 2020,
|
||||||||||||
|
Exercise Price: $85.00
|
(37
|
)
|
(314,278
|
)
|
(185
|
)
|
||||||
|
Mylan N.V.
|
||||||||||||
|
Expiration: January 2020,
|
||||||||||||
|
Exercise Price: $17.50
|
(1,488
|
)
|
(2,990,880
|
)
|
(397,296
|
)
|
||||||
|
Qiagen N.V.
|
||||||||||||
|
Expiration: January 2020,
|
||||||||||||
|
Exercise Price: $33.00
|
(37
|
)
|
(125,060
|
)
|
(8,695
|
)
|
||||||
|
Expiration: January 2020,
|
||||||||||||
|
Exercise Price: $35.00
|
(37
|
)
|
(125,060
|
)
|
(5,550
|
)
|
||||||
|
Expiration: February 2020,
|
||||||||||||
|
Exercise Price: $32.00
|
(149
|
)
|
(503,620
|
)
|
(49,170
|
)
|
||||||
|
Expiration: February 2020,
|
||||||||||||
|
Exercise Price: $44.00
|
(260
|
)
|
(878,800
|
)
|
(9,100
|
)
|
||||||
|
SPDR S&P 500 ETF Trust
|
||||||||||||
|
Expiration: January 2020,
|
||||||||||||
|
Exercise Price: $322.00
|
(84
|
)
|
(2,703,624
|
)
|
(28,308
|
)
|
||||||
The accompanying notes are an integral part of these financial statements.
56
WCM Alternatives: Event-Driven Fund
SCHEDULE OF INVESTMENTS (continued)
Open Written Options
December 31, 2019
|
Contracts
|
||||||||||||
|
(100 shares
|
Notional
|
|||||||||||
|
per contract)
|
Amount
|
Value
|
||||||||||
|
T-Mobile USA, Inc.
|
||||||||||||
|
Expiration: January 2020,
|
||||||||||||
|
Exercise Price: $72.50
|
(15
|
)
|
$
|
(117,630
|
)
|
$
|
(9,225
|
)
|
||||
|
Expiration: January 2020,
|
||||||||||||
|
Exercise Price: $77.50
|
(92
|
)
|
(721,464
|
)
|
(17,204
|
)
|
||||||
|
Expiration: February 2020,
|
||||||||||||
|
Exercise Price: $72.50
|
(187
|
)
|
(1,466,454
|
)
|
(132,770
|
)
|
||||||
|
United Technologies Corporation
|
||||||||||||
|
Expiration: January 2020,
|
||||||||||||
|
Exercise Price: $130.00
|
(153
|
)
|
(2,291,328
|
)
|
(302,328
|
)
|
||||||
|
ViacomCBS, Inc. Class B
|
||||||||||||
|
Expiration: January 2020,
|
||||||||||||
|
Exercise Price: $42.50
|
(203
|
)
|
(851,991
|
)
|
(13,601
|
)
|
||||||
|
Expiration: March 2020,
|
||||||||||||
|
Exercise Price: $40.00
|
(852
|
)
|
(3,575,844
|
)
|
(285,420
|
)
|
||||||
|
(4,369,572
|
)
|
|||||||||||
|
WRITTEN PUT OPTIONS
|
||||||||||||
|
Bayer AG
|
||||||||||||
|
Expiration: February 2020,
|
||||||||||||
|
Exercise Price: EUR 68.00 (a)(b)
|
(848
|
)
|
(6,932,308
|
)
|
(94,170
|
)
|
||||||
|
SPDR S&P 500 ETF Trust
|
||||||||||||
|
Expiration: January 2020,
|
||||||||||||
|
Exercise Price: $303.00
|
(140
|
)
|
(4,506,040
|
)
|
(5,810
|
)
|
||||||
|
Expiration: February 2020,
|
||||||||||||
|
Exercise Price: $310.00
|
(56
|
)
|
(1,802,416
|
)
|
(14,728
|
)
|
||||||
|
VanEck Vectors Semiconductor ETF
|
||||||||||||
|
Expiration: February 2020,
|
||||||||||||
|
Exercise Price: $130.00
|
(76
|
)
|
(1,074,716
|
)
|
(11,856
|
)
|
||||||
|
(126,564
|
)
|
|||||||||||
|
TOTAL WRITTEN OPTIONS
|
||||||||||||
|
(Premiums received $4,180,510)
|
$
|
(4,496,136
|
)
|
|||||||||
ETF – Exchange-Traded Fund
EUR – Euro
|
(a)
|
Foreign Security.
|
|
(b)
|
Level 2 Security. Please see Note 2 in the Notes to the Financial Statements for more information.
|
The accompanying notes are an integral part of these financial statements.
57
WCM Alternatives: Event-Driven Fund
SCHEDULE OF INVESTMENTS
Forward Currency Exchange Contracts
December 31, 2019
|
USD Value at
|
USD Value at
|
Unrealized
|
|||||||||||||||||||||
|
Settlement
|
Currency to
|
December 31,
|
Currency to
|
December 31,
|
Appreciation
|
||||||||||||||||||
|
Date
|
Counterparty
|
be Delivered
|
2019
|
be Received
|
2019
|
(Depreciation)*
|
|||||||||||||||||
|
1/15/20
|
GS
|
148,625
|
EUR
|
$
|
166,872
|
166,446
|
USD
|
$
|
166,446
|
$
|
(426
|
)
|
|||||||||||
|
1/15/20
|
JPM
|
10,743,849
|
EUR
|
12,062,874
|
11,977,163
|
USD
|
11,977,163
|
(85,711
|
)
|
||||||||||||||
|
1/15/20
|
JPM
|
2,070,597
|
USD
|
2,070,597
|
1,877,700
|
EUR
|
2,108,226
|
37,629
|
|||||||||||||||
|
1/22/20
|
JPM
|
1,322,725
|
EUR
|
1,485,789
|
1,465,175
|
USD
|
1,465,175
|
(20,614
|
)
|
||||||||||||||
|
2/19/20
|
JPM
|
203,344
|
EUR
|
228,806
|
226,260
|
USD
|
226,260
|
(2,546
|
)
|
||||||||||||||
|
4/22/20
|
JPM
|
2,724,512
|
EUR
|
3,077,928
|
3,063,584
|
USD
|
3,063,584
|
(14,344
|
)
|
||||||||||||||
|
5/20/20
|
JPM
|
594,898
|
EUR
|
673,240
|
665,944
|
USD
|
665,944
|
(7,296
|
)
|
||||||||||||||
|
1/10/20
|
JPM
|
1,139,740
|
GBP
|
1,510,145
|
1,442,316
|
USD
|
1,442,316
|
(67,829
|
)
|
||||||||||||||
|
1/10/20
|
JPM
|
1,486,973
|
USD
|
1,486,973
|
1,139,740
|
GBP
|
1,510,145
|
23,172
|
|||||||||||||||
|
2/6/20
|
JPM
|
747,518
|
GBP
|
991,225
|
928,003
|
USD
|
928,003
|
(63,222
|
)
|
||||||||||||||
|
2/12/20
|
JPM
|
545,077
|
GBP
|
722,894
|
717,267
|
USD
|
717,267
|
(5,627
|
)
|
||||||||||||||
|
3/4/20
|
JPM
|
5,469,717
|
GBP
|
7,258,005
|
7,197,365
|
USD
|
7,197,365
|
(60,640
|
)
|
||||||||||||||
|
1/16/20
|
JPM
|
5,274,830
|
HKD
|
676,789
|
673,067
|
USD
|
673,067
|
(3,722
|
)
|
||||||||||||||
|
1/16/20
|
JPM
|
672,519
|
USD
|
672,519
|
5,274,830
|
HKD
|
676,790
|
4,271
|
|||||||||||||||
|
3/17/20
|
JPM
|
225,547
|
HKD
|
28,927
|
28,791
|
USD
|
28,791
|
(136
|
)
|
||||||||||||||
|
5/7/20
|
JPM
|
8,506,035
|
HKD
|
1,090,689
|
1,084,925
|
USD
|
1,084,925
|
(5,764
|
)
|
||||||||||||||
|
2/4/20
|
JPM
|
112,165,000
|
JPY
|
1,034,350
|
1,034,102
|
USD
|
1,034,102
|
(248
|
)
|
||||||||||||||
|
2/26/20
|
JPM
|
117,237,942
|
JPY
|
1,082,481
|
1,085,819
|
USD
|
1,085,819
|
3,338
|
|||||||||||||||
|
3/3/20
|
JPM
|
127,695,400
|
JPY
|
1,179,446
|
1,173,212
|
USD
|
1,173,212
|
(6,234
|
)
|
||||||||||||||
|
$
|
37,500,549
|
$
|
37,224,600
|
$
|
(275,949
|
)
|
|||||||||||||||||
EUR – Euro
GBP – British Pound
GS – Goldman Sachs & Co.
HKD – Hong Kong Dollar
JPM – JPMorgan Chase & Co., Inc.
JPY – Japanese Yen
USD – U.S. Dollar
|
*
|
Net unrealized appreciation (depreciation) is a receivable (payable).
|
The accompanying notes are an integral part of these financial statements.
58
WCM Alternatives: Event-Driven Fund
SCHEDULE OF INVESTMENTS (continued)
Open Swap Contracts
December 31, 2019
|
Pay/Receive
|
Unrealized
|
|||||||||||||||||
|
Counter-
|
Termination
|
on Financing
|
Payment
|
Notional
|
Appreciation
|
|||||||||||||
|
party
|
Security
|
Date
|
Rate
|
Financing Rate
|
Frequency
|
Shares
|
Amount
|
(Depreciation)*
|
||||||||||
|
LONG TOTAL RETURN SWAP CONTRACTS
|
||||||||||||||||||
|
JPM
|
Altran Technologies S.A.
|
6/25/20
|
Pay
|
0.400% +3 Month U.S. LIBOR
|
Quarterly
|
194,608
|
$
|
3,104,754
|
$
|
(16,894
|
)
|
|||||||
|
JPM
|
AT&T, Inc.
|
9/5/20
|
Pay
|
0.300% +3 Month U.S. LIBOR
|
Quarterly
|
3,000
|
107,779
|
9,356
|
||||||||||
|
BAML
|
Avon Products, Inc.
|
8/26/20
|
Pay
|
0.750% +1 Month U.S. LIBOR
|
Monthly
|
414,229
|
1,776,557
|
583,419
|
||||||||||
|
GS
|
Avon Products, Inc.
|
9/17/20
|
Pay
|
0.500% +1 Month U.S. LIBOR
|
Monthly
|
161,246
|
685,243
|
232,066
|
||||||||||
|
JPM
|
Axalta Coating
|
|||||||||||||||||
|
Systems Ltd.
|
10/28/20
|
Pay
|
0.300% +3 Month U.S. LIBOR
|
Quarterly
|
138,455
|
4,121,805
|
83,208
|
|||||||||||
|
JPM
|
The Blackstone
|
|||||||||||||||||
|
Group, Inc.
|
5/31/20
|
Pay
|
0.650% +3 Month U.S. LIBOR
|
Quarterly
|
58,432
|
2,211,651
|
1,054,535
|
|||||||||||
|
GS
|
Bolsas y Mercados
|
|||||||||||||||||
|
Espanoles
|
10/15/20
|
Pay
|
0.500% +1 Month U.S. LIBOR
|
Monthly
|
15,785
|
620,322
|
(12,894
|
)
|
||||||||||
|
JPM
|
Bolsas y Mercados
|
|||||||||||||||||
|
Espanoles
|
12/20/20
|
Pay
|
0.400% +3 Month U.S. LIBOR
|
Quarterly
|
1,712
|
66,184
|
(164
|
)
|
||||||||||
|
BAML
|
Bristol-Myers Squibb
|
|||||||||||||||||
|
Company
|
11/21/20
|
Pay
|
0.000%(1)
|
|
Monthly
|
25,034
|
—
|
(1)
|
75,352
|
|||||||||
|
JPM
|
China Agri-Industries
|
|||||||||||||||||
|
Holdings, Ltd.
|
12/10/20
|
Pay
|
0.400% +3 Month U.S. LIBOR
|
Quarterly
|
53,070
|
27,939
|
160
|
|||||||||||
|
JPM
|
Cobham plc
|
9/10/20
|
Pay
|
0.300% +3 Month U.S. LIBOR
|
Quarterly
|
3,061,101
|
6,062,059
|
591,993
|
||||||||||
|
BAML
|
Cobham plc
|
12/11/20
|
Pay
|
0.750% +1 Month U.S. LIBOR
|
Monthly
|
253,880
|
527,770
|
24,254
|
||||||||||
|
BAML
|
Cypress Semiconductor
|
|||||||||||||||||
|
Corporation
|
8/26/20
|
Pay
|
0.750% +1 Month U.S. LIBOR
|
Monthly
|
292,480
|
6,744,112
|
75,157
|
|||||||||||
|
JPM
|
Discovery Communications,
|
|||||||||||||||||
|
Inc. Class C
|
3/9/20
|
Pay
|
0.300% +3 Month U.S. LIBOR
|
Quarterly
|
10,767
|
292,539
|
35,461
|
|||||||||||
|
BAML
|
Dupont De Nemours, Inc.
|
4/2/20
|
Pay
|
0.400% +1 Month U.S. LIBOR
|
Monthly
|
2,280
|
181,917
|
(35,641
|
)
|
|||||||||
|
BAML
|
EI Group plc
|
9/27/20
|
Pay
|
0.450% +1 Month U.S. LIBOR
|
Monthly
|
262,287
|
910,851
|
74,637
|
||||||||||
|
BAML
|
Faurecia S.E.
|
11/14/20
|
Pay
|
0.350% +1 Month U.S. LIBOR
|
Monthly
|
3,371
|
176,823
|
4,696
|
||||||||||
|
BAML
|
Fiat Chrysler
|
|||||||||||||||||
|
Automobiles N.V.
|
11/14/20
|
Pay
|
0.350% +1 Month U.S. LIBOR
|
Monthly
|
83,025
|
1,271,441
|
(43,372
|
)
|
||||||||||
The accompanying notes are an integral part of these financial statements.
59
WCM Alternatives: Event-Driven Fund
SCHEDULE OF INVESTMENTS (continued)
Open Swap Contracts
December 31, 2019
|
Pay/Receive
|
Unrealized
|
|||||||||||||||
|
Counter-
|
Termination
|
on Financing
|
Payment
|
Notional
|
Appreciation
|
|||||||||||
|
party
|
Security
|
Date
|
Rate
|
Financing Rate
|
Frequency
|
Shares
|
Amount
|
(Depreciation)*
|
||||||||
|
JPM
|
First Trust Senior Floating
|
|||||||||||||||
|
Rate Income Fund II
|
12/6/20
|
Pay
|
0.800% +3 Month U.S. LIBOR
|
Quarterly
|
12,108
|
$
|
147,287
|
$
|
4,492
|
|||||||
|
JPM
|
Hilton Grand
|
|||||||||||||||
|
Vacations, Inc.
|
10/11/20
|
Pay
|
0.300% +3 Month U.S. LIBOR
|
Quarterly
|
139,448
|
4,637,854
|
153,241
|
|||||||||
|
BAML
|
Hitachi Chemical
|
|||||||||||||||
|
Company, Ltd.
|
12/23/20
|
Pay
|
0.500% +1 Month U.S. LIBOR
|
Monthly
|
15,213
|
636,579
|
3,818
|
|||||||||
|
JPM
|
Hitachi Chemical
|
|||||||||||||||
|
Company, Ltd.
|
12/30/20
|
Pay
|
0.400% +3 Month U.S. LIBOR
|
Quarterly
|
12,367
|
520,070
|
652
|
|||||||||
|
JPM
|
Huaneng Renewables
|
|||||||||||||||
|
Corporation, Ltd.
|
11/15/20
|
Pay
|
0.400% +3 Month U.S. LIBOR
|
Quarterly
|
2,683,292
|
1,020,279
|
22,066
|
|||||||||
|
JPM
|
IAC/InterActiveCorp
|
10/21/20
|
Pay
|
0.300% +3 Month U.S. LIBOR
|
Quarterly
|
15,000
|
3,380,850
|
352,504
|
||||||||
|
JPM
|
Innogy S.E.
|
6/6/20
|
Pay
|
0.400% +3 Month U.S. LIBOR
|
Quarterly
|
34,699
|
1,650,732
|
83,490
|
||||||||
|
JPM
|
Just Eat plc
|
12/12/20
|
Pay
|
0.300% +3 Month U.S. LIBOR
|
Quarterly
|
73,659
|
756,794
|
56,977
|
||||||||
|
JPM
|
Liberty Media
|
|||||||||||||||
|
Corporation – Liberty
|
||||||||||||||||
|
SiriusXM Class C
|
12/17/20
|
Pay
|
0.300% +3 Month U.S. LIBOR
|
Quarterly
|
11,359
|
535,479
|
10,957
|
|||||||||
|
GS
|
Liberty Property Trust
|
11/26/20
|
Pay
|
0.500% +1 Month U.S. LIBOR
|
Monthly
|
80,523
|
4,985,179
|
(158,684
|
)
|
|||||||
|
JPM
|
Line Corporation
|
11/20/20
|
Pay
|
0.400% +3 Month U.S. LIBOR
|
Quarterly
|
22,140
|
1,052,050
|
37,016
|
||||||||
|
JPM
|
The Madison Square
|
|||||||||||||||
|
Garden Company
|
||||||||||||||||
|
Class A
|
10/31/20
|
Pay
|
0.300% +3 Month U.S. LIBOR
|
Quarterly
|
16,300
|
4,350,796
|
440,259
|
|||||||||
|
JPM
|
Mellanox
|
|||||||||||||||
|
Technologies, Inc.
|
5/14/20
|
Pay
|
0.300% +3 Month U.S. LIBOR
|
Quarterly
|
28,335
|
3,320,371
|
(3,209
|
)
|
||||||||
|
JPM
|
Mylan N.V.
|
8/26/20
|
Pay
|
0.300% +3 Month U.S. LIBOR
|
Quarterly
|
148,800
|
2,795,952
|
192,202
|
||||||||
|
JPM
|
Osram Licht AG
|
12/6/20
|
Pay
|
0.400% +3 Month U.S. LIBOR
|
Quarterly
|
174,568
|
7,660,557
|
272,057
|
||||||||
|
BAML
|
Osram Licht AG
|
12/16/20
|
Pay
|
0.350% +1 Month U.S. LIBOR
|
Monthly
|
8,364
|
378,460
|
1,639
|
||||||||
|
GS
|
Osram Licht AG
|
12/17/20
|
Pay
|
0.500% +1 Month U.S. LIBOR
|
Monthly
|
37,366
|
1,691,619
|
6,834
|
||||||||
|
JPM
|
Renault S.A.
|
4/3/20
|
Pay
|
0.400% +3 Month U.S. LIBOR
|
Quarterly
|
25,418
|
1,502,409
|
(301,326
|
)
|
|||||||
The accompanying notes are an integral part of these financial statements.
60
WCM Alternatives: Event-Driven Fund
SCHEDULE OF INVESTMENTS (continued)
Open Swap Contracts
December 31, 2019
|
Pay/Receive
|
Unrealized
|
|||||||||||||||
|
Counter-
|
Termination
|
on Financing
|
Payment
|
Notional
|
Appreciation
|
|||||||||||
|
party
|
Security
|
Date
|
Rate
|
Financing Rate
|
Frequency
|
Shares
|
Amount
|
(Depreciation)*
|
||||||||
|
BAML
|
Renault S.A.
|
5/29/20
|
Pay
|
0.350% +1 Month U.S. LIBOR
|
Monthly
|
3,000
|
$
|
179,398
|
$
|
(37,554
|
)
|
|||||
|
JPM
|
SLM Corporation,
|
|||||||||||||||
|
4.311%, Series B
|
2/8/20
|
Pay
|
1.100% +3 Month U.S. LIBOR
|
Quarterly
|
35,769
|
2,378,639
|
(459,220
|
)
|
||||||||
|
BAML
|
Sophos Group plc
|
10/14/20
|
Pay
|
0.450% +1 Month U.S. LIBOR
|
Monthly
|
757,280
|
5,529,081
|
42,682
|
||||||||
|
JPM
|
Tallgrass Energy
|
|||||||||||||||
|
LP Class A
|
9/26/20
|
Pay
|
0.300% +3 Month U.S. LIBOR
|
Quarterly
|
9,439
|
189,354
|
19,252
|
|||||||||
|
GS
|
Tallgrass Energy
|
|||||||||||||||
|
LP Class A
|
11/13/20
|
Pay
|
0.500% +1 Month U.S. LIBOR
|
Monthly
|
133,384
|
2,807,198
|
140,457
|
|||||||||
|
JPM
|
United Technologies
|
|||||||||||||||
|
Corporation
|
8/7/20
|
Pay
|
0.300% +3 Month U.S. LIBOR
|
Quarterly
|
15,300
|
1,973,853
|
315,551
|
|||||||||
|
JPM
|
Unizo Holdings
|
|||||||||||||||
|
Company, Ltd.
|
11/8/20
|
Pay
|
0.400% +3 Month U.S. LIBOR
|
Quarterly
|
22,433
|
1,027,906
|
28,125
|
|||||||||
|
BAML
|
ViacomCBS, Inc. Class B
|
4/11/20
|
Pay
|
0.400% +1 Month U.S. LIBOR
|
Monthly
|
54,335
|
2,756,492
|
(477,564
|
)
|
|||||||
|
GS
|
Wright Medical
|
|||||||||||||||
|
Group N.V.
|
11/26/20
|
Pay
|
0.500% +1 Month U.S. LIBOR
|
Monthly
|
231,479
|
6,837,890
|
205,367
|
|||||||||
|
BAML
|
Zayo Group LLC /
|
|||||||||||||||
|
Zayo Capital, Inc.
|
5/13/20
|
Pay
|
0.750% +1 Month U.S. LIBOR
|
Monthly
|
232,969
|
7,723,391
|
344,071
|
|||||||||
|
SHORT TOTAL RETURN SWAP CONTRACTS
|
||||||||||||||||
|
BAML
|
AbbVie, Inc.
|
10/4/20
|
Receive
|
(0.175)% +1 Month U.S. LIBOR
|
Monthly
|
(55,619
|
)
|
(4,301,060
|
)
|
(621,798
|
)
|
|||||
|
JPM
|
Alibaba Group
|
|||||||||||||||
|
Holding Ltd. – ADR
|
6/11/20
|
Receive
|
(0.600)% +3 Month U.S. LIBOR
|
Quarterly
|
(1,089
|
)
|
(186,407
|
)
|
(44,462
|
)
|
||||||
|
GS
|
Centene Corporation
|
|||||||||||||||
|
Corporation
|
12/20/20
|
Receive
|
(0.350)% + U.S. Federal Funds
|
Monthly
|
(43,867
|
)
|
(2,716,683
|
)
|
(40,627
|
)
|
||||||
|
GS
|
The Charles Schwab
|
|||||||||||||||
|
Corporation
|
12/5/20
|
Receive
|
(0.350)% + U.S. Federal Funds
|
Monthly
|
(109,262
|
)
|
(5,317,262
|
)
|
124,229
|
|||||||
|
JPM
|
Daimler AG
|
4/3/20
|
Receive
|
(0.462)% +3 Month U.S. LIBOR
|
Quarterly
|
(1,525
|
)
|
(81,561
|
)
|
(2,840
|
)
|
|||||
|
JPM
|
Digital Realty Trust, Inc.
|
12/10/20
|
Receive
|
(0.600)% +3 Month U.S. LIBOR
|
Quarterly
|
(1,813
|
)
|
(213,191
|
)
|
(3,775
|
)
|
|||||
|
JPM
|
Discovery, Inc. Class A
|
10/28/20
|
Receive
|
(0.600)% +3 Month U.S. LIBOR
|
Quarterly
|
(10,767
|
)
|
(299,215
|
)
|
(53,125
|
)
|
|||||
The accompanying notes are an integral part of these financial statements.
61
WCM Alternatives: Event-Driven Fund
SCHEDULE OF INVESTMENTS (continued)
Open Swap Contracts
December 31, 2019
|
Pay/Receive
|
Unrealized
|
||||||||||||||||
|
Counter-
|
Termination
|
on Financing
|
Payment
|
Notional
|
Appreciation
|
||||||||||||
|
party
|
Security
|
Date
|
Rate
|
Financing Rate
|
Frequency
|
Shares
|
Amount
|
(Depreciation)*
|
|||||||||
|
GS
|
Eldorado Resorts, Inc.
|
12/20/20
|
Receive
|
(0.420)% + U.S. Federal Funds
|
Monthly
|
(40,820
|
)
|
$
|
(2,353,273
|
)
|
$
|
(80,744
|
)
|
||||
|
GS
|
Flutter Entertainment
|
10/2/20
|
Receive
|
(0.550)% + U.S. Federal Funds
|
Monthly
|
(27,119
|
)
|
(2,877,626
|
)
|
(416,619
|
)
|
||||||
|
JPM
|
Flutter Entertainment
|
10/23/20
|
Receive
|
(0.619)% +3 Month U.S. LIBOR
|
Quarterly
|
(37,763
|
)
|
(3,731,152
|
)
|
(860,311
|
)
|
||||||
|
BAML
|
Natura Cosmeticos S.A.
|
8/26/20
|
Pay
|
(4.000)% +1 Month U.S. LIBOR
|
Monthly
|
(248,662
|
)
|
(1,987,027
|
)
|
(408,624
|
)
|
||||||
|
GS
|
Natura Cosmeticos S.A.
|
9/17/20
|
Pay
|
(5.500)% + U.S. Federal Funds
|
Monthly
|
(96,726
|
)
|
(756,514
|
)
|
(175,516
|
)
|
||||||
|
JPM
|
Nissan Motor
|
||||||||||||||||
|
Company Ltd.
|
4/3/20
|
Receive
|
(0.462)% +3 Month U.S. LIBOR
|
Quarterly
|
(171,229
|
)
|
(1,168,027
|
)
|
166,343
|
||||||||
|
BAML
|
Peugeot S.A.
|
11/14/20
|
Receive
|
(0.350)% +1 Month U.S. LIBOR
|
Monthly
|
(46,961
|
)
|
(1,183,766
|
)
|
62,187
|
|||||||
|
GS
|
Prologis, Inc.
|
10/31/20
|
Receive
|
(0.350)% + U.S. Federal Funds
|
Monthly
|
(59,152
|
)
|
(5,219,786
|
)
|
(46,111
|
)
|
||||||
|
$
|
1,629,688
|
||||||||||||||||
ADR – American Depository Receipt
BAML – Bank of America Merrill Lynch & Co., Inc.
GS – Goldman, Sachs & Co.
JPM – JPMorgan Chase & Co., Inc.
LIBOR – London Interbank Offered Rate
plc – Public Limited Company
U.S. Federal Funds – U.S. Federal Funds Effective Rate
|
*
|
Based on the net swap value held at each counterparty, unrealized appreciation (depreciation) is a receivable (payable).
|
|
(1)
|
Security held is the direct result of a corporate action. There is no associated financing rate and the security is held with a zero cost basis.
|
The accompanying notes are an integral part of these financial statements.
62
WCM Alternatives: Credit Event Fund
SCHEDULE OF INVESTMENTS
December 31, 2019
|
Shares
|
Value
|
|||||||
|
LONG INVESTMENTS — 88.21%
|
||||||||
|
COMMON STOCKS — 3.64%
|
||||||||
|
REITS — 3.64%
|
||||||||
|
Broadmark Realty Capital, Inc.
|
14,739
|
$
|
187,922
|
|||||
|
TOTAL COMMON STOCKS (Cost $161,688)
|
187,922
|
|||||||
|
SPECIAL PURPOSE ACQUISITION
|
||||||||
|
COMPANIES — 20.57% (a)
|
||||||||
|
Act II Global Acquisition
|
||||||||
|
Corporation Class A (b)
|
11,468
|
116,056
|
||||||
|
Alberton Acquisition Corporation (b)
|
19,986
|
206,855
|
||||||
|
CHP Merger Corporation
|
899
|
9,143
|
||||||
|
CIIG Merger Corporation
|
7,118
|
72,319
|
||||||
|
Haymaker Acquisition Corporation II Class A
|
8,028
|
80,689
|
||||||
|
Hennessy Capital Acquisition
|
||||||||
|
Corporation IV Class A
|
7,720
|
78,435
|
||||||
|
Juniper Industrial Holdings, Inc. (e)
|
3,556
|
36,325
|
||||||
|
Legacy Acquisition Corporation Class A
|
8,245
|
84,676
|
||||||
|
Leisure Acquisition Corporation
|
116
|
1,209
|
||||||
|
Merida Merger Corporation I
|
4,621
|
45,009
|
||||||
|
Mudrick Capital Acquisition
|
||||||||
|
Corporation Class A (e)
|
1,950
|
20,134
|
||||||
|
PropTech Acquisition Corporation (e)
|
4,600
|
47,564
|
||||||
|
Software Acquisition Group, Inc.
|
836
|
8,494
|
||||||
|
Tuscan Holdings Corporation
|
10,713
|
106,701
|
||||||
|
Tuscan Holdings Corporation II
|
15,000
|
147,900
|
||||||
|
TOTAL SPECIAL PURPOSE ACQUISITION
|
||||||||
|
COMPANIES (Cost $1,015,392)
|
1,061,509
|
|||||||
|
CLOSED-END FUNDS — 0.05%
|
||||||||
|
Ares Dynamic Credit Allocation Fund
|
173
|
2,656
|
||||||
|
TOTAL CLOSED-END FUNDS (Cost $2,766)
|
2,656
|
|||||||
|
PREFERRED STOCKS — 7.97%
|
||||||||
|
Fannie Mae, 8.250%, Series S (a)
|
3,654
|
43,665
|
||||||
|
Freddie Mac, 8.375%, Series Z (a)
|
11,516
|
136,465
|
||||||
|
GMAC Capital Trust I, 7.695% (3 Month U.S.
|
||||||||
|
LIBOR +5.785%), 2/15/2040 Series 2 (g)
|
8,875
|
231,193
|
||||||
|
TOTAL PREFERRED STOCKS (Cost $405,095)
|
411,323
|
|||||||
|
WARRANTS — 1.56% (a)
|
||||||||
|
Act II Global Acquisition Corporation Class A
|
||||||||
|
Expiration: April 2024,
|
||||||||
|
Exercise Price: $11.50 (b)
|
5,734
|
5,734
|
||||||
The accompanying notes are an integral part of these financial statements.
63
WCM Alternatives: Credit Event Fund
SCHEDULE OF INVESTMENTS (continued)
December 31, 2019
|
Shares
|
Value
|
|||||||
|
CF Finance Acquisition Corporation Class A
|
||||||||
|
Expiration: April 2025,
|
||||||||
|
Exercise Price: $11.50 (e)
|
11,580
|
$
|
10,249
|
|||||
|
FinTech Acquisition Corporation III Class A
|
||||||||
|
Expiration: December 2023,
|
||||||||
|
Exercise Price: $11.50
|
7,553
|
10,375
|
||||||
|
Haymaker Acquisition Corporation II Class A
|
||||||||
|
Expiration: October 2026,
|
||||||||
|
Exercise Price: $11.50
|
2,676
|
3,773
|
||||||
|
Hennessy Capital Acquisition
|
||||||||
|
Corporation IV Class A
|
||||||||
|
Expiration: September 2025,
|
||||||||
|
Exercise Price: $11.50
|
5,790
|
4,632
|
||||||
|
Merida Merger Corporation I
|
||||||||
|
Expiration: November 2026,
|
||||||||
|
Exercise Price: $11.50
|
2,310
|
1,152
|
||||||
|
Mudrick Capital Acquisition Corporation Class A
|
||||||||
|
Expiration: March 2025,
|
||||||||
|
Exercise Price: $11.50
|
1,950
|
956
|
||||||
|
Pivotal Acquisition Corporation
|
||||||||
|
Expiration: December 2025,
|
||||||||
|
Exercise Price: $11.50 (e)
|
32,598
|
19,558
|
||||||
|
Pure Acquisition Corporation
|
||||||||
|
Expiration: April 2023,
|
||||||||
|
Exercise Price: $11.50
|
7,903
|
7,792
|
||||||
|
Repay Holdings Corporation
|
||||||||
|
Expiration: July 2024,
|
||||||||
|
Exercise Price: $11.50
|
5,911
|
6,620
|
||||||
|
Tuscan Holdings Corporation
|
||||||||
|
Expiration: April 2026,
|
||||||||
|
Exercise Price: $11.50 (e)
|
10,713
|
6,160
|
||||||
|
Tuscan Holdings Corporation II
|
||||||||
|
Expiration: July 2025,
|
||||||||
|
Exercise Price: $11.50 (e)
|
7,500
|
3,375
|
||||||
|
TOTAL WARRANTS (Cost $86,699)
|
80,376
|
|||||||
|
Principal
|
||||||||
|
Amount
|
||||||||
|
BANK LOANS — 13.31% (e)(g)
|
||||||||
|
Avaya Holdings Corporation
|
||||||||
|
5.990% (1 Month U.S.
|
||||||||
|
LIBOR + 4.250%), 12/16/2024
|
$
|
148,443
|
146,093
|
|||||
|
Cengage Learning Holdings II, Inc.
|
||||||||
|
6.049% (1 Month U.S.
|
||||||||
|
LIBOR + 4.250%), 6/7/2023
|
98,231
|
93,811
|
||||||
The accompanying notes are an integral part of these financial statements.
64
WCM Alternatives: Credit Event Fund
SCHEDULE OF INVESTMENTS (continued)
December 31, 2019
|
Principal
|
||||||||
|
Amount
|
Value
|
|||||||
|
Heritage Power LLC
|
||||||||
|
8.205% (6 Month U.S.
|
||||||||
|
LIBOR + 6.000%), 7/30/2026
|
$
|
233,415
|
$
|
224,078
|
||||
|
McGraw-Hill Global Education Holdings LLC
|
||||||||
|
5.799% (1 Month U.S.
|
||||||||
|
LIBOR + 4.000%), 5/4/2022
|
74,293
|
71,414
|
||||||
|
Refinitiv US Holdings, Inc.
|
||||||||
|
5.049% (1 Month U.S.
|
||||||||
|
LIBOR + 3.250%), 10/1/2025
|
150,241
|
151,591
|
||||||
|
TOTAL BANK LOANS (Cost $694,042)
|
686,987
|
|||||||
|
CONVERTIBLE BONDS — 7.32% (e)
|
||||||||
|
Caesars Entertainment Corporation
|
||||||||
|
5.000%, 10/1/2024
|
71,000
|
136,764
|
||||||
|
NII Holdings, Inc.
|
||||||||
|
4.250%, 8/15/2023 (f)
|
227,000
|
241,188
|
||||||
|
TOTAL CONVERTIBLE BONDS (Cost $339,516)
|
377,952
|
|||||||
|
CORPORATE BONDS — 29.00% (e)
|
||||||||
|
Acadia Healthcare Company, Inc.
|
||||||||
|
5.125%, 7/1/2022 (d)
|
153,000
|
154,578
|
||||||
|
APX Group, Inc.
|
||||||||
|
7.875%, 12/1/2022
|
141,000
|
142,585
|
||||||
|
CEC Entertainment, Inc.
|
||||||||
|
8.000%, 2/15/2022
|
188,000
|
185,709
|
||||||
|
Cincinnati Bell, Inc.
|
||||||||
|
7.000%, 7/15/2024 (f)
|
15,000
|
15,769
|
||||||
|
EIG Investors Corporation
|
||||||||
|
10.875%, 2/1/2024
|
45,000
|
45,019
|
||||||
|
Nationstar Mortgage LLC /
|
||||||||
|
Nationstar Capital Corporation
|
||||||||
|
6.500%, 7/1/2021
|
21,000
|
21,113
|
||||||
|
6.500%, 6/1/2022
|
16,000
|
16,041
|
||||||
|
Nielsen Finance LLC / Nielsen Finance Company
|
||||||||
|
5.000%, 4/15/2022 (d)(f)
|
203,000
|
204,123
|
||||||
|
Refinitiv U.S. Holdings, Inc.
|
||||||||
|
8.250%, 11/15/2026 (f)
|
169,000
|
190,648
|
||||||
|
SRC Energy, Inc.
|
||||||||
|
6.250%, 12/1/2025
|
201,000
|
203,008
|
||||||
|
T-Mobile USA, Inc.
|
||||||||
|
6.375%, 3/1/2025
|
34,000
|
35,204
|
||||||
|
Vertiv Group Corporation
|
||||||||
|
9.250%, 10/15/2024 (f)
|
263,000
|
283,272
|
||||||
|
TOTAL CORPORATE BONDS (Cost $1,487,296)
|
1,497,069
|
|||||||
The accompanying notes are an integral part of these financial statements.
65
WCM Alternatives: Credit Event Fund
SCHEDULE OF INVESTMENTS (continued)
December 31, 2019
|
Shares
|
Value
|
|||||||
|
ESCROW NOTES — 2.48% (a)(e)
|
||||||||
|
Altaba, Inc.
|
6,174
|
$
|
127,853
|
|||||
|
TOTAL ESCROW NOTES (Cost $122,245)
|
127,853
|
|||||||
|
SHORT-TERM INVESTMENTS — 2.31%
|
||||||||
|
MONEY MARKET FUNDS — 2.31% (c)
|
||||||||
|
Fidelity Institutional Government Portfolio,
|
||||||||
|
Institutional Share Class, 1.49%
|
4,109
|
4,109
|
||||||
|
JPMorgan Prime Money Market Fund,
|
||||||||
|
Institutional Share Class, 1.75%
|
114,895
|
114,929
|
||||||
|
TOTAL SHORT-TERM INVESTMENTS
|
||||||||
|
(Cost $119,038)
|
119,038
|
|||||||
|
TOTAL LONG INVESTMENTS
|
||||||||
|
(Cost $4,433,777) — 88.21%
|
4,552,685
|
|||||||
|
Principal
|
||||||||
|
Amount
|
||||||||
|
SHORT INVESTMENTS — (1.04)%
|
||||||||
|
CORPORATE BONDS — (1.04)% (e)
|
||||||||
|
APX Group, Inc.
|
$
|
(57,000
|
)
|
(53,746
|
)
|
|||
|
TOTAL CORPORATE BONDS
|
||||||||
|
(Proceeds $51,386)
|
(53,746
|
)
|
||||||
|
TOTAL SHORT INVESTMENTS
|
||||||||
|
(Proceeds $51,386) — (1.04)%
|
(53,746
|
)
|
||||||
|
TOTAL NET INVESTMENTS
|
||||||||
|
(Cost $4,382,391) — 87.17%
|
4,498,939
|
|||||||
|
OTHER ASSETS IN EXCESS
|
||||||||
|
OF LIABILITIES — 12.83%
|
662,116
|
|||||||
|
TOTAL NET ASSETS — 100.00%
|
$
|
5,161,055
|
||||||
LIBOR – London Interbank Offered Rate
REITs – Real Estate Investment Trusts
|
(a)
|
Non-income producing security.
|
|
(b)
|
Foreign Security.
|
|
(c)
|
The rate quoted is the annualized seven-day yield as of December 31, 2019.
|
The accompanying notes are an integral part of these financial statements.
66
WCM Alternatives: Credit Event Fund
SCHEDULE OF INVESTMENTS (continued)
December 31, 2019
|
(d)
|
All or a portion of the shares have been committed as collateral for open securities sold short and swap contracts.
|
|
(e)
|
Level 2 Security. Please see Note 2 in the Notes to the Financial Statements for more information.
|
|
(f)
|
Security exempt from registration under Rule 144A of the Securities Act of 1933. These securities may be resold in transactions exempt from registration normally to qualified institutional buyers. As of December 31, 2019, these securities
represent 18.12% of total net assets.
|
|
(g)
|
The coupon rate shown on variable rate securities represents the rate as of December 31, 2019.
|
The Global Industry Classification Standard (GICS®) was developed by and/or is the exclusive property of MSCI, Inc. and Standard & Poor’s Financial Services LLC
(“S&P”). GICS is a service mark of MSCI and S&P and has been licensed for use by Fund Services.
The accompanying notes are an integral part of these financial statements.
67
WCM Alternatives: Credit Event Fund
SCHEDULE OF INVESTMENTS (continued)
Open Swap Contracts
December 31, 2019
|
Pay/Receive
|
Unrealized
|
||||||||||||||
|
Counter-
|
Termination
|
on Financing
|
Payment
|
Notional
|
Appreciation
|
||||||||||
|
party
|
Security
|
Date
|
Rate
|
Financing Rate
|
Frequency
|
Shares
|
Amount
|
(Depreciation)*
|
|||||||
|
LONG TOTAL RETURN SWAP CONTRACTS
|
|||||||||||||||
|
JPM
|
Apollo Tactical Income
|
||||||||||||||
|
Fund, Inc.
|
12/31/20
|
Pay
|
0.300% + 3 Month U.S. LIBOR
|
Quarterly
|
280
|
$
|
4,248
|
$
|
(23
|
)
|
|||||
|
JPM
|
BlackRock Debt
|
||||||||||||||
|
Strategies Fund, Inc.
|
5/23/20
|
Pay
|
0.800% + 3 Month U.S. LIBOR
|
Quarterly
|
2,759
|
29,604
|
1,261
|
||||||||
|
JPM
|
BlackRock Floating
|
||||||||||||||
|
Rate Income
|
|||||||||||||||
|
Strategies Fund, Inc.
|
8/30/20
|
Pay
|
0.300% + 3 Month U.S. LIBOR
|
Quarterly
|
2,208
|
27,512
|
2,137
|
||||||||
|
JPM
|
BlackRock MuniYield
|
||||||||||||||
|
Quality Fund III, Inc.
|
10/4/20
|
Pay
|
0.300% + 3 Month U.S. LIBOR
|
Quarterly
|
3,198
|
43,740
|
(609
|
)
|
|||||||
|
GS
|
CF Finance Acquisition
|
||||||||||||||
|
Corporation Class A
|
11/19/20
|
Pay
|
1.100% +1 Month U.S. LIBOR
|
Monthly
|
15,440
|
157,179
|
574
|
||||||||
|
JPM
|
Colony Capital, Inc.,
|
||||||||||||||
|
8.750%, Series E
|
4/30/20
|
Pay
|
0.753% + 3 Month U.S. LIBOR
|
Quarterly
|
8,113
|
203,481
|
1,538
|
||||||||
|
JPM
|
Eaton Vance Floating-
|
||||||||||||||
|
Rate Income Trust
|
3/18/20
|
Pay
|
0.800% + 3 Month U.S. LIBOR
|
Quarterly
|
2,062
|
28,394
|
(137
|
)
|
|||||||
|
JPM
|
Eaton Vance Senior
|
||||||||||||||
|
Floating- Rate
|
|||||||||||||||
|
Income Trust
|
8/30/20
|
Pay
|
1.000% + 3 Month U.S. LIBOR
|
Quarterly
|
1,421
|
18,331
|
900
|
||||||||
|
GS
|
FinTech Acquisition
|
||||||||||||||
|
Corporation III Class A
|
11/19/20
|
Pay
|
1.100% +1 Month U.S. LIBOR
|
Monthly
|
15,106
|
151,815
|
568
|
||||||||
|
JPM
|
First Trust Senior Floating
|
||||||||||||||
|
Rate Income Fund II
|
3/18/20
|
Pay
|
0.800% + 3 Month U.S. LIBOR
|
Quarterly
|
2,636
|
31,553
|
1,491
|
||||||||
|
JPM
|
Invesco Dynamic Credit
|
||||||||||||||
|
Opportunities Fund
|
9/3/20
|
Pay
|
0.800% + 3 Month U.S. LIBOR
|
Quarterly
|
2,954
|
32,317
|
1,172
|
||||||||
|
JPM
|
Invesco Municipal
|
||||||||||||||
|
Opportunity Trust
|
3/13/20
|
Pay
|
0.300% + 3 Month U.S. LIBOR
|
Quarterly
|
865
|
10,348
|
333
|
||||||||
|
JPM
|
Invesco Senior
|
||||||||||||||
|
Income Trust
|
8/7/20
|
Pay
|
1.000% + 3 Month U.S. LIBOR
|
Quarterly
|
10,274
|
42,596
|
1,425
|
||||||||
The accompanying notes are an integral part of these financial statements.
68
WCM Alternatives: Credit Event Fund
SCHEDULE OF INVESTMENTS (continued)
Open Swap Contracts
December 31, 2019
|
Pay/Receive
|
Unrealized
|
||||||||||||||
|
Counter-
|
Termination
|
on Financing
|
Payment
|
Notional
|
Appreciation
|
||||||||||
|
party
|
Security
|
Date
|
Rate
|
Financing Rate
|
Frequency
|
Shares
|
Amount
|
(Depreciation)*
|
|||||||
|
JPM
|
Invesco Value Municipal
|
||||||||||||||
|
Income Trust
|
3/13/20
|
Pay
|
0.300% + 3 Month U.S. LIBOR
|
Quarterly
|
721
|
$
|
10,572
|
$
|
463
|
||||||
|
JPM
|
Nuveen AMT-Free
|
||||||||||||||
|
Municipal Credit
|
|||||||||||||||
|
Income Fund
|
11/27/20
|
Pay
|
0.300% + 3 Month U.S. LIBOR
|
Quarterly
|
706
|
11,388
|
370
|
||||||||
|
JPM
|
Nuveen AMT-Free
|
||||||||||||||
|
Quality Municipal
|
|||||||||||||||
|
Income Fund
|
10/4/20
|
Pay
|
0.300% + 3 Month U.S. LIBOR
|
Quarterly
|
3,608
|
51,354
|
479
|
||||||||
|
JPM
|
Nuveen California
|
||||||||||||||
|
Quality Municipal
|
|||||||||||||||
|
Income Fund
|
11/27/20
|
Pay
|
0.300% + 3 Month U.S. LIBOR
|
Quarterly
|
768
|
11,497
|
(73
|
)
|
|||||||
|
JPM
|
Nuveen Credit
|
||||||||||||||
|
Strategies Income Fund
|
5/23/20
|
Pay
|
0.800% + 3 Month U.S. LIBOR
|
Quarterly
|
8,620
|
65,998
|
38
|
||||||||
|
JPM
|
Nuveen Intermediate
|
||||||||||||||
|
Duration Municipal
|
|||||||||||||||
|
Term Fund
|
10/4/20
|
Pay
|
0.300% + 3 Month U.S. LIBOR
|
Quarterly
|
3,184
|
43,770
|
476
|
||||||||
|
JPM
|
Nuveen Municipal Credit
|
||||||||||||||
|
Income Fund
|
10/4/20
|
Pay
|
0.300% + 3 Month U.S. LIBOR
|
Quarterly
|
2,678
|
43,551
|
245
|
||||||||
|
JPM
|
Nuveen New York
|
||||||||||||||
|
AMT-Free Quality
|
|||||||||||||||
|
Municipal Income Fund
|
10/4/20
|
Pay
|
0.300% + 3 Month U.S. LIBOR
|
Quarterly
|
3,233
|
43,760
|
69
|
||||||||
|
JPM
|
Nuveen Preferred and
|
||||||||||||||
|
Income 2022 Term Fund
|
11/29/20
|
Pay
|
0.300% + 3 Month U.S. LIBOR
|
Quarterly
|
447
|
11,049
|
198
|
||||||||
|
GS
|
Pure Acquisition
|
||||||||||||||
|
Corporation
|
11/19/20
|
Pay
|
1.100% +1 Month U.S. LIBOR
|
Monthly
|
16,153
|
166,860
|
108
|
||||||||
|
JPM
|
SLM Corporation,
|
||||||||||||||
|
4.311%, Series B
|
2/8/20
|
Pay
|
1.100% + 3 Month U.S. LIBOR
|
Quarterly
|
2,007
|
133,465
|
(25,767
|
)
|
|||||||
|
JPM
|
Voya Prime
|
||||||||||||||
|
Rate Trust
|
8/1/20
|
Pay
|
1.000% + 3 Month U.S. LIBOR
|
Quarterly
|
12,008
|
56,354
|
3,733
|
||||||||
The accompanying notes are an integral part of these financial statements.
69
WCM Alternatives: Credit Event Fund
SCHEDULE OF INVESTMENTS (continued)
Open Swap Contracts
December 31, 2019
|
Pay/Receive
|
Unrealized
|
||||||||||||||||
|
Counter-
|
|
Termination
|
on Financing
|
Payment
|
Notional
|
Appreciation
|
|||||||||||
|
party
|
Security
|
Date
|
Rate
|
Financing Rate
|
Frequency
|
Shares
|
Amount
|
(Depreciation)*
|
|||||||||
|
SHORT TOTAL RETURN SWAP CONTRACTS
|
|||||||||||||||||
|
JPM
|
Alibaba Group
|
||||||||||||||||
|
Holding Ltd. – ADR
|
5/8/20
|
Receive
|
(0.600)% +3 Month U.S. LIBOR
|
Quarterly
|
(7
|
)
|
$
|
(1,260
|
)
|
$
|
(224
|
)
|
|||||
|
GS
|
Eldorado Resorts, Inc.
|
12/20/20
|
Receive
|
(0.420)% + U.S. Federal Funds
|
Monthly
|
(902
|
)
|
(52,000
|
)
|
(1,782
|
)
|
||||||
|
$
|
(11,037
|
)
|
|||||||||||||||
ADR – American Depository Receipt
GS – Goldman, Sachs & Co.
JPM – JPMorgan Chase & Co., Inc.
LIBOR – London Interbank Offered Rate
U.S. Federal Funds – U.S. Federal Funds Effective Rate
|
*
|
Based on the net swap value held at each counterparty, unrealized appreciation (depreciation) is a receivable (payable).
|
The accompanying notes are an integral part of these financial statements.
70
(This Page Intentionally Left Blank.)
71
The Merger Fund and Westchester Capital Funds
STATEMENTS OF ASSETS AND LIABILITIES
December 31, 2019
|
WCM Alternatives:
|
WCM Alternatives:
|
|||||||||||
|
The Merger Fund
|
Event-Driven Fund
|
Credit Event Fund
|
||||||||||
|
ASSETS:
|
||||||||||||
|
Investments, at value (Cost
|
||||||||||||
|
$3,085,198,710, $216,167,980,
|
||||||||||||
|
and $4,433,777, respectively)*
|
$
|
3,243,424,639
|
$
|
223,271,236
|
$
|
4,552,685
|
||||||
|
Investment of cash collateral
|
||||||||||||
|
from securities loaned
|
||||||||||||
|
(Cost $104,867,573,
|
||||||||||||
|
$—, and $—, respectively)
|
104,867,573
|
—
|
—
|
|||||||||
|
Cash held in foreign currency
|
||||||||||||
|
(Cost $—, $10,008,
|
||||||||||||
|
and $—, respectively)
|
—
|
10,030
|
—
|
|||||||||
|
Deposits at brokers for
|
||||||||||||
|
securities sold short
|
9,276,328
|
5,206,273
|
55,029
|
|||||||||
|
Deposit at brokers for
|
||||||||||||
|
other investments
|
10,059,660
|
—
|
—
|
|||||||||
|
Receivable for swap contracts
|
4,270,240
|
2,184,571
|
—
|
|||||||||
|
Receivable for fund shares issued
|
17,149,960
|
2,155,146
|
100,000
|
|||||||||
|
Dividends and interest receivable
|
6,639,049
|
664,332
|
34,606
|
|||||||||
|
Receivable for investments sold
|
2,963,881
|
232,253
|
494,799
|
|||||||||
|
Receivable for securities
|
||||||||||||
|
lending income (Note 8)
|
18,288
|
—
|
—
|
|||||||||
|
Receivable from
|
||||||||||||
|
investment advisor
|
—
|
—
|
8,342
|
|||||||||
|
Prepaid expenses
|
||||||||||||
|
and other receivables
|
85,506
|
25,069
|
25,428
|
|||||||||
|
Total Assets
|
3,398,755,124
|
233,748,910
|
5,270,889
|
|||||||||
|
LIABILITIES:
|
||||||||||||
|
Securities sold short, at value
|
||||||||||||
|
(Proceeds of $10,789,323,
|
||||||||||||
|
$4,862,208, and
|
||||||||||||
|
$51,386, respectively)
|
12,067,601
|
5,296,608
|
53,746
|
|||||||||
|
Written option contracts, at value
|
||||||||||||
|
(Premiums received $34,445,568,
|
||||||||||||
|
$4,180,510, and $—, respectively)
|
43,793,639
|
4,496,136
|
—
|
|||||||||
|
Payable for forward currency
|
||||||||||||
|
exchange contracts
|
2,498,197
|
275,949
|
—
|
|||||||||
|
Payable for swap contracts
|
15,876,059
|
554,883
|
11,037
|
|||||||||
|
Payable for collateral received
|
||||||||||||
|
on securities loaned (Note 8)
|
104,867,573
|
—
|
—
|
|||||||||
|
Payable for investments purchased
|
21,687,410
|
2,363,915
|
800
|
|||||||||
|
Payable to the investment adviser
|
2,614,193
|
226,116
|
—
|
|||||||||
|
Payable for fund shares redeemed
|
1,647,811
|
45,337
|
—
|
|||||||||
|
Distribution fees payable
|
216,849
|
3,978
|
96
|
|||||||||
|
Dividends and interest payable
|
193,638
|
44,540
|
1,470
|
|||||||||
|
Payable to brokers
|
—
|
1,739,065
|
14,546
|
|||||||||
|
Accrued expenses
|
||||||||||||
|
and other liabilities
|
933,441
|
98,623
|
28,139
|
|||||||||
|
Total Liabilities
|
206,396,411
|
15,145,150
|
109,834
|
|||||||||
|
NET ASSETS
|
$
|
3,192,358,713
|
$
|
218,603,760
|
$
|
5,161,055
|
||||||
The accompanying notes are an integral part of these financial statements.
72
The Merger Fund and Westchester Capital Funds
STATEMENTS OF ASSETS AND LIABILITIES (continued)
December 31, 2019
|
WCM Alternatives:
|
WCM Alternatives:
|
|||||||||||
|
The Merger Fund
|
Event-Driven Fund
|
Credit Event Fund
|
||||||||||
|
NET ASSETS CONSISTS OF:
|
||||||||||||
|
Paid-in capital
|
$
|
3,077,887,144
|
$
|
205,860,586
|
$
|
5,003,591
|
||||||
|
Distributable earnings
|
114,471,569
|
12,743,174
|
157,464
|
|||||||||
|
Total Net Assets
|
$
|
3,192,358,713
|
$
|
218,603,760
|
$
|
5,161,055
|
||||||
|
Investor Class
|
||||||||||||
|
Net assets
|
$
|
1,031,357,225
|
$
|
19,352,330
|
$
|
463,352
|
||||||
|
Shares outstanding
|
60,059,178
|
1,763,744
|
44,425
|
|||||||||
|
Net asset value and
|
||||||||||||
|
offering price per share**
|
$
|
17.17
|
$
|
10.97
|
$
|
10.43
|
||||||
|
Institutional Class
|
||||||||||||
|
Net assets
|
$
|
2,161,001,488
|
$
|
199,251,430
|
$
|
4,697,703
|
||||||
|
Shares outstanding
|
126,380,967
|
18,105,012
|
449,153
|
|||||||||
|
Net asset value and
|
||||||||||||
|
offering price per share**
|
$
|
17.10
|
$
|
11.01
|
$
|
10.46
|
||||||
|
*
|
Includes securities on loan with a value of $101,702,188 at December 31, 2019.
|
|
|
**
|
The redemption price per share may vary based on the length of time a shareholder holds Fund shares.
|
The accompanying notes are an integral part of these financial statements.
73
The Merger Fund and Westchester Capital Funds
STATEMENTS OF OPERATIONS
For the Year Ended December 31, 2019
|
WCM Alternatives:
|
WCM Alternatives:
|
|||||||||||
|
The Merger Fund
|
Event-Driven Fund
|
Credit Event Fund
|
||||||||||
|
INVESTMENT INCOME:
|
||||||||||||
|
Interest
|
$
|
48,734,064
|
$
|
3,334,025
|
$
|
153,900
|
||||||
|
Dividend income on long positions
|
||||||||||||
|
(net of foreign withholding
|
||||||||||||
|
taxes of $48,723, $4,062,
|
||||||||||||
|
and $—, respectively)
|
27,897,941
|
1,545,351
|
7,059
|
|||||||||
|
Securities lending income,
|
||||||||||||
|
net (Note 8)
|
94,586
|
—
|
—
|
|||||||||
|
Total investment income
|
76,726,591
|
4,879,376
|
160,959
|
|||||||||
|
EXPENSES:
|
||||||||||||
|
Investment advisory fees
|
30,392,066
|
2,325,535
|
41,260
|
|||||||||
|
Professional fees
|
3,781,211
|
178,133
|
65,357
|
|||||||||
|
Distribution fees (Investor Class)
|
2,943,831
|
37,730
|
318
|
|||||||||
|
Sub transfer agent fees
|
||||||||||||
|
(Institutional Class)
|
1,516,074
|
174,941
|
1,048
|
|||||||||
|
Sub transfer agent fees
|
||||||||||||
|
(Investor Class)
|
1,423,588
|
17,022
|
86
|
|||||||||
|
Administration fees
|
998,373
|
66,720
|
14,783
|
|||||||||
|
Reports to shareholders
|
445,050
|
33,925
|
1,125
|
|||||||||
|
Transfer agent and shareholder
|
||||||||||||
|
servicing agent fees
|
442,350
|
26,510
|
3,535
|
|||||||||
|
Fund accounting expenses
|
306,913
|
56,507
|
5,020
|
|||||||||
|
Custody fees
|
281,711
|
36,561
|
4,063
|
|||||||||
|
Trustees’ fees and expenses
|
231,811
|
31,609
|
15,036
|
|||||||||
|
Federal and state
|
||||||||||||
|
registration fees
|
219,581
|
55,288
|
54,534
|
|||||||||
|
Compliance fees
|
186,888
|
10,239
|
188
|
|||||||||
|
Miscellaneous expenses
|
150,271
|
20,880
|
5,967
|
|||||||||
|
Dividends and interest on
|
||||||||||||
|
securities sold short
|
9,771,831
|
665,414
|
1,099
|
|||||||||
|
Borrowing expenses on
|
||||||||||||
|
securities sold short
|
3,296,647
|
205,040
|
448
|
|||||||||
|
Interest on reverse
|
||||||||||||
|
repurchase agreements
|
—
|
—
|
8,315
|
|||||||||
|
Total expenses
|
||||||||||||
|
before expense
|
||||||||||||
|
waiver/recoupment/
|
||||||||||||
|
reimbursement
|
||||||||||||
|
by adviser
|
56,388,196
|
3,942,054
|
222,182
|
|||||||||
|
Expense waived/recouped/
|
||||||||||||
|
reimbursed by adviser (Note 3)
|
(727,445
|
)
|
5,319
|
(144,336
|
)
|
|||||||
|
Net expenses
|
55,660,751
|
3,947,373
|
77,846
|
|||||||||
|
NET INVESTMENT INCOME
|
$
|
21,065,840
|
$
|
932,003
|
$
|
83,113
|
||||||
The accompanying notes are an integral part of these financial statements.
74
The Merger Fund and Westchester Capital Funds
STATEMENTS OF OPERATIONS (continued)
For the Year Ended December 31, 2019
|
WCM Alternatives:
|
WCM Alternatives:
|
|||||||||||
|
The Merger Fund
|
Event-Driven Fund
|
Credit Event Fund
|
||||||||||
|
REALIZED AND CHANGE IN
|
||||||||||||
|
UNREALIZED GAIN (LOSS)
|
||||||||||||
|
ON INVESTMENTS:
|
||||||||||||
|
Realized gain (loss) on:
|
||||||||||||
|
Investments
|
$
|
128,213,290
|
$
|
9,202,624
|
$
|
137,928
|
||||||
|
Securities sold short
|
(141,852,630
|
)
|
(5,245,000
|
)
|
(11,406
|
)
|
||||||
|
Written option contracts
|
||||||||||||
|
expired or closed
|
14,276,733
|
895,816
|
—
|
|||||||||
|
Forward currency
|
||||||||||||
|
exchange contracts
|
(1,996,867
|
)
|
83,980
|
—
|
||||||||
|
Swap contracts
|
3,611,525
|
5,460,016
|
31,187
|
|||||||||
|
Foreign currency transactions
|
8,597
|
65
|
—
|
|||||||||
|
Net realized gain
|
2,260,648
|
10,397,501
|
157,709
|
|||||||||
|
Change in unrealized
|
||||||||||||
|
appreciation (depreciation) on:
|
||||||||||||
|
Investments
|
165,352,161
|
10,730,026
|
163,906
|
|||||||||
|
Securities sold short
|
29,445,582
|
(1,759,918
|
)
|
(2,360
|
)
|
|||||||
|
Written option contracts
|
(11,499,652
|
)
|
(840,190
|
)
|
—
|
|||||||
|
Forward currency
|
||||||||||||
|
exchange contracts
|
(3,362,682
|
)
|
(391,441
|
)
|
—
|
|||||||
|
Swap contracts
|
(21,229,196
|
)
|
(24,296
|
)
|
84,021
|
|||||||
|
Foreign currency translation
|
—
|
22
|
—
|
|||||||||
|
Net change in
|
||||||||||||
|
unrealized appreciation
|
158,706,213
|
7,714,203
|
245,567
|
|||||||||
|
NET REALIZED AND CHANGE IN
|
||||||||||||
|
UNREALIZED GAIN
|
||||||||||||
|
ON INVESTMENTS
|
160,966,861
|
18,111,704
|
403,276
|
|||||||||
|
NET INCREASE IN NET
|
||||||||||||
|
ASSETS RESULTING
|
||||||||||||
|
FROM OPERATIONS
|
$
|
182,032,701
|
$
|
19,043,707
|
$
|
486,389
|
||||||
The accompanying notes are an integral part of these financial statements.
75
The Merger Fund
STATEMENTS OF CHANGES IN NET ASSETS
|
Year Ended
|
Year Ended
|
|||||||
|
December 31, 2019
|
December 31, 2018
|
|||||||
|
Net investment income
|
$
|
21,065,840
|
$
|
30,448,822
|
||||
|
Net realized gain on investments, securities
|
||||||||
|
sold short, written option contracts
|
||||||||
|
expired or closed, forward currency
|
||||||||
|
exchange contracts, swap contracts,
|
||||||||
|
and foreign currency transactions
|
2,260,648
|
175,063,866
|
||||||
|
Net change in unrealized appreciation
|
||||||||
|
(depreciation) on investments, securities sold
|
||||||||
|
short, written option contracts, forward
|
||||||||
|
currency exchange contracts, swap contracts,
|
||||||||
|
and foreign currency translation
|
158,706,213
|
(22,543,614
|
)
|
|||||
|
Net increase in net assets
|
||||||||
|
resulting from operations
|
182,032,701
|
182,969,074
|
||||||
|
Investor Class – Distributions to
|
||||||||
|
shareholders from: (Note 5)
|
||||||||
|
Total dividends and distributions
|
||||||||
|
to shareholders – Investor Class
|
(13,594,494
|
)
|
(55,076,117
|
)
|
||||
|
Institutional Class – Distributions to
|
||||||||
|
shareholders from: (Note 5)
|
||||||||
|
Total dividends and distributions to
|
||||||||
|
shareholders – Institutional Class
|
(28,505,531
|
)
|
(70,480,790
|
)
|
||||
|
Net increase in net assets from
|
||||||||
|
capital share transactions (Note 4)
|
291,074,931
|
389,567,339
|
||||||
|
Net increase in net assets
|
431,007,607
|
446,979,506
|
||||||
|
NET ASSETS:
|
||||||||
|
Beginning of year
|
2,761,351,106
|
2,314,371,600
|
||||||
|
End of year
|
$
|
3,192,358,713
|
$
|
2,761,351,106
|
||||
The accompanying notes are an integral part of these financial statements.
76
WCM Alternatives: Event-Driven Fund
STATEMENTS OF CHANGES IN NET ASSETS
|
Year Ended
|
Year Ended
|
|||||||
|
December 31, 2019
|
December 31, 2018
|
|||||||
|
Net investment income
|
$
|
932,003
|
$
|
1,614,171
|
||||
|
Net realized gain on investments, securities
|
||||||||
|
sold short, written option contracts
|
||||||||
|
expired or closed, forward currency
|
||||||||
|
exchange contracts, swap contracts,
|
||||||||
|
and foreign currency transactions
|
10,397,501
|
904,262
|
||||||
|
Net change in unrealized appreciation on
|
||||||||
|
investments, securities sold short, written
|
||||||||
|
option contracts, forward currency
|
||||||||
|
exchange contracts, swap contracts,
|
||||||||
|
and foreign currency translation
|
7,714,203
|
3,487,639
|
||||||
|
Net increase in net assets
|
||||||||
|
resulting from operations
|
19,043,707
|
6,006,072
|
||||||
|
Investor Class – Distributions to
|
||||||||
|
shareholders from: (Note 5)
|
||||||||
|
Total dividends and distributions
|
||||||||
|
to shareholders – Investor Class
|
(404,640
|
)
|
(519,098
|
)
|
||||
|
Institutional Class – Distributions to
|
||||||||
|
shareholders from: (Note 5)
|
||||||||
|
Total dividends and distributions
|
||||||||
|
to shareholders – Institutional Class
|
(4,526,978
|
)
|
(7,102,230
|
)
|
||||
|
Net increase in net assets from
|
||||||||
|
capital share transactions (Note 4)
|
59,257,900
|
47,260,037
|
||||||
|
Net increase in net assets
|
73,369,989
|
45,644,781
|
||||||
|
NET ASSETS:
|
||||||||
|
Beginning of year
|
145,233,771
|
99,588,990
|
||||||
|
End of year
|
$
|
218,603,760
|
$
|
145,233,771
|
||||
The accompanying notes are an integral part of these financial statements.
77
WCM Alternatives: Credit Event Fund
STATEMENTS OF CHANGES IN NET ASSETS
|
Year Ended
|
Year Ended
|
|||||||
|
December 31, 2019
|
December 31, 2018
|
|||||||
|
Net investment income
|
$
|
83,113
|
$
|
55,272
|
||||
|
Net realized gain (loss) on investments,
|
||||||||
|
securities sold short, and swap contracts
|
157,709
|
(33,891
|
)
|
|||||
|
Net change in unrealized appreciation
|
||||||||
|
(depreciation) on investments, securities
|
||||||||
|
sold short, and swap contracts
|
245,567
|
(140,056
|
)
|
|||||
|
Net increase (decrease) in net assets
|
||||||||
|
resulting from operations
|
486,389
|
(118,675
|
)
|
|||||
|
Investor Class – Distributions to
|
||||||||
|
shareholders from: (Note 5)
|
||||||||
|
Total dividends and distributions
|
||||||||
|
to shareholders – Investor Class
|
(13,453
|
)
|
(547
|
)
|
||||
|
Institutional Class – Distributions to
|
||||||||
|
shareholders from: (Note 5)
|
||||||||
|
Total dividends and distributions
|
||||||||
|
to shareholders – Institutional Class
|
(135,910
|
)
|
(60,465
|
)
|
||||
|
Net increase in net assets from
|
||||||||
|
capital share transactions (Note 4)
|
1,041,763
|
3,961,953
|
*
|
|||||
|
Net increase in net assets
|
1,378,789
|
3,782,266
|
||||||
|
NET ASSETS:
|
||||||||
|
Beginning of year
|
3,782,266
|
—
|
*
|
|||||
|
End of year
|
$
|
5,161,055
|
$
|
3,782,266
|
||||
|
*
|
The Fund received a seed investment of $2,710,000 on December 29, 2017 in a non-interest bearing account. The Fund did not conduct investment activity nor incur operating expenses until January 2, 2018.
|
The accompanying notes are an integral part of these financial statements.
78
(This Page Intentionally Left Blank.)
79
The Merger Fund
FINANCIAL HIGHLIGHTS
Selected per share data is based on a share of beneficial interest outstanding throughout each year.
Institutional Class
|
Year Ended December 31,
|
||||||||||||||||||||
|
2019
|
2018
|
2017
|
2016
|
2015
|
||||||||||||||||
|
Per Share Data:
|
||||||||||||||||||||
|
Net asset value, beginning of year
|
$
|
16.30
|
$
|
15.83
|
$
|
15.56
|
$
|
15.25
|
$
|
15.58
|
||||||||||
|
Income from investment operations:
|
||||||||||||||||||||
|
Net investment
|
||||||||||||||||||||
|
income (loss)(1)(2)
|
0.14
|
0.23
|
0.10
|
(0.04
|
)
|
(0.03
|
)
|
|||||||||||||
|
Net realized and unrealized
|
||||||||||||||||||||
|
gain (loss) on investments
|
0.89
|
1.03
|
0.33
|
0.49
|
(0.05
|
)
|
||||||||||||||
|
Total from
|
||||||||||||||||||||
|
investment operations
|
1.03
|
1.26
|
0.43
|
0.45
|
(0.08
|
)
|
||||||||||||||
|
Less distributions:
|
||||||||||||||||||||
|
From net investment income
|
(0.05
|
)
|
(0.23
|
)
|
(0.16
|
)
|
(0.14
|
)
|
(0.18
|
)
|
||||||||||
|
From net realized gains
|
(0.18
|
)
|
(0.56
|
)
|
—
|
—
|
(0.07
|
)
|
||||||||||||
|
Total dividends and distributions
|
(0.23
|
)
|
(0.79
|
)
|
(0.16
|
)
|
(0.14
|
)
|
(0.25
|
)
|
||||||||||
|
Net Asset Value, end of year
|
$
|
17.10
|
$
|
16.30
|
$
|
15.83
|
$
|
15.56
|
$
|
15.25
|
||||||||||
|
Total Return
|
6.32
|
%
|
7.98
|
%
|
2.74
|
%
|
2.94
|
%
|
(0.52
|
)%
|
||||||||||
The accompanying notes are an integral part of these financial statements.
80
The Merger Fund
FINANCIAL HIGHLIGHTS (continued)
Institutional Class
|
Year Ended December 31,
|
||||||||||||||||||||
|
2019
|
2018
|
2017
|
2016
|
2015
|
||||||||||||||||
|
Supplemental data and ratios:
|
||||||||||||||||||||
|
Net assets, end of year (000’s)
|
$
|
2,161,001
|
$
|
1,496,116
|
$
|
1,152,718
|
$
|
1,377,041
|
$
|
1,247,332
|
||||||||||
|
Ratio of gross expenses
|
||||||||||||||||||||
|
to average net assets:
|
||||||||||||||||||||
|
Before expense reimbursement
|
1.74
|
%(4)
|
1.64
|
%
|
1.55
|
%
|
1.70
|
%
|
1.54
|
%
|
||||||||||
|
After expense reimbursement
|
1.72
|
%(4)
|
1.61
|
%
|
1.48
|
%
|
1.59
|
%
|
1.41
|
%
|
||||||||||
|
Ratio of dividends and interest on
|
||||||||||||||||||||
|
short positions and borrowing
|
||||||||||||||||||||
|
expense on securities sold short
|
||||||||||||||||||||
|
to average net assets
|
0.53
|
%(4)
|
0.41
|
%
|
0.37
|
%
|
0.52
|
%
|
0.40
|
%
|
||||||||||
|
Ratio of operating expenses
|
||||||||||||||||||||
|
to average net assets excluding
|
||||||||||||||||||||
|
dividends and interest on short
|
||||||||||||||||||||
|
positions and borrowing expense
|
||||||||||||||||||||
|
on securities sold short
|
||||||||||||||||||||
|
(after expense reimbursement)
|
1.19
|
%(5)
|
1.20
|
%
|
1.11
|
%
|
1.07
|
%
|
1.01
|
%
|
||||||||||
|
Ratio of net investment income (loss)
|
||||||||||||||||||||
|
to average net assets
|
0.81
|
%
|
1.38
|
%
|
0.66
|
%
|
(0.27
|
)%
|
(0.21
|
)%
|
||||||||||
|
Portfolio turnover rate(3)
|
167
|
%
|
155
|
%
|
166
|
%
|
182
|
%
|
157
|
%
|
||||||||||
|
(1)
|
Net investment income (loss) before dividends and interest on short positions, borrowing expense on securities on securities sold short and legal expenses related to the settlement of an appraisal right for the years ended December 31,
2019, 2018, 2017, 2016 and 2015 was $0.22, $0.29, $0.16, $0.04, and $0.03, respectively.
|
|
(2)
|
Net investment income (loss) per share has been calculated based on average shares outstanding during the year.
|
|
(3)
|
The numerator for the portfolio turnover rate includes the lesser of purchases or sales (excluding short-term investments, short-term options, forward currency contracts, swap contracts and short positions). The denominator includes the
average long positions throughout the year.
|
|
(4)
|
The amount for the year ended December 31, 2019 includes 0.10% of legal expenses related to the settlement of an appraisal right.
|
|
(5)
|
The amount for the year ended December 31, 2019 excludes 0.10% of legal expenses related to the settlement of an appraisal right.
|
The accompanying notes are an integral part of these financial statements.
81
The Merger Fund
FINANCIAL HIGHLIGHTS
Selected per share data is based on a share of beneficial interest outstanding throughout each year.
Investor Class
|
Year Ended December 31,
|
||||||||||||||||||||
|
2019
|
2018
|
2017
|
2016
|
2015
|
||||||||||||||||
|
Per Share Data:
|
||||||||||||||||||||
|
Net asset value, beginning of year
|
$
|
16.42
|
$
|
15.94
|
$
|
15.66
|
$
|
15.31
|
$
|
15.63
|
||||||||||
|
Income from investment operations:
|
||||||||||||||||||||
|
Net investment
|
||||||||||||||||||||
|
income (loss)(1)(2)
|
0.09
|
0.18
|
0.05
|
(0.09
|
)
|
(0.08
|
)
|
|||||||||||||
|
Net realized and unrealized
|
||||||||||||||||||||
|
gain (loss) on investments
|
0.89
|
1.05
|
0.32
|
0.49
|
(0.05
|
)
|
||||||||||||||
|
Total from investment operations
|
0.98
|
1.23
|
0.37
|
0.40
|
(0.13
|
)
|
||||||||||||||
|
Less distributions:
|
||||||||||||||||||||
|
From net investment income
|
(0.05
|
)
|
(0.19
|
)
|
(0.09
|
)
|
(0.05
|
)
|
(0.12
|
)
|
||||||||||
|
From net realized gains
|
(0.18
|
)
|
(0.56
|
)
|
—
|
—
|
(0.07
|
)
|
||||||||||||
|
Total dividends and distributions
|
(0.23
|
)
|
(0.75
|
)
|
(0.09
|
)
|
(0.05
|
)
|
(0.19
|
)
|
||||||||||
|
Net Asset Value, end of year
|
$
|
17.17
|
$
|
16.42
|
$
|
15.94
|
$
|
15.66
|
$
|
15.31
|
||||||||||
|
Total Return
|
5.96
|
%
|
7.68
|
%
|
2.39
|
%
|
2.61
|
%
|
(0.82
|
)%
|
||||||||||
82
The Merger Fund
FINANCIAL HIGHLIGHTS (continued)
Investor Class
|
Year Ended December 31,
|
||||||||||||||||||||
|
2019
|
2018
|
2017
|
2016
|
2015
|
||||||||||||||||
|
Supplemental data and ratios:
|
||||||||||||||||||||
|
Net assets, end of year (in millions)
|
$
|
1,031
|
$
|
1,265
|
$
|
1,162
|
$
|
1,540
|
$
|
3,509
|
||||||||||
|
Ratio of gross expenses
|
||||||||||||||||||||
|
to average net assets:
|
||||||||||||||||||||
|
Before expense waiver
|
2.03
|
%(4)
|
1.94
|
%
|
1.87
|
%
|
2.03
|
%
|
1.87
|
%
|
||||||||||
|
After expense waiver
|
2.01
|
%(4)
|
1.91
|
%
|
1.80
|
%
|
1.92
|
%
|
1.74
|
%
|
||||||||||
|
Ratio of dividends and interest on
|
||||||||||||||||||||
|
short positions and borrowing
|
||||||||||||||||||||
|
expense on securities sold short
|
||||||||||||||||||||
|
to average net assets
|
0.53
|
%(4)
|
0.41
|
%
|
0.37
|
%
|
0.52
|
%
|
0.40
|
%
|
||||||||||
|
Ratio of operating expenses
|
||||||||||||||||||||
|
to average net assets excluding
|
||||||||||||||||||||
|
dividends and interest on short
|
||||||||||||||||||||
|
positions and borrowing expense
|
||||||||||||||||||||
|
on securities sold short
|
1.48
|
%(5)
|
1.50
|
%
|
1.43
|
%
|
1.40
|
%
|
1.34
|
%
|
||||||||||
|
Ratio of net investment income (loss)
|
||||||||||||||||||||
|
to average net assets
|
0.52
|
%
|
1.08
|
%
|
0.34
|
%
|
(0.60
|
)%
|
(0.53
|
)%
|
||||||||||
|
Portfolio turnover rate(3)
|
167
|
%
|
155
|
%
|
166
|
%
|
182
|
%
|
157
|
%
|
||||||||||
|
(1)
|
Net investment income (loss) before dividends and interest on short positions, borrowing expense on securities on securities sold short and legal expenses related to the settlement of an appraisal right for the years ended December 31,
2019, 2018, 2017, 2016 and 2015 was $0.18, $0.25, $0.11, $(0.01), and $(0.02), respectively.
|
|
(2)
|
Net investment income (loss) per share has been calculated based on average shares outstanding during the year.
|
|
(3)
|
The numerator for the portfolio turnover rate includes the lesser of purchases or sales (excluding short-term investments, short-term options, forward currency contracts, swap contracts and short positions). The denominator includes the
average long positions throughout the year.
|
|
(4)
|
The amount for the year ended December 31, 2019 includes 0.10% of legal expenses related to the settlement of an appraisal right.
|
|
(5)
|
The amount for the year ended December 31, 2019 excludes 0.10% of legal expenses related to the settlement of an appraisal right.
|
The accompanying notes are an integral part of these financial statements.
83
riven Fund
FINANCIAL HIGHLIGHTS
Selected per share data is based on a share of beneficial interest outstanding throughout each year.
Institutional Class
|
Year Ended December 31,
|
||||||||||||||||||||
|
2019
|
2018
|
2017
|
2016
|
2015
|
||||||||||||||||
|
Per Share Data:
|
||||||||||||||||||||
|
Net asset value, beginning of year
|
$
|
10.14
|
$
|
10.17
|
$
|
9.81
|
$
|
9.62
|
$
|
10.14
|
||||||||||
|
Income from investment operations:
|
||||||||||||||||||||
|
Net investment
|
||||||||||||||||||||
|
income (loss)(1)(2)
|
0.06
|
0.14
|
0.00
|
(4)
|
(0.04
|
)
|
0.01
|
|||||||||||||
|
Net realized and unrealized
|
||||||||||||||||||||
|
gain (loss) on investments
|
1.06
|
0.39
|
0.46
|
0.31
|
(0.22
|
)
|
||||||||||||||
|
Total from
|
||||||||||||||||||||
|
investment operations
|
1.12
|
0.53
|
0.46
|
0.27
|
(0.21
|
)
|
||||||||||||||
|
Less distributions:
|
||||||||||||||||||||
|
From net investment income
|
(0.17
|
)
|
(0.43
|
)
|
—
|
(0.08
|
)
|
(0.09
|
)
|
|||||||||||
|
From net realized gains
|
(0.08
|
)
|
(0.13
|
)
|
(0.10
|
)
|
—
|
(0.22
|
)
|
|||||||||||
|
Total dividends and distributions
|
(0.25
|
)
|
(0.56
|
)
|
(0.10
|
)
|
(0.08
|
)
|
(0.31
|
)
|
||||||||||
|
Net Asset Value, end of year
|
$
|
11.01
|
$
|
10.14
|
$
|
10.17
|
$
|
9.81
|
$
|
9.62
|
||||||||||
|
Total Return
|
11.13
|
%
|
5.27
|
%
|
4.72
|
%
|
2.86
|
%
|
(2.08
|
)%
|
||||||||||
The accompanying notes are an integral part of these financial statements.
84
WCM Alternatives: Event-Driven Fund
FINANCIAL HIGHLIGHTS (continued)
Institutional Class
|
Year Ended December 31,
|
||||||||||||||||||||
|
2019
|
2018
|
2017
|
2016
|
2015
|
||||||||||||||||
|
Supplemental data and ratios:
|
||||||||||||||||||||
|
Net assets, end of year (000’s)
|
$
|
199,251
|
$
|
134,923
|
$
|
94,031
|
$
|
112,947
|
$
|
96,489
|
||||||||||
|
Ratio of gross expenses
|
||||||||||||||||||||
|
to average net assets:
|
||||||||||||||||||||
|
Before expense
|
||||||||||||||||||||
|
reimbursement/recoupment
|
2.10
|
%(5)
|
2.19
|
%
|
2.20
|
%
|
2.37
|
%
|
2.23
|
%
|
||||||||||
|
After expense
|
||||||||||||||||||||
|
reimbursement/recoupment
|
2.10
|
%(5)
|
2.20
|
%
|
2.24
|
%
|
2.36
|
%
|
2.09
|
%
|
||||||||||
|
Ratio of dividends and interest on
|
||||||||||||||||||||
|
short positions and borrowing
|
||||||||||||||||||||
|
expense on securities sold short
|
||||||||||||||||||||
|
to average net assets
|
0.49
|
%(5)
|
0.46
|
%
|
0.50
|
%
|
0.62
|
%
|
0.35
|
%
|
||||||||||
|
Ratio of operating expenses
|
||||||||||||||||||||
|
to average net assets excluding
|
||||||||||||||||||||
|
dividends and interest on short
|
||||||||||||||||||||
|
positions and borrowing expense
|
||||||||||||||||||||
|
on securities sold short
|
||||||||||||||||||||
|
(after expense reimbursement/
|
||||||||||||||||||||
|
recoupment)
|
1.61
|
%(6)
|
1.74
|
%
|
1.74
|
%
|
1.74
|
%
|
1.74
|
%
|
||||||||||
|
Ratio of net investment income (loss)
|
||||||||||||||||||||
|
to average net assets
|
0.52
|
%
|
1.34
|
%
|
(0.02
|
)%
|
(0.46
|
)%
|
0.05
|
%
|
||||||||||
|
Portfolio turnover rate(3)
|
238
|
%
|
230
|
%
|
283
|
%
|
217
|
%
|
199
|
%
|
||||||||||
|
(1)
|
Net investment income (loss) before dividends and interest on short positions, borrowing expense on securities on securities sold short and legal expenses related to the settlement of an appraisal right for the years ended December 31,
2019, 2018, 2017, 2016 and 2015 was $0.11, $0.19, $0.05, $0.02, and $0.04, respectively.
|
|
(2)
|
Net investment income (loss) per share has been calculated based on average shares outstanding during the year.
|
|
(3)
|
The numerator for the portfolio turnover rate includes the lesser of purchases or sales (excluding short-term investments, short-term options, forward currency contracts, swap contracts and short positions). The denominator includes the
average long positions throughout the year.
|
|
(4)
|
Amount calculated is less than $(0.005).
|
|
(5)
|
The amount for the year ended December 31, 2019 includes 0.03% of legal expenses related to the settlement of an appraisal right.
|
|
(6)
|
The amount for the year ended December 31, 2019 excludes 0.03% of legal expenses related to the settlement of an appraisal right.
|
The accompanying notes are an integral part of these financial statements.
85
WCM Alternatives: Event-Driven Fund
FINANCIAL HIGHLIGHTS
Selected per share data is based on a share of beneficial interest outstanding throughout each period.
|
Investor Class
|
For the
|
|||||||||||
|
Period from
|
||||||||||||
|
|
March 22, 2017^
|
|||||||||||
|
Year Ended
December 31,
|
through
|
|||||||||||
|
December 31,
|
||||||||||||
|
2019
|
2018
|
2017
|
||||||||||
|
Per Share Data:
|
||||||||||||
|
Net asset value, beginning of period
|
$
|
10.12
|
$
|
10.16
|
$
|
9.89
|
||||||
|
Income from investment operations:
|
||||||||||||
|
Net investment income (loss)(1)(2)
|
0.03
|
0.11
|
(0.01
|
)
|
||||||||
|
Net realized and unrealized gain on investments
|
1.05
|
0.39
|
0.38
|
|||||||||
|
Total from investment operations
|
1.08
|
0.50
|
0.37
|
|||||||||
|
Less distributions:
|
||||||||||||
|
From net investment income
|
(0.15
|
)
|
(0.41
|
)
|
—
|
|||||||
|
From net realized gains
|
(0.08
|
)
|
(0.13
|
)
|
(0.10
|
)
|
||||||
|
Total dividends and distributions
|
(0.23
|
)
|
(0.54
|
)
|
(0.10
|
)
|
||||||
|
Net Asset Value, end of period
|
$
|
10.97
|
$
|
10.12
|
$
|
10.16
|
||||||
|
Total Return
|
10.73
|
%
|
4.95
|
%
|
3.77
|
%(3)
|
||||||
|
Supplemental data and ratios:
|
||||||||||||
|
Net assets, end of period (in 000’s)
|
$
|
19,352
|
$
|
10,311
|
$
|
5,558
|
||||||
|
Ratio of gross expenses to average net assets:
|
||||||||||||
|
Before expense recoupment
|
2.35
|
%(6)
|
2.44
|
%
|
2.52
|
%(4)
|
||||||
|
After expense recoupment
|
2.35
|
%(6)
|
2.45
|
%
|
2.54
|
%(4)
|
||||||
|
Ratio of dividends and interest on short positions
|
||||||||||||
|
and borrowing expense on securities sold
|
||||||||||||
|
short to average net assets
|
0.49
|
%(6)
|
0.46
|
%
|
0.55
|
%(4)
|
||||||
|
Ratio of operating expenses to average
|
||||||||||||
|
net assets excluding dividends and interest
|
||||||||||||
|
on short positions and borrowing expense on
|
||||||||||||
|
securities sold short (after expense recoupment)
|
1.86
|
%(7)
|
1.99
|
%
|
1.99
|
%(4)
|
||||||
|
Ratio of net investment income (loss)
|
||||||||||||
|
to average net assets
|
0.27
|
%
|
1.09
|
%
|
(0.17
|
)%(4)
|
||||||
|
Portfolio turnover rate(5)
|
238
|
%
|
230
|
%
|
283
|
%(3)
|
||||||
|
(1)
|
Net investment income (loss) before dividends and interest on short positions, borrowing expense on securities on securities sold short and legal expenses related to the settlement of an appraisal right for the periods ended December 31,
2019, 2018 and 2017 was $0.08, $0.16, and $0.03, respectively.
|
|
(2)
|
Net investment income (loss) per share has been calculated based on average shares outstanding during the period.
|
|
(3)
|
Not annualized.
|
|
(4)
|
Annualized
|
|
(5)
|
The numerator for the portfolio turnover rate includes the lesser of purchases or sales (excluding short-term investments, short-term options, forward currency contracts, swap contracts and short positions). The denominator includes the
average long positions throughout the period.
|
|
(6)
|
The amount for the year ended December 31, 2019 includes 0.03% of legal expenses related to the settlement of an appraisal right.
|
|
(7)
|
The amount for the year ended December 31, 2019 excludes 0.03% of legal expenses related to the settlement of an appraisal right.
|
|
^
|
Commencement of operations.
|
The accompanying notes are an integral part of these financial statements.
86
WCM Alternatives: Credit Event Fund
FINANCIAL HIGHLIGHTS
Selected per share data is based on a share of beneficial interest outstanding throughout each year.
Institutional Class
|
Year Ended
|
||||||||
|
December 31,
|
||||||||
|
2019
|
2018
|
|||||||
|
Per Share Data:
|
||||||||
|
Net asset value, beginning of year
|
$
|
9.55
|
$
|
10.00
|
||||
|
Income from investment operations:
|
||||||||
|
Net investment income(1)(2)
|
0.21
|
0.14
|
||||||
|
Net realized and unrealized gain (loss) on investments
|
1.02
|
(0.43
|
)
|
|||||
|
Total from investment operations
|
1.23
|
(0.29
|
)
|
|||||
|
Less distributions:
|
||||||||
|
From net investment income
|
(0.28
|
)
|
(0.16
|
)
|
||||
|
From net realized gains
|
(0.04
|
)
|
—
|
|||||
|
Total dividends and distributions
|
(0.32
|
)
|
(0.16
|
)
|
||||
|
Net Asset Value, end of year
|
$
|
10.46
|
$
|
9.55
|
||||
|
Total Return
|
12.87
|
%
|
(2.93
|
)%
|
||||
|
Supplemental data and ratios:
|
||||||||
|
Net assets, end of year (000’s)
|
$
|
4,698
|
$
|
3,744
|
||||
|
Ratio of gross expenses to average net assets:
|
||||||||
|
Before expense reimbursement
|
5.38
|
%
|
6.24
|
%
|
||||
|
After expense reimbursement
|
1.88
|
%
|
1.73
|
%
|
||||
|
Ratio of borrowing expense on securities sold short and interest
|
||||||||
|
on securities sold short and reverse repurchase agreements
|
||||||||
|
to average net assets
|
0.24
|
%
|
0.09
|
%
|
||||
|
Ratio of operating expenses to average net assets
|
||||||||
|
excluding borrowing expense on securities sold short
|
||||||||
|
and interest on securities sold short and reverse repurchase
|
||||||||
|
agreements (after expense reimbursement)
|
1.64
|
%
|
1.64
|
%
|
||||
|
Ratio of net investment income to average net assets
|
2.02
|
%
|
1.44
|
%
|
||||
|
Portfolio turnover rate(3)
|
106
|
%
|
192
|
%
|
||||
|
(1)
|
Net investment income before borrowing expense on securities on securities sold short and interest on securities sold short and reverse repurchase agreements for the years ended December 31, 2019 and 2018 was $0.23 and $0.15, respectively.
|
|
(2)
|
Net investment income per share has been calculated based on average shares outstanding during the year.
|
|
(3)
|
The numerator for the portfolio turnover rate includes the lesser of purchases or sales (excluding short-term investments, swap contracts, short positions and reverse repurchase agreements). The denominator includes the average long
positions throughout the year.
|
The accompanying notes are an integral part of these financial statements.
87
WCM Alternatives: Credit Event Fund
FINANCIAL HIGHLIGHTS
Selected per share data is based on a share of beneficial interest outstanding throughout each year.
Investor Class
|
Year Ended
December 31,
|
||||||||
|
2019
|
2018
|
|||||||
|
Per Share Data:
|
||||||||
|
Net asset value, beginning of year
|
$
|
9.54
|
$
|
10.00
|
||||
|
Income from investment operations:
|
||||||||
|
Net investment income(1)(2)
|
0.19
|
0.12
|
||||||
|
Net realized and unrealized gain (loss) on investments
|
1.01
|
(0.44
|
)
|
|||||
|
Total from investment operations
|
1.20
|
(0.32
|
)
|
|||||
|
Less distributions:
|
||||||||
|
From net investment income
|
(0.27
|
)
|
(0.14
|
)
|
||||
|
From net realized gains
|
(0.04
|
)
|
—
|
|||||
|
Total dividends and distributions
|
(0.31
|
)
|
(0.14
|
)
|
||||
|
Net Asset Value, end of year
|
$
|
10.43
|
$
|
9.54
|
||||
|
Total Return
|
12.60
|
%
|
(3.23
|
)%
|
||||
|
Supplemental data and ratios:
|
||||||||
|
Net assets, end of year (000’s)
|
$
|
463
|
$
|
38
|
||||
|
Ratio of gross expenses to average net assets:
|
||||||||
|
Before expense reimbursement
|
5.63
|
%
|
6.56
|
%
|
||||
|
After expense reimbursement
|
2.13
|
%
|
1.98
|
%
|
||||
|
Ratio of borrowing expense on securities sold short and interest
|
||||||||
|
on securities sold short and reverse repurchase agreements
|
||||||||
|
to average net assets
|
0.24
|
%
|
0.09
|
%
|
||||
|
Ratio of operating expenses to average net assets
|
||||||||
|
excluding borrowing expense on securities sold short
|
||||||||
|
and interest on securities sold short and reverse repurchase
|
||||||||
|
agreements (after expense reimbursement)
|
1.89
|
%
|
1.89
|
%
|
||||
|
Ratio of net investment income to average net assets
|
1.77
|
%
|
1.19
|
%
|
||||
|
Portfolio turnover rate(3)
|
106
|
%
|
192
|
%
|
||||
|
(1)
|
Net investment income before borrowing expense on securities on securities sold short and interest on securities sold short and reverse repurchase agreements for the years ended December 31, 2019 and 2018 was $0.21 and $0.13, respectively.
|
|
(2)
|
Net investment income per share has been calculated based on average shares outstanding during the year.
|
|
(3)
|
The numerator for the portfolio turnover rate includes the lesser of purchases or sales (excluding short-term investments, swap contracts, short positions and reverse repurchase agreements). The denominator includes the average long
positions throughout the year.
|
The accompanying notes are an integral part of these financial statements.
88
The Merger Fund and Westchester Capital Funds
NOTES TO THE FINANCIAL STATEMENTS
December 31, 2019
Note 1 — ORGANIZATION
The Merger Fund (“TMF”) is a no-load, open-end, diversified investment company organized as a trust under the laws of the Commonwealth of Massachusetts on April 12, 1982, and registered under the Investment Company Act
of 1940, as amended (the “1940 Act”). TMF was formerly known as the Risk Portfolio of The Ayco Fund. In January of 1989, TMF’s fundamental investment policies were amended to permit TMF to engage in merger arbitrage. At the same time, Westchester
Capital Management, Inc. became TMF’s investment adviser, and TMF began to do business as The Merger Fund. In a transaction that closed on December 31, 2010, Westchester Capital Management, Inc. transferred substantially all of its business and
assets to Westchester Capital Management, LLC (the “Adviser”), which became TMF’s investment adviser. Therefore, the performance information included for periods prior to 2011 reflects the performance of Westchester Capital Management, Inc. Roy
Behren and Michael Shannon, TMF’s current portfolio managers, have served as co-portfolio managers of TMF since January 2007. The Investor Class inception date was January 31, 1989, and the Institutional Class inception date was August 1, 2013. The
investment objective of TMF is to seek to achieve capital growth by engaging in merger arbitrage. Merger arbitrage is a highly specialized investment approach generally designed to profit from the successful completion of publicly announced mergers,
takeovers, tender offers, leveraged buyouts, spin-offs, liquidations and other corporate reorganizations. At December 31, 2019, 82.3% of the shares outstanding of TMF’s Investor Class were owned by 5 omnibus accounts. At December 31, 2019, 78.4% of
the shares outstanding of TMF’s Institutional Class were owned by 7 omnibus accounts.
Westchester Capital Funds (“WCF”) is an open-end series management investment company organized under the laws of the Commonwealth of Massachusetts on March 20, 2013, and registered under the 1940 Act. WCM Alternatives:
Event-Driven Fund (“EDF”), the first series within WCF, is a no-load, open-end, diversified investment company with two classes of shares, Investor Class shares and Institutional Class shares. The Institutional Class inception date was January 2,
2014. The Investor Class inception date was March 22, 2017. The investment objective of EDF is to seek to provide attractive risk-adjusted returns with low relative volatility in virtually all market environments. WCM Alternatives: Credit Event Fund
(“CEF”), the second series within WCF, is a no-load, open-end, non-diversified investment company with two classes of shares, Investor Class shares and Institutional Class shares. The Institutional Class and Investor Class inception date was December
29, 2017. The investment objective of CEF is to seek attractive risk-adjusted returns independent of market cycles.
89
The Merger Fund and Westchester Capital Funds
NOTES TO THE FINANCIAL STATEMENTS (continued)
December 31, 2019
Note 1 — ORGANIZATION (continued)
Risk-adjusted return is a concept that considers not only an investment’s return, but also the amount of potential risk involved in producing that return. At December 31, 2019, 93.8% of the shares outstanding of EDF’s Investor Class were owned by
3 omnibus accounts. At December 31, 2019, 98.2% of the shares outstanding of EDF’s Institutional Class were owned by 3 omnibus accounts. At December 31, 2019, 97.6% of the shares outstanding of CEF’s Investor Class were owned by 2 omnibus accounts.
At December 31, 2019, 53.9% and 36.3% of the shares outstanding of CEF’s Institutional Class were owned by 3 omnibus accounts and by affiliates of the Adviser, respectively. At December 31, 2019, 1.9% and 87.6% of the shares outstanding of CEF’s
Investor Class and CEF’s Institutional Class were owned by affiliates of the Adviser through omnibus accounts or were directly held.
Each class of shares of TMF, EDF and CEF (each a “Fund” and together, the “Funds”) has different eligibility and minimum investment requirements. The underlying assets attributable to a class of a Fund are charged with
the expenses attributable to that class of the Fund and with a share of the general expenses of the Fund. Any general expenses of a Fund that are not readily identifiable as belonging to a particular class of the Fund are allocated by or under the
direction of the Boards of Trustees of the Funds (the “Board of Trustees” or “Trustees”) in such manner as the Trustees determine. Shares of classes may have different voting rights, such as (i) when required by the 1940 Act, or (ii) when the
Trustees determine that such a matter affects only the interests of a particular class. Shares have no preemptive or subscription rights. The Institutional Class shares do not have a distribution fee. Income, expenses (other than expenses
attributable to a specific class), and realized and unrealized gains or losses on investments of a Fund are allocated to each class of a Fund based on its relative net assets.
Note 2 — SIGNIFICANT ACCOUNTING POLICIES
The following is a summary of significant accounting policies followed by the Funds in the preparation of their financial statements. These policies are in conformity with U.S. generally accepted accounting principles
(“GAAP”). The Funds are investment companies and, accordingly, follow the investment company accounting and reporting guidance of the Financial Accounting Standards Board Accounting Standards Codification Topic 946 – Investment Companies. The
presentation of financial statements in conformity with GAAP requires management to make estimates and assumptions that affect the reported amount of assets and liabilities at the date of the financial statements and
90
The Merger Fund and Westchester Capital Funds
NOTES TO THE FINANCIAL STATEMENTS (continued)
December 31, 2019
Note 2 — SIGNIFICANT ACCOUNTING POLICIES (continued)
the reported amounts of revenues and expenses during the reporting period. Actual results could differ from those estimates and assumptions.
|
A.
|
Investment Valuation
|
Equity securities, including common and preferred stocks, closed-end funds and ETFs, that trade on an exchange will typically be valued based on the last reported sale price. Securities listed on NASDAQ are typically
valued using the NASDAQ Official Closing Price. The securities valued using quoted prices in active markets are classified as Level 1 investments. If, on a particular day, an exchange-listed security does not trade, then the mean between the closing
bid and asked prices will typically be used to value the security. These securities are classified as Level 2 investments. Fixed income securities having a maturity of greater than 60 days are typically valued based on evaluations provided by an
independent pricing vendor. Investments in United States government securities (other than short-term securities) are valued at the mean between the 4:00 p.m. New York time bid and asked prices supplied by a third party vendor. Short-term
fixed-income securities having a maturity of less than 60 days are valued at market quotations or based on valuations supplied by a third party pricing service. If a reliable price from a third party pricing service is unavailable, amortized cost may
be used if it is determined that the instrument’s amortized cost value represents approximately the fair value of the security. These securities are classified as Level 2 investments.
Investments in Special Purpose Acquisition Companies, including their related units, shares, rights and warrants (each a “SPAC interest”), will typically be valued by reference to the last reported transaction for the
composite exchange. These securities are classified as Level 1 investments. If, on a particular day, no reliable market transaction is readily available and reported for the composite exchange, then the mean between the closing bid and asked prices
on the composite exchange will be used to value the SPAC interest, or the SPAC interest will be fair valued in accordance with the Fund’s pricing procedures. These securities are classified as Level 2 investments.
Exchange-traded options are typically valued at the higher of the intrinsic value of the option (i.e., what a Fund would pay or can receive upon the option being exercised) or the last reported composite sale price when
such sale falls between the bid and asked prices. Notwithstanding the above, options that trade principally on a European exchange are typically valued at the “settlement price” as reported by the exchange on which the option principally trades. If
the settlement price for a European exchange-traded option is unreliable or unavailable, the option will
91
The Merger Fund and Westchester Capital Funds
NOTES TO THE FINANCIAL STATEMENTS (continued)
December 31, 2019
Note 2 — SIGNIFICANT ACCOUNTING POLICIES (continued)
generally be valued at the last reported sale price. When the last sale of an exchange-traded option is outside the bid and asked prices, the Funds will typically value the option at the higher of the intrinsic value of the option or the mean
between the highest end of day option bid price and the lowest end of day option ask price. On the stipulated expiration date, expiring options will be priced at intrinsic value. Options for which there is an active market are classified as Level 1
investments, but options not listed on an exchange and/or are fair valued in accordance with the Fund’s pricing procedures are classified as Level 2 investments.
Investments in registered open-end investment companies, including Money Market Funds, are typically valued at their reported net asset value (“NAV”) per share. These securities are generally classified as Level 1
investments.
Forward currency contracts are valued daily at the prevailing forward exchange rate. These securities are generally classified as Level 2.
In general, swap prices are determined using the same methods as would be used to price the underlying security. When the underlying security is the subject of a completed corporate reorganization for which the final
deal terms are known, the swap is priced at the value of the consideration to be received by the Funds. The credit quality of counterparties and collateral is monitored and the valuation of a swap may be adjusted if it is believed that the credit
quality of the counterparty or collateral affects the market value of the swap position. These securities are generally classified as Level 2 investments.
Due to the short-term nature of the reverse repurchase agreements, amortized cost approximates fair value. These securities are generally classified as Level 2 investments. At December 31, 2019, the Funds had no open
reverse repurchase agreements.
The Funds typically fair value securities and assets for which (a) market quotations are not readily available or (b) market quotations are believed to be unrepresentative of market value. For example, the Funds may fair
value a security that primarily trades on an exchange that closes before the New York Stock Exchange (“NYSE”) if a significant event occurs after the close of the exchange on which the security primarily trades but before the NYSE closes. Fair
valuations are determined in good faith by the Valuation Group (the “Valuation Group”), a committee comprised of persons who are officers of the Trust or representatives of the Adviser, acting pursuant to procedures adopted by the Board. When fair
value pricing is employed, the prices of securities used by the Funds to calculate their NAV may differ from quoted or published prices for the same securities. In addition, due to
92
The Merger Fund and Westchester Capital Funds
NOTES TO THE FINANCIAL STATEMENTS (continued)
December 31, 2019
Note 2 — SIGNIFICANT ACCOUNTING POLICIES (continued)
the subjective nature of fair value pricing, it is possible that the value determined for a particular asset may be materially different from the value realized upon such asset’s sale. These securities are generally classified as Level 2 or 3
depending on the inputs as described below.
The Funds have performed analyses of all existing investments to determine the significance and character of all inputs to their fair value determination. Various inputs are used in determining the value of the Funds’
investments. These inputs are summarized in the three broad levels listed below:
|
Level 1 —
|
Quoted prices in active markets for identical securities.
|
|
|
Level 2 —
|
Other significant observable inputs (including quoted prices for similar securities, interest rates, prepayment speeds, credit risk, etc.).
|
|
|
Level 3 —
|
Significant unobservable inputs are those inputs that reflect the applicable Fund’s own assumptions that market participants would use to price the asset or liability based on the best available information.
|
The inputs or methodology used for valuing securities are not an indication of the risk associated with investing in those securities.
The following tables provide the fair value measurements of applicable Fund assets and liabilities by level within the fair value hierarchy for the Funds as of December 31, 2019. These assets and liabilities are measured
on a recurring basis.
|
The Merger Fund
|
||||||||||||||||
|
Investments at Fair Value
|
Level 1
|
Level 2
|
Level 3
|
Total
|
||||||||||||
|
Assets
|
||||||||||||||||
|
Common Stocks*
|
$
|
1,417,084,819
|
$
|
94,625,208
|
$
|
—
|
$
|
1,511,710,027
|
||||||||
|
Special Purpose
|
||||||||||||||||
|
Acquisition Companies
|
167,108,270
|
62,813,989
|
—
|
229,922,259
|
||||||||||||
|
Preferred Stocks
|
2,471,911
|
—
|
—
|
2,471,911
|
||||||||||||
|
Contingent Value Rights
|
—
|
2,123,520
|
—
|
2,123,520
|
||||||||||||
|
Warrants
|
4,100,111
|
1,406,244
|
—
|
5,506,355
|
||||||||||||
|
Bank Loans
|
—
|
94,309,670
|
—
|
94,309,670
|
||||||||||||
|
Corporate Bonds
|
—
|
156,125,716
|
—
|
156,125,716
|
||||||||||||
|
Purchased Option Contracts
|
2,489,719
|
—
|
—
|
2,489,719
|
||||||||||||
|
Escrow Notes
|
—
|
124,513,656
|
285,983
|
124,799,639
|
||||||||||||
|
Short-Term Investments
|
954,326,671
|
159,639,152
|
—
|
1,113,965,823
|
||||||||||||
|
Investments Purchased
|
||||||||||||||||
|
with the Cash Proceeds
|
||||||||||||||||
|
from Securities Lending***
|
—
|
—
|
—
|
104,867,573
|
||||||||||||
|
Swap Contracts**
|
—
|
4,270,240
|
—
|
4,270,240
|
||||||||||||
|
Total
|
$
|
2,547,581,501
|
$
|
699,827,395
|
$
|
285,983
|
$
|
3,352,562,452
|
||||||||
93
The Merger Fund and Westchester Capital Funds
NOTES TO THE FINANCIAL STATEMENTS (continued)
December 31, 2019
Note 2 — SIGNIFICANT ACCOUNTING POLICIES (continued)
|
The Merger Fund (continued)
|
||||||||||||||||
|
Investments at Fair Value
|
Level 1
|
Level 2
|
Level 3
|
Total
|
||||||||||||
|
Liabilities
|
||||||||||||||||
|
Short Common Stocks*
|
$
|
(12,067,601
|
)
|
$
|
—
|
$
|
—
|
$
|
(12,067,601
|
)
|
||||||
|
Written Option Contracts
|
(43,793,639
|
)
|
—
|
—
|
(43,793,639
|
)
|
||||||||||
|
Forward Currency
|
||||||||||||||||
|
Exchange Contracts**
|
—
|
(2,498,197
|
)
|
—
|
(2,498,197
|
)
|
||||||||||
|
Swap Contracts**
|
—
|
(15,876,059
|
)
|
—
|
(15,876,059
|
)
|
||||||||||
|
Total
|
$
|
(55,861,240
|
)
|
$
|
(18,374,256
|
)
|
$
|
—
|
$
|
(74,235,496
|
)
|
|||||
|
WCM Alternatives: Event-Driven Fund
|
||||||||||||||||
|
Investments at Fair Value
|
Level 1
|
Level 2
|
Level 3
|
Total
|
||||||||||||
|
Assets
|
||||||||||||||||
|
Common Stocks*
|
$
|
79,616,830
|
$
|
7,436,793
|
$
|
—
|
$
|
87,053,623
|
||||||||
|
Special Purpose
|
||||||||||||||||
|
Acquisition Companies
|
19,389,367
|
7,757,786
|
—
|
27,147,153
|
||||||||||||
|
Closed-End Funds
|
7,171,029
|
—
|
—
|
7,171,029
|
||||||||||||
|
Preferred Stocks
|
7,807,787
|
—
|
—
|
7,807,787
|
||||||||||||
|
Contingent Value Rights
|
—
|
184,747
|
—
|
184,747
|
||||||||||||
|
Rights
|
—
|
9,448
|
—
|
9,448
|
||||||||||||
|
Warrants
|
571,177
|
265,540
|
—
|
836,717
|
||||||||||||
|
Bank Loans
|
—
|
9,278,911
|
—
|
9,278,911
|
||||||||||||
|
Convertible Bonds
|
—
|
3,589,941
|
—
|
3,589,941
|
||||||||||||
|
Corporate Bonds
|
—
|
23,393,611
|
—
|
23,393,611
|
||||||||||||
|
Purchased Option Contracts
|
368,296
|
18,073
|
—
|
386,369
|
||||||||||||
|
Escrow Notes
|
—
|
8,750,127
|
6,636
|
8,756,763
|
||||||||||||
|
Short-Term Investments
|
20,461,003
|
27,194,134
|
—
|
47,655,137
|
||||||||||||
|
Swap Contracts**
|
—
|
2,184,571
|
—
|
2,184,571
|
||||||||||||
|
Total
|
$
|
135,385,489
|
$
|
90,063,682
|
$
|
6,636
|
$
|
225,455,807
|
||||||||
|
Liabilities
|
||||||||||||||||
|
Short Common Stocks*
|
$
|
(4,362,179
|
)
|
$
|
—
|
$
|
—
|
$
|
(4,362,179
|
)
|
||||||
|
Short Corporate Bonds
|
—
|
(934,429
|
)
|
—
|
(934,429
|
)
|
||||||||||
|
Written Option Contracts
|
(4,401,966
|
)
|
(94,170
|
)
|
—
|
(4,496,136
|
)
|
|||||||||
|
Forward Currency
|
||||||||||||||||
|
Exchange Contracts**
|
—
|
(275,949
|
)
|
—
|
(275,949
|
)
|
||||||||||
|
Swap Contracts**
|
—
|
(554,883
|
)
|
—
|
(554,883
|
)
|
||||||||||
|
Total
|
$
|
(8,764,145
|
)
|
$
|
(1,859,431
|
)
|
$
|
—
|
$
|
(10,623,576
|
)
|
|||||
94
The Merger Fund and Westchester Capital Funds
NOTES TO THE FINANCIAL STATEMENTS (continued)
December 31, 2019
Note 2 — SIGNIFICANT ACCOUNTING POLICIES (continued)
WCM Alternatives: Credit Event Fund
|
Investments at Fair Value
|
Level 1
|
Level 2
|
Level 3
|
Total
|
||||||||||||
|
Assets
|
||||||||||||||||
|
Common Stocks*
|
$
|
187,922
|
$
|
—
|
$
|
—
|
$
|
187,922
|
||||||||
|
Special Purpose
|
||||||||||||||||
|
Acquisition Companies
|
957,486
|
104,023
|
—
|
1,061,509
|
||||||||||||
|
Closed-End Funds
|
2,656
|
—
|
—
|
2,656
|
||||||||||||
|
Preferred Stocks
|
411,323
|
—
|
—
|
411,323
|
||||||||||||
|
Warrants
|
41,034
|
39,342
|
—
|
80,376
|
||||||||||||
|
Bank Loans
|
—
|
686,987
|
—
|
686,987
|
||||||||||||
|
Convertible Bonds
|
—
|
377,952
|
—
|
377,952
|
||||||||||||
|
Corporate Bonds
|
—
|
1,497,069
|
—
|
1,497,069
|
||||||||||||
|
Escrow Notes
|
—
|
127,853
|
—
|
127,853
|
||||||||||||
|
Short-Term Investments
|
119,038
|
—
|
—
|
119,038
|
||||||||||||
|
Total
|
$
|
1,719,459
|
$
|
2,833,226
|
$
|
—
|
$
|
4,552,685
|
||||||||
|
Liabilities
|
||||||||||||||||
|
Short Corporate Bonds
|
$
|
—
|
$
|
(53,746
|
)
|
$
|
—
|
$
|
(53,746
|
)
|
||||||
|
Swap Contracts**
|
—
|
(11,037
|
)
|
—
|
(11,037
|
)
|
||||||||||
|
Total
|
$
|
—
|
$
|
(64,783
|
)
|
$
|
—
|
$
|
(64,783
|
)
|
||||||
|
*
|
Please refer to the Schedules of Investments to view long/short common stocks segregated by industry type.
|
|
|
**
|
Swap contracts and forward currency exchange contracts are valued at the net unrealized appreciation (depreciation) on the instrument by counterparty.
|
|
|
***
|
Certain investments that are measured at fair value using the net asset value per share (or its equivalent) practical expedient have not been characterized in the fair value hierarchy. The fair value amount presented in the table is
intended to permit reconciliation of the fair value hierarchy to the amount presented in the Schedule of Investments and Statement of Assets and Liabilities. See Note 8 for additional information regarding securities lending activity.
|
The Level 2 securities are priced using inputs such as current yields, discount rates, credit quality, yields on comparable securities, trading volume, maturity date, market bid and ask prices, prices on comparable
securities and other significant inputs. Level 3 securities are valued by using broker quotes or such other pricing sources or data as are permitted by the Funds’ pricing procedures. At December 31, 2019, the value of these securities held by TMF and
EDF were $285,983 and $15,574, respectively. The inputs for these securities are not readily available or cannot be reasonably estimated and are generally those inputs as described in Note 2 A. The appropriateness of fair values for these securities
is monitored by the Valuation Group on an ongoing basis.
During the year ended December 31, 2019, the value of securities transferred out of Level 3 and into Level 2 for TMF and EDF were $44,558 and $11,081, respectively. These securities were transferred out of Level 3 and
into Level 2 due to increased market activity and availability of broker valuations. There were no transfers into or out of Level 3 for CEF for the year ended December 31, 2019.
95
The Merger Fund and Westchester Capital Funds
NOTES TO THE FINANCIAL STATEMENTS (continued)
December 31, 2019
Note 2 — SIGNIFICANT ACCOUNTING POLICIES (continued)
Level 3 Reconciliation Disclosure
The following is a reconciliation of Level 3 assets for which significant unobservable inputs were used to determine fair value.
|
The Merger Fund
|
||||||||||||||||
|
Common
|
Contingent
|
Escrow
|
Total
|
|||||||||||||
|
Description
|
Stocks
|
Value Rights
|
Notes
|
Investment
|
||||||||||||
|
Balance as of December 31, 2018
|
$
|
59,773,482
|
$
|
26,735
|
$
|
1,927,279
|
$
|
61,727,496
|
||||||||
|
Purchases on Investments
|
—
|
—
|
—
|
—
|
||||||||||||
|
(Sales) of Investments
|
(57,736,820
|
)
|
—
|
—
|
(57,736,820
|
)
|
||||||||||
|
Realized (Gain) Loss
|
(310,207
|
)
|
—
|
—
|
(310,207
|
)
|
||||||||||
|
Transfers Into Level 3
|
—
|
—
|
—
|
—
|
||||||||||||
|
(Transfer Out) of Level 3
|
—
|
(44,558
|
)
|
—
|
(44,558
|
)
|
||||||||||
|
Change in Unrealized
|
||||||||||||||||
|
Appreciation (Depreciation)
|
(1,726,455
|
)
|
17,823
|
(1,641,296
|
)*
|
(3,349,928
|
)
|
|||||||||
|
Balance as of December 31, 2019
|
$
|
—
|
$
|
—
|
$
|
285,983
|
$
|
285,983
|
||||||||
|
Change in unrealized appreciation
|
||||||||||||||||
|
(depreciation) during the year
|
||||||||||||||||
|
for Level 3 investments held
|
||||||||||||||||
|
at December 31, 2019.
|
$
|
(2,036,662
|
)
|
$
|
17,823
|
$
|
(1,055,453
|
)*
|
$
|
(3,074,292
|
)
|
|||||
|
WCM Alternatives: Event-Driven Fund
|
||||||||||||||||
|
Common
|
Contingent
|
Escrow
|
Total
|
|||||||||||||
|
Description
|
Stocks
|
Value Rights
|
Notes
|
Investment
|
||||||||||||
|
Balance as of December 31, 2018
|
$
|
1,016,674
|
$
|
1,286
|
$
|
60,608
|
$
|
1,078,568
|
||||||||
|
Purchases on Investments
|
—
|
—
|
—
|
—
|
||||||||||||
|
(Sales) of Investments
|
(983,662
|
)
|
—
|
—
|
(983,662
|
)
|
||||||||||
|
Realized (Gain) Loss
|
(3,648
|
)
|
—
|
—
|
(3,648
|
)
|
||||||||||
|
Transfers Into Level 3
|
—
|
—
|
—
|
—
|
||||||||||||
|
(Transfer Out) of Level 3
|
—
|
(2,143
|
)
|
(8,938
|
)
|
(11,081
|
)
|
|||||||||
|
Change in Unrealized
|
||||||||||||||||
|
Appreciation (Depreciation)
|
(29,364
|
)
|
857
|
(45,034
|
)*
|
(73,541
|
)
|
|||||||||
|
Balance as of December 31, 2019
|
$
|
—
|
$
|
—
|
$
|
6,636
|
$
|
6,636
|
||||||||
|
Change in unrealized appreciation
|
||||||||||||||||
|
(depreciation) during the year
|
||||||||||||||||
|
for Level 3 investments held
|
||||||||||||||||
|
at December 31, 2019.
|
$
|
(33,012
|
)
|
$
|
857
|
$
|
(19,760
|
)*
|
$
|
(51,915
|
)
|
|||||
|
*
|
The difference in unrealized depreciation values is due to a change in the cost basis from a corporate action.
|
The realized and unrealized gains and losses from Level 3 transactions are included with the net realized gain (loss) on investments and net change in unrealized appreciation (depreciation) on investments on the
Statements of Operations. The net change in unrealized depreciation on investments related to Level 3 securities held by TMF and EDF at December 31, 2019 totals $(3,349,928) and $(73,541), respectively. CEF held no Level 3 securities during the year
ended December 31, 2019.
96
The Merger Fund and Westchester Capital Funds
NOTES TO THE FINANCIAL STATEMENTS (continued)
December 31, 2019
Note 2 — SIGNIFICANT ACCOUNTING POLICIES (continued)
Significant unobservable valuation inputs monitored by the Valuation Group under the supervision of the Board of Trustees for restricted securities or material Level 3 investments as of December 31, 2019 for TMF is as
follows:
The Merger Fund
|
Fair Value at
|
Valuation
|
Unobservable
|
|
|
Description
|
December 31, 2019
|
Technique
|
Input
|
|
Escrow Note
|
$ —*
|
Projected Final
|
Discount of Projected
|
|
|
Distribution**
|
Distribution
|
|
*
|
Amount less than $0.50.
|
|
|
**
|
This Level 3 security was received through a corporate action. The security is being kept open due to the potential of an additional distribution. Based on the evaluation of the likelihood of an additional
distribution, the security is being priced at zero.
|
The table above does not include certain Level 3 investments that are valued by brokers. At December 31, 2019, the net value of these securities for TMF and EDF were $285,983 and $15,574, respectively. The inputs for
these investments are not readily available or cannot be reasonably estimated and are generally those inputs described in Note 2 A.
|
B.
|
Federal Income Taxes
|
No provision for federal income taxes has been made since the Funds have complied to date with the provisions of Subchapter M of the Internal Revenue Code applicable to regulated investment companies and intends to
continue to comply in future years and to distribute investment company net taxable income and net capital gains to shareholders. Additionally, the Funds intend to make all required distributions to avoid federal excise tax.
The Funds have reviewed all open tax years in major jurisdictions and concluded that there is no impact on the Funds’ net assets and there is no tax liability resulting from unrecognized tax benefits relating to
uncertain income tax positions taken or expected to be taken on a tax return. The Funds are also not aware of any tax positions for which it is reasonably possible that the total amounts of unrecognized tax benefits will significantly change in the
next twelve months. As of December 31, 2019, TMF’s and EDF’s open Federal and New York tax years include the tax years ended December 31, 2016 through December 31, 2019. As of December 31, 2019, CEF’s open Federal and New York tax years include the
tax years ended December 31, 2018 through December 31, 2019. The Funds have no tax examination in progress.
|
C.
|
Transactions with Brokers
|
The Funds’ deposits at brokers for securities sold short and deposits at brokers for other investments are with two securities dealers. The Funds are required by the brokers to maintain collateral for securities sold
short. The
97
The Merger Fund and Westchester Capital Funds
NOTES TO THE FINANCIAL STATEMENTS (continued)
December 31, 2019
Note 2 — SIGNIFICANT ACCOUNTING POLICIES (continued)
receivable from brokers for securities sold short on the Statements of Assets and Liabilities represents the proceeds from securities sold short that is maintained at the broker. The Funds do not require the brokers to maintain collateral in
support of the receivables from the brokers for proceeds on securities sold short. The Funds may maintain cash deposits at brokers beyond the receivables for short sales. On the Statement of Assets and Liabilities, these are classified as deposits at
brokers for other investments. A Fund may be required by the brokers with which it executes short sales to maintain an additional amount of collateral in a special tri-party custody arrangement for the benefit of the broker.
The Funds’ equity swap contracts’ and forward currency exchange contracts’ cash deposits are monitored daily by the Adviser and counterparty. These transactions may involve market risk in excess of the amounts receivable
or payable reflected on the Statements of Assets and Liabilities.
|
D.
|
Securities Sold Short
|
The Funds sell securities or currencies short for economic hedging purposes or any other investment purpose. For financial statement purposes, an amount equal to the settlement amount is initially included in the
Statements of Assets and Liabilities as an asset and an equivalent liability. The amount of the liability is subsequently priced to reflect the current value of the short position. Subsequent fluctuations in the market prices of securities or
currencies sold, but not yet purchased, may require purchasing the securities or currencies at prices which may differ from the market value reflected on the Statements of Assets and Liabilities. Short sale transactions result in off balance sheet
risk because the ultimate obligation may exceed the related amounts shown in the Statements of Assets and Liabilities. The Funds will incur losses if the price of the security increases between the date of the short sale and the date on which the
Funds purchase the securities to replace the borrowed securities. The Funds’ losses on short sales are potentially unlimited because there is no upward limit on the price a borrowed security could attain.
The Funds are liable for any dividends payable on securities while those securities are sold short. Until the security is replaced, the Funds are required to pay to the lender any income earned, which is recorded as an
expense by the Funds. The Funds segregate liquid assets in an amount equal to the market value of securities sold short, which is reflected in the Schedules of Investments. These assets are required to be adjusted daily to reflect changes in the
value of the securities or currencies sold short.
98
The Merger Fund and Westchester Capital Funds
NOTES TO THE FINANCIAL STATEMENTS (continued)
December 31, 2019
Note 2 — SIGNIFICANT ACCOUNTING POLICIES (continued)
|
E.
|
Written Option Contracts
|
The Funds are subject to equity price risk in the normal course of pursuing their investment objectives. The Funds write (sell) put or call options for hedging purposes, volatility management purposes, or otherwise to
gain, or reduce, long or short exposure to one or more asset classes or issuers. When a Fund writes (sells) an option, an amount equal to the premium received by the Fund is included in the Statements of Assets and Liabilities as an asset and an
equivalent liability. The amount of the liability is subsequently priced daily to reflect the current value of the option written. Refer to Note 2 A. for a pricing description. By writing an option, a Fund may become obligated during the term of the
option to deliver or purchase the securities underlying the option at the exercise price if the option is exercised. These contracts may involve market risk in excess of the amounts receivable or payable reflected on the Statements of Assets and
Liabilities. Refer to Note 2 R. for further derivative disclosures, and Note 2 P. for further counterparty risk disclosure.
When an option expires on its stipulated expiration date or the Funds enter into a closing purchase transaction, the Funds realize gains or losses if the cost of the closing purchase transaction differs from the premium
received when the option was sold without regard to any unrealized appreciation or depreciation on the underlying security, and the liability related to such option is eliminated. When a written call option is exercised, the premium originally
received decreases the cost basis of the security and the Funds realize gains or losses from the sale of the underlying security. When a written put option is exercised, the cost of the security acquired is decreased by the premium received for the
put.
|
F.
|
Purchased Option Contracts
|
The Funds are subject to equity price risk in the normal course of pursuing their investment objectives. The Funds purchase put or call options for hedging purposes, volatility management purposes, or otherwise to gain,
or reduce, long or short exposure to one or more asset classes or issuers. When the Funds purchase an option contract, an amount equal to the premiums paid is included in the Statements of Assets and Liabilities as an investment, and is subsequently
priced daily to reflect the value of the purchased option. Refer to Note 2 A. for a pricing description. Refer to Note 2 R. for further derivative disclosures, and Note 2 P. for further counterparty risk disclosure.
When option contracts expire or are closed, realized gains or losses are recognized without regard to any unrealized appreciation or depreciation on the underlying securities that may be held by the Funds. If the Fund
99
The Merger Fund and Westchester Capital Funds
NOTES TO THE FINANCIAL STATEMENTS (continued)
December 31, 2019
Note 2 — SIGNIFICANT ACCOUNTING POLICIES (continued)
exercises a call option, the cost of the security acquired is increased by the premium paid for the call. If the Fund exercises a put option, the premium paid for the put option increases the cost of the underlying security and a gain or loss is
realized from the sale of the underlying security.
|
G.
|
Forward Currency Exchange Contracts
|
The Funds are subject to foreign currency exchange rate risk in the normal course of pursuing their investment objectives. TMF and EDF use forward currency exchange contracts to hedge against changes in the value of
foreign currencies. The Funds may enter into forward currency exchange contracts obligating the Funds to deliver and receive a currency at a specified future date. Forward contracts are valued daily, and unrealized appreciation or depreciation is
recorded daily as the difference between the contract exchange rate and the closing forward rate applied to the face amount of the contract. Refer to Note 2 A. for a pricing description. A realized gain or loss is recorded at the time the forward
contract expires. Credit risk may arise as a result of the failure of the counterparty to comply with the terms of the contract. Refer to Note 2 P. for further counterparty risk disclosure.
The use of forward currency exchange contracts does not eliminate fluctuations in the underlying prices of the Funds’ investment securities. The use of forward currency exchange contracts involves the risk that
anticipated currency movements will not be accurately predicted. A forward currency exchange contract would limit the risk of loss due to a decline in the value of a particular currency; however, it would also limit any potential gain that might
result should the value of the currency increase instead of decrease. These contracts may involve market risk in excess of the amounts receivable or payable reflected on the Statements of Assets and Liabilities. Refer to Note 2 R. for further
derivative disclosures.
|
H.
|
Equity Swap Contracts
|
The Funds are subject to equity price risk and interest rate risk in the normal course of pursuing their investment objectives. The Funds entered into long and/or short equity swap contracts with multiple broker-dealers.
A long equity swap contract entitles the Funds to receive from the counterparty any appreciation and dividends paid on an individual security, while obligating the Funds to pay the counterparty any depreciation on the security as well as interest on
the notional amount of the contract at a rate equal to LIBOR and/or the U.S. Federal Funds Effective Rate plus an agreed upon spread (refer to the Schedules of Investments for further disclosure of the contracts’ financing rates). A short equity swap
contract obligates the Funds to pay the counterparty any appreciation and dividends paid on an individual security,
100
The Merger Fund and Westchester Capital Funds
NOTES TO THE FINANCIAL STATEMENTS (continued)
December 31, 2019
Note 2 — SIGNIFICANT ACCOUNTING POLICIES (continued)
while entitling the Funds to receive from the counterparty any depreciation on the security, and to pay to or receive from the counterparty interest on the notional value of the contract at a rate equal to LIBOR and/or the U.S. Federal Funds
Effective Rate less an agreed upon spread (refer to the Schedules of Investments for further disclosure of the contracts’ financing rates).
The Funds may also enter into equity swap contracts whose value may be determined by the spread between a long equity position and a short equity position. This type of swap contract obligates the Funds to pay the
counterparty an amount tied to any increase in the spread between the two securities over the term of the contract. The Funds are also obligated to pay the counterparty any dividends paid on the short equity holding as well as any net financing
costs. This type of swap contract entitles the Funds to receive from the counterparty any gains based on a decrease in the spread as well as any dividends paid on the long equity holding and any net interest income.
Fluctuations in the value of an open contract are recorded daily as net unrealized appreciation or depreciation. The Funds will realize gains or losses upon termination or reset of the contract. The Funds or the Funds’
counterparty, under certain conditions, may terminate the contract prior to the contract’s expiration date.
Credit risk may arise as a result of the failure of the counterparty to comply with the terms of the contract. Refer to Note 2 P. for further counterparty risk disclosure. Additionally, risk may arise from unanticipated
movements in interest rates or in the value of the underlying securities. Equity swap contracts may involve market risk in excess of the amounts receivable or payable reflected on the Statements of Assets and Liabilities. Refer to Note 2 R. for
further derivative disclosures.
|
I.
|
Reverse Repurchase Agreements
|
CEF may enter into reverse repurchase agreements. In a reverse repurchase agreement, CEF sells to a financial institution a security that it holds with an agreement to repurchase the same security at an agreed-upon price
and date. A reverse repurchase agreement involves the risk that the market value of the security may decline below the repurchase price of the security. CEF will segregate assets determined to be liquid by the Adviser or otherwise cover its
obligations under reverse repurchase agreements. Securities pledged as collateral are reflected as a component of Investments, at value on the Statements of Assets and Liabilities and are noted on CEF’s Schedule of Investments. Typically, the
counterparty under the terms of the agreement is able to rehypothecate, resell or repledge the security. The value of reverse repurchase agreements entered into are recorded in Payable for reverse repurchase agreements on the Statements of Assets and
Liabilities. Interest is accrued daily and an appropriate payment reflecting the interest due for
101
The Merger Fund and Westchester Capital Funds
NOTES TO THE FINANCIAL STATEMENTS (continued)
December 31, 2019
Note 2 — SIGNIFICANT ACCOUNTING POLICIES (continued)
reverse repurchase agreements held at period end is recorded in Interest payable for reverse repurchase agreements on the Statements of Assets and Liabilities. The cumulative interest paid during the period is recorded in Interest expense on
reverse repurchase agreements on the Statements of Operations. Refer to Note 2 P. for future counterparty risk disclosure.
|
J.
|
Distributions to Shareholders
|
Dividends from net investment income and net realized capital gains, if any, are declared and paid at least annually. Income and capital gain distributions are determined in accordance with income tax regulations which
may differ from GAAP. These differences are due primarily to wash sale-loss deferrals, constructive sales, straddle-loss deferrals, adjustments on swap contracts, and unrealized gains or losses on Section 1256 contracts, which were realized, for tax
purposes, at the end of each Fund’s fiscal year.
|
K.
|
Foreign Securities
|
Investing in securities of foreign companies and foreign governments involves special risks and considerations not typically associated with investing in U.S. companies and the U.S. government. These risks include
fluctuations in currency exchange rates and adverse political, cultural, regulatory, legal, tax, and economic developments as well as different custody and/or settlement practices or delayed settlements in some foreign markets. Moreover, securities
of many foreign companies and their markets may be less liquid and their prices more volatile than those of securities of comparable U.S. companies and the U.S. government.
|
L.
|
Foreign Currency Transactions
|
The books and records of the Funds are maintained in U.S. dollars. Foreign currency transactions are translated into U.S. dollars on the following basis: (i) market value of investment securities, assets and liabilities
at the daily rates of exchange, and (ii) purchases and sales of investment securities, dividend and interest income and certain expenses at the rates of exchange prevailing on the respective dates of such transactions. For financial reporting
purposes, the Funds do not isolate changes in the exchange rate of investment securities from the fluctuations arising from changes in the market prices of securities. However, for federal income tax purposes, the Funds do isolate and treat as
ordinary income the effect of changes in foreign exchange rates on realized gain or loss from the sale of investment securities and payables and receivables arising from trade-date and settlement-date differences. Foreign currency, if any, held as
cash by the Funds’ custodian is reported separately on the Statements of Assets and Liabilities.
|
M.
|
Cash and Cash Equivalents
|
The Funds consider highly liquid short-term fixed income investments purchased with an original maturity of less than three months to be cash
102
The Merger Fund and Westchester Capital Funds
NOTES TO THE FINANCIAL STATEMENTS (continued)
December 31, 2019
Note 2 — SIGNIFICANT ACCOUNTING POLICIES (continued)
equivalents. Cash equivalents are included in short-term investments on the Schedules of Investments as well as in investments on the Statements of Assets and Liabilities. Temporary cash overdrafts are reported as payable to custodian.
|
N.
|
Guarantees and Indemnifications
|
In the normal course of business, the Funds enter into contracts with service providers that contain general indemnification clauses. The Funds’ maximum exposure under these arrangements is unknown, as this would involve
future claims that may be made against the Funds that have not yet occurred. The Funds have not historically incurred material expenses in respect of those provisions.
|
O.
|
Security Transactions, Investment Income and Expenses
|
Transactions are recorded for financial statement purposes on the trade date. Realized gains and losses from security transactions are recorded on the identified cost basis. Distributions to shareholders are recorded on
the ex-dividend date. Dividend income is recorded on the ex-dividend date, except for certain dividends on foreign securities, which are recorded as soon as the Funds are informed after the ex-dividend date. Interest is accounted for on the accrual
basis and includes amortization of premiums and discounts on the effective interest method utilizing call features. At December 31, 2019, expenses include $3,296,647, $205,040 and $488 of borrowing expenses on securities sold short for TMF, EDF and
CEF, respectively. At December 31, 2019, expenses include $9,771,831, $665,414 and $1,099 of dividends and interest on securities sold short for TMF, EDF and CEF, respectively. At December 31, 2019, expenses included $8,315 of interest expenses on
reverse repurchase agreements for CEF.
|
P.
|
Counterparty Risk
|
The Funds help manage counterparty credit risk by entering into agreements only with counterparties the Adviser believes have the financial resources to honor their obligations. The Adviser considers the creditworthiness
of each counterparty to a contract in evaluating potential credit risk. The counterparty risk for forward currency exchange contracts to the Funds includes the amount of any net unrealized appreciation on the contract. The counterparty risk for
equity swaps contracts to the Funds includes the risk of loss of the full amount of any net unrealized appreciation on the contract, along with dividends receivable on long equity contracts and interest receivable on short equity contracts. The
counterparty risk for reverse repurchase agreements is failure of a counterparty to return the security and any net unrealized appreciation. The Fund may also have difficulty replacing the security the counterparty failed to return. Written and
purchased options sold on an exchange expose the Funds to counterparty
103
The Merger Fund and Westchester Capital Funds
NOTES TO THE FINANCIAL STATEMENTS (continued)
December 31, 2019
Note 2 — SIGNIFICANT ACCOUNTING POLICIES (continued)
risk; however, the exchange’s clearinghouse guarantees the options against default. Over-the-counter options counterparty risk includes the risk of loss of the full amount of any net unrealized appreciation.
|
Q.
|
The Right to Offset
|
Financial assets and liabilities, as well as cash collateral received by the Funds’ counterparties and posted are offset by the respective counterparty, and the net amount is reported in the Statements of Assets and
Liabilities when the Funds believe there exists a legally enforceable right to offset the recognized amounts.
|
R.
|
Derivatives
|
The Funds may utilize derivative instruments such as options, swaps, futures, forward contracts and other instruments with similar characteristics to the extent that they are consistent with the Funds’ respective
investment objectives and limitations. The use of these instruments may involve additional investment risks, including the possibility of illiquid markets or imperfect correlation between the value of the instruments and the underlying securities.
Derivatives also may create leverage which will amplify the effect of their performance on the Funds and may produce significant losses.
The Funds have adopted authoritative standards regarding disclosure about derivatives and hedging activities and how they affect the Funds’ Statements of Assets and Liabilities and Statements of Operations. For the year
ended December 31, 2019, each Fund’s monthly average quantity and notional value are described below:
The Merger Fund
|
Monthly Average
|
Monthly Average
|
|||||||
|
Quantity
|
Notional Value
|
|||||||
|
Purchased Option Contracts
|
30,838
|
$
|
252,682,019
|
|||||
|
Written Option Contracts
|
38,558
|
$
|
300,648,565
|
|||||
|
Forward Currency Exchange Contracts
|
9
|
$
|
127,169,912
|
|||||
|
Long Total Return Swap Contracts
|
35,547,998
|
$
|
171,094,571
|
|||||
|
Short Total Return Swap Contracts
|
2,766,519
|
$
|
108,651,072
|
|||||
|
WCM Alternatives: Event-Driven Fund
|
||||||||
|
Monthly Average
|
Monthly Average
|
|||||||
|
Quantity
|
Notional Value
|
|||||||
|
Purchased Option Contracts
|
11,712
|
$
|
49,322,637
|
|||||
|
Written Option Contracts
|
12,300
|
$
|
52,955,858
|
|||||
|
Forward Currency Exchange Contracts
|
10
|
$
|
13,441,723
|
|||||
|
Long Total Return Swap Contracts
|
4,709,709
|
$
|
74,609,440
|
|||||
|
Short Total Return Swap Contracts
|
358,742
|
$
|
15,060,165
|
|||||
104
The Merger Fund and Westchester Capital Funds
NOTES TO THE FINANCIAL STATEMENTS (continued)
December 31, 2019
Note 2 — SIGNIFICANT ACCOUNTING POLICIES (continued)
WCM Alternatives: Credit Event Fund
|
Monthly Average
|
Monthly Average
|
|||||||
|
Quantity
|
Notional Value
|
|||||||
|
Long Total Return Swap Contracts
|
110,138
|
$
|
1,228,855
|
|||||
|
Short Total Return Swap Contracts
|
298
|
$
|
45,470
|
|||||
Statements of Assets and Liabilities
Fair values of derivative instruments as of December 31, 2019 are described below:
|
Asset Derivatives
|
||||||
|
Statements of Assets
|
||||||
|
Derivatives
|
and Liabilities Location
|
Fair Value
|
||||
|
The Merger Fund
|
||||||
|
Equity Contracts:
|
||||||
|
Purchased Option Contracts
|
Investments
|
$
|
2,489,719
|
|||
|
Swap Contracts
|
Receivables
|
4,270,240
|
||||
|
Total
|
$
|
6,759,959
|
||||
|
WCM Alternatives: Event-Driven Fund
|
||||||
|
Equity Contracts:
|
||||||
|
Purchased Option Contracts
|
Investments
|
$
|
386,369
|
|||
|
Swap Contracts
|
Receivables
|
2,184,571
|
||||
|
Total
|
$
|
2,570,940
|
||||
|
Liability Derivatives
|
||||||
|
Statements of Assets
|
||||||
|
Derivatives
|
and Liabilities Location
|
Fair Value
|
||||
|
The Merger Fund
|
||||||
|
Equity Contracts:
|
||||||
|
Written Option Contracts
|
Written Option Contracts
|
$
|
43,793,639
|
|||
|
Swap Contracts
|
Payables
|
15,876,059
|
||||
|
Foreign Exchange Contracts:
|
||||||
|
Forward Currency Exchange Contracts
|
Payables
|
2,498,197
|
||||
|
Total
|
$
|
62,167,895
|
||||
|
WCM Alternatives: Event-Driven Fund
|
||||||
|
Equity Contracts:
|
||||||
|
Written Option Contracts
|
Written Option Contracts
|
$
|
4,496,136
|
|||
|
Swap Contracts
|
Payables
|
554,883
|
||||
|
Foreign Exchange Contracts:
|
||||||
|
Forward Currency Exchange Contracts
|
Payables
|
275,949
|
||||
|
Total
|
$
|
5,326,968
|
||||
|
WCM Alternatives: Credit Event Fund
|
||||||
|
Equity Contracts:
|
||||||
|
Swap Contracts
|
Payables
|
$
|
11,037
|
|||
|
Tota
|
$
|
11,037
|
||||
105
The Merger Fund and Westchester Capital Funds
NOTES TO THE FINANCIAL STATEMENTS (continued)
December 31, 2019
Note 2 — SIGNIFICANT ACCOUNTING POLICIES (continued)
Statements of Operations
The effect of derivative instruments on the Statements of Operations for the year ended December 31, 2019 are described below:
Amount of Realized Gain (Loss) on Derivatives
|
Forward
|
|||||||||||||||||||||
|
Purchased
|
Written
|
Currency
|
|||||||||||||||||||
|
Option
|
Option
|
Exchange
|
Swap
|
||||||||||||||||||
|
Derivatives
|
Contracts*
|
Contracts
|
Contracts
|
Contracts
|
Total
|
||||||||||||||||
|
The Merger Fund
|
|||||||||||||||||||||
|
Equity Contracts
|
$
|
(24,180,175
|
)
|
$
|
14,276,733
|
$
|
—
|
$
|
3,611,525
|
$
|
(6,291,917
|
)
|
|||||||||
|
Foreign Exchange
|
|||||||||||||||||||||
|
Contracts
|
—
|
—
|
(1,996,867
|
)
|
—
|
(1,996,867
|
)
|
||||||||||||||
|
Total
|
$
|
(24,180,175
|
)
|
$
|
14,276,733
|
$
|
(1,996,867
|
)
|
$
|
3,611,525
|
$
|
(8,288,784
|
)
|
||||||||
|
WCM Alternatives:
|
|||||||||||||||||||||
|
Event-Driven Fund
|
|||||||||||||||||||||
|
Equity Contracts
|
$
|
(3,257,062
|
)
|
$
|
895,816
|
$
|
—
|
$
|
5,460,016
|
$
|
3,098,770
|
||||||||||
|
Foreign Exchange
|
|||||||||||||||||||||
|
Contracts
|
—
|
—
|
83,980
|
—
|
83,980
|
||||||||||||||||
|
Total
|
$
|
(3,257,062
|
)
|
$
|
895,816
|
$
|
83,980
|
$
|
5,460,016
|
$
|
3,182,750
|
||||||||||
|
WCM Alternatives:
|
|||||||||||||||||||||
|
Credit Event Fund
|
|||||||||||||||||||||
|
Equity Contracts
|
$
|
31,187
|
$
|
31,187
|
|||||||||||||||||
|
Total
|
$
|
31,187
|
$
|
31,187
|
|||||||||||||||||
|
*
|
The amounts disclosed are included in the realized gain (loss) on investments.
|
Change in Unrealized Appreciation (Depreciation) on Derivatives
|
Forward
|
|||||||||||||||||||||
|
Purchased
|
Written
|
Currency
|
|||||||||||||||||||
|
Option
|
Option
|
Exchange
|
Swap
|
||||||||||||||||||
|
Derivatives
|
Contracts*
|
Contracts
|
Contracts
|
Contracts
|
Total
|
||||||||||||||||
|
The Merger Fund
|
|||||||||||||||||||||
|
Equity Contracts
|
$
|
(4,162,876
|
)
|
$
|
(11,499,652
|
)
|
$
|
—
|
$
|
(21,229,196
|
)
|
$
|
(36,891,724
|
)
|
|||||||
|
Foreign Exchange
|
|||||||||||||||||||||
|
Contracts
|
—
|
—
|
(3,362,682
|
)
|
—
|
(3,362,682
|
)
|
||||||||||||||
|
Total
|
$
|
(4,162,876
|
)
|
$
|
(11,499,652
|
)
|
$
|
(3,362,682
|
)
|
$
|
(21,229,196
|
)
|
$
|
(40,254,406
|
)
|
||||||
|
WCM Alternatives:
|
|||||||||||||||||||||
|
Event-Driven Fund
|
|||||||||||||||||||||
|
Equity Contracts
|
$
|
(1,052,312
|
)
|
$
|
(840,190
|
)
|
$
|
—
|
$
|
(24,296
|
)
|
$
|
(1,916,798
|
)
|
|||||||
|
Foreign Exchange
|
|||||||||||||||||||||
|
Contracts
|
—
|
—
|
(391,441
|
)
|
—
|
(391,441
|
)
|
||||||||||||||
|
Total
|
$
|
(1,052,312
|
)
|
$
|
(840,190
|
)
|
$
|
(391,441
|
)
|
$
|
(24,296
|
)
|
$
|
(2,308,239
|
)
|
||||||
|
WCM Alternatives:
|
|||||||||||||||||||||
|
Credit Event Fund
|
|||||||||||||||||||||
|
Equity Contracts
|
$
|
84,021
|
$
|
84,021
|
|||||||||||||||||
|
Total
|
$
|
84,021
|
$
|
84,021
|
|||||||||||||||||
|
*
|
The amounts disclosed are included in the change in unrealized appreciation (depreciation) on investments.
|
106
The Merger Fund and Westchester Capital Funds
NOTES TO THE FINANCIAL STATEMENTS (continued)
December 31, 2019
Note 2 — SIGNIFICANT ACCOUNTING POLICIES (continued)
|
S.
|
LIBOR
|
The London Interbank Offered Rate, or “LIBOR,” is intended to represent the rate at which contributing banks may obtain short-term borrowings from each other in the London interbank market. LIBOR may be available for
different durations (e.g., 1 month or 3 months) and for different currencies. The terms of many investments, financings or other transactions to which the Funds may have exposure have been historically tied to LIBOR. LIBOR may be a significant factor
in determining the Funds’ payment obligations under a derivative investment, the cost of financing to the Funds or an investment’s value or return to the Funds, and may be used in other ways that affect the Funds’ investment performance.
The regulatory authority that oversees financial services firms and financial markets in the U.K. has announced that, after the end of 2021, it would no longer persuade or compel contributing banks to make rate
submissions for purposes of determining the LIBOR rate. As a result, it is possible that commencing in 2022, LIBOR may no longer be available or no longer deemed an appropriate reference rate upon which to determine the interest rate on or impacting
certain investments of the Funds’ portfolio.
In light of this eventuality, public and private sector industry initiatives are currently underway to identify new or alternative reference rates to be used in place of LIBOR. However, there are obstacles to converting
certain securities and transactions to a new reference rate. Transition planning is at an early stage, and neither the effect of the transition process nor its ultimate success can yet be known. The transition process might lead to increased
volatility and illiquidity in markets for instruments whose terms currently include LIBOR. It could also lead to a reduction in the value of some LIBOR-based investments and reduce the effectiveness of new hedges placed against existing LIBOR-based
investments. There is no assurance that the composition or characteristics of any such alternative reference rate will be similar to or produce the same value or economic equivalence as LIBOR or that it will have the same volume or liquidity as did
LIBOR prior to its discontinuance or unavailability, which may affect the value or liquidity or return on certain investments of the Funds and result in costs incurred in connection with closing out positions and entering into new trades. These risks
may also apply with respect to changes in connection with other interbank offering rates (e.g., Euribor) and a wide range of other index levels, rates and values that are treated as “benchmarks” and are the subject of recent regulatory reform. All of
the aforementioned may adversely affect the Funds’ performance or NAV. Refer to Note 2 A. for a pricing description.
107
The Merger Fund and Westchester Capital Funds
NOTES TO THE FINANCIAL STATEMENTS (continued)
December 31, 2019
Note 3 — AGREEMENTS
The Funds’ investment adviser is Westchester Capital Management, LLC pursuant to an investment advisory agreement between TMF and the Adviser dated as of January 1, 2011 (the “TMF Advisory Agreement”) and pursuant to an
investment advisory agreement between WCF, with respect to EDF and CEF, and the Adviser dated as of November 13, 2017 (the “EDF and CEF Advisory Agreement” and together with the TMF Advisory Agreement, the “Advisory Agreements”).
Under the terms of the TMF Advisory Agreement, the Adviser is entitled to receive a fee, calculated daily and payable monthly, at the annual rate of 1.00% of TMF’s average daily net assets. The Adviser has agreed until
April 30, 2020 to reduce its advisory fee so that the advisory fee will be: (i) 1.00% of the first $2.0 billion in average daily net assets of TMF and (ii) 0.93% on average daily net assets above $2.0 billion (the “TMF Fee Waiver Agreement”).
Investment advisory fees waived by the Adviser on behalf of TMF for the year ended December 31, 2019 were $727,445.
Under the terms of the EDF and CEF Advisory Agreement, the Adviser is entitled to receive a fee, calculated daily and payable monthly, at the annual rate of 1.25% of EDF’s average daily net assets and 1.00% of CEF’s
average daily net assets. The Adviser contractually agreed until December 31, 2019 to waive its investment advisory fee and to reimburse EDF for other ordinary operating expenses to the extent necessary to limit ordinary operating expenses to an
amount not to exceed 1.74% for Institutional Class shares and 1.99% for Investor Class shares (the “EDF Expense Limitation Agreement”). Refer to Note 9 for changes to the EDF Expense Limitation Agreement effective January 1, 2020. The Advisor has
contractually agreed until December 31, 2020 to waive its investment advisory fee and to reimburse CEF for other ordinary operating expenses to the extent necessary to limit ordinary operating expenses to an amount not to exceed 1.64% for
Institutional Class shares and 1.89% for Investor Class shares (the “CEF Expense Limitation Agreement”). Ordinary operating expenses exclude taxes, commissions, mark-ups, litigation expenses, indemnification expenses, interest expenses, borrowing
expenses, including on securities sold short, dividend expenses on securities sold short, trading or investment expenses, acquired fund fees and expenses, and any extraordinary expenses. To the extent that the Adviser waives its investment advisory
fee for EDF or CEF and/or reimburses EDF or CEF for other ordinary operating expenses, it may seek reimbursement of a portion or all of such amounts at any time within three fiscal years after the fiscal year in which such amounts were waived or
reimbursed, subject to the expense limitation in place at the time such amounts were waived or reimbursed. For the year ended December 31, 2019, the Adviser recouped $5,319 of advisory fees and other expenses to
108
The Merger Fund and Westchester Capital Funds
NOTES TO THE FINANCIAL STATEMENTS (continued)
December 31, 2019
Note 3 — AGREEMENTS (continued)
EDF and for the year ended December 31, 2019, the Adviser waived and reimbursed $144,336 of advisory fees and other expenses to CEF.
Investment advisory fees waived and expenses reimbursed on behalf of EDF and CEF that are subject to potential recovery by the Adviser are shown in the following table by year of expiration.
|
WCM Alternatives: Event-Driven Fund
|
Year of Expiration
|
Potential Recovery
|
|
12/31/2019
|
$5,319(a)
|
|
|
WCM Alternatives: Credit Event Fund
|
Year of Expiration
|
Potential Recovery
|
|
12/31/2020
|
$173,278
|
|
|
12/31/2021
|
$144,336
|
|
(a)
|
For the year ended December 31, 2019, the Advisor has recouped/recovered all available fees and expenses.
|
Each of the TMF Fee Waiver Agreement, the EDF Expense Limitation Agreement and the CEF Expense Limitation Agreement may be terminated at any time by such Fund’s Board of Trustees. Certain officers of the Funds are also
officers of the Adviser. Each Advisory Agreement was approved for an initial term of two years and thereafter will remain in effect from year to year provided that such continuance is specifically approved at least annually by the vote of a majority
of the relevant Fund’s Trustees who are not interested persons of the Adviser or such Fund or by a vote of a majority of the outstanding voting securities of such Fund.
U.S. Bancorp Fund Services, LLC, doing business as U.S. Bank Global Fund Services (“Fund Services”) and a subsidiary of U.S. Bancorp, a publicly held bank holding company, serves as transfer agent, administrator,
accountant, dividend paying agent and shareholder servicing agent for the Funds. U.S. Bank, N.A. serves as custodian for the Funds.
Distribution services are performed pursuant to distribution contracts with broker-dealers and other qualified institutions.
Note 4 — SHARES OF BENEFICIAL INTEREST
The Board of Trustees of each Fund has the authority to issue an unlimited amount of shares of beneficial interest without par value.
Changes in shares of beneficial interest were as follows:
|
Year Ended
|
Year Ended
|
|||||||||||||||
| The Merger Fund |
December 31, 2019
|
December 31, 2018
|
||||||||||||||
|
Investor Class
|
Shares
|
Amount
|
Shares
|
Amount
|
||||||||||||
|
Issued
|
22,139,549
|
$
|
372,043,431
|
33,197,364
|
$
|
553,768,103
|
||||||||||
|
Issued as reinvestment
|
||||||||||||||||
|
of dividends
|
671,088
|
11,522,587
|
2,808,501
|
46,003,244
|
||||||||||||
|
Redeemed
|
(39,825,094
|
)
|
(672,209,911
|
)
|
(31,786,636
|
)
|
(526,161,249
|
)
|
||||||||
|
Net Increase (Decrease)
|
(17,014,457
|
)
|
$
|
(288,643,893
|
)
|
4,219,229
|
$
|
73,610,098
|
||||||||
109
The Merger Fund and Westchester Capital Funds
NOTES TO THE FINANCIAL STATEMENTS (continued)
December 31, 2019
Note 4 — SHARES OF BENEFICIAL INTEREST (continued)
|
Year Ended
|
Year Ended
|
|||||||||||||||
|
The Merger Fund (continued)
|
December 31, 2019
|
December 31, 2018
|
||||||||||||||
|
Institutional Class
|
Shares
|
Amount
|
Shares
|
Amount
|
||||||||||||
|
Issued
|
63,747,760
|
$
|
1,069,624,980
|
43,506,112
|
$
|
720,447,542
|
||||||||||
|
Issued as reinvestment
|
||||||||||||||||
|
of dividends
|
1,204,623
|
20,599,052
|
2,631,814
|
42,793,301
|
||||||||||||
|
Redeemed
|
(30,358,811
|
)
|
(510,505,208
|
)
|
(27,148,324
|
)
|
(447,283,602
|
)
|
||||||||
|
Net Increase
|
34,593,572
|
$
|
579,718,824
|
18,989,602
|
$
|
315,957,241
|
||||||||||
|
Year Ended
|
Year Ended
|
|||||||||||||||
| WCM Alternatives: |
December 31, 2019
|
December 31, 2018
|
||||||||||||||
|
Event-Driven Fund
|
Shares
|
Amount
|
Shares
|
Amount
|
||||||||||||
|
Investor Class
|
||||||||||||||||
|
Issued
|
980,466
|
$
|
10,482,375
|
507,188
|
$
|
5,306,943
|
||||||||||
|
Issued as reinvestment
|
||||||||||||||||
|
of dividends
|
36,828
|
404,005
|
51,498
|
519,098
|
||||||||||||
|
Redeemed
|
(272,769
|
)
|
(2,920,389
|
)
|
(86,753
|
)
|
(909,847
|
)
|
||||||||
|
Net Increase
|
744,525
|
$
|
7,965,991
|
471,933
|
$
|
4,916,194
|
||||||||||
|
Year Ended
|
Year Ended
|
|||||||||||||||
|
December 31, 2019
|
December 31, 2018
|
|||||||||||||||
|
Institutional Class
|
Shares
|
Amount
|
Shares
|
Amount
|
||||||||||||
|
Issued
|
7,467,678
|
$
|
79,923,691
|
4,957,091
|
$
|
51,992,483
|
||||||||||
|
Issued as reinvestment
|
||||||||||||||||
|
of dividends
|
411,433
|
4,525,763
|
692,534
|
6,994,591
|
||||||||||||
|
Redeemed
|
(3,079,889
|
)
|
(33,157,545
|
)
|
(1,585,769
|
)
|
(16,643,231
|
)
|
||||||||
|
Net Increase
|
4,799,222
|
$
|
51,291,909
|
4,063,856
|
$
|
42,343,843
|
||||||||||
|
Year Ended
|
Year Ended
|
|||||||||||||||
| WCM Alternatives: |
December 31, 2019
|
December 31, 2018
|
||||||||||||||
|
Credit Event Fund
|
Shares
|
Amount
|
Shares
|
Amount
|
||||||||||||
|
Investor Class
|
||||||||||||||||
|
Issued
|
39,549
|
$
|
417,609
|
4,231
|
$
|
42,400
|
*
|
|||||||||
|
Issued as reinvestment
|
||||||||||||||||
|
of dividends
|
1,284
|
13,380
|
57
|
547
|
||||||||||||
|
Redeemed
|
(438
|
)
|
(4,628
|
)
|
(258
|
)
|
(2,561
|
)
|
||||||||
|
Net Increase
|
40,395
|
$
|
426,361
|
4,030
|
$
|
40,386
|
||||||||||
|
Year Ended
|
Year Ended
|
|||||||||||||||
|
December 31, 2019
|
December 31, 2018
|
|||||||||||||||
|
Institutional Class
|
Shares
|
Amount
|
Shares
|
Amount
|
||||||||||||
|
Issued
|
55,741
|
$
|
592,859
|
395,754
|
$
|
3,960,131
|
*
|
|||||||||
|
Issued as reinvestment
|
||||||||||||||||
|
of dividends
|
13,006
|
135,910
|
6,338
|
60,465
|
||||||||||||
|
Redeemed
|
(11,681
|
)
|
(113,367
|
)
|
(10,005
|
)
|
(99,029
|
)
|
||||||||
|
Net Increase
|
57,066
|
$
|
615,402
|
392,087
|
$
|
3,921,567
|
||||||||||
|
*
|
The Fund received a seed investment of $2,700,000 and $10,000 within the Institutional and Investor share class, respectively, on December 29, 2017 in a non-interest bearing account. The Fund did not conduct investment activity nor incur
operating expenses until January 2, 2018.
|
110
The Merger Fund and Westchester Capital Funds
NOTES TO THE FINANCIAL STATEMENTS (continued)
December 31, 2019
Note 5 — INVESTMENT TRANSACTIONS AND INCOME TAX INFORMATION
TMF’s purchases and sales of securities for the year ended December 31, 2019 (excluding short-term investments, short-term options, forward currency contracts, swap contracts and securities sold short) in the aggregate
were $4,187,957,621 and $3,706,669,566, respectively. EDF’s purchases and sales of securities for the year ended December 31, 2019 (excluding short-term investments, short-term options, forward currency contracts, swap contracts and securities sold
short) in the aggregate were $398,440,881 and $369,750,744, respectively. CEF’s purchases and sales of securities for the year ended December 31, 2019 (excluding short-term investments and swap contracts, reverse repurchase agreements and securities
sold short) in the aggregate were $4,547,403 and $4,443,851, respectively. There were no purchases or sales of long-term U.S. Government securities by the Funds.
At December 31, 2019, the components of accumulated earnings gains (losses) on a tax basis were as follows:
|
WCM Alternatives:
|
WCM Alternatives:
|
|||||||||||
|
The Merger Fund
|
Event-Driven Fund
|
Credit Event Fund
|
||||||||||
|
Cost of investments*
|
$
|
3,137,936,052
|
$
|
209,363,204
|
$
|
4,396,020
|
||||||
|
Gross unrealized appreciation
|
185,222,949
|
10,307,702
|
157,590
|
|||||||||
|
Gross unrealized depreciation
|
(44,832,045
|
)
|
(4,838,653
|
)
|
(65,708
|
)
|
||||||
|
Net unrealized
|
||||||||||||
|
appreciation (depreciation)
|
$
|
140,390,904
|
$
|
5,469,049
|
$
|
91,882
|
||||||
|
Undistributed ordinary income
|
—
|
4,752,552
|
30,339
|
|||||||||
|
Undistributed long-term capital gain
|
—
|
3,208,033
|
35,243
|
|||||||||
|
Total distributable earnings
|
$
|
—
|
$
|
7,960,585
|
$
|
65,582
|
||||||
|
Other accumulated losses
|
(25,919,335
|
)
|
(686,460
|
)
|
—
|
|||||||
|
Total accumulated gains (losses)
|
$
|
114,471,569
|
$
|
12,743,174
|
$
|
157,464
|
||||||
|
*
|
Represents cost (including derivative contracts) for federal income tax purposes and differs from the cost for financial reporting purposes due to wash sales, constructive sales, PFIC mark to market, and unsettled short losses.
|
GAAP requires that certain components of net assets relating to permanent differences be reclassified between financial and tax reporting. Permanent differences are primarily related to foreign currency transactions and
swap treatment. These reclassifications have no effect on net assets or net asset value per share. For the year ended December 31, 2019, the following table shows the reclassifications made:
|
Distributable
|
||||||||
|
Loss
|
Paid-in Capital
|
|||||||
|
The Merger Fund
|
$
|
4,322
|
$
|
(4,322
|
)
|
|||
|
WCM Alternatives: Event-Driven Fund
|
$
|
76,164
|
$
|
(76,164
|
)
|
|||
|
WCM Alternatives: Credit Event Fund
|
$
|
125
|
$
|
(125
|
)
|
|||
111
The Merger Fund and Westchester Capital Funds
NOTES TO THE FINANCIAL STATEMENTS (continued)
December 31, 2019
Note 5 — INVESTMENT TRANSACTIONS AND INCOME TAX INFORMATION (continued)
The tax components of dividends paid during the year ended December 31, 2019 and the year ended December 31, 2018 were as follows:
|
WCM Alternatives:
|
WCM Alternatives:
|
|||||||||||||||||||||||
|
The Merger Fund
|
Event-Driven Fund
|
Credit Event Fund
|
||||||||||||||||||||||
|
Investor Class
|
2019
|
2018
|
2019
|
2018
|
2019
|
2018
|
||||||||||||||||||
|
Ordinary Income
|
$
|
13,594,494
|
$
|
48,391,719
|
$
|
404,640
|
$
|
519,098
|
$
|
12,495
|
$
|
547
|
||||||||||||
|
Long-Term Capital Gains
|
—
|
6,684,398
|
—
|
—
|
958
|
—
|
||||||||||||||||||
|
Total Distributions Paid
|
$
|
13,594,494
|
$
|
55,076,117
|
$
|
404,640
|
$
|
519,098
|
$
|
13,453
|
$
|
547
|
||||||||||||
|
Institutional Class
|
||||||||||||||||||||||||
|
Ordinary Income
|
$
|
28,505,531
|
$
|
62,454,617
|
$
|
4,526,978
|
$
|
7,102,230
|
$
|
126,453
|
$
|
60,465
|
||||||||||||
|
Long-Term Capital Gains
|
—
|
8,026,173
|
—
|
—
|
9,457
|
—
|
||||||||||||||||||
|
Total Distributions Paid
|
$
|
28,505,531
|
$
|
70,480,790
|
$
|
4,526,978
|
$
|
7,102,230
|
$
|
135,910
|
$
|
60,465
|
||||||||||||
The Funds designated as long-term capital gain dividend, pursuant to Internal Revenue Case Section 852(b)(3), the amount necessary to reduce the earnings and profits of the Fund related to net capital gain to zero for
the tax year ended December 31, 2019.
As of December 31, 2019, TMF had no post-October and $6,389,765 of late-year losses. As of December 31, 2019, CEF did not have any post-October ordinary losses deferred, on a tax basis. As of December 31, 2019, EDF did
not have any post-October ordinary losses deferred, on a tax basis. As of December 31, 2019, TMF had $14,726,543 of short-term and no long-term capital loss carryover. As of December 31, 2019, EDF had no short-term or long-term capital loss
carryover. As of December 31, 2019, CEF had no short-term or long-term capital loss carryover.
Note 6 — DISTRIBUTION PLAN
TMF has adopted an Amended and Restated Plan of Distribution (the “TMF Plan”) dated July 30, 2013, pursuant to Rule 12b-1 under the 1940 Act that applies to TMF’s Investor Class shares. EDF has adopted a Plan of
Distribution (the “EDF Plan”) dated July 30, 2013, pursuant to Rule 12b-1 under the 1940 Act that applies to EDF’s Investor Class shares. CEF has adopted a Plan of Distribution (the “CEF Plan” and together with the TMF Plan and EDF Plan, the “Plans”)
dated October 31, 2017, pursuant to Rule 12b-1 under the 1940 Act that applies to CEF’s Investor Class shares. Under each Plan, a Fund may pay the Fund's distributor for certain of the distribution and shareholder service expenses associated with
the Fund's Investor Class shares, as well as to reimburse the distributor for payments made to any broker-dealer or other financial intermediary with whom the Fund has entered into a contract to distribute the Fund's Investor Class shares, or any
other qualified financial services firm, to compensate those
112
The Merger Fund and Westchester Capital Funds
NOTES TO THE FINANCIAL STATEMENTS (continued)
December 31, 2019
Note 6 — DISTRIBUTION PLAN (continued)
broker-dealers, intermediaries or firms for distribution and/or shareholder-related services with respect to the Fund's Investor Class shares held or purchased by their respective customers or in connection with the purchase of the Fund's Investor
Class shares attributable to their efforts. Under each Plan, the amount of such compensation paid in any one year shall not exceed 0.25% annually of the average daily net assets attributable to the respective Fund’s Investor Class shares, which may
be payable as a distribution fee or a service fee for providing permitted recordkeeping, subaccounting, subtransfer agency and/or shareholder liaison services. For the year ended December 31, 2019, TMF incurred $2,943,831 pursuant to the TMF Plan in
respect of TMF’s Investor Class shares. For the year ended December 31, 2019, EDF incurred $37,730 pursuant to the EDF Plan in respect of EDF’s Investor Class shares. For the year ended December 31, 2019, CEF incurred $318 pursuant to the CEF Plan in
respect of CEF’s Investor Class shares. Each Plan will remain in effect from year to year provided such continuance is approved at least annually by a vote either of a majority of the relevant Fund’s Trustees, including a majority of the
non-interested Trustees, or a majority of the relevant Fund’s outstanding Investor Class shares.
Note 7 — OFFSETTING ASSETS AND LIABILITIES
Each Fund is subject to various Master Netting Arrangements, which govern the terms of certain transactions with select counterparties. The Master Netting Arrangements allow each Fund to close out and net its total
exposure to a counterparty in the event of a default with respect to all the transactions governed under a single agreement with a counterparty. The Master Netting Arrangements also specify collateral posting arrangements at pre-arranged exposure
levels. Under the Master Netting Arrangements, collateral is routinely transferred if the total net exposure to certain transactions (net of existing collateral already in place) governed under the relevant Master Netting Arrangement with a
counterparty in a given account exceeds a specified threshold depending on the counterparty and the type of Master Netting Arrangement.
113
The Merger Fund and Westchester Capital Funds
NOTES TO THE FINANCIAL STATEMENTS (continued)
December 31, 2019
Note 7 — OFFSETTING ASSETS AND LIABILITIES (continued)
The Merger Fund
|
Gross
|
Net
|
|||||||||||||||||||||||
|
Amounts
|
Amounts
|
|||||||||||||||||||||||
|
Offset
|
Presented
|
Gross Amounts not
|
||||||||||||||||||||||
|
Gross
|
in the
|
in the
|
offset in the Statement
|
|||||||||||||||||||||
|
Amounts of
|
Statement
|
Statement
|
of Assets and Liabilities
|
|||||||||||||||||||||
|
Recognized
|
of Assets
|
of Assets
|
Collateral
|
|||||||||||||||||||||
|
Assets/
|
and
|
and
|
Financial
|
Received/
|
Net
|
|||||||||||||||||||
|
Liabilities
|
Liabilities
|
Liabilities
|
Instruments
|
Pledged*
|
Amount
|
|||||||||||||||||||
|
Assets:
|
||||||||||||||||||||||||
|
Description
|
||||||||||||||||||||||||
|
Forward Currency
|
||||||||||||||||||||||||
|
Exchange Contracts —
|
||||||||||||||||||||||||
|
JPMorgan Chase
|
||||||||||||||||||||||||
|
& Co., Inc.
|
$
|
603,955
|
$
|
603,955
|
$
|
—
|
$
|
—
|
$
|
—
|
$
|
—
|
||||||||||||
|
Swap Contracts —
|
||||||||||||||||||||||||
|
Bank of America
|
||||||||||||||||||||||||
|
Merrill Lynch
|
||||||||||||||||||||||||
|
& Co., Inc.
|
9,015,220
|
9,015,220
|
—
|
—
|
—
|
—
|
||||||||||||||||||
|
Swap Contracts —
|
||||||||||||||||||||||||
|
JPMorgan Chase
|
||||||||||||||||||||||||
|
& Co., Inc.
|
12,080,529
|
7,810,289
|
4,270,240
|
—
|
—
|
4,270,240
|
||||||||||||||||||
|
Swap Contracts —
|
||||||||||||||||||||||||
|
Goldman,
|
||||||||||||||||||||||||
|
Sachs & Co.
|
3,974,141
|
3,974,141
|
—
|
—
|
—
|
—
|
||||||||||||||||||
|
$
|
25,673,845
|
$
|
21,403,605
|
$
|
4,270,240
|
$
|
—
|
$
|
—
|
$
|
4,270,240
|
|||||||||||||
|
Liabilities:
|
||||||||||||||||||||||||
|
Description
|
||||||||||||||||||||||||
|
Written Option
|
||||||||||||||||||||||||
|
Contracts**
|
$
|
43,793,639
|
$
|
—
|
$
|
43,793,639
|
$
|
—
|
$
|
43,793,639
|
$
|
—
|
||||||||||||
|
Forward Currency
|
||||||||||||||||||||||||
|
Exchange Contracts —
|
||||||||||||||||||||||||
|
JPMorgan Chase
|
||||||||||||||||||||||||
|
& Co., Inc.
|
3,094,994
|
603,955
|
2,491,039
|
—
|
2,491,039
|
—
|
||||||||||||||||||
|
Forward Currency
|
||||||||||||||||||||||||
|
Exchange Contracts —
|
||||||||||||||||||||||||
|
Goldman,
|
||||||||||||||||||||||||
|
Sachs & Co.
|
7,158
|
—
|
7,158
|
—
|
7,158
|
—
|
||||||||||||||||||
|
Swap Contracts —
|
||||||||||||||||||||||||
|
Bank of America
|
||||||||||||||||||||||||
|
Merrill Lynch
|
||||||||||||||||||||||||
|
& Co., Inc.
|
12,965,039
|
9,015,220
|
3,949,819
|
—
|
3,949,819
|
—
|
||||||||||||||||||
|
Swap Contracts —
|
||||||||||||||||||||||||
|
JPMorgan Chase
|
||||||||||||||||||||||||
|
& Co., Inc.
|
7,810,289
|
7,810,289
|
—
|
—
|
—
|
—
|
||||||||||||||||||
|
Swap Contracts —
|
||||||||||||||||||||||||
|
Goldman,
|
||||||||||||||||||||||||
|
Sachs & Co.
|
15,900,381
|
3,974,141
|
11,926,240
|
—
|
11,926,240
|
—
|
||||||||||||||||||
|
$
|
83,571,500
|
$
|
21,403,605
|
$
|
62,167,895
|
$
|
—
|
$
|
62,167,895
|
$
|
—
|
|||||||||||||
114
The Merger Fund and Westchester Capital Funds
NOTES TO THE FINANCIAL STATEMENTS (continued)
December 31, 2019
Note 7 — OFFSETTING ASSETS AND LIABILITIES (continued)
WCM Alternatives: Event-Driven Fund
|
Gross
|
Net
|
|||||||||||||||||||||||
|
Amounts
|
Amounts
|
|||||||||||||||||||||||
|
Offset
|
Presented
|
Gross Amounts not
|
||||||||||||||||||||||
|
Gross
|
in the
|
in the
|
offset in the Statement
|
|||||||||||||||||||||
|
Amounts of
|
Statement
|
Statement
|
of Assets and Liabilities
|
|||||||||||||||||||||
|
Recognized
|
of Assets
|
of Assets
|
Collateral
|
|||||||||||||||||||||
|
Assets/
|
and
|
and
|
Financial
|
Received/
|
Net
|
|||||||||||||||||||
|
Liabilities
|
Liabilities
|
Liabilities
|
Instruments
|
Pledged*
|
Amount
|
|||||||||||||||||||
|
Assets:
|
||||||||||||||||||||||||
|
Description
|
||||||||||||||||||||||||
|
Forward Currency
|
||||||||||||||||||||||||
|
Exchange Contracts —
|
||||||||||||||||||||||||
|
JPMorgan Chase
|
||||||||||||||||||||||||
|
& Co., Inc.
|
$
|
68,410
|
$
|
68,410
|
$
|
—
|
$
|
—
|
$
|
—
|
$
|
—
|
||||||||||||
|
Swap
|
||||||||||||||||||||||||
|
Contracts —
|
||||||||||||||||||||||||
|
Bank of America
|
||||||||||||||||||||||||
|
Merrill Lynch
|
||||||||||||||||||||||||
|
& Co., Inc.
|
1,291,912
|
1,291,912
|
—
|
—
|
—
|
—
|
||||||||||||||||||
|
Swap Contracts —
|
||||||||||||||||||||||||
|
JPMorgan
|
||||||||||||||||||||||||
|
Chase &
|
||||||||||||||||||||||||
|
Co., Inc.
|
3,929,897
|
1,745,326
|
2,184,571
|
—
|
—
|
2,184,571
|
||||||||||||||||||
|
Swap Contracts —
|
||||||||||||||||||||||||
|
Goldman,
|
||||||||||||||||||||||||
|
Sachs & Co.
|
708,953
|
708,953
|
—
|
—
|
—
|
—
|
||||||||||||||||||
|
$
|
5,999,172
|
$
|
3,814,601
|
$
|
2,184,571
|
$
|
—
|
$
|
—
|
$
|
2,184,571
|
|||||||||||||
|
Liabilities:
|
||||||||||||||||||||||||
|
Description
|
||||||||||||||||||||||||
|
Written Option
|
||||||||||||||||||||||||
|
Contracts**
|
$
|
4,496,136
|
$
|
—
|
$
|
4,496,136
|
$
|
—
|
$
|
4,496,136
|
$
|
—
|
||||||||||||
|
Forward Currency
|
||||||||||||||||||||||||
|
Exchange Contracts —
|
||||||||||||||||||||||||
|
JPMorgan Chase
|
||||||||||||||||||||||||
|
& Co., Inc.
|
343,933
|
68,410
|
275,523
|
—
|
275,523
|
—
|
||||||||||||||||||
|
Forward Currency
|
||||||||||||||||||||||||
|
Exchange Contracts —
|
||||||||||||||||||||||||
|
Goldman,
|
||||||||||||||||||||||||
|
Sachs & Co.
|
426
|
—
|
426
|
—
|
426
|
—
|
||||||||||||||||||
|
Swap Contracts —
|
||||||||||||||||||||||||
|
Bank of America
|
||||||||||||||||||||||||
|
Merrill Lynch
|
||||||||||||||||||||||||
|
& Co., Inc.
|
1,624,553
|
1,291,912
|
332,641
|
—
|
332,641
|
—
|
||||||||||||||||||
|
Swap Contracts —
|
||||||||||||||||||||||||
|
JPMorgan
|
||||||||||||||||||||||||
|
Chase &
|
||||||||||||||||||||||||
|
Co., Inc.
|
1,745,326
|
1,745,326
|
—
|
—
|
—
|
—
|
||||||||||||||||||
|
Swap Contracts —
|
||||||||||||||||||||||||
|
Goldman,
|
||||||||||||||||||||||||
|
Sachs & Co.
|
931,195
|
708,953
|
222,242
|
—
|
222,242
|
—
|
||||||||||||||||||
|
$
|
9,141,569
|
$
|
3,814,601
|
$
|
5,326,968
|
$
|
—
|
$
|
5,326,968
|
$
|
—
|
|||||||||||||
115
The Merger Fund and Westchester Capital Funds
NOTES TO THE FINANCIAL STATEMENTS (continued)
December 31, 2019
Note 7 — OFFSETTING ASSETS AND LIABILITIES (continued)
WCM Alternatives: Credit Event Fund
|
Gross
|
Net
|
|||||||||||||||||||||||
|
Amounts
|
Amounts
|
|||||||||||||||||||||||
|
Offset
|
Presented
|
Gross Amounts not
|
||||||||||||||||||||||
|
Gross
|
in the
|
in the
|
offset in the Statement
|
|||||||||||||||||||||
|
Amounts of
|
Statement
|
Statement
|
of Assets and Liabilities
|
|||||||||||||||||||||
|
Recognized
|
of Assets
|
of Assets
|
Collateral
|
|||||||||||||||||||||
|
Assets/
|
and
|
and
|
Financial
|
Received/
|
Net
|
|||||||||||||||||||
|
Liabilities
|
Liabilities
|
Liabilities
|
Instruments
|
Pledged*
|
Amount
|
|||||||||||||||||||
|
Assets:
|
||||||||||||||||||||||||
|
Description
|
||||||||||||||||||||||||
|
Swap
|
||||||||||||||||||||||||
|
Contracts —
|
||||||||||||||||||||||||
|
JPMorgan
|
||||||||||||||||||||||||
|
Chase &
|
||||||||||||||||||||||||
|
Co., Inc.
|
$
|
16,328
|
$
|
16,328
|
$
|
—
|
$
|
—
|
$
|
—
|
$
|
—
|
||||||||||||
|
Swap
|
||||||||||||||||||||||||
|
Contracts —
|
||||||||||||||||||||||||
|
Goldman,
|
||||||||||||||||||||||||
|
Sachs & Co.
|
1,250
|
1,250
|
—
|
—
|
—
|
—
|
||||||||||||||||||
|
$
|
17,578
|
$
|
17,578
|
$
|
—
|
$
|
—
|
$
|
—
|
$
|
—
|
|||||||||||||
|
Liabilities:
|
||||||||||||||||||||||||
|
Description
|
||||||||||||||||||||||||
|
Swap
|
||||||||||||||||||||||||
|
Contracts —
|
||||||||||||||||||||||||
|
JPMorgan
|
||||||||||||||||||||||||
|
Chase &
|
||||||||||||||||||||||||
|
Co., Inc.
|
$
|
26,833
|
$
|
16,328
|
$
|
10,505
|
$
|
—
|
$
|
10,505
|
$
|
—
|
||||||||||||
|
Swap
|
||||||||||||||||||||||||
|
Contracts —
|
||||||||||||||||||||||||
|
Goldman,
|
||||||||||||||||||||||||
|
Sachs & Co.
|
1,782
|
1,250
|
532
|
—
|
532
|
—
|
||||||||||||||||||
|
$
|
28,615
|
$
|
17,578
|
$
|
11,037
|
$
|
—
|
$
|
11,037
|
$
|
—
|
|||||||||||||
|
*
|
In some instances, the actual collateral received/pledged may be more than amount shown.
|
|
|
**
|
JPMorgan Chase & Co., Inc. is the prime broker for all written option contracts held by the Funds as of December 31, 2019.
|
Note 8 — SECURITIES LENDING
Effective November 13, 2018, TMF became authorized to engage in securities lending in order to generate additional income. TMF is able to lend to approved borrowers. TMF’s custodian, U.S. Bank N.A. serves as the lending
agent for TMF, pursuant to a Securities Lending Agreement (the “Securities Lending Agreement”). Securities loaned are collateralized by cash equal to at least 100% of the market value plus accrued interest on the securities lent, which is invested in
the Mount Vernon Liquid Assets Portfolio, LLC. TMF retains loan fees and the interest on cash collateral investments but is required to pay the borrower a rebate for the use of
116
The Merger Fund and Westchester Capital Funds
NOTES TO THE FINANCIAL STATEMENTS (continued)
December 31, 2019
Note 8 — SECURITIES LENDING (continued)
cash collateral. In cases where the lent security is of high value to borrowers, there may be a negative rebate (i.e., a net payment from the borrower to TMF). Upon termination of a loan, TMF is required to return to the borrower an amount equal
to the cash collateral, plus any rebate owed to the borrowers. The remaining maturities of the securities lending transactions are considered overnight and continuous. Loans are subject to termination by TMF or the borrower at any time.
The net income earned on the securities lending (after payment of rebates and U.S Bank N.A.’s fee) is included on the Statements of Operations as Securities lending income (net). TMF also received payments from the
borrower during the period of the loan, equivalent to dividends and interest earned on the securities loaned, which are recorded as Dividend or Interest income, respectively, on the Statements of Operations.
Under the Securities Lending Agreement, U.S Bank N.A. marks to market the loaned securities on a daily basis. In the event the cash received from the borrower is less than 102% of the value of the loaned securities (105%
for loaned securities that are non-U.S. securities), U.S. Bank N.A. requests additional cash from the borrower so as to maintain a collateralization level of at least 102% of the value of the loaned securities plus accrued interest (105% for loans of
non-U.S. securities).
The value of securities out on loan is recorded as an asset on the Statements of Assets and Liabilities. The value of the cash collateral received is recorded as a liability on the Statements of Assets and Liabilities
and details of collateral investments are disclosed on the Schedule of Investments. At December 31, 2019, the value of outstanding securities on loan and the value of collateral investment were as follows:
|
Value of
|
Cash
|
Total value
|
|
|
Securities
|
Collateral Posted
|
of Collateral
|
|
|
on Loan
|
by Borrower
|
Investments
|
|
|
Mount Vernon Liquid Asset Portfolio, LLC*
|
$101,702,188
|
$104,867,573
|
$104,867,573
|
|
*
|
Please refer to the Schedule of Investments to view classification as this instrument is classified as a short-term fund and is not a registered money market fund.
|
TMF bears the risk of loss associated with the collateral investments and is not entitled to additional collateral from the borrower to cover any such losses. To the extent that the value of the collateral investments
declines below the amount owed to a borrower, TMF may incur losses that exceed the amount it earned on lending the security. Upon termination of a loan, TMF may use leverage (borrow money) to repay the borrower for cash collateral posted if the
Adviser does not believe that it is prudent to sell the collateral investments to fund the payment of this liability.
117
The Merger Fund and Westchester Capital Funds
NOTES TO THE FINANCIAL STATEMENTS (continued)
December 31, 2019
Note 8 — SECURITIES LENDING (continued)
TMF is not subject to a master netting agreement with respect to securities lending.
Securities lending also involves counterparty risks, including the risk that the loaned securities may not be returned in a timely manner or at all. Subject to certain conditions, U.S Bank N.A. has agreed to indemnify
TMF from losses resulting from a borrower’s failure to return a loaned security.
Note 9 — SUBSEQUENT EVENTS
Management has evaluated events and transactions occurring after December 31, 2019 through the date that the financial statements were issued and has identified the following subsequent event:
Effective January 1, 2020, the Adviser has agreed to waive its investment advisory fee and to reimburse EDF for other ordinary operating expense to the extent necessary to limit ordinary operating expenses to an amount
not to exceed 1.57% and 1.82% for Institutional Class shares and Investor Class shares, respectively. Ordinary operating expenses exclude taxes, commissions, mark-ups, litigation expenses, indemnification expenses, interest expenses, borrowing
expenses, including on securities sold short, dividend expenses on securities sold short, trading or investment expenses, Acquired Fund Fees and Expenses, and any extraordinary expenses. This expense limitation will apply through December 31, 2020,
unless it is terminated by the Board of Trustees at an earlier time. To the extent that the Adviser waives its investment advisory fee and/or reimburses the Fund for other ordinary operating expenses, it may seek reimbursement of a portion or all of
such amounts at any time within three fiscal years after the fiscal year in which such amounts were waived or reimbursed, subject to the expense limitations in place at the time such amounts were waived or reimbursed.
118
REPORT OF INDEPENDENT REGISTERED PUBLIC ACCOUNTING FIRM
To the Board of Trustees of The Merger Fund and Westchester Capital Funds and Shareholders of The Merger Fund, WCM Alternatives: Event-Driven Fund, and WCM Alternatives: Credit Event Fund
Opinions on the Financial Statements
We have audited the accompanying statements of assets and liabilities, including the schedules of investments of, The Merger Fund and WCM Alternatives: Event-Driven Fund and WCM Alternatives: Credit Event Fund
(constituting Westchester Capital Funds) (hereafter collectively referred to as the “Funds”) as of December 31, 2019, the related statements of operations for the year ended December 31, 2019, the statements of changes in net assets for each of the
two years in the period ended December 31, 2019, including the related notes, and the financial highlights for each of the periods indicated therein (collectively referred to as the “financial statements”). In our opinion, the financial statements
present fairly, in all material respects, the financial position of each of the Funds as of December 31, 2019, the results of each of their operations for the year then ended, the changes in each of their net assets for each of the two years in the
period ended December 31, 2019 and each of the financial highlights for each of the periods indicated therein, in conformity with accounting principles generally accepted in the United States of America.
Basis for Opinions
These financial statements are the responsibility of the Funds’ management. Our responsibility is to express an opinion on the Funds’ financial statements based on our audits. We are a public accounting firm registered
with the Public Company Accounting Oversight Board (United States) (PCAOB) and are required to be independent with respect to the Funds in accordance with the U.S. federal securities laws and the applicable rules and regulations of the Securities and
Exchange Commission and the PCAOB.
We conducted our audits of these financial statements in accordance with the standards of the PCAOB. Those standards require that we plan and perform the audit to obtain reasonable assurance about whether the financial
statements are free of material misstatement, whether due to error or fraud.
Our audits included performing procedures to assess the risks of material misstatement of the financial statements, whether due to error or fraud, and performing procedures that respond to those risks. Such procedures
included examining, on a test basis, evidence regarding the amounts and disclosures in the financial statements. Our audits also included evaluating the accounting principles used and significant estimates made by management, as well as evaluating
the overall presentation of the financial statements. Our procedures included confirmation of securities owned as of December 31, 2019 by correspondence with the custodian, agent banks, and brokers; when replies were not received from brokers, we
performed other auditing procedures. We believe that our audits provide a reasonable basis for our opinions.

New York, New York
February 24, 2020
We have served as the auditor of one or more investment companies in Westchester Capital Management (or its predecessor) since 1995.-
119
BOARD APPROVAL OF INVESTMENT ADVISORY AGREEMENT
(Unaudited)
Each year, the Board of Trustees of each of The Merger Fund, The Merger Fund VL, and Westchester Capital Funds (together, the “Board”), including a majority of the Trustees who are not interested persons of The Merger
Fund, The Merger Fund VL, and Westchester Capital Funds (together, the “Independent Trustees”), is required to determine whether to continue the advisory agreements for each of The Merger Fund, The Merger Fund VL, WCM Alternatives: Event-Driven Fund,
and WCM Alternatives: Credit-Event Fund, respectively. In November 2019, the Board and the Independent Trustees approved the continuation of The Merger Fund’s, The Merger Fund VL’s, WCM Alternatives: Event-Driven Fund’s, and WCM Alternatives: Credit
Event Fund’s (each, a “Fund” and, together, the “Funds”) advisory arrangements with Westchester Capital Management, LLC (the “Adviser”) (collectively, the “Agreements”) for an additional one-year period. A summary of the material factors and
conclusions that formed the basis for the approval by the Board and the Independent Trustees are discussed below.
Review Process
The Investment Company Act of 1940, as amended, requires that the Board request and evaluate, and that the Adviser furnish, such information as may reasonably be necessary to evaluate the terms of the Agreements. The
Independent Trustees began their formal review process in the summer of 2019 by compiling a request for information that sought a wide range of information the Independent Trustees believed might be necessary to evaluate the terms of the Funds’
Agreements. The Independent Trustees were assisted in compiling that information request by counsel to the Independent Trustees.
Following receipt of the Adviser’s response to their information request, the Independent Trustees evaluated all of the information available to them on a Fund-by-Fund basis, and their deliberations were made separately
in respect of each Fund. The Independent Trustees also requested additional information after their review of the Adviser’s response to their initial information request. Throughout their review process, the Independent Trustees were advised by
their counsel and they also discussed their obligations with respect to the continuation of the Agreements in private sessions with their counsel. The Independent Trustees and the Board, in determining to approve the continuation of the Agreements,
did not identify any particular factor that was all-important or controlling, and each Trustee attributed different weights to the various factors. The following summary describes some, but not all, of the factors considered by the Board and the
Independent Trustees.
Materials Reviewed
During the course of each year, the Board receives a wide variety of materials relating to the services provided by the Adviser and the Funds’ other service providers, including reports on: each Fund’s investment
results; portfolio construction; portfolio composition; portfolio trading practices; and other information relating to the nature, extent and quality of services provided
120
BOARD APPROVAL OF INVESTMENT ADVISORY AGREEMENT
(continued) (Unaudited)
by the Adviser to the Funds. In addition, in connection with its annual consideration of the Agreements, the Board requested and reviewed supplementary information regarding the terms of the Agreements, the Funds’ investment results, advisory fee
and total expense comparisons, financial and profitability information regarding the Adviser, descriptions of various functions undertaken by the Adviser, such as compliance monitoring, information about the personnel providing investment management
services to the Funds, and information regarding the terms of the Adviser’s other advisory relationships.
The Board also requested and evaluated performance and expense information for other investment companies that was compiled and presented by Broadridge Financial Solutions, Inc. (“Broadridge”). During the review process,
the Board received information regarding the methodology used in compiling Broadridge’s report and the process by which Broadridge constructed each Fund’s peer group. The Board and the Independent Trustees also considered information regarding
so-called “fall-out” benefits to the Adviser and its affiliates due to the Adviser’s relationships with the Funds. After consideration of all of the information presented to it, the Board concluded that it had received all of the information it
believed was reasonably necessary to assess the terms of each Agreement and determine whether to renew each Agreement.
Nature, Extent and Quality of Services
Nature and Extent of Services – In considering whether to continue the Agreements for an additional year, the Board and the Independent Trustees evaluated the
nature and extent of the services provided by the Adviser. The Board and the Independent Trustees considered information concerning the investment philosophy and investment process used by the Adviser in managing the Funds. In this context, the Board
and the Independent Trustees considered the in-house research capabilities of the Adviser as well as other resources available to the Adviser, including research services available to the Adviser as a result of securities transactions effected for
the Funds and other investment advisory clients of the Adviser. The Trustees also considered the scope of services provided by the Adviser under the Agreements and noted that the scope of work required of the Adviser to perform the contracted-for and
other necessary related services had expanded over time as a result of regulatory and other developments. In this respect, the Board also considered the oversight functions, including with respect to the management of Fund expenses, performed by
officers of the Funds who were supplied by the Adviser. The Board and the Independent Trustees also considered the managerial and financial resources available to the Adviser.
Quality of Services – The Board and the Independent Trustees considered the quality of the services provided by the Adviser and the quality of the resources of
the Adviser available to the Funds. The Board and the Independent Trustees considered the specialized experience, expertise and professional qualifications of the personnel of the Adviser, including that the Adviser was among a limited number of
investment advisers with a long track
121
BOARD APPROVAL OF INVESTMENT ADVISORY AGREEMENT
(continued) (Unaudited)
record managing merger arbitrage and event-driven strategies within the context of a registered mutual fund. The Board and the Independent Trustees considered the complexity of managing the Funds’ strategies relative to other types of funds. The
Board and the Independent Trustees also received and reviewed information regarding the non-portfolio management services provided to the Funds by the Adviser in support of the Funds’ operations. The Trustees also considered the Adviser’s efforts at
attracting and retaining personnel to maintain and, potentially, enhance the level of services provided to the Funds. The Trustees also weighed the significant investments the Adviser had made in promoting and otherwise supporting the distribution
of the Funds and the potential benefits of those investments that might inure to the Funds. The Board and the Independent Trustees also considered whether the Funds operated within their investment objectives and their record of compliance with
their investment restrictions.
In their evaluation of the quality of the services provided by the Adviser, the Board and the Independent Trustees considered the performance of the Funds (both net and gross of expenses). The Board and the Independent
Trustees reviewed information comparing the Funds’ historical performance to relevant market indices and to performance information for other investment companies with similar investment strategies over the one-, three-, five- and ten-year periods
(where applicable) ended August 31, 2019. The Board considered that The Merger Fund (both net and gross of expenses) ranked in the first or second quartile of its peer group for each of the one-, three-, five- and ten-year periods ended August 31,
2019. The Board also considered that the Fund (both net and gross of expenses) outperformed its benchmark index, the ICE BofA Merrill Lynch 3-Month U.S. Treasury Bill Index, over the one-, three-, five-, and ten-year periods ended August 31, 2019.
The Board considered that The Merger Fund VL (both net and gross of expenses) ranked in the first or second quartile of its peer group over the one-, three-, five- and ten-year periods ended August 31, 2019. The Board also considered that The Merger
Fund VL (both net and gross of expenses) outperformed its benchmark, the ICE BofA Merrill Lynch 3-Month U.S. Treasury Bill Index, over the one-, three-, five-, and ten-year periods ended August 31, 2019. The Board also considered that WCM
Alternatives: Event-Driven Fund (both net and gross of expenses) ranked in the first or second quartile of its peer group for the one-, three- and five-year periods ended August 31, 2019. The Board also considered that WCM Alternatives: Event-Driven
Fund (both net and gross of expenses) outperformed its benchmark, the ICE BofA Merrill Lynch 3-Month U.S. Treasury Bill Index, over the one-, three- and five-year periods ended August 31, 2019. The Board also considered that WCM Alternatives: Credit
Event Fund (both net and gross of expenses) ranked in the first quartile of its peer group for the one-year period ended August 31, 2019, and outperformed its benchmark, the ICE BofA Merrill Lynch 3-Month U.S. Treasury Bill Index, for the one-year
period ended
122
BOARD APPROVAL OF INVESTMENT ADVISORY AGREEMENT
(continued) (Unaudited)
(continued) (Unaudited)
August 31, 2019. The Trustees noted that in evaluating the relative performance and percentile information presented they considered the limited number of close peers for each Fund, especially for periods of five years or longer (where
applicable). The Trustees also considered that the WCM Alternatives: Credit Event Fund had a very limited operating history.
In all of their evaluations of relative performance, the Trustees noted that the report provided by Broadridge included a relatively small number of peer funds for The Merger Fund, The Merger Fund VL, WCM Alternatives:
Event-Driven Fund and WCM Alternatives: Credit Event Fund, especially over longer-term periods (where performance information was available over longer-term periods), due to the limited number of registered mutual funds pursuing merger-arbitrage
and/or event-driven investment strategies. In their evaluation of each Fund’s performance, including each Fund’s level of absolute performance over recent periods, the Trustees also considered, among other things, information the Adviser had
provided regarding the market conditions affecting merger-arbitrage and event-driven strategies generally, the prevailing low interest rate environment generally, and the Funds’ historical relationship to interest rates, and that the Adviser had
continued to deliver low volatility returns, with relatively low levels of correlation to the equity markets. The Board and the Independent Trustees concluded, within the context of their overall conclusions regarding each of the Agreements, that
they were satisfied with the nature, extent and quality of the services provided by the Adviser and that each Fund’s performance record supported the renewal of the Agreements.
Management Fees and Expenses
The Board and the Independent Trustees reviewed information, including comparative information provided by Broadridge, regarding the advisory fees paid to the Adviser and the total expenses borne by the Funds. They
considered the Funds’ advisory fees relative to their peer groups. In this regard, the Independent Trustees noted The Merger Fund’s net advisory fees and net operating expenses (Investor Class) were at or below the median of its peer group. The
Independent Trustees also noted The Merger Fund VL’s net advisory fees and net operating expenses were at or below the median of its peer group. The Independent Trustees noted that WCM Alternatives: Event-Driven Fund’s net advisory fees were above
the median of its peer group, though in line with a number of its peers, and that although the Fund’s net operating expenses (Investor Class) were also above median, that was driven primarily by the Fund’s non-advisory fee expenses and the varying
level of subsidies offered by the sponsors of the other funds in the peer group. In respect of WCM Alternatives: Event-Driven Fund, the Independent Trustees also considered (i) information the Adviser provided regarding the substantial reduction in
that Fund’s non-management expenses (as a percentage of the Fund’s net assets) that had been achieved since the date of the comparative expense information provided to the Trustees by Broadridge and (ii) the Adviser’s agreement to implement a revised
123
BOARD APPROVAL OF INVESTMENT ADVISORY AGREEMENT
(continued) (Unaudited)
and lower expense cap limitation that was expected to reduce further that Fund’s net operating expenses for the period of the proposed renewal of the Fund’s advisory agreement. The Independent Trustees also noted that WCM Alternatives: Credit
Event Fund’s net advisory fees and net operating expenses (Institutional Class) were above its peer group medians, respectively, though they noted that the Adviser was waiving substantially all of its advisory fee under the terms of the Fund’s
expense limitation agreement due to, among other things, the Fund’s very limited asset base.
The Board and the Independent Trustees also considered the fees that the Adviser and its affiliates charge other clients with investment strategies similar to the Funds, including where an account is subject to a
performance-based fee. The Board and the Independent Trustees considered information provided by the Adviser describing the differences in services provided to these other clients. In this regard, the Adviser noted that the services provided to these
other clients typically consist nearly exclusively or primarily of portfolio management services. The Adviser described the additional level of services provided to the Funds under the terms of the Funds’ advisory arrangements or otherwise, such as
supplying Fund management, general coordination of the Funds’ other service providers, the provision of middle and back office support functions, the provision of certain compliance and regulatory functions, and quarterly preparation and attendance
of meetings with the Board, as well as the greater financial obligations and entrepreneurial risks the Adviser undertakes in respect of sponsoring a registered mutual fund. The Board and the Independent Trustees concluded, within the context of their
overall conclusions regarding each of the Agreements, that the fees charged under the Agreements represent reasonable compensation to the Adviser in light of the services provided and the sponsorship and other risks assumed by the Adviser.
Profitability and Possible Economies of Scale
Profitability – The Board and the Independent Trustees reviewed information regarding the cost of services provided by the Adviser and the profitability (before
distribution and certain other expenses) of the Adviser’s relationship with each Fund. The Board noted that, in reporting on its profitability, the Adviser had included an estimated expense for compensation of the Funds’ portfolio managers (other
than Mr. Tan) because those portfolio managers are the principal owners of the Adviser and do not receive a salary or bonus. The Board noted that the Adviser would have incurred significant compensation expense if it instead had to hire equivalently
qualified portfolio managers to perform the services performed by the owners, which costs would significantly reduce the Adviser’s profitability. In conducting their review, the Board considered the Adviser’s profitability both with and without the
estimated compensation expense for the Funds’ portfolio managers who are also the Adviser’s principal owners.
In evaluating the Adviser’s reported profitability, the Independent Trustees considered that certain of the information provided by the Adviser was
124
BOARD APPROVAL OF INVESTMENT ADVISORY AGREEMENT
(continued) (Unaudited)
necessarily estimated and that preparing the related profitability information involved certain assumptions and allocations that were imprecise. The Board and the Independent Trustees recognized that the probative value of profitability
information may be limited because a wide range of comparative information for peer advisers often is not generally available and it can be affected by numerous factors, including the structure of the particular adviser, the types of funds it
manages, its overall business mix, the efficiency of an adviser’s operations, numerous assumptions about allocations and the adviser’s cost of capital. The Independent Trustees concluded that the Adviser’s profitability with respect to The Merger
Fund was not excessive, especially in light of the Adviser’s experience; the Adviser’s status as one of a limited number of investment advisers with an extensive history of providing competitive merger-arbitrage portfolio management services within a
registered mutual fund vehicle; and the Fund’s highly competitive net advisory fees and net operating expenses. The Independent Trustees concluded that the Adviser’s profitability with respect to WCM Alternatives: Event-Driven Fund was not excessive,
especially in light of the Adviser’s experience; the Adviser’s status as one of a limited number of investment advisers with an extensive history of providing competitive event-driven portfolio management services within a registered mutual fund
vehicle; and the Adviser’s agreement to implement a revised and lower expense cap limitation that was expected to benefit the Fund’s shareholders for a one-year period.
In addition, the Board and the Independent Trustees considered information regarding the direct and indirect benefits the Adviser receives as a result of its relationship with the Funds, including research purchased with
soft dollar credits earned from portfolio transactions effected on behalf of the Funds (soft dollar arrangements) and reputational benefits.
Economies of Scale – The Board and the Independent Trustees reviewed the extent to which the Adviser may realize economies of scale in managing the Funds. The
Board and the Independent Trustees concluded within the context of their overall conclusions regarding each of the Agreements that the Adviser’s level of profitability from its relationship with each Fund was not excessive in light of, among other
things, the Funds’ competitive advisory fees and expense ratios. The Trustees also considered that the Adviser proposed to continue the expense limitation agreements applicable to The Merger Fund VL and WCM Alternatives: Credit Event Fund, and the
advisory fee waiver in respect of The Merger Fund for another one-year period. The Trustees also considered that the Adviser agreed to implement a revised and lower expense limitation applicable to WCM Alternatives: Event-Driven Fund that would
benefit that Fund’s shareholders for a one-year period. The Independent Trustees concluded that those measures were reasonably designed to result in the sharing of economies of scale realized by the Adviser, if any, with the Funds and their
shareholders.
125
BOARD APPROVAL OF INVESTMENT ADVISORY AGREEMENT
(continued) (Unaudited)
(continued) (Unaudited)
Conclusions
Based on their review, including their consideration of each of the factors referred to above, the Board and the Independent Trustees concluded that the terms of the Agreements, including the fees payable to the Adviser,
are fair and reasonable to the Funds and their shareholders given the scope and quality of the services provided to the Funds and such other considerations as the Independent Trustees considered relevant in the exercise of their reasonable business
judgment and that the continuation of the Agreements was in the best interests of the Funds and their shareholders. Accordingly, the Board and Independent Trustees unanimously approved the continuation of the Agreements.
126
STATEMENT REGARDING THE FUNDS’ LIQUIDITY RISK
MANAGEMENT PROGRAM
The Funds have adopted a liquidity risk management program. The program’s principal objectives are to support each Fund’s compliance with limits on investments in illiquid assets and to mitigate the risk that a Fund is
unable to meet its redemption obligations timely. During the period covered by the report, the program supported the Fund’s ability to honor redemption requests timely and the Adviser’s management of each Fund’s liquidity profile, including during
any periods of market volatility and net redemptions. In this regard, the program includes a number of elements that support the management or assessment of liquidity risk, including an assessment of factors that influence a Fund’s liquidity and the
periodic classification and re-classification of a Fund’s investments into groupings that reflect an assessment of their relative liquidity under current market conditions. There can be no assurance that the program will achieve its objectives under
all circumstances in the future. Please refer to your Fund’s prospectus for more information regarding the Fund’s exposure to liquidity risk and other risks to which it may be subject.
127
INFORMATION ABOUT TRUSTEES AND OFFICERS
The business and affairs of the Fund are managed under the direction of the Fund’s Board of Trustees. Information pertaining to the Fund’s Trustees and Officers is set forth below. The Statement of Additional Information
includes additional information about the Fund’s Trustees and Officers and is available, without charge, upon request by calling 1-800-343-8959.
|
# of
|
Other
|
||||
|
Term of
|
Portfolios
|
Directorships
|
|||
|
Office
|
in Fund
|
Held by
|
|||
|
and
|
Principal
|
Complex
|
Trustee
|
||
|
Name,
|
Position(s)
|
Length
|
Occupation(s)
|
Overseen
|
During
|
|
Address and
|
Held with
|
of Time
|
During the
|
by
|
the Past
|
|
Year of Birth
|
the Fund
|
Served
|
Past Five Years
|
Trustee**
|
Five Years
|
|
Interested Trustees
|
|||||
|
Roy D. Behren*
|
Co-President
|
Indefinite,
|
Co-Portfolio Manager
|
4
|
None
|
|
Westchester Capital
|
and
|
since
|
and Co-President of
|
||
|
Management, LLC
|
Treasurer;
|
2011
|
Westchester Capital
|
||
|
100 Summit Lake Drive
|
Trustee
|
Management, LLC, the
|
|||
|
Valhalla, NY 10595
|
Fund’s Adviser, since
|
||||
|
Year of Birth: 1960
|
2011.
|
||||
|
Michael T. Shannon*
|
Co-President
|
Indefinite,
|
Co-Portfolio Manager
|
4
|
None
|
|
Westchester Capital
|
and
|
since
|
and Co-President of
|
||
|
Management, LLC
|
Trustee
|
2011
|
Westchester Capital
|
||
|
100 Summit Lake Drive
|
Management, LLC, the
|
||||
|
Valhalla, NY 10595
|
Fund’s Adviser, since
|
||||
|
Year of Birth: 1966
|
2011.
|
||||
|
Non-Interested Trustees
|
|||||
|
Barry Hamerling
|
Independent
|
Indefinite,
|
Managing Partner of
|
4
|
Former
|
|
c/o Westchester
|
Trustee
|
since
|
Premium Ice Cream of
|
Trustee of
|
|
|
Capital
|
2007
|
America since 1995.
|
AXA Premier
|
||
|
Management, LLC
|
Managing Partner of
|
VIP Trust
|
|||
|
100 Summit Lake Drive
|
B&J Freeport since
|
||||
|
Valhalla, NY 10595
|
1990.
|
||||
|
Year of Birth: 1946
|
|||||
|
Richard V. Silver
|
Independent
|
Indefinite,
|
Retired Senior
|
4
|
None
|
|
c/o Westchester
|
Trustee
|
since
|
Executive Vice
|
||
|
Capital
|
2013
|
President, Chief
|
|||
|
Management, LLC
|
Administrative Officer
|
||||
|
100 Summit Lake Drive
|
and Chief Legal Officer
|
||||
|
Valhalla, NY 10595
|
of AXA Equitable Life
|
||||
|
Year of Birth: 1955
|
Insurance Company.
|
||||
|
Senior Advisor to AXA
|
|||||
|
Equitable Life Insurance
|
|||||
|
Company from May
|
|||||
|
2012 to April 2013.
|
|||||
|
Christianna Wood
|
Independent
|
Indefinite,
|
Chief Executive Officer
|
4
|
Director of
|
|
c/o Westchester
|
Trustee
|
since
|
and President of Gore
|
H&R Block
|
|
|
Capital
|
2013
|
Creek Capital, Ltd.
|
Corporation;
|
||
|
Management, LLC
|
since August 2009.
|
Director of
|
|||
|
100 Summit Lake Drive
|
|
Grange
|
|||
|
Valhalla, NY 10595
|
|
Insurance;
|
|||
|
Year of Birth: 1959
|
|
Trustee of
|
|||
|
|
the Delaware
|
||||
|
|
Funds
|
128
INFORMATION ABOUT TRUSTEES AND OFFICERS (continued)
|
# of
|
Other
|
|||||
|
Term of
|
Portfolios
|
Directorships
|
||||
|
Office
|
in Fund
|
Held by
|
||||
|
and
|
Principal
|
Complex
|
Trustee
|
|||
|
Name,
|
Position(s)
|
Length
|
Occupation(s)
|
Overseen
|
During
|
|
|
Address and
|
Held with
|
of Time
|
During the
|
by
|
the Past
|
|
|
Year of Birth
|
the Fund
|
Served
|
Past Five Years
|
Trustee**
|
Five Years
|
|
|
Officers
|
||||||
|
Bruce Rubin
|
Vice
|
One-year
|
Chief Operating
|
N/A
|
N/A
|
|
|
Westchester Capital
|
President,
|
terms,
|
Officer of Westchester
|
|||
|
Management, LLC
|
Chief
|
since
|
Capital Management,
|
|||
|
100 Summit Lake Drive
|
Compliance
|
2010
|
LLC, the Fund’s Adviser,
|
|||
|
Valhalla, NY 10595
|
Officer and
|
|
since 2010.
|
|||
|
Year of Birth: 1959
|
Anti-Money
|
|||||
|
|
Laundering
|
|||||
|
|
Compliance
|
|||||
|
|
Officer
|
|||||
|
Abraham R. Cary
|
Secretary
|
One-year
|
Head of Trading of
|
N/A
|
N/A
|
|
|
Westchester Capital
|
|
terms,
|
Westchester Capital
|
|||
|
Management, LLC
|
|
since
|
Management, LLC, the
|
|||
|
100 Summit Lake Drive
|
|
2012
|
Fund’s Adviser, since
|
|||
|
Valhalla, NY 10595
|
|
2011.
|
||||
|
Year of Birth: 1975
|
|
*
|
Denotes a trustee who is an “interested person” (as that term is defined in Section 2(a)(19) of the Investment Company Act of 1940, as amended) of the Fund or of the Adviser. Messrs. Behren and Shannon are deemed to be interested persons
because of their affiliation with the Fund’s investment adviser, Westchester Capital Management, LLC, and because they are officers of the Fund.
|
|
**
|
The fund complex consists of TMF, The Merger Fund VL, EDF and CEF.
|
129
ADDITIONAL INFORMATION (Unaudited)
For the fiscal year ended December 31, 2019, certain dividends paid by the Funds may be reported as qualified dividend income (QDI) and may be eligible for taxation at capital gains rates. The percentage of dividends
declared from ordinary income designated as qualified dividend income for the fiscal year ended December 31, 2019 was 33.26% for TMF and 10.89% for EDF and 0.00% for CEF.
For corporate shareholders, the percent of ordinary income distributions qualifying for the corporate dividends-received deduction for the fiscal year ended December 31, 2019 was 23.00% for TMF and 7.52% for EDF and
1.04% for CEF.
The percentage of taxable ordinary income distributions that are designated as short-term capital gain distributions under Internal Revenue Code Section 871(k)(2)(c) for the fiscal year ended December 31, 2019 was 78.63%
for TMF and 32.41% for EDF and 5.78% for CEF.
AVAILABILITY OF PROXY VOTING INFORMATION
Information regarding how the Funds generally vote proxies relating to portfolio securities may be obtained without charge by calling the Funds’ Transfer Agent at 1-800-343-8959 or by visiting the SEC’s website at
www.sec.gov. Information regarding how the Funds voted proxies during the most recent 12-month period ended June 30 is available on the SEC’s website or by calling the toll-free number listed above.
AVAILABILITY OF QUARTERLY PORTFOLIO SCHEDULE
The Funds file their complete schedule of portfolio holdings with the SEC for the first and third quarters of each fiscal year on Part F of Form N-PORT. The Funds’ Parts F of Form N-PORT are available on the SEC’s
website at www.sec.gov. Once filed, the most recent Parts F of Form N-PORT will also be available without charge, upon request, by calling 1-800-343-8959.
130
The Merger Fund and Westchester Capital Funds
PRIVACY POLICY
We collect the following non-public personal information about you:
|
•
|
Information we receive from you on or in applications or other forms, correspondence, or conversations, including, but not limited to, your name, address, phone number, social security number, assets, income and date of birth; and
|
|
|
•
|
Information about your transactions with us, our affiliates, or others, including, but not limited to, your account number and balance, payments history, parties to transactions, cost basis information, and other financial information.
|
We do not disclose any non-public personal information about our current or former shareholders to non-affiliated third parties, except as permitted by law. For example, we are permitted by law to disclose all of the information we collect, as
described above, to our transfer agent to process your transactions. Furthermore, we restrict access to your non- public personal information to those persons who require such information to provide products or services to you. We maintain physical,
electronic, and procedural safeguards that comply with federal standards to guard your non-public personal information.
In the event that you hold shares of the Fund through a financial intermediary, including, but not limited to, a broker-dealer, bank, or trust company, the privacy policy of your financial intermediary would govern how your non-public personal
information would be shared with non- affiliated third parties.
THIS PRIVACY POLICY IS NOT A PART OF THE ANNUAL REPORT.
131
Investment Adviser
|
Westchester Capital Management, LLC
|
|
|
100 Summit Lake Drive
|
|
|
Valhalla, NY 10595
|
|
|
(914) 741-5600
|
|
|
www.westchestercapitalfunds.com
|
Administrator, Transfer Agent, Accountant,
Dividend Paying Agent and Shareholder Servicing Agent
|
U.S. Bancorp Fund Services, LLC
|
|
|
615 East Michigan Street
|
|
|
P.O. Box 701
|
|
|
Milwaukee, WI 53201-0701
|
|
|
(800) 343-8959
|
Custodian
|
U.S. Bank, N.A.
|
|
|
1555 North Rivercenter Drive, Suite 302
|
|
|
Milwaukee, WI 53212
|
|
|
(800) 343-8959
|
Distributor
|
Compass Distributors, LLC
|
|
|
Three Canal Plaza, 3rd Floor
|
|
|
Portland, ME 04101
|
Trustees
|
Roy Behren
|
|
|
Michael T. Shannon
|
|
|
Barry Hamerling
|
|
|
Richard V. Silver
|
|
|
Christianna Wood
|
Executive Officers
|
Roy Behren, Co-President and Treasurer
|
|
|
Michael T. Shannon, Co-President
|
|
|
Bruce Rubin, Vice President and
|
|
|
Chief Compliance Officer
|
|
|
Abraham R. Cary, Secretary
|
Counsel
|
Ropes & Gray LLP
|
|
|
1211 Avenue of the Americas
|
|
|
New York, NY 10036
|
Independent Registered
Public Accounting Firm
|
PricewaterhouseCoopers LLP
|
|
|
300 Madison Avenue
|
|
|
New York, NY 10017
|
This report is authorized for distribution only when
preceded or accompanied by a current prospectus.
preceded or accompanied by a current prospectus.
Item 2. Code of Ethics.
The registrant has adopted a code of ethics that applies to the registrant’s principal executive officer and principal financial officer. The registrant has not made any substantive amendments to its code of ethics during the period covered by
this report. The registrant has not granted any waivers from any provisions of the code of ethics during the period covered by this report. A copy of the registrant’s Code of Ethics is filed herewith. The registrant also undertakes to provide to
any person without charge, upon request, a copy of its code of ethics by mail when they call the registrant at (800) 343-8959.
Item 3. Audit Committee Financial Expert.
The registrant’s board of trustees has determined that there is at least one audit committee financial expert serving on its audit committee. Barry Hamerling and Christianna Wood are the “audit committee financial experts” and are considered to
be “independent” as each term is defined in Item 3 of Form N-CSR.
Item 4. Principal Accountant Fees and Services.
The registrant has engaged its principal accountant, PricewaterhouseCoopers LLP, to perform audit services, audit-related services, tax services and other services during the past two fiscal years. “Audit services” refer to performing an audit
of the registrant's annual financial statements or services that are normally provided by the accountant in connection with statutory and regulatory filings or engagements for those fiscal years. “Audit-related services” refer to the assurance and
related services by the principal accountant that are reasonably related to the performance of the audit. “Tax services” refer to professional services rendered by the principal accountant for tax compliance, tax advice, and tax planning. The
following table details the aggregate fees billed or expected to be billed for each of the last two fiscal years for audit fees, audit-related fees, tax fees and other fees by the principal accountant.
|
FYE 12/31/2019
|
FYE 12/31/2018
|
|
|
Audit Fees
|
$109,250
|
$107,750
|
|
Audit-Related Fees
|
$ -
|
$ -
|
|
Tax Fees
|
$12,605
|
$12,605
|
|
All Other Fees
|
$ -
|
$ -
|
The audit committee has adopted pre-approval policies and procedures that require the audit committee to pre approve all audit and non-audit services of the registrant, including services provided to any entity affiliated with the registrant.
The percentage of fees billed by PricewaterhouseCoopers LLP applicable to non-audit services pursuant to waiver of pre-approval requirement were as follows:
|
FYE 12/31/2019
|
FYE 12/31/2018
|
|
|
Audit-Related Fees
|
0%
|
0%
|
|
Tax Fees
|
0%
|
0%
|
|
All Other Fees
|
0%
|
0%
|
All of the principal accountant’s hours spent on auditing the registrant’s financial statements were attributed to work performed by full time permanent employees of the principal accountant.
The following table indicates the non-audit fees billed or expected to be billed by the registrant’s accountant for services to the registrant and to the registrant’s investment adviser (and any other controlling entity, etc.—not sub-adviser)
for the last two years. The audit committee of the board of trustees/directors has considered whether the provision of non-audit services that were rendered to the registrant's investment adviser is compatible with maintaining the principal
accountant's independence and has concluded that the provision of such non-audit services by the accountant has not compromised the accountant’s independence.
|
Non-Audit Related Fees
|
FYE 12/31/2019
|
FYE 12/31/2018
|
|
Registrant
|
-
|
-
|
|
Registrant’s Investment Adviser
|
-
|
-
|
Item 5. Audit Committee of Listed Registrants.
Not applicable.
Item 6. Investments.
The registrant’s Schedule of Investments is included as part of the report to shareholders filed under Item 1 of this Form.
Item 7. Disclosure of Proxy Voting Policies and Procedures for Closed-End Management Investment Companies.
Not applicable to open-end investment companies.
Item 8. Portfolio Managers of Closed-End Management Investment Companies.
Not applicable to open-end investment companies.
Item 9. Purchases of Equity Securities by Closed‑End Management Investment Company and Affiliated Purchasers.
Not applicable to open-end investment companies.
Item 10. Submission of Matters to a Vote of Security Holders.
There have been no material changes to the procedures by which shareholders may recommend nominees to the registrant’s board of trustees.
Item 11. Controls and Procedures.
|
(a)
|
The registrant’s Co-Presidents/Chief Executive Officers and Treasurer/Chief Financial Officer have reviewed the registrant's disclosure controls and procedures (as defined in Rule 30a-3(c) under the Investment Company Act of 1940 (the
“Act”)) as of a date within 90 days of the filing of this report, as required by Rule 30a-3(b) under the Act and Rules 13a-15(b) or 15d‑15(b) under the Securities Exchange Act of 1934. Based on their review, such officers have concluded
that the disclosure controls and procedures are effective in ensuring that information required to be disclosed in this report is appropriately recorded, processed, summarized and reported and made known to them by others within the
registrant and by the registrant’s service provider.
|
| (b) |
There were no changes in the registrant's internal control over financial reporting (as defined in Rule 30a-3(d) under the Act) that occurred during the second fiscal quarter of the period covered by this report that has materially
affected, or is reasonably likely to materially affect, the registrant's internal control over financial reporting.
|
Item 12. Disclosure of Securities Lending Activities for Closed-End Management Investment Companies.
Not applicable to open-end investment companies.
Item 13. Exhibits.
|
(a)
|
(1) Any code of ethics or amendment thereto, that is the subject of the disclosure required by Item 2, to the extent that the registrant intends to satisfy Item 2 requirements through filing an
exhibit. Filed herewith.
|
(2) A separate certification for each principal executive officer and principal financial officer pursuant to Section 302 of the Sarbanes-Oxley Act of 2002. Filed herewith.
(3) Any written solicitation to purchase securities under Rule 23c‑1 under the Act sent or given during the period covered by the report by or on behalf of the registrant to 10 or
more persons. Not applicable to open-end investment companies.
(4) Change in the registrant’s independent public accountant. Provide the information called for by Item 4 of Form 8-K under the Exchange Act (17 CFR 249.308). Unless otherwise
specified by Item 4, or related to and necessary for a complete understanding of information not previously disclosed, the information should relate to events occurring during the reporting period. Not Applicable.
|
(b)
|
Certifications pursuant to Section 906 of the Sarbanes‑Oxley Act of 2002. Furnished herewith.
|
SIGNATURES
Pursuant to the requirements of the Securities Exchange Act of 1934 and the Investment Company Act of 1940, the registrant has duly caused this report to be signed on its behalf by the undersigned, thereunto duly
authorized.
(Registrant) The Merger Fund
By (Signature and Title)* /s/ Michael T. Shannon
Michael T. Shannon, Co-President
Date 3/3/2020
By (Signature and Title)* /s/ Roy Behren
Roy Behren, Co-President and Treasurer
Date 3/3/2020
Pursuant to the requirements of the Securities Exchange Act of 1934 and the Investment Company Act of 1940, this report has been signed below by the following persons on behalf of the registrant and in the capacities
and on the dates indicated.
By (Signature and Title)* /s/ Michael T. Shannon
Michael T. Shannon, Co-President
Date 3/3/2020
By (Signature and Title)* /s/ Roy Behren
Roy Behren, Co-President and Treasurer
Date 3/3/2020
* Print the name and title of each signing officer under his or her signature.