UNITED STATES
SECURITIES AND EXCHANGE COMMISSION
Washington, D.C. 20549
SECURITIES AND EXCHANGE COMMISSION
Washington, D.C. 20549
FORM N-CSR
CERTIFIED SHAREHOLDER REPORT OF REGISTERED
MANAGEMENT INVESTMENT COMPANIES
Investment Company Act file number 811-03445
The Merger Fund
(Exact name of registrant as specified in charter)
(Exact name of registrant as specified in charter)
100 Summit Lake Drive
Valhalla, New York 10595
(Address of principal executive offices) (Zip code)
Roy Behren and Michael T. Shannon
100 Summit Lake Drive
Valhalla, New York 10595
(Name and address of agent for service)
(Name and address of agent for service)
914-741-5600
Registrant's telephone number, including area code
Date of fiscal year end: December 31, 2019
Date of reporting period: June 30, 2019
Item 1. Reports to Stockholders.
June 30, 2019
Semi-Annual Report
THE MERGER FUND
WCM ALTERNATIVES:
EVENT-DRIVEN FUND
WCM ALTERNATIVES:
CREDIT EVENT FUND
Beginning on January 1, 2021, as permitted by regulations adopted by the U.S. Securities and Exchange Commission, paper copies of the Fund’s shareholder reports will no longer be sent by mail, unless you specifically
request paper copies of the reports from the Fund (or from your financial intermediary, such as a broker-dealer or bank). Instead, the reports will be made available free of charge on a website, and if you have not previously elected electronic
delivery of your shareholder reports, you will be notified by mail each time a report is posted and provided with a website link to access the report. If you already elected to receive shareholder reports electronically, you will not be affected by
this change and you need not take any action. You may elect to receive shareholder reports and other communications from the Fund (or your financial intermediary) electronically by calling 1-800-343-8959 (or by contacting your financial
intermediary). You may elect to receive all future reports in paper free of charge. You can inform the Fund (or your financial intermediary) that you wish to continue receiving paper copies of your shareholder reports by calling 1-800-343-8959 (or by
contacting your financial intermediary). Your election to receive reports in paper will apply to all funds held with Westchester Capital Funds if you invest directly with the Fund or all funds held in your account if you invest through your financial
intermediary.
DEAL COMPOSITION
The Merger Fund (Unaudited)
|
Type of Buyer
|
Deal Terms*
|
|||||||||||||
|
Strategic
|
97.5
|
%
|
Cash
|
40.2
|
%
|
|||||||||
|
Financial
|
2.5
|
%
|
Cash & Stock
|
24.7
|
%
|
|||||||||
|
Stock with Fixed Exchange Ratio
|
20.8
|
%
|
||||||||||||
|
By Deal Type
|
Stock and Stub(1)
|
14.3
|
%
|
|||||||||||
|
Friendly
|
100.0
|
%
|
Stock with Flexible
|
|||||||||||
|
Hostile
|
—
|
%
|
Exchange Ratio (Collar)
|
—
|
%**
|
|||||||||
|
Undetermined(2)
|
—
|
%**
|
||||||||||||
|
*
|
Data expressed as a percentage of long common stock, corporate bonds and swap contract positions as of June 30, 2019.
|
|
**
|
Less than 0.05%.
|
|
(1)
|
“Stub” includes assets other than cash and stock (e.g., escrow notes).
|
|
(2)
|
The compensation is undetermined because the compensation to be received (e.g., stock, cash, escrow notes, other) will be determined at a later date, potentially at the option of the Fund’s investment adviser.
|
2
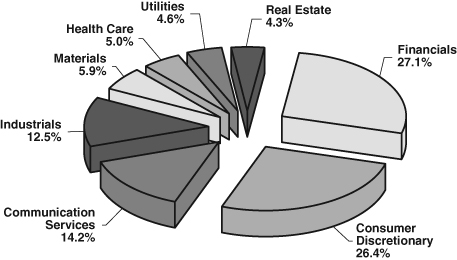
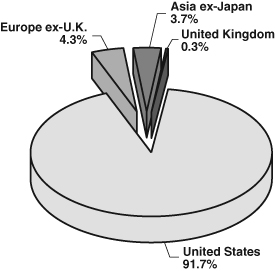
PORTFOLIO COMPOSITION*
The Merger Fund (Unaudited)
By Sector
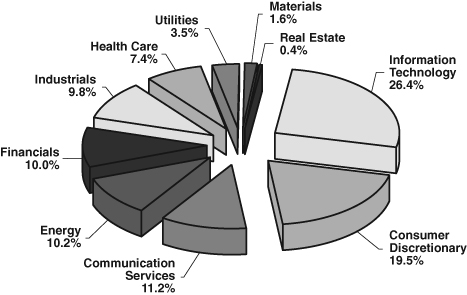
By Region
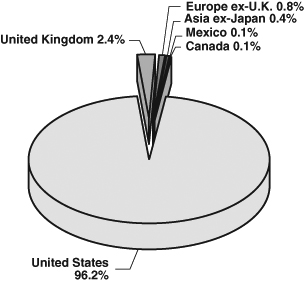
|
*
|
Data expressed as a percentage of long common stock, closed-end funds, preferred stocks, contingent value rights, rights, warrants, bank loans, corporate bonds and swap contract positions as of June 30, 2019. Data
expressed excludes special purpose acquisition companies, escrow notes, short-term investments, investments purchased with the cash proceeds from securities lending collateral, securities sold short, written and purchased options, forward
currency exchange contracts and short total return swap contracts. Please refer to the Schedule of Investments for more details on the Fund’s individual holdings.
|
3
PORTFOLIO COMPOSITION*
WCM Alternatives: Event-Driven Fund (Unaudited)
By Sector
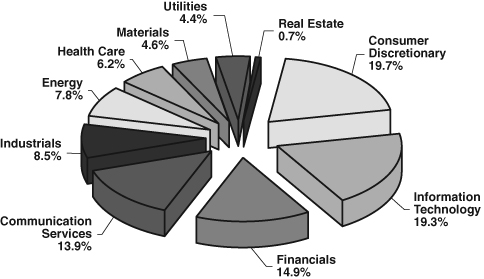
By Region
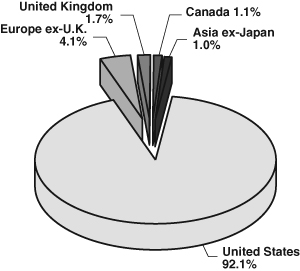
|
*
|
Data expressed as a percentage of long common stock, closed-end funds, preferred stocks, contingent value rights, rights, warrants, bank loans, convertible bonds, corporate bonds and swap contract positions as of
June 30, 2019. Data expressed excludes special purpose acquisition companies, escrow notes, short-term investments, securities sold short, written and purchased options, forward currency exchange contracts and short total return swap
contracts. Please refer to the Schedule of Investments for more details on the Fund’s individual holdings.
|
4
PORTFOLIO COMPOSITION*
WCM Alternatives: Credit Event Fund (Unaudited)
By Sector
By Region
|
*
|
Data expressed as a percentage of closed-end funds, preferred stocks, warrants, bank loans, convertible bonds, corporate bonds and swap contract positions as of June 30, 2019. Data expressed excludes special
purpose acquisition companies, short-term investments, securities sold short and reverse repurchase agreements. Please refer to the Schedule of Investments for more details on the Fund’s individual holdings.
|
The Global Industry Classification Standard (GICS®) was developed by and/or is the exclusive property of MSCI, Inc. and Standard & Poor’s
Financial Services LLC (“S&P”). GICS is a service mark of MSCI and S&P and has been licensed for use by U.S. Bancorp Fund Services, LLC, doing business as U.S. Bank Global Fund Services (“Fund Services”).
5
The Merger Fund and Westchester Capital Funds
EXPENSE EXAMPLE
June 30, 2019 (Unaudited)
As a shareholder of The Merger Fund, WCM Alternatives: Event-Driven Fund and/or WCM Alternatives: Credit Event Fund (the “Funds”), you incur two types of costs: (1) transaction costs and (2) ongoing costs, including
management fees, and other Fund specific expenses. The expense example is intended to help a shareholder understand ongoing costs (in dollars) of investing in the Fund(s) and to compare these costs with the ongoing costs of investing in other mutual
funds. The example is based on an investment of $1,000 invested at the beginning of the period and held for the most recent six-month period.
The Actual Expenses comparison provides information about actual account values and actual expenses. A shareholder may use the information in this line, together with the amount invested, to estimate the expenses paid over
the period. A shareholder may divide his/her account value by $1,000 (e.g., an $8,600 account value divided by $1,000 = 8.6), then multiply the result by the number in the first line under the heading entitled “Expenses Paid During Period” to
estimate the expenses paid on his/her account during this period. The example below includes, among other fees, management fees, fund accounting, custody and transfer agent fees. However, the example does not include portfolio trading commissions
and related expenses or extraordinary expenses.
The Hypothetical Example for Comparison Purposes provides information about hypothetical account values and hypothetical expenses based on each Fund’s actual expense ratios and assumed rates of return of 5% per year before
expenses, which are not the Fund’s actual returns. The hypothetical account values and expenses may not be used to estimate the actual ending account balance or expenses paid for the period. A shareholder may use this information to compare the
ongoing costs of investing in the Funds and other funds. To do so, a shareholder would compare this 5% hypothetical example with the 5% hypothetical examples that appear in the shareholder reports of other funds.
The expenses shown in the table are meant to highlight your ongoing costs only and do not reflect any transactional costs, such as sales charges (loads), redemptions fees, or exchange fees. Therefore, the Hypothetical
Example for Comparison Purposes is useful in comparing ongoing costs only, and will not help to determine the relevant total costs of owning different funds. In addition, if these transactional costs were included, shareholder costs would have been
higher.
6
The Merger Fund and Westchester Capital Funds
EXPENSE EXAMPLE (continued)
June 30, 2019 (Unaudited)
|
Annualized
|
Beginning
|
Ending
|
Expenses Paid
|
|
|
Net Expense
|
Account
|
Account
|
During Period
|
|
|
Ratio
|
Value
|
Value
|
1/1/19-
|
|
|
6/30/19
|
1/1/19
|
6/30/19
|
6/30/19(1)
|
|
|
The Merger Fund
|
||||
|
Investor Class
|
||||
|
Actual Expenses(2)(3)
|
2.09%
|
$1,000.00
|
$1,024.40
|
$10.49
|
|
Hypothetical Example for
|
||||
|
Comparison Purposes
|
||||
|
(5% return before
|
||||
|
expenses)(3)
|
2.09%
|
$1,000.00
|
$1,014.43
|
$10.44
|
|
Institutional Class
|
||||
|
Actual Expenses(2)(3)
|
1.80%
|
$1,000.00
|
$1,025.80
|
$ 9.04
|
|
Hypothetical Example for
|
||||
|
Comparison Purposes
|
||||
|
(5% return before
|
||||
|
expenses)(3)
|
1.80%
|
$1,000.00
|
$1,015.87
|
$ 9.00
|
|
Annualized
|
Beginning
|
Ending
|
Expenses Paid
|
|
|
Net Expense
|
Account
|
Account
|
During Period
|
|
|
Ratio
|
Value
|
Value
|
1/1/19-
|
|
|
6/30/19
|
1/1/19
|
6/30/19
|
6/30/19(1)
|
|
|
WCM Alternatives: Event-Driven Fund
|
||||
|
Investor Class
|
||||
|
Actual Expenses(2)(4)
|
2.50%
|
$1,000.00
|
$1,059.30
|
$12.76
|
|
Hypothetical Example for
|
||||
|
Comparison Purposes
|
||||
|
(5% return before
|
||||
|
expenses)(4)
|
2.50%
|
$1,000.00
|
$1,012.40
|
$12.47
|
|
Institutional Class
|
||||
|
Actual Expenses(2)(4)
|
2.25%
|
$1,000.00
|
$1,061.10
|
$11.50
|
|
Hypothetical Example for
|
||||
|
Comparison Purposes
|
||||
|
(5% return before
|
||||
|
expenses)(4)
|
2.25%
|
$1,000.00
|
$1,013.64
|
$11.23
|
7
The Merger Fund and Westchester Capital Funds
EXPENSE EXAMPLE (continued)
June 30, 2019 (Unaudited)
|
Annualized
|
Beginning
|
Ending
|
Expenses Paid
|
|
|
Net Expense
|
Account
|
Account
|
During Period
|
|
|
Ratio
|
Value
|
Value
|
1/1/19-
|
|
|
6/30/19
|
1/1/19
|
6/30/19
|
6/30/19(1)
|
|
|
WCM Alternatives: Credit Event Fund
|
||||
|
Investor Class
|
||||
|
Actual Expenses(2)(5)
|
2.19%
|
$1,000.00
|
$1,094.30
|
$11.37
|
|
Hypothetical Example for
|
||||
|
Comparison Purposes
|
||||
|
(5% return before
|
||||
|
expenses)(5)
|
2.19%
|
$1,000.00
|
$1,013.93
|
$10.94
|
|
Institutional Class
|
||||
|
Actual Expenses(2)(5)
|
1.94%
|
$1,000.00
|
$1,095.30
|
$10.08
|
|
Hypothetical Example for
|
||||
|
Comparison Purposes
|
||||
|
(5% return before
|
||||
|
expenses)(5)
|
1.94%
|
$1,000.00
|
$1,015.17
|
$ 9.69
|
|
(1)
|
Expenses are equal to the Fund’s annualized net expense ratio, multiplied by the average account value over the period, multiplied by 181/365 to reflect the one-half year period.
|
|
(2)
|
Based on the actual returns of 2.44%, 2.58%, 5.93%, 6.11%, 9.43% and 9.53% for the six-month period ended June 30, 2019 for The Merger Fund Investor and Institutional Classes, WCM Alternatives: Event-Driven Fund
Investor and Institutional Classes and WCM Alternatives: Credit Event Fund Investor and Institutional Classes, respectively.
|
|
(3)
|
Excluding dividends on securities sold short and borrowing expense on securities sold short, your actual cost of investment and your hypothetical cost of investment would have been $7.48 and $7.45, respectively in
the The Merger Fund Investor Class and $5.98 and $5.96, respectively in The Merger Fund Institutional Class.
|
|
(4)
|
Excluding dividends on securities sold short and borrowing expense on securities sold short, your actual cost of investment and your hypothetical cost of investment would have been $9.55 and $9.35, respectively in
WCM Alternatives: Event-Driven Fund Investor Class and $8.28 and $8.10, respectively in WCM Alternatives: Event-Driven Fund Institutional Class.
|
|
(5)
|
Excluding interest on reverse repurchase agreements, your actual cost of investment and your hypothetical cost of investment would have been $9.81 and $9.44, respectively in WCM Alternatives: Credit Event Fund
Investor Class and $8.52 and $8.20, respectively in WCM Alternatives: Credit Event Fund Institutional Class.
|
8
The Merger Fund
SCHEDULE OF INVESTMENTS
June 30, 2019 (Unaudited)
|
Shares
|
Value
|
|||||||
|
LONG INVESTMENTS — 99.29%
|
||||||||
|
COMMON STOCKS — 60.87%
|
||||||||
|
AEROSPACE & DEFENSE — 4.97%
|
||||||||
|
L3 Technologies, Inc. (e)
|
615,645
|
$
|
150,937,685
|
|||||
|
ALTERNATIVE CARRIERS — 2.22%
|
||||||||
|
Zayo Group Holdings, Inc. (a)
|
2,053,975
|
67,596,317
|
||||||
|
ASSET MANAGEMENT
|
||||||||
|
& CUSTODY BANKS — 3.27%
|
||||||||
|
Oaktree Capital Group LLC (e)
|
2,006,355
|
99,394,827
|
||||||
|
BIOTECHNOLOGY — 3.90%
|
||||||||
|
Celgene Corporation (a)(e)
|
1,034,239
|
95,605,053
|
||||||
|
Spark Therapeutics, Inc. (a)
|
224,248
|
22,958,510
|
||||||
|
118,563,563
|
||||||||
|
BROADCASTING — 1.09%
|
||||||||
|
Discovery Communications, Inc. Class C (a)
|
133,231
|
3,790,422
|
||||||
|
Fox Corporation Class B (e)
|
569,846
|
20,816,474
|
||||||
|
Tribune Media Company Class A (l)
|
184,143
|
8,511,090
|
||||||
|
33,117,986
|
||||||||
|
CASINOS & GAMING — 1.48%
|
||||||||
|
Caesars Entertainment Corporation (a)(l)
|
3,812,883
|
45,068,277
|
||||||
|
CHEMICALS — 0.54%
|
||||||||
|
Corteva, Inc. (e)(k)
|
155,734
|
4,605,054
|
||||||
|
DuPont de Nemours, Inc. (e)(k)
|
155,735
|
11,691,027
|
||||||
|
16,296,081
|
||||||||
|
COMMODITY CHEMICALS — 0.26%
|
||||||||
|
Dow, Inc. (e)(k)
|
157,290
|
7,755,970
|
||||||
|
CONSTRUCTION MACHINERY
|
||||||||
|
& HEAVY TRUCKS — 0.92%
|
||||||||
|
WABCO Holdings, Inc. (a)(k)
|
211,804
|
28,085,210
|
||||||
|
DATA PROCESSING &
|
||||||||
|
OUTSOURCED SERVICES — 10.95%
|
||||||||
|
First Data Corporation Class A (a)(e)
|
7,696,743
|
208,350,833
|
||||||
|
Total System Services, Inc.
|
5,530
|
709,333
|
||||||
|
Worldpay, Inc. Class A (a)(e)(f)
|
996,856
|
123,719,798
|
||||||
|
332,779,964
|
||||||||
|
EMPLOYMENT SERVICES — 0.50%
|
||||||||
|
WageWorks, Inc. (a)
|
300,543
|
15,264,579
|
||||||
|
ENVIRONMENTAL &
|
||||||||
|
FACILITIES SERVICES — 0.20%
|
||||||||
|
Advanced Disposal Services, Inc. (a)
|
192,258
|
6,134,953
|
||||||
The accompanying notes are an integral part of these financial statements.
9
The Merger Fund
SCHEDULE OF INVESTMENTS (continued)
June 30, 2019 (Unaudited)
|
Shares
|
Value
|
|||||||
|
GAS UTILITIES — 1.83%
|
||||||||
|
AmeriGas Partners LP (e)
|
1,598,181
|
$
|
55,680,626
|
|||||
|
INTEGRATED TELECOMMUNICATION
|
||||||||
|
SERVICES — 0.50%
|
||||||||
|
AT&T, Inc. (e)(k)(l)
|
453,909
|
15,210,491
|
||||||
|
INTERNET & DIRECT
|
||||||||
|
MARKETING RETAIL — 0.54%
|
||||||||
|
Liberty Expedia Holdings, Inc. Class A (a)
|
344,018
|
16,440,620
|
||||||
|
LIFE & HEALTH INSURANCE — 0.04%
|
||||||||
|
Genworth Financial, Inc. Class A (a)
|
306,379
|
1,136,666
|
||||||
|
MANAGED HEALTH CARE — 1.24%
|
||||||||
|
WellCare Health Plans, Inc. (a)(k)
|
131,645
|
37,528,040
|
||||||
|
OIL & GAS EXPLORATION
|
||||||||
|
& PRODUCTION — 5.85%
|
||||||||
|
Anadarko Petroleum Corporation
|
2,475,766
|
174,690,049
|
||||||
|
EnCana Corporation (b)
|
621,372
|
3,187,638
|
||||||
|
177,877,687
|
||||||||
|
OIL & GAS STORAGE
|
||||||||
|
& TRANSPORTATION — 2.85%
|
||||||||
|
Andeavor Logistics LP
|
100,398
|
3,647,459
|
||||||
|
Buckeye Partners LP
|
558,500
|
22,926,425
|
||||||
|
Columbia Pipeline Group, Inc. (a)(d)(g)(i)
|
2,276,354
|
60,205,170
|
||||||
|
86,779,054
|
||||||||
|
PHARMACEUTICALS — 0.51%
|
||||||||
|
Allergan plc (b)
|
91,514
|
15,322,189
|
||||||
|
REGIONAL BANKS — 5.10%
|
||||||||
|
SunTrust Banks, Inc. (e)
|
2,467,773
|
155,099,533
|
||||||
|
REITs — 0.37%
|
||||||||
|
Brookfield Property REIT, Inc. Class A (l)
|
600,931
|
11,351,587
|
||||||
|
SEMICONDUCTOR EQUIPMENT — 1.82%
|
||||||||
|
Versum Materials, Inc.
|
1,073,415
|
55,366,746
|
||||||
|
SEMICONDUCTORS — 1.38%
|
||||||||
|
Mellanox Technologies Ltd. (a)(b)(e)
|
379,504
|
41,999,708
|
||||||
|
SEMICONDUCTORS &
|
||||||||
|
SEMICONDUCTOR EQUIPMENT — 0.20%
|
||||||||
|
Cypress Semiconductor Corporation (l)
|
277,825
|
6,178,828
|
||||||
|
STEEL — 0.17%
|
||||||||
|
SunCoke Energy, Inc. (a)
|
593,358
|
5,269,015
|
||||||
The accompanying notes are an integral part of these financial statements.
10
The Merger Fund
SCHEDULE OF INVESTMENTS (continued)
June 30, 2019 (Unaudited)
|
Shares
|
Value
|
|||||||
|
SYSTEMS SOFTWARE — 7.21%
|
||||||||
|
Red Hat, Inc. (a)(e)
|
1,167,805
|
$
|
219,267,067
|
|||||
|
TECHNOLOGY HARDWARE
|
||||||||
|
& STORAGE & PERIPHERALS — 0.00%
|
||||||||
|
Cray, Inc. (a)
|
700
|
24,374
|
||||||
|
WIRELESS TELECOMMUNICATION
|
||||||||
|
SERVICES — 0.96%
|
||||||||
|
Sprint Corporation (a)(l)
|
4,429,565
|
29,102,242
|
||||||
|
TOTAL COMMON STOCKS
|
||||||||
|
(Cost $1,778,481,850)
|
1,850,629,885
|
|||||||
|
SPECIAL PURPOSE ACQUISITION
|
||||||||
|
COMPANIES — 4.86% (a)
|
||||||||
|
Act II Global Acquisition
|
||||||||
|
Corporation Class A (b)(f)
|
675,184
|
6,579,668
|
||||||
|
Alberton Acquisition Corporation (b)
|
472,825
|
4,794,446
|
||||||
|
Black Ridge Acquisition Corporation (l)
|
286,249
|
2,934,052
|
||||||
|
CF Finance Acquisition
|
||||||||
|
Corporation Class A
|
390,688
|
3,914,694
|
||||||
|
ChaSerg Technology Acquisition
|
||||||||
|
Corporation Class A
|
439,436
|
4,411,937
|
||||||
|
Churchill Capital Corporation II
|
302,611
|
3,071,501
|
||||||
|
Collier Creek Holdings Class A (b)
|
195,000
|
1,950,000
|
||||||
|
FinTech Acquisition Corporation III Class A
|
328,770
|
3,225,234
|
||||||
|
Forum Merger II Corporation Class A (f)(l)
|
334,654
|
3,363,273
|
||||||
|
GigCapital, Inc. (f)
|
300,000
|
3,100,500
|
||||||
|
Gordon Pointe Acquisition Corporation
|
424,801
|
4,388,194
|
||||||
|
Graf Industrial Corporation
|
434,606
|
4,324,330
|
||||||
|
Haymaker Acquisition Corporation II
|
893,499
|
9,122,625
|
||||||
|
Hennessy Capital Acquisition
|
||||||||
|
Corporation IV
|
175,540
|
1,737,846
|
||||||
|
Legacy Acquisition Corporation Class A
|
247,158
|
2,496,296
|
||||||
|
Leisure Acquisition Corporation (f)(l)
|
500,080
|
5,075,812
|
||||||
|
Longevity Acquisition Corporation (b)(f)
|
262,500
|
2,660,438
|
||||||
|
Megalith Financial Acquisition
|
||||||||
|
Corporation Class A (f)
|
260,768
|
2,623,326
|
||||||
|
Modern Media Acquisition Corporation (f)
|
711,578
|
7,443,106
|
||||||
|
Monocle Acquisition Corporation (f)
|
204,085
|
2,022,482
|
||||||
|
Mudrick Capital Acquisition
|
||||||||
|
Corporation Class A (f)
|
428,413
|
4,359,102
|
||||||
|
New Frontier Corporation Class A (b)(l)
|
73,972
|
744,898
|
||||||
|
Opes Acquisition Corporation (f)
|
299,301
|
3,084,297
|
||||||
|
Pivotal Acquisition Corporation
|
495,651
|
5,030,858
|
||||||
The accompanying notes are an integral part of these financial statements.
11
The Merger Fund
SCHEDULE OF INVESTMENTS (continued)
June 30, 2019 (Unaudited)
|
Shares
|
Value
|
|||||||
|
Pure Acquisition Corporation
|
687,660
|
$
|
6,972,872
|
|||||
|
Thunder Bridge Acquisition Ltd. Class A (b)
|
148,497
|
1,548,824
|
||||||
|
Tiberius Acquisition Corporation (f)
|
311,172
|
3,169,287
|
||||||
|
TKK Symphony Acquisition Corporation (b)
|
399,444
|
3,998,434
|
||||||
|
Trident Acquisitions Corporation
|
1,071,790
|
11,082,309
|
||||||
|
Trinity Merger Corporation Class A
|
1,119,455
|
11,530,386
|
||||||
|
Tuscan Holdings Corporation
|
610,840
|
6,035,099
|
||||||
|
Twelve Seas Investment Company (b)(f)
|
467,667
|
4,751,497
|
||||||
|
VectoIQ Acquisition Corporation
|
620,727
|
6,287,965
|
||||||
|
TOTAL SPECIAL PURPOSE ACQUISITION
|
||||||||
|
COMPANIES (Cost $140,735,449)
|
147,835,588
|
|||||||
|
CLOSED-END FUNDS — 11.41% (a)(e)
|
||||||||
|
Altaba, Inc.
|
5,001,052
|
346,922,977
|
||||||
|
TOTAL CLOSED-END FUNDS
|
||||||||
|
(Cost $304,872,890)
|
346,922,977
|
|||||||
|
PREFERRED STOCKS — 0.02%
|
||||||||
|
Colony Capital, Inc., 8.750%, Series E
|
18,334
|
455,783
|
||||||
|
TOTAL PREFERRED STOCKS
|
||||||||
|
(Cost $469,690)
|
455,783
|
|||||||
|
CONTINGENT VALUE
|
||||||||
|
RIGHTS — 0.00% (a)(e)(g)
|
||||||||
|
Media General, Inc.
|
891,153
|
26,735
|
||||||
|
TOTAL CONTINGENT VALUE RIGHTS
|
||||||||
|
(Cost $0)
|
26,735
|
|||||||
|
RIGHTS — 0.00% (a)
|
||||||||
|
Modern Media Acquisition Corporation
|
||||||||
|
Expiration: September 2019
|
477,700
|
138,533
|
||||||
|
TOTAL RIGHTS (Cost $206,542)
|
138,533
|
|||||||
|
WARRANTS — 0.13% (a)
|
||||||||
|
Act II Global Acquisition Corporation Class A
|
||||||||
|
Expiration: April 2024,
|
||||||||
|
Exercise Price: $11.50 (b)
|
337,592
|
229,563
|
||||||
|
CF Finance Acquisition Corporation Class A
|
||||||||
|
Expiration: April 2025,
|
||||||||
|
Exercise Price: $11.50
|
293,016
|
175,810
|
||||||
|
ChaSerg Technology Acquisition
|
||||||||
|
Corporation Class A
|
||||||||
|
Expiration: September 2023,
|
||||||||
|
Exercise Price: $11.50
|
219,718
|
164,788
|
||||||
The accompanying notes are an integral part of these financial statements.
12
The Merger Fund
SCHEDULE OF INVESTMENTS (continued)
June 30, 2019 (Unaudited)
|
Shares
|
Value
|
|||||||
|
Collier Creek Holdings Class A
|
||||||||
|
Expiration: November 2023,
|
||||||||
|
Exercise Price: $11.50 (b)
|
65,000
|
$
|
84,500
|
|||||
|
FinTech Acquisition Corporation III Class A
|
||||||||
|
Expiration: December 2023,
|
||||||||
|
Exercise Price: $11.50
|
164,385
|
228,660
|
||||||
|
Graf Industrial Corporation
|
||||||||
|
Expiration: December 2025,
|
||||||||
|
Exercise Price: $11.50 (f)
|
434,606
|
162,977
|
||||||
|
Hennessy Capital Acquisition Corporation IV
|
||||||||
|
Expiration: September 2025,
|
||||||||
|
Exercise Price: $11.50
|
131,655
|
78,993
|
||||||
|
Modern Media Acquisition Corporation
|
||||||||
|
Expiration: June 2022,
|
||||||||
|
Exercise Price: $11.50
|
238,850
|
52,547
|
||||||
|
Monocle Acquisition Corporation
|
||||||||
|
Expiration: June 2024,
|
||||||||
|
Exercise Price: $11.50 (f)
|
204,085
|
69,389
|
||||||
|
Mudrick Capital Acquisition
|
||||||||
|
Corporation Class A
|
||||||||
|
Expiration: March 2025,
|
||||||||
|
Exercise Price: $11.50
|
428,413
|
209,922
|
||||||
|
Pivotal Acquisition Corporation
|
||||||||
|
Expiration: December 2025,
|
||||||||
|
Exercise Price: $11.50
|
495,651
|
669,129
|
||||||
|
Pure Acquisition Corporation
|
||||||||
|
Expiration: April 2023,
|
||||||||
|
Exercise Price: $11.50
|
342,226
|
369,604
|
||||||
|
Thunder Bridge Acquisition Ltd. Class A
|
||||||||
|
Expiration: July 2022,
|
||||||||
|
Exercise Price: $11.50 (b)
|
338,801
|
684,378
|
||||||
|
Tiberius Acquisition Corporation
|
||||||||
|
Expiration: April 2023,
|
||||||||
|
Exercise Price: $11.50 (f)
|
311,172
|
141,583
|
||||||
|
Tuscan Holdings Corporation
|
||||||||
|
Expiration: April 2026,
|
||||||||
|
Exercise Price: $11.50
|
610,840
|
476,455
|
||||||
|
TOTAL WARRANTS (Cost $3,075,708)
|
3,798,298
|
|||||||
|
Principal
|
||||||||
|
Amount
|
||||||||
|
BANK LOANS — 3.03% (f)(j)
|
||||||||
|
Avaya Holdings Corporation
|
||||||||
|
6.651% (3 Month U.S.
|
||||||||
|
LIBOR + 4.250%), 12/15/2024
|
$
|
7,680,848
|
7,357,638
|
|||||
The accompanying notes are an integral part of these financial statements.
13
The Merger Fund
SCHEDULE OF INVESTMENTS (continued)
June 30, 2019 (Unaudited)
|
Principal
|
||||||||
|
Amount
|
Value
|
|||||||
|
Cengage Learning Holdings II, Inc.
|
||||||||
|
6.652% (3 Month U.S.
|
||||||||
|
LIBOR + 4.250%), 6/7/2023
|
$
|
15,380,360
|
$
|
14,745,920
|
||||
|
McGraw-Hill Global
|
||||||||
|
Education Holdings LLC
|
||||||||
|
6.402% (3 Month U.S.
|
||||||||
|
LIBOR + 4.000%), 5/4/2022
|
15,382,018
|
14,721,899
|
||||||
|
Tribune Media Company
|
||||||||
|
5.402% (3 Month U.S.
|
||||||||
|
LIBOR + 3.000%), 1/27/2024
|
28,757,000
|
28,792,946
|
||||||
|
Zayo Group LLC
|
||||||||
|
4.402% (3 Month U.S.
|
||||||||
|
LIBOR + 2.000%), 1/19/2021
|
26,325,763
|
26,350,509
|
||||||
|
TOTAL BANK LOANS (Cost $92,769,652)
|
91,968,912
|
|||||||
|
CORPORATE BONDS — 7.83% (f)
|
||||||||
|
Arconic, Inc.
|
||||||||
|
5.400%, 4/15/2021
|
7,553,000
|
7,832,164
|
||||||
|
Ardagh Packaging Finance plc /
|
||||||||
|
Ardagh Holdings USA, Inc.
|
||||||||
|
7.250%, 5/15/2024 (b)(h)
|
8,779,000
|
9,283,792
|
||||||
|
CEC Entertainment, Inc.
|
||||||||
|
8.000%, 2/15/2022
|
11,217,000
|
11,428,581
|
||||||
|
EIG Investors Corporation
|
||||||||
|
10.875%, 2/1/2024
|
16,610,000
|
17,689,650
|
||||||
|
First Data Corporation
|
||||||||
|
5.750%, 1/15/2024 (h)
|
17,852,000
|
18,387,560
|
||||||
|
GenOn Energy, Inc. / NRG Americas, Inc.
|
||||||||
|
9.044% (6 Month U.S.
|
||||||||
|
LIBOR + 6.500%), 12/1/2023 (j)
|
9,862,000
|
9,825,018
|
||||||
|
Inmarsat Finance plc
|
||||||||
|
6.500%, 10/1/2024 (b)(h)
|
4,585,000
|
4,808,519
|
||||||
|
Kinetic Concepts, Inc. / KCI USA, Inc.
|
||||||||
|
12.500%, 11/1/2021 (h)
|
15,253,000
|
16,835,499
|
||||||
|
Multi-Color Corporation
|
||||||||
|
4.875%, 11/1/2025 (h)
|
7,811,000
|
8,230,841
|
||||||
|
Nationstar Mortgage LLC /
|
||||||||
|
Nationstar Capital Corporation
|
||||||||
|
6.500%, 7/1/2021
|
2,935,000
|
2,946,799
|
||||||
|
6.500%, 6/1/2022
|
1,939,000
|
1,923,245
|
||||||
|
Nielsen Finance LLC /
|
||||||||
|
Nielsen Finance Company
|
||||||||
|
5.000%, 4/15/2022 (h)
|
12,171,000
|
12,216,641
|
||||||
The accompanying notes are an integral part of these financial statements.
14
The Merger Fund
SCHEDULE OF INVESTMENTS (continued)
June 30, 2019 (Unaudited)
|
Principal
|
||||||||||||
|
Amount
|
Value
|
|||||||||||
|
Rent-A-Center, Inc.
|
||||||||||||
|
6.625%, 11/15/2020
|
$
|
7,517,000
|
$
|
7,563,981
|
||||||||
|
4.750%, 5/1/2021 (l)
|
12,832,000
|
12,880,120
|
||||||||||
|
T-Mobile USA, Inc.
|
||||||||||||
|
6.500%, 1/15/2024
|
9,842,000
|
10,211,075
|
||||||||||
|
Unitymedia GmbH
|
||||||||||||
|
6.125%, 1/15/2025 (b)(h)
|
14,621,000
|
15,282,600
|
||||||||||
|
Unitymedia Hessen GmbH & Company
|
||||||||||||
|
KG / Unitymedia NRW GmbH
|
||||||||||||
|
5.000%, 1/15/2025 (b)(h)
|
7,192,000
|
7,443,720
|
||||||||||
|
Univar USA, Inc.
|
||||||||||||
|
6.750%, 7/15/2023 (h)
|
24,763,000
|
25,351,121
|
||||||||||
|
Vistra Energy Corporation
|
||||||||||||
|
5.875%, 6/1/2023
|
15,354,000
|
15,757,043
|
||||||||||
|
Zayo Group LLC / Zayo Capital, Inc.
|
||||||||||||
|
5.750%, 1/15/2027 (h)
|
21,763,000
|
22,198,260
|
||||||||||
|
TOTAL CORPORATE BONDS
|
||||||||||||
|
(Cost $236,756,036)
|
238,096,229
|
|||||||||||
|
Contracts
|
||||||||||||
|
(100 shares
|
Notional
|
|||||||||||
|
per contract)
|
Amount
|
|||||||||||
|
PURCHASED PUT OPTIONS — 0.05% (a)
|
||||||||||||
|
Corteva, Inc.
|
||||||||||||
|
Expiration: September 2019,
|
||||||||||||
|
Exercise Price: $26.00
|
1,557
|
$
|
4,604,049
|
85,635
|
||||||||
|
Dow, Inc.
|
||||||||||||
|
Expiration: September 2019,
|
||||||||||||
|
Exercise Price: $45.00
|
1,541
|
7,598,671
|
171,051
|
|||||||||
|
DuPont de Nemours, Inc.
|
||||||||||||
|
Expiration: September 2019,
|
||||||||||||
|
Exercise Price: $70.00
|
1,557
|
11,688,399
|
315,293
|
|||||||||
|
SPDR S&P 500 ETF Trust
|
||||||||||||
|
Expiration: July 2019,
|
||||||||||||
|
Exercise Price: $285.00
|
852
|
24,963,600
|
107,778
|
|||||||||
|
Expiration: July 2019,
|
||||||||||||
|
Exercise Price: $292.00
|
1,462
|
42,836,600
|
394,740
|
|||||||||
|
SPDR S&P Oil & Gas Exploration
|
||||||||||||
|
& Production ETF Trust
|
||||||||||||
|
Expiration: July 2019,
|
||||||||||||
|
Exercise Price: $25.00
|
1,290
|
3,515,250
|
28,380
|
|||||||||
The accompanying notes are an integral part of these financial statements.
15
The Merger Fund
SCHEDULE OF INVESTMENTS (continued)
June 30, 2019 (Unaudited)
|
Contracts
|
||||||||||||
|
(100 shares
|
Notional
|
|||||||||||
|
per contract)
|
Amount
|
Value
|
||||||||||
|
Technology Select Sector SPDR Fund
|
||||||||||||
|
Expiration: July 2019,
|
||||||||||||
|
Exercise Price: $74.00
|
1,964
|
$
|
15,327,056
|
$
|
86,416
|
|||||||
|
VanEck Vectors Semiconductor ETF
|
||||||||||||
|
Expiration: August 2019,
|
||||||||||||
|
Exercise Price: $106.00
|
1,010
|
11,128,180
|
284,315
|
|||||||||
|
TOTAL PURCHASED PUT OPTIONS
|
||||||||||||
|
(Cost $2,431,692)
|
1,473,608
|
|||||||||||
|
Principal
|
||||||||||||
|
Amount
|
||||||||||||
|
ESCROW NOTES — 0.01% (a)(d)(g)
|
||||||||||||
|
AMR Corporation
|
$
|
1,243,406
|
273,549
|
|||||||||
|
T-Mobile USA, Inc.
|
7,594,000
|
—
|
||||||||||
|
TOTAL ESCROW NOTES (Cost $93,712)
|
273,549
|
|||||||||||
|
Shares
|
||||||||||||
|
SHORT-TERM INVESTMENTS — 11.08%
|
||||||||||||
|
MONEY MARKET FUNDS — 10.37% (c)
|
||||||||||||
|
The Government & Agency Portfolio,
|
||||||||||||
|
Institutional Share Class, 2.26%
|
149,080,000
|
149,080,000
|
||||||||||
|
JPMorgan U.S. Government
|
||||||||||||
|
Money Market Fund,
|
||||||||||||
|
Institutional Share Class, 2.26%
|
149,080,000
|
149,080,000
|
||||||||||
|
Morgan Stanley Institutional Liquidity
|
||||||||||||
|
Fund — Government Portfolio,
|
||||||||||||
|
Institutional Share Class, 2.24%
|
16,972,526
|
16,972,526
|
||||||||||
|
315,132,526
|
||||||||||||
|
Principal
|
||||||||||||
|
Amount
|
||||||||||||
|
U.S. TREASURY BILLS — 0.71% (e)(f)(m)
|
||||||||||||
|
United States Treasury Bills
|
||||||||||||
|
2.41%, 9/12/2019
|
$
|
2,370,000
|
2,360,099
|
|||||||||
|
2.37%, 9/19/2019
|
2,355,000
|
2,344,175
|
||||||||||
|
2.33%, 9/26/2019
|
2,265,000
|
2,253,683
|
||||||||||
|
2.36%, 10/3/2019
|
900,000
|
895,103
|
||||||||||
|
2.35%, 10/10/2019
|
3,260,000
|
3,240,965
|
||||||||||
|
2.35%, 10/17/2019
|
1,755,000
|
1,744,352
|
||||||||||
|
2.35%, 10/24/2019
|
1,860,000
|
1,848,249
|
||||||||||
The accompanying notes are an integral part of these financial statements.
16
The Merger Fund
SCHEDULE OF INVESTMENTS (continued)
June 30, 2019 (Unaudited)
|
Principal
|
||||||||
|
Amount
|
Value
|
|||||||
|
2.36%, 10/31/2019
|
$
|
1,095,000
|
$
|
1,087,550
|
||||
|
2.33%, 11/7/2019
|
305,000
|
302,762
|
||||||
|
2.32%, 11/14/2019
|
4,575,000
|
4,539,694
|
||||||
|
2.21%, 11/29/2019
|
310,000
|
307,336
|
||||||
|
2.10%, 12/5/2019
|
340,000
|
337,008
|
||||||
|
1.99%, 12/19/2019
|
400,000
|
396,123
|
||||||
|
21,657,099
|
||||||||
|
TOTAL SHORT-TERM INVESTMENTS
|
||||||||
|
(Cost $336,773,024)
|
336,789,625
|
|||||||
|
TOTAL LONG INVESTMENTS
|
||||||||
|
(Cost $2,896,666,245) — 99.29%
|
3,018,409,722
|
|||||||
|
Shares
|
||||||||
|
INVESTMENT OF CASH COLLATERAL
|
||||||||
|
FROM SECURITIES LOANED — 2.01%
|
||||||||
|
SHORT-TERM FUND — 2.01% (c)
|
||||||||
|
Mount Vernon Liquid Asset
|
||||||||
|
Portfolio LLC, 2.52%
|
61,258,584
|
61,258,584
|
||||||
|
TOTAL SHORT-TERM FUND —
|
||||||||
|
(Cost $61,258,584)
|
61,258,584
|
|||||||
|
TOTAL INVESTMENT OF CASH COLLATERAL
|
||||||||
|
FROM SECURITIES LOANED —
|
||||||||
|
(Cost $61,258,584)
|
61,258,584
|
|||||||
|
SHORT INVESTMENTS — (37.31)%
|
||||||||
|
COMMON STOCKS — (37.28)%
|
||||||||
|
AEROSPACE & DEFENSE — (4.98)%
|
||||||||
|
Harris Corporation
|
(800,329
|
)
|
(151,366,224
|
)
|
||||
|
AIRLINES — (0.01)%
|
||||||||
|
American Airlines Group, Inc.
|
(11,395
|
)
|
(371,591
|
)
|
||||
|
ASSET MANAGEMENT
|
||||||||
|
& CUSTODY BANKS — (1.70)%
|
||||||||
|
Brookfield Asset Management,
|
||||||||
|
Inc. Class A (b)
|
(1,079,982
|
)
|
(51,601,540
|
)
|
||||
|
BROADCASTING — (0.41)%
|
||||||||
|
Discovery Communications, Inc. Class A
|
(133,231
|
)
|
(4,090,192
|
)
|
||||
|
Fox Corporation Class A
|
(226,116
|
)
|
(8,284,890
|
)
|
||||
|
(12,375,082
|
)
|
|||||||
The accompanying notes are an integral part of these financial statements.
17
The Merger Fund
SCHEDULE OF INVESTMENTS (continued)
June 30, 2019 (Unaudited)
|
Shares
|
Value
|
|||||||
|
CASINOS & GAMING — (0.52)%
|
||||||||
|
Eldorado Resorts, Inc.
|
(340,882
|
)
|
$
|
(15,704,434
|
)
|
|||
|
DATA PROCESSING &
|
||||||||
|
OUTSOURCED SERVICES — (10.76)%
|
||||||||
|
Fidelity National Information Services, Inc.
|
(925,774
|
)
|
(113,573,955
|
)
|
||||
|
Fiserv, Inc.
|
(2,335,663
|
)
|
(212,919,039
|
)
|
||||
|
Global Payments, Inc.
|
(4,479
|
)
|
(717,222
|
)
|
||||
|
(327,210,216
|
)
|
|||||||
|
GAS UTILITIES — (1.40)%
|
||||||||
|
UGI Corporation
|
(799,210
|
)
|
(42,685,806
|
)
|
||||
|
INTEGRATED OIL & GAS — (1.00)%
|
||||||||
|
Occidental Petroleum Corporation
|
(602,851
|
)
|
(30,311,348
|
)
|
||||
|
INTERNET & DIRECT
|
||||||||
|
MARKETING RETAIL — (7.45)%
|
||||||||
|
Alibaba Group Holding Ltd. — ADR
|
(1,239,524
|
)
|
(210,037,342
|
)
|
||||
|
Expedia Group, Inc.
|
(123,846
|
)
|
(16,475,233
|
)
|
||||
|
(226,512,575
|
)
|
|||||||
|
MANAGED HEALTH CARE — (0.46)%
|
||||||||
|
Centene Corporation
|
(266,498
|
)
|
(13,975,155
|
)
|
||||
|
OIL & GAS STORAGE
|
||||||||
|
& TRANSPORTATION — (0.12)%
|
||||||||
|
MPLX LP
|
(113,798
|
)
|
(3,663,158
|
)
|
||||
|
PHARMACEUTICALS — (1.73)%
|
||||||||
|
AbbVie, Inc.
|
(79,251
|
)
|
(5,763,133
|
)
|
||||
|
Bristol-Myers Squibb Company
|
(1,034,239
|
)
|
(46,902,738
|
)
|
||||
|
(52,665,871
|
)
|
|||||||
|
REGIONAL BANKS — (5.16)%
|
||||||||
|
BB&T Corporation
|
(3,193,113
|
)
|
(156,877,642
|
)
|
||||
|
REITs — (0.30)%
|
||||||||
|
Brookfield Property Partners LP (b)
|
(488,190
|
)
|
(9,241,437
|
)
|
||||
|
STEEL — (0.17)%
|
||||||||
|
SunCoke Energy, Inc.
|
(594,665
|
)
|
(5,280,625
|
)
|
||||
|
WIRELESS TELECOMMUNICATION
|
||||||||
|
SERVICES — (1.11)%
|
||||||||
|
T-Mobile USA, Inc.
|
(454,295
|
)
|
(33,681,431
|
)
|
||||
|
TOTAL COMMON STOCKS
|
||||||||
|
(Proceeds $1,014,032,812)
|
(1,133,524,135
|
)
|
||||||
The accompanying notes are an integral part of these financial statements.
18
The Merger Fund
SCHEDULE OF INVESTMENTS (continued)
June 30, 2019 (Unaudited)
|
Shares
|
Value
|
|||||||
|
PRIVATE PLACEMENTS — (0.03)% (g)
|
||||||||
|
Celgene Corporation
|
(344,402
|
)
|
$
|
(757,684
|
)
|
|||
|
TOTAL PRIVATE PLACEMENTS
|
||||||||
|
(Proceeds $748,500)
|
(757,684
|
)
|
||||||
|
TOTAL SHORT INVESTMENTS
|
||||||||
|
(Proceeds $1,014,781,312) — (37.31)%
|
(1,134,281,819
|
)
|
||||||
|
TOTAL NET INVESTMENTS
|
||||||||
|
(Cost $1,943,143,517) — 63.99%
|
1,945,386,487
|
|||||||
|
OTHER ASSETS IN
|
||||||||
|
EXCESS OF LIABILITIES — 36.01%
|
1,094,745,848
|
|||||||
|
TOTAL NET ASSETS — 100.00%
|
$
|
3,040,132,335
|
||||||
ADR – American Depository Receipt
ETF – Exchange-Traded Fund
LIBOR – London Interbank Offered Rate
plc – Public Limited Company
REITs – Real Estate Investment Trusts
|
(a)
|
Non-income producing security.
|
|
(b)
|
Foreign security.
|
|
(c)
|
The rate shown is the annualized seven-day yield as of June 30, 2019.
|
|
(d)
|
Security fair valued by the Valuation Group in good faith in accordance with the policies adopted by the Board of Trustees.
|
|
(e)
|
All or a portion of the shares have been committed as collateral for open securities sold short, written option contracts, swap contracts, and forward currency exchange contracts.
|
|
(f)
|
Level 2 Security. Please see Note 2 in the Notes to the Financial Statements for more information.
|
|
(g)
|
Level 3 Security. Please see Note 2 in the Notes to the Financial Statements for more information.
|
|
(h)
|
Security exempt from registration under Rule 144A of the Securities Act of 1933. These securities may be resold in transactions exempt from registration normally to qualified institutional buyers. As of June 30,
2019, these securities represent 4.61% of total net assets.
|
|
(i)
|
Restricted security. The Fund may own investment securities that have other legal or contractual limitations, and thus are restricted as to resale. These securities are valued by the Valuation Group under the
supervision of the Board of Trustees. As of June 30, 2019, this common stock had a cost of $57,736,820 and its market value represented 1.98% of total net assets. The Fund’s adviser perfected its appraisal rights over this security as of
6/20/2016. Please see Note 2 in the Notes to the Financial Statements for more information.
|
|
(j)
|
The coupon rate shown on variable rate securities represents the rate as of June 30, 2019.
|
|
(k)
|
This security is held in connection with a written option contract.
|
|
(l)
|
All or a portion of the shares was out on loan at June 30, 2019. Total loaned securities had a value of $60,235,769 at June 30, 2019.
|
|
(m)
|
The rate shown represents yield to maturity.
|
The Global Industry Classification Standard (GICS®) was developed by and/or is the exclusive property of MSCI, Inc. and Standard & Poor’s
Financial Services LLC (“S&P”). GICS is a service mark of MSCI and S&P and has been licensed for use by Fund Services.
The accompanying notes are an integral part of these financial statements.
19
WCM Alternatives: Event-Driven Fund
SCHEDULE OF INVESTMENTS
June 30, 2019 (Unaudited)
|
Shares
|
Value
|
|||||||
|
LONG INVESTMENTS — 101.70%
|
||||||||
|
COMMON STOCKS — 49.30%
|
||||||||
|
AEROSPACE & DEFENSE — 4.16%
|
||||||||
|
L3 Technologies, Inc. (e)
|
33,011
|
$
|
8,093,307
|
|||||
|
ASSET MANAGEMENT
|
||||||||
|
& CUSTODY BANKS — 4.28%
|
||||||||
|
The Blackstone Group LP (l)
|
40,033
|
1,778,266
|
||||||
|
Oaktree Capital Group LLC (e)
|
132,236
|
6,550,971
|
||||||
|
8,329,237
|
||||||||
|
BIOTECHNOLOGY — 3.22%
|
||||||||
|
Celgene Corporation (a)(e)
|
67,807
|
6,268,079
|
||||||
|
BROADCASTING — 0.72%
|
||||||||
|
CBS Corporation Class B (l)
|
15,300
|
763,470
|
||||||
|
Tribune Media Company Class A (e)
|
13,686
|
632,567
|
||||||
|
1,396,037
|
||||||||
|
BUILDING PRODUCTS — 1.95%
|
||||||||
|
Masco Corporation (e)(l)
|
96,700
|
3,794,508
|
||||||
|
CASINOS & GAMING — 6.03%
|
||||||||
|
Caesars Entertainment Corporation (a)(e)(l)
|
760,222
|
8,985,824
|
||||||
|
MGM Resorts International (l)
|
96,700
|
2,762,719
|
||||||
|
11,748,543
|
||||||||
|
CHEMICALS — 1.43%
|
||||||||
|
Corteva, Inc. (e)(l)
|
26,551
|
785,113
|
||||||
|
DuPont de Nemours, Inc. (e)(l)
|
26,553
|
1,993,334
|
||||||
|
2,778,447
|
||||||||
|
COMMODITY CHEMICALS — 0.67%
|
||||||||
|
Dow, Inc. (e)(l)
|
26,551
|
1,309,230
|
||||||
|
DATA PROCESSING &
|
||||||||
|
OUTSOURCED SERVICES — 5.03%
|
||||||||
|
First Data Corporation Class A (a)
|
71,064
|
1,923,703
|
||||||
|
Total System Services, Inc.
|
345
|
44,253
|
||||||
|
Worldpay, Inc. Class A (a)(e)(f)
|
63,094
|
7,830,596
|
||||||
|
9,798,552
|
||||||||
|
ENVIRONMENTAL &
|
||||||||
|
FACILITIES SERVICES — 0.46%
|
||||||||
|
Advanced Disposal Services, Inc. (a)
|
28,084
|
896,160
|
||||||
|
GAS UTILITIES — 1.92%
|
||||||||
|
AmeriGas Partners LP (e)
|
107,109
|
3,731,678
|
||||||
The accompanying notes are an integral part of these financial statements.
20
WCM Alternatives: Event-Driven Fund
SCHEDULE OF INVESTMENTS (continued)
June 30, 2019 (Unaudited)
|
Shares
|
Value
|
|||||||
|
INTEGRATED TELECOMMUNICATION
|
||||||||
|
SERVICES — 0.11%
|
||||||||
|
AT&T, Inc.
|
6,484
|
$
|
217,279
|
|||||
|
INTERNET & DIRECT
|
||||||||
|
MARKETING RETAIL — 1.89%
|
||||||||
|
Liberty Expedia Holdings, Inc. Class A (a)(e)
|
76,935
|
3,676,723
|
||||||
|
Reebonz Holdings Ltd. (a)(b)
|
597
|
2,245
|
||||||
|
3,678,968
|
||||||||
|
LIFE & HEALTH INSURANCE — 0.03%
|
||||||||
|
Genworth Financial, Inc. Class A (a)
|
15,670
|
58,136
|
||||||
|
MANAGED HEALTH CARE — 1.09%
|
||||||||
|
WellCare Health Plans, Inc. (a)(e)(l)
|
7,461
|
2,126,907
|
||||||
|
MOVIES & ENTERTAINMENT — 1.11%
|
||||||||
|
The Madison Square Garden
|
||||||||
|
Company Class A (a)(l)
|
7,700
|
2,155,538
|
||||||
|
OIL & GAS EXPLORATION
|
||||||||
|
& PRODUCTION — 7.12%
|
||||||||
|
Anadarko Petroleum Corporation
|
174,055
|
12,281,321
|
||||||
|
EnCana Corporation (b)(e)
|
306,630
|
1,573,012
|
||||||
|
13,854,333
|
||||||||
|
OIL & GAS STORAGE
|
||||||||
|
& TRANSPORTATION — 1.51%
|
||||||||
|
Buckeye Partners LP (e)
|
46,514
|
1,909,400
|
||||||
|
Columbia Pipeline Group, Inc. (a)(d)(g)(i)
|
38,718
|
1,024,016
|
||||||
|
2,933,416
|
||||||||
|
PHARMACEUTICALS — 0.50%
|
||||||||
|
Allergan plc (b)
|
5,836
|
977,122
|
||||||
|
REGIONAL BANKS — 3.52%
|
||||||||
|
SunTrust Banks, Inc. (e)
|
109,145
|
6,859,763
|
||||||
|
SEMICONDUCTOR EQUIPMENT — 0.16%
|
||||||||
|
Versum Materials, Inc.
|
6,197
|
319,641
|
||||||
|
SEMICONDUCTORS &
|
||||||||
|
SEMICONDUCTOR EQUIPMENT — 0.43%
|
||||||||
|
Cypress Semiconductor Corporation
|
38,079
|
846,877
|
||||||
|
SPECIALTY RETAIL — 0.01%
|
||||||||
|
Kaixin Auto Holdings (a)(b)
|
9,742
|
21,433
|
||||||
|
STEEL — 0.64%
|
||||||||
|
SunCoke Energy, Inc. (a)(e)
|
139,625
|
1,239,866
|
||||||
The accompanying notes are an integral part of these financial statements.
21
WCM Alternatives: Event-Driven Fund
SCHEDULE OF INVESTMENTS (continued)
June 30, 2019 (Unaudited)
|
Shares
|
Value
|
|||||||
|
TECHNOLOGY HARDWARE &
|
||||||||
|
STORAGE & PERIPHERALS — 0.00%
|
||||||||
|
Cray, Inc. (a)
|
100
|
$
|
3,482
|
|||||
|
WIRELESS TELECOMMUNICATION
|
||||||||
|
SERVICES — 1.31%
|
||||||||
|
Sprint Corporation (a)(e)
|
389,040
|
2,555,993
|
||||||
|
TOTAL COMMON STOCKS
|
||||||||
|
(Cost $92,356,632)
|
95,992,532
|
|||||||
|
SPECIAL PURPOSE ACQUISITION
|
||||||||
|
COMPANIES — 11.77% (a)
|
||||||||
|
Act II Global Acquisition
|
||||||||
|
Corporation Class A (b)(f)
|
90,858
|
885,411
|
||||||
|
Alberton Acquisition Corporation (b)
|
242,664
|
2,460,613
|
||||||
|
Big Rock Partners Acquisition Corporation (f)
|
45,950
|
481,556
|
||||||
|
Black Ridge Acquisition Corporation
|
40,778
|
417,975
|
||||||
|
CF Finance Acquisition Corporation Class A
|
108,500
|
1,087,170
|
||||||
|
ChaSerg Technology Acquisition
|
||||||||
|
Corporation Class A
|
22,830
|
229,213
|
||||||
|
Collier Creek Holdings Class A (b)
|
42,300
|
423,000
|
||||||
|
FinTech Acquisition Corporation III Class A
|
168,874
|
1,656,654
|
||||||
|
GigCapital, Inc. (f)
|
122,996
|
1,271,164
|
||||||
|
GigCapital2, Inc.
|
37,777
|
378,903
|
||||||
|
Gordon Pointe Acquisition Corporation
|
4,482
|
46,299
|
||||||
|
Graf Industrial Corporation (e)
|
197,624
|
1,966,359
|
||||||
|
Hennessy Capital Acquisition Corporation IV
|
167,612
|
1,659,359
|
||||||
|
Legacy Acquisition Corporation Class A
|
144,392
|
1,458,359
|
||||||
|
Modern Media Acquisition Corporation (e)(f)
|
106,188
|
1,110,726
|
||||||
|
Monocle Acquisition Corporation (f)
|
15,759
|
156,172
|
||||||
|
Mudrick Capital Acquisition
|
||||||||
|
Corporation Class A (f)
|
19,411
|
197,507
|
||||||
|
Pure Acquisition Corporation
|
44,644
|
452,690
|
||||||
|
Regalwood Global Energy Ltd. Class A (b)
|
97,770
|
997,254
|
||||||
|
Thunder Bridge Acquisition Ltd. Class A (b)
|
21,365
|
222,837
|
||||||
|
Trident Acquisitions Corporation
|
161,127
|
1,666,053
|
||||||
|
Trinity Merger Corporation Class A
|
171,957
|
1,771,157
|
||||||
|
Tuscan Holdings Corporation (e)
|
168,926
|
1,668,989
|
||||||
|
VectoIQ Acquisition Corporation
|
25,000
|
253,250
|
||||||
|
TOTAL SPECIAL PURPOSE ACQUISITION
|
||||||||
|
COMPANIES (Cost $21,848,120)
|
22,918,670
|
|||||||
The accompanying notes are an integral part of these financial statements.
22
WCM Alternatives: Event-Driven Fund
SCHEDULE OF INVESTMENTS (continued)
June 30, 2019 (Unaudited)
|
Shares
|
Value
|
|||||||
|
CLOSED-END FUNDS — 2.99%
|
||||||||
|
Apollo Senior Floating Rate Fund, Inc.
|
22,543
|
$
|
337,018
|
|||||
|
Apollo Tactical Income Fund, Inc.
|
21,782
|
321,284
|
||||||
|
Ares Dynamic Credit Allocation Fund
|
4,683
|
70,854
|
||||||
|
BlackRock Debt Strategies Fund, Inc. (e)
|
71,056
|
765,273
|
||||||
|
BlackRock Floating Rate Income
|
||||||||
|
Strategies Fund, Inc.
|
19,222
|
246,618
|
||||||
|
Eaton Vance Floating-Rate Income Trust
|
57,056
|
769,115
|
||||||
|
First Trust Senior Floating Rate Income Fund II
|
22,317
|
268,920
|
||||||
|
Invesco Dynamic Credit Opportunities Fund
|
53,124
|
593,926
|
||||||
|
Invesco Senior Income Trust
|
173,546
|
749,719
|
||||||
|
Nuveen Credit Strategies Income Fund
|
1,574
|
12,466
|
||||||
|
Voya Prime Rate Trust
|
147,638
|
702,757
|
||||||
|
Western Asset High Income
|
||||||||
|
Opportunity Fund, Inc. (e)
|
191,266
|
981,195
|
||||||
|
TOTAL CLOSED-END FUNDS
|
||||||||
|
(Cost $5,852,257)
|
5,819,145
|
|||||||
|
PREFERRED STOCKS — 3.87%
|
||||||||
|
Colony Capital, Inc., 8.750%, Series E (e)
|
37,590
|
934,487
|
||||||
|
Fannie Mae, 8.250%, Series S (a)
|
123,181
|
1,534,835
|
||||||
|
Freddie Mac, 8.375%, Series Z (a)(e)
|
319,239
|
3,958,564
|
||||||
|
MB Financial, Inc., 6.000%, Series C (a)
|
38,790
|
1,018,238
|
||||||
|
Pebblebrook Hotel Trust, 6.375%, Series E
|
3,515
|
87,734
|
||||||
|
TOTAL PREFERRED STOCKS
|
||||||||
|
(Cost $6,154,724)
|
7,533,858
|
|||||||
|
CONTINGENT VALUE RIGHTS — 0.00% (a)(e)(g)
|
||||||||
|
Media General, Inc.
|
42,852
|
1,286
|
||||||
|
TOTAL CONTINGENT VALUE RIGHTS (Cost $0)
|
1,286
|
|||||||
|
RIGHTS — 0.01% (a)
|
||||||||
|
Big Rock Partners Acquisition Corporation
|
||||||||
|
Expiration: December 2022 (f)
|
42,195
|
8,017
|
||||||
|
Modern Media Acquisition Corporation
|
||||||||
|
Expiration: September 2019
|
71,496
|
20,734
|
||||||
|
TOTAL RIGHTS (Cost $47,707)
|
28,751
|
|||||||
|
WARRANTS — 0.33% (a)
|
||||||||
|
Act II Global Acquisition Corporation Class A
|
||||||||
|
Expiration: April 2024,
|
||||||||
|
Exercise Price: $11.50 (b)
|
45,429
|
30,892
|
||||||
The accompanying notes are an integral part of these financial statements.
23
WCM Alternatives: Event-Driven Fund
SCHEDULE OF INVESTMENTS (continued)
June 30, 2019 (Unaudited)
|
Shares
|
Value
|
|||||||
|
CF Finance Acquisition Corporation Class A
|
||||||||
|
Expiration: April 2025,
|
||||||||
|
Exercise Price: $11.50
|
81,375
|
$
|
48,825
|
|||||
|
ChaSerg Technology Acquisition
|
||||||||
|
Corporation Class A
|
||||||||
|
Expiration: September 2023,
|
||||||||
|
Exercise Price: $11.50
|
11,415
|
8,561
|
||||||
|
Collier Creek Holdings Class A
|
||||||||
|
Expiration: November 2023,
|
||||||||
|
Exercise Price: $11.50 (b)
|
14,100
|
18,330
|
||||||
|
FinTech Acquisition Corporation III Class A
|
||||||||
|
Expiration: December 2023,
|
||||||||
|
Exercise Price: $11.50
|
84,437
|
117,452
|
||||||
|
Graf Industrial Corporation
|
||||||||
|
Expiration: December 2025,
|
||||||||
|
Exercise Price: $11.50 (f)
|
197,624
|
74,109
|
||||||
|
Hennessy Capital Acquisition Corporation IV
|
||||||||
|
Expiration: September 2025,
|
||||||||
|
Exercise Price: $11.50
|
125,709
|
75,425
|
||||||
|
Kaixin Auto Holdings
|
||||||||
|
Expiration: April 2024,
|
||||||||
|
Exercise Price: $11.50 (b)(f)
|
48,712
|
2,436
|
||||||
|
Legacy Acquisition Corporation Class A
|
||||||||
|
Expiration: November 2022,
|
||||||||
|
Exercise Price: $11.50
|
144,392
|
46,206
|
||||||
|
Modern Media Acquisition Corporation
|
||||||||
|
Expiration: June 2022,
|
||||||||
|
Exercise Price: $11.50
|
35,748
|
7,865
|
||||||
|
Monocle Acquisition Corporation
|
||||||||
|
Expiration: June 2024,
|
||||||||
|
Exercise Price: $11.50 (f)
|
15,759
|
5,358
|
||||||
|
Mudrick Capital Acquisition Corporation Class A
|
||||||||
|
Expiration: March 2025,
|
||||||||
|
Exercise Price: $11.50
|
19,411
|
9,511
|
||||||
|
Pure Acquisition Corporation
|
||||||||
|
Expiration: April 2023,
|
||||||||
|
Exercise Price: $11.50
|
22,218
|
23,995
|
||||||
|
Reebonz Holdings Ltd.
|
||||||||
|
Expiration: December 2023,
|
||||||||
|
Exercise Price: $11.50 (b)(f)
|
23,859
|
358
|
||||||
|
Trinity Merger Corporation Class A
|
||||||||
|
Expiration: May 2023,
|
||||||||
|
Exercise Price: $11.50
|
99,243
|
32,651
|
||||||
The accompanying notes are an integral part of these financial statements.
24
WCM Alternatives: Event-Driven Fund
SCHEDULE OF INVESTMENTS (continued)
June 30, 2019 (Unaudited)
|
Shares
|
Value
|
|||||||
|
Tuscan Holdings Corporation
|
||||||||
|
Expiration: April 2026,
|
||||||||
|
Exercise Price: $11.50 (e)
|
168,926
|
$
|
131,762
|
|||||
|
TOTAL WARRANTS (Cost $599,831)
|
633,736
|
|||||||
|
Principal
|
||||||||
|
Amount
|
||||||||
|
BANK LOANS — 2.28% (f)(j)
|
||||||||
|
Avaya Holdings Corporation
|
||||||||
|
6.651% (3 Month U.S.
|
||||||||
|
LIBOR + 4.250%), 12/15/2024
|
$
|
447,863
|
429,017
|
|||||
|
Cengage Learning Holdings II, Inc.
|
||||||||
|
6.652% (3 Month U.S.
|
||||||||
|
LIBOR + 4.250%), 6/7/2023
|
1,368,473
|
1,312,024
|
||||||
|
McGraw-Hill Global Education Holdings LLC
|
||||||||
|
6.402% (3 Month U.S.
|
||||||||
|
LIBOR + 4.000%), 5/4/2022
|
1,366,448
|
1,307,807
|
||||||
|
Tribune Media Company
|
||||||||
|
5.402% (3 Month U.S.
|
||||||||
|
LIBOR + 3.000%), 1/27/2024
|
1,384,000
|
1,385,730
|
||||||
|
TOTAL BANK LOANS (Cost $4,520,236)
|
4,434,578
|
|||||||
|
CONVERTIBLE BONDS — 1.25% (f)
|
||||||||
|
Caesars Entertainment Corporation
|
||||||||
|
5.000%, 10/1/2024
|
251,397
|
430,939
|
||||||
|
NII Holdings, Inc.
|
||||||||
|
4.250%, 8/15/2023 (h)
|
1,960,000
|
2,007,740
|
||||||
|
TOTAL CONVERTIBLE BONDS (Cost $2,189,567)
|
2,438,679
|
|||||||
|
CORPORATE BONDS — 13.96% (f)
|
||||||||
|
Arconic, Inc.
|
||||||||
|
5.400%, 4/15/2021
|
795,000
|
824,384
|
||||||
|
Ardagh Packaging Finance plc /
|
||||||||
|
Ardagh Holdings USA, Inc.
|
||||||||
|
7.250%, 5/15/2024 (b)(h)
|
2,971,000
|
3,141,832
|
||||||
|
CEC Entertainment, Inc.
|
||||||||
|
8.000%, 2/15/2022
|
3,440,000
|
3,504,887
|
||||||
|
EIG Investors Corporation
|
||||||||
|
10.875%, 2/1/2024
|
2,068,000
|
2,202,420
|
||||||
|
First Data Corporation
|
||||||||
|
5.750%, 1/15/2024 (h)
|
996,000
|
1,025,880
|
||||||
|
GenOn Energy, Inc. / NRG Americas, Inc.
|
||||||||
|
9.044% (6 Month U.S.
|
||||||||
|
LIBOR + 6.500%), 12/1/2023 (j)
|
1,474,000
|
1,468,472
|
||||||
The accompanying notes are an integral part of these financial statements.
25
WCM Alternatives: Event-Driven Fund
SCHEDULE OF INVESTMENTS (continued)
June 30, 2019 (Unaudited)
|
Principal
|
||||||||||||
|
Amount
|
Value
|
|||||||||||
|
Inmarsat Finance plc
|
||||||||||||
|
6.500%, 10/1/2024 (b)(h)
|
$
|
337,000
|
$
|
353,429
|
||||||||
|
Kinetic Concepts, Inc. / KCI USA, Inc.
|
||||||||||||
|
12.500%, 11/1/2021 (h)
|
3,286,000
|
3,626,922
|
||||||||||
|
MEG Energy Corporation
|
||||||||||||
|
6.500%, 1/15/2025 (b)(h)
|
1,246,000
|
1,256,902
|
||||||||||
|
Multi-Color Corporation
|
||||||||||||
|
4.875%, 11/1/2025 (h)
|
437,000
|
460,489
|
||||||||||
|
Nielsen Finance LLC /
|
||||||||||||
|
Nielsen Finance Company
|
||||||||||||
|
5.000%, 4/15/2022 (h)
|
4,022,000
|
4,037,083
|
||||||||||
|
Rent-A-Center, Inc.
|
||||||||||||
|
6.625%, 11/15/2020
|
382,000
|
384,388
|
||||||||||
|
4.750%, 5/1/2021
|
512,000
|
513,920
|
||||||||||
|
Sinclair Television Group, Inc.
|
||||||||||||
|
6.125%, 10/1/2022 (e)
|
1,600,000
|
1,630,000
|
||||||||||
|
T-Mobile USA, Inc.
|
||||||||||||
|
6.500%, 1/15/2024
|
217,000
|
225,138
|
||||||||||
|
Univar USA, Inc.
|
||||||||||||
|
6.750%, 7/15/2023 (h)
|
1,435,000
|
1,469,081
|
||||||||||
|
Vistra Energy Corporation
|
||||||||||||
|
5.875%, 6/1/2023
|
601,000
|
616,776
|
||||||||||
|
Zayo Group LLC / Zayo Capital, Inc.
|
||||||||||||
|
5.750%, 1/15/2027 (h)
|
440,000
|
448,800
|
||||||||||
|
TOTAL CORPORATE BONDS (Cost $27,025,156)
|
27,190,803
|
|||||||||||
|
Contracts
|
||||||||||||
|
(100 shares
|
Notional
|
|||||||||||
|
per contract)
|
Amount
|
|||||||||||
|
PURCHASED PUT OPTIONS — 0.19% (a)
|
||||||||||||
|
Bayer AG
|
||||||||||||
|
Expiration: August 2019,
|
||||||||||||
|
Exercise Price: EUR 50.00 (b)(f)
|
502
|
$
|
3,059,188
|
12,558
|
||||||||
|
The Blackstone Group LP
|
||||||||||||
|
Expiration: July 2019,
|
||||||||||||
|
Exercise Price: $40.00
|
864
|
3,837,888
|
10,368
|
|||||||||
|
Expiration: September 2019,
|
||||||||||||
|
Exercise Price: $32.00
|
238
|
1,057,196
|
2,380
|
|||||||||
|
Expiration: September 2019,
|
||||||||||||
|
Exercise Price: $34.00
|
396
|
1,759,032
|
6,138
|
|||||||||
The accompanying notes are an integral part of these financial statements.
26
WCM Alternatives: Event-Driven Fund
SCHEDULE OF INVESTMENTS (continued)
June 30, 2019 (Unaudited)
|
Contracts
|
||||||||||||
|
(100 shares
|
Notional
|
|||||||||||
|
per contract)
|
Amount
|
Value
|
||||||||||
|
Caesars Entertainment Corporation
|
||||||||||||
|
Expiration: July 2019,
|
||||||||||||
|
Exercise Price: $9.00 (f)
|
2,173
|
$
|
2,568,486
|
$
|
1,086
|
|||||||
|
Expiration: September 2019,
|
||||||||||||
|
Exercise Price: $6.00
|
832
|
983,424
|
832
|
|||||||||
|
Expiration: September 2019,
|
||||||||||||
|
Exercise Price: $8.00 (f)
|
2,194
|
2,593,308
|
4,388
|
|||||||||
|
CBS Corporation Class B
|
||||||||||||
|
Expiration: September 2019,
|
||||||||||||
|
Exercise Price: $42.50
|
517
|
2,579,830
|
23,265
|
|||||||||
|
Expiration: September 2019,
|
||||||||||||
|
Exercise Price: $45.00
|
755
|
3,767,450
|
58,512
|
|||||||||
|
Corteva, Inc.
|
||||||||||||
|
Expiration: September 2019,
|
||||||||||||
|
Exercise Price: $26.00
|
288
|
851,616
|
15,840
|
|||||||||
|
Dow, Inc.
|
||||||||||||
|
Expiration: September 2019,
|
||||||||||||
|
Exercise Price: $45.00
|
285
|
1,405,335
|
31,635
|
|||||||||
|
DuPont de Nemours, Inc.
|
||||||||||||
|
Expiration: September 2019,
|
||||||||||||
|
Exercise Price: $70.00
|
288
|
2,162,016
|
58,320
|
|||||||||
|
FTSE 100 Index
|
||||||||||||
|
Expiration: July 2019,
|
||||||||||||
|
Exercise Price: GBP 7,600.00 (b)(f)(k)
|
2
|
188,225
|
4,318
|
|||||||||
|
Huntsman Corporation
|
||||||||||||
|
Expiration: July 2019,
|
||||||||||||
|
Exercise Price: $16.00
|
918
|
1,876,392
|
4,590
|
|||||||||
|
The Madison Square Garden Company Class A
|
||||||||||||
|
Expiration: August 2019,
|
||||||||||||
|
Exercise Price: $260.00
|
77
|
2,155,538
|
29,645
|
|||||||||
|
Masco Corporation
|
||||||||||||
|
Expiration: July 2019,
|
||||||||||||
|
Exercise Price: $30.00
|
499
|
1,958,076
|
1,248
|
|||||||||
|
Expiration: October 2019,
|
||||||||||||
|
Exercise Price: $34.00
|
468
|
1,836,432
|
35,100
|
|||||||||
|
MGM Resorts International
|
||||||||||||
|
Expiration: July 2019,
|
||||||||||||
|
Exercise Price: $20.00
|
367
|
1,048,519
|
734
|
|||||||||
|
Expiration: July 2019,
|
||||||||||||
|
Exercise Price: $21.00
|
180
|
514,260
|
900
|
|||||||||
|
Expiration: July 2019,
|
||||||||||||
|
Exercise Price: $22.00
|
420
|
1,199,940
|
840
|
|||||||||
The accompanying notes are an integral part of these financial statements.
27
WCM Alternatives: Event-Driven Fund
SCHEDULE OF INVESTMENTS (continued)
June 30, 2019 (Unaudited)
|
Contracts
|
||||||||||||
|
(100 shares
|
Notional
|
|||||||||||
|
per contract)
|
Amount
|
Value
|
||||||||||
|
SPDR S&P 500 ETF Trust
|
||||||||||||
|
Expiration: July 2019,
|
||||||||||||
|
Exercise Price: $285.00
|
51
|
$
|
1,494,300
|
$
|
6,452
|
|||||||
|
Expiration: July 2019,
|
||||||||||||
|
Exercise Price: $292.00
|
94
|
2,754,200
|
25,380
|
|||||||||
|
SPDR S&P Oil & Gas Exploration &
|
||||||||||||
|
Production ETF Trust
|
||||||||||||
|
Expiration: July 2019,
|
||||||||||||
|
Exercise Price: $25.00
|
471
|
1,283,475
|
10,362
|
|||||||||
|
Technology Select Sector SPDR Fund
|
||||||||||||
|
Expiration: July 2019,
|
||||||||||||
|
Exercise Price: $74.00
|
103
|
803,812
|
4,532
|
|||||||||
|
VanEck Vectors Semiconductor ETF
|
||||||||||||
|
Expiration: August 2019,
|
||||||||||||
|
Exercise Price: $106.00
|
64
|
705,152
|
18,016
|
|||||||||
|
TOTAL PURCHASED PUT OPTIONS (Cost $711,579)
|
367,439
|
|||||||||||
|
Principal
|
||||||||||||
|
Amount
|
||||||||||||
|
ESCROW NOTES — 0.01% (a)(d)(g)
|
||||||||||||
|
AMR Corporation
|
$
|
28,850
|
6,347
|
|||||||||
|
Winthrop Realty Trust (e)
|
26,484
|
15,890
|
||||||||||
|
TOTAL ESCROW NOTES (Cost $75,778)
|
22,237
|
|||||||||||
|
Shares
|
||||||||||||
|
SHORT-TERM INVESTMENTS — 15.74%
|
||||||||||||
|
MONEY MARKET FUNDS — 3.20% (c)
|
||||||||||||
|
JPMorgan U.S. Government Money Market
|
||||||||||||
|
Fund, Institutional Share Class, 2.26%
|
6,229,598
|
6,229,598
|
||||||||||
|
6,229,598
|
||||||||||||
|
Principal
|
||||||||||||
|
Amount
|
||||||||||||
|
U.S. TREASURY BILLS — 12.54% (e)(f)(m)
|
||||||||||||
|
United States Treasury Bills
|
||||||||||||
|
2.40%, 7/18/2019
|
$
|
660,000
|
659,370
|
|||||||||
|
2.41%, 7/25/2019
|
915,000
|
913,815
|
||||||||||
|
2.39%, 8/8/2019
|
380,000
|
379,184
|
||||||||||
|
2.42%, 8/22/2019
|
200,000
|
199,402
|
||||||||||
|
2.41%, 8/29/2019
|
1,350,000
|
1,345,370
|
||||||||||
|
2.41%, 9/12/2019
|
315,000
|
313,684
|
||||||||||
|
2.37%, 9/19/2019
|
300,000
|
298,621
|
||||||||||
The accompanying notes are an integral part of these financial statements.
28
WCM Alternatives: Event-Driven Fund
SCHEDULE OF INVESTMENTS (continued)
June 30, 2019 (Unaudited)
|
Principal
|
||||||||
|
Amount
|
Value
|
|||||||
|
2.33%, 9/26/2019
|
$
|
20,000
|
$
|
19,900
|
||||
|
2.35%, 10/24/2019
|
555,000
|
551,494
|
||||||
|
2.33%, 11/7/2019
|
6,740,000
|
6,690,549
|
||||||
|
2.32%, 11/14/2019
|
2,465,000
|
2,445,978
|
||||||
|
2.29%, 11/21/2019
|
6,550,000
|
6,496,793
|
||||||
|
2.23%, 11/29/2019
|
820,000
|
812,953
|
||||||
|
2.09%, 12/5/2019
|
1,345,000
|
1,333,166
|
||||||
|
2.10%, 12/12/2019
|
275,000
|
272,449
|
||||||
|
1.95%, 12/19/2019
|
1,710,000
|
1,693,428
|
||||||
|
24,426,156
|
||||||||
|
TOTAL SHORT-TERM INVESTMENTS
|
||||||||
|
(Cost $30,639,251)
|
30,655,754
|
|||||||
|
TOTAL LONG INVESTMENTS
|
||||||||
|
(Cost $192,020,838) — 101.70%
|
198,037,468
|
|||||||
|
Shares
|
||||||||
|
SHORT INVESTMENTS — (26.72)%
|
||||||||
|
COMMON STOCKS — (26.70)%
|
||||||||
|
AEROSPACE & DEFENSE — (4.17)%
|
||||||||
|
Harris Corporation
|
(42,914
|
)
|
(8,116,325
|
)
|
||||
|
AIRLINES — 0.00%
|
||||||||
|
American Airlines Group, Inc.
|
(194
|
)
|
(6,326
|
)
|
||||
|
ASSET MANAGEMENT &
|
||||||||
|
CUSTODY BANKS — (1.75)%
|
||||||||
|
Brookfield Asset Management, Inc. Class A (b)
|
(71,173
|
)
|
(3,400,646
|
)
|
||||
|
BROADCASTING — (0.17)%
|
||||||||
|
Discovery Communications, Inc. Class A
|
(10,767
|
)
|
(330,547
|
)
|
||||
|
CABLE & SATELLITE — (0.34)%
|
||||||||
|
Sirius XM Holdings, Inc.
|
(117,749
|
)
|
(657,039
|
)
|
||||
|
CASINOS & GAMING — (0.78)%
|
||||||||
|
Eldorado Resorts, Inc.
|
(32,978
|
)
|
(1,519,297
|
)
|
||||
|
DATA PROCESSING &
|
||||||||
|
OUTSOURCED SERVICES — (4.72)%
|
||||||||
|
Fidelity National Information Services, Inc.
|
(58,595
|
)
|
(7,188,435
|
)
|
||||
|
Fiserv, Inc.
|
(21,532
|
)
|
(1,962,857
|
)
|
||||
|
Global Payments, Inc.
|
(280
|
)
|
(44,836
|
)
|
||||
|
(9,196,128
|
)
|
|||||||
|
GAS UTILITIES — (1.47)%
|
||||||||
|
UGI Corporation
|
(53,563
|
)
|
(2,860,800
|
)
|
||||
The accompanying notes are an integral part of these financial statements.
29
WCM Alternatives: Event-Driven Fund
SCHEDULE OF INVESTMENTS (continued)
June 30, 2019 (Unaudited)
|
Shares
|
Value
|
|||||||
|
INTEGRATED OIL & GAS — (1.06)%
|
||||||||
|
Occidental Petroleum Corporation
|
(41,038
|
)
|
$
|
(2,063,391
|
)
|
|||
|
INTERNET & DIRECT
|
||||||||
|
MARKETING RETAIL — (4.10)%
|
||||||||
|
Alibaba Group Holding Ltd. — ADR
|
(25,368
|
)
|
(4,298,607
|
)
|
||||
|
Expedia Group, Inc.
|
(27,694
|
)
|
(3,684,133
|
)
|
||||
|
(7,982,740
|
)
|
|||||||
|
MANAGED HEALTH CARE — (0.40)%
|
||||||||
|
Centene Corporation
|
(14,979
|
)
|
(785,499
|
)
|
||||
|
PHARMACEUTICALS — (1.77)%
|
||||||||
|
AbbVie, Inc.
|
(5,054
|
)
|
(367,527
|
)
|
||||
|
Bristol-Myers Squibb Company
|
(67,807
|
)
|
(3,075,047
|
)
|
||||
|
(3,442,574
|
)
|
|||||||
|
REGIONAL BANKS — (3.57)%
|
||||||||
|
BB&T Corporation
|
(141,558
|
)
|
(6,954,745
|
)
|
||||
|
REITs — (0.24)%
|
||||||||
|
Brookfield Property Partners LP (b)
|
(24,527
|
)
|
(464,296
|
)
|
||||
|
STEEL — (0.64)%
|
||||||||
|
SunCoke Energy, Inc.
|
(139,942
|
)
|
(1,242,685
|
)
|
||||
|
WIRELESS TELECOMMUNICATION
|
||||||||
|
SERVICES — (1.52)%
|
||||||||
|
T-Mobile USA, Inc.
|
(39,901
|
)
|
(2,958,260
|
)
|
||||
|
TOTAL COMMON STOCKS
|
||||||||
|
(Proceeds $50,301,494)
|
(51,981,298
|
)
|
||||||
|
PRIVATE PLACEMENTS — (0.02)% (g)
|
||||||||
|
Celgene Corporation
|
(22,580
|
)
|
(49,676
|
)
|
||||
|
TOTAL PRIVATE PLACEMENTS
|
||||||||
|
(Proceeds $48,929)
|
(49,676
|
)
|
||||||
|
TOTAL SHORT INVESTMENTS
|
||||||||
|
(Proceeds $50,350,423) — (26.72)%
|
(52,030,974
|
)
|
||||||
|
TOTAL NET INVESTMENTS
|
||||||||
|
(Cost $141,670,415) — 74.98%
|
146,006,494
|
|||||||
|
OTHER ASSETS IN
|
||||||||
|
EXCESS OF LIABILITIES — 25.02%
|
48,709,685
|
|||||||
|
TOTAL NET ASSETS — 100.00%
|
$
|
194,716,179
|
||||||
The accompanying notes are an integral part of these financial statements.
30
WCM Alternatives: Event-Driven Fund
SCHEDULE OF INVESTMENTS (continued)
June 30, 2019 (Unaudited)
ADR – American Depository Receipt
ETF – Exchange-Traded Fund
EUR – Euro
GBP – British Pounds
LIBOR – London Interbank Offered Rate
plc – Public Limited Company
REITs – Real Estate Investment Trusts
|
(a)
|
Non-income producing security.
|
|
(b)
|
Foreign security.
|
|
(c)
|
The rate shown is the annualized seven-day yield as of June 30, 2019.
|
|
(d)
|
Security fair valued by the Valuation Group in good faith in accordance with the policies adopted by the Board of Trustees.
|
|
(e)
|
All or a portion of the shares have been committed as collateral for open securities sold short, written option contracts, swap contracts, and forward currency exchange contracts.
|
|
(f)
|
Level 2 Security. Please see Note 2 in the Notes to the Financial Statements for more information.
|
|
(g)
|
Level 3 Security. Please see Note 2 in the Notes to the Financial Statements for more information.
|
|
(h)
|
Security exempt from registration under Rule 144A of the Securities Act of 1933. These securities may be resold in transactions exempt from registration normally to qualified institutional buyers. As of June 30,
2019, these securities represent 9.16% of total net assets.
|
|
(i)
|
Restricted security. The Fund may own investment securities that have other legal or contractual limitations, and thus are restricted as to resale. These securities are valued by the Valuation Group under the
supervision of the Board of Trustees. As of June 30, 2019, this common stock had a cost of $983,662 and its market value represented 0.53% of total net assets. The Fund’s adviser perfected its appraisal rights over this security as of
6/20/2016. Please see Note 2 in the Notes to the Financial Statements for more information.
|
|
(j)
|
The coupon rate shown on variable rate securities represents the rate as of June 30, 2019.
|
|
(k)
|
This security has 10 shares per contract.
|
|
(l)
|
This security is held in connection with a written option contract.
|
|
(m)
|
The rate shown represents yield to maturity.
|
The Global Industry Classification Standard (GICS®) was developed by and/or is the exclusive property of MSCI, Inc. and Standard & Poor’s
Financial Services LLC (“S&P”). GICS is a service mark of MSCI and S&P and has been licensed for use by Fund Services.
The accompanying notes are an integral part of these financial statements.
31
WCM Alternatives: Credit Event Fund
SCHEDULE OF INVESTMENTS
June 30, 2019 (Unaudited)
|
Shares
|
Value
|
|||||||
|
LONG INVESTMENTS — 108.00%
|
||||||||
|
SPECIAL PURPOSE ACQUISITION
|
||||||||
|
COMPANIES — 35.70% (a)
|
||||||||
|
Act II Global Acquisition
|
||||||||
|
Corporation Class A (b)(e)
|
11,468
|
$
|
111,756
|
|||||
|
Alberton Acquisition Corporation (b)
|
19,986
|
202,658
|
||||||
|
CF Finance Acquisition
|
||||||||
|
Corporation Class A
|
15,440
|
154,709
|
||||||
|
FinTech Acquisition
|
||||||||
|
Corporation III Class A
|
15,106
|
148,190
|
||||||
|
Haymaker Acquisition Corporation II
|
8,030
|
81,986
|
||||||
|
Hennessy Capital Acquisition
|
||||||||
|
Corporation IV
|
7,720
|
76,428
|
||||||
|
Legacy Acquisition Corporation Class A
|
8,245
|
83,275
|
||||||
|
Mudrick Capital Acquisition
|
||||||||
|
Corporation Class A (e)
|
1,950
|
19,841
|
||||||
|
Pivotal Acquisition Corporation
|
7,598
|
77,120
|
||||||
|
Pure Acquisition Corporation
|
15,882
|
161,043
|
||||||
|
Trident Acquisitions Corporation
|
13,565
|
140,262
|
||||||
|
Trinity Merger Corporation Class A
|
7,578
|
78,053
|
||||||
|
Tuscan Holdings Corporation
|
10,713
|
105,845
|
||||||
|
TOTAL SPECIAL PURPOSE ACQUISITION
|
||||||||
|
COMPANIES (Cost $1,376,387)
|
1,441,166
|
|||||||
|
CLOSED-END FUNDS — 0.11%
|
||||||||
|
Apollo Tactical Income Fund, Inc.
|
23
|
339
|
||||||
|
Ares Dynamic Credit Allocation Fund
|
173
|
2,618
|
||||||
|
BlackRock Debt Strategies Fund, Inc.
|
82
|
883
|
||||||
|
Nuveen Credit Strategies Income Fund
|
58
|
459
|
||||||
|
TOTAL CLOSED-END FUNDS
|
||||||||
|
(Cost $4,396)
|
4,299
|
|||||||
|
PREFERRED STOCKS — 2.78% (a)
|
||||||||
|
Fannie Mae, 8.250%, Series S
|
2,531
|
31,536
|
||||||
|
Freddie Mac, 8.375%, Series Z
|
6,510
|
80,724
|
||||||
|
TOTAL PREFERRED STOCKS
|
||||||||
|
(Cost $92,675)
|
112,260
|
|||||||
|
WARRANTS — 1.61% (a)
|
||||||||
|
Act II Global Acquisition Corporation Class A
|
||||||||
|
Expiration: April 2024,
|
||||||||
|
Exercise Price: $11.50 (b)
|
5,734
|
3,899
|
||||||
The accompanying notes are an integral part of these financial statements.
32
WCM Alternatives: Credit Event Fund
SCHEDULE OF INVESTMENTS (continued)
June 30, 2019 (Unaudited)
|
Shares
|
Value
|
|||||||
|
CF Finance Acquisition Corporation Class A
|
||||||||
|
Expiration: April 2025,
|
||||||||
|
Exercise Price: $11.50
|
11,580
|
$
|
6,948
|
|||||
|
FinTech Acquisition Corporation III Class A
|
||||||||
|
Expiration: December 2023,
|
||||||||
|
Exercise Price: $11.50
|
7,553
|
10,506
|
||||||
|
Hennessy Capital Acquisition Corporation IV
|
||||||||
|
Expiration: September 2025,
|
||||||||
|
Exercise Price: $11.50
|
5,790
|
3,474
|
||||||
|
Mudrick Capital Acquisition
|
||||||||
|
Corporation Class A
|
||||||||
|
Expiration: March 2025,
|
||||||||
|
Exercise Price: $11.50
|
1,950
|
956
|
||||||
|
Pivotal Acquisition Corporation
|
||||||||
|
Expiration: December 2025,
|
||||||||
|
Exercise Price: $11.50
|
7,598
|
10,257
|
||||||
|
Pure Acquisition Corporation
|
||||||||
|
Expiration: April 2023,
|
||||||||
|
Exercise Price: $11.50
|
7,903
|
8,535
|
||||||
|
Thunder Bridge Acquisition Ltd. Class A
|
||||||||
|
Expiration: July 2022,
|
||||||||
|
Exercise Price: $11.50 (b)
|
5,911
|
11,941
|
||||||
|
Tuscan Holdings Corporation
|
||||||||
|
Expiration: April 2026,
|
||||||||
|
Exercise Price: $11.50
|
10,713
|
8,356
|
||||||
|
TOTAL WARRANTS (Cost $47,552)
|
64,872
|
|||||||
|
Principal
|
||||||||
|
Amount
|
||||||||
|
BANK LOANS — 9.42% (e)(g)
|
||||||||
|
Cengage Learning Holdings II, Inc.
|
||||||||
|
6.652% (3 Month U.S.
|
||||||||
|
LIBOR + 4.250%), 6/7/2023
|
$
|
99,743
|
95,628
|
|||||
|
McGraw-Hill Global
|
||||||||
|
Education Holdings LLC
|
||||||||
|
6.402% (3 Month U.S.
|
||||||||
|
LIBOR + 4.000%), 5/4/2022
|
98,743
|
94,506
|
||||||
|
Tribune Media Company
|
||||||||
|
5.402% (3 Month U.S.
|
||||||||
|
LIBOR + 3.000%), 1/27/2024
|
190,000
|
190,238
|
||||||
|
TOTAL BANK LOANS (Cost $384,938)
|
380,372
|
|||||||
The accompanying notes are an integral part of these financial statements.
33
WCM Alternatives: Credit Event Fund
SCHEDULE OF INVESTMENTS (continued)
June 30, 2019 (Unaudited)
|
Principal
|
||||||||
|
Amount
|
Value
|
|||||||
|
CONVERTIBLE BONDS — 8.14% (e)
|
||||||||
|
Caesars Entertainment Corporation
|
||||||||
|
5.000%, 10/1/2024
|
$
|
71,000
|
$
|
121,706
|
||||
|
NII Holdings, Inc.
|
||||||||
|
4.250%, 8/15/2023 (f)
|
202,000
|
206,921
|
||||||
|
TOTAL CONVERTIBLE BONDS
|
||||||||
|
(Cost $318,469)
|
328,627
|
|||||||
|
CORPORATE BONDS — 47.42% (e)
|
||||||||
|
Acadia Healthcare Company, Inc.
|
||||||||
|
5.125%, 7/1/2022 (d)
|
153,000
|
154,339
|
||||||
|
Ardagh Packaging Finance plc /
|
||||||||
|
Ardagh Holdings USA, Inc.
|
||||||||
|
7.250%, 5/15/2024 (b)(f)(h)
|
225,000
|
237,937
|
||||||
|
CEC Entertainment, Inc.
|
||||||||
|
8.000%, 2/15/2022
|
188,000
|
191,546
|
||||||
|
EIG Investors Corporation
|
||||||||
|
10.875%, 2/1/2024
|
182,000
|
193,829
|
||||||
|
GenOn Energy, Inc. / NRG Americas, Inc.
|
||||||||
|
9.044% (6 Month U.S.
|
||||||||
|
LIBOR + 6.500%), 12/1/2023 (g)
|
184,000
|
183,310
|
||||||
|
Inmarsat Finance plc
|
||||||||
|
6.500%, 10/1/2024 (b)(f)
|
13,000
|
13,634
|
||||||
|
Kinetic Concepts, Inc. / KCI USA, Inc.
|
||||||||
|
7.875%, 2/15/2021 (f)
|
45,000
|
46,189
|
||||||
|
Multi-Color Corporation
|
||||||||
|
4.875%, 11/1/2025 (f)
|
57,000
|
60,064
|
||||||
|
Nationstar Mortgage LLC /
|
||||||||
|
Nationstar Capital Corporation
|
||||||||
|
6.500%, 7/1/2021
|
25,000
|
25,101
|
||||||
|
6.500%, 6/1/2022
|
16,000
|
15,870
|
||||||
|
Nielsen Finance LLC /
|
||||||||
|
Nielsen Finance Company
|
||||||||
|
5.000%, 4/15/2022 (d)(f)
|
203,000
|
203,761
|
||||||
|
Rent-A-Center, Inc.
|
||||||||
|
6.625%, 11/15/2020
|
12,000
|
12,075
|
||||||
|
4.750%, 5/1/2021 (d)
|
184,000
|
184,690
|
||||||
|
Unitymedia GmbH
|
||||||||
|
6.125%, 1/15/2025 (b)(f)
|
148,000
|
154,697
|
||||||
|
Univar USA, Inc.
|
||||||||
|
6.750%, 7/15/2023 (f)(h)
|
232,000
|
237,510
|
||||||
|
TOTAL CORPORATE BONDS
|
||||||||
|
(Cost $1,897,004)
|
1,914,552
|
|||||||
The accompanying notes are an integral part of these financial statements.
34
WCM Alternatives: Credit Event Fund
SCHEDULE OF INVESTMENTS (continued)
June 30, 2019 (Unaudited)
|
Shares
|
Value
|
|||||||
|
SHORT-TERM INVESTMENTS — 2.82%
|
||||||||
|
MONEY MARKET FUNDS — 2.82% (c)
|
||||||||
|
JPMorgan U.S. Government Money Market
|
||||||||
|
Fund, Institutional Share Class, 2.26%
|
113,946
|
$
|
113,946
|
|||||
|
TOTAL SHORT-TERM INVESTMENTS
|
||||||||
|
(Cost $113,946)
|
113,946
|
|||||||
|
TOTAL LONG INVESTMENTS
|
||||||||
|
(Cost $4,235,367) — 108.00%
|
4,360,094
|
|||||||
|
SHORT INVESTMENTS — (1.03)%
|
||||||||
|
COMMON STOCKS — (1.03)%
|
||||||||
|
CASINOS & GAMING — (1.03)%
|
||||||||
|
Eldorado Resorts, Inc.
|
(902
|
)
|
(41,555
|
)
|
||||
|
TOTAL COMMON STOCKS
|
||||||||
|
(Proceeds $40,595)
|
(41,555
|
)
|
||||||
|
TOTAL SHORT INVESTMENTS
|
||||||||
|
(Proceeds $40,595) — (1.03)%
|
(41,555
|
)
|
||||||
|
TOTAL NET INVESTMENTS
|
||||||||
|
(Cost $4,194,772) — 106.97%
|
4,318,539
|
|||||||
|
OTHER LIABILITIES IN
|
||||||||
|
EXCESS OF ASSETS — (6.97)%
|
(281,488
|
)
|
||||||
|
TOTAL NET ASSETS — 100.00%
|
$
|
4,037,051
|
||||||
LIBOR – London Interbank Offered Rate
plc – Public Limited Company
|
(a)
|
Non-income producing security.
|
|
(b)
|
Foreign Security.
|
|
(c)
|
The rate shown is the annualized seven-day yield as of June 30, 2019.
|
|
(d)
|
All or a portion of the shares have been committed as collateral for open securities sold short and swap contracts.
|
|
(e)
|
Level 2 Security. Please see Note 2 in the Notes to the Financial Statements for more information.
|
|
(f)
|
Security exempt from registration under Rule 144A of the Securities Act of 1933. These securities may be resold in transactions exempt from registration normally to qualified institutional buyers. As of June 30,
2019, these securities represent 28.75% of total net assets.
|
|
(g)
|
The coupon rate shown on variable rate securities represents the rate as of June 30, 2019.
|
|
(h)
|
All or partial amount transferred for the benefit of the counterparty as collateral for reverse repurchase agreements.
|
The Global Industry Classification Standard (GICS®) was developed by and/or is the exclusive property of MSCI, Inc. and Standard & Poor’s
Financial Services LLC (“S&P”). GICS is a service mark of MSCI and S&P and has been licensed for use by Fund Services.
The accompanying notes are an integral part of these financial statements.
35
The Merger Fund
SCHEDULE OF INVESTMENTS (continued)
Open Written Options
June 30, 2019 (Unaudited)
|
Contracts
|
||||||||||||
|
(100 shares
|
Notional
|
|||||||||||
|
per contract)
|
Amount
|
Value
|
||||||||||
|
WRITTEN CALL OPTIONS
|
||||||||||||
|
AT&T, Inc.
|
||||||||||||
|
Expiration: August 2019,
|
||||||||||||
|
Exercise Price: $33.00
|
(492
|
)
|
$
|
(1,648,692
|
)
|
$
|
(49,692
|
)
|
||||
|
BB&T Corporation
|
||||||||||||
|
Expiration: September 2019,
|
||||||||||||
|
Exercise Price: $46.00
|
(28
|
)
|
(137,564
|
)
|
(11,130
|
)
|
||||||
|
Centene Corporation
|
||||||||||||
|
Expiration: September 2019,
|
||||||||||||
|
Exercise Price: $50.00
|
(986
|
)
|
(5,170,584
|
)
|
(478,210
|
)
|
||||||
|
Corteva, Inc.
|
||||||||||||
|
Expiration: September 2019,
|
||||||||||||
|
Exercise Price: $29.00
|
(1,557
|
)
|
(4,604,049
|
)
|
(303,615
|
)
|
||||||
|
Dow, Inc.
|
||||||||||||
|
Expiration: September 2019,
|
||||||||||||
|
Exercise Price: $50.00
|
(1,541
|
)
|
(7,598,671
|
)
|
(312,823
|
)
|
||||||
|
DuPont de Nemours, Inc.
|
||||||||||||
|
Expiration: September 2019,
|
||||||||||||
|
Exercise Price: $77.50
|
(1,557
|
)
|
(11,688,399
|
)
|
(424,282
|
)
|
||||||
|
Occidental Petroleum Corporation
|
||||||||||||
|
Expiration: July 2019,
|
||||||||||||
|
Exercise Price: $45.00
|
(393
|
)
|
(1,976,004
|
)
|
(209,273
|
)
|
||||||
|
SPDR S&P 500 ETF Trust
|
||||||||||||
|
Expiration: July 2019,
|
||||||||||||
|
Exercise Price: $295.00
|
(425
|
)
|
(12,452,500
|
)
|
(144,075
|
)
|
||||||
|
Expiration: July 2019,
|
||||||||||||
|
Exercise Price: $296.00
|
(426
|
)
|
(12,481,800
|
)
|
(121,410
|
)
|
||||||
|
WABCO Holdings, Inc.
|
||||||||||||
|
Expiration: September 2019,
|
||||||||||||
|
Exercise Price: $135.00
|
(1,720
|
)
|
(22,807,200
|
)
|
(172,000
|
)
|
||||||
|
WellCare Health Plans, Inc.
|
||||||||||||
|
Expiration: September 2019,
|
||||||||||||
|
Exercise Price: $250.00
|
(236
|
)
|
(6,727,652
|
)
|
(936,920
|
)
|
||||||
|
(3,163,430
|
)
|
|||||||||||
The accompanying notes are an integral part of these financial statements.
36
The Merger Fund
SCHEDULE OF INVESTMENTS (continued)
Open Written Options
June 30, 2019 (Unaudited)
|
Contracts
|
||||||||||||
|
(100 shares
|
Notional
|
|||||||||||
|
per contract)
|
Amount
|
Value
|
||||||||||
|
WRITTEN PUT OPTIONS
|
||||||||||||
|
SPDR S&P 500 ETF Trust
|
||||||||||||
|
Expiration: July 2019,
|
||||||||||||
|
Exercise Price: $270.00
|
(852
|
)
|
$
|
(24,963,600
|
)
|
$
|
(26,412
|
)
|
||||
|
Technology Select Sector SPDR Fund
|
||||||||||||
|
Expiration: July 2019,
|
||||||||||||
|
Exercise Price: $68.00
|
(1,964
|
)
|
(15,327,056
|
)
|
(15,712
|
)
|
||||||
|
VanEck Vectors Semiconductor ETF
|
||||||||||||
|
Expiration: August 2019,
|
||||||||||||
|
Exercise Price: $99.00
|
(1,010
|
)
|
(11,128,180
|
)
|
(117,160
|
)
|
||||||
|
(159,284
|
)
|
|||||||||||
|
TOTAL WRITTEN OPTIONS
|
||||||||||||
|
(Premiums received $3,307,611)
|
$
|
(3,322,714
|
)
|
|||||||||
ETF – Exchange-Traded Fund
The accompanying notes are an integral part of these financial statements.
37
WCM Alternatives: Event-Driven Fund
SCHEDULE OF INVESTMENTS (continued)
Open Written Options
June 30, 2019 (Unaudited)
|
Contracts
|
||||||||||||
|
(100 shares
|
Notional
|
|||||||||||
|
per contract)
|
Amount
|
Value
|
||||||||||
|
WRITTEN CALL OPTIONS
|
||||||||||||
|
The Blackstone Group LP
|
||||||||||||
|
Expiration: July 2019,
|
||||||||||||
|
Exercise Price: $44.00
|
(864
|
)
|
$
|
(3,837,888
|
)
|
$
|
(117,936
|
)
|
||||
|
Expiration: September 2019,
|
||||||||||||
|
Exercise Price: $38.00
|
(224
|
)
|
(995,008
|
)
|
(149,520
|
)
|
||||||
|
Expiration: September 2019,
|
||||||||||||
|
Exercise Price: $39.00
|
(285
|
)
|
(1,265,970
|
)
|
(163,875
|
)
|
||||||
|
Expiration: September 2019,
|
||||||||||||
|
Exercise Price: $40.00
|
(194
|
)
|
(861,748
|
)
|
(93,508
|
)
|
||||||
|
Caesars Entertainment Corporation
|
||||||||||||
|
Expiration: July 2019,
|
||||||||||||
|
Exercise Price: $11.00 (b)
|
(2,173
|
)
|
(2,568,486
|
)
|
(184,705
|
)
|
||||||
|
Expiration: September 2019,
|
||||||||||||
|
Exercise Price: $10.00 (b)
|
(2,194
|
)
|
(2,593,308
|
)
|
(399,308
|
)
|
||||||
|
CBS Corporation Class B
|
||||||||||||
|
Expiration: September 2019,
|
||||||||||||
|
Exercise Price: $47.50
|
(517
|
)
|
(2,579,830
|
)
|
(200,337
|
)
|
||||||
|
Expiration: September 2019,
|
||||||||||||
|
Exercise Price: $50.00
|
(755
|
)
|
(3,767,450
|
)
|
(177,425
|
)
|
||||||
|
Centene Corporation
|
||||||||||||
|
Expiration: September 2019,
|
||||||||||||
|
Exercise Price: $50.00
|
(55
|
)
|
(288,420
|
)
|
(26,675
|
)
|
||||||
|
Corteva, Inc.
|
||||||||||||
|
Expiration: September 2019,
|
||||||||||||
|
Exercise Price: $30.00
|
(288
|
)
|
(851,616
|
)
|
(41,760
|
)
|
||||||
|
Dow, Inc.
|
||||||||||||
|
Expiration: September 2019,
|
||||||||||||
|
Exercise Price: $52.50
|
(285
|
)
|
(1,405,335
|
)
|
(28,500
|
)
|
||||||
|
DuPont de Nemours, Inc.
|
||||||||||||
|
Expiration: September 2019,
|
||||||||||||
|
Exercise Price: $80.00
|
(288
|
)
|
(2,162,016
|
)
|
(51,840
|
)
|
||||||
|
Huntsman Corporation
|
||||||||||||
|
Expiration: July 2019,
|
||||||||||||
|
Exercise Price: $20.00
|
(918
|
)
|
(1,876,392
|
)
|
(82,620
|
)
|
||||||
|
The Madison Square Garden Company Class A
|
||||||||||||
|
Expiration: August 2019,
|
||||||||||||
|
Exercise Price: $290.00
|
(77
|
)
|
(2,155,538
|
)
|
(54,285
|
)
|
||||||
|
Masco Corporation
|
||||||||||||
|
Expiration: July 2019,
|
||||||||||||
|
Exercise Price: $35.00
|
(499
|
)
|
(1,958,076
|
)
|
(219,560
|
)
|
||||||
|
Expiration: October 2019,
|
||||||||||||
|
Exercise Price: $38.00
|
(468
|
)
|
(1,836,432
|
)
|
(149,760
|
)
|
||||||
The accompanying notes are an integral part of these financial statements.
38
WCM Alternatives: Event-Driven Fund
SCHEDULE OF INVESTMENTS (continued)
Open Written Options
June 30, 2019 (Unaudited)
|
Contracts
|
||||||||||||
|
(100 shares
|
Notional
|
|||||||||||
|
per contract)
|
Amount
|
Value
|
||||||||||
|
MGM Resorts International
|
||||||||||||
|
Expiration: July 2019,
|
||||||||||||
|
Exercise Price: $23.00
|
(367
|
)
|
$
|
(1,048,519
|
)
|
$
|
(208,273
|
)
|
||||
|
Expiration: July 2019,
|
||||||||||||
|
Exercise Price: $24.00
|
(180
|
)
|
(514,260
|
)
|
(82,260
|
)
|
||||||
|
Expiration: July 2019,
|
||||||||||||
|
Exercise Price: $25.00
|
(420
|
)
|
(1,199,940
|
)
|
(149,940
|
)
|
||||||
|
Occidental Petroleum Corporation
|
||||||||||||
|
Expiration: July 2019,
|
||||||||||||
|
Exercise Price: $45.00
|
(30
|
)
|
(150,840
|
)
|
(15,975
|
)
|
||||||
|
SPDR S&P 500 ETF Trust
|
||||||||||||
|
Expiration: July 2019,
|
||||||||||||
|
Exercise Price: $295.00
|
(27
|
)
|
(791,100
|
)
|
(9,153
|
)
|
||||||
|
Expiration: July 2019,
|
||||||||||||
|
Exercise Price: $296.00
|
(26
|
)
|
(761,800
|
)
|
(7,410
|
)
|
||||||
|
Uniper SE
|
||||||||||||
|
Expiration: September 2019,
|
||||||||||||
|
Exercise Price: EUR 26.00 (a)(b)
|
(845
|
)
|
(2,250,235
|
)
|
(139,323
|
)
|
||||||
|
WellCare Health Plans, Inc.
|
||||||||||||
|
Expiration: September 2019,
|
||||||||||||
|
Exercise Price: $250.00
|
(14
|
)
|
(399,098
|
)
|
(55,580
|
)
|
||||||
|
|
|
(2,809,528
|
) |
|||||||||
|
WRITTEN PUT OPTIONS
|
||||||||||||
|
Bayer AG
|
||||||||||||
|
Expiration: August 2019,
|
||||||||||||
|
Exercise Price: EUR 56.00 (a)(b)
|
(251
|
)
|
(1,529,594
|
)
|
(22,262
|
)
|
||||||
|
Expiration: August 2019,
|
||||||||||||
|
Exercise Price: EUR 57.00 (a)(b)
|
(251
|
)
|
(1,529,594
|
)
|
(29,112
|
)
|
||||||
|
SPDR S&P 500 ETF Trust
|
||||||||||||
|
Expiration: July 2019,
|
||||||||||||
|
Exercise Price: $270.00
|
(52
|
)
|
(1,523,600
|
)
|
(1,612
|
)
|
||||||
|
Technology Select Sector SPDR Fund
|
||||||||||||
|
Expiration: July 2019,
|
||||||||||||
|
Exercise Price: $68.00
|
(103
|
)
|
(803,812
|
)
|
(824
|
)
|
||||||
|
VanEck Vectors Semiconductor ETF
|
||||||||||||
|
Expiration: August 2019,
|
||||||||||||
|
Exercise Price: $99.00
|
(64
|
)
|
(705,152
|
)
|
(7,424
|
)
|
||||||
|
(61,234
|
)
|
|||||||||||
|
TOTAL WRITTEN OPTIONS
|
||||||||||||
|
(Premiums received $2,142,506)
|
$
|
(2,870,762
|
)
|
|||||||||
ETF – Exchange-Traded Fund
EUR – Euro
|
(a)
|
Foreign Security.
|
|
(b)
|
Level 2 Security. Please see Note 2 in the Notes to the Financial Statements for more information.
|
The accompanying notes are an integral part of these financial statements.
39
The Merger Fund
SCHEDULE OF INVESTMENTS (continued)
Forward Currency Exchange Contracts
June 30, 2019 (Unaudited)
|
Unrealized
|
||||||||||||||||||||||
|
Settlement
|
Currency to
|
USD Value at
|
Currency to
|
USD Value at
|
Appreciation
|
|||||||||||||||||
|
Date
|
Counterparty
|
be Delivered
|
June 30, 2019
|
be Received
|
June 30, 2019
|
(Depreciation)*
|
||||||||||||||||
|
7/11/19
|
JPM
|
13,077,748
|
AUD
|
$
|
9,185,484
|
9,088,564
|
USD
|
$
|
9,088,564
|
$
|
(96,920
|
)
|
||||||||||
|
7/11/19
|
JPM
|
9,152,528
|
USD
|
9,152,528
|
13,077,748
|
AUD
|
9,185,485
|
32,957
|
||||||||||||||
|
9/25/19
|
JPM
|
7,098,594
|
EUR
|
8,129,089
|
8,104,611
|
USD
|
8,104,611
|
(24,478
|
)
|
|||||||||||||
|
12/19/19
|
JPM
|
3,212,244
|
EUR
|
3,702,895
|
3,703,974
|
USD
|
3,703,974
|
1,079
|
||||||||||||||
|
7/2/19
|
JPM
|
49,884,830
|
GBP
|
63,364,322
|
65,474,142
|
USD
|
65,474,142
|
2,109,820
|
||||||||||||||
|
7/2/19
|
JPM
|
66,061,482
|
USD
|
66,061,482
|
49,884,830
|
GBP
|
63,364,322
|
(2,697,160
|
)
|
|||||||||||||
|
7/23/19
|
JPM
|
2,694,283
|
GBP
|
3,426,035
|
3,416,255
|
USD
|
3,416,255
|
(9,780
|
)
|
|||||||||||||
|
7/30/19
|
JPM
|
3,281,648
|
GBP
|
4,174,374
|
4,294,200
|
USD
|
4,294,200
|
119,826
|
||||||||||||||
|
10/15/19
|
JPM
|
4,829,658
|
GBP
|
6,162,489
|
6,152,115
|
USD
|
6,152,115
|
(10,374
|
)
|
|||||||||||||
|
$
|
173,358,698
|
$
|
172,783,668
|
$
|
(575,030
|
)
|
||||||||||||||||
AUD – Australian Dollar
EUR – Euro
GBP – British Pound
JPM – JPMorgan Chase & Co., Inc.
USD – U.S. Dollar
|
*
|
Net unrealized appreciation (depreciation) is a receivable (payable).
|
The accompanying notes are an integral part of these financial statements.
40
WCM Alternatives: Event-Driven Fund
SCHEDULE OF INVESTMENTS (continued)
Forward Currency Exchange Contracts
June 30, 2019 (Unaudited)
|
Unrealized
|
||||||||||||||||||||||
|
Settlement
|
Currency to
|
USD Value at
|
Currency to
|
USD Value at
|
Appreciation
|
|||||||||||||||||
|
Date
|
Counterparty
|
be Delivered
|
June 30, 2019
|
be Received
|
June 30, 2019
|
(Depreciation)*
|
||||||||||||||||
|
7/11/19
|
JPM
|
1,161,365
|
AUD
|
$
|
815,714
|
807,138
|
USD
|
$
|
807,138
|
$
|
(8,576
|
)
|
||||||||||
|
7/11/19
|
JPM
|
812,787
|
USD
|
812,787
|
1,161,365
|
AUD
|
815,714
|
2,927
|
||||||||||||||
|
7/10/19
|
JPM
|
66,920
|
EUR
|
76,173
|
75,563
|
USD
|
75,563
|
(610
|
)
|
|||||||||||||
|
8/26/19
|
JPM
|
1,476,432
|
EUR
|
1,687,062
|
1,690,530
|
USD
|
1,690,530
|
3,468
|
||||||||||||||
|
8/27/19
|
JPM
|
2,197,000
|
EUR
|
2,510,628
|
2,493,156
|
USD
|
2,493,156
|
(17,472
|
)
|
|||||||||||||
|
9/25/19
|
JPM
|
1,488,890
|
EUR
|
1,705,030
|
1,701,747
|
USD
|
1,701,747
|
(3,283
|
)
|
|||||||||||||
|
12/19/19
|
JPM
|
509,614
|
EUR
|
587,455
|
587,626
|
USD
|
587,626
|
171
|
||||||||||||||
|
7/2/19
|
JPM
|
2,629,335
|
GBP
|
3,339,814
|
3,456,731
|
USD
|
3,456,731
|
116,917
|
||||||||||||||
|
7/2/19
|
JPM
|
3,481,976
|
USD
|
3,481,976
|
2,629,335
|
GBP
|
3,339,814
|
(142,162
|
)
|
|||||||||||||
|
8/29/19
|
JPM
|
346,064
|
GBP
|
440,779
|
441,560
|
USD
|
441,560
|
781
|
||||||||||||||
|
10/15/19
|
JPM
|
769,848
|
GBP
|
982,302
|
980,648
|
USD
|
980,648
|
(1,654
|
)
|
|||||||||||||
|
$
|
16,439,720
|
$
|
16,390,227
|
$
|
(49,493
|
)
|
||||||||||||||||
AUD – Australian Dollar
EUR – Euro
GBP – British Pound
JPM – JPMorgan Chase & Co., Inc.
USD – U.S. Dollar
|
*
|
Net unrealized appreciation (depreciation) is a receivable (payable).
|
The accompanying notes are an integral part of these financial statements.
41
The Merger Fund
SCHEDULE OF INVESTMENTS (continued)
Open Swap Contracts
June 30, 2019 (Unaudited)
|
Pay/Receive
|
Unrealized
|
||||||||||||||||||
|
Counter-
|
Termination
|
on Financing
|
Payment
|
Notional
|
Appreciation
|
||||||||||||||
|
party
|
Security
|
Date
|
Rate
|
Financing Rate
|
Frequency
|
Shares
|
Amount
|
(Depreciation)*
|
|||||||||||
|
LONG TOTAL RETURN SWAP CONTRACTS
|
|||||||||||||||||||
|
JPM
|
Altran
Technologies SA
|
6/25/20
|
Pay
|
0.400% +3 Month U.S. LIBOR
|
Quarterly
|
229,446
|
$
|
3,655,259
|
$
|
(15,183
|
)
|
||||||||
|
JPM
|
BCA
Marketplace plc
|
6/27/20
|
Pay
|
0.300% +3 Month U.S. LIBOR
|
Quarterly
|
1,987,514
|
6,088,904
|
44,541
|
|||||||||||
|
JPM
|
BTG plc
|
1/9/20
|
Pay
|
0.300% +3 Month U.S. LIBOR
|
Quarterly
|
320,748
|
3,383,694
|
16,026
|
|||||||||||
|
BAML
|
Inmarsat
Finance plc
|
4/1/20
|
Pay
|
0.550% +1 Month U.S. LIBOR
|
Monthly
|
1,053,516
|
7,542,705
|
(261,380
|
)
|
||||||||||
|
JPM
|
Inmarsat
Finance plc
|
4/4/20
|
Pay
|
0.300% +3 Month U.S. LIBOR
|
Quarterly
|
4,919,510
|
34,314,529
|
(337,703
|
)
|
||||||||||
|
JPM
|
Innogy SE
|
7/18/19
|
Pay
|
0.400% +3 Month U.S. LIBOR
|
Quarterly
|
186,217
|
8,275,317
|
546,240
|
|||||||||||
|
BAML
|
Renault SA
|
6/6/20
|
Pay
|
0.350% +1 Month U.S. LIBOR
|
Monthly
|
25,488
|
1,507,210
|
93,746
|
|||||||||||
|
JPM
|
RPC Group plc
|
5/2/20
|
Pay
|
0.300% +3 Month U.S. LIBOR
|
Quarterly
|
413,827
|
4,251,397
|
(90,437
|
)
|
||||||||||
|
SHORT TOTAL RETURN SWAP CONTRACTS
|
|||||||||||||||||||
|
BAML
|
Brookfield Property
|
||||||||||||||||||
|
Partners LP
|
3/28/20
|
Pay
|
(4.500)% +1 Month U.S. LIBOR
|
Monthly
|
(112,741
|
)
|
(2,333,739
|
)
|
198,471
|
||||||||||
|
BAML
|
Fiat Chrysler
|
||||||||||||||||||
|
Automobiles N.V.
|
6/6/20
|
Receive
|
(0.917)% +1 Month U.S. LIBOR
|
Monthly
|
(135,810
|
)
|
(1,791,683
|
)
|
(101,651
|
)
|
|||||||||
|
$
|
92,670
|
||||||||||||||||||
BAML – Bank of America Merrill Lynch & Co., Inc.
JPM – JPMorgan Chase & Co., Inc.
LIBOR – London Interbank Offered Rate
plc – Public Limited Company
|
*
|
Based on the net swap value held at each counterparty, unrealized appreciation (depreciation) is a receivable (payable).
|
The accompanying notes are an integral part of these financial statements.
42
WCM Alternatives: Event-Driven Fund
SCHEDULE OF INVESTMENTS (continued)
Open Swap Contracts
June 30, 2019 (Unaudited)
|
Pay/Receive
|
Unrealized
|
||||||||||||||||||
|
Counter-
|
Termination
|
on Financing
|
Payment
|
Notional
|
Appreciation
|
||||||||||||||
|
party
|
Security
|
Date
|
Rate
|
Financing Rate
|
Frequency
|
Shares
|
Amount
|
(Depreciation)*
|
|||||||||||
|
LONG TOTAL RETURN SWAP CONTRACTS
|
|||||||||||||||||||
|
JPM
|
Altaba, Inc.
|
7/10/19
|
Pay
|
0.701% +3 Month U.S. LIBOR
|
Quarterly
|
291,378
|
$
|
19,971,352
|
$
|
217,791
|
|||||||||
|
JPM
|
Altran
Technologies SA
|
6/25/20
|
Pay
|
0.400% +3 Month U.S. LIBOR
|
Quarterly
|
36,401
|
579,897
|
(2,409
|
)
|
||||||||||
|
JPM
|
AT&T, Inc.
|
9/5/19
|
Pay
|
0.300% +3 Month U.S. LIBOR
|
Quarterly
|
20,218
|
647,307
|
29,516
|
|||||||||||
|
JPM
|
BCA
Marketplace plc
|
6/27/20
|
Pay
|
0.300% +3 Month U.S. LIBOR
|
Quarterly
|
316,810
|
970,572
|
7,100
|
|||||||||||
|
JPM
|
The Blackstone
Group LP
|
5/28/20
|
Pay
|
0.650% +3 Month U.S. LIBOR
|
Quarterly
|
116,667
|
4,517,346
|
659,626
|
|||||||||||
|
BAML
|
Brookfield Property
|
||||||||||||||||||
|
REIT, Inc. Class A
|
8/30/19
|
Pay
|
0.750% +1 Month U.S. LIBOR
|
Monthly
|
29,422
|
574,989
|
(19,609
|
)
|
|||||||||||
|
BAML
|
CBS Corporation
Class B |
10/22/19
|
Pay
|
0.400% +1 Month U.S. LIBOR
|
Monthly
|
73,435
|
3,789,697
|
(127,645
|
)
|
||||||||||
|
JPM
|
CBS Corporation
Class B
|
5/8/20
|
Pay
|
0.300% +3 Month U.S. LIBOR
|
Quarterly
|
41,100
|
1,994,994
|
53,793
|
|||||||||||
|
BAML
|
Corteva, Inc.
|
6/3/20
|
Pay
|
0.400% +1 Month U.S. LIBOR
|
Monthly
|
2,280
|
75,961
|
(8,588
|
)
|
||||||||||
|
JPM
|
Discovery
Communications,
|
||||||||||||||||||
|
Inc. Class C
|
3/9/20
|
Pay
|
0.300% +3 Month U.S. LIBOR
|
Quarterly
|
10,767
|
292,539
|
13,474
|
||||||||||||
|
BAML
|
Dow, Inc.
|
4/2/20
|
Pay
|
0.400% +1 Month U.S. LIBOR
|
Monthly
|
2,280
|
125,697
|
(13,348
|
)
|
||||||||||
|
BAML
|
Dupont De
Nemours, Inc.
|
4/2/20
|
Pay
|
0.400% +1 Month U.S. LIBOR
|
Monthly
|
2,280
|
181,917
|
(10,871
|
)
|
||||||||||
|
BAML
|
EnCana
Corporation
|
11/14/19
|
Pay
|
0.750% +1 Month U.S. LIBOR
|
Monthly
|
28,969
|
213,100
|
(64,638
|
)
|
||||||||||
|
BAML
|
First Data
Corporation
|
||||||||||||||||||
|
Class A
|
5/7/20
|
Pay
|
0.750% +1 Month U.S. LIBOR
|
Monthly
|
447,804
|
11,405,568
|
708,514
|
||||||||||||
|
JPM
|
First Trust
Senior Floating
|
||||||||||||||||||
|
Rate Income
Fund II
|
12/6/19
|
Pay
|
0.800% +3 Month U.S. LIBOR
|
Quarterly
|
12,108
|
143,025
|
2,697
|
||||||||||||
|
JPM
|
Fox Corporation
Class B
|
3/22/20
|
Pay
|
0.300% +3 Month U.S. LIBOR
|
Quarterly
|
49,765
|
1,864,197
|
(49,503
|
)
|
||||||||||
|
BAML
|
Huntsman
Corporation
|
5/24/20
|
Pay
|
0.750% +1 Month U.S. LIBOR
|
Monthly
|
91,800
|
1,725,840
|
149,345
|
|||||||||||
|
BAML
|
Inmarsat
Finance plc
|
4/1/20
|
Pay
|
0.550% +1 Month U.S. LIBOR
|
Monthly
|
61,344
|
439,195
|
(15,217
|
)
|
||||||||||
|
JPM
|
Inmarsat
Finance plc
|
4/4/20
|
Pay
|
0.300% +3 Month U.S. LIBOR
|
Quarterly
|
315,558
|
2,203,681
|
(23,551
|
)
|
||||||||||
|
JPM
|
Innogy SE
|
7/17/19
|
Pay
|
0.400% +3 Month U.S. LIBOR
|
Quarterly
|
39,058
|
1,723,093
|
127,166
|
|||||||||||
|
JPM
|
Liberty Media
|
||||||||||||||||||
|
Corporation-
Liberty
|
|||||||||||||||||||
|
SiriusXM Class A
|
12/17/19
|
Pay
|
0.300% +3 Month U.S. LIBOR
|
Quarterly
|
12,597
|
485,740
|
(9,960
|
)
|
|||||||||||
|
JPM
|
Mellanox
|
||||||||||||||||||
|
Technologies Ltd.
|
5/14/20
|
Pay
|
0.300% +3 Month U.S. LIBOR
|
Quarterly
|
24,660
|
2,888,919
|
(162,842
|
)
|
|||||||||||
The accompanying notes are an integral part of these financial statements.
43
WCM Alternatives: Event-Driven Fund
SCHEDULE OF INVESTMENTS (continued)
Open Swap Contracts
June 30, 2019 (Unaudited)
|
Pay/Receive
|
Unrealized
|
||||||||||||||||||
|
Counter-
|
Termination
|
on Financing
|
Payment
|
Notional
|
Appreciation
|
||||||||||||||
|
party
|
Security
|
Date
|
Rate
|
Financing Rate
|
Frequency
|
Shares
|
Amount
|
(Depreciation)*
|
|||||||||||
|
JPM
|
Melrose
Industries plc
|
9/5/19
|
Pay
|
0.300% +3 Month U.S. LIBOR
|
Quarterly
|
166,701
|
$
|
449,187
|
$
|
(66,797
|
)
|
||||||||
|
BAML
|
Red Hat, Inc.
|
11/9/19
|
Pay
|
0.750% +1 Month U.S. LIBOR
|
Monthly
|
72,766
|
12,963,415
|
690,071
|
|||||||||||
|
JPM
|
Renault SA
|
4/3/20
|
Pay
|
0.400% +3 Month U.S. LIBOR
|
Quarterly
|
8,365
|
550,397
|
(25,089
|
)
|
||||||||||
|
BAML
|
Renault SA
|
5/28/20
|
Pay
|
0.350% +1 Month U.S. LIBOR
|
Monthly
|
3,000
|
179,398
|
9,003
|
|||||||||||
|
GS
|
Scout24 AG
|
5/6/20
|
Pay
|
0.500% +1 Month U.S. LIBOR
|
Monthly
|
32,087
|
1,619,702
|
83,501
|
|||||||||||
|
JPM
|
SLM Corporation,
|
||||||||||||||||||
|
4.110%, Series B
|
2/8/20
|
Pay
|
1.100% +3 Month U.S. LIBOR
|
Quarterly
|
35,769
|
2,378,639
|
(282,961
|
)
|
|||||||||||
|
BAML
|
Spark
Therapeutics, Inc.
|
5/24/20
|
Pay
|
0.750% +1 Month U.S. LIBOR
|
Monthly
|
14,638
|
1,615,011
|
(117,502
|
)
|
||||||||||
|
JPM
|
Uniper SE
|
2/12/20
|
Pay
|
0.400% +3 Month U.S. LIBOR
|
Quarterly
|
84,500
|
2,525,395
|
30,588
|
|||||||||||
|
BAML
|
Versum
Materials, Inc.
|
5/14/20
|
Pay
|
0.750% +1 Month U.S. LIBOR
|
Monthly
|
70,593
|
3,646,274
|
(7,636
|
)
|
||||||||||
|
BAML
|
Zayo Group LLC /
|
||||||||||||||||||
|
Zayo Capital, Inc.
|
5/13/20
|
Pay
|
0.750% +1 Month U.S. LIBOR
|
Monthly
|
180,768
|
5,950,776
|
(5,817
|
)
|
|||||||||||
|
SHORT TOTAL RETURN SWAP CONTRACTS
|
|||||||||||||||||||
|
JPM
|
Alibaba Group
|
||||||||||||||||||
|
Holding Ltd. –
ADR
|
11/1/19
|
Receive
|
(0.600)% +3 Month U.S. LIBOR
|
Quarterly
|
(47,107
|
)
|
(7,316,150
|
)
|
(660,738
|
)
|
|||||||||
|
BAML
|
Brookfield Property
|
||||||||||||||||||
|
Partners LP
|
3/29/20
|
Pay
|
(4.500)% +1 Month U.S. LIBOR
|
Monthly
|
(4,895
|
)
|
(101,327
|
)
|
8,617
|
||||||||||
|
JPM
|
Daimler AG
|
4/3/20
|
Receive
|
(0.400)% +3 Month U.S. LIBOR
|
Quarterly
|
(502
|
)
|
(31,276
|
)
|
3,373
|
|||||||||
|
BAML
|
Fiat Chrysler
|
||||||||||||||||||
|
Automobiles N.V.
|
5/28/20
|
Receive
|
(0.775)% +1 Month U.S. LIBOR
|
Monthly
|
(15,986
|
)
|
(211,653
|
)
|
(11,179
|
)
|
|||||||||
|
BAML
|
Fiserv, Inc.
|
5/7/20
|
Receive
|
(0.400)% +1 Month U.S. LIBOR
|
Monthly
|
(135,685
|
)
|
(11,606,495
|
)
|
(757,403
|
)
|
||||||||
|
JPM
|
Nissan Motor
|
||||||||||||||||||
|
Company Ltd.
|
4/3/20
|
Receive
|
(0.400)% +3 Month U.S. LIBOR
|
Quarterly
|
(56,329
|
)
|
(450,258
|
)
|
47,480
|
||||||||||
|
$
|
398,352
|
||||||||||||||||||
ADR – American Depositary Receipt
BAML – Bank of America Merrill Lynch & Co., Inc.
GS – Goldman, Sachs & Co.
JPM – JPMorgan Chase & Co., Inc.
LIBOR – London Interbank Offered Rate
plc – Public Limited Company
|
*
|
Based on the net swap value held at each counterparty, unrealized appreciation (depreciation) is a receivable (payable).
|
The accompanying notes are an integral part of these financial statements.
44
WCM Alternatives: Credit Event Fund
SCHEDULE OF INVESTMENTS (continued)
Open Swap Contracts
June 30, 2019 (Unaudited)
|
Pay/Receive
|
Unrealized
|
||||||||||||||||||
|
Counter-
|
Termination
|
on Financing
|
Payment
|
Notional
|
Appreciation
|
||||||||||||||
|
party
|
Security
|
Date
|
Rate
|
Financing Rate
|
Frequency
|
Shares
|
Amount
|
(Depreciation)*
|
|||||||||||
|
LONG TOTAL RETURN SWAP CONTRACTS
|
|||||||||||||||||||
|
JPM
|
Altaba, Inc.
|
4/5/20
|
Pay
|
0.800% + 3 Month U.S. LIBOR
|
Quarterly
|
2,369
|
$
|
175,222
|
$
|
(11,116
|
)
|
||||||||
|
JPM
|
Apollo
Tactical Income
|
||||||||||||||||||
|
Fund, Inc.
|
12/27/19
|
Pay
|
0.300% + 3 Month U.S. LIBOR
|
Quarterly
|
546
|
7,495
|
551
|
||||||||||||
|
JPM
|
BlackRock Debt
|
||||||||||||||||||
|
Strategies
Fund, Inc.
|
11/28/19
|
Pay
|
0.800% + 3 Month U.S. LIBOR
|
Quarterly
|
5,442
|
57,895
|
642
|
||||||||||||
|
JPM
|
BlackRock Floating
|
||||||||||||||||||
|
Rate Income
|
|||||||||||||||||||
|
Strategies
Fund, Inc.
|
8/30/19
|
Pay
|
0.462% + 3 Month U.S. LIBOR
|
Quarterly
|
4,417
|
59,362
|
(2,758
|
)
|
|||||||||||
|
JPM
|
Colony Capital, Inc.,
|
||||||||||||||||||
|
8.750%, Series E
|
6/29/19
|
Pay
|
0.826% + 3 Month U.S. LIBOR
|
Quarterly
|
6,970
|
174,902
|
(1,845
|
)
|
|||||||||||
|
JPM
|
Eaton Vance
Floating-Rate
|
||||||||||||||||||
|
Income Trust
|
11/28/19
|
Pay
|
0.800% + 3 Month U.S. LIBOR
|
Quarterly
|
4,124
|
55,764
|
(243
|
)
|
|||||||||||
|
JPM
|
Eaton Vance Senior
|
||||||||||||||||||
|
Floating-Rate
|
|||||||||||||||||||
|
Income Trust
|
8/30/19
|
Pay
|
1.000% + 3 Month U.S. LIBOR
|
Quarterly
|
2,841
|
40,086
|
(2,951
|
)
|
|||||||||||
|
JPM
|
First Trust
Senior Floating
|
||||||||||||||||||
|
Rate Income
Fund II
|
3/18/20
|
Pay
|
0.800% + 3 Month U.S. LIBOR
|
Quarterly
|
5,272
|
63,106
|
343
|
||||||||||||
|
JPM
|
Invesco Dynamic
Credit Opportunities |
||||||||||||||||||
| Fund |
8/30/19
|
Pay
|
0.802% + 3 Month U.S. LIBOR
|
Quarterly
|
8,430
|
93,834
|
296
|
||||||||||||
|
JPM
|
Invesco Municipal
|
||||||||||||||||||
|
Opportunity Trust
|
3/13/20
|
Pay
|
0.300% + 3 Month U.S. LIBOR
|
Quarterly
|
1,733
|
20,732
|
561
|
||||||||||||
|
JPM
|
Invesco Senior
|
||||||||||||||||||
|
Income Trust
|
8/7/19
|
Pay
|
1.000% + 3 Month U.S. LIBOR
|
Quarterly
|
27,652
|
118,576
|
722
|
||||||||||||
|
JPM
|
Invesco Value
Municipal
|
||||||||||||||||||
|
Income Trust
|
3/13/20
|
Pay
|
0.300% + 3 Month U.S. LIBOR
|
Quarterly
|
1,442
|
21,145
|
779
|
||||||||||||
|
JPM
|
Nuveen AMT-Free
|
||||||||||||||||||
|
Municipal Credit
|
|||||||||||||||||||
|
Income Fund
|
11/28/19
|
Pay
|
0.300% + 3 Month U.S. LIBOR
|
Quarterly
|
1,413
|
19,230
|
3,174
|
||||||||||||
The accompanying notes are an integral part of these financial statements.
45
WCM Alternatives: Credit Event Fund
SCHEDULE OF INVESTMENTS (continued)
Open Swap Contracts
June 30, 2019 (Unaudited)
|
Pay/Receive
|
Unrealized
|
||||||||||||||||||
|
Counter-
|
Termination
|
on Financing
|
Payment
|
Notional
|
Appreciation
|
||||||||||||||
|
party
|
Security
|
Date
|
Rate
|
Financing Rate
|
Frequency
|
Shares
|
Amount
|
(Depreciation)*
|
|||||||||||
|
JPM
|
Nuveen AMT-Free
|
||||||||||||||||||
|
Quality Municipal
|
|||||||||||||||||||
|
Income Fund
|
11/28/19
|
Pay
|
0.300% + 3 Month U.S. LIBOR
|
Quarterly
|
1,566
|
$
|
19,245
|
$
|
2,361
|
||||||||||
|
JPM
|
Nuveen California
Quality Municipal |
||||||||||||||||||
|
Income Fund
|
11/28/19
|
Pay
|
0.300% + 3 Month U.S. LIBOR
|
Quarterly
|
1,536
|
19,246
|
2,975
|
||||||||||||
|
JPM
|
Nuveen Credit
Strategies
|
||||||||||||||||||
|
Income Fund
|
11/28/19
|
Pay
|
0.800% + 3 Month U.S. LIBOR
|
Quarterly
|
8,620
|
66,627
|
1,560
|
||||||||||||
|
JPM
|
Nuveen Preferred
|
||||||||||||||||||
|
and Income 2022
|
|||||||||||||||||||
|
Term Fund
|
11/29/19
|
Pay
|
0.300% + 3 Month U.S. LIBOR
|
Quarterly
|
894
|
19,275
|
2,474
|
||||||||||||
|
JPM
|
SLM Corporation,
|
||||||||||||||||||
|
4.311%, Series B
|
2/8/20
|
Pay
|
1.100% + 3 Month U.S. LIBOR
|
Quarterly
|
2,007
|
133,465
|
(15,878
|
)
|
|||||||||||
|
JPM
|
Voya Prime
Rate Trust
|
8/1/19
|
Pay
|
1.000% + 3 Month U.S. LIBOR
|
Quarterly
|
24,016
|
117,482
|
(3,322
|
)
|
||||||||||
|
SHORT TOTAL RETURN SWAP CONTRACTS
|
|||||||||||||||||||
|
JPM
|
Alibaba Group
|
||||||||||||||||||
|
Holding Ltd. –
ADR
|
4/5/20
|
Receive
|
(0.600)% + 3 Month U.S. LIBOR
|
Quarterly
|
(590
|
)
|
(109,092
|
)
|
9,244
|
||||||||||
|
$
|
(12,431
|
)
|
|||||||||||||||||
ADR – American Depository Receipt
JPM – JPMorgan Chase & Co., Inc.
LIBOR – London Interbank Offered Rate
|
*
|
Based on the net swap value held at each counterparty, unrealized appreciation (depreciation) is a receivable (payable).
|
The accompanying notes are an integral part of these financial statements.
46
WCM Alternatives: Credit Event Fund
SCHEDULE OF INVESTMENTS (continued)
Reverse Repurchase Agreements
June 30, 2019 (Unaudited)
|
Counterparty
|
Rate
|
Trade Date
|
Maturity Date
|
Principal
|
Principal & Interest
|
|||||||||
|
JPM
|
3.263%
|
6/13/19
|
7/12/19
|
$
|
(178,000
|
)
|
$
|
(178,274
|
)
|
|||||
|
JPM
|
3.263%
|
6/13/19
|
7/12/19
|
(174,000
|
)
|
(174,268
|
)
|
|||||||
|
$
|
(352,000
|
)
|
$
|
(352,542
|
)
|
|||||||||
JPM – JPMorgan Chase & Co., Inc.
The weighted average daily balance of reverse repurchase agreements during the six months ended June 30, 2019 was $362,867, at a weighted average interest rate of 3.22%. Total market value of underlying
collateral (refer to the Schedule of Investments for positions transferred for the benefit of the counterparty as collateral) for open reverse repurchase agreements at June 30, 2019 was $472,376.
Securities Accounted for as Secured Borrowings
|
Remaining Contractual Maturity of the Agreements
|
||||||||||||||||||||
|
Overnight and
|
Greater than
|
|||||||||||||||||||
|
Continuous
|
Up to 30 Days
|
31-90 Days
|
90 Days
|
Total
|
||||||||||||||||
|
Reverse Repurchase Agreements
|
||||||||||||||||||||
|
Corporate Bonds
|
$
|
—
|
$
|
(352,000
|
)
|
$
|
—
|
$
|
—
|
$
|
(352,000
|
)
|
||||||||
|
Total Borrowings
|
$
|
—
|
$
|
(352,000
|
)
|
$
|
—
|
$
|
—
|
$
|
(352,000
|
)
|
||||||||
|
Gross amount of recognized liabilities
|
||||||||||||||||||||
|
for reverse repurchase agreements
|
$
|
(352,000
|
)
|
|||||||||||||||||
The accompanying notes are an integral part of these financial statements.
47
The Merger Fund and Westchester Capital Funds
STATEMENTS OF ASSETS AND LIABILITIES
June 30, 2019 (Unaudited)
|
WCM Alternatives:
|
WCM Alternatives:
|
|||||||||||
|
The Merger Fund
|
Event-Driven Fund
|
Credit Event Fund
|
||||||||||
|
ASSETS:
|
||||||||||||
|
Investments, at value (Cost
$2,896,666,245, $192,020,838,
|
||||||||||||
|
and $4,235,367, respectively)
|
$
|
3,018,409,722
|
$
|
198,037,468
|
$
|
4,360,094
|
||||||
|
Investment of cash collateral
|
||||||||||||
|
from securities loaned
|
||||||||||||
|
(Cost $61,258,584)
|
61,258,584
|
—
|
—
|
|||||||||
|
Cash
|
62,047
|
5,512
|
—
|
|||||||||
|
Deposits at brokers for
|
||||||||||||
|
securities sold short
|
1,148,957,101
|
52,048,801
|
41,555
|
|||||||||
|
Deposit at brokers for
|
||||||||||||
|
other investments
|
46,558,143
|
1,400,466
|
—
|
|||||||||
|
Receivable for swap contracts
|
163,484
|
489,598
|
—
|
|||||||||
|
Receivable for investments sold
|
31,300,860
|
2,292,689
|
—
|
|||||||||
|
Dividends and interest receivable
|
9,781,117
|
724,506
|
48,180
|
|||||||||
|
Receivable for fund shares issued
|
7,316,578
|
662,931
|
—
|
|||||||||
|
Receivable from securities
|
||||||||||||
|
lending income (Note 9)
|
6,405
|
—
|
—
|
|||||||||
|
Receivable from
|
||||||||||||
|
investment adviser
|
—
|
—
|
4,410
|
|||||||||
|
Prepaid expenses
|
||||||||||||
|
and other receivables
|
307,487
|
38,734
|
23,938
|
|||||||||
|
Total Assets
|
4,324,121,528
|
255,700,705
|
4,478,177
|
|||||||||
|
LIABILITIES:
|
||||||||||||
|
Securities sold short, at value
|
||||||||||||
|
(Proceeds of $1,014,781,312,
|
||||||||||||
|
$50,350,423, and
|
||||||||||||
|
$40,595, respectively)
|
1,134,281,819
|
52,030,974
|
41,555
|
|||||||||
|
Written option contracts,
|
||||||||||||
|
at value (Premiums received
$3,307,611, $2,142,506,
|
||||||||||||
|
and $—, respectively)
|
3,322,714
|
2,870,762
|
—
|
|||||||||
|
Payable for forward currency
|
||||||||||||
|
exchange contracts
|
575,030
|
49,493
|
—
|
|||||||||
|
Payable for swap contracts
|
70,814
|
91,246
|
12,431
|
|||||||||
|
Payable reverse
|
||||||||||||
|
repurchase agreements
|
—
|
—
|
352,000
|
|||||||||
|
Payable for collateral received
|
||||||||||||
|
on securities loaned (Note 9)
|
61,258,584
|
—
|
—
|
|||||||||
|
Payable for investments purchased
|
75,953,565
|
5,516,666
|
1,948
|
|||||||||
|
Payable for fund shares redeemed
|
3,457,576
|
52,318
|
—
|
|||||||||
|
Payable to the investment adviser
|
2,435,545
|
196,041
|
—
|
|||||||||
|
Dividends and interest payable
|
1,213,097
|
78,582
|
—
|
|||||||||
|
Distribution fees payable
|
250,812
|
3,057
|
9
|
|||||||||
|
Interest payable for reverse
|
||||||||||||
|
repurchase agreements
|
—
|
—
|
542
|
|||||||||
|
Accrued expenses
|
||||||||||||
|
and other liabilities
|
1,169,637
|
95,387
|
32,641
|
|||||||||
|
Total Liabilities
|
1,283,989,193
|
60,984,526
|
441,126
|
|||||||||
|
NET ASSETS
|
$
|
3,040,132,335
|
$
|
194,716,179
|
$
|
4,037,051
|
||||||
The accompanying notes are an integral part of these financial statements.
48
The Merger Fund and Westchester Capital Funds
STATEMENTS OF ASSETS AND LIABILITIES (continued)
June 30, 2019 (Unaudited)
|
WCM Alternatives:
|
WCM Alternatives:
|
|||||||||||
|
The Merger Fund
|
Event-Driven Fund
|
Credit Event Fund
|
||||||||||
|
NET ASSETS CONSISTS OF:
|
||||||||||||
|
Paid-in capital
|
$
|
2,991,400,092
|
$
|
186,302,609
|
$
|
3,864,729
|
||||||
|
Distributable gain
|
48,732,243
|
8,413,570
|
172,322
|
|||||||||
|
Total Net Assets
|
$
|
3,040,132,335
|
$
|
194,716,179
|
$
|
4,037,051
|
||||||
|
Investor Class
|
||||||||||||
|
Net assets
|
$
|
1,175,126,868
|
$
|
15,058,643
|
$
|
42,078
|
||||||
|
Shares outstanding
|
69,862,903
|
1,404,028
|
4,030
|
|||||||||
|
Net asset value and
|
||||||||||||
|
offering price per share*
|
$
|
16.82
|
$
|
10.73
|
$
|
10.44
|
||||||
|
Institutional Class
|
||||||||||||
|
Net assets
|
$
|
1,865,005,467
|
$
|
179,657,536
|
$
|
3,994,973
|
||||||
|
Shares outstanding
|
111,507,461
|
16,690,463
|
381,928
|
|||||||||
|
Net asset value and
|
||||||||||||
|
offering price per share*
|
$
|
16.73
|
$
|
10.76
|
$
|
10.46
|
||||||
|
*
|
The redemption price per share may vary based on the length of time a shareholder holds Fund shares.
|
The accompanying notes are an integral part of these financial statements.
49
The Merger Fund and Westchester Capital Funds
STATEMENTS OF OPERATIONS
For the Six Months Ended June 30, 2019 (Unaudited)
|
WCM Alternatives:
|
WCM Alternatives:
|
|||||||||||
|
The Merger Fund
|
Event-Driven Fund
|
Credit Event Fund
|
||||||||||
|
INVESTMENT INCOME:
|
||||||||||||
|
Interest
|
$
|
19,835,520
|
$
|
1,662,146
|
$
|
88,969
|
||||||
|
Dividend income on long positions
|
||||||||||||
|
(net of foreign withholding
|
||||||||||||
|
taxes of $48,723, $3,761,
|
||||||||||||
|
and $—, respectively)
|
13,446,742
|
759,253
|
2,388
|
|||||||||
|
Securities lending income, net
|
||||||||||||
|
(Note 9)
|
10,073
|
—
|
—
|
|||||||||
|
Total investment income
|
33,292,335
|
2,421,399
|
91,357
|
|||||||||
|
EXPENSES:
|
||||||||||||
|
Investment advisory fees
|
14,821,573
|
1,071,240
|
19,353
|
|||||||||
|
Distribution fees (Investor Class)
|
1,589,697
|
16,536
|
50
|
|||||||||
|
Sub transfer agent fees
|
||||||||||||
|
(Investor Class)
|
778,375
|
7,533
|
24
|
|||||||||
|
Sub transfer agent fees
|
||||||||||||
|
(Institutional Class)
|
689,822
|
79,870
|
505
|
|||||||||
|
Administration fees
|
489,394
|
32,006
|
6,785
|
|||||||||
|
Professional fees
|
409,014
|
68,643
|
31,809
|
|||||||||
|
Reports to shareholders
|
234,174
|
15,319
|
574
|
|||||||||
|
Transfer agent and shareholder
|
||||||||||||
|
servicing agent fees
|
219,986
|
14,418
|
2,514
|
|||||||||
|
Fund accounting expenses
|
144,528
|
27,542
|
2,441
|
|||||||||
|
Custody fees
|
132,433
|
7,920
|
125
|
|||||||||
|
Federal and state
|
||||||||||||
|
registration fees
|
117,339
|
28,697
|
34,337
|
|||||||||
|
Trustees’ fees and expenses
|
113,732
|
15,580
|
7,455
|
|||||||||
|
Compliance fees
|
92,699
|
5,056
|
58
|
|||||||||
|
Miscellaneous expenses
|
69,803
|
8,294
|
1,307
|
|||||||||
|
Borrowing expenses on
|
||||||||||||
|
securities sold short
|
2,404,549
|
129,415
|
—
|
|||||||||
|
Dividends on securities
|
||||||||||||
|
sold short
|
6,538,062
|
412,166
|
—
|
|||||||||
|
Interest on reverse
|
||||||||||||
|
repurchase agreements
|
—
|
—
|
5,877
|
|||||||||
|
Total expenses
|
||||||||||||
|
before expense
|
||||||||||||
|
waiver/recoupment/
|
||||||||||||
|
reimbursement
|
||||||||||||
|
by adviser
|
28,845,180
|
1,940,235
|
113,214
|
|||||||||
|
Expense waived/recouped/
|
||||||||||||
|
reimbursed by adviser (Note 3)
|
(343,263
|
)
|
5,319
|
(75,547
|
)
|
|||||||
|
Net expenses
|
28,501,917
|
1,945,554
|
37,667
|
|||||||||
|
NET INVESTMENT INCOME
|
$
|
4,790,418
|
$
|
475,845
|
$
|
53,690
|
||||||
The accompanying notes are an integral part of these financial statements.
50
The Merger Fund and Westchester Capital Funds
STATEMENTS OF OPERATIONS (continued)
For the Six Months Ended June 30, 2019 (Unaudited)
|
WCM Alternatives:
|
WCM Alternatives:
|
|||||||||||
|
The Merger Fund
|
Event-Driven Fund
|
Credit Event Fund
|
||||||||||
|
REALIZED AND CHANGE IN
|
||||||||||||
|
UNREALIZED GAIN (LOSS)
|
||||||||||||
|
ON INVESTMENTS:
|
||||||||||||
|
Realized gain (loss) on:
|
||||||||||||
|
Investments
|
$
|
60,200,145
|
$
|
3,140,881
|
$
|
43,666
|
||||||
|
Securities sold short
|
(38,122,346
|
)
|
(1,412,764
|
)
|
—
|
|||||||
|
Written option contracts
|
||||||||||||
|
expired or closed
|
6,982,059
|
(172,182
|
)
|
—
|
||||||||
|
Forward currency
|
||||||||||||
|
exchange contracts
|
2,671,854
|
222,446
|
—
|
|||||||||
|
Swap contracts
|
10,717,598
|
3,640,779
|
3,261
|
|||||||||
|
Foreign currency transactions
|
1,788
|
(250
|
)
|
—
|
||||||||
|
Net realized gain
|
42,451,098
|
5,418,910
|
46,927
|
|||||||||
|
Change in unrealized
|
||||||||||||
|
appreciation (depreciation) on:
|
||||||||||||
|
Investments
|
128,869,709
|
9,643,400
|
169,725
|
|||||||||
|
Securities sold short
|
(88,776,647
|
)
|
(3,006,069
|
)
|
(960
|
)
|
||||||
|
Written option contracts
|
(2,166,684
|
)
|
(1,252,820
|
)
|
—
|
|||||||
|
Forward currency
|
||||||||||||
|
exchange contracts
|
(1,439,515
|
)
|
(164,985
|
)
|
—
|
|||||||
|
Swap contracts
|
(9,530,707
|
)
|
(1,255,632
|
)
|
82,627
|
|||||||
|
Net unrealized appreciation
|
26,956,156
|
3,963,894
|
251,392
|
|||||||||
|
NET REALIZED AND CHANGE IN
|
||||||||||||
|
UNREALIZED GAIN
|
||||||||||||
|
ON INVESTMENTS
|
69,407,254
|
9,382,804
|
298,319
|
|||||||||
|
NET INCREASE IN NET
|
||||||||||||
|
ASSETS RESULTING
|
||||||||||||
|
FROM OPERATIONS
|
$
|
74,197,672
|
$
|
9,858,649
|
$
|
352,009
|
||||||
The accompanying notes are an integral part of these financial statements.
51
The Merger Fund
STATEMENTS OF CHANGES IN NET ASSETS
|
Six Months Ended
|
Year Ended
|
|||||||
|
June 30, 2019
|
December 31, 2018
|
|||||||
|
(Unaudited)
|
||||||||
|
Net investment income
|
$
|
4,790,418
|
$
|
30,448,822
|
||||
|
Net realized gain on investments, securities
|
||||||||
|
sold short, written option contracts
|
||||||||
|
expired or closed, forward currency
|
||||||||
|
exchange contracts, swap contracts,
|
||||||||
|
and foreign currency transactions
|
42,451,098
|
175,063,866
|
||||||
|
Net change in unrealized appreciation
|
||||||||
|
(depreciation) on investments, securities sold
|
||||||||
|
short, written option contracts, forward
|
||||||||
|
currency exchange contracts, swap contracts,
|
||||||||
|
and foreign currency translation
|
26,956,156
|
(22,543,614
|
)
|
|||||
|
Net increase in net assets
|
||||||||
|
resulting from operations
|
74,197,672
|
182,969,074
|
||||||
|
Investor Class – Distributions to
|
||||||||
|
shareholders from: (Note 5)
|
||||||||
|
Total dividends and distributions
|
||||||||
|
to shareholders – Investor Class
|
—
|
(55,076,117
|
)
|
|||||
|
Institutional Class – Distributions to
|
||||||||
|
shareholders from: (Note 5)
|
||||||||
|
Total dividends and distributions
|
||||||||
|
to shareholders – Institutional Class
|
—
|
(70,480,790
|
)
|
|||||
|
Net increase in net assets from
|
||||||||
|
capital share transactions (Note 4)
|
204,583,557
|
389,567,339
|
||||||
|
Net increase in net assets
|
278,781,229
|
446,979,506
|
||||||
|
NET ASSETS:
|
||||||||
|
Beginning of period
|
2,761,351,106
|
2,314,371,600
|
||||||
|
End of period
|
$
|
3,040,132,335
|
$
|
2,761,351,106
|
||||
The accompanying notes are an integral part of these financial statements.
52
WCM Alternatives: Event-Driven Fund
STATEMENTS OF CHANGES IN NET ASSETS
|
Six Months Ended
|
Year Ended
|
|||||||
|
June 30, 2019
|
December 31, 2018
|
|||||||
|
(Unaudited)
|
||||||||
|
Net investment income
|
$
|
475,845
|
$
|
1,614,171
|
||||
|
Net realized gain on investments, securities
|
||||||||
|
sold short, written option contracts
|
||||||||
|
expired or closed, forward currency
|
||||||||
|
exchange contracts, swap contracts,
|
||||||||
|
and foreign currency transactions
|
5,418,910
|
904,262
|
||||||
|
Net change in unrealized appreciation on
|
||||||||
|
investments, securities sold short, written
|
||||||||
|
option contracts, forward currency
|
||||||||
|
exchange contracts, swap contracts,
|
||||||||
|
and foreign currency translation
|
3,963,894
|
3,487,639
|
||||||
|
Net increase in net assets
|
||||||||
|
resulting from operations
|
9,858,649
|
6,006,072
|
||||||
|
Investor Class – Distributions to
|
||||||||
|
shareholders from: (Note 5)
|
||||||||
|
Total dividends and distributions
|
||||||||
|
to shareholders – Investor Class
|
—
|
(519,098
|
)
|
|||||
|
Institutional Class – Distributions to
|
||||||||
|
shareholders from: (Note 5)
|
||||||||
|
Total dividends and distributions
|
||||||||
|
to shareholders – Institutional Class
|
—
|
(7,102,230
|
)
|
|||||
|
Net increase in net assets from
|
||||||||
|
capital share transactions (Note 4)
|
39,623,759
|
47,260,037
|
||||||
|
Net increase in net assets
|
49,482,408
|
45,644,781
|
||||||
|
NET ASSETS:
|
||||||||
|
Beginning of period
|
145,233,771
|
99,588,990
|
||||||
|
End of period
|
$
|
194,716,179
|
$
|
145,233,771
|
||||
The accompanying notes are an integral part of these financial statements.
53
WCM Alternatives: Credit Event Fund
STATEMENTS OF CHANGES IN NET ASSETS
|
Six Months Ended
|
Year Ended
|
|||||||
|
June 30, 2019
|
December 31, 2018
|
|||||||
|
(Unaudited)
|
||||||||
|
Net investment income
|
$
|
53,690
|
$
|
55,272
|
||||
|
Net realized gain (loss) on
|
||||||||
|
investments and swap contracts
|
46,927
|
(33,891
|
)
|
|||||
|
Net change in unrealized appreciation
|
||||||||
|
(depreciation) on investments, securities
|
||||||||
|
sold short, and swap contracts
|
251,392
|
(140,056
|
)
|
|||||
|
Net increase (decrease) in net assets
|
||||||||
|
resulting from operations
|
352,009
|
(118,675
|
)
|
|||||
|
Investor Class – Distributions to
|
||||||||
|
shareholders from: (Note 5)
|
||||||||
|
Total dividends and distributions
|
||||||||
|
to shareholders – Investor Class
|
—
|
(547
|
)
|
|||||
|
Institutional Class – Distributions to
|
||||||||
|
shareholders from: (Note 5)
|
||||||||
|
Total dividends and distributions
|
||||||||
|
to shareholders – Institutional Class
|
—
|
(60,465
|
)
|
|||||
|
Net increase (decrease) in net assets from
|
||||||||
|
capital share transactions (Note 4)
|
(97,224
|
)
|
3,961,953
|
*
|
||||
|
Net increase in net assets
|
254,785
|
3,782,266
|
||||||
|
NET ASSETS:
|
||||||||
|
Beginning of period
|
3,782,266
|
—
|
*
|
|||||
|
End of period
|
$
|
4,037,051
|
$
|
3,782,266
|
||||
|
*
|
The Fund received a seed investment of $2,710,000 on December 29, 2017 in a non-interest bearing account. The Fund did not conduct investment activity nor incur operating expenses until January 2, 2018.
|
The accompanying notes are an integral part of these financial statements.
54
(This Page Intentionally Left Blank.)
55
The Merger Fund
FINANCIAL HIGHLIGHTS
Selected per share data is based on a share of beneficial interest outstanding throughout each period/year.
Institutional Class
|
Six Months
|
||||||||||||||||||||||||
|
Ended
|
||||||||||||||||||||||||
|
June 30,
|
Year Ended December 31,
|
|||||||||||||||||||||||
|
2019
|
2018
|
2017
|
2016
|
2015
|
2014
|
|||||||||||||||||||
|
(Unaudited)
|
||||||||||||||||||||||||
|
Per Share Data:
|
||||||||||||||||||||||||
|
Net asset value,
|
||||||||||||||||||||||||
|
beginning of period
|
$
|
16.30
|
$
|
15.83
|
$
|
15.56
|
$
|
15.25
|
$
|
15.58
|
$
|
15.97
|
||||||||||||
|
Income from
|
||||||||||||||||||||||||
|
investment operations:
|
||||||||||||||||||||||||
|
Net investment
|
||||||||||||||||||||||||
|
income (loss)(1)(2)
|
0.04
|
0.23
|
0.10
|
(0.04
|
)
|
(0.03
|
)
|
0.37
|
||||||||||||||||
|
Net realized and
|
||||||||||||||||||||||||
|
unrealized gain (loss)
|
||||||||||||||||||||||||
|
on investments
|
0.39
|
1.03
|
0.33
|
0.49
|
(0.05
|
)
|
(0.10
|
)
|
||||||||||||||||
|
Total from
|
||||||||||||||||||||||||
|
investment operations
|
0.43
|
1.26
|
0.43
|
0.45
|
(0.08
|
)
|
0.27
|
|||||||||||||||||
|
Less distributions:
|
||||||||||||||||||||||||
|
From net
|
||||||||||||||||||||||||
|
investment income
|
—
|
(0.23
|
)
|
(0.16
|
)
|
(0.14
|
)
|
(0.18
|
)
|
(0.45
|
)
|
|||||||||||||
|
From net realized gains
|
—
|
(0.56
|
)
|
—
|
—
|
(0.07
|
)
|
(0.21
|
)
|
|||||||||||||||
|
Total dividends
|
||||||||||||||||||||||||
|
and distributions
|
—
|
(0.79
|
)
|
(0.16
|
)
|
(0.14
|
)
|
(0.25
|
)
|
(0.66
|
)
|
|||||||||||||
|
Net Asset Value,
|
||||||||||||||||||||||||
|
end of period
|
$
|
16.73
|
$
|
16.30
|
$
|
15.83
|
$
|
15.56
|
$
|
15.25
|
$
|
15.58
|
||||||||||||
|
Total Return
|
2.58
|
%(3)
|
7.98
|
%
|
2.74
|
%
|
2.94
|
%
|
(0.52
|
)%
|
1.63
|
%
|
||||||||||||
The accompanying notes are an integral part of these financial statements.
56
The Merger Fund
FINANCIAL HIGHLIGHTS (continued)
Institutional Class
|
Six Months
|
||||||||||||||||||||||||
|
Ended
|
||||||||||||||||||||||||
|
June 30,
|
Year Ended December 31,
|
|||||||||||||||||||||||
|
2019
|
2018
|
2017
|
2016
|
2015
|
2014
|
|||||||||||||||||||
|
(Unaudited)
|
||||||||||||||||||||||||
|
Supplemental data and ratios:
|
||||||||||||||||||||||||
|
Net assets, end
|
||||||||||||||||||||||||
|
of period (000’s)
|
$
|
1,865,005
|
$
|
1,496,116
|
$
|
1,152,718
|
$
|
1,377,041
|
$
|
1,247,332
|
$
|
1,332,078
|
||||||||||||
|
Ratio of gross expenses
|
||||||||||||||||||||||||
|
to average net assets:
|
||||||||||||||||||||||||
|
Before expense
|
||||||||||||||||||||||||
|
reimbursement
|
1.82
|
%(4)
|
1.64
|
%
|
1.55
|
%
|
1.70
|
%
|
1.54
|
%
|
1.44
|
%
|
||||||||||||
|
After expense
|
||||||||||||||||||||||||
|
reimbursement
|
1.80
|
%(4)
|
1.61
|
%
|
1.48
|
%
|
1.59
|
%
|
1.41
|
%
|
1.28
|
%
|
||||||||||||
|
Ratio of dividends and interest
|
||||||||||||||||||||||||
|
on short positions and
|
||||||||||||||||||||||||
|
borrowing expense on
|
||||||||||||||||||||||||
|
securities sold short to
|
||||||||||||||||||||||||
|
average net assets
|
0.60
|
%(4)
|
0.41
|
%
|
0.37
|
%
|
0.52
|
%
|
0.40
|
%
|
0.29
|
%
|
||||||||||||
|
Ratio of operating expense
|
||||||||||||||||||||||||
|
to average net assets
|
||||||||||||||||||||||||
|
excluding dividends and
|
||||||||||||||||||||||||
|
interest on short positions
|
||||||||||||||||||||||||
|
and borrowing expense on
|
||||||||||||||||||||||||
|
securities sold short
|
1.20
|
%(4)
|
1.20
|
%
|
1.11
|
%
|
1.07
|
%
|
1.01
|
%
|
0.99
|
%
|
||||||||||||
|
Ratio of net investment income
|
||||||||||||||||||||||||
|
(loss) to average net assets
|
0.45
|
%(4)
|
1.38
|
%
|
0.66
|
%
|
(0.27
|
)%
|
(0.21
|
)%
|
2.30
|
%
|
||||||||||||
|
Portfolio turnover rate(5)
|
69
|
%(3)
|
155
|
%
|
166
|
%
|
182
|
%
|
157
|
%
|
137
|
%
|
||||||||||||
|
(1)
|
Net investment income before dividends and interest on short positions and borrowing expense on securities on securities sold short for the six months ended June 30, 2019 and the years ended December 31, 2018, 2017,
2016, 2015 and 2014 was $0.09, $0.29, $0.16 $0.04, $0.03, and $0.42, respectively.
|
|
(2)
|
Net investment income (loss) per share has been calculated based on average shares outstanding during the period.
|
|
(3)
|
Not annualized.
|
|
(4)
|
Annualized.
|
|
(5)
|
The numerator for the portfolio turnover rate includes the lesser of purchases or sales (excluding short-term investments, short-term options, forward currency contracts, swap contracts and short positions). The
denominator includes the average long positions throughout the period.
|
The accompanying notes are an integral part of these financial statements.
57
The Merger Fund
FINANCIAL HIGHLIGHTS
Selected per share data is based on a share of beneficial interest outstanding throughout each period/year.
Investor Class
|
Six Months
|
||||||||||||||||||||||||
|
Ended
|
||||||||||||||||||||||||
|
June 30,
|
Year Ended December 31,
|
|||||||||||||||||||||||
|
2019
|
2018
|
2017
|
2016
|
2015
|
2014
|
|||||||||||||||||||
|
(Unaudited)
|
||||||||||||||||||||||||
|
Per Share Data:
|
||||||||||||||||||||||||
|
Net asset value,
|
||||||||||||||||||||||||
|
beginning of period
|
$
|
16.42
|
$
|
15.94
|
$
|
15.66
|
$
|
15.31
|
$
|
15.63
|
$
|
16.01
|
||||||||||||
|
Income from
|
||||||||||||||||||||||||
|
investment operations:
|
||||||||||||||||||||||||
|
Net investment
|
||||||||||||||||||||||||
|
income (loss)(1)(2)
|
0.01
|
0.18
|
0.05
|
(0.09
|
)
|
(0.08
|
)
|
0.33
|
||||||||||||||||
|
Net realized and
|
||||||||||||||||||||||||
|
unrealized gain (loss)
|
||||||||||||||||||||||||
|
on investments
|
0.39
|
1.05
|
0.32
|
0.49
|
(0.05
|
)
|
(0.10
|
)
|
||||||||||||||||
|
Total from
|
||||||||||||||||||||||||
|
investment operations
|
0.40
|
1.23
|
0.37
|
0.40
|
(0.13
|
)
|
0.23
|
|||||||||||||||||
|
Less distributions:
|
||||||||||||||||||||||||
|
From net
|
||||||||||||||||||||||||
|
investment income
|
—
|
(0.19
|
)
|
(0.09
|
)
|
(0.05
|
)
|
(0.12
|
)
|
(0.40
|
)
|
|||||||||||||
|
From net realized gains
|
—
|
(0.56
|
)
|
—
|
—
|
(0.07
|
)
|
(0.21
|
)
|
|||||||||||||||
|
Total dividends
|
||||||||||||||||||||||||
|
and distributions
|
—
|
(0.75
|
)
|
(0.09
|
)
|
(0.05
|
)
|
(0.19
|
)
|
(0.61
|
)
|
|||||||||||||
|
Net Asset Value,
|
||||||||||||||||||||||||
|
end of period
|
$
|
16.82
|
$
|
16.42
|
$
|
15.94
|
$
|
15.66
|
$
|
15.31
|
$
|
15.63
|
||||||||||||
|
Total Return
|
2.44
|
%(3)
|
7.68
|
%
|
2.39
|
%
|
2.61
|
%
|
(0.82
|
)%
|
1.43
|
%
|
||||||||||||
The accompanying notes are an integral part of these financial statements.
58
The Merger Fund
FINANCIAL HIGHLIGHTS (continued)
Investor Class
|
Six Months
|
||||||||||||||||||||||||
|
Ended
|
||||||||||||||||||||||||
|
June 30,
|
Year Ended December 31,
|
|||||||||||||||||||||||
|
2019
|
2018
|
2017
|
2016
|
2015
|
2014
|
|||||||||||||||||||
|
(Unaudited)
|
||||||||||||||||||||||||
|
Supplemental data and ratios:
|
||||||||||||||||||||||||
|
Net assets, end
|
||||||||||||||||||||||||
|
of period (in millions)
|
$
|
1,175
|
$
|
1,265
|
$
|
1,162
|
$
|
1,540
|
$
|
3,509
|
$
|
4,069
|
||||||||||||
|
Ratio of gross expenses
|
||||||||||||||||||||||||
|
to average net assets:
|
||||||||||||||||||||||||
|
Before expense waiver
|
2.11
|
%(4)
|
1.94
|
%
|
1.87
|
%
|
2.03
|
%
|
1.87
|
%
|
1.68
|
%
|
||||||||||||
|
After expense waiver
|
2.09
|
%(4)
|
1.91
|
%
|
1.80
|
%
|
1.92
|
%
|
1.74
|
%
|
1.52
|
%
|
||||||||||||
|
Ratio of dividends and interest
|
||||||||||||||||||||||||
|
on short positions and
|
||||||||||||||||||||||||
|
borrowing expense on
|
||||||||||||||||||||||||
|
securities sold short to
|
||||||||||||||||||||||||
|
average net assets
|
0.60
|
%(4)
|
0.41
|
%
|
0.37
|
%
|
0.52
|
%
|
0.40
|
%
|
0.29
|
%
|
||||||||||||
|
Ratio of operating expense
|
||||||||||||||||||||||||
|
to average net assets
|
||||||||||||||||||||||||
|
excluding dividends and
|
||||||||||||||||||||||||
|
interest on short positions
|
||||||||||||||||||||||||
|
and borrowing expense on
|
||||||||||||||||||||||||
|
securities sold short
|
1.49
|
%(4)
|
1.50
|
%
|
1.43
|
%
|
1.40
|
%
|
1.34
|
%
|
1.23
|
%
|
||||||||||||
|
Ratio of net investment income
|
||||||||||||||||||||||||
|
(loss) to average net assets
|
0.16
|
%(4)
|
1.08
|
%
|
0.34
|
%
|
(0.60
|
)%
|
(0.53
|
)%
|
2.06
|
%
|
||||||||||||
|
Portfolio turnover rate(5)
|
69
|
%(3)
|
155
|
%
|
166
|
%
|
182
|
%
|
157
|
%
|
137
|
%
|
||||||||||||
|
(1)
|
Net investment income (loss) before dividends and interest on short positions and borrowing expense on securities on securities sold short for the six months ended June 30, 2019 and the years ended December 31,
2018, 2017, 2016, 2015 and 2014 was $0.06, $0.25, $0.11, $(0.01), $(0.02), and $0.38, respectively.
|
|
(2)
|
Net investment income (loss) per share has been calculated based on average shares outstanding during the period.
|
|
(3)
|
Not annualized.
|
|
(4)
|
Annualized.
|
|
(5)
|
The numerator for the portfolio turnover rate includes the lesser of purchases or sales (excluding short-term investments, short-term options, forward currency contracts, swap contracts and short positions). The
denominator includes the average long positions throughout the period.
|
The accompanying notes are an integral part of these financial statements.
59
WCM Alternatives: Event-Driven Fund
FINANCIAL HIGHLIGHTS
Selected per share data is based on a share of beneficial interest outstanding throughout each period/year.
Institutional Class
|
For the
|
||||||||||||||||||||||||
|
Period from
|
||||||||||||||||||||||||
|
January 2,
|
||||||||||||||||||||||||
|
Six Months
|
2014^
|
|||||||||||||||||||||||
|
Ended
|
through
|
|||||||||||||||||||||||
|
June 30,
|
Year Ended December 31,
|
December 31,
|
||||||||||||||||||||||
|
2019
|
2018
|
2017
|
2016
|
2015
|
2014
|
|||||||||||||||||||
|
(Unaudited)
|
||||||||||||||||||||||||
|
Per Share Data:
|
||||||||||||||||||||||||
|
Net asset value,
|
||||||||||||||||||||||||
|
beginning
|
||||||||||||||||||||||||
|
of period
|
$
|
10.14
|
$
|
10.17
|
$
|
9.81
|
$
|
9.62
|
$
|
10.14
|
$
|
10.00
|
||||||||||||
|
Income from
|
||||||||||||||||||||||||
|
investment
|
||||||||||||||||||||||||
|
operations:
|
||||||||||||||||||||||||
|
Net investment
|
||||||||||||||||||||||||
|
income
|
||||||||||||||||||||||||
|
(loss)(1)(2)
|
0.03
|
0.14
|
0.00
|
(6)
|
(0.04
|
)
|
0.01
|
0.05
|
||||||||||||||||
|
Net realized and
|
||||||||||||||||||||||||
|
unrealized gain
|
||||||||||||||||||||||||
|
(loss) on
|
||||||||||||||||||||||||
|
investments
|
0.59
|
0.39
|
0.46
|
0.31
|
(0.22
|
)
|
0.34
|
|||||||||||||||||
|
Total from
|
||||||||||||||||||||||||
|
investment
|
||||||||||||||||||||||||
|
operations
|
0.62
|
0.53
|
0.46
|
0.27
|
(0.21
|
)
|
0.39
|
|||||||||||||||||
|
Less distributions:
|
||||||||||||||||||||||||
|
From net
|
||||||||||||||||||||||||
|
investment
|
||||||||||||||||||||||||
|
income
|
—
|
(0.43
|
)
|
—
|
(0.08
|
)
|
(0.09
|
)
|
—
|
|||||||||||||||
|
From net
|
||||||||||||||||||||||||
|
realized gains
|
—
|
(0.13
|
)
|
(0.10
|
)
|
—
|
(0.22
|
)
|
(0.25
|
)
|
||||||||||||||
|
Total dividends
|
||||||||||||||||||||||||
|
and
|
||||||||||||||||||||||||
|
distributions
|
—
|
(0.56
|
)
|
(0.10
|
)
|
(0.08
|
)
|
(0.31
|
)
|
(0.25
|
)
|
|||||||||||||
|
Net Asset Value,
|
||||||||||||||||||||||||
|
end of period
|
$
|
10.76
|
$
|
10.14
|
$
|
10.17
|
$
|
9.81
|
$
|
9.62
|
$
|
10.14
|
||||||||||||
|
Total Return
|
6.11
|
%(3)
|
5.27
|
%
|
4.72
|
%
|
2.86
|
%
|
(2.08
|
)%
|
3.87
|
%(3)
|
||||||||||||
The accompanying notes are an integral part of these financial statements.
60
WCM Alternatives: Event-Driven Fund
FINANCIAL HIGHLIGHTS (continued)
Institutional Class
|
For the
|
||||||||||||||||||||||||
|
Period from
|
||||||||||||||||||||||||
|
January 2,
|
||||||||||||||||||||||||
|
Six Months
|
2014^
|
|||||||||||||||||||||||
|
Ended
|
through
|
|||||||||||||||||||||||
|
June 30,
|
Year Ended December 31,
|
December 31,
|
||||||||||||||||||||||
|
2019
|
2018
|
2017
|
2016
|
2015
|
2014
|
|||||||||||||||||||
|
(Unaudited)
|
||||||||||||||||||||||||
|
Supplemental data
|
||||||||||||||||||||||||
|
and ratios:
|
||||||||||||||||||||||||
|
Net assets, end
|
||||||||||||||||||||||||
|
of period (000’s)
|
$
|
179,658
|
$
|
134,923
|
$
|
94,031
|
$
|
112,947
|
$
|
96,489
|
$
|
12,085
|
||||||||||||
|
Ratio of gross
|
||||||||||||||||||||||||
|
expenses to
|
||||||||||||||||||||||||
|
average net assets:
|
||||||||||||||||||||||||
|
Before expense
|
||||||||||||||||||||||||
|
reimbursement/
|
||||||||||||||||||||||||
|
recoupment
|
2.24
|
%(4)
|
2.19
|
%
|
2.20
|
%
|
2.37
|
%
|
2.23
|
%
|
7.95
|
%(4)
|
||||||||||||
|
After expense
|
||||||||||||||||||||||||
|
reimbursement/
|
||||||||||||||||||||||||
|
recoupment
|
2.25
|
%(4)
|
2.20
|
%
|
2.24
|
%
|
2.36
|
%
|
2.09
|
%
|
2.39
|
%(4)
|
||||||||||||
|
Ratio of dividends
|
||||||||||||||||||||||||
|
and interest on
|
||||||||||||||||||||||||
|
short positions and
|
||||||||||||||||||||||||
|
borrowing expense
|
||||||||||||||||||||||||
|
on securities sold
|
||||||||||||||||||||||||
|
short to average
|
||||||||||||||||||||||||
|
net assets
|
0.63
|
%(4)
|
0.46
|
%
|
0.50
|
%
|
0.62
|
%
|
0.35
|
%
|
0.65
|
%(4)
|
||||||||||||
|
Ratio of operating
|
||||||||||||||||||||||||
|
expense to average
|
||||||||||||||||||||||||
|
net assets
|
||||||||||||||||||||||||
|
excluding dividends
|
||||||||||||||||||||||||
|
and interest on
|
||||||||||||||||||||||||
|
short positions
|
||||||||||||||||||||||||
|
and borrowing
|
||||||||||||||||||||||||
|
expense on
|
||||||||||||||||||||||||
|
securities sold
|
||||||||||||||||||||||||
|
short (after expense
|
||||||||||||||||||||||||
|
reimbursement/
|
||||||||||||||||||||||||
|
recoupment)
|
1.62
|
%(4)
|
1.74
|
%
|
1.74
|
%
|
1.74
|
%
|
1.74
|
%
|
1.74
|
%(4)
|
||||||||||||
|
Ratio of net
|
||||||||||||||||||||||||
|
investment income
|
||||||||||||||||||||||||
|
(loss) to average
|
||||||||||||||||||||||||
|
net assets
|
0.57
|
%(4)
|
1.34
|
%
|
(0.02
|
)%
|
(0.46
|
)%
|
0.05
|
%
|
0.52
|
%(4)
|
||||||||||||
|
Portfolio
|
||||||||||||||||||||||||
|
turnover rate(5)
|
99
|
%(3)
|
230
|
%
|
283
|
%
|
217
|
%
|
199
|
%
|
212
|
%(3)
|
||||||||||||
The accompanying notes are an integral part of these financial statements.
61
WCM Alternatives: Event-Driven Fund
FINANCIAL HIGHLIGHTS (continued)
Institutional Class
|
(1)
|
Net investment income before dividends and interest on short positions and borrowing expense on securities on securities sold short for the six months ended June 30, 2019 and the years ended December 31, 2018, 2017,
2016, 2015 and 2014 was $0.06, $0.19, $0.05, $0.02, $0.04, and $0.12, respectively.
|
|
(2)
|
Net investment income (loss) per share has been calculated based on average shares outstanding during the period.
|
|
(3)
|
Not annualized.
|
|
(4)
|
Annualized.
|
|
(5)
|
The numerator for the portfolio turnover rate includes the lesser of purchases or sales (excluding short-term investments, short-term options, forward currency contracts, swap contracts and short positions). The
denominator includes the average long positions throughout the period.
|
|
(6)
|
Amount calculated is less than $(0.005).
|
|
^
|
Commencement of operations.
|
The accompanying notes are an integral part of these financial statements.
62
WCM Alternatives: Event-Driven Fund
FINANCIAL HIGHLIGHTS
Selected per share data is based on a share of beneficial interest outstanding throughout each period/year.
Investor Class
|
For the
|
||||||||||||
|
Period from
|
||||||||||||
|
March 22, 2017^
|
||||||||||||
|
Six Months
|
Year Ended
|
through
|
||||||||||
|
Ended
|
December 31,
|
December 31,
|
||||||||||
|
June 30, 2019
|
2018
|
2017
|
||||||||||
|
(Unaudited)
|
||||||||||||
|
Per Share Data:
|
||||||||||||
|
Net asset value, beginning of period
|
$
|
10.12
|
$
|
10.16
|
$
|
9.89
|
||||||
|
Income from investment operations:
|
||||||||||||
|
Net investment income (loss)(1)(2)
|
0.02
|
0.11
|
(0.01
|
)
|
||||||||
|
Net realized and unrealized gain on investments
|
0.59
|
0.39
|
0.38
|
|||||||||
|
Total from investment operations
|
0.61
|
0.50
|
0.37
|
|||||||||
|
Less distributions:
|
||||||||||||
|
From net investment income
|
—
|
(0.41
|
)
|
—
|
||||||||
|
From net realized gains
|
—
|
(0.13
|
)
|
(0.10
|
)
|
|||||||
|
Total dividends and distributions
|
—
|
(0.54
|
)
|
(0.10
|
)
|
|||||||
|
Net Asset Value, end of period
|
$
|
10.73
|
$
|
10.12
|
$
|
10.16
|
||||||
|
Total Return
|
5.93
|
%(3)
|
4.95
|
%
|
3.77
|
%(3)
|
||||||
|
Supplemental data and ratios:
|
||||||||||||
|
Net assets, end of period (in 000’s)
|
$
|
15,059
|
$
|
10,311
|
$
|
5,558
|
||||||
|
Ratio of gross expenses to average net assets:
|
||||||||||||
|
Before expense recoupment
|
2.49
|
%(4)
|
2.44
|
%
|
2.52
|
%(4)
|
||||||
|
After expense recoupment
|
2.50
|
%(4)
|
2.45
|
%
|
2.54
|
%(4)
|
||||||
|
Ratio of dividends and interest on short
|
||||||||||||
|
positions and borrowing expense on
|
||||||||||||
|
securities sold short to average net assets
|
0.63
|
%(4)
|
0.46
|
%
|
0.55
|
%(4)
|
||||||
|
Ratio of operating expense to average net assets
|
||||||||||||
|
excluding dividends and interest on short
|
||||||||||||
|
positions and borrowing expense on securities
|
||||||||||||
|
sold short (after expense recoupment)
|
1.87
|
%(4)
|
1.99
|
%
|
1.99
|
%(4)
|
||||||
|
Ratio of net investment income (loss)
|
||||||||||||
|
to average net assets
|
0.32
|
%(4)
|
1.09
|
%
|
(0.17
|
)%(4)
|
||||||
|
Portfolio turnover rate(5)
|
99
|
%(3)
|
230
|
%
|
283
|
%(3)
|
||||||
|
(1)
|
Net investment income (loss) before dividends and interest on short positions and borrowing expense on securities on securities sold short for the six months ended June 30, 2019, the year ended December 31, 2018,
and the period ended December 31, 2017, $0.05, $0.16 and $0.03, respectively.
|
|
(2)
|
Net investment income (loss) per share has been calculated based on average shares outstanding during the period.
|
|
(3)
|
Not annualized.
|
|
(4)
|
Annualized.
|
|
(5)
|
The numerator for the portfolio turnover rate includes the lesser of purchases or sales (excluding short-term investments, short-term options, forward currency contracts, swap contracts and short positions). The
denominator includes the average long positions throughout the period.
|
|
^
|
Commencement of operations.
|
The accompanying notes are an integral part of these financial statements.
63
WCM Alternatives: Credit Event Fund
FINANCIAL HIGHLIGHTS
Selected per share data is based on a share of beneficial interest outstanding throughout each period/year.
Institutional Class
|
Six Months
|
Year Ended
|
|||||||
|
Ended
|
December 31,
|
|||||||
|
June 30, 2019
|
2018
|
|||||||
|
(Unaudited)
|
||||||||
|
Per Share Data:
|
||||||||
|
Net asset value, beginning of period
|
$
|
9.55
|
$
|
10.00
|
||||
|
Income from investment operations:
|
||||||||
|
Net investment income(1)(2)
|
0.14
|
0.14
|
||||||
|
Net realized and unrealized gain (loss)
|
||||||||
|
on investments
|
0.77
|
(0.43
|
)
|
|||||
|
Total from investment operations
|
0.91
|
(0.29
|
)
|
|||||
|
Less distributions:
|
||||||||
|
From net investment income
|
—
|
(0.16
|
)
|
|||||
|
Total dividends and distributions
|
—
|
(0.16
|
)
|
|||||
|
Net Asset Value, end of period
|
$
|
10.46
|
$
|
9.55
|
||||
|
Total Return
|
9.53
|
%(3)
|
(2.93
|
)%
|
||||
|
Supplemental data and ratios:
|
||||||||
|
Net assets, end of period (000’s)
|
$
|
3,995
|
$
|
3,744
|
||||
|
Ratio of gross expenses to average net assets:
|
||||||||
|
Before expense reimbursement
|
5.85
|
%(4)
|
6.24
|
%
|
||||
|
After expense reimbursement
|
1.94
|
%(4)
|
1.73
|
%
|
||||
|
Ratio of interest on reverse repurchase
|
||||||||
|
agreements to average net assets
|
0.30
|
%(4)
|
0.09
|
%
|
||||
|
Ratio of operating expenses to average net assets
|
||||||||
|
excluding interest on reverse repurchase
|
||||||||
|
agreements (after expense reimbursement)
|
1.64
|
%(4)
|
1.64
|
%
|
||||
|
Ratio of net investment income
|
||||||||
|
to average net assets
|
2.78
|
%(4)
|
1.44
|
%
|
||||
|
Portfolio turnover rate(5)
|
42
|
%(3)
|
192
|
%
|
||||
|
(1)
|
Net investment income before interest on reverse repurchase agreements for the six months ended June 30, 2019 and the year ended December 31, 2018 was $0.15 and $0.15, respectively.
|
|
(2)
|
Net investment income per share has been calculated based on average shares outstanding during the period.
|
|
(3)
|
Not annualized.
|
|
(4)
|
Annualized.
|
|
(5)
|
The numerator for the portfolio turnover rate includes the lesser of purchases or sales (excluding short-term investments, swap contracts, reverse repurchase agreements, and short positions). The denominator
includes the average long positions throughout the period.
|
The accompanying notes are an integral part of these financial statements.
64
WCM Alternatives: Credit Event Fund
FINANCIAL HIGHLIGHTS
Selected per share data is based on a share of beneficial interest outstanding throughout each period/year.
Investor Class
|
Six Months
|
Year Ended
|
|||||||
|
Ended
|
December 31,
|
|||||||
|
June 30, 2019
|
2018
|
|||||||
|
(Unaudited)
|
||||||||
|
Per Share Data:
|
||||||||
|
Net asset value, beginning of period
|
$
|
9.54
|
$
|
10.00
|
||||
|
Income from investment operations:
|
||||||||
|
Net investment income(1)(2)
|
0.13
|
0.12
|
||||||
|
Net realized and unrealized gain (loss)
|
||||||||
|
on investments
|
0.77
|
(0.44
|
)
|
|||||
|
Total from investment operations
|
0.90
|
(0.32
|
)
|
|||||
|
Less distributions:
|
||||||||
|
From net investment income
|
—
|
(0.14
|
)
|
|||||
|
Total dividends and distributions
|
—
|
(0.14
|
)
|
|||||
|
Net Asset Value, end of period
|
$
|
10.44
|
$
|
9.54
|
||||
|
Total Return
|
9.43
|
%(3)
|
(3.23
|
)%
|
||||
|
Supplemental data and ratios:
|
||||||||
|
Net assets, end of period (000’s)
|
$
|
42
|
$
|
38
|
||||
|
Ratio of gross expenses to average net assets:
|
||||||||
|
Before expense reimbursement
|
6.10
|
%(4)
|
6.56
|
%
|
||||
|
After expense reimbursement
|
2.19
|
%(4)
|
1.98
|
%
|
||||
|
Ratio of interest on reverse repurchase
|
||||||||
|
agreements to average net assets
|
0.30
|
%(4)
|
0.09
|
%
|
||||
|
Ratio of operating expenses to average net assets
|
||||||||
|
excluding interest on reverse repurchase
|
||||||||
|
agreements (after expense reimbursement)
|
1.89
|
%(4)
|
1.89
|
%
|
||||
|
Ratio of net investment income
|
||||||||
|
to average net assets
|
2.53
|
%(4)
|
1.19
|
%
|
||||
|
Portfolio turnover rate(5)
|
42
|
%(3)
|
192
|
%
|
||||
|
(1)
|
Net investment income before interest on reverse repurchase agreements for the six months ended June 30, 2019 and the year ended December 31, 2018 was $0.14 and $0.13, respectively.
|
|
(2)
|
Net investment income per share has been calculated based on average shares outstanding during the period.
|
|
(3)
|
Not annualized.
|
|
(4)
|
Annualized.
|
|
(5)
|
The numerator for the portfolio turnover rate includes the lesser of purchases or sales (excluding short-term investments, swap contracts, reverse repurchase agreements, and short positions). The denominator
includes the average long positions throughout the period.
|
The accompanying notes are an integral part of these financial statements.
65
The Merger Fund and Westchester Capital Funds
NOTES TO THE FINANCIAL STATEMENTS
June 30, 2019 (Unaudited)
Note 1 — ORGANIZATION
The Merger Fund (“TMF”) is a no-load, open-end, diversified investment company organized as a trust under the laws of the Commonwealth of Massachusetts on April 12, 1982, and registered under the
Investment Company Act of 1940, as amended (the “1940 Act”). TMF was formerly known as the Risk Portfolio of The Ayco Fund. In January of 1989, TMF’s fundamental investment policies were amended to permit TMF to engage in merger arbitrage. At the
same time, Westchester Capital Management, Inc. became TMF’s investment adviser, and TMF began to do business as The Merger Fund. In a transaction that closed on December 31, 2010, Westchester Capital Management, Inc. transferred substantially all of
its business and assets to Westchester Capital Management, LLC (the “Adviser”), which became TMF’s investment adviser. Therefore, the performance information included for periods prior to 2011 reflects the performance of Westchester Capital
Management, Inc. Roy Behren and Michael Shannon, TMF’s current portfolio managers, have served as co-portfolio managers of TMF since January 2007. The Investor Class inception date was January 31, 1989, and the Institutional Class inception date was
August 1, 2013. The investment objective of TMF is to seek to achieve capital growth by engaging in merger arbitrage. Merger arbitrage is a highly specialized investment approach generally designed to profit from the successful completion of publicly
announced mergers, takeovers, tender offers, leveraged buyouts, spin-offs, liquidations and other corporate reorganizations. At June 30, 2019, 84.9% of the shares outstanding of TMF’s Investor Class were owned by 6 omnibus accounts. At June 30,
2019, 77.0% of the shares outstanding of TMF’s Institutional Class were owned by 6 omnibus accounts.
Westchester Capital Funds (“WCF”) is an open-end series management investment company organized under the laws of the Commonwealth of Massachusetts on March 20, 2013, and registered under the 1940 Act.
WCM Alternatives: Event-Driven Fund (“EDF”), the first series within WCF, is a no-load, open-end, diversified investment company with two classes of shares, Investor Class shares and Institutional Class shares. The Institutional Class inception date
was January 2, 2014. The Investor Class inception date was March 22, 2017. The investment objective of EDF is to seek to provide attractive risk-adjusted returns with low relative volatility in virtually all market environments. WCM Alternatives:
Credit Event Fund (“CEF”), the second series within WCF, is a no-load, open-end, non-diversified investment company with two classes of shares, Investor Class shares and Institutional Class shares. The Institutional Class and Investor Class inception
date was December 29,
66
The Merger Fund and Westchester Capital Funds
NOTES TO THE FINANCIAL STATEMENTS (continued)
June 30, 2019 (Unaudited)
Note 1 — ORGANIZATION (continued)
2017. The investment objective of CEF is to seek attractive risk-adjusted returns independent of market cycles. Risk-adjusted return is a concept that considers not only an investment’s return, but also the amount of
potential risk involved in producing that return. At June 30, 2019, 94.4% of the shares outstanding of EDF’s Investor Class were owned by 3 omnibus accounts. At June 30, 2019, 97.1% of the shares outstanding of EDF’s Institutional Class were owned by
3 omnibus accounts. At June 30, 2019, 84.9% and 15.1% of the shares outstanding of CEF’s Investor Class were owned by 3 omnibus accounts and by affiliates of the Adviser, respectively. At June 30, 2019, 53.1% and 41.5% of the shares outstanding of
CEF’s Institutional Class were owned by 2 omnibus accounts and by affiliates of the Adviser, respectively. At June 30, 2019, 25.2% and 100.0% of the shares outstanding of CEF’s Investor Class and CEF’s Institutional Class were owned by affiliates of
the Adviser through omnibus accounts or were directly held.
Each class of shares of TMF, EDF and CEF (each a “Fund” and together, the “Funds”) has different eligibility and minimum investment requirements. The underlying assets attributable to a class of a Fund
are charged with the expenses attributable to that class of the Fund and with a share of the general expenses of the Fund. Any general expenses of a Fund that are not readily identifiable as belonging to a particular class of the Fund are allocated
by or under the direction of the Boards of Trustees of the Funds (the “Board of Trustees” or “Trustees”) in such manner as the Trustees determine. Shares of classes may have different voting rights, such as (i) when required by the 1940 Act, or (ii)
when the Trustees determine that such a matter affects only the interests of a particular class. Shares have no preemptive or subscription rights. The Institutional Class shares do not have a distribution fee. Income, expenses (other than expenses
attributable to a specific class), and realized and unrealized gains or losses on investments of a Fund are allocated to each class of a Fund based on its relative net assets.
Note 2 — SIGNIFICANT ACCOUNTING POLICIES
The following is a summary of significant accounting policies followed by the Funds in the preparation of their financial statements. These policies are in conformity with U.S. generally accepted
accounting principles (“GAAP”). The Funds are investment companies and, accordingly, follow the investment company accounting and reporting guidance of the Financial Accounting Standards Board Accounting Standards Codification Topic 946 – Investment
Companies. The presentation of financial statements in conformity with GAAP requires
67
The Merger Fund and Westchester Capital Funds
NOTES TO THE FINANCIAL STATEMENTS (continued)
June 30, 2019 (Unaudited)
Note 2 — SIGNIFICANT ACCOUNTING POLICIES (continued)
management to make estimates and assumptions that affect the reported amount of assets and liabilities at the date of the financial statements and the reported amounts of revenues and expenses during the reporting period.
Actual results could differ from those estimates and assumptions.
A. Investment Valuation
Equity securities, including common and preferred stocks, closed-end funds and ETFs, that trade on an exchange will typically be valued based on the last reported sale price. Securities listed on NASDAQ
are typically valued using the NASDAQ Official Closing Price. The securities valued using quoted prices in active markets are classified as Level 1 investments. If, on a particular day, an exchange-listed security does not trade, then the mean
between the closing bid and asked prices will typically be used to value the security. These securities are classified as Level 2 investments. Fixed income securities having a maturity of greater than 60 days are typically valued based on evaluations
provided by an independent pricing vendor. Investments in United States government securities (other than short-term securities) are valued at the mean between the 4:00 p.m. New York time bid and asked prices supplied by a third party vendor.
Short-term fixed-income securities having a maturity of less than 60 days are valued at market quotations or based on valuations supplied by a third party pricing service. If a reliable price from a third party pricing service is unavailable,
amortized cost may be used if it is determined that the instrument’s amortized cost value represents approximately the fair value of the security. These securities are classified as Level 2 investments.
Investments in Special Purpose Acquisition Companies, including their related units, shares, rights and warrants (each a “SPAC interest”), will typically be valued by reference to the last reported
transaction for the composite exchange. These securities are classified as Level 1 investments. If, on a particular day, no reliable market transaction is readily available and reported for the composite exchange, then the mean between the closing
bid and asked prices on the composite exchange will be used to value the SPAC interest, or the SPAC interest will be fair valued in accordance with the Fund’s pricing procedures. These securities are classified as Level 2 investments.
Exchange-traded options are typically valued at the higher of the intrinsic value of the option (i.e., what a Fund would pay or can receive upon the option being exercised) or the last reported composite
sale price when such sale falls between the bid and asked prices. Notwithstanding the above, options that trade principally on a European exchange are typically valued at the “settlement price” as reported by the exchange on
68
The Merger Fund and Westchester Capital Funds
NOTES TO THE FINANCIAL STATEMENTS (continued)
June 30, 2019 (Unaudited)
Note 2 — SIGNIFICANT ACCOUNTING POLICIES (continued)
which the option principally trades. If the settlement price for a European exchange-traded option is unreliable or unavailable, the option will generally be valued at the last reported sale price. When the last sale of an
exchange-traded option is outside the bid and asked prices, the Funds will typically value the option at the higher of the intrinsic value of the option or the mean between the highest end of day option bid price and the lowest end of day option ask
price. On the stipulated expiration date, expiring options will be priced at intrinsic value. Options for which there is an active market are classified as Level 1 investments, but options not listed on an exchange and/or are fair valued in
accordance with the Fund’s pricing procedures are classified as Level 2 investments.
Investments in registered open-end investment companies, including Money Market Funds, are typically valued at their reported net asset value (“NAV”) per share. These securities are generally classified
as Level 1 investments.
Forward currency contracts are valued daily at the prevailing forward exchange rate. These securities are generally classified as Level 2.
In general, swap prices are determined using the same methods as would be used to price the underlying security. When the underlying security is the subject of a completed corporate reorganization for
which the final deal terms are known, the swap is priced at the value of the consideration to be received by the Funds. The credit quality of counterparties and collateral is monitored and the valuation of a swap may be adjusted if it is believed
that the credit quality of the counterparty or collateral affects the market value of the swap position. These securities are generally classified as Level 2 investments.
Due to the short-term nature of the reverse repurchase agreements, amortized cost approximates fair value at June 30, 2019. These securities are generally classified as Level 2 investments.
The Funds typically fair value securities and assets for which (a) market quotations are not readily available or (b) market quotations are believed to be unrepresentative of market value. For example,
the Funds may fair value a security that primarily trades on an exchange that closes before the New York Stock Exchange (“NYSE”) if a significant event occurs after the close of the exchange on which the security primarily trades but before the NYSE
closes. Fair valuations are determined in good faith by the Valuation Group (the “Valuation Group”), a committee comprised of persons who are officers of the Trust or representatives of the Adviser, acting pursuant to procedures adopted by the Board.
When fair value pricing is employed,
69
The Merger Fund and Westchester Capital Funds
NOTES TO THE FINANCIAL STATEMENTS (continued)
June 30, 2019 (Unaudited)
Note 2 — SIGNIFICANT ACCOUNTING POLICIES (continued)
the prices of securities used by the Funds to calculate their NAV may differ from quoted or published prices for the same securities. In addition, due to the subjective nature of fair value pricing, it is possible that the
value determined for a particular asset may be materially different from the value realized upon such asset’s sale. These securities are generally classified as Level 2 or 3 depending on the inputs as described below.
The Funds have performed analyses of all existing investments to determine the significance and character of all inputs to their fair value determination. Various inputs are used in determining the value
of the Funds’ investments. These inputs are summarized in the three broad levels listed below:
|
Level 1 —
|
Quoted prices in active markets for identical securities.
|
|
|
Level 2 —
|
Other significant observable inputs (including quoted prices for similar securities, interest rates, prepayment speeds, credit risk, etc.).
|
|
|
Level 3 —
|
Significant unobservable inputs are those inputs that reflect the applicable Fund’s own assumptions that market participants would use to price the asset or liability based on the best available information.
|
The inputs or methodology used for valuing securities are not an indication of the risk associated with investing in those securities.
The following tables provide the fair value measurements of applicable Fund assets and liabilities by level within the fair value hierarchy for the Funds as of June 30, 2019. These assets and liabilities
are measured on a recurring basis.
70
The Merger Fund and Westchester Capital Funds
NOTES TO THE FINANCIAL STATEMENTS (continued)
June 30, 2019 (Unaudited)
Note 2 — SIGNIFICANT ACCOUNTING POLICIES (continued)
The Merger Fund
|
Investments at Fair Value
|
Level 1
|
Level 2
|
Level 3
|
Total
|
||||||||||||
|
Assets
|
||||||||||||||||
|
Common Stocks*
|
$
|
1,666,704,917
|
$
|
123,719,798
|
$
|
60,205,170
|
$
|
1,850,629,885
|
||||||||
|
Special Purpose
|
||||||||||||||||
|
Acquisition Companies
|
99,602,800
|
48,232,788
|
—
|
147,835,588
|
||||||||||||
|
Closed-End Funds
|
346,922,977
|
—
|
—
|
346,922,977
|
||||||||||||
|
Preferred Stocks
|
455,783
|
—
|
—
|
455,783
|
||||||||||||
|
Contingent Value Rights
|
—
|
—
|
26,735
|
26,735
|
||||||||||||
|
Rights
|
138,533
|
—
|
—
|
138,533
|
||||||||||||
|
Warrants
|
3,424,349
|
373,949
|
—
|
3,798,298
|
||||||||||||
|
Bank Loans
|
—
|
91,968,912
|
—
|
91,968,912
|
||||||||||||
|
Corporate Bonds
|
—
|
238,096,229
|
—
|
238,096,229
|
||||||||||||
|
Purchased Option Contracts
|
1,473,608
|
—
|
—
|
1,473,608
|
||||||||||||
|
Escrow Notes
|
—
|
—
|
273,549
|
273,549
|
||||||||||||
|
Short-Term Investments
|
315,132,526
|
21,657,099
|
—
|
336,789,625
|
||||||||||||
|
Investments Purchased
|
||||||||||||||||
|
with the Cash Proceeds
|
||||||||||||||||
|
from Securities Lending***
|
—
|
—
|
—
|
61,258,584
|
||||||||||||
|
Swap Contracts**
|
—
|
163,484
|
—
|
163,484
|
||||||||||||
|
Total
|
$
|
2,433,855,493
|
$
|
524,212,259
|
$
|
60,505,454
|
$
|
3,079,831,790
|
||||||||
|
Liabilities
|
||||||||||||||||
|
Short Common Stocks*
|
$
|
(1,133,524,135
|
)
|
$
|
—
|
$
|
—
|
$
|
(1,133,524,135
|
)
|
||||||
|
Private Placements
|
—
|
—
|
(757,684
|
)
|
(757,684
|
)
|
||||||||||
|
Written Option Contracts
|
(3,322,714
|
)
|
—
|
—
|
(3,322,714
|
)
|
||||||||||
|
Forward Currency
|
||||||||||||||||
|
Exchange Contracts**
|
—
|
(575,030
|
)
|
—
|
(575,030
|
)
|
||||||||||
|
Swap Contracts**
|
—
|
(70,814
|
)
|
—
|
(70,814
|
)
|
||||||||||
|
Total
|
$
|
(1,136,846,849
|
)
|
$
|
(645,844
|
)
|
$
|
(757,684
|
)
|
$
|
(1,138,250,377
|
)
|
||||
71
The Merger Fund and Westchester Capital Funds
NOTES TO THE FINANCIAL STATEMENTS (continued)
June 30, 2019 (Unaudited)
Note 2 — SIGNIFICANT ACCOUNTING POLICIES (continued)
WCM Alternatives: Event-Driven Fund
|
Investments at Fair Value
|
Level 1
|
Level 2
|
Level 3
|
Total
|
||||||||||||
|
Assets
|
||||||||||||||||
|
Common Stocks*
|
$
|
87,137,920
|
$
|
7,830,596
|
$
|
1,024,016
|
$
|
95,992,532
|
||||||||
|
Special Purpose
|
||||||||||||||||
|
Acquisition Companies
|
18,816,134
|
4,102,536
|
—
|
22,918,670
|
||||||||||||
|
Closed End Funds
|
5,819,145
|
—
|
—
|
5,819,145
|
||||||||||||
|
Preferred Stocks
|
7,533,858
|
—
|
—
|
7,533,858
|
||||||||||||
|
Contingent Value Rights
|
—
|
—
|
1,286
|
1,286
|
||||||||||||
|
Rights
|
20,734
|
8,017
|
—
|
28,751
|
||||||||||||
|
Warrants
|
551,475
|
82,261
|
—
|
633,736
|
||||||||||||
|
Bank Loans
|
—
|
4,434,578
|
—
|
4,434,578
|
||||||||||||
|
Convertible Bonds
|
—
|
2,438,679
|
—
|
2,438,679
|
||||||||||||
|
Corporate Bonds
|
—
|
27,190,803
|
—
|
27,190,803
|
||||||||||||
|
Purchased Option Contracts
|
345,089
|
22,350
|
—
|
367,439
|
||||||||||||
|
Escrow Notes
|
—
|
—
|
22,237
|
22,237
|
||||||||||||
|
Short-Term Investments
|
6,229,598
|
24,426,156
|
—
|
30,655,754
|
||||||||||||
|
Swap Contracts**
|
—
|
489,598
|
—
|
489,598
|
||||||||||||
|
Total
|
$
|
126,453,953
|
$
|
71,025,574
|
$
|
1,047,539
|
$
|
198,527,066
|
||||||||
|
Liabilities
|
||||||||||||||||
|
Short Common Stocks*
|
$
|
(51,981,298
|
)
|
$
|
—
|
$
|
—
|
$
|
(51,981,298
|
)
|
||||||
|
Private Placements
|
—
|
—
|
(49,676
|
)
|
(49,676
|
)
|
||||||||||
|
Written Option Contracts
|
(2,096,052
|
)
|
(774,710
|
)
|
—
|
(2,870,762
|
)
|
|||||||||
|
Forward Currency
|
||||||||||||||||
|
Exchange Contracts**
|
—
|
(49,493
|
)
|
—
|
(49,493
|
)
|
||||||||||
|
Swap Contracts**
|
—
|
(91,246
|
)
|
—
|
(91,246
|
)
|
||||||||||
|
Total
|
$
|
(54,077,350
|
)
|
$
|
(915,449
|
)
|
$
|
(49,676
|
)
|
$
|
(55,042,475
|
)
|
||||
72
The Merger Fund and Westchester Capital Funds
NOTES TO THE FINANCIAL STATEMENTS (continued)
June 30, 2019 (Unaudited)
Note 2 — SIGNIFICANT ACCOUNTING POLICIES (continued)
WCM Alternatives: Credit Event Fund
|
Investments at Fair Value
|
Level 1
|
Level 2
|
Level 3
|
Total
|
||||||||||||
|
Assets
|
||||||||||||||||
|
Special Purpose
|
||||||||||||||||
|
Acquisition Companies
|
$
|
1,309,569
|
$
|
131,597
|
$
|
—
|
$
|
1,441,166
|
||||||||
|
Closed-End Funds
|
4,299
|
—
|
—
|
4,299
|
||||||||||||
|
Preferred Stocks
|
112,260
|
—
|
—
|
112,260
|
||||||||||||
|
Warrants
|
64,872
|
—
|
—
|
64,872
|
||||||||||||
|
Bank Loans
|
—
|
380,372
|
—
|
380,372
|
||||||||||||
|
Convertible Bonds
|
—
|
328,627
|
—
|
328,627
|
||||||||||||
|
Corporate Bonds
|
—
|
1,914,552
|
—
|
1,914,552
|
||||||||||||
|
Short-Term Investments
|
113,946
|
—
|
—
|
113,946
|
||||||||||||
|
Total
|
$
|
1,604,946
|
$
|
2,755,148
|
$
|
—
|
$
|
4,360,094
|
||||||||
|
Liabilities
|
||||||||||||||||
|
Short Common Stock*
|
$
|
(41,555
|
)
|
$
|
—
|
$
|
—
|
$
|
(41,555
|
)
|
||||||
|
Swap Contracts**
|
—
|
(12,431
|
)
|
—
|
(12,431
|
)
|
||||||||||
|
Reverse Repurchase Agreements
|
—
|
(352,000
|
)
|
—
|
(352,000
|
)
|
||||||||||
|
Total
|
$
|
(41,555
|
)
|
$
|
(364,431
|
)
|
$
|
—
|
$
|
(405,986
|
)
|
|||||
|
*
|
Please refer to the Schedules of Investments to view long/short common stocks segregated by industry type.
|
|
|
**
|
Swap contracts and forward currency exchange contracts are valued at the net unrealized appreciation (depreciation) on the instrument by counterparty.
|
|
|
***
|
Certain investments that are measured at fair value using the net asset value per share (or its equivalent) practical expedient have not been characterized in the fair value hierarchy. The fair value amount
presented in the table is intended to permit reconciliation of the fair value hierarchy to the amount presented in the Schedule of Investments and Statement of Assets and Liabilities. See Note 9 for additional information regarding securities
lending activity.
|
The Level 2 securities are priced using inputs such as current yields, discount rates, credit quality, yields on comparable securities, trading volume, maturity date, market bid and ask prices, prices on
comparable securities and other significant inputs. Level 3 securities are valued by using broker quotes or such other pricing sources or data as are permitted by the Funds’ pricing procedures. At June 30, 2019, the net value of these securities held
by TMF and EDF were $59,747,770 and $997,863, respectively. The inputs for these securities are not readily available or cannot be reasonably estimated and are generally those inputs as described in Note 2 A. The appropriateness of fair values for
these securities is monitored by the Valuation Group on an ongoing basis.
There were no transfers into or out of Level 3 for TMF and EDF for the six months ended June 30, 2019.
73
The Merger Fund and Westchester Capital Funds
NOTES TO THE FINANCIAL STATEMENTS (continued)
June 30, 2019 (Unaudited)
Note 2 — SIGNIFICANT ACCOUNTING POLICIES (continued)
Level 3 Reconciliation Disclosure
The following is a reconciliation of Level 3 assets for which significant unobservable inputs were used to determine fair value.
The Merger Fund
|
Common
|
Contingent
|
Escrow
|
Private
|
Total
|
||||||||||||||||
|
Description
|
Stocks
|
Value Rights
|
Notes
|
Placements
|
Investment
|
|||||||||||||||
|
Balance as of December 31, 2018
|
$
|
59,773,482
|
$
|
26,735
|
$
|
1,927,279
|
$
|
—
|
$
|
61,727,496
|
||||||||||
|
Purchases on Investments*
|
—
|
—
|
—
|
(748,500
|
)
|
(748,500
|
)
|
|||||||||||||
|
(Sales) of Investments
|
—
|
—
|
—
|
—
|
—
|
|||||||||||||||
|
Realized (Gain) Loss
|
—
|
—
|
—
|
—
|
—
|
|||||||||||||||
|
Transfers Into Level 3
|
—
|
—
|
—
|
—
|
—
|
|||||||||||||||
|
(Transfer Out) of Level 3
|
—
|
—
|
—
|
—
|
—
|
|||||||||||||||
|
Change in Unrealized
|
||||||||||||||||||||
|
Appreciation (Depreciation)
|
431,688
|
—
|
(1,653,730
|
)**
|
(9,184
|
)
|
(1,231,226
|
)
|
||||||||||||
|
Balance as of June 30, 2019
|
$
|
60,205,170
|
$
|
26,735
|
$
|
273,549
|
$
|
(757,684
|
)
|
$
|
59,747,770
|
|||||||||
|
Change in unrealized appreciation
|
||||||||||||||||||||
|
(depreciation) during the period
|
||||||||||||||||||||
|
for Level 3 investments
|
||||||||||||||||||||
|
held at June 30, 2019.
|
$
|
431,688
|
$
|
—
|
$
|
(1,067,887
|
)**
|
$
|
(9,184
|
)
|
$
|
(645,383
|
)
|
|||||||
|
WCM Alternatives: Event-Driven Fund
|
||||||||||||||||||||
|
Common
|
Contingent
|
Escrow
|
Private
|
Total
|
||||||||||||||||
|
Description
|
Stocks
|
Value Rights
|
Notes
|
Placements
|
Investment
|
|||||||||||||||
|
Balance as of December 31, 2018
|
$
|
1,016,674
|
$
|
1,286
|
$
|
60,608
|
$
|
—
|
$
|
1,078,568
|
||||||||||
|
Purchases on Investments*
|
—
|
—
|
—
|
(48,929
|
)
|
(48,929
|
)
|
|||||||||||||
|
(Sales) of Investments
|
—
|
—
|
—
|
—
|
—
|
|||||||||||||||
|
Realized (Gain) Loss
|
—
|
—
|
—
|
—
|
—
|
|||||||||||||||
|
Transfers Into Level 3
|
—
|
—
|
—
|
—
|
—
|
|||||||||||||||
|
(Transfer Out) of Level 3
|
—
|
—
|
—
|
—
|
—
|
|||||||||||||||
|
Change in Unrealized
|
||||||||||||||||||||
|
Appreciation (Depreciation)
|
7,342
|
—
|
(38,371
|
)**
|
(747
|
)
|
(31,776
|
)
|
||||||||||||
|
Balance as of June 30, 2019
|
$
|
1,024,016
|
$
|
1,286
|
$
|
22,237
|
$
|
(49,676
|
)
|
$
|
997,863
|
|||||||||
|
Change in unrealized appreciation
|
||||||||||||||||||||
|
(depreciation) during the period
|
||||||||||||||||||||
|
for Level 3 investments
|
||||||||||||||||||||
|
held at June 30, 2019.
|
$
|
7,342
|
$
|
—
|
$
|
(19,717
|
)**
|
$
|
(747
|
)
|
$
|
(13,122
|
)
|
|||||||
|
*
|
Includes receipts from corporate actions.
|
|
|
**
|
The difference in unrealized depreciation values is due to a change in the cost basis from a corporate action.
|
The realized and unrealized gains and losses from Level 3 transactions are included with the net realized gain (loss) on investments and net change in unrealized appreciation (depreciation) on investments
on the Statements of Operations. The net change in unrealized depreciation on investments related to Level 3 securities held by TMF and EDF at June 30, 2019 totals $(1,231,226) and $(31,776), respectively. CEF held no Level 3 securities during the
six months ended June 30, 2019.
74
The Merger Fund and Westchester Capital Funds
NOTES TO THE FINANCIAL STATEMENTS (continued)
June 30, 2019 (Unaudited)
Note 2 — SIGNIFICANT ACCOUNTING POLICIES (continued)
Significant unobservable valuation inputs monitored by the Valuation Group under the supervision of the Board of Trustees for restricted securities or material Level 3 investments as of June 30, 2019 for
both TMF and EDF are as follows:
The Merger Fund
|
Fair Value
|
Valuation
|
Unobservable
|
||||
|
Description
|
June 30, 2019
|
Technique
|
Input
|
|||
|
Common Stock
|
$
|
60,205,170
|
Discounted Cash
|
Discount Rates/
|
||
|
Flow Model
|
Terminal Value/
|
|||||
|
Cash Flow Projections
|
||||||
|
Escrow Note
|
$
|
—
|
*
|
Projected Final
|
Discount of Projected
|
|
|
Distribution**
|
Distribution
|
|||||
|
*
|
Amount less than $0.50.
|
|
|
**
|
This Level 3 security was received through a corporate action. The security is being kept open due to the potential of an additional distribution. Based on the evaluation of the likelihood of an
additional distribution, the security is being priced at zero.
|
WCM Alternatives: Event-Driven Fund
|
Fair Value at
|
Valuation
|
Unobservable
|
||||
|
Description
|
June 30, 2019
|
Technique
|
Input
|
|||
|
Common Stock
|
$
|
1,024,016
|
Discounted Cash
|
Discount Rates/
|
||
|
Flow Model
|
Terminal Value/
|
|||||
|
Cash Flow Projections
|
||||||
The tables above do not include certain Level 3 investments that are valued by brokers. At June 30, 2019, the net value of these securities for TMF and EDF were $(457,400) and $(26,153), respectively. The
inputs for these investments are not readily available or cannot be reasonably estimated and are generally those inputs described in Note 2 A.
B. Federal Income Taxes
No provision for federal income taxes has been made since the Funds have complied to date with the provisions of Subchapter M of the Internal Revenue Code applicable to regulated investment companies and
intends to continue to comply in future years and to distribute investment company net taxable income and net capital gains to shareholders. Additionally, the Funds intend to make all required distributions to avoid federal excise tax.
The Funds have reviewed all open tax years in major jurisdictions and concluded that there is no impact on the Funds’ net assets and there is no tax liability resulting from unrecognized tax benefits
relating to uncertain income tax positions taken or expected to be taken on a tax return. The Funds are also not aware of any tax positions for which it is reasonably possible that the total amounts of unrecognized tax benefits will significantly
change in the next twelve months. As of June 30, 2019, TMF’s and EDF’s open Federal and New York tax years include the tax years
75
The Merger Fund and Westchester Capital Funds
NOTES TO THE FINANCIAL STATEMENTS (continued)
June 30, 2019 (Unaudited)
Note 2 — SIGNIFICANT ACCOUNTING POLICIES (continued)
ended December 31, 2015 through December 31, 2018. In the prior year CEF was in its first year of operations and therefore open Federal and New York tax include the tax year ended December 31, 2018. The Funds have no tax
examination in progress.
C. Transactions with Brokers
The Funds’ deposits at brokers for securities sold short and deposits at brokers for other investments are with two securities dealers. The Funds are required by the brokers to maintain collateral for
securities sold short. The receivable from brokers for securities sold short on the Statements of Assets and Liabilities represents the proceeds from securities sold short that is maintained at the broker. The Funds do not require the brokers to
maintain collateral in support of the receivables from the brokers for proceeds on securities sold short. The Funds may maintain cash deposits at brokers beyond the receivables for short sales. On the Statement of Assets and Liabilities, these are
classified as deposits at brokers for other investments. A Fund may be required by the brokers with which it executes short sales to maintain an additional amount of collateral in a special tri-party custody arrangement for the benefit of the
broker.
The Funds’ equity swap contracts’ and forward currency exchange contracts’ cash deposits are monitored daily by the Adviser and counterparty. These transactions may involve market risk in excess of the
amounts receivable or payable reflected on the Statements of Assets and Liabilities.
D. Securities Sold Short
The Funds sell securities or currencies short for economic hedging purposes or any other investment purpose. For financial statement purposes, an amount equal to the settlement amount is initially
included in the Statements of Assets and Liabilities as an asset and an equivalent liability. The amount of the liability is subsequently priced to reflect the current value of the short position. Subsequent fluctuations in the market prices of
securities or currencies sold, but not yet purchased, may require purchasing the securities or currencies at prices which may differ from the market value reflected on the Statements of Assets and Liabilities. Short sale transactions result in off
balance sheet risk because the ultimate obligation may exceed the related amounts shown in the Statements of Assets and Liabilities. The Funds will incur losses if the price of the security increases between the date of the short sale and the date on
which the Funds purchase the securities to replace the borrowed securities. The Funds’ losses on short sales are potentially unlimited because there is no upward limit on the price a borrowed security could attain.
76
The Merger Fund and Westchester Capital Funds
NOTES TO THE FINANCIAL STATEMENTS (continued)
June 30, 2019 (Unaudited)
Note 2 — SIGNIFICANT ACCOUNTING POLICIES (continued)
The Funds are liable for any dividends payable on securities while those securities are sold short. Until the security is replaced, the Funds are required to pay to the lender any income earned, which is
recorded as an expense by the Funds. The Funds segregate liquid assets in an amount equal to the market value of securities sold short, which is reflected in the Schedules of Investments. These assets are required to be adjusted daily to reflect
changes in the value of the securities or currencies sold short.
E. Written Option Contracts
The Funds are subject to equity price risk in the normal course of pursuing their investment objectives. The Funds write (sell) put or call options for hedging purposes, volatility management purposes, or
otherwise to gain, or reduce, long or short exposure to one or more asset classes or issuers. When a Fund writes (sells) an option, an amount equal to the premium received by the Fund is included in the Statements of Assets and Liabilities as an
asset and an equivalent liability. The amount of the liability is subsequently priced daily to reflect the current value of the option written. Refer to Note 2 A. for a pricing description. By writing an option, a Fund may become obligated during the
term of the option to deliver or purchase the securities underlying the option at the exercise price if the option is exercised. These contracts may involve market risk in excess of the amounts receivable or payable reflected on the Statements of
Assets and Liabilities. Refer to Note 2 R. for further derivative disclosures, and Note 2 P. for further counterparty risk disclosure.
When an option expires on its stipulated expiration date or the Funds enter into a closing purchase transaction, the Funds realize gains or losses if the cost of the closing purchase transaction differs
from the premium received when the option was sold without regard to any unrealized appreciation or depreciation on the underlying security, and the liability related to such option is eliminated. When a written call option is exercised, the premium
originally received decreases the cost basis of the security and the Funds realize gains or losses from the sale of the underlying security. When a written put option is exercised, the cost of the security acquired is decreased by the premium
received for the put.
F. Purchased Option Contracts
The Funds are subject to equity price risk in the normal course of pursuing their investment objectives. The Funds purchase put or call options for hedging purposes, volatility management purposes, or
otherwise to gain, or reduce, long or short exposure to one or more asset classes or issuers. When the Funds purchase an option contract, an amount equal to the premiums paid is included in the Statements of
77
The Merger Fund and Westchester Capital Funds
NOTES TO THE FINANCIAL STATEMENTS (continued)
June 30, 2019 (Unaudited)
Note 2 — SIGNIFICANT ACCOUNTING POLICIES (continued)
Assets and Liabilities as an investment, and is subsequently priced daily to reflect the value of the purchased option. Refer to Note 2 A. for a pricing description. Refer to Note 2 R. for further derivative disclosures,
and Note 2 P. for further counterparty risk disclosure.
When option contracts expire or are closed, realized gains or losses are recognized without regard to any unrealized appreciation or depreciation on the underlying securities that may be held by the
Funds. If the Fund exercises a call option, the cost of the security acquired is increased by the premium paid for the call. If the Fund exercises a put option, the premium paid for the put option increases the cost of the underlying security and a
gain or loss is realized from the sale of the underlying security.
G. Forward Currency Exchange Contracts
The Funds are subject to foreign currency exchange rate risk in the normal course of pursuing their investment objectives. TMF and EDF use forward currency exchange contracts to hedge against changes in
the value of foreign currencies. The Funds may enter into forward currency exchange contracts obligating the Funds to deliver and receive a currency at a specified future date. Forward contracts are valued daily, and unrealized appreciation or
depreciation is recorded daily as the difference between the contract exchange rate and the closing forward rate applied to the face amount of the contract. Refer to Note 2 A. for a pricing description. A realized gain or loss is recorded at the time
the forward contract expires. Credit risk may arise as a result of the failure of the counterparty to comply with the terms of the contract. Refer to Note 2 P. for further counterparty risk disclosure.
The use of forward currency exchange contracts does not eliminate fluctuations in the underlying prices of the Funds’ investment securities. The use of forward currency exchange contracts involves the
risk that anticipated currency movements will not be accurately predicted. A forward currency exchange contract would limit the risk of loss due to a decline in the value of a particular currency; however, it would also limit any potential gain that
might result should the value of the currency increase instead of decrease. These contracts may involve market risk in excess of the amounts receivable or payable reflected on the Statements of Assets and Liabilities. Refer to Note 2 R. for further
derivative disclosures.
H. Equity Swap Contracts
The Funds are subject to equity price risk and interest rate risk in the normal course of pursuing their investment objectives. The Funds entered into long and/or short equity swap contracts with multiple
broker-dealers. A long equity swap contract entitles the Funds to receive from the
78
The Merger Fund and Westchester Capital Funds
NOTES TO THE FINANCIAL STATEMENTS (continued)
June 30, 2019 (Unaudited)
Note 2 — SIGNIFICANT ACCOUNTING POLICIES (continued)
counterparty any appreciation and dividends paid on an individual security, while obligating the Funds to pay the counterparty any depreciation on the security as well as interest on the notional amount of the contract at a
rate equal to LIBOR plus an agreed upon spread (refer to the Schedules of Investments for further disclosure of the contracts’ financing rates). A short equity swap contract obligates the Funds to pay the counterparty any appreciation and dividends
paid on an individual security, while entitling the Funds to receive from the counterparty any depreciation on the security, and to pay to or receive from the counterparty interest on the notional value of the contract at a rate equal to LIBOR less
an agreed upon spread (refer to the Schedules of Investments for further disclosure of the contracts’ financing rates). Refer to Note 2 A. for a pricing description.
The Funds may also enter into equity swap contracts whose value may be determined by the spread between a long equity position and a short equity position. This type of swap contract obligates the Funds
to pay the counterparty an amount tied to any increase in the spread between the two securities over the term of the contract. The Funds are also obligated to pay the counterparty any dividends paid on the short equity holding as well as any net
financing costs. This type of swap contract entitles the Funds to receive from the counterparty any gains based on a decrease in the spread as well as any dividends paid on the long equity holding and any net interest income.
Fluctuations in the value of an open contract are recorded daily as net unrealized appreciation or depreciation. The Funds will realize gains or losses upon termination or reset of the contract. The Funds
or the Funds’ counterparty, under certain conditions, may terminate the contract prior to the contract’s expiration date.
Credit risk may arise as a result of the failure of the counterparty to comply with the terms of the contract. Refer to Note 2 P. for further counterparty risk disclosure. Additionally, risk may arise
from unanticipated movements in interest rates or in the value of the underlying securities. Equity swap contracts may involve market risk in excess of the amounts receivable or payable reflected on the Statements of Assets and Liabilities. Refer to
Note 2 R. for further derivative disclosures.
I. Reverse Repurchase Agreements
CEF may enter into reverse repurchase agreements. In a reverse repurchase agreement, CEF sells to a financial institution a security that it holds with an agreement to repurchase the same security at an
agreed-upon price and date. A reverse repurchase agreement involves the risk that the market
79
The Merger Fund and Westchester Capital Funds
NOTES TO THE FINANCIAL STATEMENTS (continued)
June 30, 2019 (Unaudited)
Note 2 — SIGNIFICANT ACCOUNTING POLICIES (continued)
value of the security may decline below the repurchase price of the security. CEF will segregate assets determined to be liquid by the Adviser or otherwise cover its obligations under reverse repurchase agreements.
Securities pledged as collateral are reflected as a component of Investments, at value on the Statements of Assets and Liabilities and are noted on CEF’s Schedule of Investments. Typically, the counterparty under the terms of the agreement is able to
rehypothecate, resell or repledge the security. The value of reverse repurchase agreements entered into are recorded in Payable for reverse repurchase agreements on the Statements of Assets and Liabilities. Interest is accrued daily and an
appropriate payment reflecting the interest due for reverse repurchase agreements held at period end is recorded in Interest payable for reverse repurchase agreements on the Statements of Assets and Liabilities. The cumulative interest paid during
the period is recorded in Interest expense on reverse repurchase agreements on the Statements of Operations. Refer to Note 2 P. for future counterparty risk disclosure.
J. Distributions to Shareholders
Dividends from net investment income and net realized capital gains, if any, are declared and paid at least annually. Income and capital gain distributions are determined in accordance with income tax
regulations which may differ from GAAP. These differences are due primarily to wash sale-loss deferrals, constructive sales, straddle-loss deferrals, adjustments on swap contracts, and unrealized gains or losses on Section 1256 contracts, which were
realized, for tax purposes, at the end of each Fund’s fiscal year.
K. Foreign Securities
Investing in securities of foreign companies and foreign governments involves special risks and considerations not typically associated with investing in U.S. companies and the U.S. government. These
risks include fluctuations in currency exchange rates and adverse political, cultural, regulatory, legal, tax, and economic developments as well as different custody and/or settlement practices or delayed settlements in some foreign markets.
Moreover, securities of many foreign companies and their markets may be less liquid and their prices more volatile than those of securities of comparable U.S. companies and the U.S. government.
L. Foreign Currency Transactions
The books and records of the Funds are maintained in U.S. dollars. Foreign currency transactions are translated into U.S. dollars on the following basis: (i) market value of investment securities, assets
and liabilities at the daily rates of exchange, and (ii) purchases and sales of investment securities, dividend and interest income and certain expenses at the rates of exchange prevailing on the respective dates of such
80
The Merger Fund and Westchester Capital Funds
NOTES TO THE FINANCIAL STATEMENTS (continued)
June 30, 2019 (Unaudited)
Note 2 — SIGNIFICANT ACCOUNTING POLICIES (continued)
transactions. For financial reporting purposes, the Funds do not isolate changes in the exchange rate of investment securities from the fluctuations arising from changes in the market prices of securities. However, for
federal income tax purposes, the Funds do isolate and treat as ordinary income the effect of changes in foreign exchange rates on realized gain or loss from the sale of investment securities and payables and receivables arising from trade-date and
settlement-date differences. Foreign currency, if any, held as cash by the Funds’ custodian is reported separately on the Statements of Assets and Liabilities.
M. Cash and Cash Equivalents
The Funds consider highly liquid short-term fixed income investments purchased with an original maturity of less than three months to be cash equivalents. Cash equivalents are included in short-term
investments on the Schedules of Investments as well as in investments on the Statements of Assets and Liabilities. Temporary cash overdrafts are reported as payable to custodian.
N. Guarantees and Indemnifications
In the normal course of business, the Funds enter into contracts with service providers that contain general indemnification clauses. The Funds’ maximum exposure under these arrangements is unknown, as
this would involve future claims that may be made against the Funds that have not yet occurred. The Funds have not historically incurred material expenses in respect of those provisions.
O. Security Transactions, Investment Income and Expenses
Transactions are recorded for financial statement purposes on the trade date. Realized gains and losses from security transactions are recorded on the identified cost basis. Distributions to shareholders
are recorded on the ex-dividend date. Dividend income is recorded on the ex-dividend date, except for certain dividends on foreign securities, which are recorded as soon as the Funds are informed after the ex-dividend date. Interest is accounted for
on the accrual basis and includes amortization of premiums and discounts on the effective interest method. At June 30, 2019, expenses include $2,404,549 and $129,415 of borrowing expenses on securities sold short for TMF and EDF, respectively. At
June 30, 2019, expenses include $6,538,062 and $412,166 of dividends on securities sold short for TMF and EDF, respectively. At June 30, 2019, expenses included $5,877 of borrowing expenses on reverse repurchase agreements for CEF.
81
The Merger Fund and Westchester Capital Funds
NOTES TO THE FINANCIAL STATEMENTS (continued)
June 30, 2019 (Unaudited)
Note 2 — SIGNIFICANT ACCOUNTING POLICIES (continued)
P. Counterparty Risk
The Funds help manage counterparty credit risk by entering into agreements only with counterparties the Adviser believes have the financial resources to honor their obligations. The Adviser considers the
creditworthiness of each counterparty to a contract in evaluating potential credit risk. The counterparty risk for forward currency exchange contracts to the Funds includes the amount of any net unrealized appreciation on the contract. The
counterparty risk for equity swaps contracts to the Funds includes the risk of loss of the full amount of any net unrealized appreciation on the contract, along with dividends receivable on long equity contracts and interest receivable on short
equity contracts. The counterparty risk for reverse repurchase agreements is failure of a counterparty to return the security and any net unrealized appreciation. The Fund may also have difficulty replacing the security the counterparty failed to
return. Written and purchased options sold on an exchange expose the Funds to counterparty risk; however, the exchange’s clearinghouse guarantees the options against default. Over-the-counter options counterparty risk includes the risk of loss of
the full amount of any net unrealized appreciation.
Q. The Right to Offset
Financial assets and liabilities, as well as cash collateral received by the Funds’ counterparties and posted are offset by the respective counterparty, and the net amount is reported in the Statements of
Assets and Liabilities when the Funds believe there exists a legally enforceable right to offset the recognized amounts.
R. Derivatives
The Funds may utilize derivative instruments such as options, swaps, futures, forward contracts and other instruments with similar characteristics to the extent that they are consistent with the Funds’
respective investment objectives and limitations. The use of these instruments may involve additional investment risks, including the possibility of illiquid markets or imperfect correlation between the value of the instruments and the underlying
securities. Derivatives also may create leverage which will amplify the effect of their performance on the Funds and may produce significant losses.
The Funds have adopted authoritative standards regarding disclosure about derivatives and hedging activities and how they affect the Funds’ Statements of Assets and Liabilities and Statements of
Operations. For the six months ended June 30, 2019, each Fund’s monthly average quantity and notional value are described below:
82
The Merger Fund and Westchester Capital Funds
NOTES TO THE FINANCIAL STATEMENTS (continued)
June 30, 2019 (Unaudited)
Note 2 — SIGNIFICANT ACCOUNTING POLICIES (continued)
The Merger Fund
|
Monthly Average
|
Monthly Average
|
|||||||
|
Quantity
|
Notional Value
|
|||||||
|
Purchased Option Contracts
|
30,334
|
$
|
210,658,254
|
|||||
|
Written Option Contracts
|
38,623
|
$
|
279,593,694
|
|||||
|
Forward Currency Exchange Contracts
|
8
|
$
|
64,265,167
|
|||||
|
Long Total Return Swap Contracts
|
11,562,593
|
$
|
82,417,352
|
|||||
|
Short Total Return Swap Contracts
|
233,538
|
$
|
4,925,927
|
|||||
|
WCM Alternatives: Event-Driven Fund
|
||||||||
|
Monthly Average
|
Monthly Average
|
|||||||
|
Quantity
|
Notional Value
|
|||||||
|
Purchased Option Contracts
|
11,710
|
$
|
41,031,318
|
|||||
|
Written Option Contracts
|
12,179
|
$
|
44,627,123
|
|||||
|
Forward Currency Exchange Contracts
|
9
|
$
|
7,632,009
|
|||||
|
Long Total Return Swap Contracts
|
2,135,303
|
$
|
63,475,664
|
|||||
|
Short Total Return Swap Contracts
|
141,546
|
$
|
13,655,007
|
|||||
|
WCM Alternatives: Credit Event Fund
|
||||||||
|
Monthly Average
|
Monthly Average
|
|||||||
|
Quantity
|
Notional Value
|
|||||||
|
Long Total Return Swap Contracts
|
109,070
|
$
|
1,174,701
|
|||||
|
Short Total Return Swap Contracts
|
405
|
$
|
74,866
|
|||||
Statements of Assets and Liabilities
Fair values of derivative instruments as of June 30, 2019 are described below:
|
Asset Derivatives
|
||||||
|
Statements of Assets
|
||||||
|
Derivatives
|
and Liabilities Location
|
Fair Value
|
||||
|
The Merger Fund
|
||||||
|
Equity Contracts:
|
||||||
|
Purchased Option Contracts
|
Investments
|
$
|
1,473,608
|
|||
|
Swap Contracts
|
Receivables
|
163,484
|
||||
|
Total
|
$
|
1,637,092
|
||||
|
WCM Alternatives: Event-Driven Fund
|
||||||
|
Equity Contracts:
|
||||||
|
Purchased Option Contracts
|
Investments
|
$
|
367,439
|
|||
|
Swap Contracts
|
Receivables
|
489,598
|
||||
|
Total
|
$
|
857,037
|
||||
83
The Merger Fund and Westchester Capital Funds
NOTES TO THE FINANCIAL STATEMENTS (continued)
June 30, 2019 (Unaudited)
Note 2 — SIGNIFICANT ACCOUNTING POLICIES (continued)
|
Liability Derivatives
|
|||||||
|
Statements of Assets
|
|||||||
|
Derivatives
|
and Liabilities Location
|
Fair Value
|
|||||
|
The Merger Fund
|
|||||||
|
Equity Contracts:
|
|||||||
|
Written Option Contracts
|
Written Option Contracts
|
$
|
3,322,714
|
||||
|
Swap Contracts
|
Payables
|
70,814
|
|||||
|
Foreign Exchange Contracts:
|
|||||||
|
Forward Currency Exchange Contracts
|
Payables
|
575,030
|
|||||
|
Total
|
$
|
3,968,558
|
|||||
|
WCM Alternatives: Event-Driven Fund
|
|||||||
|
Equity Contracts:
|
|||||||
|
Written Option Contracts
|
Written Option Contracts
|
$
|
2,870,762
|
||||
|
Swap Contracts
|
Payables
|
91,246
|
|||||
|
Foreign Exchange Contracts:
|
|||||||
|
Forward Currency Exchange Contracts
|
Payables
|
49,493
|
|||||
|
Total
|
$
|
3,011,501
|
|||||
|
WCM Alternatives: Credit Event Fund
|
|||||||
|
Equity Contracts:
|
|||||||
|
Swap Contracts
|
Payables
|
$
|
12,431
|
||||
|
Total
|
$
|
12,431
|
|||||
Statements of Operations
The effect of derivative instruments on the Statements of Operations for the six months ended June 30, 2019 are described below:
Amount of Realized Gain (Loss) on Derivatives
|
Forward
|
||||||||||||||||||||||
|
Purchased
|
Written
|
Currency
|
||||||||||||||||||||
|
Option
|
Option
|
Exchange
|
Swap
|
|||||||||||||||||||
|
Derivatives
|
Contracts*
|
Contracts
|
Contracts
|
Contracts
|
Total
|
|||||||||||||||||
|
The Merger Fund
|
||||||||||||||||||||||
|
Equity Contracts
|
$
|
(13,429,600
|
)
|
$
|
6,982,059
|
$
|
—
|
$
|
10,717,598
|
$
|
4,270,057
|
|||||||||||
|
Foreign Exchange
|
||||||||||||||||||||||
|
Contracts
|
—
|
—
|
2,671,854
|
—
|
2,671,854
|
|||||||||||||||||
|
Total
|
$
|
(13,429,600
|
)
|
$
|
6,982,059
|
$
|
2,671,854
|
$
|
10,717,598
|
$
|
6,941,911
|
|||||||||||
|
WCM Alternatives:
|
||||||||||||||||||||||
|
Event-Driven Fund
|
||||||||||||||||||||||
|
Equity Contracts
|
$
|
(1,340,170
|
)
|
$
|
(172,182
|
)
|
$
|
—
|
$
|
3,640,779
|
$
|
2,128,427
|
||||||||||
|
Foreign Exchange
|
||||||||||||||||||||||
|
Contracts
|
—
|
—
|
222,446
|
—
|
222,446
|
|||||||||||||||||
|
Total
|
$
|
(1,340,170
|
)
|
$
|
(172,182
|
)
|
$
|
222,446
|
$
|
3,640,779
|
$
|
2,350,873
|
||||||||||
|
WCM Alternatives:
|
||||||||||||||||||||||
|
Credit Event Fund
|
||||||||||||||||||||||
|
Equity Contracts
|
$
|
3,261
|
$
|
3,261
|
||||||||||||||||||
|
Total
|
$
|
3,261
|
$
|
3,261
|
||||||||||||||||||
* The amounts disclosed are included in the realized gain (loss) on investments.
84
The Merger Fund and Westchester Capital Funds
NOTES TO THE FINANCIAL STATEMENTS (continued)
June 30, 2019 (Unaudited)
Note 2 — SIGNIFICANT ACCOUNTING POLICIES (continued)
Change in Unrealized Appreciation (Depreciation) on Derivatives
|
Forward
|
||||||||||||||||||||||
|
Purchased
|
Written
|
Currency
|
||||||||||||||||||||
|
Option
|
Option
|
Exchange
|
Swap
|
|||||||||||||||||||
|
Derivatives
|
Contracts*
|
Contracts
|
Contracts
|
Contracts
|
Total
|
|||||||||||||||||
|
The Merger Fund
|
||||||||||||||||||||||
|
Equity Contracts
|
$
|
(2,667,178
|
)
|
$
|
(2,166,684
|
)
|
$
|
—
|
$
|
(9,530,707
|
)
|
$
|
(14,364,569
|
)
|
||||||||
|
Foreign Exchange
|
||||||||||||||||||||||
|
Contracts
|
—
|
—
|
(1,439,515
|
)
|
—
|
(1,439,515
|
)
|
|||||||||||||||
|
Total
|
$
|
(2,667,178
|
)
|
$
|
(2,166,684
|
)
|
$
|
(1,439,515
|
)
|
$
|
(9,530,707
|
)
|
$
|
(15,804,084
|
)
|
|||||||
|
WCM Alternatives:
|
||||||||||||||||||||||
|
Event-Driven Fund
|
||||||||||||||||||||||
|
Equity Contracts
|
$
|
(1,026,411
|
)
|
$
|
(1,252,820
|
)
|
$
|
—
|
$
|
(1,255,632
|
)
|
$
|
(3,534,863
|
)
|
||||||||
|
Foreign Exchange
|
||||||||||||||||||||||
|
Contracts
|
—
|
—
|
(164,985
|
)
|
—
|
(164,985
|
)
|
|||||||||||||||
|
Total
|
$
|
(1,026,411
|
)
|
$
|
(1,252,820
|
)
|
$
|
(164,985
|
)
|
$
|
(1,255,632
|
)
|
$
|
(3,699,848
|
)
|
|||||||
|
WCM Alternatives:
|
||||||||||||||||||||||
|
Credit Event Fund
|
||||||||||||||||||||||
|
Equity Contracts
|
$
|
82,627
|
$
|
82,627
|
||||||||||||||||||
|
Total
|
$
|
82,627
|
$
|
82,627
|
||||||||||||||||||
* The amounts disclosed are included in the change in unrealized appreciation (depreciation) on investments.
Note 3 — AGREEMENTS
The Funds’ investment adviser is Westchester Capital Management, LLC pursuant to an investment advisory agreement between TMF and the Adviser dated as of January 1, 2011 (the “TMF Advisory Agreement”) and
pursuant to an investment advisory agreement between WCF, with respect to EDF and CEF, and the Adviser dated as of November 13, 2017 (the “EDF and CEF Advisory Agreement” and together with the TMF Advisory Agreement, the “Advisory Agreements”).
Under the terms of the TMF Advisory Agreement, the Adviser is entitled to receive a fee, calculated daily and payable monthly, at the annual rate of 1.00% of TMF’s average daily net assets. The Adviser
has agreed until April 30, 2020 to reduce its advisory fee so that the advisory fee will be: (i) 1.00% of the first $2.0 billion in average daily net assets of TMF and (ii) 0.93% on average daily net assets above $2.0 billion (the “TMF Fee Waiver
Agreement”). Investment advisory fees waived by the Adviser on behalf of TMF for the six months ended June 30, 2019 were $343,263.
Under the terms of the EDF and CEF Advisory Agreement, the Adviser is entitled to receive a fee, calculated daily and payable monthly, at the annual rate of 1.25% of EDF’s average daily net assets and
1.00% of CEF’s average daily net assets. The Adviser has contractually agreed until April 30, 2020 to waive its investment advisory fee and to reimburse EDF for other ordinary operating expenses to the extent necessary to limit ordinary operating
85
The Merger Fund and Westchester Capital Funds
NOTES TO THE FINANCIAL STATEMENTS (continued)
June 30, 2019 (Unaudited)
Note 3 — AGREEMENTS (continued)
expenses to an amount not to exceed 1.74% for Institutional Class shares and 1.99% for Investor Class shares (the “EDF Expense Limitation Agreement”). The Advisor has contractually agreed until December 31, 2019 to waive
its investment advisory fee and to reimburse CEF for other ordinary operating expenses to the extent necessary to limit ordinary operating expenses to an amount not to exceed 1.64% for Institutional Class shares and 1.89% for Investor Class shares
(the “CEF Expense Limitation Agreement”). Ordinary operating expenses exclude taxes, commissions, mark-ups, litigation expenses, indemnification expenses, interest expenses, borrowing expenses, including on securities sold short, dividend expenses on
securities sold short, trading or investment expenses, acquired fund fees and expenses, and any extraordinary expenses. To the extent that the Adviser waives its investment advisory fee for EDF or CEF and/or reimburses EDF or CEF for other ordinary
operating expenses, it may seek reimbursement of a portion or all of such amounts at any time within three fiscal years after the fiscal year in which such amounts were waived or reimbursed, subject to the expense limitation in place at the time such
amounts were waived or reimbursed. For the six months ended June 30, 2019, the Adviser recouped $5,319 of advisory fees and other expenses to EDF and for the six months ended June 30, 2019, the Adviser reimbursed $75,547 of advisory fees and other
expenses to CEF.
Investment advisory fees waived and expenses reimbursed on behalf of EDF and CEF that are subject to potential recovery by the Adviser are shown in the following table by year of expiration.
|
WCM Alternatives: Event-Driven Fund
|
Year of Expiration
|
Potential Recovery
|
|
12/31/2019
|
$ 5,319(a)
|
|
|
WCM Alternatives: Credit Event Fund
|
Year of Expiration
|
Potential Recovery
|
|
12/31/2020
|
$173,278
|
|
|
12/31/2021
|
$ 75,547
|
|
(a)
|
For the six months ended June 30, 2019, the Advisor has recouped/recovered all available fees and expenses.
|
Each of the TMF Fee Waiver Agreement, the EDF Expense Limitation Agreement and the CEF Expense Limitation Agreement may be terminated at any time by such Fund’s Board of Trustees. Certain officers of the
Funds are also officers of the Adviser. Each Advisory Agreement was approved for an initial term of two years and thereafter will remain in effect from year to year provided that such continuance is specifically approved at least annually by the vote
of a majority of the relevant Fund’s Trustees who are not interested persons of the Adviser or such Fund or by a vote of a majority of the outstanding voting securities of such Fund.
U.S. Bancorp Fund Services, LLC, doing business as U.S. Bank Global Fund Services (“Fund Services”) and a subsidiary of U.S. Bancorp, a publicly held bank holding company, serves as transfer agent,
administrator,
86
The Merger Fund and Westchester Capital Funds
NOTES TO THE FINANCIAL STATEMENTS (continued)
June 30, 2019 (Unaudited)
Note 3 — AGREEMENTS (continued)
accountant, dividend paying agent and shareholder servicing agent for the Funds. U.S. Bank, N.A. serves as custodian for the Funds.
Distribution services are performed pursuant to distribution contracts with broker-dealers and other qualified institutions.
Note 4 — SHARES OF BENEFICIAL INTEREST
The Board of Trustees of each Fund has the authority to issue an unlimited amount of shares of beneficial interest without par value.
Changes in shares of beneficial interest were as follows:
|
Six Months Ended
|
Year Ended
|
|||||||||||||||
|
The Merger Fund
|
June 30, 2019
|
December 31, 2018
|
||||||||||||||
|
Investor Class
|
Shares
|
Amount
|
Shares
|
Amount
|
||||||||||||
|
Issued
|
14,271,056
|
$
|
237,258,054
|
33,197,364
|
$
|
553,768,103
|
||||||||||
|
Issued as reinvestment
|
||||||||||||||||
|
of dividends
|
—
|
—
|
2,808,501
|
46,003,244
|
||||||||||||
|
Redeemed
|
(21,481,788
|
)
|
(359,148,867
|
)
|
(31,786,636
|
)
|
(526,161,249
|
)
|
||||||||
|
Net Increase (Decrease)
|
(7,210,732
|
)
|
$
|
(121,890,813
|
)
|
4,219,229
|
$
|
73,610,098
|
||||||||
|
Six Months Ended
|
Year Ended
|
|||||||||||||||
|
June 30, 2019
|
December 31, 2018
|
|||||||||||||||
|
Institutional Class
|
Shares
|
Amount
|
Shares
|
Amount
|
||||||||||||
|
Issued
|
33,283,218
|
$
|
551,285,429
|
43,506,112
|
$
|
720,447,542
|
||||||||||
|
Issued as reinvestment
|
||||||||||||||||
|
of dividends
|
—
|
—
|
2,631,814
|
42,793,301
|
||||||||||||
|
Redeemed
|
(13,563,152
|
)
|
(224,811,059
|
)
|
(27,148,324
|
)
|
(447,283,602
|
)
|
||||||||
|
Net Increase
|
19,720,066
|
$
|
326,474,370
|
18,989,602
|
$
|
315,957,241
|
||||||||||
|
Six Months Ended
|
Year Ended
|
|||||||||||||||
|
WCM Alternatives:
|
June 30, 2019
|
December 31, 2018
|
||||||||||||||
|
Event-Driven Fund
|
Shares
|
Amount
|
Shares
|
Amount
|
||||||||||||
|
Investor Class
|
||||||||||||||||
|
Issued
|
553,806
|
$
|
5,813,839
|
507,188
|
$
|
5,306,943
|
||||||||||
|
Issued as reinvestment
|
||||||||||||||||
|
of dividends
|
—
|
—
|
51,498
|
519,098
|
||||||||||||
|
Redeemed
|
(168,997
|
)
|
(1,786,750
|
)
|
(86,753
|
)
|
(909,847
|
)
|
||||||||
|
Net Increase
|
384,809
|
$
|
4,027,089
|
471,933
|
$
|
4,916,194
|
||||||||||
|
Six Months Ended
|
Year Ended
|
|||||||||||||||
|
June 30, 2019
|
December 31, 2018
|
|||||||||||||||
|
Institutional Class
|
Shares
|
Amount
|
Shares
|
Amount
|
||||||||||||
|
Issued
|
4,439,725
|
$
|
46,711,624
|
4,957,091
|
$
|
51,992,483
|
||||||||||
|
Issued as reinvestment
|
||||||||||||||||
|
of dividends
|
—
|
—
|
692,534
|
6,994,591
|
||||||||||||
|
Redeemed
|
(1,055,052
|
)
|
(11,114,954
|
)
|
(1,585,769
|
)
|
(16,643,231
|
)
|
||||||||
|
Net Increase
|
3,384,673
|
$
|
35,596,670
|
4,063,856
|
$
|
42,343,843
|
||||||||||
87
The Merger Fund and Westchester Capital Funds
NOTES TO THE FINANCIAL STATEMENTS (continued)
June 30, 2019 (Unaudited)
Note 4 — SHARES OF BENEFICIAL INTEREST (continued)
|
Six Months Ended
|
Year Ended
|
|||||||||||||||
|
WCM Alternatives:
|
June 30, 2019
|
December 31, 2018
|
||||||||||||||
|
Credit Event Fund
|
Shares
|
Amount
|
Shares
|
Amount
|
||||||||||||
|
Investor Class
|
||||||||||||||||
|
Issued
|
—
|
$
|
—
|
4,231
|
$
|
42,400
|
*
|
|||||||||
|
Issued as reinvestment
|
||||||||||||||||
|
of dividends
|
—
|
—
|
57
|
547
|
||||||||||||
|
Redeemed
|
—
|
—
|
(258
|
)
|
(2,561
|
)
|
||||||||||
|
Net Increase
|
—
|
$
|
—
|
4,030
|
$
|
40,386
|
||||||||||
|
Six Months Ended
|
Year Ended
|
|||||||||||||||
|
June 30, 2019
|
December 31, 2018
|
|||||||||||||||
|
Institutional Class
|
Shares
|
Amount
|
Shares
|
Amount
|
||||||||||||
|
Issued
|
—
|
$
|
—
|
395,754
|
$
|
3,960,131
|
*
|
|||||||||
|
Issued as reinvestment
|
||||||||||||||||
|
of dividends
|
—
|
—
|
6,338
|
60,465
|
||||||||||||
|
Redeemed
|
(10,159
|
)
|
(97,224
|
)
|
(10,005
|
)
|
(99,029
|
)
|
||||||||
|
Net Increase (Decrease)
|
(10,159
|
)
|
$
|
(97,224
|
)
|
392,087
|
$
|
3,921,567
|
||||||||
|
*
|
The Fund received a seed investment of $2,700,000 and $10,000 within the Institutional and Investor share class, respectively, on December 29, 2017 in a non-interest bearing account. The Fund did not conduct
investment activity nor incur operating expenses until January 2, 2018.
|
Note 5 — INVESTMENT TRANSACTIONS AND INCOME TAX INFORMATION
TMF’s purchases and sales of securities for the six months ended June 30, 2019 (excluding short-term investments, short-term options, forward currency contracts, swap contracts and securities sold short)
in the aggregate were $2,157,674,948 and $1,545,683,029, respectively. EDF’s purchases and sales of securities for the six months ended June 30, 2019 (excluding short-term investments, short-term options, forward currency contracts, swap contracts
and securities sold short) in the aggregate were $175,829,133 and $142,105,931, respectively. CEF’s purchases and sales of securities for the six months ended June 30, 2019 (excluding short-term investments and swap contracts and reverse repurchase
agreements and securities sold short) in the aggregate were $1,733,124 and $1,749,279, respectively. There were no purchases or sales of long-term U.S. Government securities by the Funds.
88
The Merger Fund and Westchester Capital Funds
NOTES TO THE FINANCIAL STATEMENTS (continued)
June 30, 2019 (Unaudited)
Note 5 — INVESTMENT TRANSACTIONS AND INCOME TAX INFORMATION (continued)
At December 31, 2018, the components of accumulated earnings gains (losses) on a tax basis were as follows:
|
WCM Alternatives:
|
WCM Alternatives:
|
|||||||||||
|
The Merger Fund
|
Event-Driven Fund
|
Credit Event Fund
|
||||||||||
|
Cost of investments*
|
$
|
2,320,747,673
|
$
|
121,954,901
|
$
|
4,128,252
|
||||||
|
Gross unrealized appreciation
|
125,811,658
|
8,141,053
|
23,779
|
|||||||||
|
Gross unrealized depreciation
|
(187,950,252
|
)
|
(10,569,904
|
)
|
(76,882
|
)
|
||||||
|
Net unrealized depreciation
|
$
|
(62,138,594
|
)
|
$
|
(2,428,851
|
)
|
$
|
(53,103
|
)
|
|||
|
Undistributed ordinary income
|
42,262,347
|
2,055,265
|
—
|
|||||||||
|
Undistributed long-term capital gain
|
—
|
—
|
—
|
|||||||||
|
Total distributable earnings
|
$
|
42,262,347
|
$
|
2,055,265
|
$
|
—
|
||||||
|
Other accumulated losses
|
(5,589,182
|
)
|
(1,071,493
|
)
|
(126,584
|
)
|
||||||
|
Total accumulated gains (losses)
|
$
|
(25,465,429
|
)
|
$
|
(1,445,079
|
)
|
$
|
(179,687
|
)
|
|||
|
*
|
Represents cost (including derivative contracts) for federal income tax purposes and differs from the cost for financial reporting purposes due to wash sales, constructive sales, PFIC mark to market, and unsettled
short losses.
|
GAAP requires that certain components of net assets relating to permanent differences be reclassified between financial and tax reporting. Permanent differences are primarily related to foreign currency
transactions and swap treatment. These reclassifications have no effect on net assets or net asset value per share. For the year ended December 31, 2018, the following table shows the reclassifications made:
|
Distributable
|
||||||||
|
Loss
|
Paid-in Capital
|
|||||||
|
The Merger Fund
|
$
|
222,089
|
$
|
(222,089
|
)
|
|||
|
WCM Alternatives: Event-Driven Fund
|
$
|
1,848
|
$
|
(1,848
|
)
|
|||
|
WCM Alternatives: Credit Event Fund
|
$
|
—
|
$
|
—
|
||||
The tax components of dividends paid during the six months ended June 30, 2019 and the year ended December 31, 2018 were as follows:
|
WCM Alternatives:
|
WCM Alternatives:
|
|||||||||||||||||||||||
|
The Merger Fund
|
Event-Driven Fund
|
Credit Event Fund
|
||||||||||||||||||||||
|
Investor Class
|
2019
|
2018
|
2019
|
2018
|
2019
|
2018
|
||||||||||||||||||
|
Ordinary Income
|
$
|
—
|
$
|
48,391,719
|
$
|
—
|
$
|
519,098
|
$
|
—
|
$
|
547
|
||||||||||||
|
Long-Term Capital Gains
|
—
|
6,684,398
|
—
|
—
|
—
|
—
|
||||||||||||||||||
|
Total Distributions Paid
|
$
|
—
|
$
|
55,076,117
|
$
|
—
|
$
|
519,098
|
$
|
—
|
$
|
547
|
||||||||||||
|
Institutional Class
|
||||||||||||||||||||||||
|
Ordinary Income
|
$
|
—
|
$
|
62,454,617
|
$
|
—
|
$
|
7,102,230
|
$
|
—
|
$
|
60,465
|
||||||||||||
|
Long-Term Capital Gains
|
—
|
8,026,173
|
—
|
—
|
—
|
—
|
||||||||||||||||||
|
Total Distributions Paid
|
$
|
—
|
$
|
70,480,790
|
$
|
—
|
$
|
7,102,230
|
$
|
—
|
$
|
60,465
|
||||||||||||
89
The Merger Fund and Westchester Capital Funds
NOTES TO THE FINANCIAL STATEMENTS (continued)
June 30, 2019 (Unaudited)
Note 5 — INVESTMENT TRANSACTIONS AND INCOME TAX INFORMATION (continued)
The Funds designated as long-term capital gain dividend, pursuant to Internal Revenue Case Section 852(b)(3), the amount necessary to reduce the earnings and profits of the Fund related to net capital
gain to zero for the tax year ended December 31, 2018.
As of December 31, 2018, TMF and CEF had post-October ordinary losses of $266,156 and $53,164, respectively. As of December 31, 2018, EDF did not have any post-October ordinary losses deferred, on a tax
basis. As of December 31, 2018, TMF had no short-term or long-term capital loss carryover. As of December 31, 2018, EDF had $1,012,419 of short-term and no long-term capital loss carryover. As of December 31, 2018, CEF had $73,420 of short-term
and no long-term capital loss carryover.
Note 6 — DISTRIBUTION PLAN
TMF has adopted an Amended and Restated Plan of Distribution (the “TMF Plan”) dated July 30, 2013, pursuant to Rule 12b-1 under the 1940 Act that applies to TMF’s Investor Class shares. EDF has adopted a
Plan of Distribution (the “EDF Plan”) dated July 30, 2013, pursuant to Rule 12b-1 under the 1940 Act that applies to EDF’s Investor Class shares. CEF has adopted a Plan of Distribution (the “CEF Plan” and together with the TMF Plan and EDF Plan, the
“Plans”) dated October 31, 2017, pursuant to Rule 12b-1 under the 1940 Act that applies to CEF’s Investor Class shares. Under each Plan, a Fund may pay the Fund's distributor for certain of the distribution and shareholder service expenses
associated with the Fund's Investor Class shares, as well as to reimburse the distributor for payments made to any broker-dealer or other financial intermediary with whom the Fund has entered into a contract to distribute the Fund's Investor Class
shares, or any other qualified financial services firm, to compensate those broker-dealers, intermediaries or firms for distribution and/or shareholder-related services with respect to the Fund's Investor Class shares held or purchased by their
respective customers or in connection with the purchase of the Fund's Investor Class shares attributable to their efforts. Under each Plan, the amount of such compensation paid in any one year shall not exceed 0.25% annually of the average daily net
assets attributable to the respective Fund’s Investor Class shares, which may be payable as a distribution fee or a service fee for providing permitted recordkeeping, subaccounting, subtransfer agency and/or shareholder liaison services. For the six
months ended June 30, 2019, TMF incurred $1,589,697 pursuant to the TMF Plan in respect of TMF’s Investor Class shares. For the six months ended June 30, 2019, EDF incurred $16,536 pursuant to the EDF Plan in respect of EDF’s Investor Class shares.
For the
90
The Merger Fund and Westchester Capital Funds
NOTES TO THE FINANCIAL STATEMENTS (continued)
June 30, 2019 (Unaudited)
Note 6 — DISTRIBUTION PLAN (continued)
six months ended June 30, 2019, CEF incurred $50 pursuant to the CEF Plan in respect of CEF’s Investor Class shares. Each Plan will remain in effect from year to year provided such continuance is approved at least annually
by a vote either of a majority of the relevant Fund’s Trustees, including a majority of the non-interested Trustees, or a majority of the relevant Fund’s outstanding Investor Class shares.
Note 7 — OFFSETTING ASSETS AND LIABILITIES
Each Fund is subject to various Master Netting Arrangements, which govern the terms of certain transactions with select counterparties. The Master Netting Arrangements allow each Fund to close out and net
its total exposure to a counterparty in the event of a default with respect to all the transactions governed under a single agreement with a counterparty. The Master Netting Arrangements also specify collateral posting arrangements at pre-arranged
exposure levels. Under the Master Netting Arrangements, collateral is routinely transferred if the total net exposure to certain transactions (net of existing collateral already in place) governed under the relevant Master Netting Arrangement with a
counterparty in a given account exceeds a specified threshold depending on the counterparty and the type of Master Netting Arrangement.
91
The Merger Fund and Westchester Capital Funds
NOTES TO THE FINANCIAL STATEMENTS (continued)
June 30, 2019 (Unaudited)
Note 7 — OFFSETTING ASSETS AND LIABILITIES (continued)
The Merger Fund
|
Gross
|
Net
|
|||||||||||||||||||||||
|
Amounts
|
Amounts
|
|||||||||||||||||||||||
|
Offset
|
Presented
|
Gross Amounts not
|
||||||||||||||||||||||
|
Gross
|
in the
|
in the
|
offset in the Statement
|
|||||||||||||||||||||
|
Amounts of
|
Statement
|
Statement
|
of Assets and Liabilities
|
|||||||||||||||||||||
|
Recognized
|
of Assets
|
of Assets
|
Collateral
|
|||||||||||||||||||||
|
Assets/
|
and
|
and
|
Financial
|
Received/
|
Net
|
|||||||||||||||||||
|
Liabilities
|
Liabilities
|
Liabilities
|
Instruments
|
Pledged*
|
Amount
|
|||||||||||||||||||
|
Assets:
|
||||||||||||||||||||||||
|
Description
|
||||||||||||||||||||||||
|
Forward
|
||||||||||||||||||||||||
|
Currency
|
||||||||||||||||||||||||
|
Exchange
|
||||||||||||||||||||||||
|
Contracts**
|
$
|
2,263,682
|
$
|
2,263,682
|
$
|
—
|
$
|
—
|
$
|
—
|
$
|
—
|
||||||||||||
|
Swap Contracts —
|
||||||||||||||||||||||||
|
Bank of America
|
||||||||||||||||||||||||
|
Merrill Lynch
|
||||||||||||||||||||||||
|
& Co., Inc.
|
292,217
|
292,217
|
—
|
—
|
—
|
—
|
||||||||||||||||||
|
Swap Contracts —
|
||||||||||||||||||||||||
|
JPMorgan
|
||||||||||||||||||||||||
|
Chase &
|
||||||||||||||||||||||||
|
Co., Inc.
|
606,807
|
443,323
|
163,484
|
—
|
—
|
163,484
|
||||||||||||||||||
|
$
|
3,162,706
|
$
|
2,999,222
|
$
|
163,484
|
$
|
—
|
$
|
—
|
$
|
163,484
|
|||||||||||||
|
Liabilities:
|
||||||||||||||||||||||||
|
Description
|
||||||||||||||||||||||||
|
Written Option
|
||||||||||||||||||||||||
|
Contracts**
|
$
|
3,322,714
|
$
|
—
|
$
|
3,322,714
|
$
|
—
|
$
|
3,322,714
|
$
|
—
|
||||||||||||
|
Forward
|
||||||||||||||||||||||||
|
Currency
|
||||||||||||||||||||||||
|
Exchange
|
||||||||||||||||||||||||
|
Contracts**
|
2,838,712
|
2,263,682
|
575,030
|
—
|
575,030
|
—
|
||||||||||||||||||
|
Swap Contracts —
|
||||||||||||||||||||||||
|
Bank of America
|
||||||||||||||||||||||||
|
Merrill Lynch
|
||||||||||||||||||||||||
|
& Co., Inc.
|
363,031
|
292,217
|
70,814
|
—
|
70,814
|
—
|
||||||||||||||||||
|
Swap Contracts —
|
||||||||||||||||||||||||
|
JPMorgan
|
||||||||||||||||||||||||
|
Chase &
|
||||||||||||||||||||||||
|
Co., Inc.
|
443,323
|
443,323
|
—
|
—
|
—
|
—
|
||||||||||||||||||
|
$
|
6,967,780
|
$
|
2,999,222
|
$
|
3,968,558
|
$
|
—
|
$
|
3,968,558
|
$
|
—
|
|||||||||||||
92
The Merger Fund and Westchester Capital Funds
NOTES TO THE FINANCIAL STATEMENTS (continued)
June 30, 2019 (Unaudited)
Note 7 — OFFSETTING ASSETS AND LIABILITIES (continued)
WCM Alternatives: Event-Driven Fund
|
Gross
|
Net
|
|||||||||||||||||||||||
|
Amounts
|
Amounts
|
|||||||||||||||||||||||
|
Offset
|
Presented
|
Gross Amounts not
|
||||||||||||||||||||||
|
Gross
|
in the
|
in the
|
offset in the Statement
|
|||||||||||||||||||||
|
Amounts of
|
Statement
|
Statement
|
of Assets and Liabilities
|
|||||||||||||||||||||
|
Recognized
|
of Assets
|
of Assets
|
Collateral
|
|||||||||||||||||||||
|
Assets/
|
and
|
and
|
Financial
|
Received/
|
Net
|
|||||||||||||||||||
|
Liabilities
|
Liabilities
|
Liabilities
|
Instruments
|
Pledged*
|
Amount
|
|||||||||||||||||||
|
Assets:
|
||||||||||||||||||||||||
|
Description
|
||||||||||||||||||||||||
|
Forward
|
||||||||||||||||||||||||
|
Currency
|
||||||||||||||||||||||||
|
Exchange
|
||||||||||||||||||||||||
|
Contracts**
|
$
|
124,264
|
$
|
124,264
|
$
|
—
|
$
|
—
|
$
|
—
|
$
|
—
|
||||||||||||
|
Swap
|
||||||||||||||||||||||||
|
Contracts —
|
||||||||||||||||||||||||
|
Bank of America
|
||||||||||||||||||||||||
|
Merrill Lynch
|
||||||||||||||||||||||||
|
& Co., Inc.
|
1,565,550
|
1,159,453
|
406,097
|
—
|
—
|
406,097
|
||||||||||||||||||
|
Swap
|
||||||||||||||||||||||||
|
Contracts —
|
||||||||||||||||||||||||
|
JPMorgan
|
||||||||||||||||||||||||
|
Chase &
|
||||||||||||||||||||||||
|
Co., Inc.
|
1,192,604
|
1,192,604
|
—
|
—
|
—
|
—
|
||||||||||||||||||
|
Swap Contracts —
|
||||||||||||||||||||||||
|
Goldman,
|
||||||||||||||||||||||||
|
Sachs & Co.
|
83,501
|
—
|
83,501
|
—
|
—
|
83,501
|
||||||||||||||||||
|
$
|
2,965,919
|
$
|
2,476,321
|
$
|
489,598
|
$
|
—
|
$
|
—
|
$
|
489,598
|
|||||||||||||
|
Liabilities:
|
||||||||||||||||||||||||
|
Description
|
||||||||||||||||||||||||
|
Written
|
||||||||||||||||||||||||
|
Option
|
||||||||||||||||||||||||
|
Contracts**
|
$
|
2,870,762
|
$
|
—
|
$
|
2,870,762
|
$
|
—
|
$
|
2,870,762
|
$
|
—
|
||||||||||||
|
Forward
|
||||||||||||||||||||||||
|
Currency
|
||||||||||||||||||||||||
|
Exchange
|
||||||||||||||||||||||||
|
Contracts**
|
173,757
|
124,264
|
49,493
|
—
|
49,493
|
—
|
||||||||||||||||||
|
Swap
|
||||||||||||||||||||||||
|
Contracts —
|
||||||||||||||||||||||||
|
Bank of America
|
||||||||||||||||||||||||
|
Merrill Lynch
|
||||||||||||||||||||||||
|
& Co., Inc.
|
1,159,453
|
1,159,453
|
—
|
—
|
—
|
—
|
||||||||||||||||||
|
Swap
|
||||||||||||||||||||||||
|
Contracts —
|
||||||||||||||||||||||||
|
JPMorgan
|
||||||||||||||||||||||||
|
Chase &
|
||||||||||||||||||||||||
|
Co., Inc.
|
1,283,850
|
1,192,604
|
91,246
|
—
|
91,246
|
—
|
||||||||||||||||||
|
Swap Contracts —
|
||||||||||||||||||||||||
|
Goldman,
|
||||||||||||||||||||||||
|
Sachs & Co.
|
—
|
—
|
—
|
—
|
—
|
—
|
||||||||||||||||||
|
$
|
5,487,822
|
$
|
2,476,321
|
$
|
3,011,501
|
$
|
—
|
$
|
3,011,501
|
$
|
—
|
|||||||||||||
93
The Merger Fund and Westchester Capital Funds
NOTES TO THE FINANCIAL STATEMENTS (continued)
June 30, 2019 (Unaudited)
Note 7 — OFFSETTING ASSETS AND LIABILITIES (continued)
WCM Alternatives: Credit Event Fund
|
Gross
|
Net
|
|||||||||||||||||||||||
|
Amounts
|
Amounts
|
|||||||||||||||||||||||
|
Offset
|
Presented
|
Gross Amounts not
|
||||||||||||||||||||||
|
Gross
|
in the
|
in the
|
offset in the Statement
|
|||||||||||||||||||||
|
Amounts of
|
Statement
|
Statement
|
of Assets and Liabilities
|
|||||||||||||||||||||
|
Recognized
|
of Assets
|
of Assets
|
Collateral
|
|||||||||||||||||||||
|
Assets/
|
and
|
and
|
Financial
|
Received/
|
Net
|
|||||||||||||||||||
|
Liabilities
|
Liabilities
|
Liabilities
|
Instruments
|
Pledged*
|
Amount
|
|||||||||||||||||||
|
Assets:
|
||||||||||||||||||||||||
|
Description
|
||||||||||||||||||||||||
|
Swap
|
||||||||||||||||||||||||
|
Contracts —
|
||||||||||||||||||||||||
|
JPMorgan
|
||||||||||||||||||||||||
|
Chase &
|
||||||||||||||||||||||||
|
Co., Inc.
|
$
|
25,682
|
$
|
25,682
|
$
|
—
|
$
|
—
|
$
|
—
|
$
|
—
|
||||||||||||
|
|
$
|
25,682
|
$
|
25,682
|
$
|
—
|
$
|
—
|
$
|
—
|
$
|
—
|
||||||||||||
|
Liabilities:
|
||||||||||||||||||||||||
|
Description
|
||||||||||||||||||||||||
|
Swap
|
||||||||||||||||||||||||
|
Contracts —
|
||||||||||||||||||||||||
|
JPMorgan
|
||||||||||||||||||||||||
|
Chase &
|
||||||||||||||||||||||||
|
Co., Inc.
|
$
|
38,113
|
$
|
25,682
|
$
|
12,431
|
$
|
—
|
$
|
12,431
|
$
|
—
|
||||||||||||
|
Reverse
|
||||||||||||||||||||||||
|
Repurchase
|
||||||||||||||||||||||||
|
Agreements —
|
||||||||||||||||||||||||
|
JPMorgan
|
||||||||||||||||||||||||
|
Chase &
|
||||||||||||||||||||||||
|
Co., Inc.
|
352,000
|
—
|
352,000
|
—
|
352,000
|
—
|
||||||||||||||||||
|
$
|
390,113
|
$
|
25,682
|
$
|
364,431
|
$
|
—
|
$
|
364,431
|
$
|
—
|
|||||||||||||
|
*
|
In some instances, the actual collateral received/pledged may be more than amount shown.
|
|
|
**
|
JPMorgan Chase & Co., Inc. is the counterparty for all open forward currency exchange contracts and reverse repurchase agreements and the prime broker for all written option contracts held by the Funds as of
June 30, 2019.
|
Note 8 — ACCOUNTING PRONOUNCEMENTS
In August 2018, FASB issued ASU 2018-13, Fair Value Measurement (Topic 820): Disclosure Framework—Changes to the Disclosure Requirements for Fair Value Measurement (“ASU 2018-13”). The primary focus of
ASU 2018-13 is to improve the effectiveness of the disclosure requirements for fair value measurements. The changes affect all companies that are required to include fair value measurement disclosures. In general, the amendments in ASU 2018-13 are
effective for all entities for fiscal years and interim periods within those fiscal years, beginning after December 15, 2019. An entity is permitted to early adopt the removed or modified disclosures upon the issuance of ASU 2018-13 and may delay
adoption of the additional disclosures, which are required for public companies only,
94
The Merger Fund and Westchester Capital Funds
NOTES TO THE FINANCIAL STATEMENTS (continued)
June 30, 2019 (Unaudited)
Note 8 — ACCOUNTING PRONOUNCEMENTS (continued)
until their effective date. Management has evaluated the impact of these changes and has incorporated these changes, as applicable, to the Funds’ financial statements and disclosures here and within.
Note 9 — SECURITIES LENDING
Effective November 13, 2018, TMF became authorized to engage in securities lending in order to generate additional income. TMF is able to lend to approved borrowers. TMF’s custodian, U.S. Bank N.A. serves
as the lending agent for TMF, pursuant to a Securities Lending Agreement (the “Securities Lending Agreement”). Securities loaned are collateralized by cash equal to at least 100% of the market value plus accrued interest on the securities lent, which
is invested in the Mount Vernon Liquid Assets Portfolio, LLC. TMF retains loan fees and the interest on cash collateral investments but is required to pay the borrower a rebate for the use of cash collateral. In cases where the lent security is of
high value to borrowers, there may be a negative rebate (i.e., a net payment from the borrower to TMF). Upon termination of a loan, TMF is required to return to the borrower an amount equal to the cash collateral, plus any rebate owed to the
borrowers. The remaining maturities of the securities lending transactions are considered overnight and continuous. Loans are subject to termination by TMF or the borrower at any time.
The net income earned on the securities lending (after payment of rebates and U.S Bank N.A.’s fee) is included on the Statements of Operations as Securities lending income (net). TMF also received
payments from the borrower during the period of the loan, equivalent to dividends and interest earned on the securities loaned, which are recorded as Dividend or Interest income, respectively, on the Statements of Operations.
Under the Securities Lending Agreement, U.S Bank N.A. marks to market the loaned securities on a daily basis. In the event the cash received from the borrower is less than 102% of the value of the loaned
securities (105% for loaned securities that are non-U.S. securities), U.S. Bank N.A. requests additional cash from the borrower so as to maintain a collateralization level of at least 102% of the value of the loaned securities plus accrued interest
(105% for loans of non-U.S. securities).
The value of securities out on loan is recorded as an asset on the Statements of Assets and Liabilities. The value of the cash collateral received is recorded as a liability on the Statements of Assets
and Liabilities and details of collateral investments are disclosed on the Schedule of Investments. At June 30, 2019, the value of outstanding securities on loan and the value of collateral investment were as follows:
95
The Merger Fund and Westchester Capital Funds
NOTES TO THE FINANCIAL STATEMENTS (continued)
June 30, 2019 (Unaudited)
Note 9 — SECURITIES LENDING (continued)
|
Value of
|
Cash
|
Total value
|
|
|
Securities
|
Collateral Posted
|
of Collateral
|
|
|
on Loan
|
by Borrower
|
Investments
|
|
|
Mount Vernon Liquid Asset Portfolio, LLC*
|
$60,235,769
|
$61,258,584
|
$61,258,584
|
|
*
|
Please refer to the Schedule of Investments to view classification as this instrument is classified as a short-term fund and is not a registered money market fund.
|
TMF bears the risk of loss associated with the collateral investments and are not entitled to additional collateral from the borrower to cover any such losses. To the extent that the value of the
collateral investments declines below the amount owed to a borrower, TMF may incur losses that exceed the amount they earned on lending the security. Upon termination of a loan, TMF may use leverage (borrow money) to repay the borrower for cash
collateral posted if the Adviser does not believe that it is prudent to sell the collateral investments to fund the payment of this liability.
TMF is not subject to a master netting agreement with respect to securities lending.
Securities lending also involves counterparty risks, including the risk that the loaned securities may not be returned in a timely manner or at all. Subject to certain conditions, U.S Bank N.A. has agreed
to indemnify TMF from losses resulting from a borrower’s failure to return a loaned security.
Note 10 — SUBSEQUENT EVENTS
Management has evaluated events and transactions occurring after June 30, 2019 through the date that the financial statements were issued, and has determined that no additional disclosure in the financial
statements is required.
96
ADDITIONAL INFORMATION (Unaudited)
For the fiscal year ended December 31, 2018, certain dividends paid by TMF may be subject to a maximum tax rate of 15% as provided for by the Jobs and Growth Tax Relief Reconciliation Act of 2003. The
percentage of dividends declared from ordinary income designated as qualified dividend income for the fiscal year ended December 31, 2018 was 43.27% for TMF and 14.23% for EDF and 8.47% for CEF.
For corporate shareholders, the percent of ordinary income distributions qualifying for the corporate dividends-received deduction for the fiscal year ended December 31, 2018 was 34.52% for TMF and 9.06%
for EDF and 8.37% for CEF.
The percentage of taxable ordinary income distributions that are designated as short-term capital gain distributions under Internal Revenue Code Section 871(k)(2)(c) for the fiscal year ended December 31,
2018 was 68.78% for TMF and 23.45% for EDF and 0.00% for CEF.
AVAILABILITY OF PROXY VOTING INFORMATION
Information regarding how the Funds generally vote proxies relating to portfolio securities may be obtained without charge by calling the Funds’ Transfer Agent at 1-800-343-8959 or by visiting the SEC’s
website at www.sec.gov. Information regarding how the Funds voted proxies during the most recent 12-month period ended June 30 is available on the SEC’s website or by calling the toll-free number listed above.
AVAILABILITY OF QUARTERLY PORTFOLIO SCHEDULE
The Funds file their complete schedule of portfolio holdings with the SEC for the first and third quarters of each fiscal year on Part F of Form N-PORT. The Funds’ Parts F of Form N-PORT are available on
the SEC’s website at www.sec.gov. Once filed, the most recent Parts F of Form N-PORT will also be available without charge, upon request, by calling 1-800-343-8959.
97
The Merger Fund and Westchester Capital Funds
PRIVACY POLICY
We collect the following non-public personal information about you:
|
•
|
Information we receive from you on or in applications or other forms, correspondence, or conversations, including, but not limited to, your name, address, phone number, social security number, assets, income and
date of birth; and
|
|
|
•
|
Information about your transactions with us, our affiliates, or others, including, but not limited to, your account number and balance, payments history, parties to transactions, cost basis information, and other
financial information.
|
We do not disclose any non-public personal information about our current or former shareholders to non-affiliated third parties, except as permitted by law. For example, we are permitted by law to disclose all of the
information we collect, as described above, to our transfer agent to process your transactions. Furthermore, we restrict access to your non- public personal information to those persons who require such information to provide products or services to
you. We maintain physical, electronic, and procedural safeguards that comply with federal standards to guard your non-public personal information.
In the event that you hold shares of the Fund through a financial intermediary, including, but not limited to, a broker-dealer, bank, or trust company, the privacy policy of your financial intermediary would govern how your
non-public personal information would be shared with non- affiliated third parties.
THIS PRIVACY POLICY IS NOT A PART OF THE SEMI-ANNUAL REPORT.
98
(This Page Intentionally Left Blank.)
Investment Adviser
Westchester Capital Management, LLC
100 Summit Lake Drive
Valhalla, NY 10595
(914) 741-5600
www.westchestercapitalfunds.com
Administrator, Transfer Agent, Accountant,
Dividend Paying Agent and Shareholder Servicing Agent
U.S. Bancorp Fund Services, LLC
615 East Michigan Street
P.O. Box 701
Milwaukee, WI 53201-0701
(800) 343-8959
Custodian
U.S. Bank, N.A.
1555 North Rivercenter Drive, Suite 302
Milwaukee, WI 53212
(800) 343-8959
Distributor
Compass Distributors, LLC
Three Canal Plaza, 3rd Floor
Portland, ME 04101
Trustees
Roy Behren
Michael T. Shannon
Barry Hamerling
Richard V. Silver
Christianna Wood
Executive Officers
Roy Behren, Co-President and Treasurer
Michael T. Shannon, Co-President
Bruce Rubin, Vice President and
Chief Compliance Officer
Abraham R. Cary, Secretary
Counsel
Ropes & Gray LLP
1211 Avenue of the Americas
New York, NY 10036
Independent Registered
Public Accounting Firm
PricewaterhouseCoopers LLP
300 Madison Avenue
New York, NY 10017
This report is authorized for distribution only when
preceded or accompanied by a current prospectus.
Item 2. Code of Ethics.
Not applicable for semi-annual reports.
Item 3. Audit Committee Financial Expert.
Not applicable for semi-annual reports.
Item 4. Principal Accountant Fees and Services.
Not applicable for semi-annual reports.
Item 5. Audit Committee of Listed Registrants.
Not applicable.
Item 6. Investments.
The registrant’s Schedule of Investments is included as part of the report to shareholders filed under Item 1 of this Form.
Item 7. Disclosure of Proxy Voting Policies and Procedures for Closed-End Management Investment Companies.
Not applicable to open-end investment companies.
Item 8. Portfolio Managers of Closed-End Management Investment Companies.
Not applicable to open-end investment companies.
Item 9. Purchases of Equity Securities by Closed‑End Management Investment Company and Affiliated Purchasers.
Not applicable to open-end investment companies.
Item 10. Submission of Matters to a Vote of Security Holders.
There have been no material changes to the procedures by which shareholders may recommend nominees to the registrant’s board of trustees.
Item 11. Controls and Procedures.
|
(a)
|
The registrant’s Co-Presidents/Chief Executive Officers and Treasurer/Chief Financial Officer have reviewed the registrant's disclosure controls and procedures (as defined in Rule 30a-3(c) under the Investment Company Act of 1940 (the
“Act”)) as of a date within 90 days of the filing of this report, as required by Rule 30a-3(b) under the Act and Rules 13a-15(b) or 15d‑15(b) under the Securities Exchange Act of 1934. Based on their review, such officers have concluded
that the disclosure controls and procedures are effective in ensuring that information required to be disclosed in this report is appropriately recorded, processed, summarized and reported and made known to them by others within the
registrant and by the registrant’s service provider.
|
| (b) |
There were no changes in the registrant's internal control over financial reporting (as defined in Rule 30a-3(d) under the Act) that occurred during the second fiscal quarter of the period covered by this report that has materially
affected, or is reasonably likely to materially affect, the registrant's internal control over financial reporting.
|
Item 12. Disclosure of Securities Lending Activities for Closed-End Management Investment Companies.
Not applicable to open-end investment companies.
Item 13. Exhibits.
|
(a)
|
(1) Any code of ethics or amendment thereto, that is the subject of the disclosure required by Item 2, to the extent that the registrant intends to satisfy Item 2 requirements through filing an
exhibit. Not Applicable.
|
(2) A separate certification for each principal executive officer and principal financial officer pursuant to Section 302 of the Sarbanes-Oxley Act of 2002. Filed herewith.
(3) Any written solicitation to purchase securities under Rule 23c‑1 under the Act sent or given during the period covered by the report by or on behalf of the registrant to 10 or
more persons. Not applicable to open-end investment companies.
(4) Change in the registrant’s independent public accountant. Provide the information called for by Item 4 of Form 8-K under the Exchange Act (17 CFR 249.308). Unless otherwise
specified by Item 4, or related to and necessary for a complete understanding of information not previously disclosed, the information should relate to events occurring during the reporting period. Not Applicable.
|
(b)
|
Certifications pursuant to Section 906 of the Sarbanes‑Oxley Act of 2002. Furnished herewith.
|
SIGNATURES
Pursuant to the requirements of the Securities Exchange Act of 1934 and the Investment Company Act of 1940, the registrant has duly caused this report to be signed on its behalf by the undersigned, thereunto duly
authorized.
(Registrant) The Merger Fund
By (Signature and Title)* /s/ Michael T. Shannon
Michael T. Shannon, Co-President
Date September 3, 2019
By (Signature and Title)* /s/ Roy Behren
Roy Behren, Co-President and Treasurer
Date September 3, 2019
Pursuant to the requirements of the Securities Exchange Act of 1934 and the Investment Company Act of 1940, this report has been signed below by the following persons on behalf of the registrant and in the capacities
and on the dates indicated.
By (Signature and Title)* /s/ Michael T. Shannon
Michael T. Shannon, Co-President
Date September 3, 2019
By (Signature and Title)* /s/ Roy Behren
Roy Behren, Co-President and Treasurer
Date September 3, 2019
* Print the name and title of each signing officer under his or her signature.