UNITED STATES
SECURITIES AND EXCHANGE COMMISSION
Washington, D.C. 20549
FORM 10-K
(Mark One)
For the fiscal year ended December 31, 2019
or
For the transition period from _________ to_________
Commission file number: 001-01011

(Exact name of registrant as specified in its charter)
(State or other jurisdiction of incorporation or organization) | (I.R.S. Employer Identification No.) |
(Address of principal executive offices) | (Zip Code) | ||
Registrant’s telephone number, including area code: | ||
Securities registered pursuant to Section 12(b) of the Act: | ||
Title of each class | Trading Symbol(s) | Name of each exchange on which registered |
Securities registered pursuant to Section 12(g) of the Act: | None | |
Indicate by check mark if the registrant is a well-known seasoned issuer, as defined in Rule 405 of the Securities Act. | ☑ | ☐ | No | ||||
Indicate by check mark if the registrant is not required to file reports pursuant to Section 13 or Section 15(d) of the Act. | ☐ | Yes | ☑ | ||||
Indicate by check mark whether the registrant (1) has filed all reports required to be filed by Section 13 or 15(d) of the Securities Exchange Act of 1934 during the preceding 12 months (or for such shorter period that the registrant was required to file such reports), and (2) has been subject to such filing requirements for the past 90 days. | ☑ | ☐ | No | ||||
Indicate by check mark whether the registrant has submitted electronically every Interactive Data File required to be submitted pursuant to Rule 405 of Regulation S-T (§232.405 of this chapter) during the preceding 12 months (or for such shorter period that the registrant was required to submit such files). | ☑ | ☐ | No | ||||
Indicate by check mark whether the registrant is a large accelerated filer, an accelerated filer, a non-accelerated filer, a smaller reporting company, or an emerging growth company. See the definitions of “large accelerated filer,” “accelerated filer,” “smaller reporting company,” and “emerging growth company” in Rule 12b-2 of the Exchange Act. | |||||||
☑ | Accelerated filer | ☐ | |||||
Non-accelerated filer | ☐ | Smaller reporting company | |||||
Emerging growth company | |||||||
If an emerging growth company, indicate by check mark if the registrant has elected not to use the extended transition period for complying with any new or revised financial accounting standards provided pursuant to Section 13(a) of the Exchange Act. | ☐ | ||||||
Indicate by check mark whether the registrant is a shell company (as defined in Rule 12b-2 of the Act). | Yes | ☑ | No | ||||
The aggregate market value of the registrant’s common stock held by non-affiliates was approximately $70,617,679,934 as of June 28, 2019, based on the closing price of the common stock on the New York Stock Exchange. For purposes of this calculation, only executive officers and directors are deemed to be affiliates of the registrant.
As of February 12, 2020, the registrant had 1,304,159,680 shares of common stock outstanding.
DOCUMENTS INCORPORATED BY REFERENCE
The following materials are incorporated by reference into this Form 10-K:
Information contained in the definitive proxy statement for CVS Health Corporation’s 2020 Annual Meeting of Stockholders, to be filed with the Securities and Exchange Commission within 120 days after the end of the fiscal year ended December 31, 2019 (the “Proxy Statement”), is incorporated by reference in Parts III and IV to the extent described therein.
TABLE OF CONTENTS
Page | ||
Part I | ||
Item 1: | ||
Item 1A: | ||
Item 1B: | ||
Item 2: | ||
Item 3: | ||
Item 4: | ||
Part II | ||
Item 5: | ||
Item 6: | ||
Item 7: | ||
Item 7A: | ||
Item 8: | ||
Item 9: | ||
Item 9A: | ||
Item 9B: | ||
Part III | ||
Item 10: | ||
Item 11: | ||
Item 12: | ||
Item 13: | ||
Item 14: | ||
Part IV | ||
Item 15: | ||
Item 16: | ||
Unless the context otherwise requires, references to the terms “we,” “our” or “us” used throughout this Annual Report on Form 10-K (this “10-K”) refer to CVS Health Corporation (a Delaware corporation) (“CVS Health”) and its subsidiaries (collectively, the “Company”). References to competitors and other companies throughout this 10-K, including the information incorporated herein by reference, are for illustrative or comparison purposes only and do not indicate that these companies are the Company’s or any segment’s only competitors or closest competitors.
CAUTIONARY STATEMENT CONCERNING FORWARD-LOOKING STATEMENTS
The Private Securities Litigation Reform Act of 1995 (the “Reform Act”) provides a “safe harbor” for forward-looking statements, so long as (1) those statements are identified as forward-looking, and (2) the statements are accompanied by meaningful cautionary statements that identify important factors that could cause actual results to differ materially from those discussed in the statement. We want to take advantage of these safe harbor provisions.
Certain information contained in this 10-K is forward-looking within the meaning of the Reform Act or SEC rules. This information includes, but is not limited to: “Outlook for 2020” of Management’s Discussion and Analysis of Financial Condition and Results of Operations (“MD&A”) included in Item 7, “Quantitative and Qualitative Disclosures About Market Risk” included in Item 7A, “Government Regulation” included in Item 1, and “Risk Factors” included in Item 1A. In addition, throughout this 10-K and our other reports and communications, we use the following words or variations or negatives of these words and similar expressions when we intend to identify forward-looking statements:
· | Anticipates | · | Believes | · | Can | · | Continue | · | Could |
· | Estimates | · | Evaluate | · | Expects | · | Explore | · | Forecast |
· | Guidance | · | Intends | · | Likely | · | May | · | Might |
· | Outlook | · | Plans | · | Potential | · | Predict | · | Probable |
· | Projects | · | Seeks | · | Should | · | View | · | Will |
All statements addressing the future operating performance of CVS Health or any segment or any subsidiary and/or future events or developments, including statements relating to corporate strategy; revenue or adjusted revenue; operating income or adjusted operating income; earnings per share or adjusted earnings per share; Pharmacy Services segment business, sales results and/or trends and/or operations; Retail/LTC segment business, sales results and/or trends and/or operations; Health Care Benefits segment business, sales results and/or trends, medical cost trends, medical membership, Medicare Part D membership, medical benefit ratios and/or operations; incremental investment spending; interest expense; effective tax rate; weighted-average share count; cash flow from operations; net capital expenditures; cash available for debt repayment; integration synergies; net synergies; integration costs; enterprise modernization; transformation; leverage ratio; cash available for enhancing shareholder value; inventory reduction, turn rate and/or loss rate; debt ratings; the Company’s ability to attract or retain customers and clients; store development and/or relocations; new product development; and the impact of industry and regulatory developments, as well as statements expressing optimism or pessimism about future operating results or events, are forward-looking statements within the meaning of the Reform Act.
Forward-looking statements rely on a number of estimates, assumptions and projections concerning future events, and are subject to a number of significant risks and uncertainties and other factors that could cause actual results to differ materially from those statements. Many of these risks and uncertainties and other factors are outside our control. Certain of these risks and uncertainties and other factors are described under “Risk Factors” included in Item 1A of this 10-K; these are not the only risks and uncertainties we face. There can be no assurance that the Company has identified all the risks that affect it. Additional risks and uncertainties not presently known to the Company or that the Company currently believes to be immaterial also may adversely affect the Company’s businesses. If any of those risks or uncertainties develops into actual events, these events or circumstances could have a material adverse effect on the Company’s businesses, operating results, cash flows, financial condition and/or stock price, among other effects.
You should not put undue reliance on forward-looking statements. Any forward-looking statement speaks only as of the date of this 10-K, and we disclaim any intention or obligation to update or revise forward-looking statements, whether as a result of new information, future events, uncertainties or otherwise.
1
PART I
Item 1. Business.
Overview
CVS Health Corporation (“CVS Health”), together with its subsidiaries (collectively, the “Company,” “we,” “our” or “us”), is the nation’s premier health innovation company helping people on their path to better health. Whether in one of its pharmacies or through its health services and plans, CVS Health is pioneering a bold new approach to total health by making quality care more affordable, accessible, simple and seamless. CVS Health is community-based and locally focused, engaging consumers with the care they need when and where they need it. The Company has approximately 9,900 retail locations, approximately 1,100 walk-in medical clinics, a leading pharmacy benefits manager with approximately 105 million plan members, a dedicated senior pharmacy care business serving more than one million patients per year and expanding specialty pharmacy services. CVS Health also serves an estimated 37 million people through traditional, voluntary and consumer-directed health insurance products and related services, including expanding Medicare Advantage offerings and a leading standalone Medicare Part D prescription drug plan (“PDP”). The Company believes its innovative health care model increases access to quality care, delivers better health outcomes and lowers overall health care costs.
On November 28, 2018 (the “Aetna Acquisition Date”), the Company acquired Aetna Inc. (“Aetna”) for a combination of cash and CVS Health stock (the “Aetna Acquisition”). The Company acquired Aetna to help improve the consumer health care experience by combining Aetna’s health care benefits products and services with CVS Health’s retail locations, walk-in medical clinics and integrated pharmacy capabilities with the goal of becoming the new, trusted front door to health care. Under the terms of the merger agreement, Aetna shareholders received $145.00 in cash and 0.8378 CVS Health shares for each Aetna share. The transaction valued Aetna at approximately $212 per share or approximately $70 billion. Including the assumption of Aetna’s debt, the total value of the transaction was approximately $78 billion. The Company financed the cash portion of the purchase price through a combination of cash on hand and by issuing approximately $45 billion of new debt, including senior notes and term loans. For additional information, see Note 2 ‘‘Acquisitions and Divestitures’’ included in Item 8 of this 10-K.
On October 10, 2018, the Company and Aetna entered into a consent decree with the U.S. Department of Justice (the “DOJ”) that allowed the Company’s proposed acquisition of Aetna to proceed, provided Aetna agreed to sell its individual standalone PDPs. As part of the agreement reached with the DOJ, Aetna entered into a purchase agreement with a subsidiary of WellCare Health Plans, Inc. (“WellCare”) for the divestiture of Aetna’s standalone PDPs effective December 31, 2018. On November 30, 2018, the Company completed the sale of Aetna’s standalone PDPs. The Company provided administrative services to, and retained the financial results of, the divested plans through 2019. Subsequent to 2019, the Company will no longer retain the financial results of the divested plans. Aetna’s standalone PDPs had an aggregate of 2.5 million members as of December 31, 2019.
As a result of the Aetna Acquisition, the Company added the Health Care Benefits segment. Certain aspects of Aetna’s operations, including products for which the Company no longer solicits or accepts new customers, such as large case pensions and long-term care insurance products, are included in the Company’s Corporate/Other segment.
Effective for the first quarter of 2019, the Company realigned the composition of its segments to correspond with changes to its operating model and reflect how its Chief Operating Decision Maker reviews information and manages the business. As a result of this realignment, the Company’s SilverScript® PDP moved from the Pharmacy Services segment to the Health Care Benefits segment. In addition, the Company moved Aetna’s mail order and specialty pharmacy operations from the Health Care Benefits segment to the Pharmacy Services segment. Segment financial information has been retrospectively adjusted to reflect these changes. See Note 17 ‘‘Segment Reporting’’ included in Item 8 of this 10-K for segment financial information.
The Company has four reportable segments: Pharmacy Services, Retail/LTC, Health Care Benefits and Corporate/Other.
Business Strategy
CVS Health’s purpose of helping people on their path to better health guides the Company’s approach to transforming the consumer health experience. The Company is working to create the most consumer-centric health company by being consumer obsessed and pursuing its three strategic goals: be local, make it simple and improve health. These goals are embedded in the Company’s four Enterprise priorities: growing and differentiating our businesses, delivering transformational products and services, creating a consumer-centric technology infrastructure and modernizing Enterprise functions and capabilities. The
2
Company believes its strategy of putting the consumer at the center of care will drive long-term sustainable value and place the Company at the forefront of the evolution of health care.
Pharmacy Services Segment
The Pharmacy Services segment provides a full range of pharmacy benefit management (“PBM”) solutions, including plan design offerings and administration, formulary management, retail pharmacy network management services, mail order pharmacy, specialty pharmacy and infusion services, clinical services, disease management services and medical spend management. The Pharmacy Services segment’s clients are primarily employers, insurance companies, unions, government employee groups, health plans, PDPs, Medicaid managed care (“Managed Medicaid”) plans, plans offered on public health insurance exchanges (“Public Exchanges”) and private health insurance exchanges (“Private Exchanges” and together with Public Exchanges, “Insurance Exchanges”), other sponsors of health benefit plans and individuals throughout the U.S. The Pharmacy Services segment includes retail specialty pharmacy stores, specialty mail order pharmacies, mail order dispensing pharmacies, compounding pharmacies and branches for infusion and enteral nutrition services. During the year ended December 31, 2019, the Company’s PBM filled or managed 2.0 billion prescriptions on a 30-day equivalent basis.
PBM Services
The Company dispenses prescription drugs directly through its mail order dispensing and specialty mail order pharmacies and through pharmacies in its retail network. All prescriptions processed by the Company are analyzed, processed and documented by the Company’s proprietary prescription management systems. These systems provide essential features and functionality to allow plan members to utilize their prescription drug benefits. These systems also streamline the process by which prescriptions are processed by staff and network pharmacists by enhancing review of various items through automation, including plan eligibility, early refills, duplicate dispensing, appropriateness of dosage, drug interactions or allergies, over-utilization and potential fraud.
Plan Design Offerings and Administration
The Company administers pharmacy benefit plans for clients who contract with it to facilitate prescription drug coverage and claims processing for their eligible plan members. The Company assists its PBM clients in designing pharmacy benefit plans that help improve health outcomes while minimizing the costs to the client. The Company also assists PBM clients in monitoring the effectiveness of their plans through frequent, informal communications, the use of proprietary software, as well as through formal annual, quarterly and sometimes monthly performance reviews.
The Company makes recommendations to help PBM clients design benefit plans that promote the use of lower cost, clinically appropriate drugs and helps its PBM clients control costs by recommending plan designs that encourage the use of generic equivalents of brand name drugs when such equivalents are available. Clients also have the option, through plan design, to further lower their pharmacy benefit plan costs by setting different member payment levels for different products on their drug lists or “formularies,” which helps guide members to choose lower cost alternatives through appropriate financial incentives.
Formulary Management
The Company utilizes an independent panel of doctors, pharmacists and other medical experts, referred to as the CVS Caremark National Pharmacy and Therapeutics Committee, to review and approve the selection of drugs that meet the Company’s standards of safety and efficacy for inclusion on one of the Company’s template formularies. The Company’s formularies provide recommended products in numerous drug classes to help ensure member access to clinically appropriate drugs with alternatives within a class under the client’s pharmacy benefit plan, while helping to drive the lowest net cost for clients that select one of the Company’s formularies. To help improve clinical outcomes for members and clients, the Company conducts ongoing, independent reviews of all drugs, including those appearing on the formularies and generic equivalent products. Many of the Company’s clients choose to adopt a template formulary offering as part of their plan design. Beginning in 2018, PBM clients were given new capabilities to offer real time benefits information for a member’s specific plan design, provided digitally at the point of prescribing, at the pharmacy and directly to members.
Retail Pharmacy Network Management Services
The Company maintains a national network of more than 68,000 retail pharmacies, consisting of approximately 41,000 chain pharmacies (which includes CVS Pharmacy locations) and approximately 27,000 independent pharmacies, in the United States, including Puerto Rico, the District of Columbia, Guam and the U.S. Virgin Islands. When a customer fills a prescription in a retail pharmacy, the pharmacy sends prescription data electronically to the Company from the point-of-sale. This data interfaces with the Company’s proprietary prescription management systems, which verify relevant plan member data and eligibility, while also performing a drug utilization review to help evaluate clinical appropriateness and safety and confirming that the
3
pharmacy will receive payment for the prescription. The Company also offers a Performance program for non-Medicare customers. The Performance program may be applied to any network. It can be implemented with either the Company’s broad, national network or with a managed network (as allowed by applicable laws and regulations). Under the program, high performing pharmacies are eligible to receive an incremental positive performance payment. The program aligns with key Healthcare Effectiveness Data Information Set measures and is funded by client fees.
Mail Order Pharmacy Services
The Pharmacy Services segment operates mail order dispensing pharmacies in the United States. Plan members or their prescribers submit prescriptions or refill requests, primarily for maintenance medications, to these pharmacies, and staff pharmacists review these prescriptions and refill requests with the assistance of the Company’s prescription management systems. This review may involve communications with the prescriber and, with the prescriber’s approval when required, can result in generic substitution, therapeutic interchange or other actions designed to help reduce cost and/or improve quality of treatment. The Company’s mail order dispensing pharmacies have been awarded Mail Service Pharmacy accreditation from URAC, a health care accrediting organization that establishes quality standards for the health care industry.
Specialty Pharmacy and Infusion Services
The Pharmacy Services segment operates specialty mail order pharmacies, retail specialty pharmacy stores and branches for infusion and enteral nutrition services in the United States. These specialty mail order pharmacies are used for delivery of advanced medications to individuals with chronic or genetic diseases and disorders. The Company’s specialty mail order pharmacies also have been awarded Specialty Pharmacy accreditation from URAC. Substantially all of the Company’s specialty mail order pharmacies also have been accredited by the Joint Commission, which is an independent, not-for-profit organization that accredits and certifies health care programs and organizations in the United States.
Clinical Services
The Company offers multiple clinical programs and services to help clients manage overall pharmacy and health care costs in a clinically appropriate manner. These programs are primarily designed to promote better health outcomes and to help target inappropriate medication utilization and non-adherence to medication, each of which may result in adverse medical events that negatively affect member health and client pharmacy and medical spend. These programs include utilization management (“UM”), medication management, quality assurance, adherence and counseling programs to complement the client’s plan design and clinical strategies. To help address prescription opioid abuse and misuse, the Company introduced an industry-leading UM approach that limits to seven days the supply of opioids dispensed for certain acute prescriptions for patients who are new to therapy, limits the daily dosage of opioids dispensed based on the strength of the opioid and requires the use of immediate-release formulations of opioids before extended-release opioids are dispensed. The Company’s Pharmacy Advisor® program facilitates pharmacist counseling, both face-to-face and over the telephone, to help participating plan members with certain chronic diseases, such as diabetes and cardiovascular conditions, to identify gaps in care, adhere to their prescribed medications and manage their health conditions. The Company also has digital connectivity that helps to lower drug costs for patients by providing expanded visibility to lower cost alternatives through enhanced analytics and data sharing.
Disease Management Programs
The Company’s clinical programs and services utilize advanced protocols and offer clients convenience in working with health care providers (“providers”) and other third parties. The Company’s utilization management program covers diseases such as rheumatoid arthritis, Parkinson’s disease, seizure disorders and multiple sclerosis and is accredited by the National Committee for Quality Assurance (“NCQA”), a private, not-for-profit organization that evaluates, accredits and certifies a wide range of health care organizations.
Medical Benefit Management
The Company’s NovoLogix® online preauthorization tool helps identify and capture cost savings opportunities for specialty drugs billed under the medical benefit by identifying outliers to appropriate dosages and costs, and helps to ensure clinically appropriate use of specialty drugs.
Pharmacy Services Information Systems
The majority of the Pharmacy Services segment’s clients have migrated to a single claim adjudication platform. This platform incorporates architecture that centralizes the data generated from filling mail order prescriptions, adjudicating retail pharmacy claims and delivering other solutions to PBM clients. The Health Engagement Engine® technology and proprietary clinical algorithms help connect the various parts of the Enterprise and serve an essential role in cost management and health improvement. This capability transforms pharmacy data into actionable interventions at key points of care, such as mail and specialty pharmacists, to help provide quality care.
4
Pharmacy Services Clients
The Company’s Pharmacy Services clients are primarily employers, insurance companies, unions, government employee groups, health plans, Medicare Part D plans, Managed Medicaid plans and plans offered on Insurance Exchanges, other sponsors of health benefit plans and individuals located throughout the United States. Pharmaceuticals are provided to eligible members in benefit plans maintained by clients and utilize the Company’s information systems, among other things, to help perform safety checks, drug interaction screening and identify opportunities for generic substitution. Substantially all of the Pharmacy Services segment’s revenues are generated from dispensing and managing prescription drugs to eligible members in benefit plans maintained by clients. In 2018 and 2017, revenues from Aetna accounted for approximately 9.8% and 12.3%, respectively, of the Company’s consolidated total revenues. On the Aetna Acquisition Date, Aetna became a wholly-owned subsidiary of CVS Health. Subsequent to the Aetna Acquisition Date, revenues from Aetna continue to be reported in the Pharmacy Services segment; however, these revenues are eliminated in the consolidated financial statements.
Pharmacy Services Seasonality
The majority of Pharmacy Services segment revenues are not seasonal in nature.
Pharmacy Services Competition
The Company believes the primary competitive factors in the pharmacy services industry include: (i) the ability to negotiate favorable discounts from drug manufacturers as well as to negotiate favorable discounts from, and access to, retail pharmacy networks; (ii) the ability to identify and apply effective cost management programs utilizing clinical strategies, including the development and utilization of preferred formularies; (iii) the ability to market PBM products and services; (iv) the commitment to provide flexible, clinically-oriented services to clients and be responsive to clients’ needs; (v) the quality, scope and costs of products and services offered to clients and their members; and (vi) operational excellence in delivering services. The Pharmacy Services segment has a significant number of competitors (e.g., the Express Scripts business of Cigna Corporation, OptumRx, Prime Therapeutics, MedImpact, Humana and PillPack), offering PBM services, including large, national PBM companies, PBMs owned by large national health plans and smaller standalone PBMs.
Retail/LTC Segment
The Retail/LTC segment sells prescription drugs and a wide assortment of general merchandise, including over-the-counter drugs, beauty products, cosmetics and personal care products, provides health care services through its MinuteClinic® walk-in medical clinics and conducts long-term care pharmacy (“LTC”) operations, which distribute prescription drugs and provide related pharmacy consulting and other ancillary services to chronic care facilities and other care settings. As of December 31, 2019, the Retail/LTC segment operated approximately 9,900 retail locations, approximately 1,100 MinuteClinic locations as well as online retail pharmacy websites, LTC pharmacies and onsite pharmacies. During the year ended December 31, 2019, the Retail/LTC segment filled 1.4 billion prescriptions on a 30-day equivalent basis. For the year ended December 31, 2019, the Company dispensed approximately 26.6% of the total retail pharmacy prescriptions in the United States.
Retail/LTC Products and Services
A typical retail store sells prescription drugs and a wide assortment of high-quality, nationally advertised brand name and proprietary brand merchandise. Front store categories include over-the-counter drugs, beauty products, cosmetics and personal care products. LTC operations include distribution of prescription drugs and related consulting and ancillary services. The Company purchases merchandise from numerous manufacturers and distributors. The Company believes that competitive sources are readily available for substantially all of the products carried in its retail stores and the loss of any one supplier would not likely have a material effect on the Retail/LTC segment. The Company’s MinuteClinic locations offer a variety of health care services.
5
Retail/LTC revenues by major product group are as follows:
Percentage of Revenues | ||||||||
2019 | 2018 | 2017 | ||||||
Pharmacy (1) | 76.7 | % | 76.4 | % | 75.0 | % | ||
Front store and other (2) | 23.3 | % | 23.6 | % | 25.0 | % | ||
100.0 | % | 100.0 | % | 100.0 | % | |||
_____________________________________________
(1) | Pharmacy includes LTC sales and sales in pharmacies within Target Corporation stores. |
(2) | “Other” represents less than 5% of the “Front store and other” revenue category. |
Pharmacy
Pharmacy revenues represented approximately three-fourths of Retail/LTC segment revenues in each of 2019, 2018 and 2017. The Company believes that retail pharmacy operations will continue to represent a critical part of the Company’s business due to industry demographics, e.g., an aging American population consuming a greater number of prescription drugs, prescription drugs being used more often as the first line of defense for managing illness, the introduction of new pharmaceutical products, and Medicare Part D growth. The Company believes the retail pharmacy business benefits from investment in both people and technology, as well as innovative collaborations with health plans, PBMs and providers. Given the nature of prescriptions, consumers want their prescriptions filled accurately by professional pharmacists using the latest tools and technology, and ready when promised. Consumers also need medication management programs and better information to help them get the most out of their health care dollars. To assist consumers with these needs, the Company has introduced integrated pharmacy health care services that provide an earlier, easier and more effective approach to engaging consumers in behaviors that can help lower costs, improve health and save lives.
Front Store
Front store revenues reflect the Company’s strategy of innovating with new and unique products and services, using innovative personalized marketing and adjusting the mix of merchandise to match customers’ needs and preferences. A key component of the front store strategy is the ExtraCare® card program, which is one of the largest and most successful retail loyalty programs in the United States. The ExtraCare program allows the Company to balance marketing efforts so it can reward its best customers by providing them with automatic sale prices, customized coupons, ExtraBucks® rewards and other benefits. The Company also offers a subscription-based membership program, CarePass®, under which members are entitled to a suite of benefits delivered over the course of the subscription period, as well as a promotional reward that can be redeemed for future goods and services. The Company continues to launch and enhance new and exclusive brands to create unmatched offerings in beauty products and deliver other unique product offerings, including a full range of high-quality CVS Health and other proprietary brand products that are only available through CVS stores. The Company currently carries approximately 7,000 CVS Health and proprietary brand products, which accounted for approximately 22% of front store revenues during 2019.
MinuteClinic
As of December 31, 2019, the Company operated approximately 1,100 MinuteClinic locations in the United States. The clinics are staffed by nurse practitioners and physician assistants who utilize nationally established guidelines to deliver a variety of health care services. Payors value these clinics because they provide convenient, high-quality, cost-effective care, in many cases offering an attractive alternative to more expensive sites of care. Visits paid for by employers, health insurers or other third parties accounted for approximately 92% of MinuteClinic’s total revenues in 2019. MinuteClinic is collaborating with the Pharmacy Services and Health Care Benefits segments to help meet the needs of CVS Caremark’s client plan members and the Company’s health plan members by offering programs that can improve member health and lower costs. MinuteClinic is now affiliated with more than 90 major health systems and continues to build a platform that supports primary care.
Long-term Care Pharmacy Operations
The Retail/LTC segment provides LTC pharmacy services through the Omnicare® business. Omnicare’s customers consist of skilled nursing facilities, assisted living facilities, independent living communities, hospitals, correctional facilities, and other health care service providers. The Company provides pharmacy consulting, including monthly patient drug therapy evaluations, to assist in compliance with state and federal regulations and provide proprietary clinical and health management programs. It also provides pharmaceutical case management services for retirees, employees and dependents who have drug benefits under corporate-sponsored health care programs.
Onsite Pharmacies
The Company also operates a limited number of pharmacies located at client sites, which provide certain health plan members and customers with a convenient alternative for filling their prescriptions.
6
Retail Store Development
The addition of new retail locations has played, and will continue to play, a key role in the Company’s continued growth and success. The Company’s store development program focuses on three areas: entering new service areas, adding stores within existing service areas and relocating stores to more convenient sites. During 2019, the Company opened approximately 100 new retail locations, relocated approximately 25 stores, converted approximately 50 stores into HealthHUB® locations and closed approximately 130 locations. HealthHUBs are stores with a redesigned format that provide enhanced services, offer a care concierge and focus on health and wellness products. HealthHUBs are designed to meet consumer needs and improve the customer experience by providing care that complements physician practices and hospital systems, enabling improved health outcomes and reducing overall health care costs. The Company expects to continue HealthHUB conversions through 2021. During the last five years, the Company opened approximately 790 new and relocated locations, and acquired approximately 1,810 locations, including the pharmacies acquired from Target Corporation (“Target”) in 2015. The Company believes that continuing to assess the appropriateness of its store base and locate retail stores in more accessible locations are essential components of competing effectively in the current health care environment. As a result, the Company believes that its store development program is an integral part of its ability to meet the needs of customers and maintain its leadership position in the retail pharmacy marketplace given the changing health care landscape.
Retail/LTC Information Systems
The Company has continued to invest in information systems to enable it to deliver exceptional customer service, enhance safety and quality, and expand patient care services while lowering operating costs. The proprietary WeCARE Workflow supports pharmacy teams by prioritizing work to meet customer expectations, facilitating prescriber outreach, and seamlessly integrating clinical programs. This solution delivers improved efficiency and enhances the customer experience, as well as providing a framework to accommodate the evolution of pharmacy practice and the expansion of clinical programs. The Health Engagement Engine technology and proprietary clinical algorithms enable the Company to help identify opportunities for pharmacists to deliver face-to-face counseling regarding patient health and safety matters, including medication adherence issues, gaps in care and management of certain chronic health conditions. The Company’s digital strategy is to empower the consumer to navigate their pharmacy experience and manage their condition through integrated online and mobile solutions that offer utility and convenience. The Company’s LTC digital technology suite, Omniview®, improves the efficiency of customers’ operations with tools that include executive dashboards, pre-admission pricing, electronic ordering of prescription refills, proof-of-delivery tracking, access to patient profiles, receipt and management of facility bills, and real-time validation of Medicare Part D coverage, among other capabilities.
Retail/LTC Customers
The success of the Retail/LTC segment’s businesses is dependent upon the Company’s ability to establish and maintain contractual relationships with pharmacy benefit managers and other payors on acceptable terms. Substantially all of the Retail/LTC segment’s pharmacy revenues are derived from pharmacy benefit managers, managed care organizations, government funded health care programs, commercial employers and other third party payors. No single Retail/LTC payor accounted for 10% or more of the Company’s consolidated total revenues in 2019, 2018 or 2017.
Retail/LTC Seasonality
The majority of Retail/LTC segment revenues, particularly pharmacy revenues, generally are not seasonal in nature. However, front store revenues tend to be higher during the December holiday season. In addition, both pharmacy and front store revenues are affected by the timing and severity of the cough, cold and flu season. Uncharacteristic or extreme weather conditions also can adversely affect consumer shopping patterns and Retail/LTC revenues, expenses and operating results.
Retail/LTC Competition
The retail pharmacy business is highly competitive. The Company believes that it competes principally on the basis of: (i) store location and convenience, (ii) customer service and satisfaction, (iii) product selection and variety, and (iv) price. In the areas it serves, the Company competes with other drugstore chains (e.g., Walgreens and Rite Aid), supermarkets, discount retailers (e.g., Wal-Mart), independent pharmacies, restrictive pharmacy networks, membership clubs, internet companies, and retail health clinics (including urgent care centers), as well as mail order dispensing pharmacies.
LTC pharmacy services are highly regional or local in nature, and within a given geographic area of operation, highly competitive. The Company’s largest LTC pharmacy competitor nationally is PharMerica. The Company also competes with
7
numerous local and regional institutional pharmacies, pharmacies owned by long-term care facilities and local retail pharmacies. Some states have enacted “freedom of choice” or “any willing provider” requirements as part of their state Medicaid programs or in separate legislation, which may increase the competition that the Company faces in providing services to long-term care facility residents in these states.
Health Care Benefits Segment
The Health Care Benefits segment is one of the nation’s leading diversified health care benefits providers, serving an estimated 37 million people as of December 31, 2019. The Health Care Benefits segment has the information and resources to help members, in consultation with their health care professionals, make more informed decisions about their health care. The Health Care Benefits segment offers a broad range of traditional, voluntary and consumer-directed health insurance products and related services, including medical, pharmacy, dental and behavioral health plans, medical management capabilities, Medicare Advantage and Medicare Supplement plans, PDPs, Medicaid health care management services, workers’ compensation administrative services and health information technology (“HIT”) products and services. The Health Care Benefits segment’s customers include employer groups, individuals, college students, part-time and hourly workers, health plans, health care providers, governmental units, government-sponsored plans, labor groups and expatriates. For periods prior to November 28, 2018 (the Aetna Acquisition Date), the Health Care Benefits segment was comprised of the Company’s SilverScript PDP business.
Health Care Benefits Products and Services
The Company refers to insurance products (where it assumes all or a majority of the risk for medical and dental care costs) as “Insured” and administrative services contract products (where the plan sponsor assumes all or a majority of the risk of medical and dental care costs) as “ASC.” Health Care Benefits products and services consist of the following:
• | Commercial Medical: The Health Care Benefits segment offers point-of-service (“POS”), preferred provider organization (“PPO”), health maintenance organization (“HMO”) and indemnity benefit (“Indemnity”) plans. Commercial medical products also include health savings accounts (“HSAs”) and consumer-directed health plans that combine traditional POS or PPO and/or dental coverage, subject to a deductible, with an accumulating benefit account (which may be funded by the plan sponsor and/or the member in the case of HSAs). Principal products and services are targeted specifically to large multi-site national, mid-sized and small employers, individual insureds and expatriates. The Company offers medical stop loss insurance coverage for certain employers who elect to self-insure their health benefits. Under medical stop loss insurance products, the Company assumes risk for costs associated with large individual claims and/or aggregate loss experience within an employer’s plan above a pre-set annual threshold. |
• | Government Medical: In select geographies, the Health Care Benefits segment offers Medicare Advantage plans, Medicare Supplement plans and prescription drug coverage for Medicare beneficiaries; participates in Medicaid and subsidized Children’s Health Insurance Programs (“CHIP”); and participates in demonstration projects for members who are eligible for both Medicare and Medicaid (“Duals”). These Government Medical products are further described below: |
• | Medicare Advantage: Through annual contracts with the U.S. Centers for Medicare & Medicaid Services (“CMS”), the Company offers HMO and PPO products for eligible individuals in certain geographic areas through the Medicare Advantage program. Members typically receive enhanced benefits over traditional fee-for-service Medicare coverage (“Original Medicare”), including reduced cost-sharing for preventive care, vision and other services. The Company offered network-based HMO and/or PPO plans in 1,416 counties in 45 states and Washington, D.C. in 2019. The Company has expanded to 1,680 counties in 45 states and Washington, D.C. for 2020. For certain qualifying employer groups, the Company offers Medicare PPO products nationally. When combined with the Company’s PDP product, these national PPO plans form an integrated national Insured Medicare product for employers that provides medical and pharmacy benefits. |
• | Medicare PDP: The Company is a national provider of drug benefits under the Medicare Part D prescription drug program. All Medicare eligible individuals are eligible to participate in this voluntary prescription drug plan. Members typically receive coverage for certain prescription drugs, usually subject to a deductible, co-insurance and/or co-payment. On November 30, 2018, the Company completed the sale of Aetna’s standalone PDPs to WellCare effective December 31, 2018. The Company provided administrative services to, and retained the financial results of, the divested plans through 2019. Subsequent to 2019, the Company will no longer retain the financial results of the divested plans. |
• | Medicare Supplement: For certain Medicare eligible members, the Company offers supplemental coverage for certain health care costs not covered by Original Medicare. The products included in the Medicare Supplement portfolio help to cover some of the gaps in Original Medicare, and include coverage for Medicare deductibles and |
8
coinsurance amounts. The Company offered a wide selection of Medicare Supplement products in 49 states and Washington, D.C. in 2019.
• | Medicaid and CHIP: The Company offers health care management services to individuals eligible for Medicaid and CHIP under multi-year contracts with government agencies in various states that are subject to annual appropriations. CHIP are state-subsidized insurance programs that provide benefits for families with uninsured children. The Company offered these services on an Insured or ASC basis in 16 states in 2019. |
• | Duals: The Company provides health coverage to beneficiaries who are dually eligible for both Medicare and Medicaid coverage. These members must meet certain income and resource requirements in order to qualify for this coverage. The Company coordinates 100% of the care for these members and may provide them with additional services in order to manage their health care costs. |
• | Specialty: The Health Care Benefits segment has a portfolio of additional health products and services that complement its medical products such as dental plans, behavioral health and employee assistance products, provider network access and vision products and workers’ compensation administrative services. |
• | Transformative Products and Services: The Company has a portfolio of transformative products and services aimed at creating a holistic and integrated approach to individual health and wellness. These products and services complement the Commercial Medical and Government Medical products and aim to provide innovative solutions, create integrated experience offerings and enable enhanced care delivery to customers. |
Health Care Benefits Provider Networks
The Company contracts with physicians, hospitals and other providers for services they provide to the Company’s members. The Company uses a variety of techniques designed to help encourage appropriate utilization of medical services (“utilization”) and maintain affordability of quality coverage. In addition to contracts with providers for negotiated rates of reimbursement, these techniques include creating risk sharing arrangements that align economic incentives with providers, the development and implementation of guidelines for the appropriate utilization of medical services and the provision of data to providers to enable them to improve health care quality. At December 31, 2019, the Company’s underlying nationwide provider network had approximately 1.3 million participating providers, including over 706,000 primary care and specialist physicians and approximately 5,900 hospitals. Other providers in the Company’s provider networks also include laboratory, imaging, urgent care and other freestanding health facilities.
Health Care Benefits Quality Assessment
CMS uses a 5-star rating system to monitor Medicare health care and drug plans and ensure that they meet CMS’s quality standards. CMS uses this rating system to provide Medicare beneficiaries with a tool that they can use to compare the overall quality of care and level of customer service of companies that provide Medicare health care and drug plans. The rating system considers a variety of measures adopted by CMS, including quality of preventative services, chronic illness management and overall customer satisfaction. See “Health Care Benefits Pricing” below in this Item 1 for further discussion of star ratings. The Company seeks Health Plan accreditation for Aetna HMO plans from the NCQA. Health care plans seeking accreditation must pass a rigorous, comprehensive review and must annually report on their performance.
Aetna Life Insurance Company (“ALIC”), a wholly-owned subsidiary of the Company, has received nationwide NCQA PPO Health Plan accreditation. As of December 31, 2019, all of the Company’s Commercial HMO and all of ALIC’s PPO members who were eligible participated in HMOs or PPOs that are accredited by the NCQA.
The Company’s provider selection and credentialing/re-credentialing policies and procedures are consistent with NCQA and URAC, as well as state and federal, requirements. In addition, the Company is certified under the NCQA Credentials Verification Organization (“CVO”) certification program for all certification options and has URAC CVO accreditation.
Quality assessment programs for contracted providers who participate in the Company’s networks begin with the initial review of health care practitioners. Practitioners’ licenses and education are verified, and their work history is collected by the Company or in some cases by the practitioner’s affiliated group or organization. The Company generally requires participating hospitals to be certified by CMS or accredited by the Joint Commission, the American Osteopathic Association, or Det Norske Veritas Healthcare.
The Company also offers quality and outcome measurement programs, quality improvement programs, and health care data analysis systems to providers and purchasers of health care services.
9
Health Care Benefits Information Systems
The Health Care Benefits segment currently operates and supports an end-to-end suite of information technology platforms to support member engagement, enrollment, health benefit administration, care management, service operations, financial reporting and analytics. The multiple platforms are supported by an integration layer to facilitate the transfer of real-time data. There is continued focus and investment in digital products to offer innovative solutions and a seamless experience to the Company’s members through mobile and web channels. The Company is making concerted investments in emerging technology capabilities such as voice, artificial intelligence and robotics to further automate and improve the experience for all of its constituents. The Health Care Benefits segment is integrating with the Retail/LTC and Pharmacy Services segments to build Enterprise technology assets that will help guide our members through their health care journey, provide them a high level of service, enable healthier outcomes and encourage them to take next best actions to lead healthier lives.
Health Care Benefits Customers
Medical membership is dispersed throughout the United States, and the Company also serves medical members in certain countries outside the United States. The Company offers a broad range of traditional, voluntary and consumer-directed health insurance products and related services, many of which are available nationwide. Depending on the product, the Company markets to a range of customers including employer groups, individuals, college students, part-time and hourly workers, health plans, providers, governmental units, government-sponsored plans, labor groups and expatriates.
For additional information on medical membership, see “Health Care Benefits Segment” in the Management’s Discussion and Analysis of Financial Condition and Results of Operations (the “MD&A”) included in Item 7 of this 10-K.
The Company markets both Commercial Insured and ASC products and services primarily to employers that sponsor the Company’s products for the benefit of their employees and their employees’ dependents. Frequently, larger employers offer employees a choice among coverage options, from which the employee makes his or her selection during a designated annual open enrollment period. Typically, employers pay all of the monthly premiums to the Company and, through payroll deductions, obtain reimbursement from employees for a percentage of the premiums that is determined by each employer. Some Health Care Benefits products are sold directly to employees of employer groups on a fully employee-funded basis. In some cases, the Company bills the covered individual directly.
The Company offers Insured Medicare coverage on an individual basis as well as through employer groups to their retirees. Medicaid and CHIP members are enrolled on an individual basis. The Company also offers Insured health care coverage to members who are dually-eligible for both Medicare and Medicaid.
Health Care Benefits products are sold through the Company’s sales personnel; through independent brokers, agents and consultants who assist in the production and servicing of business; and through Private Exchanges. For large plan sponsors, independent consultants and brokers are frequently involved in employer health plan selection decisions and sales. In some instances, the Company may pay commissions, fees and other amounts to brokers, agents, consultants and sales representatives who place business with the Company. In certain cases, the customer pays the broker for services rendered, and the Company may facilitate that arrangement by collecting the funds from the customer and transmitting them to the broker. The Company supports marketing and sales efforts with an advertising program that may include television, radio, billboards, print media and social media, supplemented by market research and direct marketing efforts.
The U.S. federal government is a significant customer of the Health Care Benefits segment through contracts with CMS for coverage of Medicare-eligible individuals and federal employee-related benefit programs. Other than the contracts with CMS, the Health Care Benefits segment is not dependent upon a single customer or a few customers the loss of which would have a significant effect on the earnings of the segment. The loss of business from any one, or a few, independent brokers or agents would not have a material adverse effect on the earnings of the Health Care Benefits segment. In 2019, Health Care Benefits segment revenues from the federal government accounted for approximately 13% of the Company’s consolidated total revenues. Contracts with CMS for coverage of Medicare-eligible individuals accounted for approximately 95% of the Company’s revenues from the federal government in 2019. No single Health Care Benefits customer accounted for 10% or more of the Company’s consolidated total revenues in 2018 or 2017.
10
Health Care Benefits Pricing
For Commercial Insured plans, contracts containing the pricing and other terms of the relationship are generally established in advance of the policy period and typically have a duration of one year. Fees under ASC plans are generally fixed for a period of one year.
Generally, a fixed premium rate is determined at the beginning of the policy period for Commercial Insured plans. The Company typically cannot recover unanticipated increases in health care and other benefit costs in the current policy period; however, it may consider prior experience for a product in the aggregate or for a specific customer, among other factors, in determining premium rates for future policy periods. Where required by state laws, premium rates are filed and approved by state regulators prior to contract inception. Future operating results could be adversely affected if the premium rates requested are not approved or are adjusted downward or their approval is delayed by state or federal regulators.
The Company has Medicare Advantage and PDP contracts with CMS to provide HMO, PPO and prescription drug coverage to Medicare beneficiaries in certain geographic areas. Under these annual contracts, CMS pays the Company a fixed per member (or “capitation”) payment and/or a portion of the premium, both of which are based on membership and adjusted for demographic and health risk factors. CMS also considers inflation, changes in utilization patterns and average per capita fee-for-service Medicare costs in the calculation of the fixed capitation payment or premium. PDP contracts also provide a risk-sharing arrangement with CMS to limit the Company’s exposure to unfavorable expenses or benefit from favorable expenses. Amounts payable to the Company under the Medicare arrangements are subject to annual revision by CMS, and the Company elects to participate in each Medicare service area or region on an annual basis. Premiums paid to the Company for Medicare products are subject to federal government reviews and audits, which can result, and have resulted, in retroactive and prospective premium adjustments and refunds to the government and/or members. In addition to payments received from CMS, some of Medicare Advantage products and all PDP products require a supplemental premium to be paid by the member or sponsoring employer. In some cases these supplemental premiums are adjusted based on the member’s income and asset levels. Compared to Commercial Medical products, Medicare contracts generate higher per member per month revenues and higher health care and other benefit costs.
The Patient Protection and Affordable Care Act and the Health Care and Education Reconciliation Act of 2010 (collectively, the “ACA”) ties a portion of each Medicare Advantage plan’s reimbursement to the plan’s “star ratings.” Plans must have a star rating of four or higher (out of five) to qualify for bonus payments. CMS released the Company’s 2020 star ratings in October 2019. The Company’s 2020 star ratings will be used to determine which of the Company’s Medicare Advantage plans have ratings of four stars or higher and qualify for bonus payments in 2021. Based on the Company’s membership at December 31, 2019, 83% of the Company’s Medicare Advantage members were in plans with 2020 star ratings of at least 4.0 stars, compared to 79% of the Company’s Medicare Advantage members being in plans with 2019 star ratings of at least 4.0 stars based on the Company’s membership at December 31, 2018.
Rates for Medicare Supplement products are regulated at the state level and vary by state and plan.
Under Insured Medicaid contracts, state government agencies pay the Company fixed monthly rates per member that vary by state, line of business and demographics; and the Company arranges, pays for and manages the health care services provided to Medicaid beneficiaries. These rates are subject to change by each state, and, in some instances, provide for adjustment for health risk factors. CMS requires these rates to be actuarially sound. The Company also receives fees from customers where it provides services under ASC Medicaid contracts. ASC Medicaid contracts generally are for periods of more than one year, and certain of them contain performance incentives and limited financial risk sharing with respect to certain medical, financial and operational metrics. Under these arrangements, performance is evaluated annually, with associated financial incentive opportunities, and financial risk share obligations are typically limited to a percentage of the fees otherwise payable to the Company. Payments to the Company under Medicaid contracts are subject to the annual appropriation process in the applicable state.
Under Duals contracts, the rate setting process is generally established by CMS in partnership with the state government agency participating in the demonstration project. Both CMS and the state government agency may seek premium and other refunds under certain circumstances, including if the Company fails to comply with CMS regulations or other contractual requirements.
The Company offers HMO and consumer-directed medical and dental plans to federal employees under the Federal Employees Health Benefits (“FEHB”) Program and the Federal Employees Dental and Vision Insurance Program. Premium rates and fees
11
for those plans are subject to federal government review and audit, which can result, and have resulted, in retroactive and prospective premium and fee adjustments and refunds to the government and/or members.
Beginning in 2014, the ACA imposed significant new industry-wide fees, assessments and taxes, including an annual levy known as the Health Insurer Fee (the “HIF”). The HIF applies for 2020 and was temporarily suspended for 2019 and 2017. In December 2019, the HIF was repealed for calendar years after 2020. For additional information on the ACA fees, assessments and taxes, see Note 1 ‘‘Significant Accounting Policies’’ included in Item 8 of this 10-K. The Company’s goal is to collect in premiums and fees where possible, or solve for, all of the ACA-related fees, assessments and taxes.
Health Care Benefits Seasonality
For periods prior to the Aetna Acquisition Date, the Health Care Benefits segment was comprised of the Company’s SilverScript PDP business. The quarterly earnings and operating cash flows of the PDP business are impacted by the Medicare Part D benefit design and changes in the composition of PDP membership. The Medicare Part D standard benefit design results in coverage that varies with a member’s cumulative annual out-of-pocket costs. The benefit design generally results in employers or other entities that sponsor the Company’s products (“plan sponsors”) sharing a greater portion of the responsibility for total prescription drug costs in the early part of the year. As a result, the PDP pay percentage or benefit ratio generally decreases and operating income generally increases as the year progresses. For periods subsequent to the Aetna Acquisition, the Health Care Benefits segment’s quarterly operating income progression is also impacted by (i) the seasonality of benefit costs which generally increase during the year as Insured members progress through their annual deductibles and out-of-pocket expense limits and (ii) the seasonality of operating expenses which are generally the highest during the fourth quarter due primarily to spending to support readiness for the start of the upcoming Medicare plan year and marketing associated with Medicare annual enrollment.
Health Care Benefits Competition
The health care benefits industry is highly competitive, primarily due to a large number of for-profit and not-for-profit competitors, competitors’ marketing and pricing and a proliferation of competing products, including new products that are continually being introduced into the marketplace. New entrants into the marketplace, as well as consolidation within the industry, have contributed to and are expected to intensify the competitive environment. In addition, the rapid pace of change as the industry evolves towards a consumer-focused retail marketplace, including Insurance Exchanges, and the increased use of technology to interact with members, providers and customers, increase the risks the Company currently faces from new entrants and disruptive actions by existing competitors compared to prior periods.
The Company believes that the significant factors that distinguish competing health plans include the perceived overall quality (including accreditation status), quality of service, comprehensiveness of coverage, cost (including premium rates, provider discounts and member out-of-pocket costs), product design, financial stability and ratings, breadth and quality of provider networks, ability to offer different provider network options, providers available in such networks, and quality of member support and care management programs. The Company believes that it is competitive on each of these factors. The Company’s ability to increase the number of persons covered by its health plans or to increase Health Care Benefits segment revenues is affected by its ability to differentiate itself from its competitors on these factors. Competition may also affect the availability of services from health care providers, including primary care physicians, specialists and hospitals.
Insured products compete with local and regional health care benefits plans, health care benefits and other plans sponsored by other large commercial health care benefit insurance companies, health system owned health plans, new entrants into the marketplace and numerous for-profit and not-for-profit organizations operating under licenses from the Blue Cross and Blue Shield Association. The largest competitor in Medicare products is Original Medicare. Additional Health Care Benefits segment competitors include other types of medical and dental provider organizations, various specialty service providers (including PBM services providers), health care consultants, financial services companies, integrated health care delivery organizations (networks of providers who also coordinate administrative services for and assume insurance risk of their members), third party administrators (“TPAs”), HIT companies and, for certain plans, programs sponsored by the federal or state governments. Emerging competitors include start up health care benefits plans, technology companies, provider-owned health plans, new joint ventures (including not-for-profit joint ventures among firms from multiple industries), technology firms, financial services firms that are distributing competing products on their proprietary Private Exchanges, and consulting firms that are distributing competing products on their proprietary Private Exchanges, as well as non-traditional distributors such as retail companies. The Company’s ability to increase the number of persons enrolled in Insured Commercial Medical products also is affected by the desire and ability of employers to self-fund their health coverage.
12
The Health Care Benefits segment’s ASC plans compete primarily with other large commercial health care benefit companies, numerous for-profit and not-for-profit organizations operating under licenses from the Blue Cross and Blue Shield Association and TPAs.
The Health Care Benefits segment’s international products compete with local, global and U.S.-based health plans and commercial health care benefit insurance companies, many of whom are licensed in more geographies and have a longer operating history, better brand recognition and greater marketplace presence in one or more geographies.
The provider solutions and HIT marketplaces and products are evolving rapidly. The Company competes for provider solutions and HIT business with other large health plans and commercial health care benefit insurance companies as well as information technology companies and companies that specialize in provider solutions and HIT. Many information technology product competitors have longer operating histories, better brand recognition, greater marketplace presence and more experience in developing innovative products.
In addition to competitive pressures affecting the Company’s ability to obtain new customers or retain existing customers, the Health Care Benefits segment’s medical membership has been and may continue to be adversely affected by adverse and/or uncertain economic conditions and reductions in workforce by existing customers due to adverse and/or uncertain general economic conditions, especially in the United States and industries where such membership is concentrated.
Health Care Benefits Reinsurance
The Company currently has several reinsurance agreements with non-affiliated insurers that relate to Health Care Benefits insurance policies. The Company entered into these contracts to reduce the risk of catastrophic losses which in turn reduces capital and surplus requirements. The Company frequently evaluates reinsurance opportunities and refines its reinsurance and risk management strategies on a regular basis.
Corporate/Other Segment
The Company presents the remainder of its financial results in the Corporate/Other segment, which consists of:
• | Management and administrative expenses to support the overall operations of the Company, which include certain aspects of executive management and the corporate relations, legal, compliance, human resources, information technology and finance departments, expenses associated with the Company’s investments in its transformation and Enterprise modernization programs and acquisition-related transaction and integration costs; and |
• | Products for which the Company no longer solicits or accepts new customers such as large case pensions and long-term care insurance products. |
Generic Sourcing Venture
The Company and Cardinal Health, Inc. (“Cardinal”) each have a 50% ownership in Red Oak Sourcing, LLC (“Red Oak”), a generic pharmaceutical sourcing entity. Under this arrangement, the Company and Cardinal contributed their sourcing and supply chain expertise to Red Oak and agreed to source and negotiate generic pharmaceutical supply contracts for both companies through Red Oak. Red Oak does not own or hold inventory on behalf of either company.
Working Capital Practices
The Company funds the growth of its businesses through a combination of cash flow from operations, commercial paper and other short-term borrowings, proceeds from sale-leaseback transactions and long-term borrowings. For additional information on the Company’s working capital practices, see “Liquidity and Capital Resources” in the MD&A included in Item 7 of this 10-K. The majority of the Retail/LTC segment non-pharmacy revenues are paid in cash, or with debit or credit cards. Managed care organizations, pharmacy benefit managers, government funded health care programs, commercial employers and other third party insurance programs, which represent the vast majority of the Company’s consolidated pharmacy revenues, typically settle in less than 30 days. The remainder of the Company’s consolidated pharmacy revenues are paid in cash, or with debit or credit cards. Employer groups, individuals, college students, part-time and hourly workers, health plans, providers, governmental units, government-sponsored plans (with the exception of Medicare Part D services, which are described below), labor groups and expatriates, which represent the vast majority of Health Care Benefits segment revenues, typically settle in less than 30 days. As a provider of Medicare Part D services, the Company contracts annually with CMS. Utilization of services each plan
13
year results in the accumulation of either a receivable from or a payable to CMS. The timing of settlement of the receivable or payable with CMS takes several quarters, which impacts working capital from year to year.
Colleague Development
As of December 31, 2019, the Company employed approximately 290,000 colleagues in all 50 states, the District of Columbia, Puerto Rico and a number of countries outside the United States. To deliver the highest levels of service to customers, the Company devotes considerable time and attention to its people and service standards. The Company emphasizes attracting and training knowledgeable, friendly and helpful associates to work in the organization.
Intellectual Property
The Company has registered and/or applied to register a variety of trademarks and service marks used throughout its businesses, as well as domain names, and relies on a combination of copyright, patent, trademark and trade secret laws, in addition to contractual restrictions, to establish and protect the Company’s proprietary rights. The Company regards its intellectual property as having significant value in the Pharmacy Services, Retail/LTC and Health Care Benefits segments. The Company is not aware of any facts that could materially impact the continuing use of any of its intellectual property.
Government Regulation
Overview
The Company’s operations are subject to comprehensive federal, state and local laws and regulations and comparable multiple levels of international regulation in the jurisdictions in which it does business. There also continues to be a heightened level of review and/or audit by federal, state and international regulators of the health and related benefits industry’s business and reporting practices. In addition, many of the Company’s PBM clients and the Company’s payors in the Retail/LTC segment, including insurers, Medicare Part D plans, Managed Medicaid plans and managed care organizations (“MCOs”), are themselves subject to extensive regulations that affect the design and implementation of prescription drug benefit plans that they sponsor. Similarly, the Company’s LTC clients, such as skilled nursing facilities, are subject to government regulations, including many of the same government regulations to which the Company is subject.
The laws and rules governing the Company’s businesses and interpretations of those laws and rules continue to expand and become more restrictive each year and are subject to frequent change. The application of these complex legal and regulatory requirements to the detailed operation of the Company’s businesses creates areas of uncertainty. Further, there are numerous proposed health care, financial services and other laws and regulations at the federal, state and international levels, some of which could adversely affect the Company’s businesses if they are enacted. The Company cannot predict whether pending or future federal or state legislation or court proceedings, including fundamental changes to the dynamics of one or more of the industries in which it competes, such as the federal or one or more state governments fundamentally restructuring the Commercial, Medicare or Medicaid marketplace or reducing payments to the Company under or financing for Medicare, Medicaid, dual eligible or special needs programs, increasing its involvement in drug reimbursement, pricing, purchasing, and/or importation or changing the laws governing PBMs, will change various aspects of the industries in which it competes or the health care industry generally or the impact those changes will have on the Company’s businesses, operating results, cash flows and/or stock price, but the effects could be materially adverse. Any failure or alleged failure to comply with applicable laws and regulations summarized below, or any adverse applications or interpretations of, or changes in, the laws and regulations affecting the Company and/or its businesses, could have a material adverse effect on the Company’s operating results, financial condition, cash flows and/or stock price. See Item 3 of this 10-K, “Legal Proceedings,” for further information.
The Company can give no assurance that its businesses, financial condition, operating results and/or cash flows will not be materially adversely affected, or that the Company will not be required to materially change its business practices, based on: (i) future enactment of new health care or other laws or regulations; (ii) the interpretation or application of existing laws or regulations, including the laws and regulations described in this Government Regulation section, as they may relate to one or more of the Company’s businesses, one or more of the industries in which the Company competes and/or the health care industry generally; (iii) pending or future federal or state governmental investigations of one or more of the Company’s businesses, one or more of the industries in which the Company competes and/or the health care industry generally; (iv) pending or future government audits, investigations or enforcement actions against the Company; (v) adverse developments in any pending qui tam lawsuit against the Company, whether sealed or unsealed, or in any future qui tam lawsuit that may be filed against the Company; or (vi) adverse developments in pending or future legal proceedings against the Company or affecting one or more of the industries in which the Company competes and/or the health care industry generally.
14
Laws and Regulations Related to Multiple Segments of the Company’s Business
Laws Related to Reimbursement by Government Programs - The Company is subject to various federal and state laws concerning its submission of claims and other information to Medicare, Medicaid and other federal and state government-sponsored health care programs. Potential sanctions for violating these laws include recoupment or reduction of government reimbursement amounts, civil penalties, treble damages, and exclusion from participation in government health care programs. Such laws include the federal False Claims Act (the “False Claims Act”), the federal anti-kickback statute, state false claims acts and anti-kickback statutes in most states, the federal “Stark Law” and related state laws. In particular, the False Claims Act prohibits intentionally submitting, conspiring to submit, or causing to be submitted, false claims, records, or statements to the federal government, or intentionally failing to return overpayments, in connection with reimbursement by federal government programs. In addition, any claim for government reimbursement also violates the False Claims Act where it results from a violation of the federal anti-kickback statute.
Both federal and state false claims laws permit private individuals to file qui tam or “whistleblower” lawsuits on behalf of the federal or state government. Participants in the health and related benefits industry, including the Company, frequently are subject to actions under the False Claims Act or similar state laws. The federal Stark Law generally prohibits physicians from referring Medicare or Medicaid beneficiaries for certain services, including outpatient prescription drugs, to any entity with which the physician, or an immediate family member of the physician, has a financial relationship. The Stark Law further prohibits the entity receiving a prohibited referral from presenting a claim for reimbursement by Medicare or Medicaid for services furnished pursuant to the prohibited referral. Various states have enacted similar laws.
The ACA - The ACA made broad-based changes to the U.S. health care system. While the Company anticipates continued efforts in 2020 and beyond to invalidate, modify, repeal or replace the ACA, the Company expects aspects of the ACA to continue to significantly impact its business operations and operating results, including pricing, medical benefit ratios (“MBRs”) and the geographies in which the Company’s products are available.
While most of the significant aspects of the ACA became effective during or prior to 2014, parts of the ACA continue to evolve through the promulgation of executive orders, legislation, regulations and guidance as well as ongoing litigation. Additional changes to the ACA and those regulations and guidance at the federal and/or state level are likely, and those changes are likely to be significant. Growing federal and state budgetary pressures make it more likely that any changes, including changes at the state level in response to changes to, or invalidation, repeal or replacement of, the ACA and/or changes in the funding levels and/or payment mechanisms of federally supported benefit programs, will be adverse to us. For example, if any elements of the ACA are invalidated or repealed at the federal level, the Company expects that some states would seek to enact similar requirements, such as prohibiting pre-existing condition exclusions, prohibiting rescission of insurance coverage, requiring coverage for dependents up to age 26, requiring guaranteed renewability of insurance coverage and prohibiting lifetime limits on insurance coverage.
The expansion of health care coverage contemplated by the ACA is being funded in part by reductions to the reimbursements the Company and other health plans are paid by the federal government for Medicare members, among other sources. While not all-inclusive, the following are some of the key funding changes related to the ACA (assuming it continues to be implemented in its current form) that become effective on or after January 1, 2020. The Company continues to evaluate these provisions and the related regulations and regulatory guidance to determine the impact that they will have on its business operations and operating results:
• | The repeal of the annual non-tax deductible industry-wide HIF for calendar years after 2020. The HIF was $14.3 billion for 2018 and suspended for 2019. As currently enacted, the HIF will be $15.5 billion for 2020. |
• | The repeal of the non-tax deductible 40% excise tax on employer-sponsored health care benefits above a certain threshold that was scheduled to begin in 2022. |
• | Reduced funding for Medicaid expansion, which began in 2017. |
The ACA also specifies minimum medical loss ratios (“MLRs”) for Commercial and Medicare Insured products, specifies features required to be included in Commercial benefit designs, limits Commercial individual and small group rating and pricing practices, encourages additional competition (including potential incentives for new participants to enter the marketplace) and significantly increases federal and state oversight of health plans, including regulations and processes that could delay or limit the Company’s ability to appropriately increase its health plan premium rates. This in turn could adversely affect the Company’s ability to continue to participate in certain product lines and/or geographies that it serves today.
15
Potential repeal of the ACA, ongoing legislative, regulatory and administrative policy changes to the ACA, the results of federal and state level elections, pending litigation challenging the constitutionality of the ACA or funding for the law and federal budget negotiations continue to create uncertainty about the ultimate impact of the ACA. The time frame for conclusion and final outcome and ultimate impact of this litigation are uncertain. Given the inherent difficulty of foreseeing the nature and scope of future changes to the ACA and how states, businesses and individuals will respond to those changes, the Company cannot predict the impact on it of future changes to the ACA. It is reasonably possible that invalidation, repeal or replacement of or other changes to the ACA and/or states’ responses to such changes, in the aggregate, could have a significant adverse effect on the Company’s businesses, operating results and cash flows.
Medicare Regulation - The Company’s Medicare Advantage products compete directly with Original Medicare and Medicare Advantage products offered by other Medicare Advantage organizations and Medicare Supplement products offered by other insurers. The Company’s Medicare PDP and Medicare Supplement products are products that Medicare beneficiaries who are enrolled in Original Medicare purchase to enhance their Original Medicare coverage.
The Company continues to expand the number of counties in which it offers Medicare products. The Company expects to further expand its Medicare service area and products in 2020 and is seeking to substantially grow its Medicare membership, revenue and operating results over the next several years, including through growth in Medicare Supplement products. The anticipated organic expansion of the Medicare service area and Medicare products offered and the Medicare-related provisions of the ACA significantly increase the Company’s exposure to funding and regulation of, and changes in government policy with respect to and/or funding or regulation of, the various Medicare programs in which the Company participates, including changes in the amounts payable to us under those programs and/or new reforms or surcharges on existing programs. For example, the ACA requires minimum MLRs for Medicare Advantage and Medicare Part D plans of 85%. If a Medicare Advantage or Medicare Part D contract pays minimum MLR rebates for three consecutive years, it will become ineligible to enroll new members. If a Medicare Advantage or Medicare Part D contract pays such rebates for five consecutive years, it will be terminated by CMS.
The Company’s Medicare Advantage and PDP products are heavily regulated by CMS. The regulations and contractual requirements applicable to the Company and other private participants in Medicare programs are complex, expensive to comply with and subject to change. For example, in the second quarter of 2014, CMS issued a final rule implementing the ACA requirements that Medicare Advantage and PDP plans report and refund to CMS overpayments that those plans receive from CMS. The precise interpretation, impact and legality of this rule are not clear and are subject to pending litigation. Payments the Company receives from CMS for its Medicare Advantage and Part D businesses also are subject to risk adjustment based on the health status of the individuals enrolled. Elements of that risk adjustment mechanism continue to be challenged by the DOJ, the Office of the Inspector General of the U.S. Department of Health and Human Services (the “OIG”) and CMS itself. Substantial changes in the risk adjustment mechanism, including changes that result from enforcement or audit actions, could materially affect the amount of the Company’s Medicare reimbursement, require the Company to raise prices or reduce the benefits offered to Medicare beneficiaries, and potentially limit the Company’s (and the industry’s) participation in the Medicare program.
The Company has invested significant resources to comply with Medicare standards, and its Medicare compliance efforts will continue to require significant resources. CMS may seek premium and other refunds, prohibit the Company from continuing to market and/or enroll members in or refuse to passively enroll members in one or more of the Company’s Medicare or Medicare-Medicaid demonstration (historically known as “dual eligible”) plans, exclude us from participating in one or more Medicare, dual eligible or dual eligible special needs plan programs and/or institute other sanctions and/or civil monetary penalties against the Company if it fails to comply with CMS regulations or its Medicare contractual requirements. The Company’s Medicare Supplement products are regulated at the state level and subject to similar significant compliance requirements and risks.
CMS regularly audits the Company’s performance to determine its compliance with CMS’s regulations and its contracts with CMS and to assess the quality of services it provides to Medicare Advantage and PDP beneficiaries. For example, CMS conducts risk adjustment data validation (“RADV”) audits of a subset of Medicare Advantage contracts for each contract year. Since 2013, CMS has selected certain of the Company’s Medicare Advantage contracts for various years for RADV audit, and the number of RADV audits continues to increase. The OIG also is auditing the Company’s risk adjustment data and that of other companies, and the Company expects CMS and the OIG to continue auditing risk adjustment data. The Company also has received Civil Investigative Demands (“CIDs”) from, and provided documents and information to, the Civil Division of the DOJ in connection with a current investigation of its patient chart review processes in connection with risk adjustment data submissions under Parts C and D of the Medicare program.
16
On October 26, 2018, CMS issued proposed rules related to, among other things, changes to the RADV audit methodology established by CMS in 2012. CMS projects that the changes to the RADV audit methodology would increase its recoveries from Medicare Advantage plans as a result of RADV audits. CMS has requested comments on the proposed rules, including whether the proposed RADV rule change should apply retroactively to audits of Medicare Advantage plans for contract year 2011 and forward. The Company is evaluating the potential adverse effect, which could be material, on the Company’s operating results, financial condition, and cash flows if the proposed RADV rule change were adopted as proposed. CMS also has announced that its goal is to subject all Medicare Advantage contracts to either a comprehensive or a targeted RADV audit for each contract year.
A portion of each Medicare Advantage plan’s reimbursement is tied to the plan’s “star ratings.” The star rating system considers a variety of measures adopted by CMS, including quality of preventative services, chronic illness management, compliance and overall customer satisfaction. Only Medicare Advantage plans with an overall star rating of four or more stars (out of five stars) are eligible for a quality bonus in their basic premium rates. As a result, the Company’s Medicare Advantage plans’ operating results in 2020 and going forward will be significantly affected by their star ratings. The Company’s star ratings and past performance scores are adversely affected by the compliance issues that arise each year in its Medicare operations. CMS released the Company’s 2020 star ratings in October 2019. The Company’s 2020 star ratings will be used to determine which of its Medicare Advantage plans have ratings of four stars or higher and qualify for bonus payments in 2021. Based on the Company’s membership at December 31, 2019, 83% of the Company’s Medicare Advantage members were in plans with 2020 star ratings of at least 4.0 stars. CMS will release updated stars ratings in October 2020 that will be used to determine which Medicare Advantage plans have ratings of four stars or higher and qualify for bonus payments in 2022. CMS also gives PDPs star ratings which affect PDP’s enrollment. Medicare Advantage and PDP plans that are rated less than three stars for three consecutive years are subject to contract termination by CMS. CMS continues to revise its star ratings system to make it harder to achieve four stars or more. Despite the Company’s success in achieving high 2020 star ratings and other quality measures and the continuation of its improvement efforts, there can be no assurances that it will be successful in maintaining or improving its star ratings in future years. Accordingly, the Company’s Medicare Advantage plans may not be eligible for full level quality bonuses, which could adversely affect the benefits such plans can offer, reduce membership and/or reduce profit margins.
Overall, the Company projects the benchmark payment rates in CMS’s April 2019 final notice detailing final Medicare Advantage benchmark payment rates for 2020 (the “Final Notice”) will increase funding for the Company’s Medicare Advantage business, excluding the impact of the HIF, by approximately 2.0% in 2020 compared to 2019. This 2020 rate increase only partially offsets the challenge the Company faces from the impact of the increasing cost of medical care (including prescription medications) and CMS local and national coverage decisions that require the Company to pay for services and supplies that are not factored into the Company’s bids. The federal government may seek to impose restrictions on the configuration of pharmacy or other provider networks for Medicare Advantage and/or PDP plans, or otherwise restrict the ability of these plans to alter benefits, negotiate prices or establish other terms to improve affordability or maintain viability of products. The Company currently believes that the payments it has received and will receive in the near term are adequate to justify the Company’s continued participation in the Medicare Advantage and PDP programs, although there are economic and political pressures to continue to reduce spending on the program, and this outlook could change.
Going forward, the Company expects CMS, the OIG, the DOJ, other federal agencies and the U.S. Congress to continue to scrutinize closely each component of the Medicare program (including Medicare Advantage, PDP, demonstration projects such as Medicare-Medicaid plans and provider network access and adequacy), modify the terms and requirements of the program and possibly seek to recast or limit private insurers’ role. It is not possible to predict the outcome of this Congressional or regulatory activity, any of which could materially and adversely affect the Company.
Anti-Remuneration Laws - Federal law prohibits, among other things, an entity from knowingly and willfully offering, paying, soliciting or receiving, subject to certain exceptions and “safe harbors,” any remuneration to induce the referral of individuals or the purchase, lease or order of items or services for which payment may be made under Medicare, Medicaid or certain other federal and state health care programs. A number of states have similar laws, some of which are not limited to services paid for with government funds. Sanctions for violating these federal and state anti-remuneration laws may include imprisonment, criminal and civil fines, and exclusion from participation in Medicare, Medicaid and other federal and state government-sponsored health care programs. Companies involved in public health care programs such as Medicare and/or Medicaid are required to maintain compliance programs to detect and deter fraud, waste and abuse, and are often the subject of fraud, waste and abuse investigations and audits. The Company has invested significant resources to comply with Medicare and Medicaid program standards. Ongoing vigorous law enforcement and the highly technical regulatory scheme mean that the Company’s compliance efforts in this area will continue to require significant resources.
17
Antitrust and Unfair Competition - The U.S. Federal Trade Commission (“FTC”) investigates and prosecutes practices that are “unfair trade practices” or “unfair methods of competition.” Numerous lawsuits have been filed throughout the United States against pharmaceutical manufacturers, retail pharmacies and/or PBMs under various federal and state antitrust and unfair competition laws challenging, among other things: (i) brand name drug pricing and rebate practices of pharmaceutical manufacturers, (ii) the maintenance of retail or specialty pharmacy networks by PBMs, and (iii) various other business practices of PBMs and retail pharmacies. To the extent that the Company appears to have actual or potential market power in a relevant market or CVS Pharmacy, CVS Specialty or MinuteClinic plays a unique or expanded role in a PBM or Health Care Benefits segment product offering, the Company’s business arrangements and uses of confidential information may be subject to heightened scrutiny from an anti-competitive perspective and possible challenge by state and/or federal regulators and/or private parties.
Privacy and Confidentiality Requirements - Many of the Company’s activities involve the receipt, use and disclosure by the Company of personally identifiable information (“PII”) as permitted in accordance with applicable federal and state privacy and data security laws, which require organizations to provide appropriate privacy and security safeguards for such information. In addition to PII, the Company uses and discloses de-identified data for analytical and other purposes when permitted. Additionally, there are industry standards for handling credit card data known as the Payment Card Industry Data Security Standard, which are a set of requirements designed to help ensure that entities that process, store or transmit credit card information maintain a secure environment. Certain states have incorporated these requirements into state laws or enacted other requirements relating to the use and/or disclosure of PII.
The federal Health Insurance Portability and Accountability Act of 1996 and the regulations issued thereunder (collectively, “HIPAA”), as further modified by the American Recovery and Reinvestment Act of 2009 (“ARRA”) impose extensive requirements on the way in which health plans, health care providers, health care clearinghouses (known as “covered entities”) and their business associates use, disclose and safeguard protected health information (“PHI”). Further, ARRA requires the Company and other covered entities to report any breaches of PHI to impacted individuals and to the U.S. Department of Health and Human Services (“HHS”) and to notify the media in any states where 500 or more people are impacted by the unauthorized release or use of or access to PHI. Criminal penalties and civil sanctions may be imposed for failing to comply with HIPAA standards. The Health Information Technology for Economic and Clinical Health Act (the “HITECH Act”), enacted as part of ARRA, amended HIPAA to impose additional restrictions on third-party funded communications using PHI and the receipt of remuneration in exchange for PHI. The HITECH Act also extended HIPAA privacy and security requirements and penalties directly to business associates. HHS has begun to audit health plans, providers and other parties to enforce HIPAA compliance, including with respect to data security.
In addition to HIPAA, state health privacy laws apply to the extent they are more protective of individual privacy than is HIPAA, including laws that place stricter controls on the release of information relating to specific diseases or conditions and requirements to notify members of unauthorized release or use of or access to PHI. States also have adopted regulations to implement provisions of the Financial Modernization Act of 1999 (also known as the Gramm-Leach-Bliley Act (“GLBA”)) which generally require insurers, including health insurers, to provide customers with notice regarding how their non-public personal health and financial information is used and the opportunity to “opt out” of certain disclosures before the insurer shares such information with a non-affiliated third party. Like HIPAA, GLBA sets a “floor” standard, allowing states to adopt more stringent requirements governing privacy protection. Complying with additional state requirements requires us to make additional investments beyond those the Company has made to comply with HIPAA and GLBA.
The Cybersecurity Information Sharing Act of 2015 encourages organizations to share cyber threat indicators with the federal government and, among other things, directs HHS to develop a set of voluntary cybersecurity best practices for organizations in the health care industry. In addition, states have begun to enact more comprehensive privacy laws and regulations addressing consumer rights to data access, deletion, protection or transparency, such as the California Consumer Privacy Act (“CCPA”). States also are starting to issue regulations and proposed regulations specifically related to cybersecurity, such as the regulations issued by the New York Department of Financial Services. Complying with conflicting cybersecurity regulations, which may differ from state to state, requires significant resources. In addition, differing approaches to state privacy and/or cyber-security regulation and varying enforcement philosophies may materially and adversely affect the Company’s ability to standardize its products and services across state lines. Widely-reported large scale commercial data breaches in the United States and abroad increase the likelihood that additional data security legislation will be considered by additional states. These legislative and regulatory developments will impact the design and operation of the Company’s businesses, its privacy and security strategy and its web-based and mobile assets.
Finally, each Public Exchange is required to adhere to privacy and security standards with respect to PII, and to impose privacy and security standards that are at least as protective of PII as those the Public Exchange has implemented for itself or non-
18
Public Exchange entities, which include insurers offering plans through the Public Exchange and their designated downstream entities, including PBMs and other business associates. These standards may differ from, and be more stringent than, HIPAA.
Consumer Protection Laws - The federal government has many consumer protection laws, such as the Federal Trade Commission Act, the Federal Postal Service Act, the Consumer Product Safety Act and the FTC’s Telemarketing Sales Rule. Most states also have similar consumer protection laws. In addition, the federal government and most states have adopted laws and/or regulations requiring places of public accommodation, health care services and other goods and services to be accessible to people with disabilities. These consumer protection and accessibility laws and regulations have been the basis for investigations, lawsuits and multistate settlements relating to, among other matters, the marketing of loyalty programs, and health care products and services, pricing accuracy, expired front store products, financial incentives provided by drug manufacturers to pharmacies in connection with therapeutic interchange programs, disclosures related to how personal data is used and protected and the accessibility of goods and services to people with disabilities. As a result of the Company’s direct-to-consumer activities, including mobile and web-based solutions offered to members and to other consumers, the Company also is subject to federal and state regulations applicable to electronic communications and to other general consumer protection laws and regulations. For example, the CCPA became effective in 2020, and additional federal and state regulation of consumer privacy protection may be proposed or enacted in 2020. The Company expects these new laws and regulations to impact the design of its products and services and the management and operation of its businesses and to increase its compliance costs.
Telemarketing and Other Outbound Contacts - Certain federal and state laws, such as the Telephone Consumer Protection Act, give the FTC, the Federal Communications Commission and state attorneys general the ability to regulate, and bring enforcement actions relating to, telemarketing practices and certain automated outbound contacts such as phone calls, texts or emails. Under certain circumstances, these laws provide consumers with a private right of action. Violations of these laws could result in substantial statutory penalties and other sanctions.
Pharmacy and Professional Licensure and Regulation - The Company is subject to a variety of intersecting federal and state statutes and regulations that govern the wholesale distribution of drugs; operation of retail, specialty, infusion, LTC and mail order pharmacies; licensure of facilities and professionals, including pharmacists, technicians, nurses and other health care professionals; registration of facilities with the U.S. Drug Enforcement Administration (the “DEA”) and analogous state agencies that regulate controlled substances; packaging, storing, shipping and tracking of pharmaceuticals; repackaging of drug products; labeling, medication guides and other consumer disclosures; interactions with prescribers and health care professionals; compounding of prescription medications; dispensing of controlled and non-controlled substances; counseling of patients; transfers of prescriptions; advertisement of prescription products and pharmacy services; security; inventory control; recordkeeping; reporting to Boards of Pharmacy, the U.S. Food and Drug Administration (the “FDA”), the U.S. Consumer Product Safety Commission, the DEA and related state agencies; and other elements of pharmacy practice. Pharmacies are highly regulated and have contact with a wide variety of federal, state and local agencies with various powers to investigate, inspect, audit or solicit information, including Boards of Pharmacy and Nursing, the DEA, the FDA, the DOJ, HHS and others. Many of these agencies have broad enforcement powers, conduct audits on a regular basis, can impose substantial fines and penalties, and may revoke the license, registration or program enrollment of a facility or professional.
State Insurance, HMO and Insurance Holding Company Regulation - A number of states regulate affiliated groups of insurers and HMOs such as the Company under holding company statutes. These laws may, among other things, require prior regulatory approval of dividends and material intercompany transfers of assets and transactions between the regulated companies and their affiliates, including their parent holding companies. The Company expects the states in which its insurance and HMO subsidiaries are licensed to continue to expand their regulation of the corporate governance and internal control activities of its insurance companies and HMOs. Changes to state insurance, HMO and/or insurance holding company laws or regulations or changes to the interpretation of those laws or regulations, including due to regulators’ increasing concerns regarding insurance company and/or HMO solvency due, among other things, to past and expected payor insolvencies, could negatively affect the Company’s businesses in various ways, including through increases in solvency fund assessments, requirements that the Company hold greater levels of capital and/or delays in approving dividends from regulated subsidiaries.
PBM offerings of prescription drug coverage under certain risk arrangements may be subject to laws and regulations in various states. Such laws may require that the party at risk become licensed as an insurer, establish reserves or otherwise demonstrate financial viability. Laws that may apply in such cases include insurance laws and laws governing MCOs and limited prepaid health service plans.
The states of domicile of the Company’s regulated subsidiaries have statutory risk-based capital, or “RBC”, requirements for health and other insurance companies and HMOs based on the National Association of Insurance Commissioners’ Risk-Based Capital (RBC) for Insurers Model Act (the “RBC Model Act”). These RBC requirements are intended to assess the capital
19
adequacy of life and health insurers and HMOs, taking into account the risk characteristics of a company’s investments and products. The RBC Model Act sets forth the formula for calculating RBC requirements, which are designed to take into account asset risks, insurance risks, interest rate risks and other relevant risks with respect to an individual company’s business. In general, under these laws, an insurance company or HMO must submit a report of its RBC level to the insurance department or insurance commissioner of its state of domicile for each calendar year. At December 31, 2019, the RBC level of each of the Company’s insurance and HMO subsidiaries was above the level that would require regulatory action.
For information regarding restrictions on certain payments of dividends or other distributions by the Company’s HMO and insurance company subsidiaries, see Note 12 ‘‘Shareholders’ Equity’’ included in Item 8 of this 10-K.
The holding company laws for the states of domicile of certain of the Company’s subsidiaries also restrict the ability of any person to obtain control of an insurance company or HMO without prior regulatory approval. Under those statutes, without such approval (or an exemption), no person may acquire any voting security of an insurance holding company (such as the Company’s ultimate parent company, CVS Health) that controls an insurance company or HMO, or merge with such a holding company, if as a result of such transaction such person would control the insurance holding company. Control is generally defined as the direct or indirect power to direct or cause the direction of the management and policies of a person and is presumed to exist if a person directly or indirectly owns or controls 10% or more of the voting securities of another person.
Certain states have laws that prohibit submitting a false claim or making a false record or statement in order to secure reimbursement from an insurance company. These state laws vary, and violation of them may lead to the imposition of civil or criminal penalties.
Government Agreements and Mandates - The Company and/or its various affiliates are subject to certain consent decrees, settlement and other agreements, corrective action plans and corporate integrity agreements with various federal, state and local authorities relating to such matters as privacy practices, controlled substances, PDPs, expired products, environmental and safety matters, marketing and advertising practices, PBM, LTC and other pharmacy operations and various other business practices. Certain of these agreements contain ongoing reporting, monitoring and/or other compliance requirements for the Company. Failure to meet the Company’s obligations under these agreements could result in civil or criminal remedies, financial penalties, administrative remedies, and/or exclusion from participation in federal health care programs.
Environmental and Safety Regulation - The Company’s businesses are subject to various federal, state and local laws, regulations and other requirements pertaining to protection of the environment, public health and employee safety, including, for example, regulations governing the management of hazardous substances, the cleaning up of contaminated sites, and the maintenance of safe working conditions in the Company’s stores, distribution centers and other facilities. Governmental agencies at the federal, state and local levels continue to focus on the retail and health care sectors’ compliance with such laws and regulations, and have at times pursued enforcement activities. Any failure to comply with these regulations could result in fines or other sanctions by government authorities.
ERISA Regulation - The Employee Retirement Income Security Act of 1974 (“ERISA”), provides for comprehensive federal regulation of certain employee pension and benefit plans, including private employer and union sponsored health plans and certain other plans that contract with us to provide PBM services. In general, the Company assists plan sponsors in the administration of their health benefit plans, including the prescription drug benefit portion of those plans, in accordance with the plan designs adopted by the plan sponsors. In addition, the Company may have fiduciary duties where it has specifically contracted with a plan sponsor to accept limited fiduciary responsibility, such as for the adjudication of initial prescription drug benefit claims and/or the appeals of denied claims under a plan. In addition to its fiduciary provisions, ERISA imposes civil and criminal liability on service providers to health plans and certain other persons if certain forms of illegal remuneration are made or received. These provisions of ERISA are broadly written and their application to specific business practices is often uncertain.
Some of the Company’s health and related benefits and large case pensions products and services and related fees also are subject to potential issues raised by judicial interpretations relating to ERISA. Under those interpretations, together with U.S. Department of Labor (“DOL”) regulations, the Company may have ERISA fiduciary duties with respect to PBM members and/or certain general account assets held under contracts that are not guaranteed benefit policies. As a result, certain transactions related to those general account assets are subject to conflict of interest and other restrictions, and the Company must provide certain disclosures to policyholders annually. The Company must comply with these restrictions or face substantial penalties.
In addition, ERISA generally preempts all state and local laws that relate to employee benefit plans, but the extent of the pre-emption continues to be reviewed by courts, including the U.S. Supreme Court.
20
Other Legislative Initiatives and Regulatory Initiatives - The U.S. federal and state governments, as well as governments in other countries where the Company does business, continue to enact and seriously consider many broad-based legislative and regulatory proposals that have had a material impact on or could materially impact various aspects of the health care and related benefits system and the Company’s businesses, operating results and/or cash flows. For example:
• | Under the Budget Control Act of 2011 and the American Taxpayer Relief Act of 2012 significant, automatic across-the-board budget cuts (known as sequestration) began in March 2013, including Medicare spending cuts of not more than 2% of total program costs per year through 2024. Significant uncertainty remains as to whether and how the U.S. Congress will proceed with actions that create additional federal revenue and/or with entitlement reform. The Company cannot predict future federal Medicare or federal or state Medicaid funding levels or the impact that future federal or state budget actions or entitlement program reform, if it occurs, will have on the Company’s businesses, operations or operating results, but the effects could be materially adverse, particularly on the Company’s Medicare and/or Medicaid revenues, MBRs and operating results. |
• | The European Union’s (“EU’s”) General Data Protection Regulation (“GDPR”) began to apply across the EU during 2018. |
• | Other significant legislative and/or regulatory measures which are or recently have been under consideration include the following: |
• | Elimination of the payment of manufacturer’s rebates on prescription drugs to PBMs, PDPs and Managed Medicaid organizations in connection with federally funded health care programs. |
• | Imposing requirements and restrictions on the design and/or administration of pharmacy benefit plans offered by the Company’s and its clients’ health plans and/or its PBM clients and/or the services the Company provides to those clients, including prohibiting “differential” or “spread” pricing in PBM contracts; restricting or eliminating the use of formularies for prescription drugs; restricting the Company’s ability to require members to obtain drugs through a home delivery or specialty pharmacy; restricting the Company’s ability to place certain specialty or other drugs in the higher cost tiers of its pharmacy formularies; restricting the Company’s ability to make changes to drug formularies and/or clinical programs; limiting or eliminating rebates on pharmaceuticals; requiring the use of up front purchase price discounts on pharmaceuticals in lieu of rebates; restricting the Company’s ability to configure its health plan and retail pharmacy provider networks; and restricting or eliminating the use of certain drug pricing methodologies. |
• | Increased federal or state government regulation of, or involvement in, the pricing and/or purchasing of drugs. |
• | Restricting the Company’s ability to limit providers’ participation in its networks and/or remove providers from its networks by imposing network adequacy requirements or otherwise (including in its Medicare and Commercial Health Care Benefits products). |
• | Imposing assessments on (or to be collected by) health plans or health carriers that may or may not be passed through to their customers. These assessments may include assessments for insolvency, the uninsured, uncompensated care, Medicaid funding or defraying health care provider medical malpractice insurance costs. |
• | Mandating coverage by the Company’s and its clients’ health plans for additional conditions and/or specified procedures, drugs or devices (for example, high cost pharmaceuticals, experimental pharmaceuticals and oral chemotherapy regimens). |
• | Regulating electronic connectivity. |
• | Mandating or regulating the disclosure of provider fee schedules, manufacturer’s rebates and other data about the Company’s payments to providers and/or payments the Company receives from pharmaceutical manufacturers. |
• | Mandating or regulating disclosure of provider outcome and/or efficiency information. |
• | Prescribing or limiting members’ financial responsibility for health care or other covered services they utilize, including restricting “surprise” bills by providers and by specifying procedures for resolving “surprise” bills. |
• | Prescribing payment levels for health care and other covered services rendered to the Company’s members by providers who do not have contracts with the Company. |
• | Assessing the medical device status of HIT products and/or solutions, mobile consumer wellness tools and clinical decision support tools, which may require compliance with FDA requirements in relation to some of these products, solutions and/or tools. |
• | Restricting the ability of employers and/or health plans to establish or impose member financial responsibility. |
• | Amending or supplementing ERISA to impose greater requirements on PBMs or the administration of employer-funded benefit plans or limit the scope of current ERISA pre-emption, which would among other things expose the Company and other health plans to expanded liability for punitive and other extra-contractual damages and additional state regulation. |
21
It is uncertain whether the Company can counter the potential adverse effects of such potential legislation or regulation on its operating results or cash flows, including whether it can recoup, through higher premium rates, expanded membership or other measures, the increased costs of mandated coverage or benefits, assessments, fees, taxes or other increased costs, including the cost of modifying its systems to implement any enacted legislation or regulations.
The Company’s businesses also may be affected by other legislation and regulations. The Dodd-Frank Wall Street Reform and Consumer Protection Act (the “Financial Reform Act”) creates incentives for whistleblowers to speak directly to the government rather than utilizing internal compliance programs and reduces the burden of proof under the Foreign Corrupt Practices Act of 1977 (the “FCPA”). There also are laws and regulations that set standards for the escheatment of funds to states.
Health savings accounts, health reimbursement arrangements and flexible spending accounts and certain of the tax, fee and subsidy provisions of the ACA also are regulated by the U.S. Department of the Treasury and the Internal Revenue Service.
The Company also may be adversely affected by court and regulatory decisions that expand or revise the interpretations of existing statutes and regulations or impose medical malpractice or bad faith liability. Federal and state courts, including the U.S. Supreme Court, continue to consider cases, and federal and state regulators continue to issue regulations and interpretations, addressing bad faith liability for denial of medical claims, the scope of ERISA’s fiduciary duty requirements, the scope of the False Claims Act and the pre-emptive effect of ERISA on state laws.
Contract Audits - The Company is subject to audits of many of its contracts, including its PBM client contracts, its PBM rebate contracts, its PBM network contracts, its contracts relating to Medicare Advantage and/or Medicare Part D, the agreements the Company’s pharmacies enter into with other payors, its Medicaid contracts and its customer contracts. Because some of the Company’s contracts are with state or federal governments or with entities contracted with state or federal agencies, audits of these contracts are often regulated by the federal or state agencies responsible for administering federal or state benefits programs, including those which operate Medicaid fee for service plans, Managed Medicaid plans, Medicare Part D plans or Medicare Advantage organizations.
Federal Employee Health Benefits Program - The Company’s subsidiaries contract with the Office of Personnel Management (the “OPM”) to provide managed health care services under the FEHB program in their service areas. These contracts with the OPM and applicable government regulations establish premium rating arrangements for this program. OPM regulations require that community-rated FEHB plans meet a FEHB program-specific minimum MLR by plan code and market. Managing to these rules is complicated by the simultaneous application of the minimum MLR standards and associated premium rebate requirements of the ACA. The Company also has a contractual arrangement with carriers for the FEHB program, such as the BlueCross BlueShield Association, to provide pharmacy services to federal employees, postal workers, annuitants, and their dependents under the Government-wide Service Benefit Plan, as authorized by the FEHB Act and as part of the FEHB program. Additionally, the Company manages certain FEHB plans on a “cost-plus” basis. These arrangements subject the Company to certain aspects of FEHB Act, and other federal regulations, such as the FEHB Acquisition Regulation, that otherwise would not be applicable to the Company. The OPM also is auditing the Company and its other contractors to, among other things, verify that plans meet their applicable FEHB program-specific MLR and the premiums established under the OPM’s Insured contracts and costs allocated pursuant to the OPM’s cost-based contracts are in compliance with the requirements of the applicable FEHB program. The OPM may seek premium refunds or institute other sanctions against the Company if it fails to comply with the FEHB program requirements.
Clinical Services Regulation - The Company provides clinical services to health plan and PBM plan members for complex and common medical conditions, including arranging for those members to participate in disease management programs. State laws regulate the practice of medicine, the practice of pharmacy, the practice of nursing and certain other clinical activities. Clinicians engaged in a professional practice in connection with the provision of clinical services must satisfy applicable state licensing requirements and must act within their scope of practice.
Third Party Administration and Other State Licensure Laws - Many states have licensure or registration laws governing certain types of administrative organizations, such as PPOs, TPAs and companies that provide utilization review services. Several states also have licensure or registration laws governing the organizations that provide or administer consumer card programs (also known as cash card or discount card programs).
International Regulation - The Company has insurance licenses in several foreign jurisdictions and does business directly or through local affiliations in numerous countries around the world. The Company has taken steps to be able to continue to serve
22
customers in the European Economic Area following the United Kingdom’s exit from the EU (“Brexit”). However, the impact of Brexit on the Company’s international business and operating results is uncertain.
The Company’s international operations are subject to different, and sometimes more stringent, legal and regulatory requirements, which vary widely by jurisdiction, including anti-corruption laws; economic sanctions laws; various privacy, insurance, tax, tariff and trade laws and regulations; corporate governance, privacy, data protection (including the EU’s General Data Protection Regulation which began to apply across the EU during 2018), data mining, data transfer, labor and employment, intellectual property, consumer protection and investment laws and regulations; discriminatory licensing procedures; compulsory cessions of reinsurance; required localization of records and funds; higher premium and income taxes; limitations on dividends and repatriation of capital; and requirements for local participation in an insurer’s ownership. In addition, the expansion of the Company’s operations into foreign countries increases the Company’s exposure to the anti-bribery, anti-corruption and anti-money laundering provisions of U.S. law, including the FCPA, and corresponding foreign laws, including the U.K. Bribery Act 2010 (the “UK Bribery Act”).
Anti-Corruption Laws - The FCPA prohibits offering, promising or authorizing others to give anything of value to a foreign government official to obtain or retain business or otherwise secure a business advantage. The Company also is subject to applicable anti-corruption laws of the jurisdictions in which it operates. In many countries outside the United States, health care professionals are employed by the government. Therefore, the Company’s dealings with them are subject to regulation under the FCPA. Violations of the FCPA and other anti-corruption laws may result in severe criminal and civil sanctions as well as other penalties, and there continues to be a heightened level of FCPA enforcement activity by the U.S. Securities and Exchange Commission (the “SEC”) and the DOJ. The UK Bribery Act is an anti-corruption law that is broader in scope than the FCPA and applies to all companies with a nexus to the United Kingdom. Disclosures of FCPA violations may be shared with the UK authorities, thus potentially exposing companies to liability and potential penalties in multiple jurisdictions. The Company has internal control policies and procedures and conducts training and compliance programs for its employees to deter prohibited practices. However, if the Company’s employees or agents fail to comply with applicable laws governing its international or other operations, it may face investigations, prosecutions and other legal proceedings and actions which could result in civil penalties, administrative remedies and criminal sanctions.
Anti-Money Laundering Regulations - Certain lines of the Company’s businesses are subject to Treasury anti-money laundering regulations. Those lines of business have implemented anti-money laundering policies designed to ensure their compliance with the regulations. The Company also is subject to anti-money laundering laws in non-U.S. jurisdictions where it operates.
Office of Foreign Assets Control - The Company also is subject to regulation by OFAC. OFAC administers and enforces economic and trade sanctions based on U.S. foreign policy and national security goals against targeted foreign countries and regimes, terrorists, international narcotics traffickers, those engaged in activities related to the proliferation of weapons of mass destruction, and other threats to the national security, foreign policy or economy of the United States. In addition, the Company is subject to similar regulations in the non-U.S. jurisdictions in which it operates.
FDA Regulation - The FDA regulates the Company’s compounding pharmacy and clinical research operations. The FDA also generally has authority to, among other things, regulate the manufacture, distribution, sale and labeling of medical devices (including hemodialysis devices such as the device the Company is developing and mobile medical devices) and many products sold through retail pharmacies, including prescription drugs, over-the-counter medications, cosmetics, dietary supplements and certain food items. In addition, the FDA regulates the Company’s activities as a distributor of store brand products.
Laws and Regulations Related to the Pharmacy Services Segment
In addition to the laws and regulations discussed above that may affect multiple segments of the Company’s business, the Company is subject to federal, state and local statutes and regulations governing the operation of its Pharmacy Services segment specifically. Among these are the following:
PBM Laws and Regulation - Legislation and/or regulations seeking to regulate PBM activities in a comprehensive manner have been proposed or enacted in a number of states. This legislation could adversely affect the Company’s ability to conduct business on commercially reasonable terms in states where the legislation is in effect and the Company’s ability to standardize its PBM products and services across state lines. In addition, certain quasi-regulatory organizations, including the National Association of Boards of Pharmacy and the National Association of Insurance Commissioners (“NAIC”) and the National Council of Insurance Legislators, have issued model regulations or may propose future regulations concerning PBMs and/or PBM activities. Similarly, credentialing organizations such as NCQA and URAC may establish voluntary standards regarding
23
PBM, mail order pharmacy and/or specialty pharmacy activities. While the actions of these quasi-regulatory or standard-setting organizations do not have the force of law, they may influence states to adopt their requirements or recommendations and influence client requirements for PBM, mail order pharmacy and/or specialty pharmacy services. Moreover, any standards established by these organizations could also impact the Company’s health plan clients and/or the services provided to those clients and/or the Company’s health plans.
The Company’s PBM activities also are regulated directly and indirectly at the federal and state levels, including being subject to the False Claims Act and state false claims acts and federal and state anti-kickback laws. These laws and regulations govern, and proposed legislation and regulations may govern and/or further restrict, critical PBM practices, including disclosure, receipt and retention of rebates and other payments received from pharmaceutical manufacturers; use of, administration of and/or changes to drug formularies, maximum allowable cost (“MAC”) list pricing, average wholesale prices (“AWPs”) and/or clinical programs; the offering to plan sponsors of pricing that includes retail network “differential” or “spread” (i.e., a difference between the drug price charged to the plan sponsor by a PBM and the price paid by the PBM to the dispensing provider); disclosure of data to third parties; drug utilization management practices; the level of duty a PBM owes its customers; configuration of pharmacy networks; the operations of the Company’s pharmacies (including audits of its pharmacies); disclosure of negotiated provider reimbursement rates; disclosure of fees associated with administrative service agreements and patient care programs that are attributable to members’ drug utilization; and registration or licensing of PBMs. Failure by the Company or one of its PBM services suppliers to comply with these laws or regulations could result in material fines and/or sanctions and could have a material adverse effect on the Company’s operating results and/or cash flows.
The Company’s PBM service contracts, including those in which the Company assumes certain risks under performance guarantees or similar arrangements, are generally not subject to insurance regulation by the states. However, state departments of insurance are increasing their oversight of PBM activities due to legislation passing in a number of states requiring PBMs to register or obtain a license with the department. Rulemaking is either underway or has already taken place in a number of states with the areas of focus on licensure requirements, pharmacy reimbursement for generics (MAC reimbursement) and pharmacy audits - most of which fall under the state insurance code.
Pharmacy Network Access Legislation - Medicare Part D and a majority of states now have some form of legislation affecting the Company’s (and its health plans’ and its health plan clients’) ability to limit access to a pharmacy provider network or remove pharmacy network providers. For example, certain “any willing provider” legislation may require the Company or its clients to admit a nonparticipating pharmacy if such pharmacy is willing and able to meet the plan’s price and other applicable terms and conditions for network participation. These laws could negatively affect the services and economic benefits achievable through a limited pharmacy provider network. Also, a majority of states now have some form of legislation affecting the Company’s ability (and the Company’s and its client health plans’ ability) to conduct audits of network pharmacies regarding claims submitted to the Company for payment. These laws could negatively affect the Company’s ability to recover overpayments of claims submitted by network pharmacies that the Company identifies through pharmacy audits.
Pharmacy Pricing Legislation - A number of states have passed legislation regulating the Company’s ability to manage and establish MACs for generic prescription drugs. MAC methodology is a common cost management practice used by private and public payors (including CMS) to pay pharmacies for dispensing generic prescription drugs. MAC prices specify the allowable reimbursement by a PBM for a particular strength and dosage of a generic drug that is available from multiple manufacturers but sold at different prices. State legislation can regulate the disclosure of MAC prices and MAC price methodologies, the kinds of drugs that a PBM can pay for at a MAC price, and the rights of pharmacies to appeal a MAC price established by a PBM. These laws could negatively affect the Company’s ability to establish MAC prices for generic drugs.
Formulary and Plan Design Regulation - A number of government entities regulate the administration of prescription drug benefits. HHS regulates how Medicare Part D formularies are developed and administered, including requiring the inclusion of all drugs in certain classes and categories, subject to limited exceptions. Under the ACA, CMS imposes drug coverage requirements for health plans required to cover essential health benefits, including plans offered through federal or state Public Exchanges. Additionally, the NAIC and health care accreditation agencies like NCQA and URAC have developed model acts and standards for formulary development that are often incorporated into government requirements. Many states regulate the scope of prescription drug coverage, as well as the delivery channels to receive prescriptions, for insurers, MCOs and Medicaid managed care plans. The increasing government regulation of formularies could significantly affect the Company’s ability to develop and administer formularies, pharmacy networks and other plan design features on behalf of its insurer, MCO and other clients. Similarly, some states prohibit health plan sponsors from implementing certain restrictive pharmacy benefit plan design features. This regulation could limit or preclude (i) limited networks, (ii) a requirement to use particular providers, (iii) copayment differentials among providers and (iv) formulary tiering practices.
24
Laws and Regulations Related to the Retail/LTC Segment
In addition to the laws and regulations discussed above that may affect multiple segments of the Company’s business, the Company is subject to federal, state and local statutes and regulations governing the operation of its Retail/LTC segment specifically. Among these are the following:
Retail Medical Clinics - States regulate retail medical clinics operated by nurse practitioners or physician assistants through physician oversight, clinic and lab licensure requirements and the prohibition of the corporate practice of medicine. A number of states have implemented or proposed laws or regulations that impact certain components of retail medical clinic operations such as physician oversight, signage, third party contracting requirements, bathroom facilities, and scope of services. These laws and regulations may affect the operation and expansion of the Company’s owned and managed retail medical clinics.
Other Laws - Other federal, state and local laws and regulations also impact the Company’s retail operations, including laws and regulations governing the practice of optometry, the practice of audiology, the provision of dietician services and the sale of durable medical equipment, contact lenses, eyeglasses, hearing aids and alcohol.
Laws and Regulations Related to the Health Care Benefits Segment
In addition to the laws and regulations discussed above that may affect multiple segments of the Company’s business, the Company is subject to federal, state, local and international statutes and regulations governing its Health Care Benefits segment specifically.
Overview - Differing approaches to state insurance regulation and varying enforcement philosophies may materially and adversely affect the Company’s ability to standardize its Health Care Benefits products and services across state lines. These laws and regulations, including the ACA, restrict how the Company conducts its business and result in additional burdens and costs to the Company. Significant areas of governmental regulation include premium rates and rating methodologies, underwriting rules and procedures, required benefits, sales and marketing activities, provider rates of payment, restrictions on health plans’ ability to limit providers’ participation in their networks and/or remove providers from their networks and financial condition (including reserves and minimum capital or risk based capital requirements). These laws and regulations are different in each jurisdiction and vary from product to product.
Each health insurer and HMO must file periodic financial and operating reports with the states in which it does business. In addition, health insurers and HMOs are subject to state examination and periodic license renewal. Applicable laws also restrict the ability of the Company’s regulated subsidiaries to pay dividends, and certain dividends require prior regulatory approval. In addition, some of the Company’s businesses and related activities may be subject to PPO, managed care organization, utilization review or TPA-related licensure requirements and regulations. These licensure requirements and regulations differ from state to state, but may contain provider network, contracting, product and rate, financial and reporting requirements. There also are laws and regulations that set specific standards for the Company’s delivery of services, payment of claims, fraud prevention, protection of consumer health information, and payment for covered benefits and services.
Required Regulatory Approvals - The Company must obtain and maintain regulatory approvals to price, market and administer many of its Health Care Benefits products. Supervisory agencies, including CMS, the Center for Consumer Information and Insurance Oversight and the DOL, as well as state health, insurance, managed care and Medicaid agencies, have broad authority to take one or more of the following actions:
• | Grant, suspend and revoke the Company’s licenses to transact business; |
• | Suspend or exclude the Company from participation in government programs; |
• | Suspend or limit the Company’s authority to market products; |
• | Regulate many aspects of the products and services the Company offers, including the pricing and underwriting of many of its products and services; |
• | Assess damages, fines and/or penalties; |
• | Terminate the Company’s contract with the government agency and/or withhold payments from the government agency to the Company; |
• | Impose retroactive adjustments to premiums and require the Company to pay refunds to the government, customers and/or members; |
• | Restrict the Company’s ability to conduct acquisitions or dispositions; |
25
• | Require the Company to maintain minimum capital levels in its subsidiaries and monitor its solvency and reserve adequacy; |
• | Regulate the Company’s investment activities on the basis of quality, diversification and other quantitative criteria; and/or |
• | Exclude the Company’s plans from participating in Public Exchanges if they are deemed to have a history of “unreasonable” premium rate increases or fail to meet other criteria set by HHS or the applicable state. |
The Company’s operations, current and past business practices, current and past contracts, and accounts and other books and records are subject to routine, regular and special investigations, audits, examinations and reviews by, and from time to time the Company receives subpoenas and other requests for information from, federal, state and international supervisory and enforcement agencies, attorneys general and other state, federal and international governmental authorities and legislators.
Commercial Product Pricing and Underwriting Restrictions - Pricing and underwriting regulation by states limits the Company’s underwriting and rating practices and those of other health insurers, particularly for small employer groups, and varies by state. In general, these limitations apply to certain customer segments and limit the Company’s ability to set prices for new or renewing groups, or both, based on specific characteristics of the group or the group’s prior claim experience. In some states, these laws and regulations restrict the Company’s ability to price for the risk it assumes and/or reflect reasonable costs in the Company’s pricing.
The ACA expanded the premium rate review process by, among other things, requiring the Company’s Commercial Insured rates to be reviewed for “reasonableness” at either the state or the federal level. HHS established a federal premium rate review process that generally applies to proposed premium rate increases equal to or exceeding a federally (or lower state) specified threshold. HHS’s rate review process imposes additional public disclosure requirements as well as additional review on filings requesting premium rate increases equal to or exceeding this “reasonableness” threshold. These combined state and federal review requirements may prevent, further delay or otherwise affect the Company’s ability to price for the risk it assumes, which could adversely affect its MBRs and operating results, particularly during periods of increased utilization of medical services and/or medical cost trend or when such utilization and/or trend exceeds the Company’s projections.
The ACA also specifies minimum MLRs of 85% for large group Commercial products and 80% for individual and small group Commercial products. Because the ACA minimum MLRs are structured as “floors” for many of their requirements, states have the latitude to enact more stringent rules governing these restrictions. For Commercial products, states have and may adopt higher minimum MLR requirements, use more stringent definitions of “medical loss ratio,” incorporate minimum MLR requirements into prospective premium rate filings, require prior approval of premium rates or impose other requirements related to minimum MLR. Minimum MLR requirements and similar actions further limit the level of margin the Company can earn in its Insured Commercial products while leaving the Company exposed to medical costs that are higher than those reflected in its pricing. The Company also may be subject to significant fines, penalties, premium refunds and litigation if it fails to comply with minimum MLR laws and regulations.
In addition, the Company requested significant increases in its premium rates in its Commercial Health Care Benefits business for 2020 (including as a result of the reinstatement of the HIF for 2020 following the temporary suspension of the HIF for 2019) and expects to continue to request increases in those rates for 2021 and beyond in order to adequately price for projected medical cost trends, required expansions of coverage and rating limits, and significant assessments, fees and taxes imposed by the federal and state governments, including as a result of the ACA. The Company’s rates also must be adequate to reflect adverse selection in its products, particularly in small group Commercial products, which the Company expects to continue and potentially worsen in 2020. These rate increases may be significant and thus heighten the risks of adverse publicity, adverse regulatory action and adverse selection and the likelihood that the Company’s requested premium rate increases will be denied, reduced or delayed, which could lead to operating margin compression.
Many of the laws and regulations governing the Company’s pricing and underwriting practices also limit the differentials in premium rates insurers and other carriers may charge between new and renewal business, and/or between groups based on differing characteristics. They may also require that carriers disclose to customers the basis on which the carrier establishes new business and renewal premium rates and limit the ability of a carrier to terminate customers’ coverage.
Medicaid Regulation - The Company is seeking to substantially grow its Medicaid, dual eligible and dual eligible special needs plan businesses over the next several years. As a result, the Company also is increasing its exposure to changes in government policy with respect to and/or regulation of the various Medicaid, dual eligible and dual eligible special needs plan programs in which the Company participates, including changes in the amounts payable to the Company under those programs.
26
Since 2017, Managed Medicaid products, including those the Company offers, are subject to a minimum federal MLR of 85%. A Medicaid managed care quality rating system and provider network adequacy requirements also apply to Medicaid products. Because the federal minimum MLR is structured as a “floor,” states have the latitude to enact more stringent rules governing these restrictions. For Managed Medicaid products, states may adopt higher minimum MLR requirements, use more stringent definitions of “medical loss ratio” or impose other requirements related to minimum MLR. Minimum MLR requirements and similar actions further limit the level of margin the Company can earn in its Insured Medicaid products while leaving the Company exposed to medical costs that are higher than those reflected in its pricing. The Company also may be subject to significant fines, penalties, premium refunds and litigation if it fails to comply with minimum MLR laws and regulations.
The impact of Medicaid expansion under the ACA is uncertain. The future of the ACA is uncertain, and states may opt out of the elements of the ACA requiring expansion of Medicaid coverage without losing their current federal Medicaid funding. To date, a number of states and the District of Columbia have expanded Medicaid coverage to the higher eligibility levels contemplated by the ACA. In addition, the election of new governors and/or state legislatures may impact states’ previous decisions regarding Medicaid expansion. Proposals for substantial changes to federal funding of state Medicaid programs are likely to be considered in 2020 and beyond, including the possibility of converting federal Medicaid support to block grants (such as the block grant option outlined by CMS on January 30, 2020) and per capita caps on federal funding. Uncertainty regarding federal funding is causing and will continue to cause states to re-evaluate their Medicaid expansions and consider new assessments, fees and/or taxes on health plans. That re-evaluation and any changes to federal funding of state Medicaid programs may adversely affect Medicaid payment rates, the Company’s revenues and its Medicaid membership.
The economic aspects of the Medicaid, dual eligible and dual eligible special needs plan business vary from state to state and are subject to frequent change. Medicaid premiums are paid by each state and differ from state to state. The federal government and certain states also are considering proposals and legislation for Medicaid and dual eligible program reforms or redesigns, including restrictions on the collection of manufacturer’s rebates on pharmaceuticals by Medicaid MCOs and their contracted PBMs, further program, population and/or geographic expansions of risk-based managed care, increasing beneficiary cost-sharing or payment levels, and changes to benefits, reimbursement, eligibility criteria, provider network adequacy requirements (including requiring the inclusion of specified high cost providers in the Company’s networks) and program structure. In some states, current Medicaid and dual eligible funding and premium revenue may not be adequate for the Company to continue program participation. The Company’s Medicaid and dual eligible contracts with states (or sponsors of Medicaid managed care plans) are subject to cancellation by the state (or the sponsors of the managed care plans) after a short notice period without cause (for example, when a state discontinues a managed care program) or in the event of insufficient state funding.
The Company’s Medicaid, dual eligible and dual eligible special needs plan products also are heavily regulated by CMS and state Medicaid agencies, which have the right to audit the Company’s performance to determine compliance with CMS contracts and regulations. The Company’s Medicaid products, dual eligible products and CHIP contracts also are subject to complex federal and state regulations and oversight by state Medicaid agencies regarding the services provided to Medicaid enrollees, payment for those services, network requirements (including mandatory inclusion of specified high-cost providers), and other aspects of these programs, and by external review organizations which audit Medicaid plans on behalf of state Medicaid agencies. The laws, regulations and contractual requirements applicable to the Company and other participants in Medicaid and dual eligible programs, including requirements that the Company submit encounter data to the applicable state agency, are extensive, complex and subject to change. The Company has invested significant resources to comply with these standards, and its Medicaid and dual eligible program compliance efforts will continue to require significant resources. CMS and/or state Medicaid agencies may fine the Company, withhold payments to the Company, seek premium and other refunds, terminate the Company’s existing contracts, elect not to award the Company new contracts or not to renew the Company’s existing contracts, prohibit the Company from continuing to market and/or enroll members in or refuse to automatically assign members to one or more of the Company’s Medicaid or dual eligible products, exclude the Company from participating in one or more Medicaid or dual eligible programs and/or institute other sanctions and/or civil monetary penalties against the Company if it fails to comply with CMS or state regulations or contractual requirements.
The Company cannot predict whether pending or future federal or state legislation or court proceedings will change various aspects of the Medicaid program, nor can it predict the impact those changes will have on its business operations or operating results, but the effects could be materially adverse.
State Workers’ Compensation Laws - The Company’s workers’ compensation business includes the comparison of medical claims data against the applicable state’s fee schedule pricing, including applicable regulations and clinical guidelines. State fee schedules, which typically represent the maximum reimbursement for medical services provided to the injured worker, differ by state and change as state laws and regulations are passed and/or amended. The Company’s workers’ compensation business also includes PBM and care management services, both of which are regulated at the state level. The Company’s workers’
27
compensation customers include insurance carriers and TPAs who also are regulated at the state level. The laws and regulations applicable to the Company and other participants in the workers’ compensation business are extensive, complex and subject to change. The Company has invested significant resources to comply with these standards, and its workers’ compensation compliance efforts will continue to require significant resources. The Company may be subject to significant fines, penalties and litigation if it fails to comply with those laws and regulations.
Federal and State Reporting - The Company is subject to extensive financial and business reporting requirements, including penalties for inaccuracies and/or omissions, at both the federal and state level. The Company’s ability to comply with certain of these requirements depends on receipt of information from third parties that may not be readily available or reliably provided in all instances. The Company is and will continue to be required to modify its information systems, dedicate significant resources and incur significant expenses to comply with these requirements. However, the Company cannot eliminate the risks of unavailability of or errors in its reports.
Product Design and Administration and Sales Practices - State and/or federal regulatory scrutiny of health care benefit product design and administration and marketing and advertising practices, including the filing of insurance policy forms, the adequacy of provider networks, the accuracy of provider directories, and the adequacy of disclosure regarding products and their administration, is increasing as are the penalties being imposed for inappropriate practices. Medicare, Medicaid and dual eligible products and products offering more limited benefits in particular continue to attract increased regulatory scrutiny.
Guaranty Fund Assessments/Solvency Protection - Under guaranty fund laws existing in all states, insurers doing business in those states can be assessed (in most states up to prescribed limits) for certain obligations of insolvent insurance companies to policyholders and claimants. The life and health insurance guaranty associations in which the Company participates that operate under these laws respond to insolvencies of long-term care insurers as well as health insurers. The Company’s assessments generally are based on a formula relating to the Company’s health care premiums in the state compared to the premiums of other insurers. Certain states allow assessments to be recovered over time as offsets to premium taxes. Some states have similar laws relating to HMOs and/or other payors such as not-for-profit consumer governed health plans established under the ACA. While historically the Company has ultimately recovered more than half of guaranty fund assessments through statutorily permitted premium tax offsets, significant increases in assessments could lead to legislative and/or regulatory actions that limit future offsets.
Available Information
CVS Health Corporation was incorporated in Delaware in 1996. The corporate office is located at One CVS Drive, Woonsocket, Rhode Island 02895, telephone (401) 765-1500. CVS Health’s common stock is listed on the New York Stock Exchange under the trading symbol “CVS.” General information about CVS Health is available through the Company’s website at http://www.cvshealth.com. The Company’s financial press releases and filings with the SEC are available free of charge within the Investors section of the Company’s website at http://investors.cvshealth.com. In addition, the SEC maintains an internet site that contains reports, proxy and information statements and other information regarding issuers, such as the Company, that file electronically with the SEC. The address of that website is http://www.sec.gov. The information on or linked to the Company’s website is neither a part of nor incorporated by reference in this 10-K or any of the Company’s other SEC filings.
In accordance with guidance provided by the SEC regarding use by a company of its websites and social media channels as a means to disclose material information to investors and to comply with its disclosure obligations under SEC Regulation FD, CVS Health Corporation (the “Registrant”) hereby notifies investors, the media and other interested parties that it intends to continue to use its media and investor relations website (http://investors.cvshealth.com/) and its Twitter feed (@CVSHealthIR) to publish important information about the Registrant, including information that may be deemed material to investors. The list of social media channels that the Registrant uses may be updated on its media and investor relations website from time to time. The Registrant encourages investors, the media, and other interested parties to review the information the Registrant posts on its website and social media channels as described above, in addition to information announced by the Registrant through its SEC filings, press releases and public conference calls and webcasts.
28
Item 1A. Risk Factors.
You should carefully consider each of the following risks and uncertainties and all of the other information set forth in this Form 10-K. These risks and uncertainties and other factors may affect forward-looking statements, including those we make in this Form 10-K or elsewhere, such as in news releases or investor or analyst calls, meetings or presentations, on our websites or through our social media channels. The risks and uncertainties described below are not the only ones we face. There can be no assurance that we have identified all the risks that affect us. Additional risks and uncertainties not presently known to us or that we currently believe to be immaterial also may adversely affect our businesses. Any of these risks or uncertainties could cause our actual results to differ materially from our expectations and the expected results discussed in our forward-looking statements. You should not consider past results to be an indication of future performance.
If any of the following risks or uncertainties develops into actual events or if the circumstances described in the risks or uncertainties occur or continue to occur, those events or circumstances could have a material adverse effect on our businesses, operating results, cash flows, financial condition and/or stock price, among other effects on us. You should read the following section in conjunction with the MD&A, included in Item 7 of this Form 10-K, our consolidated financial statements and the related notes, included in Item 8 of this 10-K, and our “Cautionary Statement Concerning Forward-Looking Statements” in this 10-K.
Risks Relating to Our Businesses
Each of our segments operates in a highly competitive and evolving business environment; and gross margins in the industries in which we compete may decline.
Each of our segments, Pharmacy Services, which includes our pharmacy benefit management (“PBM”) business, Retail/LTC, and Health Care Benefits, operates in a highly competitive and evolving business environment. Specifically:
• | As competition increases in the geographies in which we operate, including competition from new entrants, a significant increase in price compression and/or reimbursement pressures could occur, and this could require us to reevaluate our pricing structures to remain competitive. |
• | The competitive success of our Pharmacy Services segment is dependent on our ability to establish and maintain contractual relationships with network pharmacies as PBM clients evaluate adopting narrow or restricted retail pharmacy networks. |
• | The competitive success of our Retail/LTC segment and our specialty pharmacy operations is dependent on our ability to establish and maintain contractual relationships with PBMs and other payors on acceptable terms as the payors’ clients evaluate adopting narrow or restricted retail pharmacy networks. |
• | In our PBM business, we maintain contractual relationships with brand name drug manufacturers that provide for purchase discounts and/or rebates on drugs dispensed by pharmacies in our retail network and by our specialty and mail order pharmacies (all or a portion of which may be passed on to clients). Manufacturer’s rebates often depend on a PBM’s ability to meet contractual requirements, including the placement of a manufacturer’s products on the PBM’s formularies. If we lose our relationship with one or more drug manufacturers, or if the discounts or rebates provided by drug manufacturers decline, our operating results, cash flows and/or prospects could be adversely affected. |
• | The PBM industry has been experiencing price compression as a result of competitive pressures and increased client demands for lower prices, increased revenue sharing, including sharing in a larger portion of rebates received from drug manufacturers, enhanced service offerings and/or higher service levels. Marketplace dynamics and regulatory changes also have adversely affected our ability to offer plan sponsors pricing that includes the use of retail “differential” or “spread,” which could adversely affect our future profitability, and we expect these trends to continue. |
• | Our retail pharmacy, specialty pharmacy and LTC pharmacy operations have been affected by reimbursement pressure caused by competition, including client demands for lower prices, generic drug pricing, earlier than expected generic drug introductions and network reimbursement pressure. If we are unable to increase our prices to reflect, or otherwise mitigate the impact of, increasing costs, our profitability will be adversely affected. If we are unable to limit our price increases, we may lose customers to competitors with more favorable pricing, adversely affecting our revenues and operating results. |
• | A shift in the mix of our pharmacy prescription volume towards programs offering lower reimbursement rates as a result of competition or otherwise could adversely affect our margins, including the ongoing shift in pharmacy mix towards 90-day prescriptions at retail and the ongoing shift in pharmacy mix towards Medicare Part D prescriptions. |
• | PBM client contracts often are for a period of approximately three years. However, PBM clients may require early or periodic re-negotiation of pricing prior to contract expiration. PBM clients are generally well informed, can move between us and our competitors and often seek competing bids prior to expiration of their contracts. We are therefore under pressure |
29
to contain price increases despite being faced with increasing drug costs and increasing operating costs. If we are unable to increase our prices to reflect, or otherwise mitigate the impact of, increasing costs, our profitability will be adversely affected. If we are unable to limit our price increases, we may lose customers to competitors with more favorable pricing, adversely affecting our revenues and operating results.
• | The operating results and margins of our LTC business are further affected by the increased efforts of health care payors to negotiate reduced or capitated pricing arrangements and by the financial health of, and purchases and sales of, our LTC customers. |
• | In our Health Care Benefits segment we are seeking to substantially grow our Medicaid, dual eligible and dual eligible special needs plan membership over the next several years. In many instances, to acquire and retain our government customers’ business, we must bid against our competitors in a highly competitive environment. Winning bids often are challenged successfully by unsuccessful bidders. |
• | Customer contracts in our Health Care Benefits segment are generally for a period of one year, and our customers have considerable flexibility in moving between us and our competitors. One of the key factors on which we compete for customers, especially in uncertain economic environments, is overall cost. We are therefore under pressure to contain premium price increases despite being faced with increasing health care and other benefit costs and increasing operating costs. If we are unable to increase our prices to reflect, or otherwise mitigate the impact of, increasing costs, our profitability will be adversely affected. If we are unable to limit our price increases, we may lose members to competitors with more favorable pricing, adversely affecting our revenues and operating results. In response to rising prices, our customers may elect to self-insure or to reduce benefits in order to limit increases in their benefit costs. Alternatively, our customers may purchase different types of products from us that are less profitable. Such elections may result in reduced membership in our more profitable Insured products and/or lower premiums for our Insured products, which may adversely affect our revenues and operating results, although such elections also may reduce our health care and other benefit costs. In addition, our Medicare, Medicaid and CHIP products are subject to termination without cause, periodic re-bid, rate adjustment and program redesign, as customers seek to contain their benefit costs, particularly in an uncertain economy, and our exposure to this risk is increasing as we grow our Government products membership. These actions may adversely affect our membership, revenues and operating results. |
• | We requested significant increases in our premium rates in our Commercial Health Care Benefits business for 2020 (including as a result of the reinstatement for 2020 of the Health Insurer Fee (the “HIF”) imposed by the Patient Protection and Affordable Care Act and the Health Care and Education Reconciliation Act of 2010 (collectively, the “ACA”) following the temporary suspension of the HIF for 2019) and expect to continue to request increases in those rates for 2021 and beyond in order to adequately price for projected medical cost trends, required expansions of coverage and rating limits, and significant assessments, fees and taxes imposed by the federal and state governments, including as a result of the ACA. Our rates also must be adequate to reflect the risk that our products will be selected by people with a higher risk profile or utilization rate than the pool of participants we anticipated when we established pricing for the applicable products (also known as “adverse selection”), particularly in small group Commercial products, which we expect to continue and potentially worsen in 2020. These rate increases may be significant and thus heighten the risks of adverse publicity, adverse regulatory action and adverse selection and the likelihood that our requested premium rate increases will be denied, reduced or delayed, which could lead to operating margin compression. |
In addition, competitors in each of our businesses may offer services and pricing terms that we may not be willing or able to offer. Competition also may come from new entrants and other sources in the future. Unless we can demonstrate enhanced value to our clients through innovative product and service offerings in the rapidly changing health care industry, we may be unable to remain competitive.
Disruptive innovation by existing or new competitors could alter the competitive landscape in the future and require us to accurately identify and assess such alterations and make timely and effective changes to our strategies and business model to compete effectively. For example, decisions to buy our Pharmacy Services and Health Care Benefits products and services increasingly are made or influenced by consumers, either through direct purchasing (for example, Medicare Advantage plans and PDPs) or through public health insurance exchanges (“Public Exchanges”) and private health insurance exchanges (together with Public Exchanges, collectively, “Insurance Exchanges”) that allow individual choice. Consumers also are increasingly seeking to access consumer goods and health care products and services locally and through other direct channels such as mobile devices and websites. To compete effectively in the consumer-driven marketplace, we will be required to develop or acquire new capabilities, attract new talent and develop new service and distribution relationships that respond to consumer needs and preferences.
30
Changes in marketplace dynamics or the actions of competitors or manufacturers, including industry consolidation, the emergence of new competitors and strategic alliances, and decisions to exclude us from new narrow or restricted retail pharmacy networks could materially and adversely affect our businesses, operating results, cash flows and/or prospects.
A change in our Health Care Benefits product mix may adversely affect our profit margins.
Our Insured Health Care Benefits products that involve greater potential risk generally tend to be more profitable than our ASC products. Historically, smaller employer groups have been more likely to purchase Insured Health Care Benefits products because such purchasers are generally unable or unwilling to bear greater liability for health care expenditures, although over the last several years even relatively small employers have moved to ASC products. We also serve, and expect to grow our business with, government-sponsored programs, including Medicare and Medicaid, that are subject to competitive bids and have lower profit margins than our Commercial Insured Health Care Benefits products. A shift of enrollees from more profitable products to less profitable products could have a material adverse effect on the Health Care Benefits segment’s operating results.
Negative public perception of the industries in which we operate, or of our industries’ or our practices, can adversely affect our businesses, operating results, cash flows and prospects.
Our brand and reputation are two of our most important assets, and the industries in which we operate have been and are negatively perceived by the public from time to time. Negative publicity may come as a result of adverse media coverage, litigation against us and other industry participants, the ongoing public debates over drug pricing, PBMs, government involvement in drug pricing and purchasing, the future of the ACA, “surprise” medical bills, governmental hearings and/or investigations, actual or perceived shortfalls regarding our industries’ or our own products and/or business practices (including PBM operations, drug pricing and insurance coverage determinations) and social media and other media relations activities. Negative publicity also may come from a failure to meet customer expectations for consistent, high quality and accessible care. This risk may increase as we continue to offer products and services that make greater use of data and as our business model becomes more focused on delivering health care to consumers.
Negative public perception and/or publicity of our industries in general, or of us or our key vendors, brokers or product distribution networks in particular, can further increase our costs of doing business and adversely affect our operating results and our stock price by:
• | adversely affecting our brand and reputation; |
• | adversely affecting our ability to market and sell our products and/or services and/or retain our existing customers and members; |
• | requiring us to change our products and/or services; |
• | reducing or restricting the revenue we can receive for our products and/or services; and/or |
• | increasing or significantly changing the regulatory and legislative requirements with which we must comply. |
We must maintain and improve our relationships with our retail and specialty pharmacy customers and increase the demand for our products and services, including proprietary brands.
The success of our businesses depends in part on customer loyalty, superior customer service and our ability to persuade customers to frequent our retail stores and online sites and to purchase products in additional categories and our proprietary brands. Failure to timely identify or effectively respond to changing consumer preferences and spending patterns, and evolving demographic mixes in the communities we serve, an inability to expand the products being purchased by our clients and customers, or the failure or inability to obtain or offer particular categories of products could adversely affect our relationship with our customers and clients and the demand for our products and services and could result in excess inventories of products.
We offer our retail customers proprietary brand products that are available exclusively at our retail stores and through our online retail sites. The sale of proprietary products subjects us to unique risks including potential product liability risks, mandatory or voluntary product recalls, potential supply chain and distribution chain disruptions for raw materials and finished products, our ability to successfully protect our intellectual property rights and the rights of applicable third parties, and other risks generally encountered by entities that source, market and sell private-label products. We also face similar risks for the other products we sell in our retail operations, including supply chain and distribution chain disruption risk. Any failure to adequately address some or all of these risks could have an adverse effect on our retail business, operating results, cash flows and/or financial condition. Additionally, an increase in the sales of our proprietary brands may adversely affect our sales of products owned by
31
our suppliers and adversely impact certain of our supplier relationships. Our ability to locate qualified, economically stable suppliers who satisfy our requirements, and to acquire sufficient products in a timely and effective manner, is critical to ensuring, among other things, that customer confidence is not diminished. Any failure to develop sourcing relationships with a broad and deep supplier base could adversely affect our operating results and erode customer loyalty.
We also could be adversely affected if we fail to identify or effectively respond to changes in marketplace dynamics. For example, specialty pharmacy represents a significant and growing proportion of prescription drug spending in the U.S., a significant portion of which is dispensed outside of traditional retail pharmacies. Because our specialty pharmacy business focuses on complex and high-cost medications, many of which are made available by manufacturers to a limited number of pharmacies (so-called limited distribution drugs) that serve a relatively limited universe of patients, the future growth of our specialty pharmacy business depends largely upon expanding our access to key drugs and penetration in certain treatment categories. Any contraction of our base of patients or reduction in demand for the prescriptions we currently dispense could have an adverse effect on our specialty pharmacy business, operating results and cash flows.
We face risks relating to the availability, pricing and safety profiles of prescription drugs that we purchase and sell.
The profitability of our Retail/LTC and Pharmacy Services segments is dependent upon the utilization of prescription drug products. We dispense significant volumes of brand name and generic drugs from our retail, LTC, specialty and mail order pharmacies, and the retail pharmacies in our PBM’s network also dispense significant volumes of brand name and generic drugs. Our revenues, operating results and cash flows may decline if physicians cease writing prescriptions for drugs or the utilization of drugs is reduced due to:
• | increased safety risk profiles or regulatory restrictions; |
• | manufacturing or other supply issues; |
• | certain products being withdrawn by their manufacturers or transitioned to over-the-counter products; |
• | future FDA rulings restricting the supply or increasing the cost of products; |
• | the introduction of new and successful prescription drugs or lower-priced generic alternatives to existing brand name products; or |
• | inflation in the price of brand name drugs. |
In addition, increased utilization of generic drugs (which normally yield a higher gross profit rate than equivalent brand name drugs) has resulted in pressure to decrease reimbursement payments to retail, mail order, specialty and LTC pharmacies for generic drugs, causing a reduction in our margins on sales of generic drugs. Consolidation within the generic drug manufacturing industry and other external factors may enhance the ability of manufacturers to sustain or increase pricing of generic drugs and diminish our ability to negotiate reduced generic drug acquisition costs. Any inability to offset increased brand name or generic prescription drug acquisition costs or to modify our activities to lessen the financial impact of such increased costs could have a significant adverse effect on our operating results.
A number of factors, many of which are beyond our control, contribute to rising health care and other benefit costs. We may not be able to accurately forecast health care and other benefit costs, which could adversely affect our Health Care Benefits segment’s operating results.
Premiums for our Insured Health Care Benefits products, which comprised 91% of our Health Care Benefits revenues for 2019, are priced in advance based on our forecasts of health care and other benefit costs during a fixed premium period, which is generally one year. These forecasts are typically developed several months before the fixed premium period begins, are influenced by historical data (and recent historical data in particular), are dependent on our ability to anticipate and detect medical cost trends and changes in our members’ behavior and health care utilization patterns and require a significant degree of judgment. For example, our revenue on Medicare policies is based on bids submitted in June of the year before the contract year. Cost increases in excess of our projections cannot be recovered in the fixed premium period through higher premiums. As a result, our profits are particularly sensitive to the accuracy of our forecasts and our ability to anticipate and detect medical cost trends. Even relatively small differences between predicted and actual health care and other benefit costs as a percentage of premium revenues can result in significant adverse changes in our operating results.
A number of factors contribute to rising health care and other benefit costs, including previously uninsured members entering the health care system, changes in members’ behavior and health care utilization patterns, turnover in our membership, additional government mandated benefits or other regulatory changes, changes in the health status of our members, the aging of the population and other changing demographic characteristics, advances in medical technology, increases in the number and
32
cost of prescription drugs (including specialty pharmacy drugs and ultra-high cost drugs and therapies), direct-to-consumer marketing by drug manufacturers, the increasing influence of social media on our members’ health care utilization and other behaviors, changes in health care practices and general economic conditions (such as inflation and employment levels). In addition, government-imposed limitations on Medicare and Medicaid reimbursements to health plans and providers have caused the private sector to bear a greater share of increasing health care and other benefits costs over time, and future amendments or repeal or replacement of the ACA that increase the uninsured population may exacerbate this problem. Other factors that affect our health care and other benefit costs include changes as a result of the ACA, changes to the ACA and other changes in the regulatory environment, the evolution toward a consumer driven business model, new technologies, influenza related health care costs (which may be substantial and higher than we project), clusters of high-cost cases, epidemics or pandemics, health care provider and member fraud, and numerous other factors that are or may be beyond our control. For example, the 2019-2020 influenza season had an earlier than average start and has a higher incidence of influenza than the 2018-2019 influenza season; and influenza related health care costs were higher than Aetna projected in 2017-2018.
Our Health Care Benefits segment’s operating results and competitiveness depend in large part on our ability to appropriately manage future health care and other benefit costs through underwriting criteria, product design, provider network configuration, negotiation of favorable provider contracts and medical management programs. Our medical cost management programs may not be successful and may have a smaller impact on health care and benefit costs than we expect. The factors described above may adversely affect our ability to predict and manage health care and other benefit costs, which can adversely affect our competitiveness and operating results.
The reserves we hold for expected claims in our Insured Health Care Benefits products are based on estimates that involve an extensive degree of judgment and are inherently variable. Any reserve, including a premium deficiency reserve, may be insufficient. If actual claims exceed our estimates, our operating results could be materially adversely affected, and our ability to take timely corrective actions to limit future costs may be limited.
A large portion of health care claims are not submitted to us until after the end of the quarter in which services are rendered by providers to our members. Our reported health care costs payable for any particular period reflect our estimates of the ultimate cost of such claims as well as claims that have been reported to us but not yet paid. We also must estimate the amount of rebates payable under the ACA’s, the U.S. Centers for Medicare & Medicaid Services’ (“CMS’s”) and the federal Office of Personnel Management’s (“OPM’s”) minimum medical loss ratio (“MLR”) rules and the amounts payable by us to, and receivable by us from, the United States federal government under the ACA’s remaining premium stabilization program.
Our estimates of health care costs payable are based on a number of factors, including those derived from historical claim experience, but this estimation process also makes use of extensive judgment. Considerable variability is inherent in such estimates, and the accuracy of the estimates is highly sensitive to changes in medical claims submission and processing patterns and/or procedures, turnover and other changes in membership, changes in product mix, changes in the utilization of medical and/or other covered services, including prescription drugs, changes in medical cost trends, changes in our medical management practices and the introduction of new benefits and products. We estimate health care costs payable periodically, and any resulting adjustments, including premium deficiency reserves, are reflected in current-period operating results within benefit costs. For example, as of December 31, 2019 and 2018, we established a premium deficiency reserve of $4 million and $16 million, respectively, related to Medicaid products in the Health Care Benefits segment. A worsening (or improvement) of health care cost trend rates or changes in claim payment patterns from those that we assumed in estimating health care costs payable as of December 31, 2019 would cause these estimates to change in the near term, and such a change could be material.
Furthermore, if we are not able to accurately and promptly anticipate and detect medical cost trends or accurately estimate the cost of incurred but not yet reported claims or reported claims that have not been paid, our ability to take timely corrective actions to limit future health care costs and reflect our current benefit cost experience in our pricing process may be limited, which would further exacerbate the extent of any adverse impact on our operating results. These risks are particularly acute during and following periods when utilization of medical and/or other covered services and/or medical cost trends are below recent historical levels and in products where there is significant turnover in our membership each year, and such risks are further magnified by the ACA and other legislation and regulations that limit our ability to price for our projected and/or experienced increases in utilization and/or medical cost trends.
Our operating results are affected by the health of the economy in general and in the geographies we serve.
Our businesses are affected by the U.S. economy and consumer confidence in general and in the geographies we serve, including various economic factors, including inflation and changes in consumer purchasing power, preferences and/or spending patterns. An unfavorable, uncertain or volatile economic environment could cause a decline in drug utilization, an
33
increase in health care utilization and dampen demand for PBM services as well as consumer demand for products sold in our retail stores.
If our customers’ operating and financial performance deteriorates, or they are unable to make scheduled payments or obtain adequate financing, our customers may not be able to pay timely, or may delay payment of, amounts owed to us. Any inability of our customers to pay us for our products and services may adversely affect our businesses, operating results and cash flows. In addition, both state and federal government sponsored payers, as a result of budget deficits or spending reductions, may suspend payments or seek to reduce their health care expenditures resulting in our customers delaying payments to us or renegotiating their contracts with us.
Further, economic conditions including interest rate fluctuations, changes in capital market conditions and regulatory changes may affect our ability to obtain necessary financing on acceptable terms, our ability to secure suitable store locations under acceptable terms, our ability to execute sale-leaseback transactions under acceptable terms and the value of our investment portfolio. Adverse changes in the U.S. economy, consumer confidence and economic conditions could have an adverse effect on our businesses and financial results. This adverse effect could be further exacerbated by the increasing prevalence of high deductible health plans and health plan designs favoring co-insurance over co-payments as members and other consumers may decide to postpone, or not to seek, medical treatment which may lead them to incur more expensive medical treatment in the future and/or decrease our prescription volumes.
In addition, our Health Care Benefits membership remains concentrated in certain U.S. geographies and in certain industries. Unfavorable changes in health care or other benefit costs or reimbursement rates or increased competition in those geographic areas where our membership is concentrated could therefore have a disproportionately adverse effect on our Health Care Benefits segment’s operating results. Our Health Care Benefits membership has been and may continue to be affected by workforce reductions by our customers due to adverse and/or uncertain general economic conditions, especially in the U.S. geographies and industries where our membership is concentrated. As a result, we may not be able to profitably grow and diversify our Health Care Benefits membership geographically, by product type or by customer industry, and our revenues and operating results may be disproportionately affected by adverse changes affecting our customers.
We are exposed to risks relating to the solvency of other insurers.
We are subject to assessments under guaranty fund laws existing in all states for obligations of insolvent insurance companies (including long-term care insurers), HMOs, ACA co-ops and other payors to policyholders and claimants. For example, in the first quarter of 2017, Aetna recorded a discounted estimated liability expense of $231 million pretax for our estimated share of future assessments for long-term care insurer Penn Treaty Network America Insurance Company and one of its subsidiaries. Guaranty funds are maintained by state insurance commissioners to protect policyholders and claimants in the event that an insurer, HMO, ACA co-op and/or other payor becomes insolvent or is unable to meet its financial obligations. These funds are usually financed by assessments against insurers regulated by a state. Future assessments may have an adverse effect on our operating results and cash flows.
Extreme events, or the threat of extreme events, could materially increase our health care (including behavioral health) costs.
Nuclear, biological or other attacks, whether as a result of war or terrorism, other man-made disasters, natural disasters, epidemics, pandemics and other extreme events can affect the U.S. economy in general, our industries and us specifically. In particular, such extreme events or the threat of such extreme events could result in significant health care (including behavioral health) costs, which also would be affected by the government’s actions and the responsiveness of public health agencies and other insurers. Such extreme events or the threat of such extreme events also could disrupt our supply chains and/or our distribution chains for the products we sell. In addition, our employees and those of our vendors are concentrated in certain large, metropolitan areas which may be particularly exposed to these events. Such events could adversely affect our businesses, operating results and cash flows, and, in the event of extreme circumstances, our financial condition or viability, particularly if our responses to such events are less adequate than those of our competitors.
34
Risks From Changes in Public Policy and Other Legal and Regulatory Risks
We are subject to potential changes in public policy, laws and regulations, including reform of the U.S. health care system, which can adversely affect our businesses. Entitlement program reform, if it occurs, could have a material adverse effect on our businesses, operations and/or operating results.
The political environment in which we operate remains uncertain. It is reasonably possible that our business operations and operating results could be materially adversely affected by legislative, regulatory and public policy changes at the federal or state level, increased government involvement in drug reimbursement, pricing, purchasing and/or importation and/or increased regulation of PBMs, including: changes to the Medicare or Medicaid programs (including the block grant option outlined by CMS on January 30, 2020) or the regulatory environment for health care and related benefits, including the ACA; changes to laws or regulations governing drug reimbursement and/or pricing; changes to the laws and regulations governing PBMs’, PDPs’ and/or Managed Medicaid organizations’ interactions with government funded health care programs; changes to laws and/or regulations governing drug manufacturers’ rebates; changes to laws and/or regulations governing reimbursements paid to pharmacists by and/or reporting required by PBMs; changes to immigration policies and/or other public policy initiatives. It is not possible to predict whether or when any such changes will occur or what form any such changes may take (including through the use of U.S. Presidential Executive Orders). Other significant changes to health care and related benefits system legislation or regulation as well as changes with respect to tax and trade policies, tariffs and other government regulations affecting trade between the United States and other countries also are possible and could adversely affect our businesses. If we fail to respond adequately to such changes, including by implementing strategic and operational initiatives, or do not respond as effectively as our competitors, our businesses, operations and operating results may be materially adversely affected.
In addition to efforts to amend, repeal or replace the ACA and related regulations, we expect the federal and state governments to continue to enact and seriously consider many broad-based legislative and regulatory proposals that will or could materially impact various aspects of the health care and related benefits system and our businesses. Potential modification to the ACA, including changes in enforcement and/or funding that further destabilize the Public Exchanges, as well as significant changes to Medicaid funding (including the block grant option outlined by CMS on January 30, 2020) could impact the number of Americans with health insurance and, consequently, prescription drug coverage. Further changes to federal health care and related benefits laws, including the ACA, drug reimbursement and pricing laws, laws governing PBMs and/or laws governing PBMs’, PDPs’ and/or Managed Medicaid organizations’ interactions with government funded health care programs, are probable. We cannot predict the effect, if any, that new health care and related benefits legislation, future changes to the ACA or the implementation of or failure to implement the outstanding provisions of ACA, may have on our Pharmacy Services, retail pharmacy, LTC pharmacy and/or Health Care Benefits operations and/or operating results. The federal and many state governments also are considering changes in the interpretation, enforcement and/or application of existing programs, laws and regulations, including changes to payments under and funding of Medicare and Medicaid programs and increased regulation of PBMs.
Further, changes in existing federal or state laws or regulations or the adoption of new laws or regulations relating to additional regulation of PBMs (including formulary management or other PBM services), drug pricing or purchasing, patent term extensions and/or purchase discount and/or rebate arrangements with drug manufacturers also could reduce the discounts or rebates we receive. Changes in existing federal or state laws or regulations or the adoption of new laws or regulations relating to claims processing and billing, including our ability to use MAC lists and collect transmission fees, also could adversely affect our profitability.
We cannot predict the enactment or content of new legislation or regulations or changes to existing laws or regulations or their enforcement, interpretation or application, or the effect they will have on our business operations or operating results, which could be materially adverse. Even if we could predict such matters, it is not possible to eliminate the adverse impact of public policy changes that would fundamentally change the dynamics of one or more of the industries in which we compete. Examples of such changes include: the federal or one or more state governments fundamentally restructuring or reducing the funding available for Medicare, Medicaid, dual eligible or dual eligible special needs plan programs, increasing its involvement in drug reimbursement, pricing, purchasing and/or importation, changing the laws and regulations governing PBMs’, PDPs’ and/or Managed Medicaid organizations’ interactions with government funded health care programs, changing the tax treatment of health or related benefits, or repealing or otherwise significantly altering the ACA. The likelihood of adverse changes remains high due to state and federal budgetary pressures, and our businesses and operating results could be materially and adversely affected by such changes, even if we correctly predict their occurrence.
For more information on these matters, see “Government Regulation” included in Item 1 of this Form 10-K.
35
If we fail to comply with applicable laws and regulations, many of which are highly complex, we could be subject to significant adverse regulatory actions or suffer brand and reputational harm.
Our businesses are subject to extensive regulation and oversight by state, federal and international governmental authorities. The laws and regulations governing our operations and interpretations of those laws and regulations are increasing in number and complexity, change frequently and can be inconsistent or conflict with one another. In general, these laws and regulations are designed to benefit and protect customers, members and providers rather than us or our investors. In addition, the governmental authorities that regulate our businesses have broad latitude to make, interpret and enforce the laws and regulations that govern us and continue to interpret and enforce those laws and regulations more strictly and more aggressively each year. We also must follow various restrictions on certain of our businesses and the payment of dividends by certain of our subsidiaries put in place by certain state regulators.
Certain of our Pharmacy Services and Retail/LTC operations, products and services are subject to:
• | the clinical quality, patient safety and other risks inherent in the dispensing, packaging and distribution of drugs and other health care products and services, including claims related to purported dispensing and other operational errors (any failure by our Pharmacy Services and/or Retail/LTC operations to adhere to the laws and regulations applicable to the dispensing of drugs could subject us to civil and criminal penalties); |
• | federal and state anti-kickback and other laws that govern our relationship with drug manufacturers, customers and consumers; |
• | compliance requirements under the Employee Retirement Income Security Act of 1974 (“ERISA”), including fiduciary obligations in connection with the development and implementation of items such as drug formularies and preferred drug listings; and |
• | federal and state legislative proposals and/or regulatory activity that could adversely affect pharmacy benefit industry practices. |
Our Health Care Benefits products are highly regulated, particularly those that serve Medicare, Medicaid, dual eligible, dual eligible special needs and small group Commercial customers and members. The laws and regulations governing participation in Medicare Advantage, Medicare Part D, Medicaid, dual eligible and dual eligible special needs plan programs are complex, are subject to interpretation and can expose us to penalties for non-compliance.
The scope of the practices and activities that are prohibited by federal and state false claims acts is the subject of pending litigation. Claims under federal and state false claims acts can be brought by the government or by private individuals on behalf of the government through a qui tam or “whistleblower” suit, and we are a defendant in a number of such proceedings. If we are convicted of fraud or other criminal conduct in the performance of a government program or if there is an adverse decision against us under the federal False Claims Act (the “False Claims Act”), we may be temporarily or permanently suspended from participating in government health care programs, including Medicare Advantage, Medicare Part D, Medicaid, dual eligible and dual eligible special needs plan programs, and we also may be required to pay significant fines and/or other monetary penalties. Whistleblower suits have resulted in significant settlements between governmental agencies and health care companies. The significant incentives and protections provided to whistleblowers under applicable law increase the risk of whistleblower suits.
If we fail to comply with laws and regulations that apply to government programs, we could be subject to criminal fines, civil penalties, premium refunds, prohibitions on marketing or active or passive enrollment of members, corrective actions, termination of our contracts or other sanctions which could have a material adverse effect on our ability to participate in Medicare Advantage, Medicare Part D, Medicaid, dual eligible, dual eligible special needs plan and other programs and on our operating results, cash flows and financial condition.
Our businesses, profitability and growth also may be adversely affected by (i) judicial and regulatory decisions that change and/or expand the interpretations of existing statutes and regulations, impose medical or bad faith liability, increase our responsibilities under ERISA or the remedies available under ERISA, or reduce the scope of ERISA pre-emption of state law claims (including Rutledge v. Pharm. Care Mgmt. Assoc., which is currently pending before the U.S. Supreme Court) or (ii) other legislation and regulations.
36
If our compliance or other systems and processes fail or are deemed inadequate, we may suffer brand and reputational harm and become subject to regulatory actions and/or litigation.
In addition to being subject to extensive and complex regulations, many of our contracts with customers include detailed requirements. In order to be eligible to offer certain products or bid on certain contracts, we must demonstrate that we have robust systems and processes in place that are designed to maintain compliance with all applicable legal, regulatory and contractual requirements. These systems and processes frequently are reviewed and audited by our customers and regulators. If our systems and processes designed to maintain compliance with applicable legal and contractual requirements, and to prevent and detect instances of, or the potential for, non-compliance fail or are deemed inadequate, we may suffer brand and reputational harm and be subject to regulatory actions, litigation and other proceedings which may result in damages, fines, suspension or loss of licensure, suspension or exclusion from participation in government programs and/or other penalties, any of which could adversely affect our businesses, operating results, cash flows and/or financial condition.
We routinely are subject to litigation and other adverse legal proceedings, including class actions and qui tam actions. Many of these proceedings seek substantial damages which may not be covered by insurance. These proceedings are costly to defend, may result in changes in our business practices, harm our brand and reputation and adversely affect our businesses and operating results.
PBM, retail pharmacy, mail order pharmacy, specialty pharmacy, LTC pharmacy and health care and related benefits are highly regulated industries whose participants frequently are subject to litigation and other adverse legal proceedings. We are currently subject to various litigation and arbitration matters, investigations, regulatory audits, inspections, government inquiries, and regulatory and other legal proceedings, both inside and outside the U.S. Outside the U.S., contractual rights, tax positions and applicable regulations may be subject to interpretation or uncertainty to a greater degree than in the U.S. Litigation related to our provision of professional services in our medical clinics, pharmacies and LTC operations is increasing as we expand our services along the continuum of health care.
Litigation, and particularly securities, derivative, collective or class action and qui tam litigation, is often expensive and disruptive. Many of the legal proceedings against us seek substantial damages (including non-economic or punitive damages and treble damages), and certain of these proceedings also seek changes in our business practices. While we currently have insurance coverage for some potential liabilities, other potential liabilities may not be covered by insurance, insurers may dispute coverage and/or the amount of our insurance may not be enough to cover the damages awarded or costs incurred. In addition, some types of damages, like punitive damages, may not be covered by insurance, and in some jurisdictions the coverage of punitive damages is prohibited. Insurance coverage for all or some forms of liability also may become unavailable or prohibitively expensive in the future.
The outcome of litigation and other adverse legal proceedings is always uncertain, and outcomes that are not justifiable by the evidence or existing law or regulation can and do occur, and the costs incurred frequently are substantial regardless of the outcome. Litigation and other adverse legal proceedings could materially adversely affect our businesses, operating results and/or cash flows because of brand and reputational harm to us caused by such proceedings, the cost of defending such proceedings, the cost of settlement or judgments against us, or the changes in our operations that could result from such proceedings. See Item 3 of this Form 10-K for additional information.
We frequently are subject to regular and special governmental audits, investigations and reviews that could result in changes to our business practices and also could result in material refunds, fines, penalties, civil liabilities, criminal liabilities and other sanctions.
As one of the largest national retail, mail order, specialty and LTC pharmacy, PBM and health care and related benefits providers, we frequently are subject to regular and special governmental market conduct and other audits, investigations and reviews by, and we receive subpoenas and other requests for information from, various federal and state agencies, regulatory authorities, attorneys general, committees, subcommittees and members of the U.S. Congress and other state, federal and international governmental authorities. For example, we have received civil investigative demands (“CIDs”) from, and provided documents and information to, the Civil Division of the DOJ in connection with a current investigation of our patient chart review processes in connection with risk adjustment data submissions under Parts C and D of the Medicare program. CMS and the Office of the Inspector General of the U.S. Department of Health and Human Services (the “OIG”) also are auditing the risk adjustment-related data of certain of our Medicare Advantage plans, and the number of such audits continues to increase. Several such audits, investigations and reviews by governmental authorities currently are pending, some of which may be resolved in 2020, the results of which may be adverse to us.
37
Federal and state governments have made investigating and prosecuting health care and other insurance fraud, waste and abuse a priority. Fraud, waste and abuse prohibitions encompass a wide range of activities, including kickbacks for referral of members, billing for unnecessary medical and/or other covered services, improper marketing and violations of patient privacy rights. The regulations and contractual requirements applicable to us and other industry participants are complex and subject to change, making it necessary for us to invest significant resources in complying with our regulatory and contractual requirements. Ongoing vigorous law enforcement and the highly technical regulatory scheme mean that our compliance efforts in this area will continue to require significant resources. In addition, our medical costs and the medical expenses of our Health Care Benefits ASC customers may be adversely affected if we do not prevent or detect fraudulent activity by providers and/or members.
Regular and special governmental audits, investigations and reviews by federal, state and international regulators could result in changes to our business practices, and also could result in significant or material premium refunds, fines, penalties, civil liabilities, criminal liabilities or other sanctions, including suspension or exclusion from participation in government programs and suspension or loss of licensure. Any of these audits, investigations or reviews could have a material adverse effect on our businesses, operating results, cash flows and/or financial condition or result in significant liabilities and negative publicity for us.
See “Legal and Regulatory Proceedings” in Note 16 “Commitments and Contingencies” included in Item 8 of this 10-K for additional information.
Our litigation and regulatory risk profile are changing as we offer new products and services and expand in business areas beyond our historical core businesses of Pharmacy Services, Retail/LTC and Health Care Benefits.
Historically, we focused primarily on providing Pharmacy Services, Retail/LTC and Health Care Benefits products and services. As a result of our transformation program and other innovation initiatives, we are expanding our presence in the health care space and plan to offer new products and services (such as the home hemodialysis device we are developing) which present a different litigation and regulatory risk profile than the products and services that we historically have offered.
The increased volume of business in areas beyond our historical core businesses and new products and services subject us to litigation and regulatory risks that are different from the risks of providing Pharmacy Services, Retail/LTC and Health Care Benefits products and services and increase significantly our exposure to other risks.
We face unique regulatory and other challenges in our Medicare and Medicaid businesses.
We are seeking to substantially grow the Medicare and Medicaid membership in our Health Care Benefits segment in 2020 and over the next several years. We face unique regulatory and other challenges that may inhibit the growth and profitability of those businesses.
• | In April 2019, CMS issued a final notice detailing final Medicare Advantage benchmark payment rates for 2020 (the “Final Notice”). Overall, we project the benchmark rates in the Final Notice will increase funding for our Medicare Advantage business, excluding the impact of the HIF, by approximately 2.0 percent in 2020 compared to 2019. This 2020 rate increase only partially offsets the challenge we face from the impact of the increasing cost of medical care (including prescription medications) and CMS local and national coverage decisions that require us to pay for services and supplies that are not factored into our bids and creates continued pressure on our Medicare Advantage operating results. We cannot predict future Medicare funding levels, the impact of future federal budget actions or ensure that such changes or actions will not have an adverse effect on our Medicare operating results. |
• | The organic expansion of our Medicare Advantage and Medicare Part D service area is subject to the ability of CMS to process our requests for service area expansions and our ability to build cost competitive provider networks in the expanded service areas that meet applicable network adequacy requirements. CMS’ decisions on our requests for service area expansions also may be affected adversely by compliance issues that arise each year in our Medicare operations. |
• | CMS regularly audits our performance to determine our compliance with CMS’s regulations and our contracts with CMS and to assess the quality of the services we provide to our Medicare members. As a result of these audits, we may be subject to significant or material retroactive adjustments to and/or withholding of certain premiums and fees, fines, criminal liability, civil monetary penalties, CMS imposed sanctions (including suspension or exclusion from participation in government programs) or other restrictions on our Medicare, Medicaid and other businesses, including suspension or loss of licensure. |
38
• | “Star ratings” from CMS for our Medicare Advantage plans will continue to have a significant effect on our plans’ operating results. Since 2015, only Medicare Advantage plans with a star rating of four or higher (out of five) are eligible for a quality bonus in their basic premium rates. CMS continues to change its rating system to make achieving and maintaining a four or higher star rating more difficult. Our star ratings and past performance scores are adversely affected by the compliance issues that arise each year in our Medicare operations. If our star ratings fall below 4 for a significant portion of our Medicare Advantage membership or do not match the performance of our competitors or the star rating quality bonuses are reduced or eliminated, our revenues, operating results and cash flows may be significantly adversely affected. |
• | Payments we receive from CMS for our Medicare Advantage and Part D businesses also are subject to risk adjustment based on the health status of the individuals we enroll. Elements of that risk adjustment mechanism continue to be challenged by the DOJ, the OIG and CMS itself. Substantial changes in the risk adjustment mechanism, including changes that result from enforcement or audit actions, could materially affect the amount of our Medicare reimbursement, require us to raise prices or reduce the benefits we offer to Medicare beneficiaries, and potentially limit our (and the industry’s) participation in the Medicare program. |
• | Medicare Part D has resulted in increased utilization of prescription medications and puts pressure on our pharmacy gross margin rates due to regulatory and competitive pressures. Further, as a result of the ACA and changes to the retiree drug subsidy rules, clients of our PBM business could decide to discontinue providing prescription drug benefits to their Medicare-eligible members. To the extent this phenomenon occurs, the adverse effects of increasing customer migration into Medicare Part D may outweigh the benefits we realize from growth of our Medicare Part D products. |
• | Our Medicare Part D operating results and our ability to expand our Medicare Part D business could be adversely affected if: the cost and complexity of Medicare Part D exceed management’s expectations or prevent effective program implementation or administration; changes to the regulations regarding how drug costs are reported for Medicare Part D are implemented in a manner that adversely affects the profitability of our Medicare Part D business; changes to the applicable regulations impact our ability to retain fees from third parties including network pharmacies; the government alters Medicare Part D program requirements or reduces funding because of the higher-than-anticipated cost to taxpayers of Medicare Part D or for other reasons; the government mandates the use of point-of-sale manufacturer’s rebates or up front drug pricing discounts, makes drug manufacturer’s rebates illegal, or makes changes to how pharmacy pay-for-performance is calculated; or reinsurance thresholds are reduced below their current levels. |
• | We have experienced challenges in obtaining complete and accurate encounter data for our Medicaid products due to difficulties with providers and third-party vendors submitting claims in a timely fashion in the proper format, and with state agencies in coordinating such submissions. As states increase their reliance on encounter data, these difficulties could affect the Medicaid premium rates we receive and how Medicaid membership is assigned to us, which could have a material adverse effect on our Medicaid operating results and cash flows and/or our ability to bid for, and continue to participate in, certain Medicaid programs. |
• | Federal funding for expanded Medicaid coverage began to decrease in 2017. This reduction is causing states to re-evaluate funding for their Medicaid expansions. That re-evaluation may adversely affect Medicaid payment rates, our Medicaid membership in those states, our revenues, our MLRs and our operating results. |
• | If we fail to report and correct errors discovered through our own auditing procedures or during a CMS audit or otherwise fail to comply with the applicable laws and regulations, we could be subject to fines, civil monetary penalties or other sanctions, including fines and penalties under the False Claims Act, which could have a material adverse effect on our ability to participate in Medicare Advantage, Part D or other government programs, and on our operating results, cash flows and financial condition. |
• | In the second quarter of 2014, CMS issued a final rule implementing ACA requirements that Medicare Advantage and PDP plans report and refund to CMS overpayments that those plans receive from CMS. However, CMS’s statements in formalized guidance regarding “overpayments” to Medicare Advantage plans appear to be inconsistent with CMS’s prior risk adjustment data validation (“RADV”) audit guidance. These statements appear to equate each Medicare Advantage risk adjustment data error with an “overpayment” without reconciliation to the principles underlying the fee for service adjustment comparison contemplated by CMS’s RADV audit methodology. The precise interpretation, impact and legality of the final rule are not clear and are subject to pending litigation. If Medicare Advantage plans were not paid based on payment model principles that align with the requirements of the Social Security Act or such payments were not implemented correctly, it could have a material adverse effect on our operating results, cash flows and/or financial condition. |
• | Certain of our Medicaid contracts require the submission of complete and correct encounter data. The accurate and timely reporting of encounter data is increasingly important to the success of our Medicaid programs because more states are using encounter data to determine compliance with performance standards and, in part, to set premium rates. We have expended and may continue to expend additional effort and incur significant additional costs to collect accurate, or to |
39
correct inaccurate or incomplete, encounter data and have been and could be exposed to premium withholding, operating sanctions and financial fines and penalties for noncompliance. We have experienced challenges in obtaining complete and accurate encounter data due to difficulties with providers and third-party vendors submitting claims in a timely fashion in the proper format, and with state agencies in coordinating such submissions. As states increase their reliance on encounter data, these difficulties could affect the Medicaid premium rates we receive and how Medicaid membership is assigned to us, which could have a material adverse effect on our Medicaid operating results and cash flows and/or our ability to bid for, and continue to participate in, certain Medicaid programs.
• | Our businesses that dispense drugs also face challenges in the Medicaid space. The ACA made several significant changes to Medicaid rebates and to reimbursement rates. One of these changes was to revise the definition of the Average Manufacturer Price, a pricing element common to most payment formulas, and the reimbursement formula for generic drugs. This change has adversely affected the reimbursements we receive when we dispense prescription drugs to Medicaid recipients. |
Programs funded in whole or in part by the U.S. federal government account for a significant portion of our revenues, and we expect that percentage to increase.
Programs funded in whole or in part by the U.S. federal government account for a significant portion of our revenues, and we expect that percentage to increase. As our government funded businesses grow, our exposure to changes in federal and state government policy with respect to and/or regulation of the various government funded programs in which we participate also increases.
Our revenues from government funded programs, including in Health Care Benefits’ Medicare, Medicaid, dual eligible and dual eligible special needs plan businesses and from government customers in its Commercial business, are dependent on annual funding by the federal government and/or applicable state or local governments. Federal, state and local governments have the right to cancel or not to renew their contracts with us on short notice without cause or if funds are not available. Funding for these programs is dependent on many factors outside our control, including general economic conditions, continuing government efforts to contain health care costs and budgetary constraints at the federal or applicable state or local level and general political issues and priorities.
The U.S. federal government and our other government customers also may reduce funding for health care or other programs, cancel or decline to renew contracts with us, or make changes that adversely affect the number of persons eligible for certain programs, the services provided to enrollees in such programs, our premiums and our administrative and health care and other benefit costs, any of which could have a material adverse effect on our businesses, operating results and cash flows. When federal funding is delayed, suspended or curtailed, we continue to receive, and we remain liable for and are required to fund, claims from providers for providing services to beneficiaries of federally funded health benefits programs in which we participate. An extended federal government shutdown or a delay by Congress in raising the federal government’s debt ceiling also could lead to a delay, reduction, suspension or cancellation of federal government spending and a significant increase in interest rates that could, in turn, have a material adverse effect on the value of our investment portfolio, our ability to access the capital markets and our businesses, operating results, cash flows and liquidity.
Possible changes in industry pricing benchmarks and drug pricing generally can adversely affect our PBM and Retail/LTC businesses.
It is possible that the pharmaceutical industry or regulators may evaluate and/or develop an alternative pricing reference to replace Average Wholesale Price (“AWP”) or Wholesale Acquisition Cost (“WAC”), which are the pricing references used for many of our PBM and LTC client contracts, drug purchase agreements, retail network contracts, specialty payor agreements and other contracts with third party payors in connection with the reimbursement of drug payments. In addition, many state Medicaid fee-for-service programs (“FFS Medicaid”) have established pharmacy network payments on the basis of Actual Acquisition Cost (“AAC”). The use of an AAC basis in FFS Medicaid could have an impact on reimbursement practices in Health Care Benefits’ Commercial and other Government products.
Future changes to the use of AWP, WAC or to other published pricing benchmarks used to establish drug pricing, including changes in the basis for calculating reimbursement by federal and state health care programs and/or other payors, could impact the reimbursement we receive from Medicare and Medicaid programs, the reimbursement we receive from our PBM clients and other payors and/or our ability to negotiate rebates and/or discounts with drug manufacturers, wholesalers, PBMs and retail pharmacies. A failure or inability to fully offset any increased prices or costs or to modify our operations to mitigate the impact of such increases could have a material adverse effect on our operating results. Additionally, any future changes in drug prices could be significantly different than our projections. We cannot predict the effect of these possible changes on our businesses.
40
We may not be able to obtain adequate premium rate increases in our Insured Health Care Benefits products, which would have an adverse effect on our revenues, MBRs and operating results and could magnify the adverse impact of increases in health care and other benefit costs and of ACA assessments, fees and taxes.
Premium rates for our Insured Health Care Benefits products generally must be filed with state insurance regulators and are subject to their approval, which creates risk for us in the current political and regulatory environment. The ACA generally requires a review by HHS in conjunction with state regulators of premium rate increases that exceed a federally specified threshold (or lower state-specific thresholds set by states determined by HHS to have adequate processes). Rate reviews can magnify the adverse impact on our operating margins, medical benefit ratios (“MBRs”) and operating results of increases in health care and other benefit costs, increased utilization of covered services, and ACA assessments, fees and taxes, by restricting our ability to reflect these increases and/or these assessments, fees and taxes in our pricing. Further, our ability to reflect ACA assessments, fees and taxes in our Medicare, Medicaid and CHIP premium rates is limited.
Since 2013, HHS has issued determinations to health plans that their premium rate increases were “unreasonable,” and we continue to experience challenges to appropriate premium rate increases in certain states. Regulators or legislatures in several states have implemented or are considering limits on premium rate increases, either by enforcing existing legal requirements more stringently or proposing different regulatory standards. Regulators or legislatures in several states also have conducted hearings on proposed premium rate increases, which can result, and in some instances have resulted, in substantial delays in implementing proposed rate increases even if they ultimately are approved. Our plans can be excluded from participating in small group Public Exchanges if they are deemed to have a history of “unreasonable” rate increases. Any significant rate increases we may request heighten the risks of adverse publicity, adverse regulatory action and adverse selection and the likelihood that our requested premium rate increases will be denied, reduced or delayed, which could adversely affect our MBRs and lead to operating margin compression.
We anticipate continued regulatory and legislative action to increase regulation of premium rates in our Insured Health Care Benefits products. We may not be able to obtain rates that are actuarially justified or that are sufficient to make our policies profitable in one or more product lines or geographies. If we are unable to obtain adequate premium rates and/or premium rate increases, it could materially and adversely affect our operating margins and MBRs and our ability to earn adequate returns on Insured Health Care Benefits products in one or more states or cause us to withdraw from certain geographies and/or products.
Minimum MLR rebate requirements limit the level of margin we can earn in our Insured Health Care Benefits products while leaving us exposed to higher than expected medical costs. Challenges to our minimum MLR rebate methodology and/or reports could adversely affect our operating results.
The ACA’s minimum MLR rebate requirements limit the level of margin we can earn in Health Care Benefits’ Commercial Insured and Medicare Insured businesses. CMS minimum MLR rebate regulations limit the level of margin we can earn in our Medicaid Insured business. Certain portions of our Health Care Benefits Medicaid and Federal Employees Health Benefits (“FEHB”) program business also are subject to minimum MLR rebate requirements in addition to but separate from those imposed by the ACA. Minimum MLR rebate requirements leave us exposed to medical costs that are higher than those reflected in our pricing. The process supporting the management and determination of the amount of MLR rebates payable is complex and requires judgment, and the minimum MLR reporting requirements are detailed. Federal and state auditors are challenging our Commercial Health Care Benefits business’ compliance with the ACA’s minimum MLR requirements as well as our FEHB plans’ compliance with OPM’s FEHB program-specific minimum MLR requirements. Our Medicare and Medicaid contracts also are subject to minimum MLR audits. If a Medicare Advantage or Medicare Part D contract pays minimum MLR rebates for three consecutive years, it will become ineligible to enroll new members. If a Medicare Advantage or Medicare Part D contract pays such rebates for five consecutive years, it will be terminated by CMS. Additional challenges to our methodology and/or reports relating to minimum MLR and related rebates by federal and state regulators and private litigants are reasonably possible. The outcome of these audits and additional challenges could adversely affect our operating results.
Our operating results may be adversely affected by changes in laws and policies governing employers and by union organizing activity.
The federal and certain state legislatures continue to consider and pass legislation that increases our costs of doing business, including increased minimum wages and requiring employers to provide paid sick leave or paid family leave. In addition, our employee-related operating costs may be increased by union organizing activity. If we are unable to reflect these increased expenses in our pricing or otherwise modify our operations to mitigate the effects of such increases, our operating results will be adversely affected.
41
We face international political, legal and compliance, operational, regulatory, economic and other risks that may be more significant than in our domestic operations.
We significantly expanded our international operations as a result of the Aetna Acquisition. As a result of our expanded international operations, we face political, legal, compliance, operational, regulatory, economic and other risks that we do not face or that are more significant than in our domestic operations. These risks vary widely by country and include varying regional and geopolitical business conditions and demands, government intervention and censorship, discriminatory regulation, nationalization or expropriation of assets and pricing constraints. Our international products need to meet country-specific customer and member preferences as well as country-specific legal requirements, including those related to licensing, data privacy, data storage and data protection.
Our international operations increase our exposure to, and require us to devote significant management resources to implement controls and systems to comply with, the privacy and data protection laws of non-U.S. jurisdictions, such as the European Union’s (“EU’s”) General Data Protection Regulation (“GDPR”), and the anti-bribery, anti-corruption and anti-money laundering laws of the United States (including the FCPA) and the United Kingdom (including the UK Bribery Act) and similar laws in other jurisdictions. Implementing our compliance policies, internal controls and other systems upon our expansion into new countries and geographies may require the investment of considerable management time and financial and other resources over several years before any significant revenues or profits are generated. Violations of these laws and regulations could result in fines, criminal sanctions against us, our officers or employees, restrictions or outright prohibitions on the conduct of our business, and significant brand and reputational harm. We must regularly reassess the size, capability and location of our global infrastructure and make appropriate changes, and must have effective change management processes and internal controls in place to address changes in our businesses and operations. Our success depends, in part, on our ability to anticipate these risks and manage these difficulties, and the failure to do so could have a material adverse effect on our brand, reputation, businesses, operating results and/or financial condition.
Our international operations require us to overcome logistical and other challenges based on differing languages, cultures, legal and regulatory schemes and time zones. Our international operations encounter labor laws, standards and customs that can be difficult and make employee relationships less flexible than in our domestic operations and expensive to modify or terminate. In some countries we are required to, or choose to, operate with local business associates, which requires us to manage our relationships with these third parties and may reduce our operational flexibility and ability to quickly respond to business challenges.
In some countries we may be exposed to currency exchange controls or other restrictions that prevent us from transferring funds internationally or converting local currencies into U.S. dollars or other currencies. Fluctuations in foreign currency exchange rates may adversely affect our revenues, operating results and cash flows from our international operations. Some of our operations are, and are increasingly likely to be, in emerging markets where these risks are heightened. Any measures we may implement to reduce the effect of volatile currencies and other risks on our international operations may not be effective.
Risks Associated with Mergers, Acquisitions, and Divestitures
Risks Relating to Our Acquisition of Aetna
We expect to continue to incur significant non-recurring costs associated with combining the operations of CVS Health and Aetna. We may not achieve the net benefit that we project of such expenditures associated with the elimination of duplicative costs, the realization of other efficiencies that we project related to the integration of our businesses or the realization of the growth opportunities that we project from the Aetna Acquisition in the near term, or at all. In addition, the post-closing integration of the operations of CVS Health and Aetna and related matters may require substantial commitments of management and other resources and management time which could otherwise have been devoted to our ongoing businesses and operations and/or to other opportunities that may have been beneficial to us.
Parties with which we do business may experience uncertainty associated with the Aetna Acquisition and/or the post-closing integration process, including with respect to current or future business relationships with the combined business. Our business relationships (including business relationships of our Health Care Benefits segment) may be subject to disruption as customers, members, manufacturers, providers, vendors and others may attempt to negotiate changes in existing business relationships or consider entering into business relationships with parties other than the combined business.
42
We may be unable to successfully integrate companies we acquire.
Upon the closing of any acquisition we complete, we will need to successfully integrate the products, services and related assets, as well as internal controls into our business operations. If an acquisition is consummated, the integration of the acquired business, its products, services and related assets into our company also may be complex and time-consuming and, if the integration is not fully successful, we may not achieve the anticipated benefits, operating and cost synergies and/or growth opportunities of an acquisition. Potential difficulties that may be encountered in the integration process include the following:
• | Integrating personnel, operations and systems (including internal control environments and compliance policies), while maintaining focus on producing and delivering consistent, high quality products and services; |
• | Coordinating geographically dispersed organizations; |
• | Disrupting management’s attention from our ongoing business operations; |
• | Retaining existing customers and attracting new customers; and |
• | Managing inefficiencies associated with integrating our operations. |
An inability to realize the full extent of the anticipated benefits, operating and cost synergies, innovations and operations efficiencies or growth opportunities of an acquisition, as well as any delays or additional expenses encountered in the integration process, could have a material adverse effect on our businesses and operating results. Furthermore, acquisitions, even if successfully integrated, may fail to further our business strategy as anticipated, expose us to increased competition or challenges with respect to our products, services or service areas, and expose us to additional liabilities associated with an acquired business including risks and liabilities associated with litigation involving the acquired business. Any one of these challenges or risks could impair our ability to realize any benefit from our acquisitions after we have expended resources on them.
We expect to continue to pursue acquisitions, joint ventures, strategic alliances and other inorganic growth opportunities, which may be unsuccessful, cause us to assume unanticipated liabilities, disrupt our existing businesses, be dilutive or lead us to assume significant debt, among other things.
We expect to continue to pursue acquisitions, joint ventures, strategic alliances and other inorganic growth opportunities as part of our growth strategy. In addition to the integration risks noted above, some other risks we face with respect to acquisitions and other inorganic growth strategies include:
• | we frequently compete with other firms, some of which may have greater financial and other resources and a greater tolerance for risk, to acquire attractive companies; |
• | the acquired, alliance and/or joint venture businesses may not perform as projected; |
• | the goodwill or other intangible assets established as a result of our acquisitions may be incorrectly valued or may become impaired; for example, in 2018 we took $6.1 billion of goodwill impairment charges related to our LTC reporting unit within the Retail/LTC segment; |
• | we may assume unanticipated liabilities, including those that were not disclosed to us or which we underestimated; |
• | the acquired businesses, or the pursuit of other inorganic growth strategies, could disrupt or compete with our existing businesses, distract management, result in the loss of key employees, divert resources, result in tax costs or inefficiencies and make it difficult to maintain our current business standards, controls, information technology systems, policies, procedures and performance; |
• | as we did in the Aetna Acquisition, we may finance future acquisitions and other inorganic growth strategies by issuing common stock for some or all of the purchase price, which would dilute the ownership interests of our stockholders; |
• | as we did in the Aetna Acquisition, we may incur significant debt in connection with acquisitions (whether to finance acquisitions or by assuming debt from the businesses we acquire); |
• | we may not have the expertise to manage and profitably grow the businesses we acquire, and we may need to rely on the retention of key personnel and other suppliers of businesses we acquire, which may be difficult or impossible to accomplish; |
• | we may enter into merger or purchase agreements but, due to reasons within or outside our control, fail to complete the related transactions, which could result in termination fees or other penalties that could be material, cause material disruptions to our businesses and operations and adversely affect our brand and reputation; |
• | in order to complete a proposed acquisition, we may be required to divest certain portions of our business, for which we may not be able to obtain favorable pricing; |
43
• | as is the case with the Aetna Acquisition and our acquisition of Omnicare, Inc., we may be involved in litigation related to mergers or acquisitions, including for matters that occurred prior to the applicable closing, which may be costly to defend and may result in adverse rulings against us that could be material; and |
• | the integration into our businesses of the businesses and entities we acquire may affect the way in which existing laws and regulations apply to us, including subjecting us to laws and regulations that did not previously apply to us. |
In addition, joint ventures present risks that are different from acquisitions, including selection of appropriate joint venture parties, initial and ongoing governance of the joint venture, joint venture compliance activities (including compliance with applicable CMS requirements), growing the joint venture’s business in a manner acceptable to all the parties, including other providers in the networks that include joint ventures, maintaining positive relationships among the joint venture parties and the joint venture’s customers, and member and business disruption that may occur upon joint venture termination.
Risks Related to Our Operations
Failure to meet customer expectations may harm our brand and reputation, our ability to retain and grow our customer base and membership and our operating results and cash flows.
Our ability to attract and retain customers and members is dependent upon providing cost effective, quality customer service operations (such as call center operations, PBM functions, retail pharmacy and LTC services, retail, mail order and specialty pharmacy prescription delivery, claims processing, customer case installation and online access and tools) that meet or exceed our customers’ and members’ expectations, either directly or through vendors. As we seek to reduce general and administrative expenses, we must balance the potential impact of cost-saving measures on our customer and other service and performance. If we misjudge the effects of such measures, customer and other service may be adversely affected. We depend on third parties for certain of our customer service, PBM and prescription delivery operations. If we or our vendors fail to provide service that meets our customers’ and members’ expectations, we may have difficulty retaining or profitably growing our customer base and/or membership, which could adversely affect our operating results. For example, noncompliance with any privacy or security laws or regulations or any security breach involving us or one of our third-party vendors could have a material adverse effect on our businesses, operating results, brand and reputation.
We and our vendors have experienced and continue to experience cyber attacks. We can provide no assurance that we or our vendors will be able to detect, prevent or contain the effects of such attacks or other information security (including cybersecurity) risks or threats in the future.
We and our vendors have experienced and continue to experience a variety of cyber attacks, and we and our vendors expect to continue to experience cyber attacks going forward. Among other things, we and our vendors have experienced automated attempts to gain access to public facing networks, brute force, SYN flood and distributed denial of service attacks, attempted malware infections, vulnerability scanning, ransomware attacks, spear-phishing campaigns, mass reconnaissance attempts, injection attempts, phishing, PHP injection and cross-site scripting. We also have seen an increase in attacks designed to obtain access to consumers’ accounts using illegally obtained demographic information. Although the impact of such attacks has not been material to our operations or operating results through December 31, 2019, we can provide no assurance that we or our vendors will be able to detect, prevent or contain the effects of such attacks or other information security (including cybersecurity) risks or threats in the future. As we expand our consumer-oriented products and services, increase the amount and types of data we acquire, generate and use, increase the amount of information we make available to members, consumers and providers on mobile devices, expand our use of vendors, expand internationally and expand our use of social media, our exposure to these data security and related cybersecurity risks, including the risk of undetected attacks, damage, loss or unauthorized disclosure or access to and/or disruption of our systems and the customer, member, provider, employee, accountable care organization (“ACO”), joint venture, vendor and other third party information they contain, increases, and the cost of attempting to protect against these risks also increases.
Although we deploy a layered approach to address information security (including cybersecurity) threats and vulnerabilities that is designed to protect confidential information against data security breaches, a compromise of our information security controls or of those businesses with whom we interact, which results in confidential information being accessed, obtained, damaged, or used by unauthorized or improper persons, could harm our reputation and expose us to regulatory actions and claims from customers and clients, financial institutions, payment card associations and other persons, any of which could adversely affect our businesses, operating results and financial condition. Because the techniques used to obtain unauthorized access, disable or degrade service, or sabotage systems change frequently and may not immediately produce signs of intrusion, we may be unable to anticipate these techniques or to implement adequate preventative measures. Moreover, a data security breach could require that we expend significant resources related to our information systems and infrastructure, and could
44
distract management and other key personnel from performing their primary operational duties. We also could be adversely affected by any significant disruption in the systems of third parties we interact with, including key payors and vendors.
The costs of attempting to protect against the foregoing risks and the costs of responding to a cyber-incident are significant. Large scale data breaches at other entities increase the challenge we and our vendors face in maintaining the security of our information technology systems and proprietary information and of our customers’, members’ and other constituents’ sensitive information. Following a cyber-incident, our and/or our vendors’ remediation efforts may not be successful, and a cyber-incident could result in interruptions, delays or cessation of service, and loss of existing or potential customers and members. In addition, breaches of our and/or our vendors’ security measures and the unauthorized dissemination of sensitive personal information or proprietary information or confidential information about us, our customers, our members or other third-parties, could expose our customers’, members’ and other constituents’ private information and our customers, members and other constituents to the risk of financial or medical identity theft, or expose us or other third parties to a risk of loss or misuse of this information, and result in investigations, regulatory enforcement actions, material fines and penalties, loss of customers, litigation or other actions which could have a material adverse effect on our brand, reputation, businesses, operating results and cash flows.
Data governance failures can adversely affect our reputation, businesses and prospects. Our use and disclosure of members’, customers’ and other constituents’ sensitive information is subject to complex regulations at multiple levels. We would be adversely affected if we or our business associates or other vendors fail to adequately protect members’, customers’ or other constituents’ sensitive information.
Our information systems are critical to the operation of our businesses. We collect, process, maintain, retain, evaluate, utilize and distribute large amounts of personal health and financial information and other confidential and sensitive data about our customers, members and other constituents in the ordinary course of our businesses. Some of our information systems rely upon third party systems to accomplish these tasks. The use and disclosure of such information is regulated at the federal, state and international levels, and these laws, rules and regulations are subject to change and increased enforcement activity, such as the California Consumer Privacy Act which went into effect January 1, 2020, the EU’s GDPR which began to apply across the EU during 2018 and the audit program implemented by HHS under HIPAA. In some cases, such laws, rules and regulations also apply to our vendors and/or may hold us liable for any violations by our vendors. International laws, rules and regulations governing the use and disclosure of such information are generally more stringent than U.S. laws and regulations, and they vary from jurisdiction to jurisdiction. Noncompliance with any privacy or security laws or regulations, or any security breach, cyber-attack or cybersecurity breach, and any incident involving the theft, misappropriation, loss or other unauthorized disclosure of, or access to, sensitive or confidential customer, member or other constituent information, whether by us, by one of our business associates or vendors or by another third party, could require us to expend significant resources to remediate any damage, could interrupt our operations and could adversely affect our brand and reputation, membership and operating results and also could expose and/or has exposed us to mandatory disclosure to the media, litigation (including class action litigation), governmental investigations and enforcement proceedings, material fines, penalties and/or remediation costs, and compensatory, special, punitive and statutory damages, consent orders, adverse actions against our licenses to do business and/or injunctive relief, any of which could adversely affect our businesses, operating results, cash flows or financial condition.
Our businesses depend on our customers’, members’ and other constituents’ willingness to entrust us with their health related and other sensitive personal information. Events that adversely affect that trust, including inadequate disclosure to our members or customers of our uses of their information, failing to keep our information technology systems and our customers’, members’ and other constituents’ sensitive information secure from significant attack, theft, damage, loss or unauthorized disclosure or access, whether as a result of our action or inaction (including human error) or that of our business associates, vendors or other third parties, could adversely affect our brand and reputation, membership and operating results and also could expose and/or has exposed us to mandatory disclosure to the media, litigation (including class action litigation), governmental investigations and enforcement proceedings, material fines, penalties and/or remediation costs, and compensatory, special, punitive and statutory damages, consent orders, adverse actions against our licenses to do business and/or injunctive relief, any of which could adversely affect our businesses, operating results, cash flows or financial condition. Large scale data breaches at other entities increase the challenge we and our vendors face in maintaining the security of our information technology systems and proprietary information and of our customers’, members’ and other constituents’ sensitive information. There can be no assurance that additional such failures will not occur, or if any do occur, that we will detect them or that they can be sufficiently remediated.
45
Product liability, product recall or personal injury issues could damage our reputation and have a significant adverse effect on our businesses, operating results, cash flows and/or financial condition.
The products that we sell could become subject to contamination, product tampering, mislabeling, recall or other damage. In addition, errors in the dispensing and packaging of drugs and consuming drugs in a manner that is not prescribed could lead to serious injury or death. Product liability or personal injury claims may be asserted against us with respect to any of the drugs or other products we sell or services we provide. For example, we are a defendant in hundreds of litigation proceedings relating to opioids and the sale of products containing talc. Our businesses involve the provision of professional services, including by pharmacists, physician assistants, nurses and nurse practitioners, which exposes us to professional liability claims. Should a product or other liability issue arise, the coverage available under our insurance programs and the indemnification amounts available to us from third parties may not be adequate to protect us against the financial impact of the related claims. We also may not be able to maintain our existing levels of insurance on acceptable terms in the future. A product liability or personal injury issue or judgment against us or a product recall could damage our reputation and have a significant adverse effect on our businesses, operating results and/or financial condition.
We face significant competition in attracting and retaining talented employees. Further, managing succession for, and retention of, key executives is critical to our success, and our failure to do so could adversely affect our businesses, operating results and/or future performance.
Our ability to attract and retain qualified and experienced employees is essential to meet our current and future goals and objectives. There is no guarantee we will be able to attract and retain such employees or that competition among potential employers will not result in increased compensation and/or benefits costs. If we are unable to retain existing employees or attract additional employees, or we experience an unexpected loss of leadership, we could experience a material adverse effect on our businesses, operating results and/or future performance.
In addition, our failure to adequately plan for succession of senior management and other key management roles or the failure of key employees to successfully transition into new roles could have a material adverse effect on our businesses, operating results and/or future performance. The succession plans we have in place and our employment arrangements with certain key executives do not guarantee the services of these executives will continue to be available to us.
Sales of our products and services are dependent on our ability to attract and motivate internal sales personnel and independent third-party brokers, consultants and agents. New distribution channels create new disintermediation risk. We may be subject to penalties or other regulatory actions as a result of the marketing practices of brokers and agents selling our products.
Our products are sold primarily through our sales personnel, who frequently work with independent brokers, consultants and agents who assist in the production and servicing of business. The independent brokers, consultants and agents generally are not dedicated to us exclusively and may frequently recommend and/or market health care benefits products of our competitors. Accordingly, we must compete intensely for their services and allegiance. Our sales could be adversely affected if we are unable to attract, retain or motivate sales personnel and third-party brokers, consultants and agents, or if we do not adequately provide support, training and education to this sales network regarding our complex product portfolio, or if our sales strategy is not appropriately aligned across distribution channels. This risk is heightened as we develop, operate and expand our consumer-oriented products and services and we expand in the health care space and our business model evolves to include a greater focus on consumers and direct-to-consumer sales, such as competing for sales on Insurance Exchanges.
New distribution channels for our products and services continue to emerge, including Private Exchanges operated by health care consultants and technology companies. These channels may make it more difficult for us to directly engage consumers and other customers in the selection and management of their health care benefits, in health care utilization and in the effective navigation of the health care system. We also may be challenged by new technologies and marketplace entrants that could interfere with our existing relationships with customers and health plan members in these areas.
In addition, there have been several investigations regarding the marketing practices of brokers and agents selling health care and other insurance products and the payments they receive. These investigations have resulted in enforcement actions against companies in our industry and brokers and agents marketing and selling those companies’ products. For example, CMS and state departments of insurance have increased their scrutiny of the marketing practices of brokers and agents who market Medicare products. These investigations and enforcement actions could result in penalties and the imposition of corrective action plans and/or changes to industry practices, which could adversely affect our ability to market our products.
46
Failure of our businesses to effectively collaborate could prevent us from maximizing our operating results.
To maximize our overall Enterprise value, our various businesses need to collaborate effectively. Our businesses need to be aligned in order to prioritize goals and coordinate the design of new products intended to utilize the offerings of multiple businesses, including our transformation and Enterprise modernization programs. In addition, misaligned incentives, information siloes, ineffective product development and failure of our corporate governance policies or procedures, for example significant financial decisions being made at an inappropriate level in our organization, also could prevent us from maximizing our operating results and/or achieving our financial and other projections.
The failure or disruption of our information technology systems or the failure of our information technology infrastructure to support our businesses could adversely affect our reputation, businesses, operating results and cash flows.
Our information systems are subject to damage or interruption from power outages, facility damage, computer and telecommunications failures, computer viruses, security breaches (including credit card or personally identifiable information breaches), cyber-attacks, vandalism, catastrophic events and human error. If our information systems are damaged, fail to work properly or otherwise become unavailable, we may incur substantial costs to repair or replace them, and may experience reputational damage, loss of critical information, customer disruption and interruptions or delays in our ability to perform essential functions and implement new and innovative services. In addition, compliance with changes in U.S. and foreign laws and regulations, including privacy and information security laws and standards, may cause us to incur significant expense due to increased investment in technology and the development of new operational processes.
Our business success and operating results depend in part on effective information technology systems and on continuing to develop and implement improvements in technology. Pursuing multiple initiatives simultaneously could make this continued development and implementation significantly more challenging.
Many aspects of our operations are dependent on our information systems and the information collected, processed, stored, and handled by these systems. We rely heavily on our computer systems to manage our ordering, pricing, point-of-sale, pharmacy fulfillment, inventory replenishment, claims processing, customer loyalty and subscription programs, finance and other processes. Throughout our operations, we collect, process, maintain, retain, evaluate, utilize and distribute large amounts of confidential and sensitive data and information, including personally identifiable information and protected health information, that our customers, members and other constituents provide to purchase products or services, enroll in programs or services, register on our websites, interact with our personnel, or otherwise communicate with us. In addition, for these operations, we depend in part on the secure transmission of confidential information over public networks.
We have many different information and other technology systems supporting our businesses (including as a result of our acquisitions). Our businesses depend in large part on these systems to adequately price our products and services; accurately establish reserves, process claims and report operating results; and interact with providers, employer plan sponsors, customers, members, consumers and vendors in an efficient and uninterrupted fashion. In addition, recent trends toward greater consumer engagement in health care require new and enhanced technologies, including more sophisticated applications for mobile devices. Certain of our technology systems (including software) are older, legacy systems that are less flexible, less efficient and require a significant ongoing commitment of capital and human resources to maintain, protect and enhance them and to integrate them with our other systems. We must re-engineer and reduce the number of these systems to meet changing consumer and vendor preferences and needs, improve our productivity and reduce our operating expenses. We also need to develop or acquire new technology systems, contract with new vendors or modify certain of our existing systems to support the consumer-oriented and transformation products and services we are developing, operating and expanding and/or to meet current and developing industry and regulatory standards, including to keep pace with continuing changes in information processing technology and emerging cybersecurity risks and threats. If we fail to achieve these objectives, our ability to profitably grow our business and/or our operating results may be adversely affected.
In addition, information technology and other technology and process improvement projects, including our transformation and Enterprise modernization programs, frequently are long-term in nature and may take longer to complete and cost more than we expect and may not deliver the benefits we project once they are complete. If we do not effectively and efficiently secure, manage, integrate and enhance our technology portfolio (including vendor sourced systems), we could, among other things, have problems determining health care and other benefit cost estimates and/or establishing appropriate pricing, meeting the needs of customers, consumers, providers, members and vendors, developing and expanding our consumer-oriented products and services or keeping pace with industry and regulatory standards, and our operating results may be adversely affected.
47
We are subject to payment-related risks that could increase our operating costs, expose us to fraud or theft, subject us to potential liability and disrupt our business operations.
We accept payments using a variety of methods, including cash, checks, credit cards, debit cards, gift cards, mobile payments and potentially other technologies in the future. Acceptance of these payment methods subjects us to rules, regulations, contractual obligations and compliance requirements, including payment network rules and operating guidelines, data security standards and certification requirements, and rules governing electronic funds transfers. These requirements may change in the future, which could make compliance more difficult or costly. For certain payment options, including credit and debit cards, we pay interchange and other fees, which could increase periodically thereby raising our operating costs. We rely on third parties to provide payment processing services, including the processing of credit cards, debit cards, and various other forms of electronic payment. If these vendors are unable to provide these services to us, or if their systems are compromised, our operations could be disrupted. The payment methods that we offer also expose us to potential fraud and theft by persons seeking to obtain unauthorized access to, or exploit any weaknesses in, the payment systems we use. If we fail to abide by applicable rules or requirements, or if data relating to our payment systems is compromised due to a breach or misuse, we may be responsible for any costs incurred by payment card issuing banks and other third parties or subject to fines and higher transaction fees. In addition, our reputation and ability to accept certain types of payments could each be harmed resulting in reduced sales and adverse effects on our operating results.
Both our and our vendors’ operations are subject to a variety of business continuity hazards and risks, any of which could interrupt our operations or otherwise adversely affect our performance and operating results.
We and our vendors are subject to business continuity hazards and other risks, including natural disasters, utility and other mechanical failures, acts of war or terrorism, disruption of communications, data security and preservation, disruption of supply or distribution, safety regulation and labor difficulties. The occurrence of any of these or other events to us or our vendors might disrupt or shut down our operations or otherwise adversely affect our operations. We also may be subject to certain liability claims in the event of an injury or loss of life, or damage to property, resulting from such events. Although we have developed procedures for crisis management and disaster recovery and business continuity plans and maintain insurance policies that we believe are customary and adequate for our size and industry, our insurance policies include limits and exclusions and, as a result, our coverage may be insufficient to protect against all potential hazards and risks incident to our businesses. In addition, our crisis management and disaster recovery procedures and business continuity plans may not be effective. Should any such hazards or risks occur, or should our insurance coverage be inadequate or unavailable, our businesses, operating results, cash flows and financial condition could be adversely affected.
Financial Risks
We would be adversely affected if we do not effectively deploy our capital. Downgrades or potential downgrades in our credit ratings, should they occur, could adversely affect our brand and reputation, businesses, operating results, cash flows and financial condition.
Our operations generate significant capital, and we have the ability to raise additional capital. The manner in which we deploy our capital, including investments in our businesses, our operations (such as information technology and other strategic and capital projects), dividends, acquisitions, share and/or debt repurchases, repayment of debt, reinsurance or other capital uses, impacts our financial strength, claims paying ability and credit ratings issued by nationally-recognized statistical rating organizations. Credit ratings issued by nationally-recognized statistical rating organizations are broadly distributed and generally used throughout our industries. Our ratings reflect each rating organization’s opinion of our financial strength, operating performance and ability to meet our debt obligations or obligations to our insureds. We believe our credit ratings and the financial strength and claims paying ability of our principal insurance and HMO subsidiaries are important factors in marketing our Health Care Benefits products to certain of our customers.
Each of the ratings organizations reviews our ratings periodically, and there can be no assurance that our current ratings will be maintained in the future. In connection with the completion of the Aetna Acquisition, each of Standard & Poor’s, Moody’s and Fitch downgraded certain of our debt, financial strength and/or other credit ratings. Downgrades in our ratings could adversely affect our businesses, operating results, cash flows and financial condition.
Goodwill and other intangible assets could, in the future, become impaired.
As of December 31, 2019, we had $112.9 billion of goodwill and other intangible assets. During the year ended December 31, 2018, we took $6.1 billion of goodwill impairment charges related to our LTC reporting unit within the Retail/LTC segment.
48
Goodwill and indefinitely-lived intangible assets are subject to annual impairment reviews, or more frequent reviews if events or circumstances indicate that the carrying value may not be recoverable. When evaluating goodwill for potential impairment, we compare the fair value of our reporting units to their respective carrying amounts. We estimate the fair value of our reporting units using a combination of a discounted cash flow method and a market multiple method. If the carrying amount of a reporting unit exceeds its estimated fair value, a goodwill impairment loss is recognized in an amount equal to the excess to the extent of the goodwill balance. Estimated fair values could change if, for example, there are changes in the business climate, industry-wide changes, changes in the competitive environment, adverse legal or regulatory actions or developments, changes in capital structure, cost of debt, interest rates, capital expenditure levels, operating cash flows or market capitalization. Because of the significance of our goodwill and intangible assets, any future impairment of these assets could require material noncash charges to our operating results, which also could have a material adverse effect on our financial condition.
Adverse conditions in the U.S. and global capital markets can significantly and adversely affect the value of our investments in debt and equity securities, mortgage loans, alternative investments and other investments, and our operating results and/or our financial condition.
The global capital markets, including credit markets, continue to experience volatility and uncertainty. As an insurer, we have a substantial investment portfolio that supports our policy liabilities and surplus and is comprised largely of debt securities of issuers located in the U.S. As a result, the income we earn from our investment portfolio is largely driven by the level of interest rates in the U.S., and to a lesser extent the international financial markets; and volatility, uncertainty and/or disruptions in the global capital markets, particularly the U.S. credit markets, and governments’ monetary policy, particularly U.S. monetary policy, can significantly and adversely affect the value of our investment portfolio, our operating results and/or our financial condition by:
• | significantly reducing the value and/or liquidity of the debt securities we hold in our investment portfolio and creating realized capital losses that reduce our operating results and/or unrealized capital losses that reduce our shareholders’ equity; |
• | keeping interest rates low on high-quality short-term or medium-term debt securities (such as we have experienced during recent years) and thereby materially reducing our net investment income and operating results as the proceeds from securities in our investment portfolio that mature or are otherwise disposed of continue to be reinvested in lower yielding securities; |
• | reducing the fair values of our investments if interest rates rise; |
• | causing non-performance of or defaults on their obligations to us by third parties, including customers, issuers of securities in our investment portfolio, mortgage borrowers and/or reinsurance and/or derivatives counterparties; |
• | making it more difficult to value certain of our investment securities, for example if trading becomes less frequent, which could lead to significant period-to-period changes in our estimates of the fair values of those securities and cause period-to-period volatility in our net income and shareholders’ equity; |
• | reducing our ability to issue short-term debt securities at attractive interest rates, thereby increasing our interest expense and decreasing our operating results; and |
• | reducing our ability to issue other securities. |
Although we seek, within guidelines we deem appropriate, to match the duration of our assets and liabilities and to manage our credit and counterparty exposures, a failure adequately to do so could adversely affect our net income and our financial condition and, in extreme circumstances, our cash flows.
We have incurred and assumed significant indebtedness which has increased our consolidated interest expense and could adversely affect our business flexibility and increase our borrowing costs.
In order to complete the Aetna Acquisition, we incurred acquisition-related debt financing of approximately $45.0 billion and assumed Aetna’s existing indebtedness with a fair value of approximately $8.1 billion. Our substantial indebtedness and elevated debt-to-equity ratio have the effect, among other things, of reducing our flexibility to respond to changing business and economic conditions and increasing our interest expense compared to pre-Aetna Acquisition periods. In addition, the amount of cash required to service our increased indebtedness levels and thus the demands on our cash resources are greater than the amount of cash flows required to service our indebtedness prior to the Aetna Acquisition. We have suspended share repurchases until we reach our desired debt-to-equity ratio. The increased levels of indebtedness also could reduce funds available to engage in investments in product development, capital expenditures, dividend payments and other activities and may create competitive disadvantages for us relative to other companies with lower debt levels.
49
Risks Related to Our Relationships with Manufacturers, Providers, Suppliers and Vendors
We face risks relating to the market availability, pricing, suppliers and safety profiles of prescription drugs and other products that we purchase and sell.
Our Retail/LTC segment and our mail order and specialty pharmacy operations generate revenues in significant part by dispensing prescription drugs. Our PBM business generates revenues primarily by contracting with clients to provide prescription drugs and related health care services to plan members. As a result, we are dependent on our relationships with prescription drug manufacturers and suppliers. We acquire a substantial amount of our mail order and specialty pharmacies’ prescription drug supply from a limited number of suppliers. Certain of our agreements with such suppliers are short-term and cancelable by either party without cause. In addition, these agreements may allow the supplier to distribute through channels other than us. Certain of these agreements also allow pricing and other terms to be adjusted periodically for changing market conditions or required service levels. A termination or modification to any of these relationships could adversely affect our prescription drug supply and have a material adverse effect on our businesses, operating results and financial condition. Moreover, many products distributed by our pharmacies are manufactured with ingredients that are susceptible to supply shortages. In some cases, we depend upon a single source of supply. Any such supply shortages or loss of any such single source of supply could adversely affect our operating results and cash flows.
Much of the branded and generic drug product that we sell in our pharmacies, and much of the other merchandise we sell, is manufactured in whole or in substantial part outside of the United States. In most cases, the products or merchandise are imported by others and sold to us. As a result, significant changes in tax or trade policies, tariffs or trade relations between the United States and other countries, such as the imposition of unilateral tariffs on imported products, could result in significant increases in our costs, restrict our access to suppliers, depress economic activity, and have a material adverse effect on our businesses, operating results and cash flows. In addition, other countries may change their business and trade policies and such changes, as well as any negative sentiments towards the United States in response to increased import tariffs and other changes in U.S. trade regulations, could adversely affect our businesses.
Our suppliers are independent entities subject to their own operational and financial risks that are outside our control. If our current suppliers were to stop selling prescription drugs to us or delay delivery, including as a result of supply shortages, supplier production disruptions, supplier quality issues, closing or bankruptcies of our suppliers, or for other reasons, we may be unable to procure alternatives from other suppliers in a timely and efficient manner and on acceptable terms, or at all.
Our operating results may be adversely affected if we are unable to contract with providers on competitive terms and develop and maintain attractive networks with high quality providers.
We are seeking to enhance our health care provider networks by entering into joint ventures and other collaborative risk-sharing arrangements with health care providers. Providers’ willingness to enter these arrangements with us depends upon, among other things, our ability to provide them with up to date quality of care data to support these value-based contracts. These arrangements are designed to give providers incentives to engage in population health management and optimize delivery of health care to our members. These arrangements also may allow us to expand into new geographies, target new customer groups, increase membership and reduce medical costs and, if we provide technology or other services to the relevant health system or provider organization, may contribute to our revenue and earnings from alternative sources. If such arrangements do not result in the lower medical costs that we project or if we fail to attract health care providers to such arrangements, or are less successful at implementing such arrangements than our competitors, our medical costs may not be competitive and may be higher than we project, our attractiveness to customers may be reduced, we may lose or be unable to grow medical membership, and our ability to profitably grow our business and/or our operating results may be adversely affected.
While we believe joint ventures, ACOs and other non-traditional health care provider organizational structures present opportunities for us, the implementation of our joint ventures and other non-traditional structure strategies may not achieve the intended results, which could adversely affect our operating results and cash flows. Among other things, joint ventures require us to maintain collaborative relationships with our counterparties, continue to gain access to provider rates that make the joint ventures economically sustainable and devote significant management time to the operation and management of the joint ventures. We may not be able to achieve these objectives in one or more of our joint ventures, which could adversely affect our operating results and cash flows.
50
If our service providers fail to meet their contractual obligations to us or to comply with applicable laws or regulations, we may be exposed to brand and reputational harm, litigation and/or regulatory action. This risk is particularly high in our Medicare, Medicaid, dual eligible and dual eligible special needs plan programs.
We contract with various third parties to perform certain functions and services and provide us with certain information technology systems. Our arrangements with these third parties may expose us to public scrutiny, adversely affect our brand and reputation, expose us to litigation or regulatory action, and otherwise make our operations vulnerable if we fail to adequately oversee, monitor and regulate their performance or if they fail to meet their contractual obligations to us or to comply with applicable laws or regulations. For example, certain of our vendors have been responsible for releases of sensitive information of our members and employees, which has caused us to incur additional expenses and given rise to regulatory actions and litigation against us.
These risks are particularly high in our Medicare, Medicaid, dual eligible and dual eligible special needs plan programs, where third parties perform PBM, medical management and other member related services for us. Any failure of our or these third parties’ prevention, detection or control systems related to regulatory compliance, compliance with our internal policies, data security and/or cybersecurity or any incident involving the theft, misappropriation, loss or other unauthorized disclosure of, or access to, members’, customers’ or other constituents’ sensitive information could require us to expend significant resources to remediate any damage, interrupt our operations and adversely affect our brand and reputation and also expose us to whistleblower, class action and other litigation, other proceedings, prohibitions on marketing or active or passive enrollment of members, corrective actions, fines, sanctions and/or penalties, any of which could adversely affect our businesses, operating results, cash flows and/or financial condition.
We may experience increased medical and other benefit costs, litigation risk and customer and member dissatisfaction when providers that do not have contracts with us render services to our Health Care Benefits members.
Some providers that render services to our Health Care Benefits members do not have contracts with us. In those cases, we do not have a pre-established understanding with these providers as to the amount of compensation that is due to them for services rendered to our members. In some states, the amount of compensation due to these nonparticipating providers is defined by law or regulation, but in most instances it is either not defined or it is established by a standard that is not clearly translatable into dollar terms. In such instances providers may believe that they are underpaid for their services and may either litigate or arbitrate their dispute with us or try to recover the difference between what we have paid them and the amount they charged us from our members, which may result in customer and member dissatisfaction. For example, in October 2018, an arbitrator awarded certain claimant hospitals approximately $150 million in a proceeding relating to Aetna’s out-of-network benefit payment and administration practices, and in March 2019 that award was reduced to approximately $86 million. Such disputes may cause us to pay higher medical or other benefit costs than we projected.
Continuing consolidation and integration among providers and other suppliers may increase our medical and other covered benefits costs, make it difficult for us to compete in certain geographies and create new competitors.
Hospitals and other providers and health systems continue to consolidate across the health care industry. While this consolidation could increase efficiency and has the potential to improve the delivery of health care services, it also reduces competition and the number of potential contracting parties in certain geographies. These health systems also are increasingly forming and considering forming health plans to directly offer health insurance in competition with us, a process that has been accelerated by the ACA. In addition, ACOs (including Commercial and Medicaid-only ACOs developed as a result of state Medicaid laws), practice management companies, consolidation among and by integrated health systems and other changes in the organizational structures that physicians, hospitals and other health care providers adopt continues to change the way these providers interact with us and the competitive landscape in which we operate. These changes may increase our medical and other covered benefits costs, may affect the way we price our products and services and estimate our medical and other covered benefits costs and may require us to change our operations, including by withdrawing from certain geographies where we do not have a significant presence across our businesses or are unable to collaborate or contract with providers on acceptable terms. Each of these changes may adversely affect our businesses and operating results.
51
Item 1B. Unresolved Staff Comments.
There are no unresolved SEC Staff Comments.
Item 2. Properties.
The Company’s principal office is an owned building complex located in Woonsocket, Rhode Island, which totals approximately one million square feet. The Company also leases office space in other locations in the United States.
Pharmacy Services Segment
The Pharmacy Services segment includes owned or leased mail service dispensing pharmacies, call centers, on-site pharmacy stores, retail specialty pharmacy stores, specialty mail service pharmacies and branches for infusion and enteral services throughout the United States.
Retail/LTC Segment
As of December 31, 2019, the Retail/LTC segment operated the following properties:
• | Approximately 8,170 retail stores, of which approximately 5% were owned. Net selling space for retail stores was approximately 80.3 million square feet as of December 31, 2019. Approximately 45% of the store base was opened or significantly remodeled within the last five years; |
• | Approximately 1,725 retail pharmacies and approximately 80 clinics in Target stores; |
• | Owned distribution centers and leased distribution facilities throughout the U.S. totaling approximately 10.5 million square feet; and |
• | Owned and leased LTC pharmacies throughout the U.S. and an owned LTC repackaging facility. |
In connection with certain business dispositions completed between 1995 and 1997, the Company continues to guarantee lease obligations for 79 former stores. The Company is indemnified for these guarantee obligations by the respective initial purchasers. These guarantees generally remain in effect for the initial lease term and any extension thereof pursuant to a renewal option provided for in the lease prior to the time of the disposition. For additional information on these guarantees, see “Lease Guarantees” in Note 16 ‘‘Commitments and Contingencies’’ included in Item 8 of this 10-K.
Health Care Benefits Segment
The Health Care Benefits segment’s principal office is an owned building complex located in Hartford, Connecticut, which totals approximately 1.7 million square feet. The Health Care Benefits segment also owns or leases office space in other locations in the United States and several other countries.
Management believes that the Company’s owned and leased facilities are suitable and adequate to meet the Company’s anticipated needs. At the end of the existing lease terms, management believes the leases can be renewed or replaced by alternative space. For additional information on the amount of right-of-use assets and lease liabilities for the Company’s leases, see Note 6 ‘‘Leases’’ included in Item 8 of this 10-K.
Item 3. Legal Proceedings.
I. Legal Proceedings
The information contained in Note 16 ‘‘Commitments and Contingencies’’ included in Item 8 of this 10-K is incorporated herein by reference.
II. Environmental Matters
Item 103 of SEC Regulation S-K requires disclosure of environmental legal proceedings with a governmental authority if management reasonably believes that the proceedings involve potential monetary sanctions of $100,000 or more. The Company is in the process of negotiating with the New York State Department of Environmental Conservation to resolve claims of
52
alleged historical noncompliance with hazardous waste regulations in connection with LTC pharmacies in the State of New York. These proceedings are not material to the Company’s business or financial condition.
Item 4. Mine Safety Disclosures.
Not applicable.
53
Information about our Executive Officers
The following sets forth the name, age and biographical information for each of the Registrant’s executive officers as of February 18, 2020. In each case the officer’s term of office extends to the date of the meeting of the CVS Health Board of Directors (the “Board”) following the next annual meeting of stockholders of CVS Health. Previous positions and responsibilities held by each of the executive officers over the past five years or more are indicated below:
Lisa G. Bisaccia, age 63, Executive Vice President of CVS Health Corporation since March 2016 and Chief Human Resources Officer of CVS Health Corporation since January 2010; Senior Vice President of CVS Health Corporation from January 2010 through February 2016. Ms. Bisaccia is also a member of the board of directors of Aramark, a leading global provider of food, facilities and uniform services.
Eva C. Boratto, age 53, Executive Vice President and Chief Financial Officer of CVS Health Corporation since November 2018; Executive Vice President - Controller and Chief Accounting Officer of CVS Health Corporation from March 2017 through November 2018; Senior Vice President - Controller and Chief Accounting Officer of CVS Health Corporation from July 2013 through February 2017.
Troyen A. Brennan, M.D., age 65, Executive Vice President and Chief Medical Officer of CVS Health Corporation since November 2008; Executive Vice President and Chief Medical Officer of Aetna Inc. from February 2006 through November 2008.
James D. Clark, age 55, Senior Vice President - Controller and Chief Accounting Officer of CVS Health Corporation since November 2018; Vice President - Finance and Accounting of CVS Pharmacy, Inc. from September 2009 through October 2018.
Joshua M. Flum, age 50, Executive Vice President, Enterprise Strategy and Digital of CVS Health Corporation since November 2018; Executive Vice President, Corporate Strategy and Business Development of CVS Pharmacy, Inc. from June 2016 through October 2018; Executive Vice President - Pharmacy Services of CVS Pharmacy, Inc. from March 2015 through May 2016; Senior Vice President of Retail Pharmacy of CVS Pharmacy, Inc. from December 2010 through February 2015. Mr. Flum is a member of the board of directors of CreditRiskMonitor.com, Inc., a company that facilitates the analysis of corporate financial risk, mostly in the context of the extension of trade credit from one business to another.
Alan M. Lotvin, M.D., age 58, served as Executive Vice President - Transformation of CVS Health Corporation from June 2018 through February 2020, and will serve as Executive Vice President of CVS Health Corporation and President of CVS Caremark following the departure of Mr. Rice. Dr. Lotvin served as Executive Vice President - Specialty Pharmacy, CVS Caremark from November 2012 through May 2018.
Karen S. Lynch, age 57, Executive Vice President of CVS Health Corporation since November 2018; President of Aetna since January 2015; Executive Vice President, Local and Regional Businesses of Aetna from February 2013 through December 2014. Ms. Lynch is a member of the board of directors of U.S. Bancorp, a banking and financial services company.
Larry J. Merlo, age 64, President and Chief Executive Officer of CVS Health Corporation since March 2011; and a director of CVS Health Corporation since May 2010.
Thomas M. Moriarty, age 56, Executive Vice President and General Counsel of CVS Health Corporation since October 2012; Chief Policy and External Affairs Officer since March 2017; Chief Strategy Officer from March 2014 through February 2017.
Derica W. Rice, age 54, Executive Vice President of CVS Health Corporation and President of CVS Caremark since March 2018; Executive Vice President of Global Services and Chief Financial Officer of Eli Lilly & Company from May 2006 through December 2017. Mr. Rice is a director of The Walt Disney Company since March 2019 and was a director of Target Corporation from September 2007 until January 2018. Mr. Rice will be leaving the Company effective March 1, 2020.
Jonathan C. Roberts, age 64, Executive Vice President and Chief Operating Officer of CVS Health Corporation since March 2017 and Interim President of CVS Pharmacy since January 2020; Executive Vice President of CVS Health Corporation and President of CVS Caremark from September 2012 through February 2017.
54
PART II
Item 5. Market for Registrant’s Common Equity, Related Stockholder Matters and Issuer Purchases of Equity Securities.
On February 3, 2020, the Company announced that Richard J. Swift, Richard M. Bracken and Mark T. Bertolini would not stand for re-election at the Company’s upcoming Annual Meeting of Stockholders (the “2020 Annual Meeting”). On February 7, 2020, Mr. Bertolini informed the Company of his decision to resign from the Board, effective immediately. On February 10, 2020, the Board reduced the size of the Board from 16 to 15 members effective immediately and further reduced the size of the Board to 13 members effective at the time of the 2020 Annual Meeting.
Market information
CVS Health’s common stock is listed on the New York Stock Exchange under the symbol “CVS.”
Dividends
CVS Health has paid cash dividends every quarter since becoming a public company. Future dividends will depend on the Company’s earnings, capital requirements, financial condition and other factors considered relevant by CVS Health’s Board of Directors.
See Note 12 ‘‘Shareholders’ Equity’’ included in Item 8 of this 10-K for information regarding CVS Health’s dividends.
Holders of common stock
As of February 12, 2020, there were 26,656 registered holders of the registrant’s common stock according to the records maintained by the registrant’s transfer agent.
Issuer purchases of equity securities
The following share repurchase programs have been authorized by the Board:
In billions | Remaining as of | ||||||
Authorization Date | Authorized | December 31, 2019 | |||||
November 2, 2016 (“2016 Repurchase Program”) | $ | 15.0 | $ | 13.9 | |||
December 15, 2014 (“2014 Repurchase Program”) | 10.0 | — | |||||
Each of the share Repurchase Programs was effective immediately. The 2014 Repurchase Program has been completed. The 2016 Repurchase Program permits the Company to effect repurchases from time to time through a combination of open market repurchases, privately negotiated transactions, accelerated share repurchase transactions, and/or other derivative transactions. The 2016 Repurchase Program can be modified or terminated by the Board at any time. During the three months ended December 31, 2019, the Company did not repurchase any shares of common stock.
See Note 12 ‘‘Shareholders’ Equity’’ included in Item 8 of this 10-K for additional information regarding the Company’s share repurchases.
55
Stock Performance Graph
The following graph compares the cumulative total shareholder return on CVS Health’s common stock (assuming reinvestment of dividends) with the cumulative total return on the S&P 500 Index, the S&P 500 Food and Staples Retailing Industry Group Index and the S&P 500 Healthcare Sector Group Index from December 31, 2014 through December 31, 2019. The graph assumes a $100 investment in shares of CVS Health’s common stock on December 31, 2014.
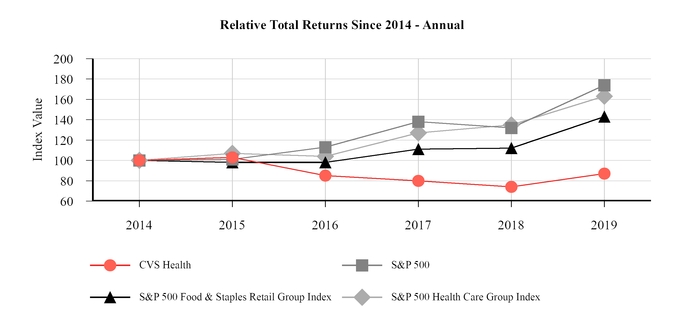
December 31, | |||||||||||||||||||||||
2014 | 2015 | 2016 | 2017 | 2018 | 2019 | ||||||||||||||||||
CVS Health Corporation | $ | 100 | $ | 103 | $ | 85 | $ | 80 | $ | 74 | $ | 87 | |||||||||||
S&P 500 (1) | 100 | 101 | 113 | 138 | 132 | 174 | |||||||||||||||||
S&P 500 Food & Staples Retail Group Index (2) | 100 | 98 | 98 | 111 | 112 | 143 | |||||||||||||||||
S&P 500 Health Care Group Index (1) (3) | 100 | 107 | 104 | 127 | 135 | 163 | |||||||||||||||||
_____________________________________________
(1) | Includes CVS Health. |
(2) | Includes 5 companies (COST, KR, SYY, WBA, WMT). |
(3) | Includes 61 companies. |
The year-ended values of each investment shown in the preceding graph are based on share price appreciation plus dividends, with the dividends reinvested as of the last business day of the month during which such dividends were ex-dividend. The calculations exclude trading commissions and taxes. Total shareholder returns from each investment can be calculated from the year-end investment values shown beneath the graph.
56
Item 6. Selected Financial Data.
The selected consolidated financial data of CVS Health Corporation as of and for the periods indicated in the five-year period ended December 31, 2019, has been derived from the consolidated financial statements of CVS Health Corporation. The selected consolidated financial data should be read in conjunction with the MD&A included in Item 7 of this 10-K and the audited consolidated financial statements and related notes included in Item 8 of this 10-K.
In millions, except per share amounts | 2019 | 2018 (1) | 2017 | 2016 | 2015 | ||||||||||||||
Statement of operations data: | |||||||||||||||||||
Total revenues | $ | 256,776 | $ | 194,579 | $ | 184,786 | $ | 177,546 | $ | 153,311 | |||||||||
Operating income | 11,987 | 4,021 | 9,538 | 10,386 | 9,496 | ||||||||||||||
Income (loss) from continuing operations | 6,631 | (596 | ) | 6,631 | 5,320 | 5,230 | |||||||||||||
Net income (loss) attributable to CVS Health | 6,634 | (594 | ) | 6,622 | 5,317 | 5,237 | |||||||||||||
Per common share data: | |||||||||||||||||||
Basic earnings (loss) per common share: | |||||||||||||||||||
Income (loss) from continuing operations attributable to CVS Health | $ | 5.10 | $ | (0.57 | ) | $ | 6.48 | $ | 4.93 | $ | 4.65 | ||||||||
Income (loss) from discontinued operations attributable to CVS Health | $ | — | $ | — | $ | (0.01 | ) | $ | — | $ | 0.01 | ||||||||
Net income (loss) attributable to CVS Health | $ | 5.10 | $ | (0.57 | ) | $ | 6.47 | $ | 4.93 | $ | 4.66 | ||||||||
Diluted earnings (loss) per common share: | |||||||||||||||||||
Income (loss) from continuing operations attributable to CVS Health | $ | 5.08 | $ | (0.57 | ) | $ | 6.45 | $ | 4.91 | $ | 4.62 | ||||||||
Income (loss) from discontinued operations attributable to CVS Health | $ | — | $ | — | $ | (0.01 | ) | $ | — | $ | 0.01 | ||||||||
Net income (loss) attributable to CVS Health | $ | 5.08 | $ | (0.57 | ) | $ | 6.44 | $ | 4.90 | $ | 4.63 | ||||||||
Dividends per common share | $ | 2.00 | $ | 2.00 | $ | 2.00 | $ | 1.70 | $ | 1.40 | |||||||||
Balance sheet and other data: | |||||||||||||||||||
Total assets | $ | 222,449 | $ | 196,456 | $ | 95,131 | $ | 94,462 | $ | 92,437 | |||||||||
Long-term debt, less current portion | $ | 64,699 | $ | 71,444 | $ | 22,181 | $ | 25,615 | $ | 26,267 | |||||||||
Total shareholders’ equity | $ | 64,170 | $ | 58,543 | $ | 37,695 | $ | 36,834 | $ | 37,203 | |||||||||
Number of stores (at end of year) | 9,941 | 9,967 | 9,846 | 9,750 | 9,681 | ||||||||||||||
_____________________________________________
(1) | On November 28, 2018, the Company acquired Aetna. Aetna’s operations are included in the Company’s consolidated financial statements subsequent to the Aetna Acquisition Date. See Note 2 ‘‘Acquisitions and Divestitures’’ included in Item 8 of this 10-K for additional information. |
57
Item 7. Management’s Discussion and Analysis of Financial Condition and Results of Operations. (“MD&A”)
The following discussion and analysis should be read in conjunction with the audited consolidated financial statements and related notes included in Item 8 of this 10-K, “Risk Factors” included in Item 1A of this 10-K and the “Cautionary Statement Concerning Forward Looking Statements” in this 10-K.
Overview of Business
CVS Health Corporation (“CVS Health”), together with its subsidiaries (collectively, the “Company,” “we,” “our” or “us”), is the nation’s premier health innovation company helping people on their path to better health. Whether in one of its pharmacies or through its health services and plans, CVS Health is pioneering a bold new approach to total health by making quality care more affordable, accessible, simple and seamless. CVS Health is community-based and locally focused, engaging consumers with the care they need when and where they need it. The Company has approximately 9,900 retail locations, approximately 1,100 walk-in medical clinics, a leading pharmacy benefits manager with approximately 105 million plan members, a dedicated senior pharmacy care business serving more than one million patients per year and expanding specialty pharmacy services. CVS Health also serves an estimated 37 million people through traditional, voluntary and consumer-directed health insurance products and related services, including expanding Medicare Advantage offerings and a leading standalone Medicare Part D prescription drug plan (“PDP”). The Company believes its innovative health care model increases access to quality care, delivers better health outcomes and lowers overall health care costs.
On November 28, 2018 (the “Aetna Acquisition Date”), the Company acquired Aetna Inc. (“Aetna”) for a combination of cash and CVS Health stock (the “Aetna Acquisition”). The Company acquired Aetna to help improve the consumer health care experience by combining Aetna’s health care benefits products and services with CVS Health’s retail locations, walk-in medical clinics and integrated pharmacy capabilities with the goal of becoming the new, trusted front door to health care. Under the terms of the merger agreement, Aetna shareholders received $145.00 in cash and 0.8378 CVS Health shares for each Aetna share. The transaction valued Aetna at approximately $212 per share or approximately $70 billion. Including the assumption of Aetna’s debt, the total value of the transaction was approximately $78 billion. The Company financed the cash portion of the purchase price through a combination of cash on hand and by issuing approximately $45 billion of new debt, including senior notes and term loans (see “Liquidity and Capital Resources” later in this MD&A). The consolidated financial statements reflect Aetna’s results subsequent to the Aetna Acquisition Date.
On October 10, 2018, the Company and Aetna entered into a consent decree with the U.S. Department of Justice (the “DOJ”) that allowed the Company’s proposed acquisition of Aetna to proceed, provided Aetna agreed to sell its individual standalone PDPs. As part of the agreement reached with the DOJ, Aetna entered into a purchase agreement with a subsidiary of WellCare Health Plans, Inc. (“WellCare”) for the divestiture of Aetna’s standalone PDPs effective December 31, 2018. On November 30, 2018, the Company completed the sale of Aetna’s standalone PDPs. The Company provided administrative services to, and retained the financial results of, the divested plans through 2019. Subsequent to 2019, the Company will no longer retain the financial results of the divested plans. Aetna’s standalone PDPs had an aggregate of 2.5 million members as of December 31, 2019.
As a result of the Aetna Acquisition, the Company added the Health Care Benefits segment. Certain aspects of Aetna’s operations, including products for which the Company no longer solicits or accepts new customers, such as large case pensions and long-term care insurance products, are included in the Company’s Corporate/Other segment.
Effective for the first quarter of 2019, the Company realigned the composition of its segments to correspond with changes to its operating model and reflect how its Chief Operating Decision Maker (the “CODM”) reviews information and manages the business. As a result of this realignment, the Company’s SilverScript® PDP moved from the Pharmacy Services segment to the Health Care Benefits segment. In addition, the Company moved Aetna’s mail order and specialty pharmacy operations from the Health Care Benefits segment to the Pharmacy Services segment. Segment financial information has been retrospectively adjusted to reflect these changes. See Note 17 ‘‘Segment Reporting’’ included in Item 8 of this 10-K for segment financial information.
The Company has four reportable segments: Pharmacy Services, Retail/LTC, Health Care Benefits and Corporate/Other, which are described below.
58
Overview of the Pharmacy Services Segment
The Pharmacy Services segment provides a full range of pharmacy benefit management (“PBM”) solutions, including plan design offerings and administration, formulary management, retail pharmacy network management services, mail order pharmacy, specialty pharmacy and infusion services, clinical services, disease management services and medical spend management. The Pharmacy Services segment’s clients are primarily employers, insurance companies, unions, government employee groups, health plans, PDPs, Medicaid managed care plans, plans offered on public health insurance exchanges and private health insurance exchanges, other sponsors of health benefit plans and individuals throughout the United States. The Pharmacy Services segment operates retail specialty pharmacy stores, specialty mail order pharmacies, mail order dispensing pharmacies, compounding pharmacies and branches for infusion and enteral nutrition services. During the year ended December 31, 2019, the Company’s PBM filled or managed 2.0 billion prescriptions on a 30-day equivalent basis.
Overview of the Retail/LTC Segment
The Retail/LTC segment sells prescription drugs and a wide assortment of general merchandise, including over-the-counter drugs, beauty products, cosmetics and personal care products, provides health care services through its MinuteClinic® walk-in medical clinics and conducts long-term care pharmacy (“LTC”) operations, which distribute prescription drugs and provide related pharmacy consulting and other ancillary services to chronic care facilities and other care settings. As of December 31, 2019, the Retail/LTC segment operated approximately 9,900 retail locations, approximately 1,100 MinuteClinic® locations as well as online retail pharmacy websites, LTC pharmacies and onsite pharmacies. During the year ended December 31, 2019, the Retail/LTC segment filled 1.4 billion prescriptions on a 30-day equivalent basis. For the year ended December 31, 2019, the Company dispensed approximately 26.6% of the total retail pharmacy prescriptions in the United States.
Overview of the Health Care Benefits Segment
The Health Care Benefits segment is one of the nation’s leading diversified health care benefits providers, serving an estimated 37 million people as of December 31, 2019. The Health Care Benefits segment has the information and resources to help members, in consultation with their health care professionals, make more informed decisions about their health care. The Health Care Benefits segment offers a broad range of traditional, voluntary and consumer-directed health insurance products and related services, including medical, pharmacy, dental and behavioral health plans, medical management capabilities, Medicare Advantage and Medicare Supplement plans, PDPs, Medicaid health care management services, workers’ compensation administrative services and health information technology products and services. The Health Care Benefits segment’s customers include employer groups, individuals, college students, part-time and hourly workers, health plans, health care providers (“providers”), governmental units, government-sponsored plans, labor groups and expatriates. The Company refers to insurance products (where it assumes all or a majority of the risk for medical and dental care costs) as “Insured” and administrative services contract products (where the plan sponsor assumes all or a majority of the risk for medical and dental care costs) as “ASC.” For periods prior to November 28, 2018 (the Aetna Acquisition Date), the Health Care Benefits segment was comprised of the Company’s SilverScript PDP business.
Overview of the Corporate/Other Segment
The Company presents the remainder of its financial results in the Corporate/Other segment, which consists of:
• | Management and administrative expenses to support the overall operations of the Company, which include certain aspects of executive management and the corporate relations, legal, compliance, human resources, information technology and finance departments, expenses associated with the Company’s investments in its transformation and Enterprise modernization programs and acquisition-related transaction and integration costs; and |
• | Products for which the Company no longer solicits or accepts new customers such as large case pensions and long-term care insurance products. |
59
Results of Operations
The following information summarizes the Company’s results of operations for 2019 compared to 2018. For discussion of the Company’s results of operations for 2018 compared to 2017, see “Management’s Discussion and Analysis of Financial Condition and Results of Operations with Retrospective Application of Segments” for the year ended December 31, 2018, which was revised to reflect the Company’s segment realignment and is included in Exhibit 99.2 to the Company’s Current Report on Form 8-K filed with the U.S. Securities and Exchange Commission (the “SEC”) on August 8, 2019.
Summary of Consolidated Financial Results
Change | |||||||||||||||||||||||||
Year Ended December 31, | 2019 vs. 2018 | 2018 vs. 2017 | |||||||||||||||||||||||
In millions | 2019 | 2018 | 2017 | $ | % | $ | % | ||||||||||||||||||
Revenues: | |||||||||||||||||||||||||
Products | $ | 185,236 | $ | 183,910 | $ | 180,063 | $ | 1,326 | 0.7 | % | $ | 3,847 | 2.1 | % | |||||||||||
Premiums | 63,122 | 8,184 | 3,558 | 54,938 | 671.3 | % | 4,626 | 130.0 | % | ||||||||||||||||
Services | 7,407 | 1,825 | 1,144 | 5,582 | 305.9 | % | 681 | 59.5 | % | ||||||||||||||||
Net investment income | 1,011 | 660 | 21 | 351 | 53.2 | % | 639 | 3,042.9 | % | ||||||||||||||||
Total revenues | 256,776 | 194,579 | 184,786 | 62,197 | 32.0 | % | 9,793 | 5.3 | % | ||||||||||||||||
Operating costs: | |||||||||||||||||||||||||
Cost of products sold | 158,719 | 156,447 | 153,448 | 2,272 | 1.5 | % | 2,999 | 2.0 | % | ||||||||||||||||
Benefit costs | 52,529 | 6,594 | 2,810 | 45,935 | 696.6 | % | 3,784 | 134.7 | % | ||||||||||||||||
Goodwill impairments | — | 6,149 | 181 | (6,149 | ) | (100.0 | )% | 5,968 | 3,297.2 | % | |||||||||||||||
Operating expenses | 33,541 | 21,368 | 18,809 | 12,173 | 57.0 | % | 2,559 | 13.6 | % | ||||||||||||||||
Total operating costs | 244,789 | 190,558 | 175,248 | 54,231 | 28.5 | % | 15,310 | 8.7 | % | ||||||||||||||||
Operating income | 11,987 | 4,021 | 9,538 | 7,966 | 198.1 | % | (5,517 | ) | (57.8 | )% | |||||||||||||||
Interest expense | 3,035 | 2,619 | 1,062 | 416 | 15.9 | % | 1,557 | 146.6 | % | ||||||||||||||||
Loss on early extinguishment of debt | 79 | — | — | 79 | 100.0 | % | — | — | % | ||||||||||||||||
Other expense (income) | (124 | ) | (4 | ) | 208 | (120 | ) | (3,000.0 | )% | (212 | ) | (101.9 | )% | ||||||||||||
Income before income tax provision | 8,997 | 1,406 | 8,268 | 7,591 | 539.9 | % | (6,862 | ) | (83.0 | )% | |||||||||||||||
Income tax provision | 2,366 | 2,002 | 1,637 | 364 | 18.2 | % | 365 | 22.3 | % | ||||||||||||||||
Income (loss) from continuing operations | 6,631 | (596 | ) | 6,631 | 7,227 | 1,212.6 | % | (7,227 | ) | (109.0 | )% | ||||||||||||||
Loss from discontinued operations, net of tax | — | — | (8 | ) | — | — | % | 8 | 100.0 | % | |||||||||||||||
Net income (loss) | 6,631 | (596 | ) | 6,623 | 7,227 | 1,212.6 | % | (7,219 | ) | (109.0 | )% | ||||||||||||||
Net (income) loss attributable to noncontrolling interests | 3 | 2 | (1 | ) | 1 | 50.0 | % | 3 | 300.0 | % | |||||||||||||||
Net income (loss) attributable to CVS Health | $ | 6,634 | $ | (594 | ) | $ | 6,622 | $ | 7,228 | 1,216.8 | % | $ | (7,216 | ) | (109.0 | )% | |||||||||
Commentary - 2019 compared to 2018
Revenues
• | Total revenues increased $62.2 billion or 32.0% in 2019 compared to 2018. The increase in total revenues was primarily due to the impact of the Aetna Acquisition (primarily reflected in the Health Care Benefits segment) which occurred in November 2018, a 5.0% increase in Pharmacy Services segment revenue and a 3.1% increase in Retail/LTC segment revenue. |
• | Please see “Segment Analysis” later in this MD&A for additional information about the revenues of the Company’s segments. |
Operating expenses
• | Operating expenses increased $12.2 billion or 57.0% in 2019 compared to 2018. Operating expenses as a percentage of total revenues were 13.1% in 2019, an increase of 210 basis points compared to 2018. The increase in operating expenses was primarily due to the impact of the Aetna Acquisition (including intangible asset amortization) and higher operating |
60
expenses in the Retail/LTC segment, including $231 million of store rationalization charges and the $205 million pre-tax loss on the sale of the Company’s Brazilian subsidiary, Drogaria Onofre Ltda. (“Onofre”), both recorded in the year ended December 31, 2019.
• | Please see “Segment Analysis” later in this MD&A for additional information about the operating expenses of the Company’s segments. |
Operating income
• | Operating income increased $8.0 billion in 2019 compared to 2018. The increase was primarily due to (i) the absence of the $6.1 billion of pre-tax goodwill impairment charges related to the LTC reporting unit recorded within the Retail/LTC segment in 2018, (ii) the impact of the Aetna Acquisition and (iii) increased prescription volume and improved purchasing economics in the Pharmacy Services and Retail/LTC segments. The increase was partially offset by: |
•Continued reimbursement pressure in the Retail/LTC segment;
•Continued price compression in the Pharmacy Services segment;
•An increase in intangible asset amortization primarily related to the Aetna Acquisition;
• | Higher operating expenses in the Retail/LTC segment, including $231 million of store rationalization charges and the $205 million pre-tax loss on the sale of Onofre; and |
• | The absence of $536 million in interest income on the proceeds from the financing for the Aetna Acquisition recorded in the year ended December 31, 2018. |
• | Please see “Segment Analysis” later in this MD&A for additional information about the operating income of the Company’s segments. |
Interest expense
• | Interest expense increased $416 million in 2019 compared to 2018, primarily due to financing activity associated with the Aetna Acquisition and the assumption of Aetna’s debt as of the Aetna Acquisition Date. See Note 8 ‘‘Borrowings and Credit Agreements’’ included in Item 8 of this 10-K for additional information. |
Loss on early extinguishment of debt
• | During 2019, the loss on early extinguishment of debt relates to the Company’s repayment of $4.0 billion of its outstanding senior notes pursuant to its tender offers for such senior notes in August 2019, which resulted in a loss on early extinguishment of debt of $79 million. See Note 8 ‘‘Borrowings and Credit Agreements’’ included in Item 8 of this 10-K for additional information. |
Other income
• | Other income increased $120 million in 2019 compared to 2018. Other income represents pension plan asset returns in excess of interest cost on pension plan obligations. The increase in other income in 2019 was primarily due to 2019 including a full year of income associated with the Aetna pension plan, as compared to 2018 which only included the Aetna pension plan income for the period subsequent to the Aetna Acquisition Date. |
Income tax provision
• | The Company’s effective income tax rate was 26.3% in 2019 compared to 142.4% in 2018. The decrease in the effective income tax rate was primarily due to the absence of the $6.1 billion of pre-tax goodwill impairment charges recorded during 2018, the majority of which were not deductible for income tax purposes. |
Loss from discontinued operations
• | In connection with certain business dispositions completed between 1995 and 1997, the Company retained guarantees on store lease obligations for a number of former subsidiaries, including Linens ‘n Things, which filed for bankruptcy in 2008, and Bob’s Stores, which filed for bankruptcy in 2016. The Company’s loss from discontinued operations primarily includes lease-related costs required to satisfy its Linens ‘n Things and Bob’s Stores lease guarantees. |
• | See “Discontinued Operations” in Note 1 ‘‘Significant Accounting Policies’’ and “Lease Guarantees” in Note 16 ‘‘Commitments and Contingencies’’ included in Item 8 of this 10-K for additional information about the Company’s discontinued operations and the Company’s lease guarantees, respectively. |
61
Outlook for 2020
With respect to 2020, the Company believes you should consider the following important information:
• | The Pharmacy Services segment is expected to benefit from continued improvements in purchasing economics and Enterprise modernization, partially offset by net selling season losses during 2020 and continued price compression. |
• | The Retail/LTC segment is expected to benefit from projected adjusted script growth driven by the continued successful execution of patient care programs, partially offset by continued reimbursement pressure. |
• | The Health Care Benefits segment is expected to benefit from Government Services membership growth including projected above-industry growth in its Medicare Advantage products and new Medicaid contract wins, as well as integration synergies that will continue to disproportionately benefit the Health Care Benefits segment. |
• | The Patient Protection and Affordable Care Act and the Health Care and Education Reconciliation Act of 2010 (collectively, the “ACA”) imposes a significant industry-wide fee known as the Health Insurer Fee (the “HIF”). The HIF is non-deductible for federal income tax purposes and is allocated to insurers based on the ratio of the amount of an insurer’s net premium revenues written during the preceding calendar year to the amount of health insurance premium for all U.S. health risk for certain lines of business during the preceding calendar year. The HIF was suspended for 2019, will be $15.5 billion for 2020 and has been repealed for calendar years after 2020. While the Company expects the reintroduction of the HIF to result in a lower medical benefit ratio (“MBR”) in 2020 compared to 2019, all else being equal, the Company expects its 2020 consolidated net income will be negatively impacted due to an increase in its effective income tax rate in 2020 compared to 2019 as a result of the non-deductibility of the HIF. |
• | The Company believes that it is on track to achieve its 2020 target of $800-900 million of synergies from the Aetna Acquisition. |
• | The Company expects changes to its business environment to continue for the next several years as elected and other government officials at the national and state levels continue to propose and enact significant modifications to public policy and existing laws and regulations that govern the Company’s businesses. |
The Company’s current expectations described above are forward-looking statements. Please see “Risk Factors” in Item 1A of this 10-K for information regarding important factors that may cause the Company’s actual results to differ from those currently projected and/or otherwise materially affect the Company.
62
Segment Analysis
The following discussion of segment operating results is presented based on the Company’s reportable segments in accordance with the accounting guidance for segment reporting and is consistent with the segment disclosure in Note 17 ‘‘Segment Reporting’’ included in Item 8 of this 10-K.
The Company has three operating segments, Pharmacy Services, Retail/LTC and Health Care Benefits, as well as a Corporate/Other segment. The Company’s segments maintain separate financial information, and the CODM evaluates the segments’ operating results on a regular basis in deciding how to allocate resources among the segments and in assessing segment performance. The CODM evaluates the performance of the Company’s segments based on adjusted operating income. Effective for the first quarter of 2019, adjusted operating income is defined as operating income (GAAP measure) excluding the impact of amortization of intangible assets and other items, if any, that neither relate to the ordinary course of the Company’s business nor reflect the Company’s underlying business performance. Segment financial information has been retrospectively adjusted to conform with the current period presentation. See the reconciliations of operating income (GAAP measure) to adjusted operating income below for further context regarding the items excluded from operating income in determining adjusted operating income. The Company uses adjusted operating income as its principal measure of segment performance as it enhances the Company’s ability to compare past financial performance with current performance and analyze underlying business performance and trends. Non-GAAP financial measures the Company discloses, such as consolidated adjusted operating income, should not be considered a substitute for, or superior to, financial measures determined or calculated in accordance with GAAP.
Effective for the first quarter of 2019, the Company realigned the composition of its segments to correspond with changes to its operating model and reflect how the CODM reviews information and manages the business. See Note 1 ‘‘Significant Accounting Policies’’ included in Item 8 of this 10-K for further discussion of this realignment. Segment financial information has been retrospectively adjusted to reflect these changes.
The following is a reconciliation of financial measures of the Company’s segments to the consolidated totals:
In millions | Pharmacy Services (1) | Retail/ LTC | Health Care Benefits | Corporate/ Other | Intersegment Eliminations (2) | Consolidated Totals | |||||||||||||||||
2019 | |||||||||||||||||||||||
Total revenues | $ | 141,491 | $ | 86,608 | $ | 69,604 | $ | 512 | $ | (41,439 | ) | $ | 256,776 | ||||||||||
Adjusted operating income (loss) | 5,129 | 6,705 | 5,202 | (1,000 | ) | (697 | ) | 15,339 | |||||||||||||||
2018 | |||||||||||||||||||||||
Total revenues | 134,736 | 83,989 | 8,962 | 606 | (33,714 | ) | 194,579 | ||||||||||||||||
Adjusted operating income (loss) | 4,955 | 7,403 | 528 | (856 | ) | (769 | ) | 11,261 | |||||||||||||||
2017 | |||||||||||||||||||||||
Total revenues | 130,822 | 79,398 | 3,587 | 16 | (29,037 | ) | 184,786 | ||||||||||||||||
Adjusted operating income (loss) | 4,628 | 7,475 | 359 | (896 | ) | (741 | ) | 10,825 | |||||||||||||||
_____________________________________________
(1) | Total revenues of the Pharmacy Services segment include approximately $11.5 billion, $11.4 billion and $10.8 billion of retail co-payments for 2019, 2018 and 2017, respectively. See Note 1 ‘‘Significant Accounting Policies’’ included in Item 8 of this 10-K for additional information about retail co-payments. |
(2) | Intersegment eliminations relate to intersegment revenue generating activities that occur between the Pharmacy Services segment, the Retail/LTC segment and/or the Health Care Benefits segment. |
63
The following is a reconciliation of operating income to adjusted operating income for the years ended December 31, 2019, 2018 and 2017:
Year Ended December 31, 2019 | |||||||||||||||||||||||
In millions | Pharmacy Services | Retail/ LTC | Health Care Benefits | Corporate/ Other | Intersegment Eliminations | Consolidated Totals | |||||||||||||||||
Operating income (loss) (GAAP measure) | $ | 4,735 | $ | 5,793 | $ | 3,639 | $ | (1,483 | ) | $ | (697 | ) | $ | 11,987 | |||||||||
Non-GAAP adjustments: | |||||||||||||||||||||||
Amortization of intangible assets (1) | 394 | 476 | 1,563 | 3 | — | 2,436 | |||||||||||||||||
Acquisition-related integration costs (2) | — | — | — | 480 | — | 480 | |||||||||||||||||
Store rationalization charges (3) | — | 231 | — | — | — | 231 | |||||||||||||||||
Loss on divestiture of subsidiary (4) | — | 205 | — | — | — | 205 | |||||||||||||||||
Adjusted operating income (loss) | $ | 5,129 | $ | 6,705 | $ | 5,202 | $ | (1,000 | ) | $ | (697 | ) | $ | 15,339 | |||||||||
Year Ended December 31, 2018 | |||||||||||||||||||||||
In millions | Pharmacy Services | Retail/ LTC | Health Care Benefits | Corporate/ Other | Intersegment Eliminations | Consolidated Totals | |||||||||||||||||
Operating income (loss) (GAAP measure) | $ | 4,607 | $ | 620 | $ | 368 | $ | (805 | ) | $ | (769 | ) | $ | 4,021 | |||||||||
Non-GAAP adjustments: | |||||||||||||||||||||||
Amortization of intangible assets (1) | 348 | 498 | 160 | — | — | 1,006 | |||||||||||||||||
Acquisition-related transaction and integration costs (2) | — | 7 | — | 485 | — | 492 | |||||||||||||||||
Loss on divestiture of subsidiary (4) | — | 86 | — | — | — | 86 | |||||||||||||||||
Goodwill impairments (5) | — | 6,149 | — | — | — | 6,149 | |||||||||||||||||
Impairment of long-lived assets (6) | — | 43 | — | — | — | 43 | |||||||||||||||||
Interest income on financing for the Aetna Acquisition (7) | — | — | — | (536 | ) | — | (536 | ) | |||||||||||||||
Adjusted operating income (loss) | $ | 4,955 | $ | 7,403 | $ | 528 | $ | (856 | ) | $ | (769 | ) | $ | 11,261 | |||||||||
64
Year Ended December 31, 2017 | |||||||||||||||||||||||
In millions | Pharmacy Services | Retail/ LTC | Health Care Benefits | Corporate/ Other | Intersegment Eliminations | Consolidated Totals | |||||||||||||||||
Operating income (loss) (GAAP measure) | $ | 4,300 | $ | 6,558 | $ | 357 | $ | (936 | ) | $ | (741 | ) | $ | 9,538 | |||||||||
Non-GAAP adjustments: | |||||||||||||||||||||||
Amortization of intangible assets (1) | 328 | 487 | 2 | — | — | 817 | |||||||||||||||||
Acquisition-related transaction and integration costs (2) | — | 34 | — | 31 | — | 65 | |||||||||||||||||
Store rationalization charges (3) | — | 215 | — | — | — | 215 | |||||||||||||||||
Loss on divestiture of subsidiary (4) | — | — | — | 9 | — | 9 | |||||||||||||||||
Goodwill impairments (5) | — | 181 | — | — | — | 181 | |||||||||||||||||
Adjusted operating income (loss) | $ | 4,628 | $ | 7,475 | $ | 359 | $ | (896 | ) | $ | (741 | ) | $ | 10,825 | |||||||||
_____________________________________________
(1) | The Company’s acquisition activities have resulted in the recognition of intangible assets as required under the acquisition method of accounting which consist primarily of trademarks, customer contracts/relationships, covenants not to compete, technology, provider networks and value of business acquired. Definite-lived intangible assets are amortized over their estimated useful lives and are tested for impairment when events indicate that the carrying value may not be recoverable. The amortization of intangible assets is reflected in the Company’s statements of operations in operating expenses within each segment. Although intangible assets contribute to the Company’s revenue generation, the amortization of intangible assets does not directly relate to the underwriting of the Company’s insurance products, the services performed for the Company’s customers or the sale of the Company’s products or services. Additionally, intangible asset amortization expense typically fluctuates based on the size and timing of the Company’s acquisition activity. Accordingly, the Company believes excluding the amortization of intangible assets enhances the Company’s and investors’ ability to compare the Company’s past financial performance with its current performance and to analyze underlying business performance and trends. Intangible asset amortization excluded from the related non-GAAP financial measure represents the entire amount recorded within the Company’s GAAP financial statements, and the revenue generated by the associated intangible assets has not been excluded from the related non-GAAP financial measure. Intangible asset amortization is excluded from the related non-GAAP financial measure because the amortization, unlike the related revenue, is not affected by operations of any particular period unless an intangible asset becomes impaired or the estimated useful life of an intangible asset is revised. |
(2) | In 2019, 2018 and 2017, acquisition-related transaction and integration costs relate to the Aetna Acquisition. In 2018 and 2017, acquisition-related transaction and integration costs also relate to the acquisition of Omnicare, Inc. (“Omnicare”). The acquisition-related transaction and integration costs are reflected in the Company’s consolidated statements of operations in operating expenses within the Corporate/Other segment and the Retail/LTC segment. |
(3) | In 2019, the store rationalization charges relate to the planned closure of 46 underperforming retail pharmacy stores during the second quarter of 2019 and the planned closure of 22 underperforming retail pharmacy stores during the first quarter of 2020. In 2019, the store rationalization charges primarily relate to operating lease right-of-use asset impairment charges and are reflected in the Company’s consolidated statements of operations in operating expenses within the Retail/LTC segment. In 2017, the store rationalization charges related to the Company’s enterprise streamlining initiative and are reflected in the Company’s consolidated statements of operations in operating expenses within the Retail/LTC segment. |
(4) | In 2019, the loss on divestiture of subsidiary represents the pre-tax loss on the sale of Onofre, which occurred on July 1, 2019. The loss on divestiture primarily relates to the elimination of the cumulative translation adjustment from accumulated other comprehensive income. In 2018, the loss on divestiture of subsidiary represents the pre-tax loss on the sale of the Company’s RxCrossroads subsidiary for $725 million on January 2, 2018. In 2017, the loss on divestiture of subsidiary represents transaction costs associated with the sale of RxCrossroads. The loss on divestiture of subsidiary costs are reflected in the Company’s consolidated statements of operations in operating expenses within the Retail/LTC segment and Corporate/Other segment. |
(5) | In 2018, the goodwill impairments relate to the LTC reporting unit within the Retail/LTC segment. In 2017, the goodwill impairments relate to the RxCrossroads reporting unit within the Retail/LTC segment. |
(6) | In 2018, impairment of long-lived assets primarily relates to the impairment of property and equipment within the Retail/LTC segment and is reflected in operating expenses in the Company’s consolidated statements of operations. |
(7) | In 2018, the Company recorded interest income of $536 million on the proceeds of the $40 billion of unsecured senior notes it issued in March 2018 to partially fund the Aetna Acquisition. All amounts are for the periods prior to the close of the Aetna Acquisition, which occurred on November 28, 2018, and were recorded within the Corporate/Other segment. |
65
Pharmacy Services Segment
The following table summarizes the Pharmacy Services segment’s performance for the respective periods:
Change | |||||||||||||||||||||||||
Year Ended December 31, | 2019 vs. 2018 | 2018 vs. 2017 | |||||||||||||||||||||||
In millions, except percentages | 2019 | 2018 | 2017 | $ | % | $ | % | ||||||||||||||||||
Revenues: | |||||||||||||||||||||||||
Products | $ | 140,946 | $ | 134,285 | $ | 130,578 | $ | 6,661 | 5.0 | % | $ | 3,707 | 2.8 | % | |||||||||||
Services | 545 | 451 | 244 | 94 | 20.8 | % | 207 | 84.8 | % | ||||||||||||||||
Total revenues | 141,491 | 134,736 | 130,822 | 6,755 | 5.0 | % | 3,914 | 3.0 | % | ||||||||||||||||
Cost of products sold | 135,245 | 128,777 | 125,273 | 6,468 | 5.0 | % | 3,504 | 2.8 | % | ||||||||||||||||
Operating expenses | 1,511 | 1,352 | 1,249 | 159 | 11.8 | % | 103 | 8.2 | % | ||||||||||||||||
Operating expenses as a % of total revenues | 1.1 | % | 1.0 | % | 1.0 | % | |||||||||||||||||||
Operating income | $ | 4,735 | $ | 4,607 | $ | 4,300 | $ | 128 | 2.8 | % | $ | 307 | 7.1 | % | |||||||||||
Operating income as a % of total revenues | 3.3 | % | 3.4 | % | 3.3 | % | |||||||||||||||||||
Adjusted operating income (1) | $ | 5,129 | $ | 4,955 | $ | 4,628 | $ | 174 | 3.5 | % | $ | 327 | 7.1 | % | |||||||||||
Adjusted operating income as a % of total revenues | 3.6 | % | 3.7 | % | 3.5 | % | |||||||||||||||||||
Revenues (by distribution channel): | |||||||||||||||||||||||||
Pharmacy network (2) (3) | $ | 88,755 | $ | 87,167 | $ | 84,677 | $ | 1,588 | 1.8 | % | $ | 2,490 | 2.9 | % | |||||||||||
Mail choice (3) (4) | 52,141 | 47,049 | 45,731 | 5,092 | 10.8 | % | 1,318 | 2.9 | % | ||||||||||||||||
Other | 595 | 520 | 414 | 75 | 14.4 | % | 106 | 25.6 | % | ||||||||||||||||
Pharmacy claims processed: (5) | |||||||||||||||||||||||||
Total | 2,014.2 | 1,889.8 | 1,781.9 | 124.4 | 6.6 | % | 107.9 | 6.1 | % | ||||||||||||||||
Pharmacy network (2) | 1,704.0 | 1,601.4 | 1,516.7 | 102.6 | 6.4 | % | 84.7 | 5.6 | % | ||||||||||||||||
Mail choice (4) | 310.2 | 288.4 | 265.2 | 21.8 | 7.6 | % | 23.2 | 8.7 | % | ||||||||||||||||
Generic dispensing rate: (5) | |||||||||||||||||||||||||
Total | 88.2 | % | 87.3 | % | 87.0 | % | |||||||||||||||||||
Pharmacy network (2) | 88.7 | % | 87.9 | % | 87.7 | % | |||||||||||||||||||
Mail choice (4) | 85.1 | % | 83.9 | % | 83.1 | % | |||||||||||||||||||
Mail choice penetration rate (4) (5) | 15.4 | % | 15.3 | % | 14.9 | % | |||||||||||||||||||
_____________________________________________
(1) | See “Segment Analysis” above in this MD&A for a reconciliation of operating income (GAAP measure) to adjusted operating income for the Pharmacy Services segment. |
(2) | Pharmacy network revenues, pharmacy claims processed and generic dispensing rate do not include Maintenance Choice® activity, which is included within the mail choice category. Pharmacy network is defined as claims filled at retail and specialty retail pharmacies, including the Company’s retail pharmacies and LTC pharmacies, but excluding Maintenance Choice activity, which is included within the mail choice category. Maintenance choice permits eligible client plan members to fill their maintenance prescriptions through mail order delivery or at a CVS pharmacy retail store for the same price as mail order. |
(3) | Certain prior year amounts have been reclassified for consistency with the current period presentation. |
(4) | Mail choice is defined as claims filled at a Pharmacy Services mail order facility, which includes specialty mail claims inclusive of Specialty Connect® claims picked up at a retail pharmacy, as well as prescriptions filled at the Company’s retail pharmacies under the Maintenance Choice program. |
(5) | Includes an adjustment to convert 90-day prescriptions to the equivalent of three 30-day prescriptions. This adjustment reflects the fact that these prescriptions include approximately three times the amount of product days supplied compared to a normal prescription. |
66
Commentary - 2019 compared to 2018
Revenues
• | Total revenues increased $6.8 billion, or 5.0%, to $141.5 billion in 2019 compared to 2018. The increase was primarily due to brand inflation as well as increased total pharmacy claims volume, partially offset by continued price compression and an increased generic dispensing rate. |
• | As you review the Pharmacy Services segment’s performance in this area, you should consider the following important information about the business: |
• | The Company’s mail choice claims processed, on a 30-day equivalent basis, increased 7.6% to 310.2 million claims in 2019 compared to 288.4 million claims in 2018. The increase in mail choice claims was primarily driven by the continued adoption of Maintenance Choice offerings. |
• | During 2019, the average revenue per mail choice claim, on a 30-day equivalent basis, increased by 3.0% compared to 2018 primarily due to growth in specialty pharmacy claims processed. |
• | The Company’s pharmacy network claims processed, on a 30-day equivalent basis, increased 6.4% to 1.7 billion claims in 2019 compared to 1.6 billion claims in 2018. The increase in the pharmacy network claim volume was primarily due to net new business, including the onboarding of Anthem, Inc.’s (“Anthem’s”) PBM, IngenioRx, during 2019. |
• | During 2019, the average revenue per pharmacy network claim processed, on a 30-day equivalent basis, decreased 4.2% compared to 2018 as a result of continued price compression. |
• | The segment’s total generic dispensing rate increased to 88.2% in 2019 compared to 87.3% in 2018. The continued increase in the segment’s generic dispensing rate was primarily due to the impact of new generic drug introductions and the Company’s ongoing efforts to encourage plan members to use generic drugs when they are available and clinically appropriate. The Company believes its generic dispensing rate will continue to increase in future periods, albeit at a slower pace. This increase will be affected by, among other things, the number of new brand and generic drug introductions and the Company’s success at encouraging plan members to utilize generic drugs when they are available and clinically appropriate. |
Operating expenses
• | Operating expenses in the Pharmacy Services segment include selling, general and administrative expenses; depreciation and amortization related to selling, general and administrative activities; and expenses related to specialty retail pharmacies, which include store and administrative payroll, employee benefits and occupancy costs. |
• | Operating expenses increased $159 million, or 11.8%, in 2019 compared to 2018. The increase in operating expenses was primarily due to growth in the business, including operating expenses associated with Aetna’s mail order and specialty pharmacy operations (including intangible asset amortization) and investments related to the Company’s agreement with Anthem’s PBM, IngenioRx, during 2019. |
• | Operating expenses as a percentage of total revenues remained relatively consistent at 1.1% and 1.0% in 2019 and 2018, respectively. |
Operating income and adjusted operating income
• | Operating income increased $128 million, or 2.8%, and adjusted operating income increased $174 million, or 3.5%, in 2019 compared to 2018. The increase in both operating income and adjusted operating income was primarily driven by increased claims volume, the addition of Aetna’s mail order and specialty pharmacy operations and improved purchasing economics, partially offset by continued price compression. The increase in operating income also was partially offset by increased intangible asset amortization related to Aetna’s mail order and specialty pharmacy operations. |
• | As you review the Pharmacy Services segment’s performance in this area, you should consider the following important information about the business: |
• | The Company’s efforts to (i) retain existing clients, (ii) obtain new business and (iii) maintain or improve the rebates and/or discounts the Company receives from manufacturers, wholesalers and retail pharmacies continue to have an impact on operating income and adjusted operating income. In particular, competitive pressures in the PBM industry have caused the Company and other PBMs to continue to share with clients a larger portion of rebates and/or discounts received from pharmaceutical manufacturers. In addition, marketplace dynamics and regulatory changes have limited the Company’s ability to offer plan sponsors pricing that includes retail network “differential” or “spread,” and the Company expects these trends to continue. The “differential” or “spread” is any difference between the drug price charged to plan sponsors, including Medicare Part D plan sponsors, by a PBM and the price paid for the drug by the PBM to the dispensing provider. |
67
Retail/LTC Segment
The following table summarizes the Retail/LTC segment’s performance for the respective periods:
Change | |||||||||||||||||||||||||
Year Ended December 31, | 2019 vs. 2018 | 2018 vs. 2017 | |||||||||||||||||||||||
In millions, except percentages | 2019 | 2018 | 2017 | $ | % | $ | % | ||||||||||||||||||
Revenues: | |||||||||||||||||||||||||
Products | $ | 85,729 | $ | 83,175 | $ | 78,522 | $ | 2,554 | 3.1 | % | $ | 4,653 | 5.9 | % | |||||||||||
Services | 879 | 814 | 876 | 65 | 8.0 | % | (62 | ) | (7.1 | )% | |||||||||||||||
Total revenues | 86,608 | 83,989 | 79,398 | 2,619 | 3.1 | % | 4,591 | 5.8 | % | ||||||||||||||||
Cost of products sold | 62,688 | 59,906 | 56,066 | 2,782 | 4.6 | % | 3,840 | 6.8 | % | ||||||||||||||||
Goodwill impairments | — | 6,149 | 181 | (6,149 | ) | (100.0 | )% | 5,968 | 3,297.2 | % | |||||||||||||||
Operating expenses | 18,127 | 17,314 | 16,593 | 813 | 4.7 | % | 721 | 4.3 | % | ||||||||||||||||
Operating expenses as a % of total revenues | 20.9 | % | 20.6 | % | 20.9 | % | |||||||||||||||||||
Operating income | $ | 5,793 | $ | 620 | $ | 6,558 | $ | 5,173 | 834.4 | % | $ | (5,938 | ) | (90.5 | )% | ||||||||||
Operating income as a % of total revenues | 6.7 | % | 0.7 | % | 8.3 | % | |||||||||||||||||||
Adjusted operating income (1) | $ | 6,705 | $ | 7,403 | $ | 7,475 | $ | (698 | ) | (9.4 | )% | $ | (72 | ) | (1.0 | )% | |||||||||
Adjusted operating income as a % of total revenues | 7.7 | % | 8.8 | % | 9.4 | % | |||||||||||||||||||
Revenues (by major goods/service lines): | |||||||||||||||||||||||||
Pharmacy | $ | 66,442 | $ | 64,179 | $ | 59,528 | $ | 2,263 | 3.5 | % | $ | 4,651 | 7.8 | % | |||||||||||
Front Store | 19,422 | 19,055 | 18,769 | 367 | 1.9 | % | 286 | 1.5 | % | ||||||||||||||||
Other | 744 | 755 | 1,101 | (11 | ) | (1.5 | )% | (346 | ) | (31.4 | )% | ||||||||||||||
Prescriptions filled (2) | 1,417.2 | 1,339.1 | 1,230.5 | 78.1 | 5.8 | % | 108.6 | 8.8 | % | ||||||||||||||||
Revenues increase (decrease): | |||||||||||||||||||||||||
Total | 3.1 | % | 5.8 | % | (2.1 | )% | |||||||||||||||||||
Pharmacy | 3.5 | % | 7.8 | % | (2.2 | )% | |||||||||||||||||||
Front Store | 1.9 | % | 1.5 | % | (1.9 | )% | |||||||||||||||||||
Total prescription volume increase (2) | 5.8 | % | 8.8 | % | 0.6 | % | |||||||||||||||||||
Same store sales increase (decrease): (3) | |||||||||||||||||||||||||
Total | 3.7 | % | 6.0 | % | (2.6 | )% | |||||||||||||||||||
Pharmacy | 4.5 | % | 7.9 | % | (2.6 | )% | |||||||||||||||||||
Front Store | 1.1 | % | 0.5 | % | (2.6 | )% | |||||||||||||||||||
Prescription volume (2) | 7.2 | % | 9.1 | % | 0.4 | % | |||||||||||||||||||
Generic dispensing rate (2) | 88.3 | % | 87.5 | % | 87.3 | % | |||||||||||||||||||
_____________________________________________
(1) | See “Segment Analysis” above in this MD&A for a reconciliation of operating income (GAAP measure) to adjusted operating income for the Retail/LTC segment. |
(2) | Includes an adjustment to convert 90‑day prescriptions to the equivalent of three 30‑day prescriptions. This adjustment reflects the fact that these prescriptions include approximately three times the amount of product days supplied compared to a normal prescription. |
(3) | Same store sales and prescription volume exclude revenues from MinuteClinic, and revenue and prescriptions from stores in Brazil and LTC operations. |
Commentary - 2019 compared to 2018
Revenues
• | Total revenues increased approximately $2.6 billion, or 3.1%, to $86.6 billion in 2019 compared to 2018. The increase was primarily driven by increased prescription volume and brand inflation, partially offset by continued reimbursement pressure and an increased generic dispensing rate. |
68
• | As you review the Retail/LTC segment’s performance in this area, you should consider the following important information about the business: |
• | Front store same store sales increased 1.1% in 2019 compared to 2018. The increase in front store sales in 2019 was primarily driven by increases in health and beauty product sales. |
• | Pharmacy same store sales increased 4.5% in 2019 compared to 2018. The increase was primarily driven by the 7.2% increase in pharmacy same store prescription volumes on a 30-day equivalent basis driven mainly by (i) continued adoption of patient care programs, (ii) collaborations with PBMs and (iii) the Company’s preferred status in a number of Medicare Part D networks. |
• | Pharmacy revenue growth continues to be adversely affected by reimbursement pressure. Pharmacy revenue growth also continues to be adversely affected by the conversion of brand name drugs to equivalent generic drugs, which typically have a lower selling price. The segment’s generic dispensing rate grew to 88.3% in 2019 compared to 87.5% in 2018. |
• | Pharmacy revenue growth also continues to be adversely affected by industry challenges in the LTC business, such as continuing lower occupancy rates at skilled nursing facilities, as well as the deteriorating financial health of many skilled nursing facilities. |
• | Pharmacy revenue in 2019 continued to benefit from the Company’s ability to attract and retain managed care customers and the increased use of pharmaceuticals by an aging population as the first line of defense for health care. |
Operating expenses
• | Operating expenses in the Retail/LTC segment include store payroll, store employee benefits, store occupancy costs, selling expenses, advertising expenses, depreciation and amortization expense and certain administrative expenses. |
• | Operating expenses increased $813 million, or 4.7%, in 2019 compared to 2018, primarily due to the following: |
• | Store rationalization charges of $231 million recorded in 2019 primarily related to operating lease right-of-use asset impairment charges in connection with the planned closure of underperforming retail pharmacy stores during the second quarter of 2019 and the first quarter of 2020; |
• | The $205 million pre-tax loss on the sale of Onofre, which occurred on July 1, 2019; |
• | The increased prescription volume described above; and |
• | The investment of a portion of the savings from the Tax Cuts and Jobs Act (the “TCJA”) in wages and benefits. |
• | Operating expenses as a percentage of total revenues were 20.9% in 2019 compared to 20.6% in 2018. The increase in operating expenses as a percentage of total revenues was primarily driven by the increases in operating expenses described above. |
Operating income and adjusted operating income
• | Operating income increased $5.2 billion in 2019 compared to 2018. The increase in operating income was primarily due to the absence of the $6.1 billion of pre-tax goodwill impairment charges related to the LTC reporting unit recorded in the year ended December 31, 2018, partially offset by the decrease in adjusted operating income described below, as well as the $231 million of store rationalization charges and the $205 million pre-tax loss on the sale of Onofre, both recorded in 2019. |
• | Adjusted operating income decreased $698 million, or 9.4%, in 2019 compared to 2018. The decrease in adjusted operating income was primarily due to continued reimbursement pressure and increased operating expenses primarily driven by the investment of a portion of the savings from the TCJA in wages and benefits. The decrease was partially offset by increased prescription volume, an increased generic dispensing rate and improved purchasing economics. |
• | As you review the Retail/LTC segment’s performance in this area, you should consider the following important information about the business: |
• | The segment’s pharmacy operating income and adjusted operating income has been adversely affected by the efforts of managed care organizations, PBMs and governmental and other third-party payors to reduce their prescription drug costs, including the use of restrictive networks, as well as changes in the mix of business within the pharmacy portion of the Retail/LTC segment. If the reimbursement pressure accelerates, the segment may not be able grow revenues, and its operating income and adjusted operating income could be adversely affected. |
• | The increased use of generic drugs has positively impacted the segment’s operating income and adjusted operating income but has resulted in third-party payors augmenting their efforts to reduce reimbursement payments to retail pharmacies for prescriptions. This trend, which the Company expects to continue, reduces the benefit the segment realizes from brand to generic drug conversions. |
69
Health Care Benefits Segment
For periods prior to November 28, 2018 (the Aetna Acquisition Date), the Health Care Benefits segment was comprised of the Company’s SilverScript PDP business. The following table summarizes the Health Care Benefits segment’s performance for the respective periods:
Change | |||||||||||||||||||||||||
Year Ended December 31, | 2019 vs. 2018 | 2018 vs. 2017 | |||||||||||||||||||||||
In millions, except percentages | 2019 | 2018 | 2017 | $ | % | $ | % | ||||||||||||||||||
Revenues: | |||||||||||||||||||||||||
Products | $ | — | $ | 164 | $ | — | $ | (164 | ) | (100.0 | )% | $ | 164 | 100.0 | % | ||||||||||
Premiums | 63,031 | 8,180 | 3,558 | 54,851 | 670.6 | % | 4,622 | 129.9 | % | ||||||||||||||||
Services | 5,974 | 560 | 24 | 5,414 | 966.8 | % | 536 | 2,233.3 | % | ||||||||||||||||
Net investment income | 599 | 58 | 5 | 541 | 932.8 | % | 53 | 1,060.0 | % | ||||||||||||||||
Total revenues | 69,604 | 8,962 | 3,587 | 60,642 | 676.7 | % | 5,375 | 149.8 | % | ||||||||||||||||
Cost of products sold | — | 147 | — | (147 | ) | (100.0 | )% | 147 | 100.0 | % | |||||||||||||||
Benefit costs | 53,092 | 6,678 | 2,810 | 46,414 | 695.0 | % | 3,868 | 137.7 | % | ||||||||||||||||
MBR (Benefit costs as a % of premium revenues) (1) | 84.2 | % | NM | NM | |||||||||||||||||||||
Operating expenses | $ | 12,873 | $ | 1,769 | $ | 420 | $ | 11,104 | 627.7 | % | $ | 1,349 | 321.2 | % | |||||||||||
Operating expenses as a % of total revenues | 18.5 | % | 19.7 | % | 11.7 | % | |||||||||||||||||||
Operating income | $ | 3,639 | $ | 368 | $ | 357 | $ | 3,271 | 888.9 | % | $ | 11 | 3.1 | % | |||||||||||
Operating income as a % of total revenues | 5.2 | % | 4.1 | % | 10.0 | % | |||||||||||||||||||
Adjusted operating income (2) | $ | 5,202 | $ | 528 | $ | 359 | $ | 4,674 | 885.2 | % | $ | 169 | 47.1 | % | |||||||||||
Adjusted operating income as a % of total revenues | 7.5 | % | 5.9 | % | 10.0 | % | |||||||||||||||||||
_____________________________________________
(1) | For periods prior to the Aetna Acquisition Date, the Health Care Benefits segment was comprised of the Company’s SilverScript PDP business. Accordingly, the MBR for the years ended December 31, 2018 and 2017 are not meaningful (“NM”) and are not directly comparable to the MBRs for the year ended December 31, 2019. |
(2) | See “Segment Analysis” above in this MD&A for a reconciliation of operating income (GAAP measure) to adjusted operating income for the Health Care Benefits segment. |
Commentary - 2019 compared to 2018
Revenues
• | Total revenues increased $60.6 billion in 2019 compared to 2018 primarily due to the Aetna Acquisition. |
Operating expenses
• | Operating expenses in the Health Care Benefits segment include selling, general and administrative expenses and depreciation and amortization expenses. |
• | Operating expenses increased $11.1 billion in 2019 compared to 2018 primarily due to the Aetna Acquisition (including the amortization of intangible assets). |
Operating income and adjusted operating income
• | Operating income increased $3.3 billion and adjusted operating income increased $4.7 billion in 2019 compared to 2018. The increases were primarily due to the Aetna Acquisition. The increase in operating income was partially offset by increased intangible asset amortization related to the Aetna Acquisition. |
70
The following table summarizes the Health Care Benefits segment’s medical membership as of December 31, 2019 and 2018:
2019 | 2018 | ||||||||||||||||
In thousands | Insured | ASC | Total | Insured | ASC | Total | |||||||||||
Medical membership: | |||||||||||||||||
Commercial | 3,591 | 14,159 | 17,750 | 3,871 | 13,888 | 17,759 | |||||||||||
Medicare Advantage | 2,321 | — | 2,321 | 1,758 | — | 1,758 | |||||||||||
Medicare Supplement | 881 | — | 881 | 793 | — | 793 | |||||||||||
Medicaid | 1,398 | 558 | 1,956 | 1,128 | 663 | 1,791 | |||||||||||
Total medical membership | 8,191 | 14,717 | 22,908 | 7,550 | 14,551 | 22,101 | |||||||||||
Supplemental membership information: | |||||||||||||||||
Medicare Prescription Drug Plan (standalone) (1) | 5,994 | 6,134 | |||||||||||||||
_____________________________________________
(1) | Represents the Company’s SilverScript PDP membership only. Excludes 2.5 million and 2.3 million members as of December 31, 2019 and 2018, respectively, related to Aetna’s standalone PDPs that were sold effective December 31, 2018. The Company retained the financial results of the divested plans through 2019 through a reinsurance agreement. Subsequent to 2019, the Company will no longer retain the financial results of the divested plans. |
Medical Membership
Medical membership as of December 31, 2019 increased compared with December 31, 2018, reflecting increases in Medicare, Commercial ASC and Medicaid products, partially offset by declines in Commercial Insured products.
Medicare Update
On April 1, 2019, the U.S. Centers for Medicare & Medicaid Services (“CMS”) issued its final notice detailing final 2020 Medicare Advantage benchmark payment rates (the “Final Notice”). Overall the Company projects the benchmark rates in the Final Notice will increase funding for its Medicare Advantage business, excluding the impact of the health insurer fee, by approximately 2.0% in 2020 compared to 2019.
The ACA ties a portion of each Medicare Advantage plan’s reimbursement to the plan’s “star ratings.” Plans must have a star rating of four or higher (out of five) to qualify for bonus payments. CMS released the Company’s 2020 star ratings in October 2019. The Company’s 2020 star ratings will be used to determine which of the Company’s Medicare Advantage plans have ratings of four stars or higher and qualify for bonus payments in 2021. Based on the Company’s membership at December 31, 2019, 83% of the Company’s Medicare Advantage members were in plans with 2020 star ratings of at least 4.0 stars, compared to 79% of the Company’s Medicare Advantage members being in plans with 2019 star ratings of at least 4.0 stars based on the Company’s membership at December 31, 2018.
Corporate/Other Segment
Commentary - 2019 compared to 2018
Revenues
• | Total revenues decreased $94 million in 2019 compared to 2018. |
• | In 2019, revenues relate to products for which the Company no longer solicits or accepts new customers, such as large case pensions and long-term care insurance products, that were acquired in the Aetna Acquisition. Revenues in 2019 include $104 million of net realized capital gains, primarily related to the sale of debt securities and other invested assets that support these insurance products. In 2018, revenues relate to interest income on the proceeds from the financing of the Aetna Acquisition. |
Operating expenses
• | Operating expenses within the Corporate/Other segment include certain aspects of costs related to executive management and the corporate relations, legal, compliance, human resources, information technology and finance departments, expenses associated with the Company’s investments in its transformation and Enterprise modernization programs and acquisition-related transaction and integration costs. After the Aetna Acquisition Date, such operating expenses also include operating costs to support the large case pensions and long-term care insurance products acquired in the Aetna Acquisition. |
71
• | Operating expenses increased $321 million in 2019 compared to 2018. The increase was primarily driven by growth in the business, incremental operating expenses associated with the Company’s investments in transformation and Enterprise modernization, legal costs and a $30 million charitable contribution to the CVS Health Foundation in 2019. |
Liquidity and Capital Resources
Cash Flows
The Company maintains a level of liquidity sufficient to allow it to meet its cash needs in the short-term. Over the long term, the Company manages its cash and capital structure to maximize shareholder return, maintain its financial condition and maintain flexibility for future strategic initiatives. The Company continuously assesses its regulatory capital requirements, working capital needs, debt and leverage levels, debt maturity schedule, capital expenditure requirements, dividend payouts, potential share repurchases and future investments or acquisitions. The Company believes its operating cash flows, commercial paper program, credit facilities, sale-leaseback program, as well as any potential future borrowings, will be sufficient to fund these future payments and long-term initiatives. As of December 31, 2019, the Company had approximately $5.7 billion in cash and cash equivalents, approximately $1.7 billion of which was held by the parent company or nonrestricted subsidiaries.
The net change in cash, cash equivalents and restricted cash for the years ended December 31, 2019, 2018 and 2017 is as follows:
Change | |||||||||||||||||||||||||
Year Ended December 31, | 2019 vs. 2018 | 2018 vs. 2017 | |||||||||||||||||||||||
In millions | 2019 | 2018 | 2017 | $ | % | $ | % | ||||||||||||||||||
Net cash provided by operating activities | $ | 12,848 | $ | 8,865 | $ | 8,007 | $ | 3,983 | 44.9 | % | $ | 858 | 10.7 | % | |||||||||||
Net cash used in investing activities | (3,339 | ) | (43,285 | ) | (2,877 | ) | 39,946 | (92.3 | )% | (40,408 | ) | 1,404.5 | % | ||||||||||||
Net cash provided by (used in) financing activities | (7,850 | ) | 36,819 | (6,751 | ) | (44,669 | ) | (121.3 | )% | 43,570 | (645.4 | )% | |||||||||||||
Effect of exchange rate changes on cash, cash equivalents and restricted cash | — | (4 | ) | 1 | 4 | (100.0 | )% | (5 | ) | (500.0 | )% | ||||||||||||||
Net increase (decrease) in cash, cash equivalents and restricted cash | $ | 1,659 | $ | 2,395 | $ | (1,620 | ) | $ | (736 | ) | (30.7 | )% | $ | 4,015 | (247.8 | )% | |||||||||
Commentary - 2019 compared to 2018
• | Net cash provided by operating activities increased by $4.0 billion in 2019 compared to 2018 due primarily to the Aetna Acquisition as well as improvements in working capital, including the timing of certain payables and receipts. |
• | Net cash used in investing activities decreased by $39.9 billion in 2019 compared to 2018 largely due to the Aetna Acquisition in November 2018. The decrease was partially offset by the absence of the $725 million in proceeds from the sale of RxCrossroads in 2018 and net purchases of investments in 2019 compared to net sales of investments in 2018. |
• | Net cash used in financing activities was $7.9 billion in 2019 compared to net cash provided by financing activities of $36.8 billion in 2018. The decrease in cash provided by financing activities primarily related to long-term borrowings during 2018 to partially fund the Aetna Acquisition, as well as debt repayments during 2019 including (i) the repayment of $4.0 billion of outstanding senior notes pursuant to tender offers for such outstanding senior notes, (ii) the repayment of the remaining $3.0 billion of the term loan used to partially fund the Aetna Acquisition and (iii) the repayment of $1.2 billion aggregate principal amount of senior notes upon maturity. The decrease was partially offset by the issuance of $3.5 billion of senior notes in 2019. |
72
Included in net cash used in investing activities for the years ended December 31, 2019, 2018 and 2017 was the following store development activity: (1)
2019 | 2018 | 2017 | ||||||
Total stores (beginning of year) | 9,967 | 9,846 | 9,750 | |||||
New and acquired stores (2) | 102 | 148 | 179 | |||||
Closed stores (2) | (128 | ) | (27 | ) | (83 | ) | ||
Total stores (end of year) | 9,941 | 9,967 | 9,846 | |||||
Relocated stores (2) | 23 | 34 | 30 | |||||
_____________________________________________
(1) | Includes retail drugstores, certain onsite pharmacy stores, retail specialty pharmacy stores and pharmacies within Target stores. |
(2) | Relocated stores are not included in new and acquired stores or closed stores totals. |
Short-term Borrowings
Commercial Paper and Back-up Credit Facilities
The Company did not have any commercial paper outstanding as of December 31, 2019. The Company had $720 million of commercial paper outstanding at a weighted average interest rate of 2.8% as of December 31, 2018. In connection with its commercial paper program, the Company maintains a $1.0 billion 364-day unsecured back-up revolving credit facility, which expires on May 14, 2020, a $1.0 billion, five-year unsecured back-up revolving credit facility, which expires on May 18, 2022, a $2.0 billion, five-year unsecured back-up revolving credit facility, which expires on May 17, 2023 and a $2.0 billion, five-year unsecured back-up revolving credit facility, which expires on May 16, 2024. The credit facilities allow for borrowings at various rates that are dependent, in part, on the Company’s public debt ratings and require the Company to pay a weighted average quarterly facility fee of approximately .03%, regardless of usage. As of December 31, 2019 and 2018, there were no borrowings outstanding under any of the Company’s back-up credit facilities.
Bridge Loan Facility
On December 3, 2017, in connection with the Aetna Acquisition, the Company entered into a $49.0 billion unsecured bridge loan facility commitment. The Company paid $221 million in fees upon entering into the agreement. The fees were capitalized in other current assets and were amortized as interest expense over the period the bridge loan facility commitment was outstanding. The bridge loan facility commitment was reduced to $44.0 billion on December 15, 2017 upon the Company entering into a $5.0 billion term loan agreement. The Company recorded $56 million of amortization of the bridge loan facility fees during the year ended December 31, 2017, which was recorded in interest expense in the consolidated statement of operations.
On March 9, 2018, the Company issued senior notes with an aggregate principal amount of $40.0 billion (see “Long-term Borrowings - 2018 Notes” below). At that time, the bridge loan facility commitment was reduced to $4.0 billion, and the Company paid $8 million in fees to retain the bridge loan facility commitment through the Aetna Acquisition Date. Those fees were capitalized in other current assets and were amortized as interest expense over the period the bridge loan facility commitment was outstanding. The Company recorded $173 million of amortization of the bridge loan facility commitment fees during the year ended December 31, 2018, which was recorded in interest expense in the consolidated statement of operations. On October 26, 2018, the Company entered into a $4.0 billion unsecured 364-day bridge term loan agreement to formalize the bridge loan facility discussed above. On November 28, 2018, in connection with the Aetna Acquisition, the $4.0 billion unsecured 364-day bridge term loan agreement terminated.
Federal Home Loan Bank of Boston
Since the Aetna Acquisition Date, a subsidiary of the Company is a member of the Federal Home Loan Bank of Boston (the “FHLBB”). As a member, the subsidiary has the ability to obtain cash advances, subject to certain minimum collateral requirements. The maximum borrowing capacity available from the FHLBB as of December 31, 2019 was approximately $850 million. At both December 31, 2019 and 2018, there were no outstanding advances from the FHLBB.
Long-term Borrowings
2019 Notes
On August 15, 2019, the Company issued $1.0 billion aggregate principal amount of 2.625% unsecured senior notes due August 15, 2024, $750 million aggregate principal amount of 3% unsecured senior notes due August 15, 2026 and $1.75 billion aggregate principal amount of 3.25% unsecured senior notes due August 15, 2029 (collectively, the “2019 Notes”) for total
73
proceeds of approximately $3.5 billion, net of discounts and underwriting fees. The net proceeds of the 2019 Notes were used to repay certain of the Company’s outstanding debt.
Beginning in July 2019, the Company entered into several interest rate swap and treasury lock transactions to manage interest rate risk. These agreements were designated as cash flow hedges and were used to hedge the exposure to variability in future cash flows resulting from changes in interest rates related to the anticipated issuance of the 2019 Notes. In connection with the issuance of the 2019 Notes, the Company terminated all outstanding cash flow hedges. The Company paid a net amount of $25 million to the hedge counterparties upon termination, which was recorded as a loss, net of tax, of $18 million in accumulated other comprehensive income and will be reclassified as interest expense over the life of the 2019 Notes. See Note 13 ‘‘Other Comprehensive Income’’ included in Item 8 of this 10-K for additional information.
Early Extinguishment of Debt
In August 2019, the Company purchased $4.0 billion of its outstanding senior notes through cash tender offers. The senior notes purchased included the following: $1.3 billion of its 3.125% senior notes due 2020, $723 million of its floating rate notes due 2020, $328 million of its 4.125% senior notes due 2021, $297 million of 4.125% senior notes due 2021 issued by Aetna, $413 million of 5.45% senior notes due 2021 issued by Coventry Health Care, Inc., a wholly-owned subsidiary of Aetna, and $962 million of its 3.35% senior notes due 2021. In connection with the purchase of such senior notes, the Company paid a premium of $76 million in excess of the aggregate principal amount of the senior notes that were purchased, incurred $8 million in fees and recognized a net gain of $5 million on the write-off of net unamortized deferred financing premiums, for a net loss on early extinguishment of debt of $79 million.
2018 Notes
On March 9, 2018, the Company issued an aggregate of $40.0 billion in principal amount of unsecured floating rate notes and unsecured fixed rate senior notes (collectively the “2018 Notes”) for total proceeds of approximately $39.4 billion, net of discounts and underwriting fees. The net proceeds of the 2018 Notes were used to fund a portion of the Aetna Acquisition. The 2018 Notes consisted of the following at the time of issuance:
In millions | |||
3.125% senior notes due March 2020 | $ | 2,000 | |
Floating rate notes due March 2020 | 1,000 | ||
3.35% senior notes due March 2021 | 3,000 | ||
Floating rate notes due March 2021 | 1,000 | ||
3.7% senior notes due March 2023 | 6,000 | ||
4.1% senior notes due March 2025 | 5,000 | ||
4.3% senior notes due March 2028 | 9,000 | ||
4.78% senior notes due March 2038 | 5,000 | ||
5.05% senior notes due March 2048 | 8,000 | ||
Total debt principal | $ | 40,000 | |
From December 2017 through March 2018, the Company entered into several interest rate swap and treasury lock transactions to manage interest rate risk. These agreements were designated as cash flow hedges and were used to hedge the exposure to variability in future cash flows resulting from changes in interest rates related to the anticipated issuance of long-term debt to fund the Aetna Acquisition.
In connection with the issuance of the 2018 Notes, the Company terminated all outstanding cash flow hedges. In connection with the hedge transactions, the Company received a net amount of $446 million from the hedge counterparties upon termination, which was recorded as a gain, net of tax, of $331 million in accumulated other comprehensive income and will be reclassified as a reduction of interest expense over the life of the 2018 Notes. See Note 13 ‘‘Other Comprehensive Income’’ included in Item 8 of this 10-K for additional information.
Term Loan Agreement
On December 15, 2017, in connection with the Aetna Acquisition, the Company entered into a $5.0 billion term loan agreement. The term loan agreement allowed for borrowings at various rates that were dependent, in part, on the Company’s debt ratings. In connection with the Aetna Acquisition, the Company borrowed $5.0 billion (a $3.0 billion three-year tranche and a $2.0 billion five-year tranche) under the term loan agreement in November 2018. The Company terminated the $2.0 billion five-year tranche in December 2018 with the repayment of the borrowing. The Company made principal payments of
74
$500 million in March 2019, $1.0 billion in May 2019 and $1.5 billion in July 2019 on the three-year tranche, and terminated the three-year tranche and the term loan agreement with the final repayment of the borrowing in July 2019, at which time the Company had repaid all term loans.
Aetna Related Debt
Upon the closing of the Aetna Acquisition, the Company assumed long-term debt with a fair value of $8.1 billion, with stated interest rates ranging from 2.2% to 6.75%.
See Note 8 ‘‘Borrowings and Credit Agreements’’ and Note 12 ‘‘Shareholders’ Equity’’ included in Item 8 of this 10-K for additional information about debt issuances, debt repayments, share repurchases and dividend payments.
Derivative Financial Instruments
The Company uses derivative financial instruments in order to manage interest rate and foreign exchange risk and credit exposure. The Company’s use of these derivatives is generally limited to hedging risk and has principally consisted of using interest rate swaps, treasury rate locks, forward contracts, futures contracts, warrants, put options and credit default swaps.
Debt Covenants
The Company’s back-up revolving credit facilities, unsecured senior notes and unsecured floating rate notes (see Note 8 ‘‘Borrowings and Credit Agreements’’ included in Item 8 of this 10-K) contain customary restrictive financial and operating covenants. These covenants do not include an acceleration of the Company’s debt maturities in the event of a downgrade in the Company’s credit ratings. The Company does not believe the restrictions contained in these covenants materially affect its financial or operating flexibility. As of December 31, 2019, the Company was in compliance with all of its debt covenants.
Debt Ratings
As of December 31, 2019, the Company’s long-term debt was rated “Baa2” by Moody’s Investors Service, Inc. (“Moody’s) and “BBB” by Standard & Poor’s Financial Services LLC (“S&P”), and its commercial paper program was rated “P-2” by Moody’s and “A-2” by S&P. In December 2017, subsequent to the announcement of the proposed acquisition of Aetna, Moody’s changed the outlook on the Company’s long-term debt to “Under Review” from “Stable.” Similarly, S&P placed the Company’s long-term debt outlook on “Watch Negative” from “Stable.” Upon the issuance of the 2018 Notes on March 9, 2018, S&P lowered its corporate credit rating on the Company’s long-term debt to “BBB” from “BBB+” and changed the outlook from “Watch Negative” to “Stable.” On November 27, 2018, S&P lowered its rating on the long-term debt of Aetna to “BBB” from “A.” On November 28, 2018, upon the completion of the Aetna Acquisition, Moody’s lowered its rating on CVS Health Corporation’s long-term debt to “Baa2” from “Baa1.” Additionally, Moody’s changed the outlook on CVS Health Corporation’s long-term debt to “Negative” from “Under Review” and changed the outlook on the long-term debt of Aetna to “Negative” from “Stable.” In assessing the Company’s credit strength, the Company believes that both Moody’s and S&P considered, among other things, the Company’s capital structure and financial policies as well as its consolidated balance sheet, its historical acquisition activity and other financial information. Although the Company currently believes its long-term debt ratings will remain investment grade, it cannot guarantee the future actions of Moody’s and/or S&P. The Company’s debt ratings have a direct impact on its future borrowing costs, access to capital markets and new store operating lease costs.
Share Repurchase Programs
During the years ended December 31, 2019 and 2018, the Company did not repurchase any shares of common stock. See Note 12 ‘‘Shareholders’ Equity’’ included in Item 8 of this 10-K for information about share repurchases for the year ended December 31, 2017.
Quarterly Cash Dividend
In December 2016, CVS Health’s Board of Directors (the “Board”) authorized an 18% increase in CVS Health’s quarterly common stock cash dividend to $0.50 per share effective in 2017. This increase equated to an annual dividend rate of $2.00 per share. During 2019 and 2018, CVS Health maintained its quarterly dividend of $0.50 per share. CVS Health has paid cash dividends every quarter since becoming a public company and expects to maintain its quarterly dividend of $0.50 per share throughout 2020. Future dividends will depend on the Company’s earnings, capital requirements, financial condition and other factors considered relevant by the Board.
75
Off-Balance Sheet Arrangements
Between 1995 and 1997, the Company sold or spun off a number of subsidiaries, including Bob’s Stores and Linens ‘n Things, each of which subsequently filed for bankruptcy, and Marshalls. In many cases, when a former subsidiary leased a store, the Company provided a guarantee of the former subsidiary’s lease obligations for the initial lease term and any extension thereof pursuant to a renewal option provided for in the lease prior to the time of the disposition. When the subsidiaries were disposed of and accounted for as discontinued operations, the Company’s guarantees remained in place, although each initial purchaser agreed to indemnify the Company for any lease obligations the Company was required to satisfy. If any of the purchasers or any of the former subsidiaries fail to make the required payments under a store lease, the Company could be required to satisfy those obligations.
As of December 31, 2019, the Company guaranteed 79 such store leases (excluding the lease guarantees related to Linens ‘n Things, which have been recorded as a liability on the consolidated balance sheets), with the maximum remaining lease term extending through 2030. Management believes the ultimate disposition of any of the remaining lease guarantees will not have a material adverse effect on the Company’s consolidated financial condition or future cash flows. See “Lease Guarantees” in Note 16 ‘‘Commitments and Contingencies’’ included in Item 8 of this 10-K for further information regarding the Company’s guarantees of lease obligations.
Contractual Obligations
The following table summarizes certain estimated future obligations by period under the Company’s various contractual obligations at December 31, 2019. The table below does not include future payments of claims to health care providers or pharmacies because certain terms of these payments are not determinable at December 31, 2019 (for example, the timing and volume of future services provided under fee-for-service arrangements and future membership levels for capitated arrangements).
Payments Due by Period | |||||||||||||||||||
In millions | Total | 2020 | 2021 to 2022 | 2023 to 2024 | Thereafter | ||||||||||||||
Operating lease liabilities | $ | 27,833 | $ | 2,699 | $ | 5,042 | $ | 4,438 | $ | 15,654 | |||||||||
Finance lease liabilities | 1,454 | 84 | 161 | 153 | 1,056 | ||||||||||||||
Contractual lease obligations with Target (1) | 2,218 | — | — | — | 2,218 | ||||||||||||||
Lease obligations for discontinued operations | 8 | 4 | 4 | — | — | ||||||||||||||
Long-term debt | 68,438 | 3,754 | 9,557 | 11,258 | 43,869 | ||||||||||||||
Interest payments on long-term debt (2) | 35,343 | 2,751 | 5,076 | 4,299 | 23,217 | ||||||||||||||
Other long-term liabilities on the consolidated balance sheets (3) | |||||||||||||||||||
Future policy benefits (4) | 6,127 | 508 | 937 | 809 | 3,873 | ||||||||||||||
Unpaid claims (4) | 2,522 | 705 | 514 | 346 | 957 | ||||||||||||||
Policyholders’ funds (4) (5) | 1,156 | 553 | 137 | 85 | 381 | ||||||||||||||
Other liabilities | 1,540 | 426 | 801 | 89 | 224 | ||||||||||||||
Total | $ | 146,639 | $ | 11,484 | $ | 22,229 | $ | 21,477 | $ | 91,449 | |||||||||
_____________________________________________
(1) | The Company leases pharmacy and clinic space from Target Corporation (“Target”). See Note 6 ‘‘Leases’’ included in Item 8 of this 10-K for additional information regarding the lease arrangements with Target. Amounts related to such operating and finance leases are reflected within the operating lease liabilities and finance lease liabilities in the table above. Pharmacy lease amounts due in excess of the remaining estimated economic life of the buildings are reflected in the table above assuming equivalent stores continue to operate through the term of the arrangements. |
(2) | Interest payments on long-term debt are calculated using outstanding balances and interest rates in effect on December 31, 2019. |
(3) | Payments of other long-term liabilities exclude Separate Accounts liabilities of approximately $4.5 billion because these liabilities are supported by assets that are legally segregated and are not subject to claims that arise out of the Company’s business. |
(4) | Total payments of future policy benefits, unpaid claims and policyholders’ funds include $807 million, $2.5 billion and $291 million, respectively, of reserves for contracts subject to reinsurance. The Company expects the assuming reinsurance carrier to fund these obligations and has reflected these amounts as reinsurance recoverable assets on the consolidated balance sheets. |
(5) | Customer funds associated with group life and health contracts of approximately $2.4 billion have been excluded from the table above because such funds may be used primarily at the customer’s discretion to offset future premiums and/or for refunds, and the timing of the related cash flows cannot be determined. Additionally, net unrealized capital gains on debt securities supporting experience-rated products of $83 million, before tax, have been excluded from the table above. |
76
Restrictions on Certain Payments
In addition to general state law restrictions on payments of dividends and other distributions to stockholders applicable to all corporations, health maintenance organizations (“HMOs”) and insurance companies are subject to further regulations that, among other things, may require those companies to maintain certain levels of equity (referred to as surplus) and restrict the amount of dividends and other distributions that may be paid to their equity holders. These regulations are not directly applicable to CVS Health as a holding company, since CVS Health is not an HMO or an insurance company. In addition, in connection with the Aetna Acquisition, the Company made certain undertakings that require prior regulatory approval of dividends by certain of its HMOs and insurance companies. The additional regulations and undertakings applicable to the Company’s HMO and insurance company subsidiaries are not expected to affect the Company’s ability to service the Company’s debt, meet other financing obligations or pay dividends, or the ability of any of the Company’s subsidiaries to service their debt or other financing obligations. Under applicable regulatory requirements and undertakings, at December 31, 2019, the maximum amount of dividends that may be paid by the Company’s insurance and HMO subsidiaries without prior approval by regulatory authorities was $366 million in the aggregate.
The Company maintains capital levels in its operating subsidiaries at or above targeted and/or required capital levels and dividends amounts in excess of these levels to meet liquidity requirements, including the payment of interest on debt and stockholder dividends. In addition, at the Company’s discretion, it uses these funds for other purposes such as funding share and debt repurchase programs, investments in new businesses and other purposes considered advisable.
At December 31, 2019 and 2018, the Company held investments of $537 million and $531 million, respectively, that are not accounted for as Separate Accounts assets but are legally segregated and are not subject to claims that arise out of the Company’s business. See Note 3 ‘‘Investments’’ included in Item 8 of this 10-K for additional information on investments related to the 2012 conversion of an existing group annuity contract from a participating to a non-participating contract.
Solvency Regulation
The National Association of Insurance Commissioners (the “NAIC”) utilizes risk-based capital (“RBC”) standards for insurance companies that are designed to identify weakly-capitalized companies by comparing each company’s adjusted surplus to its required surplus (the “RBC Ratio”). The RBC Ratio is designed to reflect the risk profile of insurance companies. Within certain ratio ranges, regulators have increasing authority to take action as the RBC Ratio decreases. There are four levels of regulatory action, ranging from requiring an insurer to submit a comprehensive financial plan for increasing its RBC to the state insurance commissioner to requiring the state insurance commissioner to place the insurer under regulatory control. At December 31, 2019, the RBC Ratio of each of the Company’s primary insurance subsidiaries was above the level that would require regulatory action. The RBC framework described above for insurers has been extended by the NAIC to health organizations, including HMOs. Although not all states had adopted these rules at December 31, 2019, at that date, each of the Company’s active HMOs had a surplus that exceeded either the applicable state net worth requirements or, where adopted, the levels that would require regulatory action under the NAIC’s RBC rules. External rating agencies use their own capital models and/or RBC standards when they determine a company’s rating.
77
Critical Accounting Policies
The Company prepares the consolidated financial statements in conformity with generally accepted accounting principles, which require management to make certain estimates and apply judgment. Estimates and judgments are based on historical experience, current trends and other factors that management believes to be important at the time the consolidated financial statements are prepared. On a regular basis, the Company reviews its accounting policies and how they are applied and disclosed in the consolidated financial statements. While the Company believes the historical experience, current trends and other factors considered by management support the preparation of the consolidated financial statements in conformity with generally accepted accounting principles, actual results could differ from estimates, and such differences could be material.
Significant accounting policies are discussed in Note 1 ‘‘Significant Accounting Policies’’ included in Item 8 of this 10-K. Management believes the following accounting policies include a higher degree of judgment and/or complexity and, thus, are considered to be critical accounting policies. The Company has discussed the development and selection of these critical accounting policies with the Audit Committee of the Board (the “Audit Committee”), and the Audit Committee has reviewed the disclosures relating to them.
Revenue Recognition
Pharmacy Services Segment
The Pharmacy Services segment sells prescription drugs directly through its mail service dispensing pharmacies and indirectly through the Company’s retail pharmacy network. The Company’s pharmacy benefit arrangements are accounted for in a manner consistent with a master supply arrangement as there are no contractual minimum volumes and each prescription is considered a separate purchasing decision and distinct performance obligation transferred at a point in time. PBM services performed in connection with each prescription claim are considered part of a single performance obligation which culminates in the dispensing of prescription drugs.
The Company recognizes revenue using the gross method at the contract price negotiated with its clients when the Company has concluded it controls the prescription drug before it is transferred to the client plan members. The Company controls prescriptions dispensed indirectly through its retail pharmacy network because it has separate contractual arrangements with those pharmacies, has discretion in setting the price for the transaction and assumes primary responsibility for fulfilling the promise to provide prescription drugs to its client plan members while also performing the related PBM services.
Revenues include (i) the portion of the price the client pays directly to the Company, net of any discounts earned on brand name drugs or other discounts and refunds paid back to the client (see “Drug Discounts” and “Guarantees” below), (ii) the price paid to the Company by client plan members for mail order prescriptions and the price paid to retail network pharmacies by client plan members for retail prescriptions (“retail co-payments”), and (iii) claims based administrative fees for retail pharmacy network contracts. Sales taxes are not included in revenues.
The Company recognizes revenue when control of the prescription drugs is transferred to customers, in an amount that reflects the consideration the Company expects to be entitled to receive in exchange for those prescription drugs. The Company has established the following revenue recognition policies for the Pharmacy Services segment:
• | Revenues generated from prescription drugs sold by mail service dispensing pharmacies are recognized when the prescription drug is delivered to the client plan member. At the time of delivery, the Company has performed substantially all of its performance obligations under its client contracts and does not experience a significant level of returns or reshipments. |
• | Revenues generated from prescription drugs sold by third party pharmacies in the Company’s retail pharmacy network and associated administrative fees are recognized at the Company’s point-of-sale, which is when the claim is adjudicated by the Company’s online claims processing system and the Company has transferred control of the prescription drug and performed all of its performance obligations. |
For contracts under which the Company acts as an agent or does not control the prescription drugs prior to transfer to the client plan member, revenue is recognized using the net method.
Drug Discounts
The Company records revenue net of manufacturers’ rebates earned by its clients based on their plan members’ utilization of brand-name formulary drugs. The Company estimates these rebates at period-end based on actual and estimated claims data and its estimates of the manufacturers’ rebates earned by its clients. The estimates are based on the best available data at period-end
78
and recent history for the various factors that can affect the amount of rebates due to the client. The Company adjusts its rebates payable to clients to the actual amounts paid when these rebates are paid or as significant events occur. Any cumulative effect of these adjustments is recorded against revenues at the time it is identified. Adjustments generally result from contract changes with clients or manufacturers that have retroactive rebate adjustments, differences between the estimated and actual product mix subject to rebates, or whether the brand name drug was included in the applicable formulary. The effect of adjustments between estimated and actual manufacturers’ rebate amounts has not been material to the Company’s operating results or financial condition.
Guarantees
The Company also adjusts revenues for refunds owed to clients resulting from pricing guarantees and performance against defined service and performance metrics. The inputs to these estimates are not subject to a high degree of subjectivity or volatility. The effect of adjustments between estimated and actual pricing and performance refund amounts has not been material to the Company’s operating results or financial condition.
Retail/LTC Segment
Retail Pharmacy
The Company’s retail drugstores recognize revenue at the time the customer takes possession of the merchandise. For pharmacy sales, each prescription claim is its own arrangement with the customer and is a performance obligation, separate and distinct from other prescription claims under other retail network arrangements. Revenues are adjusted for refunds owed to third party payers resulting from pricing guarantees and performance against defined value-based service and performance metrics. The inputs to these estimates are not subject to a high degree of subjectivity or volatility. The effect of adjustments between estimated and actual pricing and performance refund amounts has not been material to the Company’s operating results or financial condition.
Revenue from Company gift cards purchased by customers is deferred as a contract liability until goods or services are transferred. Any amounts not expected to be redeemed by customers (i.e., breakage) are recognized based on historical redemption patterns.
Customer returns are not material to the Company’s operating results or financial condition. Sales taxes are not included in revenues.
Loyalty and Other Programs
The Company’s customer loyalty program, ExtraCare®, consists of two components, ExtraSavingsTM and ExtraBucks® Rewards. ExtraSavings are coupons that are recorded as a reduction of revenue when redeemed as the Company concluded that they do not represent a promise to the customer to deliver additional goods or services at the time of issuance because they are not tied to a specific transaction or spending level.
ExtraBucks Rewards are accumulated by customers based on their historical spending levels. Thus, the Company has determined that there is an additional performance obligation to those customers at the time of the initial transaction. The Company allocates the transaction price to the initial transaction and the ExtraBucks Rewards transaction based upon the relative standalone selling price, which considers historical redemption patterns for the rewards. Revenue allocated to ExtraBucks Rewards is recognized as those rewards are redeemed. At the end of each period, unredeemed ExtraBucks Rewards are reflected as a contract liability.
The Company also offers a subscription-based membership program, CarePass®, under which members are entitled to a suite of benefits delivered over the course of the subscription period, as well as a promotional reward that can be redeemed for future goods and services. Subscriptions are paid for on a monthly or annual basis at the time of or in advance of the Company delivering the goods and services. Revenue from these arrangements is recognized as the performance obligations are satisfied.
Long-term Care
Revenue is recognized when control of the promised goods or services is transferred to customers in an amount that reflects the consideration the Company expects to be entitled to receive in exchange for those goods or services. Each prescription claim represents a separate performance obligation of the Company, separate and distinct from other prescription claims under customer arrangements. A significant portion of Long-term Care revenue from sales of pharmaceutical and medical products is reimbursed by the federal Medicare Part D program and, to a lesser extent, state Medicaid programs. The Company monitors its revenues and receivables from these reimbursement sources, as well as long-term care facilities and other third party insurance payors, and reduces revenue at the revenue recognition date to properly account for the variable consideration due to anticipated
79
differences between billed and reimbursed amounts. Accordingly, the total revenues and receivables reported in the Company’s consolidated financial statements are recorded at the amount expected to be ultimately received from these payors.
Patient co-payments associated with Medicare Part D, certain state Medicaid programs, Medicare Part B and certain third party payors typically are not collected at the time products are delivered or services are rendered, but are billed to the individuals as part of normal billing procedures and subject to normal accounts receivable collections procedures.
Walk-In Medical Clinics
For services provided by the Company’s walk-in medical clinics, revenue recognition occurs for completed services provided to patients, with adjustments taken for third party payor contractual obligations and patient direct bill historical collection rates.
Health Care Benefits Segment
Health Care Benefits revenue is principally derived from insurance premiums and fees billed to customers. Revenue is recognized based on customer billings, which reflect contracted rates per employee and the number of covered employees recorded in the Company’s records at the time the billings are prepared. Billings are generally sent monthly for coverage during the following month.
The Company’s billings may be subsequently adjusted to reflect enrollment changes due to member terminations or other factors. These adjustments are known as retroactivity adjustments. In each period, the Company estimates the amount of future retroactivity and adjusts the recorded revenue accordingly. As information regarding actual retroactivity amounts becomes known, the Company refines its estimates and records any required adjustments to revenues in the period in which they arise. A significant difference in the actual level of retroactivity compared to estimated levels would have a significant effect on the Company’s operating results.
Premium Revenue
Premiums are recognized as revenue in the month in which the enrollee is entitled to receive health care services. Premiums are reported net of an allowance for estimated terminations and uncollectible amounts. Additionally, premium revenue subject to the ACA’s minimum medical loss ratio (“MLR”) rebate requirements is recorded net of the estimated minimum MLR rebates for the current calendar year. Premiums related to unexpired contractual coverage periods (unearned premiums) are reported as other insurance liabilities on the consolidated balance sheets and recognized as revenue when earned.
Some of the Company’s contracts allow for premiums to be adjusted to reflect actual experience or the relative health status of Insured members. Such adjustments are reasonably estimable at the outset of the contract, and adjustments to those estimates are made based on actual experience of the customer emerging under the contract and the terms of the underlying contract.
Services Revenue
Services revenue relates to contracts that can include various combinations of services or series of services which generally are capable of being distinct and accounted for as separate performance obligations. The Health Care Benefits segment’s services revenue primarily consists of the following components:
• | ASC fees are received in exchange for performing certain claim processing and member services for ASC members. ASC fee revenue is recognized over the period the service is provided. Some of the Company’s administrative services contracts include guarantees with respect to certain functions, such as customer service response time, claim processing accuracy and claim processing turnaround time, as well as certain guarantees that a plan sponsor’s benefit claim experience will fall within a certain range. With any of these guarantees, the Company is financially at risk if the conditions of the arrangements are not met, although the maximum amount at risk typically is limited to a percentage of the fees otherwise payable to the Company by the customer involved. Each period the Company estimates its obligations under the terms of these guarantees and records its estimate as an offset to services revenues. |
• | Workers’ compensation administrative services consist of fee-based managed care services. Workers’ compensation administrative services revenue is recognized once the service is provided. |
Accounting for Medicare Part D
Revenues include insurance premiums earned by the Company’s PDPs, which are determined based on the PDP’s annual bid and related contractual arrangements with CMS. The insurance premiums include a beneficiary premium, which is the responsibility of the PDP member, and can be subsidized by CMS in the case of low-income members, and a direct premium paid by CMS. Premiums collected in advance are initially recorded within other insurance liabilities and are then recognized ratably as revenue over the period in which members are entitled to receive benefits.
80
Revenues also include a risk-sharing feature of the Medicare Part D program design referred to as the risk corridor. The Company estimates variable consideration in the form of amounts payable to, or receivable from, CMS under the risk corridor, and adjusts revenue based on calculations of additional subsidies to be received from or owed to CMS at the end of the reporting year.
In addition to Medicare Part D premiums, the Company receives additional payments each month from CMS related to catastrophic reinsurance, low-income cost sharing subsidies and coverage gap benefits. If the subsidies received differ from the amounts earned from actual prescriptions transferred, the difference is recorded in either accounts receivable, net or accrued expenses.
Other-Than-Temporary Impairments of Debt Securities
The Company regularly reviews its debt securities to determine whether a decline in fair value below the cost basis or carrying value is other-than-temporary. If a decline in the fair value of a debt security is considered other-than-temporary, the cost basis or carrying value of the debt security is written down. The write-down is then bifurcated into its credit and non-credit related components. The amount of the credit-related component is included in the Company’s net income (loss), and the amount of the non-credit related component is included in other comprehensive income (loss), unless the Company intends to sell the debt security or it is more likely than not that the Company will be required to sell the debt security prior to its anticipated recovery of the debt security’s amortized cost basis. The Company analyzes all facts and circumstances believed to be relevant for each investment when performing this analysis, in accordance with applicable accounting guidance.
Among the factors considered in evaluating whether a decline in fair value is other-than-temporary are whether the decline results from a change in the quality of the debt security itself, whether the decline results from a downward movement in the market as a whole, and the prospects for realizing the carrying value of the debt security based on the investment’s current and short-term prospects for recovery. For unrealized losses determined to be the result of market conditions (for example, increasing interest rates and volatility due to conditions in the overall market) or industry-related events, the Company determines whether it intends to sell the debt security or if it is more likely than not that the Company will be required to sell the debt security prior to its anticipated recovery of the debt security’s amortized cost basis. If either case is true, the Company recognizes an other-than-temporary impairment, and the cost basis/carrying amount of the debt security is written down to fair value.
The risks inherent in assessing the impairment of a debt security include the risk that market factors may differ from projections and the risk that the facts and circumstances factored into the Company’s assessment may change with the passage of time. Unexpected changes to market factors and circumstances that were not present in past reporting periods are among the factors that may result in a current period decision to sell debt securities that were not impaired in prior reporting periods.
Vendor Allowances and Purchase Discounts
Pharmacy Services Segment
The Pharmacy Services segment receives purchase discounts on products purchased. Contractual arrangements with vendors, including manufacturers, wholesalers and retail pharmacies, normally provide for the Pharmacy Services segment to receive purchase discounts from established list prices in one, or a combination, of the following forms: (i) a direct discount at the time of purchase, (ii) a discount for the prompt payment of invoices or (iii) when products are purchased indirectly from a manufacturer (e.g., through a wholesaler or retail pharmacy), a discount (or rebate) paid subsequent to dispensing. These rebates are recognized when prescriptions are dispensed and are generally calculated and billed to manufacturers within 30 days of the end of each completed quarter. Historically, the effect of adjustments resulting from the reconciliation of rebates recognized to the amounts billed and collected has not been material to the Company’s operating results or financial condition. The Company accounts for the effect of any such differences as a change in accounting estimate in the period the reconciliation is completed. The Pharmacy Services segment also receives additional discounts under its wholesaler contracts if it exceeds contractually defined purchase volumes. In addition, the Pharmacy Services segment receives fees from pharmaceutical manufacturers for administrative services. Purchase discounts and administrative service fees are recorded as a reduction of cost of products sold.
Retail/LTC Segment
Vendor allowances received by the Retail/LTC segment reduce the carrying cost of inventory and are recognized in cost of products sold when the related inventory is sold, unless they are specifically identified as a reimbursement of incremental costs for promotional programs and/or other services provided. Amounts that are directly linked to advertising commitments are recognized as a reduction of advertising expense (included in operating expenses) when the related advertising commitment is
81
satisfied. Any such allowances received in excess of the actual cost incurred also reduce the carrying cost of inventory. The total value of any upfront payments received from vendors that are linked to purchase commitments is initially deferred. The deferred amounts are then amortized to reduce cost of products sold over the life of the contract based upon purchase volume. The total value of any upfront payments received from vendors that are not linked to purchase commitments is also initially deferred. The deferred amounts are then amortized to reduce cost of products sold on a straight-line basis over the life of the related contract.
There have not been any material changes in the way the Company accounts for vendor allowances or purchase discounts during the past three years.
Inventory
Inventories are valued at the lower of cost or net realizable value using the weighted average cost method.
The value of ending inventory is reduced for estimated inventory losses that have occurred during the interim period between physical inventory counts. Physical inventory counts are taken on a regular basis in each retail store and LTC pharmacy, and a continuous cycle count process is the primary procedure used to validate the inventory balances on hand in each distribution center and mail facility to ensure that the amounts reflected in the consolidated financial statements are properly stated. The Company’s accounting for inventory contains uncertainty since management must use judgment to estimate the inventory losses that have occurred during the interim period between physical inventory counts. When estimating these losses, a number of factors are considered which include historical physical inventory results on a location-by-location basis and current physical inventory loss trends.
The total reserve for estimated inventory losses covered by this critical accounting policy was $401 million as of December 31, 2019. Although management believes there is sufficient current and historical information available to record reasonable estimates for estimated inventory losses, it is possible that actual results could differ. In order to help investors assess the aggregate risk, if any, associated with the inventory-related uncertainties discussed above, a ten percent (10%) pre-tax change in estimated inventory losses, which is a reasonably likely change, would increase or decrease the total reserve for estimated inventory losses by approximately $40 million as of December 31, 2019.
Although management believes that the estimates discussed above are reasonable and the related calculations conform to generally accepted accounting principles, actual results could differ from such estimates, and such differences could be material.
Right-of-Use Assets and Lease Liabilities
The Company determines if an arrangement contains a lease at the inception of a contract. Right-of-use assets represent the Company’s right to use an underlying asset for the lease term and lease liabilities represent the Company’s obligation to make lease payments arising from the lease. Right-of-use assets and lease liabilities are recognized at the commencement date of the lease, renewal date of the lease or significant remodeling of the lease space based on the present value of the remaining future minimum lease payments. As the interest rate implicit in the Company’s leases is not readily determinable, the Company utilizes its incremental borrowing rate, determined by class of underlying asset, to discount the lease payments. The operating lease right-of-use assets also include lease payments made before commencement and are reduced by lease incentives.
The Company’s real estate leases typically contain options that permit renewals for additional periods of up to five years each. For real estate leases, the options to extend are not considered reasonably certain at lease commencement because the Company reevaluates each lease on a regular basis to consider the economic and strategic incentives of exercising the renewal options and regularly opens or closes stores to align with its operating strategy. Generally, the renewal option periods are not included within the lease term and the associated payments are not included in the measurement of the right-of-use asset and lease liability. Similarly, renewal options are not included in the lease term for non-real estate leases because they are not considered reasonably certain of being exercised at lease commencement. Leases with an initial term of 12 months or less are not recorded on the balance sheets, and lease expense is recognized on a straight-line basis over the term of the short-term lease.
For real estate leases, the Company accounts for lease components and nonlease components as a single lease component. Certain real estate leases require additional payments based on sales volume, as well as reimbursement for real estate taxes, common area maintenance and insurance, which are expensed as incurred as variable lease costs. Other real estate leases contain one fixed lease payment that includes real estate taxes, common area maintenance and insurance. These fixed payments are considered part of the lease payment and included in the right-of-use assets and lease liabilities.
82
Long-Lived Asset Impairment
Recoverability of Definite-Lived Assets
The Company evaluates the recoverability of long-lived assets, excluding goodwill and indefinite-lived intangible assets, which are tested for impairment using separate tests described below, whenever events or changes in circumstances indicate that the carrying value of such an asset may not be recoverable. The Company groups and evaluates these long-lived assets for impairment at the lowest level at which individual cash flows can be identified. If indicators of impairment are present, the Company first compares the carrying amount of the asset group to the estimated future cash flows associated with the asset group (undiscounted and without interest charges). If the estimated future cash flows used in this analysis are less than the carrying amount of the asset group, an impairment loss calculation is prepared. The impairment loss calculation compares the carrying amount of the asset group to the asset group’s estimated future cash flows (discounted and with interest charges). If required, an impairment loss is recorded for the portion of the asset group’s carrying value that exceeds the asset group’s estimated future cash flows (discounted and with interest charges).
The long-lived asset impairment loss calculation contains uncertainty since management must use judgment to estimate each asset group’s future sales, profitability and cash flows. When preparing these estimates, the Company considers historical results and current operating trends and consolidated sales, profitability and cash flow results and forecasts. These estimates can be affected by a number of factors including general economic and regulatory conditions, efforts of third party organizations to reduce their prescription drug costs and/or increased member co-payments, the continued efforts of competitors to gain market share and consumer spending patterns.
During the year ended December 31, 2019, the Company recorded store rationalization charges of $231 million, primarily related to operating lease right-of-use asset impairment charges. During the year ended December 31, 2018, the Company recognized a $43 million long-lived asset impairment charge, primarily related to the impairment of property and equipment. There were no material impairment charges recognized on long-lived assets in the year ended December 31, 2017.
Recoverability of Goodwill
Goodwill represents the excess of amounts paid for acquisitions over the fair value of the net identifiable assets acquired. Goodwill is subject to annual impairment reviews, or more frequent reviews if events or circumstances indicate that the carrying value may not be recoverable. Goodwill is tested for impairment on a reporting unit basis. The impairment test is performed by comparing the reporting unit’s fair value with its net book value (or carrying amount), including goodwill. The fair value of the reporting units is estimated using a combination of a discounted cash flow method and a market multiple method. If the net book value (carrying amount) of the reporting unit exceeds its fair value, the reporting unit’s goodwill is considered to be impaired, and an impairment is recognized in an amount equal to the excess.
The determination of the fair value of the reporting units requires the Company to make significant assumptions and estimates. These assumptions and estimates primarily include the selection of appropriate peer group companies; control premiums and valuation multiples appropriate for acquisitions in the industries in which the Company competes; discount rates; terminal growth rates; and forecasts of revenue, operating income, depreciation and amortization, income taxes, capital expenditures and future working capital requirements. When determining these assumptions and preparing these estimates, the Company considers each reporting unit’s historical results and current operating trends; consolidated revenues, profitability and cash flow results and forecasts; and industry trends. The Company’s estimates can be affected by a number of factors, including general economic and regulatory conditions; the risk-free interest rate environment; the Company’s market capitalization; efforts of customers and payers to reduce costs, including their prescription drug costs, and/or increase member co-payments; the continued efforts of competitors to gain market share and consumer spending patterns.
2019 Goodwill Impairment Test
During the third quarter of 2019, the Company performed its required annual impairment test of goodwill. The results of this impairment test indicated that there was no impairment of goodwill as of the testing date. The goodwill impairment test resulted in the fair values of all of the Company’s reporting units exceeding their carrying values by significant margins, with the exception of the Commercial Business and LTC reporting units, which exceeded their carrying values by approximately 4% and 9%, respectively.
As of the Aetna Acquisition Date, the Company added the Health Care Benefits segment which included the Commercial Business reporting unit. The transaction was accounted for using the acquisition method of accounting which requires, among other things, the assets acquired and liabilities assumed to be recognized at their fair values at the date of acquisition. As a result, at the time of the acquisition the fair value of the Commercial Business reporting unit was equal to its carrying value. Given the close proximity of the Aetna Acquisition Date to the 2019 annual impairment test of goodwill, as expected, the fair
83
value of the Commercial Business reporting unit remained relatively in line with the carrying value of the reporting unit. In addition, this fair value estimate is sensitive to significant assumptions including changes in the revenue growth rate, operating income and the discount rate.
Although the Company believes the financial projections used to determine the fair value of the LTC reporting unit in the third quarter of 2019 were reasonable and achievable, the LTC reporting unit may continue to face challenges that may affect the Company’s ability to grow the LTC reporting unit’s business at the rate estimated when such goodwill impairment test was performed. These challenges and some of the key assumptions included in the Company’s financial projections to determine the estimated fair value of the LTC reporting unit include client retention rates; occupancy rates in skilled nursing facilities; the financial health of skilled nursing facility customers; facility reimbursement pressures; the Company’s ability to execute its senior living initiative; the Company’s ability to make acquisitions and integrate those businesses into its LTC operations in an orderly manner; and the Company’s ability to extract cost savings from labor productivity and other initiatives. The fair value of the LTC reporting unit also is dependent on market multiples of peer group companies and the risk-free interest rate environment, which impacts the discount rate used in the discounted cash flow valuation method. If the Company does not achieve its forecasts, it is reasonably possible in the near term that the goodwill of the LTC reporting unit could be deemed to be impaired by a material amount. As of December 31, 2019, the remaining goodwill balance in the LTC reporting unit was $431 million.
2018 Goodwill Impairment Tests
As discussed in Note 5 ‘‘Goodwill and Other Intangibles’’ included in Item 8 of this 10-K, during 2018, the LTC reporting unit continued to experience industry-wide challenges that impacted management’s ability to grow the business at the rate that was originally estimated when the Company acquired Omnicare and when the 2017 annual goodwill impairment test was performed. Those challenges included lower client retention rates, lower occupancy rates in skilled nursing facilities, the deteriorating financial health of numerous skilled nursing facility customers which resulted in a number of customer bankruptcies in 2018, and continued facility reimbursement pressures. In June 2018, LTC management submitted its initial budget for 2019 and updated the 2018 annual forecast which showed a deterioration in the projected financial results for the remainder of 2018 and in 2019, which also caused management to update its long-term forecast beyond 2019. Based on these updated projections, management determined that there were indicators that the LTC reporting unit’s goodwill may be impaired and, accordingly, management performed an interim goodwill impairment test as of June 30, 2018. The results of that interim impairment test showed that the fair value of the LTC reporting unit was lower than the carrying value, resulting in a $3.9 billion pre-tax goodwill impairment charge in the second quarter of 2018.
During the third quarter of 2018, the Company performed its required annual impairment tests of goodwill and concluded there was no impairment of goodwill. The goodwill impairment tests showed that the fair values of the Pharmacy Services and Retail Pharmacy reporting units exceeded their carrying values by significant margins and the fair value of the LTC reporting unit exceeded its carrying value by approximately 2%.
During the fourth quarter of 2018, the LTC reporting unit missed its forecast primarily due to operational issues and customer liquidity issues, including one significant customer bankruptcy. Additionally, LTC management submitted an updated final budget for 2019 which showed significant additional deterioration in the projected financial results for 2019 compared to the analyses performed in the second and third quarters of 2018 primarily due to continued industry and operational challenges, which also caused management to make further updates to its long-term forecast beyond 2019. Based on these updated projections, management determined that there were indicators that the LTC reporting unit’s goodwill may be further impaired and, accordingly, management performed an interim goodwill impairment test during the fourth quarter of 2018. The results of that interim impairment test showed that the fair value of the LTC reporting unit was lower than the carrying value, resulting in an additional $2.2 billion pre-tax goodwill impairment charge in the fourth quarter of 2018.
In 2018, the fair value of the LTC reporting unit was determined using a combination of a discounted cash flow method and a market multiple method. In addition to the lower financial projections, changes in risk-free interest rates and lower market multiples of peer group companies also contributed to the amount of the 2018 goodwill impairment charges.
2017 Goodwill Impairment Tests
The Company recorded $181 million in goodwill impairment charges in 2017 related to the RxCrossroads reporting unit. During the third quarter of 2017, the Company performed its required annual impairment test of goodwill. The goodwill impairment test showed that the fair values of the Pharmacy Services and Retail Pharmacy reporting units exceeded their carrying values by significant margins and the fair values of the LTC and RxCrossroads reporting units exceeded their carrying values by approximately 1% and 6%, respectively. On January 2, 2018, the Company sold its RxCrossroads reporting unit to McKesson Corporation for $725 million.
84
Recoverability of Indefinite-Lived Intangible Assets
Indefinite-lived intangible assets are subject to annual impairment reviews, or more frequent reviews if events or circumstances indicate that their carrying value may not be recoverable. Indefinite-lived intangible assets are tested by comparing the estimated fair value of the asset to its carrying value. If the carrying value of the asset exceeds its estimated fair value, an impairment loss is recognized, and the asset is written down to its estimated fair value.
The indefinite-lived intangible asset impairment loss calculation contains uncertainty since management must use judgment to estimate fair value based on the assumption that, in lieu of ownership of an intangible asset, the Company would be willing to pay a royalty in order to utilize the benefits of the asset. Fair value is estimated by discounting the hypothetical royalty payments to their present value over the estimated economic life of the asset. These estimates can be affected by a number of factors including general economic conditions, availability of market information and the profitability of the Company. There were no impairment losses recognized on indefinite-lived intangible assets in any of the years ended December 31, 2019, 2018 or 2017.
Health Care Costs Payable
At December 31, 2019 and 2018, 73% and 67% respectively, of health care costs payable are estimates of the ultimate cost of (i) services rendered to the Company’s Insured members but not yet reported to the Company and (ii) claims which have been reported to the Company but not yet paid (collectively, “IBNR”). Health care costs payable also include an estimate of the cost of services that will continue to be rendered after the financial statement date if the Company is obligated to pay for such services in accordance with contractual or regulatory requirements. The remainder of health care costs payable is primarily comprised of pharmacy and capitation payables, other amounts due to providers pursuant to risk sharing agreements and accruals for state assessments. The Company develops its estimate of IBNR using actuarial principles and assumptions that consider numerous factors. See Note 1 ‘‘Significant Accounting Policies’’ included in Item 8 of this 10-K for additional information on the Company’s reserving methodology.
During 2019, the Company observed an increase in completion factors relative to those assumed at the prior year end. After considering the claims paid in 2019 with dates of service prior to the fourth quarter of the previous year, the Company observed assumed incurred claim weighted average completion factors that were 27 basis points higher than previously estimated, resulting in a decrease of $240 million in 2019, in health care costs payable that related to the prior year. The Company has considered the pattern of changes in its completion factors when determining the completion factors used in its estimates of IBNR as of December 31, 2019. However, based on historical claim experience, it is reasonably possible that the Company’s estimated weighted average completion factors may vary by plus or minus 19 basis points from the Company’s assumed rates, which could impact health care costs payable by approximately plus or minus $227 million pretax.
Also during 2019, the Company observed that health care costs for claims with claim incurred dates of three months or less before the financial statement date were lower than previously estimated. Specifically, after considering the claims paid in 2019 with claim incurred dates for the fourth quarter of the previous year, the Company observed health care costs that were approximately 3.2% lower than previously estimated during the fourth quarter of 2018, resulting in a reduction of $284 million in 2019 in health care costs payable that related to prior year.
Management considers historical health care cost trend rates together with its knowledge of recent events that may impact current trends when developing estimates of current health care cost trend rates. When establishing reserves as of December 31, 2019, the Company increased its assumed health care cost trend rates for the most recent three months by 3.4% from health care cost trend rates recently observed. However, based on historical claim experience, it is reasonably possible that the Company’s estimated health care cost trend rates may vary by plus or minus 3.5% from the assumed rates, which could impact health care costs payable by plus or minus $349 million pretax.
Income Taxes
The Company accounts for income taxes using the asset and liability method. Deferred tax assets and liabilities are established for any temporary differences between financial and tax reporting bases and are adjusted as needed to reflect changes in the enacted tax rates expected to be in effect when the temporary differences reverse. Such adjustments are recorded in the period in which changes in tax laws are enacted, regardless of when they are effective. Deferred tax assets are reduced, if necessary, by a valuation allowance to the extent future realization of those losses, deductions or other tax benefits is sufficiently uncertain.
Significant judgment is required in determining the provision for income taxes and the related taxes payable and deferred tax assets and liabilities since, in the ordinary course of business, there are transactions and calculations where the ultimate tax outcome is uncertain. Additionally, the Company’s tax returns are subject to audit by various domestic and foreign tax
85
authorities that could result in material adjustments based on differing interpretations of the tax laws. Although management believes that its estimates are reasonable and are based on the best available information at the time the provision is prepared, actual results could differ from these estimates resulting in a final tax outcome that may be materially different from that which is reflected in the consolidated financial statements.
The tax benefit from an uncertain tax position is recognized only if it is more likely than not that the tax position will be sustained on examination by the taxing authorities, based on the technical merits of the position. The tax benefits recognized in the consolidated financial statements from such positions are then measured based on the largest benefit that has a greater than 50% likelihood of being realized upon settlement with the related tax authority. Interest and/or penalties related to uncertain tax positions are recognized in the income tax provision. Significant judgment is required in determining uncertain tax positions. The Company has established accruals for uncertain tax positions using its judgment and adjusts these accruals, as warranted, due to changing facts and circumstances.
New Accounting Pronouncements
See Note 1 ‘‘Significant Accounting Policies’’ included in Item 8 of this 10-K for a description of new accounting pronouncements applicable to the Company.
86
Item 7A. Quantitative and Qualitative Disclosures About Market Risk.
The Company’s earnings and financial condition are exposed to interest rate risk, credit quality risk, market valuation risk, foreign currency risk, commodity risk and operational risk.
Evaluation of Interest Rate and Credit Quality Risk
The Company manages interest rate risk by seeking to maintain a tight match between the durations of assets and liabilities when appropriate. The Company manages credit quality risk by seeking to maintain high average credit quality ratings and diversified sector exposure within its debt securities portfolio. In connection with its investment and risk management objectives, the Company also uses derivative financial instruments whose market value is at least partially determined by, among other things, levels of or changes in interest rates (short-term or long-term), duration, prepayment rates, equity markets or credit ratings/spreads. The Company’s use of these derivatives is generally limited to hedging risk and has principally consisted of using interest rate swaps, treasury rate locks, forward contracts, futures contracts, warrants, put options and credit default swaps. These instruments, viewed separately, subject the Company to varying degrees of interest rate, equity price and credit risk. However, when used for hedging, the Company expects these instruments to reduce overall risk.
Investments
The Company’s investment portfolio supported the following products at December 31, 2019 and 2018:
In millions | 2019 | 2018 | |||||
Experience-rated products | $ | 1,100 | $ | 1,063 | |||
Remaining products | 18,587 | 17,191 | |||||
Total investments | $ | 19,687 | $ | 18,254 | |||
Investment risks associated with experience-rated products generally do not impact the Company’s operating results. The risks associated with investments supporting experience-rated pension and annuity products in the large case pensions business in the Company’s Corporate/Other segment are assumed by the contract holders and not by the Company (subject to, among other things, certain minimum guarantees). Assets supporting experience-rated products may be subject to contract holder or participant withdrawals.
The debt securities in the Company’s investment portfolio had an average credit quality rating of A at both December 31, 2019 and 2018 with approximately $4.4 billion and $3.9 billion rated AAA at December 31, 2019 and 2018, respectively. The debt securities that were rated below investment grade (that is, having a credit quality rating below BBB-/Baa3) were $1.2 billion and $1.1 billion at December 31, 2019 and 2018, respectively (of which 4% and 6% at December 31, 2019 and 2018, respectively, supported experience-rated products).
At December 31, 2019 and 2018, the Company held $333 million and $373 million, respectively, of municipal debt securities that were guaranteed by third parties, representing 2% of total investments at both December 31, 2019 and 2018. These securities had an average credit quality rating of AA and AA- at December 31, 2019 and 2018, respectively, with the guarantee. These securities had an average credit quality rating of A+ and A- at December 31, 2019 and 2018, respectively, without the guarantee. The Company does not have any significant concentration of investments with third party guarantors (either direct or indirect).
The Company generally classifies debt securities as available for sale, and carries them at fair value on the consolidated balance sheets. At both December 31, 2019 and 2018, less than 1% of debt securities were valued using inputs that reflect the Company’s assumptions (categorized as Level 3 inputs in accordance with accounting principles generally accepted in the United States of America). See Note 4 ‘‘Fair Value’’ included in Item 8 of this 10-K, for additional information on the methodologies and key assumptions used to determine the fair value of investments. For additional information related to investments, see Note 3 ‘‘Investments’’ included in Item 8 of this 10-K.
The Company regularly reviews debt securities in its portfolio to determine whether a decline in fair value below the cost basis or carrying value is other-than-temporary. When a debt security is in an unrealized capital loss position, the Company monitors the duration and severity of the loss to determine if sufficient market recovery can occur within a reasonable period of time. If a decline in fair value is considered other-than-temporary, the cost basis or carrying value of the debt security is written down. The write down is then bifurcated into its credit and non-credit related components. The amount of the credit-related component
87
is included in net income, and the amount of the non-credit related component is included in other comprehensive income (loss), unless the Company intends to sell the debt security or it is more likely than not that the Company will be required to sell the debt security prior to its anticipated recovery of the debt security’s amortized cost basis. Accounting for other-than-temporary impairment (“OTTI”) of debt securities is considered a critical accounting policy. See “Critical Accounting Policies - Other-Than-Temporary Impairment of Debt Securities” in the MD&A included in Item 7 of this 10-K for additional information.
Evaluation of Market Valuation Risks
The Company regularly evaluates its risk from market-sensitive instruments by examining, among other things, levels of or changes in interest rates (short-term or long-term), duration, prepayment rates, equity markets and/or credit ratings/spreads. The Company also regularly evaluates the appropriateness of investments relative to management-approved investment guidelines (and operates within those guidelines) and the business objectives of its portfolios.
On a quarterly basis, the Company reviews the impact of hypothetical net losses in its investment portfolio on the Company’s consolidated near-term financial condition, operating results and cash flows assuming the occurrence of certain reasonably possible changes in near-term market rates and prices. Interest rate changes (whether resulting from changes in treasury yields or credit spreads or other factors) represent the most material risk exposure category for the Company. The Company has estimated the impact on the fair value of market sensitive instruments based on the net present value of cash flows using a representative set of likely future interest rate scenarios. The assumptions used were as follows: an immediate increase of 100 basis points in interest rates (which the Company believes represents a moderately adverse scenario and is approximately equal to the historical annual volatility of interest rate movements for intermediate-term available-for-sale debt securities) and an immediate decrease of 15% in prices for domestic equity securities.
Assuming an immediate increase of 100 basis points in interest rates and an immediate decrease of 15% in the prices for domestic equity securities, the theoretical decline in the fair values of market sensitive instruments at December 31, 2019 is as follows:
• | The fair value of long-term debt would decline by approximately $4.5 billion ($5.7 billion pretax). Changes in the fair value of long-term debt do not impact the Company’s operating results or financial condition. |
• | The theoretical reduction in the fair value of investment securities partially offset by the theoretical reduction in the fair value of interest rate sensitive liabilities would result in a net decline in fair value of approximately $420 million ($530 million pretax) related to continuing non-experience-rated products. Reductions in the fair value of investment securities would be reflected as an unrealized loss in equity, as the Company classifies these securities as available for sale. The Company does not record liabilities at fair value. |
Based on overall exposure to interest rate risk and equity price risk, the Company believes that these changes in market rates and prices would not materially affect consolidated near-term financial condition, operating results or cash flows as of December 31, 2019.
Evaluation of Foreign Currency and Commodity Risk
As of each of December 31, 2019 and 2018, the Company did not have any material foreign currency exchange rate or commodity derivative instruments in place and believes its exposure to foreign currency exchange rate risk and commodity price risk is not material.
88
Evaluation of Operational Risks
The Company also faces certain operational risks, including risks related to information security, including cybersecurity. The Company and its vendors have experienced and continue to experience a variety of cyber attacks, and the Company and its vendors expect to continue to experience cyber attacks going forward. Among other things, the Company and its vendors have experienced automated attempts to gain access to public facing networks, brute force, SYN flood and distributed denial of service attacks, attempted malware infections, vulnerability scanning, ransomware attacks, spear-phishing campaigns, mass reconnaissance attempts, injection attempts, phishing, PHP injection and cross-site scripting. The Company also has seen an increase in attacks designed to obtain access to consumers’ accounts using illegally obtained demographic information. The Company is dedicating and will continue to dedicate significant resources and incur significant expenses to maintain and update on an ongoing basis the systems and processes that are designed to mitigate the information security risks it faces and protect the security of its computer systems, software, networks and other technology assets against attempts by unauthorized parties to obtain access to confidential information, destroy data, disrupt or degrade service, sabotage systems or cause other damage. The impact of cyber attacks has not been material to the Company’s operations or operating results through December 31, 2019. The Board and its Audit Committee (the “Audit Committee”) and Nominating and Corporate Governance Committee are regularly informed regarding the Company’s information security policies, practices and status.
89
Item 8. Financial Statements and Supplementary Data.
Index to Consolidated Financial Statements
Page | |
90
Consolidated Statements of Operations
For the Years Ended December 31, | |||||||||||
In millions, except per share amounts | 2019 | 2018 | 2017 | ||||||||
Revenues: | |||||||||||
Products | $ | $ | $ | ||||||||
Premiums | |||||||||||
Services | |||||||||||
Net investment income | |||||||||||
Total revenues | |||||||||||
Operating costs: | |||||||||||
Cost of products sold | |||||||||||
Benefit costs | |||||||||||
Goodwill impairments | |||||||||||
Operating expenses | |||||||||||
Total operating costs | |||||||||||
Operating income | |||||||||||
Interest expense | |||||||||||
Loss on early extinguishment of debt | |||||||||||
Other expense (income) | ( | ) | ( | ) | |||||||
Income before income tax provision | |||||||||||
Income tax provision | |||||||||||
Income (loss) from continuing operations | ( | ) | |||||||||
Loss from discontinued operations, net of tax | ( | ) | |||||||||
Net income (loss) | ( | ) | |||||||||
Net (income) loss attributable to noncontrolling interests | ( | ) | |||||||||
Net income (loss) attributable to CVS Health | $ | $ | ( | ) | $ | ||||||
Basic earnings (loss) per share: | |||||||||||
Income (loss) from continuing operations attributable to CVS Health | $ | $ | ( | ) | $ | ||||||
Loss from discontinued operations attributable to CVS Health | $ | $ | $ | ( | ) | ||||||
Net income (loss) attributable to CVS Health | $ | $ | ( | ) | $ | ||||||
Weighted average basic shares outstanding | |||||||||||
Diluted earnings (loss) per share: | |||||||||||
Income (loss) from continuing operations attributable to CVS Health | $ | $ | ( | ) | $ | ||||||
Loss from discontinued operations attributable to CVS Health | $ | $ | $ | ( | ) | ||||||
Net income (loss) attributable to CVS Health | $ | $ | ( | ) | $ | ||||||
Weighted average diluted shares outstanding | |||||||||||
Dividends declared per share | $ | $ | $ | ||||||||
See accompanying notes to consolidated financial statements.
91
Consolidated Statements of Comprehensive Income (Loss)
For the Years Ended December 31, | |||||||||||
In millions | 2019 | 2018 | 2017 | ||||||||
Net income (loss) | $ | $ | ( | ) | $ | ||||||
Other comprehensive income (loss), net of tax: | |||||||||||
Net unrealized investment gains | |||||||||||
Foreign currency translation adjustments | ( | ) | ( | ) | |||||||
Net cash flow hedges | ( | ) | ( | ) | |||||||
Pension and other postretirement benefits | ( | ) | |||||||||
Other comprehensive income | |||||||||||
Comprehensive income (loss) | ( | ) | |||||||||
Comprehensive (income) loss attributable to noncontrolling interests | ( | ) | |||||||||
Comprehensive income (loss) attributable to CVS Health | $ | $ | ( | ) | $ | ||||||
See accompanying notes to consolidated financial statements.
92
Consolidated Balance Sheets
At December 31, | |||||||
In millions, except per share amounts | 2019 | 2018 | |||||
Assets: | |||||||
Cash and cash equivalents | $ | $ | |||||
Investments | |||||||
Accounts receivable, net | |||||||
Inventories | |||||||
Other current assets | |||||||
Total current assets | |||||||
Long-term investments | |||||||
Property and equipment, net | |||||||
Operating lease right-of-use assets | — | ||||||
Goodwill | |||||||
Intangible assets, net | |||||||
Separate accounts assets | |||||||
Other assets | |||||||
Total assets | $ | $ | |||||
Liabilities: | |||||||
Accounts payable | $ | $ | |||||
Pharmacy claims and discounts payable | |||||||
Health care costs payable | |||||||
Policyholders’ funds | |||||||
Accrued expenses | |||||||
Other insurance liabilities | |||||||
Current portion of operating lease liabilities | — | ||||||
Short-term debt | |||||||
Current portion of long-term debt | |||||||
Total current liabilities | |||||||
Long-term operating lease liabilities | — | ||||||
Long-term debt | |||||||
Deferred income taxes | |||||||
Separate accounts liabilities | |||||||
Other long-term insurance liabilities | |||||||
Other long-term liabilities | |||||||
Total liabilities | |||||||
Commitments and contingencies (Note 16) | |||||||
Shareholders’ equity: | |||||||
Preferred stock, par value $0.01: 0.1 shares authorized; none issued or outstanding | |||||||
Common stock, par value $0.01: 3,200 shares authorized; 1,727 shares issued and 1,302 shares outstanding at December 31, 2019 and 1,720 shares issued and 1,295 shares outstanding at December 31, 2018 and capital surplus | |||||||
Treasury stock, at cost: 425 shares at both December 31, 2019 and 2018 | ( | ) | ( | ) | |||
Retained earnings | |||||||
Accumulated other comprehensive income | |||||||
Total CVS Health shareholders’ equity | |||||||
Noncontrolling interests | |||||||
Total shareholders’ equity | |||||||
Total liabilities and shareholders’ equity | $ | $ | |||||
See accompanying notes to consolidated financial statements.
93
Consolidated Statements of Cash Flows
For the Years Ended December 31, | |||||||||||
In millions | 2019 | 2018 | 2017 | ||||||||
Cash flows from operating activities: | |||||||||||
Cash receipts from customers | $ | $ | $ | ||||||||
Cash paid for inventory and prescriptions dispensed by retail network pharmacies | ( | ) | ( | ) | ( | ) | |||||
Insurance benefits paid | ( | ) | ( | ) | ( | ) | |||||
Cash paid to other suppliers and employees | ( | ) | ( | ) | ( | ) | |||||
Interest and investment income received | |||||||||||
Interest paid | ( | ) | ( | ) | ( | ) | |||||
Income taxes paid | ( | ) | ( | ) | ( | ) | |||||
Net cash provided by operating activities | |||||||||||
Cash flows from investing activities: | |||||||||||
Proceeds from sales and maturities of investments | |||||||||||
Purchases of investments | ( | ) | ( | ) | ( | ) | |||||
Purchases of property and equipment | ( | ) | ( | ) | ( | ) | |||||
Proceeds from sale-leaseback transactions | |||||||||||
Acquisitions (net of cash acquired) | ( | ) | ( | ) | ( | ) | |||||
Proceeds from sale of subsidiary and other assets | |||||||||||
Other | |||||||||||
Net cash used in investing activities | ( | ) | ( | ) | ( | ) | |||||
Cash flows from financing activities: | |||||||||||
Net repayments of short-term debt | ( | ) | ( | ) | ( | ) | |||||
Proceeds from issuance of long-term debt | |||||||||||
Repayments of long-term debt | ( | ) | ( | ) | |||||||
Derivative settlements | ( | ) | |||||||||
Repurchase of common stock | ( | ) | |||||||||
Dividends paid | ( | ) | ( | ) | ( | ) | |||||
Proceeds from exercise of stock options | |||||||||||
Payments for taxes related to net share settlement of equity awards | ( | ) | ( | ) | ( | ) | |||||
Other | ( | ) | |||||||||
Net cash provided by (used in) financing activities | ( | ) | ( | ) | |||||||
Effect of exchange rate changes on cash, cash equivalents and restricted cash | ( | ) | |||||||||
Net increase (decrease) in cash, cash equivalents and restricted cash | ( | ) | |||||||||
Cash, cash equivalents and restricted cash at the beginning of the period | |||||||||||
Cash, cash equivalents and restricted cash at the end of the period | $ | $ | $ | ||||||||
94
For the Years Ended December 31, | |||||||||||
In millions | 2019 | 2018 | 2017 | ||||||||
Reconciliation of net income (loss) to net cash provided by operating activities: | |||||||||||
Net income (loss) | $ | $ | ( | ) | $ | ||||||
Adjustments required to reconcile net income (loss) to net cash provided by operating activities: | |||||||||||
Depreciation and amortization | |||||||||||
Goodwill impairments | |||||||||||
Loss on settlement of defined benefit pension plans | |||||||||||
Stock-based compensation | |||||||||||
Loss on sale of subsidiary | |||||||||||
Loss on early extinguishment of debt | |||||||||||
Deferred income taxes | ( | ) | ( | ) | |||||||
Other noncash items | |||||||||||
Change in operating assets and liabilities, net of effects from acquisitions: | |||||||||||
Accounts receivable, net | ( | ) | ( | ) | ( | ) | |||||
Inventories | ( | ) | ( | ) | ( | ) | |||||
Other assets | ( | ) | ( | ) | ( | ) | |||||
Accounts payable and pharmacy claims and discounts payable | |||||||||||
Health care costs payable and other insurance liabilities | ( | ) | |||||||||
Other liabilities | ( | ) | |||||||||
Net cash provided by operating activities | $ | $ | $ | ||||||||
See accompanying notes to consolidated financial statements.
95
Consolidated Statements of Shareholders’ Equity
Attributable to CVS Health | ||||||||||||||||||||||||||
Number of shares outstanding | Common Stock and Capital Surplus (2) | Accumulated Other Comprehensive Income (Loss) | Total CVS Health Shareholders’ Equity | Total Shareholders’ Equity | ||||||||||||||||||||||
In millions | Common Shares | Treasury Shares (1) | Treasury Stock (1) | Retained Earnings | Noncontrolling Interests | |||||||||||||||||||||
Balance at December 31, 2016 | ( | ) | $ | $ | ( | ) | $ | $ | ( | ) | $ | $ | $ | |||||||||||||
Net income | — | — | — | — | — | |||||||||||||||||||||
Other comprehensive income (Note 13) | — | — | — | — | — | — | ||||||||||||||||||||
Stock option activity, stock awards and other | — | — | — | — | — | |||||||||||||||||||||
Purchase of treasury shares, net of ESPP issuances | — | ( | ) | — | ( | ) | — | — | ( | ) | — | ( | ) | |||||||||||||
Common stock dividends | — | — | — | — | ( | ) | — | ( | ) | — | ( | ) | ||||||||||||||
Other decreases in noncontrolling interests | — | — | — | — | — | — | — | ( | ) | ( | ) | |||||||||||||||
Balance at December 31, 2017 | ( | ) | ( | ) | ( | ) | ||||||||||||||||||||
Adoption of new accounting standards (3) | — | — | — | — | ( | ) | ( | ) | ( | ) | — | ( | ) | |||||||||||||
Net loss | — | — | — | — | ( | ) | — | ( | ) | ( | ) | ( | ) | |||||||||||||
Other comprehensive income (Note 13) | — | — | — | — | — | — | ||||||||||||||||||||
Common shares issued to acquire Aetna | — | — | — | — | ||||||||||||||||||||||
Stock option activity, stock awards and other | — | — | — | — | — | |||||||||||||||||||||
Purchase of treasury shares, net of ESPP issuances | — | ( | ) | — | — | — | — | |||||||||||||||||||
Common stock dividends | — | — | — | — | ( | ) | — | ( | ) | — | ( | ) | ||||||||||||||
Acquisition of noncontrolling interests | — | — | — | — | — | — | — | |||||||||||||||||||
Other decreases in noncontrolling interests | — | — | — | — | — | — | — | ( | ) | ( | ) | |||||||||||||||
Balance at December 31, 2018 | ( | ) | ( | ) | ||||||||||||||||||||||
Adoption of new accounting standards (Note 1) | — | — | — | — | — | |||||||||||||||||||||
Net income (loss) | — | — | — | — | — | ( | ) | |||||||||||||||||||
Other comprehensive income (Note 13) | — | — | — | — | — | — | ||||||||||||||||||||
Stock option activity, stock awards and other | — | — | — | — | ||||||||||||||||||||||
Purchase of treasury shares, net of ESPP issuances | — | ( | ) | — | ( | ) | — | — | ( | ) | — | ( | ) | |||||||||||||
Common stock dividends | — | — | — | — | ( | ) | — | ( | ) | — | ( | ) | ||||||||||||||
Other decreases in noncontrolling interests | — | — | — | — | — | — | — | ( | ) | ( | ) | |||||||||||||||
Balance at December 31, 2019 | ( | ) | $ | $ | ( | ) | $ | $ | $ | $ | $ | |||||||||||||||
_____________________________________________
(1) | Treasury shares include |
(2) | Common stock and capital surplus includes the par value of common stock of $ |
(3) | Reflects the adoption of Accounting Standards Update (“ASU”) 2014-09, Revenue from Contracts with Customers, which resulted in a reduction to retained earnings of $ |
See accompanying notes to consolidated financial statements.
96
Notes to Consolidated Financial Statements
1. | Significant Accounting Policies |
Description of Business
CVS Health Corporation (“CVS Health”), together with its subsidiaries (collectively, “Company”), has approximately 9,900 retail locations, approximately 1,100 walk-in medical clinics, a leading pharmacy benefits manager with approximately 105 million plan members, a dedicated senior pharmacy care business serving more than one million patients per year and expanding specialty pharmacy services. CVS Health also serves an estimated 37 million people through traditional, voluntary and consumer-directed health insurance products and related services, including expanding Medicare Advantage offerings and a leading standalone Medicare Part D prescription drug plan (“PDP”). The Company believes its innovative health care model increases access to quality care, delivers better health outcomes and lowers overall health care costs.
On November 28, 2018 (the “Aetna Acquisition Date”), the Company acquired Aetna Inc. (“Aetna”). As a result of the acquisition of Aetna (the “Aetna Acquisition”), the Company added the Health Care Benefits segment. Certain aspects of Aetna’s operations, including products for which the Company no longer solicits or accepts new customers, such as large case pensions and long-term care insurance products, are included in the Company’s Corporate/Other segment. The consolidated financial statements reflect Aetna’s results subsequent to the Aetna Acquisition Date.
Effective for the first quarter of 2019, the Company realigned the composition of its segments to correspond with changes to its operating model and reflect how its Chief Operating Decision Maker (the “CODM”) reviews information and manages the business. As a result of this realignment, the Company’s SilverScript® PDP moved from the Pharmacy Services segment to the Health Care Benefits segment. In addition, the Company moved Aetna’s mail order and specialty pharmacy operations from the Health Care Benefits segment to the Pharmacy Services segment. Segment financial information has been retrospectively adjusted to reflect these changes.
The Company has four reportable segments: Pharmacy Services, Retail/LTC, Health Care Benefits and Corporate/Other, which are described below.
Pharmacy Services Segment
The Pharmacy Services segment provides a full range of pharmacy benefit management (“PBM”) solutions, including plan design offerings and administration, formulary management, retail pharmacy network management services, mail order pharmacy, specialty pharmacy and infusion services, clinical services, disease management services and medical spend management. The Pharmacy Services segment’s clients are primarily employers, insurance companies, unions, government employee groups, health plans, PDPs, Medicaid managed care plans, plans offered on public health insurance exchanges (“Public Exchanges”) and private health insurance exchanges, other sponsors of health benefit plans and individuals throughout the United States. The Pharmacy Services segment operates retail specialty pharmacy stores, specialty mail order pharmacies, mail order dispensing pharmacies, compounding pharmacies and branches for infusion and enteral nutrition services.
Retail/LTC Segment
The Retail/LTC segment sells prescription drugs and a wide assortment of general merchandise, including over-the-counter drugs, beauty products, cosmetics and personal care products, provides health care services through its MinuteClinic® walk-in medical clinics and conducts long-term care pharmacy (“LTC”) operations, which distribute prescription drugs and provide related pharmacy consulting and other ancillary services to chronic care facilities and other care settings. As of December 31, 2019, the Retail/LTC segment operated approximately 9,900 retail locations, approximately 1,100 MinuteClinic® locations as well as online retail pharmacy websites, LTC pharmacies and onsite pharmacies.
Health Care Benefits Segment
The Health Care Benefits segment is one of the nation’s leading diversified health care benefits providers, serving an estimated 37 million people as of December 31, 2019. The Health Care Benefits segment has the information and resources to help members, in consultation with their health care professionals, make more informed decisions about their health care. The Health Care Benefits segment offers a broad range of traditional, voluntary and consumer-directed health insurance products and related services, including medical, pharmacy, dental and behavioral health plans, medical management capabilities, Medicare Advantage and Medicare Supplement plans, PDPs, Medicaid health care management services, workers’ compensation administrative services and health information technology products and services. The Health Care Benefit segment’s customers include employer groups, individuals, college students, part-time and hourly workers, health plans, health care providers (“providers”), governmental units, government-sponsored plans, labor groups and expatriates. The Company refers to insurance
97
products (where it assumes all or a majority of the risk for medical and dental care costs) as “Insured” and administrative services contract products (where the plan sponsor assumes all or a majority of the risk for medical and dental care costs) as “ASC.” For periods prior to November 28, 2018 (the Aetna Acquisition Date), the Health Care Benefits segment was comprised of the Company’s SilverScript PDP business.
Corporate/Other Segment
The Company presents the remainder of its financial results in the Corporate/Other segment, which consists of:
• | Management and administrative expenses to support the overall operations of the Company, which include certain aspects of executive management and the corporate relations, legal, compliance, human resources, information technology and finance departments, expenses associated with the Company’s investments in its transformation and Enterprise modernization programs and acquisition-related transaction and integration costs; and |
• | Products for which the Company no longer solicits or accepts new customers such as its large case pensions and long-term care insurance products. |
Basis of Presentation
The accompanying consolidated financial statements of CVS Health and its subsidiaries have been prepared in accordance with accounting principles generally accepted in the United States of America (“GAAP”). The consolidated financial statements include the accounts of the Company and its majority-owned subsidiaries and variable interest entities (“VIEs”) for which the Company is the primary beneficiary. All material intercompany balances and transactions have been eliminated.
Reclassifications
Certain prior year amounts have been reclassified to conform with the current year presentation.
Use of Estimates
The preparation of financial statements in conformity with GAAP requires management to make estimates and assumptions that affect the reported amounts in the consolidated financial statements and accompanying notes. Actual results could differ from those estimates.
Cash and Cash Equivalents
Cash and cash equivalents consist of cash and temporary investments with maturities of three months or less when purchased. The Company invests in short-term money market funds, commercial paper and time deposits, as well as other debt securities that are classified as cash equivalents within the accompanying consolidated balance sheets, as these funds are highly liquid and readily convertible to known amounts of cash.
Restricted Cash
Restricted cash included in other current assets on the consolidated balance sheets represents amounts held in escrow accounts in connection with certain recent acquisitions. Restricted cash included in other assets on the consolidated balance sheets represents amounts held in a trust in one of the Company’s captive insurance companies to satisfy collateral requirements associated with the assignment of certain insurance policies. All restricted cash is invested in time deposits, money market funds or commercial paper.
The following is a reconciliation of cash and cash equivalents on the consolidated balance sheets to total cash, cash equivalents and restricted cash on the consolidated statements of cash flows as of December 31, 2019, 2018 and 2017:
In millions | 2019 | 2018 | 2017 | ||||||||
Cash and cash equivalents | $ | $ | $ | ||||||||
Restricted cash (included in other current assets) | |||||||||||
Restricted cash (included in other assets) | |||||||||||
Total cash, cash equivalents and restricted cash at the end of the period in the consolidated statements of cash flows | $ | $ | $ | ||||||||
98
Investments
Debt Securities
Debt securities consist primarily of U.S. Treasury and agency securities, mortgage-backed securities, corporate and foreign bonds and other debt securities. Debt securities are classified as either current or long-term investments based on their contractual maturities unless the Company intends to sell an investment within the next twelve months, in which case it is classified as current on the consolidated balance sheets. Debt securities are classified as available for sale and are carried at fair value. See Note 4 ‘‘Fair Value’’ for additional information on how the Company estimates the fair value of these investments.
The cost for mortgage-backed and other asset-backed securities is adjusted for unamortized premiums and discounts, which are amortized using the interest method over the estimated remaining term of the securities, adjusted for anticipated prepayments.
The Company regularly reviews its debt securities to determine whether a decline in fair value below the cost basis or carrying value is other-than-temporary. When a debt security is in an unrealized capital loss position, the Company monitors the duration and severity of the loss to determine if sufficient market recovery can occur within a reasonable period of time. If a decline in the fair value of a debt security is considered other-than-temporary, the cost basis or carrying value of the debt security is written down. The write-down is then bifurcated into its credit and non-credit related components. The amount of the credit-related component is included in the Company’s net income (loss), and the amount of the non-credit related component is included in other comprehensive income (loss), unless the Company intends to sell the debt security or it is more likely than not that the Company will be required to sell the debt security prior to its anticipated recovery of the debt security’s amortized cost basis. Interest is not accrued on debt securities when management believes the collection of interest is unlikely.
Equity Securities
Equity securities with readily available fair values are measured at fair value with changes in fair value recognized in net income (loss).
Mortgage Loans
Mortgage loan investments on the consolidated balance sheets are valued at the unpaid principal balance, net of impairment reserves. A mortgage loan may be impaired when it is a problem loan (i.e., more than 60 days delinquent, in bankruptcy or in process of foreclosure), a potential problem loan (i.e., high probability of default) or a restructured loan. For impaired loans, a specific impairment reserve is established for the difference between the recorded investment in the loan and the estimated fair value of the collateral. The Company applies its loan impairment policy individually to all loans in its portfolio.
The impairment evaluation described above also considers characteristics and risk factors attributable to the aggregate portfolio. An additional allowance for loan losses is established if it is probable that there will be a credit loss on a group of similar mortgage loans. The following characteristics and risk factors are considered when evaluating if a credit loss is probable on a group of similar mortgage loans: loan-to-value ratios, property type (e.g., office, retail, apartment, industrial), geographic location, vacancy rates and property condition.
Full or partial impairments of loans are recorded at the time an event occurs affecting the legal status of the loan, typically at the time of foreclosure or upon a loan modification giving rise to forgiveness of debt. Interest income on a potential problem loan or restructured loan is accrued to the extent it is deemed to be collectible and the loan continues to perform under its original or restructured terms. Interest income on problem loans is recognized on a cash basis. Cash payments on loans in the process of foreclosure are treated as a return of principal. Mortgage loans with a maturity date or a committed prepayment date within twelve months are classified as current on the consolidated balance sheets.
Other Investments
Other investments consist primarily of the following:
• | Private equity and hedge fund limited partnerships, which are accounted for using the equity method of accounting. Under this method, the carrying value of the investment is based on the value of the Company’s equity ownership of the underlying investment funds provided by the general partner or manager of the investments, the financial statements of which generally are audited. As a result of the timing of the receipt of the valuation information provided by the fund managers, these investments are generally reported on up to a three month lag. The Company reviews investments for impairment at least quarterly and monitors their performance throughout the year through discussions with the administrators, managers and/or general partners. If the Company becomes aware of an impairment of a limited partnership’s investments through its review or prior to receiving the limited partnership’s financial statements at the |
99
financial statement date, an impairment will be recognized by recording a reduction in the carrying value of the limited partnership with a corresponding charge to net investment income.
• | Investment real estate, which is carried on the consolidated balance sheets at depreciated cost, including capital additions, net of write-downs for other-than-temporary declines in fair value. Depreciation is calculated using the straight-line method based on the estimated useful life of each asset. If any real estate investment is considered held-for-sale, it is carried at the lower of its carrying value or fair value less estimated selling costs. The Company generally estimates fair value using a discounted future cash flow analysis in conjunction with comparable sales information. At the time of the sale, the difference between the sales price and the carrying value is recorded as a realized capital gain or loss. |
• | Privately-placed equity securities, which are carried on the consolidated balance sheets at cost less impairments, plus or minus subsequent adjustments for observable price changes. Additionally, as a member of the Federal Home Loan Bank of Boston (“FHLBB”), a subsidiary of the Company is required to purchase and hold shares of the FHLBB. These shares are restricted and carried at cost. |
Net Investment Income
Net investment income on the Company’s investments is recorded when earned and is reflected in the Company’s net income (loss) (other than net investment income on assets supporting experience-rated products). Experience-rated products are products in the large case pensions business where the contract holder, not the Company, assumes investment and other risks, subject to, among other things, minimum guarantees provided by the Company. The effect of investment performance on experience-rated products is allocated to contract holders’ accounts daily, based on the underlying investment experience and, therefore, does not impact the Company’s net income (loss) (as long as the contract’s minimum guarantees are not triggered). Net investment income on assets supporting large case pensions’ experience-rated products is included in net investment income in the consolidated statements of operations and is credited to contract holders’ accounts through a charge to benefit costs.
Realized capital gains and losses on investments (other than realized capital gains and losses on investments supporting experience-rated products) are included as a component of net investment income in the consolidated statements of operations. Realized capital gains and losses are determined on a specific identification basis. Purchases and sales of debt and equity securities and alternative investments are reflected on the trade date. Purchases and sales of mortgage loans and investment real estate are reflected on the closing date.
Realized capital gains and losses on investments supporting large case pensions’ experience-rated products are not included in realized capital gains and losses in the consolidated statements of operations and instead are credited directly to contract holders’ accounts. The contract holders’ accounts are reflected in policyholders’ funds on the consolidated balance sheets.
Unrealized capital gains and losses on investments (other than unrealized capital gains and losses on investments supporting experience-rated products) are reflected in shareholders’ equity, net of tax, as a component of accumulated other comprehensive income. Unrealized capital gains and losses on investments supporting large case pensions’ experience-rated products are credited directly to contract holders’ accounts. The contract holders’ accounts are reflected in policyholders’ funds on the consolidated balance sheets.
Derivative Financial Instruments
The Company uses derivative financial instruments in order to manage interest rate and foreign exchange risk and credit exposure. The Company’s use of these derivatives is generally limited to hedging risk and has principally consisted of using interest rate swaps, treasury rate locks, forward contracts, futures contracts, warrants, put options and credit default swaps.
100
Accounts Receivable
In millions | 2019 | 2018 | |||||
Trade receivables | $ | $ | |||||
Vendor and manufacturer receivables | |||||||
Premium receivables | |||||||
Other receivables | |||||||
Total accounts receivable, net | $ | $ | |||||
The activity in the allowance for doubtful accounts receivable for the years ended December 31, 2019, 2018 and 2017 is as follows:
In millions | 2019 | 2018 | 2017 | ||||||||
Beginning balance | $ | $ | $ | ||||||||
Additions charged to bad debt expense | |||||||||||
Write-offs charged to allowance | ( | ) | ( | ) | ( | ) | |||||
Ending balance | $ | $ | $ | ||||||||
Inventories
Inventories are valued at the lower of cost or net realizable value using the weighted average cost method. Physical inventory counts are taken on a regular basis in each retail store and LTC pharmacy, and a continuous cycle count process is the primary procedure used to validate the inventory balances on hand in each distribution center and mail facility to ensure that the amounts reflected in the consolidated financial statements are properly stated. During the interim period between physical inventory counts, the Company accrues for anticipated physical inventory losses on a location-by-location basis based on historical results and current physical inventory trends.
Reinsurance Recoverables
The Company utilizes reinsurance agreements primarily to: (a) reduce required capital and (b) facilitate the acquisition or disposition of certain insurance contracts. Ceded reinsurance agreements permit the Company to recover a portion of its losses from reinsurers, although they do not discharge the Company’s primary liability as the direct insurer of the risks reinsured. Failure of reinsurers to indemnify the Company could result in losses; however, the Company does not expect charges for unrecoverable reinsurance to have a material effect on its consolidated operating results or financial condition. The Company evaluates the financial condition of its reinsurers and monitors concentrations of credit risk arising from similar geographic regions, activities or economic characteristics of its reinsurers. At December 31, 2019, the Company’s reinsurance recoverables consisted primarily of amounts due from third parties that are rated consistent with companies that are considered to have the ability to meet their obligations. Reinsurance recoverables are recorded as other current assets or other assets on the consolidated balance sheets.
Health Care Contract Acquisition Costs
101
Property and Equipment
Property and equipment is reported at historical cost, net of accumulated depreciation. Property, equipment and improvements to leased premises are depreciated using the straight-line method over the estimated useful lives of the assets, or when applicable, the term of the lease, whichever is shorter. Estimated useful lives generally range from 1 to 40 years for buildings, building improvements and leasehold improvements and 3 to 10 years for fixtures, equipment and internally developed software. Repair and maintenance costs are charged directly to expense as incurred. Major renewals or replacements that substantially extend the useful life of an asset are capitalized and depreciated. Application development stage costs for significant internally developed software projects are capitalized and depreciated.
Property and equipment consists of the following at December 31, 2019 and 2018:
In millions | 2019 | 2018 | |||||
Land | $ | $ | |||||
Building and improvements | |||||||
Fixtures and equipment | |||||||
Leasehold improvements | |||||||
Software | |||||||
Total property and equipment | |||||||
Accumulated depreciation and amortization | ( | ) | ( | ) | |||
Property and equipment, net | $ | $ | |||||
Right-of-Use Assets and Lease Liabilities
The Company determines if an arrangement contains a lease at the inception of a contract. Right-of-use assets represent the Company’s right to use an underlying asset for the lease term and lease liabilities represent the Company’s obligation to make lease payments arising from the lease. Right-of-use assets and lease liabilities are recognized at the commencement date of the lease, renewal date of the lease or significant remodeling of the lease space based on the present value of the remaining future minimum lease payments. As the interest rate implicit in the Company’s leases is not readily determinable, the Company utilizes its incremental borrowing rate, determined by class of underlying asset, to discount the lease payments. The operating lease right-of-use assets also include lease payments made before commencement and are reduced by lease incentives.
The Company’s real estate leases typically contain options that permit renewals for additional periods of up to five years each. For real estate leases, the options to extend are not considered reasonably certain at lease commencement because the Company reevaluates each lease on a regular basis to consider the economic and strategic incentives of exercising the renewal options and regularly opens or closes stores to align with its operating strategy. Generally, the renewal option periods are not included within the lease term and the associated payments are not included in the measurement of the right-of-use asset and lease liability. Similarly, renewal options are not included in the lease term for non-real estate leases because they are not considered reasonably certain of being exercised at lease commencement. Leases with an initial term of 12 months or less are not recorded on the balance sheets, and lease expense is recognized on a straight-line basis over the term of the short-term lease.
For real estate leases, the Company accounts for lease components and nonlease components as a single lease component. Certain real estate leases require additional payments based on sales volume, as well as reimbursement for real estate taxes, common area maintenance and insurance, which are expensed as incurred as variable lease costs. Other real estate leases contain one fixed lease payment that includes real estate taxes, common area maintenance and insurance. These fixed payments are considered part of the lease payment and included in the right-of-use assets and lease liabilities.
See Note 6 ‘‘Leases’’ for additional information about right-of-use assets and lease liabilities.
102
Goodwill
Intangible Assets
The Company’s identifiable intangible assets consist primarily of trademarks, trade names, customer contracts/relationships, covenants not to compete, technology, provider networks and value of business acquired (“VOBA”). These intangible assets arise primarily from the determination of their respective fair market values at the date of acquisition. Amounts assigned to identifiable intangible assets, and their related useful lives, are derived from established valuation techniques and management estimates.
The Company’s definite-lived intangible assets are amortized over their estimated useful lives based upon the pattern of future cash flows attributable to the asset. Other than VOBA, definite-lived intangible assets are amortized using the straight-line method. VOBA is amortized over the expected life of the acquired contracts in proportion to estimated premiums. Indefinite-lived intangible assets are not amortized but are tested for impairment annually, or more frequently if necessary, as further described in “Long-Lived Asset Impairment” below.
See Note 5 ‘‘Goodwill and Other Intangibles’’ for additional information about intangible assets.
Long-Lived Asset Impairment
The Company evaluates the recoverability of long-lived assets, excluding goodwill and indefinite-lived intangible assets, which are tested for impairment using separate tests described below, whenever events or changes in circumstances indicate that the carrying value of such asset may not be recoverable. The Company groups and evaluates these long-lived assets for impairment at the lowest level at which individual cash flows can be identified. If indicators of impairment are present, the Company first compares the carrying amount of the asset group to the estimated future cash flows associated with the asset group (undiscounted and without interest charges). If the estimated future cash flows used in this analysis are less than the carrying amount of the asset group, an impairment loss calculation is prepared. The impairment loss calculation compares the carrying amount of the asset group to the asset group’s estimated future cash flows (discounted and with interest charges). If required, an impairment loss is recorded for the portion of the asset group’s carrying value that exceeds the asset group’s estimated future cash flows (discounted and with interest charges). During the year ended December 31, 2019, the Company recorded store rationalization charges of $231 million, primarily related to operating lease right-of-use asset impairment charges. See Note 6 ‘‘Leases’’ for additional information about the right-of-use asset impairment charges. During the year ended December 31, 2018, the Company recognized a $43 million long-lived asset impairment charge, primarily related to the impairment of property and equipment. There were no material impairment charges recognized on long-lived assets in the year ended December 31, 2017.
When evaluating goodwill for potential impairment, the Company compares the fair value of its reporting units to their respective carrying amounts. The Company estimates the fair value of its reporting units using a combination of a discounted cash flow method and a market multiple method. If the carrying amount of a reporting unit exceeds its estimated fair value, an impairment loss is recognized in an amount equal to that excess. During the third quarter of 2019, the Company performed its required annual goodwill impairment tests and concluded there were no goodwill impairments as of the testing date. See Note 5 ‘‘Goodwill and Other Intangibles’’ for additional information about goodwill impairment charges recorded during the years ended December 31, 2018 and 2017.
103
Separate Accounts
Separate Accounts assets and liabilities related to large case pensions products represent funds maintained to meet specific objectives of contract holders who bear the investment risk. These assets and liabilities are carried at fair value. Net investment income (including net realized capital gains and losses) accrue directly to such contract holders. The assets of each account are legally segregated and are not subject to claims arising from the Company’s other businesses. Deposits, withdrawals and net investment income (including net realized and net unrealized capital gains and losses) on Separate Accounts assets are not reflected in the consolidated statements of operations or cash flows. Management fees charged to contract holders are included in services revenue and recognized over the period earned.
Health Care Costs Payable
Health care costs payable consist principally of unpaid fee-for-service medical, dental and pharmacy claims, capitation costs, other amounts due to health care providers pursuant to risk-sharing arrangements related to the Health Care Benefits segment’s Insured Commercial, Medicare and Medicaid products and accruals for state assessments. Unpaid health care claims include an estimate of payments the Company will make for (i) services rendered to the Company’s Insured members but not yet reported to the Company and (ii) claims which have been reported to the Company but not yet paid, each as of the financial statement date (collectively, “IBNR”). Health care costs payable also include an estimate of the cost of services that will continue to be rendered after the financial statement date if the Company is obligated to pay for such services in accordance with contractual or regulatory requirements. Such estimates are developed using actuarial principles and assumptions which consider, among other things, historical and projected claim submission and processing patterns, assumed and historical medical cost trends, historical utilization of medical services, claim inventory levels, changes in Insured membership and product mix, seasonality and other relevant factors. The Company reflects changes in these estimates in benefit costs in the Company’s consolidated operating results in the period they are determined. Capitation costs represent contractual monthly fees paid to participating physicians and other medical providers for providing medical care, regardless of the volume of medical services provided to the Insured member. Amounts due under risk-sharing arrangements are based on the terms of the underlying contracts with the providers and consider claims experience under the contracts through the financial statement date.
The Company develops its estimate of IBNR using actuarial principles and assumptions that consider numerous factors. Of those factors, the Company considers the analysis of historical and projected claim payment patterns (including claims submission and processing patterns) and the assumed health care cost trend rate (the year-over-year change in per member per month health care costs) to be the most critical assumptions. In developing its IBNR estimate, the Company consistently applies these actuarial principles and assumptions each period, with consideration to the variability of related factors. There have been no significant changes to the methodologies or assumptions used to develop the Company’s estimate of IBNR in 2019.
The Company analyzes historical claim payment patterns by comparing claim incurred dates (i.e., the date services were provided) to claim payment dates to estimate “completion factors.” The Company uses completion factors predominantly to estimate the ultimate cost of claims incurred more than three months before the financial statement date. The Company estimates completion factors by aggregating claim data based on the month of service and month of claim payment and estimating the percentage of claims incurred for a given month that are complete by each month thereafter. For any given month, substantially all claims are paid within six months of the date of service, but it can take up to 48 months or longer after the date of service before all of the claims are completely resolved and paid. These historically-derived completion factors are then applied to claims paid through the financial statement date to estimate the ultimate claim cost for a given month’s incurred claim activity. The difference between the estimated ultimate claim cost and the claims paid through the financial statement date represents the Company’s estimate of claims remaining to be paid as of the financial statement date and is included in the Company’s health care costs payable. The completion factors the Company uses reflect judgments and possible adjustments based on data such as claim inventory levels, claim submission and processing patterns and, to a lesser extent, other factors such as changes in health care cost trend rates, changes in Insured membership and changes in product mix. If claims are submitted or processed on a faster (slower) pace than prior periods, the actual claims may be more (less) complete than originally estimated using the Company’s completion factors, which may result in reserves that are higher (lower) than the ultimate cost of claims.
Because claims incurred within three months before the financial statement date are less mature, the Company uses a combination of historically-derived completion factors and the assumed health care cost trend rate to estimate the ultimate cost of claims incurred for these months. The Company applies its actuarial judgment and places a greater emphasis on the assumed health care cost trend rate for the most recent claim incurred dates as these months may be influenced by seasonal patterns and changes in membership and product mix.
104
The Company’s health care cost trend rate is affected by changes in per member utilization of medical services as well as changes in the unit cost of such services. Many factors influence the health care cost trend rate, including the Company’s ability to manage benefit costs through product design, negotiation of favorable provider contracts and medical management programs, as well as the mix of the Company’s business. The health status of the Company’s Insured members, aging of the population and other demographic characteristics, advances in medical technology and other factors continue to contribute to rising per member utilization and unit costs. Changes in health care practices, inflation, new technologies, increases in the cost of prescription drugs (including specialty pharmacy drugs), direct-to-consumer marketing by pharmaceutical companies, clusters of high-cost cases, claim intensity, changes in the regulatory environment, health care provider or member fraud and numerous other factors also contribute to the cost of health care and the Company’s health care cost trend rate.
For each reporting period, the Company uses an extensive degree of judgment in the process of estimating its health care costs payable. As a result, considerable variability and uncertainty is inherent in such estimates, particularly with respect to claims with claim incurred dates of three months or less before the financial statement date; and the adequacy of such estimates is highly sensitive to changes in assumed completion factors and the assumed health care cost trend rates. For each reporting period the Company recognizes the actuarial best estimate of health care costs payable considering the potential volatility in assumed completion factors and health care cost trend rates, as well as other factors. The Company believes its estimate of health care costs payable is reasonable and adequate to cover its obligations at December 31, 2019; however, actual claim payments may differ from the Company’s estimates. A worsening (or improvement) of the Company’s health care cost trend rates or changes in completion factors from those that the Company assumed in estimating health care costs payable at December 31, 2019 would cause these estimates to change in the near term, and such a change could be material.
Each quarter, the Company re-examines previously established health care costs payable estimates based on actual claim payments for prior periods and other changes in facts and circumstances. Given the extensive degree of judgment in this estimate, it is possible that the Company’s estimates of health care costs payable could develop either favorably (that is, its actual benefit costs for the period were less than estimated) or unfavorably. The changes in the Company’s estimate of health care costs payable may relate to a prior quarter, prior year or earlier periods. For a roll forward of the Company’s health care costs payable, see Note 7 ‘‘Health Care Costs Payable.’’ The Company’s reserving practice is to consistently recognize the actuarial best estimate of its ultimate liability for health care costs payable.
Other Insurance Liabilities
Unpaid Claims
Unpaid claims consist primarily of reserves associated with certain short-duration group disability and term life insurance contracts, including an estimate for IBNR as of the financial statement date. Reserves associated with certain short-duration group disability and term life insurance contracts are based upon the Company’s estimate of the present value of future benefits, which is based on assumed investment yields and assumptions regarding mortality, morbidity and recoveries from the U.S. Social Security Administration. The Company develops its estimate of IBNR using actuarial principles and assumptions which consider, among other things, contractual requirements, claim incidence rates, claim recovery rates, seasonality and other relevant factors. The Company discounts certain claim liabilities related to group long-term disability and life insurance waiver of premium contracts. The discount rates generally reflect the Company’s expected investment returns for the investments supporting all incurral years of these liabilities. The discount rates for retrospectively-rated contracts are set at contractually specified levels. The Company’s estimates of unpaid claims are subject to change due to changes in the underlying experience of the insurance contracts, changes in investment yields or other factors, and these changes are recorded in current and future benefits in the consolidated statements of operations in the period they are determined. The Company estimates its reserve for claims IBNR for life products largely based on completion factors. The completion factors used are based on the Company’s historical experience and reflect judgments and possible adjustments based on data such as claim inventory levels, claim payment patterns, changes in business volume and other factors. If claims are submitted or processed on a faster (slower) pace than historical periods, the actual claims may be more (less) complete than originally estimated using completion factors, which may result in reserves that are higher (lower) than required to cover future life benefit payments. There have been no significant changes to the methodologies or assumptions used to develop the Company’s estimate of unpaid claims IBNR in 2019. As of December 31, 2019, unpaid claims balances of $704 million and $1.8 billion were recorded in other insurance liabilities and other long-term insurance liabilities, respectively. As of December 31, 2018, unpaid claims balances of $816 million and $1.9 billion were recorded in other insurance liabilities and other long-term insurance liabilities, respectively.
Substantially all life and disability insurance liabilities have been fully ceded to unrelated third parties through indemnity reinsurance agreements; however, the Company remains directly obligated to the policyholders.
105
Future Policy Benefits
Premium Deficiency Reserves
Policyholders’ Funds
Policyholders’ funds consist primarily of reserves for pension and annuity investment contracts and customer funds associated with certain health contracts. Reserves for such contracts are equal to cumulative deposits less withdrawals and charges plus interest credited thereon, net of experience-rated adjustments. In 2019, interest rates for pension and annuity investment contracts ranged from 3.5 % to 15.0 %. From the Aetna Acquisition Date through December 31, 2018, interest rates for pension and annuity investment contracts ranged from 3.5 % to 13.4 %. Reserves for contracts subject to experience rating reflect the Company’s rights as well as the rights of policyholders and plan participants. The Company also holds funds for health savings accounts (“HSAs”) on behalf of members associated with high deductible health plans. These amounts are held to pay for qualified health care expenses incurred by these members. The HSA balances were approximately $2.2 billion and $2.1 billion at December 31, 2019 and 2018, respectively, and are reflected in other current assets with a corresponding liability in policyholders’ funds.
Policyholders’ funds liabilities that are expected to be paid within twelve months from the balance sheet date are classified as current on the consolidated balance sheets. Policyholders’ funds liabilities that are expected to be paid greater than twelve months from the balance sheet date are included in other long-term liabilities on the consolidated balance sheets.
Self-Insurance Liabilities
Foreign Currency Translation and Transactions
For non-U.S. dollar functional currency locations, (i) assets and liabilities are translated at end-of-period exchange rates, (ii) revenues and expenses are translated at average exchange rates in effect during the period and (iii) equity is translated at historical exchange rates. The resulting cumulative translation adjustments are included as a component of accumulated other comprehensive income (loss).
106
For U.S. dollar functional currency locations, foreign currency assets and liabilities are remeasured into U.S. dollars at end-of-period exchange rates, except for nonmonetary balance sheet accounts which are remeasured at historical exchange rates. Revenues and expenses are remeasured at average exchange rates in effect during each period, except for those expenses related to the nonmonetary balance sheet amounts which are remeasured at historical exchange rates. Gains or losses from foreign currency remeasurement are included in net income (loss).
On July 1, 2019, the Company sold its Brazilian subsidiary, Drogaria Onofre Ltda. (“Onofre”) for an immaterial amount. The Company recorded a loss on the divestiture, which included the elimination of the subsidiary’s $154 million cumulative translation adjustment from accumulated other comprehensive income. Gains and losses from foreign currency transactions and the effects of foreign currency remeasurements were not material in 2018 or 2017.
Revenue Recognition
Pharmacy Services Segment
The Pharmacy Services segment sells prescription drugs directly through its mail service dispensing pharmacies and indirectly through the Company’s retail pharmacy network. The Company’s pharmacy benefit arrangements are accounted for in a manner consistent with a master supply arrangement as there are no contractual minimum volumes and each prescription is considered a separate purchasing decision and distinct performance obligation transferred at a point in time. PBM services performed in connection with each prescription claim are considered part of a single performance obligation which culminates in the dispensing of prescription drugs.
The Company recognizes revenue using the gross method at the contract price negotiated with its clients when the Company has concluded it controls the prescription drug before it is transferred to the client plan members. The Company controls prescriptions dispensed indirectly through its retail pharmacy network because it has separate contractual arrangements with those pharmacies, has discretion in setting the price for the transaction and assumes primary responsibility for fulfilling the promise to provide prescription drugs to its client plan members while also performing the related PBM services.
Revenues include (i) the portion of the price the client pays directly to the Company, net of any discounts earned on brand name drugs or other discounts and refunds paid back to the client (see “Drug Discounts” and “Guarantees” below), (ii) the price paid to the Company by client plan members for mail order prescriptions and the price paid to retail network pharmacies by client plan members for retail prescriptions (“retail co-payments”), and (iii) claims based administrative fees for retail pharmacy network contracts. Sales taxes are not included in revenues.
The Company recognizes revenue when control of the prescription drugs is transferred to customers, in an amount that reflects the consideration the Company expects to be entitled to receive in exchange for those prescription drugs. The Company has established the following revenue recognition policies for the Pharmacy Services segment:
• | Revenues generated from prescription drugs sold by mail service dispensing pharmacies are recognized when the prescription drug is delivered to the client plan member. At the time of delivery, the Company has performed substantially all of its performance obligations under its client contracts and does not experience a significant level of returns or reshipments. |
• | Revenues generated from prescription drugs sold by third party pharmacies in the Company’s retail pharmacy network and associated administrative fees are recognized at the Company’s point-of-sale, which is when the claim is adjudicated by the Company’s online claims processing system and the Company has transferred control of the prescription drug and performed all of its performance obligations. |
For contracts under which the Company acts as an agent or does not control the prescription drugs prior to transfer to the client plan member, revenue is recognized using the net method.
Drug Discounts
The Company records revenue net of manufacturers’ rebates earned by its clients based on their plan members’ utilization of brand-name formulary drugs. The Company estimates these rebates at period-end based on actual and estimated claims data and its estimates of the manufacturers’ rebates earned by its clients. The estimates are based on the best available data at period-end and recent history for the various factors that can affect the amount of rebates due to the client. The Company adjusts its rebates payable to clients to the actual amounts paid when these rebates are paid or as significant events occur. Any cumulative effect of these adjustments is recorded against revenues at the time it is identified. Adjustments generally result from contract changes with clients or manufacturers that have retroactive rebate adjustments, differences between the estimated and actual product mix subject to rebates, or whether the brand name drug was included in the applicable formulary. The effect of adjustments
107
between estimated and actual manufacturers’ rebate amounts has not been material to the Company’s operating results or financial condition.
Guarantees
The Company also adjusts revenues for refunds owed to clients resulting from pricing guarantees and performance against defined service and performance metrics. The inputs to these estimates are not subject to a high degree of subjectivity or volatility. The effect of adjustments between estimated and actual pricing and performance refund amounts has not been material to the Company’s operating results or financial condition.
Retail/LTC Segment
Retail Pharmacy
The Company’s retail drugstores recognize revenue at the time the customer takes possession of the merchandise. For pharmacy sales, each prescription claim is its own arrangement with the customer and is a performance obligation, separate and distinct from other prescription claims under other retail network arrangements. Revenues are adjusted for refunds owed to third party payers resulting from pricing guarantees and performance against defined value-based service and performance metrics. The inputs to these estimates are not subject to a high degree of subjectivity or volatility. The effect of adjustments between estimated and actual pricing and performance refund amounts has not been material to the Company’s operating results or financial condition.
Revenue from Company gift cards purchased by customers is deferred as a contract liability until goods or services are transferred. Any amounts not expected to be redeemed by customers (i.e., breakage) are recognized based on historical redemption patterns.
Customer returns are not material to the Company’s operating results or financial condition. Sales taxes are not included in revenues.
Loyalty and Other Programs
The Company’s customer loyalty program, ExtraCare®, consists of two components, ExtraSavingsTM and ExtraBucks® Rewards. ExtraSavings are coupons that are recorded as a reduction of revenue when redeemed as the Company concluded that they do not represent a promise to the customer to deliver additional goods or services at the time of issuance because they are not tied to a specific transaction or spending level.
ExtraBucks Rewards are accumulated by customers based on their historical spending levels. Thus, the Company has determined that there is an additional performance obligation to those customers at the time of the initial transaction. The Company allocates the transaction price to the initial transaction and the ExtraBucks Rewards transaction based upon the relative standalone selling price, which considers historical redemption patterns for the rewards. Revenue allocated to ExtraBucks Rewards is recognized as those rewards are redeemed. At the end of each period, unredeemed ExtraBucks Rewards are reflected as a contract liability.
The Company also offers a subscription-based membership program, CarePass®, under which members are entitled to a suite of benefits delivered over the course of the subscription period, as well as a promotional reward that can be redeemed for future goods and services. Subscriptions are paid for on a monthly or annual basis at the time of or in advance of the Company delivering the goods and services. Revenue from these arrangements is recognized as the performance obligations are satisfied.
Long-term Care
Revenue is recognized when control of the promised goods or services is transferred to customers in an amount that reflects the consideration the Company expects to be entitled to receive in exchange for those goods or services. Each prescription claim represents a separate performance obligation of the Company, separate and distinct from other prescription claims under customer arrangements. A significant portion of Long-term Care revenue from sales of pharmaceutical and medical products is reimbursed by the federal Medicare Part D program and, to a lesser extent, state Medicaid programs. The Company monitors its revenues and receivables from these reimbursement sources, as well as long-term care facilities and other third party insurance payors, and reduces revenue at the revenue recognition date to properly account for the variable consideration due to anticipated differences between billed and reimbursed amounts. Accordingly, the total revenues and receivables reported in the Company’s consolidated financial statements are recorded at the amount expected to be ultimately received from these payors.
Patient co-payments associated with Medicare Part D, certain state Medicaid programs, Medicare Part B and certain third party payors typically are not collected at the time products are delivered or services are rendered, but are billed to the individuals as part of normal billing procedures and subject to normal accounts receivable collections procedures.
108
Walk-In Medical Clinics
For services provided by the Company’s walk-in medical clinics, revenue recognition occurs for completed services provided to patients, with adjustments taken for third party payor contractual obligations and patient direct bill historical collection rates.
Health Care Benefits Segment
Health Care Benefits revenue is principally derived from insurance premiums and fees billed to customers. Revenue is recognized based on customer billings, which reflect contracted rates per employee and the number of covered employees recorded in the Company’s records at the time the billings are prepared. Billings are generally sent monthly for coverage during the following month.
The Company’s billings may be subsequently adjusted to reflect enrollment changes due to member terminations or other factors. These adjustments are known as retroactivity adjustments. In each period, the Company estimates the amount of future retroactivity and adjusts the recorded revenue accordingly. As information regarding actual retroactivity amounts becomes known, the Company refines its estimates and records any required adjustments to revenues in the period in which they arise.
Premium Revenue
Premiums are recognized as revenue in the month in which the enrollee is entitled to receive health care services. Premiums are reported net of an allowance for estimated terminations and uncollectible amounts. Additionally, premium revenue subject to the Patient Protection and Affordable Care Act and the Health Care and Education Reconciliation Act of 2010’s (as amended, collectively, the “ACA’s”) minimum medical loss ratio (“MLR”) rebate requirements is recorded net of the estimated minimum MLR rebates for the current calendar year. Premiums related to unexpired contractual coverage periods (unearned premiums) are reported as other insurance liabilities on the consolidated balance sheets and recognized as revenue when earned.
Some of the Company’s contracts allow for premiums to be adjusted to reflect actual experience or the relative health status of Insured members. Such adjustments are reasonably estimable at the outset of the contract, and adjustments to those estimates are made based on actual experience of the customer emerging under the contract and the terms of the underlying contract.
Services Revenue
Services revenue relates to contracts that can include various combinations of services or series of services which generally are capable of being distinct and accounted for as separate performance obligations. The Health Care Benefits segment’s services revenue primarily consists of the following components:
• | ASC fees are received in exchange for performing certain claim processing and member services for ASC members. ASC fee revenue is recognized over the period the service is provided. Some of the Company’s administrative services contracts include guarantees with respect to certain functions, such as customer service response time, claim processing accuracy and claim processing turnaround time, as well as certain guarantees that a plan sponsor’s benefit claim experience will fall within a certain range. With any of these guarantees, the Company is financially at risk if the conditions of the arrangements are not met, although the maximum amount at risk typically is limited to a percentage of the fees otherwise payable to the Company by the customer involved. Each period the Company estimates its obligations under the terms of these guarantees and records its estimate as an offset to services revenues. |
• | Workers’ compensation administrative services consist of fee-based managed care services. Workers’ compensation administrative services revenue is recognized once the service is provided. |
Accounting for Medicare Part D
Revenues include insurance premiums earned by the Company’s PDPs, which are determined based on the PDP’s annual bid and related contractual arrangements with the U.S. Centers for Medicare & Medicaid Services (“CMS”). The insurance premiums include a beneficiary premium, which is the responsibility of the PDP member, and can be subsidized by CMS in the case of low-income members, and a direct premium paid by CMS. Premiums collected in advance are initially recorded within other insurance liabilities and are then recognized ratably as revenue over the period in which members are entitled to receive benefits.
Revenues also include a risk-sharing feature of the Medicare Part D program design referred to as the risk corridor. The Company estimates variable consideration in the form of amounts payable to, or receivable from, CMS under the risk corridor, and adjusts revenue based on calculations of additional subsidies to be received from or owed to CMS at the end of the reporting year.
In addition to Medicare Part D premiums, the Company receives additional payments each month from CMS related to catastrophic reinsurance, low-income cost sharing subsidies and coverage gap benefits. If the subsidies received differ from the
109
amounts earned from actual prescriptions transferred, the difference is recorded in either accounts receivable, net or accrued expenses.
Disaggregation of Revenue
The following table disaggregates the Company’s revenue by major source in each segment for the years ended December 31, 2019 and 2018:
In millions | Pharmacy Services | Retail/ LTC | Health Care Benefits | Corporate/ Other | Intersegment Eliminations | Consolidated Totals | |||||||||||||||||
2019 | |||||||||||||||||||||||
Major goods/services lines: | |||||||||||||||||||||||
Pharmacy | $ | $ | $ | $ | $ | ( | ) | $ | |||||||||||||||
Front Store | |||||||||||||||||||||||
Premiums | |||||||||||||||||||||||
Net investment income | |||||||||||||||||||||||
Other | |||||||||||||||||||||||
Total | $ | $ | $ | $ | $ | ( | ) | $ | |||||||||||||||
Pharmacy Services distribution channel: | |||||||||||||||||||||||
Pharmacy network (1) | $ | ||||||||||||||||||||||
Mail choice (2) | |||||||||||||||||||||||
Other | |||||||||||||||||||||||
Total | $ | ||||||||||||||||||||||
2018 | |||||||||||||||||||||||
Major goods/services lines: | |||||||||||||||||||||||
Pharmacy | $ | $ | $ | $ | $ | ( | ) | $ | |||||||||||||||
Front Store | |||||||||||||||||||||||
Premiums | |||||||||||||||||||||||
Net investment income | |||||||||||||||||||||||
Other | |||||||||||||||||||||||
Total | $ | $ | $ | $ | $ | ( | ) | $ | |||||||||||||||
Pharmacy Services distribution channel: | |||||||||||||||||||||||
Pharmacy network (1) (3) | $ | ||||||||||||||||||||||
Mail choice (2) (3) | |||||||||||||||||||||||
Other | |||||||||||||||||||||||
Total | $ | ||||||||||||||||||||||
(1) | Pharmacy Services pharmacy network is defined as claims filled at retail and specialty retail pharmacies, including the Company’s retail pharmacies and LTC pharmacies, but excluding Maintenance Choice® activity, which is included within the mail choice category. Maintenance choice permits eligible client plan members to fill their maintenance prescriptions through mail order delivery or at a CVS pharmacy retail store for the same price as mail order. |
(2) | Pharmacy Services mail choice is defined as claims filled at a Pharmacy Services mail order facility, which includes specialty mail claims inclusive of Specialty Connect® claims picked up at a retail pharmacy, as well as prescriptions filled at the Company’s retail pharmacies under the Maintenance Choice program. |
(3) | Certain prior year amounts have been reclassified for consistency with the current period presentation. |
Contract Balances
Contract liabilities primarily represent the Company’s obligation to transfer additional goods or services to a customer for which the Company has received consideration, and include ExtraBucks Rewards and unredeemed Company gift cards. The consideration received remains a contract liability until goods or services have been provided to the customer. In addition, the Company recognizes breakage on Company gift cards based on historical redemption patterns.
110
The following table provides information about receivables and contract liabilities from contracts with customers as of December 31, 2019 and 2018:
In millions | 2019 | 2018 | |||||
Trade receivables (included in accounts receivable, net) | $ | $ | |||||
Contract liabilities (included in accrued expenses) | |||||||
During the year ended December 31, 2019, the contract liabilities balance includes increases related to customers’ earnings in ExtraBucks Rewards or issuances of Company gift cards and decreases for revenues recognized during the period as a result of the redemption of ExtraBucks Rewards or Company gift cards and breakage of Company gift cards. Below is a summary of such changes:
In millions | 2019 | 2018 | |||||
Balance at December 31, 2018 | $ | $ | |||||
Adoption of ASU 2014-09 | |||||||
Rewards earnings and gift card issuances | |||||||
Redemption and breakage | ( | ) | ( | ) | |||
Balance at December 31, 2019 | $ | $ | |||||
Cost of Products Sold
The Company accounts for cost of products sold as follows:
Pharmacy Services Segment
Cost of products sold includes: (i) the cost of prescription drugs sold during the reporting period directly through the Company’s mail service dispensing pharmacies and indirectly through the Company’s retail pharmacy network, (ii) shipping and handling costs, and (iii) the operating costs of the Company’s mail service dispensing pharmacies and client service operations and related information technology support costs including depreciation and amortization. The cost of prescription drugs sold component of cost of products sold includes: (i) the cost of the prescription drugs purchased from manufacturers or distributors and shipped to members in clients’ benefit plans from the Company’s mail service dispensing pharmacies, net of any volume-related or other discounts (see “Vendor Allowances and Purchase Discounts” below) and (ii) the cost of prescription drugs sold (including retail co-payments) through the Company’s retail pharmacy network under contracts where the Company is the principal, net of any volume-related or other discounts.
Retail/LTC Segment
Cost of products sold includes: the cost of merchandise sold during the reporting period, including prescription drug costs, and the related purchasing costs, warehousing and delivery costs (including depreciation and amortization) and actual and estimated inventory losses.
Vendor Allowances and Purchase Discounts
The Company accounts for vendor allowances and purchase discounts as follows:
Pharmacy Services Segment
The Pharmacy Services segment receives purchase discounts on products purchased. Contractual arrangements with vendors, including manufacturers, wholesalers and retail pharmacies, normally provide for the Pharmacy Services segment to receive purchase discounts from established list prices in one, or a combination, of the following forms: (i) a direct discount at the time of purchase, (ii) a discount for the prompt payment of invoices or (iii) when products are purchased indirectly from a manufacturer (e.g., through a wholesaler or retail pharmacy), a discount (or rebate) paid subsequent to dispensing. These rebates are recognized when prescriptions are dispensed and are generally calculated and billed to manufacturers within 30 days of the end of each completed quarter. Historically, the effect of adjustments resulting from the reconciliation of rebates recognized to the amounts billed and collected has not been material to the Company’s operating results or financial condition. The Company accounts for the effect of any such differences as a change in accounting estimate in the period the reconciliation is completed. The Pharmacy Services segment also receives additional discounts under its wholesaler contracts if it exceeds contractually defined purchase volumes. In addition, the Pharmacy Services segment receives fees from pharmaceutical
111
manufacturers for administrative services. Purchase discounts and administrative service fees are recorded as a reduction of cost of products sold.
Retail/LTC Segment
Vendor allowances received by the Retail/LTC segment reduce the carrying cost of inventory and are recognized in cost of products sold when the related inventory is sold, unless they are specifically identified as a reimbursement of incremental costs for promotional programs and/or other services provided. Amounts that are directly linked to advertising commitments are recognized as a reduction of advertising expense (included in operating expenses) when the related advertising commitment is satisfied. Any such allowances received in excess of the actual cost incurred also reduce the carrying cost of inventory. The total value of any upfront payments received from vendors that are linked to purchase commitments is initially deferred. The deferred amounts are then amortized to reduce cost of products sold over the life of the contract based upon purchase volume. The total value of any upfront payments received from vendors that are not linked to purchase commitments is also initially deferred. The deferred amounts are then amortized to reduce cost of products sold on a straight-line basis over the life of the related contract. The total amortization of these upfront payments was not material to the Company’s consolidated financial statements in any of the periods presented.
Health Care Reform
Health Insurer Fee
Since January 1, 2014, the ACA imposes an annual premium-based health insurer fee (“HIF”) for each calendar year payable in September which is not deductible for tax purposes. The Company is required to estimate a liability for the HIF at the beginning of the calendar year in which the fee is payable with a corresponding deferred asset that is amortized ratably to operating expenses over the calendar year. The Company records the liability for the HIF in accrued expenses and records the deferred asset in other current assets. There was no expense related to the HIF in 2019 and 2017, since the HIF was temporarily suspended for each of those periods. In 2018, operating expenses included $157 million related to the Company’s share of the HIF. The HIF applies for 2020, and in December 2019, the HIF was repealed for calendar years after 2020.
Risk Adjustment
The ACA established a permanent risk adjustment program to transfer funds from qualified individual and small group insurance plans with below average risk scores to plans with above average risk scores. Based on the risk of the Company’s qualified plan members relative to the average risk of members of other qualified plans in comparable markets, as defined by the ACA, the Company estimates its ultimate risk adjustment receivable (recorded in accounts receivable) or payable (recorded in accrued expenses) for the current calendar year and reflects the pro-rata year-to-date impact as an adjustment to premium revenue.
Advertising Costs
Advertising costs, which are reduced by the portion funded by vendors, are expensed when the related advertising takes place. Net advertising costs, which are included in operating expenses, were $396 million, $364 million and $230 million in 2019, 2018 and 2017, respectively.
Stock-Based Compensation
Stock-based compensation is measured at the grant date based on the fair value of the award and is recognized as an expense over the applicable requisite service period of the stock award (generally 3 to 5 years) using the straight-line method.
Income Taxes
The Company accounts for income taxes under the asset and liability method, which requires the recognition of deferred tax assets and liabilities for the expected future tax consequences of events that have been included in the consolidated financial statements. Under this method, deferred tax assets and liabilities are determined on the basis of the differences between the consolidated financial statements and tax basis of assets and liabilities using enacted tax rates in effect for the year or years in which the differences are expected to reverse. The effect of a change in the tax rates on deferred tax assets and liabilities is recognized in income in the period that includes the enactment date of such change.
The Tax Cuts and Jobs Act (the “TCJA”) was enacted on December 22, 2017. Among numerous changes to existing tax laws, the TCJA permanently reduced the federal corporate income tax rate from 35% to 21% effective January 1, 2018. The effects of changes in tax rates on deferred tax balances are required to be taken into consideration in the period in which the changes are
112
enacted, regardless of when they are effective. As a result of the reduction of the corporate income tax rate under the TCJA, the Company estimated the revaluation of its net deferred tax liabilities and recorded a provisional income tax benefit of approximately $1.5 billion for year ended December 31, 2017. In 2018, the Company completed its process of determining the TCJA’s final impact and recorded an additional income tax benefit of $100 million.
The Company recognizes deferred tax assets to the extent that it believes these assets are more likely than not to be realized. In making such a determination, the Company considers all available positive and negative evidence, including future reversals of existing taxable temporary differences, projected future taxable income, tax planning strategies, and the Company’s recent operating results. The Company establishes a valuation allowance when it does not consider it more likely than not that a deferred tax asset will be recovered.
The Company records uncertain tax positions on the basis of a two-step process whereby (1) the Company determines whether it is more likely than not that the tax positions will be sustained on the basis of the technical merits of the position and (2) for those tax positions that meet the more-likely-than-not recognition threshold, the Company recognizes the largest amount of tax benefit that is more than 50% likely to be realized upon ultimate settlement with the related tax authority.
Interest and/or penalties related to uncertain tax positions are recognized in the income tax provision.
Measurement of Defined Benefit Pension and Other Postretirement Employee Benefit Plans
The Company sponsors defined benefit pension plans (“pension plans”) and other postretirement employee benefit plans (“OPEB plans”) for its employees and retirees. The Company recognizes the funded status of its pension and OPEB plans on the consolidated balance sheets based on the year-end measurements of plan assets and benefit obligations. When the fair value of plan assets are in excess of the plan benefit obligations, the amounts are reported in other current assets and other assets. When the fair value of plan benefit obligations are in excess of plan assets, the amounts are reported in accrued expenses and other long-term liabilities based on the amount by which the actuarial present value of benefits payable in the next twelve months included in the benefit obligation exceeds the fair value of plan assets. The net periodic benefit costs for the Company’s pension and OPEB plans do not contain a service cost component as these plans have been frozen for an extended period of time. Non-service cost components of pension and postretirement benefit cost are included in other expense (income) in the consolidated statements of operations.
Earnings (Loss) per Common Share
Earnings (loss) per share is computed using the two-class method. The Company calculates basic earnings (loss) per share based on the weighted average number of common shares outstanding for the period. See Note 14 ‘‘Earnings (Loss) Per Share’’ for additional information.
Shares Held in Trust
The Company maintains grantor trusts, which held approximately one million shares of its common stock at both December 31, 2019 and 2018. These shares are designated for use under various employee compensation plans. Since the Company holds these shares, they are excluded from the computation of basic and diluted shares outstanding.
Variable Interest Entities
The Company has investments in (i) a generic pharmaceutical sourcing entity, (ii) certain hedge fund and private equity investments and (iii) certain real estate partnerships that are considered VIE’s. The Company does not have a future obligation to fund losses or debts on behalf of these investments; however, it may voluntarily contribute funds. In evaluating whether the Company is the primary beneficiary of a VIE, the Company considers several factors, including whether the Company has (a) the power to direct the activities that most significantly impact the VIE’s economic performance and (b) the obligation to absorb losses and the right to receive benefits that could potentially be significant to the VIE.
Variable Interest Entities - Primary Beneficiary
In 2014, the Company and Cardinal Health, Inc. (“Cardinal”) established Red Oak Sourcing, LLC (“Red Oak”), a generic pharmaceutical sourcing entity in which the Company and Cardinal each own 50 %. The Red Oak arrangement has an initial term of 10 years. Under this arrangement, the Company and Cardinal contributed their sourcing and supply chain expertise to Red Oak and agreed to source and negotiate generic pharmaceutical supply contracts for both companies through Red Oak; however, Red Oak does not own or hold inventory on behalf of either company. No physical assets (e.g., property and
113
equipment) were contributed to Red Oak by either company, and minimal funding was provided to capitalize Red Oak. The Company has determined that it is the primary beneficiary of this VIE because it has the ability to direct the activities of Red Oak. Consequently, the Company consolidates Red Oak in its consolidated financial statements within the Retail/LTC segment.
Cardinal is required to pay the Company 39 quarterly payments beginning in October 2014. As milestones are met, the quarterly payments increase. The Company received from Cardinal $183 million during each of the years ended December 31, 2019, 2018 and 2017. The payments reduce the Company’s carrying value of inventory and are recognized in cost of products sold when the related inventory is sold. Revenues associated with Red Oak expenses reimbursed by Cardinal for the years ended December 31, 2019, 2018 and 2017, and amounts due to or due from Cardinal at December 31, 2019 and 2018 were immaterial.
Variable Interest Entities - Other Variable Interest Holder
The Company has invested in certain VIEs for which it has determined that it is not the primary beneficiary, consisting of the following:
• | Hedge fund and private equity investments - The Company invests in hedge fund and private equity investments in order to generate investment returns for its investment portfolio supporting its insurance businesses. |
• | Real estate partnerships - The Company invests in various real estate partnerships, including those that construct, own and manage low-income housing developments. For the low income housing development investments, substantially all of the projected benefits to the Company are from tax credits and other tax benefits. |
The Company is not the primary beneficiary of these VIEs because the nature of the Company’s involvement with the activities of these VIEs does not give the Company the power to direct the activities that most significantly impact their economic performance. The Company records the amount of its investment in these VIEs as long-term investments on the consolidated balance sheets and recognizes its share of each VIE’s income or losses in net income (loss). The Company’s maximum exposure to loss from these VIEs is limited to its investment balances as disclosed below and the risk of recapture of previously recognized tax credits related to the real estate partnerships, which the Company does not consider significant.
The total amount of other variable interest holder VIE assets included in long-term investments on the consolidated balance sheets at December 31, 2019 and 2018 was as follows:
In millions | 2019 | 2018 | |||||
Hedge fund investments | $ | $ | |||||
Private equity investments | |||||||
Real estate partnerships | |||||||
Total | $ | $ | |||||
Related Party Transactions
The Company has an equity method investment in SureScripts, LLC (“SureScripts”), which operates a clinical health information network. The Company utilizes this clinical health information network in providing services to its client plan members and retail customers. The Company expensed fees for the use of this network of $32 million, $45 million and $35 million in the years ended December 31, 2019, 2018 and 2017, respectively. The Company’s investment in and equity in the earnings of SureScripts for all periods presented is immaterial.
The Company has an equity method investment in Heartland Healthcare Services (“Heartland”). Heartland operates several LTC pharmacies in four states. Heartland paid the Company $96 million, $135 million and $139 million for pharmaceutical inventory purchases during the years ended December 31, 2019, 2018 and 2017, respectively. Additionally, the Company performs certain collection functions for Heartland and then passes those customer cash collections back to Heartland. The Company’s investment in and equity in the earnings of Heartland for all periods presented is immaterial.
During the year ended December 31, 2019, the Company made a charitable contribution of $30 million to the CVS Health Foundation, a non-profit entity that focuses on health, education and community involvement programs. The charitable contribution will fund future charitable giving and was recorded as an operating expense in the consolidated statement of operations for the year ended December 31, 2019.
114
Discontinued Operations
Results from discontinued operations were immaterial for the years ended December 31, 2019 and 2018. Below is a summary of the results of discontinued operations for the year ended December 31, 2017:
In millions | 2017 | ||
Loss from discontinued operations | $ | ( | ) |
Income tax benefit | |||
Loss from discontinued operations, net of tax | $ | ( | ) |
New Accounting Pronouncements Recently Adopted
Leases
In February 2016, the Financial Accounting Standards Board (the “FASB”) issued ASU 2016-02, Leases (Topic 842). Under this accounting standard, lessees are required to recognize a right-of-use asset and a lease liability for virtually all of their leases (other than leases that meet the definition of a short-term lease). The liability is equal to the present value of lease payments. The asset is based on the liability, subject to certain adjustments, such as for initial direct costs. For income statement purposes, a dual model was retained, requiring leases to be classified as either operating or finance leases. Operating leases result in straight-line expense (similar to operating leases under the prior accounting standard), while finance leases result in a front-loaded expense pattern (similar to capital leases under the prior accounting standard). Lessor accounting is similar to the prior model, but updated to align with certain changes to the lessee model (e.g., certain definitions, such as initial direct costs, have been updated) and the new revenue recognition standard that was adopted in 2018.
The Company adopted this new accounting standard on January 1, 2019 on a modified retrospective basis and applied the new standard to all leases through a cumulative-effect adjustment to beginning retained earnings. As a result, comparative financial information has not been restated and continues to be reported under the accounting standards in effect for those periods. The Company elected the package of practical expedients permitted under the transition guidance within the new standard, which includes, among other things, the ability to carry forward the existing lease classification. On January 1, 2019, the Company recorded an after-tax transition adjustment to increase retained earnings by approximately $178 million ($241 million prior to tax effect). The new standard had a material impact on the Company’s consolidated balance sheet, but did not materially impact the Company’s consolidated operating results and had no impact on the Company’s cash flows.
115
Impact of New Lease Standard on Balance Sheet Line Items
As a result of applying the new lease accounting standard using a modified retrospective method, the following adjustments were made to accounts on the consolidated balance sheet as of January 1, 2019:
Impact of Change in Accounting Policy | |||||||||||
In millions | As Reported December 31, 2018 | Adjustments | As Adjusted January 1, 2019 | ||||||||
Consolidated Balance Sheets: | |||||||||||
Other current assets | $ | $ | ( | ) | $ | ||||||
Total current assets | ( | ) | |||||||||
Property and equipment, net | |||||||||||
Operating lease right-of-use assets | — | ||||||||||
Intangible assets, net | ( | ) | |||||||||
Other assets | ( | ) | |||||||||
Total assets | |||||||||||
Accrued expenses | ( | ) | |||||||||
Current portion of operating lease liabilities | — | ||||||||||
Current portion of long-term debt | |||||||||||
Total current liabilities | |||||||||||
Long-term operating lease liabilities | — | ||||||||||
Long-term debt | ( | ) | |||||||||
Deferred income taxes | |||||||||||
Other long-term liabilities | ( | ) | |||||||||
Total liabilities | |||||||||||
Retained earnings | |||||||||||
Total CVS Health shareholders’ equity | |||||||||||
Total shareholders’ equity | |||||||||||
Accounting for Interest Associated with the Purchase of Callable Debt Securities
In March 2017, the FASB issued ASU 2017-08, Accounting for Interest Associated with the Purchase of Callable Debt Securities (Topic 310). Under this standard, premiums on callable debt securities are amortized to the earliest call date rather than to the contractual maturity date. Callable debt securities held at a discount will continue to be amortized to the contractual maturity date. The Company adopted this new accounting standard on January 1, 2019 on a modified retrospective basis and recorded an immaterial cumulative effect adjustment from accumulated other comprehensive income to retained earnings on the consolidated balance sheet.
New Accounting Pronouncements Not Yet Adopted
Measurement of Credit Losses on Financial Instruments
In June 2016, the FASB issued ASU 2016-13, Financial Instruments - Credit Losses (Topic 326). This standard requires the use of a forward-looking expected credit loss impairment model for trade and other receivables, held-to-maturity debt securities, loans and other instruments. This standard also requires impairments and recoveries for available-for-sale debt securities to be recorded through an allowance account and revises certain disclosure requirements. The Company adopted this new accounting standard on January 1, 2020. The Company adopted the credit loss impairment model on a modified retrospective basis and recorded an immaterial cumulative effect adjustment to retained earnings as of the adoption date. The Company adopted the available-for-sale debt security impairment model on a prospective basis. The adoption of this standard did not have a material impact on the Company’s consolidated operating results, cash flows or financial condition.
Customer’s Accounting for Implementation Costs Incurred in a Cloud Computing Arrangement that is a Service Contract
In August 2018, the FASB issued ASU 2018-15, Intangibles - Goodwill and other - Internal-Use Software (Topic 350-40): Customer’s Accounting for Implementation Costs Incurred in a Cloud Computing Arrangement that is a Service Contract. This standard requires a customer in a cloud computing arrangement that is a service contract to follow the internal-use software guidance in Topic 350-40 to determine which implementation costs to capitalize as assets. The Company adopted this new
116
accounting guidance on January 1, 2020 on a prospective basis. The implementation of this standard is not expected to have a material impact on the Company’s consolidated operating results, cash flows, financial condition or related disclosures.
Targeted Improvements to the Accounting for Long-Duration Insurance Contracts
In August 2018, the FASB issued ASU 2018-12, Targeted Improvements to the Accounting for Long-Duration Contracts (Topic 944). This standard requires the Company to review cash flow assumptions for its long-duration insurance contracts at least annually and recognize the effect of changes in future cash flow assumptions in net income (loss). This standard also requires the Company to update discount rate assumptions quarterly and recognize the effect of changes in these assumptions in other comprehensive income. The rate used to discount the Company’s liability for future policy benefits will be based on an estimate of the yield for an upper-medium grade fixed-income instrument with a duration profile matching that of the Company’s liabilities. In addition, this standard changes the amortization method for deferred acquisition costs and requires additional disclosures regarding the long duration insurance contract liabilities in the Company’s interim and annual financial statements. The standard is effective for public companies for fiscal years, and interim periods within those fiscal years, beginning after December 15, 2021. The Company is currently evaluating the effect that implementation of this standard will have on the Company’s consolidated operating results, cash flows, financial condition and related disclosures.
Simplifying the Accounting for Income Taxes
In December 2019, the FASB issued ASU 2019-12, Simplifying the Accounting for Income Taxes (Topic 740). This standard simplifies the accounting for income taxes by eliminating certain exceptions to the guidance in Accounting Standards Codification (“ASC”) 740 related to the approach for intraperiod tax allocation, the methodology for calculating income taxes in an interim period and the recognition of deferred tax liabilities for outside basis differences. The standard also simplifies aspects of the accounting for franchise taxes and enacted changes in tax laws or rates and clarifies the accounting for transactions that result in a step-up in the tax basis of goodwill. The standard is effective for public companies for fiscal years, and interim periods within those fiscal years, beginning after December 15, 2021. Early adoption is permitted. The Company is currently evaluating the effect that implementation of this standard will have on the Company’s consolidated operating results, cash flows, financial condition and related disclosures.
117
2. | Acquisitions and Divestitures |
Acquisition of Aetna
On the Aetna Acquisition Date, the Company acquired 100 % of the outstanding shares and voting interests of Aetna for a combination of cash and stock. Under the terms of the merger agreement, Aetna shareholders received $145.00 in cash and 0.8378 CVS Health shares for each Aetna share. The transaction valued Aetna at approximately $212 per share or approximately $70 billion. Including the assumption of Aetna’s debt, the total value of the transaction was approximately $78 billion. The Company financed the cash portion of the purchase price through a combination of cash on hand and by issuing approximately $45 billion of new debt, including senior notes and term loans. The Company acquired Aetna to help improve the consumer health care experience by combining Aetna’s health care benefits products and services with CVS Health’s approximately 9,900 retail locations, approximately 1,100 walk-in medical clinics and integrated pharmacy capabilities with the goal of becoming the new, trusted front door to health care.
The transaction has been accounted for using the acquisition method of accounting which requires, among other things, the assets acquired and liabilities assumed to be recognized at their fair values at the date of acquisition. The following table summarizes the fair values of the assets acquired and liabilities assumed at the date of acquisition:
In millions | |||
Cash and cash equivalents | $ | ||
Accounts receivable | |||
Other current assets | |||
Investments (current and long-term) | |||
Goodwill | |||
Intangible assets | |||
Other assets | |||
Total assets acquired | |||
Health care costs payable | |||
Other current liabilities | |||
Debt (current and long-term) | |||
Deferred income taxes | |||
Other long-term liabilities | |||
Total liabilities assumed | |||
Noncontrolling interests | |||
Total consideration transferred | $ | ||
The Company’s assessment of the fair value of assets acquired and liabilities assumed was finalized during the fourth quarter of 2019. Measurement period adjustments to assets acquired and liabilities assumed during the year ended December 31, 2019 primarily were due to additional information received related to certain intangible asset valuations and contingencies and the related impact on the accounting for income taxes and goodwill. There were no material income statement measurement period adjustments recorded during the year ended December 31, 2019.
Consolidated Results of Operations
The Company’s consolidated operating results for the year ended December 31, 2018, included $5.6 billion of revenues and $146 million of income before income tax provision associated with the operating results of Aetna from the Aetna Acquisition Date to December 31, 2018.
During the years ended December 31, 2018 and 2017, the Company incurred transaction costs of $147 million and $34 million, respectively, associated with the Aetna Acquisition that were recorded within operating expenses.
Unaudited Pro Forma Financial Information
The following unaudited pro forma information presents a summary of the Company’s combined operating results for the years ended December 31, 2018 and 2017 as if the Aetna acquisition and the related financing transactions had occurred on January 1, 2017. The following pro forma financial information is not necessarily indicative of the Company’s operating results as they
118
would have been had the acquisition been effected on the assumed date, nor is it necessarily an indication of trends in future results for a number of reasons, including differences between the assumptions used to prepare the pro forma financial information, basic shares outstanding and dilutive equivalents, cost savings from operating efficiencies, potential synergies, and the impact of incremental costs incurred in integrating the businesses.
Year Ended December 31, | |||||||
In millions, except per share data | 2018 | 2017 | |||||
Total revenues | $ | $ | |||||
Income from continuing operations | |||||||
Basic earnings per share from continuing operations attributable to CVS Health | $ | $ | |||||
Diluted earnings per share from continuing operations attributable to CVS Health | $ | $ | |||||
The pro forma results for the years ended December 31, 2018 and 2017 include adjustments related to the following purchase accounting and acquisition-related items:
• | Elimination of intercompany transactions between CVS Health and Aetna; |
• | Elimination of estimated foregone interest income associated with (i) cash assumed to have been used to partially fund the Aetna Acquisition and (ii) adjusting the amortized cost of Aetna’s investment portfolio to fair value as of the completion of the Aetna Acquisition; |
• | Elimination of historical intangible asset, deferred acquisition cost and capitalized software amortization expense and addition of amortization expense based on the values of identified intangible assets; |
• | Additional interest expense from (i) the long-term debt issued to partially fund the Aetna Acquisition and (ii) the amortization of the fair value adjustment to assumed long-term debt. |
• | Additional depreciation expense related to the adjustment of Aetna’s property and equipment to fair value; |
• | Adjustments to align CVS Health’s and Aetna’s accounting policies; |
• | Elimination of transaction related costs; and |
• | Tax effects of the adjustments noted above. |
Divestiture of Brazilian Subsidiary
On July 1, 2019, the Company sold its Brazilian subsidiary, Onofre, for an immaterial amount. Onofre operated 50 retail pharmacy stores, the results of which historically had been reported within the Retail/LTC segment. The Company recorded a pre-tax loss on the divestiture of $205 million in the year ended December 31, 2019, which primarily relates to the elimination of the cumulative translation adjustment from accumulated other comprehensive income and is reflected in operating expenses in the Company’s consolidated statements of operations within the Retail/LTC segment.
Divestiture of RxCrossroads Subsidiary
3. | Investments |
Total investments at December 31, 2019 and 2018 were as follows:
2019 | 2018 | ||||||||||||||||||||||
In millions | Current | Long-term | Total | Current | Long-term | Total | |||||||||||||||||
Debt securities available for sale | $ | $ | $ | $ | $ | $ | |||||||||||||||||
Mortgage loans | |||||||||||||||||||||||
Other investments | |||||||||||||||||||||||
Total investments | $ | $ | $ | $ | $ | $ | |||||||||||||||||
119
At December 31, 2019 and 2018, the Company held investments of $537 million and $531 million, respectively, related to the 2012 conversion of an existing group annuity contract from a participating to a non-participating contract. The conversion occurred prior to the Aetna Acquisition. These investments are included in the total investments of large case pensions supporting non-experience-rated products. Although these investments are not accounted for as Separate Accounts assets, they are legally segregated and are not subject to claims that arise out of the Company’s business and only support future policy benefits obligations under that group annuity contract.
Debt Securities
Debt securities available for sale at December 31, 2019 and 2018 were as follows:
In millions | Amortized Cost | Gross Unrealized Gains | Gross Unrealized Losses | Fair Value | |||||||||||
December 31, 2019 | |||||||||||||||
Debt securities: | |||||||||||||||
U.S. government securities | $ | $ | $ | ( | ) | $ | |||||||||
States, municipalities and political subdivisions | ( | ) | |||||||||||||
U.S. corporate securities | ( | ) | |||||||||||||
Foreign securities | ( | ) | |||||||||||||
Residential mortgage-backed securities | |||||||||||||||
Commercial mortgage-backed securities | |||||||||||||||
Other asset-backed securities | ( | ) | |||||||||||||
Redeemable preferred securities | |||||||||||||||
Total debt securities (1) | $ | $ | $ | ( | ) | $ | |||||||||
December 31, 2018 | |||||||||||||||
Debt securities: | |||||||||||||||
U.S. government securities | $ | $ | $ | $ | |||||||||||
States, municipalities and political subdivisions | ( | ) | |||||||||||||
U.S. corporate securities | ( | ) | |||||||||||||
Foreign securities | ( | ) | |||||||||||||
Residential mortgage-backed securities | |||||||||||||||
Commercial mortgage-backed securities | |||||||||||||||
Other asset-backed securities | ( | ) | |||||||||||||
Redeemable preferred securities | ( | ) | |||||||||||||
Total debt securities (1) | $ | $ | $ | ( | ) | $ | |||||||||
_____________________________________________
(1) | Investment risks associated with the Company’s experience-rated products generally do not impact the Company’s consolidated operating results. At December 31, 2019, debt securities with a fair value of $ |
120
In millions | Amortized Cost | Fair Value | |||||
Due to mature: | |||||||
Less than one year | $ | $ | |||||
One year through five years | |||||||
After five years through ten years | |||||||
Greater than ten years | |||||||
Residential mortgage-backed securities | |||||||
Commercial mortgage-backed securities | |||||||
Other asset-backed securities | |||||||
Total | $ | $ | |||||
Mortgage-Backed and Other Asset-Backed Securities
All of the Company’s residential mortgage-backed securities at December 31, 2019 were issued by the Government National Mortgage Association, the Federal National Mortgage Association or the Federal Home Loan Mortgage Corporation and carry agency guarantees and explicit or implicit guarantees by the U.S. Government. At December 31, 2019, the Company’s residential mortgage-backed securities had an average credit quality rating of AAA and a weighted average duration of 3.3 years.
The Company’s commercial mortgage-backed securities have underlying loans that are dispersed throughout the United States. Significant market observable inputs used to value these securities include loss severity and probability of default. At December 31, 2019, these securities had an average credit quality rating of AAA and a weighted average duration of 6.1 years.
The Company’s other asset-backed securities have a variety of underlying collateral (e.g., automobile loans, credit card receivables, home equity loans and commercial loans). Significant market observable inputs used to value these securities include the unemployment rate, loss severity and probability of default. At December 31, 2019, these securities had an average credit quality rating of AA and a weighted average duration of 1.2 years.
121
Summarized below are the debt securities the Company held at December 31, 2019 and 2018 that were in an unrealized capital loss position, aggregated by the length of time the investments have been in that position:
Less than 12 months | Greater than 12 months | Total | ||||||||||||||||||||||||||||||
In millions, except number of securities | Number of Securities | Fair Value | Unrealized Losses | Number of Securities | Fair Value | Unrealized Losses | Number of Securities | Fair Value | Unrealized Losses | |||||||||||||||||||||||
December 31, 2019 | ||||||||||||||||||||||||||||||||
Debt securities: | ||||||||||||||||||||||||||||||||
U.S. government securities | $ | $ | $ | $ | $ | $ | ||||||||||||||||||||||||||
States, municipalities and political subdivisions | ||||||||||||||||||||||||||||||||
U.S. corporate securities | ||||||||||||||||||||||||||||||||
Foreign securities | ||||||||||||||||||||||||||||||||
Residential mortgage-backed securities | ||||||||||||||||||||||||||||||||
Commercial mortgage-backed securities | ||||||||||||||||||||||||||||||||
Other asset-backed securities | ||||||||||||||||||||||||||||||||
Total debt securities | $ | $ | $ | $ | $ | $ | ||||||||||||||||||||||||||
December 31, 2018 | ||||||||||||||||||||||||||||||||
Debt securities: | ||||||||||||||||||||||||||||||||
U.S. government securities | $ | $ | $ | $ | $ | $ | ||||||||||||||||||||||||||
States, municipalities and political subdivisions | ||||||||||||||||||||||||||||||||
U.S. corporate securities | ||||||||||||||||||||||||||||||||
Foreign securities | ||||||||||||||||||||||||||||||||
Residential mortgage-backed securities | ||||||||||||||||||||||||||||||||
Other asset-backed securities | ||||||||||||||||||||||||||||||||
Redeemable preferred securities | ||||||||||||||||||||||||||||||||
Total debt securities | $ | $ | $ | $ | $ | $ | ||||||||||||||||||||||||||
The Company reviewed the securities in the tables above and concluded that they are performing assets generating investment income to support the needs of the Company’s business. In performing this review, the Company considered factors such as the quality of the investment security based on research performed by the Company’s internal credit analysts and external rating agencies and the prospects of realizing the carrying value of the security based on the investment’s current prospects for recovery. As of December 31, 2019, the Company did not intend to sell these securities, and did not believe it was more likely than not that it would be required to sell these securities prior to the anticipated recovery of their amortized cost basis. Since Aetna’s investment portfolio was measured at fair value as of the Aetna Acquisition Date, each of the securities as of December 31, 2018 were in an unrealized loss position for less than 12 months.
122
The maturity dates for debt securities in an unrealized capital loss position at December 31, 2019 were as follows:
Supporting experience-rated products | Supporting remaining products | Total | |||||||||||||||||||||
In millions | Fair Value | Unrealized Losses | Fair Value | Unrealized Losses | Fair Value | Unrealized Losses | |||||||||||||||||
Due to mature: | |||||||||||||||||||||||
Less than one year | $ | $ | $ | $ | $ | $ | |||||||||||||||||
One year through five years | |||||||||||||||||||||||
After five years through ten years | |||||||||||||||||||||||
Greater than ten years | |||||||||||||||||||||||
Residential mortgage-backed securities | |||||||||||||||||||||||
Commercial mortgage-backed securities | |||||||||||||||||||||||
Other asset-backed securities | |||||||||||||||||||||||
Total | $ | $ | $ | $ | $ | $ | |||||||||||||||||
Mortgage Loans
The Company’s mortgage loans are collateralized by commercial real estate. During 2019 and subsequent to the Aetna Acquisition Date in 2018, the Company had the following activity in its mortgage loan portfolio:
In millions | 2019 | 2018 | |||||
New mortgage loans | $ | $ | |||||
Mortgage loans fully-repaid | |||||||
Mortgage loans foreclosed | |||||||
The Company assesses mortgage loans on a regular basis for credit impairments, and annually assigns a credit quality indicator to each loan. The Company’s credit quality indicator is internally developed and categorizes its portfolio on a scale from 1 to 7. These indicators are based upon several factors, including current loan-to-value ratios, property condition, market trends, creditworthiness of the borrower and deal structure.
• | Category 1 - Represents loans of superior quality. |
• | Categories 2 to 4 - Represent loans where credit risk is minimal to acceptable; however, these loans may display some susceptibility to economic changes. |
• | Categories 5 and 6 - Represent loans where credit risk is not substantial, but these loans warrant management’s close attention. |
• | Category 7 - Represents loans where collections are potentially at risk; if necessary, an impairment is recorded. |
Based upon the Company’s assessments at December 31, 2019 and 2018, the Company’s mortgage loans were given the following credit quality indicators:
In millions, except credit ratings indicator | 2019 | 2018 | |||||
1 | $ | $ | |||||
2 to 4 | |||||||
5 and 6 | |||||||
7 | |||||||
Total | $ | $ | |||||
123
At December 31, 2019 scheduled mortgage loan principal repayments were as follows:
In millions | |||
2020 | $ | ||
2021 | |||
2022 | |||
2023 | |||
2024 | |||
Thereafter | |||
Total | $ | ||
Net Investment Income
Sources of net investment income for the years ended December 31, 2019 and 2018 were as follows:
In millions | 2019 | 2018 | |||||
Debt securities | $ | $ | |||||
Mortgage loans | |||||||
Other investments | |||||||
Gross investment income | |||||||
Investment expenses | ( | ) | ( | ) | |||
Net investment income (excluding net realized capital gains or losses) | |||||||
Net realized capital gains (1) | |||||||
Net investment income (2) | $ | $ | |||||
_____________________________________________
(1) | Net realized capital gains are net of other-than-temporary impairment (“OTTI”) losses on debt securities recognized in the consolidated statements of operations of $ |
(2) | Net investment income includes $ |
The Company’s net investment income was $21 million in 2017, relating to interest income on cash equivalents and debt securities. The Company did not have any material realized capital gains or losses during 2017.
Capital gains and losses recognized during the year ended December 31, 2019 related to investments in equity securities held as of December 31, 2019 were not material.
Excluding amounts related to experience-rated products, proceeds from the sale of available for sale debt securities and the related gross realized capital gains and losses in the year ended December 31, 2019 and subsequent to the Aetna Acquisition Date in 2018 were as follows:
In millions | 2019 | 2018 | |||||
Proceeds from sales | $ | $ | |||||
Gross realized capital gains | |||||||
Gross realized capital losses | ( | ) | ( | ) | |||
4. | Fair Value |
The preparation of the Company’s consolidated financial statements in accordance with GAAP requires certain assets and liabilities to be reflected at their fair value and others to be reflected on another basis, such as an adjusted historical cost basis. In this note, the Company provides details on the fair value of financial assets and liabilities and how it determines those fair values. The Company presents this information for those financial instruments that are measured at fair value for which the change in fair value impacts net income (loss) attributable to CVS Health or other comprehensive income separately from other financial assets and liabilities.
124
Financial Instruments Measured at Fair Value on the Consolidated Balance Sheets
Certain of the Company’s financial instruments are measured at fair value on the consolidated balance sheets. The fair values of these instruments are based on valuations that include inputs that can be classified within one of three levels of a hierarchy established by GAAP. The following are the levels of the hierarchy and a brief description of the type of valuation information (“valuation inputs”) that qualifies a financial asset or liability for each level:
• | Level 1 – Unadjusted quoted prices for identical assets or liabilities in active markets. |
• | Level 2 – Valuation inputs other than Level 1 that are based on observable market data. These include: quoted prices for similar assets in active markets, quoted prices for identical assets in inactive markets, valuation inputs that are observable that are not prices (such as interest rates and credit risks) and valuation inputs that are derived from or corroborated by observable markets. |
• | Level 3 – Developed from unobservable data, reflecting the Company’s assumptions. |
Financial assets and liabilities are classified based upon the lowest level of input that is significant to the valuation. When quoted prices in active markets for identical assets and liabilities are available, the Company uses these quoted market prices to determine the fair value of financial assets and liabilities and classifies these assets and liabilities in Level 1. In other cases where a quoted market price for identical assets and liabilities in an active market is either not available or not observable, the Company estimates fair value using valuation methodologies based on available and observable market information or by using a matrix pricing model. These financial assets and liabilities are classified in Level 2. If quoted market prices are not available, the Company determines fair value using broker quotes or an internal analysis of each investment’s financial performance and cash flow projections. Thus, financial assets and liabilities may be classified in Level 3 even though there may be some significant inputs that may be observable.
The following is a description of the valuation methodologies used for the Company’s financial assets and liabilities that are measured at fair value, including the general classification of such assets and liabilities pursuant to the valuation hierarchy.
Cash and Cash Equivalents – The carrying value of cash and cash equivalents approximates fair value as maturities are less than three months. When quoted prices are available in an active market, cash equivalents are classified in Level 1 of the fair value hierarchy. Fair values of cash equivalent instruments that do not trade on a regular basis in active markets are classified as Level 2.
Debt Securities – Where quoted prices are available in an active market, debt securities are classified in Level 1 of the fair value hierarchy. The Company’s Level 1 debt securities consist primarily of U.S. Treasury securities.
The fair values of the Company’s Level 2 debt securities are obtained using models, such as matrix pricing, which use quoted market prices of debt securities with similar characteristics or discounted cash flows to estimate fair value. The Company reviews these prices to ensure they are based on observable market inputs that include quoted prices for similar assets in active markets, quoted prices for identical assets in inactive markets and inputs that are observable that are not prices (such as interest rates and credit risks). The Company also reviews the methodologies and the assumptions used to calculate prices from these observable inputs. On a quarterly basis, the Company selects a sample of its Level 2 debt securities’ prices and compares them to prices provided by a secondary source. Variances over a specified threshold are identified and reviewed to confirm the price provided by the primary source represents an appropriate estimate of fair value. In addition, the Company’s internal investment team consistently compares the prices obtained for select Level 2 debt securities to the team’s own independent estimates of fair value for those securities. The Company obtained one price for each of its Level 2 debt securities and did not adjust any of those prices at December 31, 2019 or 2018.
The Company also values certain debt securities using Level 3 inputs. For Level 3 debt securities, fair values are determined by outside brokers or, in the case of certain private placement securities, are priced internally. Outside brokers determine the value of these debt securities through a combination of their knowledge of the current pricing environment and market flows. The Company did not have any broker quoted debt securities at December 31, 2019. The total fair value of broker quoted debt securities at December 31, 2018 was $50 million. The Company obtained one non-binding broker quote for each of these Level 3 debt securities and did not adjust any of those quotes at December 31, 2018. Examples of these broker quoted Level 3 debt securities include certain U.S. and foreign corporate securities and certain of the Company’s commercial mortgage-backed securities as well as other asset-backed securities. For some private placement securities, the Company’s internal staff determines the value of these debt securities by analyzing spreads of corporate and sector indices as well as interest spreads of comparable public
125
bonds. Examples of these private placement Level 3 debt securities include certain U.S. and foreign securities and certain tax-exempt municipal securities.
Equity Securities – The Company currently has two classifications of equity securities: those that are publicly traded and those that are privately placed. Publicly-traded equity securities are classified in Level 1 because quoted prices are available for these securities in an active market. For privately placed equity securities, there is no active market; therefore, these securities are classified in Level 3 because the Company prices these securities through an internal analysis of each investment’s financial statements and cash flow projections. Significant unobservable inputs consist of earnings and revenue multiples, discount for lack of marketability and comparability adjustments. An increase or decrease in any of these unobservable inputs would result in a change in the fair value measurement, which may be significant.
There were no financial liabilities measured at fair value on a recurring basis on the consolidated balance sheets at December 31, 2019 or 2018. Financial assets measured at fair value on a recurring basis on the consolidated balance sheets at December 31, 2019 and 2018 were as follows:
In millions | Level 1 | Level 2 | Level 3 | Total | |||||||||||
December 31, 2019 | |||||||||||||||
Cash and cash equivalents | $ | $ | $ | $ | |||||||||||
Debt securities: | |||||||||||||||
U.S. government securities | |||||||||||||||
States, municipalities and political subdivisions | |||||||||||||||
U.S. corporate securities | |||||||||||||||
Foreign securities | |||||||||||||||
Residential mortgage-backed securities | |||||||||||||||
Commercial mortgage-backed securities | |||||||||||||||
Other asset-backed securities | |||||||||||||||
Redeemable preferred securities | |||||||||||||||
Total debt securities | |||||||||||||||
Equity securities | |||||||||||||||
Total | $ | $ | $ | $ | |||||||||||
December 31, 2018 | |||||||||||||||
Cash and cash equivalents | $ | $ | $ | $ | |||||||||||
Debt securities: | |||||||||||||||
U.S. government securities | |||||||||||||||
States, municipalities and political subdivisions | |||||||||||||||
U.S. corporate securities | |||||||||||||||
Foreign securities | |||||||||||||||
Residential mortgage-backed securities | |||||||||||||||
Commercial mortgage-backed securities | |||||||||||||||
Other asset-backed securities | |||||||||||||||
Redeemable preferred securities | |||||||||||||||
Total debt securities | |||||||||||||||
Equity securities | |||||||||||||||
Total | $ | $ | $ | $ | |||||||||||
126
There were no transfers between Levels 1 and 2 during the years ended December 31, 2019 and 2018. The changes in the balances of Level 3 financial assets during 2019 were as follows:
In millions | Foreign securities | U.S. corporate securities | Equity securities | Redeemable preferred securities | Total | ||||||||||||||
Beginning balance | $ | $ | $ | $ | $ | ||||||||||||||
Net realized and unrealized capital gains (losses): | |||||||||||||||||||
Included in earnings | ( | ) | ( | ) | |||||||||||||||
Included in other comprehensive income | |||||||||||||||||||
Purchases | |||||||||||||||||||
Sales | ( | ) | ( | ) | ( | ) | |||||||||||||
Settlements | ( | ) | ( | ) | ( | ) | |||||||||||||
Transfers out of Level 3, net | ( | ) | ( | ) | |||||||||||||||
Ending balance | $ | $ | $ | $ | $ | ||||||||||||||
The total gross transfers into (out of) Level 3 during the year ended December 31, 2019 were as follows:
In millions | |||
Gross transfers into Level 3 | $ | ||
Gross transfers out of Level 3 | ( | ) | |
Net transfers out of Level 3 | $ | ( | ) |
The increase in the balance of Level 3 financial assets during 2018 relates to investments acquired in the Aetna Acquisition, which occurred on November 28, 2018. There were no transfers into or out of Level 3 subsequent to the Aetna Acquisition Date in 2018.
Financial Instruments Not Measured at Fair Value on the Consolidated Balance Sheets
The carrying value and estimated fair value classified by level of fair value hierarchy for financial instruments carried on the consolidated balance sheets at adjusted cost or contract value at December 31, 2019 and 2018 were as follows:
Carrying Value | Estimated Fair Value | ||||||||||||||||||
In millions | Level 1 | Level 2 | Level 3 | Total | |||||||||||||||
December 31, 2019 | |||||||||||||||||||
Assets: | |||||||||||||||||||
Mortgage loans | $ | $ | $ | $ | $ | ||||||||||||||
Equity securities (1) | N/A | N/A | N/A | N/A | |||||||||||||||
Liabilities: | |||||||||||||||||||
Investment contract liabilities: | |||||||||||||||||||
With a fixed maturity | |||||||||||||||||||
Without a fixed maturity | |||||||||||||||||||
Long-term debt | |||||||||||||||||||
127
Carrying Value | Estimated Fair Value | ||||||||||||||||||
In millions | Level 1 | Level 2 | Level 3 | Total | |||||||||||||||
December 31, 2018 | |||||||||||||||||||
Assets: | |||||||||||||||||||
Mortgage loans | $ | $ | $ | $ | $ | ||||||||||||||
Equity securities (1) | N/A | N/A | N/A | N/A | |||||||||||||||
Liabilities: | |||||||||||||||||||
Investment contract liabilities: | |||||||||||||||||||
With a fixed maturity | |||||||||||||||||||
Without a fixed maturity | |||||||||||||||||||
Long-term debt | |||||||||||||||||||
_____________________________________________
(1) | It was not practical to estimate the fair value of these cost-method investments as it represents shares of unlisted companies. See Note 1 ‘‘Significant Accounting Policies’’ for additional information regarding the valuation of cost method investments. |
Separate Accounts assets relate to the Company’s large case pensions products which represent funds maintained to meet specific objectives of contract holders. Since contract holders bear the investment risk of these assets, a corresponding Separate Accounts liability has been established equal to the assets. These assets and liabilities are carried at fair value. Net investment income and capital gains and losses on Separate Accounts assets accrue directly to such contract holders. The assets of each account are legally segregated and are not subject to claims arising from the Company’s other businesses. Deposits, withdrawals, net investment income and realized and unrealized capital gains and losses on Separate Accounts assets are not reflected in the consolidated statements of operations, shareholders’ equity or cash flows.
Separate Accounts assets include debt and equity securities. The valuation methodologies used for these assets are similar to the methodologies described above in this Note 4 ‘‘Fair Value.’’ Separate Accounts assets also include investments in common/collective trusts that are carried at fair value. Common/collective trusts invest in other investment funds otherwise known as the underlying funds. The Separate Accounts’ interests in the common/collective trust funds are based on the fair values of the investments of the underlying funds and therefore are classified in Level 2. The assets in the underlying funds primarily consist of equity securities. Investments in common/collective trust funds are valued at their respective net asset value (“NAV”) per share/unit on the valuation date.
Separate Accounts financial assets at December 31, 2019 and 2018 were as follows:
December 31, 2019 | December 31, 2018 | ||||||||||||||||||||||||||||||
In millions | Level 1 | Level 2 | Level 3 | Total | Level 1 | Level 2 | Level 3 | Total | |||||||||||||||||||||||
Cash and cash equivalents | $ | $ | $ | $ | $ | $ | $ | $ | |||||||||||||||||||||||
Debt securities | |||||||||||||||||||||||||||||||
Equity securities | |||||||||||||||||||||||||||||||
Common/collective trusts | |||||||||||||||||||||||||||||||
Total | $ | $ | $ | $ | $ | $ | $ | $ | |||||||||||||||||||||||
During 2019 and 2018, there were no transfers of Separate Accounts financial assets between Levels 1 and 2. During 2019 and 2018, the Company had an immaterial amount of gross transfers of Separate Accounts financial assets into or out of Level 3.
Offsetting Financial Assets and Liabilities
128
5. | Goodwill and Other Intangibles |
Goodwill
Below is a summary of the changes in the carrying amount of goodwill by segment for the years ended December 31, 2019 and 2018:
In millions | Pharmacy Services | Retail/ LTC | Health Care Benefits | Total | |||||||||||
Balance at December 31, 2017 | $ | $ | $ | $ | |||||||||||
Acquisitions | |||||||||||||||
Foreign currency translation adjustments | ( | ) | ( | ) | |||||||||||
Divestiture of RxCrossroads subsidiary | ( | ) | ( | ) | |||||||||||
Impairments | ( | ) | ( | ) | |||||||||||
Balance at December 31, 2018 | |||||||||||||||
Segment realignment | ( | ) | |||||||||||||
Purchase accounting adjustments | |||||||||||||||
Other | ( | ) | |||||||||||||
Balance at December 31, 2019 | $ | $ | $ | $ | |||||||||||
Cumulative goodwill impairments were $6.1 billion at both December 31, 2019 and 2018.
The changes in the carrying amount of goodwill during the years ended December 31, 2019 and 2018 reflect the following activity:
Segment Realignment
During 2019, the Company realigned the composition of its segments to correspond with changes to its operating model and reflect how the CODM reviews information and manages the business as discussed in Note 1 ‘‘Significant Accounting Policies.’’ As a result of this realignment, the Company reallocated the goodwill balance of the Pharmacy Services and Health Care Benefits segments based on a relative fair value approach.
Aetna Acquisition
On November 28, 2018, the Company completed the Aetna Acquisition. The majority of the preliminary valuation of goodwill associated with the Aetna Acquisition was recorded in the Health Care Benefits segment. The Company also allocated a portion of such goodwill to the Retail/LTC and Pharmacy Services segments related to the fair value of identified synergies that are expected to directly benefit those segments. During 2019, the Company finalized its purchase accounting assessment and recorded the applicable measurement period adjustments, including an adjustment to the acquired goodwill. See Note 2 ‘‘Acquisitions and Divestitures’’ for further discussion regarding the Aetna Acquisition.
LTC
During 2018, the LTC reporting unit continued to experience industry-wide challenges that impacted management’s ability to grow the business at the rate that was originally estimated when the Company acquired Omnicare, Inc. (“Omnicare”) and when the 2017 annual goodwill impairment test was performed. Those challenges include lower client retention rates, lower occupancy rates in skilled nursing facilities, the deteriorating financial health of numerous skilled nursing facility customers which resulted in a number of customer bankruptcies in 2018, and continued facility reimbursement pressures. In June 2018, LTC management submitted its initial budget for 2019 and updated the 2018 annual forecast which showed a deterioration in the projected financial results for the remainder of 2018 and in 2019, which also caused management to update its long-term forecast beyond 2019. Based on these updated projections, management determined that there were indicators that the LTC reporting unit’s goodwill may be impaired and, accordingly, management performed an interim goodwill impairment test as of June 30, 2018. The results of that interim impairment test showed that the fair value of the LTC reporting unit was lower than the carrying value, resulting in a $3.9 billion pre-tax goodwill impairment charge in the second quarter of 2018. The fair value of the LTC reporting unit was determined using a combination of a discounted cash flow method and a market multiple method. In addition to the lower financial projections, changes in risk-free interest rates and lower market multiples of peer group companies contributed to the amount of the 2018 goodwill impairment charges.
129
During the third quarter of 2018, the Company performed its required annual impairment tests of goodwill and concluded there was no impairment of goodwill or trade names.
During the fourth quarter of 2018, the LTC reporting unit missed its forecast primarily due to operational issues and customer liquidity issues, including one significant customer bankruptcy. Additionally, LTC management submitted an updated final budget for 2019 which showed significant additional deterioration in the projected financial results for 2019 compared to the analyses performed in the second and third quarters of 2018 primarily due to continued industry and operational challenges, which also caused management to make further updates to its long-term forecast beyond 2019. The updated projections reflected continued industry wide challenges including lower occupancy rates in skilled nursing facilities, significant deterioration in the financial health of numerous skilled nursing facility customers and continued facility reimbursement pressures. Based on these updated projections, management determined that there were indicators that the LTC reporting unit’s goodwill may be further impaired and, accordingly, management performed an interim goodwill impairment test during the fourth quarter of 2018. The results of that interim impairment test showed that the fair value of the LTC reporting unit was lower than the carrying value, resulting in an additional $2.2 billion pre-tax goodwill impairment charge in the fourth quarter of 2018. In addition to the lower financial projections, lower market multiples of peer group companies also contributed to the amount of the fourth quarter 2018 goodwill impairment charge. The fair value of the LTC reporting unit was determined using a methodology consistent with the methodology described above for the analyses performed during the second and third quarters of 2018.
During the third quarter of 2019, the Company performed its required annual impairment tests of goodwill. The results of these impairment tests indicated that there was no impairment of goodwill. As of December 31, 2019, the remaining goodwill balance in the LTC reporting unit was $431 million.
RxCrossroads
During 2017, the Company began pursuing various strategic alternatives for its RxCrossroads reporting unit. In connection with this effort, the Company performed an interim goodwill impairment test in the second quarter of 2017. The results of that impairment test showed that the fair value of the RxCrossroads reporting unit was lower than the carrying value, resulting in a $135 million pre-tax goodwill impairment charge in the second quarter of 2017.
The TCJA was enacted on December 22, 2017 and reduced the U.S. federal corporate income tax rate from 35% to 21% effective January 1, 2018 (see Note 10 ‘‘Income Taxes’’). As a result, the RxCrossroads deferred income tax liabilities were reduced by $47 million and an income tax benefit of $47 million was recorded in the 2017 statement of operations. The reduction in the deferred income tax liabilities increased the carrying value of the RxCrossroads reporting unit by $47 million which triggered an additional goodwill impairment charge in the RxCrossroads reporting unit of $46 million during the fourth quarter of 2017.
On January 2, 2018, the Company sold its RxCrossroads subsidiary to McKesson Corporation for $725 million, at which time the remaining goodwill of this reporting unit was removed from the consolidated balance sheets.
130
Intangible Assets
The following table is a summary of the Company’s intangible assets as of December 31, 2019 and 2018:
In millions, except weighted average life | Gross Carrying Amount | Accumulated Amortization | Net Carrying Amount | Weighted Average Life (years) | |||||||||
2019 | |||||||||||||
Trademarks (indefinite-lived) | $ | $ | — | $ | N/A | ||||||||
Customer contracts/relationships and covenants not to compete | ( | ) | |||||||||||
Technology | ( | ) | |||||||||||
Provider networks | ( | ) | |||||||||||
Value of Business Acquired | ( | ) | |||||||||||
Other | ( | ) | |||||||||||
Total | $ | $ | ( | ) | $ | ||||||||
2018 | |||||||||||||
Trademarks (indefinite-lived) | $ | $ | — | $ | N/A | ||||||||
Customer contracts/relationships and covenants not to compete | ( | ) | |||||||||||
Technology | ( | ) | |||||||||||
Provider networks | ( | ) | |||||||||||
Value of Business Acquired | ( | ) | |||||||||||
Favorable leases and other (1) | ( | ) | |||||||||||
Total | $ | $ | ( | ) | $ | ||||||||
_____________________________________________
(1) | Upon adoption of ASU 2016-02, Leases, the Company’s favorable leases were reclassified from an intangible asset to a reduction of the right-of-use asset. Refer to Note 1 ‘‘Significant Accounting Policies’’ for additional information on the adoption of ASU 2016-02, Leases. |
Amortization expense for intangible assets totaled $2.4 billion, $1.0 billion and $817 million for the years ended December 31, 2019, 2018 and 2017, respectively. The projected annual amortization expense for the Company’s intangible assets for the next five years is as follows:
In millions | |||
2020 | $ | ||
2021 | |||
2022 | |||
2023 | |||
2024 | |||
6. | Leases |
The Company adopted ASU 2016-02, Leases (Topic 842) (“ASC 842”) on January 1, 2019 on a modified retrospective basis. As a result, the Company’s lease disclosures as of and for the year ended December 31, 2019 are reported under ASC 842. Comparative financial information for prior periods has not been restated and continues to be reported under ASC 840, the lease accounting standard in effect for those periods.
Disclosure Subsequent to the Adoption of the New Lease Accounting Standard (ASU 2016-02)
The Company leases most of its retail stores and mail order facilities and certain distribution centers and corporate offices under operating or finance leases, typically with initial terms of 15 to 25 years. The Company also leases certain equipment and other assets under operating or finance leases, typically with initial terms of 3 to 10 years.
In addition, the Company leases pharmacy space at the stores of another retail chain for which the noncancelable contractual term of the pharmacy lease arrangement exceeds the remaining estimated economic life of the buildings. For these pharmacy
131
lease arrangements, the Company concluded that for accounting purposes the lease term was the remaining estimated economic life of the buildings. Consequently, most of these individual pharmacy leases are finance leases.
The following table is a summary of the components of net lease cost for the year ended December 31, 2019:
In millions | 2019 | ||
Operating lease cost | $ | ||
Finance lease cost: | |||
Amortization of right-of-use assets | |||
Interest on lease liabilities | |||
Total finance lease costs | |||
Short-term lease costs | |||
Variable lease costs | |||
Less: sublease income | |||
Net lease cost | $ | ||
Supplemental cash flow information related to leases for the year ended December 31, 2019 is as follows:
In millions | 2019 | ||
Cash paid for amounts included in the measurement of lease liabilities: | |||
Operating cash flows paid for operating leases | $ | ||
Operating cash flows paid for interest portion of finance leases | |||
Financing cash flows paid for principal portion of finance leases | |||
Right-of-use assets obtained in exchange for lease obligations: | |||
Operating leases | |||
Finance leases | |||
132
Supplemental balance sheet information related to leases as of December 31, 2019 is as follows:
In millions, except remaining lease term and discount rate | |||
Operating leases: | |||
Operating lease right-of-use assets | $ | ||
Current portion of operating lease liabilities | $ | ||
Long-term operating lease liabilities | |||
Total operating lease liabilities | $ | ||
Finance leases: (1) | |||
Property and equipment, gross | $ | ||
Accumulated depreciation (2) | ( | ) | |
Property and equipment, net | $ | ||
Current portion of long-term debt | $ | ||
Long-term debt | |||
Total finance lease liabilities | $ | ||
Weighted average remaining lease term (in years) | |||
Operating leases | |||
Finance leases | |||
Weighted average discount rate | |||
Operating leases | % | ||
Finance leases | % | ||
_____________________________________________
(1) | Finance lease right-of-use assets are included within property and equipment, net and the respective finance lease liabilities are included in current portion of long-term debt and long-term debt on the consolidated balance sheets. |
(2) | In accordance with ASC 842, upon adoption the net carrying value of the prior capital leases became the initial basis of the Company’s finance leases. As a result, upon adoption there was no accumulated amortization associated with such finance leases. |
The following table summarizes the maturity of lease liabilities under finance and operating leases as of December 31, 2019:
In millions | Finance Leases | Operating Leases (1) | Total | ||||||||
2020 | $ | $ | $ | ||||||||
2021 | |||||||||||
2022 | |||||||||||
2023 | |||||||||||
2024 | |||||||||||
Thereafter | |||||||||||
Total lease payments (2) | |||||||||||
Less: imputed interest | ( | ) | ( | ) | ( | ) | |||||
Total lease liabilities | $ | $ | $ | ||||||||
_____________________________________________
(1) | Future operating lease payments have not been reduced by minimum sublease rentals of $ |
(2) | The Company leases pharmacy and clinic space from Target Corporation. Amounts related to such finance and operating leases are reflected above. Pharmacy lease amounts due in excess of the remaining estimated economic life of the buildings of approximately $ |
133
Sale-Leaseback Transactions
The Company finances a portion of its store development program through sale-leaseback transactions. The properties are generally sold at net book value, which generally approximates fair value, and the resulting leases generally qualify and are accounted for as operating leases. The operating leases that resulted from these transactions are included in the tables above. The Company does not have any retained or contingent interests in the stores and does not provide any guarantees, other than a guarantee of lease payments, in connection with the sale-leaseback transactions. Proceeds from sale-leaseback transactions totaled $5 million in 2019.
Store Rationalization Charges
During the first quarter of 2019, the Company performed a review of its retail stores and determined it would close 46 underperforming retail pharmacy stores during the second quarter of 2019. As a result, management determined that there were indicators of impairment with respect to the impacted stores, including the associated operating lease right-of-use assets. Accordingly, an interim long-lived asset impairment test was performed. The results of the impairment test indicated that the fair value of each store asset group was lower than the carrying value. The fair value was determined using a discounted cash flow method based on estimated sublease income. In the three months ended March 31, 2019, the Company recorded a store rationalization charge of $135 million, primarily related to these operating lease right-of-use asset impairment charges, which was recorded within operating expenses in the Retail/LTC segment.
During the third quarter of 2019, in connection with its annual budgeting process, the Company performed an updated review of its retail stores and determined it would close an additional 22 underperforming retail pharmacy stores during the first quarter of 2020. As a result, management determined that there were indicators of impairment with respect to the impacted stores, including the associated operating lease right-of-use assets. Accordingly, an interim long-lived asset impairment test was performed. The results of the impairment test indicated that the fair value of each store asset group was lower than the carrying value. The fair value was determined using a discounted cash flow method based on estimated sublease income. In the three months ended September 30, 2019, the Company recorded a store rationalization charge of $96 million, primarily related to these operating lease right-of-use asset impairment charges, which was recorded within operating expenses in the Retail/LTC segment.
Comparative Disclosure Prior to the Adoption of the New Lease Accounting Standard (ASU 2016-02)
The following table is a summary of the Company’s net rental expense for operating leases for the years ended December 31, 2018 and 2017:
In millions | 2018 | 2017 | |||||
Minimum rentals | $ | $ | |||||
Contingent rentals | |||||||
Rental expense | |||||||
Less: sublease income | ( | ) | ( | ) | |||
Total rental expense, net | $ | $ | |||||
The amount of property and equipment under capital leases at December 31, 2018 was as follows:
In millions | 2018 | ||
Property and equipment under capital leases | $ | ||
Accumulated amortization of property and equipment under capital leases | ( | ) | |
Property and equipment under capital leases, net | $ | ||
Sale-Leaseback Transactions
The Company finances a portion of its store development program through sale-leaseback transactions. The properties are generally sold at net book value, which generally approximates fair value, and the resulting leases generally qualify and are accounted for as operating leases. The Company does not have any retained or contingent interests in the stores and does not provide any guarantees, other than a guarantee of lease payments, in connection with the sale-leaseback transactions. There were no sale-leaseback transactions in 2018. Proceeds from sale-leaseback transactions totaled $265 million in 2017.
134
Store Rationalization Charges
Prior to the adoption of ASC 842, when the Company closed a facility, the present value of estimated unrecoverable costs, including the remaining lease obligation less estimated sublease income and the book value of abandoned property and equipment, were charged to expense. During the year ended December 31, 2018, the Company did not recognize any significant charges related to facility closing costs.
In December 2016, the Company announced an enterprise streamlining initiative designed to reduce costs and enhance operating efficiencies to allow the Company to be more competitive in the current health care environment. During the year ended December 31, 2017, in connection with that enterprise streamlining initiative, the Company closed 71 retail stores and recorded charges of $215 million within operating expenses in the Retail/LTC segment. The charges primarily consist of provisions for the present value of noncancelable lease obligations. The noncancelable lease obligations associated with stores closed during the year ended December 31, 2017 extend through the year 2039.
7. | Health Care Costs Payable |
The following is information about incurred and cumulative paid health care claims development as of December 31, 2019, net of reinsurance, and the total IBNR liabilities plus expected development on reported claims included within the net incurred claims amounts. See Note 1 ‘‘Significant Accounting Policies’’ for information on how the Company estimates IBNR reserves and health care costs payable as well as changes to those methodologies, if any. The Company’s estimate of IBNR liabilities is primarily based on trend and completion factors. Claim frequency is not used in the calculation of the Company’s liability. In addition, it is impracticable to disclose claim frequency information for health care claims due to the Company’s inability to gather consistent claim frequency information across its multiple claims processing systems. Any claim frequency count disclosure would not be comparable across the Company’s different claim processing systems and would not be consistent from period to period based on the volume of claims processed through each system. As a result, health care claim count frequency is not included in the disclosures below.
The Company acquired Aetna on November 28, 2018. The information about incurred and cumulative paid health care claims development in the table below is presented on a retrospective basis, under which the Company included Aetna’s historical development of health care claims for all years presented in the table. The information about incurred and paid health care claims development for the year ended December 31, 2018 is presented as required unaudited supplemental information.
In millions | Incurred Health Care Claims, Net of Reinsurance For the Years Ended December 31, | ||||||
Date of Service | 2018 | 2019 | |||||
(Unaudited) | |||||||
2018 | $ | $ | |||||
2019 | |||||||
Total | $ | ||||||
In millions | Cumulative Paid Health Care Claims, Net of Reinsurance For the Years Ended December 31, | ||||||
Date of Service | 2018 | 2019 | |||||
(Unaudited) | |||||||
2018 | $ | $ | |||||
2019 | |||||||
Total | $ | ||||||
All outstanding liabilities for health care costs payable prior to 2018, net of reinsurance | |||||||
Total outstanding liabilities for health care costs payable, net of reinsurance | $ | ||||||
135
At December 31, 2019, the Company’s liabilities for IBNR plus expected development on reported claims totaled approximately $5.0 billion. Substantially all of the Company’s liabilities for IBNR plus expected development on reported claims at December 31, 2019 related to the current calendar year.
The reconciliation of the December 31, 2019 health care net incurred and paid claims development tables to the health care costs payable liability on the consolidated balance sheet is as follows:
In millions | December 31, 2019 | ||
Short-duration health care costs payable, net of reinsurance | $ | ||
Reinsurance recoverables | |||
Premium deficiency reserve | |||
Insurance lines other than short duration | |||
Total health care costs payable | $ | ||
Prior to the Aetna Acquisition on November 28, 2018, the Company’s health care costs payable balance was immaterial and related to unpaid pharmacy claims for its SilverScript PDP. Accordingly, the Company has not provided disclosures for health care costs payable for periods prior to 2018. The following table shows the components of the change in health care costs payable during 2019 and 2018:
In millions | 2019 | 2018 | |||||
Health care costs payable, beginning of the period | $ | $ | |||||
Less: Reinsurance recoverables | |||||||
Health care costs payable, beginning of the period, net | |||||||
Acquisitions, net | |||||||
Reclassification from pharmacy claims and discounts payable (1) | |||||||
Add: Components of incurred health care costs | |||||||
Current year | |||||||
Prior years | ( | ) | ( | ) | |||
Total incurred health care costs (2) | |||||||
Less: Claims paid | |||||||
Current year | |||||||
Prior years | |||||||
Total claims paid | |||||||
Add: Premium deficiency reserve | |||||||
Health care costs payable, end of period, net | |||||||
Add: Reinsurance recoverables | |||||||
Health care costs payable, end of period | $ | $ | |||||
_____________________________________________
(1) | As of the Aetna Acquisition Date, the Company reclassified $ |
(2) | Total incurred health care costs for the year ended December 31, 2019 and 2018 in the table above exclude (i) $ |
The Company’s estimates of prior years’ health care costs payable decreased by $524 million in 2019 because claims were settled for amounts less than originally estimated (i.e., the amount of claims incurred was lower than originally estimated), primarily due to lower health care cost trends as well as the actual claim submission time being faster than originally assumed (i.e., the Company’s completion factors were higher than originally assumed) in estimating health care costs payable at the end of the prior year. This development does not directly correspond to an increase in the Company’s operating results as these reductions were offset by estimated current period health care costs when the Company established the estimate of the current year health care costs payable.
136
8. | Borrowings and Credit Agreements |
The following table is a summary of the Company’s borrowings as of December 31, 2019 and 2018:
In millions | 2019 | 2018 | |||||
Short-term debt | |||||||
Commercial paper | $ | $ | |||||
Long-term debt | |||||||
2.2% senior notes due March 2019 | |||||||
2.25% senior notes due August 2019 | |||||||
3.125% senior notes due March 2020 | |||||||
Floating rate notes due March 2020 (2.515% and 3.397% at December 31, 2019 and 2018) | |||||||
2.8% senior notes due July 2020 | |||||||
3.35% senior notes due March 2021 | |||||||
Floating rate notes due March 2021 (2.605% and 3.487% at December 31, 2019 and 2018) | |||||||
4.125% senior notes due May 2021 | |||||||
2.125% senior notes due June 2021 | |||||||
4.125% senior notes due June 2021 | |||||||
5.45% senior notes due June 2021 | |||||||
3-year tranche term loan due November 2021 | |||||||
3.5% senior notes due July 2022 | |||||||
2.75% senior notes due November 2022 | |||||||
2.75% senior notes due December 2022 | |||||||
4.75% senior notes due December 2022 | |||||||
3.7% senior notes due March 2023 | |||||||
2.8% senior notes due June 2023 | |||||||
4% senior notes due December 2023 | |||||||
2.625% senior notes due August 2024 | |||||||
3.375% senior notes due August 2024 | |||||||
3.5% senior notes due November 2024 | |||||||
5% senior notes due December 2024 | |||||||
4.1% senior notes due March 2025 | |||||||
3.875% senior notes due July 2025 | |||||||
2.875% senior notes due June 2026 | |||||||
3% senior notes due August 2026 | |||||||
6.25% senior notes due June 2027 | |||||||
4.3% senior notes due March 2028 | |||||||
3.25% senior notes due August 2029 | |||||||
4.875% senior notes due July 2035 | |||||||
6.625% senior notes due June 2036 | |||||||
6.75% senior notes due December 2037 | |||||||
4.78% senior notes due March 2038 | |||||||
6.125% senior notes due September 2039 | |||||||
5.75% senior notes due May 2041 | |||||||
4.5% senior notes due May 2042 | |||||||
4.125% senior notes due November 2042 | |||||||
5.3% senior notes due December 2043 | |||||||
4.75% senior notes due March 2044 | |||||||
5.125% senior notes due July 2045 | |||||||
3.875% senior notes due August 2047 | |||||||
5.05% senior notes due March 2048 | |||||||
Finance lease liabilities | |||||||
Other | |||||||
Total debt principal | |||||||
Debt premiums | |||||||
Debt discounts and deferred financing costs | ( | ) | ( | ) | |||
Less: | |||||||
Short-term debt (commercial paper) | ( | ) | |||||
Current portion of long-term debt | ( | ) | ( | ) | |||
Long-term debt | $ | $ | |||||
137
The following is a summary of the Company’s required repayments of debt principal due during each of the next five years and thereafter, as of December 31, 2019:
In millions | |||
2020 | $ | ||
2021 | |||
2022 | |||
2023 | |||
2024 | |||
Thereafter | |||
Total | |||
Finance lease liabilities (1) | |||
Total debt principal | $ | ||
_____________________________________________
(1) | See Note 6 ‘‘Leases’’ for a summary of maturities of the Company’s finance lease liabilities. |
Short-term Borrowings
Commercial Paper and Back-up Credit Facilities
The Company did no t have any commercial paper outstanding as of December 31, 2019. The Company had $720 million of commercial paper outstanding at a weighted average interest rate of 2.8 % as of December 31, 2018. In connection with its commercial paper program, the Company maintains a $1.0 billion 364 -day unsecured back-up revolving credit facility, which expires on May 14, 2020, a $1.0 billion, five-year unsecured back-up revolving credit facility, which expires on May 18, 2022, a $2.0 billion, five-year unsecured back-up revolving credit facility, which expires on May 17, 2023 and a $2.0 billion, five-year unsecured back-up revolving credit facility, which expires on May 16, 2024. The credit facilities allow for borrowings at various rates that are dependent, in part, on the Company’s public debt ratings and require the Company to pay a weighted average quarterly facility fee of approximately .03 %, regardless of usage. As of December 31, 2019 and 2018, there were no borrowings outstanding under any of the Company’s back-up credit facilities.
Bridge Loan Facility
On December 3, 2017, in connection with the Aetna Acquisition, the Company entered into a $49.0 billion unsecured bridge loan facility commitment. The Company paid $221 million in fees upon entering into the agreement. The fees were capitalized in other current assets and were amortized as interest expense over the period the bridge loan facility commitment was outstanding. The bridge loan facility commitment was reduced to $44.0 billion on December 15, 2017 upon the Company entering into a $5.0 billion term loan agreement. The Company recorded $56 million of amortization of the bridge loan facility fees during the year ended December 31, 2017, which was recorded in interest expense in the consolidated statement of operations.
On March 9, 2018, the Company issued an aggregate of $40.0 billion principal amount of unsecured floating rate notes and unsecured fixed rate senior notes, collectively the “2018 Notes.” At that time, the bridge loan facility commitment was reduced to $4.0 billion, and the Company paid $8 million in fees to retain the bridge loan facility commitment through the Aetna Acquisition Date. Those fees were capitalized in other current assets and were amortized as interest expense over the period the bridge loan facility commitment was outstanding. The Company recorded $173 million of amortization of the bridge loan facility commitment fees during the year ended December 31, 2018, which was recorded in interest expense in the consolidated statement of operations. On October 26, 2018, the Company entered into a $4.0 billion unsecured 364 -day bridge term loan agreement to formalize the bridge loan facility discussed above. On November 28, 2018, in connection with the Aetna Acquisition, the $4.0 billion unsecured 364 -day bridge term loan agreement terminated.
Federal Home Loan Bank of Boston
Since the Aetna Acquisition Date, a subsidiary of the Company is a member of the FHLBB. As a member, the subsidiary has the ability to obtain cash advances, subject to certain minimum collateral requirements. The maximum borrowing capacity available from the FHLBB as of December 31, 2019 was approximately $850 million. At both December 31, 2019 and 2018, there were no outstanding advances from the FHLBB.
138
Long-term Borrowings
2019 Notes
On August 15, 2019, the Company issued $1.0 billion aggregate principal amount of 2.625 % unsecured senior notes due August 15, 2024, $750 million aggregate principal amount of 3 % unsecured senior notes due August 15, 2026 and $1.75 billion aggregate principal amount of 3.25 % unsecured senior notes due August 15, 2029 (collectively, the “2019 Notes”) for total proceeds of approximately $3.5 billion, net of discounts and underwriting fees. The net proceeds of the 2019 Notes were used to repay certain of the Company’s outstanding debt.
Beginning in July 2019, the Company entered into several interest rate swap and treasury lock transactions to manage interest rate risk. These agreements were designated as cash flow hedges and were used to hedge the exposure to variability in future cash flows resulting from changes in interest rates related to the anticipated issuance of the 2019 Notes. In connection with the issuance of the 2019 Notes, the Company terminated all outstanding cash flow hedges. The Company paid a net amount of $25 million to the hedge counterparties upon termination, which was recorded as a loss, net of tax, of $18 million in accumulated other comprehensive income and will be reclassified as interest expense over the life of the 2019 Notes. See Note 13 ‘‘Other Comprehensive Income’’ for additional information.
Early Extinguishment of Debt
In August 2019, the Company purchased $4.0 billion of its outstanding senior notes through cash tender offers. The senior notes purchased included the following: $1.3 billion of its 3.125 % senior notes due 2020, $723 million of its floating rate notes due 2020, $328 million of its 4.125 % senior notes due 2021, $297 million of 4.125 % senior notes due 2021 issued by Aetna, $413 million of 5.45 % senior notes due 2021 issued by Coventry Health Care, Inc., a wholly-owned subsidiary of Aetna, and $962 million of its 3.35 % senior notes due 2021. In connection with the purchase of such senior notes, the Company paid a premium of $76 million in excess of the aggregate principal amount of the senior notes that were purchased, incurred $8 million in fees and recognized a net gain of $5 million on the write-off of net unamortized deferred financing premiums, for a net loss on early extinguishment of debt of $79 million.
2018 Notes
On March 9, 2018, the Company issued an aggregate of $40.0 billion in principal amount of the 2018 Notes for total proceeds of approximately $39.4 billion, net of discounts and underwriting fees. The net proceeds of the 2018 Notes were used to fund a portion of the Aetna Acquisition. The 2018 Notes consisted of the following at the time of issuance:
In millions | |||
3.125% senior notes due March 2020 | $ | ||
Floating rate notes due March 2020 | |||
3.35% senior notes due March 2021 | |||
Floating rate notes due March 2021 | |||
3.7% senior notes due March 2023 | |||
4.1% senior notes due March 2025 | |||
4.3% senior notes due March 2028 | |||
4.78% senior notes due March 2038 | |||
5.05% senior notes due March 2048 | |||
Total debt principal | $ | ||
From December 2017 through March 2018, the Company entered into several interest rate swap and treasury lock transactions to manage interest rate risk. These agreements were designated as cash flow hedges and were used to hedge the exposure to variability in future cash flows resulting from changes in interest rates related to the anticipated issuance of long-term debt to fund the Aetna Acquisition.
In connection with the issuance of the 2018 Notes, the Company terminated all outstanding cash flow hedges. In connection with the hedge transactions, the Company received a net amount of $446 million from the hedge counterparties upon termination, which was recorded as a gain, net of tax, of $331 million in accumulated other comprehensive income and will be reclassified as a reduction of interest expense over the life of the 2018 Notes. See Note 13 ‘‘Other Comprehensive Income’’ for additional information.
139
Term Loan Agreement
On December 15, 2017, in connection with the Aetna Acquisition, the Company entered into a $5.0 billion term loan agreement. The term loan agreement allowed for borrowings at various rates that were dependent, in part, on the Company’s debt ratings. In connection with the Aetna Acquisition, the Company borrowed $5.0 billion (a $3.0 billion three-year tranche and a $2.0 billion five-year tranche) under the term loan agreement in November 2018. The Company terminated the $2.0 billion five-year tranche in December 2018 with the repayment of the borrowing. The Company made principal payments of $500 million in March 2019, $1.0 billion in May 2019 and $1.5 billion in July 2019 on the three-year tranche, and terminated the three-year tranche and the term loan agreement with the final repayment of the borrowing in July 2019, at which time the Company had repaid all term loans.
Aetna Related Debt
Upon the closing of the Aetna Acquisition, the Company assumed long-term debt with a fair value of $8.1 billion, with stated interest rates ranging from 2.2 % to 6.75 %. The long-term debt assumed is included in the summary of the Company’s borrowings table above.
Debt Covenants
The Company’s back-up revolving credit facilities, unsecured senior notes and unsecured floating rate notes contain customary restrictive financial and operating covenants. These covenants do not include an acceleration of the Company’s debt maturities in the event of a downgrade in the Company’s credit ratings. The Company does not believe the restrictions contained in these covenants materially affect its financial or operating flexibility. As of December 31, 2019, the Company was in compliance with all of its debt covenants.
9. | Pension Plans and Other Postretirement Benefits |
Defined Contribution Plans
As of December 31, 2019, the Company sponsors several active 401(k) savings plans that cover all employees who meet plan eligibility requirements. The Company makes matching contributions consistent with the provisions of the respective plans.
At the participant’s option, account balances, including the Company’s matching contribution, can be invested among various investment options under each plan. Two of the defined contribution plans offer the Company’s common stock fund as an investment option. The Company also maintains nonqualified, unfunded deferred compensation plans for certain key employees. The plans provide participants the opportunity to defer portions of their eligible compensation and for certain nonqualified plans, participants receive matching contributions equivalent to what they could have received under the CVS Health Future Fund 401(k) Plan or Aetna 401(k) Plan absent certain restrictions and limitations under the Internal Revenue Code. The Company’s contributions under the above defined contribution plans were $550 million, $334 million and $314 million in 2019, 2018 and 2017, respectively. The Company’s contributions for the years ended December 31, 2019 and 2018 include contributions to the Aetna Inc. 401(k) plan subsequent to the Aetna Acquisition Date.
Defined Benefit Pension Plans
On November 28, 2018, the Company completed the Aetna Acquisition. Aetna sponsors a tax-qualified defined benefit pension plan that was frozen in 2010. Aetna also sponsors a nonqualified supplemental pension plan that was frozen in 2007. Aetna’s pension plan benefit obligations and the fair value of plan assets were remeasured as of the Aetna Acquisition Date.
Prior to the Aetna Acquisition, during the year ended December 31, 2017, the Company settled the pension obligations of its two existing tax-qualified defined benefit pension plans by irrevocably transferring pension liabilities to an insurance company through the purchase of group annuity contracts and through lump sum distributions. These purchases, funded with pension plan assets, resulted in pre-tax settlement losses of $187 million in the year ended December 31, 2017, related to the recognition of accumulated deferred actuarial losses. The settlement losses were recorded in other expense in the consolidated statement of operations. The Company also sponsors several other defined benefit pension plans that are unfunded nonqualified supplemental retirement plans.
140
Pension Benefit Obligation and Plan Assets
The following tables outline the change in pension benefit obligation and plan assets over the specified periods:
In millions | 2019 | 2018 | |||||
Change in benefit obligation: | |||||||
Benefit obligation, beginning of year | $ | $ | |||||
Acquired benefit obligations | |||||||
Interest cost | |||||||
Actuarial loss | |||||||
Benefit payments | ( | ) | ( | ) | |||
Benefit obligation, end of year | |||||||
Change in plan assets: | |||||||
Fair value of plan assets, beginning of year | |||||||
Fair value of plan assets acquired | |||||||
Actual return on plan assets | ( | ) | |||||
Employer contributions | |||||||
Benefit payments | ( | ) | ( | ) | |||
Fair value of plan assets, end of year | |||||||
Funded status | $ | $ | ( | ) | |||
The assets (liabilities) recognized on the consolidated balance sheets at December 31, 2019 and 2018 for the pension plans consisted of the following:
In millions | 2019 | 2018 | |||||
Non-current assets reflected in other assets | $ | $ | |||||
Current liabilities reflected in accrued expenses | ( | ) | ( | ) | |||
Non-current liabilities reflected in other long-term liabilities | ( | ) | ( | ) | |||
Net assets (liabilities) | $ | $ | ( | ) | |||
Net Periodic Benefit Cost (Income)
The components of net periodic benefit cost (income) for the years ended December 31, 2019, 2018 and 2017 are shown below:
In millions | 2019 | 2018 | 2017 | ||||||||
Components of net periodic benefit cost (income): | |||||||||||
Interest cost | $ | $ | $ | ||||||||
Expected return on plan assets | ( | ) | ( | ) | ( | ) | |||||
Amortization of net actuarial loss | |||||||||||
Settlement losses | |||||||||||
Net periodic benefit cost (income) | $ | ( | ) | $ | ( | ) | $ | ||||
141
Pension Plan Assumptions
The Company uses a series of actuarial assumptions to determine its benefit obligation and net periodic benefit cost (income), including discount rates and expected return on plan assets assumptions, as further detailed below.
Discount Rates - The discount rate is determined using a yield curve as of the annual measurement date. The yield curve consists of a series of individual discount rates, with each discount rate corresponding to a single point in time, based on high-quality bonds. Projected benefit payments are discounted to the measurement date using the corresponding rate from the yield curve that is consistent with the maturity profile of the expected liability cash flows.
Expected Return on Plan Assets - The expected long-term rate of return on plan assets is determined by using the plan’s target allocation and return expectations based on many factors including forecasted long-term capital market real returns and the inflationary outlook on a plan by plan basis. See “Pension Plan Assets” below for additional details regarding the pension plan assets as of December 31, 2019 and 2018.
The Company determined its benefit obligation based on the following weighted average assumptions as of December 31, 2019 and 2018:
2019 | 2018 | ||||
Discount rate | % | % | |||
The Company determined its net periodic benefit cost (income) based on the following weighted average assumptions for the years ended December 31, 2019, 2018 and 2017:
2019 | 2018 | 2017 | ||||||
Discount rate | % | % | % | |||||
Expected long-term rate of return on plan assets | % | % | % | |||||
Pension Plan Assets
As of December 31, 2017, the assets in the Company’s tax-qualified defined benefit pension plans had been fully liquidated to settle all plan obligations through the purchase of group annuity contracts and through lump sum distributions. Subsequent to the Aetna Acquisition Date, the Company’s pension plan assets primarily include debt and equity securities held in separate accounts, common/collective trusts and real estate investments. The valuation methodologies used to value these debt and equity securities and common/collective trusts are similar to the methodologies described in Note 4 “Fair Value.” Pension plan assets also include investments in other assets that are carried at fair value. The following is a description of the valuation methodologies used to value real estate investments and these additional investments, including the general classification pursuant to the fair value hierarchy.
Real Estate - Real estate investments are valued by independent third party appraisers. The appraisals comply with the Uniform Standards of Professional Appraisal Practice, which include, among other things, the income, cost, and sales comparison approaches to estimating property value. Therefore, these investments are classified in Level 3.
Private equity and hedge fund limited partnerships - Private equity and hedge fund limited partnerships are carried at fair value which is estimated using the NAV per unit as reported by the administrator of the underlying investment fund as a practical expedient to fair value. Therefore, these investments have been excluded from the fair value table below.
142
Pension plan assets with changes in fair value measured on a recurring basis at December 31, 2019 were as follows:
In millions | Level 1 | Level 2 | Level 3 | Total | |||||||||||
Cash and cash equivalents | $ | $ | $ | $ | |||||||||||
Debt securities: | |||||||||||||||
U.S. government securities | |||||||||||||||
States, municipalities and political subdivisions | |||||||||||||||
U.S. corporate securities | |||||||||||||||
Foreign securities | |||||||||||||||
Residential mortgage-backed securities | |||||||||||||||
Commercial mortgage-backed securities | |||||||||||||||
Other asset-backed securities | |||||||||||||||
Redeemable preferred securities | |||||||||||||||
Total debt securities | |||||||||||||||
Equity securities: | |||||||||||||||
U.S. domestic | |||||||||||||||
International | |||||||||||||||
Domestic real estate | |||||||||||||||
Total equity securities | |||||||||||||||
Other investments: | |||||||||||||||
Real estate | |||||||||||||||
Common/collective trusts (1) | |||||||||||||||
Derivatives | ( | ) | ( | ) | |||||||||||
Total other investments | |||||||||||||||
Total pension investments (2) | $ | $ | $ | $ | |||||||||||
_____________________________________________
(1) | The assets in the underlying funds of common/collective trusts consist of $ |
(2) | Excludes $ |
143
Pension plan assets with changes in fair value measured on a recurring basis at December 31, 2018 were as follows:
In millions | Level 1 | Level 2 | Level 3 | Total | |||||||||||
Cash and cash equivalents | $ | $ | $ | $ | |||||||||||
Debt securities: | |||||||||||||||
U.S. government securities | |||||||||||||||
States, municipalities and political subdivisions | |||||||||||||||
U.S. corporate securities | |||||||||||||||
Foreign securities | |||||||||||||||
Residential mortgage-backed securities | |||||||||||||||
Commercial mortgage-backed securities | |||||||||||||||
Other asset-backed securities | |||||||||||||||
Redeemable preferred securities | |||||||||||||||
Total debt securities | |||||||||||||||
Equity securities: | |||||||||||||||
U.S. domestic | |||||||||||||||
International | |||||||||||||||
Domestic real estate | |||||||||||||||
Total equity securities | |||||||||||||||
Other investments: | |||||||||||||||
Real estate | |||||||||||||||
Common/collective trusts (1) | |||||||||||||||
Derivatives | |||||||||||||||
Total other investments | |||||||||||||||
Total pension investments (2) | $ | $ | $ | $ | |||||||||||
_____________________________________________
(1) | The assets in the underlying funds of common/collective trusts consist of $ |
(2) | Excludes $ |
The changes in the balance of Level 3 pension plan assets during 2019 were as follows:
2019 | |||||||||||
In millions | Real estate | U.S. corporate securities | Total | ||||||||
Beginning balance | $ | $ | $ | ||||||||
Actual return on plan assets | |||||||||||
Purchases, sales and settlements | ( | ) | ( | ) | ( | ) | |||||
Transfers into (out of) Level 3 | |||||||||||
Ending balance | $ | $ | $ | ||||||||
The increase in the balance of Level 3 pension plan assets during 2018 relates to investments acquired in the Aetna Acquisition. There was an immaterial amount of transfers into or out of Level 3 from the Aetna Acquisition Date to December 31, 2018.
The Company’s pension plan invests in a diversified mix of assets intended to maximize long-term returns while recognizing the need for adequate liquidity to meet ongoing benefit and administrative obligations. The risk of unexpected investment and actuarial outcomes is regularly evaluated. This evaluation is performed through forecasting and assessing ranges of investment outcomes over short- and long-term horizons and by assessing the pension plan’s liability characteristics. Complementary investment styles and strategies are utilized by multiple investment management firms to further improve portfolio and operational risk characteristics. Public and private equity investments are used primarily to increase overall plan returns. Real estate investments are viewed favorably for their diversification benefits and above-average dividend generation. Fixed income
144
investments provide diversification benefits and liability hedging attributes that are desirable, especially in falling interest rate environments.
At December 31, 2019, target investment allocations for the Company’s pension plan were: 33 % in equity securities, 54 % in debt securities, 6 % in real estate, 4 % in private equity limited partnerships and 3 % in hedge funds. Actual asset allocations may differ from target allocations due to tactical decisions to overweight or underweight certain assets or as a result of normal fluctuations in asset values. Asset allocations are consistent with stated investment policies and, as a general rule, periodically rebalanced back to target asset allocations. Asset allocations and investment performance are formally reviewed periodically throughout the year by the pension plan’s Benefit Finance Committee. Forecasting of asset and liability growth is performed at least annually.
Cash Flows
The Company generally contributes to its tax-qualified pension plan based on minimum funding requirements determined under applicable federal laws and regulations. Employer contributions related to the nonqualified supplemental pension plans generally represent payments to retirees for current benefits. The Company contributed $25 million, $12 million and $46 million to its pension plans during 2019, 2018 and 2017, respectively. No contributions are required for the tax-qualified pension plan in 2020. The Company expects to make an immaterial amount of contributions for all other pension plans in 2020. The Company estimates the following future benefit payments, which are calculated using the same actuarial assumptions used to measure the pension benefit obligation as of December 31, 2019:
In millions | |||
2020 | $ | ||
2021 | |||
2022 | |||
2023 | |||
2024 | |||
2025-2029 | |||
Multiemployer Pension Plans
The Company also contributes to a number of multiemployer pension plans under the terms of collective-bargaining agreements that cover its union-represented employees. The risks of participating in these multiemployer plans are different from single-employer pension plans in the following respects: (i) assets contributed to the multiemployer plan by one employer may be used to provide benefits to employees of other participating employers, (ii) if a participating employer stops contributing to the plan, the unfunded obligations of the plan may be borne by the remaining participating employers, and (iii) if the Company chooses to stop participating in some of its multiemployer plans, the Company may be required to pay those plans an amount based on the underfunded status of the applicable plan, which is referred to as a withdrawal liability.
None of the multiemployer pension plans in which the Company participates are individually significant to the Company. The Company’s contributions to multiemployer pension plans were $18 million, $18 million and $17 million in 2019, 2018 and 2017, respectively.
Other Postretirement Benefits
The Company provides postretirement health care and life insurance benefits to certain retirees who meet eligibility requirements. During 2018, the Company acquired additional OPEB plans in connection with the Aetna Acquisition. The Company’s funding policy is generally to pay covered expenses as they are incurred. For retiree medical plan accounting, the Company reviews external data and its own historical trends for health care costs to determine the health care cost trend rates. As of December 31, 2019 and 2018, the Company’s other postretirement benefits had an accumulated postretirement benefit obligation of $246 million and $228 million, respectively. Net periodic benefit costs related to these other postretirement benefits were $7 million, $2 million and $1 million in 2019, 2018 and 2017, respectively.
145
The Company estimates the following future benefit payments, which are calculated using the same actuarial assumptions used to measure the accumulated other postretirement benefit obligation as of December 31, 2019:
In millions | |||
2020 | $ | ||
2021 | |||
2022 | |||
2023 | |||
2024 | |||
2025-2029 | |||
10. | Income Taxes |
The income tax provision (benefit) for continuing operations consisted of the following for the years ended December 31, 2019, 2018 and 2017:
In millions | 2019 | 2018 | 2017 | ||||||||
Current: | |||||||||||
Federal | $ | $ | $ | ||||||||
State | |||||||||||
Deferred: | |||||||||||
Federal | ( | ) | ( | ) | |||||||
State | ( | ) | |||||||||
( | ) | ( | ) | ||||||||
Total | $ | $ | $ | ||||||||
The TCJA was enacted on December 22, 2017. Among numerous changes to existing tax laws, the TCJA permanently reduced the federal corporate income tax rate from 35% to 21% effective on January 1, 2018. The effects of changes in tax rates on deferred tax balances are required to be taken into consideration in the period in which the changes are enacted, regardless of when they are effective. As a result of the reduction of the corporate income tax rate under the TCJA, the Company estimated the revaluation of its net deferred tax liabilities and recorded a provisional income tax benefit of approximately $1.5 billion for year ended December 31, 2017. In 2018, the Company completed its process of determining the TCJA’s final impact and recorded an additional income tax benefit of $100 million.
The following table is a reconciliation of the statutory income tax rate to the Company’s effective income tax rate for continuing operations for the years ended December 31, 2019, 2018 and 2017:
2019 | 2018 | 2017 | ||||||
Statutory income tax rate | % | % | % | |||||
State income taxes, net of federal tax benefit | ||||||||
Effect of the Tax Cuts and Jobs Act | ( | ) | ( | ) | ||||
Health insurer fee | ||||||||
Goodwill impairments | ||||||||
Sale of subsidiary | ||||||||
Other | ( | ) | ||||||
Effective income tax rate | % | % | % | |||||
146
The following table is a summary of the components of the Company’s deferred income tax assets and liabilities as of December 31, 2019 and 2018:
In millions | 2019 | 2018 | |||||
Deferred income tax assets: | |||||||
Lease and rents | $ | $ | |||||
Inventory | |||||||
Employee benefits | |||||||
Bad debts and other allowances | |||||||
Retirement benefits | |||||||
Net operating loss and capital loss carryforwards | |||||||
Deferred income | |||||||
Insurance reserves | |||||||
Investments | |||||||
Other | |||||||
Valuation allowance | ( | ) | ( | ) | |||
Total deferred income tax assets | |||||||
Deferred income tax liabilities: | |||||||
Investments | ( | ) | |||||
Depreciation and amortization | ( | ) | ( | ) | |||
Total deferred income tax liabilities | ( | ) | ( | ) | |||
Net deferred income tax liabilities | $ | ( | ) | $ | ( | ) | |
As of December 31, 2019, the Company has net operating and capital loss carryovers of $480 million, which expire between 2021 and 2038. The Company considers all available positive and negative evidence, including future reversals of existing taxable temporary differences, projected future taxable income, tax planning strategies and the Company’s recent operating results. The Company established a valuation allowance of $374 million because it does not consider it more likely than not that these deferred tax assets will be recovered.
A reconciliation of the beginning and ending amount of unrecognized tax benefits as of December 31, 2019, 2018 and 2017 is as follows:
In millions | 2019 | 2018 | 2017 | ||||||||
Beginning balance | $ | $ | $ | ||||||||
Additions based on tax positions related to the current year | |||||||||||
Additions based on tax positions related to prior years | |||||||||||
Reductions for tax positions of prior years | ( | ) | ( | ) | ( | ) | |||||
Expiration of statutes of limitation | ( | ) | ( | ) | ( | ) | |||||
Settlements | ( | ) | ( | ) | ( | ) | |||||
Ending balance | $ | $ | $ | ||||||||
The increase in the balance of unrecognized tax benefits in 2018 compared to 2017 was mainly due to the Aetna Acquisition.
The Company and most of its subsidiaries are subject to U.S. federal income tax as well as income tax of numerous state and local jurisdictions. The Company is a participant in the Compliance Assurance Process, which is a program made available by the U.S. Internal Revenue Service (“IRS”) to certain qualifying large taxpayers, under which participants work collaboratively with the IRS to identify and resolve potential tax issues through open, cooperative and transparent interaction prior to the annual filing of their federal income tax returns. The IRS has completed its examinations of the Company’s consolidated U.S. federal income tax returns through tax year 2013. The IRS has substantially completed its examinations of the Company’s consolidated U.S. federal income tax returns for tax years 2014 through 2018. The IRS is currently examining the Company’s 2019 consolidated U.S. federal income tax return.
147
The Company and its subsidiaries are also currently under income tax examinations by a number of state and local tax authorities. As of December 31, 2019, no examination has resulted in any proposed adjustments that would result in a material change to the Company’s operating results, financial condition or liquidity.
Substantially all material state and local income tax matters have been concluded for fiscal years through 2014. Certain state exams are likely to be concluded and certain state statutes of limitations will lapse in 2020, but the change in the balance of the Company’s uncertain tax positions is projected to be immaterial. In addition, it is reasonably possible that the Company’s unrecognized tax benefits could change within the next twelve months due to the anticipated conclusion of various examinations with the IRS for various years. An estimate of the range of the possible change cannot be made at this time.
The Company records interest expense related to unrecognized tax benefits and penalties in the income tax provision. The Company accrued interest expense of approximately $49 million, $19 million and $11 million in 2019, 2018 and 2017, respectively. The Company had approximately $173 million and $80 million accrued for interest and penalties as of December 31, 2019 and 2018, respectively.
As of December 31, 2019, the total amount of unrecognized tax benefits that, if recognized, would affect the Company’s effective income tax rate is approximately $532 million, after considering the federal benefit of state income taxes.
11. | Stock Incentive Plans |
The terms of the CVS Health 2017 Incentive Compensation Plan (“ICP”) provide for grants of annual incentive and long-term performance awards to executive officers and other officers and employees of the Company or any subsidiary of the Company, as well as equity compensation to outside directors of CVS Health. Payment of such annual incentive and long-term performance awards will be in cash, stock, other awards or other property, at the discretion of the Management Planning and Development Committee (the “MP&D Committee”) of CVS Health’s Board of Directors (the “Board”). The ICP allows for a maximum of 32 million shares of CVS Health common stock to be reserved and available for grants. Prior to the acquisition of Aetna in 2018, the ICP was the only compensation plan under which the Company granted stock options, restricted stock and other stock-based awards to its employees, with the exception of the Company’s Employee Stock Purchase Plan (“ESPP”). As of December 31, 2019, there were approximately 17 million shares of CVS Health common stock available for future grants under the ICP.
As of the Aetna Acquisition Date, approximately 22 million shares of Aetna common stock subject to awards outstanding under the Amended Aetna Inc. 2010 Stock Incentive Plan (“SIP”) were assumed by CVS Health. In addition, in accordance with the merger agreement, shares which were available for future issuance under the SIP were converted into approximately 32 million shares of CVS Health common stock reserved and available for issuance pursuant to future awards. As of December 31, 2019, there were approximately 27 million shares of CVS Health common stock available for future grants under the SIP.
Stock-Based Compensation Expense
Stock-based compensation is measured at the grant date based on the fair value of the award and is recognized as expense over the requisite service period of the stock award (generally three to five years ) using the straight-line method. The following table is a summary of stock-based compensation for the years ended December 31, 2019, 2018 and 2017:
In millions | 2019 | 2018 | 2017 | ||||||||
Stock options and stock appreciation rights (“SARs”) (1) (2) | $ | $ | $ | ||||||||
Restricted stock units and performance stock units (2) | |||||||||||
Total stock-based compensation | $ | $ | $ | ||||||||
_____________________________________________
(1) | Includes the ESPP. |
(2) | Stock-based compensation for the year ended December 31, 2018 includes $ |
ESPP
The ESPP provides for the purchase of up to 30 million shares of CVS Health common stock. Under the ESPP, eligible employees may purchase common stock at the end of each six month offering period at a purchase price equal to 90 % of the lower of the fair market value on the first day or the last day of the offering period. During 2019, approximately two million
148
shares of common stock were purchased under the provisions of the ESPP at an average price of $53.29 per share. As of December 31, 2019, approximately seven million shares of common stock were available for issuance under the ESPP.
The fair value of stock-based compensation associated with the ESPP is estimated on the date of grant (the first day of the six month offering period) using the Black-Scholes option pricing model.
The following table is a summary of the assumptions used to value the ESPP awards for the years ended December 31, 2019, 2018 and 2017:
2019 | 2018 | 2017 | |||||||||
Dividend yield (1) | % | % | % | ||||||||
Expected volatility (2) | % | % | % | ||||||||
Risk-free interest rate (3) | % | % | % | ||||||||
Expected life (in years) (4) | |||||||||||
Weighted-average grant date fair value | $ | $ | $ | ||||||||
_____________________________________________
(1) | The dividend yield is calculated based on semi-annual dividends paid and the fair market value of CVS Health stock at the grant date. |
(2) | The expected volatility is estimated based on the historical volatility of CVS Health’s daily stock price over the previous six month period. |
(3) | The risk-free interest rate is selected based on the Treasury constant maturity interest rate whose term is consistent with the expected term of ESPP purchases (i.e., six months). |
(4) | The expected life is based on the semi-annual purchase period. |
Restricted Stock Units and Performance Stock Units
The Company’s restricted stock units and performance stock units are considered nonvested share awards and require no payment from the employee. The fair value of the restricted stock units is based on the market price of CVS Health common stock on the grant date and is recognized on a straight-line basis over the vesting period. For each restricted stock unit granted, employees receive one share of common stock, net of taxes, at the end of the vesting period.
The Company’s performance stock units contain performance vesting conditions in addition to a service vesting condition. Vesting of the Company’s performance stock units is dependent upon the degree to which the Company achieves its performance goals, which are generally set for a three-year performance period and are approved at the time of grant by the MP&D Committee.
The fair value of performance stock units granted with service and performance vesting conditions is based on the market price of CVS Health common stock on the grant date and is recognized over the vesting period. Certain of the performance stock units also contain a market vesting condition based on the performance of CVS Health common stock relative to a comparator group. The fair value of these performance stock units is determined using a Monte Carlo simulation as of the grant date and is recognized over the vesting period.
On November 28, 2018, the Company completed the Aetna Acquisition. All unvested Aetna performance stock unit and restricted stock unit awards as of the Aetna Acquisition Date were converted into replacement CVS Health restricted stock awards.
As of December 31, 2019, there was $524 million of total unrecognized compensation cost related to the Company’s restricted stock units and performance stock units that are expected to vest. These costs are expected to be recognized over a weighted-average period of 2.2 years. The total fair value of restricted stock units vested during 2019, 2018 and 2017 was $265 million, $262 million and $175 million, respectively.
149
The following table is a summary of the restricted stock unit and performance stock unit activity for the year ended December 31, 2019:
In thousands, except weighted average grant date fair value | Units | Weighted Average Grant Date Fair Value | ||||
Outstanding at beginning of year, nonvested | $ | |||||
Granted | $ | |||||
Vested | ( | ) | $ | |||
Forfeited | ( | ) | $ | |||
Outstanding at end of year, nonvested | $ | |||||
Stock Options and SARs
All stock option grants are awarded at fair value on the date of grant. The fair value of stock options is estimated using the Black-Scholes option pricing model, and stock-based compensation is recognized on a straight-line basis over the requisite service period. Stock options granted generally become exercisable over a four-year period from the grant date. Stock options granted prior to 2019 generally expire seven years after the grant date. Stock options granted in 2019 expire ten years after the grant date.
On November 28, 2018, the Company completed the Aetna Acquisition. All unvested Aetna SARs outstanding as of the Aetna Acquisition Date were converted into replacement CVS Health SARs. The replacement SARs granted will be settled in CVS Health common stock, net of taxes, based on the appreciation of the stock price on the exercise date over the market price on the date of grant. The fair value of SARs is estimated using the Black-Scholes option pricing model, and stock-based compensation is recognized on a straight-line basis over the requisite service period. SARs generally become exercisable over a three-year period from the grant date. SARs generally expire ten years after the grant date.
The following table is a summary of stock option and SAR activity that occurred for the years ended December 31, 2019, 2018 and 2017:
In millions | 2019 | 2018 | 2017 | ||||||||
Cash received from stock options exercised (including ESPP) | $ | $ | $ | ||||||||
Payments for taxes for net share settlement of equity awards | |||||||||||
Intrinsic value of stock options and SARs exercised | |||||||||||
Fair value of stock options and SARs vested | |||||||||||
The fair value of each stock option and SAR is estimated using the Black-Scholes option pricing model based on the following assumptions at the time of grant:
2019 | 2018 | 2017 | |||||||||
Dividend yield (1) | % | % | % | ||||||||
Expected volatility (2) | % | % | % | ||||||||
Risk-free interest rate (3) | % | % | % | ||||||||
Expected life (in years) (4) | |||||||||||
Weighted-average grant date fair value | $ | $ | $ | ||||||||
_____________________________________________
(1) | The dividend yield is based on annual dividends paid and the fair market value of CVS Health stock at the grant date. |
(2) | The expected volatility is estimated based on the historical volatility of CVS Health’s daily stock price over a period equal to the expected life of each option or SAR grant after adjustments for infrequent events such as stock splits. |
(3) | The risk-free interest rate is selected based on yields from U.S. Treasury zero-coupon issues with a remaining term equal to the expected term of the options or SARs being valued. |
(4) | The expected life represents the number of years the options or SARs are expected to be outstanding from grant date based on historical option or SAR holder exercise experience. |
The increase in the weighted-average grant date fair value in 2018 was due to the issuance of the replacement SARs in connection with the Aetna Acquisition.
150
As of December 31, 2019, unrecognized compensation expense related to unvested stock options and SARs totaled $41 million, which the Company expects to be recognized over a weighted-average period of 2.1 years. After considering anticipated forfeitures, the Company expects approximately 10 million of the unvested stock options and SARs to vest over the requisite service period.
The following table is a summary of the Company’s stock option and SAR activity for the year ended December 31, 2019:
In thousands, except weighted average exercise price and remaining contractual term | Shares | Weighted Average Exercise Price | Weighted Average Remaining Contractual Term | Aggregate Intrinsic Value | ||||||||
Outstanding at beginning of year | $ | |||||||||||
Granted | $ | |||||||||||
Exercised | ( | ) | $ | |||||||||
Forfeited | ( | ) | $ | |||||||||
Expired | ( | ) | $ | |||||||||
Outstanding at end of year | $ | $ | ||||||||||
Exercisable at end of year | $ | |||||||||||
Vested at end of year and expected to vest in the future | $ | |||||||||||
12. | Shareholders’ Equity |
Share Repurchases
The following share repurchase programs have been authorized by the Board:
In billions Authorization Date | Authorized | Remaining as of December 31, 2019 | |||||
November 2, 2016 (“2016 Repurchase Program”) | $ | $ | |||||
December 15, 2014 (“2014 Repurchase Program”) | |||||||
Each of the share Repurchase Programs was effective immediately. The 2014 Repurchase Program has been completed. The 2016 Repurchase Program permits the Company to effect repurchases from time to time through a combination of open market repurchases, privately negotiated transactions, accelerated share repurchase (“ASR”) transactions, and/or other derivative transactions. The 2016 Repurchase Program can be modified or terminated by the Board at any time.
During the years ended December 31, 2019 and 2018, the Company did not repurchase any shares of common stock pursuant to the 2016 Repurchase Program. During the year ended December 31, 2017, the Company repurchased an aggregate of 55.4 million shares of common stock for approximately $4.4 billion under the 2014 and 2016 Repurchase Programs, a significant portion of which were repurchased through two ASR transactions which are further described below.
Pursuant to the authorization under the 2014 Repurchase Program, in August 2016, the Company entered into two fixed dollar ASRs with Barclays Bank PLC (“Barclays”) for a total of $3.6 billion. Upon payment of the $3.6 billion purchase price in January 2017, the Company received a number of shares of CVS Health common stock equal to 80 % of the $3.6 billion notional amount of the ASRs or approximately 36.1 million shares, which were placed into treasury stock in January 2017. The ASRs were accounted for as an initial treasury stock transaction for $2.9 billion and a forward contract for $0.7 billion. In April 2017, the Company received an additional 9.9 million shares of CVS Health common stock, representing the remaining 20 % of the $3.6 billion notional amount of the ASRs, thereby concluding the ASRs. The additional 9.9 million shares of common stock delivered to the Company by Barclays were placed into treasury stock, and the forward contract was reclassified from capital surplus to treasury stock in April 2017.
Dividends
The quarterly cash dividend declared by the Board was $0.50 per share in 2019 and 2018. CVS Health has paid cash dividends every quarter since becoming a public company. Future dividend payments will depend on the Company’s earnings, capital requirements, financial condition and other factors considered relevant by the Board.
151
Regulatory Requirements
On November 28, 2018, the Company completed the Aetna Acquisition. Aetna’s insurance business operations are conducted through subsidiaries that principally consist of HMOs and insurance companies. The Company’s HMO and insurance subsidiaries report their financial statements in accordance with accounting practices prescribed by state regulatory authorities which may differ from GAAP.
The combined statutory net income of the Company’s insurance and HMO subsidiaries for the year ended December 31, 2019 was $2.8 billion and for the year ended December 31, 2018 (which includes Aetna and its subsidiaries from November 28, 2018 to December 31, 2018) was not material. The estimated combined statutory capital and surplus at December 31, 2019 and 2018 of the Company’s insurance and HMO subsidiaries was approximately $11.0 billion and $10.1 billion, respectively. The Company’s insurance and HMO subsidiaries paid $2.4 billion of gross dividends to the Company for the year ended December 31, 2019.
In addition to general state law restrictions on payments of dividends and other distributions to stockholders applicable to all corporations, HMOs and insurance companies are subject to further regulations that, among other things, may require those companies to maintain certain levels of equity and restrict the amount of dividends and other distributions that may be paid to their equity holders. In addition, in connection with the Aetna Acquisition, the Company made certain undertakings that require prior regulatory approval of dividends by certain of its HMOs and insurance companies. At December 31, 2019, these amounts were as follows:
In millions | |||
Estimated minimum statutory surplus required by regulators | $ | ||
Investments on deposit with regulatory bodies | |||
Estimated maximum dividend distributions permitted in 2020 without prior regulatory approval | |||
Noncontrolling Interests
At December 31, 2019 and 2018, noncontrolling interests were $306 million and $318 million, respectively, primarily related to third party interests in the Company’s operating entities. The noncontrolling entities’ share is included in total shareholders’ equity on the consolidated balance sheets.
152
13. | Other Comprehensive Income |
Shareholders’ equity included the following activity in accumulated other comprehensive income (loss) in 2019, 2018 and 2017:
At December 31, | |||||||||||
In millions | 2019 | 2018 | 2017 | ||||||||
Net unrealized investment gains: | |||||||||||
Beginning of year balance | $ | $ | $ | ||||||||
Other comprehensive income before reclassifications ($927, $132 and $0 pretax) | |||||||||||
Amounts reclassified from accumulated other comprehensive income ($(105), $1 and $0 pretax) (1) | ( | ) | |||||||||
Other comprehensive income | |||||||||||
End of year balance | |||||||||||
Foreign currency translation adjustments: | |||||||||||
Beginning of year balance | ( | ) | ( | ) | ( | ) | |||||
Other comprehensive income (loss) before reclassifications | ( | ) | ( | ) | |||||||
Amounts reclassified from accumulated other comprehensive loss (2) | |||||||||||
Other comprehensive income (loss) | ( | ) | ( | ) | |||||||
End of year balance | ( | ) | ( | ) | |||||||
Net cash flow hedges: | |||||||||||
Beginning of year balance | ( | ) | ( | ) | |||||||
Adoption of new accounting standard (3) | — | ( | ) | — | |||||||
Other comprehensive income (loss) before reclassifications ($(25), $465 and $(18) pretax) | ( | ) | ( | ) | |||||||
Amounts reclassified from accumulated other comprehensive income (loss) ($(20), $(19) and $2 pretax) (4) | ( | ) | ( | ) | |||||||
Other comprehensive income (loss) | ( | ) | ( | ) | |||||||
End of year balance | ( | ) | |||||||||
Pension and other postretirement benefits: | |||||||||||
Beginning of year balance | ( | ) | ( | ) | ( | ) | |||||
Adoption of new accounting standard (3) | — | ( | ) | — | |||||||
Other comprehensive income (loss) before reclassifications ($162, $(178) and $0 pretax) | ( | ) | |||||||||
Amounts reclassified from accumulated other comprehensive loss ($(12), $11 and $249 pretax) (5) | ( | ) | |||||||||
Other comprehensive income (loss) | ( | ) | |||||||||
End of year balance | ( | ) | ( | ) | ( | ) | |||||
Total beginning of year accumulated other comprehensive income (loss) | ( | ) | ( | ) | |||||||
Adoption of new accounting standard (3) | — | ( | ) | — | |||||||
Total other comprehensive income | |||||||||||
Total end of year accumulated other comprehensive income (loss) | $ | $ | $ | ( | ) | ||||||
_____________________________________________
(1) | Amounts reclassified from accumulated other comprehensive income for specifically identified debt securities are included in net investment income in the consolidated statements of operations. |
(2) | Amounts reclassified from accumulated other comprehensive loss represent the elimination of the cumulative translation adjustment associated with the sale of Onofre, which was sold on July 1, 2019. The loss on the divestiture of Onofre is reflected in operating expenses in the consolidated statements of operations. |
(3) | Reflects the adoption of ASU 2018-02, Income Statement Reporting Comprehensive Income (Topic 220); Reclassification of Certain Tax Effects from Accumulated Other Comprehensive Income during the year ended December 31, 2018. |
153
(4) | Amounts reclassified from accumulated other comprehensive income (loss) for specifically identified cash flow hedges are included within interest expense in the consolidated statements of operations. The Company expects to reclassify approximately $ |
(5) |
14. | Earnings (Loss) Per Share |
Earnings (loss) per share is computed using the two-class method. For periods in which the Company reports net income, diluted earnings per share is determined by using the weighted average number of common and dilutive common equivalent shares outstanding during the period, unless the effect is antidilutive. SARs and options to purchase 17 million shares of common stock were outstanding, but were excluded from the calculation of diluted earnings per share, for the year ended December 31, 2019 because the exercise prices of the SARs and options were greater than the average market price of the common shares and, therefore, the effect would be antidilutive. For the same reason, options to purchase 13 million and 10 million shares of common stock were outstanding, but were excluded from the calculation of diluted earnings per share, for the years ended December 31, 2018 and 2017, respectively. In addition, due to the loss from continuing operations attributable to CVS Health in the year ended December 31, 2018, 3 million potentially dilutive common equivalent shares were excluded from the calculation of diluted earnings per share, as the impact of these shares was antidilutive for that period.
The following is a reconciliation of basic and diluted earnings (loss) per share from continuing operations for the years ended December 31, 2019, 2018 and 2017:
In millions, except per share amounts | 2019 | 2018 | 2017 | ||||||||
Numerator for earnings (loss) per share calculation: | |||||||||||
Income (loss) from continuing operations | $ | $ | ( | ) | $ | ||||||
Income allocated to participating securities | ( | ) | ( | ) | ( | ) | |||||
Net (income) loss attributable to noncontrolling interests | ( | ) | |||||||||
Income (loss) from continuing operations attributable to CVS Health | $ | $ | ( | ) | $ | ||||||
Denominator for earnings (loss) per share calculation: | |||||||||||
Weighted average shares, basic | |||||||||||
Effect of dilutive securities | |||||||||||
Weighted average shares, diluted | |||||||||||
Earnings (loss) per share from continuing operations: | |||||||||||
Basic | $ | $ | ( | ) | $ | ||||||
Diluted | $ | $ | ( | ) | $ | ||||||
15. | Reinsurance |
The Company utilizes reinsurance agreements primarily to: (a) reduce required capital and (b) facilitate the acquisition or disposition of certain insurance contracts. Ceded reinsurance agreements permit the Company to recover a portion of its losses from reinsurers, although they do not discharge the Company’s primary liability as the direct insurer of the risks reinsured.
On November 30, 2018, the Company completed the sale of Aetna’s standalone Medicare Part D prescription drug plans to a subsidiary of WellCare Health Plans, Inc. (“WellCare”), effective December 31, 2018. In connection with that sale, subsidiaries of WellCare and Aetna entered into reinsurance agreements under which WellCare ceded to Aetna 100% of the insurance risk related to the divested standalone Medicare Part D prescription drug plans for the 2019 PDP plan year.
In January 2020, the Company entered into two four-year reinsurance agreements with an unrelated reinsurer that allow it to reduce required capital and provide collateralized excess of loss reinsurance coverage on a portion of the Health Care Benefits segment’s group Commercial Insured business.
154
Reinsurance recoverables (recorded as other current assets or other assets on the consolidated balance sheets) at December 31, 2019 and 2018 were as follows:
In millions | 2019 | 2018 | |||||
Reinsurer | |||||||
Hartford Life and Accident Insurance Company | $ | $ | |||||
Lincoln Life & Annuity Company of New York | |||||||
WellCare Health Plans | |||||||
VOYA Retirement Insurance and Annuity Company | |||||||
All Other | |||||||
Total | $ | $ | |||||
Prior to the Aetna Acquisition Date, the Company had no material assumed or ceded premiums or benefit costs. Accordingly, the Company has not provided disclosure of these amounts for periods prior to 2018.
Direct, assumed and ceded premiums earned for the years ended December 31, 2019 and 2018 were as follows:
In millions | 2019 | 2018 | |||||
Direct | $ | $ | |||||
Assumed | |||||||
Ceded | ( | ) | ( | ) | |||
Net premiums | $ | $ | |||||
The impact of reinsurance on benefit costs for the years ended December 31, 2019 and 2018 were as follows:
In millions | 2019 | 2018 | |||||
Direct | $ | $ | |||||
Assumed | |||||||
Ceded | ( | ) | ( | ) | |||
Net benefit costs | $ | $ | |||||
There is not a material difference between premiums on a written basis versus an earned basis.
The Company also has various agreements with unrelated reinsurers that do not qualify for reinsurance accounting under GAAP, and consequently are accounted for using deposit accounting. The Company entered into these contracts to reduce the risk of catastrophic loss which in turn reduces the Company’s capital and surplus requirements. Total deposit assets and liabilities related to reinsurance agreements that do not qualify for reinsurance accounting under GAAP were not material as of December 31, 2019 or 2018.
16. | Commitments and Contingencies |
Guarantees
The Company has the following significant guarantee arrangements at December 31, 2019:
• | ASC Claim Funding Accounts - The Company has arrangements with certain banks for the processing of claim payments for its ASC customers. The banks maintain accounts to fund claims of the Company’s ASC customers. The customer is responsible for funding the amount paid by the bank each day. In these arrangements, the Company guarantees that the banks will not sustain losses if the responsible ASC customer does not properly fund its account. The aggregate maximum exposure under these arrangements is generally limited to $ |
• | Separate Accounts Assets - Certain Separate Accounts assets associated with the large case pensions business in the Corporate/Other segment represent funds maintained as a contractual requirement to fund specific pension annuities that the Company has guaranteed. Minimum contractual obligations underlying the guaranteed benefits in these Separate |
155
Accounts were approximately $1.4 billion at both December 31, 2019 and 2018. See Note 1 ‘‘Significant Accounting Policies’’ for additional information on Separate Accounts. Contract holders assume all investment and mortality risk and are required to maintain Separate Accounts balances at or above a specified level. The level of required funds is a function of the risk underlying the Separate Account’s investment strategy. If contract holders do not maintain the required level of Separate Accounts assets to meet the annuity guarantees, the Company would establish an additional liability. Contract holders’ balances in the Separate Accounts at December 31, 2019 exceeded the value of the guaranteed benefit obligation. As a result, the Company was not required to maintain any additional liability for its related guarantees at December 31, 2019.
Lease Guarantees
Between 1995 and 1997, the Company sold or spun off a number of subsidiaries, including Bob’s Stores and Linens ‘n Things, each of which subsequently filed for bankruptcy, and Marshalls. In many cases, when a former subsidiary leased a store, the Company provided a guarantee of the former subsidiary’s lease obligations for the initial lease term and any extension thereof pursuant to a renewal option provided for in the lease prior to the time of the disposition. When the subsidiaries were disposed of and accounted for as discontinued operations, the Company’s guarantees remained in place, although each initial purchaser agreed to indemnify the Company for any lease obligations the Company was required to satisfy. If any of the purchasers or any of the former subsidiaries fail to make the required payments under a store lease, the Company could be required to satisfy those obligations. As of December 31, 2019, the Company guaranteed 79 such store leases (excluding the lease guarantees related to Linens ‘n Things, which have been recorded as a liability on the consolidated balance sheet), with the maximum remaining lease term extending through 2030.
Guaranty Fund Assessments, Market Stabilization and Other Non-Voluntary Risk Sharing Pools
Under guaranty fund laws existing in all states, insurers doing business in those states can be assessed (in most states up to prescribed limits) for certain obligations of insolvent insurance companies to policyholders and claimants. The life and health insurance guaranty associations in which the Company participates that operate under these laws respond to insolvencies of long-term care insurers as well as health insurers. The Company’s assessments generally are based on a formula relating to the Company’s health care premiums in the state compared to the premiums of other insurers. Certain states allow assessments to be recovered over time as offsets to premium taxes. Some states have similar laws relating to HMOs and/or other payors such as not-for-profit consumer-governed health plans established under the ACA.
In 2009, the Pennsylvania Insurance Commissioner placed long-term care insurer Penn Treaty Network America Insurance Company and one of its subsidiaries (collectively, “Penn Treaty”) in rehabilitation, an intermediate action before insolvency, and subsequently petitioned a state court to convert the rehabilitation into a liquidation. Penn Treaty was placed in liquidation in March 2017. The Company has recorded a liability for its estimated share of future assessments by applicable life and health guaranty associations. It is reasonably possible that in the future the Company may record a liability and expense relating to other insolvencies which could have a material adverse effect on the Company’s operating results, financial condition and cash flows. While historically the Company has ultimately recovered more than half of guaranty fund assessments through statutorily permitted premium tax offsets, significant increases in assessments could lead to legislative and/or regulatory actions that limit future offsets.
HMOs in certain states in which the Company does business are subject to assessments, including market stabilization and other risk-sharing pools, for which the Company is assessed charges based on incurred claims, demographic membership mix and other factors. The Company establishes liabilities for these assessments based on applicable laws and regulations. In certain states, the ultimate assessments the Company pays are dependent upon the Company’s experience relative to other entities subject to the assessment, and the ultimate liability is not known at the financial statement date. While the ultimate amount of the assessment is dependent upon the experience of all pool participants, the Company believes it has adequate reserves to cover such assessments.
The Company’s total guaranty fund assessments liability was $84 million and $90 million at December 31, 2019 and 2018, respectively, and was recorded in accrued expenses on the consolidated balance sheets.
Litigation and Regulatory Proceedings
The Company is a party to numerous legal proceedings, investigations, audits and claims arising, for the most part, in the ordinary course of its businesses, including the matters described below. The Company records accruals for outstanding legal matters when it believes it is probable that a loss will be incurred and the amount can be reasonably estimated. The Company
156
evaluates, on a quarterly basis, developments in legal matters that could affect the amount of any accrual and developments that would make a loss contingency both probable and reasonably estimable. If a loss contingency is not both probable and reasonably estimable, the Company does not establish an accrued liability. None of the Company’s accruals for outstanding legal matters are material individually or in the aggregate to the Company’s financial condition.
Except as otherwise noted, the Company cannot predict with certainty the timing or outcome of the legal matters described below, and the Company is unable to reasonably estimate a possible loss or range of possible loss in excess of amounts already accrued for these matters. It is reasonably possible that the outcome of such legal matters could be material to the Company.
Usual and Customary Litigation
The Company is named as a defendant in a number of lawsuits that allege that the Company’s retail stores overcharged for prescription drugs by not providing the correct usual and customary charge.
Corcoran et al. v. CVS Health Corporation (U.S. District Court for the Northern District of California) and Podgorny et al. v. CVS Health Corporation (U.S. District Court for the Northern District of Illinois). These putative class actions were filed against the Company in July and September 2015. The cases were consolidated in the U.S. District Court for the Northern District of California. Plaintiffs seek damages and injunctive relief under the consumer protection statutes of certain states on behalf of a class of consumers who purchased certain prescription drugs. Several third-party payors filed similar putative class actions on behalf of payors captioned Sheet Metal Workers Local No. 20 Welfare and Benefit Fund v. CVS Health Corp. and Plumbers Welfare Fund, Local 130 v. CVS Health Corporation (both pending in the U.S. District Court for the District of Rhode Island) in February and August 2016. In all of these cases the plaintiffs allege the Company overcharged for certain prescription drugs by not submitting the price available to members of the CVS Health Savings Pass program as the pharmacy’s usual and customary price. In the Corcoran case, the U.S. District Court granted summary judgment to CVS on plaintiffs’ claims in their entirety and certified certain subclasses in September 2017. In June 2019, the U.S. Court of Appeals for the Ninth Circuit reversed the U.S. District Court’s grant of summary judgment and reversed the U.S. District Court’s narrowing of the requested class. The Corcoran case is proceeding to a trial on a six state class basis, and trial is scheduled to occur in 2020. The Sheet Metal Workers plaintiffs have amended their complaint to assert a claim under the federal Racketeer Influenced and Corrupt Organizations Act premised on an alleged conspiracy between the Company and other PBMs. The Company is defending itself against these claims.
State of California ex rel. Matthew Omlansky v. CVS Caremark Corporation (Superior Court of the State of California, County of Sacramento). In April 2016, the California Superior Court unsealed a first amended qui tam complaint filed in July 2013. The government has declined to intervene in this case. The relator alleges that the Company submitted false claims for payment to the California Medicaid program in connection with reimbursement for drugs available through the CVS Health Savings Pass program as well as certain other generic drugs. The case has been stayed pending the relator’s appeal of the judgment against him in a similar case against another retailer. The Company is defending itself against these claims.
State of Mississippi v. CVS Health Corporation, et al. (Circuit Court of DeSoto County, Mississippi, Third Judicial District). In July 2016, the Company was served with a complaint filed on behalf of the State of Mississippi. The complaint alleged that CVS retail pharmacies in Mississippi submitted false claims for reimbursement to the Mississippi Medicaid program by not submitting the price available to members of the CVS Health Savings Pass program as the pharmacy’s usual and customary price. In June 2019, the Company’s motion for judgment on the pleadings was granted in part and denied in part. Also in June 2019, the State of Mississippi’s motion to dismiss the Company’s counterclaim for declaratory relief was granted. The Company is defending itself against these claims.
PBM Litigation and Investigations
The Company is named as a defendant in a number of lawsuits and is subject to a number of investigations concerning its PBM practices.
Klein, et al. v. Prime Therapeutics, et al. (U.S. District Court for the District of Minnesota). This putative class action was filed against the Company and other PBMs in June 2017 on behalf of ERISA plan members who purchased and paid for EpiPen or EpiPen Jr. Plaintiffs allege that the PBMs are ERISA fiduciaries to plan members and have violated ERISA by allegedly causing higher inflated prices for EpiPens through the process of negotiating increased rebates from EpiPen manufacturer Mylan. This case has been consolidated with a similar matter and is now proceeding as In re EpiPen ERISA Litigation. The Company is defending itself against these claims.
157
County of Harris, Texas v. Eli Lilly and Company, et al. (U.S. District Court for the Southern District of Texas). This lawsuit was filed against Caremark, Aetna, the manufacturers of insulin and other PBMs in November 2019 by Harris County. Harris County alleges that it was overcharged for insulin as a result of a “price fixing conspiracy” between the manufacturers and PBMs to artificially increase the price of insulin and other diabetes medications. The complaint alleges that the manufacturers and PBMs engaged in an “Insulin Pricing Scheme” whereby the manufacturers artificially increased the reported prices of their insulin products while “secretly” paying rebates to the PBMs in exchange for preferred treatment on the PBMs’ drug formularies. The Company is defending itself against these claims.
In March 2017, Advanced Care Scripts, a subsidiary acquired in the Omnicare transaction that is now part of the Company’s PBM specialty operations, received a subpoena from the U.S. Department of Justice (the “DOJ”) requesting documents concerning its work with pharmaceutical manufacturers and charitable foundations that provide payment assistance to Medicare patients in connection with an investigation concerning potential violations of the federal Anti-Kickback Statute and/or federal False Claims Act. The Company has been cooperating with the government with respect to this subpoena and additional requests for information.
The Company has received subpoenas, CIDs and other requests for documents and information from, and is being investigated by, Attorneys General of several states regarding its PBM practices, including pricing and rebates. In addition, the Company has received inquiries from congressional committees regarding insulin pricing. The Company has been providing documents and information in response to these subpoenas, CIDs and requests for information.
Controlled Substances Litigation, Audits and Subpoenas
In December 2017, the U.S. Judicial Panel on Multidistrict Litigation consolidated numerous cases filed against various defendants by plaintiffs such as counties, cities, hospitals, Indian tribes and third-party payors, alleging claims generally concerning the impacts of widespread opioid abuse. The consolidated multidistrict litigation captioned In re National Prescription Opiate Litigation (MDL No. 2804) is pending in the U.S. District Court for the Northern District of Ohio. This multidistrict litigation presumptively includes hundreds of relevant federal court cases that name the Company as a defendant. A significant number of similar cases that name the Company as a defendant in some capacity are pending in state courts. In addition, the Company has been named as a defendant in similar cases brought by certain state Attorneys General. The Company is defending itself against all such claims. Additionally, the Company has received subpoenas, CIDs and/or other requests for information regarding opioids from state Attorneys General and insurance and other regulators of several states. The Company has been cooperating with the government with respect to these subpoenas, CIDs and other requests for information.
The Company routinely is audited by the U.S. Drug Enforcement Administration (the “DEA”). In some instances, the Company is in discussions with the DEA and U.S. Attorney’s Offices concerning allegations that the Company violated certain requirements of the federal Controlled Substances Act.
In September 2015, the DEA served the Company with an administrative subpoena. The subpoena seeks documents related to controlled substance policies, procedures and practices at eight Omnicare pharmacy locations from May 2012 to the present. In September 2017, the DEA expanded the investigation to include an additional Omnicare pharmacy location. The Company has been cooperating with the government and providing documents and witnesses in response to this subpoena.
In January 2020, the DOJ served the Company with a DEA administrative subpoena. The subpoena seeks documents relating to practices with respect to opioids and other controlled substances at CVS Pharmacy locations in connection with an investigation concerning potential violations of the federal Controlled Substances Act and the federal False Claims Act. The Company has been cooperating with the government with respect to this subpoena.
Prescription Processing Litigation and Investigations
U.S. ex rel. Bassan et al. v. Omnicare, Inc. and CVS Health Corp. and U.S. ex rel. Mohajer et al. v. Omnicare, Inc. and CVS Health Corp. (U.S. District Court for the Southern District of New York). In December 2019, the U.S. Attorney’s Office for the Southern District of New York (the “SDNY”) filed complaints-in-intervention in these two previously sealed qui tam cases. With respect to the Bassan complaint, all states except Washington, D.C. and Indiana have declined to intervene; Washington, D.C. has intervened, and Indiana has not filed a decision on intervention. The government’s investigation related to these complaints included the previously disclosed CID that the Company received in October 2015 from the SDNY concerning the Company’s Omnicare pharmacies’ cycle fill process for assisted living facilities. The complaints allege that for certain non-skilled nursing facilities,
158
Omnicare improperly filled prescriptions beyond one year where a valid prescription did not exist and that these dispensing events violated the federal False Claims Act. The Company is defending itself against these claims.
In July 2017, the Company also received a subpoena from the California Department of Insurance requesting documents concerning the Company’s Omnicare pharmacies’ cycle fill process for assisted living facilities. The Company has been cooperating with the California Department of Insurance and providing documents and information in response to this subpoena.
In December 2016, the Company received a CID from the U.S. Attorney’s Office for the Northern District of New York requesting documents and information in connection with a federal False Claims Act investigation concerning whether the Company’s retail pharmacies improperly submitted certain insulin claims to Part D of the Medicare program rather than Part B of the Medicare program. The Company has been cooperating with the government and providing documents and information in response to this CID.
In May 2017, the Company received a CID from the SDNY requesting documents and information concerning possible false claims submitted to Medicare in connection with reimbursements for prescription drugs under the Medicare Part D program. The Company has been cooperating with the government and providing documents and information in response to this CID.
Provider Proceedings
The Company is named as a defendant in purported class actions and individual lawsuits arising out of its practices related to the payment of claims for services rendered to its members by health care providers with whom the Company has a contract and with whom the Company does not have a contract (“out-of-network providers”). Among other things, these lawsuits allege that the Company paid too little to its health plan members and/or providers for these services and/or otherwise allege that the Company failed to timely or appropriately pay or administer claims and benefits (including the Company’s post payment audit and collection practices and reductions in payments to providers due to sequestration). Other major health insurers are the subject of similar litigation or have settled similar litigation.
The Company also has received subpoenas and/or requests for documents and other information from, and been investigated by, state Attorneys General and other state and/or federal regulators, legislators and agencies relating to, and the Company is involved in other litigation regarding, its out-of-network benefit payment and administration practices. It is reasonably possible that others could initiate additional litigation or additional regulatory action against the Company with respect to its out-of-network benefit payment and/or administration practices.
CMS Actions
CMS regularly audits the Company’s performance to determine its compliance with CMS’s regulations and its contracts with CMS and to assess the quality of services it provides to Medicare beneficiaries. CMS uses various payment mechanisms to allocate and adjust premium payments to the Company’s and other companies’ Medicare plans by considering the applicable health status of Medicare members as supported by information prepared, maintained and provided by health care providers. The Company collects claim and encounter data from providers and generally relies on providers to appropriately code their submissions to the Company and document their medical records, including the diagnosis data submitted to the Company with claims. CMS pays increased premiums to Medicare Advantage plans and Medicare PDP plans for members who have certain medical conditions identified with specific diagnosis codes. Federal regulators review and audit the providers’ medical records to determine whether those records support the related diagnosis codes that determine the members’ health status and the resulting risk-adjusted premium payments to the Company. In that regard, CMS has instituted risk adjustment data validation (“RADV”) audits of various Medicare Advantage plans, including certain of the Company’s plans, to validate coding practices and supporting medical record documentation maintained by health care providers and the resulting risk adjusted premium payments to the plans. CMS may require the Company to refund premium payments if the Company’s risk adjusted premiums are not properly supported by medical record data. The Office of the Inspector General of Health and Human Services (the “OIG”) also is auditing the Company’s risk adjustment-related data and that of other companies. The Company expects CMS and the OIG to continue these types of audits.
In 2012, CMS revised its audit methodology for RADV audits to determine refunds payable by Medicare Advantage plans for contract year 2011 and forward. Under the revised methodology, among other things, CMS will extrapolate the error rate identified in the audit sample of approximately 200 members to all risk adjusted premium payments made under the contract being audited. For contract years prior to 2011, CMS did not extrapolate sample error rates to the entire contract. As a result, the revised methodology may increase the Company’s exposure to premium refunds to CMS based on incomplete medical records
159
maintained by providers. Since 2013, CMS has selected certain of the Company’s Medicare Advantage contracts for various contract years for RADV audit, and the number of RADV audits continues to increase. The Company is currently unable to predict which of its Medicare Advantage contracts will be selected for future audit, the amounts of any retroactive refunds of, or prospective adjustments to, Medicare Advantage premium payments made to the Company, the effect of any such refunds or adjustments on the actuarial soundness of the Company’s Medicare Advantage bids, or whether any RADV audit findings would require the Company to change its method of estimating future premium revenue in future bid submissions to CMS or compromise premium assumptions made in the Company’s bids for prior contract years, the current contract year or future contract years. Any premium or fee refunds or adjustments resulting from regulatory audits, whether as a result of RADV, Public Exchange related or other audits by CMS, the OIG, the U.S. Department of Health and Human Services or otherwise, including audits of the Company’s minimum MLR rebates, methodology and/or reports, could be material and could adversely affect the Company’s operating results, financial condition and/or cash flows.
Medicare CIDs
The Company has received CIDs from the Civil Division of the DOJ in connection with a current investigation of the Company’s patient chart review processes in connection with risk adjustment data submissions under Parts C and D of the Medicare program. The Company has been cooperating with the government and providing documents and information in response to these CIDs.
Stockholder Matters
The Company and/or its current and/or former directors and/or executive officers are named as defendants in a number of lawsuits and a request for access to information initiated by holders or putative holders of CVS Health common stock.
Between February and August 2019, six class action complaints were filed by putative plaintiffs against the Company and certain current and former officers and directors: Anarkat v. CVS Health Corp., et al. (U.S. District Court for the District of Rhode Island); Labourers’ Pension Fund of Central and Eastern Canada v. CVS Health Corp., et al. (New York Supreme Court); City of Warren Police and Fire Retirement Sys.v. CVS Health Corp., et. al. (Rhode Island Superior Court); Cambria Co. Employees Retirement Sys. v. CVS Health Corp., et al. (New York Supreme Court); Freundlich v. CVS Health Corp., et al. (Rhode Island Superior Court); and Waterford Twp. Police & Fire Retirement Sys. v. CVS Health Corp., et al. (U.S. District Court for the District of Rhode Island). The plaintiffs in these cases assert a variety of causes of action under federal securities laws that are premised on allegations that the defendants made certain omissions and misrepresentations relating to the performance of the Company’s LTC business unit, which allegedly injured investors who acquired CVS Health securities between February 9, 2016 and February 20, 2019. The Freundlich case also alleges that defendants misrepresented anticipated synergies of the Aetna Acquisition. Plaintiffs in the Freundlich and the City of Warren cases have filed a consolidated complaint that combines their allegations. The Company is defending itself against these claims.
In January 2020, a derivative complaint was filed against the Company’s directors and current and former executive officers in the U.S. District Court for the District of Rhode Island by a stockholder. Lovoi v. Aguirre, et al. makes allegations similar to those contained the six stockholder class action complaints described above, including that the Company made false or misleading statements about its LTC business unit’s financial health. The Lovoi complaint alleges claims for breach of fiduciary duty against the Company’s directors and certain of its current and former executive officers and for violation of the federal securities laws. The Lovoi complaint seeks damages, restitution and equitable relief on behalf of the Company. The Company’s directors and current and former executive officers are defending themselves against these claims.
In November 2019, the Company received a demand to inspect its books and records under Delaware General Corporation Law Section 220 from purported stockholder Judith B. Cohen. The demand seeks various documents related to the Company’s LTC operations, its financial condition and its goodwill impairment charges, as well as more general information regarding share repurchases, director nominations and charitable donations. The Company has objected to this request.
Other Legal and Regulatory Proceedings.
The Company is also a party to other legal proceedings and is subject to government investigations, inquiries and audits and has received and is cooperating with the government in response to CIDs, subpoenas or similar process from various governmental agencies requesting information, arising, for the most part, in the ordinary course of its businesses. These other legal proceedings and government actions include claims of or relating to bad faith, medical or professional malpractice, claims processing, dispensing of medications, non-compliance with state and federal regulatory regimes, marketing misconduct, failure to timely or appropriately pay or administer claims and benefits, provider network structure (including the use of performance-
160
based networks and termination of provider contracts), rescission of insurance coverage, improper disclosure or use of personal information, anticompetitive practices, general contractual matters, product liability, intellectual property litigation and employment litigation. Some of these other legal proceedings are or are purported to be class actions or derivative claims. The Company is defending itself against the claims brought in these matters.
Awards to the Company and others of certain government contracts, particularly Medicaid contracts and other contracts with government customers in the Company’s Health Care Benefits segment, frequently are subject to protests by unsuccessful bidders. These protests may result in awards to the Company being reversed, delayed or modified. The loss or delay in implementation of any government contract could adversely affect the Company’s operating results. The Company will continue to defend contract awards it receives.
There also continues to be a heightened level of review and/or audit by regulatory authorities and legislators of, and increased litigation regarding, the Company’s and the rest of the health care and related benefits industry’s business and reporting practices, including premium rate increases, utilization management, development and application of medical policies, complaint, grievance and appeal processing, information privacy, provider network structure (including provider network adequacy, the use of performance-based networks and termination of provider contracts), provider directory accuracy, calculation of minimum medical loss ratios and/or payment of related rebates, delegated arrangements, rescission of insurance coverage, limited benefit health products, student health products, pharmacy benefit management practices (including manufacturers’ rebates, pricing, the use of narrow networks and the placement of drugs in formulary tiers), sales practices, customer service practices, vendor oversight and claim payment practices (including payments to out-of-network providers).
As a leading national health care company, the Company regularly is the subject of government actions of the types described above. These government actions may prevent or delay the Company from implementing planned premium rate increases and may result, and have resulted, in restrictions on the Company’s businesses, changes to or clarifications of the Company’s business practices, retroactive adjustments to premiums, refunds or other payments to members, beneficiaries, states or the federal government, withholding of premium payments to the Company by government agencies, assessments of damages, civil or criminal fines or penalties, or other sanctions, including the possible suspension or loss of licensure and/or suspension or exclusion from participation in government programs.
The Company can give no assurance that its businesses, financial condition, operating results and/or cash flows will not be materially adversely affected, or that the Company will not be required to materially change its business practices, based on: (i) future enactment of new health care or other laws or regulations; (ii) the interpretation or application of existing laws or regulations as they may relate to one or more of the Company’s businesses, one or more of the industries in which the Company competes and/or the health care industry generally; (iii) pending or future federal or state government investigations of one or more of the Company’s businesses, one or more of the industries in which the Company competes and/or the health care industry generally; (iv) pending or future government audits, investigations or enforcement actions against the Company; (v) adverse developments in any pending qui tam lawsuit against the Company, whether sealed or unsealed, or in any future qui tam lawsuit that may be filed against the Company; or (vi) adverse developments in pending or future legal proceedings against the Company or affecting one or more of the industries in which the Company competes and/or the health care industry generally.
17. | Segment Reporting |
The Company has three operating segments, Pharmacy Services, Retail/LTC and Health Care Benefits, as well as a Corporate/Other segment. The Company’s segments maintain separate financial information, and the CODM evaluates the segments’ operating results on a regular basis in deciding how to allocate resources among the segments and in assessing segment performance. The CODM evaluates the performance of the Company’s segments based on adjusted operating income. Effective for the first quarter of 2019, adjusted operating income is defined as operating income (GAAP measure) excluding the impact of amortization of intangible assets and other items, if any, that neither relate to the ordinary course of the Company’s business nor reflect the Company’s underlying business performance. Segment financial information has been retrospectively adjusted to conform with the current period presentation. See the reconciliation of consolidated operating income (GAAP measure) to adjusted operating income below for further context regarding the items excluded from operating income in determining adjusted operating income. The Company uses adjusted operating income as its principal measure of segment performance as it enhances the Company’s ability to compare past financial performance with current performance and analyze underlying business performance and trends. Non-GAAP financial measures the Company discloses, such as consolidated adjusted operating income, should not be considered a substitute for, or superior to, financial measures determined or calculated in accordance with GAAP.
161
Effective for the first quarter of 2019, the Company realigned the composition of its segments to correspond with changes to its operating model and reflect how its CODM reviews information and manages the business. See Note 1 ‘‘Significant Accounting Policies’’ for further discussion of this realignment. Segment financial information has been retrospectively adjusted to reflect these changes.
In 2018 and 2017, approximately 9.8 % and 12.3 %, respectively, of the Company’s consolidated revenues were from Aetna, a Pharmacy Services segment client. On November 28, 2018, the Company completed the Aetna Acquisition. Subsequent to the Aetna Acquisition, transactions with Aetna continue to be reported within the Pharmacy Services segment, but are eliminated in the Company’s consolidated financial statements.
In millions | Pharmacy Services (1) | Retail/ LTC | Health Care Benefits | Corporate/ Other | Intersegment Eliminations (2) | Consolidated Totals | |||||||||||||||||
2019: | |||||||||||||||||||||||
Revenues from customers | $ | $ | $ | $ | $ | ( | ) | $ | |||||||||||||||
Net investment income | |||||||||||||||||||||||
Total revenues | ( | ) | |||||||||||||||||||||
Adjusted operating income (loss) | ( | ) | ( | ) | |||||||||||||||||||
Depreciation and amortization | |||||||||||||||||||||||
Additions to property and equipment | |||||||||||||||||||||||
2018: | |||||||||||||||||||||||
Revenues from customers | ( | ) | |||||||||||||||||||||
Net investment income | |||||||||||||||||||||||
Total revenues | ( | ) | |||||||||||||||||||||
Adjusted operating income (loss) | ( | ) | ( | ) | |||||||||||||||||||
Depreciation and amortization | |||||||||||||||||||||||
Additions to property and equipment | |||||||||||||||||||||||
2017: | |||||||||||||||||||||||
Revenues from customers | ( | ) | |||||||||||||||||||||
Net investment income | |||||||||||||||||||||||
Total revenues | ( | ) | |||||||||||||||||||||
Adjusted operating income (loss) | ( | ) | ( | ) | |||||||||||||||||||
Depreciation and amortization | |||||||||||||||||||||||
Additions to property and equipment | |||||||||||||||||||||||
_____________________________________________
(1) | Total revenues of the Pharmacy Services segment include approximately $ |
(2) | Intersegment eliminations relate to intersegment revenue generating activities that occur between the Pharmacy Services segment, the Retail/LTC segment and/or the Health Care Benefits segment. |
162
The following is a reconciliation of consolidated operating income to adjusted operating income for the years ended December 31, 2019, 2018 and 2017:
In millions | 2019 | 2018 | 2017 | ||||||||
Operating income (GAAP measure) | $ | $ | $ | ||||||||
Amortization of intangible assets (1) | |||||||||||
Acquisition-related transaction and integration costs (2) | |||||||||||
Store rationalization charges (3) | |||||||||||
Loss on divestiture of subsidiary (4) | |||||||||||
Goodwill impairments (5) | |||||||||||
Impairment of long-lived assets (6) | |||||||||||
Interest income on financing for the Aetna Acquisition (7) | ( | ) | |||||||||
Adjusted operating income | $ | $ | $ | ||||||||
_____________________________________________
(1) | The Company’s acquisition activities have resulted in the recognition of intangible assets as required under the acquisition method of accounting which consist primarily of trademarks, customer contracts/relationships, covenants not to compete, technology, provider networks and value of business acquired. Definite-lived intangible assets are amortized over their estimated useful lives and are tested for impairment when events indicate that the carrying value may not be recoverable. The amortization of intangible assets is reflected in the Company’s statements of operations in operating expenses within each segment. Although intangible assets contribute to the Company’s revenue generation, the amortization of intangible assets does not directly relate to the underwriting of the Company’s insurance products, the services performed for the Company’s customers or the sale of the Company’s products or services. Additionally, intangible asset amortization expense typically fluctuates based on the size and timing of the Company’s acquisition activity. Accordingly, the Company believes excluding the amortization of intangible assets enhances the Company’s and investors’ ability to compare the Company’s past financial performance with its current performance and to analyze underlying business performance and trends. Intangible asset amortization excluded from the related non-GAAP financial measure represents the entire amount recorded within the Company’s GAAP financial statements, and the revenue generated by the associated intangible assets has not been excluded from the related non-GAAP financial measure. Intangible asset amortization is excluded from the related non-GAAP financial measure because the amortization, unlike the related revenue, is not affected by operations of any particular period unless an intangible asset becomes impaired or the estimated useful life of an intangible asset is revised. |
(2) | In 2019, 2018 and 2017, acquisition-related transaction and integration costs relate to the Aetna Acquisition. In 2018 and 2017, acquisition-related transaction and integration costs also relate to the acquisition of Omnicare. The acquisition-related transaction and integration costs are reflected in the Company’s consolidated statements of operations in operating expenses within the Corporate/Other segment and the Retail/LTC segment. |
(3) | In 2019, the store rationalization charges relate to the planned closure of 46 underperforming retail pharmacy stores during the second quarter of 2019 and the planned closure of 22 underperforming retail pharmacy stores during the first quarter of 2020. In 2019, the store rationalization charges primarily relate to operating lease right-of-use asset impairment charges and are reflected in the Company’s consolidated statements of operations in operating expenses within the Retail/LTC segment. In 2017, the store rationalization charges related to the Company’s enterprise streamlining initiative and are reflected in the Company’s consolidated statements of operations in operating expenses within the Retail/LTC segment. |
(4) | In 2019, the loss on divestiture of subsidiary represents the pre-tax loss on the sale of Onofre, which occurred on July 1, 2019. The loss on divestiture primarily relates to the elimination of the cumulative translation adjustment from accumulated other comprehensive income. In 2018, the loss on divestiture of subsidiary represents the pre-tax loss on the sale of the Company’s RxCrossroads subsidiary for $ |
(5) | In 2018, the goodwill impairments relate to the LTC reporting unit within the Retail/LTC segment. In 2017, the goodwill impairments relate to the RxCrossroads reporting unit within the Retail/LTC segment. |
(6) | In 2018, impairment of long-lived assets primarily relates to the impairment of property and equipment within the Retail/LTC segment and is reflected in operating expenses in the Company’s consolidated statements of operations. |
(7) | In 2018, the Company recorded interest income of $ |
163
Report of Independent Registered Public Accounting Firm
To the Shareholders and the Board of Directors of CVS Health Corporation
Opinion on Internal Control over Financial Reporting
We have audited CVS Health Corporation’s internal control over financial reporting as of December 31, 2019, based on criteria established in Internal Control-Integrated Framework issued by the Committee of Sponsoring Organizations of the Treadway Commission (2013 framework) (the COSO criteria). In our opinion, CVS Health Corporation (the Company) maintained, in all material respects, effective internal control over financial reporting as of December 31, 2019, based on the COSO criteria.
We also have audited, in accordance with the standards of the Public Company Accounting Oversight Board (United States) (PCAOB), the 2019 consolidated financial statements of the Company and our report dated February 18, 2020, expressed an unqualified opinion thereon.
Basis for Opinion
The Company’s management is responsible for maintaining effective internal control over financial reporting and for its assessment of the effectiveness of internal control over financial reporting included in the accompanying Management’s Report on Internal Control Over Financial Reporting. Our responsibility is to express an opinion on the Company’s internal control over financial reporting based on our audit. We are a public accounting firm registered with the PCAOB and are required to be independent with respect to the Company in accordance with the U.S. federal securities laws and the applicable rules and regulations of the Securities and Exchange Commission and the PCAOB.
We conducted our audit in accordance with the standards of the PCAOB. Those standards require that we plan and perform the audit to obtain reasonable assurance about whether effective internal control over financial reporting was maintained in all material respects.
Our audit included obtaining an understanding of internal control over financial reporting, assessing the risk that a material weakness exists, testing and evaluating the design and operating effectiveness of internal control based on the assessed risk, and performing such other procedures as we considered necessary in the circumstances. We believe that our audit provides a reasonable basis for our opinion.
Definition and Limitations of Internal Control over Financial Reporting
A company’s internal control over financial reporting is a process designed to provide reasonable assurance regarding the reliability of financial reporting and the preparation of financial statements for external purposes in accordance with generally accepted accounting principles. A company’s internal control over financial reporting includes those policies and procedures that (1) pertain to the maintenance of records that, in reasonable detail, accurately and fairly reflect the transactions and dispositions of the assets of the company; (2) provide reasonable assurance that transactions are recorded as necessary to permit preparation of financial statements in accordance with generally accepted accounting principles, and that receipts and expenditures of the company are being made only in accordance with authorizations of management and directors of the company; and (3) provide reasonable assurance regarding prevention or timely detection of unauthorized acquisition, use, or disposition of the company’s assets that could have a material effect on the financial statements.
Because of its inherent limitations, internal control over financial reporting may not prevent or detect misstatements. Also, projections of any evaluation of effectiveness to future periods are subject to the risk that controls may become inadequate because of changes in conditions, or that the degree of compliance with the policies or procedures may deteriorate.
/s/ Ernst & Young LLP
Boston, Massachusetts
February 18, 2020
164
Report of Independent Registered Public Accounting Firm
To the Shareholders and the Board of Directors of CVS Health Corporation
Opinion on the Financial Statements
We have audited the accompanying consolidated balance sheets of CVS Health Corporation (the Company) as of December 31, 2019 and 2018, the related consolidated statements of operations, comprehensive income (loss), shareholders’ equity and cash flows for each of the three years in the period ended December 31, 2019, and the related notes (collectively referred to as the “consolidated financial statements”). In our opinion, the consolidated financial statements present fairly, in all material respects, the financial position of the Company at December 31, 2019 and 2018, and the results of its operations and its cash flows for each of the three years in the period ended December 31, 2019, in conformity with U.S. generally accepted accounting principles.
We also have audited, in accordance with the standards of the Public Company Accounting Oversight Board (United States) (PCAOB), the Company’s internal control over financial reporting as of December 31, 2019, based on criteria established in Internal Control-Integrated Framework issued by the Committee of Sponsoring Organizations of the Treadway Commission (2013 framework) and our report dated February 18, 2020 expressed an unqualified opinion thereon.
Adoption of ASU 2016-02
As discussed in Note 1 to the consolidated financial statements, the Company changed its method of accounting for leases in 2019 due to the adoption of ASU 2016-02, Leases.
Basis for Opinion
These financial statements are the responsibility of the Company’s management. Our responsibility is to express an opinion on the Company’s financial statements based on our audits. We are a public accounting firm registered with the PCAOB and are required to be independent with respect to the Company in accordance with the U.S. federal securities laws and the applicable rules and regulations of the Securities and Exchange Commission and the PCAOB.
We conducted our audits in accordance with the standards of the PCAOB. Those standards require that we plan and perform the audit to obtain reasonable assurance about whether the financial statements are free of material misstatement, whether due to error or fraud. Our audits included performing procedures to assess the risks of material misstatement of the financial statements, whether due to error or fraud, and performing procedures that respond to those risks. Such procedures included examining, on a test basis, evidence regarding the amounts and disclosures in the financial statements. Our audits also included evaluating the accounting principles used and significant estimates made by management, as well as evaluating the overall presentation of the financial statements. We believe that our audits provide a reasonable basis for our opinion.
Critical Audit Matters
The critical audit matters communicated below are matters arising from the current period audit of the financial statements that were communicated or required to be communicated to the audit committee and that: (1) relate to accounts or disclosures that are material to the financial statements and (2) involved our especially challenging, subjective, or complex judgments. The communication of critical audit matters does not alter in any way our opinion on the consolidated financial statements, taken as a whole, and we are not, by communicating the critical audit matters below, providing separate opinions on the critical audit matters or on the accounts or disclosures to which they relate.
165
Impairment of goodwill | ||
Description of the Matter | At December 31, 2019, the Company’s goodwill allocated to the Long-term Care (“LTC”) and Commercial Business reporting units was $0.4 billion and $26.8 billion, respectively. As discussed in Note 1 to the consolidated financial statements, goodwill is not amortized, but rather is subject to an annual impairment review, or more frequent reviews, if events and circumstances indicate an impairment exists. Auditing management's annual goodwill impairment test related to the LTC and Commercial Business reporting units was complex and highly judgmental due to the significant estimation required to determine the fair value of the reporting units. In particular, the fair value estimate was sensitive to significant assumptions, such as changes in the discount rate, projected revenue and projected operating income that are forward-looking and affected by future economic and market conditions. | |
How We Addressed the Matter in Our Audit | We obtained an understanding, evaluated the design and tested the operating effectiveness of controls over the Company’s annual goodwill impairment review process, including controls over management’s review of the significant assumptions described above. To test the estimated fair value of the LTC and Commercial Business reporting units, we performed audit procedures that included, among others, assessing methodologies and testing the significant assumptions discussed above and the underlying data used by the Company in its analysis. We compared the significant assumptions to the reporting units’ historical results and third-party industry data. We performed sensitivity analyses of significant assumptions to evaluate the changes in the fair value of the reporting units that would result from changes in the key assumptions. We involved valuation specialists to assist in our assessment of the methodology and significant assumptions (such as discount rates), used by the Company. In addition, we tested management’s reconciliation of the fair value of all reporting units to the market capitalization of the Company. | |
Valuation of health care costs payable | ||
Description of the Matter | At December 31, 2019, the incurred but not reported (“IBNR”) liabilities represented $5.0 billion of $6.9 billion of health care costs payable. As discussed in Note 1 to the financial statements, the Company’s liability for health care costs payable includes estimated payments for (1) services rendered to members but not yet reported and (2) claims that have been reported but not yet paid, each as of the financial statement date (collectively, “IBNR”). The estimated IBNR liability is developed utilizing actuarial principles and assumptions that include historical and projected claim submission and processing patterns, historical and assumed medical cost trends, historical utilization of medical services, claim inventory levels, changes in membership and product mix, seasonality and other relevant factors to record the actuarial best estimate of health care costs payable. There is significant uncertainty inherent in determining management’s actuarial best estimate of health care costs payable. In particular, the estimate is sensitive to the assumed completion factors and the assumed health care cost trend rates. Auditing management’s actuarial best estimate of IBNR reserves for health care costs payable for its products and services involved a high degree of subjectivity in evaluating management’s assumptions used in the valuation process. | |
How We Addressed the Matter in Our Audit | We obtained an understanding, evaluated the design and tested the operating effectiveness of controls over the process for estimating IBNR reserves. This included, among others, controls over the completeness and accuracy of data used in the actuarial projections, the transfer of data between underlying source systems, and the review and approval processes that management has in place for the actuarial principles and assumptions used in estimating the health care costs payable. To test IBNR reserves, our audit procedures included, among others, testing the completeness and accuracy of the underlying claim and membership data used in the calculation of IBNR reserves. We involved actuarial specialists to assist with our audit procedures, which included, among others, evaluating the methodologies applied by the Company in determining the actuarially determined liability, evaluating management’s actuarial principles and assumptions used in their analysis based on historical claim experience, and independently calculating a range of reserve estimates for comparison to management’s actuarial best estimate of the liability for health care costs payable. Additionally, we performed a review of the prior period liabilities for incurred but not paid claims to subsequent claims development. | |
166
/s/ Ernst & Young LLP
We have served as the Company’s auditor since 2007.
Boston, Massachusetts
February 18, 2020
167
Quarterly Financial Information (Unaudited)
In millions, except per share amounts | First Quarter | Second Quarter | Third Quarter | Fourth Quarter | Year | ||||||||||||||
2019: | |||||||||||||||||||
Total revenues | $ | $ | $ | $ | $ | ||||||||||||||
Operating income | |||||||||||||||||||
Income from continuing operations | |||||||||||||||||||
Net income attributable to CVS Health | |||||||||||||||||||
Per common share data: | |||||||||||||||||||
Basic earnings per common share: | |||||||||||||||||||
Income from continuing operations attributable to CVS Health | $ | $ | $ | $ | $ | ||||||||||||||
Income from discontinued operations attributable to CVS Health | $ | $ | $ | $ | $ | ||||||||||||||
Net income attributable to CVS Health | $ | $ | $ | $ | $ | ||||||||||||||
Diluted earnings per common share: | |||||||||||||||||||
Income from continuing operations attributable to CVS Health | $ | $ | $ | $ | $ | ||||||||||||||
Income from discontinued operations attributable to CVS Health | $ | $ | $ | $ | $ | ||||||||||||||
Net income attributable to CVS Health | $ | $ | $ | $ | $ | ||||||||||||||
Dividends per common share | $ | $ | $ | $ | $ | ||||||||||||||
168
In millions, except per share amounts | First Quarter | Second Quarter | Third Quarter | Fourth Quarter | Year | ||||||||||||||
2018: | |||||||||||||||||||
Total revenues | $ | $ | $ | $ | $ | ||||||||||||||
Operating income (loss) | ( | ) | |||||||||||||||||
Income (loss) from continuing operations | ( | ) | ( | ) | ( | ) | |||||||||||||
Net income (loss) attributable to CVS Health | ( | ) | ( | ) | ( | ) | |||||||||||||
Per common share data: | |||||||||||||||||||
Basic earnings (loss) per common share: | |||||||||||||||||||
Income (loss) from continuing operations attributable to CVS Health | $ | $ | ( | ) | $ | $ | ( | ) | $ | ( | ) | ||||||||
Income (loss) from discontinued operations attributable to CVS Health | $ | $ | $ | $ | $ | ||||||||||||||
Net income (loss) attributable to CVS Health | $ | $ | ( | ) | $ | $ | ( | ) | $ | ( | ) | ||||||||
Diluted earnings (loss) per common share: | |||||||||||||||||||
Income (loss) from continuing operations attributable to CVS Health | $ | $ | ( | ) | $ | $ | ( | ) | $ | ( | ) | ||||||||
Income (loss) from discontinued operations attributable to CVS Health | $ | $ | $ | $ | $ | ||||||||||||||
Net income (loss) attributable to CVS Health | $ | $ | ( | ) | $ | $ | ( | ) | $ | ( | ) | ||||||||
Dividends per common share | $ | $ | $ | $ | $ | ||||||||||||||
169
Item 9. Changes in and Disagreements With Accountants on Accounting and Financial Disclosure.
None.
Item 9A. Controls and Procedures.
Evaluation of disclosure controls and procedures
The Company’s Chief Executive Officer and Chief Financial Officer, after evaluating the effectiveness of the design and operation of the Company’s disclosure controls and procedures (as defined in Rules 13a-15 (f) and 15d-15(f) under the Securities Exchange Act of 1934) as of December 31, 2019, have concluded that as of such date the Company’s disclosure controls and procedures were adequate and effective at a reasonable assurance level and designed to ensure that material information relating to the Company and its consolidated subsidiaries would be made known to such officers on a timely basis.
Management’s report on internal control over financial reporting
Management is responsible for establishing and maintaining adequate internal control over financial reporting. The Company’s internal control over financial reporting includes those policies and procedures that (1) pertain to the maintenance of records that, in reasonable detail, accurately and fairly reflect the transactions and dispositions of the assets of the Company; (2) provide reasonable assurance that transactions are recorded as necessary to permit preparation of the Company’s consolidated financial statements in accordance with generally accepted accounting principles, and that receipts and expenditures of the Company are being made only in accordance with authorizations of management and directors of the Company; and (3) provide reasonable assurance regarding prevention or timely detection of unauthorized acquisition, use, or disposition of the Company’s assets that could have a material effect on the Company’s consolidated financial statements. In order to ensure the Company’s internal control over financial reporting is effective, management regularly assesses such control and did so most recently for its financial reporting as of December 31, 2019.
Management conducted an assessment of the effectiveness of the Company’s internal control over financial reporting based on the criteria established in Internal Control-Integrated Framework issued by the Committee of Sponsoring Organizations of the Treadway Commission (2013 Framework). This evaluation included review of the documentation, evaluation of the design effectiveness and testing of the operating effectiveness of controls. The Company’s system of internal control over financial reporting is enhanced by periodic reviews by the Company’s internal auditors, written policies and procedures and a written Code of Conduct adopted by CVS Health’s Board of Directors, applicable to all employees of the Company. In addition, the Company has an internal Disclosure Committee, comprised of management from each functional area within the Company, which performs a separate review of disclosure controls and procedures. There are inherent limitations in the effectiveness of any system of internal control over financial reporting.
Based on management’s assessment, management concluded that the Company’s internal control over financial reporting is effective and provides reasonable assurance that assets are safeguarded and that the financial records are reliable for preparing financial statements as of December 31, 2019.
Ernst & Young LLP, the Company’s independent registered public accounting firm, is appointed by CVS Health’s Board of Directors and ratified by CVS Health’s stockholders. They were engaged to render an opinion regarding the fair presentation of the Company’s consolidated financial statements as well as conducting an audit of internal control over financial reporting. Their reports included in Item 8 of this Form 10-K are based upon audits conducted in accordance with the standards of the Public Company Accounting Oversight Board (United States).
Changes in internal control over financial reporting
On November 28, 2018, the Company completed its acquisition of Aetna. During the fourth quarter ended December 31, 2019, the Company completed the process of integrating the internal control over financial reporting of Aetna with the rest of the Company.
Other than the foregoing, there has been no change in the Company’s internal control over financial reporting identified in connection with the evaluation required by paragraph (d) of Rule 13a-15 or Rule 15d-15 that occurred during the fourth quarter ended December 31, 2019 that has materially affected, or is reasonably likely to materially affect, the Company’s internal control over financial reporting.
170
Item 9B. Other Information.
No events have occurred during the fourth quarter ended December 31, 2019 that would require disclosure under this item.
PART III
Item 10. Directors, Executive Officers and Corporate Governance.
Information concerning the Executive Officers of CVS Health Corporation is included in Part I of this 10-K pursuant to General Instruction G to Form 10-K.
The sections of the Proxy Statement under the captions “Committees of the Board as of the Annual Meeting,” “Code of Conduct,” “Audit Committee Report,” and “Biographies of our Incumbent Board Nominees” are incorporated herein by reference.
Item 11. Executive Compensation.
The sections of the Proxy Statement under the captions “Non-Employee Director Compensation” and “Executive Compensation and Related Matters,” including “Letter from the Management Planning and Development Committee,” “Compensation Committee Report,” “Compensation Discussion and Analysis” and “Compensation of Named Executive Officers” are incorporated herein by reference.
Item 12. Security Ownership of Certain Beneficial Owners and Management and Related Stockholder Matters.
The sections of the Proxy Statement under the captions “Share Ownership of Directors and Certain Executive Officers” and “Share Ownership of Principal Stockholders” are incorporated herein by reference. Those sections contain information concerning security ownership of certain beneficial owners and management and related stockholder matters.
The following table summarizes information about the registrants common stock that may be issued upon the exercise of options, warrants and rights under all of the Company’s equity compensation plans as of December 31, 2019:
Number of securities to be issued upon exercise of outstanding options, warrants and rights (1) (2) (a) | Weighted average exercise price of outstanding options, warrants and rights (b) | Number of securities remaining available for future issuance under equity compensation plans (excluding securities reflected in first column) (1) (c) | |||||||
Equity compensation plans approved by stockholders (3) | 32,237 | $ | 73.32 | 17,152 | |||||
Equity compensation plans not approved by stockholders (4) (5) | 4,518 | 43.46 | 26,849 | ||||||
Total | 36,755 | $ | 71.83 | 44,001 | |||||
_____________________________________________
(1) | Shares in thousands. |
(2) | Consists of: (i) 21,184 shares of common stock underlying outstanding options, (ii) 1,110 shares of common stock issuable upon the exercise of outstanding stock appreciation rights (“SARs”) and (iii) 14,461 shares of common stock issuable on the vesting of outstanding restricted stock units, deferred stock units and performance stock units, assuming target level performance in the case of performance stock units. The number of shares included with respect to outstanding SARs is the number of shares of CVS Health common stock that would have been issued had the SARs been exercised based on the closing price per share of CVS Health common stock on December 31, 2019, as reported on the NYSE, which was $74.29. |
(3) | Consists of the CVS Health 2017 Incentive Compensation Plan. |
(4) | Consists of the Amended Aetna Inc. 2010 Stock Incentive Plan (the “Aetna Stock Plan”). |
(5) | Amount in column (c) consists of the maximum number of shares of CVS Health common stock available for future issuance under the Aetna Stock Plan as of December 31, 2019. |
The Aetna Stock Plan was last approved by Aetna’s shareholders at Aetna’s 2017 Annual Meeting on May 19, 2017. The Company elected to continue to grant awards under the Aetna Stock Plan to employees of Aetna and its subsidiaries following the completion of the Aetna Acquisition. The Aetna Stock Plan is designed to promote the Company’s interests and those of its stockholders and to further align the interests of stockholders and employees by tying awards to total return to stockholders, enabling plan participants to acquire additional equity interests in the Company and providing compensation opportunities
171
dependent upon the Company’s performance. The Aetna Stock Plan has not been submitted to the Company’s stockholders and will expire on May 21, 2020.
Under the Aetna Stock Plan, eligible participants can be granted stock options to purchase shares of CVS Health common stock, SARs, time-vesting and/or performance-vesting incentive stock or incentive units and other stock based awards. As of December 31, 2019, the maximum number of shares of CVS Health common stock that may be issued under the awards outstanding under the Aetna Stock Plan was 4.5 million shares, subject to adjustment for corporate transactions and 26.8 million shares remained available for future awards. If an award under the Aetna Stock Plan is paid solely in cash, no shares are deducted from the number of shares available for issuance under the Aetna Stock Plan.
Item 13. Certain Relationships and Related Transactions, and Director Independence.
The sections of the Proxy Statement under the captions “Independence Determinations for Directors” and “Related Person Transaction Policy” are incorporated herein by reference.
Item 14. Principal Accountant Fees and Services.
The section of the Proxy Statement under the caption “Item 2: Ratification of Appointment of Independent Registered Public Accounting Firm for 2020” is incorporated herein by reference.
172
PART IV
Item 15. Exhibits, Financial Statement Schedules.
The following documents are filed as part of this 10-K:
1. | Financial Statements. See “Index to Consolidated Financial Statements” in Item 8 of this 10-K. |
2. | Financial Statement Schedules. All financial statement schedules are omitted because they are not applicable, not required under the instructions, or the information is included in the consolidated financial statements or related notes. |
3. | Exhibits. The exhibits listed in the “Index to Exhibits” in this Item 15 are filed or incorporated by reference as part of this 10-K. Exhibits marked with an asterisk (*) are management contracts or compensatory plans or arrangements. Exhibits other than those listed are omitted because they are not required to be listed or are not applicable. Pursuant to Item 601(b)(4)(iii) of Regulation S-K, the Registrant hereby agrees to furnish to the Securities and Exchange Commission a copy of any omitted instrument that is not required to be listed. |
INDEX TO EXHIBITS
Exhibit | Description | |
2 | Plan of acquisition, reorganization, arrangement, liquidation or succession | |
2.1 | ||
2.2 | ||
2.3 | ||
3 | Articles of Incorporation and Bylaws | |
3.1 | ||
3.2 | ||
4 | Instruments defining the rights of security holders, including indentures | |
4.1 | ||
4.2 | ||
4.3 | ||
4.4 | ||
4.5 | ||
4.6 | ||
4.7 | ||
4.8 | ||
4.9 | ||
173
4.10 | ||
4.11 | ||
4.12 | ||
4.13 | ||
4.14 | ||
4.15 | ||
10 | Material Contracts | |
10.1 | ||
10.2 | ||
10.3 | ||
10.4 | ||
10.5 | ||
10.6 | ||
10.7 | ||
10.8 | ||
10.9* | ||
10.10* | ||
10.11* | ||
10.12* | ||
10.13* | ||
10.14* | ||
10.15* | ||
10.16* | ||
174
10.17* | ||
10.18* | ||
10.19* | ||
10.20* | ||
10.21* | ||
10.22* | ||
10.23* | ||
10.24* | ||
10.25* | ||
10.26* | ||
10.27* | ||
10.28* | ||
10.29* | ||
10.30* | ||
10.31* | ||
10.32* | ||
10.33* | ||
10.34* | ||
10.35* | ||
10.36* | ||
10.37* | ||
10.38* | ||
175
10.39* | ||
10.40* | ||
10.41* | ||
10.42* | ||
10.43* | ||
10.44* | ||
10.45* | ||
10.46* | ||
10.47* | ||
10.48* | ||
10.49* | ||
10.50* | ||
10.51* | ||
10.52* | ||
10.53* | ||
10.54* | ||
10.55* | ||
10.56* | ||
10.57* | Descriptions of certain arrangements not embodied in formal documents as described under the heading “Non-Employee Director Compensation” are incorporated herein by reference to the Proxy Statement (when filed). | |
21 | Subsidiaries of the registrant | |
21.1 | ||
23 | Consents of experts and counsel | |
23.1 | ||
31 | Rule 13a-14(a)/15d-14(a) Certifications | |
31.1 | ||
176
31.2 | ||
32 | Section 1350 Certifications | |
32.1 | ||
32.2 | ||
101 | Interactive Data File | |
101 | The following materials from the CVS Health Corporation Annual Report on Form 10-K for the fiscal year ended December 31, 2019 formatted in Inline XBRL: (i) the Consolidated Statements of Operations, (ii) the Consolidated Statements of Comprehensive Income (Loss), (iii) the Consolidated Balance Sheets, (iv) the Consolidated Statements of Cash Flows, (v) the Consolidated Statements of Shareholders’ Equity and (vi) the related Notes to Consolidated Financial Statements. The instance document does not appear in the Interactive Data File because its XBRL tags are embedded within the Inline XBRL document. | |
104 | ||
104 | Cover Page Interactive Data File - The cover page from the Company's Annual Report on Form 10-K for the year ended December 31, 2019, formatted in Inline XBRL (included as Exhibit 101). | |
Item 16. Form 10-K Summary.
None.
177
SIGNATURES
Pursuant to the requirements of Section 13 or 15(d) of the Securities Exchange Act of 1934, the registrant has duly caused this report to be signed on its behalf by the undersigned, thereunto duly authorized.
Pursuant to the requirements of the Securities Exchange Act of 1934, this report has been signed below by the following persons on behalf of the registrant and in the capacities and on the dates indicated.
CVS HEALTH CORPORATION | |||
Date: | February 18, 2020 | By: | /s/ EVA C. BORATTO |
Eva C. Boratto | |||
Executive Vice President and Chief Financial Officer | |||
Signature | Title(s) | Date | ||
/s/ FERNANDO AGUIRRE | Director | February 18, 2020 | ||
Fernando Aguirre | ||||
/s/ RICHARD M. BRACKEN | Director | February 18, 2020 | ||
Richard M. Bracken | ||||
/s/ C. DAVID BROWN II | Director | February 18, 2020 | ||
C. David Brown II | ||||
/s/ EVA C. BORATTO | Executive Vice President and Chief Financial | February 18, 2020 | ||
Eva C. Boratto | Officer (Principal Financial Officer) | |||
/s/ JAMES D. CLARK | Senior Vice President - Controller and Chief | February 18, 2020 | ||
James D. Clark | Accounting Officer (Principal Accounting Officer) | |||
/s/ ALECIA A. DECOUDREAUX | Director | February 18, 2020 | ||
Alecia A. DeCoudreaux | ||||
/s/ NANCY-ANN M. DEPARLE | Director | February 18, 2020 | ||
Nancy-Ann M. DeParle | ||||
/s/ DAVID W. DORMAN | Chair of the Board and Director | February 18, 2020 | ||
David W. Dorman | ||||
/s/ ROGER N. FARAH | Director | February 18, 2020 | ||
Roger N. Farah | ||||
/s/ ANNE M. FINUCANE | Director | February 18, 2020 | ||
Anne M. Finucane | ||||
/s/ EDWARD J. LUDWIG | Director | February 18, 2020 | ||
Edward J. Ludwig | ||||
/s/ LARRY J. MERLO | President and Chief Executive Officer | February 18, 2020 | ||
Larry J. Merlo | (Principal Executive Officer) and Director | |||
/s/ JEAN-PIERRE MILLON | Director | February 18, 2020 | ||
Jean-Pierre Millon | ||||
/s/ MARY L. SCHAPIRO | Director | February 18, 2020 | ||
Mary L. Schapiro | ||||
/s/ RICHARD J. SWIFT | Director | February 18, 2020 | ||
Richard J. Swift | ||||
/s/ WILLIAM C. WELDON | Director | February 18, 2020 | ||
William C. Weldon | ||||
/s/ TONY L. WHITE | Director | February 18, 2020 | ||
Tony L. White | ||||