MFS SERIES TRUST IV N-CSR
UNITED STATES
SECURITIES AND EXCHANGE COMMISSION
Washington, D.C. 20549
FORM N-CSR
CERTIFIED SHAREHOLDER REPORT OF
REGISTERED MANAGEMENT INVESTMENT COMPANIES
Investment Company Act file
number 811-2594
MFS SERIES TRUST IV
(Exact name of registrant as specified in charter)
111 Huntington Avenue, Boston, Massachusetts 02199
(Address of principal
executive offices) (Zip code)
Christopher R. Bohane
Massachusetts Financial Services Company
111 Huntington Avenue
Boston, Massachusetts 02199
(Name and address of agents for service)
Registrant’s telephone number, including area code: (617) 954-5000
Date of fiscal year end: August 31
Date of reporting period: August 31, 2021
| ITEM 1. |
REPORTS TO STOCKHOLDERS. |
Item 1(a):
Annual Report
August 31, 2021
MFS® Blended Research® Emerging Markets
Equity Fund
MFS® Blended Research® Emerging Markets
Equity
Fund
|
1
|
|
2
|
|
4
|
|
7
|
|
10
|
|
12
|
|
19
|
|
21
|
|
22
|
|
23
|
|
29
|
|
40
|
|
42
|
|
47
|
|
51
|
|
52
|
|
52
|
|
52
|
|
52
|
|
52
|
|
53
|
The
report is prepared for the general information of shareholders. It is authorized for distribution to prospective investors only when preceded or accompanied by a current prospectus.
NOT FDIC INSURED • MAY LOSE VALUE
• NO BANK GUARANTEE
LETTER FROM THE CEO
Dear Shareholders:
After experiencing dramatic swings in the early days of the
coronavirus pandemic, global equity markets have performed strongly over the past year. Though the speedy development of vaccines brightened the economic and market outlook, uncertainty remains as new variants of the virus appear, and questions
persist over how fast vaccines can be made widely available in the developing world.
After having taken aggressive steps to
cushion the economic and market fallout related to the virus, some global central banks have begun to recalibrate monetary policy. For example, the U.S. Federal Reserve has signaled it will likely taper its bond buying program before the end of
2021, which has helped push up Treasury yields, and steepened the yield curve. Having passed a $1.9 trillion stimulus package in March, the U.S. Congress could approve additional stimulus later this year, some of it focused on infrastructure.
Production and transportation bottlenecks and labor shortages stemming from the pandemic have fueled a rise in inflation, though policymakers and investors think most of the price hikes will prove transitory.
Since midyear, the spread of the Delta variant of the
coronavirus has slowed economic growth while markets have focused on a regulatory crackdown in China, which, when coupled with stress in that country's property development sector, has contributed to a slowdown there. Tightening global energy and
raw materials supplies are a further concern for investors.
The policy measures put in place to counteract the pandemic's
effects have helped build a supportive environment and are encouraging economic recovery; however, if markets disconnect from fundamentals, they can sow the seeds of instability. As such, recent dramatic increases in speculative trading in
cryptocurrencies, special purpose acquisition companies (SPACs), and the like bear watching.
In the aftermath of the crisis, we could see societal changes
as households, businesses, and governments adjust to a new reality, and any such alterations could affect the investment landscape. For investors, events such as the COVID-19 outbreak demonstrate the importance of having a deep understanding of
company fundamentals, and we have built our global research platform to do just that.
At MFS®, we put our clients’ assets to work responsibly by carefully navigating the increasing complexity of global markets and economies. Guided by our
long-term philosophy and adhering to our commitment to sustainable investing, we tune out the noise and aim to uncover what we believe are the best, most durable investment opportunities in the market. Our unique global investment platform combines
collective expertise, long-term discipline, and thoughtful risk management to create sustainable value for investors.
Respectfully,
Michael W.
Roberge
Chief Executive Officer
MFS Investment Management
October 15, 2021
The opinions expressed in this letter are subject to change and
may not be relied upon for investment advice. No forecasts can be guaranteed.
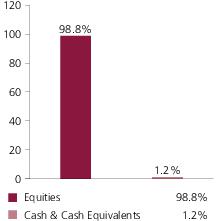
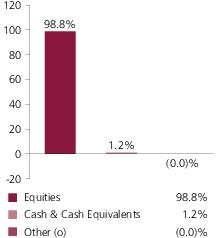
Portfolio structure
Top ten
holdings
| Taiwan
Semiconductor Manufacturing Co. Ltd. |
7.5%
|
| Samsung
Electronics Co. Ltd. |
4.9%
|
| Tencent
Holdings Ltd. |
4.7%
|
| Alibaba
Group Holding Ltd., ADR |
3.0%
|
| Tata
Consultancy Services Ltd. |
1.7%
|
| China
Construction Bank Corp. |
1.7%
|
| Sberbank
of Russia PJSC, ADR |
1.6%
|
| Infosys
Ltd. |
1.6%
|
| Chailease
Holding Co. |
1.6%
|
| Yum
China Holdings, Inc. |
1.5%
|
GICS equity sectors (g)
| Information
Technology |
21.9%
|
| Financials
|
18.7%
|
| Consumer
Discretionary |
15.0%
|
| Communication
Services |
11.3%
|
| Materials
|
8.0%
|
| Consumer
Staples |
6.4%
|
| Energy
|
5.1%
|
| Health
Care |
4.5%
|
| Industrials
|
4.1%
|
| Utilities
|
2.7%
|
| Real
Estate |
1.1%
|
Issuer country weightings (x)
| China
|
33.0%
|
| South
Korea |
14.7%
|
| Taiwan
|
14.4%
|
| India
|
10.6%
|
| Brazil
|
5.5%
|
| Russia
|
4.5%
|
| South
Africa |
3.5%
|
| Mexico
|
2.6%
|
| Thailand
|
2.1%
|
| Other
Countries |
9.1%
|
Currency exposure weightings
(y)
| Hong
Kong Dollar |
27.9%
|
| South
Korean Won |
14.7%
|
| Taiwan
Dollar |
14.4%
|
| Indian
Rupee |
10.4%
|
| Brazilian
Real |
5.5%
|
| Russian
Ruble |
4.5%
|
| Chinese
Renminbi |
3.9%
|
| South
African Rand |
3.5%
|
| United
States Dollar |
3.2%
|
| Other
Currencies |
12.0%
|
Portfolio Composition -
continued
| (g)
|
The
Global Industry Classification Standard (GICS®) was developed by and/or is the exclusive property of MSCI, Inc. and S&P Global Market
Intelligence Inc. (“S&P Global Market Intelligence”). GICS is a service mark of MSCI and S&P Global Market Intelligence and has been licensed for use by MFS. MFS has applied its own internal sector/industry classification
methodology for equity securities and non-equity securities that are unclassified by GICS. |
| (x)
|
Represents
the portfolio’s exposure to issuer countries as a percentage of a portfolio’s net assets. For purposes of this presentation, United States (included in Other Countries) includes Cash & Cash Equivalents. |
| (y)
|
Represents
the portfolio’s exposure to a particular currency as a percentage of a portfolio's net assets. For purposes of this presentation, United States Dollar includes Cash & Cash Equivalents. |
Cash & Cash Equivalents includes any cash, investments in
money market funds, short-term securities, and other assets less liabilities. Please see the Statement of Assets and Liabilities for additional information related to the fund’s cash position and other assets and liabilities.
Percentages are based on net assets as of August 31,
2021.
The portfolio is actively managed and current
holdings may be different.
Management Review
Summary of Results
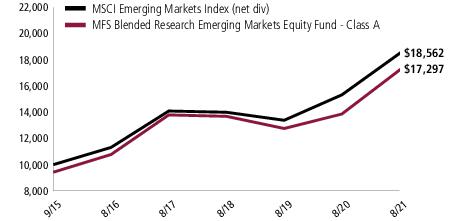
For the twelve months ended August 31, 2021, Class A shares of
the MFS Blended Research Emerging Markets Equity Fund (fund) provided a total return of 24.78%, at net asset value. This compares with a return of 21.12% for the fund’s benchmark, the MSCI Emerging Markets Index (net div).
Market Environment
The global economy continued to recover from the most unusual
recession in memory as financial markets benefited from massive fiscal and monetary intervention aimed at offsetting the economic effects of the coronavirus pandemic. In developed markets, COVID-19 vaccine distribution broadened after getting off to
a slower-than-hoped-for start in some locales, although concerns remained that too few people will be inoculated for herd immunity to be achieved, which could result in the emergence of additional variants. On balance, emerging markets experienced
slower rollouts than developed markets amid ongoing vaccine supply constraints.
Around the world, central banks responded quickly and massively
to the crisis with programs to improve liquidity and support markets. These undertakings proved largely successful in helping to restore market function, ease volatility and stimulate a prolonged rebound. In the first half of the period, the US
Federal Reserve adopted a new, flexible average-inflation-targeting framework, which is expected to result in the federal funds rate remaining at low levels longer than under its previous model, although the Fed has indicated it may scale back the
pace of asset purchases before the end of this year. Due to relatively manageable external liabilities and balances of payments in many countries and persistently low inflation, even emerging market countries were able to implement countercyclical
policies — a departure from the usual market-dictated response to risk-off crises.
Late in the period, markets grappled with the threat of
resurgent inflation resulting from pandemic-induced production bottlenecks, monumental levels of economic stimulus and the unleashing of post-lockdown pent-up demand. Meanwhile, raw materials prices rebounded strongly on account of the surprising
resilience of the global manufacturing sector during the pandemic. Global sovereign bond yields initially rose in response to these factors before yields moderated in the second half of the period as the spread of the Delta variant of the
coronavirus dented economic activity. The vaccine breakthroughs announced in November 2020 saw market leadership shift from a handful of mega-cap technology companies to a broader array of small-cap and value stocks, although growth stocks have
performed strongly in recent months. Signs of excess investor enthusiasm were seen in pockets of the market, such as the “meme stocks” popular with users of online message boards and heavy retail participation in the market for
short-dated equity options.
Contributors to
Performance
Stock selection within both the information
technology and industrials sectors was a primary contributor to the fund's performance relative to the MSCI Emerging Markets Index. Within the information technology sector, overweight positions in technology consulting firm Infosys (India) and
semiconductor foundry business United Microelectronics (Taiwan) aided relative results. The fund's holdings of semiconductor
Management Review -
continued
products manufacturer Silicon Motion Technology(b) (Taiwan) and commercial
electronic paper technology company E Ink Holdings(b) (Taiwan) also strengthened relative performance. The stock price of E Ink Holdings rose as the company reported higher-than-expected sales due to its shipment initiation of color printing
e-paper. Within the industrials sector, the fund’s overweight positions in marine shipping services provider Evergreen Marine (Taiwan) and Cosco Shipping (Taiwan) also boosted relative returns.
Elsewhere, the fund’s underweight position in online and
mobile commerce company Alibaba Group Holding (China) boosted relative performance. The stock price of Alibaba Group Holding declined as the company reported lower-than-expected adjusted earnings due to higher investments in new businesses, such as
its Taobao Deals and local services. The fund's overweight holdings of financing services provider Chailease Holdings (China) and banking services firm ABSA Group (South Africa) also aided relative returns. Avoiding shares of weak-performing
after-school tutoring services provider TAL Education Group (China) further bolstered relative results.
Detractors from Performance
Stock selection within the energy sector detracted from
relative performance, led by the timing of the fund's ownership in shares of oil and gas exploration and production company Petroleo Brasileiro(h) (Brazil). The stock price of Petroleo Brasileiro appreciated after the company reported solid
financial results, which were ahead of market estimates, driven primarily by higher overall oil prices. Not owning shares of strong-performing global energy company Gazprom (Russia) further held back relative performance.
Stocks in other sectors that weakened relative performance
included the fund’s overweight positions in real estate development firm Shimao Group Holdings(h) (Hong Kong), rubber gloves manufacturer Top Gloves (Malaysia), cement manufacturer Anhui Conch Cement (China), motorcycle manufacturer Hero
Motorcorp (India) and financial management firm E.Sun Financial(h) (Taiwan). The timing of the fund’s ownership in shares of integrated circuits manufacturer Mediatek (Taiwan), and not owning shares of banking and treasury management firm
ICICI Bank (India) and advertising and content platform provider Kakao (South Korea), also weighed on relative results. The stock price of Kakao advanced during the reporting period as the company continued to show strong revenue growth, driven by
higher-than-expected profitability from Kakao Bank and a surge in transaction value from Dunamu (operator of Upbit, the number one cryptocurrency trading platform in Korea).
Respectfully,
Portfolio Manager(s)
Jim Fallon, Matt Krummell, Jonathan Sage, and Jed Stocks
| (b)
|
Security is not a
benchmark constituent. |
| (h)
|
Security was not held in
the portfolio at period end. |
The
views expressed in this report are those of the portfolio manager(s) only through the end of the period of the report as stated on the cover and do not necessarily reflect the views of MFS or any other person in the MFS organization. These views are
subject to change at any time based on market or other conditions, and MFS disclaims any responsibility to update such views. These
Management Review -
continued
views may not be relied upon as investment advice or an indication of trading
intent on behalf of any MFS portfolio. References to specific securities are not recommendations of such securities, and may not be representative of any MFS portfolio’s current or future investments.
Performance Summary THROUGH
8/31/21
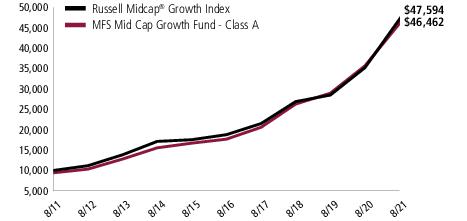
The following chart illustrates a representative
class of the fund’s historical performance in comparison to its benchmark(s). Performance results include the deduction of the maximum applicable sales charge and reflect the percentage change in net asset value, including reinvestment of
dividends and capital gains distributions. The performance of other share classes will be greater than or less than that of the class depicted below. Benchmarks are unmanaged and may not be invested in directly. Benchmark returns do not reflect
sales charges, commissions or expenses. (See Notes to Performance Summary.)
Performance data shown represents past performance and is no
guarantee of future results. Investment return and principal value fluctuate so your shares, when sold, may be worth more or less than the original cost; current performance may be lower or higher than quoted. The performance shown does not reflect
the deduction of taxes, if any, that a shareholder would pay on fund distributions or the redemption of fund shares.
Growth of a Hypothetical $10,000 Investment (t)
Performance Summary -
continued
Total Returns through 8/31/21
Average annual without sales charge
| Share
Class |
Class
Inception Date |
1-yr
|
5-yr
|
Life
(t) |
| A
|
9/15/15
|
24.78%
|
9.93%
|
10.72%
|
| B
|
9/15/15
|
23.77%
|
9.11%
|
9.89%
|
| C
|
9/15/15
|
23.78%
|
9.10%
|
9.88%
|
| I
|
9/15/15
|
25.10%
|
10.21%
|
10.98%
|
| R1
|
9/15/15
|
24.32%
|
9.20%
|
9.96%
|
| R2
|
9/15/15
|
24.47%
|
9.66%
|
10.44%
|
| R3
|
9/15/15
|
24.80%
|
9.93%
|
10.70%
|
| R4
|
9/15/15
|
25.10%
|
10.22%
|
10.99%
|
| R6
|
9/15/15
|
25.17%
|
10.30%
|
11.07%
|
Comparative benchmark(s)
| |
|
|
|
| MSCI
Emerging Markets Index (net div) (f) |
21.12%
|
10.40%
|
10.92%
|
Average annual with sales
charge
| |
|
|
|
A
With Initial Sales Charge (5.75%) |
17.61%
|
8.63%
|
9.62%
|
B
With CDSC (Declining over six years from 4% to 0%) (v) |
19.77%
|
8.83%
|
9.78%
|
C
With CDSC (1% for 12 months) (v) |
22.78%
|
9.10%
|
9.88%
|
CDSC – Contingent Deferred
Sales Charge.
Class I, R1, R2, R3, R4, and R6 shares do
not have a sales charge.
| (f)
|
Source:
FactSet Research Systems Inc. |
| (t)
|
For the
period from the class inception date through the stated period end. (See Notes to Performance Summary.) |
| (v)
|
Assuming
redemption at the end of the applicable period. |
Benchmark Definition(s)
MSCI Emerging Markets Index(e) (net div) - a market capitalization-weighted index that is designed to measure equity market performance in the global emerging markets.
It is not possible to invest directly in an index.
| (e)
|
Morgan
Stanley Capital International (“MSCI”) makes no express or implied warranties or representations and shall have no liability whatsoever with respect to any MSCI data contained herein. The MSCI data may not be further redistributed or
used as a basis for other indices or any securities or financial products. This report is not approved, reviewed, or produced by MSCI. |
Notes to Performance Summary
Average annual total return represents the average annual
change in value for each share class for the periods presented. Life returns are presented where the share class has less than 10 years of performance history and represent the average annual total return from the class inception date to the stated
period end date.
Performance Summary -
continued
Performance results reflect any applicable expense subsidies
and waivers in effect during the periods shown. Without such subsidies and waivers the fund's performance results would be less favorable. Please see the prospectus and financial statements for complete details.
Performance results do not include adjustments made for
financial reporting purposes in accordance with U.S. generally accepted accounting principles and may differ from amounts reported in the financial highlights.
From time to time the fund may receive proceeds from litigation
settlements, without which performance would be lower.
Expense Table
Fund expenses borne by the shareholders during the period,
March 1, 2021 through August 31, 2021
As a shareholder
of the fund, you incur two types of costs: (1) transaction costs, including sales charges (loads) on certain purchase or redemption payments, and (2) ongoing costs, including management fees; distribution and service (12b-1) fees; and other fund
expenses. This example is intended to help you understand your ongoing costs (in dollars) of investing in the fund and to compare these costs with the ongoing costs of investing in other mutual funds.
The example is based on an investment of $1,000 invested at the
beginning of the period and held for the entire period March 1, 2021 through August 31, 2021.
Actual Expenses
The first line for each share class in the following table
provides information about actual account values and actual expenses. You may use the information in this line, together with the amount you invested, to estimate the expenses that you paid over the period. Simply divide your account value by $1,000
(for example, an $8,600 account value divided by $1,000 = 8.6), then multiply the result by the number in the first line under the heading entitled “Expenses Paid During Period” to estimate the expenses you paid on your account during
this period.
Hypothetical Example for Comparison
Purposes
The second line for each share class in the
following table provides information about hypothetical account values and hypothetical expenses based on the fund’s actual expense ratio and an assumed rate of return of 5% per year before expenses, which is not the fund’s actual
return. The hypothetical account values and expenses may not be used to estimate the actual ending account balance or expenses you paid for the period. You may use this information to compare the ongoing costs of investing in the fund and other
funds. To do so, compare this 5% hypothetical example with the 5% hypothetical examples that appear in the shareholder reports of the other funds.
Please note that the expenses shown in the table are meant to
highlight your ongoing costs only and do not reflect any transactional costs, such as sales charges (loads). Therefore, the second line for each share class in the table is useful in comparing ongoing costs only, and will not help you determine the
relative total costs of owning different funds. In addition, if these transactional costs were included, your costs would have been higher.
Expense Table -
continued
Share
Class |
|
Annualized
Expense
Ratio |
Beginning
Account Value
3/01/21 |
Ending
Account Value
8/31/21 |
Expenses
Paid During
Period (p)
3/01/21-8/31/21 |
| A
|
Actual
|
1.24%
|
$1,000.00
|
$1,023.08
|
$6.32
|
| Hypothetical
(h) |
1.24%
|
$1,000.00
|
$1,018.95
|
$6.31
|
| B
|
Actual
|
1.99%
|
$1,000.00
|
$1,018.76
|
$10.13
|
| Hypothetical
(h) |
1.99%
|
$1,000.00
|
$1,015.17
|
$10.11
|
| C
|
Actual
|
1.99%
|
$1,000.00
|
$1,018.80
|
$10.13
|
| Hypothetical
(h) |
1.99%
|
$1,000.00
|
$1,015.17
|
$10.11
|
| I
|
Actual
|
0.99%
|
$1,000.00
|
$1,024.33
|
$5.05
|
| Hypothetical
(h) |
0.99%
|
$1,000.00
|
$1,020.21
|
$5.04
|
| R1
|
Actual
|
1.24%
|
$1,000.00
|
$1,023.26
|
$6.32
|
| Hypothetical
(h) |
1.24%
|
$1,000.00
|
$1,018.95
|
$6.31
|
| R2
|
Actual
|
1.49%
|
$1,000.00
|
$1,021.81
|
$7.59
|
| Hypothetical
(h) |
1.49%
|
$1,000.00
|
$1,017.69
|
$7.58
|
| R3
|
Actual
|
1.24%
|
$1,000.00
|
$1,023.05
|
$6.32
|
| Hypothetical
(h) |
1.24%
|
$1,000.00
|
$1,018.95
|
$6.31
|
| R4
|
Actual
|
0.99%
|
$1,000.00
|
$1,024.28
|
$5.05
|
| Hypothetical
(h) |
0.99%
|
$1,000.00
|
$1,020.21
|
$5.04
|
| R6
|
Actual
|
0.96%
|
$1,000.00
|
$1,024.27
|
$4.90
|
| Hypothetical
(h) |
0.96%
|
$1,000.00
|
$1,020.37
|
$4.89
|
| (h)
|
5% class return per year
before expenses. |
| (p)
|
“Expenses
Paid During Period” are equal to each class’s annualized expense ratio, as shown above, multiplied by the average account value over the period, multiplied by 184/365 (to reflect the one-half year period). Expenses paid do not include
any applicable sales charges (loads). If these transaction costs had been included, your costs would have been higher. |
Notes to Expense Table
For the period from March 1, 2021 through August 31, 2021, the
distribution fee for Class R1 was not imposed. Had the distribution fee been imposed throughout the entire six month period, the annualized expense ratio, the actual expenses paid during the period, and the hypothetical expenses paid during the
period would have been approximately 1.99%, $10.15, and $10.11 for Class R1. See Note 3 in the Notes to Financial Statements for additional information.
Portfolio of
Investments
8/31/21
The Portfolio of Investments is a complete list of all
securities owned by your fund. It is categorized by broad-based asset classes.
| Issuer
|
|
|
Shares/Par
|
Value
($) |
| Common
Stocks – 98.5% |
| Alcoholic
Beverages – 1.6% |
|
| Ambev
S.A. |
|
73,700 |
$
243,728 |
| China
Resources Beer Holdings Co. Ltd. |
|
12,000 |
98,747 |
| Jiangsu
Yanghe Brewery JSC Ltd. |
|
10,700 |
277,367 |
| Kweichow
Moutai Co. Ltd., “A” |
|
1,300 |
313,374 |
| |
|
|
|
$933,216 |
| Apparel
Manufacturers – 1.2% |
|
| ANTA
Sports Products Ltd. |
|
6,000 |
$
123,434 |
| Bosideng
International Holdings Ltd. |
|
240,000 |
196,260 |
| Li
Ning Co. Ltd. |
|
15,000 |
201,544 |
| LPP
S.A. |
|
30 |
109,343 |
| Shenzhou
International Group Holdings Ltd. |
|
3,200 |
69,781 |
| |
|
|
|
$700,362 |
| Automotive
– 3.6% |
|
| BAIC
Motor Corp. Ltd., “H” |
|
508,500 |
$
185,683 |
| BYD
Co. Ltd. |
|
8,000 |
270,937 |
| Great
Wall Motor Co. Ltd. |
|
32,000 |
147,298 |
| Hero
MotoCorp Ltd. |
|
13,433 |
504,486 |
| Kia
Corp. |
|
5,035 |
369,553 |
| Nio,
Inc., ADR (a) |
|
2,259 |
88,801 |
| Sinotruk
Hong Kong Ltd. |
|
85,500 |
168,418 |
| Yadea
Group Holdings Ltd. |
|
52,000 |
92,401 |
| Yutong
Bus Co. Ltd., “A” |
|
92,090 |
175,255 |
| Zhongsheng
Group Holdings Ltd. |
|
19,000 |
158,792 |
| |
|
|
|
$2,161,624 |
| Biotechnology
– 0.8% |
|
| Hugel,
Inc. (a) |
|
1,322 |
$
222,338 |
| WuXi
Biologics (Cayman), Inc. (a) |
|
16,500 |
255,431 |
| |
|
|
|
$477,769 |
| Brokerage
& Asset Managers – 0.6% |
|
| B3
Brasil Bolsa Balcao S.A. |
|
59,300 |
$
161,358 |
| Moscow
Exchange MICEX-RTS PJSC |
|
74,670 |
186,885 |
| |
|
|
|
$348,243 |
Portfolio of
Investments – continued
| Issuer
|
|
|
Shares/Par
|
Value
($) |
| Common
Stocks – continued |
| Business
Services – 3.9% |
|
| Infosys
Ltd. |
|
41,141 |
$
961,614 |
| Tata
Consultancy Services Ltd. |
|
20,090 |
1,041,945 |
| Tech
Mahindra Ltd. |
|
17,678 |
350,533 |
| |
|
|
|
$2,354,092 |
| Computer
Software – 3.0% |
|
| Kingsoft
Corp. |
|
35,800 |
$
143,385 |
| NAVER
Corp. |
|
2,407 |
911,357 |
| NetEase.com,
Inc., ADR |
|
7,830 |
762,799 |
| |
|
|
|
$1,817,541 |
| Computer
Software - Systems – 6.1% |
|
| Hon
Hai Precision Industry Co. Ltd. |
|
180,000 |
$
720,948 |
| Samsung
Electronics Co. Ltd. |
|
44,472 |
2,941,914 |
| |
|
|
|
$3,662,862 |
| Conglomerates
– 0.6% |
|
| CITIC
Pacific Ltd. |
|
305,000 |
$
379,610 |
| Construction
– 1.4% |
|
| Anhui
Conch Cement Co. Ltd. |
|
55,000 |
$
297,720 |
| CEMEX
S.A.B. de C.V. (a) |
|
491,877 |
404,101 |
| LG
Electronics, Inc. |
|
1,030 |
126,146 |
| |
|
|
|
$827,967 |
| Consumer
Products – 0.2% |
|
| AmorePacific
Corp. |
|
675 |
$
132,444 |
| Consumer
Services – 1.3% |
|
| Localiza
Rent a Car S.A. |
|
18,300 |
$
196,279 |
| MakeMyTrip
Ltd. (a) |
|
3,920 |
101,214 |
| Trip.com
Group Ltd. (a) |
|
15,252 |
465,034 |
| |
|
|
|
$762,527 |
| Electronics
– 10.5% |
|
| E
Ink Holdings, Inc. |
|
206,000 |
$
582,020 |
| MediaTek,
Inc. |
|
7,000 |
227,579 |
| Silicon
Motion Technology Corp., ADR |
|
7,702 |
575,031 |
| Taiwan
Semiconductor Manufacturing Co. Ltd. |
|
203,000 |
4,497,519 |
| United
Microelectronics Corp. |
|
196,000 |
446,266 |
| |
|
|
|
$6,328,415 |
Portfolio of
Investments – continued
| Issuer
|
|
|
Shares/Par
|
Value
($) |
| Common
Stocks – continued |
| Energy
- Independent – 1.8% |
|
| China
Shenhua Energy Co. Ltd. |
|
316,500 |
$
700,761 |
| Hindustan
Petroleum Corp. Ltd. |
|
47,307 |
172,750 |
| Reliance
Industries Ltd. |
|
6,516 |
201,542 |
| |
|
|
|
$1,075,053 |
| Energy
- Integrated – 3.3% |
|
| China
Petroleum & Chemical Corp. |
|
1,168,000
|
$
566,170 |
| LUKOIL
PJSC, ADR |
|
9,627 |
815,984 |
| MOL
Hungarian Oil & Gas PLC |
|
30,453 |
249,712 |
| PetroChina
Co. Ltd. |
|
850,000 |
372,680 |
| |
|
|
|
$2,004,546 |
| Engineering
- Construction – 1.0% |
|
| Doosan
Bobcat, Inc. (a) |
|
7,646 |
$
285,872 |
| Sany
Heavy Industry Co. Ltd., “A” |
|
39,000 |
158,276 |
| Zoomlion
Heavy Industry Science and Technology Co., Ltd. |
|
138,000 |
131,480 |
| |
|
|
|
$575,628 |
| Food
& Beverages – 2.2% |
|
| Gruma
S.A.B. de C.V. |
|
16,850 |
$
192,436 |
| Inner
Mongolia Yili Industrial Group Co. Ltd., “A” |
|
85,664 |
450,772 |
| JBS
S.A. |
|
63,888 |
385,122 |
| Tata
Consumer Products Ltd. |
|
27,448 |
325,188 |
| |
|
|
|
$1,353,518 |
| Food
& Drug Stores – 0.2% |
|
| Sendas
Distribuidora S.A. |
|
46,000 |
$
149,544 |
| Gaming
& Lodging – 0.3% |
|
| Genting
Berhad |
|
127,800 |
$
155,254 |
| General
Merchandise – 1.5% |
|
| Bim
Birlesik Magazalar A.S. |
|
30,016 |
$
259,322 |
| Walmart
de Mexico S.A.B. de C.V. |
|
174,287 |
620,123 |
| |
|
|
|
$879,445 |
| Insurance
– 3.6% |
|
| AIA
Group Ltd. |
|
9,600 |
$
114,732 |
| China
Pacific Insurance Co. Ltd. |
|
176,800 |
497,839 |
| PICC
Property & Casualty Co. Ltd. |
|
276,000 |
249,475 |
| Ping
An Insurance Co. of China Ltd., “H” |
|
92,500 |
718,359 |
| Samsung
Fire & Marine Insurance Co. Ltd. |
|
3,075 |
599,379 |
| |
|
|
|
$2,179,784 |
Portfolio of
Investments – continued
| Issuer
|
|
|
Shares/Par
|
Value
($) |
| Common
Stocks – continued |
| Internet
– 8.2% |
|
| Alibaba
Group Holding Ltd., ADR (a) |
|
10,727 |
$
1,791,302 |
| Allegro.eu
S.A. (a) |
|
19,023 |
352,681 |
| Tencent
Holdings Ltd. |
|
45,500 |
2,815,139 |
| |
|
|
|
$4,959,122 |
| Leisure
& Toys – 1.4% |
|
| Giant
Manufacturing Co. Ltd. |
|
15,000 |
$
181,319 |
| Naspers
Ltd. |
|
3,570 |
609,490 |
| NCsoft
Corp. |
|
127 |
72,293 |
| |
|
|
|
$863,102 |
| Machinery
& Tools – 0.4% |
|
| AirTAC
International Group |
|
7,000 |
$
213,434 |
| Major
Banks – 4.4% |
|
| ABSA
Group Ltd. |
|
49,670 |
$
540,425 |
| Bank
of China Ltd. |
|
1,516,000
|
532,138 |
| Bank
of Communications Co. Ltd. |
|
411,000 |
236,218 |
| China
Construction Bank Corp. |
|
1,428,000
|
1,031,875 |
| Industrial
& Commercial Bank of China, “H” |
|
366,000 |
204,237 |
| Nedbank
Group Ltd. |
|
7,490 |
95,389 |
| |
|
|
|
$2,640,282 |
| Medical
& Health Technology & Services – 0.3% |
|
| Dr.
Sulaiman Al Habib Medical Services Group |
|
3,286 |
$
160,852 |
| Medical
Equipment – 0.2% |
|
| Top
Glove Corp. |
|
149,900 |
$
144,239 |
| Metals
& Mining – 4.3% |
|
| African
Rainbow Minerals Ltd. |
|
6,326 |
$
112,870 |
| China
Hongqiao Group Ltd. |
|
185,000 |
275,926 |
| Hyundai
Steel Co. |
|
4,056 |
178,409 |
| JSW
Steel Ltd. |
|
17,075 |
160,816 |
| Kumba
Iron Ore Ltd. |
|
8,022 |
360,614 |
| POSCO
|
|
1,845 |
536,258 |
| Tata
Steel Ltd. |
|
12,349 |
245,305 |
| Vale
S.A. |
|
37,700 |
719,470 |
| |
|
|
|
$2,589,668 |
| Natural
Gas - Distribution – 0.1% |
|
| GAIL
(India) Ltd. GDR |
|
39,235 |
$
78,542 |
| Network
& Telecom – 0.5% |
|
| VTech
Holdings Ltd. |
|
29,700 |
$
288,505 |
Portfolio of
Investments – continued
| Issuer
|
|
|
Shares/Par
|
Value
($) |
| Common
Stocks – continued |
| Other
Banks & Diversified Financials – 9.6% |
|
| Banco
Macro S.A., ADR (a) |
|
8,611 |
$
161,026 |
| BNK
Financial Group, Inc. |
|
21,965 |
147,008 |
| Chailease
Holding Co. |
|
98,650 |
948,643 |
| Hacı
Ömer Sabancı Holding A.S. |
|
155,565 |
196,596 |
| Hana
Financial Group, Inc. |
|
11,417 |
443,603 |
| HDFC
Bank Ltd., ADR |
|
7,728 |
605,180 |
| Housing
Development Finance Corp. Ltd. |
|
5,230 |
200,475 |
| KB
Financial Group, Inc. |
|
18,892 |
861,949 |
| Kotak
Mahindra Bank Ltd. |
|
5,020 |
120,584 |
| PT
Bank Central Asia Tbk |
|
47,600 |
109,301 |
| Sberbank
of Russia PJSC, ADR |
|
54,796 |
977,835 |
| State
Bank of India |
|
43,023 |
251,069 |
| TCS
Group Holding PLC, GDR |
|
6,806 |
600,970 |
| Textainer
Group Holdings Ltd. (a) |
|
5,325 |
176,896 |
| |
|
|
|
$5,801,135 |
| Pharmaceuticals
– 3.2% |
|
| Ajanta
Pharma Ltd. |
|
8,462 |
$
258,215 |
| China
Medical System Holdings Ltd. |
|
152,000 |
297,846 |
| Chongqing
Zhifei Biological Products Co. Ltd., “A” |
|
3,600 |
98,589 |
| CSPC
Pharmaceutical Group Ltd. |
|
82,000 |
104,062 |
| Divi's
Laboratories Ltd. |
|
2,894 |
205,080 |
| Gedeon
Richter PLC |
|
8,762 |
262,611 |
| Genomma
Lab Internacional S.A., “B” (a) |
|
194,088 |
187,768 |
| Sinopharm
Group Co. Ltd., “H” |
|
40,400 |
103,786 |
| Sun
Pharmaceutical Industries Ltd. |
|
29,009 |
315,510 |
| Zhangzhou
Pientzehuang Pharmaceutical Co. Ltd., “A” |
|
1,500 |
80,545 |
| |
|
|
|
$1,914,012 |
| Precious
Metals & Minerals – 0.3% |
|
| Impala
Platinum Holdings Ltd. |
|
4,824 |
$
74,022 |
| Sibanye-Stillwater
Ltd. |
|
30,890 |
125,251 |
| |
|
|
|
$199,273 |
| Railroad
& Shipping – 1.0% |
|
| China
Cosco Holdings (a) |
|
157,250 |
$
297,215 |
| Evergreen
Marine Corp. (Taiwan) Ltd. |
|
58,000 |
284,627 |
| |
|
|
|
$581,842 |
| Real
Estate – 1.1% |
|
| Aldar
Properties PJSC |
|
478,942 |
$
541,119 |
| Hopson
Development Holdings Ltd. |
|
34,400 |
134,018 |
| |
|
|
|
$675,137 |
Portfolio of
Investments – continued
| Issuer
|
|
|
Shares/Par
|
Value
($) |
| Common
Stocks – continued |
| Restaurants
– 1.5% |
|
| Yum
China Holdings, Inc. |
|
14,882 |
$
916,136 |
| Special
Products & Services – 0.8% |
|
| Tisco
Financial Group PCL |
|
160,600 |
$
468,360 |
| Specialty
Chemicals – 3.0% |
|
| Asian
Paints Ltd. |
|
6,556 |
$
287,478 |
| Charoen
Pokphand Foods Public Co. Ltd. |
|
341,700 |
286,230 |
| Kingboard
Holdings Ltd. |
|
39,000 |
191,805 |
| Lotte
Chemical Corp. |
|
1,476 |
318,254 |
| Orbia
Advance Corp. S.A.B. de C.V. |
|
59,878 |
170,952 |
| PTT
Global Chemical PLC |
|
265,400 |
526,971 |
| |
|
|
|
$1,781,690 |
| Specialty
Stores – 3.2% |
|
| Cencosud
S.A. |
|
64,641 |
$
121,957 |
| China
Tourism Group Duty Free Corp. Ltd. |
|
4,400 |
155,415 |
| JD.com,
Inc., ADR (a) |
|
10,838 |
851,433 |
| Meituan,
“B” (a) |
|
23,500 |
752,367 |
| Vipshop
Holdings Ltd., ADR (a) |
|
4,202 |
62,148 |
| |
|
|
|
$1,943,320 |
| Telecommunications
- Wireless – 1.2% |
|
| LG
Uplus Corp. |
|
9,114 |
$
110,442 |
| Mobile
TeleSystems PJSC, ADR |
|
13,029 |
122,212 |
| MTN
Group Ltd. (a) |
|
23,677 |
217,500 |
| SK
Telecom Co. Ltd. |
|
475 |
122,084 |
| Telekomunikacja
Polska S.A. (a) |
|
59,763 |
129,195 |
| |
|
|
|
$701,433 |
| Telephone
Services – 2.5% |
|
| Hellenic
Telecommunications Organization S.A. |
|
38,237 |
$
752,397 |
| KT
Corp., ADR |
|
17,403 |
243,990 |
| PT
Telekom Indonesia |
|
2,164,800
|
516,061 |
| |
|
|
|
$1,512,448 |
| Utilities
- Electric Power – 2.6% |
|
| Energias
do Brasil S.A. |
|
86,858 |
$
309,751 |
| Energisa
S.A., IEU |
|
60,700 |
520,859 |
| ENGIE
Energía Brasil S.A. |
|
25,165 |
182,747 |
| Equatorial
Energia S.A. |
|
89,200 |
439,031 |
| Saudi
Electricity Co. |
|
16,186 |
117,812 |
| |
|
|
|
$1,570,200 |
| Total
Common Stocks (Identified Cost, $45,727,665) |
|
$
59,262,176 |
Portfolio of
Investments – continued
| Issuer
|
|
|
Shares/Par
|
Value
($) |
| Preferred
Stocks – 0.3% |
| Computer
Software - Systems – 0.3% |
|
|
|
|
| Samsung
Electronics Co. Ltd. (Identified Cost, $209,143) |
|
3,214 |
$
196,258 |
| Investment
Companies (h) – 1.8% |
| Money
Market Funds – 1.8% |
|
| MFS
Institutional Money Market Portfolio, 0.04% (v) (Identified Cost, $1,073,195) |
|
|
1,073,195
|
$
1,073,195 |
| |
| |
| Other
Assets, Less Liabilities – (0.6)% |
|
(344,750) |
| Net
Assets – 100.0% |
$
60,186,879 |
| (a)
|
Non-income
producing security. |
|
|
|
| (h)
|
An
affiliated issuer, which may be considered one in which the fund owns 5% or more of the outstanding voting securities, or a company which is under common control. At period end, the aggregate values of the fund's investments in affiliated issuers
and in unaffiliated issuers were $1,073,195 and $59,458,434, respectively. |
|
|
|
| (v)
|
Affiliated
issuer that is available only to investment companies managed by MFS. The rate quoted for the MFS Institutional Money Market Portfolio is the annualized seven-day yield of the fund at period end. |
|
|
|
| The
following abbreviations are used in this report and are defined: |
| ADR
|
American
Depositary Receipt |
| GDR
|
Global
Depositary Receipt |
| IEU
|
International
Equity Unit |
| PCL
|
Public
Company Limited |
See Notes to Financial
Statements
Financial Statements
Statement of Assets and Liabilities
At 8/31/21
This statement represents your fund’s balance sheet,
which details the assets and liabilities comprising the total value of the fund.
| Assets
|
|
| Investments
in unaffiliated issuers, at value (identified cost, $45,936,808) |
$59,458,434
|
| Investments
in affiliated issuers, at value (identified cost, $1,073,195) |
1,073,195
|
| Foreign
currency, at value (identified cost, $637) |
637
|
| Receivables
for |
|
| Fund
shares sold |
14,943
|
| Dividends
|
80,724
|
| Receivable
from investment adviser |
1,890
|
| Other
assets |
300
|
| Total
assets |
$60,630,123
|
| Liabilities
|
|
| Payables
for |
|
| Fund
shares reacquired |
$111,458
|
| Payable
to affiliates |
|
| Administrative
services fee |
102
|
| Shareholder
servicing costs |
3,545
|
| Distribution
and service fees |
156
|
| Payable
for independent Trustees' compensation |
1
|
| Deferred
country tax expense payable |
170,067
|
| Accrued
expenses and other liabilities |
157,915
|
| Total
liabilities |
$443,244
|
| Net
assets |
$60,186,879
|
| Net
assets consist of |
|
| Paid-in
capital |
$46,795,260
|
| Total
distributable earnings (loss) |
13,391,619
|
| Net
assets |
$60,186,879
|
| Shares
of beneficial interest outstanding |
3,761,092
|
Statement of Assets and
Liabilities – continued
| |
Net
assets |
Shares
outstanding |
Net
asset value
per share (a) |
| Class
A |
$7,868,712
|
493,102
|
$15.96
|
| Class
B |
403,354
|
25,603
|
15.75
|
| Class
C |
410,400
|
26,101
|
15.72
|
| Class
I |
33,246,587
|
2,078,065
|
16.00
|
| Class
R1 |
88,073
|
5,561
|
15.84
|
| Class
R2 |
90,397
|
5,676
|
15.93
|
| Class
R3 |
106,598
|
6,670
|
15.98
|
| Class
R4 |
117,885
|
7,355
|
16.03
|
| Class
R6 |
17,854,873
|
1,112,959
|
16.04
|
| (a)
|
Maximum
offering price per share was equal to the net asset value per share for all share classes, except for Class A, for which the maximum offering price per share was $16.93 [100 / 94.25 x $15.96]. On sales of $50,000 or more, the maximum offering price
of Class A shares is reduced. A contingent deferred sales charge may be imposed on redemptions of Class A, Class B, and Class C shares. Redemption price per share was equal to the net asset value per share for Classes I, R1, R2, R3, R4, and R6.
|
See Notes to Financial Statements
Financial Statements
Statement of Operations
Year ended 8/31/21
This statement describes how much your fund earned in
investment income and accrued in expenses. It also describes any gains and/or losses generated by fund operations.
| Net
investment income (loss) |
|
| Income
|
|
| Dividends
|
$1,629,090
|
| Other
|
9,831
|
| Dividends
from affiliated issuers |
389
|
| Foreign
taxes withheld |
(183,202)
|
| Total
investment income |
$1,456,108
|
| Expenses
|
|
| Management
fee |
$393,910
|
| Distribution
and service fees |
27,329
|
| Shareholder
servicing costs |
31,242
|
| Administrative
services fee |
18,075
|
| Independent
Trustees' compensation |
2,533
|
| Custodian
fee |
126,353
|
| Shareholder
communications |
7,402
|
| Audit
and tax fees |
78,916
|
| Legal
fees |
516
|
| Registration
fees |
124,288
|
| Miscellaneous
|
31,344
|
| Total
expenses |
$841,908
|
| Reduction
of expenses by investment adviser |
(304,582)
|
| Net
expenses |
$537,326
|
| Net
investment income (loss) |
$918,782
|
| Realized
and unrealized gain (loss) |
| Realized
gain (loss) (identified cost basis) |
|
| Unaffiliated
issuers (net of $78,766 country tax) |
$2,969,848
|
| Foreign
currency |
(20,910)
|
| Net
realized gain (loss) |
$2,948,938
|
| Change
in unrealized appreciation or depreciation |
|
| Unaffiliated
issuers (net of $156,057 increase in deferred country tax) |
$6,704,165
|
| Translation
of assets and liabilities in foreign currencies |
1,023
|
| Net
unrealized gain (loss) |
$6,705,188
|
| Net
realized and unrealized gain (loss) |
$9,654,126
|
| Change
in net assets from operations |
$10,572,908
|
See Notes to Financial
Statements
Financial Statements
Statements of Changes in Net Assets
These statements describe the increases and/or decreases in
net assets resulting from operations, any distributions, and any shareholder transactions.
| |
Year
ended |
| |
8/31/21
|
8/31/20
|
| Change
in net assets |
|
|
| From
operations |
|
|
| Net
investment income (loss) |
$918,782
|
$720,764
|
| Net
realized gain (loss) |
2,948,938
|
(2,119,090)
|
| Net
unrealized gain (loss) |
6,705,188
|
5,450,826
|
| Change
in net assets from operations |
$10,572,908
|
$4,052,500
|
| Total
distributions to shareholders |
$(745,103)
|
$(465,097)
|
| Change
in net assets from fund share transactions |
$7,985,612
|
$18,110,671
|
| Total
change in net assets |
$17,813,417
|
$21,698,074
|
| Net
assets |
|
|
| At
beginning of period |
42,373,462
|
20,675,388
|
| At
end of period |
$60,186,879
|
$42,373,462
|
See Notes to Financial
Statements
Financial
Statements
Financial Highlights
The financial highlights table is intended to help you
understand the fund's financial performance for the past 5 years. Certain information reflects financial results for a single fund share. The total returns in the table represent the rate that an investor would have earned (or lost) on an investment
in the fund share class (assuming reinvestment of all distributions) held for the entire period.
| Class
A |
Year
ended |
| |
8/31/21
|
8/31/20
|
8/31/19
|
8/31/18
|
8/31/17
|
| Net
asset value, beginning of period |
$12.97
|
$12.12
|
$13.66
|
$14.37
|
$11.37
|
| Income
(loss) from investment operations |
| Net
investment income (loss) (d) |
$0.23
|
$0.24
|
$0.25
|
$0.24
|
$0.28
|
| Net
realized and unrealized gain (loss) |
2.96
|
0.81
|
(1.20)
|
(0.32)
|
2.86
|
| Total
from investment operations |
$3.19
|
$1.05
|
$(0.95)
|
$(0.08)
|
$3.14
|
| Less
distributions declared to shareholders |
| From
net investment income |
$(0.20)
|
$(0.20)
|
$(0.22)
|
$(0.16)
|
$(0.06)
|
| From
net realized gain |
—
|
—
|
(0.37)
|
(0.47)
|
(0.08)
|
| Total
distributions declared to shareholders |
$(0.20)
|
$(0.20)
|
$(0.59)
|
$(0.63)
|
$(0.14)
|
| Net
asset value, end of period (x) |
$15.96
|
$12.97
|
$12.12
|
$13.66
|
$14.37
|
| Total
return (%) (r)(s)(t)(x) |
24.78
|
8.63
|
(6.77)
|
(0.77)
|
28.01
|
Ratios
(%) (to average net assets)
and Supplemental data: |
| Expenses
before expense reductions (f) |
1.82
|
2.39
|
2.95
|
2.94
|
3.23
|
| Expenses
after expense reductions (f) |
1.24
|
1.24
|
1.24
|
1.23
|
1.23
|
| Net
investment income (loss) |
1.50
|
1.98
|
2.01
|
1.65
|
2.22
|
| Portfolio
turnover |
60
|
63
|
64
|
58
|
92
|
| Net
assets at end of period (000 omitted) |
$7,869
|
$5,702
|
$5,174
|
$7,145
|
$4,982
|
See Notes to Financial
Statements
Financial
Highlights – continued
| Class
B |
Year
ended |
| |
8/31/21
|
8/31/20
|
8/31/19
|
8/31/18
|
8/31/17
|
| Net
asset value, beginning of period |
$12.81
|
$11.99
|
$13.54
|
$14.27
|
$11.31
|
| Income
(loss) from investment operations |
| Net
investment income (loss) (d) |
$0.11
|
$0.15
|
$0.21
|
$0.12
|
$0.12
|
| Net
realized and unrealized gain (loss) |
2.93
|
0.80
|
(1.25)
|
(0.30)
|
2.92
|
| Total
from investment operations |
$3.04
|
$0.95
|
$(1.04)
|
$(0.18)
|
$3.04
|
| Less
distributions declared to shareholders |
| From
net investment income |
$(0.10)
|
$(0.13)
|
$(0.14)
|
$(0.08)
|
$(0.00)(w)
|
| From
net realized gain |
—
|
—
|
(0.37)
|
(0.47)
|
(0.08)
|
| Total
distributions declared to shareholders |
$(0.10)
|
$(0.13)
|
$(0.51)
|
$(0.55)
|
$(0.08)
|
| Net
asset value, end of period (x) |
$15.75
|
$12.81
|
$11.99
|
$13.54
|
$14.27
|
| Total
return (%) (r)(s)(t)(x) |
23.77
|
7.88
|
(7.51)
|
(1.47)
|
27.09
|
Ratios
(%) (to average net assets)
and Supplemental data: |
| Expenses
before expense reductions (f) |
2.58
|
3.19
|
3.70
|
3.67
|
4.04
|
| Expenses
after expense reductions (f) |
1.99
|
1.99
|
1.99
|
1.98
|
1.99
|
| Net
investment income (loss) |
0.72
|
1.22
|
1.63
|
0.79
|
0.97
|
| Portfolio
turnover |
60
|
63
|
64
|
58
|
92
|
| Net
assets at end of period (000 omitted) |
$403
|
$312
|
$391
|
$318
|
$213
|
| Class
C |
Year
ended |
| |
8/31/21
|
8/31/20
|
8/31/19
|
8/31/18
|
8/31/17
|
| Net
asset value, beginning of period |
$12.78
|
$11.95
|
$13.50
|
$14.23
|
$11.31
|
| Income
(loss) from investment operations |
| Net
investment income (loss) (d) |
$0.11
|
$0.15
|
$0.16
|
$0.11
|
$0.14
|
| Net
realized and unrealized gain (loss) |
2.93
|
0.78
|
(1.19)
|
(0.29)
|
2.89
|
| Total
from investment operations |
$3.04
|
$0.93
|
$(1.03)
|
$(0.18)
|
$3.03
|
| Less
distributions declared to shareholders |
| From
net investment income |
$(0.10)
|
$(0.10)
|
$(0.15)
|
$(0.08)
|
$(0.03)
|
| From
net realized gain |
—
|
—
|
(0.37)
|
(0.47)
|
(0.08)
|
| Total
distributions declared to shareholders |
$(0.10)
|
$(0.10)
|
$(0.52)
|
$(0.55)
|
$(0.11)
|
| Net
asset value, end of period (x) |
$15.72
|
$12.78
|
$11.95
|
$13.50
|
$14.23
|
| Total
return (%) (r)(s)(t)(x) |
23.87
|
7.78
|
(7.51)
|
(1.48)
|
27.06
|
Ratios
(%) (to average net assets)
and Supplemental data: |
| Expenses
before expense reductions (f) |
2.58
|
3.19
|
3.70
|
3.64
|
4.02
|
| Expenses
after expense reductions (f) |
1.99
|
1.99
|
1.99
|
1.99
|
1.99
|
| Net
investment income (loss) |
0.72
|
1.22
|
1.31
|
0.75
|
1.16
|
| Portfolio
turnover |
60
|
63
|
64
|
58
|
92
|
| Net
assets at end of period (000 omitted) |
$410
|
$344
|
$420
|
$453
|
$438
|
See Notes to Financial
Statements
Financial
Highlights – continued
| Class
I |
Year
ended |
| |
8/31/21
|
8/31/20
|
8/31/19
|
8/31/18
|
8/31/17
|
| Net
asset value, beginning of period |
$13.00
|
$12.16
|
$13.71
|
$14.41
|
$11.38
|
| Income
(loss) from investment operations |
| Net
investment income (loss) (d) |
$0.28
|
$0.29
|
$0.29
|
$0.34
|
$0.28
|
| Net
realized and unrealized gain (loss) |
2.96
|
0.80
|
(1.22)
|
(0.39)
|
2.91
|
| Total
from investment operations |
$3.24
|
$1.09
|
$(0.93)
|
$(0.05)
|
$3.19
|
| Less
distributions declared to shareholders |
| From
net investment income |
$(0.24)
|
$(0.25)
|
$(0.25)
|
$(0.18)
|
$(0.08)
|
| From
net realized gain |
—
|
—
|
(0.37)
|
(0.47)
|
(0.08)
|
| Total
distributions declared to shareholders |
$(0.24)
|
$(0.25)
|
$(0.62)
|
$(0.65)
|
$(0.16)
|
| Net
asset value, end of period (x) |
$16.00
|
$13.00
|
$12.16
|
$13.71
|
$14.41
|
| Total
return (%) (r)(s)(t)(x) |
25.10
|
8.89
|
(6.55)
|
(0.55)
|
28.44
|
Ratios
(%) (to average net assets)
and Supplemental data: |
| Expenses
before expense reductions (f) |
1.57
|
1.91
|
2.70
|
2.78
|
3.05
|
| Expenses
after expense reductions (f) |
0.99
|
0.99
|
0.99
|
0.99
|
0.99
|
| Net
investment income (loss) |
1.83
|
2.46
|
2.26
|
2.30
|
2.28
|
| Portfolio
turnover |
60
|
63
|
64
|
58
|
92
|
| Net
assets at end of period (000 omitted) |
$33,247
|
$21,273
|
$1,811
|
$2,343
|
$669
|
| Class
R1 |
Year
ended |
| |
8/31/21
|
8/31/20
|
8/31/19
|
8/31/18
|
8/31/17
|
| Net
asset value, beginning of period |
$12.84
|
$12.01
|
$13.57
|
$14.27
|
$11.31
|
| Income
(loss) from investment operations |
| Net
investment income (loss) (d) |
$0.17
|
$0.15
|
$0.17
|
$0.10
|
$0.11
|
| Net
realized and unrealized gain (loss) |
2.94
|
0.80
|
(1.20)
|
(0.28)
|
2.93
|
| Total
from investment operations |
$3.11
|
$0.95
|
$(1.03)
|
$(0.18)
|
$3.04
|
| Less
distributions declared to shareholders |
| From
net investment income |
$(0.11)
|
$(0.12)
|
$(0.16)
|
$(0.05)
|
$—
|
| From
net realized gain |
—
|
—
|
(0.37)
|
(0.47)
|
(0.08)
|
| Total
distributions declared to shareholders |
$(0.11)
|
$(0.12)
|
$(0.53)
|
$(0.52)
|
$(0.08)
|
| Net
asset value, end of period (x) |
$15.84
|
$12.84
|
$12.01
|
$13.57
|
$14.27
|
| Total
return (%) (r)(s)(t)(x) |
24.32
|
7.84
|
(7.47)
|
(1.49)
|
27.08
|
Ratios
(%) (to average net assets)
and Supplemental data: |
| Expenses
before expense reductions (f) |
2.18
|
3.14
|
3.70
|
3.64
|
4.06
|
| Expenses
after expense reductions (f) |
1.59
|
1.99
|
1.99
|
1.99
|
1.99
|
| Net
investment income (loss) |
1.11
|
1.25
|
1.32
|
0.70
|
0.88
|
| Portfolio
turnover |
60
|
63
|
64
|
58
|
92
|
| Net
assets at end of period (000 omitted) |
$88
|
$71
|
$66
|
$71
|
$72
|
See Notes to Financial
Statements
Financial
Highlights – continued
| Class
R2 |
Year
ended |
| |
8/31/21
|
8/31/20
|
8/31/19
|
8/31/18
|
8/31/17
|
| Net
asset value, beginning of period |
$12.95
|
$12.11
|
$13.66
|
$14.36
|
$11.35
|
| Income
(loss) from investment operations |
| Net
investment income (loss) (d) |
$0.18
|
$0.21
|
$0.23
|
$0.18
|
$0.17
|
| Net
realized and unrealized gain (loss) |
2.97
|
0.81
|
(1.20)
|
(0.30)
|
2.94
|
| Total
from investment operations |
$3.15
|
$1.02
|
$(0.97)
|
$(0.12)
|
$3.11
|
| Less
distributions declared to shareholders |
| From
net investment income |
$(0.17)
|
$(0.18)
|
$(0.21)
|
$(0.11)
|
$(0.02)
|
| From
net realized gain |
—
|
—
|
(0.37)
|
(0.47)
|
(0.08)
|
| Total
distributions declared to shareholders |
$(0.17)
|
$(0.18)
|
$(0.58)
|
$(0.58)
|
$(0.10)
|
| Net
asset value, end of period (x) |
$15.93
|
$12.95
|
$12.11
|
$13.66
|
$14.36
|
| Total
return (%) (r)(s)(t)(x) |
24.47
|
8.35
|
(6.97)
|
(1.03)
|
27.71
|
Ratios
(%) (to average net assets)
and Supplemental data: |
| Expenses
before expense reductions (f) |
2.08
|
2.64
|
3.20
|
3.14
|
3.56
|
| Expenses
after expense reductions (f) |
1.49
|
1.49
|
1.49
|
1.49
|
1.49
|
| Net
investment income (loss) |
1.21
|
1.75
|
1.82
|
1.20
|
1.38
|
| Portfolio
turnover |
60
|
63
|
64
|
58
|
92
|
| Net
assets at end of period (000 omitted) |
$90
|
$73
|
$67
|
$72
|
$73
|
| Class
R3 |
Year
ended |
| |
8/31/21
|
8/31/20
|
8/31/19
|
8/31/18
|
8/31/17
|
| Net
asset value, beginning of period |
$12.98
|
$12.14
|
$13.69
|
$14.39
|
$11.37
|
| Income
(loss) from investment operations |
| Net
investment income (loss) (d) |
$0.23
|
$0.21
|
$0.24
|
$0.24
|
$0.20
|
| Net
realized and unrealized gain (loss) |
2.97
|
0.83
|
(1.19)
|
(0.32)
|
2.95
|
| Total
from investment operations |
$3.20
|
$1.04
|
$(0.95)
|
$(0.08)
|
$3.15
|
| Less
distributions declared to shareholders |
| From
net investment income |
$(0.20)
|
$(0.20)
|
$(0.23)
|
$(0.15)
|
$(0.05)
|
| From
net realized gain |
—
|
—
|
(0.37)
|
(0.47)
|
(0.08)
|
| Total
distributions declared to shareholders |
$(0.20)
|
$(0.20)
|
$(0.60)
|
$(0.62)
|
$(0.13)
|
| Net
asset value, end of period (x) |
$15.98
|
$12.98
|
$12.14
|
$13.69
|
$14.39
|
| Total
return (%) (r)(s)(t)(x) |
24.80
|
8.52
|
(6.75)
|
(0.80)
|
28.05
|
Ratios
(%) (to average net assets)
and Supplemental data: |
| Expenses
before expense reductions (f) |
1.82
|
2.43
|
2.95
|
2.94
|
3.31
|
| Expenses
after expense reductions (f) |
1.24
|
1.24
|
1.24
|
1.24
|
1.24
|
| Net
investment income (loss) |
1.50
|
1.71
|
1.89
|
1.66
|
1.63
|
| Portfolio
turnover |
60
|
63
|
64
|
58
|
92
|
| Net
assets at end of period (000 omitted) |
$107
|
$81
|
$71
|
$102
|
$73
|
See Notes to Financial
Statements
Financial
Highlights – continued
| Class
R4 |
Year
ended |
| |
8/31/21
|
8/31/20
|
8/31/19
|
8/31/18
|
8/31/17
|
| Net
asset value, beginning of period |
$13.02
|
$12.17
|
$13.72
|
$14.41
|
$11.38
|
| Income
(loss) from investment operations |
| Net
investment income (loss) (d) |
$0.26
|
$0.28
|
$0.30
|
$0.26
|
$0.23
|
| Net
realized and unrealized gain (loss) |
2.98
|
0.81
|
(1.23)
|
(0.30)
|
2.96
|
| Total
from investment operations |
$3.24
|
$1.09
|
$(0.93)
|
$(0.04)
|
$3.19
|
| Less
distributions declared to shareholders |
| From
net investment income |
$(0.23)
|
$(0.24)
|
$(0.25)
|
$(0.18)
|
$(0.08)
|
| From
net realized gain |
—
|
—
|
(0.37)
|
(0.47)
|
(0.08)
|
| Total
distributions declared to shareholders |
$(0.23)
|
$(0.24)
|
$(0.62)
|
$(0.65)
|
$(0.16)
|
| Net
asset value, end of period (x) |
$16.03
|
$13.02
|
$12.17
|
$13.72
|
$14.41
|
| Total
return (%) (r)(s)(t)(x) |
25.10
|
8.90
|
(6.55)
|
(0.50)
|
28.42
|
Ratios
(%) (to average net assets)
and Supplemental data: |
| Expenses
before expense reductions (f) |
1.58
|
2.14
|
2.70
|
2.66
|
3.06
|
| Expenses
after expense reductions (f) |
0.99
|
0.99
|
0.99
|
0.99
|
0.99
|
| Net
investment income (loss) |
1.70
|
2.25
|
2.36
|
1.76
|
1.89
|
| Portfolio
turnover |
60
|
63
|
64
|
58
|
92
|
| Net
assets at end of period (000 omitted) |
$118
|
$97
|
$85
|
$82
|
$74
|
| Class
R6 |
Year
ended |
| |
8/31/21
|
8/31/20
|
8/31/19
|
8/31/18
|
8/31/17
|
| Net
asset value, beginning of period |
$13.03
|
$12.19
|
$13.73
|
$14.42
|
$11.39
|
| Income
(loss) from investment operations |
| Net
investment income (loss) (d) |
$0.27
|
$0.29
|
$0.31
|
$0.27
|
$0.24
|
| Net
realized and unrealized gain (loss) |
2.98
|
0.81
|
(1.22)
|
(0.30)
|
2.95
|
| Total
from investment operations |
$3.25
|
$1.10
|
$(0.91)
|
$(0.03)
|
$3.19
|
| Less
distributions declared to shareholders |
| From
net investment income |
$(0.24)
|
$(0.26)
|
$(0.26)
|
$(0.19)
|
$(0.08)
|
| From
net realized gain |
—
|
—
|
(0.37)
|
(0.47)
|
(0.08)
|
| Total
distributions declared to shareholders |
$(0.24)
|
$(0.26)
|
$(0.63)
|
$(0.66)
|
$(0.16)
|
| Net
asset value, end of period (x) |
$16.04
|
$13.03
|
$12.19
|
$13.73
|
$14.42
|
| Total
return (%) (r)(s)(t)(x) |
25.17
|
8.91
|
(6.40)
|
(0.42)
|
28.45
|
Ratios
(%) (to average net assets)
and Supplemental data: |
| Expenses
before expense reductions (f) |
1.51
|
2.05
|
2.58
|
2.56
|
2.98
|
| Expenses
after expense reductions (f) |
0.93
|
0.92
|
0.87
|
0.90
|
0.91
|
| Net
investment income (loss) |
1.79
|
2.36
|
2.44
|
1.81
|
1.97
|
| Portfolio
turnover |
60
|
63
|
64
|
58
|
92
|
| Net
assets at end of period (000 omitted) |
$17,855
|
$14,422
|
$12,590
|
$13,322
|
$12,127
|
See Notes to Financial Statements
Financial
Highlights – continued
| (d)
|
Per share data
is based on average shares outstanding. |
| (f)
|
Ratios do
not reflect reductions from fees paid indirectly, if applicable. |
| (r)
|
Certain
expenses have been reduced without which performance would have been lower. |
| (s)
|
From time to
time the fund may receive proceeds from litigation settlements, without which performance would be lower. |
| (t)
|
Total
returns do not include any applicable sales charges. |
| (w)
|
Per share
amount was less than $0.01. |
| (x)
|
The
net asset values and total returns have been calculated on net assets which include adjustments made in accordance with U.S. generally accepted accounting principles required at period end for financial reporting purposes. |
See Notes to Financial Statements
Notes to Financial
Statements
(1) Business and Organization
MFS Blended Research Emerging Markets Equity Fund (the fund) is
a diversified series of MFS Series Trust IV (the trust). The trust is organized as a Massachusetts business trust and is registered under the Investment Company Act of 1940, as amended, as an open-end management investment company.
The fund is an investment company and accordingly follows the
investment company accounting and reporting guidance of the Financial Accounting Standards Board (FASB) Accounting Standards Codification Topic 946 Financial Services - Investment Companies.
(2) Significant Accounting Policies
General — The preparation
of financial statements in conformity with U.S. generally accepted accounting principles requires management to make estimates and assumptions that affect the reported amounts of assets and liabilities, and disclosure of contingent assets and
liabilities at the date of the financial statements and the reported amounts of increases and decreases in net assets from operations during the reporting period. Actual results could differ from those estimates. In the preparation of these
financial statements, management has evaluated subsequent events occurring after the date of the fund’s Statement of Assets and Liabilities through the date that the financial statements were issued.
The fund invests in foreign securities, including securities of emerging market issuers. Investments in foreign securities are vulnerable to the effects of changes in the relative values of the local currency and the U.S. dollar and to the effects
of changes in each country’s market, economic, industrial, political, regulatory, geopolitical, environmental, public health, and other conditions. Investments in emerging markets can involve additional and greater risks than the risks
associated with investments in developed foreign markets. Emerging markets can have less developed markets, greater custody and operational risk, less developed legal, regulatory, accounting, and auditing systems, and greater political, social, and
economic instability than developed markets.
Certain of the fund's investments, including its investments in
derivatives, as well as any debt issued by the fund and other contractual arrangements of the fund may be based on reference interest rates such as the London Interbank Offered Rate (“LIBOR”). In 2017, the regulatory authority that
oversees financial services firms in the United Kingdom announced plans to transition away from LIBOR by the end of 2021. In March 2021, the administrator of LIBOR announced the extension of the publication of the more commonly used U.S. dollar
LIBOR settings to the end of June 2023. Although the full impacts of the transition away from LIBOR are not fully known, the transition may result in, among other things, an increase in volatility or illiquidity of the markets for instruments that
currently rely on LIBOR to determine interest rates and this could have an adverse impact on the fund's performance. With respect to the fund's accounting for investments, including its investments in derivatives, as well as any debt issued by the
fund and other contractual arrangements of the fund that undergo reference rate-related modifications as a result of the transition, management will rely upon the relief provided by FASB Codification Topic 848 – Reference Rate Reform (Topic
848). The guidance in Topic 848 permits the fund to disregard the GAAP accounting requirements around certain contract modifications resulting from the LIBOR transition such that for contracts considered in scope, the fund can account for those
modified contracts as a continuation of the existing contracts.
Notes to Financial
Statements - continued
Balance Sheet Offsetting
— The fund's accounting policy with respect to balance sheet offsetting is that, absent an event of default by the counterparty or a termination of the agreement, the International Swaps and Derivatives Association (ISDA) Master Agreement, or
similar agreement, does not result in an offset of reported amounts of financial assets and financial liabilities in the Statement of Assets and Liabilities across transactions between the fund and the applicable counterparty. The fund's right to
setoff may be restricted or prohibited by the bankruptcy or insolvency laws of the particular jurisdiction to which a specific master netting agreement counterparty is subject. Balance sheet offsetting disclosures, to the extent applicable to the
fund, have been included in the fund’s Significant Accounting Policies note under the captions for each of the fund’s in-scope financial instruments and transactions.
Investment Valuations
— Equity securities, including restricted equity securities, are generally valued at the last sale or official closing price on their primary market or exchange as provided by a third-party pricing
service. Equity securities, for which there were no sales reported that day, are generally valued at the last quoted daily bid quotation on their primary market or exchange as provided by a third-party pricing service. Short-term instruments with a maturity at issuance of 60 days or less may be valued at amortized cost, which approximates market value. Open-end investment companies are
generally valued at net asset value per share. Securities and other assets generally valued on the basis of information from a third-party pricing service may also be valued at a broker/dealer bid
quotation. In determining values, third-party pricing services can utilize both transaction data and market information such as yield, quality, coupon rate, maturity, type of issue, trading characteristics,
and other market data. The values of foreign securities and other assets and liabilities expressed in foreign currencies are converted to U.S. dollars using the mean of bid and asked prices for rates provided
by a third-party pricing service.
The Board of
Trustees has delegated primary responsibility for determining or causing to be determined the value of the fund’s investments (including any fair valuation) to the adviser pursuant to valuation policies and procedures approved by the Board. If
the adviser determines that reliable market quotations are not readily available, investments are valued at fair value as determined in good faith by the adviser in accordance with such procedures under the oversight of the Board of Trustees. Under
the fund’s valuation policies and procedures, market quotations are not considered to be readily available for most types of debt instruments and floating rate loans and many types of derivatives. These investments are generally valued at fair
value based on information from third-party pricing services. In addition, investments may be valued at fair value if the adviser determines that an investment’s value has been materially affected by events occurring after the close of the
exchange or market on which the investment is principally traded (such as foreign exchange or market) and prior to the determination of the fund’s net asset value, or after the halt of trading of a specific security where trading does not
resume prior to the close of the exchange or market on which the security is principally traded. Events that occur after foreign markets close (such as developments in foreign markets and significant movements in the U.S. markets) and prior to the
determination of the fund’s net asset value may be deemed to have a material effect on the value of securities traded in foreign markets. Accordingly, the fund’s foreign equity securities may often be valued at fair value. The adviser
generally relies on third-party pricing services or other information (such as the correlation with price movements of similar securities in the same or other markets; the type, cost and investment characteristics of the security; the business and
financial condition of the
Notes to Financial
Statements - continued
issuer; and trading and other market data) to assist in determining whether to
fair value and at what value to fair value an investment. The value of an investment for purposes of calculating the fund’s net asset value can differ depending on the source and method used to determine value. When fair valuation is used, the
value of an investment used to determine the fund’s net asset value may differ from quoted or published prices for the same investment. There can be no assurance that the fund could obtain the fair value assigned to an investment if it were to
sell the investment at the same time at which the fund determines its net asset value per share.
Various inputs are used in determining the value of the fund's
assets or liabilities. These inputs are categorized into three broad levels. In certain cases, the inputs used to measure fair value may fall into different levels of the fair value hierarchy. In such cases, an investment's level within the fair
value hierarchy is based on the lowest level of input that is significant to the fair value measurement. The fund's assessment of the significance of a particular input to the fair value measurement in its entirety requires judgment, and considers
factors specific to the investment. Level 1 includes unadjusted quoted prices in active markets for identical assets or liabilities. Level 2 includes other significant observable market-based inputs (including quoted prices for similar securities,
interest rates, prepayment speed, and credit risk). Level 3 includes unobservable inputs, which may include the adviser's own assumptions in determining the fair value of investments. The following is a summary of the levels used as of August 31,
2021 in valuing the fund's assets or liabilities:
| Financial
Instruments |
Level
1 |
Level
2 |
Level
3 |
Total
|
| Equity
Securities: |
|
|
|
|
| China
|
$19,826,979
|
$—
|
$—
|
$19,826,979
|
| South
Korea |
8,819,551
|
—
|
—
|
8,819,551
|
| Taiwan
|
8,677,386
|
—
|
—
|
8,677,386
|
| India
|
6,387,526
|
—
|
—
|
6,387,526
|
| Brazil
|
3,307,889
|
—
|
—
|
3,307,889
|
| Russia
|
2,517,001
|
186,885
|
—
|
2,703,886
|
| South
Africa |
2,135,561
|
—
|
—
|
2,135,561
|
| Mexico
|
1,575,380
|
—
|
—
|
1,575,380
|
| Thailand
|
—
|
1,281,561
|
—
|
1,281,561
|
| Other
Countries |
4,742,715
|
—
|
—
|
4,742,715
|
| Mutual
Funds |
1,073,195
|
—
|
—
|
1,073,195
|
| Total
|
$59,063,183
|
$1,468,446
|
$—
|
$60,531,629
|
For further information regarding
security characteristics, see the Portfolio of Investments.
Foreign Currency Translation
— Purchases and sales of foreign investments, income, and expenses are converted into U.S. dollars based upon currency exchange rates prevailing on the respective dates of such transactions or on the reporting date for foreign denominated
receivables and payables. Gains and losses attributable to foreign currency exchange rates on sales of securities are recorded for financial statement purposes as net realized gains and losses on investments. Gains and losses attributable to foreign
exchange rate movements on receivables, payables, income and expenses
Notes to Financial
Statements - continued
are recorded for financial statement purposes as foreign currency transaction
gains and losses. That portion of both realized and unrealized gains and losses on investments that results from fluctuations in foreign currency exchange rates is not separately disclosed.
Indemnifications — Under
the fund's organizational documents, its officers and Trustees may be indemnified against certain liabilities and expenses arising out of the performance of their duties to the fund. Additionally, in the normal course of business, the fund enters
into agreements with service providers that may contain indemnification clauses. The fund's maximum exposure under these agreements is unknown as this would involve future claims that may be made against the fund that have not yet
occurred.
Investment Transactions and Income — Investment transactions are recorded on the trade date. Dividends received in cash are recorded on the ex-dividend date. Certain dividends from foreign securities will be
recorded when the fund is informed of the dividend if such information is obtained subsequent to the ex-dividend date. Dividend payments received in additional securities are recorded on the ex-dividend date in an amount equal to the value of the
security on such date.
The fund may receive
proceeds from litigation settlements. Any proceeds received from litigation involving portfolio holdings are reflected in the Statement of Operations in realized gain/loss if the security has been disposed of by the fund or in unrealized gain/loss
if the security is still held by the fund. Any other proceeds from litigation not related to portfolio holdings are reflected as other income in the Statement of Operations.
Tax Matters and Distributions
— The fund intends to qualify as a regulated investment company, as defined under Subchapter M of the Internal Revenue Code, and to distribute all of its taxable income, including realized capital gains. As a result, no provision for federal
income tax is required. The fund’s federal tax returns, when filed, will remain subject to examination by the Internal Revenue Service for a three year period. Management has analyzed the fund’s tax positions taken on federal and state
tax returns for all open tax years and does not believe that there are any uncertain tax positions that require recognition of a tax liability. Foreign taxes, if any, have been accrued by the fund in the accompanying financial statements in
accordance with the applicable foreign tax law. Foreign income taxes may be withheld by certain countries in which the fund invests. Additionally, capital gains realized by the fund on securities issued in or by certain foreign countries may be
subject to capital gains tax imposed by those countries.
Distributions to shareholders are recorded on the ex-dividend
date. Income and capital gain distributions are determined in accordance with income tax regulations, which may differ from U.S. generally accepted accounting principles. Certain capital accounts in the financial statements are periodically adjusted
for permanent differences in order to reflect their tax character. These adjustments have no impact on net assets or net asset value per share. Temporary differences which arise from recognizing certain items of income, expense, gain or loss in
different periods for financial statement and tax purposes will reverse at some time in the future.
Book/tax differences primarily relate to passive foreign
investment companies and wash sale loss deferrals.
Notes to Financial
Statements - continued
The tax character of distributions declared to shareholders for
the last two fiscal years is as follows:
| |
Year
ended
8/31/21 |
Year
ended
8/31/20 |
| Ordinary
income (including any short-term capital gains) |
$745,103
|
$465,097
|
The federal tax cost and the tax
basis components of distributable earnings were as follows:
| As
of 8/31/21 |
|
| Cost
of investments |
$48,200,798
|
| Gross
appreciation |
13,713,026
|
| Gross
depreciation |
(1,382,195)
|
| Net
unrealized appreciation (depreciation) |
$12,330,831
|
| Undistributed
ordinary income |
920,995
|
| Undistributed
long-term capital gain |
147,935
|
| Other
temporary differences |
(8,142)
|
| Total
distributable earnings (loss) |
$13,391,619
|
Multiple Classes of Shares of
Beneficial Interest — The fund offers multiple classes of shares, which differ in their respective distribution and service fees. The fund's income, realized and unrealized gain (loss), and common expenses are
allocated to shareholders based on the daily net assets of each class. Dividends are declared separately for each class. Differences in per share dividend rates are generally due to differences in separate class expenses. Class B and Class C shares
will convert to Class A shares approximately eight years after purchase. The fund’s distributions declared to shareholders as reported in the Statements of Changes in Net Assets are presented by class as follows:
| |
Year
ended
8/31/21 |
|
Year
ended
8/31/20 |
| Class
A |
$88,077
|
|
$83,064
|
| Class
B |
2,417
|
|
3,860
|
| Class
C |
2,784
|
|
3,499
|
| Class
I |
385,053
|
|
103,204
|
| Class
R1 |
607
|
|
633
|
| Class
R2 |
956
|
|
982
|
| Class
R3 |
1,232
|
|
1,187
|
| Class
R4 |
1,721
|
|
1,710
|
| Class
R6 |
262,256
|
|
266,958
|
| Total
|
$745,103
|
|
$465,097
|
Notes to Financial
Statements - continued
(3) Transactions with Affiliates
Investment Adviser — The
fund has an investment advisory agreement with MFS to provide overall investment management and related administrative services and facilities to the fund. The management fee is computed daily and paid
monthly at the following annual rates based on the fund's average daily net assets:
| Up
to $1 billion |
0.75%
|
| In
excess of $1 billion and up to $2.5 billion |
0.70%
|
| In
excess of $2.5 billion |
0.675%
|
MFS has agreed in writing to reduce
its management fee by a specified amount if certain MFS mutual fund assets exceed thresholds agreed to by MFS and the fund's Board of Trustees. For the year ended August 31, 2021, this management fee reduction amounted to $6,255, which is included
in the reduction of total expenses in the Statement of Operations. The management fee incurred for the year ended August 31, 2021 was equivalent to an annual effective rate of 0.74% of the fund's average daily net assets.
The investment adviser has agreed in writing to pay a portion
of the fund’s total annual operating expenses, excluding interest, taxes, extraordinary expenses, brokerage and transaction costs, and investment-related expenses, such that total fund operating expenses do not exceed the following rates
annually of each class’s average daily net assets:
| Classes
|
| A
|
B
|
C
|
I
|
R1
|
R2
|
R3
|
R4
|
R6
|
| 1.24%
|
1.99%
|
1.99%
|
0.99%
|
1.99%
|
1.49%
|
1.24%
|
0.99%
|
0.95%
|
This written agreement will continue
until modified by the fund’s Board of Trustees, but such agreement will continue at least until December 31, 2022. For the year ended August 31, 2021, this reduction amounted to $298,327, which is included in the reduction of total expenses in
the Statement of Operations.
Distributor — MFS Fund Distributors, Inc. (MFD), a wholly-owned subsidiary of MFS, as distributor, received $2,890 for the year ended August 31, 2021, as its portion of the initial sales charge on sales of Class A shares of
the fund.
The Board of Trustees has adopted a
distribution plan for certain share classes pursuant to Rule 12b-1 of the Investment Company Act of 1940.
The fund's distribution plan provides that the fund will pay
MFD for services provided by MFD and financial intermediaries in connection with the distribution and servicing of certain share classes. One component of the plan is a distribution fee paid to MFD and another component of the plan is a service fee
paid to MFD. MFD may subsequently pay all, or a portion, of the distribution and/or service fees to financial intermediaries.
Notes to Financial
Statements - continued
Distribution Plan Fee Table:
| |
Distribution
Fee Rate (d) |
Service
Fee Rate (d) |
Total
Distribution
Plan (d) |
Annual
Effective
Rate (e) |
Distribution
and Service
Fee |
| Class
A |
—
|
0.25%
|
0.25%
|
0.25%
|
$
18,073 |
| Class
B |
0.75%
|
0.25%
|
1.00%
|
1.00%
|
3,795
|
| Class
C |
0.75%
|
0.25%
|
1.00%
|
1.00%
|
4,281
|
| Class
R1 |
0.75%
|
0.25%
|
1.00%
|
0.60%
|
500
|
| Class
R2 |
0.25%
|
0.25%
|
0.50%
|
0.50%
|
428
|
| Class
R3 |
—
|
0.25%
|
0.25%
|
0.25%
|
252
|
| Total
Distribution and Service Fees |
|
|
|
|
$27,329
|
| (d)
|
In
accordance with the distribution plan for certain classes, the fund pays distribution and/or service fees equal to these annual percentage rates of each class’s average daily net assets. The distribution and service fee rates disclosed by
class represent the current rates in effect at the end of the reporting period. Any rate changes, if applicable, are detailed below. |
| (e)
|
The
annual effective rates represent actual fees incurred under the distribution plan for the year ended August 31, 2021 based on each class's average daily net assets. MFD has voluntarily agreed to rebate a portion of each class's 0.25% service fee
attributable to accounts for which there is no financial intermediary specified on the account except for accounts attributable to MFS or its affiliates' seed money. There were no service fee rebates for the year ended August 31, 2021. For the
period from March 1, 2021 through August 31, 2021, the 0.75% distribution fee was not imposed for Class R1 shares due to the sales charge limitations contained in Financial Industry Regulatory Authority (“FINRA”) Rule 2341.
|
Certain Class A shares are subject to
a contingent deferred sales charge (CDSC) in the event of a shareholder redemption within 18 months of purchase. Class B shares are subject to a CDSC in the event of a shareholder redemption within six years of purchase. Class C shares are subject
to a CDSC in the event of a shareholder redemption within 12 months of purchase. All contingent deferred sales charges are paid to MFD and during the year ended August 31, 2021, were as follows:
| |
Amount
|
| Class
A |
$—
|
| Class
B |
160
|
| Class
C |
13
|
Shareholder Servicing Agent — MFS Service Center, Inc. (MFSC), a wholly-owned subsidiary of MFS, receives a fee from the fund for its services as shareholder servicing agent calculated as a percentage of the average daily net assets of the
fund as determined periodically under the supervision of the fund's Board of Trustees. For the year ended August 31, 2021, the fee was $4,844, which equated to 0.0092% annually of the fund's average daily net assets. MFSC also receives reimbursement
from the fund for out-of-pocket expenses, sub-accounting and other shareholder servicing costs which may be paid to affiliated and unaffiliated service providers. Class R6 shares do not incur sub-accounting fees. For the year ended August 31, 2021,
these out-of-pocket expenses, sub-accounting and other shareholder servicing costs amounted to $26,398.
Notes to Financial
Statements - continued
Administrator — MFS
provides certain financial, legal, shareholder communications, compliance, and other administrative services to the fund. Under an administrative services agreement, the fund reimburses MFS the costs incurred to provide these services. The fund is
charged an annual fixed amount of $17,500 plus a fee based on average daily net assets. The administrative services fee incurred for the year ended August 31, 2021 was equivalent to an annual effective rate of 0.0344% of the fund's average daily net
assets.
Trustees’ and Officers’
Compensation — The fund pays compensation to independent Trustees in the form of a retainer, attendance fees, and additional compensation to Board and Committee chairpersons. The fund does not pay compensation
directly to Trustees or officers of the fund who are also officers of the investment adviser, all of whom receive remuneration from MFS for their services to the fund. Certain officers and Trustees of the fund are officers or directors of MFS, MFD,
and MFSC.
Other
— The fund invests in the MFS Institutional Money Market Portfolio which is managed by MFS and seeks current income consistent with preservation of capital and liquidity. This money market fund does not pay a
management fee to MFS but does incur investment and operating costs.
At August 31, 2021, MFS held approximately 86% and 79% of the
outstanding shares of Class R3 and Class R4, respectively, and 100% of the outstanding shares of Class R1 and Class R2.
The fund is permitted to engage in purchase and sale
transactions with funds and accounts for which MFS serves as investment adviser or sub-adviser (“cross-trades”) pursuant to a policy adopted by the Board of Trustees. This policy has been designed to ensure that cross-trades conducted by
the fund comply with Rule 17a-7 under the Investment Company Act of 1940. During the year ended August 31, 2021, the fund engaged in purchase transactions pursuant to this policy, which amounted to $4,159.
The adviser has voluntarily undertaken to reimburse the fund
from its own resources on a quarterly basis for the cost of investment research embedded in the cost of the fund’s securities trades. This agreement may be rescinded at any time. For the year ended August 31, 2021, this reimbursement amounted
to $9,807, which is included in “Other” income in the Statement of Operations.
(4) Portfolio Securities
For the year ended August 31, 2021, purchases and sales of
investments, other than short-term obligations, aggregated $38,701,164 and $31,048,675, respectively.
Notes to Financial
Statements - continued
(5) Shares of Beneficial Interest
The fund's Declaration of Trust permits the Trustees to issue
an unlimited number of full and fractional shares of beneficial interest. Transactions in fund shares were as follows:
| |
Year
ended
8/31/21 |
|
Year
ended
8/31/20 |
| |
Shares
|
Amount
|
|
Shares
|
Amount
|
| Shares
sold |
|
|
|
|
|
| Class
A |
167,267
|
$2,624,827
|
|
158,992
|
$1,991,029
|
| Class
B |
2,607
|
38,224
|
|
—
|
—
|
| Class
C |
9,428
|
143,250
|
|
12,555
|
155,137
|
| Class
I |
595,289
|
9,324,069
|
|
1,547,126
|
17,809,134
|
| Class
R3 |
824
|
12,657
|
|
10,400
|
136,453
|
| Class
R4 |
456
|
6,965
|
|
448
|
5,544
|
| Class
R6 |
271,938
|
4,110,557
|
|
419,437
|
5,112,047
|
| |
1,047,809
|
$16,260,549
|
|
2,148,958
|
$25,209,344
|
Shares
issued to shareholders
in reinvestment of distributions |
|
|
|
|
|
| Class
A |
6,019
|
$86,377
|
|
6,053
|
$81,347
|
| Class
B |
170
|
2,417
|
|
289
|
3,860
|
| Class
C |
196
|
2,784
|
|
262
|
3,499
|
| Class
I |
25,673
|
368,920
|
|
6,268
|
84,301
|
| Class
R1 |
43
|
607
|
|
47
|
633
|
| Class
R2 |
67
|
956
|
|
73
|
982
|
| Class
R3 |
86
|
1,232
|
|
88
|
1,187
|
| Class
R4 |
120
|
1,721
|
|
127
|
1,710
|
| Class
R6 |
18,212
|
262,256
|
|
19,804
|
266,958
|
| |
50,586
|
$727,270
|
|
33,011
|
$444,477
|
| Shares
reacquired |
|
|
|
|
|
| Class
A |
(119,894)
|
$(1,843,788)
|
|
(152,238)
|
$(1,808,610)
|
| Class
B |
(1,506)
|
(22,336)
|
|
(8,568)
|
(106,675)
|
| Class
C |
(10,417)
|
(158,661)
|
|
(21,085)
|
(257,158)
|
| Class
I |
(179,247)
|
(2,717,344)
|
|
(65,957)
|
(745,548)
|
| Class
R3 |
(470)
|
(7,190)
|
|
(10,071)
|
(129,033)
|
| Class
R4 |
(670)
|
(9,635)
|
|
(126)
|
(1,490)
|
| Class
R6 |
(283,927)
|
(4,243,253)
|
|
(365,637)
|
(4,494,636)
|
| |
(596,131)
|
$(9,002,207)
|
|
(623,682)
|
$(7,543,150)
|
Notes to Financial
Statements - continued
| |
Year
ended
8/31/21 |
|
Year
ended
8/31/20 |
| |
Shares
|
Amount
|
|
Shares
|
Amount
|
| Net
change |
|
|
|
|
|
| Class
A |
53,392
|
$867,416
|
|
12,807
|
$263,766
|
| Class
B |
1,271
|
18,305
|
|
(8,279)
|
(102,815)
|
| Class
C |
(793)
|
(12,627)
|
|
(8,268)
|
(98,522)
|
| Class
I |
441,715
|
6,975,645
|
|
1,487,437
|
17,147,887
|
| Class
R1 |
43
|
607
|
|
47
|
633
|
| Class
R2 |
67
|
956
|
|
73
|
982
|
| Class
R3 |
440
|
6,699
|
|
417
|
8,607
|
| Class
R4 |
(94)
|
(949)
|
|
449
|
5,764
|
| Class
R6 |
6,223
|
129,560
|
|
73,604
|
884,369
|
| |
502,264
|
$7,985,612
|
|
1,558,287
|
$18,110,671
|
Effective June 1, 2019, purchases of
the fund’s Class B shares are closed to new and existing investors subject to certain exceptions. Please see the fund’s prospectus for details.
The fund is one of several mutual funds in which certain MFS
funds may invest. The MFS funds do not invest in the underlying funds for the purpose of exercising management or control. At the end of the period, the MFS Lifetime 2040 Fund, the MFS Lifetime 2050 Fund, the MFS Lifetime 2045 Fund, the MFS Lifetime
2035 Fund, the MFS Lifetime 2055 Fund, and the MFS Lifetime 2060 Fund were the owners of record of approximately 7%, 6%, 6%, 3%, 3%, and 1%, respectively, of the value of outstanding voting shares of the fund.
(6) Line of Credit
The fund and certain other funds managed by MFS participate in
a $1.25 billion unsecured committed line of credit of which $1 billion is reserved for use by the fund and certain other MFS U.S. funds. The line of credit is provided by a syndicate of banks under a credit agreement. Borrowings may be made for
temporary financing needs. Interest is charged to each fund, based on its borrowings, generally at a rate equal to the highest of one month LIBOR, the Federal Funds Effective Rate and the Overnight Bank Funding Rate, plus an agreed upon spread. A
commitment fee, based on the average daily, unused portion of the committed line of credit, is allocated among the participating funds. In addition, the fund and other funds managed by MFS have established unsecured uncommitted borrowing
arrangements with certain banks for temporary financing needs. Interest is charged to each fund, based on its borrowings, at rates equal to customary reference rates plus an agreed upon spread. For the year ended August 31, 2021, the fund’s
commitment fee and interest expense were $208 and $0, respectively, and are included in “Miscellaneous” expense in the Statement of Operations.
Notes to Financial
Statements - continued
(7) Investments in Affiliated Issuers
An affiliated issuer may be considered one in which the fund
owns 5% or more of the outstanding voting securities, or a company which is under common control. For the purposes of this report, the following were affiliated issuers:
| Affiliated
Issuers |
Beginning
Value |
Purchases
|
Sales
Proceeds |
Realized
Gain
(Loss) |
Change
in
Unrealized
Appreciation or
Depreciation |
Ending
Value |
| MFS
Institutional Money Market Portfolio |
$538,721
|
$21,205,715
|
$20,671,241
|
$—
|
$—
|
$1,073,195
|
| Affiliated
Issuers |
Dividend
Income |
Capital
Gain
Distributions |
| MFS
Institutional Money Market Portfolio |
$389
|
$—
|
(8) Impacts of COVID-19
The pandemic related to the global spread of novel coronavirus
disease (COVID-19), which was first detected in December 2019, has resulted in significant disruptions to global business activity and the global economy, as well as the economies of individual countries, the financial performance of individual
companies and sectors, and the securities and commodities markets in general. Multiple surges in cases globally, the availability and widespread adoption of vaccines, and the emergence of variant strains of the virus continue to create uncertainty
as to the future and long-term impacts resulting from the pandemic including impacts to the prices and liquidity of the fund's investments and the fund's performance.
Report of Independent
Registered Public Accounting Firm
To the Shareholders of
MFS Blended Research Emerging Markets Equity Fund and the Board of Trustees of MFS Series Trust IV
Opinion on the Financial Statements
We have audited the accompanying statement of assets and
liabilities of MFS Blended Research Emerging Markets Equity Fund (the “Fund”) (one of the funds constituting MFS Series Trust IV (the “Trust”)), including the portfolio of investments, as of August 31, 2021, and the related
statement of operations for the year then ended, the statements of changes in net assets for each of the two years in the period then ended, the financial highlights for each of the five years in the period then ended and the related notes
(collectively referred to as the “financial statements”). In our opinion, the financial statements present fairly, in all material respects, the financial position of the Fund (one of the funds constituting MFS Series Trust IV) at August
31, 2021, the results of its operations for the year then ended, the changes in its net assets for each of the two years in the period then ended and its financial highlights for each of the five years in the period then ended, in conformity with
U.S. generally accepted accounting principles.
Basis for
Opinion
These financial statements are the responsibility
of the Trust’s management. Our responsibility is to express an opinion on the Fund’s financial statements based on our audits. We are a public accounting firm registered with the Public Company Accounting Oversight Board (United States)
(“PCAOB”) and are required to be independent with respect to the Trust in accordance with the U.S. federal securities laws and the applicable rules and regulations of the Securities and Exchange Commission and the PCAOB.
We conducted our audits in accordance with the standards of the
PCAOB. Those standards require that we plan and perform the audit to obtain reasonable assurance about whether the financial statements are free of material misstatement, whether due to error or fraud. The Trust is not required to have, nor were we
engaged to perform, an audit of the Trust’s internal control over financial reporting. As part of our audits we are required to obtain an understanding of internal control over financial reporting but not for the purpose of expressing an
opinion on the effectiveness of the Trust’s internal control over financial reporting. Accordingly, we express no such opinion.
Our audits included performing procedures to assess the risks
of material misstatement of the financial statements, whether due to error or fraud, and performing procedures that respond to those risks. Such procedures included examining, on a test basis, evidence regarding the amounts and disclosures in the
financial statements. Our procedures included confirmation of securities owned as of August 31, 2021, by
Report of Independent
Registered Public Accounting Firm – continued
correspondence with the custodian and others. Our audits also included
evaluating the accounting principles used and significant estimates made by management, as well as evaluating the overall presentation of the financial statements. We believe that our audits provide a reasonable basis for our opinion.
We have served as
the auditor of one or more MFS investment companies since 1993.
Boston, Massachusetts
October 15, 2021
Trustees and
Officers — Identification and Background
The Trustees and Officers of the Trust, as of October 1, 2021,
are listed below, together with their principal occupations during the past five years. (Their titles may have varied during that period.) The address of each Trustee and Officer is 111 Huntington Avenue, Boston, Massachusetts 02199-7618.
| Name,
Age |
|
Position(s)
Held with Fund |
|
Trustee/Officer
Since(h) |
|
Number
of MFS Funds overseen by the Trustee |
|
Principal
Occupations During
the Past Five Years |
|
Other
Directorships During
the Past Five Years (j) |
| INTERESTED
TRUSTEES |
|
|
Robert
J. Manning (k)
(age 57) |
|
Trustee
|
|
February
2004 |
|
136
|
|
Massachusetts
Financial Services Company, Non-Executive Chairman (since January 2021); Director; Chairman of the Board; Executive Chairman (January 2017-2020); Co-Chief Executive Officer (2015-2016) |
|
N/A
|
Michael
W. Roberge (k)
(age 55) |
|
Trustee
|
|
January
2021 |
|
136
|
|
Massachusetts
Financial Services Company, Chairman (since January 2021); Chief Executive Officer (since January 2017); Director; President (until December 2018); Chief Investment Officer (until December 2018); Co-Chief Executive Officer (until December 2016)
|
|
N/A
|
| INDEPENDENT
TRUSTEES |
|
|
John
P. Kavanaugh
(age 66) |
|
Trustee
and Chair of Trustees |
|
January
2009 |
|
136
|
|
Private
investor |
|
N/A
|
Steven
E. Buller
(age 70) |
|
Trustee
|
|
February
2014 |
|
136
|
|
Private
investor |
|
N/A
|
John
A. Caroselli
(age 67) |
|
Trustee
|
|
March
2017 |
|
136
|
|
Private
investor; JC Global Advisors, LLC (management consulting), President (since 2015) |
|
N/A
|
Maureen
R. Goldfarb
(age 66) |
|
Trustee
|
|
January
2009 |
|
136
|
|
Private
investor |
|
N/A
|
Peter
D. Jones
(age 66) |
|
Trustee
|
|
January
2019 |
|
136
|
|
Private
investor |
|
N/A
|
Trustees and Officers -
continued
| Name,
Age |
|
Position(s)
Held with Fund |
|
Trustee/Officer
Since(h) |
|
Number
of MFS Funds overseen by the Trustee |
|
Principal
Occupations During
the Past Five Years |
|
Other
Directorships During
the Past Five Years (j) |
James
W. Kilman, Jr.
(age 60) |
|
Trustee
|
|
January
2019 |
|
136
|
|
Burford
Capital Limited (finance and investment management), Senior Advisor (since May 3, 2021), Chief Financial Officer (2019 - May 2, 2021); KielStrand Capital LLC (family office), Chief Executive Officer (since 2016); Morgan Stanley & Co. (financial
services), Vice Chairman of Investment Banking, Co-Head of Diversified Financials Coverage – Financial Institutions Investment Banking Group (until 2016) |
|
Alpha-En
Corporation, Director (2016-2019) |
Clarence
Otis, Jr.
(age 65) |
|
Trustee
|
|
March
2017 |
|
136
|
|
Private
investor |
|
VF
Corporation, Director; Verizon Communications, Inc., Director; The Travelers Companies, Director |
Maryanne
L. Roepke
(age 65) |
|
Trustee
|
|
May
2014 |
|
136
|
|
Private
investor |
|
N/A
|
Laurie
J. Thomsen
(age 64) |
|
Trustee
|
|
March
2005 |
|
136
|
|
Private
investor |
|
The
Travelers Companies, Director; Dycom Industries, Inc., Director |
| Name,
Age |
|
Position(s)
Held with
Fund |
|
Trustee/Officer
Since(h) |
|
Number
of MFS Funds for which the Person is an Officer |
|
Principal
Occupations During
the Past Five Years |
| OFFICERS
|
|
|
|
|
|
|
|
|
Christopher
R. Bohane (k)
(age 47) |
|
Assistant
Secretary and Assistant Clerk |
|
July
2005 |
|
136
|
|
Massachusetts
Financial Services Company, Senior Vice President and Associate General Counsel |
Kino
Clark (k)
(age 53) |
|
Assistant
Treasurer |
|
January
2012 |
|
136
|
|
Massachusetts
Financial Services Company, Vice President |
Trustees and Officers -
continued
| Name,
Age |
|
Position(s)
Held with
Fund |
|
Trustee/Officer
Since(h) |
|
Number
of MFS Funds for which the Person is an Officer |
|
Principal
Occupations During
the Past Five Years |
John
W. Clark, Jr. (k)
(age 54) |
|
Assistant
Treasurer |
|
April
2017 |
|
136
|
|
Massachusetts
Financial Services Company, Vice President (since March 2017); Deutsche Bank (financial services), Department Head - Treasurer's Office (until February 2017) |
Thomas
H. Connors (k)
(age 62) |
|
Assistant
Secretary and Assistant Clerk |
|
September
2012 |
|
136
|
|
Massachusetts
Financial Services Company, Vice President and Senior Counsel |
David
L. DiLorenzo (k)
(age 53) |
|
President
|
|
July
2005 |
|
136
|
|
Massachusetts
Financial Services Company, Senior Vice President |
Heidi
W. Hardin (k)
(age 54) |
|
Secretary
and Clerk |
|
April
2017 |
|
136
|
|
Massachusetts
Financial Services Company, Executive Vice President and General Counsel (since March 2017); Harris Associates (investment management), General Counsel (until January 2017) |
Brian
E. Langenfeld (k)
(age 48) |
|
Assistant
Secretary and Assistant Clerk |
|
June
2006 |
|
136
|
|
Massachusetts
Financial Services Company, Vice President and Senior Counsel |
Amanda
S. Mooradian (k)
(age 42) |
|
Assistant
Secretary and Assistant Clerk |
|
September
2018 |
|
136
|
|
Massachusetts
Financial Services Company, Assistant Vice President and Senior Counsel |
Susan
A. Pereira (k)
(age 50) |
|
Assistant
Secretary and Assistant Clerk |
|
July
2005 |
|
136
|
|
Massachusetts
Financial Services Company, Vice President and Assistant General Counsel |
Kasey
L. Phillips (k)
(age 50) |
|
Assistant
Treasurer |
|
September
2012 |
|
136
|
|
Massachusetts
Financial Services Company, Vice President |
Matthew
A. Stowe (k)
(age 46) |
|
Assistant
Secretary and Assistant Clerk |
|
October
2014 |
|
136
|
|
Massachusetts
Financial Services Company, Vice President and Assistant General Counsel |
Martin
J. Wolin (k)
(age 54) |
|
Chief
Compliance Officer |
|
July
2015 |
|
136
|
|
Massachusetts
Financial Services Company, Senior Vice President and Chief Compliance Officer |
Trustees and Officers -
continued
| Name,
Age |
|
Position(s)
Held with
Fund |
|
Trustee/Officer
Since(h) |
|
Number
of MFS Funds for which the Person is an Officer |
|
Principal
Occupations During
the Past Five Years |
James
O. Yost (k)
(age 61) |
|
Treasurer
|
|
September
1990 |
|
136
|
|
Massachusetts
Financial Services Company, Senior Vice President |
| (h)
|
Date
first appointed to serve as Trustee/Officer of an MFS Fund. Each Trustee has served continuously since appointment unless indicated otherwise. For the period from December 15, 2004 until February 22, 2005, Mr. Manning served as Advisory Trustee.
From January 2012 through December 2016, Messrs. DiLorenzo and Yost served as Treasurer and Deputy Treasurer of the Funds, respectively. |
| (j)
|
Directorships
or trusteeships of companies required to report to the Securities and Exchange Commission (i.e., “public companies”). |
| (k)
|
“Interested
person” of the Trust within the meaning of the Investment Company Act of 1940 (referred to as the 1940 Act), which is the principal federal law governing investment companies like the fund, as a result of a position with MFS. The address of
MFS is 111 Huntington Avenue, Boston, Massachusetts 02199-7618. |
Each Trustee (other than Messrs. Jones, Kilman and Roberge) has
been elected by shareholders and each Trustee and Officer holds office until his or her successor is chosen and qualified or until his or her earlier death, resignation, retirement or removal. Mr. Roberge became a Trustee of the Funds on January 1,
2021 and Messrs. Jones and Kilman became Trustees of the Funds on January 1, 2019. The Trust does not hold annual meetings for the purpose of electing Trustees, and Trustees are not elected for fixed terms. Under the terms of the Board's retirement
policy, an Independent Trustee shall retire at the end of the calendar year in which he or she reaches the earlier of 75 years of age or 15 years of service on the Board (or, in the case of any Independent Trustee who joined the Board prior to 2015,
20 years of service on the Board).
Messrs. Buller, Kilman
and Otis and Ms. Roepke are members of the Trust’s Audit Committee.
Each of the Interested Trustees and certain Officers hold
comparable officer positions with certain affiliates of MFS.
Trustees and Officers -
continued
The Statement of Additional Information for a Fund includes
further information about the Trustees and is available without charge upon request by calling 1-800-225-2606.
| Investment
Adviser |
Custodian
|
Massachusetts
Financial Services Company
111 Huntington Avenue
Boston, MA 02199-7618 |
State
Street Bank and Trust Company
1 Lincoln Street
Boston, MA 02111-2900 |
| Distributor
|
Independent
Registered Public Accounting Firm |
MFS Fund
Distributors, Inc.
111 Huntington Avenue
Boston, MA 02199-7618 |
Ernst &
Young LLP
200 Clarendon Street
Boston, MA 02116 |
| Portfolio
Manager(s) |
|
Jim
Fallon
Matt Krummell
Jonathan Sage
Jed Stocks |
|
Board Review of Investment
Advisory Agreement
MFS Blended Research Emerging Markets
Equity Fund
The Investment Company Act of 1940 requires
that both the full Board of Trustees and a majority of the non-interested (“independent”) Trustees, voting separately, annually approve the continuation of the Fund’s investment advisory agreement with MFS. The Trustees consider
matters bearing on the Fund and its advisory arrangements at their meetings throughout the year, including a review of performance data at each regular meeting. In addition, the independent Trustees met several times by videoconference (in
accordance with Securities and Exchange Commission relief) over the course of three months beginning in May and ending in July, 2021 (“contract review meetings”) for the specific purpose of considering whether to approve the continuation
of the investment advisory agreement for the Fund and the other investment companies that the Board oversees (the “MFS Funds”). The independent Trustees were assisted in their evaluation of the Fund’s investment advisory agreement
by independent legal counsel, from whom they received separate legal advice and with whom they met separately from MFS during various contract review meetings. The independent Trustees were also assisted in this process by an independent consultant
who was retained by and reported to the independent Trustees.
In connection with their deliberations regarding the
continuation of the investment advisory agreement, the Trustees, including the independent Trustees, considered such information and factors as they believed, in light of the legal advice furnished to them and their own business judgment, to be
relevant. The investment advisory agreement for the Fund was considered separately, although the Trustees also took into account the common interests of all MFS Funds in their review. As described below, the Trustees considered the nature, quality,
and extent of the various investment advisory, administrative, and shareholder services performed by MFS under the existing investment advisory agreement and other arrangements with the Fund.
In connection with their contract review meetings, the Trustees
received and relied upon materials that included, among other items: (i) information provided by Broadridge Financial Solutions, Inc. (“Broadridge”), an independent third party, on the investment performance of the Fund for various time
periods ended December 31, 2020 and the investment performance of a group of funds with substantially similar investment classifications/objectives (the “Broadridge performance universe”), (ii) information provided by Broadridge on the
Fund’s advisory fees and other expenses and the advisory fees and other expenses of comparable funds identified by Broadridge as well as all other funds in the same investment classification/category (the “Broadridge expense group and
universe”), (iii) information provided by MFS on the advisory fees of portfolios of other clients of MFS, including institutional separate accounts and other clients, (iv) information as to whether and to what extent applicable expense
waivers, reimbursements or fee “breakpoints” are observed for the Fund, (v) information regarding MFS’ financial results and financial condition, including MFS’ and certain of its affiliates’ estimated profitability
from services performed for the Fund and the MFS Funds as a whole, and compared to MFS’ institutional business, (vi) MFS’ views regarding the outlook for the mutual fund industry and the strategic business plans of MFS, (vii)
descriptions of various functions performed by MFS for the Funds, such as compliance monitoring and portfolio trading practices, and (viii)
Board Review of Investment
Advisory Agreement - continued
information regarding the overall organization of MFS, including information
about MFS’ senior management and other personnel providing investment advisory, administrative and other services to the Fund and the other MFS Funds. The comparative performance, fee and expense information prepared and provided by Broadridge
was not independently verified and the independent Trustees did not independently verify any information provided to them by MFS.
The Trustees’ conclusion as to the continuation of the
investment advisory agreement was based on a comprehensive consideration of all information provided to the Trustees and not the result of any single factor. Some of the factors that figured particularly in the Trustees’ deliberations are
described below, although individual Trustees may have evaluated the information presented differently from one another, giving different weights to various factors. It is also important to recognize that the fee arrangements for the Fund and other
MFS Funds are the result of years of review and discussion between the independent Trustees and MFS, that certain aspects of such arrangements may receive greater scrutiny in some years than in others, and that the Trustees’ conclusions may be
based, in part, on their consideration of these same arrangements during the course of the year and in prior years.
Based on information provided by Broadridge and MFS, the
Trustees reviewed the Fund’s total return investment performance as well as the Broadridge performance universe over various time periods. The Trustees placed particular emphasis on the total return performance of the Fund’s Class I
shares in comparison to the performance of funds in its Broadridge performance universe over the five-year period ended December 31, 2020, which the Trustees believed was a long enough period to reflect differing market conditions. The total return
performance of the Fund’s Class I shares was in the 3rd quintile relative to the other funds in the universe for this five-year period (the 1st quintile being the best performers and the 5th quintile being the worst performers). The total
return performance of the Fund’s Class I shares was in the 5th quintile for each of the one- and three-year periods ended December 31, 2020 relative to the Broadridge performance universe. Because of the passage of time, these performance
results may differ from the performance results for more recent periods, including those shown elsewhere in this report.
In the course of their deliberations, the Trustees took into
account information provided by MFS in connection with the contract review meetings, as well as during investment review meetings conducted with portfolio management personnel during the course of the year regarding the Fund’s performance.
After reviewing these and related factors, the Trustees concluded, within the context of their overall conclusions regarding the investment advisory agreement, that they were satisfied with MFS’ responses and efforts relating to investment
performance.
In assessing the reasonableness of the
Fund’s advisory fee, the Trustees considered, among other information, the Fund’s advisory fee and the total expense ratio of the Fund’s Class I shares as a percentage of average daily net assets and the advisory fee and total
expense ratios of the Broadridge expense group based on information provided by Broadridge. The Trustees considered that MFS currently observes an expense limitation for the Fund, which may not be changed without the Trustees’ approval. The
Trustees also considered that, according to the data provided by
Board Review of Investment
Advisory Agreement - continued
Broadridge (which takes into account any fee reductions or expense limitations
that were in effect during the Fund’s last fiscal year), the Fund’s effective advisory fee rate and total expense ratio were each lower than the Broadridge expense group median.
The Trustees also considered the advisory fees charged by MFS
to any institutional separate accounts advised by MFS (“separate accounts”) and unaffiliated investment companies for which MFS serves as subadviser (“subadvised funds”) that have comparable investment strategies to the Fund,
if any. In comparing these fees, the Trustees considered information provided by MFS as to the generally broader scope of services provided by MFS to the Fund, as well as the more extensive regulatory burdens imposed on MFS in managing the Fund, in
comparison to separate accounts and subadvised funds. The Trustees also considered the higher demands placed on MFS’ investment personnel and trading infrastructure as a result of the daily cash in-flows and out-flows of the Fund in comparison
to separate accounts.
The Trustees also considered
whether the Fund may benefit from any economies of scale in the management of the Fund in the event of growth in assets of the Fund and/or growth in assets of the MFS Funds as a whole. They noted that the Fund’s advisory fee rate schedule is
subject to contractual breakpoints that reduce the Fund’s advisory fee rate on average daily net assets over $1 billion and $2.5 billion. The Trustees also noted that MFS has agreed in writing to waive a portion of the management fees of
certain MFS Funds, including the Fund, if the total combined assets of certain funds within the MFS Funds’ complex increase above agreed upon thresholds (the “group fee waiver”), enabling the Fund’s shareholders to share in
the benefits from any economies of scale at the complex level. The group fee waiver is reviewed and renewed annually between the Board and MFS. The Trustees concluded that the breakpoints and the group fee waiver were sufficient to allow the Fund to
benefit from economies of scale as its assets and overall complex assets grow.
The Trustees also considered information prepared by MFS
relating to MFS’ costs and profits with respect to the Fund, the MFS Funds considered as a group, and other investment companies and accounts advised by MFS, as well as MFS’ methodologies used to determine and allocate its costs to the
MFS Funds, the Fund and other accounts and products for purposes of estimating profitability.
After reviewing these and other factors described herein, the
Trustees concluded, within the context of their overall conclusions regarding the investment advisory agreement, that the advisory fees charged to the Fund represent reasonable compensation in light of the services being provided by MFS to the
Fund.
In addition, the Trustees considered MFS’
resources and related efforts to continue to retain, attract and motivate capable personnel to serve the Fund. The Trustees also considered current and developing conditions in the financial services industry, including the presence of large and
well-capitalized companies which are spending, and appear to be prepared to continue to spend, substantial sums to engage personnel and to provide services to competing investment companies. In this regard, the Trustees also considered the financial
resources of MFS and its ultimate parent, Sun Life Financial Inc. The Trustees also considered the advantages and possible disadvantages to the Fund of having an adviser that also serves other investment companies as well as other accounts.
Board Review of Investment
Advisory Agreement - continued
The Trustees also considered the nature, quality, cost, and
extent of administrative, transfer agency, and distribution services provided to the Fund by MFS and its affiliates under agreements and plans other than the investment advisory agreement, including any 12b-1 fees the Fund pays to MFS Fund
Distributors, Inc., an affiliate of MFS. The Trustees also considered the nature, extent and quality of certain other services MFS performs or arranges for on the Fund’s behalf, which may include securities lending programs, directed expense
payment programs, class action recovery programs, and MFS’ interaction with third-party service providers, principally custodians and sub-custodians. The Trustees concluded that the various non-advisory services provided by MFS and its
affiliates on behalf of the Fund were satisfactory.
The
Trustees considered so-called “fall-out benefits” to MFS such as reputational value derived from serving as investment manager to the MFS Funds. The Trustees also considered that MFS discontinued its historic practice of obtaining
investment research from portfolio brokerage commissions paid by certain MFS Funds effective January 2018, and directly pays or voluntarily reimburses a Fund, if applicable, for the costs of external research acquired through the use of the
Fund’s portfolio brokerage commissions.
Based on
their evaluation of factors that they deemed to be material, including those factors described above, the Board of Trustees, including the independent Trustees, concluded that the Fund’s investment advisory agreement with MFS should be
continued for an additional one-year period, commencing August 1, 2021.
Statement Regarding
Liquidity Risk Management Program
The fund has adopted
and implemented a liquidity risk management program (the “Program”) as required by Rule 22e-4 under the Investment Company Act of 1940, as amended. The fund’s Board of Trustees (the “Board”) has designated MFS as the
administrator of the Program. The Program is reasonably designed to assess and manage the liquidity risk of the fund. Liquidity risk is the risk that the fund could not meet requests to redeem shares issued by the fund without significant dilution
of remaining investors' interests.
MFS provided a written
report to the Board for consideration at its April 2021 meeting that addressed the operation of the Program and provided an assessment of the adequacy and effectiveness of the Program during the period from January 1, 2020 to December 31, 2020 (the
“Covered Period”). The report concluded that during the Covered Period the Program had operated effectively and had adequately and effectively been implemented to assess and manage the fund’s liquidity risk. MFS also reported that
there were no liquidity events that impacted the fund or its ability to timely meet redemptions without dilution to existing shareholders during the Covered Period.
There can be no assurance that the Program will achieve its
objectives in the future. Further information on liquidity risk, and other principal risks to which an investment in the fund may be subject, can be found in the prospectus.
Proxy
Voting Policies and Information
MFS votes proxies on
behalf of the fund pursuant to proxy voting policies and procedures that are available without charge, upon request, by calling 1-800-225-2606, by visiting mfs.com/proxyvoting, or by visiting the SEC’s
Web site at http://www.sec.gov.
Information regarding how the fund voted proxies relating to
portfolio securities during the most recent twelve-month period ended June 30 is available by August 31 of each year without charge by visiting mfs.com/proxyvoting, or by visiting the SEC’s Web site at http://www.sec.gov.
Quarterly Portfolio Disclosure
The fund files a complete schedule of portfolio holdings with
the SEC for the first and third quarters of each fiscal year as an exhibit to its reports on Form N-PORT. The fund's Form N-PORT reports are available on the SEC's Web site at http://www.sec.gov. A
shareholder can obtain the portfolio holdings report for the first and third quarters of the fund's fiscal year at mfs.com/openendfunds by choosing the fund's name and then scrolling to the
“Resources” section and clicking on the “Prospectus and Reports” tab.
Further Information
From time to time, MFS may post important information about the
fund or the MFS Funds on the MFS Web site (mfs.com). This information is available at https://www.mfs.com/announcements or at
mfs.com/openendfunds by choosing the fund’s name and then scrolling to the “Resources” section and clicking on the “Announcements” tab, if any.
Information About Fund Contracts and Legal Claims
The fund has entered into contractual arrangements with an
investment adviser, administrator, distributor, shareholder servicing agent, 529 program manager (if applicable), and custodian who each provide services to the fund. Unless expressly stated otherwise, shareholders are not parties to, or intended
beneficiaries of these contractual arrangements, and these contractual arrangements are not intended to create any shareholder right to enforce them against the service providers or to seek any remedy under them against the service providers, either
directly or on behalf of the fund.
Under the
Trust’s By-Laws and Declaration of Trust, any claims asserted against or on behalf of the MFS Funds, including claims against Trustees and Officers, must be brought in state and federal courts located within the Commonwealth of
Massachusetts.
Federal Tax Information (unaudited)
The
fund will notify shareholders of amounts for use in preparing 2021 income tax forms in January 2022. The following information is provided pursuant to provisions of the Internal Revenue Code.
The fund designates the maximum amount allowable as qualified
dividend income eligible to be taxed at the same rate as long-term capital gain.
The fund designates $16,908 as capital gain dividends paid
during the fiscal year.
Income derived from foreign
sources was $1,623,106. The fund intends to pass through foreign tax credits of $263,516 for the fiscal year.
| FACTS
|
WHAT
DOES MFS DO WITH YOUR PERSONAL INFORMATION? |
| Why?
|
Financial
companies choose how they share your personal information. Federal law gives consumers the right to limit some but not all sharing. Federal law also requires us to tell you how we collect, share, and protect your personal information. Please read
this notice carefully to understand what we do. |
| What?
|
The types of
personal information we collect and share depend on the product or service you have with us. This information can include: |
| • Social
Security number and account balances |
| • Account
transactions and transaction history |
| • Checking
account information and wire transfer instructions |
| When
you are no longer our customer, we continue to share your information as described in this notice. |
| How?
|
All
financial companies need to share customers' personal information to run their everyday business. In the section below, we list the reasons financial companies can share their customers' personal information; the reasons MFS chooses to share; and
whether you can limit this sharing. |
Reasons
we can share your
personal information |
Does
MFS share? |
Can
you limit
this sharing? |
For
our everyday business purposes –
such as to process your transactions, maintain your
account(s), respond to court orders and legal
investigations, or report to credit bureaus |
Yes
|
No
|
For
our marketing purposes –
to offer our products and services to you |
No
|
We
don't share |
For
joint marketing with other
financial companies |
No
|
We
don't share |
For
our affiliates' everyday business purposes –
information about your transactions and experiences |
No
|
We
don't share |
For
our affiliates' everyday business purposes –
information about your creditworthiness |
No
|
We
don't share |
| For
nonaffiliates to market to you |
No
|
We
don't share |
| Questions?
|
Call
800-225-2606 or go to mfs.com. |
| Who
we are |
| Who
is providing this notice? |
MFS
Funds, MFS Investment Management, MFS Institutional Advisors, Inc., and MFS Heritage Trust Company. |
| What
we do |
How
does MFS
protect my personal
information? |
To
protect your personal information from unauthorized access and use, we use security measures that comply with federal law. These measures include procedural, electronic, and physical safeguards for the protection of the personal information we
collect about you. |
How
does MFS
collect my personal
information? |
We
collect your personal information, for example, when you |
| • open
an account or provide account information |
| • direct
us to buy securities or direct us to sell your securities |
| • make
a wire transfer |
| We
also collect your personal information from others, such as credit bureaus, affiliates, or other companies. |
| Why
can't I limit all sharing? |
Federal
law gives you the right to limit only |
| • sharing
for affiliates' everyday business purposes – information about your creditworthiness |
| • affiliates
from using your information to market to you |
| • sharing
for nonaffiliates to market to you |
| State
laws and individual companies may give you additional rights to limit sharing. |
| Definitions
|
| Affiliates
|
Companies
related by common ownership or control. They can be financial and nonfinancial companies. |
| •
MFS does not share personal information with affiliates, except for everyday business purposes as described on page one of this notice. |
| Nonaffiliates
|
Companies
not related by common ownership or control. They can be financial and nonfinancial companies. |
| •
MFS does not share with nonaffiliates so they can market to you. |
| Joint
marketing |
A
formal agreement between nonaffiliated financial companies that together market financial products or services to you. |
| •
MFS doesn't jointly market. |
| Other
important information |
| If
you own an MFS product or receive an MFS service in the name of a third party such as a bank or broker-dealer, their privacy policy may apply to you instead of ours. |
Save paper with eDelivery.
MFS® will send you prospectuses, reports, and proxies directly via e-mail so you will get information faster with less mailbox clutter.
To sign up:
1. Go to mfs.com.
2. Log in via MFS® Access.
3. Select eDelivery.
If you own your MFS fund shares through a financial institution
or a retirement plan, MFS® TALK, MFS® Access,
or eDelivery may not be available to you.
CONTACT
WEB SITE
mfs.com
MFS TALK
1-800-637-8255
24 hours a day
ACCOUNT SERVICE AND LITERATURE
Shareholders
1-800-225-2606
Financial advisors
1-800-343-2829
Retirement plan services
1-800-637-1255
MAILING ADDRESS
MFS Service Center, Inc.
P.O. Box 219341
Kansas City, MO 64121-9341
OVERNIGHT MAIL
MFS Service Center, Inc.
Suite 219341
430 W 7th Street
Kansas City, MO 64105-1407
Annual Report
August 31, 2021
MFS® Blended Research®
International Equity Fund
MFS® Blended Research®
International Equity Fund
|
1
|
|
2
|
|
4
|
|
7
|
|
10
|
|
12
|
|
20
|
|
22
|
|
23
|
|
24
|
|
30
|
|
41
|
|
43
|
|
48
|
|
52
|
|
53
|
|
53
|
|
53
|
|
53
|
|
53
|
|
54
|
The
report is prepared for the general information of shareholders. It is authorized for distribution to prospective investors only when preceded or accompanied by a current prospectus.
NOT FDIC INSURED • MAY LOSE VALUE
• NO BANK GUARANTEE
LETTER FROM THE CEO
Dear Shareholders:
After experiencing dramatic swings in the early days of the
coronavirus pandemic, global equity markets have performed strongly over the past year. Though the speedy development of vaccines brightened the economic and market outlook, uncertainty remains as new variants of the virus appear, and questions
persist over how fast vaccines can be made widely available in the developing world.
After having taken aggressive steps to
cushion the economic and market fallout related to the virus, some global central banks have begun to recalibrate monetary policy. For example, the U.S. Federal Reserve has signaled it will likely taper its bond buying program before the end of
2021, which has helped push up Treasury yields, and steepened the yield curve. Having passed a $1.9 trillion stimulus package in March, the U.S. Congress could approve additional stimulus later this year, some of it focused on infrastructure.
Production and transportation bottlenecks and labor shortages stemming from the pandemic have fueled a rise in inflation, though policymakers and investors think most of the price hikes will prove transitory.
Since midyear, the spread of the Delta variant of the
coronavirus has slowed economic growth while markets have focused on a regulatory crackdown in China, which, when coupled with stress in that country's property development sector, has contributed to a slowdown there. Tightening global energy and
raw materials supplies are a further concern for investors.
The policy measures put in place to counteract the pandemic's
effects have helped build a supportive environment and are encouraging economic recovery; however, if markets disconnect from fundamentals, they can sow the seeds of instability. As such, recent dramatic increases in speculative trading in
cryptocurrencies, special purpose acquisition companies (SPACs), and the like bear watching.
In the aftermath of the crisis, we could see societal changes
as households, businesses, and governments adjust to a new reality, and any such alterations could affect the investment landscape. For investors, events such as the COVID-19 outbreak demonstrate the importance of having a deep understanding of
company fundamentals, and we have built our global research platform to do just that.
At MFS®, we put our clients’ assets to work responsibly by carefully navigating the increasing complexity of global markets and economies. Guided by our
long-term philosophy and adhering to our commitment to sustainable investing, we tune out the noise and aim to uncover what we believe are the best, most durable investment opportunities in the market. Our unique global investment platform combines
collective expertise, long-term discipline, and thoughtful risk management to create sustainable value for investors.
Respectfully,
Michael W.
Roberge
Chief Executive Officer
MFS Investment Management
October 15, 2021
The opinions expressed in this letter are subject to change and
may not be relied upon for investment advice. No forecasts can be guaranteed.
Portfolio structure
Top ten
holdings
| Taiwan
Semiconductor Manufacturing Co. Ltd., ADR |
2.7%
|
| LVMH
Moet Hennessy Louis Vuitton SE |
2.1%
|
| Samsung
Electronics Co. Ltd. |
2.0%
|
| Roche
Holding AG |
1.9%
|
| Novo
Nordisk A.S., “B” |
1.8%
|
| Novartis
AG |
1.7%
|
| Fujitsu
Ltd. |
1.7%
|
| Hitachi
Ltd. |
1.6%
|
| Schneider
Electric SE |
1.6%
|
| Tencent
Holdings Ltd. |
1.6%
|
GICS equity sectors (g)
| Financials
|
18.1%
|
| Information
Technology |
13.2%
|
| Consumer
Discretionary |
12.7%
|
| Industrials
|
11.3%
|
| Health
Care |
10.2%
|
| Consumer
Staples |
8.9%
|
| Materials
|
7.6%
|
| Communication
Services |
6.8%
|
| Energy
|
4.4%
|
| Utilities
|
3.8%
|
| Real
Estate |
1.9%
|
Issuer country weightings (x)
| Japan
|
13.6%
|
| United
Kingdom |
10.9%
|
| France
|
9.1%
|
| China
|
9.0%
|
| Canada
|
7.9%
|
| Switzerland
|
7.3%
|
| South
Korea |
5.7%
|
| Germany
|
4.0%
|
| Taiwan
|
4.0%
|
| Other
Countries |
28.5%
|
Currency exposure weightings
(y)
| Euro
|
19.6%
|
| Japanese
Yen |
13.6%
|
| British
Pound Sterling |
9.9%
|
| Hong
Kong Dollar |
8.9%
|
| Swiss
Franc |
7.3%
|
| Canadian
Dollar |
6.9%
|
| South
Korean Won |
5.7%
|
| United
States Dollar |
5.1%
|
| Taiwan
Dollar |
4.0%
|
| Other
Currencies |
19.0%
|
Portfolio Composition -
continued
| (g)
|
The
Global Industry Classification Standard (GICS®) was developed by and/or is the exclusive property of MSCI, Inc. and S&P Global Market
Intelligence Inc. (“S&P Global Market Intelligence”). GICS is a service mark of MSCI and S&P Global Market Intelligence and has been licensed for use by MFS. MFS has applied its own internal sector/industry classification
methodology for equity securities and non-equity securities that are unclassified by GICS. |
| (x)
|
Represents
the portfolio’s exposure to issuer countries as a percentage of a portfolio’s net assets. For purposes of this presentation, United States (included in Other Countries) includes Cash & Cash Equivalents. |
| (y)
|
Represents
the portfolio’s exposure to a particular currency as a percentage of a portfolio's net assets. For purposes of this presentation, United States Dollar includes Cash & Cash Equivalents. |
Cash & Cash Equivalents includes any cash, investments in
money market funds, short-term securities, and other assets less liabilities. Please see the Statement of Assets and Liabilities for additional information related to the fund’s cash position and other assets and liabilities.
Percentages are based on net assets as of August 31,
2021.
The portfolio is actively managed and current
holdings may be different.
Management Review
Summary of Results
For the twelve months ended August 31, 2021, Class A shares of
the MFS Blended Research International Equity Fund (fund) provided a total return of 29.82%, at net asset value. This compares with a return of 24.87% for the fund’s benchmark, the MSCI All Country World (ex-US) Index (net div).
Market Environment
The global economy continued to recover from the most unusual
recession in memory as financial markets benefited from massive fiscal and monetary intervention aimed at offsetting the economic effects of the coronavirus pandemic. In developed markets, COVID-19 vaccine distribution broadened after getting off to
a slower-than-hoped-for start in some locales, although concerns remained that too few people will be inoculated for herd immunity to be achieved, which could result in the emergence of additional variants. On balance, emerging markets experienced
slower rollouts than developed markets amid ongoing vaccine supply constraints.
Around the world, central banks responded quickly and massively
to the crisis with programs to improve liquidity and support markets. These undertakings proved largely successful in helping to restore market function, ease volatility and stimulate a prolonged rebound. In the first half of the period, the US
Federal Reserve adopted a new, flexible average-inflation-targeting framework, which is expected to result in the federal funds rate remaining at low levels longer than under its previous model, although the Fed has indicated it may scale back the
pace of asset purchases before the end of this year. Due to relatively manageable external liabilities and balances of payments in many countries and persistently low inflation, even emerging market countries were able to implement countercyclical
policies — a departure from the usual market-dictated response to risk-off crises.
Late in the period, markets grappled with the threat of
resurgent inflation resulting from pandemic-induced production bottlenecks, monumental levels of economic stimulus and the unleashing of post-lockdown pent-up demand. Meanwhile, raw materials prices rebounded strongly on account of the surprising
resilience of the global manufacturing sector during the pandemic. Global sovereign bond yields initially rose in response to these factors before yields moderated in the second half of the period as the spread of the Delta variant of the
coronavirus dented economic activity. The vaccine breakthroughs announced in November 2020 saw market leadership shift from a handful of mega-cap technology companies to a broader array of small-cap and value stocks, although growth stocks have
performed strongly in recent months. Signs of excess investor enthusiasm were seen in pockets of the market, such as the “meme stocks” popular with users of online message boards and heavy retail participation in the market for
short-dated equity options.
Contributors to
Performance
Security selection within the consumer
discretionary sector contributed to the fund's performance relative to the MSCI All Country World (ex-US) Index, led by its underweight position in online and mobile commerce company Alibaba Group Holding (China) and its overweight position in
automotive systems manufacturer Magna
Management Review -
continued
International (Canada). The stock price of Alibaba Group Holding declined as
the company reported lower-than-expected adjusted earnings due to higher investments in new businesses, such as its Taobao Deals and local services.
Stock selection within the materials sector also strengthened
relative results, led by the fund's overweight position in strong-performing iron and steel products manufacturer Tata Steel (India).
Stocks in other sectors that were among the fund's top relative
contributors included its overweight positions in electronics company Hitachi (Japan), laboratory services provider Eurofins Scientific (Luxembourg), semiconductor firm United Microelectronics (Taiwan), banking services firm ABSA Group (South
Africa), technology consulting firm Infosys(h) (India) and microchip and electronics manufacturer Samsung Electronics (South Korea). The stock price of Hitachi advanced during the reporting period as the company posted better-than-expected operating
profit results, driven by strong performance in its IT segment. In addition, management reported favorable operating profit guidance, which also benefited the stock. The fund's holdings of petroleum and natural gas producer Tourmaline Oil(b)
(Canada) further contributed to relative performance.
Detractors from Performance
A combination of stock selection and an overweight position in
the communication services sector detracted from relative performance, led by the fund's holdings of online computer and smartphone game developer GungHo Online Entertainment(b) (Japan).
Elsewhere, not owning shares of ASML (Netherlands), a
lithography systems manufacturer for the semiconductor industry, held back relative returns. The stock price of ASML rose as the company delivered stronger-than-anticipated financial results, driven by robust order intake within both its Logic and
Memory business segments. The fund's overweight positions in life sciences company Bayer (Germany), real estate development firm Shimao Group Holdings(h) (Hong Kong), telecommunications services provider Koninklijke Philips (Netherlands), cement
manufacturer Anhui Conch Cement (China), cloud services provider Kingsoft (China), latex rubber glove manufacturer Top Glove (Malaysia) and securities exchange operator ASX(b)(h) (Australia) also weakened relative performance. Additionally, the
timing of the fund's ownership in shares of oil and gas exploration and production company Petroleo Brasileiro(h) (Brazil) hindered relative results. The stock price of Petroleo Brasileiro appreciated as the company reported solid financial results
that were ahead of market estimates, primarily driven by higher overall oil prices during the reporting period.
The fund’s cash and/or cash equivalents position during
the reporting period was another detractor from relative performance. Under normal market conditions, the fund strives to be fully invested and generally holds cash to buy new holdings and to provide liquidity. In a period when equity markets rose,
as measured by the fund’s benchmark, holding cash held back performance versus the benchmark, which has no cash position.
Management Review -
continued
Respectfully,
Portfolio Manager(s)
Jim Fallon, Matt Krummell, Jonathan Sage, and Jed Stocks
| (b)
|
Security is not a
benchmark constituent. |
| (h)
|
Security was not held in
the portfolio at period end. |
The
views expressed in this report are those of the portfolio manager(s) only through the end of the period of the report as stated on the cover and do not necessarily reflect the views of MFS or any other person in the MFS organization. These views are
subject to change at any time based on market or other conditions, and MFS disclaims any responsibility to update such views. These views may not be relied upon as investment advice or an indication of trading intent on behalf of any MFS portfolio.
References to specific securities are not recommendations of such securities, and may not be representative of any MFS portfolio’s current or future investments.
Performance Summary THROUGH
8/31/21
The following chart illustrates a representative
class of the fund’s historical performance in comparison to its benchmark(s). Performance results include the deduction of the maximum applicable sales charge and reflect the percentage change in net asset value, including reinvestment of
dividends and capital gains distributions. The performance of other share classes will be greater than or less than that of the class depicted below. Benchmarks are unmanaged and may not be invested in directly. Benchmark returns do not reflect
sales charges, commissions or expenses. (See Notes to Performance Summary.)
Performance data shown represents past performance and is no
guarantee of future results. Investment return and principal value fluctuate so your shares, when sold, may be worth more or less than the original cost; current performance may be lower or higher than quoted. The performance shown does not reflect
the deduction of taxes, if any, that a shareholder would pay on fund distributions or the redemption of fund shares.
Growth of a Hypothetical $10,000 Investment (t)
Performance Summary -
continued
Total Returns through 8/31/21
Average annual without sales charge
| Share
Class |
Class
Inception Date |
1-yr
|
5-yr
|
Life
(t) |
| A
|
9/15/15
|
29.82%
|
9.97%
|
8.18%
|
| B
|
9/15/15
|
28.84%
|
9.13%
|
7.37%
|
| C
|
9/15/15
|
28.78%
|
9.12%
|
7.36%
|
| I
|
9/15/15
|
30.14%
|
10.23%
|
8.44%
|
| R1
|
9/15/15
|
28.83%
|
9.13%
|
7.37%
|
| R2
|
9/15/15
|
29.50%
|
9.68%
|
7.90%
|
| R3
|
9/15/15
|
29.75%
|
9.95%
|
8.19%
|
| R4
|
9/15/15
|
30.12%
|
10.24%
|
8.45%
|
| R6
|
9/15/15
|
30.32%
|
10.34%
|
8.53%
|
Comparative benchmark(s)
| |
|
|
|
| MSCI
All Country World (ex-US) Index (net div) (f) |
24.87%
|
9.92%
|
9.15%
|
Average annual with sales
charge
| |
|
|
|
A
With Initial Sales Charge (5.75%) |
22.36%
|
8.68%
|
7.11%
|
B
With CDSC (Declining over six years from 4% to 0%) (v) |
24.84%
|
8.84%
|
7.25%
|
C
With CDSC (1% for 12 months) (v) |
27.78%
|
9.12%
|
7.36%
|
CDSC – Contingent Deferred
Sales Charge.
Class I, R1, R2, R3, R4, and R6 shares do
not have a sales charge.
| (f)
|
Source: FactSet Research
Systems Inc. |
| (t)
|
For the
period from the class inception date through the stated period end. (See Notes to Performance Summary.) |
| (v)
|
Assuming redemption at
the end of the applicable period. |
Benchmark Definition(s)
MSCI All Country World (ex-US) Index(e) (net div) – a market capitalization-weighted index that is designed to measure equity market performance in the developed and emerging markets,
excluding the U.S.
Performance Summary -
continued
It is not possible to invest directly in an index.
| (e)
|
Morgan
Stanley Capital International (“MSCI”) makes no express or implied warranties or representations and shall have no liability whatsoever with respect to any MSCI data contained herein. The MSCI data may not be further redistributed or
used as a basis for other indices or any securities or financial products. This report is not approved, reviewed, or produced by MSCI. |
Notes to Performance Summary
Average annual total return represents the average annual
change in value for each share class for the periods presented. Life returns are presented where the share class has less than 10 years of performance history and represent the average annual total return from the class inception date to the stated
period end date.
Performance results reflect any
applicable expense subsidies and waivers in effect during the periods shown. Without such subsidies and waivers the fund's performance results would be less favorable. Please see the prospectus and financial statements for complete details.
Performance results do not include adjustments made for
financial reporting purposes in accordance with U.S. generally accepted accounting principles and may differ from amounts reported in the financial highlights.
From time to time the fund may receive proceeds from litigation
settlements, without which performance would be lower.
Expense Table
Fund expenses borne by the shareholders during the period,
March 1, 2021 through August 31, 2021
As a shareholder
of the fund, you incur two types of costs: (1) transaction costs, including sales charges (loads) on certain purchase or redemption payments, and (2) ongoing costs, including management fees; distribution and service (12b-1) fees; and other fund
expenses. This example is intended to help you understand your ongoing costs (in dollars) of investing in the fund and to compare these costs with the ongoing costs of investing in other mutual funds.
The example is based on an investment of $1,000 invested at the
beginning of the period and held for the entire period March 1, 2021 through August 31, 2021.
Actual Expenses
The first line for each share class in the following table
provides information about actual account values and actual expenses. You may use the information in this line, together with the amount you invested, to estimate the expenses that you paid over the period. Simply divide your account value by $1,000
(for example, an $8,600 account value divided by $1,000 = 8.6), then multiply the result by the number in the first line under the heading entitled “Expenses Paid During Period” to estimate the expenses you paid on your account during
this period.
Hypothetical Example for Comparison
Purposes
The second line for each share class in the
following table provides information about hypothetical account values and hypothetical expenses based on the fund’s actual expense ratio and an assumed rate of return of 5% per year before expenses, which is not the fund’s actual
return. The hypothetical account values and expenses may not be used to estimate the actual ending account balance or expenses you paid for the period. You may use this information to compare the ongoing costs of investing in the fund and other
funds. To do so, compare this 5% hypothetical example with the 5% hypothetical examples that appear in the shareholder reports of the other funds.
Please note that the expenses shown in the table are meant to
highlight your ongoing costs only and do not reflect any transactional costs, such as sales charges (loads). Therefore, the second line for each share class in the table is useful in comparing ongoing costs only, and will not help you determine the
relative total costs of owning different funds. In addition, if these transactional costs were included, your costs would have been higher.
Expense Table -
continued
Share
Class |
|
Annualized
Expense
Ratio |
Beginning
Account Value
3/01/21 |
Ending
Account Value
8/31/21 |
Expenses
Paid During
Period (p)
3/01/21-8/31/21 |
| A
|
Actual
|
0.89%
|
$1,000.00
|
$1,094.17
|
$4.70
|
| Hypothetical
(h) |
0.89%
|
$1,000.00
|
$1,020.72
|
$4.53
|
| B
|
Actual
|
1.64%
|
$1,000.00
|
$1,089.67
|
$8.64
|
| Hypothetical
(h) |
1.64%
|
$1,000.00
|
$1,016.94
|
$8.34
|
| C
|
Actual
|
1.64%
|
$1,000.00
|
$1,089.82
|
$8.64
|
| Hypothetical
(h) |
1.64%
|
$1,000.00
|
$1,016.94
|
$8.34
|
| I
|
Actual
|
0.64%
|
$1,000.00
|
$1,095.39
|
$3.38
|
| Hypothetical
(h) |
0.64%
|
$1,000.00
|
$1,021.98
|
$3.26
|
| R1
|
Actual
|
1.64%
|
$1,000.00
|
$1,089.52
|
$8.64
|
| Hypothetical
(h) |
1.64%
|
$1,000.00
|
$1,016.94
|
$8.34
|
| R2
|
Actual
|
1.14%
|
$1,000.00
|
$1,092.36
|
$6.01
|
| Hypothetical
(h) |
1.14%
|
$1,000.00
|
$1,019.46
|
$5.80
|
| R3
|
Actual
|
0.89%
|
$1,000.00
|
$1,094.22
|
$4.70
|
| Hypothetical
(h) |
0.89%
|
$1,000.00
|
$1,020.72
|
$4.53
|
| R4
|
Actual
|
0.64%
|
$1,000.00
|
$1,095.31
|
$3.38
|
| Hypothetical
(h) |
0.64%
|
$1,000.00
|
$1,021.98
|
$3.26
|
| R6
|
Actual
|
0.55%
|
$1,000.00
|
$1,096.11
|
$2.91
|
| Hypothetical
(h) |
0.55%
|
$1,000.00
|
$1,022.43
|
$2.80
|
| (h)
|
5% class return per year
before expenses. |
| (p)
|
“Expenses
Paid During Period” are equal to each class’s annualized expense ratio, as shown above, multiplied by the average account value over the period, multiplied by 184/365 (to reflect the one-half year period). Expenses paid do not include
any applicable sales charges (loads). If these transaction costs had been included, your costs would have been higher. |
Portfolio of
Investments
8/31/21
The Portfolio of Investments is a complete list of all
securities owned by your fund. It is categorized by broad-based asset classes.
| Issuer
|
|
|
Shares/Par
|
Value
($) |
| Common
Stocks – 98.9% |
| Alcoholic
Beverages – 1.1% |
|
| Ambev
S.A. |
|
363,500 |
$
1,202,106 |
| Jiangsu
Yanghe Brewery JSC Ltd. |
|
31,900 |
826,917 |
| Kirin
Holdings Co. Ltd. |
|
157,100 |
2,847,406 |
| |
|
|
|
$4,876,429 |
| Apparel
Manufacturers – 3.5% |
|
| Burberry
Group PLC |
|
43,856 |
$
1,121,193 |
| Compagnie
Financiere Richemont S.A. |
|
39,357 |
4,340,767 |
| Gildan
Activewear, Inc. |
|
22,175 |
852,445 |
| LVMH
Moet Hennessy Louis Vuitton SE |
|
11,937 |
8,834,507 |
| |
|
|
|
$15,148,912 |
| Automotive
– 3.6% |
|
| Bridgestone
Corp. |
|
88,900 |
$
4,092,075 |
| Compagnie
Generale des Etablissements Michelin SCA |
|
11,978 |
1,938,302 |
| Hero
MotoCorp Ltd. |
|
22,090 |
829,606 |
| Kia
Corp. |
|
10,596 |
777,713 |
| Magna
International, Inc. |
|
54,882 |
4,330,739 |
| Stellantis
N.V. |
|
180,151 |
3,602,939 |
| |
|
|
|
$15,571,374 |
| Brokerage
& Asset Managers – 0.9% |
|
| IG
Group Holdings PLC |
|
306,363 |
$
3,944,568 |
| Business
Services – 2.1% |
|
| Eurofins
Scientific SE |
|
41,714 |
$
5,914,399 |
| Tech
Mahindra Ltd. |
|
150,180 |
2,977,887 |
| |
|
|
|
$8,892,286 |
| Chemicals
– 0.2% |
|
| Mitsubishi
Chemical Holdings Corp. |
|
106,500 |
$
934,943 |
| Computer
Software – 2.3% |
|
| Dassault
Systemes SE |
|
66,768 |
$
3,808,190 |
| Kingsoft
Corp. |
|
287,600 |
1,151,886 |
| NAVER
Corp. |
|
8,779 |
3,323,973 |
| NetEase.com,
Inc., ADR |
|
16,980 |
1,654,192 |
| |
|
|
|
$9,938,241 |
Portfolio of
Investments – continued
| Issuer
|
|
|
Shares/Par
|
Value
($) |
| Common
Stocks – continued |
| Computer
Software - Systems – 7.5% |
|
| Constellation
Software, Inc. |
|
3,163 |
$
5,360,516 |
| Descartes
Systems Group, Inc. (a) |
|
12,557 |
984,435 |
| Fujitsu
Ltd. |
|
38,800 |
7,159,388 |
| Hitachi
Ltd. |
|
123,100 |
6,808,740 |
| Hon
Hai Precision Industry Co. Ltd. |
|
399,000 |
1,598,102 |
| NICE
Systems Ltd., ADR (a) |
|
5,747 |
1,670,653 |
| Samsung
Electronics Co. Ltd. |
|
129,941 |
8,595,864 |
| |
|
|
|
$32,177,698 |
| Construction
– 1.9% |
|
| Anhui
Conch Cement Co. Ltd. |
|
270,000 |
$
1,461,533 |
| Ashtead
Group PLC |
|
47,845 |
3,742,865 |
| Techtronic
Industries Co. Ltd. |
|
122,500 |
2,716,990 |
| |
|
|
|
$7,921,388 |
| Consumer
Products – 0.8% |
|
| AmorePacific
Corp. |
|
5,263 |
$
1,032,673 |
| Reckitt
Benckiser Group PLC |
|
30,798 |
2,345,358 |
| |
|
|
|
$3,378,031 |
| Consumer
Services – 0.9% |
|
| Carsales.com
Ltd. |
|
71,551 |
$
1,313,812 |
| Persol
Holdings Co. Ltd. |
|
42,600 |
995,930 |
| REA
Group Ltd. |
|
14,534 |
1,632,065 |
| |
|
|
|
$3,941,807 |
| Containers
– 0.8% |
|
| Brambles
Ltd. |
|
304,377 |
$
2,696,496 |
| Viscofan
S.A. |
|
11,925 |
842,011 |
| |
|
|
|
$3,538,507 |
| Electrical
Equipment – 2.6% |
|
| Legrand
S.A. |
|
16,685 |
$
1,909,404 |
| Philips
Lighting N.V. (n) |
|
44,303 |
2,480,578 |
| Schneider
Electric SE |
|
37,839 |
6,759,844 |
| |
|
|
|
$11,149,826 |
| Electronics
– 4.5% |
|
| AU
Optronics Corp. |
|
1,285,000
|
$
816,064 |
| NXP
Semiconductors N.V. |
|
17,774 |
3,823,721 |
| Silicon
Motion Technology Corp., ADR |
|
20,138 |
1,503,503 |
| Taiwan
Semiconductor Manufacturing Co. Ltd., ADR |
|
98,658 |
11,741,288 |
| United
Microelectronics Corp. |
|
603,000 |
1,372,952 |
| |
|
|
|
$19,257,528 |
Portfolio of
Investments – continued
| Issuer
|
|
|
Shares/Par
|
Value
($) |
| Common
Stocks – continued |
| Energy
- Independent – 1.5% |
|
| Aker
BP ASA |
|
48,444 |
$
1,264,834 |
| China
Shenhua Energy Co. Ltd. |
|
1,074,500
|
2,379,043 |
| Tourmaline
Oil Corp. |
|
102,364 |
2,737,496 |
| |
|
|
|
$6,381,373 |
| Energy
- Integrated – 2.6% |
|
| China
Petroleum & Chemical Corp. |
|
6,004,000
|
$
2,910,347 |
| Eni
S.p.A. |
|
110,675 |
1,366,124 |
| Galp
Energia SGPS S.A., “B” |
|
159,941 |
1,638,089 |
| LUKOIL
PJSC, ADR |
|
46,575 |
3,984,491 |
| PetroChina
Co. Ltd. |
|
2,294,000
|
1,005,798 |
| |
|
|
|
$10,904,849 |
| Engineering
- Construction – 0.3% |
|
| Doosan
Bobcat, Inc. (a) |
|
20,041 |
$
749,301 |
| Zoomlion
Heavy Industry Science and Technology Co., Ltd. |
|
630,600 |
600,807 |
| |
|
|
|
$1,350,108 |
| Food
& Beverages – 2.6% |
|
| Coca-Cola
Europacific Partners PLC |
|
72,756 |
$
4,200,931 |
| Gruma
S.A.B. de C.V. |
|
98,983 |
1,130,439 |
| Inghams
Group Ltd. |
|
373,826 |
1,129,441 |
| Inner
Mongolia Yili Industrial Group Co. Ltd., “A” |
|
336,500 |
1,770,696 |
| JBS
S.A. |
|
204,395 |
1,232,110 |
| Nestle
S.A. |
|
11,280 |
1,425,659 |
| |
|
|
|
$10,889,276 |
| Food
& Drug Stores – 1.3% |
|
| Seven
& I Holdings Co. Ltd. |
|
99,600 |
$
4,359,169 |
| Sugi
Holdings Co. Ltd. (l) |
|
15,000 |
1,158,933 |
| |
|
|
|
$5,518,102 |
| Gaming
& Lodging – 1.1% |
|
| Flutter
Entertainment PLC (a) |
|
8,826 |
$
1,716,910 |
| Tabcorp
Holdings Ltd. |
|
837,775 |
2,935,667 |
| |
|
|
|
$4,652,577 |
| General
Merchandise – 1.3% |
|
| B&M
European Value Retail S.A. |
|
330,123 |
$
2,537,131 |
| Bim
Birlesik Magazalar A.S. |
|
137,585 |
1,188,659 |
| Walmart
de Mexico S.A.B. de C.V. |
|
525,576 |
1,870,029 |
| |
|
|
|
$5,595,819 |
Portfolio of
Investments – continued
| Issuer
|
|
|
Shares/Par
|
Value
($) |
| Common
Stocks – continued |
| Insurance
– 4.6% |
|
| China
Pacific Insurance Co. Ltd. |
|
1,164,600
|
$
3,279,319 |
| Fairfax
Financial Holdings Ltd. |
|
9,907 |
4,385,339 |
| iA
Financial Corp., Inc. |
|
25,030 |
1,387,943 |
| Manulife
Financial Corp. |
|
264,442 |
5,149,875 |
| PICC
Property & Casualty Co. Ltd. |
|
1,998,000
|
1,805,983 |
| Samsung
Fire & Marine Insurance Co. Ltd. |
|
19,265 |
3,755,134 |
| |
|
|
|
$19,763,593 |
| Internet
– 1.9% |
|
| Alibaba
Group Holding Ltd., ADR (a) |
|
7,843 |
$
1,309,703 |
| Tencent
Holdings Ltd. |
|
107,900 |
6,675,900 |
| |
|
|
|
$7,985,603 |
| Leisure
& Toys – 1.6% |
|
| DeNA
Co. Ltd. |
|
62,100 |
$
1,092,811 |
| GungHo
Online Entertainment, Inc. |
|
140,000 |
2,727,083 |
| Nintendo
Co. Ltd. |
|
2,900 |
1,394,446 |
| SEGA
SAMMY Holdings, Inc. |
|
132,400 |
1,788,360 |
| |
|
|
|
$7,002,700 |
| Machinery
& Tools – 2.4% |
|
| Epiroc
AB |
|
270,612 |
$
5,937,851 |
| GEA
Group AG |
|
95,234 |
4,397,825 |
| |
|
|
|
$10,335,676 |
| Major
Banks – 9.0% |
|
| ABSA
Group Ltd. |
|
152,557 |
$
1,659,866 |
| Bank
of China Ltd. |
|
2,615,000
|
917,904 |
| Bank
of Ireland Group PLC (a) |
|
281,721 |
1,771,652 |
| Bank
of Nova Scotia |
|
13,149 |
814,485 |
| Barclays
PLC |
|
1,078,320
|
2,741,195 |
| BNP
Paribas |
|
83,669 |
5,308,105 |
| China
Construction Bank Corp. |
|
5,098,000
|
3,683,824 |
| DBS
Group Holdings Ltd. |
|
294,300 |
6,560,431 |
| Industrial
& Commercial Bank of China, “H” |
|
1,433,000
|
799,648 |
| National
Australia Bank Ltd. |
|
131,593 |
2,669,479 |
| NatWest
Group PLC |
|
946,443 |
2,772,894 |
| Toronto-Dominion
Bank |
|
34,942 |
2,269,091 |
| UBS
Group AG |
|
391,680 |
6,535,485 |
| |
|
|
|
$38,504,059 |
| Medical
& Health Technology & Services – 0.4% |
|
| Miraca
Holdings, Inc. |
|
58,200 |
$
1,719,311 |
Portfolio of
Investments – continued
| Issuer
|
|
|
Shares/Par
|
Value
($) |
| Common
Stocks – continued |
| Medical
Equipment – 1.7% |
|
| Koninklijke
Philips N.V. |
|
119,108 |
$
5,490,462 |
| Olympus
Corp. |
|
38,400 |
806,813 |
| Top
Glove Corp. |
|
837,300 |
805,677 |
| |
|
|
|
$7,102,952 |
| Metals
& Mining – 4.9% |
|
| ArcelorMittal
S.A. |
|
100,539 |
$
3,370,812 |
| Glencore
PLC |
|
782,884 |
3,523,964 |
| JFE
Holdings, Inc. |
|
70,000 |
1,135,754 |
| POSCO
|
|
8,880 |
2,581,017 |
| Rio
Tinto PLC |
|
72,777 |
5,385,093 |
| Tata
Steel Ltd. |
|
118,983 |
2,363,526 |
| Vale
S.A. |
|
126,800 |
2,419,862 |
| |
|
|
|
$20,780,028 |
| Natural
Gas - Distribution – 0.4% |
|
| Italgas
S.p.A. |
|
269,148 |
$
1,784,110 |
| Natural
Gas - Pipeline – 0.3% |
|
| Pembina
Pipeline Corp. |
|
45,804 |
$
1,395,921 |
| Network
& Telecom – 0.9% |
|
| LM
Ericsson Telephone Co., “B” |
|
187,318 |
$
2,220,608 |
| VTech
Holdings Ltd. |
|
176,300 |
1,712,575 |
| |
|
|
|
$3,933,183 |
| Other
Banks & Diversified Financials – 2.9% |
|
| AEON
Financial Service Co. Ltd. |
|
104,600 |
$
1,231,259 |
| Hana
Financial Group, Inc. |
|
50,653 |
1,968,104 |
| Julius
Baer Group Ltd. |
|
52,745 |
3,605,610 |
| KB
Financial Group, Inc. |
|
35,093 |
1,601,121 |
| Sberbank
of Russia PJSC, ADR |
|
227,206 |
4,054,491 |
| |
|
|
|
$12,460,585 |
| Pharmaceuticals
– 6.7% |
|
| Bayer
AG |
|
79,718 |
$
4,437,620 |
| Kyowa
Kirin Co. Ltd. |
|
40,900 |
1,336,504 |
| Novartis
AG |
|
77,419 |
7,168,285 |
| Novo
Nordisk A.S., “B” |
|
75,851 |
7,559,568 |
| Roche
Holding AG |
|
20,522 |
8,241,295 |
| |
|
|
|
$28,743,272 |
Portfolio of
Investments – continued
| Issuer
|
|
|
Shares/Par
|
Value
($) |
| Common
Stocks – continued |
| Precious
Metals & Minerals – 0.4% |
|
| Impala
Platinum Holdings Ltd. |
|
56,746 |
$
870,747 |
| Sibanye-Stillwater
Ltd. |
|
209,696 |
850,260 |
| |
|
|
|
$1,721,007 |
| Printing
& Publishing – 0.8% |
|
| Transcontinental,
Inc., “A” |
|
167,142 |
$
3,235,135 |
| Railroad
& Shipping – 0.8% |
|
| Canadian
Pacific Railway Ltd. |
|
12,206 |
$
838,694 |
| Sankyu,
Inc. |
|
55,700 |
2,597,291 |
| |
|
|
|
$3,435,985 |
| Real
Estate – 1.9% |
|
| Aldar
Properties PJSC |
|
2,327,413
|
$
2,629,559 |
| Ascendas
India Trust, REIT |
|
1,039,300
|
1,120,893 |
| BR
Malls Participacoes S.A. (a) |
|
775,800 |
1,354,814 |
| Goodman
Group, REIT |
|
67,638 |
1,144,486 |
| LEG
Immobilien SE |
|
12,026 |
1,916,960 |
| |
|
|
|
$8,166,712 |
| Restaurants
– 1.1% |
|
| Yum
China Holdings, Inc. |
|
74,041 |
$
4,557,964 |
| Special
Products & Services – 0.7% |
|
| Tisco
Financial Group PCL |
|
1,008,600
|
$
2,941,391 |
| Specialty
Chemicals – 1.7% |
|
| Linde
PLC |
|
9,217 |
$
2,907,932 |
| Nitto
Denko Corp. |
|
44,700 |
3,396,737 |
| Orbia
Advance Corp. S.A.B. de C.V. |
|
404,705 |
1,155,436 |
| |
|
|
|
$7,460,105 |
| Specialty
Stores – 2.1% |
|
| JD.com,
Inc., ADR (a) |
|
22,512 |
$
1,768,543 |
| NEXT
PLC |
|
28,106 |
3,056,546 |
| Zalando
SE (a) |
|
11,414 |
1,264,150 |
| ZOZO,
Inc. |
|
69,800 |
2,661,555 |
| |
|
|
|
$8,750,794 |
| Telecommunications
- Wireless – 1.8% |
|
| KDDI
Corp. |
|
80,300 |
$
2,459,765 |
| Vodafone
Group PLC |
|
3,168,017
|
5,312,027 |
| |
|
|
|
$7,771,792 |
| Telephone
Services – 0.4% |
|
| Hellenic
Telecommunications Organization S.A. |
|
88,260 |
$
1,736,710 |
Portfolio of
Investments – continued
| Issuer
|
|
|
Shares/Par
|
Value
($) |
| Common
Stocks – continued |
| Tobacco
– 2.2% |
|
| British
American Tobacco PLC |
|
116,911 |
$
4,386,461 |
| Imperial
Tobacco Group PLC |
|
82,947 |
1,757,922 |
| Japan
Tobacco, Inc. |
|
169,900 |
3,293,294 |
| |
|
|
|
$9,437,677 |
| Trucking
– 0.5% |
|
| Yamato
Holdings Co. Ltd. |
|
81,000 |
$
2,061,537 |
| Utilities
- Electric Power – 3.4% |
|
| CLP
Holdings Ltd. |
|
236,000 |
$
2,359,257 |
| E.ON
SE |
|
392,044 |
5,174,365 |
| Electricite
de France S.A. |
|
65,576 |
888,496 |
| Energisa
S.A., IEU |
|
286,900 |
2,461,854 |
| Iberdrola
S.A. |
|
208,519 |
2,583,962 |
| Terna
Participacoes S.A., IEU |
|
116,663 |
855,321 |
| |
|
|
|
$14,323,255 |
| Total
Common Stocks (Identified Cost, $338,488,200) |
|
$
423,074,699 |
| Investment
Companies (h) – 1.6% |
| Money
Market Funds – 1.6% |
|
| MFS
Institutional Money Market Portfolio, 0.04% (v) (Identified Cost, $6,933,837) |
|
|
6,933,837
|
$
6,933,837 |
| |
| |
| Other
Assets, Less Liabilities – (0.5)% |
|
(2,179,000) |
| Net
Assets – 100.0% |
$
427,829,536 |
| (a)
|
Non-income
producing security. |
|
|
|
| (h)
|
An
affiliated issuer, which may be considered one in which the fund owns 5% or more of the outstanding voting securities, or a company which is under common control. At period end, the aggregate values of the fund's investments in affiliated issuers
and in unaffiliated issuers were $6,933,837 and $423,074,699, respectively. |
|
|
|
| (l)
|
A
portion of this security is on loan. See Note 2 for additional information. |
|
|
|
| (n)
|
Securities
exempt from registration under Rule 144A of the Securities Act of 1933. These securities may be sold in the ordinary course of business in transactions exempt from registration, normally to qualified institutional buyers. At period end, the
aggregate value of these securities was $2,480,578, representing 0.6% of net assets. |
|
|
|
| (v)
|
Affiliated
issuer that is available only to investment companies managed by MFS. The rate quoted for the MFS Institutional Money Market Portfolio is the annualized seven-day yield of the fund at period end. |
|
|
|
Portfolio of
Investments – continued
| The
following abbreviations are used in this report and are defined: |
| ADR
|
American
Depositary Receipt |
| IEU
|
International
Equity Unit |
| PCL
|
Public
Company Limited |
| REIT
|
Real
Estate Investment Trust |
See Notes to
Financial Statements
Financial Statements
Statement of Assets and Liabilities
At 8/31/21
This statement represents your fund’s balance sheet,
which details the assets and liabilities comprising the total value of the fund.
| Assets
|
|
| Investments
in unaffiliated issuers, at value, including $147,901 of securities on loan (identified cost, $338,488,200) |
$423,074,699
|
| Investments
in affiliated issuers, at value (identified cost, $6,933,837) |
6,933,837
|
| Foreign
currency, at value (identified cost, $16,142) |
16,154
|
| Receivables
for |
|
| Fund
shares sold |
964,021
|
| Interest
and dividends |
2,000,911
|
| Other
assets |
340
|
| Total
assets |
$432,989,962
|
| Liabilities
|
|
| Payables
for |
|
| Investments
purchased |
$4,444,874
|
| Fund
shares reacquired |
123,506
|
| Payable
to affiliates |
|
| Investment
adviser |
1,175
|
| Administrative
services fee |
364
|
| Shareholder
servicing costs |
20,999
|
| Distribution
and service fees |
1,565
|
| Payable
for independent Trustees' compensation |
9
|
| Deferred
country tax expense payable |
367,386
|
| Accrued
expenses and other liabilities |
200,548
|
| Total
liabilities |
$5,160,426
|
| Net
assets |
$427,829,536
|
| Net
assets consist of |
|
| Paid-in
capital |
$326,774,754
|
| Total
distributable earnings (loss) |
101,054,782
|
| Net
assets |
$427,829,536
|
| Shares
of beneficial interest outstanding |
31,060,693
|
Statement of Assets and
Liabilities – continued
| |
Net
assets |
Shares
outstanding |
Net
asset value
per share (a) |
| Class
A |
$110,105,695
|
8,031,430
|
$13.71
|
| Class
B |
210,059
|
15,433
|
13.61
|
| Class
C |
382,097
|
28,107
|
13.59
|
| Class
I |
22,324,888
|
1,619,656
|
13.78
|
| Class
R1 |
232,918
|
17,240
|
13.51
|
| Class
R2 |
403,554
|
29,403
|
13.72
|
| Class
R3 |
394,509
|
28,546
|
13.82
|
| Class
R4 |
81,103
|
5,882
|
13.79
|
| Class
R6 |
293,694,713
|
21,284,996
|
13.80
|
| (a)
|
Maximum
offering price per share was equal to the net asset value per share for all share classes, except for Class A, for which the maximum offering price per share was $14.55 [100 / 94.25 x $13.71]. On sales of $50,000 or more, the maximum offering price
of Class A shares is reduced. A contingent deferred sales charge may be imposed on redemptions of Class A, Class B, and Class C shares. Redemption price per share was equal to the net asset value per share for Classes I, R1, R2, R3, R4, and R6.
|
See Notes to Financial Statements
Financial Statements
Statement of Operations
Year ended 8/31/21
This statement describes how much your fund earned in
investment income and accrued in expenses. It also describes any gains and/or losses generated by fund operations.
| Net
investment income (loss) |
|
| Income
|
|
| Dividends
|
$14,560,464
|
| Other
|
40,098
|
| Income
on securities loaned |
3,563
|
| Dividends
from affiliated issuers |
1,688
|
| Foreign
taxes withheld |
(1,239,560)
|
| Total
investment income |
$13,366,253
|
| Expenses
|
|
| Management
fee |
$1,984,881
|
| Distribution
and service fees |
267,825
|
| Shareholder
servicing costs |
118,312
|
| Administrative
services fee |
61,724
|
| Independent
Trustees' compensation |
8,086
|
| Custodian
fee |
173,078
|
| Shareholder
communications |
8,873
|
| Audit
and tax fees |
98,583
|
| Legal
fees |
2,910
|
| Miscellaneous
|
163,272
|
| Total
expenses |
$2,887,544
|
| Reduction
of expenses by investment adviser |
(341,473)
|
| Net
expenses |
$2,546,071
|
| Net
investment income (loss) |
$10,820,182
|
| Realized
and unrealized gain (loss) |
| Realized
gain (loss) (identified cost basis) |
|
| Unaffiliated
issuers (net of $388,507 country tax) |
$39,523,422
|
| Foreign
currency |
(5,336)
|
| Net
realized gain (loss) |
$39,518,086
|
| Change
in unrealized appreciation or depreciation |
|
| Unaffiliated
issuers (net of $367,385 increase in deferred country tax) |
$51,134,590
|
| Translation
of assets and liabilities in foreign currencies |
(19,073)
|
| Net
unrealized gain (loss) |
$51,115,517
|
| Net
realized and unrealized gain (loss) |
$90,633,603
|
| Change
in net assets from operations |
$101,453,785
|
See Notes to Financial
Statements
Financial Statements
Statements of Changes in Net Assets
These statements describe the increases and/or decreases in
net assets resulting from operations, any distributions, and any shareholder transactions.
| |
Year
ended |
| |
8/31/21
|
8/31/20
|
| Change
in net assets |
|
|
| From
operations |
|
|
| Net
investment income (loss) |
$10,820,182
|
$8,341,490
|
| Net
realized gain (loss) |
39,518,086
|
(22,018,905)
|
| Net
unrealized gain (loss) |
51,115,517
|
38,954,335
|
| Change
in net assets from operations |
$101,453,785
|
$25,276,920
|
| Total
distributions to shareholders |
$(8,950,028)
|
$(9,250,211)
|
| Change
in net assets from fund share transactions |
$(11,853,510)
|
$36,975,806
|
| Total
change in net assets |
$80,650,247
|
$53,002,515
|
| Net
assets |
|
|
| At
beginning of period |
347,179,289
|
294,176,774
|
| At
end of period |
$427,829,536
|
$347,179,289
|
See Notes to Financial
Statements
Financial
Statements
Financial Highlights
The financial highlights table is intended to help you
understand the fund's financial performance for the past 5 years. Certain information reflects financial results for a single fund share. The total returns in the table represent the rate that an investor would have earned (or lost) on an investment
in the fund share class (assuming reinvestment of all distributions) held for the entire period.
| Class
A |
Year
ended |
| |
8/31/21
|
8/31/20
|
8/31/19
|
8/31/18
|
8/31/17
|
| Net
asset value, beginning of period |
$10.79
|
$10.37
|
$11.71
|
$11.85
|
$9.82
|
| Income
(loss) from investment operations |
| Net
investment income (loss) (d) |
$0.31
|
$0.25
|
$0.30
|
$0.30
|
$0.25
|
| Net
realized and unrealized gain (loss) |
2.87
|
0.47
|
(1.01)
|
(0.12)
|
1.82
|
| Total
from investment operations |
$3.18
|
$0.72
|
$(0.71)
|
$0.18
|
$2.07
|
| Less
distributions declared to shareholders |
| From
net investment income |
$(0.26)
|
$(0.30)
|
$(0.26)
|
$(0.18)
|
$(0.04)
|
| From
net realized gain |
—
|
—
|
(0.37)
|
(0.14)
|
—
|
| Total
distributions declared to shareholders |
$(0.26)
|
$(0.30)
|
$(0.63)
|
$(0.32)
|
$(0.04)
|
| Net
asset value, end of period (x) |
$13.71
|
$10.79
|
$10.37
|
$11.71
|
$11.85
|
| Total
return (%) (r)(s)(t)(x) |
29.82
|
6.85
|
(5.67)
|
1.47
|
21.15
|
Ratios
(%) (to average net assets)
and Supplemental data: |
| Expenses
before expense reductions (f) |
0.98
|
0.99
|
1.00
|
0.99
|
0.98
|
| Expenses
after expense reductions (f) |
0.89
|
0.89
|
0.89
|
0.89
|
0.89
|
| Net
investment income (loss) |
2.45
|
2.39
|
2.80
|
2.49
|
2.34
|
| Portfolio
turnover |
68
|
72
|
58
|
69
|
63
|
| Net
assets at end of period (000 omitted) |
$110,106
|
$93,455
|
$84,917
|
$88,168
|
$535
|
See Notes to Financial
Statements
Financial
Highlights – continued
| Class
B |
Year
ended |
| |
8/31/21
|
8/31/20
|
8/31/19
|
8/31/18
|
8/31/17
|
| Net
asset value, beginning of period |
$10.72
|
$10.32
|
$11.64
|
$11.75
|
$9.78
|
| Income
(loss) from investment operations |
| Net
investment income (loss) (d) |
$0.22
|
$0.17
|
$0.24
|
$0.20
|
$0.16
|
| Net
realized and unrealized gain (loss) |
2.85
|
0.47
|
(1.02)
|
(0.11)
|
1.81
|
| Total
from investment operations |
$3.07
|
$0.64
|
$(0.78)
|
$0.09
|
$1.97
|
| Less
distributions declared to shareholders |
| From
net investment income |
$(0.18)
|
$(0.24)
|
$(0.17)
|
$(0.06)
|
$—
|
| From
net realized gain |
—
|
—
|
(0.37)
|
(0.14)
|
—
|
| Total
distributions declared to shareholders |
$(0.18)
|
$(0.24)
|
$(0.54)
|
$(0.20)
|
$—
|
| Net
asset value, end of period (x) |
$13.61
|
$10.72
|
$10.32
|
$11.64
|
$11.75
|
| Total
return (%) (r)(s)(t)(x) |
28.84
|
6.06
|
(6.41)
|
0.73
|
20.14
|
Ratios
(%) (to average net assets)
and Supplemental data: |
| Expenses
before expense reductions (f) |
1.72
|
1.74
|
1.75
|
1.74
|
1.73
|
| Expenses
after expense reductions (f) |
1.64
|
1.64
|
1.64
|
1.64
|
1.64
|
| Net
investment income (loss) |
1.75
|
1.61
|
2.28
|
1.63
|
1.51
|
| Portfolio
turnover |
68
|
72
|
58
|
69
|
63
|
| Net
assets at end of period (000 omitted) |
$210
|
$148
|
$152
|
$97
|
$109
|
| Class
C |
Year
ended |
| |
8/31/21
|
8/31/20
|
8/31/19
|
8/31/18
|
8/31/17
|
| Net
asset value, beginning of period |
$10.70
|
$10.28
|
$11.59
|
$11.75
|
$9.78
|
| Income
(loss) from investment operations |
| Net
investment income (loss) (d) |
$0.23
|
$0.17
|
$0.22
|
$0.21
|
$0.16
|
| Net
realized and unrealized gain (loss) |
2.83
|
0.47
|
(1.00)
|
(0.11)
|
1.81
|
| Total
from investment operations |
$3.06
|
$0.64
|
$(0.78)
|
$0.10
|
$1.97
|
| Less
distributions declared to shareholders |
| From
net investment income |
$(0.17)
|
$(0.22)
|
$(0.16)
|
$(0.12)
|
$—
|
| From
net realized gain |
—
|
—
|
(0.37)
|
(0.14)
|
—
|
| Total
distributions declared to shareholders |
$(0.17)
|
$(0.22)
|
$(0.53)
|
$(0.26)
|
$—
|
| Net
asset value, end of period (x) |
$13.59
|
$10.70
|
$10.28
|
$11.59
|
$11.75
|
| Total
return (%) (r)(s)(t)(x) |
28.78
|
6.08
|
(6.42)
|
0.74
|
20.14
|
Ratios
(%) (to average net assets)
and Supplemental data: |
| Expenses
before expense reductions (f) |
1.72
|
1.74
|
1.75
|
1.75
|
1.73
|
| Expenses
after expense reductions (f) |
1.64
|
1.64
|
1.64
|
1.64
|
1.64
|
| Net
investment income (loss) |
1.82
|
1.64
|
2.04
|
1.73
|
1.54
|
| Portfolio
turnover |
68
|
72
|
58
|
69
|
63
|
| Net
assets at end of period (000 omitted) |
$382
|
$220
|
$240
|
$284
|
$133
|
See Notes to Financial
Statements
Financial
Highlights – continued
| Class
I |
Year
ended |
| |
8/31/21
|
8/31/20
|
8/31/19
|
8/31/18
|
8/31/17
|
| Net
asset value, beginning of period |
$10.84
|
$10.42
|
$11.77
|
$11.88
|
$9.84
|
| Income
(loss) from investment operations |
| Net
investment income (loss) (d) |
$0.38
|
$0.31
|
$0.31
|
$0.31
|
$0.29
|
| Net
realized and unrealized gain (loss) |
2.84
|
0.44
|
(1.00)
|
(0.10)
|
1.80
|
| Total
from investment operations |
$3.22
|
$0.75
|
$(0.69)
|
$0.21
|
$2.09
|
| Less
distributions declared to shareholders |
| From
net investment income |
$(0.28)
|
$(0.33)
|
$(0.29)
|
$(0.18)
|
$(0.05)
|
| From
net realized gain |
—
|
—
|
(0.37)
|
(0.14)
|
—
|
| Total
distributions declared to shareholders |
$(0.28)
|
$(0.33)
|
$(0.66)
|
$(0.32)
|
$(0.05)
|
| Net
asset value, end of period (x) |
$13.78
|
$10.84
|
$10.42
|
$11.77
|
$11.88
|
| Total
return (%) (r)(s)(t)(x) |
30.14
|
7.09
|
(5.45)
|
1.74
|
21.37
|
Ratios
(%) (to average net assets)
and Supplemental data: |
| Expenses
before expense reductions (f) |
0.72
|
0.75
|
0.75
|
0.74
|
0.73
|
| Expenses
after expense reductions (f) |
0.64
|
0.64
|
0.64
|
0.64
|
0.64
|
| Net
investment income (loss) |
2.91
|
3.06
|
2.89
|
2.50
|
2.70
|
| Portfolio
turnover |
68
|
72
|
58
|
69
|
63
|
| Net
assets at end of period (000 omitted) |
$22,325
|
$5,183
|
$1,652
|
$1,760
|
$1,259
|
| Class
R1 |
Year
ended |
| |
8/31/21
|
8/31/20
|
8/31/19
|
8/31/18
|
8/31/17
|
| Net
asset value, beginning of period |
$10.65
|
$10.24
|
$11.63
|
$11.75
|
$9.78
|
| Income
(loss) from investment operations |
| Net
investment income (loss) (d) |
$0.22
|
$0.17
|
$0.22
|
$0.19
|
$0.15
|
| Net
realized and unrealized gain (loss) |
2.82
|
0.47
|
(1.01)
|
(0.10)
|
1.82
|
| Total
from investment operations |
$3.04
|
$0.64
|
$(0.79)
|
$0.09
|
$1.97
|
| Less
distributions declared to shareholders |
| From
net investment income |
$(0.18)
|
$(0.23)
|
$(0.23)
|
$(0.07)
|
$—
|
| From
net realized gain |
—
|
—
|
(0.37)
|
(0.14)
|
—
|
| Total
distributions declared to shareholders |
$(0.18)
|
$(0.23)
|
$(0.60)
|
$(0.21)
|
$—
|
| Net
asset value, end of period (x) |
$13.51
|
$10.65
|
$10.24
|
$11.63
|
$11.75
|
| Total
return (%) (r)(s)(t)(x) |
28.83
|
6.13
|
(6.44)
|
0.72
|
20.14
|
Ratios
(%) (to average net assets)
and Supplemental data: |
| Expenses
before expense reductions (f) |
1.72
|
1.74
|
1.75
|
1.73
|
1.72
|
| Expenses
after expense reductions (f) |
1.64
|
1.64
|
1.64
|
1.64
|
1.64
|
| Net
investment income (loss) |
1.74
|
1.63
|
2.09
|
1.54
|
1.41
|
| Portfolio
turnover |
68
|
72
|
58
|
69
|
63
|
| Net
assets at end of period (000 omitted) |
$233
|
$166
|
$146
|
$60
|
$59
|
See Notes to Financial
Statements
Financial
Highlights – continued
| Class
R2 |
Year
ended |
| |
8/31/21
|
8/31/20
|
8/31/19
|
8/31/18
|
8/31/17
|
| Net
asset value, beginning of period |
$10.80
|
$10.38
|
$11.73
|
$11.84
|
$9.81
|
| Income
(loss) from investment operations |
| Net
investment income (loss) (d) |
$0.29
|
$0.22
|
$0.27
|
$0.29
|
$0.20
|
| Net
realized and unrealized gain (loss) |
2.86
|
0.47
|
(1.01)
|
(0.13)
|
1.83
|
| Total
from investment operations |
$3.15
|
$0.69
|
$(0.74)
|
$0.16
|
$2.03
|
| Less
distributions declared to shareholders |
| From
net investment income |
$(0.23)
|
$(0.27)
|
$(0.24)
|
$(0.13)
|
$(0.00)(w)
|
| From
net realized gain |
—
|
—
|
(0.37)
|
(0.14)
|
—
|
| Total
distributions declared to shareholders |
$(0.23)
|
$(0.27)
|
$(0.61)
|
$(0.27)
|
$(0.00)(w)
|
| Net
asset value, end of period (x) |
$13.72
|
$10.80
|
$10.38
|
$11.73
|
$11.84
|
| Total
return (%) (r)(s)(t)(x) |
29.50
|
6.56
|
(5.95)
|
1.27
|
20.74
|
Ratios
(%) (to average net assets)
and Supplemental data: |
| Expenses
before expense reductions (f) |
1.22
|
1.24
|
1.25
|
1.25
|
1.22
|
| Expenses
after expense reductions (f) |
1.14
|
1.14
|
1.14
|
1.14
|
1.14
|
| Net
investment income (loss) |
2.30
|
2.12
|
2.54
|
2.34
|
1.90
|
| Portfolio
turnover |
68
|
72
|
58
|
69
|
63
|
| Net
assets at end of period (000 omitted) |
$404
|
$156
|
$164
|
$167
|
$60
|
| Class
R3 |
Year
ended |
| |
8/31/21
|
8/31/20
|
8/31/19
|
8/31/18
|
8/31/17
|
| Net
asset value, beginning of period |
$10.88
|
$10.45
|
$11.80
|
$11.91
|
$9.84
|
| Income
(loss) from investment operations |
| Net
investment income (loss) (d) |
$0.29
|
$0.25
|
$0.30
|
$0.28
|
$0.23
|
| Net
realized and unrealized gain (loss) |
2.91
|
0.49
|
(1.02)
|
(0.09)
|
1.84
|
| Total
from investment operations |
$3.20
|
$0.74
|
$(0.72)
|
$0.19
|
$2.07
|
| Less
distributions declared to shareholders |
| From
net investment income |
$(0.26)
|
$(0.31)
|
$(0.26)
|
$(0.16)
|
$—
|
| From
net realized gain |
—
|
—
|
(0.37)
|
(0.14)
|
—
|
| Total
distributions declared to shareholders |
$(0.26)
|
$(0.31)
|
$(0.63)
|
$(0.30)
|
$—
|
| Net
asset value, end of period (x) |
$13.82
|
$10.88
|
$10.45
|
$11.80
|
$11.91
|
| Total
return (%) (r)(s)(t)(x) |
29.75
|
6.92
|
(5.72)
|
1.50
|
21.04
|
Ratios
(%) (to average net assets)
and Supplemental data: |
| Expenses
before expense reductions (f) |
0.96
|
0.99
|
1.00
|
0.98
|
0.97
|
| Expenses
after expense reductions (f) |
0.89
|
0.89
|
0.89
|
0.89
|
0.89
|
| Net
investment income (loss) |
2.22
|
2.37
|
2.79
|
2.29
|
2.15
|
| Portfolio
turnover |
68
|
72
|
58
|
69
|
63
|
| Net
assets at end of period (000 omitted) |
$395
|
$64
|
$58
|
$61
|
$60
|
See Notes to Financial
Statements
Financial
Highlights – continued
| Class
R4 |
Year
ended |
| |
8/31/21
|
8/31/20
|
8/31/19
|
8/31/18
|
8/31/17
|
| Net
asset value, beginning of period |
$10.85
|
$10.42
|
$11.77
|
$11.88
|
$9.84
|
| Income
(loss) from investment operations |
| Net
investment income (loss) (d) |
$0.35
|
$0.27
|
$0.33
|
$0.31
|
$0.25
|
| Net
realized and unrealized gain (loss) |
2.87
|
0.49
|
(1.02)
|
(0.10)
|
1.84
|
| Total
from investment operations |
$3.22
|
$0.76
|
$(0.69)
|
$0.21
|
$2.09
|
| Less
distributions declared to shareholders |
| From
net investment income |
$(0.28)
|
$(0.33)
|
$(0.29)
|
$(0.18)
|
$(0.05)
|
| From
net realized gain |
—
|
—
|
(0.37)
|
(0.14)
|
—
|
| Total
distributions declared to shareholders |
$(0.28)
|
$(0.33)
|
$(0.66)
|
$(0.32)
|
$(0.05)
|
| Net
asset value, end of period (x) |
$13.79
|
$10.85
|
$10.42
|
$11.77
|
$11.88
|
| Total
return (%) (r)(s)(t)(x) |
30.12
|
7.18
|
(5.45)
|
1.74
|
21.36
|
Ratios
(%) (to average net assets)
and Supplemental data: |
| Expenses
before expense reductions (f) |
0.72
|
0.74
|
0.75
|
0.73
|
0.72
|
| Expenses
after expense reductions (f) |
0.64
|
0.64
|
0.64
|
0.64
|
0.64
|
| Net
investment income (loss) |
2.73
|
2.62
|
3.04
|
2.54
|
2.41
|
| Portfolio
turnover |
68
|
72
|
58
|
69
|
63
|
| Net
assets at end of period (000 omitted) |
$81
|
$62
|
$58
|
$62
|
$60
|
| Class
R6 |
Year
ended |
| |
8/31/21
|
8/31/20
|
8/31/19
|
8/31/18
|
8/31/17
|
| Net
asset value, beginning of period |
$10.85
|
$10.43
|
$11.78
|
$11.88
|
$9.84
|
| Income
(loss) from investment operations |
| Net
investment income (loss) (d) |
$0.36
|
$0.29
|
$0.34
|
$0.32
|
$0.26
|
| Net
realized and unrealized gain (loss) |
2.88
|
0.47
|
(1.02)
|
(0.09)
|
1.84
|
| Total
from investment operations |
$3.24
|
$0.76
|
$(0.68)
|
$0.23
|
$2.10
|
| Less
distributions declared to shareholders |
| From
net investment income |
$(0.29)
|
$(0.34)
|
$(0.30)
|
$(0.19)
|
$(0.06)
|
| From
net realized gain |
—
|
—
|
(0.37)
|
(0.14)
|
—
|
| Total
distributions declared to shareholders |
$(0.29)
|
$(0.34)
|
$(0.67)
|
$(0.33)
|
$(0.06)
|
| Net
asset value, end of period (x) |
$13.80
|
$10.85
|
$10.43
|
$11.78
|
$11.88
|
| Total
return (%) (r)(s)(t)(x) |
30.32
|
7.18
|
(5.33)
|
1.86
|
21.41
|
Ratios
(%) (to average net assets)
and Supplemental data: |
| Expenses
before expense reductions (f) |
0.63
|
0.65
|
0.65
|
0.65
|
0.68
|
| Expenses
after expense reductions (f) |
0.55
|
0.55
|
0.54
|
0.54
|
0.60
|
| Net
investment income (loss) |
2.82
|
2.76
|
3.13
|
2.60
|
2.43
|
| Portfolio
turnover |
68
|
72
|
58
|
69
|
63
|
| Net
assets at end of period (000 omitted) |
$293,695
|
$247,726
|
$206,790
|
$207,449
|
$196,685
|
See Notes to Financial Statements
Financial
Highlights – continued
| (d)
|
Per share data
is based on average shares outstanding. |
| (f)
|
Ratios do
not reflect reductions from fees paid indirectly, if applicable. |
| (r)
|
Certain
expenses have been reduced without which performance would have been lower. |
| (s)
|
From time to
time the fund may receive proceeds from litigation settlements, without which performance would be lower. |
| (t)
|
Total
returns do not include any applicable sales charges. |
| (w)
|
Per share
amount was less than $0.01. |
| (x)
|
The
net asset values and total returns have been calculated on net assets which include adjustments made in accordance with U.S. generally accepted accounting principles required at period end for financial reporting purposes. |
See Notes to Financial Statements
Notes to Financial
Statements
(1) Business and Organization
MFS Blended Research International Equity Fund (the fund) is a
diversified series of MFS Series Trust IV (the trust). The trust is organized as a Massachusetts business trust and is registered under the Investment Company Act of 1940, as amended, as an open-end management investment company.
The fund is an investment company and accordingly follows the
investment company accounting and reporting guidance of the Financial Accounting Standards Board (FASB) Accounting Standards Codification Topic 946 Financial Services - Investment Companies.
(2) Significant Accounting Policies
General — The preparation
of financial statements in conformity with U.S. generally accepted accounting principles requires management to make estimates and assumptions that affect the reported amounts of assets and liabilities, and disclosure of contingent assets and
liabilities at the date of the financial statements and the reported amounts of increases and decreases in net assets from operations during the reporting period. Actual results could differ from those estimates. In the preparation of these
financial statements, management has evaluated subsequent events occurring after the date of the fund’s Statement of Assets and Liabilities through the date that the financial statements were issued.
The fund invests in foreign securities, including securities of emerging market issuers. Investments in foreign securities are vulnerable to the effects of changes in the relative values of the local currency and the U.S. dollar and to the effects
of changes in each country’s market, economic, industrial, political, regulatory, geopolitical, environmental, public health, and other conditions. Investments in emerging markets can involve additional and greater risks than the risks
associated with investments in developed foreign markets. Emerging markets can have less developed markets, greater custody and operational risk, less developed legal, regulatory, accounting, and auditing systems, and greater political, social, and
economic instability than developed markets.
Certain of the fund's investments, including its investments in
derivatives, as well as any debt issued by the fund and other contractual arrangements of the fund may be based on reference interest rates such as the London Interbank Offered Rate (“LIBOR”). In 2017, the regulatory authority that
oversees financial services firms in the United Kingdom announced plans to transition away from LIBOR by the end of 2021. In March 2021, the administrator of LIBOR announced the extension of the publication of the more commonly used U.S. dollar
LIBOR settings to the end of June 2023. Although the full impacts of the transition away from LIBOR are not fully known, the transition may result in, among other things, an increase in volatility or illiquidity of the markets for instruments that
currently rely on LIBOR to determine interest rates and this could have an adverse impact on the fund's performance. With respect to the fund's accounting for investments, including its investments in derivatives, as well as any debt issued by the
fund and other contractual arrangements of the fund that undergo reference rate-related modifications as a result of the transition, management will rely upon the relief provided by FASB Codification Topic 848 – Reference Rate Reform (Topic
848). The guidance in Topic 848 permits the fund to disregard the GAAP accounting requirements around certain contract modifications resulting from the LIBOR transition such that for contracts considered in scope, the fund can account for those
modified contracts as a continuation of the existing contracts.
Notes to Financial
Statements - continued
Balance Sheet Offsetting
— The fund's accounting policy with respect to balance sheet offsetting is that, absent an event of default by the counterparty or a termination of the agreement, the International Swaps and Derivatives Association (ISDA) Master Agreement, or
similar agreement, does not result in an offset of reported amounts of financial assets and financial liabilities in the Statement of Assets and Liabilities across transactions between the fund and the applicable counterparty. The fund's right to
setoff may be restricted or prohibited by the bankruptcy or insolvency laws of the particular jurisdiction to which a specific master netting agreement counterparty is subject. Balance sheet offsetting disclosures, to the extent applicable to the
fund, have been included in the fund’s Significant Accounting Policies note under the captions for each of the fund’s in-scope financial instruments and transactions.
Investment Valuations
— Equity securities, including restricted equity securities, are generally valued at the last sale or official closing price on their primary market or exchange as provided by a third-party pricing
service. Equity securities, for which there were no sales reported that day, are generally valued at the last quoted daily bid quotation on their primary market or exchange as provided by a third-party pricing service. Short-term instruments with a maturity at issuance of 60 days or less may be valued at amortized cost, which approximates market value. Open-end investment companies are
generally valued at net asset value per share. Securities and other assets generally valued on the basis of information from a third-party pricing service may also be valued at a broker/dealer bid
quotation. In determining values, third-party pricing services can utilize both transaction data and market information such as yield, quality, coupon rate, maturity, type of issue, trading characteristics,
and other market data. The values of foreign securities and other assets and liabilities expressed in foreign currencies are converted to U.S. dollars using the mean of bid and asked prices for rates provided
by a third-party pricing service.
The Board of
Trustees has delegated primary responsibility for determining or causing to be determined the value of the fund’s investments (including any fair valuation) to the adviser pursuant to valuation policies and procedures approved by the Board. If
the adviser determines that reliable market quotations are not readily available, investments are valued at fair value as determined in good faith by the adviser in accordance with such procedures under the oversight of the Board of Trustees. Under
the fund’s valuation policies and procedures, market quotations are not considered to be readily available for most types of debt instruments and floating rate loans and many types of derivatives. These investments are generally valued at fair
value based on information from third-party pricing services. In addition, investments may be valued at fair value if the adviser determines that an investment’s value has been materially affected by events occurring after the close of the
exchange or market on which the investment is principally traded (such as foreign exchange or market) and prior to the determination of the fund’s net asset value, or after the halt of trading of a specific security where trading does not
resume prior to the close of the exchange or market on which the security is principally traded. Events that occur after foreign markets close (such as developments in foreign markets and significant movements in the U.S. markets) and prior to the
determination of the fund’s net asset value may be deemed to have a material effect on the value of securities traded in foreign markets. Accordingly, the fund’s foreign equity securities may often be valued at fair value. The adviser
generally relies on third-party pricing services or other information (such as the correlation with price movements of similar securities in the same or other markets; the type, cost and investment characteristics of the security; the business and
financial condition of the
Notes to Financial
Statements - continued
issuer; and trading and other market data) to assist in determining whether to
fair value and at what value to fair value an investment. The value of an investment for purposes of calculating the fund’s net asset value can differ depending on the source and method used to determine value. When fair valuation is used, the
value of an investment used to determine the fund’s net asset value may differ from quoted or published prices for the same investment. There can be no assurance that the fund could obtain the fair value assigned to an investment if it were to
sell the investment at the same time at which the fund determines its net asset value per share.
Various inputs are used in determining the value of the fund's
assets or liabilities. These inputs are categorized into three broad levels. In certain cases, the inputs used to measure fair value may fall into different levels of the fair value hierarchy. In such cases, an investment's level within the fair
value hierarchy is based on the lowest level of input that is significant to the fair value measurement. The fund's assessment of the significance of a particular input to the fair value measurement in its entirety requires judgment, and considers
factors specific to the investment. Level 1 includes unadjusted quoted prices in active markets for identical assets or liabilities. Level 2 includes other significant observable market-based inputs (including quoted prices for similar securities,
interest rates, prepayment speed, and credit risk). Level 3 includes unobservable inputs, which may include the adviser's own assumptions in determining the fair value of investments. The following is a summary of the levels used as of August 31,
2021 in valuing the fund's assets or liabilities:
| Financial
Instruments |
Level
1 |
Level
2 |
Level
3 |
Total
|
| Equity
Securities: |
|
|
|
|
| Japan
|
$58,059,104
|
$—
|
$—
|
$58,059,104
|
| United
Kingdom |
46,828,148
|
—
|
—
|
46,828,148
|
| France
|
38,732,059
|
—
|
—
|
38,732,059
|
| China
|
38,560,007
|
—
|
—
|
38,560,007
|
| Canada
|
33,742,114
|
—
|
—
|
33,742,114
|
| Switzerland
|
31,317,101
|
—
|
—
|
31,317,101
|
| South
Korea |
24,384,900
|
—
|
—
|
24,384,900
|
| Germany
|
17,190,920
|
—
|
—
|
17,190,920
|
| Taiwan
|
17,031,909
|
—
|
—
|
17,031,909
|
| Other
Countries |
114,287,046
|
2,941,391
|
—
|
117,228,437
|
| Mutual
Funds |
6,933,837
|
—
|
—
|
6,933,837
|
| Total
|
$427,067,145
|
$2,941,391
|
$—
|
$430,008,536
|
For further information regarding
security characteristics, see the Portfolio of Investments.
Foreign Currency Translation
— Purchases and sales of foreign investments, income, and expenses are converted into U.S. dollars based upon currency exchange rates prevailing on the respective dates of such transactions or on the reporting date for foreign denominated
receivables and payables. Gains and losses attributable to foreign currency exchange rates on sales of securities are recorded for financial statement purposes as net realized gains and losses on investments. Gains and losses attributable to foreign
exchange rate movements on receivables, payables, income and expenses
Notes to Financial
Statements - continued
are recorded for financial statement purposes as foreign currency transaction
gains and losses. That portion of both realized and unrealized gains and losses on investments that results from fluctuations in foreign currency exchange rates is not separately disclosed.
Security Loans — Under
its Securities Lending Agency Agreement with the fund, State Street Bank and Trust Company, as lending agent, loans the securities of the fund to certain qualified institutions (the “Borrowers”) approved by the fund. Security loans can
be terminated at the discretion of either the lending agent or the fund and the related securities must be returned within the earlier of the standard trade settlement period for such securities or within three business days. The loans are
collateralized by cash and/or U.S. Treasury and federal agency obligations in an amount typically at least equal to the market value of the securities loaned. On loans collateralized by cash, the cash collateral is invested in a money market fund.
The market value of the loaned securities is determined at the close of business of the fund and any additional required collateral is delivered to the fund on the next business day. The lending agent provides the fund with indemnification against
Borrower default. In the event of Borrower default, the lending agent will, for the benefit of the fund, either purchase securities identical to those loaned or, when such purchase is commercially impracticable, pay the fund the market value of the
loaned securities. In return, the lending agent assumes the fund's rights to the related collateral. If the collateral value is less than the cost to purchase identical securities, the lending agent is responsible for the shortfall, but only to the
extent that such shortfall is not due to a decline in collateral value resulting from collateral reinvestment for which the fund bears the risk of loss. At period end, the fund had investment securities on loan, all of which were classified as
equity securities in the fund’s Portfolio of Investments, with a fair value of $147,901. The fair value of the fund’s investment securities on loan is presented gross in the Statement of Assets and Liabilities. These loans were
collateralized by U.S. Treasury Obligations of $155,809 held by the lending agent. The collateral on securities loaned exceeded the value of securities on loan at period end. A portion of the income generated upon investment of the collateral is
remitted to the Borrowers, and the remainder is allocated between the fund and the lending agent. On loans collateralized by U.S. Treasury and/or federal agency obligations, a fee is received from the Borrower, and is allocated between the fund and
the lending agent. Income from securities lending is separately reported in the Statement of Operations. The dividend and interest income earned on the securities loaned is accounted for in the same manner as other dividend and interest
income.
Indemnifications — Under the fund's organizational documents, its officers and Trustees may be indemnified against certain liabilities and expenses arising out of the performance of their duties to the fund. Additionally, in the
normal course of business, the fund enters into agreements with service providers that may contain indemnification clauses. The fund's maximum exposure under these agreements is unknown as this would involve future claims that may be made against
the fund that have not yet occurred.
Investment
Transactions and Income — Investment transactions are recorded on the trade date. Dividends received in cash are recorded on the ex-dividend date. Certain dividends
from foreign securities will be recorded when the fund is informed of the dividend if such information is obtained subsequent to the ex-dividend date. Dividend payments received in additional securities are recorded on the ex-dividend date in an
amount equal to the value of the security on such date.
Notes to Financial
Statements - continued
The fund may receive proceeds from litigation settlements. Any
proceeds received from litigation involving portfolio holdings are reflected in the Statement of Operations in realized gain/loss if the security has been disposed of by the fund or in unrealized gain/loss if the security is still held by the fund.
Any other proceeds from litigation not related to portfolio holdings are reflected as other income in the Statement of Operations.
Tax Matters and Distributions
— The fund intends to qualify as a regulated investment company, as defined under Subchapter M of the Internal Revenue Code, and to distribute all of its taxable income, including realized capital gains. As a result, no provision for federal
income tax is required. The fund’s federal tax returns, when filed, will remain subject to examination by the Internal Revenue Service for a three year period. Management has analyzed the fund’s tax positions taken on federal and state
tax returns for all open tax years and does not believe that there are any uncertain tax positions that require recognition of a tax liability. Foreign taxes, if any, have been accrued by the fund in the accompanying financial statements in
accordance with the applicable foreign tax law. Foreign income taxes may be withheld by certain countries in which the fund invests. Additionally, capital gains realized by the fund on securities issued in or by certain foreign countries may be
subject to capital gains tax imposed by those countries.
Distributions to shareholders are recorded on the ex-dividend
date. Income and capital gain distributions are determined in accordance with income tax regulations, which may differ from U.S. generally accepted accounting principles. Certain capital accounts in the financial statements are periodically adjusted
for permanent differences in order to reflect their tax character. These adjustments have no impact on net assets or net asset value per share. Temporary differences which arise from recognizing certain items of income, expense, gain or loss in
different periods for financial statement and tax purposes will reverse at some time in the future.
Book/tax differences primarily relate to passive foreign
investment companies, wash sale loss deferrals, and treating a portion of the proceeds from redemptions as a distribution for tax purposes.
The tax character of distributions declared to shareholders for
the last two fiscal years is as follows:
| |
Year
ended
8/31/21 |
Year
ended
8/31/20 |
| Ordinary
income (including any short-term capital gains) |
$8,950,028
|
$9,250,211
|
Notes to Financial
Statements - continued
The federal tax cost and the tax basis components of
distributable earnings were as follows:
| As
of 8/31/21 |
|
| Cost
of investments |
$354,113,367
|
| Gross
appreciation |
87,859,349
|
| Gross
depreciation |
(11,964,180)
|
| Net
unrealized appreciation (depreciation) |
$
75,895,169 |
| Undistributed
ordinary income |
19,435,058
|
| Undistributed
long-term capital gain |
5,733,288
|
| Other
temporary differences |
(8,733)
|
| Total
distributable earnings (loss) |
$101,054,782
|
Multiple Classes of Shares of
Beneficial Interest — The fund offers multiple classes of shares, which differ in their respective distribution and service fees. The fund's income, realized and unrealized gain (loss), and common expenses are
allocated to shareholders based on the daily net assets of each class. Dividends are declared separately for each class. Differences in per share dividend rates are generally due to differences in separate class expenses. Class B and Class C shares
will convert to Class A shares approximately eight years after purchase. The fund’s distributions declared to shareholders as reported in the Statements of Changes in Net Assets are presented by class as follows:
| |
Year
ended
8/31/21 |
|
Year
ended
8/31/20 |
| Class
A |
$2,240,922
|
|
$2,350,834
|
| Class
B |
2,386
|
|
3,422
|
| Class
C |
3,123
|
|
4,533
|
| Class
I |
110,356
|
|
51,103
|
| Class
R1 |
2,896
|
|
3,314
|
| Class
R2 |
3,338
|
|
3,830
|
| Class
R3 |
1,512
|
|
1,725
|
| Class
R4 |
1,633
|
|
1,860
|
| Class
R6 |
6,583,862
|
|
6,829,590
|
| Total
|
$8,950,028
|
|
$9,250,211
|
(3) Transactions with
Affiliates
Investment Adviser — The fund has an investment advisory agreement with MFS to provide overall investment management and related administrative services and facilities to the fund. The
management fee is computed daily and paid monthly at the following annual rates based on the fund's average daily net assets:
| Up
to $1 billion |
0.50%
|
| In
excess of $1 billion and up to $2.5 billion |
0.475%
|
| In
excess of $2.5 billion |
0.45%
|
MFS has agreed in writing to reduce
its management fee by a specified amount if certain MFS mutual fund assets exceed thresholds agreed to by MFS and the fund's Board of Trustees. For the year ended August 31, 2021, this management fee reduction
Notes to Financial
Statements - continued
amounted to $47,145, which is included in the reduction of total expenses in
the Statement of Operations. The management fee incurred for the year ended August 31, 2021 was equivalent to an annual effective rate of 0.49% of the fund's average daily net assets.
The investment adviser has agreed in writing to pay a portion
of the fund’s total annual operating expenses, excluding interest, taxes, extraordinary expenses, brokerage and transaction costs, and investment-related expenses, such that total fund operating expenses do not exceed the following rates
annually of each class’s average daily net assets:
| Classes
|
| A
|
B
|
C
|
I
|
R1
|
R2
|
R3
|
R4
|
R6
|
| 0.89%
|
1.64%
|
1.64%
|
0.64%
|
1.64%
|
1.14%
|
0.89%
|
0.64%
|
0.60%
|
This written agreement will continue
until modified by the fund’s Board of Trustees, but such agreement will continue at least until December 31, 2022. For the year ended August 31, 2021, this reduction amounted to $294,327, which is included in the reduction of total expenses in
the Statement of Operations.
Distributor — MFS Fund Distributors, Inc. (MFD), a wholly-owned subsidiary of MFS, as distributor, received $2,232 for the year ended August 31, 2021, as its portion of the initial sales charge on sales of Class A shares of
the fund.
The Board of Trustees has adopted a
distribution plan for certain share classes pursuant to Rule 12b-1 of the Investment Company Act of 1940.
The fund's distribution plan provides that the fund will pay
MFD for services provided by MFD and financial intermediaries in connection with the distribution and servicing of certain share classes. One component of the plan is a distribution fee paid to MFD and another component of the plan is a service fee
paid to MFD. MFD may subsequently pay all, or a portion, of the distribution and/or service fees to financial intermediaries.
Distribution Plan Fee Table:
| |
Distribution
Fee Rate (d) |
Service
Fee Rate (d) |
Total
Distribution
Plan (d) |
Annual
Effective
Rate (e) |
Distribution
and Service
Fee |
| Class
A |
—
|
0.25%
|
0.25%
|
0.25%
|
$
259,727 |
| Class
B |
0.75%
|
0.25%
|
1.00%
|
1.00%
|
1,771
|
| Class
C |
0.75%
|
0.25%
|
1.00%
|
1.00%
|
2,783
|
| Class
R1 |
0.75%
|
0.25%
|
1.00%
|
1.00%
|
2,025
|
| Class
R2 |
0.25%
|
0.25%
|
0.50%
|
0.50%
|
1,201
|
| Class
R3 |
—
|
0.25%
|
0.25%
|
0.25%
|
318
|
| Total
Distribution and Service Fees |
|
|
|
|
$267,825
|
| (d)
|
In
accordance with the distribution plan for certain classes, the fund pays distribution and/or service fees equal to these annual percentage rates of each class’s average daily net assets. The distribution and service fee rates disclosed by
class represent the current rates in effect at the end of the reporting period. Any rate changes, if applicable, are detailed below. |
| (e)
|
The
annual effective rates represent actual fees incurred under the distribution plan for the year ended August 31, 2021 based on each class's average daily net assets. MFD has voluntarily agreed to rebate a portion of each class's 0.25% service fee
attributable to |
Notes to Financial
Statements - continued
accounts for which there is no financial intermediary
specified on the account except for accounts attributable to MFS or its affiliates' seed money. For the year ended August 31, 2021, this rebate amounted to $1 for Class A and is included in the reduction of total expenses in the Statement of
Operations.
Certain Class A shares are subject to a
contingent deferred sales charge (CDSC) in the event of a shareholder redemption within 18 months of purchase. Class B shares are subject to a CDSC in the event of a shareholder redemption within six years of purchase. Class C shares are subject to
a CDSC in the event of a shareholder redemption within 12 months of purchase. All contingent deferred sales charges are paid to MFD and during the year ended August 31, 2021, were as follows:
| |
Amount
|
| Class
A |
$1
|
| Class
B |
—
|
| Class
C |
16
|
Shareholder Servicing Agent — MFS Service Center, Inc. (MFSC), a wholly-owned subsidiary of MFS, receives a fee from the fund for its services as shareholder servicing agent calculated as a percentage of the average daily net assets of the
fund as determined periodically under the supervision of the fund's Board of Trustees. For the year ended August 31, 2021, the fee was $2,728, which equated to 0.0007% annually of the fund's average daily net assets. MFSC also receives reimbursement
from the fund for out-of-pocket expenses, sub-accounting and other shareholder servicing costs which may be paid to affiliated and unaffiliated service providers. Class R6 shares do not incur sub-accounting fees. For the year ended August 31, 2021,
these out-of-pocket expenses, sub-accounting and other shareholder servicing costs amounted to $115,584.
Administrator — MFS
provides certain financial, legal, shareholder communications, compliance, and other administrative services to the fund. Under an administrative services agreement, the fund reimburses MFS the costs incurred to provide these services. The fund is
charged an annual fixed amount of $17,500 plus a fee based on average daily net assets. The administrative services fee incurred for the year ended August 31, 2021 was equivalent to an annual effective rate of 0.0155% of the fund's average daily net
assets.
Trustees’ and Officers’
Compensation — The fund pays compensation to independent Trustees in the form of a retainer, attendance fees, and additional compensation to Board and Committee chairpersons. The fund does not pay compensation
directly to Trustees or officers of the fund who are also officers of the investment adviser, all of whom receive remuneration from MFS for their services to the fund. Certain officers and Trustees of the fund are officers or directors of MFS, MFD,
and MFSC.
Other
— The fund invests in the MFS Institutional Money Market Portfolio which is managed by MFS and seeks current income consistent with preservation of capital and liquidity. This money market fund does not pay a
management fee to MFS but does incur investment and operating costs.
At August 31, 2021, MFS held 100% of the outstanding shares of
Class R4.
The fund is permitted to engage in purchase and
sale transactions with funds and accounts for which MFS serves as investment adviser or sub-adviser (“cross-trades”) pursuant to a policy adopted by the Board of Trustees. This policy has been designed to
Notes to Financial
Statements - continued
ensure that cross-trades conducted by the fund comply with Rule 17a-7 under
the Investment Company Act of 1940. During the year ended August 31, 2021, the fund engaged in purchase transactions pursuant to this policy, which amounted to $296,518.
The adviser has voluntarily undertaken to reimburse the fund
from its own resources on a quarterly basis for the cost of investment research embedded in the cost of the fund’s securities trades. This agreement may be rescinded at any time. For the year ended August 31, 2021, this reimbursement amounted
to $39,985, which is included in “Other” income in the Statement of Operations.
(4) Portfolio Securities
For the year ended August 31, 2021, purchases and sales of
investments, other than short-term obligations, aggregated $262,311,354 and $274,519,175, respectively.
(5) Shares of Beneficial Interest
The fund's Declaration of Trust permits the Trustees to issue
an unlimited number of full and fractional shares of beneficial interest. Transactions in fund shares were as follows:
| |
Year
ended
8/31/21 |
|
Year
ended
8/31/20 |
| |
Shares
|
Amount
|
|
Shares
|
Amount
|
| Shares
sold |
|
|
|
|
|
| Class
A |
2,252,730
|
$28,171,047
|
|
5,001,865
|
$51,610,948
|
| Class
B |
2,448
|
32,261
|
|
—
|
—
|
| Class
C |
12,655
|
164,758
|
|
4,359
|
43,607
|
| Class
I |
1,319,451
|
17,532,133
|
|
711,263
|
7,109,625
|
| Class
R1 |
1,445
|
18,227
|
|
1,039
|
10,850
|
| Class
R2 |
16,531
|
221,789
|
|
203
|
2,087
|
| Class
R3 |
22,726
|
311,705
|
|
175
|
1,846
|
| Class
R6 |
3,209,197
|
39,055,547
|
|
7,300,536
|
74,505,088
|
| |
6,837,183
|
$85,507,467
|
|
13,019,440
|
$133,284,051
|
Shares
issued to shareholders
in reinvestment of distributions |
|
|
|
|
|
| Class
A |
21,163
|
$251,840
|
|
3,856
|
$43,616
|
| Class
B |
201
|
2,386
|
|
303
|
3,422
|
| Class
C |
263
|
3,123
|
|
402
|
4,533
|
| Class
I |
9,235
|
110,356
|
|
4,506
|
51,103
|
| Class
R1 |
246
|
2,896
|
|
295
|
3,314
|
| Class
R2 |
280
|
3,338
|
|
338
|
3,830
|
| Class
R3 |
126
|
1,512
|
|
151
|
1,725
|
| Class
R4 |
137
|
1,633
|
|
164
|
1,860
|
| Class
R6 |
550,951
|
6,583,862
|
|
601,726
|
6,829,590
|
| |
582,602
|
$6,960,946
|
|
611,741
|
$6,942,993
|
Notes to Financial
Statements - continued
| |
Year
ended
8/31/21 |
|
Year
ended
8/31/20 |
| |
Shares
|
Amount
|
|
Shares
|
Amount
|
| Shares
reacquired |
|
|
|
|
|
| Class
A |
(2,904,637)
|
$(36,376,292)
|
|
(4,535,077)
|
$(48,597,862)
|
| Class
B |
(1,068)
|
(13,340)
|
|
(1,217)
|
(12,710)
|
| Class
C |
(5,381)
|
(63,879)
|
|
(7,564)
|
(78,575)
|
| Class
I |
(187,071)
|
(2,206,792)
|
|
(396,295)
|
(3,652,420)
|
| Class
R2 |
(1,844)
|
(23,962)
|
|
(1,891)
|
(20,237)
|
| Class
R3 |
(148)
|
(1,983)
|
|
(1)
|
(7)
|
| Class
R6 |
(5,303,230)
|
(65,635,675)
|
|
(4,908,892)
|
(50,889,427)
|
| |
(8,403,379)
|
$(104,321,923)
|
|
(9,850,937)
|
$(103,251,238)
|
| Net
change |
|
|
|
|
|
| Class
A |
(630,744)
|
$(7,953,405)
|
|
470,644
|
$3,056,702
|
| Class
B |
1,581
|
21,307
|
|
(914)
|
(9,288)
|
| Class
C |
7,537
|
104,002
|
|
(2,803)
|
(30,435)
|
| Class
I |
1,141,615
|
15,435,697
|
|
319,474
|
3,508,308
|
| Class
R1 |
1,691
|
21,123
|
|
1,334
|
14,164
|
| Class
R2 |
14,967
|
201,165
|
|
(1,350)
|
(14,320)
|
| Class
R3 |
22,704
|
311,234
|
|
325
|
3,564
|
| Class
R4 |
137
|
1,633
|
|
164
|
1,860
|
| Class
R6 |
(1,543,082)
|
(19,996,266)
|
|
2,993,370
|
30,445,251
|
| |
(983,594)
|
$(11,853,510)
|
|
3,780,244
|
$36,975,806
|
Effective June 1, 2019, purchases of
the fund’s Class B shares are closed to new and existing investors subject to certain exceptions. Please see the fund’s prospectus for details.
The fund is one of several mutual funds in which certain MFS
funds may invest. The MFS funds do not invest in the underlying funds for the purpose of exercising management or control. At the end of the period, the MFS Lifetime 2040 Fund, the MFS Lifetime 2030 Fund, the MFS Lifetime 2035 Fund, the MFS Lifetime
2050 Fund, the MFS Lifetime 2045 Fund, the MFS Lifetime 2055 Fund, the MFS Lifetime 2025 Fund, the MFS Lifetime Income Fund, the MFS Lifetime 2020 Fund, and the MFS Lifetime 2060 Fund were the owners of record of approximately 14%, 11%, 9%, 9%, 9%,
5%, 4%, 4%, 2%, and 2%, respectively, of the value of outstanding voting shares of the fund.
(6) Line of Credit
The fund and certain other funds managed by MFS participate in
a $1.25 billion unsecured committed line of credit of which $1 billion is reserved for use by the fund and certain other MFS U.S. funds. The line of credit is provided by a syndicate of banks under a credit agreement. Borrowings may be made for
temporary financing needs. Interest is charged to each fund, based on its borrowings, generally at a rate equal to the highest of one month LIBOR, the Federal Funds Effective Rate and the Overnight Bank Funding Rate, plus an agreed upon spread. A
commitment fee, based on the
Notes to Financial
Statements - continued
average daily, unused portion of the committed line of credit, is allocated
among the participating funds. In addition, the fund and other funds managed by MFS have established unsecured uncommitted borrowing arrangements with certain banks for temporary financing needs. Interest is charged to each fund, based on its
borrowings, at rates equal to customary reference rates plus an agreed upon spread. For the year ended August 31, 2021, the fund’s commitment fee and interest expense were $1,503 and $0, respectively, and are included in
“Miscellaneous” expense in the Statement of Operations.
(7) Investments in Affiliated Issuers
An affiliated issuer may be considered one in which the fund
owns 5% or more of the outstanding voting securities, or a company which is under common control. For the purposes of this report, the following were affiliated issuers:
| Affiliated
Issuers |
Beginning
Value |
Purchases
|
Sales
Proceeds |
Realized
Gain
(Loss) |
Change
in
Unrealized
Appreciation or
Depreciation |
Ending
Value |
| MFS
Institutional Money Market Portfolio |
$2,791,445
|
$77,051,467
|
$72,909,075
|
$—
|
$—
|
$6,933,837
|
| Affiliated
Issuers |
Dividend
Income |
Capital
Gain
Distributions |
| MFS
Institutional Money Market Portfolio |
$1,688
|
$—
|
(8) Impacts of COVID-19
The pandemic related to the global spread of novel coronavirus
disease (COVID-19), which was first detected in December 2019, has resulted in significant disruptions to global business activity and the global economy, as well as the economies of individual countries, the financial performance of individual
companies and sectors, and the securities and commodities markets in general. Multiple surges in cases globally, the availability and widespread adoption of vaccines, and the emergence of variant strains of the virus continue to create uncertainty
as to the future and long-term impacts resulting from the pandemic including impacts to the prices and liquidity of the fund's investments and the fund's performance.
Report of Independent
Registered Public Accounting Firm
To the Shareholders of
MFS Blended Research International Equity Fund and the Board of Trustees of MFS Series Trust IV
Opinion on the Financial Statements
We have audited the accompanying statement of assets and
liabilities of MFS Blended Research International Equity Fund (the “Fund”) (one of the funds constituting MFS Series Trust IV (the “Trust”)), including the portfolio of investments, as of August 31, 2021, and the related
statement of operations for the year then ended, the statements of changes in net assets for each of the two years in the period then ended, the financial highlights for each of the five years in the period then ended and the related notes
(collectively referred to as the “financial statements”). In our opinion, the financial statements present fairly, in all material respects, the financial position of the Fund (one of the funds constituting MFS Series Trust IV) at August
31, 2021, the results of its operations for the year then ended, the changes in its net assets for each of the two years in the period then ended and its financial highlights for each of the five years in the period then ended, in conformity with
U.S. generally accepted accounting principles.
Basis for
Opinion
These financial statements are the responsibility
of the Trust’s management. Our responsibility is to express an opinion on the Fund’s financial statements based on our audits. We are a public accounting firm registered with the Public Company Accounting Oversight Board (United States)
(“PCAOB”) and are required to be independent with respect to the Trust in accordance with the U.S. federal securities laws and the applicable rules and regulations of the Securities and Exchange Commission and the PCAOB.
We conducted our audits in accordance with the standards of the
PCAOB. Those standards require that we plan and perform the audit to obtain reasonable assurance about whether the financial statements are free of material misstatement, whether due to error or fraud. The Trust is not required to have, nor were we
engaged to perform, an audit of the Trust’s internal control over financial reporting. As part of our audits we are required to obtain an understanding of internal control over financial reporting but not for the purpose of expressing an
opinion on the effectiveness of the Trust’s internal control over financial reporting. Accordingly, we express no such opinion.
Report of Independent
Registered Public Accounting Firm – continued
Our audits included performing procedures to assess the risks
of material misstatement of the financial statements, whether due to error or fraud, and performing procedures that respond to those risks. Such procedures included examining, on a test basis, evidence regarding the amounts and disclosures in the
financial statements. Our procedures included confirmation of securities owned as of August 31, 2021, by correspondence with the custodian and others or by other appropriate auditing procedures where replies from others were not received. Our audits
also included evaluating the accounting principles used and significant estimates made by management, as well as evaluating the overall presentation of the financial statements. We believe that our audits provide a reasonable basis for our
opinion.
We have served as
the auditor of one or more MFS investment companies since 1993.
Boston, Massachusetts
October 15, 2021
Trustees and
Officers — Identification and Background
The Trustees and Officers of the Trust, as of October 1, 2021,
are listed below, together with their principal occupations during the past five years. (Their titles may have varied during that period.) The address of each Trustee and Officer is 111 Huntington Avenue, Boston, Massachusetts 02199-7618.
| Name,
Age |
|
Position(s)
Held with Fund |
|
Trustee/Officer
Since(h) |
|
Number
of MFS Funds overseen by the Trustee |
|
Principal
Occupations During
the Past Five Years |
|
Other
Directorships During
the Past Five Years (j) |
| INTERESTED
TRUSTEES |
|
|
Robert
J. Manning (k)
(age 57) |
|
Trustee
|
|
February
2004 |
|
136
|
|
Massachusetts
Financial Services Company, Non-Executive Chairman (since January 2021); Director; Chairman of the Board; Executive Chairman (January 2017-2020); Co-Chief Executive Officer (2015-2016) |
|
N/A
|
Michael
W. Roberge (k)
(age 55) |
|
Trustee
|
|
January
2021 |
|
136
|
|
Massachusetts
Financial Services Company, Chairman (since January 2021); Chief Executive Officer (since January 2017); Director; President (until December 2018); Chief Investment Officer (until December 2018); Co-Chief Executive Officer (until December 2016)
|
|
N/A
|
| INDEPENDENT
TRUSTEES |
|
|
John
P. Kavanaugh
(age 66) |
|
Trustee
and Chair of Trustees |
|
January
2009 |
|
136
|
|
Private
investor |
|
N/A
|
Steven
E. Buller
(age 70) |
|
Trustee
|
|
February
2014 |
|
136
|
|
Private
investor |
|
N/A
|
John
A. Caroselli
(age 67) |
|
Trustee
|
|
March
2017 |
|
136
|
|
Private
investor; JC Global Advisors, LLC (management consulting), President (since 2015) |
|
N/A
|
Maureen
R. Goldfarb
(age 66) |
|
Trustee
|
|
January
2009 |
|
136
|
|
Private
investor |
|
N/A
|
Peter
D. Jones
(age 66) |
|
Trustee
|
|
January
2019 |
|
136
|
|
Private
investor |
|
N/A
|
Trustees and Officers -
continued
| Name,
Age |
|
Position(s)
Held with Fund |
|
Trustee/Officer
Since(h) |
|
Number
of MFS Funds overseen by the Trustee |
|
Principal
Occupations During
the Past Five Years |
|
Other
Directorships During
the Past Five Years (j) |
James
W. Kilman, Jr.
(age 60) |
|
Trustee
|
|
January
2019 |
|
136
|
|
Burford
Capital Limited (finance and investment management), Senior Advisor (since May 3, 2021), Chief Financial Officer (2019 - May 2, 2021); KielStrand Capital LLC (family office), Chief Executive Officer (since 2016); Morgan Stanley & Co. (financial
services), Vice Chairman of Investment Banking, Co-Head of Diversified Financials Coverage – Financial Institutions Investment Banking Group (until 2016) |
|
Alpha-En
Corporation, Director (2016-2019) |
Clarence
Otis, Jr.
(age 65) |
|
Trustee
|
|
March
2017 |
|
136
|
|
Private
investor |
|
VF
Corporation, Director; Verizon Communications, Inc., Director; The Travelers Companies, Director |
Maryanne
L. Roepke
(age 65) |
|
Trustee
|
|
May
2014 |
|
136
|
|
Private
investor |
|
N/A
|
Laurie
J. Thomsen
(age 64) |
|
Trustee
|
|
March
2005 |
|
136
|
|
Private
investor |
|
The
Travelers Companies, Director; Dycom Industries, Inc., Director |
| Name,
Age |
|
Position(s)
Held with
Fund |
|
Trustee/Officer
Since(h) |
|
Number
of MFS Funds for which the Person is an Officer |
|
Principal
Occupations During
the Past Five Years |
| OFFICERS
|
|
|
|
|
|
|
|
|
Christopher
R. Bohane (k)
(age 47) |
|
Assistant
Secretary and Assistant Clerk |
|
July
2005 |
|
136
|
|
Massachusetts
Financial Services Company, Senior Vice President and Associate General Counsel |
Kino
Clark (k)
(age 53) |
|
Assistant
Treasurer |
|
January
2012 |
|
136
|
|
Massachusetts
Financial Services Company, Vice President |
Trustees and Officers -
continued
| Name,
Age |
|
Position(s)
Held with
Fund |
|
Trustee/Officer
Since(h) |
|
Number
of MFS Funds for which the Person is an Officer |
|
Principal
Occupations During
the Past Five Years |
John
W. Clark, Jr. (k)
(age 54) |
|
Assistant
Treasurer |
|
April
2017 |
|
136
|
|
Massachusetts
Financial Services Company, Vice President (since March 2017); Deutsche Bank (financial services), Department Head - Treasurer's Office (until February 2017) |
Thomas
H. Connors (k)
(age 62) |
|
Assistant
Secretary and Assistant Clerk |
|
September
2012 |
|
136
|
|
Massachusetts
Financial Services Company, Vice President and Senior Counsel |
David
L. DiLorenzo (k)
(age 53) |
|
President
|
|
July
2005 |
|
136
|
|
Massachusetts
Financial Services Company, Senior Vice President |
Heidi
W. Hardin (k)
(age 54) |
|
Secretary
and Clerk |
|
April
2017 |
|
136
|
|
Massachusetts
Financial Services Company, Executive Vice President and General Counsel (since March 2017); Harris Associates (investment management), General Counsel (until January 2017) |
Brian
E. Langenfeld (k)
(age 48) |
|
Assistant
Secretary and Assistant Clerk |
|
June
2006 |
|
136
|
|
Massachusetts
Financial Services Company, Vice President and Senior Counsel |
Amanda
S. Mooradian (k)
(age 42) |
|
Assistant
Secretary and Assistant Clerk |
|
September
2018 |
|
136
|
|
Massachusetts
Financial Services Company, Assistant Vice President and Senior Counsel |
Susan
A. Pereira (k)
(age 50) |
|
Assistant
Secretary and Assistant Clerk |
|
July
2005 |
|
136
|
|
Massachusetts
Financial Services Company, Vice President and Assistant General Counsel |
Kasey
L. Phillips (k)
(age 50) |
|
Assistant
Treasurer |
|
September
2012 |
|
136
|
|
Massachusetts
Financial Services Company, Vice President |
Matthew
A. Stowe (k)
(age 46) |
|
Assistant
Secretary and Assistant Clerk |
|
October
2014 |
|
136
|
|
Massachusetts
Financial Services Company, Vice President and Assistant General Counsel |
Martin
J. Wolin (k)
(age 54) |
|
Chief
Compliance Officer |
|
July
2015 |
|
136
|
|
Massachusetts
Financial Services Company, Senior Vice President and Chief Compliance Officer |
Trustees and Officers -
continued
| Name,
Age |
|
Position(s)
Held with
Fund |
|
Trustee/Officer
Since(h) |
|
Number
of MFS Funds for which the Person is an Officer |
|
Principal
Occupations During
the Past Five Years |
James
O. Yost (k)
(age 61) |
|
Treasurer
|
|
September
1990 |
|
136
|
|
Massachusetts
Financial Services Company, Senior Vice President |
| (h)
|
Date
first appointed to serve as Trustee/Officer of an MFS Fund. Each Trustee has served continuously since appointment unless indicated otherwise. For the period from December 15, 2004 until February 22, 2005, Mr. Manning served as Advisory Trustee.
From January 2012 through December 2016, Messrs. DiLorenzo and Yost served as Treasurer and Deputy Treasurer of the Funds, respectively. |
| (j)
|
Directorships
or trusteeships of companies required to report to the Securities and Exchange Commission (i.e., “public companies”). |
| (k)
|
“Interested
person” of the Trust within the meaning of the Investment Company Act of 1940 (referred to as the 1940 Act), which is the principal federal law governing investment companies like the fund, as a result of a position with MFS. The address of
MFS is 111 Huntington Avenue, Boston, Massachusetts 02199-7618. |
Each Trustee (other than Messrs. Jones, Kilman and Roberge) has
been elected by shareholders and each Trustee and Officer holds office until his or her successor is chosen and qualified or until his or her earlier death, resignation, retirement or removal. Mr. Roberge became a Trustee of the Funds on January 1,
2021 and Messrs. Jones and Kilman became Trustees of the Funds on January 1, 2019. The Trust does not hold annual meetings for the purpose of electing Trustees, and Trustees are not elected for fixed terms. Under the terms of the Board's retirement
policy, an Independent Trustee shall retire at the end of the calendar year in which he or she reaches the earlier of 75 years of age or 15 years of service on the Board (or, in the case of any Independent Trustee who joined the Board prior to 2015,
20 years of service on the Board).
Messrs. Buller, Kilman
and Otis and Ms. Roepke are members of the Trust’s Audit Committee.
Each of the Interested Trustees and certain Officers hold
comparable officer positions with certain affiliates of MFS.
Trustees and Officers -
continued
The Statement of Additional Information for a Fund includes
further information about the Trustees and is available without charge upon request by calling 1-800-225-2606.
| Investment
Adviser |
Custodian
|
Massachusetts
Financial Services Company
111 Huntington Avenue
Boston, MA 02199-7618 |
State
Street Bank and Trust Company
1 Lincoln Street
Boston, MA 02111-2900 |
| Distributor
|
Independent
Registered Public Accounting Firm |
MFS Fund
Distributors, Inc.
111 Huntington Avenue
Boston, MA 02199-7618 |
Ernst &
Young LLP
200 Clarendon Street
Boston, MA 02116 |
| Portfolio
Manager(s) |
|
Jim
Fallon
Matt Krummell
Jonathan Sage
Jed Stocks |
|
Board Review of Investment
Advisory Agreement
MFS Blended Research International
Equity Fund
The Investment Company Act of 1940 requires
that both the full Board of Trustees and a majority of the non-interested (“independent”) Trustees, voting separately, annually approve the continuation of the Fund’s investment advisory agreement with MFS. The Trustees consider
matters bearing on the Fund and its advisory arrangements at their meetings throughout the year, including a review of performance data at each regular meeting. In addition, the independent Trustees met several times by videoconference (in
accordance with Securities and Exchange Commission relief) over the course of three months beginning in May and ending in July, 2021 (“contract review meetings”) for the specific purpose of considering whether to approve the continuation
of the investment advisory agreement for the Fund and the other investment companies that the Board oversees (the “MFS Funds”). The independent Trustees were assisted in their evaluation of the Fund’s investment advisory agreement
by independent legal counsel, from whom they received separate legal advice and with whom they met separately from MFS during various contract review meetings. The independent Trustees were also assisted in this process by an independent consultant
who was retained by and reported to the independent Trustees.
In connection with their deliberations regarding the
continuation of the investment advisory agreement, the Trustees, including the independent Trustees, considered such information and factors as they believed, in light of the legal advice furnished to them and their own business judgment, to be
relevant. The investment advisory agreement for the Fund was considered separately, although the Trustees also took into account the common interests of all MFS Funds in their review. As described below, the Trustees considered the nature, quality,
and extent of the various investment advisory, administrative, and shareholder services performed by MFS under the existing investment advisory agreement and other arrangements with the Fund.
In connection with their contract review meetings, the Trustees
received and relied upon materials that included, among other items: (i) information provided by Broadridge Financial Solutions, Inc. (“Broadridge”), an independent third party, on the investment performance of the Fund for various time
periods ended December 31, 2020 and the investment performance of a group of funds with substantially similar investment classifications/objectives (the “Broadridge performance universe”), (ii) information provided by Broadridge on the
Fund’s advisory fees and other expenses and the advisory fees and other expenses of comparable funds identified by Broadridge as well as all other funds in the same investment classification/category (the “Broadridge expense group and
universe”), (iii) information provided by MFS on the advisory fees of portfolios of other clients of MFS, including institutional separate accounts and other clients, (iv) information as to whether and to what extent applicable expense
waivers, reimbursements or fee “breakpoints” are observed for the Fund, (v) information regarding MFS’ financial results and financial condition, including MFS’ and certain of its affiliates’ estimated profitability
from services performed for the Fund and the MFS Funds as a whole, and compared to MFS’ institutional business, (vi) MFS’ views regarding the outlook for the mutual fund industry and the strategic business plans of MFS, (vii)
descriptions of various functions performed by MFS for the Funds, such as compliance monitoring and portfolio trading practices, and (viii)
Board Review of Investment
Advisory Agreement - continued
information regarding the overall organization of MFS, including information
about MFS’ senior management and other personnel providing investment advisory, administrative and other services to the Fund and the other MFS Funds. The comparative performance, fee and expense information prepared and provided by Broadridge
was not independently verified and the independent Trustees did not independently verify any information provided to them by MFS.
The Trustees’ conclusion as to the continuation of the
investment advisory agreement was based on a comprehensive consideration of all information provided to the Trustees and not the result of any single factor. Some of the factors that figured particularly in the Trustees’ deliberations are
described below, although individual Trustees may have evaluated the information presented differently from one another, giving different weights to various factors. It is also important to recognize that the fee arrangements for the Fund and other
MFS Funds are the result of years of review and discussion between the independent Trustees and MFS, that certain aspects of such arrangements may receive greater scrutiny in some years than in others, and that the Trustees’ conclusions may be
based, in part, on their consideration of these same arrangements during the course of the year and in prior years.
Based on information provided by Broadridge and MFS, the
Trustees reviewed the Fund’s total return investment performance as well as the Broadridge performance universe over various time periods. The Trustees placed particular emphasis on the total return performance of the Fund’s Class I
shares in comparison to the performance of funds in its Broadridge performance universe over the five-year period ended December 31, 2020, which the Trustees believed was a long enough period to reflect differing market conditions. The total return
performance of the Fund’s Class I shares was in the 3rd quintile relative to the other funds in the universe for this five-year period (the 1st quintile being the best performers and the 5th quintile being the worst performers). The total
return performance of the Fund’s Class I shares was in the 3rd quintile for the one-year period and the 4th quintile for the three-year period ended December 31, 2020 relative to the Broadridge performance universe. Because of the passage of
time, these performance results may differ from the performance results for more recent periods, including those shown elsewhere in this report.
In the course of their deliberations, the Trustees took into
account information provided by MFS in connection with the contract review meetings, as well as during investment review meetings conducted with portfolio management personnel during the course of the year regarding the Fund’s performance.
After reviewing these and related factors, the Trustees concluded, within the context of their overall conclusions regarding the investment advisory agreement, that they were satisfied with MFS’ responses and efforts relating to investment
performance.
In assessing the reasonableness of the
Fund’s advisory fee, the Trustees considered, among other information, the Fund’s advisory fee and the total expense ratio of the Fund’s Class I shares as a percentage of average daily net assets and the advisory fee and total
expense ratios of the Broadridge expense group based on information provided by Broadridge. The Trustees considered that MFS currently observes an expense limitation for the Fund, which may not be changed without the Trustees’ approval. The
Trustees also considered that, according to the data provided by
Board Review of Investment
Advisory Agreement - continued
Broadridge (which takes into account any fee reductions or expense limitations
that were in effect during the Fund’s last fiscal year), the Fund’s effective advisory fee rate and total expense ratio were each lower than the Broadridge expense group median.
The Trustees also considered the advisory fees charged by MFS
to any institutional separate accounts advised by MFS (“separate accounts”) and unaffiliated investment companies for which MFS serves as subadviser (“subadvised funds”) that have comparable investment strategies to the Fund,
if any. In comparing these fees, the Trustees considered information provided by MFS as to the generally broader scope of services provided by MFS to the Fund, as well as the more extensive regulatory burdens imposed on MFS in managing the Fund, in
comparison to separate accounts and subadvised funds. The Trustees also considered the higher demands placed on MFS’ investment personnel and trading infrastructure as a result of the daily cash in-flows and out-flows of the Fund in comparison
to separate accounts.
The Trustees also considered
whether the Fund may benefit from any economies of scale in the management of the Fund in the event of growth in assets of the Fund and/or growth in assets of the MFS Funds as a whole. They noted that the Fund’s advisory fee rate schedule is
subject to contractual breakpoints that reduce the Fund’s advisory fee rate on average daily net assets over $1 billion and $2.5 billion. The Trustees also noted that MFS has agreed in writing to waive a portion of the management fees of
certain MFS Funds, including the Fund, if the total combined assets of certain funds within the MFS Funds’ complex increase above agreed upon thresholds (the “group fee waiver”), enabling the Fund’s shareholders to share in
the benefits from any economies of scale at the complex level. The group fee waiver is reviewed and renewed annually between the Board and MFS. The Trustees concluded that the breakpoints and the group fee waiver were sufficient to allow the Fund to
benefit from economies of scale as its assets and overall complex assets grow.
The Trustees also considered information prepared by MFS
relating to MFS’ costs and profits with respect to the Fund, the MFS Funds considered as a group, and other investment companies and accounts advised by MFS, as well as MFS’ methodologies used to determine and allocate its costs to the
MFS Funds, the Fund and other accounts and products for purposes of estimating profitability.
After reviewing these and other factors described herein, the
Trustees concluded, within the context of their overall conclusions regarding the investment advisory agreement, that the advisory fees charged to the Fund represent reasonable compensation in light of the services being provided by MFS to the
Fund.
In addition, the Trustees considered MFS’
resources and related efforts to continue to retain, attract and motivate capable personnel to serve the Fund. The Trustees also considered current and developing conditions in the financial services industry, including the presence of large and
well-capitalized companies which are spending, and appear to be prepared to continue to spend, substantial sums to engage personnel and to provide services to competing investment companies. In this regard, the Trustees also considered the financial
resources of MFS and its ultimate parent, Sun Life Financial Inc. The Trustees also considered the advantages and possible disadvantages to the Fund of having an adviser that also serves other investment companies as well as other accounts.
Board Review of Investment
Advisory Agreement - continued
The Trustees also considered the nature, quality, cost, and
extent of administrative, transfer agency, and distribution services provided to the Fund by MFS and its affiliates under agreements and plans other than the investment advisory agreement, including any 12b-1 fees the Fund pays to MFS Fund
Distributors, Inc., an affiliate of MFS. The Trustees also considered the nature, extent and quality of certain other services MFS performs or arranges for on the Fund’s behalf, which may include securities lending programs, directed expense
payment programs, class action recovery programs, and MFS’ interaction with third-party service providers, principally custodians and sub-custodians. The Trustees concluded that the various non-advisory services provided by MFS and its
affiliates on behalf of the Fund were satisfactory.
The
Trustees considered so-called “fall-out benefits” to MFS such as reputational value derived from serving as investment manager to the MFS Funds. The Trustees also considered that MFS discontinued its historic practice of obtaining
investment research from portfolio brokerage commissions paid by certain MFS Funds effective January 2018, and directly pays or voluntarily reimburses a Fund, if applicable, for the costs of external research acquired through the use of the
Fund’s portfolio brokerage commissions.
Based on
their evaluation of factors that they deemed to be material, including those factors described above, the Board of Trustees, including the independent Trustees, concluded that the Fund’s investment advisory agreement with MFS should be
continued for an additional one-year period, commencing August 1, 2021.
Statement Regarding
Liquidity Risk Management Program
The fund has adopted
and implemented a liquidity risk management program (the “Program”) as required by Rule 22e-4 under the Investment Company Act of 1940, as amended. The fund’s Board of Trustees (the “Board”) has designated MFS as the
administrator of the Program. The Program is reasonably designed to assess and manage the liquidity risk of the fund. Liquidity risk is the risk that the fund could not meet requests to redeem shares issued by the fund without significant dilution
of remaining investors' interests.
MFS provided a written
report to the Board for consideration at its April 2021 meeting that addressed the operation of the Program and provided an assessment of the adequacy and effectiveness of the Program during the period from January 1, 2020 to December 31, 2020 (the
“Covered Period”). The report concluded that during the Covered Period the Program had operated effectively and had adequately and effectively been implemented to assess and manage the fund’s liquidity risk. MFS also reported that
there were no liquidity events that impacted the fund or its ability to timely meet redemptions without dilution to existing shareholders during the Covered Period.
There can be no assurance that the Program will achieve its
objectives in the future. Further information on liquidity risk, and other principal risks to which an investment in the fund may be subject, can be found in the prospectus.
Proxy
Voting Policies and Information
MFS votes proxies on
behalf of the fund pursuant to proxy voting policies and procedures that are available without charge, upon request, by calling 1-800-225-2606, by visiting mfs.com/proxyvoting, or by visiting the SEC’s
Web site at http://www.sec.gov.
Information regarding how the fund voted proxies relating to
portfolio securities during the most recent twelve-month period ended June 30 is available by August 31 of each year without charge by visiting mfs.com/proxyvoting, or by visiting the SEC’s Web site at http://www.sec.gov.
Quarterly Portfolio Disclosure
The fund files a complete schedule of portfolio holdings with
the SEC for the first and third quarters of each fiscal year as an exhibit to its reports on Form N-PORT. The fund's Form N-PORT reports are available on the SEC's Web site at http://www.sec.gov. A
shareholder can obtain the portfolio holdings report for the first and third quarters of the fund's fiscal year at mfs.com/openendfunds by choosing the fund's name and then scrolling to the
“Resources” section and clicking on the “Prospectus and Reports” tab.
Further Information
From time to time, MFS may post important information about the
fund or the MFS Funds on the MFS Web site (mfs.com). This information is available at https://www.mfs.com/announcements or at
mfs.com/openendfunds by choosing the fund’s name and then scrolling to the “Resources” section and clicking on the “Announcements” tab, if any.
Information About Fund Contracts and Legal Claims
The fund has entered into contractual arrangements with an
investment adviser, administrator, distributor, shareholder servicing agent, 529 program manager (if applicable), and custodian who each provide services to the fund. Unless expressly stated otherwise, shareholders are not parties to, or intended
beneficiaries of these contractual arrangements, and these contractual arrangements are not intended to create any shareholder right to enforce them against the service providers or to seek any remedy under them against the service providers, either
directly or on behalf of the fund.
Under the
Trust’s By-Laws and Declaration of Trust, any claims asserted against or on behalf of the MFS Funds, including claims against Trustees and Officers, must be brought in state and federal courts located within the Commonwealth of
Massachusetts.
Federal Tax Information (unaudited)
The
fund will notify shareholders of amounts for use in preparing 2021 income tax forms in January 2022. The following information is provided pursuant to provisions of the Internal Revenue Code.
The fund designates the maximum amount allowable as qualified
dividend income eligible to be taxed at the same rate as long-term capital gain.
The fund designates $1,279,813 as capital gain dividends paid
during the fiscal year.
Income derived from foreign
sources was $14,546,849. The fund intends to pass through foreign tax credits of $1,609,504 for the fiscal year.
| FACTS
|
WHAT
DOES MFS DO WITH YOUR PERSONAL INFORMATION? |
| Why?
|
Financial
companies choose how they share your personal information. Federal law gives consumers the right to limit some but not all sharing. Federal law also requires us to tell you how we collect, share, and protect your personal information. Please read
this notice carefully to understand what we do. |
| What?
|
The types of
personal information we collect and share depend on the product or service you have with us. This information can include: |
| • Social
Security number and account balances |
| • Account
transactions and transaction history |
| • Checking
account information and wire transfer instructions |
| When
you are no longer our customer, we continue to share your information as described in this notice. |
| How?
|
All
financial companies need to share customers' personal information to run their everyday business. In the section below, we list the reasons financial companies can share their customers' personal information; the reasons MFS chooses to share; and
whether you can limit this sharing. |
Reasons
we can share your
personal information |
Does
MFS share? |
Can
you limit
this sharing? |
For
our everyday business purposes –
such as to process your transactions, maintain your
account(s), respond to court orders and legal
investigations, or report to credit bureaus |
Yes
|
No
|
For
our marketing purposes –
to offer our products and services to you |
No
|
We
don't share |
For
joint marketing with other
financial companies |
No
|
We
don't share |
For
our affiliates' everyday business purposes –
information about your transactions and experiences |
No
|
We
don't share |
For
our affiliates' everyday business purposes –
information about your creditworthiness |
No
|
We
don't share |
| For
nonaffiliates to market to you |
No
|
We
don't share |
| Questions?
|
Call
800-225-2606 or go to mfs.com. |
| Who
we are |
| Who
is providing this notice? |
MFS
Funds, MFS Investment Management, MFS Institutional Advisors, Inc., and MFS Heritage Trust Company. |
| What
we do |
How
does MFS
protect my personal
information? |
To
protect your personal information from unauthorized access and use, we use security measures that comply with federal law. These measures include procedural, electronic, and physical safeguards for the protection of the personal information we
collect about you. |
How
does MFS
collect my personal
information? |
We
collect your personal information, for example, when you |
| • open
an account or provide account information |
| • direct
us to buy securities or direct us to sell your securities |
| • make
a wire transfer |
| We
also collect your personal information from others, such as credit bureaus, affiliates, or other companies. |
| Why
can't I limit all sharing? |
Federal
law gives you the right to limit only |
| • sharing
for affiliates' everyday business purposes – information about your creditworthiness |
| • affiliates
from using your information to market to you |
| • sharing
for nonaffiliates to market to you |
| State
laws and individual companies may give you additional rights to limit sharing. |
| Definitions
|
| Affiliates
|
Companies
related by common ownership or control. They can be financial and nonfinancial companies. |
| •
MFS does not share personal information with affiliates, except for everyday business purposes as described on page one of this notice. |
| Nonaffiliates
|
Companies
not related by common ownership or control. They can be financial and nonfinancial companies. |
| •
MFS does not share with nonaffiliates so they can market to you. |
| Joint
marketing |
A
formal agreement between nonaffiliated financial companies that together market financial products or services to you. |
| •
MFS doesn't jointly market. |
| Other
important information |
| If
you own an MFS product or receive an MFS service in the name of a third party such as a bank or broker-dealer, their privacy policy may apply to you instead of ours. |
Save paper with eDelivery.
MFS® will send you prospectuses, reports, and proxies directly via e-mail so you will get information faster with less mailbox clutter.
To sign up:
1. Go to mfs.com.
2. Log in via MFS® Access.
3. Select eDelivery.
If you own your MFS fund shares through a financial institution
or a retirement plan, MFS® TALK, MFS® Access,
or eDelivery may not be available to you.
CONTACT
WEB SITE
mfs.com
MFS TALK
1-800-637-8255
24 hours a day
ACCOUNT SERVICE AND LITERATURE
Shareholders
1-800-225-2606
Financial advisors
1-800-343-2829
Retirement plan services
1-800-637-1255
MAILING ADDRESS
MFS Service Center, Inc.
P.O. Box 219341
Kansas City, MO 64121-9341
OVERNIGHT MAIL
MFS Service Center, Inc.
Suite 219341
430 W 7th Street
Kansas City, MO 64105-1407
Annual Report
August 31, 2021
MFS® Global New
Discovery Fund
MFS® Global New
Discovery Fund
|
1
|
|
2
|
|
4
|
|
6
|
|
9
|
|
11
|
|
17
|
|
19
|
|
20
|
|
21
|
|
27
|
|
38
|
|
40
|
|
45
|
|
49
|
|
50
|
|
50
|
|
50
|
|
50
|
|
50
|
|
52
|
The
report is prepared for the general information of shareholders. It is authorized for distribution to prospective investors only when preceded or accompanied by a current prospectus.
NOT FDIC INSURED • MAY LOSE VALUE
• NO BANK GUARANTEE
LETTER FROM THE CEO
Dear Shareholders:
After experiencing dramatic swings in the early days of the
coronavirus pandemic, global equity markets have performed strongly over the past year. Though the speedy development of vaccines brightened the economic and market outlook, uncertainty remains as new variants of the virus appear, and questions
persist over how fast vaccines can be made widely available in the developing world.
After having taken aggressive steps to
cushion the economic and market fallout related to the virus, some global central banks have begun to recalibrate monetary policy. For example, the U.S. Federal Reserve has signaled it will likely taper its bond buying program before the end of
2021, which has helped push up Treasury yields, and steepened the yield curve. Having passed a $1.9 trillion stimulus package in March, the U.S. Congress could approve additional stimulus later this year, some of it focused on infrastructure.
Production and transportation bottlenecks and labor shortages stemming from the pandemic have fueled a rise in inflation, though policymakers and investors think most of the price hikes will prove transitory.
Since midyear, the spread of the Delta variant of the
coronavirus has slowed economic growth while markets have focused on a regulatory crackdown in China, which, when coupled with stress in that country's property development sector, has contributed to a slowdown there. Tightening global energy and
raw materials supplies are a further concern for investors.
The policy measures put in place to counteract the pandemic's
effects have helped build a supportive environment and are encouraging economic recovery; however, if markets disconnect from fundamentals, they can sow the seeds of instability. As such, recent dramatic increases in speculative trading in
cryptocurrencies, special purpose acquisition companies (SPACs), and the like bear watching.
In the aftermath of the crisis, we could see societal changes
as households, businesses, and governments adjust to a new reality, and any such alterations could affect the investment landscape. For investors, events such as the COVID-19 outbreak demonstrate the importance of having a deep understanding of
company fundamentals, and we have built our global research platform to do just that.
At MFS®, we put our clients’ assets to work responsibly by carefully navigating the increasing complexity of global markets and economies. Guided by our
long-term philosophy and adhering to our commitment to sustainable investing, we tune out the noise and aim to uncover what we believe are the best, most durable investment opportunities in the market. Our unique global investment platform combines
collective expertise, long-term discipline, and thoughtful risk management to create sustainable value for investors.
Respectfully,
Michael W.
Roberge
Chief Executive Officer
MFS Investment Management
October 15, 2021
The opinions expressed in this letter are subject to change and
may not be relied upon for investment advice. No forecasts can be guaranteed.
Portfolio structure
Top ten
holdings
| ICON
PLC |
2.6%
|
| PerkinElmer,
Inc. |
1.9%
|
| ASM
International N.V. |
1.9%
|
| NS
Solutions Corp. |
1.8%
|
| GFL
Environmental, Inc. |
1.8%
|
| Arthur
J. Gallagher & Co. |
1.7%
|
| Clarivate
PLC |
1.6%
|
| Cranswick
PLC |
1.6%
|
| STERIS
PLC |
1.4%
|
| Electrocomponents
PLC |
1.4%
|
GICS equity sectors (g)
| Industrials
|
24.6%
|
| Information
Technology |
18.6%
|
| Consumer
Discretionary |
13.7%
|
| Health
Care |
11.2%
|
| Real
Estate |
8.8%
|
| Materials
|
8.7%
|
| Financials
|
6.1%
|
| Consumer
Staples |
3.5%
|
| Communication
Services |
2.6%
|
Issuer country weightings (x)
| United
States |
39.4%
|
| United
Kingdom |
15.8%
|
| Japan
|
8.6%
|
| Germany
|
6.5%
|
| Canada
|
5.2%
|
| Netherlands
|
4.9%
|
| France
|
2.6%
|
| Ireland
|
2.5%
|
| Switzerland
|
2.0%
|
| Other
Countries |
12.5%
|
Currency exposure weightings
(y)
| United
States Dollar |
48.4%
|
| Euro
|
16.1%
|
| British
Pound Sterling |
13.7%
|
| Japanese
Yen |
8.6%
|
| Swiss
Franc |
2.0%
|
| Norwegian
Krone |
2.0%
|
| Indian
Rupee |
1.7%
|
| Brazilian
Real |
1.5%
|
| Swedish
Krona |
1.5%
|
| Other
Currencies |
4.5%
|
Portfolio Composition -
continued
| (g)
|
The
Global Industry Classification Standard (GICS®) was developed by and/or is the exclusive property of MSCI, Inc. and S&P Global Market
Intelligence Inc. (“S&P Global Market Intelligence”). GICS is a service mark of MSCI and S&P Global Market Intelligence and has been licensed for use by MFS. MFS has applied its own internal sector/industry classification
methodology for equity securities and non-equity securities that are unclassified by GICS. |
| (x)
|
Represents
the portfolio’s exposure to issuer countries as a percentage of a portfolio’s net assets. For purposes of this presentation, United States includes Cash & Cash Equivalents. |
| (y)
|
Represents
the portfolio’s exposure to a particular currency as a percentage of a portfolio's net assets. For purposes of this presentation, United States Dollar includes Cash & Cash Equivalents. |
Cash & Cash Equivalents includes any cash, investments in
money market funds, short-term securities, and other assets less liabilities. Please see the Statement of Assets and Liabilities for additional information related to the fund’s cash position and other assets and liabilities.
Percentages are based on net assets as of August 31,
2021.
The portfolio is actively managed and current
holdings may be different.
Management Review
Summary of Results
For the twelve months ended August 31, 2021, Class A shares of
the MFS Global New Discovery Fund (fund) provided a total return of 32.82%, at net asset value. This compares with a return of 38.21% for the fund’s benchmark, the MSCI All Country World Small Mid Cap Index (net div).
Market Environment
The global economy continued to recover from the most unusual
recession in memory as financial markets benefited from massive fiscal and monetary intervention aimed at offsetting the economic effects of the coronavirus pandemic. In developed markets, COVID-19 vaccine distribution broadened after getting off to
a slower-than-hoped-for start in some locales, although concerns remained that too few people will be inoculated for herd immunity to be achieved, which could result in the emergence of additional variants. On balance, emerging markets experienced
slower rollouts than developed markets amid ongoing vaccine supply constraints.
Around the world, central banks responded quickly and massively
to the crisis with programs to improve liquidity and support markets. These undertakings proved largely successful in helping to restore market function, ease volatility and stimulate a prolonged rebound. In the first half of the period, the US
Federal Reserve adopted a new, flexible average-inflation-targeting framework, which is expected to result in the federal funds rate remaining at low levels longer than under its previous model, although the Fed has indicated it may scale back the
pace of asset purchases before the end of this year. Due to relatively manageable external liabilities and balances of payments in many countries and persistently low inflation, even emerging market countries were able to implement countercyclical
policies — a departure from the usual market-dictated response to risk-off crises.
Late in the period, markets grappled with the threat of
resurgent inflation resulting from pandemic-induced production bottlenecks, monumental levels of economic stimulus and the unleashing of post-lockdown pent-up demand. Meanwhile, raw materials prices rebounded strongly on account of the surprising
resilience of the global manufacturing sector during the pandemic. Global sovereign bond yields initially rose in response to these factors before yields moderated in the second half of the period as the spread of the Delta variant of the
coronavirus dented economic activity. The vaccine breakthroughs announced in November 2020 saw market leadership shift from a handful of mega-cap technology companies to a broader array of small-cap and value stocks, although growth stocks have
performed strongly in recent months. Signs of excess investor enthusiasm were seen in pockets of the market, such as the “meme stocks” popular with users of online message boards and heavy retail participation in the market for
short-dated equity options.
Detractors from
Performance
Stock selection and, to a lesser extent, an
underweight position in the financials sector was a primary detractor from performance relative to the MSCI All Country World Small Mid Cap Index, led by the fund's holdings of trading services provider B3 SA-Brasil, Bolsa, Balcão(b)
(Brazil).
Management Review -
continued
Security selection within the consumer discretionary sector
also held back relative results. Here, overweighting shares of food delivery website operator Just Eat Takeaway (Netherlands) detracted from relative returns.
In other sectors, the fund’s overweight positions in
analytics services provider Clarivate (United Kingdom), health care glass and plastic products manufacturer Gerresheimer (Germany), intelligent identity solutions provider Ping Identity Holdings, food products manufacturer Cranswick (United
Kingdom), data center infrastructure solutions provider QTS Realty Trust(h) and digital banking solutions provider Q2 Holdings hurt relative performance. The fund's holdings of enterprise software products maker Oracle Japan(b) and business
information provider Dun & Bradstreet(b)(h) further weakened relative results.
The fund’s cash and/or cash equivalents position during
the period was also a detractor from relative performance. Under normal market conditions, the fund strives to be fully invested and generally holds cash to buy new holdings and to provide liquidity. In a period when equity markets rose, as measured
by the fund’s benchmark, holding cash held back performance versus the benchmark, which has no cash position.
Contributors to Performance
Stock selection within the health care sector contributed to
relative performance, led by the fund’s overweight positions in life sciences company Maravai Lifesciences and pharmaceutical services provider Charles River Laboratories International. The stock price of Charles River Laboratories
International rose as the company reported higher-than-expected organic revenue growth, solid margins and a lower tax rate.
Elsewhere, the fund’s overweight positions in global
cross-border payments technology provider Nuvei (Canada), semiconductor equipment manufacturer ASM International (Netherlands), ecological solutions provider GFL Environmental (Canada), cloud and IT services provider Rakus(h) (Japan), software and
technology consulting services provider Nagarro (Germany), construction materials company Summit Materials(h) and security risk intelligence solutions provider Rapid7 strengthened relative returns. The stock price of Nuvei advanced during the
reporting period as the company delivered strong revenue results and significantly raised its 2021 guidance well above consensus, which suggested that recent revenue momentum benefited not only from a temporary COVID-19 induced surge, but also from
its technology, focused verticals (gaming, social media, etc.), customer expansion strategy and distribution efforts.
Respectfully,
Portfolio Manager(s)
Eric Braz, Peter Fruzzetti, Michael Grossman, and Sandeep
Mehta
| (b)
|
Security is not a
benchmark constituent. |
| (h)
|
Security was not held in
the portfolio at period end. |
The
views expressed in this report are those of the portfolio manager(s) only through the end of the period of the report as stated on the cover and do not necessarily reflect the views of MFS or any other person in the MFS organization. These views are
subject to change at any time based on market or other conditions, and MFS disclaims any responsibility to update such views. These views may not be relied upon as investment advice or an indication of trading intent on behalf of any MFS portfolio.
References to specific securities are not recommendations of such securities, and may not be representative of any MFS portfolio’s current or future investments.
Performance Summary THROUGH
8/31/21
The following chart illustrates a representative
class of the fund’s historical performance in comparison to its benchmark(s). Performance results include the deduction of the maximum applicable sales charge and reflect the percentage change in net asset value, including reinvestment of
dividends and capital gains distributions. The performance of other share classes will be greater than or less than that of the class depicted below. Benchmarks are unmanaged and may not be invested in directly. Benchmark returns do not reflect
sales charges, commissions or expenses. (See Notes to Performance Summary.)
Performance data shown represents past performance and is no
guarantee of future results. Investment return and principal value fluctuate so your shares, when sold, may be worth more or less than the original cost; current performance may be lower or higher than quoted. The performance shown does not reflect
the deduction of taxes, if any, that a shareholder would pay on fund distributions or the redemption of fund shares.
Growth of a Hypothetical $10,000 Investment (t)
Performance Summary -
continued
Total Returns through 8/31/21
Average annual without sales charge
| Share
Class |
Class
Inception Date |
1-yr
|
5-yr
|
Life
(t) |
| A
|
12/16/11
|
32.82%
|
16.73%
|
14.52%
|
| B
|
12/16/11
|
31.84%
|
15.87%
|
13.67%
|
| C
|
12/16/11
|
31.84%
|
15.87%
|
13.67%
|
| I
|
12/16/11
|
33.16%
|
17.04%
|
14.81%
|
| R1
|
12/16/11
|
31.80%
|
15.86%
|
13.66%
|
| R2
|
12/16/11
|
32.47%
|
16.46%
|
14.23%
|
| R3
|
12/16/11
|
32.82%
|
16.74%
|
14.52%
|
| R4
|
12/16/11
|
33.16%
|
17.03%
|
14.80%
|
| R6
|
1/02/13
|
33.27%
|
17.15%
|
13.48%
|
Comparative benchmark(s)
| |
|
|
|
| MSCI
All Country World Small Mid Cap Index (net div)(f) |
38.21%
|
12.99%
|
12.33%
|
Average annual with sales
charge
| |
|
|
|
A
With Initial Sales Charge (5.75%) |
25.18%
|
15.36%
|
13.82%
|
B
With CDSC (Declining over six years from 4% to 0%) (v) |
27.84%
|
15.65%
|
13.67%
|
C
With CDSC (1% for 12 months) (v) |
30.84%
|
15.87%
|
13.67%
|
CDSC – Contingent Deferred
Sales Charge.
Class I, R1, R2, R3, R4, and R6 shares do
not have a sales charge.
| (f)
|
Source: FactSet Research
Systems Inc. |
| (t)
|
For the
period from the class inception date through the stated period end. The comparative benchmark performance information provided for the “life” period is from the inception date of the Class A shares. (See Notes to Performance Summary.)
|
| (v)
|
Assuming redemption at
the end of the applicable period. |
Benchmark Definition(s)
MSCI All Country World Small Mid Cap Index(e) (net div) - a free float weighted index that is designed to measure equity market performance of small and mid cap companies across global developed and
emerging market countries.
Performance Summary -
continued
It is not possible to invest directly in an index.
| (e)
|
Morgan
Stanley Capital International (“MSCI”) makes no express or implied warranties or representations and shall have no liability whatsoever with respect to any MSCI data contained herein. The MSCI data may not be further redistributed or
used as a basis for other indices or any securities or financial products. This report is not approved, reviewed, or produced by MSCI. |
Notes to Performance Summary
Average annual total return represents the average annual
change in value for each share class for the periods presented. Life returns are presented where the share class has less than 10 years of performance history and represent the average annual total return from the class inception date to the stated
period end date. As the fund's share classes may have different inception dates, the life returns may represent different time periods and may not be comparable.
Performance results reflect any applicable expense subsidies
and waivers in effect during the periods shown. Without such subsidies and waivers the fund's performance results would be less favorable. Please see the prospectus and financial statements for complete details.
Performance results do not include adjustments made for
financial reporting purposes in accordance with U.S. generally accepted accounting principles and may differ from amounts reported in the financial highlights.
From time to time the fund may receive proceeds from litigation
settlements, without which performance would be lower.
Expense Table
Fund expenses borne by the shareholders during the period,
March 1, 2021 through August 31, 2021
As a shareholder
of the fund, you incur two types of costs: (1) transaction costs, including sales charges (loads) on certain purchase or redemption payments, and (2) ongoing costs, including management fees; distribution and service (12b-1) fees; and other fund
expenses. This example is intended to help you understand your ongoing costs (in dollars) of investing in the fund and to compare these costs with the ongoing costs of investing in other mutual funds.
The example is based on an investment of $1,000 invested at the
beginning of the period and held for the entire period March 1, 2021 through August 31, 2021.
Actual Expenses
The first line for each share class in the following table
provides information about actual account values and actual expenses. You may use the information in this line, together with the amount you invested, to estimate the expenses that you paid over the period. Simply divide your account value by $1,000
(for example, an $8,600 account value divided by $1,000 = 8.6), then multiply the result by the number in the first line under the heading entitled “Expenses Paid During Period” to estimate the expenses you paid on your account during
this period.
Hypothetical Example for Comparison
Purposes
The second line for each share class in the
following table provides information about hypothetical account values and hypothetical expenses based on the fund’s actual expense ratio and an assumed rate of return of 5% per year before expenses, which is not the fund’s actual
return. The hypothetical account values and expenses may not be used to estimate the actual ending account balance or expenses you paid for the period. You may use this information to compare the ongoing costs of investing in the fund and other
funds. To do so, compare this 5% hypothetical example with the 5% hypothetical examples that appear in the shareholder reports of the other funds.
Please note that the expenses shown in the table are meant to
highlight your ongoing costs only and do not reflect any transactional costs, such as sales charges (loads). Therefore, the second line for each share class in the table is useful in comparing ongoing costs only, and will not help you determine the
relative total costs of owning different funds. In addition, if these transactional costs were included, your costs would have been higher.
Expense Table -
continued
Share
Class |
|
Annualized
Expense
Ratio |
Beginning
Account Value
3/01/21 |
Ending
Account Value
8/31/21 |
Expenses
Paid During
Period (p)
3/01/21-8/31/21 |
| A
|
Actual
|
1.34%
|
$1,000.00
|
$1,183.85
|
$7.38
|
| Hypothetical
(h) |
1.34%
|
$1,000.00
|
$1,018.45
|
$6.82
|
| B
|
Actual
|
2.09%
|
$1,000.00
|
$1,179.62
|
$11.48
|
| Hypothetical
(h) |
2.09%
|
$1,000.00
|
$1,014.67
|
$10.61
|
| C
|
Actual
|
2.09%
|
$1,000.00
|
$1,179.62
|
$11.48
|
| Hypothetical
(h) |
2.09%
|
$1,000.00
|
$1,014.67
|
$10.61
|
| I
|
Actual
|
1.09%
|
$1,000.00
|
$1,185.76
|
$6.01
|
| Hypothetical
(h) |
1.09%
|
$1,000.00
|
$1,019.71
|
$5.55
|
| R1
|
Actual
|
2.09%
|
$1,000.00
|
$1,179.79
|
$11.48
|
| Hypothetical
(h) |
2.09%
|
$1,000.00
|
$1,014.67
|
$10.61
|
| R2
|
Actual
|
1.59%
|
$1,000.00
|
$1,182.82
|
$8.75
|
| Hypothetical
(h) |
1.59%
|
$1,000.00
|
$1,017.19
|
$8.08
|
| R3
|
Actual
|
1.34%
|
$1,000.00
|
$1,184.36
|
$7.38
|
| Hypothetical
(h) |
1.34%
|
$1,000.00
|
$1,018.45
|
$6.82
|
| R4
|
Actual
|
1.09%
|
$1,000.00
|
$1,185.76
|
$6.01
|
| Hypothetical
(h) |
1.09%
|
$1,000.00
|
$1,019.71
|
$5.55
|
| R6
|
Actual
|
1.02%
|
$1,000.00
|
$1,186.06
|
$5.62
|
| Hypothetical
(h) |
1.02%
|
$1,000.00
|
$1,020.06
|
$5.19
|
| (h)
|
5% class return per year
before expenses. |
| (p)
|
“Expenses
Paid During Period” are equal to each class’s annualized expense ratio, as shown above, multiplied by the average account value over the period, multiplied by 184/365 (to reflect the one-half year period). Expenses paid do not include
any applicable sales charges (loads). If these transaction costs had been included, your costs would have been higher. |
Portfolio of
Investments
8/31/21
The Portfolio of Investments is a complete list of all
securities owned by your fund. It is categorized by broad-based asset classes.
| Issuer
|
|
|
Shares/Par
|
Value
($) |
| Common
Stocks – 97.8% |
| Aerospace
& Defense – 2.1% |
|
| CACI
International, Inc., “A” (a) |
|
3,982 |
$
1,025,524 |
| Howmet
Aerospace, Inc. |
|
37,674 |
1,196,150 |
| Singapore
Technologies Engineering Ltd. |
|
214,600 |
603,360 |
| |
|
|
|
$2,825,034 |
| Apparel
Manufacturers – 2.1% |
|
| Burberry
Group PLC |
|
48,617 |
$
1,242,910 |
| Skechers
USA, Inc., “A” (a) |
|
31,783 |
1,602,817 |
| |
|
|
|
$2,845,727 |
| Automotive
– 2.7% |
|
| Copart,
Inc. (a) |
|
6,452 |
$
931,153 |
| Koito
Manufacturing Co. Ltd. |
|
13,700 |
838,076 |
| LKQ
Corp. (a) |
|
35,135 |
1,851,263 |
| |
|
|
|
$3,620,492 |
| Biotechnology
– 0.7% |
|
| Abcam
PLC (a) |
|
46,625 |
$
989,741 |
| Brokerage
& Asset Managers – 4.0% |
|
| B3
Brasil Bolsa Balcao S.A. |
|
442,000 |
$
1,202,704 |
| Cboe
Global Markets, Inc. |
|
9,136 |
1,152,506 |
| Euronext
N.V. |
|
15,409 |
1,787,578 |
| NASDAQ,
Inc. |
|
6,437 |
1,260,236 |
| |
|
|
|
$5,403,024 |
| Business
Services – 7.8% |
|
| Clarivate
PLC (a) |
|
87,534 |
$
2,204,981 |
| Electrocomponents
PLC |
|
127,754 |
1,868,837 |
| Keywords
Studios PLC (a) |
|
37,865 |
1,625,273 |
| NS
Solutions Corp. |
|
70,300 |
2,383,484 |
| Nuvei
Corp. (a) |
|
11,632 |
1,477,264 |
| WNS
(Holdings) Ltd., ADR (a) |
|
12,023 |
997,188 |
| |
|
|
|
$10,557,027 |
| Cable
TV – 0.9% |
|
| Cable
One, Inc. |
|
581 |
$
1,219,862 |
Portfolio of
Investments – continued
| Issuer
|
|
|
Shares/Par
|
Value
($) |
| Common
Stocks – continued |
| Chemicals
– 2.4% |
|
| Element
Solutions, Inc. |
|
43,401 |
$
986,505 |
| IMCD
Group N.V. |
|
7,380 |
1,453,920 |
| UPL
Ltd. |
|
80,226 |
814,540 |
| |
|
|
|
$3,254,965 |
| Computer
Software – 5.6% |
|
| Everbridge,
Inc. (a) |
|
8,468 |
$
1,329,222 |
| OBIC
Co. Ltd. |
|
6,200 |
1,180,657 |
| Oracle
Corp. Japan |
|
7,300 |
599,845 |
| Paycor
HCM, Inc. (a) |
|
41,760 |
1,543,032 |
| Ping
Identity Holding Corp. (a) |
|
42,946 |
1,114,449 |
| Qualtrics
International, “A” (a) |
|
19,377 |
877,391 |
| Zendesk,
Inc. (a) |
|
7,555 |
933,798 |
| |
|
|
|
$7,578,394 |
| Computer
Software - Systems – 6.3% |
|
| Amadeus
IT Group S.A. (a) |
|
10,080 |
$
615,570 |
| Cancom
SE |
|
10,795 |
710,218 |
| Kinaxis,
Inc. (a) |
|
4,826 |
782,932 |
| Nagarro
SE (a) |
|
6,720 |
1,206,066 |
| Q2
Holdings, Inc. (a) |
|
14,402 |
1,268,672 |
| Rapid7,
Inc. (a) |
|
11,148 |
1,354,705 |
| SimCorp
A/S |
|
6,886 |
938,950 |
| TransUnion
|
|
13,081 |
1,589,734 |
| |
|
|
|
$8,466,847 |
| Construction
– 4.5% |
|
| AvalonBay
Communities, Inc., REIT |
|
5,231 |
$
1,200,933 |
| AZEK
Co. LLC (a) |
|
29,091 |
1,236,077 |
| Marshalls
PLC |
|
91,624 |
1,018,461 |
| Masco
Corp. |
|
26,264 |
1,594,750 |
| Somfy
S.A. |
|
5,455 |
1,061,476 |
| |
|
|
|
$6,111,697 |
| Consumer
Products – 0.4% |
|
| Dabur
India Ltd. |
|
60,025 |
$
510,982 |
| Consumer
Services – 1.7% |
|
| Boyd
Group Services, Inc. |
|
4,003 |
$
781,436 |
| Bright
Horizons Family Solutions, Inc. (a) |
|
5,578 |
813,050 |
| On
the Beach Group PLC (a) |
|
139,527 |
676,196 |
| |
|
|
|
$2,270,682 |
Portfolio of
Investments – continued
| Issuer
|
|
|
Shares/Par
|
Value
($) |
| Common
Stocks – continued |
| Containers
– 2.0% |
|
| Ardagh
Metal Packaging S.A. (a)(l) |
|
92,318 |
$
988,726 |
| Mayr-Melnhof
Karton AG |
|
3,481 |
734,080 |
| SIG
Combibloc Group AG |
|
32,855 |
1,006,011 |
| |
|
|
|
$2,728,817 |
| Electrical
Equipment – 1.7% |
|
| Halma
PLC |
|
19,086 |
$
787,999 |
| Sensata
Technologies Holding PLC (a) |
|
24,507 |
1,450,324 |
| |
|
|
|
$2,238,323 |
| Electronics
– 2.6% |
|
| ASM
International N.V. |
|
6,534 |
$
2,535,156 |
| Kardex
AG |
|
3,672 |
984,413 |
| |
|
|
|
$3,519,569 |
| Engineering
- Construction – 1.0% |
|
| Vantage
Towers AG |
|
38,539 |
$
1,377,435 |
| Entertainment
– 0.6% |
|
| CTS
Eventim AG (a) |
|
12,913 |
$
832,793 |
| Food
& Beverages – 3.1% |
|
| Bakkafrost
P/f |
|
15,617 |
$
1,372,690 |
| Cranswick
PLC |
|
38,267 |
2,086,568 |
| S
Foods, Inc. |
|
25,000 |
720,356 |
| |
|
|
|
$4,179,614 |
| Furniture
& Appliances – 0.5% |
|
| SEB
S.A. |
|
4,152 |
$
653,010 |
| Gaming
& Lodging – 1.0% |
|
| Penn
National Gaming, Inc. (a) |
|
16,901 |
$
1,370,671 |
| Insurance
– 1.8% |
|
| Arthur
J. Gallagher & Co. |
|
16,313 |
$
2,342,873 |
| Internet
– 2.0% |
|
| Allegro.eu
S.A. (a) |
|
66,981 |
$
1,241,810 |
| Auto
Trader Group PLC |
|
95,676 |
827,388 |
| Scout24
AG |
|
7,750 |
651,538 |
| |
|
|
|
$2,720,736 |
| Leisure
& Toys – 0.6% |
|
| Thule
Group AB |
|
15,256 |
$
832,681 |
Portfolio of
Investments – continued
| Issuer
|
|
|
Shares/Par
|
Value
($) |
| Common
Stocks – continued |
| Machinery
& Tools – 6.4% |
|
| Azbil
Corp. |
|
19,200 |
$
833,341 |
| Fujitec
Co. Ltd. |
|
43,700 |
1,076,065 |
| IDEX
Corp. |
|
4,512 |
1,010,688 |
| Ingersoll
Rand, Inc. (a) |
|
25,308 |
1,341,830 |
| Rexnord
Corp. |
|
19,755 |
1,200,314 |
| Ritchie
Bros. Auctioneers, Inc. |
|
25,347 |
1,586,469 |
| Spirax-Sarco
Engineering PLC |
|
3,671 |
813,084 |
| VAT
Group AG |
|
1,628 |
681,955 |
| |
|
|
|
$8,543,746 |
| Medical
& Health Technology & Services – 4.8% |
|
| AS
ONE Corp. |
|
5,200 |
$
772,804 |
| Charles
River Laboratories International, Inc. (a) |
|
3,871 |
1,718,182 |
| ICON
PLC (a) |
|
13,445 |
3,438,827 |
| Selcuk
Ecza Deposu Ticaret ve Sanayi A.S. |
|
524,027 |
574,656 |
| |
|
|
|
$6,504,469 |
| Medical
Equipment – 5.7% |
|
| Gerresheimer
AG |
|
17,077 |
$
1,813,723 |
| Maravai
Lifesciences Holdings, Inc., “A” (a) |
|
22,120 |
1,309,061 |
| PerkinElmer,
Inc. |
|
14,000 |
2,587,200 |
| STERIS
PLC |
|
8,982 |
1,931,220 |
| |
|
|
|
$7,641,204 |
| Network
& Telecom – 1.0% |
|
| CoreSite
Realty Corp., REIT |
|
9,175 |
$
1,361,295 |
| Other
Banks & Diversified Financials – 0.4% |
|
| Allfunds
Group PLC (a) |
|
29,314 |
$
528,256 |
| Pollution
Control – 2.7% |
|
| Daiseki
Co. Ltd. |
|
30,600 |
$
1,239,131 |
| GFL
Environmental, Inc. |
|
67,723 |
2,383,172 |
| |
|
|
|
$3,622,303 |
| Printing
& Publishing – 1.1% |
|
| Wolters
Kluwer N.V. |
|
12,494 |
$
1,437,169 |
| Real
Estate – 6.8% |
|
| Big
Yellow Group PLC, REIT |
|
55,167 |
$
1,156,657 |
| Catena
AB |
|
17,967 |
1,160,746 |
| LEG
Immobilien SE |
|
7,187 |
1,145,617 |
| Multiplan
Empreendimentos Imobiliarios S.A. |
|
216,925 |
885,186 |
| National
Storage, REIT |
|
687,768 |
1,177,340 |
| Sun
Communities, Inc., REIT |
|
4,733 |
953,652 |
Portfolio of
Investments – continued
| Issuer
|
|
|
Shares/Par
|
Value
($) |
| Common
Stocks – continued |
| Real
Estate – continued |
|
| Tritax
Big Box PLC, REIT |
|
366,374 |
$
1,193,791 |
| Unite
Group PLC, REIT |
|
90,800 |
1,526,125 |
| |
|
|
|
$9,199,114 |
| Restaurants
– 0.8% |
|
| Yum
China Holdings, Inc. |
|
16,953 |
$
1,043,627 |
| Specialty
Chemicals – 4.6% |
|
| Axalta
Coating Systems Ltd. (a) |
|
43,757 |
$
1,336,339 |
| Borregaard
ASA |
|
43,036 |
1,126,111 |
| Croda
International PLC |
|
9,327 |
1,173,069 |
| Essentra
PLC |
|
378,015 |
1,507,170 |
| Symrise
AG |
|
7,423 |
1,057,024 |
| |
|
|
|
$6,199,713 |
| Specialty
Stores – 4.6% |
|
| Burlington
Stores, Inc. (a) |
|
5,526 |
$
1,654,982 |
| Just
Eat Takeaway (a) |
|
12,815 |
1,160,874 |
| Leslie's,
Inc. (a) |
|
63,871 |
1,540,568 |
| Musti
Group OY |
|
23,418 |
945,658 |
| NISHIMATSUYA
CHAIN Co., Ltd. |
|
77,100 |
925,775 |
| |
|
|
|
$6,227,857 |
| Trucking
– 0.8% |
|
| SG
Holdings Co. Ltd. |
|
37,000 |
$
1,006,263 |
| Total
Common Stocks (Identified Cost, $97,344,733) |
|
$
131,766,012 |
| Investment
Companies (h) – 2.2% |
| Money
Market Funds – 2.2% |
|
| MFS
Institutional Money Market Portfolio, 0.04% (v) (Identified Cost, $2,980,458) |
|
|
2,980,458
|
$
2,980,458 |
| Collateral
for Securities Loaned – 0.3% |
| State
Street Navigator Securities Lending Government Money Market Portfolio, 0.03% (j) (Identified Cost, $313,639) |
|
|
313,639 |
$
313,639 |
| |
| |
| Other
Assets, Less Liabilities – (0.3)% |
|
(344,727) |
| Net
Assets – 100.0% |
$
134,715,382 |
| (a)
|
Non-income
producing security. |
|
|
|
| (h)
|
An
affiliated issuer, which may be considered one in which the fund owns 5% or more of the outstanding voting securities, or a company which is under common control. At period end, the aggregate values of the fund's investments in affiliated issuers
and in unaffiliated issuers were $2,980,458 and $132,079,651, respectively. |
|
|
|
| (j)
|
The
rate quoted is the annualized seven-day yield of the fund at period end. |
|
|
|
Portfolio of
Investments – continued
| (l)
|
A
portion of this security is on loan. See Note 2 for additional information. |
|
|
|
| (v)
|
Affiliated
issuer that is available only to investment companies managed by MFS. The rate quoted for the MFS Institutional Money Market Portfolio is the annualized seven-day yield of the fund at period end. |
|
|
|
| The
following abbreviations are used in this report and are defined: |
| ADR
|
American
Depositary Receipt |
| REIT
|
Real
Estate Investment Trust |
See Notes to
Financial Statements
Financial Statements
Statement of Assets and Liabilities
At 8/31/21
This statement represents your fund’s balance sheet,
which details the assets and liabilities comprising the total value of the fund.
| Assets
|
|
| Investments
in unaffiliated issuers, at value, including $298,584 of securities on loan (identified cost, $97,658,372) |
$132,079,651
|
| Investments
in affiliated issuers, at value (identified cost, $2,980,458) |
2,980,458
|
| Cash
|
108,526
|
| Foreign
currency, at value (identified cost, $7,977) |
7,982
|
| Receivables
for |
|
| Fund
shares sold |
128,563
|
| Interest
and dividends |
131,505
|
| Receivable
from investment adviser |
27,739
|
| Other
assets |
107
|
| Total
assets |
$135,464,531
|
| Liabilities
|
|
| Payables
for |
|
| Investments
purchased |
$237,697
|
| Fund
shares reacquired |
40,289
|
| Collateral
for securities loaned, at value |
313,639
|
| Payable
to affiliates |
|
| Administrative
services fee |
156
|
| Shareholder
servicing costs |
21,469
|
| Distribution
and service fees |
1,008
|
| Payable
for independent Trustees' compensation |
14
|
| Deferred
country tax expense payable |
28,542
|
| Accrued
expenses and other liabilities |
106,335
|
| Total
liabilities |
$749,149
|
| Net
assets |
$134,715,382
|
| Net
assets consist of |
|
| Paid-in
capital |
$95,006,809
|
| Total
distributable earnings (loss) |
39,708,573
|
| Net
assets |
$134,715,382
|
| Shares
of beneficial interest outstanding |
4,845,538
|
Statement of Assets and
Liabilities – continued
| |
Net
assets |
Shares
outstanding |
Net
asset value
per share (a) |
| Class
A |
$44,743,142
|
1,623,201
|
$27.56
|
| Class
B |
2,978,820
|
117,500
|
25.35
|
| Class
C |
3,895,881
|
153,684
|
25.35
|
| Class
I |
61,501,535
|
2,185,025
|
28.15
|
| Class
R1 |
159,902
|
6,312
|
25.33
|
| Class
R2 |
237,182
|
8,834
|
26.85
|
| Class
R3 |
294,195
|
10,676
|
27.56
|
| Class
R4 |
116,263
|
4,130
|
28.15
|
| Class
R6 |
20,788,462
|
736,176
|
28.24
|
| (a)
|
Maximum
offering price per share was equal to the net asset value per share for all share classes, except for Class A, for which the maximum offering price per share was $29.24 [100 / 94.25 x $27.56]. On sales of $50,000 or more, the maximum offering price
of Class A shares is reduced. A contingent deferred sales charge may be imposed on redemptions of Class A, Class B, and Class C shares. Redemption price per share was equal to the net asset value per share for Classes I, R1, R2, R3, R4, and R6.
|
See Notes to Financial Statements
Financial Statements
Statement of Operations
Year ended 8/31/21
This statement describes how much your fund earned in
investment income and accrued in expenses. It also describes any gains and/or losses generated by fund operations.
| Net
investment income (loss) |
|
| Income
|
|
| Dividends
|
$1,066,529
|
| Income
on securities loaned |
3,569
|
| Dividends
from affiliated issuers |
2,138
|
| Interest
|
67
|
| Other
|
34
|
| Foreign
taxes withheld |
(77,413)
|
| Total
investment income |
$994,924
|
| Expenses
|
|
| Management
fee |
$920,086
|
| Distribution
and service fees |
141,101
|
| Shareholder
servicing costs |
83,539
|
| Administrative
services fee |
23,179
|
| Independent
Trustees' compensation |
3,079
|
| Custodian
fee |
38,684
|
| Shareholder
communications |
13,432
|
| Audit
and tax fees |
72,932
|
| Legal
fees |
692
|
| Registration
fees |
154,619
|
| Miscellaneous
|
31,624
|
| Total
expenses |
$1,482,967
|
| Reduction
of expenses by investment adviser and distributor |
(325,413)
|
| Net
expenses |
$1,157,554
|
| Net
investment income (loss) |
$(162,630)
|
| Realized
and unrealized gain (loss) |
| Realized
gain (loss) (identified cost basis) |
|
| Unaffiliated
issuers (net of $14,803 country tax) |
$7,429,791
|
| Affiliated
issuers |
(67)
|
| Foreign
currency |
(10,667)
|
| Net
realized gain (loss) |
$7,419,057
|
| Change
in unrealized appreciation or depreciation |
|
| Unaffiliated
issuers (net of $28,542 increase in deferred country tax) |
$19,552,567
|
| Affiliated
issuers |
67
|
| Translation
of assets and liabilities in foreign currencies |
(1,817)
|
| Net
unrealized gain (loss) |
$19,550,817
|
| Net
realized and unrealized gain (loss) |
$26,969,874
|
| Change
in net assets from operations |
$26,807,244
|
See Notes to Financial
Statements
Financial Statements
Statements of Changes in Net Assets
These statements describe the increases and/or decreases in
net assets resulting from operations, any distributions, and any shareholder transactions.
| |
Year
ended |
| |
8/31/21
|
8/31/20
|
| Change
in net assets |
|
|
| From
operations |
|
|
| Net
investment income (loss) |
$(162,630)
|
$(118,775)
|
| Net
realized gain (loss) |
7,419,057
|
2,518,082
|
| Net
unrealized gain (loss) |
19,550,817
|
5,846,297
|
| Change
in net assets from operations |
$26,807,244
|
$8,245,604
|
| Total
distributions to shareholders |
$(2,554,040)
|
$(1,495,013)
|
| Change
in net assets from fund share transactions |
$54,622,943
|
$4,053,286
|
| Total
change in net assets |
$78,876,147
|
$10,803,877
|
| Net
assets |
|
|
| At
beginning of period |
55,839,235
|
45,035,358
|
| At
end of period |
$134,715,382
|
$55,839,235
|
See Notes to Financial
Statements
Financial
Statements
Financial Highlights
The financial highlights table is intended to help you
understand the fund's financial performance for the past 5 years. Certain information reflects financial results for a single fund share. The total returns in the table represent the rate that an investor would have earned (or lost) on an investment
in the fund share class (assuming reinvestment of all distributions) held for the entire period.
| Class
A |
Year
ended |
| |
8/31/21
|
8/31/20
|
8/31/19
|
8/31/18
|
8/31/17
|
| Net
asset value, beginning of period |
$21.57
|
$18.72
|
$21.27
|
$18.31
|
$15.69
|
| Income
(loss) from investment operations |
| Net
investment income (loss) (d) |
$(0.06)
|
$(0.06)
|
$(0.03)
|
$(0.03)
|
$(0.02)
|
| Net
realized and unrealized gain (loss) |
6.96
|
3.49
|
(0.62)
|
3.57
|
2.66
|
| Total
from investment operations |
$6.90
|
$3.43
|
$(0.65)
|
$3.54
|
$2.64
|
| Less
distributions declared to shareholders |
| From
net investment income |
$—
|
$—
|
$(0.02)
|
$—
|
$(0.02)
|
| From
net realized gain |
(0.91)
|
(0.58)
|
(1.88)
|
(0.58)
|
—
|
| Total
distributions declared to shareholders |
$(0.91)
|
$(0.58)
|
$(1.90)
|
$(0.58)
|
$(0.02)
|
| Net
asset value, end of period (x) |
$27.56
|
$21.57
|
$18.72
|
$21.27
|
$18.31
|
| Total
return (%) (r)(s)(t)(x) |
32.82
|
18.63
|
(1.65)
|
19.70
|
16.85
|
Ratios
(%) (to average net assets)
and Supplemental data: |
| Expenses
before expense reductions (f) |
1.68
|
1.97
|
2.04
|
1.94
|
2.33
|
| Expenses
after expense reductions (f) |
1.34
|
1.49
|
1.51
|
1.50
|
1.50
|
| Net
investment income (loss) |
(0.26)
|
(0.32)
|
(0.16)
|
(0.17)
|
(0.15)
|
| Portfolio
turnover |
36
|
84
|
55
|
36
|
37
|
| Net
assets at end of period (000 omitted) |
$44,743
|
$17,029
|
$11,255
|
$11,581
|
$7,893
|
See Notes to Financial
Statements
Financial
Highlights – continued
| Class
B |
Year
ended |
| |
8/31/21
|
8/31/20
|
8/31/19
|
8/31/18
|
8/31/17
|
| Net
asset value, beginning of period |
$20.05
|
$17.57
|
$20.21
|
$17.55
|
$15.13
|
| Income
(loss) from investment operations |
| Net
investment income (loss) (d) |
$(0.25)
|
$(0.19)
|
$(0.16)
|
$(0.17)
|
$(0.13)
|
| Net
realized and unrealized gain (loss) |
6.46
|
3.25
|
(0.60)
|
3.41
|
2.55
|
| Total
from investment operations |
$6.21
|
$3.06
|
$(0.76)
|
$3.24
|
$2.42
|
| Less
distributions declared to shareholders |
| From
net investment income |
$—
|
$—
|
$—
|
$—
|
$—
|
| From
net realized gain |
(0.91)
|
(0.58)
|
(1.88)
|
(0.58)
|
—
|
| Total
distributions declared to shareholders |
$(0.91)
|
$(0.58)
|
$(1.88)
|
$(0.58)
|
$—
|
| Net
asset value, end of period (x) |
$25.35
|
$20.05
|
$17.57
|
$20.21
|
$17.55
|
| Total
return (%) (r)(s)(t)(x) |
31.84
|
17.72
|
(2.35)
|
18.83
|
15.99
|
Ratios
(%) (to average net assets)
and Supplemental data: |
| Expenses
before expense reductions (f) |
2.46
|
2.72
|
2.79
|
2.69
|
3.07
|
| Expenses
after expense reductions (f) |
2.10
|
2.24
|
2.26
|
2.25
|
2.25
|
| Net
investment income (loss) |
(1.12)
|
(1.08)
|
(0.91)
|
(0.90)
|
(0.83)
|
| Portfolio
turnover |
36
|
84
|
55
|
36
|
37
|
| Net
assets at end of period (000 omitted) |
$2,979
|
$2,678
|
$2,508
|
$2,488
|
$1,513
|
| Class
C |
Year
ended |
| |
8/31/21
|
8/31/20
|
8/31/19
|
8/31/18
|
8/31/17
|
| Net
asset value, beginning of period |
$20.05
|
$17.57
|
$20.21
|
$17.55
|
$15.13
|
| Income
(loss) from investment operations |
| Net
investment income (loss) (d) |
$(0.25)
|
$(0.19)
|
$(0.16)
|
$(0.18)
|
$(0.13)
|
| Net
realized and unrealized gain (loss) |
6.46
|
3.25
|
(0.60)
|
3.42
|
2.55
|
| Total
from investment operations |
$6.21
|
$3.06
|
$(0.76)
|
$3.24
|
$2.42
|
| Less
distributions declared to shareholders |
| From
net investment income |
$—
|
$—
|
$—
|
$—
|
$—
|
| From
net realized gain |
(0.91)
|
(0.58)
|
(1.88)
|
(0.58)
|
—
|
| Total
distributions declared to shareholders |
$(0.91)
|
$(0.58)
|
$(1.88)
|
$(0.58)
|
$—
|
| Net
asset value, end of period (x) |
$25.35
|
$20.05
|
$17.57
|
$20.21
|
$17.55
|
| Total
return (%) (r)(s)(t)(x) |
31.84
|
17.72
|
(2.35)
|
18.83
|
15.99
|
Ratios
(%) (to average net assets)
and Supplemental data: |
| Expenses
before expense reductions (f) |
2.46
|
2.72
|
2.78
|
2.69
|
3.08
|
| Expenses
after expense reductions (f) |
2.10
|
2.24
|
2.26
|
2.25
|
2.25
|
| Net
investment income (loss) |
(1.13)
|
(1.08)
|
(0.91)
|
(0.93)
|
(0.84)
|
| Portfolio
turnover |
36
|
84
|
55
|
36
|
37
|
| Net
assets at end of period (000 omitted) |
$3,896
|
$3,422
|
$3,287
|
$4,470
|
$4,944
|
See Notes to Financial
Statements
Financial
Highlights – continued
| Class
I |
Year
ended |
| |
8/31/21
|
8/31/20
|
8/31/19
|
8/31/18
|
8/31/17
|
| Net
asset value, beginning of period |
$21.96
|
$19.00
|
$21.54
|
$18.49
|
$15.86
|
| Income
(loss) from investment operations |
| Net
investment income (loss) (d) |
$(0.00)(w)
|
$(0.02)
|
$0.01
|
$0.02
|
$0.04
|
| Net
realized and unrealized gain (loss) |
7.10
|
3.56
|
(0.62)
|
3.61
|
2.67
|
| Total
from investment operations |
$7.10
|
$3.54
|
$(0.61)
|
$3.63
|
$2.71
|
| Less
distributions declared to shareholders |
| From
net investment income |
$—
|
$—
|
$(0.05)
|
$—
|
$(0.08)
|
| From
net realized gain |
(0.91)
|
(0.58)
|
(1.88)
|
(0.58)
|
—
|
| Total
distributions declared to shareholders |
$(0.91)
|
$(0.58)
|
$(1.93)
|
$(0.58)
|
$(0.08)
|
| Net
asset value, end of period (x) |
$28.15
|
$21.96
|
$19.00
|
$21.54
|
$18.49
|
| Total
return (%) (r)(s)(t)(x) |
33.16
|
18.94
|
(1.41)
|
20.01
|
17.20
|
Ratios
(%) (to average net assets)
and Supplemental data: |
| Expenses
before expense reductions (f) |
1.43
|
1.72
|
1.76
|
1.69
|
2.06
|
| Expenses
after expense reductions (f) |
1.09
|
1.24
|
1.26
|
1.25
|
1.25
|
| Net
investment income (loss) |
(0.02)
|
(0.09)
|
0.05
|
0.11
|
0.21
|
| Portfolio
turnover |
36
|
84
|
55
|
36
|
37
|
| Net
assets at end of period (000 omitted) |
$61,502
|
$18,688
|
$14,059
|
$28,463
|
$17,606
|
| Class
R1 |
Year
ended |
| |
8/31/21
|
8/31/20
|
8/31/19
|
8/31/18
|
8/31/17
|
| Net
asset value, beginning of period |
$20.04
|
$17.56
|
$20.20
|
$17.55
|
$15.13
|
| Income
(loss) from investment operations |
| Net
investment income (loss) (d) |
$(0.25)
|
$(0.19)
|
$(0.16)
|
$(0.18)
|
$(0.14)
|
| Net
realized and unrealized gain (loss) |
6.45
|
3.25
|
(0.60)
|
3.41
|
2.56
|
| Total
from investment operations |
$6.20
|
$3.06
|
$(0.76)
|
$3.23
|
$2.42
|
| Less
distributions declared to shareholders |
| From
net investment income |
$—
|
$—
|
$—
|
$—
|
$—
|
| From
net realized gain |
(0.91)
|
(0.58)
|
(1.88)
|
(0.58)
|
—
|
| Total
distributions declared to shareholders |
$(0.91)
|
$(0.58)
|
$(1.88)
|
$(0.58)
|
$—
|
| Net
asset value, end of period (x) |
$25.33
|
$20.04
|
$17.56
|
$20.20
|
$17.55
|
| Total
return (%) (r)(s)(t)(x) |
31.80
|
17.73
|
(2.35)
|
18.77
|
15.99
|
Ratios
(%) (to average net assets)
and Supplemental data: |
| Expenses
before expense reductions (f) |
2.45
|
2.72
|
2.79
|
2.69
|
3.08
|
| Expenses
after expense reductions (f) |
2.09
|
2.24
|
2.26
|
2.25
|
2.25
|
| Net
investment income (loss) |
(1.11)
|
(1.08)
|
(0.92)
|
(0.92)
|
(0.86)
|
| Portfolio
turnover |
36
|
84
|
55
|
36
|
37
|
| Net
assets at end of period (000 omitted) |
$160
|
$120
|
$101
|
$73
|
$62
|
See Notes to Financial
Statements
Financial
Highlights – continued
| Class
R2 |
Year
ended |
| |
8/31/21
|
8/31/20
|
8/31/19
|
8/31/18
|
8/31/17
|
| Net
asset value, beginning of period |
$21.09
|
$18.36
|
$20.93
|
$18.06
|
$15.50
|
| Income
(loss) from investment operations |
| Net
investment income (loss) (d) |
$(0.14)
|
$(0.11)
|
$(0.07)
|
$(0.07)
|
$(0.05)
|
| Net
realized and unrealized gain (loss) |
6.81
|
3.42
|
(0.62)
|
3.52
|
2.62
|
| Total
from investment operations |
$6.67
|
$3.31
|
$(0.69)
|
$3.45
|
$2.57
|
| Less
distributions declared to shareholders |
| From
net investment income |
$—
|
$—
|
$—
|
$—
|
$(0.01)
|
| From
net realized gain |
(0.91)
|
(0.58)
|
(1.88)
|
(0.58)
|
—
|
| Total
distributions declared to shareholders |
$(0.91)
|
$(0.58)
|
$(1.88)
|
$(0.58)
|
$(0.01)
|
| Net
asset value, end of period (x) |
$26.85
|
$21.09
|
$18.36
|
$20.93
|
$18.06
|
| Total
return (%) (r)(s)(t)(x) |
32.47
|
18.33
|
(1.89)
|
19.47
|
16.58
|
Ratios
(%) (to average net assets)
and Supplemental data: |
| Expenses
before expense reductions (f) |
1.95
|
2.22
|
2.29
|
2.18
|
2.57
|
| Expenses
after expense reductions (f) |
1.59
|
1.74
|
1.76
|
1.75
|
1.75
|
| Net
investment income (loss) |
(0.61)
|
(0.58)
|
(0.41)
|
(0.33)
|
(0.32)
|
| Portfolio
turnover |
36
|
84
|
55
|
36
|
37
|
| Net
assets at end of period (000 omitted) |
$237
|
$178
|
$218
|
$211
|
$115
|
| Class
R3 |
Year
ended |
| |
8/31/21
|
8/31/20
|
8/31/19
|
8/31/18
|
8/31/17
|
| Net
asset value, beginning of period |
$21.57
|
$18.72
|
$21.26
|
$18.30
|
$15.70
|
| Income
(loss) from investment operations |
| Net
investment income (loss) (d) |
$(0.09)
|
$(0.06)
|
$(0.03)
|
$(0.04)
|
$(0.02)
|
| Net
realized and unrealized gain (loss) |
6.99
|
3.49
|
(0.62)
|
3.58
|
2.66
|
| Total
from investment operations |
$6.90
|
$3.43
|
$(0.65)
|
$3.54
|
$2.64
|
| Less
distributions declared to shareholders |
| From
net investment income |
$—
|
$—
|
$(0.01)
|
$—
|
$(0.04)
|
| From
net realized gain |
(0.91)
|
(0.58)
|
(1.88)
|
(0.58)
|
—
|
| Total
distributions declared to shareholders |
$(0.91)
|
$(0.58)
|
$(1.89)
|
$(0.58)
|
$(0.04)
|
| Net
asset value, end of period (x) |
$27.56
|
$21.57
|
$18.72
|
$21.26
|
$18.30
|
| Total
return (%) (r)(s)(t)(x) |
32.82
|
18.63
|
(1.63)
|
19.72
|
16.87
|
Ratios
(%) (to average net assets)
and Supplemental data: |
| Expenses
before expense reductions (f) |
1.70
|
1.97
|
2.04
|
1.94
|
2.32
|
| Expenses
after expense reductions (f) |
1.34
|
1.49
|
1.51
|
1.50
|
1.50
|
| Net
investment income (loss) |
(0.35)
|
(0.31)
|
(0.16)
|
(0.18)
|
(0.13)
|
| Portfolio
turnover |
36
|
84
|
55
|
36
|
37
|
| Net
assets at end of period (000 omitted) |
$294
|
$206
|
$152
|
$144
|
$116
|
See Notes to Financial
Statements
Financial
Highlights – continued
| Class
R4 |
Year
ended |
| |
8/31/21
|
8/31/20
|
8/31/19
|
8/31/18
|
8/31/17
|
| Net
asset value, beginning of period |
$21.96
|
$19.00
|
$21.56
|
$18.50
|
$15.87
|
| Income
(loss) from investment operations |
| Net
investment income (loss) (d) |
$(0.03)
|
$(0.02)
|
$0.02
|
$0.02
|
$0.03
|
| Net
realized and unrealized gain (loss) |
7.13
|
3.56
|
(0.64)
|
3.62
|
2.67
|
| Total
from investment operations |
$7.10
|
$3.54
|
$(0.62)
|
$3.64
|
$2.70
|
| Less
distributions declared to shareholders |
| From
net investment income |
$—
|
$—
|
$(0.06)
|
$—
|
$(0.07)
|
| From
net realized gain |
(0.91)
|
(0.58)
|
(1.88)
|
(0.58)
|
—
|
| Total
distributions declared to shareholders |
$(0.91)
|
$(0.58)
|
$(1.94)
|
$(0.58)
|
$(0.07)
|
| Net
asset value, end of period (x) |
$28.15
|
$21.96
|
$19.00
|
$21.56
|
$18.50
|
| Total
return (%) (r)(s)(t)(x) |
33.16
|
18.94
|
(1.43)
|
20.05
|
17.11
|
Ratios
(%) (to average net assets)
and Supplemental data: |
| Expenses
before expense reductions (f) |
1.45
|
1.72
|
1.78
|
1.69
|
2.08
|
| Expenses
after expense reductions (f) |
1.09
|
1.24
|
1.26
|
1.25
|
1.25
|
| Net
investment income (loss) |
(0.11)
|
(0.08)
|
0.08
|
0.08
|
0.18
|
| Portfolio
turnover |
36
|
84
|
55
|
36
|
37
|
| Net
assets at end of period (000 omitted) |
$116
|
$87
|
$73
|
$74
|
$62
|
| Class
R6 |
Year
ended |
| |
8/31/21
|
8/31/20
|
8/31/19
|
8/31/18
|
8/31/17
|
| Net
asset value, beginning of period |
$22.01
|
$19.03
|
$21.58
|
$18.51
|
$15.87
|
| Income
(loss) from investment operations |
| Net
investment income (loss) (d) |
$(0.00)(w)
|
$0.01
|
$0.05
|
$0.04
|
$0.03
|
| Net
realized and unrealized gain (loss) |
7.14
|
3.55
|
(0.64)
|
3.61
|
2.70
|
| Total
from investment operations |
$7.14
|
$3.56
|
$(0.59)
|
$3.65
|
$2.73
|
| Less
distributions declared to shareholders |
| From
net investment income |
$—
|
$—
|
$(0.08)
|
$—
|
$(0.09)
|
| From
net realized gain |
(0.91)
|
(0.58)
|
(1.88)
|
(0.58)
|
—
|
| Total
distributions declared to shareholders |
$(0.91)
|
$(0.58)
|
$(1.96)
|
$(0.58)
|
$(0.09)
|
| Net
asset value, end of period (x) |
$28.24
|
$22.01
|
$19.03
|
$21.58
|
$18.51
|
| Total
return (%) (r)(s)(t)(x) |
33.27
|
19.01
|
(1.26)
|
20.09
|
17.31
|
Ratios
(%) (to average net assets)
and Supplemental data: |
| Expenses
before expense reductions (f) |
1.37
|
1.62
|
1.69
|
1.60
|
1.97
|
| Expenses
after expense reductions (f) |
1.01
|
1.15
|
1.16
|
1.16
|
1.15
|
| Net
investment income (loss) |
(0.01)
|
0.03
|
0.24
|
0.18
|
0.21
|
| Portfolio
turnover |
36
|
84
|
55
|
36
|
37
|
| Net
assets at end of period (000 omitted) |
$20,788
|
$13,432
|
$13,382
|
$6,332
|
$4,609
|
See Notes to Financial Statements
Financial
Highlights – continued
| (d)
|
Per share data
is based on average shares outstanding. |
| (f)
|
Ratios do
not reflect reductions from fees paid indirectly, if applicable. |
| (r)
|
Certain
expenses have been reduced without which performance would have been lower. |
| (s)
|
From time to
time the fund may receive proceeds from litigation settlements, without which performance would be lower. |
| (t)
|
Total
returns do not include any applicable sales charges. |
| (w)
|
Per share
amount was less than $0.01. |
| (x)
|
The
net asset values and total returns have been calculated on net assets which include adjustments made in accordance with U.S. generally accepted accounting principles required at period end for financial reporting purposes. |
See Notes to Financial Statements
Notes to Financial
Statements
(1) Business and Organization
MFS Global New Discovery Fund (the fund) is a diversified
series of MFS Series Trust IV (the trust). The trust is organized as a Massachusetts business trust and is registered under the Investment Company Act of 1940, as amended, as an open-end management investment company.
The fund is an investment company and accordingly follows the
investment company accounting and reporting guidance of the Financial Accounting Standards Board (FASB) Accounting Standards Codification Topic 946 Financial Services - Investment Companies.
(2) Significant Accounting Policies
General — The preparation
of financial statements in conformity with U.S. generally accepted accounting principles requires management to make estimates and assumptions that affect the reported amounts of assets and liabilities, and disclosure of contingent assets and
liabilities at the date of the financial statements and the reported amounts of increases and decreases in net assets from operations during the reporting period. Actual results could differ from those estimates. In the preparation of these
financial statements, management has evaluated subsequent events occurring after the date of the fund’s Statement of Assets and Liabilities through the date that the financial statements were issued.
The fund invests in foreign securities. Investments in foreign securities are vulnerable to the effects of changes in the relative values of the local currency and the U.S. dollar and to the effects of changes in each country’s market,
economic, industrial, political, regulatory, geopolitical, environmental, public health, and other conditions.
Certain of the fund's investments, including its investments in
derivatives, as well as any debt issued by the fund and other contractual arrangements of the fund may be based on reference interest rates such as the London Interbank Offered Rate (“LIBOR”). In 2017, the regulatory authority that
oversees financial services firms in the United Kingdom announced plans to transition away from LIBOR by the end of 2021. In March 2021, the administrator of LIBOR announced the extension of the publication of the more commonly used U.S. dollar
LIBOR settings to the end of June 2023. Although the full impacts of the transition away from LIBOR are not fully known, the transition may result in, among other things, an increase in volatility or illiquidity of the markets for instruments that
currently rely on LIBOR to determine interest rates and this could have an adverse impact on the fund's performance. With respect to the fund's accounting for investments, including its investments in derivatives, as well as any debt issued by the
fund and other contractual arrangements of the fund that undergo reference rate-related modifications as a result of the transition, management will rely upon the relief provided by FASB Codification Topic 848 – Reference Rate Reform (Topic
848). The guidance in Topic 848 permits the fund to disregard the GAAP accounting requirements around certain contract modifications resulting from the LIBOR transition such that for contracts considered in scope, the fund can account for those
modified contracts as a continuation of the existing contracts.
Balance Sheet Offsetting
— The fund's accounting policy with respect to balance sheet offsetting is that, absent an event of default by the counterparty or a termination of the agreement, the International Swaps and Derivatives Association (ISDA) Master Agreement, or
similar agreement, does not result in an offset of reported amounts of financial assets and financial liabilities in the Statement of Assets and Liabilities across
Notes to Financial
Statements - continued
transactions between the fund and the applicable counterparty. The fund's
right to setoff may be restricted or prohibited by the bankruptcy or insolvency laws of the particular jurisdiction to which a specific master netting agreement counterparty is subject. Balance sheet offsetting disclosures, to the extent applicable
to the fund, have been included in the fund’s Significant Accounting Policies note under the captions for each of the fund’s in-scope financial instruments and transactions.
Investment Valuations
— Equity securities, including restricted equity securities, are generally valued at the last sale or official closing price on their primary market or exchange as provided by a third-party pricing
service. Equity securities, for which there were no sales reported that day, are generally valued at the last quoted daily bid quotation on their primary market or exchange as provided by a third-party pricing service. Short-term instruments with a maturity at issuance of 60 days or less may be valued at amortized cost, which approximates market value. Open-end investment companies are
generally valued at net asset value per share. Securities and other assets generally valued on the basis of information from a third-party pricing service may also be valued at a broker/dealer bid
quotation. In determining values, third-party pricing services can utilize both transaction data and market information such as yield, quality, coupon rate, maturity, type of issue, trading characteristics,
and other market data. The values of foreign securities and other assets and liabilities expressed in foreign currencies are converted to U.S. dollars using the mean of bid and asked prices for rates provided
by a third-party pricing service.
The Board of
Trustees has delegated primary responsibility for determining or causing to be determined the value of the fund’s investments (including any fair valuation) to the adviser pursuant to valuation policies and procedures approved by the Board. If
the adviser determines that reliable market quotations are not readily available, investments are valued at fair value as determined in good faith by the adviser in accordance with such procedures under the oversight of the Board of Trustees. Under
the fund’s valuation policies and procedures, market quotations are not considered to be readily available for most types of debt instruments and floating rate loans and many types of derivatives. These investments are generally valued at fair
value based on information from third-party pricing services. In addition, investments may be valued at fair value if the adviser determines that an investment’s value has been materially affected by events occurring after the close of the
exchange or market on which the investment is principally traded (such as foreign exchange or market) and prior to the determination of the fund’s net asset value, or after the halt of trading of a specific security where trading does not
resume prior to the close of the exchange or market on which the security is principally traded. Events that occur after foreign markets close (such as developments in foreign markets and significant movements in the U.S. markets) and prior to the
determination of the fund’s net asset value may be deemed to have a material effect on the value of securities traded in foreign markets. Accordingly, the fund’s foreign equity securities may often be valued at fair value. The adviser
generally relies on third-party pricing services or other information (such as the correlation with price movements of similar securities in the same or other markets; the type, cost and investment characteristics of the security; the business and
financial condition of the issuer; and trading and other market data) to assist in determining whether to fair value and at what value to fair value an investment. The value of an investment for purposes of calculating the fund’s net asset
value can differ depending on the source and method used to determine value. When fair valuation is used, the value of an investment used to determine the fund’s net asset value may differ from quoted or
Notes to Financial
Statements - continued
published prices for the same investment. There can be no assurance that the
fund could obtain the fair value assigned to an investment if it were to sell the investment at the same time at which the fund determines its net asset value per share.
Various inputs are used in determining the value of the fund's
assets or liabilities. These inputs are categorized into three broad levels. In certain cases, the inputs used to measure fair value may fall into different levels of the fair value hierarchy. In such cases, an investment's level within the fair
value hierarchy is based on the lowest level of input that is significant to the fair value measurement. The fund's assessment of the significance of a particular input to the fair value measurement in its entirety requires judgment, and considers
factors specific to the investment. Level 1 includes unadjusted quoted prices in active markets for identical assets or liabilities. Level 2 includes other significant observable market-based inputs (including quoted prices for similar securities,
interest rates, prepayment speed, and credit risk). Level 3 includes unobservable inputs, which may include the adviser's own assumptions in determining the fair value of investments. The following is a summary of the levels used as of August 31,
2021 in valuing the fund's assets or liabilities:
| Financial
Instruments |
Level
1 |
Level
2 |
Level
3 |
Total
|
| Equity
Securities |
$131,766,012
|
$—
|
$—
|
$131,766,012
|
| Mutual
Funds |
3,294,097
|
—
|
—
|
3,294,097
|
| Total
|
$135,060,109
|
$—
|
$—
|
$135,060,109
|
For further information regarding
security characteristics, see the Portfolio of Investments.
Foreign Currency Translation
— Purchases and sales of foreign investments, income, and expenses are converted into U.S. dollars based upon currency exchange rates prevailing on the respective dates of such transactions or on the reporting date for foreign denominated
receivables and payables. Gains and losses attributable to foreign currency exchange rates on sales of securities are recorded for financial statement purposes as net realized gains and losses on investments. Gains and losses attributable to foreign
exchange rate movements on receivables, payables, income and expenses are recorded for financial statement purposes as foreign currency transaction gains and losses. That portion of both realized and unrealized gains and losses on investments that
results from fluctuations in foreign currency exchange rates is not separately disclosed.
Security Loans — Under
its Securities Lending Agency Agreement with the fund, State Street Bank and Trust Company, as lending agent, loans the securities of the fund to certain qualified institutions (the “Borrowers”) approved by the fund. Security loans can
be terminated at the discretion of either the lending agent or the fund and the related securities must be returned within the earlier of the standard trade settlement period for such securities or within three business days. The loans are
collateralized by cash and/or U.S. Treasury and federal agency obligations in an amount typically at least equal to the market value of the securities loaned. On loans collateralized by cash, the cash collateral is invested in a money market fund.
The market value of the loaned securities is determined at the close of business of the fund and any additional required collateral is delivered to the fund on the next business day. The lending agent provides the fund with indemnification against
Borrower default. In the event of Borrower default, the lending agent will, for the benefit of the fund, either purchase securities identical to those loaned or, when such purchase is commercially impracticable, pay the
Notes to Financial
Statements - continued
fund the market value of the loaned securities. In return, the lending agent
assumes the fund's rights to the related collateral. If the collateral value is less than the cost to purchase identical securities, the lending agent is responsible for the shortfall, but only to the extent that such shortfall is not due to a
decline in collateral value resulting from collateral reinvestment for which the fund bears the risk of loss. At period end, the fund had investment securities on loan, all of which were classified as equity securities in the fund's Portfolio of
Investments, with a fair value of $298,584. The fair value of the fund's investment securities on loan and a related liability of $313,639 for cash collateral received on securities loaned are both presented gross in the Statement of Assets and
Liabilities. The collateral on securities loaned exceeded the value of securities on loan at period end. The liability for cash collateral for securities loaned is carried at fair value, which is categorized as level 2 within the fair value
hierarchy. A portion of the income generated upon investment of the collateral is remitted to the Borrowers, and the remainder is allocated between the fund and the lending agent. On loans collateralized by U.S. Treasury and/or federal agency
obligations, a fee is received from the Borrower, and is allocated between the fund and the lending agent. Income from securities lending is separately reported in the Statement of Operations. The dividend and interest income earned on the
securities loaned is accounted for in the same manner as other dividend and interest income.
Indemnifications — Under
the fund's organizational documents, its officers and Trustees may be indemnified against certain liabilities and expenses arising out of the performance of their duties to the fund. Additionally, in the normal course of business, the fund enters
into agreements with service providers that may contain indemnification clauses. The fund's maximum exposure under these agreements is unknown as this would involve future claims that may be made against the fund that have not yet
occurred.
Investment Transactions and Income — Investment transactions are recorded on the trade date. Dividends received in cash are recorded on the ex-dividend date. Certain dividends from foreign securities will be
recorded when the fund is informed of the dividend if such information is obtained subsequent to the ex-dividend date. Dividend and interest payments received in additional securities are recorded on the ex-dividend or ex-interest date in an amount
equal to the value of the security on such date.
The fund may receive proceeds from litigation settlements. Any
proceeds received from litigation involving portfolio holdings are reflected in the Statement of Operations in realized gain/loss if the security has been disposed of by the fund or in unrealized gain/loss if the security is still held by the fund.
Any other proceeds from litigation not related to portfolio holdings are reflected as other income in the Statement of Operations.
Tax Matters and Distributions
— The fund intends to qualify as a regulated investment company, as defined under Subchapter M of the Internal Revenue Code, and to distribute all of its taxable income, including realized capital gains. As a result, no provision for federal
income tax is required. The fund’s federal tax returns, when filed, will remain subject to examination by the Internal Revenue Service for a three year period. Management has analyzed the fund’s tax positions taken on federal and state
tax returns for all open tax years and does not believe that there are any uncertain tax positions that require recognition of a tax liability. Foreign taxes, if any, have been accrued by the fund in the accompanying financial statements in
accordance with the
Notes to Financial
Statements - continued
applicable foreign tax law. Foreign income taxes may be withheld by certain
countries in which the fund invests. Additionally, capital gains realized by the fund on securities issued in or by certain foreign countries may be subject to capital gains tax imposed by those countries.
Distributions to shareholders are recorded on the ex-dividend
date. Income and capital gain distributions are determined in accordance with income tax regulations, which may differ from U.S. generally accepted accounting principles. Certain capital accounts in the financial statements are periodically adjusted
for permanent differences in order to reflect their tax character. These adjustments have no impact on net assets or net asset value per share. Temporary differences which arise from recognizing certain items of income, expense, gain or loss in
different periods for financial statement and tax purposes will reverse at some time in the future.
Book/tax differences primarily relate to passive foreign
investment companies, wash sale loss deferrals, and treating a portion of the proceeds from redemptions as a distribution for tax purposes.
The tax character of distributions declared to shareholders for
the last two fiscal years is as follows:
| |
Year
ended
8/31/21 |
Year
ended
8/31/20 |
| Ordinary
income (including any short-term capital gains) |
$294,028
|
$—
|
| Long-term
capital gains |
2,260,012
|
1,495,013
|
| Total
distributions |
$2,554,040
|
$1,495,013
|
The federal tax cost and the tax
basis components of distributable earnings were as follows:
| As
of 8/31/21 |
|
| Cost
of investments |
$101,247,349
|
| Gross
appreciation |
34,487,115
|
| Gross
depreciation |
(674,355)
|
| Net
unrealized appreciation (depreciation) |
$
33,812,760 |
| Undistributed
ordinary income |
2,297,807
|
| Undistributed
long-term capital gain |
3,612,509
|
| Other
temporary differences |
(14,503)
|
| Total
distributable earnings (loss) |
$
39,708,573 |
Multiple Classes of Shares of Beneficial Interest — The fund offers multiple classes of shares, which differ in their respective distribution and service fees. The fund's income, realized and unrealized gain (loss), and common expenses are allocated to
shareholders based on the daily net assets of each class. Dividends are declared separately for each class. Differences in per share dividend rates are generally due to differences in separate class expenses. Class B and Class C shares will convert
to
Notes to Financial
Statements - continued
Class A shares approximately eight years after purchase. The fund’s
distributions declared to shareholders as reported in the Statements of Changes in Net Assets are presented by class as follows:
| |
Year
ended
8/31/21 |
|
Year
ended
8/31/20 |
| Class
A |
$767,556
|
|
$373,287
|
| Class
B |
114,415
|
|
81,085
|
| Class
C |
155,692
|
|
107,440
|
| Class
I |
926,902
|
|
465,351
|
| Class
R1 |
5,483
|
|
3,350
|
| Class
R2 |
8,332
|
|
7,003
|
| Class
R3 |
8,753
|
|
4,715
|
| Class
R4 |
3,603
|
|
2,255
|
| Class
R6 |
563,304
|
|
450,527
|
| Total
|
$2,554,040
|
|
$1,495,013
|
(3) Transactions with
Affiliates
Investment Adviser — The fund has an investment advisory agreement with MFS to provide overall investment management and related administrative services and facilities to the fund. The
management fee is computed daily and paid monthly at the following annual rates based on the fund's average daily net assets:
| Up
to $1 billion |
0.975%
|
| In
excess of $1 billion and up to $2.5 billion |
0.90%
|
| In
excess of $2.5 billion |
0.85%
|
MFS has agreed in writing to reduce
its management fee by a specified amount if certain MFS mutual fund assets exceed thresholds agreed to by MFS and the fund's Board of Trustees. For the year ended August 31, 2021, this management fee reduction amounted to $11,339, which is included
in the reduction of total expenses in the Statement of Operations. The management fee incurred for the year ended August 31, 2021 was equivalent to an annual effective rate of 0.96% of the fund's average daily net assets.
The investment adviser has agreed in writing to pay a portion
of the fund’s total annual operating expenses, excluding interest, taxes, extraordinary expenses, brokerage and transaction costs, and investment-related expenses, such that total fund operating expenses do not exceed the following rates
annually of each class’s average daily net assets:
| Classes
|
| A
|
B
|
C
|
I
|
R1
|
R2
|
R3
|
R4
|
R6
|
| 1.35%
|
2.10%
|
2.10%
|
1.10%
|
2.10%
|
1.60%
|
1.35%
|
1.10%
|
1.01%
|
This written agreement will continue
until modified by the fund’s Board of Trustees, but such agreement will continue at least until December 31, 2022. For the year ended August 31, 2021, this reduction amounted to $314,055, which is included in the reduction of total expenses in
the Statement of Operations.
Notes to Financial
Statements - continued
Distributor — MFS Fund
Distributors, Inc. (MFD), a wholly-owned subsidiary of MFS, as distributor, received $12,219 for the year ended August 31, 2021, as its portion of the initial sales charge on sales of Class A shares of the fund.
The Board of Trustees has adopted a distribution plan for
certain share classes pursuant to Rule 12b-1 of the Investment Company Act of 1940.
The fund's distribution plan provides that the fund will pay
MFD for services provided by MFD and financial intermediaries in connection with the distribution and servicing of certain share classes. One component of the plan is a distribution fee paid to MFD and another component of the plan is a service fee
paid to MFD. MFD may subsequently pay all, or a portion, of the distribution and/or service fees to financial intermediaries.
Distribution Plan Fee Table:
| |
Distribution
Fee Rate (d) |
Service
Fee Rate (d) |
Total
Distribution
Plan (d) |
Annual
Effective
Rate (e) |
Distribution
and Service
Fee |
| Class
A |
—
|
0.25%
|
0.25%
|
0.25%
|
$
72,555 |
| Class
B |
0.75%
|
0.25%
|
1.00%
|
1.00%
|
28,184
|
| Class
C |
0.75%
|
0.25%
|
1.00%
|
1.00%
|
37,258
|
| Class
R1 |
0.75%
|
0.25%
|
1.00%
|
1.00%
|
1,390
|
| Class
R2 |
0.25%
|
0.25%
|
0.50%
|
0.50%
|
1,102
|
| Class
R3 |
—
|
0.25%
|
0.25%
|
0.25%
|
612
|
| Total
Distribution and Service Fees |
|
|
|
|
$141,101
|
| (d)
|
In
accordance with the distribution plan for certain classes, the fund pays distribution and/or service fees equal to these annual percentage rates of each class’s average daily net assets. The distribution and service fee rates disclosed by
class represent the current rates in effect at the end of the reporting period. Any rate changes, if applicable, are detailed below. |
| (e)
|
The
annual effective rates represent actual fees incurred under the distribution plan for the year ended August 31, 2021 based on each class's average daily net assets. MFD has voluntarily agreed to rebate a portion of each class's 0.25% service fee
attributable to accounts for which there is no financial intermediary specified on the account except for accounts attributable to MFS or its affiliates' seed money. For the year ended August 31, 2021, this rebate amounted to $19 for Class A and is
included in the reduction of total expenses in the Statement of Operations. |
Certain Class A shares are subject to a contingent deferred
sales charge (CDSC) in the event of a shareholder redemption within 18 months of purchase. Class B shares are subject to a CDSC in the event of a shareholder redemption within six years of purchase. Class C shares are subject to a CDSC in the event
of a shareholder redemption within 12 months of purchase. All contingent deferred sales charges are paid to MFD and during the year ended August 31, 2021, were as follows:
| |
Amount
|
| Class
A |
$908
|
| Class
B |
2,756
|
| Class
C |
85
|
Shareholder Servicing Agent — MFS Service Center, Inc. (MFSC), a wholly-owned subsidiary of MFS, receives a fee from the fund for its services as shareholder servicing agent calculated as a percentage of the average daily net assets of the
fund as
Notes to Financial
Statements - continued
determined periodically under the supervision of the fund's Board of Trustees.
For the year ended August 31, 2021, the fee was $12,067, which equated to 0.0128% annually of the fund's average daily net assets. MFSC also receives reimbursement from the fund for out-of-pocket expenses, sub-accounting and other shareholder
servicing costs which may be paid to affiliated and unaffiliated service providers. Class R6 shares do not incur sub-accounting fees. For the year ended August 31, 2021, these out-of-pocket expenses, sub-accounting and other shareholder servicing
costs amounted to $71,472.
Administrator — MFS provides certain financial, legal, shareholder communications, compliance, and other administrative services to the fund. Under an administrative services agreement, the fund reimburses MFS the costs incurred
to provide these services. The fund is charged an annual fixed amount of $17,500 plus a fee based on average daily net assets. The administrative services fee incurred for the year ended August 31, 2021 was equivalent to an annual effective rate of
0.0246% of the fund's average daily net assets.
Trustees’ and Officers’ Compensation — The fund pays compensation to independent Trustees in the form of a retainer, attendance fees, and additional compensation to Board and Committee chairpersons. The fund does not pay compensation directly to
Trustees or officers of the fund who are also officers of the investment adviser, all of whom receive remuneration from MFS for their services to the fund. Certain officers and Trustees of the fund are officers or directors of MFS, MFD, and
MFSC.
Other
— The fund invests in the MFS Institutional Money Market Portfolio which is managed by MFS and seeks current income consistent with preservation of capital and liquidity. This money market fund does not pay a
management fee to MFS but does incur investment and operating costs.
At August 31, 2021, MFS held approximately 69% of the
outstanding shares of Class R1 and 100% of the outstanding shares of Class R4.
The fund is permitted to engage in purchase and sale
transactions with funds and accounts for which MFS serves as investment adviser or sub-adviser (“cross-trades”) pursuant to a policy adopted by the Board of Trustees. This policy has been designed to ensure that cross-trades conducted by
the fund comply with Rule 17a-7 under the Investment Company Act of 1940. During the year ended August 31, 2021, the fund engaged in purchase transactions pursuant to this policy, which amounted to $16,317.
(4) Portfolio Securities
For the year ended August 31, 2021, purchases and sales of
investments, other than short-term obligations, aggregated $83,850,444 and $32,740,138, respectively.
Notes to Financial
Statements - continued
(5) Shares of Beneficial Interest
The fund's Declaration of Trust permits the Trustees to issue
an unlimited number of full and fractional shares of beneficial interest. Transactions in fund shares were as follows:
| |
Year
ended
8/31/21 |
|
Year
ended
8/31/20 |
| |
Shares
|
Amount
|
|
Shares
|
Amount
|
| Shares
sold |
|
|
|
|
|
| Class
A |
957,677
|
$22,970,310
|
|
338,113
|
$6,494,965
|
| Class
B |
1,592
|
34,067
|
|
1,276
|
24,857
|
| Class
C |
53,041
|
1,179,880
|
|
34,254
|
609,703
|
| Class
I |
1,644,775
|
40,132,646
|
|
449,581
|
8,714,037
|
| Class
R1 |
119
|
2,544
|
|
80
|
1,390
|
| Class
R2 |
3,878
|
89,826
|
|
1,098
|
19,039
|
| Class
R3 |
1,069
|
26,521
|
|
3,130
|
54,410
|
| Class
R6 |
412,599
|
10,165,460
|
|
866,050
|
17,065,262
|
| |
3,074,750
|
$74,601,254
|
|
1,693,582
|
$32,983,663
|
Shares
issued to shareholders
in reinvestment of distributions |
|
|
|
|
|
| Class
A |
33,474
|
$767,556
|
|
18,847
|
$372,607
|
| Class
B |
5,394
|
114,415
|
|
4,390
|
81,085
|
| Class
C |
7,344
|
155,692
|
|
5,817
|
107,440
|
| Class
I |
39,662
|
926,902
|
|
23,175
|
465,351
|
| Class
R1 |
259
|
5,483
|
|
181
|
3,350
|
| Class
R2 |
372
|
8,332
|
|
362
|
7,003
|
| Class
R3 |
382
|
8,753
|
|
239
|
4,715
|
| Class
R4 |
154
|
3,603
|
|
113
|
2,255
|
| Class
R6 |
19,296
|
452,293
|
|
8,711
|
175,256
|
| |
106,337
|
$2,443,029
|
|
61,835
|
$1,219,062
|
| Shares
reacquired |
|
|
|
|
|
| Class
A |
(157,226)
|
$(3,846,783)
|
|
(168,839)
|
$(3,111,028)
|
| Class
B |
(23,031)
|
(506,891)
|
|
(14,874)
|
(270,825)
|
| Class
C |
(77,348)
|
(1,730,105)
|
|
(56,516)
|
(973,290)
|
| Class
I |
(350,462)
|
(8,728,707)
|
|
(361,621)
|
(6,686,741)
|
| Class
R1 |
(57)
|
(1,207)
|
|
(1)
|
(10)
|
| Class
R2 |
(3,835)
|
(91,686)
|
|
(4,936)
|
(102,205)
|
| Class
R3 |
(316)
|
(8,060)
|
|
(1,972)
|
(36,791)
|
| Class
R6 |
(306,001)
|
(7,507,901)
|
|
(967,876)
|
(18,968,549)
|
| |
(918,276)
|
$(22,421,340)
|
|
(1,576,635)
|
$(30,149,439)
|
Notes to Financial
Statements - continued
| |
Year
ended
8/31/21 |
|
Year
ended
8/31/20 |
| |
Shares
|
Amount
|
|
Shares
|
Amount
|
| Net
change |
|
|
|
|
|
| Class
A |
833,925
|
$19,891,083
|
|
188,121
|
$3,756,544
|
| Class
B |
(16,045)
|
(358,409)
|
|
(9,208)
|
(164,883)
|
| Class
C |
(16,963)
|
(394,533)
|
|
(16,445)
|
(256,147)
|
| Class
I |
1,333,975
|
32,330,841
|
|
111,135
|
2,492,647
|
| Class
R1 |
321
|
6,820
|
|
260
|
4,730
|
| Class
R2 |
415
|
6,472
|
|
(3,476)
|
(76,163)
|
| Class
R3 |
1,135
|
27,214
|
|
1,397
|
22,334
|
| Class
R4 |
154
|
3,603
|
|
113
|
2,255
|
| Class
R6 |
125,894
|
3,109,852
|
|
(93,115)
|
(1,728,031)
|
| |
2,262,811
|
$54,622,943
|
|
178,782
|
$4,053,286
|
Effective June 1, 2019, purchases of
the fund’s Class B shares are closed to new and existing investors subject to certain exceptions. Please see the fund’s prospectus for details.
(6) Line of Credit
The fund and certain other funds managed by MFS participate in
a $1.25 billion unsecured committed line of credit of which $1 billion is reserved for use by the fund and certain other MFS U.S. funds. The line of credit is provided by a syndicate of banks under a credit agreement. Borrowings may be made for
temporary financing needs. Interest is charged to each fund, based on its borrowings, generally at a rate equal to the highest of one month LIBOR, the Federal Funds Effective Rate and the Overnight Bank Funding Rate, plus an agreed upon spread. A
commitment fee, based on the average daily, unused portion of the committed line of credit, is allocated among the participating funds. In addition, the fund and other funds managed by MFS have established unsecured uncommitted borrowing
arrangements with certain banks for temporary financing needs. Interest is charged to each fund, based on its borrowings, at rates equal to customary reference rates plus an agreed upon spread. For the year ended August 31, 2021, the fund’s
commitment fee and interest expense were $310 and $0, respectively, and are included in “Miscellaneous” expense in the Statement of Operations.
(7) Investments in Affiliated Issuers
An affiliated issuer may be considered one in which the fund
owns 5% or more of the outstanding voting securities, or a company which is under common control. For the purposes of this report, the following were affiliated issuers:
| Affiliated
Issuers |
Beginning
Value |
Purchases
|
Sales
Proceeds |
Realized
Gain
(Loss) |
Change
in
Unrealized
Appreciation or
Depreciation |
Ending
Value |
| MFS
Institutional Money Market Portfolio |
$2,190,378
|
$58,330,518
|
$57,540,438
|
$(67)
|
$67
|
$2,980,458
|
Notes to Financial
Statements - continued
| Affiliated
Issuers |
Dividend
Income |
Capital
Gain
Distributions |
| MFS
Institutional Money Market Portfolio |
$2,138
|
$—
|
(8) Impacts of COVID-19
The pandemic related to the global spread of novel coronavirus
disease (COVID-19), which was first detected in December 2019, has resulted in significant disruptions to global business activity and the global economy, as well as the economies of individual countries, the financial performance of individual
companies and sectors, and the securities and commodities markets in general. Multiple surges in cases globally, the availability and widespread adoption of vaccines, and the emergence of variant strains of the virus continue to create uncertainty
as to the future and long-term impacts resulting from the pandemic including impacts to the prices and liquidity of the fund's investments and the fund's performance.
Report of Independent
Registered Public Accounting Firm
To the Shareholders of
MFS Global New Discovery Fund and the Board of Trustees of MFS Series Trust IV
Opinion on the Financial Statements
We have audited the accompanying statement of assets and
liabilities of MFS Global New Discovery Fund (the “Fund”) (one of the funds constituting MFS Series Trust IV (the “Trust”)), including the portfolio of investments, as of August 31, 2021, and the related statement of
operations for the year then ended, the statements of changes in net assets for each of the two years in the period then ended, the financial highlights for each of the five years in the period then ended and the related notes (collectively referred
to as the “financial statements”). In our opinion, the financial statements present fairly, in all material respects, the financial position of the Fund (one of the funds constituting MFS Series Trust IV) at August 31, 2021, the results
of its operations for the year then ended, the changes in its net assets for each of the two years in the period then ended and its financial highlights for each of the five years in the period then ended, in conformity with U.S. generally accepted
accounting principles.
Basis for Opinion
These financial statements are the responsibility of the
Trust’s management. Our responsibility is to express an opinion on the Fund’s financial statements based on our audits. We are a public accounting firm registered with the Public Company Accounting Oversight Board (United States)
(“PCAOB”) and are required to be independent with respect to the Trust in accordance with the U.S. federal securities laws and the applicable rules and regulations of the Securities and Exchange Commission and the PCAOB.
We conducted our audits in accordance with the standards of the
PCAOB. Those standards require that we plan and perform the audit to obtain reasonable assurance about whether the financial statements are free of material misstatement, whether due to error or fraud. The Trust is not required to have, nor were we
engaged to perform, an audit of the Trust’s internal control over financial reporting. As part of our audits we are required to obtain an understanding of internal control over financial reporting but not for the purpose of expressing an
opinion on the effectiveness of the Trust’s internal control over financial reporting. Accordingly, we express no such opinion.
Report of Independent
Registered Public Accounting Firm – continued
Our audits included performing procedures to assess the risks
of material misstatement of the financial statements, whether due to error or fraud, and performing procedures that respond to those risks. Such procedures included examining, on a test basis, evidence regarding the amounts and disclosures in the
financial statements. Our procedures included confirmation of securities owned as of August 31, 2021, by correspondence with the custodian and others or by other appropriate auditing procedures where replies from others were not received. Our audits
also included evaluating the accounting principles used and significant estimates made by management, as well as evaluating the overall presentation of the financial statements. We believe that our audits provide a reasonable basis for our
opinion.
We have served as
the auditor of one or more MFS investment companies since 1993.
Boston, Massachusetts
October 15, 2021
Trustees and
Officers — Identification and Background
The Trustees and Officers of the Trust, as of October 1, 2021,
are listed below, together with their principal occupations during the past five years. (Their titles may have varied during that period.) The address of each Trustee and Officer is 111 Huntington Avenue, Boston, Massachusetts 02199-7618.
| Name,
Age |
|
Position(s)
Held with Fund |
|
Trustee/Officer
Since(h) |
|
Number
of MFS Funds overseen by the Trustee |
|
Principal
Occupations During
the Past Five Years |
|
Other
Directorships During
the Past Five Years (j) |
| INTERESTED
TRUSTEES |
|
|
Robert
J. Manning (k)
(age 57) |
|
Trustee
|
|
February
2004 |
|
136
|
|
Massachusetts
Financial Services Company, Non-Executive Chairman (since January 2021); Director; Chairman of the Board; Executive Chairman (January 2017-2020); Co-Chief Executive Officer (2015-2016) |
|
N/A
|
Michael
W. Roberge (k)
(age 55) |
|
Trustee
|
|
January
2021 |
|
136
|
|
Massachusetts
Financial Services Company, Chairman (since January 2021); Chief Executive Officer (since January 2017); Director; President (until December 2018); Chief Investment Officer (until December 2018); Co-Chief Executive Officer (until December 2016)
|
|
N/A
|
| INDEPENDENT
TRUSTEES |
|
|
John
P. Kavanaugh
(age 66) |
|
Trustee
and Chair of Trustees |
|
January
2009 |
|
136
|
|
Private
investor |
|
N/A
|
Steven
E. Buller
(age 70) |
|
Trustee
|
|
February
2014 |
|
136
|
|
Private
investor |
|
N/A
|
John
A. Caroselli
(age 67) |
|
Trustee
|
|
March
2017 |
|
136
|
|
Private
investor; JC Global Advisors, LLC (management consulting), President (since 2015) |
|
N/A
|
Maureen
R. Goldfarb
(age 66) |
|
Trustee
|
|
January
2009 |
|
136
|
|
Private
investor |
|
N/A
|
Peter
D. Jones
(age 66) |
|
Trustee
|
|
January
2019 |
|
136
|
|
Private
investor |
|
N/A
|
Trustees and Officers -
continued
| Name,
Age |
|
Position(s)
Held with Fund |
|
Trustee/Officer
Since(h) |
|
Number
of MFS Funds overseen by the Trustee |
|
Principal
Occupations During
the Past Five Years |
|
Other
Directorships During
the Past Five Years (j) |
James
W. Kilman, Jr.
(age 60) |
|
Trustee
|
|
January
2019 |
|
136
|
|
Burford
Capital Limited (finance and investment management), Senior Advisor (since May 3, 2021), Chief Financial Officer (2019 - May 2, 2021); KielStrand Capital LLC (family office), Chief Executive Officer (since 2016); Morgan Stanley & Co. (financial
services), Vice Chairman of Investment Banking, Co-Head of Diversified Financials Coverage – Financial Institutions Investment Banking Group (until 2016) |
|
Alpha-En
Corporation, Director (2016-2019) |
Clarence
Otis, Jr.
(age 65) |
|
Trustee
|
|
March
2017 |
|
136
|
|
Private
investor |
|
VF
Corporation, Director; Verizon Communications, Inc., Director; The Travelers Companies, Director |
Maryanne
L. Roepke
(age 65) |
|
Trustee
|
|
May
2014 |
|
136
|
|
Private
investor |
|
N/A
|
Laurie
J. Thomsen
(age 64) |
|
Trustee
|
|
March
2005 |
|
136
|
|
Private
investor |
|
The
Travelers Companies, Director; Dycom Industries, Inc., Director |
| Name,
Age |
|
Position(s)
Held with
Fund |
|
Trustee/Officer
Since(h) |
|
Number
of MFS Funds for which the Person is an Officer |
|
Principal
Occupations During
the Past Five Years |
| OFFICERS
|
|
|
|
|
|
|
|
|
Christopher
R. Bohane (k)
(age 47) |
|
Assistant
Secretary and Assistant Clerk |
|
July
2005 |
|
136
|
|
Massachusetts
Financial Services Company, Senior Vice President and Associate General Counsel |
Kino
Clark (k)
(age 53) |
|
Assistant
Treasurer |
|
January
2012 |
|
136
|
|
Massachusetts
Financial Services Company, Vice President |
Trustees and Officers -
continued
| Name,
Age |
|
Position(s)
Held with
Fund |
|
Trustee/Officer
Since(h) |
|
Number
of MFS Funds for which the Person is an Officer |
|
Principal
Occupations During
the Past Five Years |
John
W. Clark, Jr. (k)
(age 54) |
|
Assistant
Treasurer |
|
April
2017 |
|
136
|
|
Massachusetts
Financial Services Company, Vice President (since March 2017); Deutsche Bank (financial services), Department Head - Treasurer's Office (until February 2017) |
Thomas
H. Connors (k)
(age 62) |
|
Assistant
Secretary and Assistant Clerk |
|
September
2012 |
|
136
|
|
Massachusetts
Financial Services Company, Vice President and Senior Counsel |
David
L. DiLorenzo (k)
(age 53) |
|
President
|
|
July
2005 |
|
136
|
|
Massachusetts
Financial Services Company, Senior Vice President |
Heidi
W. Hardin (k)
(age 54) |
|
Secretary
and Clerk |
|
April
2017 |
|
136
|
|
Massachusetts
Financial Services Company, Executive Vice President and General Counsel (since March 2017); Harris Associates (investment management), General Counsel (until January 2017) |
Brian
E. Langenfeld (k)
(age 48) |
|
Assistant
Secretary and Assistant Clerk |
|
June
2006 |
|
136
|
|
Massachusetts
Financial Services Company, Vice President and Senior Counsel |
Amanda
S. Mooradian (k)
(age 42) |
|
Assistant
Secretary and Assistant Clerk |
|
September
2018 |
|
136
|
|
Massachusetts
Financial Services Company, Assistant Vice President and Senior Counsel |
Susan
A. Pereira (k)
(age 50) |
|
Assistant
Secretary and Assistant Clerk |
|
July
2005 |
|
136
|
|
Massachusetts
Financial Services Company, Vice President and Assistant General Counsel |
Kasey
L. Phillips (k)
(age 50) |
|
Assistant
Treasurer |
|
September
2012 |
|
136
|
|
Massachusetts
Financial Services Company, Vice President |
Matthew
A. Stowe (k)
(age 46) |
|
Assistant
Secretary and Assistant Clerk |
|
October
2014 |
|
136
|
|
Massachusetts
Financial Services Company, Vice President and Assistant General Counsel |
Martin
J. Wolin (k)
(age 54) |
|
Chief
Compliance Officer |
|
July
2015 |
|
136
|
|
Massachusetts
Financial Services Company, Senior Vice President and Chief Compliance Officer |
Trustees and Officers -
continued
| Name,
Age |
|
Position(s)
Held with
Fund |
|
Trustee/Officer
Since(h) |
|
Number
of MFS Funds for which the Person is an Officer |
|
Principal
Occupations During
the Past Five Years |
James
O. Yost (k)
(age 61) |
|
Treasurer
|
|
September
1990 |
|
136
|
|
Massachusetts
Financial Services Company, Senior Vice President |
| (h)
|
Date
first appointed to serve as Trustee/Officer of an MFS Fund. Each Trustee has served continuously since appointment unless indicated otherwise. For the period from December 15, 2004 until February 22, 2005, Mr. Manning served as Advisory Trustee.
From January 2012 through December 2016, Messrs. DiLorenzo and Yost served as Treasurer and Deputy Treasurer of the Funds, respectively. |
| (j)
|
Directorships
or trusteeships of companies required to report to the Securities and Exchange Commission (i.e., “public companies”). |
| (k)
|
“Interested
person” of the Trust within the meaning of the Investment Company Act of 1940 (referred to as the 1940 Act), which is the principal federal law governing investment companies like the fund, as a result of a position with MFS. The address of
MFS is 111 Huntington Avenue, Boston, Massachusetts 02199-7618. |
Each Trustee (other than Messrs. Jones, Kilman and Roberge) has
been elected by shareholders and each Trustee and Officer holds office until his or her successor is chosen and qualified or until his or her earlier death, resignation, retirement or removal. Mr. Roberge became a Trustee of the Funds on January 1,
2021 and Messrs. Jones and Kilman became Trustees of the Funds on January 1, 2019. The Trust does not hold annual meetings for the purpose of electing Trustees, and Trustees are not elected for fixed terms. Under the terms of the Board's retirement
policy, an Independent Trustee shall retire at the end of the calendar year in which he or she reaches the earlier of 75 years of age or 15 years of service on the Board (or, in the case of any Independent Trustee who joined the Board prior to 2015,
20 years of service on the Board).
Messrs. Buller, Kilman
and Otis and Ms. Roepke are members of the Trust’s Audit Committee.
Each of the Interested Trustees and certain Officers hold
comparable officer positions with certain affiliates of MFS.
Trustees and Officers -
continued
The Statement of Additional Information for a Fund includes
further information about the Trustees and is available without charge upon request by calling 1-800-225-2606.
| Investment
Adviser |
Custodian
|
Massachusetts
Financial Services Company
111 Huntington Avenue
Boston, MA 02199-7618 |
State
Street Bank and Trust Company
1 Lincoln Street
Boston, MA 02111-2900 |
| Distributor
|
Independent
Registered Public Accounting Firm |
MFS Fund
Distributors, Inc.
111 Huntington Avenue
Boston, MA 02199-7618 |
Ernst &
Young LLP
200 Clarendon Street
Boston, MA 02116 |
| Portfolio
Manager(s) |
|
Eric
Braz
Peter Fruzzetti
Michael Grossman
Sandeep Mehta |
|
Board Review of Investment
Advisory Agreement
MFS Global New Discovery Fund
The Investment Company Act of 1940 requires that both the full
Board of Trustees and a majority of the non-interested (“independent”) Trustees, voting separately, annually approve the continuation of the Fund’s investment advisory agreement with MFS. The Trustees consider matters bearing on
the Fund and its advisory arrangements at their meetings throughout the year, including a review of performance data at each regular meeting. In addition, the independent Trustees met several times by videoconference (in accordance with Securities
and Exchange Commission relief) over the course of three months beginning in May and ending in July, 2021 (“contract review meetings”) for the specific purpose of considering whether to approve the continuation of the investment advisory
agreement for the Fund and the other investment companies that the Board oversees (the “MFS Funds”). The independent Trustees were assisted in their evaluation of the Fund’s investment advisory agreement by independent legal
counsel, from whom they received separate legal advice and with whom they met separately from MFS during various contract review meetings. The independent Trustees were also assisted in this process by an independent consultant who was retained by
and reported to the independent Trustees.
In connection
with their deliberations regarding the continuation of the investment advisory agreement, the Trustees, including the independent Trustees, considered such information and factors as they believed, in light of the legal advice furnished to them and
their own business judgment, to be relevant. The investment advisory agreement for the Fund was considered separately, although the Trustees also took into account the common interests of all MFS Funds in their review. As described below, the
Trustees considered the nature, quality, and extent of the various investment advisory, administrative, and shareholder services performed by MFS under the existing investment advisory agreement and other arrangements with the Fund.
In connection with their contract review meetings, the Trustees
received and relied upon materials that included, among other items: (i) information provided by Broadridge Financial Solutions, Inc. (“Broadridge”), an independent third party, on the investment performance of the Fund for various time
periods ended December 31, 2020 and the investment performance of a group of funds with substantially similar investment classifications/objectives (the “Broadridge performance universe”), (ii) information provided by Broadridge on the
Fund’s advisory fees and other expenses and the advisory fees and other expenses of comparable funds identified by Broadridge as well as all other funds in the same investment classification/category (the “Broadridge expense group and
universe”), (iii) information provided by MFS on the advisory fees of portfolios of other clients of MFS, including institutional separate accounts and other clients, (iv) information as to whether and to what extent applicable expense
waivers, reimbursements or fee “breakpoints” are observed for the Fund, (v) information regarding MFS’ financial results and financial condition, including MFS’ and certain of its affiliates’ estimated profitability
from services performed for the Fund and the MFS Funds as a whole, and compared to MFS’ institutional business, (vi) MFS’ views regarding the outlook for the mutual fund industry and the strategic business plans of MFS, (vii)
descriptions of various functions performed by MFS for the Funds, such as compliance monitoring and portfolio trading practices, and (viii)
Board Review of Investment
Advisory Agreement - continued
information regarding the overall organization of MFS, including information
about MFS’ senior management and other personnel providing investment advisory, administrative and other services to the Fund and the other MFS Funds. The comparative performance, fee and expense information prepared and provided by Broadridge
was not independently verified and the independent Trustees did not independently verify any information provided to them by MFS.
The Trustees’ conclusion as to the continuation of the
investment advisory agreement was based on a comprehensive consideration of all information provided to the Trustees and not the result of any single factor. Some of the factors that figured particularly in the Trustees’ deliberations are
described below, although individual Trustees may have evaluated the information presented differently from one another, giving different weights to various factors. It is also important to recognize that the fee arrangements for the Fund and other
MFS Funds are the result of years of review and discussion between the independent Trustees and MFS, that certain aspects of such arrangements may receive greater scrutiny in some years than in others, and that the Trustees’ conclusions may be
based, in part, on their consideration of these same arrangements during the course of the year and in prior years.
Based on information provided by Broadridge and MFS, the
Trustees reviewed the Fund’s total return investment performance as well as the Broadridge performance universe over various time periods. The Trustees placed particular emphasis on the total return performance of the Fund’s Class I
shares in comparison to the performance of funds in its Broadridge performance universe over the five-year period ended December 31, 2020, which the Trustees believed was a long enough period to reflect differing market conditions. The total return
performance of the Fund’s Class I shares was in the 3rd quintile relative to the other funds in the universe for this five-year period (the 1st quintile being the best performers and the 5th quintile being the worst performers). The total
return performance of the Fund’s Class I shares was in the 3rd quintile for each of the one- and three-year periods ended December 31, 2020 relative to the Broadridge performance universe. Because of the passage of time, these performance
results may differ from the performance results for more recent periods, including those shown elsewhere in this report.
In the course of their deliberations, the Trustees took into
account information provided by MFS in connection with the contract review meetings, as well as during investment review meetings conducted with portfolio management personnel during the course of the year regarding the Fund’s performance.
After reviewing these and related factors, the Trustees concluded, within the context of their overall conclusions regarding the investment advisory agreement, that they were satisfied with MFS’ responses and efforts relating to investment
performance.
In assessing the reasonableness of the
Fund’s advisory fee, the Trustees considered, among other information, the Fund’s advisory fee and the total expense ratio of the Fund’s Class I shares as a percentage of average daily net assets and the advisory fee and total
expense ratios of the Broadridge expense group based on information provided by Broadridge. The Trustees considered that MFS currently observes an expense limitation for the Fund, which may not be changed without the Trustees’ approval. The
Trustees also considered that, according to the data provided by Broadridge (which takes into account any fee reductions or expense limitations that
Board Review of Investment
Advisory Agreement - continued
were in effect during the Fund’s last fiscal year), the Fund’s
effective advisory fee rate was lower than the Broadridge expense group median and the Fund’s total expense ratio was approximately at the Broadridge expense group median.
The Trustees also considered the advisory fees charged by MFS
to any institutional separate accounts advised by MFS (“separate accounts”) and unaffiliated investment companies for which MFS serves as subadviser (“subadvised funds”) that have comparable investment strategies to the Fund,
if any. In comparing these fees, the Trustees considered information provided by MFS as to the generally broader scope of services provided by MFS to the Fund, as well as the more extensive regulatory burdens imposed on MFS in managing the Fund, in
comparison to separate accounts and subadvised funds. The Trustees also considered the higher demands placed on MFS’ investment personnel and trading infrastructure as a result of the daily cash in-flows and out-flows of the Fund in comparison
to separate accounts.
The Trustees also considered
whether the Fund may benefit from any economies of scale in the management of the Fund in the event of growth in assets of the Fund and/or growth in assets of the MFS Funds as a whole. They noted that the Fund’s advisory fee rate schedule is
subject to contractual breakpoints that reduce the Fund’s advisory fee rate on average daily net assets over $1 billion and $2.5 billion. The Trustees also noted that MFS has agreed in writing to waive a portion of the management fees of
certain MFS Funds, including the Fund, if the total combined assets of certain funds within the MFS Funds’ complex increase above agreed upon thresholds (the “group fee waiver”), enabling the Fund’s shareholders to share in
the benefits from any economies of scale at the complex level. The group fee waiver is reviewed and renewed annually between the Board and MFS. The Trustees concluded that the breakpoints and the group fee waiver were sufficient to allow the Fund to
benefit from economies of scale as its assets and overall complex assets grow.
The Trustees also considered information prepared by MFS
relating to MFS’ costs and profits with respect to the Fund, the MFS Funds considered as a group, and other investment companies and accounts advised by MFS, as well as MFS’ methodologies used to determine and allocate its costs to the
MFS Funds, the Fund and other accounts and products for purposes of estimating profitability.
After reviewing these and other factors described herein, the
Trustees concluded, within the context of their overall conclusions regarding the investment advisory agreement, that the advisory fees charged to the Fund represent reasonable compensation in light of the services being provided by MFS to the
Fund.
In addition, the Trustees considered MFS’
resources and related efforts to continue to retain, attract and motivate capable personnel to serve the Fund. The Trustees also considered current and developing conditions in the financial services industry, including the presence of large and
well-capitalized companies which are spending, and appear to be prepared to continue to spend, substantial sums to engage personnel and to provide services to competing investment companies. In this regard, the Trustees also considered the financial
resources of MFS and its ultimate parent, Sun Life Financial Inc. The Trustees also considered the advantages and possible disadvantages to the Fund of having an adviser that also serves other investment companies as well as other accounts.
Board Review of Investment
Advisory Agreement - continued
The Trustees also considered the nature, quality, cost, and
extent of administrative, transfer agency, and distribution services provided to the Fund by MFS and its affiliates under agreements and plans other than the investment advisory agreement, including any 12b-1 fees the Fund pays to MFS Fund
Distributors, Inc., an affiliate of MFS. The Trustees also considered the nature, extent and quality of certain other services MFS performs or arranges for on the Fund’s behalf, which may include securities lending programs, directed expense
payment programs, class action recovery programs, and MFS’ interaction with third-party service providers, principally custodians and sub-custodians. The Trustees concluded that the various non-advisory services provided by MFS and its
affiliates on behalf of the Fund were satisfactory.
The
Trustees considered so-called “fall-out benefits” to MFS such as reputational value derived from serving as investment manager to the MFS Funds. The Trustees also considered that MFS discontinued its historic practice of obtaining
investment research from portfolio brokerage commissions paid by certain MFS Funds effective January 2018, and directly pays or voluntarily reimburses a Fund, if applicable, for the costs of external research acquired through the use of the
Fund’s portfolio brokerage commissions.
Based on
their evaluation of factors that they deemed to be material, including those factors described above, the Board of Trustees, including the independent Trustees, concluded that the Fund’s investment advisory agreement with MFS should be
continued for an additional one-year period, commencing August 1, 2021.
Statement Regarding
Liquidity Risk Management Program
The fund has adopted
and implemented a liquidity risk management program (the “Program”) as required by Rule 22e-4 under the Investment Company Act of 1940, as amended. The fund’s Board of Trustees (the “Board”) has designated MFS as the
administrator of the Program. The Program is reasonably designed to assess and manage the liquidity risk of the fund. Liquidity risk is the risk that the fund could not meet requests to redeem shares issued by the fund without significant dilution
of remaining investors' interests.
MFS provided a written
report to the Board for consideration at its April 2021 meeting that addressed the operation of the Program and provided an assessment of the adequacy and effectiveness of the Program during the period from January 1, 2020 to December 31, 2020 (the
“Covered Period”). The report concluded that during the Covered Period the Program had operated effectively and had adequately and effectively been implemented to assess and manage the fund’s liquidity risk. MFS also reported that
there were no liquidity events that impacted the fund or its ability to timely meet redemptions without dilution to existing shareholders during the Covered Period.
There can be no assurance that the Program will achieve its
objectives in the future. Further information on liquidity risk, and other principal risks to which an investment in the fund may be subject, can be found in the prospectus.
Proxy
Voting Policies and Information
MFS votes proxies on
behalf of the fund pursuant to proxy voting policies and procedures that are available without charge, upon request, by calling 1-800-225-2606, by visiting mfs.com/proxyvoting, or by visiting the SEC’s
Web site at http://www.sec.gov.
Information regarding how the fund voted proxies relating to
portfolio securities during the most recent twelve-month period ended June 30 is available by August 31 of each year without charge by visiting mfs.com/proxyvoting, or by visiting the SEC’s Web site at http://www.sec.gov.
Quarterly Portfolio Disclosure
The fund files a complete schedule of portfolio holdings with
the SEC for the first and third quarters of each fiscal year as an exhibit to its reports on Form N-PORT. The fund's Form N-PORT reports are available on the SEC's Web site at http://www.sec.gov. A
shareholder can obtain the portfolio holdings report for the first and third quarters of the fund's fiscal year at mfs.com/openendfunds by choosing the fund's name and then scrolling to the
“Resources” section and clicking on the “Prospectus and Reports” tab.
Further Information
From time to time, MFS may post important information about the
fund or the MFS Funds on the MFS Web site (mfs.com). This information is available at https://www.mfs.com/announcements or at
mfs.com/openendfunds by choosing the fund’s name and then scrolling to the “Resources” section and clicking on the “Announcements” tab, if any.
Information About Fund Contracts and Legal Claims
The fund has entered into contractual arrangements with an
investment adviser, administrator, distributor, shareholder servicing agent, 529 program manager (if applicable), and custodian who each provide services to the fund. Unless expressly stated otherwise, shareholders are not parties to, or intended
beneficiaries of these contractual arrangements, and these contractual arrangements are not intended to create any shareholder right to enforce them against the service providers or to seek any remedy under them against the service providers, either
directly or on behalf of the fund.
Under the
Trust’s By-Laws and Declaration of Trust, any claims asserted against or on behalf of the MFS Funds, including claims against Trustees and Officers, must be brought in state and federal courts located within the Commonwealth of
Massachusetts.
Federal Tax Information (unaudited)
The
fund will notify shareholders of amounts for use in preparing 2021 income tax forms in January 2022. The following information is provided pursuant to provisions of the Internal Revenue Code.
The fund designates the maximum amount allowable as qualified
dividend income eligible to be taxed at the same rate as long-term capital gain.
The fund designates $2,940,000 as capital gain dividends paid
during the fiscal year.
For corporate shareholders, 4.40%
of the ordinary income dividends paid during the fiscal year qualify for the corporate dividends received deduction.
Federal Tax Information (unaudited) - continued
Income derived from foreign sources was $877,324. The fund
intends to pass through foreign tax credits of $83,220 for the fiscal year.
The fund designates the maximum amount allowable as Section
199A dividends as defined in Proposed Treasury Regulation §1.199A-3(d).
| FACTS
|
WHAT
DOES MFS DO WITH YOUR PERSONAL INFORMATION? |
| Why?
|
Financial
companies choose how they share your personal information. Federal law gives consumers the right to limit some but not all sharing. Federal law also requires us to tell you how we collect, share, and protect your personal information. Please read
this notice carefully to understand what we do. |
| What?
|
The types of
personal information we collect and share depend on the product or service you have with us. This information can include: |
| • Social
Security number and account balances |
| • Account
transactions and transaction history |
| • Checking
account information and wire transfer instructions |
| When
you are no longer our customer, we continue to share your information as described in this notice. |
| How?
|
All
financial companies need to share customers' personal information to run their everyday business. In the section below, we list the reasons financial companies can share their customers' personal information; the reasons MFS chooses to share; and
whether you can limit this sharing. |
Reasons
we can share your
personal information |
Does
MFS share? |
Can
you limit
this sharing? |
For
our everyday business purposes –
such as to process your transactions, maintain your
account(s), respond to court orders and legal
investigations, or report to credit bureaus |
Yes
|
No
|
For
our marketing purposes –
to offer our products and services to you |
No
|
We
don't share |
For
joint marketing with other
financial companies |
No
|
We
don't share |
For
our affiliates' everyday business purposes –
information about your transactions and experiences |
No
|
We
don't share |
For
our affiliates' everyday business purposes –
information about your creditworthiness |
No
|
We
don't share |
| For
nonaffiliates to market to you |
No
|
We
don't share |
| Questions?
|
Call
800-225-2606 or go to mfs.com. |
| Who
we are |
| Who
is providing this notice? |
MFS
Funds, MFS Investment Management, MFS Institutional Advisors, Inc., and MFS Heritage Trust Company. |
| What
we do |
How
does MFS
protect my personal
information? |
To
protect your personal information from unauthorized access and use, we use security measures that comply with federal law. These measures include procedural, electronic, and physical safeguards for the protection of the personal information we
collect about you. |
How
does MFS
collect my personal
information? |
We
collect your personal information, for example, when you |
| • open
an account or provide account information |
| • direct
us to buy securities or direct us to sell your securities |
| • make
a wire transfer |
| We
also collect your personal information from others, such as credit bureaus, affiliates, or other companies. |
| Why
can't I limit all sharing? |
Federal
law gives you the right to limit only |
| • sharing
for affiliates' everyday business purposes – information about your creditworthiness |
| • affiliates
from using your information to market to you |
| • sharing
for nonaffiliates to market to you |
| State
laws and individual companies may give you additional rights to limit sharing. |
| Definitions
|
| Affiliates
|
Companies
related by common ownership or control. They can be financial and nonfinancial companies. |
| •
MFS does not share personal information with affiliates, except for everyday business purposes as described on page one of this notice. |
| Nonaffiliates
|
Companies
not related by common ownership or control. They can be financial and nonfinancial companies. |
| •
MFS does not share with nonaffiliates so they can market to you. |
| Joint
marketing |
A
formal agreement between nonaffiliated financial companies that together market financial products or services to you. |
| •
MFS doesn't jointly market. |
| Other
important information |
| If
you own an MFS product or receive an MFS service in the name of a third party such as a bank or broker-dealer, their privacy policy may apply to you instead of ours. |
Save paper with eDelivery.
MFS® will send you prospectuses, reports, and proxies directly via e-mail so you will get information faster with less mailbox clutter.
To sign up:
1. Go to mfs.com.
2. Log in via MFS® Access.
3. Select eDelivery.
If you own your MFS fund shares through a financial institution
or a retirement plan, MFS® TALK, MFS® Access,
or eDelivery may not be available to you.
CONTACT
WEB SITE
mfs.com
MFS TALK
1-800-637-8255
24 hours a day
ACCOUNT SERVICE AND LITERATURE
Shareholders
1-800-225-2606
Financial advisors
1-800-343-2829
Retirement plan services
1-800-637-1255
MAILING ADDRESS
MFS Service Center, Inc.
P.O. Box 219341
Kansas City, MO 64121-9341
OVERNIGHT MAIL
MFS Service Center, Inc.
Suite 219341
430 W 7th Street
Kansas City, MO 64105-1407
Annual Report
August 31, 2021
|
1
|
|
2
|
|
3
|
|
6
|
|
9
|
|
12
|
|
18
|
|
20
|
|
21
|
|
22
|
|
29
|
|
43
|
|
45
|
|
50
|
|
54
|
|
55
|
|
55
|
|
55
|
|
55
|
|
55
|
|
56
|
The
report is prepared for the general information of shareholders. It is authorized for distribution to prospective investors only when preceded or accompanied by a current prospectus.
NOT FDIC INSURED • MAY LOSE VALUE
• NO BANK GUARANTEE
LETTER FROM THE CEO
Dear Shareholders:
After experiencing dramatic swings in the early days of the
coronavirus pandemic, global equity markets have performed strongly over the past year. Though the speedy development of vaccines brightened the economic and market outlook, uncertainty remains as new variants of the virus appear, and questions
persist over how fast vaccines can be made widely available in the developing world.
After having taken aggressive steps to
cushion the economic and market fallout related to the virus, some global central banks have begun to recalibrate monetary policy. For example, the U.S. Federal Reserve has signaled it will likely taper its bond buying program before the end of
2021, which has helped push up Treasury yields, and steepened the yield curve. Having passed a $1.9 trillion stimulus package in March, the U.S. Congress could approve additional stimulus later this year, some of it focused on infrastructure.
Production and transportation bottlenecks and labor shortages stemming from the pandemic have fueled a rise in inflation, though policymakers and investors think most of the price hikes will prove transitory.
Since midyear, the spread of the Delta variant of the
coronavirus has slowed economic growth while markets have focused on a regulatory crackdown in China, which, when coupled with stress in that country's property development sector, has contributed to a slowdown there. Tightening global energy and
raw materials supplies are a further concern for investors.
The policy measures put in place to counteract the pandemic's
effects have helped build a supportive environment and are encouraging economic recovery; however, if markets disconnect from fundamentals, they can sow the seeds of instability. As such, recent dramatic increases in speculative trading in
cryptocurrencies, special purpose acquisition companies (SPACs), and the like bear watching.
In the aftermath of the crisis, we could see societal changes
as households, businesses, and governments adjust to a new reality, and any such alterations could affect the investment landscape. For investors, events such as the COVID-19 outbreak demonstrate the importance of having a deep understanding of
company fundamentals, and we have built our global research platform to do just that.
At MFS®, we put our clients’ assets to work responsibly by carefully navigating the increasing complexity of global markets and economies. Guided by our
long-term philosophy and adhering to our commitment to sustainable investing, we tune out the noise and aim to uncover what we believe are the best, most durable investment opportunities in the market. Our unique global investment platform combines
collective expertise, long-term discipline, and thoughtful risk management to create sustainable value for investors.
Respectfully,
Michael W.
Roberge
Chief Executive Officer
MFS Investment Management
October 15, 2021
The opinions expressed in this letter are subject to change and
may not be relied upon for investment advice. No forecasts can be guaranteed.
Portfolio structure
Top ten
holdings
| Monolithic
Power Systems, Inc. |
2.9%
|
| PerkinElmer,
Inc. |
2.8%
|
| MSCI,
Inc. |
2.7%
|
| Charles
River Laboratories International, Inc. |
2.7%
|
| Cadence
Design Systems, Inc. |
2.4%
|
| AMETEK,
Inc. |
1.9%
|
| Bio-Techne
Corp. |
1.8%
|
| STERIS
PLC |
1.8%
|
| TransUnion
|
1.8%
|
| Verisk
Analytics, Inc., “A” |
1.7%
|
GICS equity sectors (g)
| Information
Technology |
25.9%
|
| Health
Care |
20.3%
|
| Industrials
|
18.2%
|
| Consumer
Discretionary |
15.6%
|
| Financials
|
6.9%
|
| Communication
Services |
6.1%
|
| Materials
|
2.9%
|
| Real
Estate |
2.6%
|
| Consumer
Staples |
0.3%
|
| Equity
Warrants (o) |
0.0%
|
| (g)
|
The
Global Industry Classification Standard (GICS®) was developed by and/or is the exclusive property of MSCI, Inc. and S&P Global Market
Intelligence Inc. (“S&P Global Market Intelligence”). GICS is a service mark of MSCI and S&P Global Market Intelligence and has been licensed for use by MFS. MFS has applied its own internal sector/industry classification
methodology for equity securities and non-equity securities that are unclassified by GICS. |
Cash & Cash
Equivalents includes any cash, investments in money market funds, short-term securities, and other assets less liabilities. Please see the Statement of Assets and Liabilities for additional information related to the fund’s cash position and
other assets and liabilities.
Other includes
equivalent exposure from currency derivatives and/or any offsets to derivative positions and may be negative.
Percentages are based on net assets as of August 31,
2021.
The portfolio is actively managed and
current holdings may be different.
Management Review
Summary of Results
For the twelve months ended August 31, 2021, Class A shares of
the MFS Mid Cap Growth Fund (fund) provided a total return of 30.30%, at net asset value. This compares with a return of 35.17% for the fund’s benchmark, the Russell Midcap® Growth Index.
Market Environment
The global economy continued to recover from the most unusual
recession in memory as financial markets benefited from massive fiscal and monetary intervention aimed at offsetting the economic effects of the coronavirus pandemic. In developed markets, COVID-19 vaccine distribution broadened after getting off to
a slower-than-hoped-for start in some locales, although concerns remained that too few people will be inoculated for herd immunity to be achieved, which could result in the emergence of additional variants. On balance, emerging markets experienced
slower rollouts than developed markets amid ongoing vaccine supply constraints.
Around the world, central banks responded quickly and massively
to the crisis with programs to improve liquidity and support markets. These undertakings proved largely successful in helping to restore market function, ease volatility and stimulate a prolonged rebound. In the first half of the period, the US
Federal Reserve adopted a new, flexible average-inflation-targeting framework, which is expected to result in the federal funds rate remaining at low levels longer than under its previous model, although the Fed has indicated it may scale back the
pace of asset purchases before the end of this year. Due to relatively manageable external liabilities and balances of payments in many countries and persistently low inflation, even emerging market countries were able to implement countercyclical
policies — a departure from the usual market-dictated response to risk-off crises.
Late in the period, markets grappled with the threat of
resurgent inflation resulting from pandemic-induced production bottlenecks, monumental levels of economic stimulus and the unleashing of post-lockdown pent-up demand. Meanwhile, raw materials prices rebounded strongly on account of the surprising
resilience of the global manufacturing sector during the pandemic. Global sovereign bond yields initially rose in response to these factors before yields moderated in the second half of the period as the spread of the Delta variant of the
coronavirus dented economic activity. The vaccine breakthroughs announced in November 2020 saw market leadership shift from a handful of mega-cap technology companies to a broader array of small-cap and value stocks, although growth stocks have
performed strongly in recent months. Signs of excess investor enthusiasm were seen in pockets of the market, such as the “meme stocks” popular with users of online message boards and heavy retail participation in the market for
short-dated equity options.
Detractors from
Performance
Security selection within the information
technology sector detracted from the fund's performance relative to the Russell Midcap® Growth Index. Within this sector, not owning shares of
network security solutions company Fortinet, and an overweight position in integrated software, data and analytics provider Black Knight, held back
Management Review -
continued
relative returns. The share price of Fortinet appreciated steadily over the
period, led by increased awareness around security, accelerated new customer adds, a strong new deal pipeline, increased sales capacity and product development efforts.
Stock selection in both the industrials and real estate sectors
also weighted on relative results. Within the industrials sector, the fund's position in analytics services provider Clarivate(b), and its overweight position in business information provider Dun & Bradstreet, hindered relative performance. The
share price of Clarivate suffered from softer-than-expected growth amid the challenging macroeconomic environment. Within the real estate sector, there were no individual stocks, either in the fund or in the benchmark, that were among the fund's
largest relative detractors during the period.
Elsewhere,
not owning shares of biotechnology company Moderna and streaming platform services provider Roku detracted from relative returns. The share price of Moderna advanced due to higher-than-anticipated revenue growth from the company's COVID-19 vaccine
sales. Furthermore, investor optimism that the firm's mRNA technology will significantly advance the company's pipeline, with its flu, Zika and CMV vaccines, further supported its share price performance. The fund's overweight positions in game
software developer Take-Two Interactive Software and childcare and early education provider Bright Horizons Family Solutions, and the timing of its ownership in shares of medical device manufacturing company Dexcom(h), further dampened relative
results.
The fund’s cash and/or cash equivalents
position during the period was also a detractor from relative performance. Under normal market conditions, the fund strives to be fully invested and generally holds cash to buy new holdings and to provide liquidity. In a period when equity markets
rose, as measured by the fund’s benchmark, holding cash hurt performance versus the benchmark, which has no cash position.
Contributors to Performance
An underweight position in the consumer staples sector was a
key contributor to the fund's relative performance. Within this sector, not owning shares of consumer and professional products manufacturer Clorox boosted relative results. The share price of Clorox fell following the company's softer-than-expected
financial results that were driven by significantly weaker organic sales performance, a steep decline in gross margin and higher operating costs.
Stock selection in the health care sector also supported
relative performance, led by the fund's overweight positions in contract research company Charles River Laboratories International, biotechnology instrument manufacturer Bio-Techne, diagnostics and life science research services provider PerkinElmer
and life science company Maravai Lifesciences. The share price of Charles River Laboratories International climbed over the reporting period following higher-than-expected organic revenue growth, better margins and a lower tax rate. Additionally, a
combination of solid asset growth, higher net interest income and lower expenses further supported its share price growth.
Stocks in other sectors that contributed to relative
performance included the fund's overweight positions in semiconductor company Monolithic Power Systems and index data provider MSCI. The share price of Monolithic Power Systems appreciated after the company reported strong financial results and
raised its outlook on the back of robust
Management Review -
continued
product demand. Additionally, not owning shares of software company Splunk and
digital music services provider Spotify Technology, and the fund's holdings of semiconductor equipment manufacturer ASM International(b) (Netherlands), further boosted relative results.
Respectfully,
Portfolio Manager(s)
Eric Braz, Eric Fischman, and Paul
Gordon
Note to Shareholders: Effective June 30, 2021,
Eric Braz was added as a Portfolio Manager of the fund.
| (b)
|
Security is not a
benchmark constituent. |
| (h)
|
Security was not held in
the portfolio at period end. |
The
views expressed in this report are those of the portfolio manager(s) only through the end of the period of the report as stated on the cover and do not necessarily reflect the views of MFS or any other person in the MFS organization. These views are
subject to change at any time based on market or other conditions, and MFS disclaims any responsibility to update such views. These views may not be relied upon as investment advice or an indication of trading intent on behalf of any MFS portfolio.
References to specific securities are not recommendations of such securities, and may not be representative of any MFS portfolio’s current or future investments.
Performance Summary THROUGH
8/31/21
The following chart illustrates a representative
class of the fund’s historical performance in comparison to its benchmark(s). Performance results include the deduction of the maximum applicable sales charge and reflect the percentage change in net asset value, including reinvestment of
dividends and capital gains distributions. The performance of other share classes will be greater than or less than that of the class depicted below. Benchmarks are unmanaged and may not be invested in directly. Benchmark returns do not reflect
sales charges, commissions or expenses. (See Notes to Performance Summary.)
Performance data shown represents past performance and is no
guarantee of future results. Investment return and principal value fluctuate so your shares, when sold, may be worth more or less than the original cost; current performance may be lower or higher than quoted. The performance shown does not reflect
the deduction of taxes, if any, that a shareholder would pay on fund distributions or the redemption of fund shares.
Growth of a Hypothetical $10,000 Investment
Performance Summary -
continued
Total Returns through 8/31/21
Average annual without sales charge
| Share
Class |
Class
Inception Date |
1-yr
|
5-yr
|
10-yr
|
Life
(t) |
| A
|
12/01/93
|
30.30%
|
21.32%
|
17.30%
|
N/A
|
| B
|
12/01/93
|
29.36%
|
20.41%
|
16.41%
|
N/A
|
| C
|
8/01/94
|
29.34%
|
20.40%
|
16.41%
|
N/A
|
| I
|
1/02/97
|
30.60%
|
21.61%
|
17.58%
|
N/A
|
| R1
|
4/01/05
|
29.36%
|
20.40%
|
16.41%
|
N/A
|
| R2
|
10/31/03
|
30.00%
|
21.01%
|
17.00%
|
N/A
|
| R3
|
4/01/05
|
30.29%
|
21.31%
|
17.29%
|
N/A
|
| R4
|
4/01/05
|
30.61%
|
21.60%
|
17.59%
|
N/A
|
| R6
|
1/02/13
|
30.78%
|
21.74%
|
N/A
|
18.78%
|
| 529A
|
7/31/02
|
30.27%
|
21.29%
|
17.27%
|
N/A
|
| 529B
|
7/31/02
|
30.07%
|
20.49%
|
16.44%
|
N/A
|
| 529C
|
7/31/02
|
29.31%
|
20.37%
|
16.38%
|
N/A
|
Comparative benchmark(s)
| |
|
|
|
|
| Russell
Midcap® Growth Index (f) |
35.17%
|
20.44%
|
16.88%
|
N/A
|
Average annual with sales
charge
| |
|
|
|
|
A
With Initial Sales Charge (5.75%) |
22.80%
|
19.89%
|
16.60%
|
N/A
|
B
With CDSC (Declining over six years from 4% to 0%) (v) |
25.36%
|
20.22%
|
16.41%
|
N/A
|
C
With CDSC (1% for 12 months) (v) |
28.34%
|
20.40%
|
16.41%
|
N/A
|
529A
With Initial Sales Charge (5.75%) |
22.78%
|
19.86%
|
16.58%
|
N/A
|
529B
With CDSC (Declining over six years from 4% to 0%) (v) |
26.07%
|
20.30%
|
16.44%
|
N/A
|
529C
With CDSC (1% for 12 months) (v) |
28.31%
|
20.37%
|
16.38%
|
N/A
|
CDSC – Contingent Deferred
Sales Charge.
Class I, R1, R2, R3, R4, and R6 shares do
not have a sales charge.
| (f)
|
Source:
FactSet Research Systems Inc. |
| (t)
|
For the
period from the class inception date through the stated period end (for those share classes with less than 10 years of performance history). No comparative benchmark performance information is provided for “life” periods. (See Notes to
Performance Summary.) |
| (v)
|
Assuming
redemption at the end of the applicable period. |
Performance Summary -
continued
Benchmark Definition(s)
Russell Midcap® Growth Index(h) - constructed to provide a
comprehensive barometer for growth securities in the mid-cap segment of the U.S. equity universe. Companies in this index generally have higher price-to-book ratios and higher forecasted growth values.
It is not possible to invest directly in an index.
| (h)
|
Frank
Russell Company (“Russell”) is the source and owner of the trademarks, service marks, and copyrights related to the Russell Indexes.
Russell® is a trademark of Frank Russell Company. Neither Russell nor its licensors accept any liability for any errors or omissions in the Russell
Indexes and/or Russell ratings or underlying data and no party may rely on any Russell Indexes and/or Russell ratings and/or underlying data contained in this document. No further distribution of Russell Data is permitted without Russell's express
written consent. Russell does not promote, sponsor, or endorse the content of this document. |
Notes to Performance Summary
Class 529 shares are only available in conjunction with
qualified tuition programs, such as the MFS 529 Savings Plan. There also is an additional fee, which is detailed in the program description, on qualified tuition programs. If this fee was reflected, the performance for Class 529 shares would have
been lower. This annual fee is waived for Oregon residents and for those accounts with assets of $25,000 or more.
Average annual total return represents the average annual
change in value for each share class for the periods presented. Life returns are presented where the share class has less than 10 years of performance history and represent the average annual total return from the class inception date to the stated
period end date. As the fund's share classes may have different inception dates, the life returns may represent different time periods and may not be comparable. As a result, no comparative benchmark performance information is provided for life
periods.
Performance results reflect any applicable
expense subsidies and waivers in effect during the periods shown. Without such subsidies and waivers the fund's performance results would be less favorable. Please see the prospectus and financial statements for complete details.
Performance results do not include adjustments made for
financial reporting purposes in accordance with U.S. generally accepted accounting principles and may differ from amounts reported in the financial highlights.
From time to time the fund may receive proceeds from litigation
settlements, without which performance would be lower.
Expense Table
Fund expenses borne by the shareholders during the period,
March 1, 2021 through August 31, 2021
As a shareholder
of the fund, you incur two types of costs: (1) transaction costs, including sales charges (loads) on certain purchase or redemption payments, and (2) ongoing costs, including management fees; distribution and service (12b-1) fees; and other fund
expenses. This example is intended to help you understand your ongoing costs (in dollars) of investing in the fund and to compare these costs with the ongoing costs of investing in other mutual funds.
The example is based on an investment of $1,000 invested at the
beginning of the period and held for the entire period March 1, 2021 through August 31, 2021.
Actual Expenses
The first line for each share class in the following table
provides information about actual account values and actual expenses. You may use the information in this line, together with the amount you invested, to estimate the expenses that you paid over the period. Simply divide your account value by $1,000
(for example, an $8,600 account value divided by $1,000 = 8.6), then multiply the result by the number in the first line under the heading entitled “Expenses Paid During Period” to estimate the expenses you paid on your account during
this period.
Hypothetical Example for Comparison
Purposes
The second line for each share class in the
following table provides information about hypothetical account values and hypothetical expenses based on the fund’s actual expense ratio and an assumed rate of return of 5% per year before expenses, which is not the fund’s actual
return. The hypothetical account values and expenses may not be used to estimate the actual ending account balance or expenses you paid for the period. You may use this information to compare the ongoing costs of investing in the fund and other
funds. To do so, compare this 5% hypothetical example with the 5% hypothetical examples that appear in the shareholder reports of the other funds.
Please note that the expenses shown in the table are meant to
highlight your ongoing costs only and do not reflect any transactional costs, such as sales charges (loads). Therefore, the second line for each share class in the table is useful in comparing ongoing costs only, and will not help you determine the
relative total costs of owning different funds. In addition, if these transactional costs were included, your costs would have been higher.
Expense Table -
continued
Share
Class |
|
Annualized
Expense
Ratio |
Beginning
Account Value
3/01/21 |
Ending
Account Value
8/31/21 |
Expenses
Paid During
Period (p)
3/01/21-8/31/21 |
| A
|
Actual
|
1.00%
|
$1,000.00
|
$1,151.54
|
$5.42
|
| Hypothetical
(h) |
1.00%
|
$1,000.00
|
$1,020.16
|
$5.09
|
| B
|
Actual
|
1.74%
|
$1,000.00
|
$1,147.23
|
$9.42
|
| Hypothetical
(h) |
1.74%
|
$1,000.00
|
$1,016.43
|
$8.84
|
| C
|
Actual
|
1.75%
|
$1,000.00
|
$1,146.98
|
$9.47
|
| Hypothetical
(h) |
1.75%
|
$1,000.00
|
$1,016.38
|
$8.89
|
| I
|
Actual
|
0.75%
|
$1,000.00
|
$1,152.96
|
$4.07
|
| Hypothetical
(h) |
0.75%
|
$1,000.00
|
$1,021.42
|
$3.82
|
| R1
|
Actual
|
1.74%
|
$1,000.00
|
$1,147.58
|
$9.42
|
| Hypothetical
(h) |
1.74%
|
$1,000.00
|
$1,016.43
|
$8.84
|
| R2
|
Actual
|
1.25%
|
$1,000.00
|
$1,150.27
|
$6.77
|
| Hypothetical
(h) |
1.25%
|
$1,000.00
|
$1,018.90
|
$6.36
|
| R3
|
Actual
|
1.00%
|
$1,000.00
|
$1,151.44
|
$5.42
|
| Hypothetical
(h) |
1.00%
|
$1,000.00
|
$1,020.16
|
$5.09
|
| R4
|
Actual
|
0.75%
|
$1,000.00
|
$1,152.91
|
$4.07
|
| Hypothetical
(h) |
0.75%
|
$1,000.00
|
$1,021.42
|
$3.82
|
| R6
|
Actual
|
0.65%
|
$1,000.00
|
$1,153.64
|
$3.53
|
| Hypothetical
(h) |
0.65%
|
$1,000.00
|
$1,021.93
|
$3.31
|
| 529A
|
Actual
|
1.02%
|
$1,000.00
|
$1,151.66
|
$5.53
|
| Hypothetical
(h) |
1.02%
|
$1,000.00
|
$1,020.06
|
$5.19
|
| 529B
|
Actual
|
1.04%
|
$1,000.00
|
$1,151.50
|
$5.64
|
| Hypothetical
(h) |
1.04%
|
$1,000.00
|
$1,019.96
|
$5.30
|
| 529C
|
Actual
|
1.78%
|
$1,000.00
|
$1,146.89
|
$9.63
|
| Hypothetical
(h) |
1.78%
|
$1,000.00
|
$1,016.23
|
$9.05
|
| (h)
|
5% class return per year
before expenses. |
| (p)
|
“Expenses
Paid During Period” are equal to each class’s annualized expense ratio, as shown above, multiplied by the average account value over the period, multiplied by 184/365 (to reflect the one-half year period). Expenses paid do not include
any applicable sales charges (loads). If these transaction costs had been included, your costs would have been higher. |
Notes to Expense Table
For the period from March 1, 2021 through August 31, 2021, the
distribution fee for Class 529B was not imposed. Had the distribution fee been imposed throughout the entire six month period, the annualized expense ratio, the actual expenses paid during the period, and the hypothetical expenses paid during the
period would have been approximately 1.79%, $9.71, and $9.10 for Class 529B. See Note 3 in the Notes to Financial Statements for additional information.
Each class with a Rule 12b-1 service fee is subject to a rebate
of a portion of such fee. Such rebates are included in the expense ratios above and are outside of the expense limitation
Expense Table -
continued
arrangement. For Class 529A and Class 529C shares, this rebate reduced the
expense ratios above by 0.02%. See Note 3 in the Notes to Financial Statements for additional information.
Portfolio of
Investments
8/31/21
The Portfolio of Investments is a complete list of all
securities owned by your fund. It is categorized by broad-based asset classes.
| Issuer
|
|
|
Shares/Par
|
Value
($) |
| Common
Stocks – 98.8% |
| Aerospace
& Defense – 0.8% |
|
| Howmet
Aerospace, Inc. |
|
4,018,680 |
$
127,593,090 |
| Automotive
– 2.1% |
|
| Copart,
Inc. (a) |
|
1,815,746 |
$
262,048,463 |
| LKQ
Corp. (a) |
|
1,478,767 |
77,916,233 |
| |
|
|
|
$339,964,696 |
| Biotechnology
– 0.9% |
|
| Adaptive
Biotechnologies Corp. (a) |
|
1,236,008 |
$
44,891,811 |
| Alnylam
Pharmaceuticals, Inc. (a) |
|
534,935 |
107,751,957 |
| |
|
|
|
$152,643,768 |
| Brokerage
& Asset Managers – 2.3% |
|
| NASDAQ,
Inc. |
|
1,233,039 |
$
241,404,375 |
| Tradeweb
Markets, Inc. |
|
1,416,748 |
123,271,244 |
| |
|
|
|
$364,675,619 |
| Business
Services – 10.4% |
|
| Clarivate
PLC (a) |
|
8,503,590 |
$
214,205,432 |
| CoStar
Group, Inc. (a) |
|
2,189,070 |
185,501,792 |
| Endava
PLC, ADR (a) |
|
490,036 |
65,615,820 |
| Equifax,
Inc. |
|
830,830 |
226,201,776 |
| IHS
Markit Ltd. |
|
332,052 |
40,045,471 |
| MSCI,
Inc. |
|
689,406 |
437,483,260 |
| Paysafe
Ltd. (a)(l) |
|
2,098,229 |
17,751,017 |
| Tyler
Technologies, Inc. (a) |
|
426,447 |
207,125,308 |
| Verisk
Analytics, Inc., “A” |
|
1,370,053 |
276,421,893 |
| |
|
|
|
$1,670,351,769 |
| Cable
TV – 0.4% |
|
| Cable
One, Inc. |
|
34,656 |
$
72,763,391 |
| Computer
Software – 12.3% |
|
| Autodesk,
Inc. (a) |
|
653,331 |
$
202,591,410 |
| Black
Knight, Inc. (a) |
|
2,120,977 |
160,494,330 |
| Bumble,
Inc., “A” (a) |
|
1,098,685 |
59,878,332 |
| Cadence
Design Systems, Inc. (a) |
|
2,332,829 |
381,370,885 |
| CCC
Intelligent Holdings, Inc. (a) |
|
2,632,429 |
30,536,176 |
| CCC
Intelligent Holdings, Inc. (PIPE) (a)(u)(z) |
|
452,972 |
5,135,763 |
| Coupa
Software, Inc. (a) |
|
298,911 |
73,176,402 |
| DocuSign,
Inc. (a) |
|
407,477 |
120,710,986 |
Portfolio of
Investments – continued
| Issuer
|
|
|
Shares/Par
|
Value
($) |
| Common
Stocks – continued |
| Computer
Software – continued |
|
| Dun
& Bradstreet Holdings, Inc. (a) |
|
3,852,077 |
$
70,608,571 |
| Eventbrite,
Inc. (a) |
|
2,651,794 |
46,883,718 |
| Everbridge,
Inc. (a) |
|
699,192 |
109,752,168 |
| Okta,
Inc. (a) |
|
478,561 |
126,148,680 |
| Paylocity
Holding Corp. (a) |
|
818,762 |
220,410,730 |
| Qualtrics
International, “A” (a) |
|
708,234 |
32,068,836 |
| RingCentral,
Inc. (a) |
|
337,753 |
85,201,572 |
| Synopsys,
Inc. (a) |
|
635,145 |
211,020,575 |
| Topicus.Com,
Inc. (a) |
|
197,211 |
20,012,622 |
| Unity
Software, Inc. (a) |
|
143,231 |
18,154,529 |
| |
|
|
|
$1,974,156,285 |
| Computer
Software - Systems – 7.7% |
|
| Constellation
Software, Inc. |
|
104,933 |
$
177,835,922 |
| NICE
Systems Ltd., ADR (a) |
|
926,837 |
269,431,516 |
| ServiceNow,
Inc. (a) |
|
255,825 |
164,659,203 |
| Square,
Inc., “A” (a) |
|
635,167 |
170,269,218 |
| SS&C
Technologies Holdings, Inc. |
|
997,278 |
75,454,054 |
| TransUnion
|
|
2,329,338 |
283,084,447 |
| Wix.com
Ltd. (a) |
|
383,803 |
85,234,970 |
| |
|
|
|
$1,225,969,330 |
| Construction
– 4.8% |
|
| AZEK
Co. LLC (a) |
|
2,106,529 |
$
89,506,417 |
| Builders
FirstSource, Inc. (a) |
|
2,011,088 |
107,170,880 |
| Lennox
International, Inc. |
|
180,882 |
60,628,029 |
| Pool
Corp. |
|
526,958 |
260,475,339 |
| Vulcan
Materials Co. |
|
1,333,539 |
247,944,906 |
| |
|
|
|
$765,725,571 |
| Consumer
Products – 0.7% |
|
| Scotts
Miracle-Gro Co. |
|
680,213 |
$
106,677,805 |
| Consumer
Services – 2.3% |
|
| Bright
Horizons Family Solutions, Inc. (a) |
|
1,886,558 |
$
274,984,694 |
| Peloton
Interactive, Inc., “A” (a) |
|
965,697 |
96,753,182 |
| |
|
|
|
$371,737,876 |
| Containers
– 0.7% |
|
| Ball
Corp. |
|
1,111,664 |
$
106,675,277 |
| Electrical
Equipment – 2.5% |
|
| AMETEK,
Inc. |
|
2,183,946 |
$
296,951,138 |
| Littlefuse,
Inc. |
|
371,560 |
106,043,224 |
| |
|
|
|
$402,994,362 |
Portfolio of
Investments – continued
| Issuer
|
|
|
Shares/Par
|
Value
($) |
| Common
Stocks – continued |
| Electronics
– 5.5% |
|
| ASM
International N.V. |
|
319,464 |
$
123,950,259 |
| Entegris,
Inc. |
|
2,015,415 |
242,131,958 |
| Monolithic
Power Systems, Inc. |
|
925,569 |
458,091,865 |
| Silicon
Laboratories, Inc. (a) |
|
353,531 |
55,723,557 |
| |
|
|
|
$879,897,639 |
| Food
& Beverages – 0.3% |
|
| Oatly
Group AB, ADR (a) |
|
2,543,593 |
$
46,344,264 |
| Gaming
& Lodging – 2.4% |
|
| Caesars
Entertainment, Inc. (a) |
|
1,051,744 |
$
106,888,743 |
| DraftKings,
Inc. (a) |
|
606,010 |
35,930,333 |
| Penn
National Gaming, Inc. (a) |
|
1,073,520 |
87,062,472 |
| Red
Rock Resorts, Inc. (a) |
|
2,236,524 |
104,691,688 |
| Vail
Resorts, Inc. (a) |
|
157,490 |
48,010,827 |
| |
|
|
|
$382,584,063 |
| General
Merchandise – 0.7% |
|
| Five
Below, Inc. (a) |
|
525,636 |
$
111,860,597 |
| Insurance
– 1.6% |
|
| Arthur
J. Gallagher & Co. |
|
1,754,251 |
$
251,945,529 |
| Internet
– 3.0% |
|
| Gartner,
Inc. (a) |
|
178,900 |
$
55,233,586 |
| IAC/InterActiveCorp
(a) |
|
837,902 |
110,644,959 |
| Match
Group, Inc. (a) |
|
1,887,845 |
259,465,417 |
| Vimeo,
Inc. (a) |
|
1,360,334 |
51,855,932 |
| |
|
|
|
$477,199,894 |
| Leisure
& Toys – 2.0% |
|
| Electronic
Arts, Inc. |
|
458,589 |
$
66,591,709 |
| Roblox
Corp., “A” (a) |
|
582,018 |
47,754,577 |
| Take-Two
Interactive Software, Inc. (a) |
|
1,325,164 |
213,642,940 |
| |
|
|
|
$327,989,226 |
| Machinery
& Tools – 2.0% |
|
| IDEX
Corp. |
|
978,487 |
$
219,181,088 |
| MKS
Instruments, Inc. |
|
490,188 |
72,145,870 |
| Roper
Technologies, Inc. |
|
58,077 |
28,067,452 |
| |
|
|
|
$319,394,410 |
Portfolio of
Investments – continued
| Issuer
|
|
|
Shares/Par
|
Value
($) |
| Common
Stocks – continued |
| Medical
& Health Technology & Services – 5.8% |
|
| Charles
River Laboratories International, Inc. (a) |
|
968,926 |
$
430,067,494 |
| Guardant
Health, Inc. (a) |
|
716,095 |
91,137,411 |
| ICON
PLC (a) |
|
1,000,978 |
256,020,143 |
| IDEXX
Laboratories, Inc. (a) |
|
213,943 |
144,146,236 |
| |
|
|
|
$921,371,284 |
| Medical
Equipment – 13.1% |
|
| Agilent
Technologies, Inc. |
|
1,225,272 |
$
214,998,478 |
| Align
Technology, Inc. (a) |
|
268,416 |
190,306,944 |
| Bio-Techne
Corp. |
|
586,979 |
292,984,698 |
| Maravai
Lifesciences Holdings, Inc., “A” (a) |
|
2,471,700 |
146,275,206 |
| Masimo
Corp. (a) |
|
665,164 |
180,618,633 |
| Mettler-Toledo
International, Inc. (a) |
|
47,645 |
73,984,585 |
| PerkinElmer,
Inc. |
|
2,430,480 |
449,152,704 |
| STERIS
PLC |
|
1,346,592 |
289,530,746 |
| West
Pharmaceutical Services, Inc. |
|
559,025 |
252,466,870 |
| |
|
|
|
$2,090,318,864 |
| Network
& Telecom – 0.9% |
|
| CoreSite
Realty Corp., REIT |
|
1,018,704 |
$
151,145,112 |
| Other
Banks & Diversified Financials – 0.4% |
|
| Altimeter
Growth Corp. (SPAC Units) (a) |
|
2,181,559 |
$
24,520,723 |
| Altimeter
Growth Corp. 2 (SPAC) (a) |
|
2,014,554 |
19,863,502 |
| Catalyst
Partners Acquisition Corp. (SPAC Units) (a) |
|
1,387,766 |
13,766,639 |
| |
|
|
|
$58,150,864 |
| Pharmaceuticals
– 0.6% |
|
| Ascendis
Pharma (a) |
|
567,577 |
$
88,956,343 |
| Pollution
Control – 0.7% |
|
| Waste
Connections, Inc. |
|
854,798 |
$
110,448,450 |
| Printing
& Publishing – 1.7% |
|
| Warner
Music Group Corp. |
|
1,264,948 |
$
48,068,024 |
| Wolters
Kluwer N.V. |
|
1,963,844 |
225,898,354 |
| |
|
|
|
$273,966,378 |
| Railroad
& Shipping – 0.6% |
|
| Kansas
City Southern Co. |
|
321,900 |
$
90,347,673 |
| Real
Estate – 0.8% |
|
| Extra
Space Storage, Inc., REIT |
|
729,908 |
$
136,427,104 |
Portfolio of
Investments – continued
| Issuer
|
|
|
Shares/Par
|
Value
($) |
| Common
Stocks – continued |
| Restaurants
– 2.3% |
|
| Chipotle
Mexican Grill, Inc., “A” (a) |
|
113,416 |
$
215,868,075 |
| Domino's
Pizza, Inc. |
|
296,048 |
153,024,251 |
| |
|
|
|
$368,892,326 |
| Specialty
Stores – 5.7% |
|
| Burlington
Stores, Inc. (a) |
|
690,934 |
$
206,927,823 |
| Chewy,
Inc., “A” (a) |
|
1,172,443 |
103,315,677 |
| Farfetch
Ltd., “A” (a) |
|
851,887 |
35,659,990 |
| Lululemon
Athletica, Inc. (a) |
|
434,222 |
173,762,618 |
| O'Reilly
Automotive, Inc. (a) |
|
198,949 |
118,191,622 |
| Petco
Health & Wellness Co., Inc. (a) |
|
613,708 |
13,213,133 |
| Tractor
Supply Co. |
|
609,243 |
118,345,453 |
| Ulta
Beauty, Inc. (a) |
|
388,251 |
150,373,495 |
| |
|
|
|
$919,789,811 |
| Telecommunications
- Wireless – 0.8% |
|
| SBA
Communications Corp., REIT |
|
345,307 |
$
123,954,854 |
| Total
Common Stocks (Identified Cost, $8,927,903,745) |
|
$15,812,913,524
|
| |
Strike
Price |
First
Exercise |
|
|
| Warrants
– 0.0% |
|
|
|
|
| Business
Services – 0.0% |
|
|
|
|
| Paysafe
Ltd. (1 share for 1 warrant, Expiration 12/31/28) (a) |
$11.50
|
3/30/26
|
707,145 |
$
1,428,433 |
| Computer
Software – 0.0% |
|
|
|
|
| CCC
Intelligent Holdings, Inc. (1 share for 1 warrant, Expiration 8/14/25) (a) |
$11.50
|
8/14/20
|
369,639 |
$
1,075,649 |
| Total
Warrants (Identified Cost, $0) |
|
$
2,504,082 |
| |
|
|
|
|
| Investment
Companies (h) – 1.2% |
| Money
Market Funds – 1.2% |
|
| MFS
Institutional Money Market Portfolio, 0.04% (v) (Identified Cost, $192,794,084) |
|
|
192,794,084
|
$
192,794,084 |
| Collateral
for Securities Loaned – 0.0% |
| JPMorgan
U.S. Government Money Market Fund, 0.03% (j) (Identified Cost, $6,839,177) |
|
|
6,839,177 |
$
6,839,177 |
| |
| |
| Other
Assets, Less Liabilities – (0.0)% |
|
(4,236,017) |
| Net
Assets – 100.0% |
$16,010,814,850
|
| (a)
|
Non-income
producing security. |
Portfolio of
Investments – continued
| (h)
|
An affiliated issuer, which
may be considered one in which the fund owns 5% or more of the outstanding voting securities, or a company which is under common control. At period end, the aggregate values of the fund's investments in affiliated issuers and in unaffiliated issuers
were $192,794,084 and $15,822,256,783, respectively. |
| (j)
|
The rate
quoted is the annualized seven-day yield of the fund at period end. |
| (l)
|
A
portion of this security is on loan. See Note 2 for additional information. |
| (u)
|
The
security was valued using significant unobservable inputs and is considered level 3 under the fair value hierarchy. For further information about the fund’s level 3 holdings, please see Note 2 in the Notes to Financial Statements. |
| (v)
|
Affiliated
issuer that is available only to investment companies managed by MFS. The rate quoted for the MFS Institutional Money Market Portfolio is the annualized seven-day yield of the fund at period end. |
| (z)
|
Restricted
securities are not registered under the Securities Act of 1933 and are subject to legal restrictions on resale. These securities generally may be resold in transactions exempt from registration or to the public if the securities are subsequently
registered. Disposal of these securities may involve time-consuming negotiations and prompt sale at an acceptable price may be difficult. The fund holds the following restricted securities: |
| Restricted
Securities |
Acquisition
Date |
Cost
|
Value
|
| CCC
Intelligent Holdings, Inc. (PIPE) |
2/02/21
|
$4,529,720
|
$5,135,763
|
| %
of Net assets |
|
|
0.0%
|
| The
following abbreviations are used in this report and are defined: |
| ADR
|
American
Depositary Receipt |
| PIPE
|
Private
Investment in Public Equity |
| REIT
|
Real
Estate Investment Trust |
| SPAC
|
Special
Purpose Acquisition Company |
See Notes
to Financial Statements
Financial Statements
Statement of Assets and Liabilities
At 8/31/21
This statement represents your fund’s balance sheet,
which details the assets and liabilities comprising the total value of the fund.
| Assets
|
|
| Investments
in unaffiliated issuers, at value, including $8,502,334 of securities on loan (identified cost, $8,934,742,922) |
$15,822,256,783
|
| Investments
in affiliated issuers, at value (identified cost, $192,794,084) |
192,794,084
|
| Receivables
for |
|
| Investments
sold |
5,717,857
|
| Fund
shares sold |
24,932,797
|
| Interest
and dividends |
4,353,172
|
| Other
assets |
8,543
|
| Total
assets |
$16,050,063,236
|
| Liabilities
|
|
| Payables
for |
|
| Investments
purchased |
$4,059,358
|
| Fund
shares reacquired |
25,722,827
|
| Collateral
for securities loaned, at value (c) |
6,839,177
|
| Payable
to affiliates |
|
| Investment
adviser |
544,221
|
| Administrative
services fee |
3,089
|
| Shareholder
servicing costs |
1,556,889
|
| Distribution
and service fees |
48,789
|
| Program
manager fees |
65
|
| Payable
for independent Trustees' compensation |
99
|
| Accrued
expenses and other liabilities |
473,872
|
| Total
liabilities |
$39,248,386
|
| Net
assets |
$16,010,814,850
|
| Net
assets consist of |
|
| Paid-in
capital |
$8,717,922,618
|
| Total
distributable earnings (loss) |
7,292,892,232
|
| Net
assets |
$16,010,814,850
|
| Shares
of beneficial interest outstanding |
476,170,561
|
| (c)
|
Non-cash
collateral is not included. |
Statement of Assets and
Liabilities – continued
| |
Net
assets |
Shares
outstanding |
Net
asset value
per share (a) |
| Class
A |
$2,130,372,327
|
66,917,667
|
$31.84
|
| Class
B |
18,021,348
|
707,387
|
25.48
|
| Class
C |
137,007,402
|
5,555,662
|
24.66
|
| Class
I |
4,444,324,918
|
130,448,123
|
34.07
|
| Class
R1 |
5,280,995
|
208,354
|
25.35
|
| Class
R2 |
29,119,943
|
980,546
|
29.70
|
| Class
R3 |
777,473,857
|
24,581,504
|
31.63
|
| Class
R4 |
389,322,957
|
11,707,285
|
33.25
|
| Class
R6 |
8,056,149,531
|
234,272,278
|
34.39
|
| Class
529A |
21,331,646
|
691,953
|
30.83
|
| Class
529B |
465,401
|
18,671
|
24.93
|
| Class
529C |
1,944,525
|
81,131
|
23.97
|
| (a)
|
Maximum
offering price per share was equal to the net asset value per share for all share classes, except for Classes A and 529A, for which the maximum offering prices per share were $33.78 [100 / 94.25 x $31.84] and $32.71 [100 / 94.25 x $30.83],
respectively. On sales of $50,000 or more, the maximum offering prices of Class A and Class 529A shares are reduced. A contingent deferred sales charge may be imposed on redemptions of Class A, Class B, Class C, Class 529B, and Class 529C shares.
Redemption price per share was equal to the net asset value per share for Classes I, R1, R2, R3, R4, R6, and 529A. |
See Notes to Financial Statements
Financial Statements
Statement of Operations
Year ended 8/31/21
This statement describes how much your fund earned in
investment income and accrued in expenses. It also describes any gains and/or losses generated by fund operations.
| Net
investment income (loss) |
|
| Income
|
|
| Dividends
|
$49,251,640
|
| Other
|
470,198
|
| Dividends
from affiliated issuers |
140,402
|
| Income
on securities loaned |
67,149
|
| Foreign
taxes withheld |
(877,469)
|
| Total
investment income |
$49,051,920
|
| Expenses
|
|
| Management
fee |
$88,409,929
|
| Distribution
and service fees |
7,727,123
|
| Shareholder
servicing costs |
8,108,549
|
| Program
manager fees |
9,995
|
| Administrative
services fee |
551,588
|
| Independent
Trustees' compensation |
98,714
|
| Custodian
fee |
405,349
|
| Shareholder
communications |
735,692
|
| Audit
and tax fees |
61,853
|
| Legal
fees |
85,507
|
| Miscellaneous
|
748,835
|
| Total
expenses |
$106,943,134
|
| Fees
paid indirectly |
(174)
|
| Reduction
of expenses by investment adviser and distributor |
(1,650,785)
|
| Net
expenses |
$105,292,175
|
| Net
investment income (loss) |
$(56,240,255)
|
| Realized
and unrealized gain (loss) |
| Realized
gain (loss) (identified cost basis) |
|
| Unaffiliated
issuers |
$598,405,912
|
| Affiliated
issuers |
2,711
|
| Foreign
currency |
25,482
|
| Net
realized gain (loss) |
$598,434,105
|
| Change
in unrealized appreciation or depreciation |
|
| Unaffiliated
issuers |
$3,206,499,666
|
| Affiliated
issuers |
(2,712)
|
| Translation
of assets and liabilities in foreign currencies |
(9,675)
|
| Net
unrealized gain (loss) |
$3,206,487,279
|
| Net
realized and unrealized gain (loss) |
$3,804,921,384
|
| Change
in net assets from operations |
$3,748,681,129
|
See Notes to Financial
Statements
Financial Statements
Statements of Changes in Net Assets
These statements describe the increases and/or decreases in
net assets resulting from operations, any distributions, and any shareholder transactions.
| |
Year
ended |
| |
8/31/21
|
8/31/20
|
| Change
in net assets |
|
|
| From
operations |
|
|
| Net
investment income (loss) |
$(56,240,255)
|
$(9,640,845)
|
| Net
realized gain (loss) |
598,434,105
|
43,890,779
|
| Net
unrealized gain (loss) |
3,206,487,279
|
1,994,075,707
|
| Change
in net assets from operations |
$3,748,681,129
|
$2,028,325,641
|
| Total
distributions to shareholders |
$(110,534,296)
|
$(64,368,451)
|
| Change
in net assets from fund share transactions |
$850,536,712
|
$3,571,746,148
|
| Total
change in net assets |
$4,488,683,545
|
$5,535,703,338
|
| Net
assets |
|
|
| At
beginning of period |
11,522,131,305
|
5,986,427,967
|
| At
end of period |
$16,010,814,850
|
$11,522,131,305
|
See Notes to Financial
Statements
Financial
Statements
Financial Highlights
The financial highlights table is intended to help you
understand the fund's financial performance for the past 5 years. Certain information reflects financial results for a single fund share. The total returns in the table represent the rate that an investor would have earned (or lost) on an investment
in the fund share class (assuming reinvestment of all distributions) held for the entire period.
| Class
A |
Year
ended |
| |
8/31/21
|
8/31/20
|
8/31/19
|
8/31/18
|
8/31/17
|
| Net
asset value, beginning of period |
$24.65
|
$20.19
|
$19.16
|
$16.34
|
$14.82
|
| Income
(loss) from investment operations |
| Net
investment income (loss) (d) |
$(0.18)
|
$(0.07)
|
$(0.07)
|
$(0.09)
|
$(0.06)(c)
|
| Net
realized and unrealized gain (loss) |
7.60
|
4.71
|
1.83
|
4.32
|
2.36
|
| Total
from investment operations |
$7.42
|
$4.64
|
$1.76
|
$4.23
|
$2.30
|
| Less
distributions declared to shareholders |
| From
net realized gain |
$(0.23)
|
$(0.18)
|
$(0.73)
|
$(1.41)
|
$(0.78)
|
| Net
asset value, end of period (x) |
$31.84
|
$24.65
|
$20.19
|
$19.16
|
$16.34
|
| Total
return (%) (r)(s)(t)(x) |
30.30
|
23.16
|
10.13
|
27.69
|
16.44(c)
|
Ratios
(%) (to average net assets)
and Supplemental data: |
| Expenses
before expense reductions (f) |
1.01
|
1.05
|
1.10
|
1.17
|
1.22(c)
|
| Expenses
after expense reductions (f) |
1.00
|
1.04
|
1.09
|
1.16
|
1.20(c)
|
| Net
investment income (loss) |
(0.65)
|
(0.35)
|
(0.36)
|
(0.55)
|
(0.42)(c)
|
| Portfolio
turnover |
23
|
34
|
21
|
33
|
30
|
| Net
assets at end of period (000 omitted) |
$2,130,372
|
$1,483,320
|
$1,065,566
|
$824,847
|
$572,338
|
See Notes to Financial
Statements
Financial
Highlights – continued
| Class
B |
Year
ended |
| |
8/31/21
|
8/31/20
|
8/31/19
|
8/31/18
|
8/31/17
|
| Net
asset value, beginning of period |
$19.91
|
$16.47
|
$15.90
|
$13.88
|
$12.80
|
| Income
(loss) from investment operations |
| Net
investment income (loss) (d) |
$(0.31)
|
$(0.19)
|
$(0.17)
|
$(0.19)
|
$(0.15)(c)
|
| Net
realized and unrealized gain (loss) |
6.11
|
3.81
|
1.47
|
3.62
|
2.01
|
| Total
from investment operations |
$5.80
|
$3.62
|
$1.30
|
$3.43
|
$1.86
|
| Less
distributions declared to shareholders |
| From
net realized gain |
$(0.23)
|
$(0.18)
|
$(0.73)
|
$(1.41)
|
$(0.78)
|
| Net
asset value, end of period (x) |
$25.48
|
$19.91
|
$16.47
|
$15.90
|
$13.88
|
| Total
return (%) (r)(s)(t)(x) |
29.36
|
22.20
|
9.28
|
26.77
|
15.56(c)
|
Ratios
(%) (to average net assets)
and Supplemental data: |
| Expenses
before expense reductions (f) |
1.76
|
1.80
|
1.85
|
1.92
|
1.97(c)
|
| Expenses
after expense reductions (f) |
1.75
|
1.79
|
1.84
|
1.91
|
1.95(c)
|
| Net
investment income (loss) |
(1.39)
|
(1.10)
|
(1.12)
|
(1.30)
|
(1.16)(c)
|
| Portfolio
turnover |
23
|
34
|
21
|
33
|
30
|
| Net
assets at end of period (000 omitted) |
$18,021
|
$17,725
|
$18,581
|
$19,329
|
$16,326
|
| Class
C |
Year
ended |
| |
8/31/21
|
8/31/20
|
8/31/19
|
8/31/18
|
8/31/17
|
| Net
asset value, beginning of period |
$19.28
|
$15.95
|
$15.42
|
$13.50
|
$12.48
|
| Income
(loss) from investment operations |
| Net
investment income (loss) (d) |
$(0.30)
|
$(0.18)
|
$(0.16)
|
$(0.18)
|
$(0.15)(c)
|
| Net
realized and unrealized gain (loss) |
5.91(g)
|
3.69
|
1.42
|
3.51
|
1.95
|
| Total
from investment operations |
$5.61
|
$3.51
|
$1.26
|
$3.33
|
$1.80
|
| Less
distributions declared to shareholders |
| From
net realized gain |
$(0.23)
|
$(0.18)
|
$(0.73)
|
$(1.41)
|
$(0.78)
|
| Net
asset value, end of period (x) |
$24.66
|
$19.28
|
$15.95
|
$15.42
|
$13.50
|
| Total
return (%) (r)(s)(t)(x) |
29.34
|
22.23
|
9.31
|
26.77
|
15.48(c)
|
Ratios
(%) (to average net assets)
and Supplemental data: |
| Expenses
before expense reductions (f) |
1.76
|
1.80
|
1.85
|
1.92
|
1.97(c)
|
| Expenses
after expense reductions (f) |
1.75
|
1.79
|
1.84
|
1.91
|
1.95(c)
|
| Net
investment income (loss) |
(1.40)
|
(1.10)
|
(1.11)
|
(1.30)
|
(1.17)(c)
|
| Portfolio
turnover |
23
|
34
|
21
|
33
|
30
|
| Net
assets at end of period (000 omitted) |
$137,007
|
$109,521
|
$78,858
|
$54,080
|
$58,623
|
See Notes to Financial
Statements
Financial
Highlights – continued
| Class
I |
Year
ended |
| |
8/31/21
|
8/31/20
|
8/31/19
|
8/31/18
|
8/31/17
|
| Net
asset value, beginning of period |
$26.30
|
$21.48
|
$20.28
|
$17.17
|
$15.50
|
| Income
(loss) from investment operations |
| Net
investment income (loss) (d) |
$(0.12)
|
$(0.02)
|
$(0.02)
|
$(0.06)
|
$(0.03)(c)
|
| Net
realized and unrealized gain (loss) |
8.12
|
5.02
|
1.95
|
4.58
|
2.48
|
| Total
from investment operations |
$8.00
|
$5.00
|
$1.93
|
$4.52
|
$2.45
|
| Less
distributions declared to shareholders |
| From
net realized gain |
$(0.23)
|
$(0.18)
|
$(0.73)
|
$(1.41)
|
$(0.78)
|
| Net
asset value, end of period (x) |
$34.07
|
$26.30
|
$21.48
|
$20.28
|
$17.17
|
| Total
return (%) (r)(s)(t)(x) |
30.60
|
23.45
|
10.42
|
28.05
|
16.70(c)
|
Ratios
(%) (to average net assets)
and Supplemental data: |
| Expenses
before expense reductions (f) |
0.76
|
0.80
|
0.84
|
0.92
|
0.97(c)
|
| Expenses
after expense reductions (f) |
0.75
|
0.79
|
0.83
|
0.91
|
0.96(c)
|
| Net
investment income (loss) |
(0.40)
|
(0.10)
|
(0.09)
|
(0.30)
|
(0.18)(c)
|
| Portfolio
turnover |
23
|
34
|
21
|
33
|
30
|
| Net
assets at end of period (000 omitted) |
$4,444,325
|
$3,837,781
|
$1,330,368
|
$332,008
|
$100,858
|
| Class
R1 |
Year
ended |
| |
8/31/21
|
8/31/20
|
8/31/19
|
8/31/18
|
8/31/17
|
| Net
asset value, beginning of period |
$19.81
|
$16.39
|
$15.82
|
$13.82
|
$12.75
|
| Income
(loss) from investment operations |
| Net
investment income (loss) (d) |
$(0.31)
|
$(0.18)
|
$(0.17)
|
$(0.19)
|
$(0.15)(c)
|
| Net
realized and unrealized gain (loss) |
6.08
|
3.78
|
1.47
|
3.60
|
2.00
|
| Total
from investment operations |
$5.77
|
$3.60
|
$1.30
|
$3.41
|
$1.85
|
| Less
distributions declared to shareholders |
| From
net realized gain |
$(0.23)
|
$(0.18)
|
$(0.73)
|
$(1.41)
|
$(0.78)
|
| Net
asset value, end of period (x) |
$25.35
|
$19.81
|
$16.39
|
$15.82
|
$13.82
|
| Total
return (%) (r)(s)(t)(x) |
29.36
|
22.18
|
9.33
|
26.73
|
15.54(c)
|
Ratios
(%) (to average net assets)
and Supplemental data: |
| Expenses
before expense reductions (f) |
1.76
|
1.80
|
1.85
|
1.92
|
1.97(c)
|
| Expenses
after expense reductions (f) |
1.75
|
1.79
|
1.84
|
1.91
|
1.96(c)
|
| Net
investment income (loss) |
(1.39)
|
(1.09)
|
(1.12)
|
(1.30)
|
(1.17)(c)
|
| Portfolio
turnover |
23
|
34
|
21
|
33
|
30
|
| Net
assets at end of period (000 omitted) |
$5,281
|
$4,187
|
$3,472
|
$2,827
|
$2,348
|
See Notes to Financial
Statements
Financial
Highlights – continued
| Class
R2 |
Year
ended |
| |
8/31/21
|
8/31/20
|
8/31/19
|
8/31/18
|
8/31/17
|
| Net
asset value, beginning of period |
$23.06
|
$18.95
|
$18.08
|
$15.53
|
$14.16
|
| Income
(loss) from investment operations |
| Net
investment income (loss) (d) |
$(0.24)
|
$(0.12)
|
$(0.11)
|
$(0.13)
|
$(0.10)(c)
|
| Net
realized and unrealized gain (loss) |
7.11
|
4.41
|
1.71
|
4.09
|
2.25
|
| Total
from investment operations |
$6.87
|
$4.29
|
$1.60
|
$3.96
|
$2.15
|
| Less
distributions declared to shareholders |
| From
net realized gain |
$(0.23)
|
$(0.18)
|
$(0.73)
|
$(1.41)
|
$(0.78)
|
| Net
asset value, end of period (x) |
$29.70
|
$23.06
|
$18.95
|
$18.08
|
$15.53
|
| Total
return (%) (r)(s)(t)(x) |
30.00
|
22.83
|
9.84
|
27.37
|
16.14(c)
|
Ratios
(%) (to average net assets)
and Supplemental data: |
| Expenses
before expense reductions (f) |
1.26
|
1.30
|
1.35
|
1.42
|
1.47(c)
|
| Expenses
after expense reductions (f) |
1.25
|
1.29
|
1.34
|
1.41
|
1.46(c)
|
| Net
investment income (loss) |
(0.90)
|
(0.60)
|
(0.61)
|
(0.80)
|
(0.67)(c)
|
| Portfolio
turnover |
23
|
34
|
21
|
33
|
30
|
| Net
assets at end of period (000 omitted) |
$29,120
|
$15,176
|
$11,060
|
$9,069
|
$6,681
|
| Class
R3 |
Year
ended |
| |
8/31/21
|
8/31/20
|
8/31/19
|
8/31/18
|
8/31/17
|
| Net
asset value, beginning of period |
$24.49
|
$20.06
|
$19.04
|
$16.24
|
$14.74
|
| Income
(loss) from investment operations |
| Net
investment income (loss) (d) |
$(0.18)
|
$(0.07)
|
$(0.06)
|
$(0.09)
|
$(0.07)(c)
|
| Net
realized and unrealized gain (loss) |
7.55
|
4.68
|
1.81
|
4.30
|
2.35
|
| Total
from investment operations |
$7.37
|
$4.61
|
$1.75
|
$4.21
|
$2.28
|
| Less
distributions declared to shareholders |
| From
net realized gain |
$(0.23)
|
$(0.18)
|
$(0.73)
|
$(1.41)
|
$(0.78)
|
| Net
asset value, end of period (x) |
$31.63
|
$24.49
|
$20.06
|
$19.04
|
$16.24
|
| Total
return (%) (r)(s)(t)(x) |
30.29
|
23.16
|
10.14
|
27.73
|
16.39(c)
|
Ratios
(%) (to average net assets)
and Supplemental data: |
| Expenses
before expense reductions (f) |
1.01
|
1.05
|
1.09
|
1.17
|
1.22(c)
|
| Expenses
after expense reductions (f) |
1.00
|
1.04
|
1.09
|
1.16
|
1.21(c)
|
| Net
investment income (loss) |
(0.65)
|
(0.35)
|
(0.34)
|
(0.55)
|
(0.44)(c)
|
| Portfolio
turnover |
23
|
34
|
21
|
33
|
30
|
| Net
assets at end of period (000 omitted) |
$777,474
|
$451,972
|
$239,505
|
$95,010
|
$32,496
|
See Notes to Financial
Statements
Financial
Highlights – continued
| Class
R4 |
Year
ended |
| |
8/31/21
|
8/31/20
|
8/31/19
|
8/31/18
|
8/31/17
|
| Net
asset value, beginning of period |
$25.67
|
$20.97
|
$19.82
|
$16.82
|
$15.20
|
| Income
(loss) from investment operations |
| Net
investment income (loss) (d) |
$(0.12)
|
$(0.02)
|
$(0.02)
|
$(0.05)
|
$(0.03)(c)
|
| Net
realized and unrealized gain (loss) |
7.93
|
4.90
|
1.90
|
4.46
|
2.43
|
| Total
from investment operations |
$7.81
|
$4.88
|
$1.88
|
$4.41
|
$2.40
|
| Less
distributions declared to shareholders |
| From
net realized gain |
$(0.23)
|
$(0.18)
|
$(0.73)
|
$(1.41)
|
$(0.78)
|
| Net
asset value, end of period (x) |
$33.25
|
$25.67
|
$20.97
|
$19.82
|
$16.82
|
| Total
return (%) (r)(s)(t)(x) |
30.61
|
23.45
|
10.40
|
27.98
|
16.70(c)
|
Ratios
(%) (to average net assets)
and Supplemental data: |
| Expenses
before expense reductions (f) |
0.76
|
0.80
|
0.84
|
0.92
|
0.97(c)
|
| Expenses
after expense reductions (f) |
0.75
|
0.79
|
0.83
|
0.91
|
0.96(c)
|
| Net
investment income (loss) |
(0.40)
|
(0.10)
|
(0.08)
|
(0.30)
|
(0.18)(c)
|
| Portfolio
turnover |
23
|
34
|
21
|
33
|
30
|
| Net
assets at end of period (000 omitted) |
$389,323
|
$242,937
|
$173,441
|
$54,141
|
$22,346
|
| Class
R6 |
Year
ended |
| |
8/31/21
|
8/31/20
|
8/31/19
|
8/31/18
|
8/31/17
|
| Net
asset value, beginning of period |
$26.51
|
$21.63
|
$20.40
|
$17.25
|
$15.55
|
| Income
(loss) from investment operations |
| Net
investment income (loss) (d) |
$(0.09)
|
$(0.00)(w)
|
$(0.00)(w)
|
$(0.04)
|
$(0.01)(c)
|
| Net
realized and unrealized gain (loss) |
8.20
|
5.06
|
1.96
|
4.60
|
2.49
|
| Total
from investment operations |
$8.11
|
$5.06
|
$1.96
|
$4.56
|
$2.48
|
| Less
distributions declared to shareholders |
| From
net realized gain |
$(0.23)
|
$(0.18)
|
$(0.73)
|
$(1.41)
|
$(0.78)
|
| Net
asset value, end of period (x) |
$34.39
|
$26.51
|
$21.63
|
$20.40
|
$17.25
|
| Total
return (%) (r)(s)(t)(x) |
30.78
|
23.57
|
10.51
|
28.17
|
16.84(c)
|
Ratios
(%) (to average net assets)
and Supplemental data: |
| Expenses
before expense reductions (f) |
0.66
|
0.70
|
0.75
|
0.81
|
0.86(c)
|
| Expenses
after expense reductions (f) |
0.65
|
0.69
|
0.74
|
0.81
|
0.84(c)
|
| Net
investment income (loss) |
(0.30)
|
(0.01)
|
(0.01)
|
(0.19)
|
(0.05)(c)
|
| Portfolio
turnover |
23
|
34
|
21
|
33
|
30
|
| Net
assets at end of period (000 omitted) |
$8,056,150
|
$5,343,295
|
$3,053,325
|
$2,013,624
|
$1,520,339
|
See Notes to Financial
Statements
Financial
Highlights – continued
| Class
529A |
Year
ended |
| |
8/31/21
|
8/31/20
|
8/31/19
|
8/31/18
|
8/31/17
|
| Net
asset value, beginning of period |
$23.88
|
$19.57
|
$18.60
|
$15.90
|
$14.45
|
| Income
(loss) from investment operations |
| Net
investment income (loss) (d) |
$(0.18)
|
$(0.08)
|
$(0.07)
|
$(0.09)
|
$(0.06)(c)
|
| Net
realized and unrealized gain (loss) |
7.36
|
4.57
|
1.77
|
4.20
|
2.29
|
| Total
from investment operations |
$7.18
|
$4.49
|
$1.70
|
$4.11
|
$2.23
|
| Less
distributions declared to shareholders |
| From
net realized gain |
$(0.23)
|
$(0.18)
|
$(0.73)
|
$(1.41)
|
$(0.78)
|
| Net
asset value, end of period (x) |
$30.83
|
$23.88
|
$19.57
|
$18.60
|
$15.90
|
| Total
return (%) (r)(s)(t)(x) |
30.27
|
23.13
|
10.11
|
27.70
|
16.38(c)
|
Ratios
(%) (to average net assets)
and Supplemental data: |
| Expenses
before expense reductions (f) |
1.06
|
1.10
|
1.15
|
1.23
|
1.32(c)
|
| Expenses
after expense reductions (f) |
1.03
|
1.06
|
1.10
|
1.18
|
1.21(c)
|
| Net
investment income (loss) |
(0.67)
|
(0.38)
|
(0.38)
|
(0.56)
|
(0.43)(c)
|
| Portfolio
turnover |
23
|
34
|
21
|
33
|
30
|
| Net
assets at end of period (000 omitted) |
$21,332
|
$13,593
|
$9,590
|
$7,582
|
$4,916
|
| Class
529B |
Year
ended |
| |
8/31/21
|
8/31/20
|
8/31/19
|
8/31/18
|
8/31/17
|
| Net
asset value, beginning of period |
$19.38
|
$16.04
|
$15.51
|
$13.58
|
$12.55
|
| Income
(loss) from investment operations |
| Net
investment income (loss) (d) |
$(0.18)
|
$(0.19)
|
$(0.17)
|
$(0.19)
|
$(0.15)(c)
|
| Net
realized and unrealized gain (loss) |
5.96(g)
|
3.71
|
1.43
|
3.53
|
1.96
|
| Total
from investment operations |
$5.78
|
$3.52
|
$1.26
|
$3.34
|
$1.81
|
| Less
distributions declared to shareholders |
| From
net realized gain |
$(0.23)
|
$(0.18)
|
$(0.73)
|
$(1.41)
|
$(0.78)
|
| Net
asset value, end of period (x) |
$24.93
|
$19.38
|
$16.04
|
$15.51
|
$13.58
|
| Total
return (%) (r)(s)(t)(x) |
30.07
|
22.17
|
9.26
|
26.69
|
15.47(c)
|
Ratios
(%) (to average net assets)
and Supplemental data: |
| Expenses
before expense reductions (f) |
1.18
|
1.85
|
1.90
|
1.98
|
2.07(c)
|
| Expenses
after expense reductions (f) |
1.17
|
1.84
|
1.89
|
1.96
|
2.00(c)
|
| Net
investment income (loss) |
(0.81)
|
(1.15)
|
(1.17)
|
(1.35)
|
(1.23)(c)
|
| Portfolio
turnover |
23
|
34
|
21
|
33
|
30
|
| Net
assets at end of period (000 omitted) |
$465
|
$407
|
$361
|
$304
|
$210
|
See Notes to Financial
Statements
Financial
Highlights – continued
| Class
529C |
Year
ended |
| |
8/31/21
|
8/31/20
|
8/31/19
|
8/31/18
|
8/31/17
|
| Net
asset value, beginning of period |
$18.75
|
$15.52
|
$15.04
|
$13.20
|
$12.22
|
| Income
(loss) from investment operations |
| Net
investment income (loss) (d) |
$(0.30)
|
$(0.18)
|
$(0.16)
|
$(0.18)
|
$(0.15)(c)
|
| Net
realized and unrealized gain (loss) |
5.75(g)
|
3.59
|
1.37
|
3.43
|
1.91
|
| Total
from investment operations |
$5.45
|
$3.41
|
$1.21
|
$3.25
|
$1.76
|
| Less
distributions declared to shareholders |
| From
net realized gain |
$(0.23)
|
$(0.18)
|
$(0.73)
|
$(1.41)
|
$(0.78)
|
| Net
asset value, end of period (x) |
$23.97
|
$18.75
|
$15.52
|
$15.04
|
$13.20
|
| Total
return (%) (r)(s)(t)(x) |
29.31
|
22.20
|
9.21
|
26.78
|
15.48(c)
|
Ratios
(%) (to average net assets)
and Supplemental data: |
| Expenses
before expense reductions (f) |
1.81
|
1.85
|
1.90
|
1.99
|
2.07(c)
|
| Expenses
after expense reductions (f) |
1.79
|
1.83
|
1.88
|
1.95
|
1.99(c)
|
| Net
investment income (loss) |
(1.43)
|
(1.14)
|
(1.16)
|
(1.34)
|
(1.21)(c)
|
| Portfolio
turnover |
23
|
34
|
21
|
33
|
30
|
| Net
assets at end of period (000 omitted) |
$1,945
|
$2,217
|
$2,299
|
$2,236
|
$1,955
|
| (c)
|
Amount
reflects a one-time reimbursement of expenses by the custodian (or former custodian) without which net investment income and performance would be lower and expenses would be higher. |
| (d)
|
Per share
data is based on average shares outstanding. |
| (f)
|
Ratios do
not reflect reductions from fees paid indirectly, if applicable. |
| (g)
|
The per
share amount varies from the net realized and unrealized gain/loss for the period because of the timing of sales of fund shares and the per share amount of realized and unrealized gains and losses at such time. |
| (r)
|
Certain
expenses have been reduced without which performance would have been lower. |
| (s)
|
From time
to time the fund may receive proceeds from litigation settlements, without which performance would be lower. |
| (t)
|
Total
returns do not include any applicable sales charges. |
| (w)
|
Per share
amount was less than $0.01. |
| (x)
|
The
net asset values and total returns have been calculated on net assets which include adjustments made in accordance with U.S. generally accepted accounting principles required at period end for financial reporting purposes. |
See Notes to Financial Statements
Notes to Financial
Statements
(1) Business and Organization
MFS Mid Cap Growth Fund (the fund) is a diversified series of
MFS Series Trust IV (the trust). The trust is organized as a Massachusetts business trust and is registered under the Investment Company Act of 1940, as amended, as an open-end management investment company.
The fund is an investment company and accordingly follows the
investment company accounting and reporting guidance of the Financial Accounting Standards Board (FASB) Accounting Standards Codification Topic 946 Financial Services - Investment Companies.
(2) Significant Accounting Policies
General — The preparation
of financial statements in conformity with U.S. generally accepted accounting principles requires management to make estimates and assumptions that affect the reported amounts of assets and liabilities, and disclosure of contingent assets and
liabilities at the date of the financial statements and the reported amounts of increases and decreases in net assets from operations during the reporting period. Actual results could differ from those estimates. In the preparation of these
financial statements, management has evaluated subsequent events occurring after the date of the fund’s Statement of Assets and Liabilities through the date that the financial statements were issued.
Certain of the fund's investments, including its investments in
derivatives, as well as any debt issued by the fund and other contractual arrangements of the fund may be based on reference interest rates such as the London Interbank Offered Rate (“LIBOR”). In 2017, the regulatory authority that
oversees financial services firms in the United Kingdom announced plans to transition away from LIBOR by the end of 2021. In March 2021, the administrator of LIBOR announced the extension of the publication of the more commonly used U.S. dollar
LIBOR settings to the end of June 2023. Although the full impacts of the transition away from LIBOR are not fully known, the transition may result in, among other things, an increase in volatility or illiquidity of the markets for instruments that
currently rely on LIBOR to determine interest rates and this could have an adverse impact on the fund's performance. With respect to the fund's accounting for investments, including its investments in derivatives, as well as any debt issued by the
fund and other contractual arrangements of the fund that undergo reference rate-related modifications as a result of the transition, management will rely upon the relief provided by FASB Codification Topic 848 – Reference Rate Reform (Topic
848). The guidance in Topic 848 permits the fund to disregard the GAAP accounting requirements around certain contract modifications resulting from the LIBOR transition such that for contracts considered in scope, the fund can account for those
modified contracts as a continuation of the existing contracts.
Balance Sheet Offsetting
— The fund's accounting policy with respect to balance sheet offsetting is that, absent an event of default by the counterparty or a termination of the agreement, the International Swaps and Derivatives Association (ISDA) Master Agreement, or
similar agreement, does not result in an offset of reported amounts of financial assets and financial liabilities in the Statement of Assets and Liabilities across transactions between the fund and the applicable counterparty. The fund's right to
setoff may be restricted or prohibited by the bankruptcy or insolvency laws of the particular jurisdiction to which a specific master netting agreement counterparty is
Notes to Financial
Statements - continued
subject. Balance sheet offsetting disclosures, to the extent applicable to the
fund, have been included in the fund’s Significant Accounting Policies note under the captions for each of the fund’s in-scope financial instruments and transactions.
Investment Valuations
— Equity securities, including restricted equity securities, are generally valued at the last sale or official closing price on their primary market or exchange as provided by a third-party pricing
service. Equity securities, for which there were no sales reported that day, are generally valued at the last quoted daily bid quotation on their primary market or exchange as provided by a third-party pricing service. Short-term instruments with a maturity at issuance of 60 days or less may be valued at amortized cost, which approximates market value. Open-end investment companies are
generally valued at net asset value per share. Securities and other assets generally valued on the basis of information from a third-party pricing service may also be valued at a broker/dealer bid
quotation. In determining values, third-party pricing services can utilize both transaction data and market information such as yield, quality, coupon rate, maturity, type of issue, trading characteristics,
and other market data. The values of foreign securities and other assets and liabilities expressed in foreign currencies are converted to U.S. dollars using the mean of bid and asked prices for rates provided
by a third-party pricing service.
The Board of
Trustees has delegated primary responsibility for determining or causing to be determined the value of the fund’s investments (including any fair valuation) to the adviser pursuant to valuation policies and procedures approved by the Board. If
the adviser determines that reliable market quotations are not readily available, investments are valued at fair value as determined in good faith by the adviser in accordance with such procedures under the oversight of the Board of Trustees. Under
the fund’s valuation policies and procedures, market quotations are not considered to be readily available for most types of debt instruments and floating rate loans and many types of derivatives. These investments are generally valued at fair
value based on information from third-party pricing services. In addition, investments may be valued at fair value if the adviser determines that an investment’s value has been materially affected by events occurring after the close of the
exchange or market on which the investment is principally traded (such as foreign exchange or market) and prior to the determination of the fund’s net asset value, or after the halt of trading of a specific security where trading does not
resume prior to the close of the exchange or market on which the security is principally traded. Events that occur after foreign markets close (such as developments in foreign markets and significant movements in the U.S. markets) and prior to the
determination of the fund’s net asset value may be deemed to have a material effect on the value of securities traded in foreign markets. Accordingly, the fund’s foreign equity securities may often be valued at fair value. The adviser
generally relies on third-party pricing services or other information (such as the correlation with price movements of similar securities in the same or other markets; the type, cost and investment characteristics of the security; the business and
financial condition of the issuer; and trading and other market data) to assist in determining whether to fair value and at what value to fair value an investment. The value of an investment for purposes of calculating the fund’s net asset
value can differ depending on the source and method used to determine value. When fair valuation is used, the value of an investment used to determine the fund’s net asset value may differ from quoted or published prices for the same
investment. There can be no assurance that the fund could obtain the fair value assigned to an investment if it were to sell the investment at the same time at which the fund determines its net asset value per share.
Notes to Financial
Statements - continued
Various inputs are used in determining the value of the fund's
assets or liabilities. These inputs are categorized into three broad levels. In certain cases, the inputs used to measure fair value may fall into different levels of the fair value hierarchy. In such cases, an investment's level within the fair
value hierarchy is based on the lowest level of input that is significant to the fair value measurement. The fund's assessment of the significance of a particular input to the fair value measurement in its entirety requires judgment, and considers
factors specific to the investment. Level 1 includes unadjusted quoted prices in active markets for identical assets or liabilities. Level 2 includes other significant observable market-based inputs (including quoted prices for similar securities,
interest rates, prepayment speed, and credit risk). Level 3 includes unobservable inputs, which may include the adviser's own assumptions in determining the fair value of investments. The following is a summary of the levels used as of August 31,
2021 in valuing the fund's assets or liabilities:
| Financial
Instruments |
Level
1 |
Level
2 |
Level
3 |
Total
|
| Equity
Securities: |
|
|
|
|
| United
States |
$14,137,012,022
|
$—
|
$5,135,763
|
$14,142,147,785
|
| Israel
|
354,666,486
|
—
|
—
|
354,666,486
|
| Netherlands
|
349,848,613
|
—
|
—
|
349,848,613
|
| United
Kingdom |
315,481,242
|
—
|
—
|
315,481,242
|
| Canada
|
308,296,994
|
—
|
—
|
308,296,994
|
| Ireland
|
256,020,143
|
—
|
—
|
256,020,143
|
| Denmark
|
88,956,343
|
—
|
—
|
88,956,343
|
| Mutual
Funds |
199,633,261
|
—
|
—
|
199,633,261
|
| Total
|
$16,009,915,104
|
$—
|
$5,135,763
|
$16,015,050,867
|
For further information regarding
security characteristics, see the Portfolio of Investments.
The following is a reconciliation of level 3 assets for which
significant unobservable inputs were used to determine fair value. The table presents the activity of level 3 securities held at the beginning and the end of the period.
| |
Equity
Securities |
| Balance
as of 8/31/20 |
$—
|
| Purchases
|
5,135,763
|
| Balance
as of 8/31/21 |
$5,135,763
|
At August 31, 2021, the fund held
one level 3 security.
Foreign Currency Translation — Purchases and sales of foreign investments, income, and expenses are converted into U.S. dollars based upon currency exchange rates prevailing on the respective dates of such transactions or on the reporting
date for foreign denominated receivables and payables. Gains and losses attributable to foreign currency exchange rates on sales of securities are recorded for financial statement purposes as net realized gains and losses on investments. Gains and
losses attributable to foreign exchange rate movements on receivables, payables, income and expenses are recorded for financial statement purposes as foreign currency transaction gains and losses. That portion of both realized and unrealized gains
and losses on investments that results from fluctuations in foreign currency exchange rates is not separately disclosed.
Notes to Financial
Statements - continued
Security Loans — Under
its Securities Lending Agency Agreement with the fund, JPMorgan Chase and Co., as lending agent, loans the securities of the fund to certain qualified institutions (the “Borrowers”) approved by the fund. Security loans can be terminated
at the discretion of either the lending agent or the fund and the related securities must be returned within the earlier of the standard trade settlement period for such securities or within three business days. The loans are collateralized by cash
and/or U.S. Treasury and federal agency obligations in an amount typically at least equal to the market value of the securities loaned. On loans collateralized by cash, the cash collateral is invested in a money market fund. The market value of the
loaned securities is determined at the close of business of the fund and any additional required collateral is delivered to the fund on the next business day. The lending agent provides the fund with indemnification against Borrower default. In the
event of Borrower default, the lending agent will, for the benefit of the fund, either purchase securities identical to those loaned or, when such purchase is commercially impracticable, pay the fund the market value of the loaned securities. In
return, the lending agent assumes the fund's rights to the related collateral. If the collateral value is less than the cost to purchase identical securities, the lending agent is responsible for the shortfall, but only to the extent that such
shortfall is not due to a decline in collateral value resulting from collateral reinvestment for which the fund bears the risk of loss. At period end, the fund had investment securities on loan, all of which were classified as equity securities in
the fund's Portfolio of Investments, with a fair value of $8,502,334. The fair value of the fund's investment securities on loan and a related liability of $6,839,177 for cash collateral received on securities loaned are both presented gross in the
Statement of Assets and Liabilities. Additionally, these loans were collateralized by U.S. Treasury Obligations of $1,719,847 held by the lending agent. The collateral on securities loaned exceeded the value of securities on loan at period end. The
liability for cash collateral for securities loaned is carried at fair value, which is categorized as level 2 within the fair value hierarchy. A portion of the income generated upon investment of the collateral is remitted to the Borrowers, and the
remainder is allocated between the fund and the lending agent. On loans collateralized by U.S. Treasury and/or federal agency obligations, a fee is received from the Borrower, and is allocated between the fund and the lending agent. Income from
securities lending is separately reported in the Statement of Operations. The dividend and interest income earned on the securities loaned is accounted for in the same manner as other dividend and interest income.
Indemnifications — Under
the fund's organizational documents, its officers and Trustees may be indemnified against certain liabilities and expenses arising out of the performance of their duties to the fund. Additionally, in the normal course of business, the fund enters
into agreements with service providers that may contain indemnification clauses. The fund's maximum exposure under these agreements is unknown as this would involve future claims that may be made against the fund that have not yet
occurred.
Investment Transactions and Income — Investment transactions are recorded on the trade date. Dividends received in cash are recorded on the ex-dividend date. Certain dividends from foreign securities will be
recorded when the fund is informed of the dividend if such information is obtained subsequent to the ex-dividend date. Dividend payments received in additional securities are recorded on the ex-dividend date in an amount equal to the value of the
security on such date.
Notes to Financial
Statements - continued
The fund may receive proceeds from litigation settlements. Any
proceeds received from litigation involving portfolio holdings are reflected in the Statement of Operations in realized gain/loss if the security has been disposed of by the fund or in unrealized gain/loss if the security is still held by the fund.
Any other proceeds from litigation not related to portfolio holdings are reflected as other income in the Statement of Operations.
Fees Paid Indirectly —
The fund's custody fee may be reduced by a credit earned under an arrangement that measures the value of U.S. dollars deposited with the custodian by the fund. The amount of the credit, for the year ended August 31, 2021, is shown as a reduction of
total expenses in the Statement of Operations.
Tax
Matters and Distributions — The fund intends to qualify as a regulated investment company, as defined under Subchapter M of the Internal Revenue Code, and to distribute all of its taxable income, including
realized capital gains. As a result, no provision for federal income tax is required. The fund’s federal tax returns, when filed, will remain subject to examination by the Internal Revenue Service for a three year period. Management has
analyzed the fund’s tax positions taken on federal and state tax returns for all open tax years and does not believe that there are any uncertain tax positions that require recognition of a tax liability. Foreign taxes, if any, have been
accrued by the fund in the accompanying financial statements in accordance with the applicable foreign tax law. Foreign income taxes may be withheld by certain countries in which the fund invests. Additionally, capital gains realized by the fund on
securities issued in or by certain foreign countries may be subject to capital gains tax imposed by those countries.
Distributions to shareholders are recorded on the ex-dividend
date. Income and capital gain distributions are determined in accordance with income tax regulations, which may differ from U.S. generally accepted accounting principles. Certain capital accounts in the financial statements are periodically adjusted
for permanent differences in order to reflect their tax character. These adjustments have no impact on net assets or net asset value per share. Temporary differences which arise from recognizing certain items of income, expense, gain or loss in
different periods for financial statement and tax purposes will reverse at some time in the future.
Book/tax differences primarily relate to net operating losses,
passive foreign investment companies, wash sale loss deferrals, treating a portion of the proceeds from redemptions as a distribution for tax purposes, and redemptions in-kind.
The tax character of distributions declared to shareholders for
the last two fiscal years is as follows:
| |
Year
ended
8/31/21 |
Year
ended
8/31/20 |
| Long-term
capital gains |
$110,534,296
|
$64,368,451
|
Notes to Financial
Statements - continued
The federal tax cost and the tax basis components of
distributable earnings were as follows:
| As
of 8/31/21 |
|
| Cost
of investments |
$9,153,464,533
|
| Gross
appreciation |
6,903,391,402
|
| Gross
depreciation |
(41,805,068)
|
| Net
unrealized appreciation (depreciation) |
$6,861,586,334
|
| Undistributed
long-term capital gain |
455,671,303
|
| Late
year ordinary loss deferral |
(24,377,143)
|
| Other
temporary differences |
11,738
|
| Total
distributable earnings (loss) |
$7,292,892,232
|
Multiple Classes of Shares of
Beneficial Interest — The fund offers multiple classes of shares, which differ in their respective distribution, service, and program manager fees. The fund's income, realized and unrealized gain (loss), and
common expenses are allocated to shareholders based on the daily net assets of each class. Dividends are declared separately for each class. Differences in per share dividend rates are generally due to differences in separate class expenses. Class B
and Class C shares will convert to Class A shares approximately eight years after purchase. Class 529B and Class 529C shares will convert to Class 529A shares approximately eight years after purchase. The fund’s distributions declared to
shareholders as reported in the Statements of Changes in Net Assets are presented by class as follows:
| |
Year
ended
8/31/21 |
Year
ended
8/31/20 |
| Class
A |
$14,608,056
|
$9,859,800
|
| Class
B |
199,879
|
192,285
|
| Class
C |
1,338,598
|
934,695
|
| Class
I |
37,451,688
|
18,997,911
|
| Class
R1 |
44,908
|
44,903
|
| Class
R2 |
158,195
|
100,054
|
| Class
R3 |
4,810,101
|
2,828,218
|
| Class
R4 |
2,303,508
|
1,671,984
|
| Class
R6 |
49,446,575
|
29,619,366
|
| Class
529A |
140,412
|
90,325
|
| Class
529B |
4,840
|
3,816
|
| Class
529C |
27,536
|
25,094
|
| Total
|
$110,534,296
|
$64,368,451
|
Notes to Financial
Statements - continued
(3) Transactions with Affiliates
Investment Adviser — The
fund has an investment advisory agreement with MFS to provide overall investment management and related administrative services and facilities to the fund. For the period from September 1, 2020 through July
31, 2021, the management fee was computed daily and paid monthly at the following annual rates based on the fund's average daily net assets:
| Up
to $1 billion |
0.75%
|
| In
excess of $1 billion and up to $2.5 billion |
0.70%
|
| In
excess of $2.5 billion and up to $5 billion |
0.65%
|
| In
excess of $5 billion and up to $10 billion |
0.62%
|
| In
excess of $10 billion |
0.60%
|
Effective August 1, 2021, the
management fee is computed daily and paid monthly at the following annual rates based on the fund's average daily net assets:
| Up
to $1 billion |
0.75%
|
| In
excess of $1 billion and up to $2.5 billion |
0.70%
|
| In
excess of $2.5 billion and up to $5 billion |
0.65%
|
| In
excess of $5 billion and up to $10 billion |
0.62%
|
| In
excess of $10 billion and up to $20 billion |
0.60%
|
| In
excess of $20 billion |
0.55%
|
MFS has agreed in writing to reduce
its management fee by a specified amount if certain MFS mutual fund assets exceed thresholds agreed to by MFS and the fund's Board of Trustees. For the year ended August 31, 2021, this management fee reduction amounted to $1,643,675, which is
included in the reduction of total expenses in the Statement of Operations. The management fee incurred for the year ended August 31, 2021 was equivalent to an annual effective rate of 0.63% of the fund's average daily net assets.
The investment adviser has agreed in writing to pay a portion
of the fund’s total annual operating expenses, excluding interest, taxes, extraordinary expenses, brokerage and transaction costs, and investment-related expenses, such that total fund operating expenses do not exceed the following rates
annually of each class’s average daily net assets:
| Classes
|
| A
|
B
|
C
|
I
|
R1
|
R2
|
R3
|
R4
|
R6
|
529A
|
529B
|
529C
|
| 1.30%
|
2.05%
|
2.05%
|
1.05%
|
2.05%
|
1.55%
|
1.30%
|
1.05%
|
0.95%
|
1.35%
|
2.10%
|
2.10%
|
This written agreement will continue
until modified by the fund’s Board of Trustees, but such agreement will continue at least until December 31, 2022. For the year ended August 31, 2021, the fund’s actual operating expenses did not exceed the limit and therefore, the
investment adviser did not pay any portion of the fund’s expenses related to this agreement.
Distributor — MFS Fund
Distributors, Inc. (MFD), a wholly-owned subsidiary of MFS, as distributor, received $561,040 and $10,017 for the year ended August 31, 2021, as its portion of the initial sales charge on sales of Class A and Class 529A shares of the fund,
respectively.
Notes to Financial
Statements - continued
The Board of Trustees has adopted a distribution plan for
certain share classes pursuant to Rule 12b-1 of the Investment Company Act of 1940.
The fund's distribution plan provides that the fund will pay
MFD for services provided by MFD and financial intermediaries in connection with the distribution and servicing of certain share classes. One component of the plan is a distribution fee paid to MFD and another component of the plan is a service fee
paid to MFD. MFD may subsequently pay all, or a portion, of the distribution and/or service fees to financial intermediaries.
Distribution Plan Fee Table:
| |
Distribution
Fee Rate (d) |
Service
Fee Rate (d) |
Total
Distribution
Plan (d) |
Annual
Effective
Rate (e) |
Distribution
and Service
Fee |
| Class
A |
—
|
0.25%
|
0.25%
|
0.25%
|
$
4,523,056 |
| Class
B |
0.75%
|
0.25%
|
1.00%
|
1.00%
|
179,894
|
| Class
C |
0.75%
|
0.25%
|
1.00%
|
1.00%
|
1,224,897
|
| Class
R1 |
0.75%
|
0.25%
|
1.00%
|
1.00%
|
43,488
|
| Class
R2 |
0.25%
|
0.25%
|
0.50%
|
0.50%
|
117,149
|
| Class
R3 |
—
|
0.25%
|
0.25%
|
0.25%
|
1,572,490
|
| Class
529A |
—
|
0.25%
|
0.25%
|
0.22%
|
43,685
|
| Class
529B |
0.75%
|
0.25%
|
1.00%
|
0.37%
|
1,574
|
| Class
529C |
0.75%
|
0.25%
|
1.00%
|
0.98%
|
20,890
|
| Total
Distribution and Service Fees |
|
|
|
|
$7,727,123
|
| (d)
|
In
accordance with the distribution plan for certain classes, the fund pays distribution and/or service fees equal to these annual percentage rates of each class’s average daily net assets. The distribution and service fee rates disclosed by
class represent the current rates in effect at the end of the reporting period. Any rate changes, if applicable, are detailed below. |
| (e)
|
The
annual effective rates represent actual fees incurred under the distribution plan for the year ended August 31, 2021 based on each class's average daily net assets. MFD has voluntarily agreed to rebate a portion of each class's 0.25% service fee
attributable to accounts for which there is no financial intermediary specified on the account except for accounts attributable to MFS or its affiliates' seed money. For the year ended August 31, 2021, this rebate amounted to $2,197, $57, $27,
$4,524, and $305 for Class A, Class B, Class C, Class 529A, and Class 529C, respectively, and is included in the reduction of total expenses in the Statement of Operations. For the period from November 1, 2020 through August 31, 2021, the 0.75%
distribution fee was not imposed for Class 529B shares due to the sales charge limitations contained in Financial Industry Regulatory Authority (“FINRA”) Rule 2341. |
Certain Class A shares are subject to a contingent deferred
sales charge (CDSC) in the event of a shareholder redemption within 18 months of purchase. Class B and Class 529B shares are subject to a CDSC in the event of a shareholder redemption within six
Notes to Financial
Statements - continued
years of purchase. Class C and Class 529C shares are subject to a CDSC in the
event of a shareholder redemption within 12 months of purchase. All contingent deferred sales charges are paid to MFD and during the year ended August 31, 2021, were as follows:
| |
Amount
|
| Class
A |
$25,920
|
| Class
B |
8,621
|
| Class
C |
15,428
|
| Class
529B |
—
|
| Class
529C |
34
|
The fund has entered into and may
from time to time enter into contracts with program managers and other parties which administer the tuition programs through which an investment in the fund’s 529 share classes is made. The fund has entered into an agreement with MFD pursuant
to which MFD receives an annual fee of up to 0.05% of the average daily net assets attributable to each 529 share class. The services provided by MFD, or a third party with which MFD contracts, include recordkeeping and tax reporting and account
services, as well as services designed to maintain the program’s compliance with the Internal Revenue Code and other regulatory requirements. Program manager fees for the year ended August 31, 2021, were as follows:
| |
Fee
|
| Class
529A |
$8,737
|
| Class
529B |
215
|
| Class
529C |
1,043
|
| Total
Program Manager Fees |
$9,995
|
Shareholder Servicing Agent — MFS Service Center, Inc. (MFSC), a wholly-owned subsidiary of MFS, receives a fee from the fund for its services as shareholder servicing agent calculated as a percentage of the average daily net assets of the
fund as determined periodically under the supervision of the fund's Board of Trustees. For the year ended August 31, 2021, the fee was $513,446, which equated to 0.0037% annually of the fund's average daily net assets. MFSC also receives
reimbursement from the fund for out-of-pocket expenses, sub-accounting and other shareholder servicing costs which may be paid to affiliated and unaffiliated service providers. Class R6 shares do not incur sub-accounting fees. For the year ended
August 31, 2021, these out-of-pocket expenses, sub-accounting and other shareholder servicing costs amounted to $7,595,103.
Administrator — MFS
provides certain financial, legal, shareholder communications, compliance, and other administrative services to the fund. Under an administrative services agreement, the fund reimburses MFS the costs incurred to provide these services. The fund is
charged an annual fixed amount of $17,500 plus a fee based on average daily net assets. The administrative services fee incurred for the year ended August 31, 2021 was equivalent to an annual effective rate of 0.0040% of the fund's average daily net
assets.
Trustees’ and Officers’
Compensation — The fund pays compensation to independent Trustees in the form of a retainer, attendance fees, and additional compensation to Board and Committee chairpersons. The fund does not pay
Notes to Financial
Statements - continued
compensation directly to Trustees or officers of the fund who are also
officers of the investment adviser, all of whom receive remuneration from MFS for their services to the fund. Certain officers and Trustees of the fund are officers or directors of MFS, MFD, and MFSC.
Other — The fund invests
in the MFS Institutional Money Market Portfolio which is managed by MFS and seeks current income consistent with preservation of capital and liquidity. This money market fund does not pay a management fee to MFS but does incur investment and
operating costs.
The fund is permitted to engage
in purchase and sale transactions with funds and accounts for which MFS serves as investment adviser or sub-adviser (“cross-trades”) pursuant to a policy adopted by the Board of Trustees. This policy has been designed to ensure that
cross-trades conducted by the fund comply with Rule 17a-7 under the Investment Company Act of 1940. During the year ended August 31, 2021, the fund engaged in sale transactions pursuant to this policy, which amounted to $10,907,413. The sales
transactions resulted in net realized gains (losses) of $3,295,432.
The adviser has voluntarily undertaken to reimburse the fund
from its own resources on a quarterly basis for the cost of investment research embedded in the cost of the fund’s securities trades. This agreement may be rescinded at any time. For the year ended August 31, 2021, this reimbursement amounted
to $468,526, which is included in “Other” income in the Statement of Operations.
(4) Portfolio Securities
For the year ended August 31, 2021, purchases and sales of
investments, other than short-term obligations, aggregated $3,989,660,562 and $3,177,675,133, respectively.
Notes to Financial
Statements - continued
(5) Shares of Beneficial Interest
The fund's Declaration of Trust permits the Trustees to issue
an unlimited number of full and fractional shares of beneficial interest. Transactions in fund shares were as follows:
| |
Year
ended
8/31/21 |
|
Year
ended
8/31/20 |
| |
Shares
|
Amount
|
|
Shares
|
Amount
|
| Shares
sold |
|
|
|
|
|
| Class
A |
18,145,587
|
$498,726,808
|
|
19,150,294
|
$397,151,871
|
| Class
B |
32,143
|
687,093
|
|
40,035
|
659,617
|
| Class
C |
1,249,807
|
26,777,999
|
|
2,088,030
|
34,325,371
|
| Class
I |
53,459,598
|
1,549,619,016
|
|
118,050,630
|
2,647,030,965
|
| Class
R1 |
68,825
|
1,569,178
|
|
95,610
|
1,623,960
|
| Class
R2 |
611,002
|
15,913,080
|
|
320,112
|
6,206,067
|
| Class
R3 |
12,326,487
|
338,320,683
|
|
10,948,478
|
226,467,798
|
| Class
R4 |
6,035,785
|
177,359,062
|
|
3,758,366
|
81,341,594
|
| Class
R6 |
77,970,903
|
2,330,624,202
|
|
97,278,087
|
2,184,427,324
|
| Class
529A |
190,499
|
5,134,124
|
|
128,965
|
2,618,266
|
| Class
529B |
318
|
6,083
|
|
1,265
|
18,728
|
| Class
529C |
22,753
|
459,951
|
|
14,594
|
240,063
|
| |
170,113,707
|
$4,945,197,279
|
|
251,874,466
|
$5,582,111,624
|
Shares
issued to shareholders
in reinvestment of distributions |
|
|
|
|
|
| Class
A |
503,774
|
$13,541,450
|
|
440,258
|
$9,095,745
|
| Class
B |
9,180
|
198,566
|
|
11,391
|
191,132
|
| Class
C |
62,251
|
1,302,918
|
|
55,628
|
903,950
|
| Class
I |
1,266,483
|
36,360,734
|
|
835,859
|
18,388,907
|
| Class
R1 |
2,087
|
44,908
|
|
2,689
|
44,903
|
| Class
R2 |
6,253
|
157,065
|
|
4,761
|
92,224
|
| Class
R3 |
180,154
|
4,810,101
|
|
137,760
|
2,828,218
|
| Class
R4 |
80,098
|
2,245,140
|
|
75,746
|
1,627,032
|
| Class
R6 |
1,626,951
|
47,116,499
|
|
1,273,386
|
28,230,957
|
| Class
529A |
5,058
|
131,661
|
|
4,510
|
90,253
|
| Class
529B |
230
|
4,840
|
|
234
|
3,816
|
| Class
529C |
1,278
|
26,019
|
|
1,587
|
25,075
|
| |
3,743,797
|
$105,939,901
|
|
2,843,809
|
$61,522,212
|
Notes to Financial
Statements - continued
| |
Year
ended
8/31/21 |
|
Year
ended
8/31/20 |
| |
Shares
|
Amount
|
|
Shares
|
Amount
|
| Shares
reacquired |
|
|
|
|
|
| Class
A |
(11,916,673)
|
$(330,288,912)
|
|
(12,182,500)
|
$(250,900,560)
|
| Class
B |
(224,082)
|
(5,007,809)
|
|
(289,584)
|
(4,807,304)
|
| Class
C |
(1,436,286)
|
(31,034,335)
|
|
(1,406,988)
|
(22,690,262)
|
| Class
I |
(70,224,943)
|
(2,125,197,943)
|
|
(34,879,710)
|
(775,106,805)
|
| Class
R1 |
(73,894)
|
(1,621,997)
|
|
(98,817)
|
(1,558,161)
|
| Class
R2 |
(294,760)
|
(7,756,811)
|
|
(250,454)
|
(4,821,076)
|
| Class
R3 |
(6,383,310)
|
(176,284,383)
|
|
(4,567,435)
|
(93,853,569)
|
| Class
R4 |
(3,872,087)
|
(115,613,523)
|
|
(2,641,306)
|
(56,676,069)
|
| Class
R6 |
(46,868,226)
|
(1,404,422,796)
|
|
(38,173,178)
|
(859,598,802)
|
| Class
529A |
(72,945)
|
(2,012,645)
|
|
(54,306)
|
(1,084,906)
|
| Class
529B |
(2,881)
|
(62,354)
|
|
(3,034)
|
(46,375)
|
| Class
529C |
(61,131)
|
(1,296,960)
|
|
(46,093)
|
(743,799)
|
| |
(141,431,218)
|
$(4,200,600,468)
|
|
(94,593,405)
|
$(2,071,887,688)
|
| Net
change |
|
|
|
|
|
| Class
A |
6,732,688
|
$181,979,346
|
|
7,408,052
|
$155,347,056
|
| Class
B |
(182,759)
|
(4,122,150)
|
|
(238,158)
|
(3,956,555)
|
| Class
C |
(124,228)
|
(2,953,418)
|
|
736,670
|
12,539,059
|
| Class
I |
(15,498,862)
|
(539,218,193)
|
|
84,006,779
|
1,890,313,067
|
| Class
R1 |
(2,982)
|
(7,911)
|
|
(518)
|
110,702
|
| Class
R2 |
322,495
|
8,313,334
|
|
74,419
|
1,477,215
|
| Class
R3 |
6,123,331
|
166,846,401
|
|
6,518,803
|
135,442,447
|
| Class
R4 |
2,243,796
|
63,990,679
|
|
1,192,806
|
26,292,557
|
| Class
R6 |
32,729,628
|
973,317,905
|
|
60,378,295
|
1,353,059,479
|
| Class
529A |
122,612
|
3,253,140
|
|
79,169
|
1,623,613
|
| Class
529B |
(2,333)
|
(51,431)
|
|
(1,535)
|
(23,831)
|
| Class
529C |
(37,100)
|
(810,990)
|
|
(29,912)
|
(478,661)
|
| |
32,426,286
|
$850,536,712
|
|
160,124,870
|
$3,571,746,148
|
Effective June 1, 2019, purchases of
the fund’s Class B and Class 529B shares are closed to new and existing investors subject to certain exceptions. Please see the fund’s prospectus for details.
The fund is one of several mutual funds in which certain MFS
funds may invest. The MFS funds do not invest in the underlying funds for the purpose of exercising management or control. At the end of the period, the MFS Growth Allocation Fund, the MFS Moderate Allocation Fund, the MFS Aggressive Growth
Allocation Fund, and the MFS Conservative Allocation Fund were the owners of record of approximately 4%, 3%, 2%, and 1%, respectively, of the value of outstanding voting shares of the fund. In addition, the MFS Lifetime Income Fund, the MFS Lifetime
2020 Fund, the MFS Lifetime 2025 Fund, the MFS Lifetime 2030 Fund, the MFS Lifetime 2035 Fund,
Notes to Financial
Statements - continued
the MFS Lifetime 2040 Fund, the MFS Lifetime 2045 Fund, the MFS Lifetime 2050
Fund, the MFS Lifetime 2055 Fund, and the MFS Lifetime 2060 Fund were each the owners of record of less than 1% of the value of outstanding voting shares of the fund.
(6) Line of Credit
The fund and certain other funds managed by MFS participate in
a $1.25 billion unsecured committed line of credit of which $1 billion is reserved for use by the fund and certain other MFS U.S. funds. The line of credit is provided by a syndicate of banks under a credit agreement. Borrowings may be made for
temporary financing needs. Interest is charged to each fund, based on its borrowings, generally at a rate equal to the highest of one month LIBOR, the Federal Funds Effective Rate and the Overnight Bank Funding Rate, plus an agreed upon spread. A
commitment fee, based on the average daily, unused portion of the committed line of credit, is allocated among the participating funds. In addition, the fund and other funds managed by MFS have established unsecured uncommitted borrowing
arrangements with certain banks for temporary financing needs. Interest is charged to each fund, based on its borrowings, at rates equal to customary reference rates plus an agreed upon spread. For the year ended August 31, 2021, the fund’s
commitment fee and interest expense were $54,958 and $0, respectively, and are included in “Miscellaneous” expense in the Statement of Operations.
(7) Investments in Affiliated Issuers
An affiliated issuer may be considered one in which the fund
owns 5% or more of the outstanding voting securities, or a company which is under common control. For the purposes of this report, the following were affiliated issuers:
| Affiliated
Issuers |
Beginning
Value |
Purchases
|
Sales
Proceeds |
Realized
Gain
(Loss) |
Change
in
Unrealized
Appreciation or
Depreciation |
Ending
Value |
| MFS
Institutional Money Market Portfolio |
$321,141,622
|
$2,298,730,030
|
$2,427,077,567
|
$2,711
|
$(2,712)
|
$192,794,084
|
| Affiliated
Issuers |
Dividend
Income |
Capital
Gain
Distributions |
| MFS
Institutional Money Market Portfolio |
$140,402
|
$—
|
(8) Redemptions In-Kind
On October 12, 2020, the fund recorded a redemption in-kind of
portfolio securities and cash that was valued at $27,279,122. The redeeming shareholder generally receives a pro rata share of the securities held by the fund. The distribution of such securities generated a realized gain of $15,620,838 for the
fund, which is included in Net realized gain (loss) in the Statement of Operations. For tax purposes, no gains or losses were recognized with respect to the portfolio securities redeemed in-kind.
Notes to Financial
Statements - continued
(9) Impacts of COVID-19
The pandemic related to the global spread of novel coronavirus
disease (COVID-19), which was first detected in December 2019, has resulted in significant disruptions to global business activity and the global economy, as well as the economies of individual countries, the financial performance of individual
companies and sectors, and the securities and commodities markets in general. Multiple surges in cases globally, the availability and widespread adoption of vaccines, and the emergence of variant strains of the virus continue to create uncertainty
as to the future and long-term impacts resulting from the pandemic including impacts to the prices and liquidity of the fund's investments and the fund's performance.
Report of Independent
Registered Public Accounting Firm
To the Board of
Trustees of MFS Series Trust IV and the Shareholders of MFS Mid Cap Growth Fund:
Opinion on the Financial Statements and Financial
Highlights
We have audited the accompanying statement of
assets and liabilities of MFS Mid Cap Growth Fund (the “Fund”), including the portfolio of investments, as of August 31, 2021, the related statement of operations for the year then ended, the statements of changes in net assets for each
of the two years in the period then ended, the financial highlights for each of the five years in the period then ended, and the related notes. In our opinion, the financial statements and financial highlights present fairly, in all material
respects, the financial position of the Fund as of August 31, 2021, and the results of its operations for the year then ended, the changes in its net assets for each of the two years in the period then ended, and the financial highlights for each of
the five years in the period then ended, in conformity with accounting principles generally accepted in the United States of America.
Basis for Opinion
These financial statements and financial highlights are the
responsibility of the Fund’s management. Our responsibility is to express an opinion on the Fund's financial statements and financial highlights based on our audits. We are a public accounting firm registered with the Public Company Accounting
Oversight Board (United States) (PCAOB) and are required to be independent with respect to the Fund in accordance with the U.S. federal securities laws and the applicable rules and regulations of the Securities and Exchange Commission and the
PCAOB.
We conducted our audits in accordance with the
standards of the PCAOB. Those standards require that we plan and perform the audit to obtain reasonable assurance about whether the financial statements and financial highlights are free of material misstatement, whether due to error or fraud. The
Fund is not required to have, nor were we engaged to perform, an audit of its internal control over financial reporting. As part of our audits we are required to obtain an understanding of internal control over financial reporting but not for the
purpose of expressing an opinion on the effectiveness of the Fund's internal control over financial reporting. Accordingly, we express no such opinion.
Our audits included performing procedures to assess the risks
of material misstatement of the financial statements and financial highlights, whether due to error or fraud, and performing procedures that respond to those risks. Such procedures included examining, on a test basis, evidence regarding the amounts
and disclosures in the financial statements and financial highlights. Our audits also included evaluating the accounting principles used and significant estimates made by management, as well as evaluating the overall presentation of the financial
statements and financial highlights.
Report of Independent
Registered Public Accounting Firm – continued
Our procedures included confirmation of securities owned as of August 31,
2021, by correspondence with the custodian and brokers; when replies were not received from brokers, we performed other auditing procedures. We believe that our audits provide a reasonable basis for our opinion.
DELOITTE & TOUCHE LLP
Boston, Massachusetts
October 15, 2021
We have served as the auditor of one or more of the MFS
investment companies since 1924.
Trustees and
Officers — Identification and Background
The Trustees and Officers of the Trust, as of October 1, 2021,
are listed below, together with their principal occupations during the past five years. (Their titles may have varied during that period.) The address of each Trustee and Officer is 111 Huntington Avenue, Boston, Massachusetts 02199-7618.
| Name,
Age |
|
Position(s)
Held with Fund |
|
Trustee/Officer
Since(h) |
|
Number
of MFS Funds overseen by the Trustee |
|
Principal
Occupations During
the Past Five Years |
|
Other
Directorships During
the Past Five Years (j) |
| INTERESTED
TRUSTEES |
|
|
Robert
J. Manning (k)
(age 57) |
|
Trustee
|
|
February
2004 |
|
136
|
|
Massachusetts
Financial Services Company, Non-Executive Chairman (since January 2021); Director; Chairman of the Board; Executive Chairman (January 2017-2020); Co-Chief Executive Officer (2015-2016) |
|
N/A
|
Michael
W. Roberge (k)
(age 55) |
|
Trustee
|
|
January
2021 |
|
136
|
|
Massachusetts
Financial Services Company, Chairman (since January 2021); Chief Executive Officer (since January 2017); Director; President (until December 2018); Chief Investment Officer (until December 2018); Co-Chief Executive Officer (until December 2016)
|
|
N/A
|
| INDEPENDENT
TRUSTEES |
|
|
John
P. Kavanaugh
(age 66) |
|
Trustee
and Chair of Trustees |
|
January
2009 |
|
136
|
|
Private
investor |
|
N/A
|
Steven
E. Buller
(age 70) |
|
Trustee
|
|
February
2014 |
|
136
|
|
Private
investor |
|
N/A
|
John
A. Caroselli
(age 67) |
|
Trustee
|
|
March
2017 |
|
136
|
|
Private
investor; JC Global Advisors, LLC (management consulting), President (since 2015) |
|
N/A
|
Maureen
R. Goldfarb
(age 66) |
|
Trustee
|
|
January
2009 |
|
136
|
|
Private
investor |
|
N/A
|
Peter
D. Jones
(age 66) |
|
Trustee
|
|
January
2019 |
|
136
|
|
Private
investor |
|
N/A
|
Trustees and Officers -
continued
| Name,
Age |
|
Position(s)
Held with Fund |
|
Trustee/Officer
Since(h) |
|
Number
of MFS Funds overseen by the Trustee |
|
Principal
Occupations During
the Past Five Years |
|
Other
Directorships During
the Past Five Years (j) |
James
W. Kilman, Jr.
(age 60) |
|
Trustee
|
|
January
2019 |
|
136
|
|
Burford
Capital Limited (finance and investment management), Senior Advisor (since May 3, 2021), Chief Financial Officer (2019 - May 2, 2021); KielStrand Capital LLC (family office), Chief Executive Officer (since 2016); Morgan Stanley & Co. (financial
services), Vice Chairman of Investment Banking, Co-Head of Diversified Financials Coverage – Financial Institutions Investment Banking Group (until 2016) |
|
Alpha-En
Corporation, Director (2016-2019) |
Clarence
Otis, Jr.
(age 65) |
|
Trustee
|
|
March
2017 |
|
136
|
|
Private
investor |
|
VF
Corporation, Director; Verizon Communications, Inc., Director; The Travelers Companies, Director |
Maryanne
L. Roepke
(age 65) |
|
Trustee
|
|
May
2014 |
|
136
|
|
Private
investor |
|
N/A
|
Laurie
J. Thomsen
(age 64) |
|
Trustee
|
|
March
2005 |
|
136
|
|
Private
investor |
|
The
Travelers Companies, Director; Dycom Industries, Inc., Director |
| Name,
Age |
|
Position(s)
Held with
Fund |
|
Trustee/Officer
Since(h) |
|
Number
of MFS Funds for which the Person is an Officer |
|
Principal
Occupations During
the Past Five Years |
| OFFICERS
|
|
|
|
|
|
|
|
|
Christopher
R. Bohane (k)
(age 47) |
|
Assistant
Secretary and Assistant Clerk |
|
July
2005 |
|
136
|
|
Massachusetts
Financial Services Company, Senior Vice President and Associate General Counsel |
Kino
Clark (k)
(age 53) |
|
Assistant
Treasurer |
|
January
2012 |
|
136
|
|
Massachusetts
Financial Services Company, Vice President |
Trustees and Officers -
continued
| Name,
Age |
|
Position(s)
Held with
Fund |
|
Trustee/Officer
Since(h) |
|
Number
of MFS Funds for which the Person is an Officer |
|
Principal
Occupations During
the Past Five Years |
John
W. Clark, Jr. (k)
(age 54) |
|
Assistant
Treasurer |
|
April
2017 |
|
136
|
|
Massachusetts
Financial Services Company, Vice President (since March 2017); Deutsche Bank (financial services), Department Head - Treasurer's Office (until February 2017) |
Thomas
H. Connors (k)
(age 62) |
|
Assistant
Secretary and Assistant Clerk |
|
September
2012 |
|
136
|
|
Massachusetts
Financial Services Company, Vice President and Senior Counsel |
David
L. DiLorenzo (k)
(age 53) |
|
President
|
|
July
2005 |
|
136
|
|
Massachusetts
Financial Services Company, Senior Vice President |
Heidi
W. Hardin (k)
(age 54) |
|
Secretary
and Clerk |
|
April
2017 |
|
136
|
|
Massachusetts
Financial Services Company, Executive Vice President and General Counsel (since March 2017); Harris Associates (investment management), General Counsel (until January 2017) |
Brian
E. Langenfeld (k)
(age 48) |
|
Assistant
Secretary and Assistant Clerk |
|
June
2006 |
|
136
|
|
Massachusetts
Financial Services Company, Vice President and Senior Counsel |
Amanda
S. Mooradian (k)
(age 42) |
|
Assistant
Secretary and Assistant Clerk |
|
September
2018 |
|
136
|
|
Massachusetts
Financial Services Company, Assistant Vice President and Senior Counsel |
Susan
A. Pereira (k)
(age 50) |
|
Assistant
Secretary and Assistant Clerk |
|
July
2005 |
|
136
|
|
Massachusetts
Financial Services Company, Vice President and Assistant General Counsel |
Kasey
L. Phillips (k)
(age 50) |
|
Assistant
Treasurer |
|
September
2012 |
|
136
|
|
Massachusetts
Financial Services Company, Vice President |
Matthew
A. Stowe (k)
(age 46) |
|
Assistant
Secretary and Assistant Clerk |
|
October
2014 |
|
136
|
|
Massachusetts
Financial Services Company, Vice President and Assistant General Counsel |
Martin
J. Wolin (k)
(age 54) |
|
Chief
Compliance Officer |
|
July
2015 |
|
136
|
|
Massachusetts
Financial Services Company, Senior Vice President and Chief Compliance Officer |
Trustees and Officers -
continued
| Name,
Age |
|
Position(s)
Held with
Fund |
|
Trustee/Officer
Since(h) |
|
Number
of MFS Funds for which the Person is an Officer |
|
Principal
Occupations During
the Past Five Years |
James
O. Yost (k)
(age 61) |
|
Treasurer
|
|
September
1990 |
|
136
|
|
Massachusetts
Financial Services Company, Senior Vice President |
| (h)
|
Date
first appointed to serve as Trustee/Officer of an MFS Fund. Each Trustee has served continuously since appointment unless indicated otherwise. For the period from December 15, 2004 until February 22, 2005, Mr. Manning served as Advisory Trustee.
From January 2012 through December 2016, Messrs. DiLorenzo and Yost served as Treasurer and Deputy Treasurer of the Funds, respectively. |
| (j)
|
Directorships
or trusteeships of companies required to report to the Securities and Exchange Commission (i.e., “public companies”). |
| (k)
|
“Interested
person” of the Trust within the meaning of the Investment Company Act of 1940 (referred to as the 1940 Act), which is the principal federal law governing investment companies like the fund, as a result of a position with MFS. The address of
MFS is 111 Huntington Avenue, Boston, Massachusetts 02199-7618. |
Each Trustee (other than Messrs. Jones, Kilman and Roberge) has
been elected by shareholders and each Trustee and Officer holds office until his or her successor is chosen and qualified or until his or her earlier death, resignation, retirement or removal. Mr. Roberge became a Trustee of the Funds on January 1,
2021 and Messrs. Jones and Kilman became Trustees of the Funds on January 1, 2019. The Trust does not hold annual meetings for the purpose of electing Trustees, and Trustees are not elected for fixed terms. Under the terms of the Board's retirement
policy, an Independent Trustee shall retire at the end of the calendar year in which he or she reaches the earlier of 75 years of age or 15 years of service on the Board (or, in the case of any Independent Trustee who joined the Board prior to 2015,
20 years of service on the Board).
Messrs. Buller, Kilman
and Otis and Ms. Roepke are members of the Trust’s Audit Committee.
Each of the Interested Trustees and certain Officers hold
comparable officer positions with certain affiliates of MFS.
Trustees and Officers -
continued
The Statement of Additional Information for a Fund includes
further information about the Trustees and is available without charge upon request by calling 1-800-225-2606.
| Investment
Adviser |
Custodian
|
Massachusetts
Financial Services Company
111 Huntington Avenue
Boston, MA 02199-7618 |
JPMorgan
Chase Bank, NA
4 Metrotech Center
New York, NY 11245 |
| Distributor
|
Independent
Registered Public Accounting Firm |
MFS Fund
Distributors, Inc.
111 Huntington Avenue
Boston, MA 02199-7618 |
Deloitte
& Touche LLP
200 Berkeley Street
Boston, MA 02116 |
| Portfolio
Manager(s) |
|
Eric
Braz
Eric Fischman
Paul Gordon |
|
Board Review of Investment
Advisory Agreement
MFS Mid Cap Growth Fund
The Investment Company Act of 1940 requires that both the full
Board of Trustees and a majority of the non-interested (“independent”) Trustees, voting separately, annually approve the continuation of the Fund’s investment advisory agreement with MFS. The Trustees consider matters bearing on
the Fund and its advisory arrangements at their meetings throughout the year, including a review of performance data at each regular meeting. In addition, the independent Trustees met several times by videoconference (in accordance with Securities
and Exchange Commission relief) over the course of three months beginning in May and ending in July, 2021 (“contract review meetings”) for the specific purpose of considering whether to approve the continuation of the investment advisory
agreement for the Fund and the other investment companies that the Board oversees (the “MFS Funds”). The independent Trustees were assisted in their evaluation of the Fund’s investment advisory agreement by independent legal
counsel, from whom they received separate legal advice and with whom they met separately from MFS during various contract review meetings. The independent Trustees were also assisted in this process by an independent consultant who was retained by
and reported to the independent Trustees.
In connection
with their deliberations regarding the continuation of the investment advisory agreement, the Trustees, including the independent Trustees, considered such information and factors as they believed, in light of the legal advice furnished to them and
their own business judgment, to be relevant. The investment advisory agreement for the Fund was considered separately, although the Trustees also took into account the common interests of all MFS Funds in their review. As described below, the
Trustees considered the nature, quality, and extent of the various investment advisory, administrative, and shareholder services performed by MFS under the existing investment advisory agreement and other arrangements with the Fund.
In connection with their contract review meetings, the Trustees
received and relied upon materials that included, among other items: (i) information provided by Broadridge Financial Solutions, Inc. (“Broadridge”), an independent third party, on the investment performance of the Fund for various time
periods ended December 31, 2020 and the investment performance of a group of funds with substantially similar investment classifications/objectives (the “Broadridge performance universe”), (ii) information provided by Broadridge on the
Fund’s advisory fees and other expenses and the advisory fees and other expenses of comparable funds identified by Broadridge as well as all other funds in the same investment classification/category (the “Broadridge expense group and
universe”), (iii) information provided by MFS on the advisory fees of portfolios of other clients of MFS, including institutional separate accounts and other clients, (iv) information as to whether and to what extent applicable expense
waivers, reimbursements or fee “breakpoints” are observed for the Fund, (v) information regarding MFS’ financial results and financial condition, including MFS’ and certain of its affiliates’ estimated profitability
from services performed for the Fund and the MFS Funds as a whole, and compared to MFS’ institutional business, (vi) MFS’ views regarding the outlook for the mutual fund industry and the strategic business plans of MFS, (vii)
descriptions of various functions performed by MFS for the Funds, such as compliance monitoring and portfolio trading practices, and (viii)
Board Review of Investment
Advisory Agreement - continued
information regarding the overall organization of MFS, including information
about MFS’ senior management and other personnel providing investment advisory, administrative and other services to the Fund and the other MFS Funds. The comparative performance, fee and expense information prepared and provided by Broadridge
was not independently verified and the independent Trustees did not independently verify any information provided to them by MFS.
The Trustees’ conclusion as to the continuation of the
investment advisory agreement was based on a comprehensive consideration of all information provided to the Trustees and not the result of any single factor. Some of the factors that figured particularly in the Trustees’ deliberations are
described below, although individual Trustees may have evaluated the information presented differently from one another, giving different weights to various factors. It is also important to recognize that the fee arrangements for the Fund and other
MFS Funds are the result of years of review and discussion between the independent Trustees and MFS, that certain aspects of such arrangements may receive greater scrutiny in some years than in others, and that the Trustees’ conclusions may be
based, in part, on their consideration of these same arrangements during the course of the year and in prior years.
Based on information provided by Broadridge and MFS, the
Trustees reviewed the Fund’s total return investment performance as well as the Broadridge performance universe over various time periods. The Trustees placed particular emphasis on the total return performance of the Fund’s Class I
shares in comparison to the performance of funds in its Broadridge performance universe over the five-year period ended December 31, 2020, which the Trustees believed was a long enough period to reflect differing market conditions. The total return
performance of the Fund’s Class I shares was in the 2nd quintile relative to the other funds in the universe for this five-year period (the 1st quintile being the best performers and the 5th quintile being the worst performers). The total
return performance of the Fund’s Class I shares was in the 3rd quintile for the one-year period and the 2nd quintile for the three-year period ended December 31, 2020 relative to the Broadridge performance universe. Because of the passage of
time, these performance results may differ from the performance results for more recent periods, including those shown elsewhere in this report.
In the course of their deliberations, the Trustees took into
account information provided by MFS in connection with the contract review meetings, as well as during investment review meetings conducted with portfolio management personnel during the course of the year regarding the Fund’s performance.
After reviewing these and related factors, the Trustees concluded, within the context of their overall conclusions regarding the investment advisory agreement, that they were satisfied with MFS’ responses and efforts relating to investment
performance.
In assessing the reasonableness of the
Fund’s advisory fee, the Trustees considered, among other information, the Fund’s advisory fee and the total expense ratio of the Fund’s Class I shares as a percentage of average daily net assets and the advisory fee and total
expense ratios of the Broadridge expense group based on information provided by Broadridge. The Trustees considered that MFS currently observes an expense limitation for the Fund, which may not be changed without the Trustees’ approval. The
Trustees also considered that, according to the data provided by Broadridge (which takes into account any fee reductions or expense limitations that
Board Review of Investment
Advisory Agreement - continued
were in effect during the Fund’s last fiscal year), the Fund’s
effective advisory fee rate was lower than the Broadridge expense group median and the Fund’s total expense ratio was approximately at the Broadridge expense group median.
The Trustees also considered the advisory fees charged by MFS
to any institutional separate accounts advised by MFS (“separate accounts”) and unaffiliated investment companies for which MFS serves as subadviser (“subadvised funds”) that have comparable investment strategies to the Fund,
if any. In comparing these fees, the Trustees considered information provided by MFS as to the generally broader scope of services provided by MFS to the Fund, as well as the more extensive regulatory burdens imposed on MFS in managing the Fund, in
comparison to separate accounts and subadvised funds. The Trustees also considered the higher demands placed on MFS’ investment personnel and trading infrastructure as a result of the daily cash in-flows and out-flows of the Fund in comparison
to separate accounts.
The Trustees also considered
whether the Fund may benefit from any economies of scale in the management of the Fund in the event of growth in assets of the Fund and/or growth in assets of the MFS Funds as a whole. They noted that the Fund’s advisory fee rate schedule is
subject to contractual breakpoints that reduce the Fund’s advisory fee rate on average daily net assets over $1 billion, $2.5 billion, $5 billion, and $10 billion. They also noted that MFS has agreed to implement an additional contractual
breakpoint that reduces its advisory fee rate on the Fund’s average daily net assets over $20 billion effective August 1, 2021. The Trustees also noted that MFS has agreed in writing to waive a portion of the management fees of certain MFS
Funds, including the Fund, if the total combined assets of certain funds within the MFS Funds’ complex increase above agreed upon thresholds (the “group fee waiver”), enabling the Fund’s shareholders to share in the benefits
from any economies of scale at the complex level. The group fee waiver is reviewed and renewed annually between the Board and MFS. The Trustees concluded that the breakpoints and the group fee waiver were sufficient to allow the Fund to benefit from
economies of scale as its assets and overall complex assets grow.
The Trustees also considered information prepared by MFS
relating to MFS’ costs and profits with respect to the Fund, the MFS Funds considered as a group, and other investment companies and accounts advised by MFS, as well as MFS’ methodologies used to determine and allocate its costs to the
MFS Funds, the Fund and other accounts and products for purposes of estimating profitability.
After reviewing these and other factors described herein, the
Trustees concluded, within the context of their overall conclusions regarding the investment advisory agreement, that the advisory fees charged to the Fund represent reasonable compensation in light of the services being provided by MFS to the
Fund.
In addition, the Trustees considered MFS’
resources and related efforts to continue to retain, attract and motivate capable personnel to serve the Fund. The Trustees also considered current and developing conditions in the financial services industry, including the presence of large and
well-capitalized companies which are spending, and appear to be prepared to continue to spend, substantial sums to engage personnel and to provide services to competing investment companies. In this regard, the Trustees
Board Review of Investment
Advisory Agreement - continued
also considered the financial resources of MFS and its ultimate parent, Sun
Life Financial Inc. The Trustees also considered the advantages and possible disadvantages to the Fund of having an adviser that also serves other investment companies as well as other accounts.
The Trustees also considered the nature, quality, cost, and
extent of administrative, transfer agency, and distribution services provided to the Fund by MFS and its affiliates under agreements and plans other than the investment advisory agreement, including any 12b-1 fees the Fund pays to MFS Fund
Distributors, Inc., an affiliate of MFS. The Trustees also considered the nature, extent and quality of certain other services MFS performs or arranges for on the Fund’s behalf, which may include securities lending programs, directed expense
payment programs, class action recovery programs, and MFS’ interaction with third-party service providers, principally custodians and sub-custodians. The Trustees concluded that the various non-advisory services provided by MFS and its
affiliates on behalf of the Fund were satisfactory.
The
Trustees considered so-called “fall-out benefits” to MFS such as reputational value derived from serving as investment manager to the MFS Funds. The Trustees also considered that MFS discontinued its historic practice of obtaining
investment research from portfolio brokerage commissions paid by certain MFS Funds effective January 2018, and directly pays or voluntarily reimburses a Fund, if applicable, for the costs of external research acquired through the use of the
Fund’s portfolio brokerage commissions.
Based on
their evaluation of factors that they deemed to be material, including those factors described above, the Board of Trustees, including the independent Trustees, concluded that the Fund’s investment advisory agreement with MFS should be
continued for an additional one-year period, commencing August 1, 2021.
Statement Regarding
Liquidity Risk Management Program
The fund has adopted
and implemented a liquidity risk management program (the “Program”) as required by Rule 22e-4 under the Investment Company Act of 1940, as amended. The fund’s Board of Trustees (the “Board”) has designated MFS as the
administrator of the Program. The Program is reasonably designed to assess and manage the liquidity risk of the fund. Liquidity risk is the risk that the fund could not meet requests to redeem shares issued by the fund without significant dilution
of remaining investors' interests.
MFS provided a written
report to the Board for consideration at its April 2021 meeting that addressed the operation of the Program and provided an assessment of the adequacy and effectiveness of the Program during the period from January 1, 2020 to December 31, 2020 (the
“Covered Period”). The report concluded that during the Covered Period the Program had operated effectively and had adequately and effectively been implemented to assess and manage the fund’s liquidity risk. MFS also reported that
there were no liquidity events that impacted the fund or its ability to timely meet redemptions without dilution to existing shareholders during the Covered Period.
There can be no assurance that the Program will achieve its
objectives in the future. Further information on liquidity risk, and other principal risks to which an investment in the fund may be subject, can be found in the prospectus.
Proxy
Voting Policies and Information
MFS votes proxies on
behalf of the fund pursuant to proxy voting policies and procedures that are available without charge, upon request, by calling 1-800-225-2606, by visiting mfs.com/proxyvoting, or by visiting the SEC’s
Web site at http://www.sec.gov.
Information regarding how the fund voted proxies relating to
portfolio securities during the most recent twelve-month period ended June 30 is available by August 31 of each year without charge by visiting mfs.com/proxyvoting, or by visiting the SEC’s Web site at http://www.sec.gov.
Quarterly Portfolio Disclosure
The fund files a complete schedule of portfolio holdings with
the SEC for the first and third quarters of each fiscal year as an exhibit to its reports on Form N-PORT. The fund's Form N-PORT reports are available on the SEC's Web site at http://www.sec.gov. A
shareholder can obtain the portfolio holdings report for the first and third quarters of the fund's fiscal year at mfs.com/openendfunds by choosing the fund's name and then scrolling to the
“Resources” section and clicking on the “Prospectus and Reports” tab.
Further Information
From time to time, MFS may post important information about the
fund or the MFS Funds on the MFS Web site (mfs.com). This information is available at https://www.mfs.com/announcements or at
mfs.com/openendfunds by choosing the fund’s name and then scrolling to the “Resources” section and clicking on the “Announcements” tab, if any.
Information About Fund Contracts and Legal Claims
The fund has entered into contractual arrangements with an
investment adviser, administrator, distributor, shareholder servicing agent, 529 program manager (if applicable), and custodian who each provide services to the fund. Unless expressly stated otherwise, shareholders are not parties to, or intended
beneficiaries of these contractual arrangements, and these contractual arrangements are not intended to create any shareholder right to enforce them against the service providers or to seek any remedy under them against the service providers, either
directly or on behalf of the fund.
Under the
Trust’s By-Laws and Declaration of Trust, any claims asserted against or on behalf of the MFS Funds, including claims against Trustees and Officers, must be brought in state and federal courts located within the Commonwealth of
Massachusetts.
Federal Tax Information (unaudited)
The
fund will notify shareholders of amounts for use in preparing 2021 income tax forms in January 2022. The following information is provided pursuant to provisions of the Internal Revenue Code.
The fund designates $182,452,000 as capital gain dividends paid
during the fiscal year.
| FACTS
|
WHAT
DOES MFS DO WITH YOUR PERSONAL INFORMATION? |
| Why?
|
Financial
companies choose how they share your personal information. Federal law gives consumers the right to limit some but not all sharing. Federal law also requires us to tell you how we collect, share, and protect your personal information. Please read
this notice carefully to understand what we do. |
| What?
|
The types of
personal information we collect and share depend on the product or service you have with us. This information can include: |
| • Social
Security number and account balances |
| • Account
transactions and transaction history |
| • Checking
account information and wire transfer instructions |
| When
you are no longer our customer, we continue to share your information as described in this notice. |
| How?
|
All
financial companies need to share customers' personal information to run their everyday business. In the section below, we list the reasons financial companies can share their customers' personal information; the reasons MFS chooses to share; and
whether you can limit this sharing. |
Reasons
we can share your
personal information |
Does
MFS share? |
Can
you limit
this sharing? |
For
our everyday business purposes –
such as to process your transactions, maintain your
account(s), respond to court orders and legal
investigations, or report to credit bureaus |
Yes
|
No
|
For
our marketing purposes –
to offer our products and services to you |
No
|
We
don't share |
For
joint marketing with other
financial companies |
No
|
We
don't share |
For
our affiliates' everyday business purposes –
information about your transactions and experiences |
No
|
We
don't share |
For
our affiliates' everyday business purposes –
information about your creditworthiness |
No
|
We
don't share |
| For
nonaffiliates to market to you |
No
|
We
don't share |
| Questions?
|
Call
800-225-2606 or go to mfs.com. |
| Who
we are |
| Who
is providing this notice? |
MFS
Funds, MFS Investment Management, MFS Institutional Advisors, Inc., and MFS Heritage Trust Company. |
| What
we do |
How
does MFS
protect my personal
information? |
To
protect your personal information from unauthorized access and use, we use security measures that comply with federal law. These measures include procedural, electronic, and physical safeguards for the protection of the personal information we
collect about you. |
How
does MFS
collect my personal
information? |
We
collect your personal information, for example, when you |
| • open
an account or provide account information |
| • direct
us to buy securities or direct us to sell your securities |
| • make
a wire transfer |
| We
also collect your personal information from others, such as credit bureaus, affiliates, or other companies. |
| Why
can't I limit all sharing? |
Federal
law gives you the right to limit only |
| • sharing
for affiliates' everyday business purposes – information about your creditworthiness |
| • affiliates
from using your information to market to you |
| • sharing
for nonaffiliates to market to you |
| State
laws and individual companies may give you additional rights to limit sharing. |
| Definitions
|
| Affiliates
|
Companies
related by common ownership or control. They can be financial and nonfinancial companies. |
| •
MFS does not share personal information with affiliates, except for everyday business purposes as described on page one of this notice. |
| Nonaffiliates
|
Companies
not related by common ownership or control. They can be financial and nonfinancial companies. |
| •
MFS does not share with nonaffiliates so they can market to you. |
| Joint
marketing |
A
formal agreement between nonaffiliated financial companies that together market financial products or services to you. |
| •
MFS doesn't jointly market. |
| Other
important information |
| If
you own an MFS product or receive an MFS service in the name of a third party such as a bank or broker-dealer, their privacy policy may apply to you instead of ours. |
Save paper with eDelivery.
MFS® will send you prospectuses, reports, and proxies directly via e-mail so you will get information faster with less mailbox clutter.
To sign up:
1. Go to mfs.com.
2. Log in via MFS® Access.
3. Select eDelivery.
If you own your MFS fund shares through a financial institution
or a retirement plan, MFS® TALK, MFS® Access,
or eDelivery may not be available to you.
CONTACT
WEB SITE
mfs.com
MFS TALK
1-800-637-8255
24 hours a day
ACCOUNT SERVICE AND LITERATURE
Shareholders
1-800-225-2606
Financial advisors
1-800-343-2829
Retirement plan services
1-800-637-1255
MAILING ADDRESS
MFS Service Center, Inc.
P.O. Box 219341
Kansas City, MO 64121-9341
OVERNIGHT MAIL
MFS Service Center, Inc.
Suite 219341
430 W 7th Street
Kansas City, MO 64105-1407
Annual Report
August 31, 2021
MFS® U.S. Government
Money Market Fund
MFS® U.S. Government
Money Market Fund
|
1
|
|
2
|
|
3
|
|
4
|
|
6
|
|
8
|
|
9
|
|
10
|
|
11
|
|
12
|
|
18
|
|
20
|
|
24
|
|
28
|
|
28
|
|
28
|
|
28
|
|
28
|
|
29
|
The
report is prepared for the general information of shareholders. It is authorized for distribution to prospective investors only when preceded or accompanied by a current prospectus.
NOT FDIC INSURED • MAY LOSE VALUE
• NO BANK GUARANTEE
LETTER FROM THE CEO
Dear Shareholders:
After experiencing dramatic swings in the early days of the
coronavirus pandemic, global equity markets have performed strongly over the past year. Though the speedy development of vaccines brightened the economic and market outlook, uncertainty remains as new variants of the virus appear, and questions
persist over how fast vaccines can be made widely available in the developing world.
After having taken aggressive steps to
cushion the economic and market fallout related to the virus, some global central banks have begun to recalibrate monetary policy. For example, the U.S. Federal Reserve has signaled it will likely taper its bond buying program before the end of
2021, which has helped push up Treasury yields, and steepened the yield curve. Having passed a $1.9 trillion stimulus package in March, the U.S. Congress could approve additional stimulus later this year, some of it focused on infrastructure.
Production and transportation bottlenecks and labor shortages stemming from the pandemic have fueled a rise in inflation, though policymakers and investors think most of the price hikes will prove transitory.
Since midyear, the spread of the Delta variant of the
coronavirus has slowed economic growth while markets have focused on a regulatory crackdown in China, which, when coupled with stress in that country's property development sector, has contributed to a slowdown there. Tightening global energy and
raw materials supplies are a further concern for investors.
The policy measures put in place to counteract the pandemic's
effects have helped build a supportive environment and are encouraging economic recovery; however, if markets disconnect from fundamentals, they can sow the seeds of instability. As such, recent dramatic increases in speculative trading in
cryptocurrencies, special purpose acquisition companies (SPACs), and the like bear watching.
In the aftermath of the crisis, we could see societal changes
as households, businesses, and governments adjust to a new reality, and any such alterations could affect the investment landscape. For investors, events such as the COVID-19 outbreak demonstrate the importance of having a deep understanding of
company fundamentals, and we have built our global research platform to do just that.
At MFS®, we put our clients’ assets to work responsibly by carefully navigating the increasing complexity of global markets and economies. Guided by our
long-term philosophy and adhering to our commitment to sustainable investing, we tune out the noise and aim to uncover what we believe are the best, most durable investment opportunities in the market. Our unique global investment platform combines
collective expertise, long-term discipline, and thoughtful risk management to create sustainable value for investors.
Respectfully,
Michael W.
Roberge
Chief Executive Officer
MFS Investment Management
October 15, 2021
The opinions expressed in this letter are subject to change and
may not be relied upon for investment advice. No forecasts can be guaranteed.
Maturity breakdown (u)
| 0
- 7 days |
38.0%
|
| 8
- 29 days |
24.6%
|
| 30
- 59 days |
26.0%
|
| 60
- 89 days |
11.7%
|
| Other
Assets Less Liabilities |
(0.3)%
|
Composition including fixed income credit quality
(a)(u)
| A-1+
|
54.4%
|
| A-1
|
45.9%
|
| Other
Assets Less Liabilities |
(0.3)%
|
| (a)
|
Ratings
are assigned to portfolio securities utilizing ratings from Moody’s, Fitch, and Standard & Poor’s rating agencies and applying the following hierarchy: If all three agencies provide a rating, the middle rating (after dropping the
highest and lowest ratings) is assigned; if two of the three agencies rate a security, the lower of the two is assigned. Ratings are shown in the S&P scale. All ratings are subject to change. The fund did not hold unrated securities. The fund is
not rated by these agencies. |
| (u)
|
For purposes of this
presentation, accrued interest, where applicable, is included. |
Percentages are based on net assets as of August 31,
2021.
The portfolio is actively managed and current
holdings may be different.
Performance Summary THROUGH
8/31/21
Total returns as well as the current 7-day yield
have been provided for the applicable time periods. Performance results reflect the percentage change in net asset value, including the reinvestment of any dividends and capital gains distributions. (See Notes to Performance Summary.)
Performance data shown represents past performance and is no
guarantee of future results. You could lose money by investing in the fund. Although the fund seeks to preserve the value of your investment at $1.00 per share, it cannot guarantee it will do so. An investment in the fund is not insured or
guaranteed by the Federal Deposit Insurance Corporation or any other governmental agency. The fund’s sponsor has no legal obligation to provide financial support to the fund, and you should not expect the sponsor will provide financial support
to the fund at any time. The performance shown does not reflect the deduction of taxes, if any, that a shareholder would pay on fund distributions or the redemption of fund shares.
| Inception
|
1-Year
Total Return (without sales charge) |
Current
7-day yield |
| 12/19/75
|
0.00%
|
0.00%
|
Yields quoted are based on the
latest seven days ended as of August 31, 2021, with dividends annualized. The yield quotations more closely reflect the current earnings of the fund than the total return quotations. Shares of the fund can be purchased at net asset value without a
sales charge.
Certain shares of the fund acquired through
an exchange may be subject to a contingent deferred sales charge upon redemption depending on when the shares exchanged were originally purchased. See the notes to financial statements for more details.
Notes to Performance Summary
Performance results reflect any applicable expense subsidies,
waivers and adjustments in effect during the periods shown. Without such subsidies and waivers the fund’s performance results would be less favorable. Please see the prospectus and financial statements for complete details. All results are
historical and assume the reinvestment of any dividends and capital gain distributions.
Expense Table
Fund expenses borne by the shareholders during the period,
March 1, 2021 through August 31, 2021
As a shareholder
of the fund, you incur two types of costs: (1) transaction costs, including sales charges (loads) on certain purchase or redemption payments, and (2) ongoing costs, including management fees; and other fund expenses. This example is intended to help
you understand your ongoing costs (in dollars) of investing in the fund and to compare these costs with the ongoing costs of investing in other mutual funds.
The example is based on an investment of $1,000 invested at the
beginning of the period and held for the entire period March 1, 2021 through August 31, 2021.
Actual Expenses
The first line in the following table provides information
about actual account values and actual expenses. You may use the information in this line, together with the amount you invested, to estimate the expenses that you paid over the period. Simply divide your account value by $1,000 (for example, an
$8,600 account value divided by $1,000 = 8.6), then multiply the result by the number in the first line under the heading entitled “Expenses Paid During Period” to estimate the expenses you paid on your account during this period.
Hypothetical Example for Comparison Purposes
The second line of the following table provides information
about hypothetical account values and hypothetical expenses based on the fund’s actual expense ratio and an assumed rate of return of 5% per year before expenses, which is not the fund’s actual return. The hypothetical account values and
expenses may not be used to estimate the actual ending account balance or expenses you paid for the period. You may use this information to compare the ongoing costs of investing in the fund and other funds. To do so, compare this 5% hypothetical
example with the 5% hypothetical examples that appear in the shareholder reports of the other funds.
Please note that the expenses shown in the table are meant to
highlight your ongoing costs only and do not reflect any transactional costs, such as sales charges (loads). Therefore, the second line of the table is useful in comparing ongoing costs only, and will not help you determine the relative total costs
of owning different funds. In addition, if these transactional costs were included, your costs would have been higher.
Expense Table -
continued
| |
Annualized
Expense
Ratio |
Beginning
Account Value
3/01/21 |
Ending
Account Value
8/31/21 |
Expenses
Paid During
Period (p)
3/01/21-8/31/21 |
| Actual
|
0.03%
|
$1,000.00
|
$1,000.00
|
$0.15
|
| Hypothetical
(h) |
0.03%
|
$1,000.00
|
$1,025.05
|
$0.15
|
| (h)
|
5% fund return per year
before expenses. |
| (p)
|
“Expenses
Paid During Period” are equal to the fund's annualized expense ratio, as shown above, multiplied by the average account value over the period, multiplied by 184/365 (to reflect the one-half year period). Expenses paid do not include any
applicable sales charges (loads). If these transaction costs had been included, your costs would have been higher. |
Notes to Expense Table
As more fully disclosed in Note 3 in the Notes to Financial
Statements, the expense ratios reported above include additional expense reductions to avoid a negative yield.
Portfolio of
Investments
8/31/21
The Portfolio of Investments is a complete list of all
securities owned by your fund. It is categorized by broad-based asset classes.
| Issuer
|
|
|
Shares/Par
|
Value
($) |
| U.S.
Government Agencies and Equivalents (y) – 79.3% |
| Fannie
Mae, 0.001%, due 9/01/2021 |
|
$
8,044,000 |
$
8,044,000 |
| Fannie
Mae, 0.001%, due 9/08/2021 |
|
9,914,000 |
9,913,998 |
| Fannie
Mae, 0.007%, due 9/15/2021 |
|
4,629,000 |
4,628,987 |
| Fannie
Mae, 0.041%, due 9/22/2021 |
|
2,487,000 |
2,486,942 |
| Fannie
Mae, 0.03%, due 9/29/2021 |
|
7,653,000 |
7,652,821 |
| Fannie
Mae, 0.035%, due 11/03/2021 |
|
2,925,000 |
2,924,821 |
| Federal
Farm Credit Bank, 0.03%, due 9/10/2021 |
|
9,985,000 |
9,984,925 |
| Federal
Farm Credit Bank, 0.03%, due 10/01/2021 |
|
6,498,000 |
6,497,838 |
| Federal
Farm Credit Bank, 0.041%, due 11/08/2021 |
|
9,025,000 |
9,024,318 |
| Federal
Home Loan Bank, 0.02%, due 9/01/2021 |
|
2,818,000 |
2,818,000 |
| Federal
Home Loan Bank, 0.02%, due 9/03/2021 |
|
10,354,000
|
10,353,989 |
| Federal
Home Loan Bank, 0.018%, due 9/03/2021 |
|
3,500,000 |
3,499,997 |
| Federal
Home Loan Bank, 0.033%, due 9/15/2021 |
|
4,055,000 |
4,054,948 |
| Federal
Home Loan Bank, 0.03%, due 9/15/2021 |
|
3,744,000 |
3,743,956 |
| U.S.
Treasury Bill, 0.018%, due 9/02/2021 |
|
4,462,000 |
4,461,998 |
| U.S.
Treasury Bill, 0.041%, due 9/07/2021 |
|
19,661,000
|
19,660,869 |
| U.S.
Treasury Bill, 0.015%, due 9/09/2021 |
|
6,165,000 |
6,164,979 |
| U.S.
Treasury Bill, 0.035%, due 9/09/2021 |
|
2,000,000 |
1,999,984 |
| U.S.
Treasury Bill, 0.038%, due 9/09/2021 |
|
2,590,000 |
2,589,978 |
| U.S.
Treasury Bill, 0.035%, due 9/14/2021 |
|
2,878,000 |
2,877,964 |
| U.S.
Treasury Bill, 0.035%, due 9/16/2021 |
|
15,089,000
|
15,088,780 |
| U.S.
Treasury Bill, 0.041%, due 9/21/2021 |
|
5,514,000 |
5,513,877 |
| U.S.
Treasury Bill, 0.035%, due 9/28/2021 |
|
17,871,000
|
17,870,531 |
| U.S.
Treasury Bill, 0.041%, due 10/05/2021 |
|
10,895,000
|
10,894,588 |
| U.S.
Treasury Bill, 0.035%, due 10/07/2021 |
|
3,610,000 |
3,609,874 |
| U.S.
Treasury Bill, 0.046%, due 10/07/2021 |
|
5,117,000 |
5,116,770 |
| U.S.
Treasury Bill, 0.041%, due 10/12/2021 |
|
15,729,000
|
15,728,283 |
| U.S.
Treasury Bill, 0.042%, due 10/14/2021 |
|
11,475,000
|
11,474,438 |
| U.S.
Treasury Bill, 0.051%, due 10/19/2021 |
|
11,718,000
|
11,717,219 |
| U.S.
Treasury Bill, 0.042%, due 10/21/2021 |
|
8,179,000 |
8,178,534 |
| U.S.
Treasury Bill, 0.041%, due 10/26/2021 |
|
8,179,000 |
8,178,500 |
| U.S.
Treasury Bill, 0.046%, due 10/26/2021 |
|
8,074,000 |
8,073,445 |
| U.S.
Treasury Bill, 0.041%, due 11/02/2021 |
|
15,101,000
|
15,099,960 |
| U.S.
Treasury Bill, 0.056%, due 11/12/2021 |
|
9,384,000 |
9,382,968 |
| U.S.
Treasury Bill, 0.041%, due 11/16/2021 |
|
3,827,000 |
3,826,677 |
| Total
U.S. Government Agencies and Equivalents, at Amortized Cost and Value |
|
|
$273,139,756
|
Portfolio of
Investments – continued
| Issuer
|
|
|
Shares/Par
|
Value
($) |
| Repurchase
Agreements – 21.0% |
|
Bank
of America Corp. Repurchase Agreement, 0.05%,
dated 8/31/2021, due 9/01/2021, total to be received $36,125,050
(secured by U.S. Treasury and Federal Agency obligations valued at
$36,940,950) |
|
$
36,125,000 |
$
36,125,000 |
JPMorgan
Chase & Co. Repurchase Agreement, 0.05%,
dated 8/31/2021, due 9/01/2021, total to be received $36,147,050
(secured by U.S. Treasury and Federal Agency obligations valued at
$36,869,992) |
|
36,147,000
|
36,147,000 |
| Total
Repurchase Agreements, at Cost and Value |
|
|
|
$
72,272,000 |
| |
| |
| Other
Assets, Less Liabilities – (0.3)% |
|
|
(1,202,692) |
| Net
Assets – 100.0% |
|
|
$344,209,064
|
| (y)
|
The rate
shown represents an annualized yield at time of purchase. |
See Notes to Financial Statements
Financial Statements
Statement of Assets and Liabilities
At 8/31/21
This statement represents your fund’s balance sheet,
which details the assets and liabilities comprising the total value of the fund.
| Assets
|
|
| Investments
in unaffiliated issuers, at cost and value |
$273,139,756
|
| Investments
in unaffiliated repurchase agreements, at cost and value |
72,272,000
|
| Cash
|
97
|
| Receivables
for |
|
| Fund
shares sold |
448,127
|
| Interest
|
100
|
| Receivable
from investment adviser and distributor |
25,150
|
| Other
assets |
545
|
| Total
assets |
$345,885,775
|
| Liabilities
|
|
| Payables
for |
|
| Fund
shares reacquired |
$1,563,711
|
| Payable
to affiliates |
|
| Administrative
services fee |
306
|
| Shareholder
servicing costs |
48,499
|
| Payable
for independent Trustees' compensation |
1,755
|
| Accrued
expenses and other liabilities |
62,440
|
| Total
liabilities |
$1,676,711
|
| Net
assets |
$344,209,064
|
| Net
assets consist of |
|
| Paid-in
capital |
$344,172,099
|
| Total
distributable earnings (loss) |
36,965
|
| Net
assets |
$344,209,064
|
| Shares
of beneficial interest outstanding |
344,168,763
|
| Net
asset value per share (net assets of $344,209,064 / 344,168,763 shares of beneficial interest outstanding) |
$1.00
|
A contingent deferred sales charge
may be imposed on redemptions.
See Notes to Financial
Statements
Financial Statements
Statement of Operations
Year ended 8/31/21
This statement describes how much your fund earned in
investment income and accrued in expenses. It also describes any gains and/or losses generated by fund operations.
| Net
investment income (loss) |
|
| Income
|
|
| Interest
|
$247,298
|
| Other
|
2,251
|
| Total
investment income |
$249,549
|
| Expenses
|
|
| Management
fee |
$1,835,889
|
| Shareholder
servicing costs |
445,160
|
| Administrative
services fee |
69,358
|
| Independent
Trustees' compensation |
8,819
|
| Custodian
fee |
22,598
|
| Shareholder
communications |
11,965
|
| Audit
and tax fees |
39,817
|
| Legal
fees |
3,014
|
| Miscellaneous
|
95,152
|
| Total
expenses |
$2,531,772
|
| Fees
paid indirectly |
(22,598)
|
| Reduction
of expenses by investment adviser and distributor |
(2,259,625)
|
| Net
expenses |
$249,549
|
| Net
investment income (loss) |
$0
|
| Realized
gain (loss) (identified cost basis) |
|
| Unaffiliated
issuers |
$40,151
|
| Change
in net assets from operations |
$40,151
|
See Notes to Financial
Statements
Financial Statements
Statements of Changes in Net Assets
These statements describe the increases and/or decreases in
net assets resulting from operations, any distributions, and any shareholder transactions.
| |
Year
ended |
| |
8/31/21
|
8/31/20
|
| Change
in net assets |
|
|
| From
operations |
|
|
| Net
investment income (loss) |
$0
|
$1,868,799
|
| Net
realized gain (loss) |
40,151
|
100
|
| Change
in net assets from operations |
$40,151
|
$1,868,899
|
| Total
distributions to shareholders |
$—
|
$(1,868,799)
|
| Change
in net assets from fund share transactions |
$(174,481,934)
|
$214,851,860
|
| Total
change in net assets |
$(174,441,783)
|
$214,851,960
|
| Net
assets |
|
|
| At
beginning of period |
518,650,847
|
303,798,887
|
| At
end of period |
$344,209,064
|
$518,650,847
|
See Notes to Financial
Statements
Financial
Statements
Financial Highlights
The financial highlights table is intended to help you
understand the fund's financial performance for the past 5 years. Certain information reflects financial results for a single fund share. The total returns in the table represent the rate that an investor would have earned (or lost) on an investment
in the fund share class (assuming reinvestment of all distributions) held for the entire period.
| |
Year
ended |
| |
8/31/21
|
8/31/20
|
8/31/19
|
8/31/18
|
8/31/17
|
| Net
asset value, beginning of period |
$1.00
|
$1.00
|
$1.00
|
$1.00
|
$1.00
|
| Income
(loss) from investment operations |
| Net
investment income (loss) (d) |
$0.00
|
$0.00(w)
|
$0.02
|
$0.01
|
$0.00(c)(w)
|
| Net
realized and unrealized gain (loss) |
0.00(w)
|
0.01
|
0.00(w)
|
—
|
(0.00)(w)
|
| Total
from investment operations |
$0.00(w)
|
$0.01
|
$0.02
|
$0.01
|
$0.00(w)
|
| Less
distributions declared to shareholders |
| From
net investment income |
$—
|
$(0.01)
|
$(0.02)
|
$(0.01)
|
$(0.00)(w)
|
| Contribution
from adviser |
$—
|
$—
|
$—
|
$(0.00)(w)
|
$—
|
| Net
asset value, end of period |
$1.00
|
$1.00
|
$1.00
|
$1.00
|
$1.00
|
| Total
return (%) (r)(t) |
0.00
|
0.61
|
1.70
|
0.83
|
0.17(c)
|
Ratios
(%) (to average net assets)
and Supplemental data: |
| Expenses
before expense reductions (f) |
0.55
|
0.60
|
0.62
|
0.63
|
0.56(c)
|
| Expenses
after expense reductions (f) |
0.06
|
0.36
|
0.61
|
0.62
|
0.43(c)
|
| Net
investment income (loss) |
0.00
|
0.45
|
1.69
|
0.81
|
0.17(c)
|
| Net
assets at end of period (000 omitted) |
$344,209
|
$518,651
|
$303,799
|
$264,370
|
$307,591
|
| (c)
|
Amount
reflects a one-time reimbursement of expenses by the custodian (or former custodian) without which net investment income and performance would be lower and expenses would be higher. |
| (d)
|
Per share
data is based on average shares outstanding. |
| (f)
|
Ratios do
not reflect reductions from fees paid indirectly, if applicable. |
| (r)
|
Certain
expenses have been reduced without which performance would have been lower. |
| (t)
|
Total
returns do not include any applicable sales charges. |
| (w)
|
Per
share amount was less than $0.01 and total return or ratio was less than 0.01%, as applicable. |
See Notes to Financial Statements
Notes to Financial
Statements
(1) Business and Organization
MFS U.S. Government Money Market Fund (the fund) is a
diversified series of MFS Series Trust IV (the trust). The trust is organized as a Massachusetts business trust and is registered under the Investment Company Act of 1940, as amended, as an open-end management investment company.
The fund is an investment company and accordingly follows the
investment company accounting and reporting guidance of the Financial Accounting Standards Board (FASB) Accounting Standards Codification Topic 946 Financial Services - Investment Companies.
(2) Significant Accounting Policies
General — The preparation
of financial statements in conformity with U.S. generally accepted accounting principles requires management to make estimates and assumptions that affect the reported amounts of assets and liabilities, and disclosure of contingent assets and
liabilities at the date of the financial statements and the reported amounts of increases and decreases in net assets from operations during the reporting period. Actual results could differ from those estimates. In the preparation of these
financial statements, management has evaluated subsequent events occurring after the date of the fund’s Statement of Assets and Liabilities through the date that the financial statements were issued.
Certain of the fund's investments, including its investments in
derivatives, as well as any debt issued by the fund and other contractual arrangements of the fund may be based on reference interest rates such as the London Interbank Offered Rate (“LIBOR”). In 2017, the regulatory authority that
oversees financial services firms in the United Kingdom announced plans to transition away from LIBOR by the end of 2021. In March 2021, the administrator of LIBOR announced the extension of the publication of the more commonly used U.S. dollar
LIBOR settings to the end of June 2023. Although the full impacts of the transition away from LIBOR are not fully known, the transition may result in, among other things, an increase in volatility or illiquidity of the markets for instruments that
currently rely on LIBOR to determine interest rates and this could have an adverse impact on the fund's performance. With respect to the fund's accounting for investments, including its investments in derivatives, as well as any debt issued by the
fund and other contractual arrangements of the fund that undergo reference rate-related modifications as a result of the transition, management will rely upon the relief provided by FASB Codification Topic 848 – Reference Rate Reform (Topic
848). The guidance in Topic 848 permits the fund to disregard the GAAP accounting requirements around certain contract modifications resulting from the LIBOR transition such that for contracts considered in scope, the fund can account for those
modified contracts as a continuation of the existing contracts.
Balance Sheet Offsetting
— The fund's accounting policy with respect to balance sheet offsetting is that, absent an event of default by the counterparty or a termination of the agreement, the International Swaps and Derivatives Association (ISDA) Master Agreement, or
similar agreement, does not result in an offset of reported amounts of financial assets and financial liabilities in the Statement of Assets and Liabilities across transactions between the fund and the applicable counterparty. The fund's right to
setoff may be restricted or prohibited by the bankruptcy or insolvency laws of the particular jurisdiction to which a specific master netting agreement counterparty is
Notes to Financial
Statements - continued
subject. Balance sheet offsetting disclosures, to the extent applicable to the
fund, have been included in the fund’s Significant Accounting Policies note under the captions for each of the fund’s in-scope financial instruments and transactions.
Investment Valuations
— Pursuant to procedures approved by the Board of Trustees, investments held by the fund are generally valued at amortized cost, which approximates market value. Amortized cost involves valuing an
instrument at its cost as adjusted for amortization of premium or accretion of discount rather than its current market value. The amortized cost value of an instrument can be different from the market value of an instrument.
Various inputs are used in determining the value of the fund's
assets or liabilities. These inputs are categorized into three broad levels. In certain cases, the inputs used to measure fair value may fall into different levels of the fair value hierarchy. In such cases, an investment's level within the fair
value hierarchy is based on the lowest level of input that is significant to the fair value measurement. The fund's assessment of the significance of a particular input to the fair value measurement in its entirety requires judgment, and considers
factors specific to the investment. Level 1 includes unadjusted quoted prices in active markets for identical assets or liabilities. Level 2 includes other significant observable market-based inputs (including quoted prices for similar securities,
interest rates, prepayment speed, and credit risk). Level 3 includes unobservable inputs, which may include the adviser's own assumptions in determining the fair value of investments. The following is a summary of the levels used as of August 31,
2021 in valuing the fund's assets or liabilities:
| Financial
Instruments |
Level
1 |
Level
2 |
Level
3 |
Total
|
| Short-Term
Securities |
$—
|
$345,411,756
|
$—
|
$345,411,756
|
For further information regarding
security characteristics, see the Portfolio of Investments.
Repurchase Agreements —
The fund enters into repurchase agreements under the terms of Master Repurchase Agreements with approved counterparties. Each repurchase agreement is recorded at cost. The fund requires that the securities collateral in a repurchase transaction be
transferred to a custodian. The fund monitors, on a daily basis, the value of the collateral to ensure that its value, including accrued interest, is greater than amounts owed to the fund under each such repurchase agreement. Upon an event of
default under a Master Repurchase Agreement, the non-defaulting party may close out all transactions traded under such agreement and net amounts owed under each transaction to one net amount payable by one party to the other. Absent an event of
default, the Master Repurchase Agreement does not result in an offset of reported amounts of assets and liabilities in the Statement of Assets and Liabilities across transactions between the fund and the applicable counterparty. At August 31, 2021,
the fund had investments in repurchase agreements with a gross value of $72,272,000 in the Statement of Assets and Liabilities. The value of the related collateral exceeded the value of the repurchase agreements at period end.
Indemnifications — Under
the fund's organizational documents, its officers and Trustees may be indemnified against certain liabilities and expenses arising out of the performance of their duties to the fund. Additionally, in the normal course of business,
Notes to Financial
Statements - continued
the fund enters into agreements with service providers that may contain
indemnification clauses. The fund's maximum exposure under these agreements is unknown as this would involve future claims that may be made against the fund that have not yet occurred.
Investment Transactions and Income — Investment transactions are recorded on the trade date. Interest income is recorded on the accrual basis. All premium and
discount is amortized or accreted for financial statement purposes in accordance with U.S. generally accepted accounting principles.
Fees Paid Indirectly —
The fund’s custody fee may be reduced by credits earned under a previous arrangement that measured the value of U.S. dollars deposited with the custodian by the fund. The amount of the credits that were used to reduce the fund's custody fee
for the year ended August 31, 2021, is shown as a reduction of total expenses in the Statement of Operations.
Tax Matters and Distributions
— The fund intends to qualify as a regulated investment company, as defined under Subchapter M of the Internal Revenue Code, and to distribute all of its taxable income, including realized capital gains. As a
result, no provision for federal income tax is required. The fund’s federal tax returns, when filed, will remain subject to examination by the Internal Revenue Service for a three year period. Management has analyzed the fund’s tax
positions taken on federal and state tax returns for all open tax years and does not believe that there are any uncertain tax positions that require recognition of a tax liability.
Distributions to shareholders are recorded on the ex-dividend
date. Income and capital gain distributions are determined in accordance with income tax regulations, which may differ from U.S. generally accepted accounting principles. Certain capital accounts in the financial statements are periodically adjusted
for permanent differences in order to reflect their tax character. These adjustments have no impact on net assets or net asset value per share. Temporary differences which arise from recognizing certain items of income, expense, gain or loss in
different periods for financial statement and tax purposes will reverse at some time in the future.
During the year ended August 31, 2021, there were no
significant adjustments due to differences between book and tax accounting.
The tax character of distributions declared to shareholders for
the last two fiscal years is as follows:
| |
Year
ended
8/31/21 |
Year
ended
8/31/20 |
| Ordinary
income (including any short-term capital gains) |
$—
|
$1,868,799
|
The federal tax cost and the tax
basis components of distributable earnings were as follows:
| As
of 8/31/21 |
|
| Cost
of investments |
$345,411,756
|
| Undistributed
ordinary income |
38,684
|
| Other
temporary differences |
(1,719)
|
| Total
distributable earnings (loss) |
$
36,965 |
Notes to Financial
Statements - continued
(3) Transactions with Affiliates
Investment Adviser — The
fund has an investment advisory agreement with MFS to provide overall investment management and related administrative services and facilities to the fund. The management fee is computed daily and paid monthly at the following annual rates based on
the fund’s average daily net assets:
| Up
to $1 billion |
0.40%
|
| In
excess of $1 billion |
0.35%
|
During the year ended August 31,
2021, MFS voluntarily waived receipt of $1,732,608 of the fund’s management fee in order to avoid a negative yield. For the year ended August 31, 2021, this amount is included in the reduction of total expenses in the Statement of Operations.
MFS has also agreed in writing to reduce its management fee by a specified amount if certain MFS mutual fund assets exceed thresholds agreed to by MFS and the fund’s Board of Trustees. For the year ended August 31, 2021, this management fee
reduction amounted to $53,611, which is included in the reduction of total expenses in the Statement of Operations. For the year ended August 31, 2021, these waivers had the effect of reducing the management fee by 0.39% of average daily net assets
on an annualized basis. The management fee incurred for the year ended August 31, 2021 was equivalent to an annual effective rate of 0.01% of the fund’s average daily net assets.
In order to avoid a negative yield for the year ended August
31, 2021, MFS voluntarily agreed to reduce certain other expenses in the amount of $63,059, which is included in the reduction of total expenses in the Statement of Operations.
The investment adviser has agreed in writing to pay a portion
of the fund’s total annual operating expenses, excluding interest, taxes, extraordinary expenses, brokerage and transaction costs, and investment-related expenses, such that total fund operating expenses do not exceed 0.45% annually of the
fund’s average daily net assets. This written agreement will continue until modified by the fund’s Board of Trustees, but such agreement will continue at least until December 31, 2022. For the year ended August 31, 2021, this reduction
amounted to $410,347 which is included in the reduction of total expenses in the Statement of Operations.
Distributor — Certain
shares acquired through an exchange may be subject to a contingent deferred sales charge upon redemption depending on when the shares exchanged were originally purchased. Contingent deferred sales charges paid to MFS Distributors, Inc. (MFD) during
the year ended August 31, 2021 were $8,251.
Shareholder Servicing Agent
— MFS Service Center, Inc. (MFSC), a wholly-owned subsidiary of MFS, receives a fee from the fund for its services as shareholder servicing agent calculated as a percentage of the average daily net assets of the fund as determined periodically
under the supervision of the fund's Board of Trustees. For the year ended August 31, 2021, the fee was $180,038, which equated to 0.0392% annually of the fund's average daily net assets. MFSC also receives reimbursement from the fund for
out-of-pocket expenses, sub-accounting and other shareholder servicing costs which may be paid to affiliated and unaffiliated service providers. For the year ended August 31, 2021, these out-of-pocket expenses, sub-accounting and other shareholder
servicing costs amounted to $265,122.
Notes to Financial
Statements - continued
Administrator — MFS
provides certain financial, legal, shareholder communications, compliance, and other administrative services to the fund. Under an administrative services agreement, the fund reimburses MFS the costs incurred to provide these services. The fund is
charged an annual fixed amount of $17,500 plus a fee based on average daily net assets. The administrative services fee incurred for the year ended August 31, 2021 was equivalent to an annual effective rate of 0.0151% of the fund's average daily net
assets.
Trustees’ and Officers’
Compensation — The fund pays compensation to independent Trustees in the form of a retainer, attendance fees, and additional compensation to Board and Committee chairpersons. The fund does not pay compensation
directly to Trustees or officers of the fund who are also officers of the investment adviser, all of whom receive remuneration from MFS for their services to the fund. Certain officers and Trustees of the fund are officers or directors of MFS, MFD,
and MFSC.
Prior to December 31, 2001, the fund had
an unfunded defined benefit plan (“DB plan”) for independent Trustees. As of December 31, 2001, the Board took action to terminate the DB plan with respect to then-current and any future independent Trustees, such that the DB plan covers
only certain of those former independent Trustees who retired on or before December 31, 2001. The DB plan resulted in a pension expense of $726 and is included in “Independent Trustees’ compensation” in the Statement of Operations
for the year ended August 31, 2021. The liability for deferred retirement benefits payable to those former independent Trustees under the DB plan amounted to $1,720 at August 31, 2021, and is included in “Payable for independent
Trustees’ compensation” in the Statement of Assets and Liabilities.
(4) Shares of Beneficial Interest
The fund's Declaration of Trust permits the Trustees to issue
an unlimited number of full and fractional shares of beneficial interest. The number of shares sold, reinvested and reacquired corresponds to the net proceeds from the sale of shares, reinvestment of distributions and cost of shares reacquired,
respectively, since shares are sold and reacquired at $1.00 per share. Transactions in fund shares were as follows:
| |
Year
ended
8/31/21 |
|
Year
ended
8/31/20 |
| Shares
sold |
223,841,885
|
|
532,195,804
|
Shares
issued to shareholders in
reinvestment of distributions |
—
|
|
1,528,478
|
| Shares
reacquired |
(398,323,819)
|
|
(318,872,422)
|
| Net
change |
(174,481,934)
|
|
214,851,860
|
Effective at the close of business
on May 29, 2020, purchases of the fund are closed to new and existing investors subject to certain exceptions. Please see the fund's prospectus for details.
(5) Line of Credit
The fund and certain other funds managed by MFS participate in
a $1.25 billion unsecured committed line of credit of which $1 billion is reserved for use by the fund and certain other MFS U.S. funds. The line of credit is provided by a syndicate of banks under a credit agreement. Borrowings may be made for
temporary financing needs.
Notes to Financial
Statements - continued
Interest is charged to each fund, based on its borrowings, generally at a rate
equal to the highest of one month LIBOR, the Federal Funds Effective Rate and the Overnight Bank Funding Rate, plus an agreed upon spread. A commitment fee, based on the average daily, unused portion of the committed line of credit, is allocated
among the participating funds. In addition, the fund and other funds managed by MFS have established unsecured uncommitted borrowing arrangements with certain banks for temporary financing needs. Interest is charged to each fund, based on its
borrowings, at rates equal to customary reference rates plus an agreed upon spread. For the year ended August 31, 2021, the fund’s commitment fee and interest expense were $2,393 and $0, respectively, and are included in
“Miscellaneous” expense in the Statement of Operations.
(6) Impacts of COVID-19
The pandemic related to the global spread of novel coronavirus
disease (COVID-19), which was first detected in December 2019, has resulted in significant disruptions to global business activity and the global economy, as well as the economies of individual countries, the financial performance of individual
companies and sectors, and the securities and commodities markets in general. Multiple surges in cases globally, the availability and widespread adoption of vaccines, and the emergence of variant strains of the virus continue to create uncertainty
as to the future and long-term impacts resulting from the pandemic including impacts to the prices and liquidity of the fund's investments and the fund's performance.
Report of Independent
Registered Public Accounting Firm
To the Board of
Trustees of MFS Series Trust IV and the Shareholders of MFS U.S. Government Money Market Fund:
Opinion on the Financial Statements and Financial
Highlights
We have audited the accompanying statement of
assets and liabilities of MFS U.S. Government Money Market Fund (the “Fund”), including the portfolio of investments, as of August 31, 2021, the related statement of operations for the year then ended, the statements of changes in net
assets for each of the two years in the period then ended, the financial highlights for each of the five years in the period then ended, and the related notes. In our opinion, the financial statements and financial highlights present fairly, in all
material respects, the financial position of the Fund as of August 31, 2021, and the results of its operations for the year then ended, the changes in its net assets for each of the two years in the period then ended, and the financial highlights
for each of the five years in the period then ended, in conformity with accounting principles generally accepted in the United States of America.
Basis for Opinion
These financial statements and financial highlights are the
responsibility of the Fund’s management. Our responsibility is to express an opinion on the Fund's financial statements and financial highlights based on our audits. We are a public accounting firm registered with the Public Company Accounting
Oversight Board (United States) (PCAOB) and are required to be independent with respect to the Fund in accordance with the U.S. federal securities laws and the applicable rules and regulations of the Securities and Exchange Commission and the
PCAOB.
We conducted our audits in accordance with the
standards of the PCAOB. Those standards require that we plan and perform the audit to obtain reasonable assurance about whether the financial statements and financial highlights are free of material misstatement, whether due to error or fraud. The
Fund is not required to have, nor were we engaged to perform, an audit of its internal control over financial reporting. As part of our audits we are required to obtain an understanding of internal control over financial reporting but not for the
purpose of expressing an opinion on the effectiveness of the Fund's internal control over financial reporting. Accordingly, we express no such opinion.
Our audits included performing procedures to assess the risks
of material misstatement of the financial statements and financial highlights, whether due to error or fraud, and performing procedures that respond to those risks. Such procedures included examining, on a test basis, evidence regarding the amounts
and disclosures in the financial statements and financial highlights. Our audits also included evaluating the accounting principles used and significant estimates made by management, as well as
Report of Independent
Registered Public Accounting Firm – continued
evaluating the overall presentation of the financial statements and financial
highlights. Our procedures included confirmation of securities owned as of August 31, 2021, by correspondence with the custodian and brokers. We believe that our audits provide a reasonable basis for our opinion.
DELOITTE & TOUCHE LLP
Boston, Massachusetts
October 15, 2021
We have served as the auditor of one or more of the MFS
investment companies since 1924.
Trustees and
Officers — Identification and Background
The Trustees and Officers of the Trust, as of October 1, 2021,
are listed below, together with their principal occupations during the past five years. (Their titles may have varied during that period.) The address of each Trustee and Officer is 111 Huntington Avenue, Boston, Massachusetts 02199-7618.
| Name,
Age |
|
Position(s)
Held with Fund |
|
Trustee/Officer
Since(h) |
|
Number
of MFS Funds overseen by the Trustee |
|
Principal
Occupations During
the Past Five Years |
|
Other
Directorships During
the Past Five Years (j) |
| INTERESTED
TRUSTEES |
|
|
Robert
J. Manning (k)
(age 57) |
|
Trustee
|
|
February
2004 |
|
136
|
|
Massachusetts
Financial Services Company, Non-Executive Chairman (since January 2021); Director; Chairman of the Board; Executive Chairman (January 2017-2020); Co-Chief Executive Officer (2015-2016) |
|
N/A
|
Michael
W. Roberge (k)
(age 55) |
|
Trustee
|
|
January
2021 |
|
136
|
|
Massachusetts
Financial Services Company, Chairman (since January 2021); Chief Executive Officer (since January 2017); Director; President (until December 2018); Chief Investment Officer (until December 2018); Co-Chief Executive Officer (until December 2016)
|
|
N/A
|
| INDEPENDENT
TRUSTEES |
|
|
John
P. Kavanaugh
(age 66) |
|
Trustee
and Chair of Trustees |
|
January
2009 |
|
136
|
|
Private
investor |
|
N/A
|
Steven
E. Buller
(age 70) |
|
Trustee
|
|
February
2014 |
|
136
|
|
Private
investor |
|
N/A
|
John
A. Caroselli
(age 67) |
|
Trustee
|
|
March
2017 |
|
136
|
|
Private
investor; JC Global Advisors, LLC (management consulting), President (since 2015) |
|
N/A
|
Maureen
R. Goldfarb
(age 66) |
|
Trustee
|
|
January
2009 |
|
136
|
|
Private
investor |
|
N/A
|
Peter
D. Jones
(age 66) |
|
Trustee
|
|
January
2019 |
|
136
|
|
Private
investor |
|
N/A
|
Trustees and Officers -
continued
| Name,
Age |
|
Position(s)
Held with Fund |
|
Trustee/Officer
Since(h) |
|
Number
of MFS Funds overseen by the Trustee |
|
Principal
Occupations During
the Past Five Years |
|
Other
Directorships During
the Past Five Years (j) |
James
W. Kilman, Jr.
(age 60) |
|
Trustee
|
|
January
2019 |
|
136
|
|
Burford
Capital Limited (finance and investment management), Senior Advisor (since May 3, 2021), Chief Financial Officer (2019 - May 2, 2021); KielStrand Capital LLC (family office), Chief Executive Officer (since 2016); Morgan Stanley & Co. (financial
services), Vice Chairman of Investment Banking, Co-Head of Diversified Financials Coverage – Financial Institutions Investment Banking Group (until 2016) |
|
Alpha-En
Corporation, Director (2016-2019) |
Clarence
Otis, Jr.
(age 65) |
|
Trustee
|
|
March
2017 |
|
136
|
|
Private
investor |
|
VF
Corporation, Director; Verizon Communications, Inc., Director; The Travelers Companies, Director |
Maryanne
L. Roepke
(age 65) |
|
Trustee
|
|
May
2014 |
|
136
|
|
Private
investor |
|
N/A
|
Laurie
J. Thomsen
(age 64) |
|
Trustee
|
|
March
2005 |
|
136
|
|
Private
investor |
|
The
Travelers Companies, Director; Dycom Industries, Inc., Director |
| Name,
Age |
|
Position(s)
Held with
Fund |
|
Trustee/Officer
Since(h) |
|
Number
of MFS Funds for which the Person is an Officer |
|
Principal
Occupations During
the Past Five Years |
| OFFICERS
|
|
|
|
|
|
|
|
|
Christopher
R. Bohane (k)
(age 47) |
|
Assistant
Secretary and Assistant Clerk |
|
July
2005 |
|
136
|
|
Massachusetts
Financial Services Company, Senior Vice President and Associate General Counsel |
Kino
Clark (k)
(age 53) |
|
Assistant
Treasurer |
|
January
2012 |
|
136
|
|
Massachusetts
Financial Services Company, Vice President |
Trustees and Officers -
continued
| Name,
Age |
|
Position(s)
Held with
Fund |
|
Trustee/Officer
Since(h) |
|
Number
of MFS Funds for which the Person is an Officer |
|
Principal
Occupations During
the Past Five Years |
John
W. Clark, Jr. (k)
(age 54) |
|
Assistant
Treasurer |
|
April
2017 |
|
136
|
|
Massachusetts
Financial Services Company, Vice President (since March 2017); Deutsche Bank (financial services), Department Head - Treasurer's Office (until February 2017) |
Thomas
H. Connors (k)
(age 62) |
|
Assistant
Secretary and Assistant Clerk |
|
September
2012 |
|
136
|
|
Massachusetts
Financial Services Company, Vice President and Senior Counsel |
David
L. DiLorenzo (k)
(age 53) |
|
President
|
|
July
2005 |
|
136
|
|
Massachusetts
Financial Services Company, Senior Vice President |
Heidi
W. Hardin (k)
(age 54) |
|
Secretary
and Clerk |
|
April
2017 |
|
136
|
|
Massachusetts
Financial Services Company, Executive Vice President and General Counsel (since March 2017); Harris Associates (investment management), General Counsel (until January 2017) |
Brian
E. Langenfeld (k)
(age 48) |
|
Assistant
Secretary and Assistant Clerk |
|
June
2006 |
|
136
|
|
Massachusetts
Financial Services Company, Vice President and Senior Counsel |
Amanda
S. Mooradian (k)
(age 42) |
|
Assistant
Secretary and Assistant Clerk |
|
September
2018 |
|
136
|
|
Massachusetts
Financial Services Company, Assistant Vice President and Senior Counsel |
Susan
A. Pereira (k)
(age 50) |
|
Assistant
Secretary and Assistant Clerk |
|
July
2005 |
|
136
|
|
Massachusetts
Financial Services Company, Vice President and Assistant General Counsel |
Kasey
L. Phillips (k)
(age 50) |
|
Assistant
Treasurer |
|
September
2012 |
|
136
|
|
Massachusetts
Financial Services Company, Vice President |
Matthew
A. Stowe (k)
(age 46) |
|
Assistant
Secretary and Assistant Clerk |
|
October
2014 |
|
136
|
|
Massachusetts
Financial Services Company, Vice President and Assistant General Counsel |
Martin
J. Wolin (k)
(age 54) |
|
Chief
Compliance Officer |
|
July
2015 |
|
136
|
|
Massachusetts
Financial Services Company, Senior Vice President and Chief Compliance Officer |
Trustees and Officers -
continued
| Name,
Age |
|
Position(s)
Held with
Fund |
|
Trustee/Officer
Since(h) |
|
Number
of MFS Funds for which the Person is an Officer |
|
Principal
Occupations During
the Past Five Years |
James
O. Yost (k)
(age 61) |
|
Treasurer
|
|
September
1990 |
|
136
|
|
Massachusetts
Financial Services Company, Senior Vice President |
| (h)
|
Date
first appointed to serve as Trustee/Officer of an MFS Fund. Each Trustee has served continuously since appointment unless indicated otherwise. For the period from December 15, 2004 until February 22, 2005, Mr. Manning served as Advisory Trustee.
From January 2012 through December 2016, Messrs. DiLorenzo and Yost served as Treasurer and Deputy Treasurer of the Funds, respectively. |
| (j)
|
Directorships
or trusteeships of companies required to report to the Securities and Exchange Commission (i.e., “public companies”). |
| (k)
|
“Interested
person” of the Trust within the meaning of the Investment Company Act of 1940 (referred to as the 1940 Act), which is the principal federal law governing investment companies like the fund, as a result of a position with MFS. The address of
MFS is 111 Huntington Avenue, Boston, Massachusetts 02199-7618. |
Each Trustee (other than Messrs. Jones, Kilman and Roberge) has
been elected by shareholders and each Trustee and Officer holds office until his or her successor is chosen and qualified or until his or her earlier death, resignation, retirement or removal. Mr. Roberge became a Trustee of the Funds on January 1,
2021 and Messrs. Jones and Kilman became Trustees of the Funds on January 1, 2019. The Trust does not hold annual meetings for the purpose of electing Trustees, and Trustees are not elected for fixed terms. Under the terms of the Board's retirement
policy, an Independent Trustee shall retire at the end of the calendar year in which he or she reaches the earlier of 75 years of age or 15 years of service on the Board (or, in the case of any Independent Trustee who joined the Board prior to 2015,
20 years of service on the Board).
Messrs. Buller, Kilman
and Otis and Ms. Roepke are members of the Trust’s Audit Committee.
Each of the Interested Trustees and certain Officers hold
comparable officer positions with certain affiliates of MFS.
The Statement of Additional Information for a Fund includes
further information about the Trustees and is available without charge upon request by calling 1-800-225-2606.
| Investment
Adviser |
Custodian
|
Massachusetts
Financial Services Company
111 Huntington Avenue
Boston, MA 02199-7618 |
State
Street Bank and Trust Company
1 Lincoln Street
Boston, MA 02111-2900 |
| Distributor
|
Independent
Registered Public Accounting Firm |
MFS Fund
Distributors, Inc.
111 Huntington Avenue
Boston, MA 02199-7618 |
Deloitte
& Touche LLP
200 Berkeley Street
Boston, MA 02116 |
Board Review of Investment
Advisory Agreement
MFS U.S. Government Money Market
Fund
The Investment Company Act of 1940 requires that
both the full Board of Trustees and a majority of the non-interested (“independent”) Trustees, voting separately, annually approve the continuation of the Fund’s investment advisory agreement with MFS. The Trustees consider matters
bearing on the Fund and its advisory arrangements at their meetings throughout the year, including a review of performance data at each regular meeting. In addition, the independent Trustees met several times by videoconference (in accordance with
Securities and Exchange Commission relief) over the course of three months beginning in May and ending in July, 2021 (“contract review meetings”) for the specific purpose of considering whether to approve the continuation of the
investment advisory agreement for the Fund and the other investment companies that the Board oversees (the “MFS Funds”). The independent Trustees were assisted in their evaluation of the Fund’s investment advisory agreement by
independent legal counsel, from whom they received separate legal advice and with whom they met separately from MFS during various contract review meetings. The independent Trustees were also assisted in this process by an independent consultant who
was retained by and reported to the independent Trustees.
In connection with their deliberations regarding the
continuation of the investment advisory agreement, the Trustees, including the independent Trustees, considered such information and factors as they believed, in light of the legal advice furnished to them and their own business judgment, to be
relevant. The investment advisory agreement for the Fund was considered separately, although the Trustees also took into account the common interests of all MFS Funds in their review. As described below, the Trustees considered the nature, quality,
and extent of the various investment advisory, administrative, and shareholder services performed by MFS under the existing investment advisory agreement and other arrangements with the Fund.
In connection with their contract review meetings, the Trustees
received and relied upon materials that included, among other items: (i) information provided by Broadridge Financial Solutions, Inc. (“Broadridge”), an independent third party, on the investment performance of the Fund for various time
periods ended December 31, 2020 and the investment performance of a group of funds with substantially similar investment classifications/objectives (the “Broadridge performance universe”), (ii) information provided by Broadridge on the
Fund’s advisory fees and other expenses and the advisory fees and other expenses of comparable funds identified by Broadridge as well as all other funds in the same investment classification/category (the “Broadridge expense group and
universe”), (iii) information provided by MFS on the advisory fees of portfolios of other clients of MFS, including institutional separate accounts and other clients, (iv) information as to whether and to what extent applicable expense
waivers, reimbursements or fee “breakpoints” are observed for the Fund, (v) information regarding MFS’ financial results and financial condition, including MFS’ and certain of its affiliates’ estimated profitability
from services performed for the Fund and the MFS Funds as a whole, and compared to MFS’ institutional business, (vi) MFS’ views regarding the outlook for the mutual fund industry and the strategic business plans of MFS, (vii)
descriptions of various functions performed by MFS for the Funds, such as compliance monitoring and portfolio trading practices, and (viii)
Board Review of Investment
Advisory Agreement - continued
information regarding the overall organization of MFS, including information
about MFS’ senior management and other personnel providing investment advisory, administrative and other services to the Fund and the other MFS Funds. The comparative performance, fee and expense information prepared and provided by Broadridge
was not independently verified and the independent Trustees did not independently verify any information provided to them by MFS.
The Trustees’ conclusion as to the continuation of the
investment advisory agreement was based on a comprehensive consideration of all information provided to the Trustees and not the result of any single factor. Some of the factors that figured particularly in the Trustees’ deliberations are
described below, although individual Trustees may have evaluated the information presented differently from one another, giving different weights to various factors. It is also important to recognize that the fee arrangements for the Fund and other
MFS Funds are the result of years of review and discussion between the independent Trustees and MFS, that certain aspects of such arrangements may receive greater scrutiny in some years than in others, and that the Trustees’ conclusions may be
based, in part, on their consideration of these same arrangements during the course of the year and in prior years.
Based on information provided by Broadridge and MFS, the
Trustees reviewed the Fund’s total return investment performance as well as the Broadridge performance universe over various time periods. The Trustees placed particular emphasis on the total return performance of the Fund’s shares in
comparison to the performance of funds in its Broadridge performance universe over the five-year period ended December 31, 2020, which the Trustees believed was a long enough period to reflect differing market conditions. The total return
performance of the Fund’s shares was in the 4th quintile relative to the other funds in the universe for this five-year period (the 1st quintile being the best performers and the 5th quintile being the worst performers). The total return
performance of the Fund’s shares was in the 5th quintile for the one-year period and the 4th quintile for the three-year period ended December 31, 2020 relative to the Broadridge performance universe. Because of the passage of time, these
performance results may differ from the performance results for more recent periods, including those shown elsewhere in this report.
In the course of their deliberations, the Trustees took into
account information provided by MFS in connection with the contract review meetings, as well as during investment review meetings conducted with portfolio management personnel during the course of the year regarding the Fund’s performance. In
addition, the Trustees noted the market conditions affecting all money market funds, in particular the low interest rate environment during portions of the one-, three- and five-year periods, and MFS’ voluntary waiver of all or a portion of
its fees to ensure that the Fund avoided a negative yield during certain periods. After reviewing these and related factors, the Trustees concluded, within the context of their overall conclusions regarding the investment advisory agreement, that
they were satisfied with MFS’ responses and efforts relating to investment performance.
In assessing the reasonableness of the Fund’s advisory
fee, the Trustees considered, among other information, the Fund’s advisory fee and the total expense ratio of the Fund’s shares as a percentage of average daily net assets and the advisory fee and total expense ratios of the Broadridge
expense group based on information provided by Broadridge. The Trustees considered that MFS currently observes an expense limitation
Board Review of Investment
Advisory Agreement - continued
for the Fund, which may not be changed without the Trustees’ approval.
The Trustees also considered that, according to the data provided by Broadridge (which takes into account any fee reductions or expense limitations that were in effect during the Fund’s last fiscal year), the Fund’s effective advisory
fee rate and total expense ratio were each approximately at the Broadridge expense group median.
The Trustees also considered the advisory fees charged by MFS
to any institutional separate accounts advised by MFS (“separate accounts”) and unaffiliated investment companies for which MFS serves as subadviser (“subadvised funds”) that have comparable investment strategies to the Fund,
if any. In comparing these fees, the Trustees considered information provided by MFS as to the generally broader scope of services provided by MFS to the Fund, as well as the more extensive regulatory burdens imposed on MFS in managing the Fund, in
comparison to separate accounts and subadvised funds. The Trustees also considered the higher demands placed on MFS’ investment personnel and trading infrastructure as a result of the daily cash in-flows and out-flows of the Fund in comparison
to separate accounts.
The Trustees also considered
whether the Fund may benefit from any economies of scale in the management of the Fund in the event of growth in assets of the Fund and/or growth in assets of the MFS Funds as a whole. They noted that the Fund’s advisory fee rate schedule is
subject to a contractual breakpoint that reduces the Fund’s advisory fee rate on average daily net assets over $1 billion. The Trustees also noted that MFS has agreed in writing to waive a portion of the management fees of certain MFS Funds,
including the Fund, if the total combined assets of certain funds within the MFS Funds’ complex increase above agreed upon thresholds (the “group fee waiver”), enabling the Fund’s shareholders to share in the benefits from
any economies of scale at the complex level. The group fee waiver is reviewed and renewed annually between the Board and MFS. The Trustees concluded that the breakpoint and the group fee waiver were sufficient to allow the Fund to benefit from
economies of scale as its assets and overall complex assets grow.
The Trustees also considered information prepared by MFS
relating to MFS’ costs and profits with respect to the Fund, the MFS Funds considered as a group, and other investment companies and accounts advised by MFS, as well as MFS’ methodologies used to determine and allocate its costs to the
MFS Funds, the Fund and other accounts and products for purposes of estimating profitability.
After reviewing these and other factors described herein, the
Trustees concluded, within the context of their overall conclusions regarding the investment advisory agreement, that the advisory fees charged to the Fund represent reasonable compensation in light of the services being provided by MFS to the
Fund.
In addition, the Trustees considered MFS’
resources and related efforts to continue to retain, attract and motivate capable personnel to serve the Fund. The Trustees also considered current and developing conditions in the financial services industry, including the presence of large and
well-capitalized companies which are spending, and appear to be prepared to continue to spend, substantial sums to engage personnel and to provide services to competing investment companies. In this regard, the Trustees also considered the financial
resources of MFS and its ultimate parent, Sun Life Financial Inc. The Trustees also considered the advantages and possible disadvantages to the Fund of having an adviser that also serves other investment companies as well as other accounts.
Board Review of Investment
Advisory Agreement - continued
The Trustees also considered the nature, quality, cost, and
extent of administrative, transfer agency, and distribution services provided to the Fund by MFS and its affiliates under agreements other than the investment advisory agreement. The Trustees also considered the nature, extent and quality of certain
other services MFS performs or arranges for on the Fund’s behalf, which may include securities lending programs, directed expense payment programs, class action recovery programs, and MFS’ interaction with third-party service providers,
principally custodians and sub-custodians. The Trustees concluded that the various non-advisory services provided by MFS and its affiliates on behalf of the Fund were satisfactory.
The Trustees considered so-called “fall-out
benefits” to MFS such as reputational value derived from serving as investment manager to the MFS Funds. The Trustees also considered that MFS discontinued its historic practice of obtaining investment research from portfolio brokerage
commissions paid by certain MFS Funds effective January 2018, and directly pays or voluntarily reimburses a Fund, if applicable, for the costs of external research acquired through the use of the Fund’s portfolio brokerage commissions.
Based on their evaluation of factors that they deemed to be
material, including those factors described above, the Board of Trustees, including the independent Trustees, concluded that the Fund’s investment advisory agreement with MFS should be continued for an additional one-year period, commencing
August 1, 2021.
Proxy
Voting Policies and Information
MFS votes proxies on
behalf of the fund pursuant to proxy voting policies and procedures that are available without charge, upon request, by calling 1-800-225-2606, by visiting mfs.com/proxyvoting, or by visiting the SEC’s
Web site at http://www.sec.gov.
Information regarding how the fund voted proxies relating to
portfolio securities during the most recent twelve-month period ended June 30 is available by August 31 of each year without charge by visiting mfs.com/proxyvoting, or by visiting the SEC’s Web site at http://www.sec.gov.
Portfolio Holdings Information
The fund files monthly portfolio information with the SEC on
Form N-MFP. The fund’s Form N-MFP reports are available on the SEC’s Web site at http://www.sec.gov. A shareholder can also access the fund’s portfolio holdings as of each month end and
the fund’s Form N-MFP reports at mfs.com/openendfunds after choosing “Click here for access to Money Market fund reports”.
Further Information
From time to time, MFS may post important information about the
fund or the MFS Funds on the MFS Web site (mfs.com). This information is available at https://www.mfs.com/announcements or at
mfs.com/openendfunds by choosing the fund’s name and then scrolling to the “Resources” section and clicking on the “Announcements” tab, if any.
Information About Fund Contracts and Legal Claims
The fund has entered into contractual arrangements with an
investment adviser, administrator, distributor, shareholder servicing agent, 529 program manager (if applicable), and custodian who each provide services to the fund. Unless expressly stated otherwise, shareholders are not parties to, or intended
beneficiaries of these contractual arrangements, and these contractual arrangements are not intended to create any shareholder right to enforce them against the service providers or to seek any remedy under them against the service providers, either
directly or on behalf of the fund.
Under the
Trust’s By-Laws and Declaration of Trust, any claims asserted against or on behalf of the MFS Funds, including claims against Trustees and Officers, must be brought in state and federal courts located within the Commonwealth of
Massachusetts.
Federal Tax Information (unaudited)
The
fund will notify shareholders of amounts for use in preparing 2021 income tax forms in January 2022. The following information is provided pursuant to provisions of the Internal Revenue Code.
The fund intends to pass through the maximum amount allowable
as Section 163(j) Interest Dividends as defined in Treasury Regulation §1.163(j)-1(b).
| FACTS
|
WHAT
DOES MFS DO WITH YOUR PERSONAL INFORMATION? |
| Why?
|
Financial
companies choose how they share your personal information. Federal law gives consumers the right to limit some but not all sharing. Federal law also requires us to tell you how we collect, share, and protect your personal information. Please read
this notice carefully to understand what we do. |
| What?
|
The types of
personal information we collect and share depend on the product or service you have with us. This information can include: |
| • Social
Security number and account balances |
| • Account
transactions and transaction history |
| • Checking
account information and wire transfer instructions |
| When
you are no longer our customer, we continue to share your information as described in this notice. |
| How?
|
All
financial companies need to share customers' personal information to run their everyday business. In the section below, we list the reasons financial companies can share their customers' personal information; the reasons MFS chooses to share; and
whether you can limit this sharing. |
Reasons
we can share your
personal information |
Does
MFS share? |
Can
you limit
this sharing? |
For
our everyday business purposes –
such as to process your transactions, maintain your
account(s), respond to court orders and legal
investigations, or report to credit bureaus |
Yes
|
No
|
For
our marketing purposes –
to offer our products and services to you |
No
|
We
don't share |
For
joint marketing with other
financial companies |
No
|
We
don't share |
For
our affiliates' everyday business purposes –
information about your transactions and experiences |
No
|
We
don't share |
For
our affiliates' everyday business purposes –
information about your creditworthiness |
No
|
We
don't share |
| For
nonaffiliates to market to you |
No
|
We
don't share |
| Questions?
|
Call
800-225-2606 or go to mfs.com. |
| Who
we are |
| Who
is providing this notice? |
MFS
Funds, MFS Investment Management, MFS Institutional Advisors, Inc., and MFS Heritage Trust Company. |
| What
we do |
How
does MFS
protect my personal
information? |
To
protect your personal information from unauthorized access and use, we use security measures that comply with federal law. These measures include procedural, electronic, and physical safeguards for the protection of the personal information we
collect about you. |
How
does MFS
collect my personal
information? |
We
collect your personal information, for example, when you |
| • open
an account or provide account information |
| • direct
us to buy securities or direct us to sell your securities |
| • make
a wire transfer |
| We
also collect your personal information from others, such as credit bureaus, affiliates, or other companies. |
| Why
can't I limit all sharing? |
Federal
law gives you the right to limit only |
| • sharing
for affiliates' everyday business purposes – information about your creditworthiness |
| • affiliates
from using your information to market to you |
| • sharing
for nonaffiliates to market to you |
| State
laws and individual companies may give you additional rights to limit sharing. |
| Definitions
|
| Affiliates
|
Companies
related by common ownership or control. They can be financial and nonfinancial companies. |
| •
MFS does not share personal information with affiliates, except for everyday business purposes as described on page one of this notice. |
| Nonaffiliates
|
Companies
not related by common ownership or control. They can be financial and nonfinancial companies. |
| •
MFS does not share with nonaffiliates so they can market to you. |
| Joint
marketing |
A
formal agreement between nonaffiliated financial companies that together market financial products or services to you. |
| •
MFS doesn't jointly market. |
| Other
important information |
| If
you own an MFS product or receive an MFS service in the name of a third party such as a bank or broker-dealer, their privacy policy may apply to you instead of ours. |
Save paper with eDelivery.
MFS® will send you prospectuses, reports, and proxies directly via e-mail so you will get information faster with less mailbox clutter.
To sign up:
1. Go to mfs.com.
2. Log in via MFS® Access.
3. Select eDelivery.
If you own your MFS fund shares through a financial institution
or a retirement plan, MFS® TALK, MFS® Access,
or eDelivery may not be available to you.
CONTACT
WEB SITE
mfs.com
MFS TALK
1-800-637-8255
24 hours a day
ACCOUNT SERVICE AND LITERATURE
Shareholders
1-800-225-2606
Financial advisors
1-800-343-2829
Retirement plan services
1-800-637-1255
MAILING ADDRESS
MFS Service Center, Inc.
P.O. Box 219341
Kansas City, MO 64121-9341
OVERNIGHT MAIL
MFS Service Center, Inc.
Suite 219341
430 W 7th Street
Kansas City, MO 64105-1407
Item 1(b):
Not applicable
The Registrant has adopted a Code of Ethics (the “Code”) pursuant to Section 406 of the Sarbanes-Oxley Act and as defined in Form N-CSR that applies
to the Registrant’s principal executive officer and principal financial and accounting officer. During the period covered by this report, the Registrant has not amended any provision in its Code that relates to an element of the Code’s
definition enumerated in paragraph (b) of Item 2 of this Form N-CSR. During the period covered by this report, the Registrant did not grant a waiver, including an implicit waiver, from any provision of
the Code.
A copy of the Code is attached hereto as EX-99.COE.
| ITEM 3. |
AUDIT COMMITTEE FINANCIAL EXPERT. |
Messrs. Steven E. Buller, James Kilman, and Clarence Otis, Jr. and Ms. Maryanne L. Roepke, members of the Audit Committee, have been determined by the Board of Trustees in their reasonable
business judgment to meet the definition of “audit committee financial expert” as such term is defined in Form N-CSR. In addition, Messrs. Buller, Kilman, and Otis and Ms. Roepke are
“independent” members of the Audit Committee (as such term has been defined by the Securities and Exchange Commission in regulations implementing Section 407 of the Sarbanes-Oxley Act of 2002). The Securities and Exchange Commission
has stated that the designation of a person as an audit committee financial expert pursuant to this Item 3 on the Form N-CSR does not impose on such a person any duties, obligations or liability that are
greater than the duties, obligations or liability imposed on such person as a member of the Audit Committee and the Board of Trustees in the absence of such designation or identification.
| ITEM 4. |
PRINCIPAL ACCOUNTANT FEES AND SERVICES. |
Items 4(a) through 4(d) and 4(g):
The Board of Trustees has appointed Deloitte &
Touche LLP (“Deloitte”) to serve as independent accountants to certain series of the Registrant and Ernst & Young LLP (“E&Y”) to serve in the same capacity to certain other series of the Registrant (each a
“Fund” and collectively the “Funds”). The tables below set forth the audit fees billed to each Fund as well as fees for non-audit services provided to each Fund and/or to each Fund’s
investment adviser, Massachusetts Financial Services Company (“MFS”), and to various entities either controlling, controlled by, or under common control with MFS that provide ongoing services to the Funds (“MFS Related
Entities”).
For the fiscal years ended August 31, 2021 and 2020, audit fees billed to each Fund by Deloitte and
E&Y were as follows:
|
|
|
|
|
|
|
|
|
| |
|
Audit Fees |
|
| |
|
2021 |
|
|
2020 |
|
| Fees Billed by Deloitte |
|
|
|
|
|
|
|
|
| MFS Mid Cap Growth Fund |
|
|
48,766 |
|
|
|
48,104 |
|
| MFS U.S. Government Money Market Fund |
|
|
34,201 |
|
|
|
33,740 |
|
|
|
|
|
|
|
|
|
|
| Total |
|
|
82,967 |
|
|
|
81,844 |
|
|
|
| |
|
Audit Fees |
|
| |
|
2021 |
|
|
2020 |
|
| Fees Billed by E&Y |
|
|
|
|
|
|
|
|
| MFS Blended Research Emerging Markets Equity Fund |
|
|
55,921 |
|
|
|
55,160 |
|
| MFS Blended Research Global Equity Fund+ |
|
|
N/A |
|
|
|
0 |
|
| MFS Blended Research International Equity Fund |
|
|
55,921 |
|
|
|
55,160 |
|
| MFS Global New Discovery Fund |
|
|
48,935 |
|
|
|
48,270 |
|
|
|
|
|
|
|
|
|
|
| Total |
|
|
160,777 |
|
|
|
158,590 |
|
For the fiscal years ended August 31, 2021 and 2020, fees billed by Deloitte and E&Y for audit-related, tax and
other services provided to each Fund and for audit-related, tax and other services provided to MFS and MFS Related Entities were as follows:
|
|
|
|
|
|
|
|
|
|
|
|
|
|
|
|
|
|
|
|
|
|
|
|
|
| |
|
Audit-Related
Fees1 |
|
|
Tax Fees2 |
|
|
All Other Fees3 |
|
| |
|
2021 |
|
|
2020 |
|
|
2021 |
|
|
2020 |
|
|
2021 |
|
|
2020 |
|
| Fees Billed by Deloitte |
|
|
|
|
|
|
|
|
|
|
|
|
|
|
|
|
|
|
|
|
|
|
|
|
| To MFS Mid Cap Growth Fund |
|
|
0 |
|
|
|
0 |
|
|
|
7,623 |
|
|
|
7,123 |
|
|
|
0 |
|
|
|
0 |
|
| To MFS U.S. Government Money Market Fund |
|
|
0 |
|
|
|
0 |
|
|
|
4,507 |
|
|
|
4,050 |
|
|
|
0 |
|
|
|
0 |
|
| Total fees billed by Deloitte To above Funds |
|
|
0 |
|
|
|
0 |
|
|
|
12,130 |
|
|
|
11,173 |
|
|
|
0 |
|
|
|
0 |
|
|
|
|
|
| |
|
Audit-Related Fees1 |
|
|
Tax Fees2 |
|
|
All Other Fees3 |
|
| |
|
2021 |
|
|
2020 |
|
|
2021 |
|
|
2020 |
|
|
2021 |
|
|
2020 |
|
| Fees Billed by Deloitte |
|
|
|
|
|
|
|
|
|
|
|
|
|
|
|
|
|
|
|
|
|
|
|
|
| To MFS and MFS Related Entities of MFS Mid Cap Growth Fund* |
|
|
0 |
|
|
|
0 |
|
|
|
0 |
|
|
|
0 |
|
|
|
1,600 |
|
|
|
5,390 |
|
| To MFS and MFS Related Entities of MFS U.S. Government Money Market
Fund* |
|
|
0 |
|
|
|
0 |
|
|
|
0 |
|
|
|
0 |
|
|
|
1,600 |
|
|
|
5,390 |
|
|
|
|
|
|
|
|
|
|
| |
|
Aggregate Fees for Non-audit
Services |
|
| |
|
2021 |
|
|
2020 |
|
| Fees Billed by Deloitte |
|
|
|
|
|
|
|
|
| To MFS Mid Cap Growth Fund, MFS and MFS Related Entities# |
|
|
9,223 |
|
|
|
906,263 |
|
| To MFS U.S. Government Money Market Fund, MFS and MFS Related Entities# |
|
|
6,107 |
|
|
|
903,190 |
|
|
|
|
|
|
|
|
|
|
|
|
|
|
|
|
|
|
|
|
|
|
|
|
|
|
|
|
|
|
| |
|
Audit-Related
Fees1 |
|
|
Tax Fees2 |
|
|
All Other Fees4 |
|
| |
|
2021 |
|
|
2020 |
|
|
2021 |
|
|
2020 |
|
|
2021 |
|
|
2020 |
|
| Fees Billed by E&Y |
|
|
|
|
|
|
|
|
|
|
|
|
|
|
|
|
|
|
|
|
|
|
|
|
| To MFS Blended Research Emerging Markets Equity Fund |
|
|
0 |
|
|
|
0 |
|
|
|
10,527 |
|
|
|
10,372 |
|
|
|
1,009 |
|
|
|
1,006 |
|
| To MFS Blended Research Global Equity Fund+ |
|
|
N/A |
|
|
|
0 |
|
|
|
N/A |
|
|
|
8,159 |
|
|
|
N/A |
|
|
|
1,001 |
|
| To MFS Blended Research International Equity Fund |
|
|
0 |
|
|
|
0 |
|
|
|
10,527 |
|
|
|
10,372 |
|
|
|
1,079 |
|
|
|
1,080 |
|
| To MFS Global New Discovery Fund |
|
|
0 |
|
|
|
0 |
|
|
|
9,409 |
|
|
|
9,270 |
|
|
|
1,013 |
|
|
|
1,012 |
|
| Total fees billed by E&Y To above Funds |
|
|
0 |
|
|
|
0 |
|
|
|
30,463 |
|
|
|
38,173 |
|
|
|
3,101 |
|
|
|
4,099 |
|
|
|
|
|
| |
|
Audit-Related Fees1 |
|
|
Tax Fees2 |
|
|
All Other Fees4 |
|
| |
|
2021 |
|
|
2020 |
|
|
2021 |
|
|
2020 |
|
|
2021 |
|
|
2020 |
|
| Fees Billed by E&Y |
|
|
|
|
|
|
|
|
|
|
|
|
|
|
|
|
|
|
|
|
|
|
|
|
| To MFS and MFS Related Entities of MFS Blended Research Emerging Markets Equity Fund* |
|
|
1,668,649 |
|
|
|
1,785,828 |
|
|
|
0 |
|
|
|
0 |
|
|
|
107,150 |
|
|
|
104,750 |
|
| To MFS and MFS Related Entities of MFS Blended Research Global Equity Fund*+ |
|
|
N/A |
|
|
|
1,785,828 |
|
|
|
N/A |
|
|
|
0 |
|
|
|
N/A |
|
|
|
104,750 |
|
| To MFS and MFS Related Entities of MFS Blended Research International Equity Fund* |
|
|
1,668,649 |
|
|
|
1,785,828 |
|
|
|
0 |
|
|
|
0 |
|
|
|
107,150 |
|
|
|
104,750 |
|
| To MFS and MFS Related Entities of MFS Global New Discovery Fund* |
|
|
1,668,649 |
|
|
|
1,785,828 |
|
|
|
0 |
|
|
|
0 |
|
|
|
107,150 |
|
|
|
104,750 |
|
|
|
|
|
|
|
|
|
|
| |
|
Aggregate Fees for Non-audit
Services |
|
| |
|
2021 |
|
|
2020 |
|
| Fees Billed by E&Y |
|
|
|
|
|
|
|
|
| To MFS Blended Research Emerging Markets Equity Fund, MFS and MFS Related Entities# |
|
|
2,053,765 |
|
|
|
2,080,956 |
|
| To MFS Blended Research Global Equity Fund, MFS and MFS Related
Entities#+ |
|
|
N/A |
|
|
|
2,078,738 |
|
| To MFS Blended Research International Equity Fund, MFS and MFS Related Entities# |
|
|
2,053,835 |
|
|
|
2,081,030 |
|
| To MFS Global New Discovery Fund, MFS and MFS Related Entities# |
|
|
2,052,651 |
|
|
|
2,079,860 |
|
| + |
MFS Blended Research Global Equity Fund liquidated effective August 20, 2020. |
| * |
This amount reflects the fees billed to MFS and MFS Related Entities for non-audit services relating directly
to the operations and financial reporting of the Funds (portions of which services also related to the operations and financial reporting of other funds within the MFS Funds complex). |
| # |
This amount reflects the aggregate fees billed by Deloitte or E&Y for non-audit services rendered
to the Funds and for non-audit services rendered to MFS and the MFS Related Entities. |
| 1 |
The fees included under “Audit-Related Fees” are fees related to assurance and related services that are reasonably related to the
performance of the audit or review of financial statements, but not reported under ‘‘Audit Fees,’’ including accounting consultations, agreed-upon procedure reports, attestation reports, comfort letters and internal control
reviews. |
| 2 |
The fees included under “Tax Fees” are fees associated with tax compliance, tax advice and tax planning, including services relating to the
filing or amendment of federal, state or local income tax returns, regulated investment company qualification reviews and tax distribution and analysis. |
| 3 |
The fees included under “All Other Fees” are fees for products and services provided by Deloitte other than those reported under “Audit
Fees,” “Audit-Related Fees” and “Tax Fees”. |
| 4 |
The fees included under “All Other Fees” are fees for products and services provided by E&Y other than those reported under “Audit
Fees,” “Audit-Related Fees” and “Tax Fees,” including fees for services related to review of internal controls and review of Rule 38a-1 compliance program.
|
Item 4(e)(1):
Set forth below are the policies and procedures established by the Audit Committee of the Board of Trustees relating to the pre-approval of audit and non-audit related services:
To the extent required by applicable law,
pre-approval by the Audit Committee of the Board is needed for all audit and permissible non-audit services rendered to the Fund and all permissible non-audit services rendered to MFS or MFS Related Entities if the services relate directly to the operations and financial reporting of the Registrant. Pre-approval is
currently on an engagement-by-engagement basis. In the event pre-approval of such services is necessary between regular meetings
of the Audit Committee and it is not practical to wait to seek pre-approval at the next regular meeting of the Audit Committee, pre-approval of such services may be
referred to the Chair of the Audit Committee for approval; provided that the Chair may not pre-approve any individual engagement for such services exceeding $50,000 or multiple engagements for such services in
the aggregate exceeding $100,000 in each period between regular meetings of the Audit Committee. Any engagement pre-approved by the Chair between regular meetings of the Audit Committee shall be presented for
ratification by the entire Audit Committee at its next regularly scheduled meeting.
Item 4(e)(2):
None, or 0%, of the services relating to the Audit-Related Fees, Tax Fees and All Other Fees paid by the Fund and MFS and MFS Related Entities relating
directly to the operations and financial reporting of the Registrant disclosed above were approved by the audit committee pursuant to paragraphs (c)(7)(i)(C) of Rule 2-01 of Regulation S-X (which permits audit committee approval after the start of the engagement with respect to services other than audit, review or attest services, if certain conditions are satisfied).
Item 4(f):
Not applicable.
Item 4(h):
The
Registrant’s Audit Committee has considered whether the provision by a Registrant’s independent registered public accounting firm of non-audit services to MFS and MFS Related Entities that were not pre-approved by the Committee (because such services did not relate directly to the operations and financial reporting of the Registrant) was compatible with maintaining the independence of the independent
registered public accounting firm as the Registrant’s principal auditors.
| ITEM 5. |
AUDIT COMMITTEE OF LISTED REGISTRANTS. |
Not applicable to the Registrant.
A schedule of investments of the Registrant is included as part of the report to shareholders of such series under Item 1(a) of this Form N-CSR.
| ITEM 7. |
DISCLOSURE OF PROXY VOTING POLICIES AND PROCEDURES FOR CLOSED-END MANAGEMENT INVESTMENT COMPANIES.
|
Not applicable to the Registrant.
| ITEM 8. |
PORTFOLIO MANAGERS OF CLOSED-END MANAGEMENT INVESTMENT COMPANIES. |
Not applicable to the Registrant.
| ITEM 9. |
PURCHASES OF EQUITY SECURITIES BY CLOSED-END MANAGEMENT INVESTMENT COMPANY AND AFFILIATED
PURCHASERS. |
Not applicable to the Registrant.
| ITEM 10. |
SUBMISSION OF MATTERS TO A VOTE OF SECURITY HOLDERS. |
There were no material changes to the procedures by which shareholders may send recommendations to the Board for nominees to the Registrant’s Board since the Registrant last provided disclosure as to
such procedures in response to the requirements of Item 407 (c)(2)(iv) of Regulation S-K or this Item.
| ITEM 11. |
CONTROLS AND PROCEDURES. |
| (a) |
Based upon their evaluation of the effectiveness of the registrant’s disclosure controls and procedures (as defined in Rule 30a-3(c) under the Investment Company Act of 1940 (the “Act”)) as conducted within 90 days of the filing date of this report on Form N-CSR, the registrant’s
principal financial officer and principal executive officer have concluded that those disclosure controls and procedures provide reasonable assurance that the material information required to be disclosed by the registrant on this report is
recorded, processed, summarized and reported within the time periods specified in the Securities and Exchange Commission’s rules and forms. |
| (b) |
There were no changes in the registrant’s internal controls over financial reporting (as defined in Rule
30a-3(d) under the Act) that occurred during the period covered by the report that have materially affected, or are reasonably likely to materially affect, the registrant’s internal control over financial
reporting. |
| ITEM 12. |
DISCLOSURE OF SECURITIES LENDING ACTIVITIES FOR CLOSED-END MANAGEMENT INVESTMENT COMPANIES.
|
Not applicable to the Registrant.
| (a) (1) |
Any code of ethics, or amendment thereto, that is the subject of the disclosure required by Item 2, to the extent that the registrant intends
to satisfy the Item 2 requirements through filing of an exhibit: Attached hereto as EX-99.COE. |
| |
(2) |
A separate certification for each principal executive officer and principal financial officer of the registrant as required by Rule 30a-2(a) under the Act (17 CFR 270.30a-2): Attached hereto as EX-99.302CERT.
|
| |
(3) |
Any written solicitation to purchase securities under Rule 23c-1 under the Act (17 CFR 270.23c-1) sent or given during the period covered by the report by or on behalf of the registrant to 10 or more persons. Not applicable. |
| |
(4) |
Change in the registrant’s independent public accountant. Not applicable. |
| (b) |
If the report is filed under Section 13(a) or 15(d) of the Exchange Act, provide the certifications required by Rule 30a-2(b) under the Act (17 CFR 270.30a-2(b)), Rule 13a-14(b) or Rule 15d-14(b) under the
Exchange Act (17 CFR 240.13a-14(b) or 240.15d-14(b)) and Section 1350 of Chapter 63 of Title 18 of the United States Code (18 U.S.C. 1350) as an exhibit. A
certification furnished pursuant to this paragraph will not be deemed “filed” for the purposes of Section 18 of the Exchange Act (15 U.S.C. 78r), or otherwise subject to the liability of that section. Such certification will not be
deemed to be incorporated by reference into any filing under the Securities Act of 1933 or the Exchange Act, except to the extent that the registrant specifically incorporates it by reference. Attached hereto as EX-99.906CERT. |
Notice
A copy of the Amended and Restated Declaration of Trust, as amended, of the Registrant is on file with the Secretary of State of The Commonwealth of Massachusetts and notice is hereby given that this
instrument is executed on behalf of the Registrant by an officer of the Registrant as an officer and not individually and the obligations of or arising out of this instrument are not binding upon any of the Trustees or shareholders individually, but
are binding only upon the assets and property of the respective constituent series of the Registrant.
SIGNATURES
Pursuant to the requirements of the Securities Exchange Act of 1934 and the Investment Company Act of 1940, the registrant has duly caused this report to be signed on its behalf by the undersigned,
thereunto duly authorized.
(Registrant) MFS SERIES TRUST IV
|
|
|
| By (Signature and Title)* |
|
/S/ DAVID L. DILORENZO |
|
|
David L. DiLorenzo, President |
Date: October 15, 2021
Pursuant to the requirements of the Securities Exchange Act of 1934 and the Investment Company Act of 1940, this report has been signed below by the following persons on behalf of the registrant and in
the capacities and on the dates indicated.
|
|
|
| By (Signature and Title)* |
|
/S/ DAVID L. DILORENZO |
|
|
David L. DiLorenzo, President (Principal Executive Officer) |
Date: October 15, 2021
|
|
|
| By (Signature and Title)* |
|
/S/ JAMES O. YOST |
|
|
James O. Yost, Treasurer
(Principal Financial Officer and Accounting
Officer) |
Date: October 15, 2021
| * |
Print name and title of each signing officer under his or her signature. |