000005298810/22020FYFALSE12P1M3.500000529882019-09-282020-10-02xbrli:shares00000529882020-11-12iso4217:USD00000529882020-03-2700000529882020-10-0200000529882019-09-27iso4217:USDxbrli:shares00000529882018-09-292019-09-2700000529882017-09-302018-09-280000052988us-gaap:CommonStockMember2017-09-290000052988us-gaap:AdditionalPaidInCapitalMember2017-09-290000052988us-gaap:RetainedEarningsMember2017-09-290000052988us-gaap:AccumulatedOtherComprehensiveIncomeMember2017-09-290000052988us-gaap:ParentMember2017-09-290000052988us-gaap:NoncontrollingInterestMember2017-09-2900000529882017-09-290000052988us-gaap:RetainedEarningsMember2017-09-302018-09-280000052988us-gaap:ParentMember2017-09-302018-09-280000052988us-gaap:NoncontrollingInterestMember2017-09-302018-09-280000052988us-gaap:AccumulatedOtherComprehensiveIncomeMember2017-09-302018-09-280000052988us-gaap:AdditionalPaidInCapitalMember2017-09-302018-09-280000052988us-gaap:CommonStockMember2017-09-302018-09-280000052988us-gaap:CommonStockMember2018-09-280000052988us-gaap:AdditionalPaidInCapitalMember2018-09-280000052988us-gaap:RetainedEarningsMember2018-09-280000052988us-gaap:AccumulatedOtherComprehensiveIncomeMember2018-09-280000052988us-gaap:ParentMember2018-09-280000052988us-gaap:NoncontrollingInterestMember2018-09-2800000529882018-09-280000052988us-gaap:RetainedEarningsMember2018-09-292019-09-270000052988us-gaap:ParentMember2018-09-292019-09-270000052988us-gaap:NoncontrollingInterestMember2018-09-292019-09-270000052988us-gaap:AccumulatedOtherComprehensiveIncomeMember2018-09-292019-09-270000052988us-gaap:RetainedEarningsMembersrt:CumulativeEffectPeriodOfAdoptionAdjustmentMember2018-09-280000052988us-gaap:ParentMembersrt:CumulativeEffectPeriodOfAdoptionAdjustmentMember2018-09-280000052988srt:CumulativeEffectPeriodOfAdoptionAdjustmentMember2018-09-280000052988us-gaap:AdditionalPaidInCapitalMember2018-09-292019-09-270000052988us-gaap:CommonStockMember2018-09-292019-09-270000052988us-gaap:CommonStockMember2019-09-270000052988us-gaap:AdditionalPaidInCapitalMember2019-09-270000052988us-gaap:RetainedEarningsMember2019-09-270000052988us-gaap:AccumulatedOtherComprehensiveIncomeMember2019-09-270000052988us-gaap:ParentMember2019-09-270000052988us-gaap:NoncontrollingInterestMember2019-09-270000052988us-gaap:RetainedEarningsMember2019-09-282020-10-020000052988us-gaap:ParentMember2019-09-282020-10-020000052988us-gaap:NoncontrollingInterestMember2019-09-282020-10-020000052988us-gaap:AccumulatedOtherComprehensiveIncomeMember2019-09-282020-10-020000052988us-gaap:AdditionalPaidInCapitalMember2019-09-282020-10-020000052988us-gaap:CommonStockMember2019-09-282020-10-020000052988us-gaap:CommonStockMember2020-10-020000052988us-gaap:AdditionalPaidInCapitalMember2020-10-020000052988us-gaap:RetainedEarningsMember2020-10-020000052988us-gaap:AccumulatedOtherComprehensiveIncomeMember2020-10-020000052988us-gaap:ParentMember2020-10-020000052988us-gaap:NoncontrollingInterestMember2020-10-02jec:segmentxbrli:pureiso4217:GBP0000052988jec:JohnWoodGroupMember2020-03-062020-03-060000052988jec:JohnWoodGroupMember2020-03-060000052988jec:KeyWHoldingCorporationMember2019-06-120000052988jec:KeyWHoldingCorporationMember2019-06-122019-06-120000052988jec:WorleyParsonsLimitedECRBusinessMember2019-04-262019-04-260000052988jec:WorleyStockMember2019-04-262019-04-260000052988jec:CH2MHILLCompaniesLimitedMember2017-12-150000052988jec:CH2MHILLCompaniesLimitedMember2017-12-152017-12-150000052988jec:RevolvingCreditFacilityAndSecondLienNotesMemberjec:CH2MHILLCompaniesLimitedMember2017-12-150000052988srt:MinimumMemberus-gaap:BuildingMember2019-09-282020-10-020000052988srt:MaximumMemberus-gaap:BuildingMember2019-09-282020-10-020000052988srt:MinimumMemberus-gaap:EquipmentMember2019-09-282020-10-020000052988srt:MaximumMemberus-gaap:EquipmentMember2019-09-282020-10-020000052988us-gaap:LeaseholdImprovementsMembersrt:MinimumMember2019-09-282020-10-020000052988us-gaap:LeaseholdImprovementsMembersrt:MaximumMember2019-09-282020-10-0200000529882019-09-280000052988srt:MinimumMember2020-10-020000052988srt:MaximumMember2020-10-020000052988country:US2019-09-282020-10-020000052988country:US2018-09-292019-09-270000052988country:US2017-09-302018-09-280000052988srt:EuropeMember2019-09-282020-10-020000052988srt:EuropeMember2018-09-292019-09-270000052988srt:EuropeMember2017-09-302018-09-280000052988country:CA2019-09-282020-10-020000052988country:CA2018-09-292019-09-270000052988country:CA2017-09-302018-09-280000052988srt:AsiaMember2019-09-282020-10-020000052988srt:AsiaMember2018-09-292019-09-270000052988srt:AsiaMember2017-09-302018-09-280000052988country:IN2019-09-282020-10-020000052988country:IN2018-09-292019-09-270000052988country:IN2017-09-302018-09-280000052988jec:AustraliaandNewZealandMember2019-09-282020-10-020000052988jec:AustraliaandNewZealandMember2018-09-292019-09-270000052988jec:AustraliaandNewZealandMember2017-09-302018-09-280000052988jec:SouthAmericaandMexicoMember2019-09-282020-10-020000052988jec:SouthAmericaandMexicoMember2018-09-292019-09-270000052988jec:SouthAmericaandMexicoMember2017-09-302018-09-280000052988jec:MiddleEastandAfricaMember2019-09-282020-10-020000052988jec:MiddleEastandAfricaMember2018-09-292019-09-270000052988jec:MiddleEastandAfricaMember2017-09-302018-09-280000052988jec:U.S.FederalGovernmentanditsAgenciesMemberus-gaap:CustomerConcentrationRiskMember2019-09-282020-10-020000052988jec:U.S.FederalGovernmentanditsAgenciesMemberus-gaap:CustomerConcentrationRiskMember2018-09-292019-09-270000052988jec:U.S.FederalGovernmentanditsAgenciesMemberus-gaap:CustomerConcentrationRiskMember2017-09-302018-09-2800000529882020-10-032020-10-0200000529882021-10-012020-10-0200000529882019-01-17jec:financial_institution00000529882019-06-0500000529882019-12-0400000529882019-01-172019-01-1700000529882020-01-162020-01-1600000529882019-09-192019-09-1900000529882019-07-112019-07-1100000529882019-05-022019-05-020000052988jec:CriticalMissionSolutionsMember2019-09-270000052988jec:PeopleAndPlacesSolutionsMember2019-09-270000052988jec:CriticalMissionSolutionsMember2019-09-282020-10-020000052988jec:PeopleAndPlacesSolutionsMember2019-09-282020-10-020000052988jec:CriticalMissionSolutionsMember2020-10-020000052988jec:PeopleAndPlacesSolutionsMember2020-10-020000052988jec:CustomerRelationshipsContractsAndBacklogMember2019-09-270000052988us-gaap:DevelopedTechnologyRightsMember2019-09-270000052988us-gaap:TradeNamesMember2019-09-270000052988us-gaap:OtherIntangibleAssetsMember2019-09-270000052988jec:CustomerRelationshipsContractsAndBacklogMember2019-09-282020-10-020000052988us-gaap:DevelopedTechnologyRightsMember2019-09-282020-10-020000052988us-gaap:TradeNamesMember2019-09-282020-10-020000052988us-gaap:OtherIntangibleAssetsMember2019-09-282020-10-020000052988jec:CustomerRelationshipsContractsAndBacklogMember2020-10-020000052988us-gaap:DevelopedTechnologyRightsMember2020-10-020000052988us-gaap:TradeNamesMember2020-10-020000052988us-gaap:OtherIntangibleAssetsMember2020-10-020000052988us-gaap:LandMember2020-10-020000052988us-gaap:LandMember2019-09-270000052988us-gaap:BuildingMember2020-10-020000052988us-gaap:BuildingMember2019-09-270000052988us-gaap:EquipmentMember2020-10-020000052988us-gaap:EquipmentMember2019-09-270000052988us-gaap:LeaseholdImprovementsMember2020-10-020000052988us-gaap:LeaseholdImprovementsMember2019-09-270000052988us-gaap:ConstructionInProgressMember2020-10-020000052988us-gaap:ConstructionInProgressMember2019-09-270000052988country:US2020-10-020000052988country:US2019-09-270000052988srt:EuropeMember2020-10-020000052988srt:EuropeMember2019-09-270000052988country:CA2020-10-020000052988country:CA2019-09-270000052988srt:AsiaMember2020-10-020000052988srt:AsiaMember2019-09-270000052988country:IN2020-10-020000052988country:IN2019-09-270000052988jec:AustraliaandNewZealandMember2020-10-020000052988jec:AustraliaandNewZealandMember2019-09-270000052988jec:MiddleEastandAfricaMember2020-10-020000052988jec:MiddleEastandAfricaMember2019-09-270000052988us-gaap:AccumulatedDefinedBenefitPlansAdjustmentMember2018-09-280000052988us-gaap:AccumulatedTranslationAdjustmentMember2018-09-280000052988us-gaap:AccumulatedNetGainLossFromDesignatedOrQualifyingCashFlowHedgesMember2018-09-280000052988us-gaap:AccumulatedDefinedBenefitPlansAdjustmentMember2018-09-292019-09-270000052988us-gaap:AccumulatedTranslationAdjustmentMember2018-09-292019-09-270000052988us-gaap:AccumulatedNetGainLossFromDesignatedOrQualifyingCashFlowHedgesMember2018-09-292019-09-270000052988us-gaap:AccumulatedDefinedBenefitPlansAdjustmentMember2019-09-270000052988us-gaap:AccumulatedTranslationAdjustmentMember2019-09-270000052988us-gaap:AccumulatedNetGainLossFromDesignatedOrQualifyingCashFlowHedgesMember2019-09-270000052988us-gaap:AccumulatedDefinedBenefitPlansAdjustmentMember2019-09-282020-10-020000052988us-gaap:AccumulatedTranslationAdjustmentMember2019-09-282020-10-020000052988us-gaap:AccumulatedNetGainLossFromDesignatedOrQualifyingCashFlowHedgesMember2019-09-282020-10-020000052988us-gaap:AccumulatedDefinedBenefitPlansAdjustmentMember2020-10-020000052988us-gaap:AccumulatedTranslationAdjustmentMember2020-10-020000052988us-gaap:AccumulatedNetGainLossFromDesignatedOrQualifyingCashFlowHedgesMember2020-10-0200000529882018-12-222018-12-220000052988us-gaap:RetainedEarningsMembersrt:CumulativeEffectPeriodOfAdoptionAdjustmentMemberus-gaap:AccountingStandardsUpdate201802Member2020-10-020000052988country:GBus-gaap:ForeignCountryMember2019-09-282020-10-020000052988jec:CurrentYearActivityMember2019-09-282020-10-020000052988us-gaap:ForeignCountryMember2020-10-020000052988us-gaap:ForeignCountryMember2019-09-270000052988jec:ExpiringBetween2022And2037Memberus-gaap:ForeignCountryMember2020-10-020000052988us-gaap:DomesticCountryMember2019-09-282020-10-020000052988us-gaap:DomesticCountryMember2018-09-292019-09-270000052988us-gaap:DomesticCountryMember2017-09-302018-09-280000052988us-gaap:ForeignCountryMember2019-09-282020-10-020000052988us-gaap:ForeignCountryMember2018-09-292019-09-270000052988us-gaap:ForeignCountryMember2017-09-302018-09-280000052988jec:AccountingStandardsUpdate201311Member2020-10-020000052988jec:AccountingStandardsUpdate201311Member2019-09-270000052988jec:AccountingStandardsUpdate201311Membersrt:CumulativeEffectPeriodOfAdoptionAdjustmentMember2020-10-020000052988jec:AccountingStandardsUpdate201311Membersrt:CumulativeEffectPeriodOfAdoptionAdjustmentMember2019-09-270000052988us-gaap:ConsolidatedEntitiesMemberus-gaap:VariableInterestEntityPrimaryBeneficiaryMember2020-10-020000052988us-gaap:ConsolidatedEntitiesMemberus-gaap:VariableInterestEntityPrimaryBeneficiaryMember2019-09-270000052988us-gaap:ConsolidatedEntitiesMember2019-09-282020-10-020000052988us-gaap:ConsolidatedEntitiesMember2018-09-292019-09-270000052988us-gaap:ConsolidatedEntitiesMember2017-09-302018-09-280000052988us-gaap:VariableInterestEntityNotPrimaryBeneficiaryMemberus-gaap:EquityMethodInvesteeMember2020-10-020000052988us-gaap:VariableInterestEntityNotPrimaryBeneficiaryMemberus-gaap:EquityMethodInvesteeMember2019-09-270000052988us-gaap:EquityMethodInvesteeMemberus-gaap:VariableInterestEntityNotPrimaryBeneficiaryMember2020-10-020000052988us-gaap:EquityMethodInvesteeMemberus-gaap:VariableInterestEntityNotPrimaryBeneficiaryMember2019-09-270000052988us-gaap:EquityMethodInvesteeMemberus-gaap:VariableInterestEntityNotPrimaryBeneficiaryMember2018-09-280000052988us-gaap:EquityMethodInvesteeMemberus-gaap:VariableInterestEntityNotPrimaryBeneficiaryMember2019-09-282020-10-020000052988us-gaap:EquityMethodInvesteeMemberus-gaap:VariableInterestEntityNotPrimaryBeneficiaryMember2018-09-292019-09-270000052988us-gaap:EquityMethodInvesteeMemberus-gaap:VariableInterestEntityNotPrimaryBeneficiaryMember2017-09-302018-09-280000052988jec:AWEManagementLtdMember2020-10-020000052988us-gaap:LondonInterbankOfferedRateLIBORMemberus-gaap:SeniorSubordinatedNotesMember2019-09-270000052988us-gaap:LondonInterbankOfferedRateLIBORMemberus-gaap:SeniorSubordinatedNotesMember2020-03-270000052988us-gaap:RevolvingCreditFacilityMember2020-10-020000052988us-gaap:RevolvingCreditFacilityMember2019-09-270000052988jec:TermLoanFacility2020Member2020-10-020000052988jec:TermLoanFacility2020Member2018-09-280000052988jec:TermLoanFacility2017Member2020-10-020000052988jec:TermLoanFacility2017Member2019-09-270000052988jec:SeniorNotesSeriesADueMay2025Member2020-10-020000052988jec:SeniorNotesSeriesADueMay2025Member2019-09-270000052988jec:SeniorNotesSeriesBDueMay2028Member2020-10-020000052988jec:SeniorNotesSeriesBDueMay2028Member2019-09-270000052988jec:SeniorNotesSeriesCDueMay2030Member2020-10-020000052988jec:SeniorNotesSeriesCDueMay2030Member2019-09-270000052988srt:MinimumMemberjec:EurocurrencyInterestRateMemberus-gaap:RevolvingCreditFacilityMember2019-09-282020-10-020000052988srt:MaximumMemberjec:EurocurrencyInterestRateMemberus-gaap:RevolvingCreditFacilityMember2019-09-282020-10-020000052988srt:MinimumMemberjec:BaseInterestRateMemberus-gaap:RevolvingCreditFacilityMember2019-09-282020-10-020000052988srt:MaximumMemberjec:BaseInterestRateMemberus-gaap:RevolvingCreditFacilityMember2019-09-282020-10-020000052988srt:MinimumMemberus-gaap:LondonInterbankOfferedRateLIBORMemberus-gaap:RevolvingCreditFacilityMember2019-09-282020-10-020000052988srt:MaximumMemberus-gaap:LondonInterbankOfferedRateLIBORMemberus-gaap:RevolvingCreditFacilityMember2019-09-282020-10-020000052988srt:MinimumMemberjec:EurocurrencyInterestRateMemberjec:TermLoanFacility2020Member2019-09-282020-10-020000052988srt:MaximumMemberjec:EurocurrencyInterestRateMemberjec:TermLoanFacility2020Member2019-09-282020-10-020000052988srt:MinimumMemberjec:BaseInterestRateMemberjec:TermLoanFacility2020Member2019-09-282020-10-020000052988srt:MaximumMemberjec:BaseInterestRateMemberjec:TermLoanFacility2020Member2019-09-282020-10-020000052988us-gaap:LondonInterbankOfferedRateLIBORMemberjec:TermLoanFacility2020Member2019-09-282020-10-020000052988srt:MinimumMemberjec:EurocurrencyInterestRateMemberjec:TermLoanFacility2017Member2019-09-282020-10-020000052988srt:MaximumMemberjec:EurocurrencyInterestRateMemberjec:TermLoanFacility2017Member2019-09-282020-10-020000052988srt:MinimumMemberjec:BaseInterestRateMemberjec:TermLoanFacility2017Member2019-09-282020-10-020000052988srt:MaximumMemberjec:BaseInterestRateMemberjec:TermLoanFacility2017Member2019-09-282020-10-020000052988us-gaap:LondonInterbankOfferedRateLIBORMemberjec:TermLoanFacility2017Member2018-09-292019-09-270000052988jec:RevolvingCreditFacilityOneBillionSixHundredMillionMember2014-02-070000052988jec:RevolvingCreditFacilityOneBillionSixHundredMillionMemberus-gaap:RevolvingCreditFacilityMember2019-03-27jec:tranche0000052988us-gaap:RevolvingCreditFacilityMember2019-03-272019-03-270000052988us-gaap:LetterOfCreditMember2020-10-020000052988jec:SubFacilityOfSwingLineLoansMember2020-10-020000052988srt:MinimumMember2019-09-282020-10-020000052988srt:MaximumMember2019-09-282020-10-020000052988jec:TermLoanFacility2020Member2020-03-250000052988jec:TermLoanFacility2020Membersrt:SubsidiariesMember2020-03-250000052988jec:A2017TermLoanFacilityMember2017-09-280000052988jec:SeniorNotesAsAmendedNotePurchaseAgreementMember2018-03-120000052988us-gaap:SeniorNotesMember2018-03-120000052988us-gaap:LetterOfCreditMemberjec:RevolvingCreditFacilityOneBillionSixHundredMillionMember2020-10-020000052988jec:RevolvingCreditFacilityOneBillionSixHundredMillionMember2020-10-020000052988us-gaap:LetterOfCreditMemberjec:CommittedAndUncommittedLetterOfCreditFacilityMember2020-10-020000052988us-gaap:LineOfCreditMember2020-10-020000052988us-gaap:SellingGeneralAndAdministrativeExpensesMember2020-06-272020-10-020000052988jec:OperatingLeaseRightOfUseLeaseAssetMember2019-09-282020-10-020000052988us-gaap:PropertyPlantAndEquipmentOtherTypesMember2019-09-282020-10-020000052988jec:NineteenEightyNineEmployeeStockPurchasePlanMember2019-09-282020-10-020000052988jec:NineteenEightyNineEmployeeStockPurchasePlanMember2018-09-292019-09-270000052988jec:NineteenEightyNineEmployeeStockPurchasePlanMember2017-09-302018-09-280000052988jec:GlobalEmployeeStockPurchasePlanMember2019-09-282020-10-020000052988jec:GlobalEmployeeStockPurchasePlanMember2018-09-292019-09-270000052988jec:GlobalEmployeeStockPurchasePlanMember2017-09-302018-09-280000052988jec:NineteenEightyNineEmployeeStockPurchasePlanMember2017-01-192017-01-190000052988jec:GlobalEmployeeStockPurchasePlanMember2017-01-192017-01-190000052988jec:NineteenEightyNineEmployeeStockPurchasePlanMember2020-10-020000052988jec:GlobalEmployeeStockPurchasePlanMember2020-10-020000052988jec:NineteenNinetyNineStockIncentivePlanMember2020-10-020000052988jec:NineteenNinetyNineOutsideDirectorStockPlanMember2020-10-020000052988jec:NineteenNinetyNineStockIncentivePlanMember2019-09-270000052988jec:NineteenNinetyNineOutsideDirectorStockPlanMember2019-09-270000052988jec:NineteenNinetyNineStockIncentivePlanMemberjec:OtherThanOptionStockAppreciationRightsSARSMember2019-09-282020-10-020000052988jec:ServiceConditionMemberus-gaap:RestrictedStockUnitsRSUMember2019-09-282020-10-020000052988jec:ServiceConditionMemberus-gaap:RestrictedStockUnitsRSUMember2018-09-292019-09-270000052988jec:ServiceConditionMemberus-gaap:RestrictedStockUnitsRSUMember2017-09-302018-09-280000052988jec:ServiceMarketAndPerformanceConditionsMemberus-gaap:RestrictedStockUnitsRSUMember2019-09-282020-10-020000052988jec:ServiceMarketAndPerformanceConditionsMemberus-gaap:RestrictedStockUnitsRSUMember2018-09-292019-09-270000052988jec:ServiceMarketAndPerformanceConditionsMemberus-gaap:RestrictedStockUnitsRSUMember2017-09-302018-09-280000052988us-gaap:RestrictedStockUnitsRSUMember2019-09-282020-10-020000052988us-gaap:RestrictedStockUnitsRSUMember2018-09-292019-09-270000052988us-gaap:RestrictedStockUnitsRSUMember2017-09-302018-09-280000052988jec:NineteenNinetyNineStockIncentivePlanMemberus-gaap:RestrictedStockUnitsRSUMember2020-10-020000052988jec:NineteenNinetyNineStockIncentivePlanMemberus-gaap:RestrictedStockUnitsRSUMember2019-09-282020-10-020000052988jec:RangeOfExercisePricesFromThirtyTwoPointFiveOneToThirtySevenPointZeroThreeMember2019-09-282020-10-020000052988jec:RangeOfExercisePricesFromThirtyTwoPointFiveOneToThirtySevenPointZeroThreeMember2020-10-020000052988jec:RangeOfExercisePricesFromThirtySevenPointFourThreeToFortySixPointZeroNineMember2019-09-282020-10-020000052988jec:RangeOfExercisePricesFromThirtySevenPointFourThreeToFortySixPointZeroNineMember2020-10-020000052988jec:RangeOfExercisePricesFromFortySevenPointOneOneToFiftyFivePointOneThreeMember2019-09-282020-10-020000052988jec:RangeOfExercisePricesFromFortySevenPointOneOneToFiftyFivePointOneThreeMember2020-10-020000052988jec:RangeOfExercisePricesFromSixtyPointZeroEightToEightyPointSixThreeMember2019-09-282020-10-020000052988jec:RangeOfExercisePricesFromSixtyPointZeroEightToEightyPointSixThreeMember2020-10-020000052988jec:NineteenNinetyNineOutsideDirectorStockPlanandNineteenNinetyNineStockIncentivePlanMember2019-09-282020-10-020000052988jec:NineteenNinetyNineStockIncentivePlanMemberus-gaap:RestrictedStockMember2019-09-282020-10-020000052988jec:NineteenNinetyNineStockIncentivePlanMemberus-gaap:RestrictedStockMember2018-09-292019-09-270000052988jec:NineteenNinetyNineStockIncentivePlanMemberus-gaap:RestrictedStockMember2017-09-302018-09-280000052988jec:NineteenNinetyNineStockIncentivePlanMemberjec:ServiceConditionMemberus-gaap:RestrictedStockUnitsRSUMember2019-09-282020-10-020000052988jec:NineteenNinetyNineStockIncentivePlanMemberjec:ServiceConditionMemberus-gaap:RestrictedStockUnitsRSUMember2018-09-292019-09-270000052988jec:NineteenNinetyNineStockIncentivePlanMemberjec:ServiceConditionMemberus-gaap:RestrictedStockUnitsRSUMember2017-09-302018-09-280000052988jec:ServiceMarketAndPerformanceConditionsMemberjec:NineteenNinetyNineStockIncentivePlanMemberus-gaap:RestrictedStockUnitsRSUMember2019-09-282020-10-020000052988jec:ServiceMarketAndPerformanceConditionsMemberjec:NineteenNinetyNineStockIncentivePlanMemberus-gaap:RestrictedStockUnitsRSUMember2018-09-292019-09-270000052988jec:ServiceMarketAndPerformanceConditionsMemberjec:NineteenNinetyNineStockIncentivePlanMemberus-gaap:RestrictedStockUnitsRSUMember2017-09-302018-09-280000052988jec:RestrictedStockAndRestrictedStockUnitsMember2019-09-270000052988jec:RestrictedStockAndRestrictedStockUnitsMember2019-09-282020-10-020000052988jec:RestrictedStockAndRestrictedStockUnitsMember2020-10-020000052988jec:NineteenNinetyNineOutsideDirectorStockPlanandNineteenNinetyNineStockIncentivePlanMemberus-gaap:RestrictedStockMember2020-10-020000052988jec:NineteenNinetyNineStockIncentivePlanMemberus-gaap:RestrictedStockMember2020-10-020000052988jec:NineteenNinetyNineStockIncentivePlanMemberjec:ServiceConditionMemberus-gaap:RestrictedStockUnitsRSUMember2020-10-020000052988jec:ServiceMarketAndPerformanceConditionsMemberjec:NineteenNinetyNineStockIncentivePlanMemberus-gaap:RestrictedStockUnitsRSUMember2020-10-020000052988jec:NineteenNinetyNineOutsideDirectorStockPlanMemberjec:ServiceConditionMemberus-gaap:RestrictedStockUnitsRSUMember2019-09-282020-10-020000052988jec:NineteenNinetyNineOutsideDirectorStockPlanMemberjec:ServiceConditionMemberus-gaap:RestrictedStockUnitsRSUMember2018-09-292019-09-270000052988jec:NineteenNinetyNineOutsideDirectorStockPlanMemberjec:ServiceConditionMemberus-gaap:RestrictedStockUnitsRSUMember2017-09-302018-09-280000052988jec:NineteenNinetyNineOutsideDirectorStockPlanMemberus-gaap:RestrictedStockMember2020-10-020000052988jec:NineteenNinetyNineOutsideDirectorStockPlanMemberjec:ServiceConditionMemberus-gaap:RestrictedStockUnitsRSUMember2020-10-020000052988jec:NineteenNinetyNineOutsideDirectorStockPlanMember2019-09-282020-10-020000052988us-gaap:PensionPlansDefinedBenefitMember2019-09-282020-10-020000052988us-gaap:PensionPlansDefinedBenefitMember2019-09-270000052988us-gaap:PensionPlansDefinedBenefitMember2018-09-280000052988us-gaap:OtherPensionPlansDefinedBenefitMember2019-09-270000052988us-gaap:OtherPensionPlansDefinedBenefitMember2018-09-280000052988us-gaap:PensionPlansDefinedBenefitMember2018-09-292019-09-270000052988us-gaap:OtherPensionPlansDefinedBenefitMember2019-09-282020-10-020000052988us-gaap:OtherPensionPlansDefinedBenefitMember2018-09-292019-09-270000052988us-gaap:PensionPlansDefinedBenefitMember2020-10-020000052988us-gaap:OtherPensionPlansDefinedBenefitMember2020-10-020000052988us-gaap:OtherPensionPlansDefinedBenefitMemberjec:CH2MRetireeMedicalandIrelandMemberjec:SverdrupandIrelandPensionPlansMember2019-09-282020-10-020000052988us-gaap:OtherPensionPlansDefinedBenefitMemberjec:CH2MRetireeMedicalandIrelandMemberjec:SverdrupandIrelandPensionPlansMember2018-09-292019-09-270000052988srt:MinimumMemberus-gaap:PensionPlansDefinedBenefitMember2019-09-282020-10-020000052988srt:MaximumMemberus-gaap:PensionPlansDefinedBenefitMember2019-09-282020-10-020000052988srt:MinimumMemberus-gaap:PensionPlansDefinedBenefitMember2018-09-292019-09-270000052988srt:MaximumMemberus-gaap:PensionPlansDefinedBenefitMember2018-09-292019-09-270000052988srt:MinimumMemberus-gaap:PensionPlansDefinedBenefitMember2017-09-302018-09-280000052988srt:MaximumMemberus-gaap:PensionPlansDefinedBenefitMember2017-09-302018-09-280000052988us-gaap:PensionPlansDefinedBenefitMember2017-09-302018-09-280000052988us-gaap:OtherPensionPlansDefinedBenefitMembersrt:MinimumMember2019-09-282020-10-020000052988us-gaap:OtherPensionPlansDefinedBenefitMembersrt:MaximumMember2019-09-282020-10-020000052988us-gaap:OtherPensionPlansDefinedBenefitMembersrt:MinimumMember2018-09-292019-09-270000052988us-gaap:OtherPensionPlansDefinedBenefitMembersrt:MaximumMember2018-09-292019-09-270000052988us-gaap:OtherPensionPlansDefinedBenefitMembersrt:MinimumMember2017-09-302018-09-280000052988us-gaap:OtherPensionPlansDefinedBenefitMembersrt:MaximumMember2017-09-302018-09-280000052988us-gaap:OtherPensionPlansDefinedBenefitMember2017-09-302018-09-280000052988us-gaap:EquitySecuritiesMemberus-gaap:PensionPlansDefinedBenefitMember2020-10-020000052988us-gaap:EquitySecuritiesMemberus-gaap:PensionPlansDefinedBenefitMember2019-09-270000052988us-gaap:OtherPensionPlansDefinedBenefitMemberus-gaap:EquitySecuritiesMember2020-10-020000052988us-gaap:OtherPensionPlansDefinedBenefitMemberus-gaap:EquitySecuritiesMember2019-09-270000052988us-gaap:DebtSecuritiesMemberus-gaap:PensionPlansDefinedBenefitMember2020-10-020000052988us-gaap:DebtSecuritiesMemberus-gaap:PensionPlansDefinedBenefitMember2019-09-270000052988us-gaap:OtherPensionPlansDefinedBenefitMemberus-gaap:DebtSecuritiesMember2020-10-020000052988us-gaap:OtherPensionPlansDefinedBenefitMemberus-gaap:DebtSecuritiesMember2019-09-270000052988us-gaap:RealEstateMemberus-gaap:PensionPlansDefinedBenefitMember2020-10-020000052988us-gaap:RealEstateMemberus-gaap:PensionPlansDefinedBenefitMember2019-09-270000052988us-gaap:OtherPensionPlansDefinedBenefitMemberus-gaap:RealEstateMember2020-10-020000052988us-gaap:OtherPensionPlansDefinedBenefitMemberus-gaap:RealEstateMember2019-09-270000052988us-gaap:PensionPlansDefinedBenefitMemberjec:OtherPlanAssetsMember2020-10-020000052988us-gaap:PensionPlansDefinedBenefitMemberjec:OtherPlanAssetsMember2019-09-270000052988us-gaap:OtherPensionPlansDefinedBenefitMemberjec:OtherPlanAssetsMember2020-10-020000052988us-gaap:OtherPensionPlansDefinedBenefitMemberjec:OtherPlanAssetsMember2019-09-270000052988us-gaap:FairValueInputsLevel1Memberus-gaap:PensionPlansDefinedBenefitMemberjec:USDomesticEquitiesMember2020-10-020000052988us-gaap:FairValueInputsLevel2Memberus-gaap:PensionPlansDefinedBenefitMemberjec:USDomesticEquitiesMember2020-10-020000052988us-gaap:FairValueInputsLevel3Memberus-gaap:PensionPlansDefinedBenefitMemberjec:USDomesticEquitiesMember2020-10-020000052988us-gaap:FairValueMeasuredAtNetAssetValuePerShareMemberus-gaap:PensionPlansDefinedBenefitMemberjec:USDomesticEquitiesMember2020-10-020000052988us-gaap:PensionPlansDefinedBenefitMemberjec:USDomesticEquitiesMember2020-10-020000052988jec:USDomesticBondsMemberus-gaap:FairValueInputsLevel1Memberus-gaap:PensionPlansDefinedBenefitMember2020-10-020000052988us-gaap:FairValueInputsLevel2Memberjec:USDomesticBondsMemberus-gaap:PensionPlansDefinedBenefitMember2020-10-020000052988jec:USDomesticBondsMemberus-gaap:FairValueInputsLevel3Memberus-gaap:PensionPlansDefinedBenefitMember2020-10-020000052988jec:USDomesticBondsMemberus-gaap:FairValueMeasuredAtNetAssetValuePerShareMemberus-gaap:PensionPlansDefinedBenefitMember2020-10-020000052988jec:USDomesticBondsMemberus-gaap:PensionPlansDefinedBenefitMember2020-10-020000052988jec:OverseasBondsMemberus-gaap:FairValueInputsLevel1Memberus-gaap:PensionPlansDefinedBenefitMember2020-10-020000052988jec:OverseasBondsMemberus-gaap:FairValueInputsLevel2Memberus-gaap:PensionPlansDefinedBenefitMember2020-10-020000052988jec:OverseasBondsMemberus-gaap:FairValueInputsLevel3Memberus-gaap:PensionPlansDefinedBenefitMember2020-10-020000052988jec:OverseasBondsMemberus-gaap:FairValueMeasuredAtNetAssetValuePerShareMemberus-gaap:PensionPlansDefinedBenefitMember2020-10-020000052988jec:OverseasBondsMemberus-gaap:PensionPlansDefinedBenefitMember2020-10-020000052988us-gaap:FairValueInputsLevel1Memberus-gaap:CashAndCashEquivalentsMemberus-gaap:PensionPlansDefinedBenefitMember2020-10-020000052988us-gaap:FairValueInputsLevel2Memberus-gaap:CashAndCashEquivalentsMemberus-gaap:PensionPlansDefinedBenefitMember2020-10-020000052988us-gaap:FairValueInputsLevel3Memberus-gaap:CashAndCashEquivalentsMemberus-gaap:PensionPlansDefinedBenefitMember2020-10-020000052988us-gaap:CashAndCashEquivalentsMemberus-gaap:FairValueMeasuredAtNetAssetValuePerShareMemberus-gaap:PensionPlansDefinedBenefitMember2020-10-020000052988us-gaap:CashAndCashEquivalentsMemberus-gaap:PensionPlansDefinedBenefitMember2020-10-020000052988us-gaap:FairValueInputsLevel1Memberus-gaap:MutualFundMemberus-gaap:PensionPlansDefinedBenefitMember2020-10-020000052988us-gaap:FairValueInputsLevel2Memberus-gaap:MutualFundMemberus-gaap:PensionPlansDefinedBenefitMember2020-10-020000052988us-gaap:FairValueInputsLevel3Memberus-gaap:MutualFundMemberus-gaap:PensionPlansDefinedBenefitMember2020-10-020000052988us-gaap:MutualFundMemberus-gaap:FairValueMeasuredAtNetAssetValuePerShareMemberus-gaap:PensionPlansDefinedBenefitMember2020-10-020000052988us-gaap:MutualFundMemberus-gaap:PensionPlansDefinedBenefitMember2020-10-020000052988us-gaap:FairValueInputsLevel1Memberus-gaap:PensionPlansDefinedBenefitMember2020-10-020000052988us-gaap:FairValueInputsLevel2Memberus-gaap:PensionPlansDefinedBenefitMember2020-10-020000052988us-gaap:FairValueInputsLevel3Memberus-gaap:PensionPlansDefinedBenefitMember2020-10-020000052988us-gaap:FairValueMeasuredAtNetAssetValuePerShareMemberus-gaap:PensionPlansDefinedBenefitMember2020-10-020000052988us-gaap:OtherPensionPlansDefinedBenefitMemberus-gaap:FairValueInputsLevel1Memberjec:USDomesticEquitiesMember2020-10-020000052988us-gaap:OtherPensionPlansDefinedBenefitMemberus-gaap:FairValueInputsLevel2Memberjec:USDomesticEquitiesMember2020-10-020000052988us-gaap:OtherPensionPlansDefinedBenefitMemberus-gaap:FairValueInputsLevel3Memberjec:USDomesticEquitiesMember2020-10-020000052988us-gaap:OtherPensionPlansDefinedBenefitMemberus-gaap:FairValueMeasuredAtNetAssetValuePerShareMemberjec:USDomesticEquitiesMember2020-10-020000052988us-gaap:OtherPensionPlansDefinedBenefitMemberjec:USDomesticEquitiesMember2020-10-020000052988us-gaap:OtherPensionPlansDefinedBenefitMemberus-gaap:FairValueInputsLevel1Memberjec:OverseasEquitiesMember2020-10-020000052988us-gaap:OtherPensionPlansDefinedBenefitMemberus-gaap:FairValueInputsLevel2Memberjec:OverseasEquitiesMember2020-10-020000052988us-gaap:OtherPensionPlansDefinedBenefitMemberus-gaap:FairValueInputsLevel3Memberjec:OverseasEquitiesMember2020-10-020000052988us-gaap:OtherPensionPlansDefinedBenefitMemberus-gaap:FairValueMeasuredAtNetAssetValuePerShareMemberjec:OverseasEquitiesMember2020-10-020000052988us-gaap:OtherPensionPlansDefinedBenefitMemberjec:OverseasEquitiesMember2020-10-020000052988us-gaap:OtherPensionPlansDefinedBenefitMemberjec:USDomesticBondsMemberus-gaap:FairValueInputsLevel1Member2020-10-020000052988us-gaap:OtherPensionPlansDefinedBenefitMemberus-gaap:FairValueInputsLevel2Memberjec:USDomesticBondsMember2020-10-020000052988us-gaap:OtherPensionPlansDefinedBenefitMemberjec:USDomesticBondsMemberus-gaap:FairValueInputsLevel3Member2020-10-020000052988us-gaap:OtherPensionPlansDefinedBenefitMemberjec:USDomesticBondsMemberus-gaap:FairValueMeasuredAtNetAssetValuePerShareMember2020-10-020000052988us-gaap:OtherPensionPlansDefinedBenefitMemberjec:USDomesticBondsMember2020-10-020000052988jec:OverseasBondsMemberus-gaap:OtherPensionPlansDefinedBenefitMemberus-gaap:FairValueInputsLevel1Member2020-10-020000052988jec:OverseasBondsMemberus-gaap:OtherPensionPlansDefinedBenefitMemberus-gaap:FairValueInputsLevel2Member2020-10-020000052988jec:OverseasBondsMemberus-gaap:OtherPensionPlansDefinedBenefitMemberus-gaap:FairValueInputsLevel3Member2020-10-020000052988jec:OverseasBondsMemberus-gaap:OtherPensionPlansDefinedBenefitMemberus-gaap:FairValueMeasuredAtNetAssetValuePerShareMember2020-10-020000052988jec:OverseasBondsMemberus-gaap:OtherPensionPlansDefinedBenefitMember2020-10-020000052988us-gaap:OtherPensionPlansDefinedBenefitMemberus-gaap:FairValueInputsLevel1Memberus-gaap:CashAndCashEquivalentsMember2020-10-020000052988us-gaap:OtherPensionPlansDefinedBenefitMemberus-gaap:FairValueInputsLevel2Memberus-gaap:CashAndCashEquivalentsMember2020-10-020000052988us-gaap:OtherPensionPlansDefinedBenefitMemberus-gaap:FairValueInputsLevel3Memberus-gaap:CashAndCashEquivalentsMember2020-10-020000052988us-gaap:OtherPensionPlansDefinedBenefitMemberus-gaap:CashAndCashEquivalentsMemberus-gaap:FairValueMeasuredAtNetAssetValuePerShareMember2020-10-020000052988us-gaap:OtherPensionPlansDefinedBenefitMemberus-gaap:CashAndCashEquivalentsMember2020-10-020000052988us-gaap:OtherPensionPlansDefinedBenefitMemberus-gaap:RealEstateMemberus-gaap:FairValueInputsLevel1Member2020-10-020000052988us-gaap:OtherPensionPlansDefinedBenefitMemberus-gaap:FairValueInputsLevel2Memberus-gaap:RealEstateMember2020-10-020000052988us-gaap:OtherPensionPlansDefinedBenefitMemberus-gaap:FairValueInputsLevel3Memberus-gaap:RealEstateMember2020-10-020000052988us-gaap:OtherPensionPlansDefinedBenefitMemberus-gaap:RealEstateMemberus-gaap:FairValueMeasuredAtNetAssetValuePerShareMember2020-10-020000052988us-gaap:OtherPensionPlansDefinedBenefitMemberus-gaap:FairValueInputsLevel1Memberjec:InsuranceContractsMember2020-10-020000052988us-gaap:OtherPensionPlansDefinedBenefitMemberus-gaap:FairValueInputsLevel2Memberjec:InsuranceContractsMember2020-10-020000052988us-gaap:OtherPensionPlansDefinedBenefitMemberus-gaap:FairValueInputsLevel3Memberjec:InsuranceContractsMember2020-10-020000052988us-gaap:OtherPensionPlansDefinedBenefitMemberjec:InsuranceContractsMemberus-gaap:FairValueMeasuredAtNetAssetValuePerShareMember2020-10-020000052988us-gaap:OtherPensionPlansDefinedBenefitMemberjec:InsuranceContractsMember2020-10-020000052988us-gaap:OtherPensionPlansDefinedBenefitMemberus-gaap:FairValueInputsLevel1Memberus-gaap:HedgeFundsMember2020-10-020000052988us-gaap:OtherPensionPlansDefinedBenefitMemberus-gaap:FairValueInputsLevel2Memberus-gaap:HedgeFundsMember2020-10-020000052988us-gaap:OtherPensionPlansDefinedBenefitMemberus-gaap:FairValueInputsLevel3Memberus-gaap:HedgeFundsMember2020-10-020000052988us-gaap:OtherPensionPlansDefinedBenefitMemberus-gaap:HedgeFundsMemberus-gaap:FairValueMeasuredAtNetAssetValuePerShareMember2020-10-020000052988us-gaap:OtherPensionPlansDefinedBenefitMemberus-gaap:HedgeFundsMember2020-10-020000052988us-gaap:OtherPensionPlansDefinedBenefitMemberus-gaap:FairValueInputsLevel1Memberus-gaap:MutualFundMember2020-10-020000052988us-gaap:OtherPensionPlansDefinedBenefitMemberus-gaap:FairValueInputsLevel2Memberus-gaap:MutualFundMember2020-10-020000052988us-gaap:OtherPensionPlansDefinedBenefitMemberus-gaap:FairValueInputsLevel3Memberus-gaap:MutualFundMember2020-10-020000052988us-gaap:OtherPensionPlansDefinedBenefitMemberus-gaap:MutualFundMemberus-gaap:FairValueMeasuredAtNetAssetValuePerShareMember2020-10-020000052988us-gaap:OtherPensionPlansDefinedBenefitMemberus-gaap:MutualFundMember2020-10-020000052988us-gaap:OtherPensionPlansDefinedBenefitMemberus-gaap:FairValueInputsLevel1Member2020-10-020000052988us-gaap:OtherPensionPlansDefinedBenefitMemberus-gaap:FairValueInputsLevel2Member2020-10-020000052988us-gaap:OtherPensionPlansDefinedBenefitMemberus-gaap:FairValueInputsLevel3Member2020-10-020000052988us-gaap:OtherPensionPlansDefinedBenefitMemberus-gaap:FairValueMeasuredAtNetAssetValuePerShareMember2020-10-020000052988us-gaap:FairValueInputsLevel1Memberus-gaap:PensionPlansDefinedBenefitMemberjec:USDomesticEquitiesMember2019-09-270000052988us-gaap:FairValueInputsLevel2Memberus-gaap:PensionPlansDefinedBenefitMemberjec:USDomesticEquitiesMember2019-09-270000052988us-gaap:FairValueInputsLevel3Memberus-gaap:PensionPlansDefinedBenefitMemberjec:USDomesticEquitiesMember2019-09-270000052988us-gaap:FairValueMeasuredAtNetAssetValuePerShareMemberus-gaap:PensionPlansDefinedBenefitMemberjec:USDomesticEquitiesMember2019-09-270000052988us-gaap:PensionPlansDefinedBenefitMemberjec:USDomesticEquitiesMember2019-09-270000052988jec:USDomesticBondsMemberus-gaap:FairValueInputsLevel1Memberus-gaap:PensionPlansDefinedBenefitMember2019-09-270000052988us-gaap:FairValueInputsLevel2Memberjec:USDomesticBondsMemberus-gaap:PensionPlansDefinedBenefitMember2019-09-270000052988jec:USDomesticBondsMemberus-gaap:FairValueInputsLevel3Memberus-gaap:PensionPlansDefinedBenefitMember2019-09-270000052988jec:USDomesticBondsMemberus-gaap:FairValueMeasuredAtNetAssetValuePerShareMemberus-gaap:PensionPlansDefinedBenefitMember2019-09-270000052988jec:USDomesticBondsMemberus-gaap:PensionPlansDefinedBenefitMember2019-09-270000052988jec:OverseasBondsMemberus-gaap:FairValueInputsLevel1Memberus-gaap:PensionPlansDefinedBenefitMember2019-09-270000052988jec:OverseasBondsMemberus-gaap:FairValueInputsLevel2Memberus-gaap:PensionPlansDefinedBenefitMember2019-09-270000052988jec:OverseasBondsMemberus-gaap:FairValueInputsLevel3Memberus-gaap:PensionPlansDefinedBenefitMember2019-09-270000052988jec:OverseasBondsMemberus-gaap:FairValueMeasuredAtNetAssetValuePerShareMemberus-gaap:PensionPlansDefinedBenefitMember2019-09-270000052988jec:OverseasBondsMemberus-gaap:PensionPlansDefinedBenefitMember2019-09-270000052988us-gaap:FairValueInputsLevel1Memberus-gaap:CashAndCashEquivalentsMemberus-gaap:PensionPlansDefinedBenefitMember2019-09-270000052988us-gaap:FairValueInputsLevel2Memberus-gaap:CashAndCashEquivalentsMemberus-gaap:PensionPlansDefinedBenefitMember2019-09-270000052988us-gaap:FairValueInputsLevel3Memberus-gaap:CashAndCashEquivalentsMemberus-gaap:PensionPlansDefinedBenefitMember2019-09-270000052988us-gaap:CashAndCashEquivalentsMemberus-gaap:FairValueMeasuredAtNetAssetValuePerShareMemberus-gaap:PensionPlansDefinedBenefitMember2019-09-270000052988us-gaap:CashAndCashEquivalentsMemberus-gaap:PensionPlansDefinedBenefitMember2019-09-270000052988us-gaap:FairValueInputsLevel1Memberus-gaap:MutualFundMemberus-gaap:PensionPlansDefinedBenefitMember2019-09-270000052988us-gaap:FairValueInputsLevel2Memberus-gaap:MutualFundMemberus-gaap:PensionPlansDefinedBenefitMember2019-09-270000052988us-gaap:FairValueInputsLevel3Memberus-gaap:MutualFundMemberus-gaap:PensionPlansDefinedBenefitMember2019-09-270000052988us-gaap:MutualFundMemberus-gaap:FairValueMeasuredAtNetAssetValuePerShareMemberus-gaap:PensionPlansDefinedBenefitMember2019-09-270000052988us-gaap:MutualFundMemberus-gaap:PensionPlansDefinedBenefitMember2019-09-270000052988us-gaap:FairValueInputsLevel1Memberus-gaap:PensionPlansDefinedBenefitMember2019-09-270000052988us-gaap:FairValueInputsLevel2Memberus-gaap:PensionPlansDefinedBenefitMember2019-09-270000052988us-gaap:FairValueInputsLevel3Memberus-gaap:PensionPlansDefinedBenefitMember2019-09-270000052988us-gaap:FairValueMeasuredAtNetAssetValuePerShareMemberus-gaap:PensionPlansDefinedBenefitMember2019-09-270000052988us-gaap:OtherPensionPlansDefinedBenefitMemberus-gaap:FairValueInputsLevel1Memberjec:USDomesticEquitiesMember2019-09-270000052988us-gaap:OtherPensionPlansDefinedBenefitMemberus-gaap:FairValueInputsLevel2Memberjec:USDomesticEquitiesMember2019-09-270000052988us-gaap:OtherPensionPlansDefinedBenefitMemberus-gaap:FairValueInputsLevel3Memberjec:USDomesticEquitiesMember2019-09-270000052988us-gaap:OtherPensionPlansDefinedBenefitMemberus-gaap:FairValueMeasuredAtNetAssetValuePerShareMemberjec:USDomesticEquitiesMember2019-09-270000052988us-gaap:OtherPensionPlansDefinedBenefitMemberjec:USDomesticEquitiesMember2019-09-270000052988us-gaap:OtherPensionPlansDefinedBenefitMemberus-gaap:FairValueInputsLevel1Memberjec:OverseasEquitiesMember2019-09-270000052988us-gaap:OtherPensionPlansDefinedBenefitMemberus-gaap:FairValueInputsLevel2Memberjec:OverseasEquitiesMember2019-09-270000052988us-gaap:OtherPensionPlansDefinedBenefitMemberus-gaap:FairValueInputsLevel3Memberjec:OverseasEquitiesMember2019-09-270000052988us-gaap:OtherPensionPlansDefinedBenefitMemberus-gaap:FairValueMeasuredAtNetAssetValuePerShareMemberjec:OverseasEquitiesMember2019-09-270000052988us-gaap:OtherPensionPlansDefinedBenefitMemberjec:OverseasEquitiesMember2019-09-270000052988us-gaap:OtherPensionPlansDefinedBenefitMemberjec:USDomesticBondsMemberus-gaap:FairValueInputsLevel1Member2019-09-270000052988us-gaap:OtherPensionPlansDefinedBenefitMemberus-gaap:FairValueInputsLevel2Memberjec:USDomesticBondsMember2019-09-270000052988us-gaap:OtherPensionPlansDefinedBenefitMemberjec:USDomesticBondsMemberus-gaap:FairValueInputsLevel3Member2019-09-270000052988us-gaap:OtherPensionPlansDefinedBenefitMemberjec:USDomesticBondsMemberus-gaap:FairValueMeasuredAtNetAssetValuePerShareMember2019-09-270000052988us-gaap:OtherPensionPlansDefinedBenefitMemberjec:USDomesticBondsMember2019-09-270000052988jec:OverseasBondsMemberus-gaap:OtherPensionPlansDefinedBenefitMemberus-gaap:FairValueInputsLevel1Member2019-09-270000052988jec:OverseasBondsMemberus-gaap:OtherPensionPlansDefinedBenefitMemberus-gaap:FairValueInputsLevel2Member2019-09-270000052988jec:OverseasBondsMemberus-gaap:OtherPensionPlansDefinedBenefitMemberus-gaap:FairValueInputsLevel3Member2019-09-270000052988jec:OverseasBondsMemberus-gaap:OtherPensionPlansDefinedBenefitMemberus-gaap:FairValueMeasuredAtNetAssetValuePerShareMember2019-09-270000052988jec:OverseasBondsMemberus-gaap:OtherPensionPlansDefinedBenefitMember2019-09-270000052988us-gaap:OtherPensionPlansDefinedBenefitMemberus-gaap:FairValueInputsLevel1Memberus-gaap:CashAndCashEquivalentsMember2019-09-270000052988us-gaap:OtherPensionPlansDefinedBenefitMemberus-gaap:FairValueInputsLevel2Memberus-gaap:CashAndCashEquivalentsMember2019-09-270000052988us-gaap:OtherPensionPlansDefinedBenefitMemberus-gaap:FairValueInputsLevel3Memberus-gaap:CashAndCashEquivalentsMember2019-09-270000052988us-gaap:OtherPensionPlansDefinedBenefitMemberus-gaap:CashAndCashEquivalentsMemberus-gaap:FairValueMeasuredAtNetAssetValuePerShareMember2019-09-270000052988us-gaap:OtherPensionPlansDefinedBenefitMemberus-gaap:CashAndCashEquivalentsMember2019-09-270000052988us-gaap:OtherPensionPlansDefinedBenefitMemberus-gaap:RealEstateMemberus-gaap:FairValueInputsLevel1Member2019-09-270000052988us-gaap:OtherPensionPlansDefinedBenefitMemberus-gaap:FairValueInputsLevel2Memberus-gaap:RealEstateMember2019-09-270000052988us-gaap:OtherPensionPlansDefinedBenefitMemberus-gaap:FairValueInputsLevel3Memberus-gaap:RealEstateMember2019-09-270000052988us-gaap:OtherPensionPlansDefinedBenefitMemberus-gaap:RealEstateMemberus-gaap:FairValueMeasuredAtNetAssetValuePerShareMember2019-09-270000052988us-gaap:OtherPensionPlansDefinedBenefitMemberus-gaap:FairValueInputsLevel1Memberjec:InsuranceContractsMember2019-09-270000052988us-gaap:OtherPensionPlansDefinedBenefitMemberus-gaap:FairValueInputsLevel2Memberjec:InsuranceContractsMember2019-09-270000052988us-gaap:OtherPensionPlansDefinedBenefitMemberus-gaap:FairValueInputsLevel3Memberjec:InsuranceContractsMember2019-09-270000052988us-gaap:OtherPensionPlansDefinedBenefitMemberjec:InsuranceContractsMemberus-gaap:FairValueMeasuredAtNetAssetValuePerShareMember2019-09-270000052988us-gaap:OtherPensionPlansDefinedBenefitMemberjec:InsuranceContractsMember2019-09-270000052988us-gaap:OtherPensionPlansDefinedBenefitMemberus-gaap:FairValueInputsLevel1Memberus-gaap:DerivativeMember2019-09-270000052988us-gaap:OtherPensionPlansDefinedBenefitMemberus-gaap:FairValueInputsLevel2Memberus-gaap:DerivativeMember2019-09-270000052988us-gaap:OtherPensionPlansDefinedBenefitMemberus-gaap:FairValueInputsLevel3Memberus-gaap:DerivativeMember2019-09-270000052988us-gaap:OtherPensionPlansDefinedBenefitMemberus-gaap:DerivativeMemberus-gaap:FairValueMeasuredAtNetAssetValuePerShareMember2019-09-270000052988us-gaap:OtherPensionPlansDefinedBenefitMemberus-gaap:DerivativeMember2019-09-270000052988us-gaap:OtherPensionPlansDefinedBenefitMemberus-gaap:FairValueInputsLevel1Memberus-gaap:HedgeFundsMember2019-09-270000052988us-gaap:OtherPensionPlansDefinedBenefitMemberus-gaap:FairValueInputsLevel2Memberus-gaap:HedgeFundsMember2019-09-270000052988us-gaap:OtherPensionPlansDefinedBenefitMemberus-gaap:FairValueInputsLevel3Memberus-gaap:HedgeFundsMember2019-09-270000052988us-gaap:OtherPensionPlansDefinedBenefitMemberus-gaap:HedgeFundsMemberus-gaap:FairValueMeasuredAtNetAssetValuePerShareMember2019-09-270000052988us-gaap:OtherPensionPlansDefinedBenefitMemberus-gaap:HedgeFundsMember2019-09-270000052988us-gaap:OtherPensionPlansDefinedBenefitMemberus-gaap:FairValueInputsLevel1Memberus-gaap:MutualFundMember2019-09-270000052988us-gaap:OtherPensionPlansDefinedBenefitMemberus-gaap:FairValueInputsLevel2Memberus-gaap:MutualFundMember2019-09-270000052988us-gaap:OtherPensionPlansDefinedBenefitMemberus-gaap:FairValueInputsLevel3Memberus-gaap:MutualFundMember2019-09-270000052988us-gaap:OtherPensionPlansDefinedBenefitMemberus-gaap:MutualFundMemberus-gaap:FairValueMeasuredAtNetAssetValuePerShareMember2019-09-270000052988us-gaap:OtherPensionPlansDefinedBenefitMemberus-gaap:MutualFundMember2019-09-270000052988us-gaap:OtherPensionPlansDefinedBenefitMemberus-gaap:FairValueInputsLevel1Member2019-09-270000052988us-gaap:OtherPensionPlansDefinedBenefitMemberus-gaap:FairValueInputsLevel2Member2019-09-270000052988us-gaap:OtherPensionPlansDefinedBenefitMemberus-gaap:FairValueInputsLevel3Member2019-09-270000052988us-gaap:OtherPensionPlansDefinedBenefitMemberus-gaap:FairValueMeasuredAtNetAssetValuePerShareMember2019-09-270000052988us-gaap:OtherPensionPlansDefinedBenefitMemberus-gaap:FairValueInputsLevel3Memberus-gaap:RealEstateMember2018-09-280000052988us-gaap:OtherPensionPlansDefinedBenefitMemberus-gaap:FairValueInputsLevel3Memberjec:InsuranceContractsMember2018-09-280000052988us-gaap:OtherPensionPlansDefinedBenefitMemberus-gaap:FairValueInputsLevel3Memberus-gaap:HedgeFundsMember2018-09-280000052988us-gaap:OtherPensionPlansDefinedBenefitMemberus-gaap:FairValueInputsLevel3Memberus-gaap:RealEstateMember2018-09-292019-09-270000052988us-gaap:OtherPensionPlansDefinedBenefitMemberus-gaap:FairValueInputsLevel3Memberjec:InsuranceContractsMember2018-09-292019-09-270000052988us-gaap:OtherPensionPlansDefinedBenefitMemberus-gaap:FairValueInputsLevel3Memberus-gaap:HedgeFundsMember2018-09-292019-09-270000052988us-gaap:OtherPensionPlansDefinedBenefitMemberus-gaap:FairValueInputsLevel3Memberus-gaap:RealEstateMember2019-09-282020-10-020000052988us-gaap:OtherPensionPlansDefinedBenefitMemberus-gaap:FairValueInputsLevel3Memberjec:InsuranceContractsMember2019-09-282020-10-020000052988us-gaap:OtherPensionPlansDefinedBenefitMemberus-gaap:FairValueInputsLevel3Memberus-gaap:HedgeFundsMember2019-09-282020-10-020000052988us-gaap:SellingGeneralAndAdministrativeExpensesMember2017-09-302018-09-280000052988us-gaap:OtherRestructuringMemberus-gaap:OtherExpenseMemberjec:CH2MHILLCompaniesLimitedMember2018-09-292019-09-270000052988us-gaap:OtherPensionPlansDefinedBenefitMembercountry:GB2018-09-292019-09-270000052988us-gaap:OtherComprehensiveIncomeMemberus-gaap:OtherPensionPlansDefinedBenefitMembercountry:GB2018-09-292019-09-270000052988us-gaap:OtherPensionPlansDefinedBenefitMembercountry:CA2019-09-282020-10-020000052988us-gaap:OtherPensionPlansDefinedBenefitMembercountry:CA2018-09-292019-09-270000052988us-gaap:OtherPensionPlansDefinedBenefitMembercountry:CA2017-09-302018-09-280000052988us-gaap:OtherPensionPlansDefinedBenefitMembersrt:EuropeMember2019-09-282020-10-020000052988us-gaap:OtherPensionPlansDefinedBenefitMembersrt:EuropeMember2018-09-292019-09-270000052988us-gaap:OtherPensionPlansDefinedBenefitMembersrt:EuropeMember2017-09-302018-09-280000052988country:USus-gaap:PensionPlansDefinedBenefitMember2019-09-282020-10-020000052988country:USus-gaap:PensionPlansDefinedBenefitMember2018-09-292019-09-270000052988country:USus-gaap:PensionPlansDefinedBenefitMember2017-09-302018-09-280000052988jec:JohnWoodGroupMemberjec:ContractsAndBacklogIntangibleMember2020-03-062020-03-060000052988jec:JohnWoodGroupMemberus-gaap:DevelopedTechnologyRightsMember2020-03-062020-03-060000052988jec:ContractsAndBacklogIntangibleMember2019-06-122019-06-120000052988us-gaap:DevelopedTechnologyRightsMember2019-06-122019-06-120000052988us-gaap:OtherIntangibleAssetsMember2019-06-122019-06-120000052988jec:KeyWHoldingCorporationMember2018-09-292019-09-270000052988jec:CustomerRelationshipsContractsAndBacklogMemberjec:CH2MHILLCompaniesLimitedMember2017-12-150000052988jec:LeaseIntangibleAssetsMemberjec:CH2MHILLCompaniesLimitedMember2017-12-150000052988jec:CustomerRelationshipsContractsAndBacklogMembersrt:MinimumMemberjec:CH2MHILLCompaniesLimitedMember2019-09-282020-10-020000052988jec:CustomerRelationshipsContractsAndBacklogMembersrt:MaximumMemberjec:CH2MHILLCompaniesLimitedMember2019-09-282020-10-020000052988jec:CustomerRelationshipsContractsAndBacklogMemberjec:CH2MHILLCompaniesLimitedMember2019-09-282020-10-020000052988jec:OtherIntangibleAssetsAndLiabilitiesMemberjec:CH2MHILLCompaniesLimitedMember2019-09-282020-10-020000052988jec:CH2MHILLCompaniesLimitedMember2017-12-152018-09-280000052988jec:CH2MHILLCompaniesLimitedMember2017-09-302018-09-280000052988jec:WorleyParsonsLimitedECRBusinessMemberus-gaap:SegmentDiscontinuedOperationsMember2019-09-282020-10-020000052988jec:WorleyParsonsLimitedECRBusinessMemberus-gaap:SegmentDiscontinuedOperationsMember2018-09-292019-09-270000052988jec:WorleyParsonsLimitedECRBusinessMemberus-gaap:SegmentDiscontinuedOperationsMember2017-09-302018-09-280000052988jec:NuiPhaoMiningCompanyMember2019-09-282020-10-020000052988jec:NuiPhaoMiningCompanyMemberus-gaap:SegmentDiscontinuedOperationsMember2018-09-292019-09-270000052988jec:WorleyParsonsLimitedECRBusinessMemberjec:GuimarJointVentureMemberus-gaap:OtherOperatingIncomeExpenseMember2017-09-302018-09-280000052988jec:WorleyParsonsLimitedECRBusinessMemberus-gaap:OtherOperatingIncomeExpenseMember2017-09-302018-09-280000052988jec:WorleyParsonsLimitedECRBusinessMemberus-gaap:SegmentDiscontinuedOperationsMember2019-09-270000052988jec:WorleyParsonsLimitedECRBusinessMemberus-gaap:SegmentDiscontinuedOperationsMember2019-04-262019-04-260000052988jec:WorleyParsonsLimitedECRBusinessMemberus-gaap:SegmentDiscontinuedOperationsMember2019-04-260000052988us-gaap:RestrictedStockMemberjec:WorleyStockMember2019-04-262019-04-260000052988jec:WorleyStockMember2019-09-282020-10-020000052988us-gaap:FairValueInputsLevel1Memberjec:WorleyStockMember2020-10-020000052988us-gaap:FairValueInputsLevel1Memberjec:WorleyStockMember2019-09-270000052988us-gaap:RestrictedStockMemberjec:WorleyStockMember2019-09-282020-10-020000052988us-gaap:RestrictedStockMemberjec:WorleyStockMember2018-09-292019-09-270000052988us-gaap:SellingGeneralAndAdministrativeExpensesMember2019-04-262019-04-260000052988us-gaap:OtherOperatingIncomeExpenseMember2019-04-262019-04-260000052988us-gaap:OperatingSegmentsMemberjec:CriticalMissionSolutionsMemberjec:CH2MHILLCompaniesLimitedMember2019-09-282020-10-020000052988us-gaap:OperatingSegmentsMemberjec:CriticalMissionSolutionsMemberjec:CH2MHILLCompaniesLimitedMember2018-09-292019-09-270000052988us-gaap:OperatingSegmentsMemberjec:CriticalMissionSolutionsMemberjec:CH2MHILLCompaniesLimitedMember2017-09-302018-09-280000052988us-gaap:OperatingSegmentsMemberjec:PeopleAndPlacesSolutionsMemberjec:CH2MHILLCompaniesLimitedMember2019-09-282020-10-020000052988us-gaap:OperatingSegmentsMemberjec:PeopleAndPlacesSolutionsMemberjec:CH2MHILLCompaniesLimitedMember2018-09-292019-09-270000052988us-gaap:OperatingSegmentsMemberjec:PeopleAndPlacesSolutionsMemberjec:CH2MHILLCompaniesLimitedMember2017-09-302018-09-280000052988us-gaap:CorporateNonSegmentMemberjec:CH2MHILLCompaniesLimitedMember2019-09-282020-10-020000052988us-gaap:CorporateNonSegmentMemberjec:CH2MHILLCompaniesLimitedMember2018-09-292019-09-270000052988us-gaap:CorporateNonSegmentMemberjec:CH2MHILLCompaniesLimitedMember2017-09-302018-09-280000052988us-gaap:SegmentContinuingOperationsMemberjec:CH2MHILLCompaniesLimitedMember2019-09-282020-10-020000052988us-gaap:SegmentContinuingOperationsMemberjec:CH2MHILLCompaniesLimitedMember2018-09-292019-09-270000052988us-gaap:SegmentContinuingOperationsMemberjec:CH2MHILLCompaniesLimitedMember2017-09-302018-09-280000052988us-gaap:OperatingSegmentsMemberjec:EnergyChemicalsandResourcesMemberjec:CH2MHILLCompaniesLimitedMember2019-09-282020-10-020000052988us-gaap:OperatingSegmentsMemberjec:EnergyChemicalsandResourcesMemberjec:CH2MHILLCompaniesLimitedMember2018-09-292019-09-270000052988us-gaap:OperatingSegmentsMemberjec:EnergyChemicalsandResourcesMemberjec:CH2MHILLCompaniesLimitedMember2017-09-302018-09-280000052988jec:CH2MHILLCompaniesLimitedMember2019-09-282020-10-020000052988jec:CH2MHILLCompaniesLimitedMember2018-09-292019-09-270000052988us-gaap:SegmentContinuingOperationsMemberus-gaap:OtherExpenseMemberjec:CH2MHILLCompaniesLimitedMember2019-09-282020-10-020000052988us-gaap:SegmentContinuingOperationsMemberus-gaap:OtherExpenseMemberjec:CH2MHILLCompaniesLimitedMember2018-09-292019-09-270000052988us-gaap:SegmentContinuingOperationsMemberus-gaap:OtherExpenseMemberjec:CH2MHILLCompaniesLimitedMember2017-09-302018-09-280000052988us-gaap:OtherRestructuringMemberus-gaap:OtherExpenseMemberjec:CH2MHILLCompaniesLimitedMember2019-09-282020-10-020000052988jec:WriteoffofDeferredTaxAssetMemberjec:CH2MHILLCompaniesLimitedMember2019-09-282020-10-020000052988jec:A2015RestructuringPlanMember2020-10-020000052988jec:LeaseAbandonmentMemberjec:CH2MHILLCompaniesLimitedMember2019-09-282020-10-020000052988jec:LeaseAbandonmentMemberjec:CH2MHILLCompaniesLimitedMember2018-09-292019-09-270000052988jec:LeaseAbandonmentMemberjec:CH2MHILLCompaniesLimitedMember2017-09-302018-09-280000052988jec:InvoluntaryTerminationsMemberjec:CH2MHILLCompaniesLimitedMember2019-09-282020-10-020000052988jec:InvoluntaryTerminationsMemberjec:CH2MHILLCompaniesLimitedMember2018-09-292019-09-270000052988jec:InvoluntaryTerminationsMemberjec:CH2MHILLCompaniesLimitedMember2017-09-302018-09-280000052988jec:OutsideServicesMemberjec:CH2MHILLCompaniesLimitedMember2019-09-282020-10-020000052988jec:OutsideServicesMemberjec:CH2MHILLCompaniesLimitedMember2018-09-292019-09-270000052988jec:OutsideServicesMemberjec:CH2MHILLCompaniesLimitedMember2017-09-302018-09-280000052988us-gaap:OtherRestructuringMemberjec:CH2MHILLCompaniesLimitedMember2019-09-282020-10-020000052988us-gaap:OtherRestructuringMemberjec:CH2MHILLCompaniesLimitedMember2018-09-292019-09-270000052988us-gaap:OtherRestructuringMemberjec:CH2MHILLCompaniesLimitedMember2017-09-302018-09-280000052988jec:LeaseAbandonmentMember2020-10-020000052988jec:InvoluntaryTerminationsMember2020-10-020000052988jec:OutsideServicesMember2020-10-020000052988us-gaap:OtherRestructuringMember2020-10-020000052988us-gaap:InterestRateSwapMember2020-10-020000052988us-gaap:CrossCurrencyInterestRateContractMember2020-10-020000052988srt:MaximumMemberus-gaap:CrossCurrencyInterestRateContractMember2019-09-282020-10-020000052988srt:MinimumMemberus-gaap:InterestRateSwapMember2020-10-020000052988srt:MaximumMemberus-gaap:InterestRateSwapMember2020-10-020000052988us-gaap:LondonInterbankOfferedRateLIBORMemberus-gaap:CrossCurrencyInterestRateContractMember2020-10-020000052988srt:MinimumMemberus-gaap:CrossCurrencyInterestRateContractMember2020-10-020000052988srt:MaximumMemberus-gaap:CrossCurrencyInterestRateContractMember2020-10-020000052988jec:CrossCurrencyInterestRateContractAndInterestRateSwampMember2020-10-020000052988us-gaap:ForeignExchangeForwardMember2020-10-020000052988srt:MinimumMemberus-gaap:ForeignExchangeForwardMember2019-09-282020-10-020000052988srt:MaximumMemberus-gaap:ForeignExchangeForwardMember2019-09-282020-10-020000052988us-gaap:SuretyBondMember2020-10-020000052988srt:MinimumMemberus-gaap:CrossCurrencyInterestRateContractMember2019-09-282020-10-020000052988jec:NuiPhaoMiningCompanyMember2019-08-302019-08-300000052988jec:NuiPhaoMiningCompanyMember2019-12-272019-12-27utr:MW0000052988jec:GeneralElectricAndGEElectricalInternationalIncorporationMemberus-gaap:PendingLitigationMember2012-09-280000052988jec:GeneralElectricAndGEElectricalInternationalIncorporationMembersrt:MinimumMemberus-gaap:PendingLitigationMember2017-08-012017-08-310000052988jec:JKCAustraliaLNGPtyLimitedMemberus-gaap:PendingLitigationMember2017-08-012017-08-31jec:case0000052988jec:KingstonPowerPlantoftheTVAPrimaryCaseGregAdkissonETALv.JacobsEngineeringGroupInc.Member2020-10-020000052988jec:KingstonPowerPlantOfTheTVASecondaryCaseNo313CV505TAVHBGMember2020-10-020000052988jec:AerospaceAndTechnologyMemberus-gaap:OperatingSegmentsMember2019-09-282020-10-020000052988jec:AerospaceAndTechnologyMemberus-gaap:OperatingSegmentsMember2018-09-292019-09-270000052988jec:AerospaceAndTechnologyMemberus-gaap:OperatingSegmentsMember2017-09-302018-09-280000052988us-gaap:OperatingSegmentsMemberjec:BuildingsAndInfrastructureMember2019-09-282020-10-020000052988us-gaap:OperatingSegmentsMemberjec:BuildingsAndInfrastructureMember2018-09-292019-09-270000052988us-gaap:OperatingSegmentsMemberjec:BuildingsAndInfrastructureMember2017-09-302018-09-280000052988us-gaap:OperatingSegmentsMember2019-09-282020-10-020000052988us-gaap:OperatingSegmentsMember2018-09-292019-09-270000052988us-gaap:OperatingSegmentsMember2017-09-302018-09-280000052988us-gaap:CorporateNonSegmentMember2019-09-282020-10-020000052988us-gaap:CorporateNonSegmentMember2018-09-292019-09-270000052988us-gaap:CorporateNonSegmentMember2017-09-302018-09-280000052988jec:WorleyParsonsLimitedECRBusinessMemberus-gaap:OtherExpenseMember2019-09-282020-10-020000052988jec:WorleyParsonsLimitedECRBusinessMemberus-gaap:OtherExpenseMember2018-09-292019-09-270000052988jec:WorleyParsonsLimitedECRBusinessMember2019-09-282020-10-020000052988jec:WorleyParsonsLimitedECRBusinessMember2018-09-292019-09-2700000529882019-09-282019-12-2700000529882019-12-282020-03-2700000529882020-03-282020-06-2600000529882020-06-272020-10-0200000529882018-09-292018-12-2800000529882018-12-292019-03-2900000529882019-03-302019-06-2800000529882019-06-292019-09-270000052988us-gaap:OperatingIncomeLossMember2019-09-282019-12-270000052988jec:NetEarningsMember2019-09-282019-12-270000052988us-gaap:OperatingIncomeLossMember2019-12-282020-03-270000052988jec:NetEarningsMember2019-12-282020-03-270000052988us-gaap:OperatingIncomeLossMember2020-03-282020-06-260000052988jec:NetEarningsMember2020-03-282020-06-260000052988us-gaap:OperatingIncomeLossMember2020-06-272020-10-020000052988jec:NetEarningsMember2020-06-272020-10-020000052988jec:WorleyParsonsLimitedECRBusinessMemberus-gaap:SegmentContinuingOperationsMember2020-06-272020-10-020000052988us-gaap:SegmentContinuingOperationsMemberjec:A2020TransformationInitiativeMember2018-09-292019-09-270000052988us-gaap:OperatingIncomeLossMember2018-09-292018-12-280000052988jec:NetEarningsMember2018-09-292018-12-280000052988us-gaap:OperatingIncomeLossMember2018-12-292019-03-290000052988jec:NetEarningsMember2018-12-292019-03-290000052988us-gaap:OperatingIncomeLossMember2019-03-302019-06-280000052988jec:NetEarningsMember2019-03-302019-06-280000052988us-gaap:OperatingIncomeLossMember2019-06-292019-09-270000052988jec:NetEarningsMember2019-06-292019-09-270000052988jec:WorleyParsonsLimitedECRBusinessMemberus-gaap:SegmentContinuingOperationsMember2018-09-292019-09-270000052988jec:WorleyParsonsLimitedECRBusinessMemberus-gaap:SegmentDiscontinuedOperationsMember2019-06-292019-09-270000052988jec:NuiPhaoMiningCompanyMember2019-06-292019-09-27
UNITED STATES
SECURITIES AND EXCHANGE COMMISSION
Washington, D.C. 20549
_________________________________________________________________
FORM 10-K
(Mark One)
☒ ANNUAL REPORT PURSUANT TO SECTION 13 OR 15(d) OF THE SECURITIES EXCHANGE ACT OF 1934
For the fiscal year ended October 2, 2020
OR
☐ TRANSITION REPORT PURSUANT TO SECTION 13 OR 15(d) OF THE SECURITIES EXCHANGE ACT OF 1934
For the transition period from ____ to ____
Commission File No. 1-7463
_________________________________________________________________
Jacobs Engineering Group Inc.
| | | | | | | | | | | | | | |
| Delaware | | | | 95-4081636 |
| (State or other jurisdiction of incorporation or organization) | | | | (IRS Employer
identification number) |
| | | | | |
| 1999 Bryan Street | Suite 1200 | Dallas | Texas | 75201 |
| (Address of principal executive offices) | | | | (Zip Code) |
(214) 583 – 8500
(Registrant’s telephone number, including area code)
Securities registered pursuant to Section 12(b) of the Act:
_________________________________________________________________
| | | | | | | | | | | |
| Title of Each Class | | Trading Symbol(s) | Name of Each Exchange on Which Registered |
| Common Stock | $1 par value | J | New York Stock Exchange |
Securities registered pursuant to Section 12(g) of the Act: None
_________________________________________________________________
Indicate by check-mark if the Registrant is a well-known seasoned issuer, as defined in Rule 405 of the Securities Act: ☒ Yes ☐ No
Indicate by check-mark if the Registrant is not required to file reports pursuant to Section 13 or 15(d) of the Act. ☐ Yes ☒ No
Indicate by check-mark whether the Registrant (1) has filed all reports required to be filed by Section 13 or 15(d) of the Securities Exchange Act of 1934 during the preceding 12 months (or for such shorter period that the Registrant was required to file such reports), and (2) has been subject to such filing requirements for the past 90 days. ☒ Yes ☐ No
Indicate by check-mark whether the Registrant: has submitted electronically every Interactive Data File required to be submitted pursuant to Rule 405 of Regulation S-T (§232.405 of this chapter) during the preceding 12 months (or for such shorter period that the Registrant was required to submit such files). ☒ Yes ☐ No
Indicate by check-mark whether the Registrant is a large accelerated filer, an accelerated filer, a non-accelerated filer or a smaller reporting company. See the definitions of “large accelerated filer”, “accelerated filer” and “smaller reporting company” in Rule 12b-2 of the Exchange Act.
| | | | | | | | | | | | | | | | | | | | |
| Large accelerated filer | | ☒ | | Accelerated filer | | ☐ |
| Non-accelerated filer | | ☐ | | Smaller reporting company | | ☐ |
| Emerging growth company | | ☐ | | | | |
If an emerging growth company, indicate by check mark if the registrant has elected not to use the extended transition period for complying with any new or revised financial accounting standards provided pursuant to Section 13(a) of the Exchange Act. ☐
Indicate by check mark whether the registrant has filed a report on and attestation to its management's assessment of the effectiveness of its internal control over financial reporting under Section 404(b) of the Sarbanes-Oxley Act (15 U.S.C. 7262(b)) by the registered public accounting firm that prepared or issued its audit report. ☒
Indicate by check-mark whether the Registrant is a shell company (as defined in Rule 12b-2 of the Act) ☐ Yes ☒ No
There were 129,623,428 shares of common stock outstanding as of November 12, 2020. The aggregate market value of the Registrant’s common equity held by non-affiliates was approximately $9.6 billion as of March 27, 2020, based upon the last reported sales price on the New York Stock Exchange on that date.
DOCUMENTS INCORPORATED BY REFERENCE
Portions of the Registrant’s definitive proxy statement to be issued in connection with its 2021 annual meeting of shareholders are incorporated by reference into Part III of this Annual Report on Form 10-K where indicated.
JACOBS ENGINEERING GROUP INC.
Fiscal 2020 Annual Report on Form 10-K
Table of Contents
| | | | | | | | | | | | | | | | | | | | |
| Item | | | | | | Page No. |
| | | | | | |
| | | Item 1. | | | | |
| | | Item 1A. | | | | |
| | | Item 1B. | | | | |
| | | Item 2. | | | | |
| | | Item 3. | | | | |
| | | Item 4. | | | | |
| | | | | | | |
| | | | | | |
| | | Item 5. | | | | |
| | | Item 6. | | | | |
| | | Item 7. | | | | |
| | | Item 7A. | | | | |
| | | Item 8. | | | | |
| | | Item 9. | | | | |
| | | Item 9A. | | | | |
| | | Item 9B. | | | | |
| | | | | | | |
| | | | | | |
| | | Item 10. | | | | |
| | | Item 11. | | | | |
| | | Item 12. | | | | |
| | | Item 13. | | | | |
| | | Item 14. | | | | |
| | | | | | | |
| | | | | | |
| | | Item 15. | | | | |
| | | | | | | |
PART I
FORWARD-LOOKING STATEMENTS
In addition to historical information, this Annual Report on Form 10-K contains forward-looking statements within the meaning of the Private Securities Litigation Reform Act of 1995, including, among other things, statements regarding our future operations, financial condition, and business strategies and future economic and industry conditions. Forward-looking statements are statements that do not directly relate to any historical or current fact. When used herein, words such as "expects," "anticipates," "believes," "seeks," "estimates," "plans," "intends," “future,” “will,” “would,” “could,” “can,” “may,” and similar words are intended to identify forward-looking statements. You should not place undue reliance on these forward-looking statements. Although such statements are based on management’s current estimates and expectations and/or currently available competitive, financial, and economic data, forward-looking statements are inherently uncertain and involve risks and uncertainties that could cause our actual results to differ materially from what may be inferred from the forward-looking statements. Factors that could cause or contribute to such differences include, but are not limited to, those listed and discussed in Item 1A— Risk Factors below. We undertake no obligation to release publicly any revisions or updates to any forward-looking statements. We encourage you to read carefully the risk factors described herein and in other documents we file from time to time with the United States Securities and Exchange Commission (the "SEC").
Unless the context otherwise requires, all references herein to "Jacobs" or the "Registrant" are to Jacobs Engineering Group Inc. and its predecessors, and references to the "Company", "we", "us" or "our" are to Jacobs Engineering Group Inc. and its consolidated subsidiaries.
Item 1. BUSINESS
At Jacobs, we’re challenging today to reinvent tomorrow by solving the world’s most critical problems for thriving cities, resilient environments, mission-critical outcomes, operational advancement, scientific discovery and cutting-edge manufacturing, turning abstract ideas into realities that transform the world for good. Leveraging a talent force of more than 55,000, Jacobs provides a full spectrum of professional services including consulting, technical, scientific and project delivery for the government and private sector.
Our deep global domain knowledge - applied together with the latest advances in technology - are why customers large and small choose to partner with Jacobs. We operate in two lines of business: Critical Mission Solutions and People & Places Solutions.
After spending three years transforming our portfolio and setting the foundation to get us where we are today, we launched a three-year accelerated profitable growth strategy at our Investor Day in February 2019, focused on innovation and continued transformation to build upon our position as the leading solutions provider for our clients. This transformation included the $3.2 billion acquisition of CH2M Hill Companies, Ltd ("CH2M") and the $3.4 billion divestiture of the Company's energy, chemicals and resources business. The alignment of revenue synergies was key to the successful integration of CH2M and created a model for successful follow-on integrations like The KeyW Holding Corporation and John Wood Group’s nuclear business. These acquisitions further position us as a leader in high-value government services and technology-enabled solutions, enhancing our portfolio by adding intellectual property-driven technology with unique proprietary C5ISR (command, control, communications, computer, combat systems, intelligence, surveillance and reconnaissance) rapid solutions, and amplifying Jacobs’ position as a Tier-1 global nuclear services provider.
We have turned the course of Jacobs’ future and are now focused on broadening our leadership in sustainable, high growth sectors. As part of our strategy, our new brand was created from an understanding of where we’ve been, what’s true to our culture and our strategy going forward. We articulate our bold creativity in our brand promise: Challenging today. Reinventing tomorrow. Signaling our transition from an engineering and construction company to a global technology-forward solutions company, we began trading as “J” on the New York Stock Exchange in December 2019. Our Transformation Office is charged with driving further innovation, delivering value-creating solutions for our clients and leveraging an integrated digital and technology strategy to improve our efficiency and effectiveness, ultimately freeing up valuable time and resources for reinvestment in our people.
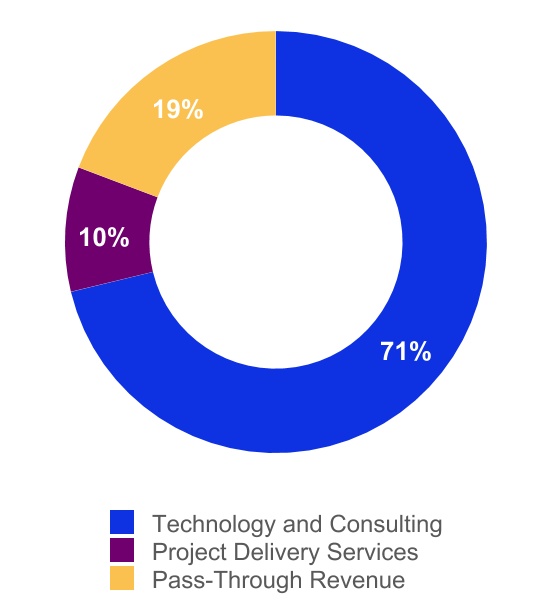
Revenue by Type (Fiscal Year 2020)
Technology and Consulting includes cybersecurity, data analytics, systems and software application integration services and consulting, enterprise and mission IT services, engineering and design, nuclear services, enterprise level operations and maintenance and other highly technical consulting solutions within Critical Mission Solutions (CMS) and data analytics, artificial intelligence and automation, software development as well as digitally-driven consulting, planning and architecture, program management and other highly technical consulting solutions within People & Places Solutions (P&PS).
Project Delivery Services includes management and execution of wind-tunnel design-build projects in CMS and progressive design-build for water and construction management for our Advanced Facilities business in P&PS. We believe these services are lower risk than typical lump-sum type construction contracting.
Pass-through Revenue includes P&PS procurement activities and revenue where we are acting as principal for subcontract labor or third-party materials and equipment and are consequently reflected in both revenues and costs.
Challenging today. Reinventing tomorrow
Our values continue to guide our behaviors, relationships and outcomes - allowing us to act as one company and unify us worldwide when interacting with our clients, employees, communities and shareholders.
•We do things right. We always act with integrity - taking responsibility for our work, caring for our people and staying focused on safety and sustainability. We make investments in our clients, people and communities, so we can grow together.
•We challenge the accepted. We know that to create a better future, we must ask the difficult questions. We always stay curious and are not afraid to try new things.
•We aim higher. We do not settle - always looking beyond to raise the bar and deliver with excellence. We are committed to our clients by bringing innovative solutions that lead to profitable growth and shared success.
•We live inclusion. We put people at the heart of our business. We have an unparalleled focus on inclusion, with a diverse team of visionaries, thinkers and doers. We embrace all perspectives, collaborating to make a positive impact.
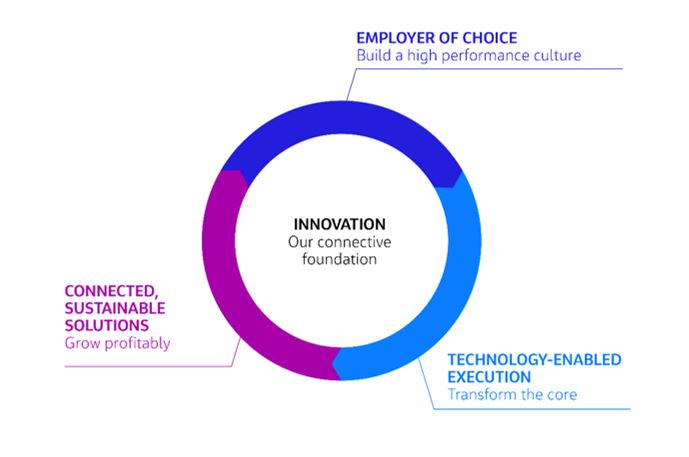
Our three-pillar strategy is based on the foundation of these values, as we drive to become the employer of choice, deliver connected and sustainable solutions, and leverage technology-enabled execution.
We do things right
We always act with integrity - taking responsibility for our work, caring for our people and staying focused on safety and sustainability. We make investments in our clients, people and communities, so we can grow together.
From the way we operate our business, to the work we perform with clients and other organizations, we continue to look at ways we can make a positive environmental, societal and economic difference for our people, businesses, governments and communities around the world.
As we face some of the world’s toughest challenges, including clean water, affordable energy, connectivity, resilient environments, climate change, environmental pollution and economic growth, our people are discovering better ways to create an enduring legacy.
PlanBeyondSM is our approach to sustainability - planning beyond today for a more sustainable future for everyone. For us, this means social and economic progress while protecting our environment and improving resilience.
Leadership on climate change and social value
In April 2020, we published our first company Climate Action Plan committing to 100% renewable energy for our operations in 20201, net zero carbon for our operations and business travel in 2020, and being carbon negative for our operations and business travel by 2030. We will achieve net zero carbon in line with global standard PAS 2060:2014.
Our ESG Disclosures Report provides supplementary information regarding our Environmental, Social and Governance (ESG) performance, organized according to the Sustainability Accounting Standards Board (SASB) framework.
1 Jacobs has achieved its 2020 Climate Action Plan commitments: carbon neutral status and 100% renewable electricity.
Our partnership with Simetrica (a U.K.-based organization that specializes in social value measurement and wellbeing analysis) enables us to help clients understand how they can transform local, city and regional decision-making – identifying innovative, inclusive and ethical investments that will drive social change, spread prosperity and meet the growing challenges facing communities. In collaboration with Simetrica-Jacobs, we released a thought leadership paper titled Before & Beyond the Build: A blueprint for creating social value through infrastructure investments. The paper explores how infrastructure investments can contribute to addressing critical societal issues and how infrastructure could be planned, delivered/built and operated to generate enduring social value at scale and help overcome entrenched social issues in our communities.
Developing our talent … a world where you can
We put the spotlight on ensuring that Jacobs is an employer of choice in every way: we aspire to be a merit-based organization that is inclusive and diverse; we take on the responsibility to continually recruit and develop the best talent.
We are building an inclusive and diverse culture to provide a solid foundation for selecting, developing and retaining the best and brightest minds at Jacobs. Our eight Jacobs Employee Networks (JENs) play a critical role in attracting new talent into our business, helping to shape our recruiting strategies and policies, our science, technology, engineering,
arts and math (STEAM) programs, and our accessibility practices, including our Disability Employment Action Plan. Our global STEAM Ambassador network helps us build partnerships with schools and other educational organizations and form lasting relationships that inspire the next generation and sustain our business.
Our global career program "e3: engage. excel. elevate." is our unique approach to ensuring every employee can engage with our global network, excel in their role and elevate their career. Our Total Rewards Compensation Program, includes our unique Global Career Structure framework, combining career planning and development resources and tools
within a consistent career structure.
Conducting our business with integrity
Jacobs' ethics and Code of Conduct are rooted in our values and provide the standards and support to help us successfully navigate issues, make the right decisions and conduct our business with the integrity that reflects our heritage and ethical reputation. We hold our suppliers and business partners to the same standards.
Our culture of caring
BeyondZero® is our approach to the health, safety and security of our people, the protection of the environment and the resilience of Jacobs. Our BeyondZero® culture of caring goes beyond taking health and safety statistics to zero, so that genuine care and respect for all people are fundamental to our culture and reaches beyond our workplace. We work together to create a workplace that values the safety, positive mental health and sense of belonging of all employees.
While our BeyondZero journey started with safety, as we continued to drive our injury rates down, we also expanded our thinking to our broader culture of caring and particularly mental health. Through our mental health matters program, we furthered our industry-leading efforts to empower our workforce, so they know they work in an environment where their mental health and well-being is the top priority and where everyone can "bring their whole self to work." We have almost 2,000 Positive Mental Health Champions trained in how to guide staff who have mental health concerns or crises to the appropriate level of help; support fellow employees; and help us encourage positive mental health throughout the workplace.
Supporting our communities
We live and play in the communities where we work - so we’re personally invested in doing what is right for people in the places and communities we’re connected with. We craft solutions that affect the way people live. Thinking beyond one-dimensional approaches to help improve social, environmental and economic resiliency. We provide infrastructure, technology and intelligence solutions to help communities build resiliency today for a better tomorrow.
From volunteering, employee matching campaigns and other fundraising, to providing wide-ranging technical and logistics support, every day, Jacobs employees around the world make a positive difference for our clients and communities. As part of our PlanBeyond™ sustainability strategy, the Collectively℠ program (our Global Giving and Volunteering program) governs and centralizes our giving strategy and budget and provides a user-friendly way for employees to donate and volunteer. The program unites our approximately 55,000 employees to support more than 2 million charities around the globe.
We challenge the accepted
We know that to create a better future, we must ask the difficult questions. We always stay curious and are not afraid to try new things.
What we do is more than a job, we work every day to make the world better for all. To us, everything we do - whether water scarcity, aging infrastructure, access to life-saving therapies or sophisticated cyberattacks - is more than projects outlined in proposals and business plans. They’re our challenges as human beings, too.
Transforming our innovation culture
For us, innovation means creating and delivering value — whether it’s new or different ideas, ways of working, services or solutions. In the past year, we continued pushing our innovative mindset. We established our Innovation as a Service series of workshops and embraced an innovation portfolio management platform to enable collaboration across internal and external teams, facilitating knowledge sharing and leading commercial practices. We launched two Jacobs podcasts series, If/When and Inflection Points, and virtual engagement platforms like our Trends & Directions videocasts and In the kNOW webinar series.
Beyond If is our award-winning global innovation program instilling and sustaining our innovation culture. It represents our creativity and agility to challenge the accepted, with the domain expertise to push beyond our boundaries and deliver for today and into tomorrow. We act to turn ideas into reality and create outcomes that deliver value for our clients and society at large.
We aim higher
We do not settle - always looking beyond to raise the bar and deliver with excellence. We are committed to our clients by bringing innovative solutions that lead to profitable growth and shared success. We take on some of the world’s biggest challenges, bringing a different way of thinking to everything we do, challenging the status quo and questioning what others might accept.
We craft solutions that affect the way people live. From first-of-its-kind environmental cleanup efforts to digital twin technologies, from helping communities adapt and thrive to retrofitting vaccine facilities to protect public health, we solve for better, never losing sight of our responsibility to each other. We work with NASA scientists to leverage remotely-sensed data and images shot from 240 miles overhead on the International Space Station to provide critical disaster response aid, and help communities recover. And, we’re on the ground assisting with critical Federal Emergency Management Agency (FEMA) disaster-related operations throughout the U.S. and its territories.
The table below highlights examples of our key focus areas where we combine our deep domain knowledge with the latest advances in technology to deliver solutions to solve our customer's most complex challenges.
BeyondExcellence℠ is our global program focused on quality, performance excellence and recognizing those who set the new standard through our awards program.
We live inclusion
We put people at the heart of our business. We have an unparalleled focus on inclusion, with a diverse team of visionaries, thinkers and doers. We embrace all perspectives, collaborating to make a positive impact.
The aperture of inclusion is broader than lifestyle and culture. Joining, belonging and thriving - these are Jacobs’ key elements in retaining talent and developing a culture where people want to stay - a place where you can bring your whole self to work. Fiscal 2020 brought a lot of change for our people - a talent force of approximately 55,000 - and we doubled down on making sure talent, inclusion and diversity remained at the top of our priorities by focusing on the employee experience.
Our eight Jacobs Employee Networks (JENs) have nearly 23,000 members among them and work to promote inclusion and equality, not only within Jacobs but with our clients, potential recruits and with the communities that we serve. The JENs are entirely employee-led and organized, partnering with leadership to drive strategy and policy.
In 2020, we launched our global Action Plan for Advancing Justice and Equality. Driven by members of our Black employee network, Harambee, in partnership with our Executive Leadership Team and Jacobs’ Board of Directors, the plan sets out actionable initiatives and measurable objectives to address embedded and systemic racial inequalities both within Jacobs and in communities across the world.
We tied inclusive behavior to our leaders’ performance review and compensation programs and delivered conscious inclusion training to nearly all (98%) of our people.
TogetherBeyond℠ is our approach to living inclusion every day and enabling diversity and equality globally. It’s not just about numbers, statistics or quotas — it’s about every one of our people and the collective strength we take from their unique perspectives, ambitions and dreams.
We maintain agile and disciplined capital deployment
Consistent with our profitable growth strategy, Jacobs pursues acquisitions, divestitures and other transactions to maximize long-term value by continuing to reshape its portfolio to higher value solutions.
On April 26, 2019, Jacobs completed the sale of its Energy, Chemicals and Resources ("ECR") business to Worley Limited, a company incorporated in Australia ("Worley"), for a purchase price of $3.4 billion consisting of (i) $2.8 billion in cash plus (ii) 58.2 million ordinary shares of Worley, subject to adjustments for changes in working capital and certain other items (the “ECR sale”). ECR provided engineering and construction services mainly for energy, chemicals and resources sectors. With the sale of ECR, the Company has exited direct hire construction and fixed price lump sum energy related construction.
The Company has deployed capital to accelerate its profitable growth strategy through the following recent acquisitions:
•On March 6, 2020, we acquired the nuclear consulting, remediation and program management business of John Wood Group ("John Wood Group" or "Wood Group"), a U.K.-based energy services company.
•On June 12, 2019, we acquired The KeyW Holding Corporation (“KeyW”), a U.S. based national security technology solutions provider to the intelligence, cyber, and counterterrorism communities
•On December 15, 2017, we acquired CH2M, a provider of consulting and other services in the water, environmental, transportation and nuclear remediation sectors.
During fiscal 2020 the Company repurchased $337.3 million of shares and paid $144.0 million in dividends to shareholders and noncontrolling interests.
For additional information regarding certain issues related to our acquisition strategy, please refer to Item 1A- Risk Factors below.
Impact of COVID-19 on Our Business
On March 11, 2020, the World Health Organization characterized the outbreak of the novel coronavirus (“COVID-19”) as a global pandemic and recommended certain containment and mitigation measures. On March 13, 2020, the United States declared a national emergency concerning the outbreak, and the vast majority of states and many municipalities declared public health emergencies or took similar actions. Along with these declarations, there were extraordinary and wide-ranging actions taken by international, federal, state and local public health and governmental authorities to contain and combat outbreaks of COVID-19 in regions across the United States and around the world. These actions included quarantines and “stay-at-home” or “shelter-in-place” orders, social distancing measures, travel restrictions, school closures and similar mandates for many individuals in order to substantially restrict daily activities and orders for many businesses to curtail or cease normal operations unless their work is critical, essential or life-sustaining. Although certain jurisdictions have subsequently taken steps to lift or ease such restrictions to various degrees, many jurisdictions have subsequently reversed, or indicated they are considering reversing, such lifting or easing in response to increased cases of COVID-19. In addition, governments and central banks in the United States and other countries in which we operate have enacted fiscal and monetary stimulus and assistance measures to counteract the economic impacts of COVID-19.
As it became clear that the pandemic was unparalleled in the rate of community spread, we took early, decisive action to put people first, help flatten the curve and take care of our clients and communities. In early March, we swiftly restricted travel and established return protocols for both client-related and personal travel. In 10 days, we successfully transitioned more than 85% of our employees to a remote working environment to support physical distancing. Where the essential and mission-critical nature of our work requires us to maintain staff at certain sites or locations, we worked closely with our clients and established project-specific plans designed to ensure the safety of our people and the integrity of our operation. Using technology and optimizing our networks, we continue to offer flexible work scenarios for our people, and to deliver business continuity for and continued collaboration with our clients. Our Executive Leadership Team met daily for the first three months and weekly thereafter, focusing on transparency, agile response and business resiliency; and our global and regional crisis management teams continued to maintain consistent messaging and direct local responses. Regular global Town Halls, a weekly Chair and CEO email and short, self-produced leadership videos share open, transparent information to connect and unite our global community.
We are a company operating in a critical infrastructure industry, as defined by the U.S. Department of Homeland Security. Consistent with international, federal, state and local requirements to date, we continue to materially operate. In addition, demand for certain of our services, including those supporting health care relief efforts relating to COVID-19, has increased, and could continue to increase, as a result of COVID-19. Notwithstanding our continued critical operations, COVID-19 has negatively impacted our business, and may have further adverse impacts on our continued operations, including those listed and discussed in Item 1A, Risk Factors included in this Annual Report on Form 10-K. Accordingly, we have reduced spending broadly across the Company, only proceeding with operating and capital spending that is critical. We have also ceased all non-essential hiring and reduced discretionary expenses, including certain employee benefits and compensation. Looking ahead, we have developed contingency plans to reduce costs further if the situation further deteriorates or lasts longer than current expectations. We will continue to actively monitor the situation and may take further actions that alter our business operations as may be necessary or appropriate for the health and safety of employees, contractors, customers, suppliers or others or as required by international, federal, state or local authorities.
Based on current estimates, we expect the impact of COVID-19 to continue in the first half of fiscal 2021, although to a lesser degree than what was seen in fiscal 2020. Although this business disruption is expected to be temporary, significant uncertainty exists concerning the magnitude, duration and impacts of the COVID-19 pandemic, including with regard to the effects on our customers and customer demand for our services. Accordingly, actual results for future fiscal periods could differ materially versus current expectations and current results and financial condition discussed herein may not be indicative of future operating results and trends.
For a discussion of risks and uncertainties related to COVID-19, including the potential impacts on our business, financial condition and results of operations, see Item 1A - Risk Factors.
Lines of Business
The services we provide fall into the following two lines of business (LOB): Critical Mission Solutions (CMS) and People & Places Solutions (P&PS) which are also the Company’s reportable segments. For additional information regarding our segments, including information about our financial results by segment and financial results by geography, see Note 19 - Segment Information of Notes to Consolidated Financial Statements beginning on page F-1 of this Annual Report on Form 10-K.
Critical Mission Solutions (CMS)
Our Critical Mission Solutions line of business provides a full spectrum of cyber, data analytics, systems and software application integration services and consulting, enterprise level operations and maintenance and mission IT, engineering and design, enterprise operations and maintenance, program management, and other highly technical consulting solutions to government agencies as well as commercial customers. Our representative clients include the U.S. Department of Defense (DoD), the Combatant Commands, the U.S. Intelligence Community, NASA, the U.S. Department of Energy (DoE), Ministry of Defence in the U.K., the U.K. Nuclear Decommissioning Authority (NDA), and the Australian Department of Defence, as well as private sector customers mainly in the aerospace, automotive, energy and telecom sectors.
Serving mission-critical end markets
Critical Mission Solutions serves broad sectors, including U.S. government services, cyber, nuclear, commercial, and international sectors.
Fiscal Year 2020
The U.S. government is the world’s largest buyer of technical services, and in fiscal 2020, approximately 79% of CMS’s revenue was earned from serving the DoD, Intelligence Community and Federal Civilian governmental entities.
Trends affecting our government clients include information warfare, cyber, IT modernization, space exploration and intelligence, defense systems and intelligent asset management, which are driving demand for our highly technical solutions.
Another trend we are witnessing is an increase in the capabilities of unmanned aircraft and hypersonic weapons, which is impacting both offensive and defensive spending priorities among our clients and is a driver for next generation solutions such as C5ISR (command, control, communications, computer, combat systems, intelligence, surveillance and reconnaissance) and advanced aeronautical testing, respectively. We are also seeing an increase in space exploration initiatives both from the U.S. government, such as NASA’s Artemis program to return to the moon in 2024, as well as the commercial sector.
Within the nuclear sector, our customers have decades-long initiatives to manage, upgrade, decommission and remediate existing energy infrastructure and nuclear weapons.
Our international customers, which accounted for 13% of fiscal 2020 revenue, have also increased demand for our IT and cybersecurity solutions and nuclear projects, and the U.K. Ministry of Defence continues to focus on accelerating its strategic innovative and technology focused initiatives.
Leveraging our base market of offering valued technical services to U.S. government customers, CMS also serves commercial and international markets. In fiscal 2020, approximately 8% of CMS’s revenue was from various U.S. commercial sectors, including the telecommunications sector, which anticipates a large cellular infrastructure build-out from 4G to 5G technology. And like our government facility-based clients, our commercial manufacturing clients are seeking ways to reduce maintenance costs and optimize their facilities with network connected facilities and equipment to optimize operational systems, which we refer to as Intelligent Asset Management.
Leveraging strong domain expertise to deliver solutions
CMS brings domain-specific capability and cross-market innovations in each of the above sectors by leveraging six core capability groups.
•Information Technology Services. Across various business units in CMS, we provide a wide range of software development and enterprise IT solutions. We develop, integrate, modify and maintain software solutions and complex systems. These services include a broad array of lifecycle services, including requirements analysis, design, integration, testing, maintenance, quality assurance and documentation management. Our software activities support all major methodologies, including Agile, DevSecOps and other hybrid methodologies. For our enterprise IT capability, we develop, implement and sustain enterprise information technology systems, with a focus on improving mission performance, increasing security and reducing cost for our customers. Solutions typically include IT service management, data center consolidation, network operations, enterprise architecture, mobile computing, cloud computing and migration, software, infrastructure and platform as a service (SaaS, IaaS and PaaS), and data collection and analytics.
•Cyber and Data Analytics. Strongly enhanced by our recent acquisition of KeyW, CMS offers a full suite of cyber services for our government and commercial clients, including defensive cyber operations and training, offensive cyber operations, cloud and data analytics, threat intelligence, intelligence analysis, incident response and forensics, software and infrastructure security engineering, computer forensics and exploitation and information technology-operational technology (IT-OT) convergence services.
•C5ISR (Command, Control, Communications, Computers, Combat Systems, Intelligence, Surveillance and Reconnaissance). CMS is a leader in the design, development, analysis, implementation and support of C5ISR systems and technology in any environment, including land, sea, air, space and cyber domains. We provide advanced solutions for collecting, processing, exploiting and disseminating geospatial intelligence for the U.S. and Allied Intelligence Communities and Special Forces organizations. Core capabilities include: imaging systems, radar systems, precision geo-location products, custom packaging and microelectronics and customizable tagging, tracking and locating devices.
•Technical Services. We provide a broad range of technical consulting services to our government and commercial clients, including: systems integration, specialized propulsion, avionics, electrical, materials, aerodynamics, manufacturing processes modeling and simulation, testing and evaluation, scientific research, intelligent asset management, program management and consulting. NASA is one of our major government customers in the U.S., where we provide a wide range of technology services. For our telecommunications customers, we provide permitting, site planning and engineering to enable the development of wireline and wireless communications including the development of 5G small cell sites.
•Facility Engineering and Operations. We provide services for advanced technical structures and systems, including flight/launch facilities, R&D facilities, test facilities and military range facilities. Customers also engage us to operate, maintain and provide technical services for these facilities and systems over their lives. We also provide sustainment and technical services for facility-oriented clients including for the automotive industry where we provide highly technical aerodynamic, climatic, altitude and acoustic solutions for our customer research and development operations.
•Nuclear Solutions. We provide support across the full nuclear life cycle, including new build, operational support, and decommissioning. Support includes project management, engineering, technical and R&D services, complemented by the full range of CMS’ other services. Customers include the U.S. DoE, the UK’s NDA, and commercial companies such as EDF Energy, the UK’s largest producer of low-carbon energy.
Applying internally-developed technology
Across multiple businesses within CMS we license internally developed technology such as:
•KeyRadar®: The acquisition of KeyW brought numerous internally developed technologies, including KeyRadar, a scalable, software-defined synthetic aperture radar that can be configured to address a variety of missions, ranging from foliage penetration to long-range maritime domain awareness or long-range moving target detection.
•Ginkgo: Ginkgo is the only virtual learning environment specifically created for cybersecurity training. Designed by experienced cyber instructors, Ginkgo offers a complete solution for implementing hands-on IT and cybersecurity training for both local and distance learning environments on desktops, tablets, and other mobile devices.
•ion©: ion© is our open architecture, multi-protocol Industrial Internet of Things (IIoT) software solution providing an integrated, secure, and scalable platform for data aggregation integration, analysis and visualization. Ion© is both licensed and delivered as-a-service (aas) to commercial customers around the globe to enable a host of operational solutions, ranging from worker monitoring and safety to industrial asset visibility and management to smart/connected construction. Most recently, Jacobs is using ion© to support Return to Work solutions that allow our pharmaceutical clients to return mission essential personnel to their advanced research and production facilities despite the ongoing COVID-19 pandemic.
People & Places Solutions (P&PS)
Jacobs' People & Places Solutions line of business provides end-to-end solutions for our clients’ most complex projects - whether connected mobility, integrated water management, smart cities, advanced manufacturing or environmental stewardship. In doing so, we employ predictive analytics, artificial intelligence and automation, digital twin technology, IoT smart sensors, geospatial visualization and advanced delivery processes and tools for consulting, planning, architecture, design, engineering, and implementation, as well as long-term operation of facilities and infrastructure. Solutions may be delivered as standalone engagements or through comprehensive program management that integrates disparate workstreams to yield additional benefits not attainable through project-by-project implementation. We also provide progressive design-build and construction management at-risk delivery for our P&PS clients.
Our clients include national, state and local government in the U.S., Europe, U.K., Middle East, Australia, New Zealand and Asia, as well as multinational private sector clients throughout the world.
Fiscal Year 2020
Serving broad market sectors that support people and places
Aging infrastructure; climate action; urbanization; water, food and energy security; global supply chains; pandemic preparedness and response; environmental, social, and corporate governance (ESG); and digital transformation are driving new challenges and opportunities for our clients. These drivers are highlighting the need for holistic, integrated technology solutions that draw on the domain knowledge resident in the multidisciplinary consulting and delivery expertise of our global workforce. For example, an airport is no longer simply aviation infrastructure but is now a smart city with extensive operational, cybersecurity and autonomous mobility requirements, as well as the contactless travel requirements necessary to best manage COVID-19. Master planning for a city now requires advanced analytics to plan for climate adaption and next-generation mobility as well as revenue generating fiber infrastructure. Furthermore, the future of nearly all water infrastructure will be highly technology-enabled, leveraging solutions with digital twins, predictive analytics and smart metering technology to ensure we're giving communities, industries and regions the secure water resource they need to flourish and expand.
This increase in technology requirements is a key factor in our organic growth strategy as well as our recent acquisitions and divestitures. Moreover, our business model is evolving to provision a broader spectrum of digital- and technology-enabled solutions to address our infrastructure clients' challenges with less exposure to craft construction services. Our focus on the five core sectors of Transportation, Water, Built Environment, Environmental and Advanced Facilities provides us with the ability to leverage our expansive domain expertise across all global markets, enabling truly end-to-end connected solutions for our clients' most complex major projects and programs, including the London 2012 Olympic and Paralympic Games, Expo 2020 Dubai, and the LaGuardia Airport Redevelopment.
Today, we are executing complex solutions that pull expertise from all markets, fused with digital expertise, for major developments in places like London, Dubai, Sydney, Singapore, Miami, Los Angeles and Toronto.
Leveraging our global platform to deliver integrated solutions to clients
One of our key differentiators is our global integrated delivery model, which harnesses deep domain expertise from our global Solutions and Technology organization that is leveraged with the benefits of scale when we focus the world’s best talent to deliver innovative solutions and value to our clients.
•Within transportation, we provide sustainable solutions to plan, develop, finance, design engineer, construct, operate and maintain next generation mobility across all modes, including highway, bridge, rail and transit, aviation, port and maritime infrastructure. For example, we do this by assessing the impact of autonomous vehicles on roadways and cities for transportation agencies, engineering and specifying vehicles for mass-transit; delivering consulting services for digital fare payment systems; providing program management of the largest airport developments, designing cutting edge automated container terminals and ports infrastructure and utilizing big data to develop cross modal mobility solutions. Our clients encompass the world’s largest transportation agencies as well as private shipping and logistics companies worldwide, including the multi-modal Port Authority of New York and New Jersey, Transport for London, Highways England, Transport for New South Wales and Etihad Rail.
•Water is one of the most precious resources in the world. Extreme weather events in the form of droughts, desertification and flooding are stressing water supplies, at the same time as population growth and industrialization are increasing demand. Addressing these challenges, we provide integrated solutions across water and wastewater treatment, water reuse, and water resources such as the deployment of next generation smart metering, digital twin technology and highly technical consulting, engineering, design-build and operation of complex water systems. We support our clients on some of the world’s largest water infrastructure projects such as California WaterFix, Thames Tideway, Houston Water and Singapore National Water Agency.
•For the built environment, we deliver full-service architecture, engineering, interiors, planning, urban design, landscape architecture and project delivery solutions for government, corporate, commercial, institutional and industrial clients across diverse sectors. Our technology-enabled expertise ranges from the future of work, transaction advisory and asset management to transportation hubs, urban developments, government, healthcare, higher education and science facilities, as well as sports and entertainment venues. We plan and deliver resilient, triple bottom line-based solutions that are connected, secure and smart, including the rebuild of Tyndall Air Force Base in Florida into a visionary Installation of the Future; the corporate headquarters and research facility relocation of Spark Therapeutics in Philadelphia, Pennsylvania; and the expanded Blacktown Mount Druitt Hospital in New South Wales, Australia.
•In our environmental business, we utilize a multidisciplinary, systems-oriented approach to develop environmental planning for infrastructure development; data-driven site remediation and regeneration for per- and polyfluoroalkyl substances (PFAS) and other known and emerging contaminants; environmental health & safety (EHS) operational excellence and information management; and climate action solutions that incorporate sustainability and resiliency principles as essential to the well-being of all people and of our planet. We also provide post-disaster response and recovery services in support of the Federal Emergency Management Agency’s mission throughout the U.S. In addition to providing end-to-end technology-enabled solutions for multinational oil & gas, chemical and life sciences, mining, manufacturing and energy clients, Jacobs provides comprehensive environmental services for the U.S. Department of Defense, the U.S. Environmental Protection Agency, NASA and other civilian agencies, the UK Environment Agency, and the Australian Department of Defense.
•Within advanced facilities, we provide fully integrated solutions for highly specialized facilities in the fields of medical research, sustainable manufacturing, nanoscience, biotechnology, semiconductor and data centers. Our services span the full range of facility work, from early planning and site selection through architecture, engineering, construction and facility operations, all tailored to specific client needs in the life sciences and pharmaceutical, specialty manufacturing, microelectronics and data intensive industries. As the largest professional services provider to the biopharmaceutical industry, we are working with our multinational clients to rapidly increase capacity for vaccines and therapeutics, as well as reshoring manufacturing facilities, in response to the COVID-19 pandemic. Representative projects include the retrofit of AstraZeneca’s West Chester, Ohio manufacturing facility to deliver a potential COVID-19 vaccine;
the Mountbatten Nanotechnology Electronics Research Complex, University of Southampton, U.K.; and the Procter & Gamble, Singapore Innovation Center.
Applying internally developed technology
A strong foundation of data-rich innovative solutions is woven into every project that we deliver. This may include Jacobs-developed proprietary software that employs an array of technical expertise to enable the most efficient, effective and predictable solutions for our clients. Examples of these technologies include:
•TrackRecord is a workflow automation and compliance management platform for the delivery of major projects.
•AquaDNA is a predictive analytics platform that integrates innovative technologies for wastewater asset management through an AI learning platform, facilitating a move from reactive to proactive maintenance and reduced operation and maintenance costs.
•Travel Service Optimisation (TSO) is Jacobs' travel sharing solution for Special Education needs children which centers on the children’s ability to travel together rather than focusing on their disability.
•SafetyWeb is a site hazard management and compliance tool.
•ProjectMapper is a web based geospatial mapping and project visualization software platform.
•Flood Modeller provides proactive decision-making to help manage our environment and the challenges associated with flood risk. It is suitable for a wide range of engineering and environmental applications, from calculating simple backwater profiles and modeling entire catchments to mapping potential flood risk for entire countries.
•ion© is an Industrial Internet of Things (IoT) multi-protocol wireless application networking system which provides an open, integrated, secure and scalable system for data aggregation and viewing.
•Replica™ is Jacobs’ digital twin solution software platform and consists of the following capabilities:
Replica Parametric Design™ (formerly CPES™) provides outputs on construction quantities and costs, life cycle quantities and costs, and estimates of environmental impacts. Rapid process design in Replica Process and the resulting development of the Replica Parametric Designs allows for thorough alternatives analysis and enhanced team communication.
Replica Preview™ is used for early stage visualization of facility designs. This software rapidly creates scaled three-dimensional designs, which can be placed on Google Earth®. Rapid design development in Replica Parametric Design and visualization with Replica Preview allows for informed analysis of many alternatives and sound decision-making.
Replica Systems Analysis™ (formerly Voyage™) is a flexible platform that can simulate resource systems dynamically, over time. Examples of modeled systems include water resources, energy, solid waste and traffic. The ability to connect complex systems together in a single interface that is visually intuitive leads to informed team collaboration and creative solutions.
Replica Process™ allows Jacobs' world-renowned expertise in water treatment to be simulated both statically and dynamically over time in Replica Process™ software. Much of the process predictive capabilities in Replica Process are founded on the Jacobs' Pro2D2™ and Source™ software. Informed decisions are founded on the ability of Replica Process to provide details on system performance among many alternatives, very quickly.
Replica Hydraulics™ was designed to simulate all pressurized and gravity flow hydraulics of a system, simultaneously. Replica’s hydraulic blocks were built on accepted engineering practice equations and have been successfully verified on hundreds of projects. The Replica Hydraulics library is the foundation for complete, dynamic water system analysis and can be used exclusively for hydraulic analysis of a system or in conjunction with Replica Process, Replica Controls and/or Replica Air.
Replica Controls™ allows for dynamic simulation of system instrumentation such as flow meters, indicator transmitters, limit switches and stream analyzers as well as the logic objects including PID controllers, sequencers, units, controller and alarms. The software's controls capabilities and functionality align with industry design standards and its ability to predict full scale performance is unmatched due to the connectivity with Replica Hydraulics.
Replica Air™ simulates all aspects of a compressible fluid (e.g. air) supply system, including pipes, valves, diffusers and blowers. The ability to couple Replica Air with Replica Controls in a single simulation allows for the development of unique and robust designs that reduce energy use and life cycle costs.
Energy, Chemicals and Resources (ECR)
ECR Disposition
On April 26, 2019, Jacobs completed the sale of its Energy, Chemicals and Resources (ECR) business to Worley Limited, a company incorporated in Australia (Worley), for a purchase price of $3.4 billion consisting of (i) $2.8 billion in cash plus (ii) 58.2 million ordinary shares of Worley, subject to adjustments for changes in working capital and certain other items (the ECR sale).
As a result of the ECR sale, substantially all ECR-related assets and liabilities were sold (the "Disposal Group"). We determined that the disposal group should be reported as discontinued operations in accordance with ASC 210-05, Discontinued Operations because their disposal represents a strategic shift that had a major effect on our operations and financial results. As such, the financial results of the ECR business are reflected in our Consolidated Statements of Earnings as discontinued operations for all periods presented. Additionally, assets and liabilities of the ECR business were reflected as held-for-sale in the Consolidated Balance Sheets through September 27, 2019. As of the year ended October 2, 2020, all of the ECR business to be sold under the terms of the sale has been conveyed to Worley and as such, no amounts remain held for sale. For further discussion see Note 15- Sale of Energy, Chemicals and Resources ("ECR") Business to the consolidated financial statements.
Prior to the sale, the ECR business served the energy, chemicals and resources sectors, including upstream, midstream and downstream oil, gas, refining, chemicals and mining and minerals industries. The ECR business provided integrated delivery of complex projects for our Oil and Gas, Refining, and Petrochemicals clients. Bridging the upstream, midstream and downstream industries, ECR's services encompassed consulting, engineering, procurement, construction, maintenance and project management.
Significant Customers
The following table sets forth the percentage of total revenues earned directly or indirectly from agencies of the U.S. federal government for each of the last three fiscal years:
Given the percentage of total revenue derived directly from the U.S. federal government, the loss of U.S. federal government agencies as customers would have a material adverse effect on the Company. In addition, any or all of our government contracts could be terminated, we could be suspended or debarred from all government contract work, or payment of our costs could be disallowed. Approximately 80% of revenue derived directly from the U.S. federal government is in the CMS segment. For more information on risks relating to our government contracts, see Item 1A - Risk Factors.
Contracts
While there is considerable variation in the pricing provisions of the contracts we undertake, our contracts generally fall into two broad categories: cost-reimbursable and fixed-price. The following table sets forth the percentages of total revenues represented by these types of contracts for each of the last three fiscal years:
| | | | | | | | | | | | | | | | | |
| 2020 | | 2019 | | 2018 |
| Cost-reimbursable | 76% | | 76% | | 74% |
| Fixed-price, limited risk | 17% | | 18% | | 19% |
| Fixed-price, at risk | 7% | | 6% | | 7% |
In accordance with industry practice, most of our contracts (including those with the U.S. federal government) are subject to termination at the discretion of the client, which is discussed in greater detail in Item 1A - Risk Factors. In such situations, our contracts typically provide for reimbursement of costs incurred and payment of fees earned through the date of termination.
Cost-Reimbursable Contracts
Cost-reimbursable contracts generally provide for reimbursement of costs incurred plus an amount of profit. The profit element may be in the form of a simple mark-up applied to the labor costs incurred or it may be in the form of a fee, or a combination of a mark-up and a fee. The fee element can also take several forms. The fee may be a fixed amount; it may be an amount based on a percentage of the costs incurred; or it may be an incentive fee based on targets, milestones, or performance factors defined in the contract.
Fixed-Price Contracts
Fixed-price contracts include both “lump sum bid” contracts and “negotiated fixed-price” contracts. Under lump sum bid contracts, we typically bid against competitors based on client-furnished specifications. This type of pricing presents certain inherent risks, including the possibility of ambiguities in the specifications received, problems with new technologies, and economic and other changes that may occur over the contract period. Additionally, it is not unusual for lump sum bid contracts to lead to an adversarial relationship with clients, which is contrary to our relationship-based business model. Accordingly, lump sum bid contracts are not our preferred form of contract. In contrast, under a negotiated fixed-price contract, we are selected as the contractor first and then we negotiate a price with our client. Negotiated fixed-price contracts frequently exist in single-responsibility arrangements where we perform some portion of the work before negotiating the total price of the project. Thus, although both types of contracts involve a firm price for the client, the lump sum bid contract provides the greater degree of risk to us in our services contracts as well as construction. However, because of economies that may be realized during the contract term, both negotiated fixed-price and lump sum bid contracts may offer greater profit potential than other types of contracts. The Company carefully manages the risk inherent in these types of contracts. In recent years, most of our fixed-price work has been either negotiated fixed-price contracts or lump sum bid contracts for design and/or project services, rather than turnkey construction.
Competition
We compete with a large number of companies across the world including technology consulting, federal IT services, aerospace, defense and engineering firms. Typically, no single company or companies dominate the markets in which we provide services and in many cases we partner with our competitors or other companies to jointly pursue projects. AECOM, Booz Allen, CACI, KBR, Leidos, Parsons, SAIC, Tetra Tech, WSP, General Dynamics and Northrop Grumman are some of our competitors. We compete based on the following factors, among others: technical capabilities, reputation for quality, price of services, safety record, availability of qualified personnel, and ability to timely perform work and contract terms.
Human Capital Management
At Jacobs, our people are the heart of our business. With our culture of caring and inclusion as our foundation, we celebrate the differences that drive our collective strength and encourage our employees that there is no limit to who they can be and what we can achieve. Together we deliver extraordinary solutions for a better tomorrow and live by our employee value statement: Jacobs. A world where you can.
As of October 2, 2020, we had a workforce of approximately 55,000 people worldwide, including a contingent workforce of approximately 3,000 people. The breakdown of our employees by region is as follows:
| | | | | | | | |
| Region | | Percentage of Global Workforce(1) |
| Americas | | 62 | % |
| Europe (including U.K) | | 23 | % |
| Asia Pacific (including India) | | 12 | % |
| Middle East and Africa | | 3 | % |
| | |
| (1) Excludes contingent workforce |
Hiring, Training and Developing our Workforce
The success of Jacobs is dependent on our ability to hire, retain, engage and leverage highly qualified employees, including engineers, architects, designers, digital specialists, craft employees and corporate professionals. We put the
spotlight on ensuring that Jacobs is an employer of choice in every way: we aspire to be a merit-based organization that is inclusive and diverse; we are building an inclusive culture where all employees feel they belong. Our culture is the foundation for selecting, developing and retaining the best and brightest minds at Jacobs. Our eight Jacobs Employee Networks (JENs) play a critical role in attracting new talent into our business, helping to shape our recruiting strategies and policies, our science, technology, engineering, arts and math programs, and our accessibility practices. In fiscal 2020, more than1,300 graduates, interns and apprentices were welcomed to our global team.
In fiscal 2020, we launched our new employee experience e3: engage. excel. elevate. From a talent profile for every employee to providing continuous celebrations and feedback, and learning new skills and driving performance, e3 is our unique approach to ensuring every employee can engage, excel in their role and elevate their career. We also introduced GlobalShare to enhance our ability to resolve short-term staffing needs and enable employees to pursue opportunities across Jacobs. We also made enhancements to some of our policies to deliver greater work-day flexibility to employees. Additionally, we undertook several new initiatives related to our Total Rewards Program, including implementing our Global Career Structure framework, combining career planning and development resources and tools within a consistent career structure, and a global pay equity review of our pay systems and processes to make pay equity a lasting reality at Jacobs.
Focus on Inclusion and Diversity
At Jacobs we have an unparalleled focus on inclusion, with a diverse team of visionaries, thinkers and doers. We embrace all perspectives, collaborating to make a positive impact. The aperture of inclusion is broader than lifestyle and culture. Joining, belonging and thriving are Jacobs’ key elements in retaining talent and developing a culture where people want to stay – and a place where you can bring your best, whole self to work.
TogetherBeyond℠ is our approach to living inclusion every day and enabling diversity and equality globally – it is not just about numbers and statistics, but about every one of our people and the collective strength we take from their unique perspectives and ambitions.
Having a culture of belonging where everyone can join in and thrive allows us to recruit and retain the best global talent and drive innovative solutions for our business, clients and communities. “We live inclusion” is supported by the strength of tangible leadership commitment and accountability at Jacobs. In that regard, we have tied inclusive behavior to our leaders’ performance review and compensation programs and delivered conscious inclusion training to nearly all (98%) of our people.
As of October 2, 2020, our U.S. employees had the following race and ethnicity demographics:
| | | | | | | | |
| | October 2, 2020 |
| | All U.S. Employees (1) |
| White | | 71.4 | % |
| Hispanic / Latino | | 8.9 | % |
| Black | | 8.5 | % |
| Asian | | 6.8 | % |
| Multiracial | | 2.0 | % |
| American Indian or Alaska Native | | 0.4 | % |
| Native Hawaiian / Other Pacific Islander | | 0.3 | % |
| Not provided | | 1.7 | % |
| | |
| (1) Includes U.S. employee population only (excluding approximately 2,000 craft employees) |
Over the last year, we have seen tangible examples of progress resulting from our approach to inclusion. In fiscal 2020, we launched our global Action Plan for Advancing Justice and Equality. Driven by members of our Black employee network, Harambee, in partnership with our Executive Leadership Team and Jacobs’ Board of Directors, the Action Plan sets out actionable initiatives and measurable objectives to address advance equality within the company and around the communities where we work.
As of October 2, 2020, our global employees had the following gender demographics:
| | | | | | | | | | | |
| October 2, 2020 |
| Women | | Men |
| All employees | 29.5% | | 70.5% |
Looking ahead, we will continue to focus on inclusion and diversity by:
•Following through on our global Action Plan for Advancing Justice and Equality
•Striving to achieve our aspirational goals of creating a more gender-balanced and racially/ethnically diverse workforce around the globe to more appropriately reflect the labor markets and communities in which we live and serve
•Amplifying our culture of belonging
•Measuring employee sense of inclusion and belonging through a global survey
•Identifying, developing and promoting allies across Jacobs
We know we have more to do when it comes to increasing the representation of historically underrepresented groups within our global workforce, and we are committed to taking action and ensuring Jacobs is, and remains, an employer of choice.
Our Employees’ Safety and Wellbeing
BeyondZero® is our approach to the health, safety and security of our people, the protection of the environment and the resilience of Jacobs. In fiscal 2020, we continued to demonstrate safety excellence with another year of zero employee fatalities at work, a 25% reduction in employee recordable incidents from fiscal 2019, and a total recordable incident rate of 0.17 (recorded in accordance with OSHA record keeping requirements) as of October 2, 2020 – compared to the North American Industry Classification System’s most recently reported aggregate rate of 0.60.
While our BeyondZero journey started with safety, as we continued to drive our injury rates down, we also expanded our thinking to our broader culture of caring and particularly mental health. It was this strong foundation that helped us act swiftly at the start of the COVID-19 pandemic. The foundation elements of our existing “Mental Health Matters” program enabled us to respond quickly to launch our “Mental Health Matters Resiliency” program and to promote our suicide awareness campaign in fiscal 2020.
In fiscal 2020, almost 2,000 Positive Mental Health Champions (an 11% increase from fiscal 2019) trained to support the mental wellbeing of our employees and one in every 29 employees trained as a Positive Mental Health Champion. In addition, 100% of Jacobs’ Executive Leadership Team participated in Positive Mental Health training.
Information About Our Executive Officers
The information required by Paragraph (a), and Paragraphs (c) through (g) of Item 401 of Regulation S-K (except for information required by Paragraph (e) of that Item to the extent the required information pertains to our executive officers) and Item 405 of Regulation S-K is set forth under the captions “Members of the Board of Directors” and “Delinquent Section 16(a) Reports” in our definitive proxy statement to be filed with the SEC pursuant to Regulation 14A within 120 days after the close of our fiscal year and is incorporated herein by reference.
The following table presents the information required by Paragraph (b) of Item 401 of Regulation S-K.
| | | | | | | | | | | | | | | | | | | | |
| Name | | Age | | Position with the Company | | Year Joined the Company |
| Steven J. Demetriou | | 62 | | | Chair and Chief Executive Officer | | 2015 |
| Kevin C. Berryman | | 61 | | | President and Chief Financial Officer | | 2014 |
| Robert V. Pragada | | 52 | | | President and Chief Operating Officer | | 2016 |
| Dawne S. Hickton | | 63 | | | Executive Vice President and COO Critical Mission Solutions | | 2019 |
| Joanne E. Caruso | | 60 | | | Executive Vice President, Chief Legal and Administrative Officer | | 2012 |
| William B. Allen, Jr. | | 56 | | | Senior Vice President, Chief Accounting Officer | | 2016 |
| Michael R. Tyler | | 64 | | | Senior Vice President, General Counsel and Chief Compliance Officer | | 2013 |
All of the officers listed in the preceding table serve in their respective capacities at the pleasure of the Board of Directors of the Company.
Mr. Demetriou joined the Company in August 2015. Mr. Demetriou served as Chairman and CEO of Aleris Corporation for 14 years, a global downstream aluminum producer based in Cleveland, Ohio. Over the course of his career, he has gained broad experience with companies in a range of industries including metals, specialty chemicals, oil & gas, manufacturing and fertilizers.
Mr. Berryman joined the Company in December 2014. Mr. Berryman served as EVP and CFO for five years at International Flavors and Fragrances Inc., an S&P 500 company and leading global creator of flavors and fragrances used in a wide variety of consumer products. Prior to that, he spent 25 years at Nestlé in a number of finance roles including treasury, mergers & acquisitions, strategic planning and control.
Mr. Pragada rejoined the Company in February 2016 after serving as President and Chief Executive Officer of The Brock Group since August 2014. From March 2006 to August 2014 Mr. Pragada served in executive and senior leadership capacities with the Company.
Ms. Hickton joined the Company as Chief Operating Officer and President of Critical Mission Solutions in 2019. Prior to this role, Ms. Hickton served as a member of the Board of Directors of the Company and was previously the Vice Chair and Chief Executive Officer for eight years at RTI International Metals, Inc., a global supplier of advanced titanium products and services in commercial aerospace, defense, propulsion, medical device and energy markets.
Ms. Caruso joined the Company in 2012. Prior to becoming Executive Vice President, Chief Legal and Administrative Officer, Ms. Caruso was Senior Vice President, Chief Administrative Officer, and previously held the positions of Senior Vice President, Global Human Resources and Vice President, Global Litigation. Prior to joining the Company, Ms. Caruso was a partner in two international law firms, Howrey LLP and Baker & Hostetler LLP.
Mr. Allen joined the Company in October 2016. Mr. Allen served as Vice President, Finance and Principal Accounting Officer at Lyondellbasell Industries, N.V. from 2013 to 2016. Prior to that, he was with Albemarle Corporation, where he served as Vice President, Corporate Controller and Chief Accounting Officer from 2009 to 2013 after serving in CFO roles for their Catalysts and Fine Chemistry businesses from 2005 to 2009.
Mr. Tyler joined the Company in June 2013. He previously served as Executive Vice President, General Counsel and Secretary of Sanmina Corporation, a global electronics manufacturing services provider from April 2007 to June 2013, and Chief Legal and Administrative Officer of Gateway, Inc., a computer hardware company, from January 2004 to April 2007.
Additional Information
Jacobs was founded in 1947 and incorporated as a Delaware corporation in 1987. We are headquartered in Dallas, Texas, USA. You may read and copy any materials we file with the SEC at the SEC’s Public Reference Room located at 100 F Street N.E., Washington, D.C. 20549. In order to obtain information about the operation of the Public Reference Room, a person may call the SEC at 1-800-732-0330. The SEC also maintains a site on the Internet that contains reports, proxy and information statements, and other information regarding issuers that file electronically with the SEC. The SEC’s website is http://www.sec.gov. You may also read and download the various reports we file with, or furnish to, the SEC free of charge from our website at www.jacobs.com.
Item 1A. RISK FACTORS
We operate in a changing global environment that involves numerous known and unknown risks and uncertainties that could materially adversely affect our business, financial condition and results of operations. The risks described below highlight some of the factors that have affected and could affect us in the future. We may also be affected by unknown risks or risks that we currently think are immaterial. If any such events actually occur, our business, financial condition and results of operations could be materially adversely affected.
Summary Risk Factors
The following is a summary of some of the risks and uncertainties that could materially adversely affect our business, financial condition and results of operations. You should read this summary together with the more detailed description of each risk factor contained below.
Risks Related to Our Operations
•The COVID-19 pandemic, including the measures that international, federal, state and local public health and other governmental authorities implement to address it, have adversely affected, and may continue to adversely affect, our business, financial condition and results of operations.
•Project sites are inherently dangerous workplaces. If we, the owner, or others working at the project site fail to maintain safe work sites, and our employees or others become injured, disabled or even lose their lives, we can be exposed to significant financial losses and reputational harm, as well as civil and criminal liabilities.
•Our results of operations depend on the award of new contracts and the timing of the performance of these contracts.
•We engage in a highly competitive business. If we are unable to compete effectively, we could lose market share and our business and results of operations could be negatively impacted.
•The nature of our contracts, particularly those that are fixed-price, subjects us to risks of cost overruns. We may experience reduced profits or, in some cases, losses if costs increase above budgets or estimates or if the project experiences schedule delays.
•The contracts in our backlog may be adjusted, canceled or suspended by our clients and, therefore, our backlog is not necessarily indicative of our future revenues or earnings. Additionally, even if fully performed, our backlog is not a good indicator of our future gross margins.
•Contracts with the U.S. federal government and other governments and their agencies pose additional risks relating to future funding and compliance. Our project execution activities may result in liability for faulty services.
•Our project execution activities may result in liability for faulty services.
•The outcome of pending and future claims and litigation could have a material adverse impact on our business, financial condition, and results of operations.
•Our use of joint ventures and partnerships exposes us to risks and uncertainties, many of which are outside of our control
•Employee, agent or partner misconduct or our overall failure to comply with laws or regulations could weaken our ability to win contracts, which could result in reduced revenues and profits.
•Our international operations are exposed to additional risks and uncertainties, including unfavorable political developments and weak foreign economies.
•Cyber security or privacy breaches, or systems and information technology interruption or failure could adversely impact our ability to operate or expose us to significant financial losses and reputational harm.
•We are subject to professional standards, duties and statutory obligations on professional reports and opinions we issue, which could subject us to monetary damages.
•If we do not have adequate indemnification for our nuclear services, it could adversely affect our business, financial condition and results of operations.
•Our actual results could differ from the estimates and assumptions used to prepare our financial statements.
•An impairment charge on our goodwill could have a material adverse impact on our financial position and results of operations.
•We may be required to contribute additional cash to meet any underfunded benefit obligations associated with retirement and post-retirement benefit plans we manage.
•Demand for our services is cyclical as the sectors and industries in which our clients operate are impacted by economic downturns, reductions in government or private spending and times of political uncertainty.
•Rising inflation, interest rates, and/or construction costs could reduce the demand for our services as well as decrease our profit on our existing contracts, in particular with respect to our fixed-price contracts.
•Our global presence could give rise to material fluctuations in our income tax rates.
•Our businesses could be materially and adversely affected by events outside of our control.
•Climate change and related environmental issues could have a material adverse impact on our business, financial condition and results of operations.
•Our continued success is dependent upon our ability to hire, retain, and utilize qualified personnel.
•Our business strategy relies in part on acquisitions to sustain our growth. Acquisitions of other companies present certain risks and uncertainties.
Risks Related to Regulatory Compliance
•Past and future environmental, health, and safety laws could impose significant additional costs and liabilities.
•If we fail to comply with federal, state, local or foreign governmental requirements, our business may be adversely affected.
•We could be adversely affected by violations of the U.S. Foreign Corrupt Practices Act and similar worldwide anti-bribery laws.
•We may be affected by market or regulatory responses to climate change.
Risks Related to Our Indebtedness
•We rely on cash provided by operations and liquidity under our credit facilities to fund our business. Negative conditions in the credit and financial markets and delays in receiving client payments could adversely affect our cost of borrowing and our business.
•Maintaining adequate bonding and letter of credit capacity is necessary for us to successfully bid on and win some contracts.
Risks Related to Our Common Stock
•Our quarterly results may fluctuate significantly, which could have a material negative effect on the price of our common stock.
•There can be no assurance that we will pay dividends on our common stock.
•In the event we issue stock as consideration for certain acquisitions we may make, we could dilute share ownership, and if we receive stock in connection with a divestiture, the value of stock is subject to fluctuation.
•Delaware law and our charter documents may impede or discourage a takeover or change of control.
Risks Related to Our Operations
The COVID-19 pandemic, including the measures that international, federal, state and local public health and other governmental authorities implement to address it, have adversely affected, and may continue to adversely affect, our business, financial condition and results of operations.
On March 11, 2020, the World Health Organization characterized the outbreak of the novel coronavirus (“COVID-19”) as a global pandemic and recommended certain containment and mitigation measures. On March 13, 2020, the United States declared a national emergency concerning the outbreak, and the vast majority of states and many municipalities declared public health emergencies or taken similar actions. Since then, there have been extraordinary and wide-ranging actions taken by international, federal, state and local public health and governmental authorities to contain and combat the outbreak of COVID-19 in regions across the United States and around the world. These actions include quarantines and “stay-at-home” or “shelter-in-place” orders, social distancing measures, travel restrictions, school closures and similar mandates for many individuals in order to substantially restrict daily activities and orders for many businesses to curtail or cease normal operations unless their work is critical, essential or life-
sustaining. Although certain jurisdictions have taken steps to lift or ease such restrictions to various degrees, some jurisdictions have subsequently reversed such lifting or easing in response to increased cases of COVID-19.
The COVID-19 pandemic has adversely affected, and may continue to adversely affect, certain elements of our business, including, but not limited to, the following:
•We have experienced, and may continue to experience, reductions in demand for certain of our services and the delay or abandonment of ongoing or anticipated projects due to our clients’, suppliers’ and other third parties’ diminished financial conditions or financial distress, as well as governmental budget constraints. These impacts are expected to continue or worsen if “stay-at-home”, “shelter-in-place”, social distancing, travel restrictions and other similar orders, measures or restrictions remain in place for an extended period of time or are re-imposed after being lifted or eased. Although we have experienced, and may continue to experience, an increase in demand for certain of our services as a result of new projects that have arisen in response to the COVID-19 pandemic, there can be no assurance that any such increased demand would be sufficient to offset lost or delayed demand.
•Government-sponsored stimulus or assistance programs enacted to-date in the United States and in the foreign countries in which we operate in response to the COVID-19 pandemic have only been available to us or our customers or suppliers on a limited basis and are insufficient to address the full impact of the COVID-19 pandemic. For example, the Coronavirus Aid, Relief and Economic Security Act (the “CARES Act”) contains provisions that authorize Federal Agencies to pay contractors to retain key workers where regular work schedules are not possible due to quarantines or other social isolation measures. We have pursued payment for these alternative work arrangements with applicable Federal Agencies or contracting officials and will continue to assess the availability of such subsidies on a contract-by-contract basis. Certain foreign governments are also permitting contracting authorities to revise the terms of government contracts and/or providing various forms of subsidies to compensate companies who maintain their workforce rather than impose layoffs or furloughs. Certain other governments have provided partial expense reimbursement for furloughed employees and also provided for the deferral of payroll taxes. Although we expect to recover a significant portion of COVID-19 related labor costs, we do not expect to recover the full amount of either our labor cost or associated fee. Additionally, these and other government-sponsored assistance and stimulus programs are subject to renewal, modification or termination by the applicable governing bodies. If any government-sponsored program from which we receive benefits is modified or terminated, our benefits thereunder could decline or cease altogether, which could have a material adverse effect on our business, financial position, results of operations, and/or cash flows.
•Our clients may be unable to meet their payment obligations to us in a timely manner, including as a result of deteriorating financial condition or bankruptcy resulting from the COVID-19 pandemic and resulting economic impacts. Further, other third parties, such as suppliers, subcontractors, joint venture partners and other outside business partners, may experience significant disruptions in their ability to satisfy their obligations with respect to us, or they may be unable to do so altogether.
•Many employers, including us, and governments continue to require all or a significant portion of employees to work from home or not go into their offices. While many of our employees can effectively perform their responsibilities while working remotely, some work is not well-suited for remote work, and that work may not be completed as efficiently as if it were performed on site. Additionally, we may be exposed to unexpected cybersecurity risks and additional information technology-related expenses as a result of these remote working requirements.
•Illness, travel restrictions or other workforce disruptions could adversely affect our supply chain, our ability to timely and satisfactorily complete our clients’ projects, our ability to provide services to our clients or our other business processes. Even after the COVID-19 pandemic subsides, we could experience a longer-term impact on our operating expenses, including, for example, due to the need for enhanced health and hygiene requirements or the periodic revival of social distancing or other measures in one or more regions in attempts to counteract future outbreaks.
•We have furloughed certain employees and may need to further furlough or reduce the number of employees that we employ. We may experience difficulties associated with hiring additional employees or replacing employees, in particular with respect to roles that require security clearances or other special qualifications that may be limited or difficult to obtain. Increased turnover rates of our employees could increase operating costs and create challenges for us in maintaining high levels of employee awareness of
and compliance with our internal procedures and external regulatory compliance requirements, in addition to increasing our recruiting, training and supervisory costs.
•In addition to existing travel restrictions implemented in response to the COVID-19 pandemic, jurisdictions may continue to close borders, impose prolonged quarantines and further restrict travel and business activity, which could materially impair our ability to support our operations and clients (both domestic and international), to source supplies through the global supply chain and to identify, pursue and capture new business opportunities, and which could continue to restrict the ability of our employees to access their workplaces. We also face the possibility of increased overhead or other expenses resulting from compliance with any future government orders or other measures enacted in response to the COVID-19 pandemic.
•The COVID-19 pandemic has increased volatility and pricing in the capital markets, and that increased volatility is likely to continue. While we entered into a new $1 billion term loan facility in the second quarter of fiscal 2020, we might not be able to access further sources of liquidity on acceptable pricing or borrowing terms if at all. Our credit facilities contain customary covenants restricting, among other things, our ability to incur certain liens and indebtedness. We are also subject to certain financial covenants, including maintenance of a maximum consolidated leverage ratio. A breach of any covenant or our inability to comply with the required financial ratios, whether as a result of the impact of the COVID-19 pandemic on our business or otherwise, could result in a default under one or more of our credit facilities and limit our ability to do further borrowing. Any inability to obtain additional liquidity as and when needed, or to maintain compliance with the instruments governing our indebtedness, could have a material adverse effect on our business, financial condition and results of operations.
•We operate in many countries around the world, and certain of those countries’ governments may be unable to effectively mitigate the financial or other impacts of the COVID-19 pandemic on their economies and workforces and our operations therein.
The continued global spread of the COVID-19 pandemic and the responses thereto are complex and rapidly evolving, and the extent to which the pandemic impacts our business, financial condition and results of operations, including the duration and magnitude of such impacts, will depend on numerous evolving factors that we may not be able to accurately predict or assess. COVID-19, and the volatile regional and global economic conditions stemming from the pandemic, as well as reactions to future pandemics or resurgences of COVID-19, could also precipitate or aggravate the other risk factors that we identify in in this Annual Report on Form 10-K, which in turn could materially adversely affect our business, financial condition and results of operations. There may be other adverse consequences to our business, financial condition and results of operations from the spread of COVID-19 that we have not considered or have not become apparent. As a result, we cannot assure you that if COVID-19 continues to spread, it would not have a further adverse impact on our business, financial condition and results of operations.
Project sites are inherently dangerous workplaces. If we, the owner, or others working at the project site fail to maintain safe work sites, and our employees or others become injured, disabled or even lose their lives, we can be exposed to significant financial losses and reputational harm, as well as civil and criminal liabilities.
Project sites often put our employees and others in close proximity with large pieces of mechanized equipment, moving vehicles, chemical and manufacturing processes and highly regulated materials, in a challenging environment and often in geographically remote locations. If we, or others working at such sites, fail to implement such procedures or if the procedures we implement are ineffective, or if others working at the site fail to implement and follow appropriate safety procedures, our employees and others may become injured, disabled or even lose their lives, the completion or commencement of our projects may be delayed and we may be exposed to litigation or investigations. Unsafe work sites also have the potential to increase employee turnover, increase the cost of a project to our clients and raise our operating and insurance costs. Any of the foregoing could result in financial losses or reputational harm, which could have a material adverse impact on our business, financial condition and results of operations.
In addition, our projects can involve the handling of hazardous and other highly regulated materials, which, if improperly handled or disposed of, could subject us to civil and/or criminal liabilities. We are also subject to regulations dealing with occupational health and safety. Although we maintain functional groups whose primary purpose is to ensure we implement effective health, safety and environmental (“HSE”) work procedures throughout our organization, including project sites and maintenance sites, the failure to comply with such regulations could subject
us to liability. In addition, despite the work of our functional groups, we cannot guarantee the safety of our personnel or that there will be no damage to or loss of our work, equipment or supplies.
Our safety record is critical to our reputation. Many of our clients require that we meet certain safety criteria to be eligible to bid for contracts and many contracts provide for automatic termination or forfeiture of some or all of our contract fees or profit in the event we fail to meet certain measures. Accordingly, if we fail to maintain adequate safety standards, we could suffer reduced profitability or the loss of projects or clients, which could have a material adverse impact on our business, financial condition and results of operations.
Our results of operations depend on the award of new contracts and the timing of the performance of these contracts.
Our revenues are derived from new contract awards. Delays in the timing of the awards or cancellations of such projects as a result of economic conditions, material and equipment pricing and availability or other factors could impact our long-term projected results. It is particularly difficult to predict whether or when we will receive large-scale projects as these contracts frequently involve a lengthy and complex bidding and selection process, which is affected by a number of factors, such as market conditions or governmental and environmental approvals. Since a significant portion of our revenues is generated from such projects, our results of operations and cash flows can fluctuate significantly from quarter to quarter depending on the timing of our contract awards and the commencement or progress of work under awarded contracts. Furthermore, many of these contracts are subject to financing contingencies and, as a result, we are subject to the risk that the customer will not be able to secure the necessary financing for the project.
In addition, many of our contracts require us to satisfy specific progress or performance milestones in order to receive payment from the customer. As a result, we may incur significant costs for engineering, materials, components, equipment, labor or subcontractors prior to receipt of payment from a customer.
The uncertainty of our contract award timing can also present difficulties in matching workforce size with contract needs. In some cases, we maintain and bear the cost of a ready workforce that is larger than necessary under existing contracts in anticipation of future workforce needs for expected contract awards. If an expected contract award is delayed or not received, we may incur additional costs resulting from reductions in staff or redundancy of facilities, which could have a material adverse effect on our business, financial condition and results of operations.
We engage in a highly competitive business. If we are unable to compete effectively, we could lose market share and our business and results of operations could be negatively impacted.
We face intense competition to provide technical, professional and construction management services to clients. The markets we serve are highly competitive and we compete against a large number of regional, national and multinational companies. The extent and type of our competition varies by industry, geographic area and project type.
Our projects are frequently awarded through a competitive bidding process, which is standard in our industry. We are constantly competing for project awards based on pricing, schedule and the breadth and technical sophistication of our services. Competition can place downward pressure on our contract prices and profit margins, which may force us to accept contractual terms and conditions that are less favorable to us, thereby increasing the risk that, among other things, we may not realize profit margins at the same rates as we have seen in the past or may become responsible for costs or other liabilities we have not accepted in the past. If we are unable to compete effectively, we may experience a loss of market share or reduced profitability or both, which if significant, could have a material adverse impact on our business, financial condition and results of operations.
The nature of our contracts, particularly those that are fixed-price, subjects us to risks of cost overruns. We may experience reduced profits or, in some cases, losses if costs increase above budgets or estimates or if the project experiences schedule delays.
For fiscal 2020, approximately 24% of our revenues were earned under fixed-price contracts. Both fixed-price and many cost reimbursable contracts require us to estimate the total cost of the project in advance of our performance. For fixed-price contracts, we may benefit from any cost-savings, but we bear greater risk of paying some, if not all, of any cost overruns. Fixed-price contracts are established in part on partial or incomplete designs, cost and scheduling estimates that are based on a number of assumptions, including those about future economic conditions, commodity and other materials pricing and availability of labor, equipment and materials and other exigencies. If the
design or the estimates prove inaccurate or if circumstances change due to, among other things, unanticipated technical problems, difficulties in obtaining permits or approvals, changes in local laws or labor conditions, weather or other delays beyond our control, changes in the costs of equipment or raw materials, our vendors’ or subcontractors’ inability or failure to perform, or changes in general economic conditions, then cost overruns may occur and we could experience reduced profits or, in some cases, a loss for that project. These risks are exacerbated for projects with long-term durations because there is an increased risk that the circumstances on which we based our original estimates will change in a manner that increases costs. If the project is significant, or there are one or more issues that impact multiple projects, costs overruns could have a material adverse impact on our business, financial condition and results of operations.
Our contracts that are fundamentally cost reimbursable in nature may also present a risk to the extent the final cost on a project exceeds the amount the customer expected or budgeted. Like fixed-price contracts, the expected cost of cost-reimbursable projects are based in part on partial design and our estimates of the resources and time necessary to perform such contracts. A portion of the fee is often linked to these estimates and the related final cost and schedule objectives, and if for whatever reason these objectives are not met, the project may be less profitable than we expect or even result in losses.
The loss of or a significant reduction in business from one or a few customers could have a material adverse impact on us.
A few clients have in the past and may in the future account for a significant portion of our revenue and/or backlog in any one year or over a period of several consecutive years. For example, in fiscal 2020, 2019 and 2018, approximately 33%, 27% and 32%, respectively, of our revenue was earned directly or indirectly from agencies of the U.S. federal government. Although we have long-standing relationships with many of our significant clients, our clients may unilaterally reduce, delay or cancel their contracts at any time. Our loss of or a significant reduction in business from a significant client could have a material adverse impact on our business, financial condition, and results of operations.
The contracts in our backlog may be adjusted, canceled or suspended by our clients and, therefore, our backlog is not necessarily indicative of our future revenues or earnings. Additionally, even if fully performed, our backlog is not a good indicator of our future gross margins.
Backlog represents the total dollar amount of revenues we expect to record in the future as a result of performing work under contracts that have been awarded to us. As of the end of fiscal 2020, our backlog totaled approximately $23.8 billion. There is no assurance that backlog will actually be realized as revenues in the amounts reported or, if realized, will result in profits. In accordance with industry practice, substantially all of our contracts are subject to cancellation, termination, or suspension at the discretion of the client, including our U.S. government work. In the event of a project cancellation, we would generally have no contractual right to the total revenue reflected in our backlog. Projects can remain in backlog for extended periods of time because of the nature of the project and the timing of the particular services required by the project. The risk of contracts in backlog being canceled or suspended generally increases during periods of widespread economic slowdowns or in response to changes in commodity prices.
The contracts in our backlog are subject to changes in the scope of services to be provided as well as adjustments to the costs relating to the contracts. The revenue for certain contracts included in backlog is based on estimates. Additionally, the way we perform on our individual contracts can affect greatly our gross margins and hence, future profitability.
In some markets, there is a continuing trend towards cost-reimbursable contracts with incentive-fee arrangements. Typically, our incentive fees are based on such things as achievement of target completion dates or target costs, overall safety performance, overall client satisfaction and other performance criteria. If we fail to meet such targets or achieve the expected performance standards, we may receive a lower, or even zero, incentive fee resulting in lower gross margins. Accordingly, there is no assurance that the contracts in backlog, assuming they produce the revenues currently expected, will generate gross margins at the rates we have realized in the past.
Contracts with the U.S. federal government and other governments and their agencies pose additional risks relating to future funding and compliance.
Contracts with the U.S. federal government and other governments and their agencies, which are a significant source of our revenue and profit, are subject to various uncertainties, restrictions, and regulations including oversight
audits by various government authorities as well as profit and cost controls, which could result in withholding or delay of payments to us. Government contracts are also exposed to uncertainties associated with funding such as sequestration and budget deficits. Contracts with the U.S. federal government, for example, are subject to the uncertainties of Congressional funding. U.S. government shutdowns or any related under-staffing of the government departments or agencies that interact with our business could result in program cancellations, disruptions and/or stop work orders, could limit the government’s ability to effectively progress programs and make timely payments, and could limit our ability to perform on our existing U.S. government contracts and successfully compete for new work. Governments are typically under no obligation to maintain funding at any specific level, and funds for government programs may even be eliminated. Legislatures typically appropriate funds on a year-by-year basis, while contract performance may take more than one year. As a result, contracts with government agencies may be only partially funded or may be terminated, and we may not realize all of the potential revenue and profit from those contracts.
Our government clients may reduce the scope of or terminate our contracts for convenience or decide not to renew our contracts with little or no prior notice. Since government contracts represent a significant percentage of our revenues (for example, those with the U.S. federal government represented approximately 33% of our total revenue in fiscal 2020), a significant reduction in government funding or the loss of such contracts could have a material adverse impact on our business, financial condition, and results of operations.
Most government contracts are awarded through a rigorous competitive process. The U.S. federal government has increasingly relied upon multiple-year contracts with multiple contractors that generally require those contractors to engage in an additional competitive bidding process for each task order issued under a contract. This process may result in us facing significant additional pricing pressure and uncertainty and incurring additional costs. Moreover, we may not be awarded government contracts because of existing policies designed to protect small businesses and under-represented minorities. Our inability to win new contracts or be awarded work under existing contracts could have a material adverse impact on our business, financial condition and results of operations.
In addition, government contracts are subject to specific procurement regulations and a variety of other socio-economic requirements, which affect how we transact business with our clients and, in some instances, impose additional costs on our business operations. For example, for contracts with the U.S. federal government, we must comply with the Federal Acquisition Regulation, the Truth in Negotiations Act, the Cost Accounting Standards, and numerous regulations governing environmental protection and employment practices. Government contracts also contain terms that expose us to heightened levels of risk and potential liability than non-government contracts. This includes, for example, unlimited indemnification obligations.
We also are subject to government audits, investigations, and proceedings. For example, government agencies such as the U.S. Defense Contract Audit Agency routinely review and audit us to determine the adequacy of and our compliance with our internal control systems and policies and whether allowable costs are in accordance with applicable regulations. These audits can result in a determination that a rule or regulation has been violated or that adjustments are necessary to the amount of contract costs we believe are reimbursable by the agencies and the amount of our overhead costs allocated to the agencies.
If we violate a rule or regulation, fail to comply with a contractual or other requirement or do not satisfy an audit, a variety of penalties can be imposed on us including monetary damages and criminal and civil penalties. For example, in so-called “qui tam” actions brought by individuals or the government under the U.S. Federal False Claims Act or under similar state and local laws, treble damages can be awarded. In addition, any or all of our government contracts could be terminated, we could be suspended or debarred from all government contract work, or payment of our costs could be disallowed. The occurrence of any of these actions could have a material adverse impact on our business, financial condition and results of operations.
Many of our federal government contracts require us to have security clearances, which can be difficult and time consuming to obtain. If our employees or our facilities are unable to obtain or retain the necessary security clearances, our clients could terminate or not renew existing contracts or award us new contracts, which could have a material adverse impact on our business, financial condition and results of operations could be negatively impacted.
Our project execution activities may result in liability for faulty services.
If we fail to provide our services in accordance with applicable professional standards or contractual requirements, we could be exposed to significant monetary damages or even criminal violations. Our engineering practice, for example, involves professional judgments regarding the planning, design, development, construction,
operations and management of industrial facilities and public infrastructure projects. While we do not generally accept liability for consequential damages in our contracts, and although we have adopted a range of insurance, risk management and risk avoidance programs designed to reduce potential liabilities, a catastrophic event at one of our project sites or completed projects resulting from the services we have performed could result in significant professional or product liability and warranty or other claims against us as well as reputational harm, especially if public safety is impacted. These liabilities could exceed our insurance limits or the fees we generate, may not be covered by insurance at all due to various exclusions in our coverage and could impact our ability to obtain insurance in the future. Further, even where coverage applies, the policies have deductibles, which result in our assumption of exposure for certain amounts with respect to any claim filed against us. In addition, clients or subcontractors who have agreed to indemnify us against any such liabilities or losses might refuse or be unable to pay us. An uninsured claim, either in part or in whole, as well as any claim covered by insurance but subject to a high deductible, if successful and of a material magnitude, could have a material adverse impact on our business, financial condition and results of operations.
The outcome of pending and future claims and litigation could have a material adverse impact on our business, financial condition, and results of operations.
We are a party to claims and litigation in the normal course of business, including litigation inherited through acquisitions. Since we engage in engineering and construction activities for large facilities and projects where design, construction or systems failures can result in substantial injury or damage to employees or others, we are exposed to substantial claims and litigation and investigations if there is a failure at any such facility or project. Such claims could relate to, among other things, personal injury, loss of life, business interruption, property damage, pollution and environmental damage and be brought by our clients or third parties, such as those who use or reside near our clients’ projects. We can also be exposed to claims if we agreed that a project will achieve certain performance standards or satisfy certain technical requirements and those standards or requirements are not met. In many of our contracts with clients, subcontractors and vendors, we agree to retain or assume potential liabilities for damages, penalties, losses and other exposures relating to projects that could result in claims that greatly exceed the anticipated profits relating to those contracts. In addition, while clients and subcontractors may agree to indemnify us against certain liabilities, such third parties may refuse or be unable to pay us.
With a workforce of approximately 55,000 people globally, we are also party to labor and employment claims in the normal course of business. Such claims could relate to allegations of harassment and discrimination, pay equity, denial of benefits, wage and hour violations, whistleblower protections, concerted protected activity, and other employment protections, and may be pursued on an individual or class action basis depending on applicable laws and regulations. Some of such claims may be insurable, while other such claims may not.
We maintain insurance coverage for various aspects of our business and operations. Our insurance programs have varying coverage limits as well as exclusions for matters such as fraud, and insurance companies may attempt to deny claims for which we seek coverage. In addition, we have elected to retain a portion of losses that may occur through the use of various deductibles, retentions and limits under these programs. As a result, we may be subject to future liability for which we are only partially insured, or completely uninsured.
Although in the past we have been generally able to cover our insurance needs, there can be no assurances that we can secure all necessary or appropriate insurance in the future, or that such insurance can be economically secured. For example, catastrophic events can result in decreased coverage limits, coverage that is more limited, or increased premium costs or higher deductibles. We monitor the financial health of the insurance companies from which we procure insurance, which is one of the factors we take into account when purchasing insurance. Our insurance is purchased from a number of the world's leading providers, often in layered insurance or quota share arrangements. If any of our third party insurers fail, abruptly cancel our coverage or otherwise cannot satisfy their insurance requirements to us, then our overall risk exposure and operational expenses could be increased and our business operations could be interrupted.
In addition, the nature of our business sometimes results in clients, subcontractors and vendors presenting claims to us for, among other things, recovery of costs related to certain projects. Similarly, we occasionally present change orders and claims to our clients, subcontractors and vendors for, among other things, additional costs exceeding the original contract price. If we fail to document properly the nature of our claims and change orders or are otherwise unsuccessful in negotiating reasonable settlements with our clients, subcontractors and vendors, we could incur cost overruns, reduced profits or, in some cases, a loss for a project. Further, these claims can be the subject of lengthy negotiations, arbitration or litigation proceedings, which could result in the investment of significant amounts
of working capital pending the resolution of the relevant change orders and claims. A failure to promptly recover on these types of claims could have a material adverse impact on our liquidity and financial results. Additionally, irrespective of how well we document the nature of our claims and change orders, the cost to prosecute and defend claims and change orders can be significant.
Litigation and regulatory proceedings are subject to inherent uncertainties and unfavorable rulings can and do occur. Pending or future claims against us could result in professional liability, product liability, criminal liability, warranty obligations, default under our credit agreements and other liabilities which, to the extent we are not insured against a loss or our insurer fails to provide coverage, could have a material adverse impact on our business, financial condition, and results of operations.
Our use of joint ventures and partnerships exposes us to risks and uncertainties, many of which are outside of our control.
As is common in our industry, we perform certain contracts as a member of joint ventures, partnerships, and similar arrangements. This situation exposes us to a number of risks, including the risk that our partners may be unable to fulfill their obligations to us or our clients.
Further, we have limited ability to control the actions of our joint venture partners, including with respect to nonperformance, default, bankruptcy or legal or regulatory compliance. Our partners may be unable or unwilling to provide the required levels of financial support to the partnerships. If these circumstances occur, we may be liable for claims and losses attributable to the partner by operation of law or contract. These circumstances could also lead to disputes and litigation with our partners or clients, all of which could have a material adverse impact on our reputation, business, financial condition and results of operations.
We depend on the management effectiveness of our joint venture partners. Differences in views among the joint venture participants may result in delayed decisions or in failures to agree on major issues, which could materially affect the business and operations of these ventures. In addition, in many of the countries in which we engage in joint ventures, it may be difficult to enforce our contractual rights under the applicable joint venture agreement. If we are not able to enforce our contractual rights, we may not be able to realize the benefits of the joint venture or we may be subject to additional liabilities.
We participate in joint ventures and similar arrangements in which we are not the controlling partner. In these cases, we have limited control over the actions of the joint venture. These joint ventures may not be subject to the same requirements regarding internal controls and internal control over financial reporting that we follow. To the extent the controlling partner makes decisions that negatively impact the joint venture or internal control problems arise within the joint venture, it could have a material adverse impact on our business, financial condition and results of operations.
The failure by a joint venture partner to comply with applicable laws, regulations or client requirements could negatively impact our business and, for government clients, could result in fines, penalties, suspension or even debarment being imposed on us, which could have a material adverse impact on our business, financial condition and results of operations.
We are dependent on third parties to complete many of our contracts.
Third-party subcontractors we hire perform a significant amount of the work performed under our contracts. We also rely on third-party equipment manufacturers or suppliers to provide much of the equipment and materials used for projects. If we are unable to hire qualified subcontractors or find qualified equipment manufacturers or suppliers, our ability to successfully complete a project could be impaired. If we are not able to locate qualified third-party subcontractors or the amount we are required to pay for subcontractors or equipment and supplies exceeds what we have estimated, especially in a lump sum or a fixed-price contract, we may suffer losses on these contracts. If a subcontractor, supplier, or manufacturer fails to provide services, supplies or equipment as required under a contract for any reason, we may be required to source these services, equipment or supplies to other third parties on a delayed basis or on less favorable terms, which could impact contract profitability. There is a risk that we may have disputes with our subcontractors relating to, among other things, the quality and timeliness of work performed, customer concerns about the subcontractor, or our failure to extend existing task orders or issue new task orders under a contract. In addition, faulty workmanship, equipment or materials could impact the overall project, resulting in claims against us for failure to meet required project specifications.
In an uncertain or downturn economic environment, third parties may find it difficult to obtain sufficient financing to help fund their operations. The inability to obtain financing could adversely affect a third party’s ability to provide materials, equipment or services which could have a material adverse impact on our business, financial condition, and results of operations. In addition, a failure by a third party subcontractor, supplier or manufacturer to comply with applicable laws, regulations or client requirements could negatively impact our business and, for government clients, could result in fines, penalties, suspension or even debarment being imposed on us, which could have a material adverse impact on our business, financial condition, and results of operations.
Employee, agent or partner misconduct or our overall failure to comply with laws or regulations could weaken our ability to win contracts, which could result in reduced revenues and profits.
Misconduct, fraud, non-compliance with applicable laws and regulations, or other improper activities by one of our employees, agents or partners could have a significant negative impact on our business and reputation. Such misconduct could include the failure to comply with government procurement regulations, regulations regarding the protection of classified information, regulations prohibiting bribery and other corrupt practices, regulations regarding the pricing of labor and other costs in government contracts, regulations on lobbying or similar activities, regulations pertaining to the internal controls over financial reporting, regulations pertaining to export control, environmental laws, employee wages, pay and benefits, and any other applicable laws or regulations. For example, we routinely provide services that may be highly sensitive or that relate to critical national security matters; if a security breach were to occur, our ability to procure future government contracts could be severely limited. The precautions we take to prevent and detect these activities may not be effective and we could face unknown risks or losses. Our failure to comply with applicable laws or regulations, or acts of misconduct, could subject us to fines and penalties, cancellation of contracts, loss of security clearance and suspension or debarment from contracting, which could weaken our ability to win contracts and result in reduced revenues and profits and could have a material adverse impact on our business, financial condition and results of operations.
Our international operations are exposed to additional risks and uncertainties, including unfavorable political developments and weak foreign economies.
For fiscal 2020, approximately 25% of our revenue was earned from clients outside the U.S. Our business is dependent on the continued success of our international operations, and we expect our international operations to continue to account for a significant portion of our total revenues. Our international operations are subject to a variety of risks, including:
•Recessions and other economic crises in other regions, such as Europe, or specific foreign economies and the impact on our costs of doing business in those countries;
•Difficulties in staffing and managing foreign operations, including logistical and communication challenges;
•Unexpected changes in foreign government policies and regulatory requirements;
•Potential non-compliance with a wide variety of laws and regulations, including anti-corruption, export control and anti-boycott laws and similar non-U.S. laws and regulations;
•Potential non-compliance with regulations and evolving industry standards regarding consumer protection and data use and security, including the General Data Protection Regulation approved by the European Union;
•Lack of developed legal systems to enforce contractual rights;
•Expropriation and nationalization of our assets in a foreign country;
•Renegotiation or nullification of our existing contracts;
•The adoption of new, and the expansion of existing, trade or other restrictions;
•Embargoes, duties, tariffs or other trade restrictions, including sanctions;
•Changes in labor conditions;
•Acts of war, civil unrest, force majeure, and terrorism;
•The ability to finance efficiently our foreign operations;
•Social, political, and economic instability;
•Changes to tax policy;
•Currency exchange rate fluctuations;
•Limitations on the ability to repatriate foreign earnings; and
•U.S. government policy changes in relation to the foreign countries in which we operate.
The lack of a well-developed legal system in some of these countries may make it difficult to enforce our contractual rights. In addition, military action, geopolitical shifts or continued unrest, particularly in the Middle East, could impact the supply or pricing of oil, disrupt our operations in the region and elsewhere and increase our security costs. To the extent our international operations are affected by unexpected or adverse economic, political and other conditions, our business, financial condition and results of operations may be adversely affected.
We work in international locations where there are high security risks, which could result in harm to our employees or unanticipated cost.
Some of our services are performed in high-risk locations, where the country or location is subject to political, social or economic risks, or war, terrorism or civil unrest. In those locations where we have employees or operations, we may expend significant efforts and incur substantial security costs to maintain the safety of our personnel. Despite these activities, in these locations, we cannot guarantee the safety of our personnel and we may suffer future losses of employees and subcontractors. Acts of terrorism and threats of armed conflicts in or around various areas in which we operate could limit or disrupt markets and our operations, including disruptions resulting from the evacuation of personnel, cancellation of contracts, or the loss of key employees, contractors or assets.
Cyber security or privacy breaches, or systems and information technology interruption or failure could adversely impact our ability to operate or expose us to significant financial losses and reputational harm.
We rely heavily on computer, information and communications technology and related systems in order to properly operate our business. From time to time, we experience occasional system interruptions and delays. In the event we are unable to regularly deploy software and hardware, effectively upgrade our systems and network infrastructure and take other steps to maintain or improve the efficiency and efficacy of our systems, the operation of such systems could be interrupted or result in the loss, corruption, or release of data. In addition, our computer and communication systems and operations could be damaged or interrupted by natural disasters, force majeure events, telecommunications failures, power loss, acts of war or terrorism, computer viruses, malicious code, physical or electronic security breaches, intentional or inadvertent user misuse or error or similar events or disruptions. Any of these or other events could cause interruptions, delays, loss of critical and/or sensitive data or similar effects, which could have a material adverse impact on our business, financial condition, protection of intellectual property and results of operations, as well as those of our clients.
In addition, we face the threat to our computer systems of unauthorized access, computer hackers, computer viruses, malicious code, ransomware, phishing, organized cyber-attacks and other security problems and system disruptions, including possible unauthorized access to and disclosure of our and our clients’ proprietary or classified information. In addition, such tactics may also seek to cause payments due to or from the Company to be misdirected to fraudulent accounts, which may not be recoverable by the Company.
While we have security measures and technology in place to protect our and our clients’ proprietary or classified information, if these measures fail as a result of a cyber-attack, other third-party action, employee error, malfeasance or otherwise, and someone obtains unauthorized access to our or our clients’ information, our reputation could be damaged, our business may suffer and we could incur significant liability. Because the techniques used to obtain unauthorized access or sabotage systems change frequently and generally are not identified until they are launched against a target, we may be unable to anticipate these techniques or to implement adequate preventative measures. As a result, we may be required to expend significant resources to protect against the threat of system disruptions and security breaches or to alleviate problems caused by these disruptions and breaches. Any of these events could damage our reputation and have a material adverse effect on our business, financial condition and results of operations.
In addition, new laws and regulations governing data privacy and the unauthorized disclosure of confidential information, including the European Union General Data Protection Regulation and the California Consumer Privacy
Act, pose increasingly complex compliance challenges and potentially elevate costs, and any failure to comply with these laws and regulations could result in significant penalties and legal liability.
We continuously evaluate the need to upgrade and/or replace our systems and network infrastructure to protect our computing environment, to stay current on vendor supported products and to improve the efficiency of our systems and for other business reasons. The implementation of new systems and information technology could adversely impact our operations by imposing substantial capital expenditures, demands on management time and risks of delays or difficulties in transitioning to new systems. In addition, our systems implementations may not result in productivity improvements at the levels anticipated. Systems implementation disruption and any other information technology disruption, if not anticipated and appropriately mitigated, could have an adverse effect on our business.
We are subject to professional standards, duties and statutory obligations on professional reports and opinions we issue, which could subject us to monetary damages.
We issue reports and opinions to clients based on our professional engineering expertise as well as our other professional credentials that subject us to professional standards, duties and obligations regulating the performance of our services. For example, we issue opinions and reports to government clients in connection with securities offerings. If a client or another third party alleges that our report or opinion is incorrect or it is improperly relied upon and we are held responsible, we could be subject to significant monetary damages. In addition, our reports and other work product may need to comply with professional standards, licensing requirements, securities regulations and other laws and rules governing the performance of professional services in the jurisdiction where the services are performed. We could be liable to third parties who use or rely upon our reports and other work product even if we are not contractually bound to those third parties. These events could in turn result in monetary damages and penalties.
We may not be able to protect our intellectual property or that of our clients.
Our technology and intellectual property provide us, in certain instances, with a competitive advantage. Although we protect our property through registration, licensing, contractual arrangements, security controls and similar mechanisms, we may not be able to successfully preserve our rights and they could be invalidated, circumvented, challenged or become obsolete. Trade secrets are generally difficult to protect. Our employees and contractors are subject to confidentiality obligations, but this protection may be inadequate to deter or prevent misappropriation of our confidential information and/or infringement of our intellectual property. In addition, the laws of some foreign countries in which we operate do not protect intellectual property rights to the same extent as the U.S. If we are unable to protect and maintain our intellectual property rights or if there are any successful intellectual property challenges or infringement proceedings against us, our ability to differentiate our service offerings could be reduced. Litigation to determine the scope of intellectual property rights, even if ultimately successful, could be costly and could divert leadership’s attention away from other aspects of our business.
We also hold licenses from third parties which may be utilized in our business operations. If we are no longer able to license such technology on commercially reasonable terms or otherwise, our business and financial performance could be adversely affected.
If our intellectual property rights or work processes become obsolete, we may not be able to differentiate our service offerings and some of our competitors may be able to offer more attractive services to our customers. Our competitors may independently attempt to develop or obtain access to technologies that are similar or superior to our technologies.
Our clients or other third parties may also provide us with their technology and intellectual property. There is a risk we may not sufficiently protect our or their information from improper use or dissemination and, as a result, could be subject to claims and litigation and resulting liabilities, loss of contracts or other consequences that could have a material adverse impact on our business, financial condition and results of operations.
If we do not have adequate indemnification for our nuclear services, it could adversely affect our business, financial condition and results of operations.
The Price-Anderson Nuclear Industries Indemnity Act, commonly called the Price-Anderson Act (“PAA”), is a U.S. federal law, which, among other things, regulates radioactive materials and the nuclear energy industry, including liability and compensation in the event of nuclear related incidents. The PAA provides certain protections and indemnification to nuclear energy plant operators and U.S. Department of Energy (“DOE”) contractors. The PAA
protections and indemnification apply to us as part of our services to the U.S. nuclear energy industry and DOE for new facilities, maintenance, modification, decontamination and decommissioning of nuclear energy, weapons and research facilities.
We offer similar services in other jurisdictions outside the U.S. For those jurisdictions, varying levels of nuclear liability protection is provided by international treaties, and/or domestic laws, such as the Nuclear Liability and Compensation Act of Canada and the Nuclear Installations Act of the United Kingdom, insurance and/or assets of the nuclear installation operators (some of which are backed by governments) as well as under appropriate enforceable contractual indemnifications and hold-harmless provisions. These protections and indemnifications, however, may not cover all of our liability that could arise in the performance of these services. To the extent the PAA or other protections and indemnifications do not apply to our services, the cost of losses associated with liability not covered by the available protections and indemnifications, or by virtue of our loss of business because of these added costs could have a material adverse impact on our business, financial condition and results of operations.
Our actual results could differ from the estimates and assumptions used to prepare our financial statements.
In preparing our financial statements, our leadership is required under U.S. GAAP to make estimates and assumptions as of the date of the financial statements. These estimates and assumptions affect the reported values of assets, liabilities, revenue and expenses and disclosure of contingent assets and liabilities. Areas requiring significant estimates by our leadership include:
•Recognition of contract revenue, costs, profit or losses in applying the principles of percentage of completion accounting;
•Estimated amounts for expected project losses, warranty costs, contract close-out or other costs;
•Recognition of recoveries under contract change orders or claims;
•Collectability of billed and unbilled accounts receivable and the need and amount of any allowance for doubtful accounts;
•Estimates of other liabilities, including litigation and insurance revenues/reserves and reserves necessary for self-insured risks;
•Accruals for estimated liabilities, including litigation reserves;
•Valuation of assets acquired, and liabilities, goodwill, and intangible assets assumed, in acquisitions and ongoing assessment of impairment;
•Valuation of stock-based compensation;
•The determination of liabilities under pension and other post-retirement benefit programs;
•Income tax provisions and related valuation allowances; and
•Valuation of investment in Worley stock.
Our actual business and financial results could differ from our estimates of such results, which could have a material adverse impact on our financial condition and results of operations.
An impairment charge on our goodwill or intangible assets could have a material adverse impact on our financial position and results of operations.
Because we have grown in part through acquisitions, goodwill and intangible assets represent a substantial portion of our assets. Under U.S. GAAP, we are required to test goodwill carried in our Consolidated Balance Sheets for possible impairment on an annual basis based upon a fair value approach. We also assess the recoverability of the unamortized balance of our intangible assets when indications of impairment are present based on expected future probability and undiscounted expected cash flows and their contribution to our overall operations. As of October 2, 2020, we had $5.64 billion of goodwill, representing 45.6% of our total assets of $12.35 billion. We have chosen to perform our annual impairment reviews of goodwill at the beginning of the fourth quarter of our fiscal year. We also are required to test goodwill for impairment between annual tests if events occur or circumstances change that would more likely than not reduce our enterprise fair value below its book value. These events or circumstances could include a significant change in the business climate, including a significant sustained decline in a reporting unit’s market value, legal factors, operating performance indicators, competition, sale or disposition of a significant portion of our business, potential government actions toward our facilities and other factors.
If our market capitalization drops significantly below the amount of net equity recorded on our balance sheet, it might indicate a decline in our fair value and would require us to further evaluate whether our goodwill has been impaired. If the fair value of our reporting units is less than their carrying value, we could be required to record an impairment charge. The amount of any impairment could be significant and could have a material adverse impact on our financial position and results of operations for the period in which the charge is taken. For a further discussion of goodwill impairment testing, please see Item 7- Management’s Discussion and Analysis of Financial Condition and Results of Operations below.
Impairment of long-lived assets or restructuring activities may require us to record a significant charge to earnings.
Our long-lived assets, including our lease right-of-use assets, equity investments and other, are subject to periodic testing for impairment. Failure to achieve sufficient levels of cash flow at the asset group level could result in impairment of our long-lived assets. Further changes in the business environment could lead to changes in the scope of operations of our business. These changes, including the closure of one or more offices, could result in restructuring and/or asset impairment charges. The COVID-19 pandemic raises the possibility of an extended global economic downturn which increase the risk of long-lived asset impairment charges.
We may be required to contribute additional cash to meet any underfunded benefit obligations associated with retirement and post-retirement benefit plans we manage.
We have various employee benefit plan obligations that require us to make contributions to satisfy, over time, our underfunded benefit obligations, which are generally determined by calculating the projected benefit obligations minus the fair value of plan assets. For example, as of October 2, 2020 and September 27, 2019, our defined benefit pension and post-retirement benefit plans were underfunded by $400.4 million and $399.8 million, respectively. See Note 13- Pension and Other Postretirement Benefit Plans in the Notes to Consolidated Financial Statements beginning on page F-1 of this Annual Report on Form 10-K for additional disclosure. In the future, our benefit plan obligations may increase or decrease depending on changes in the levels of interest rates, pension plan asset performance and other factors. If we are required to contribute a significant amount of the deficit for underfunded benefit plans, our cash flows could be materially and adversely affected.
Negotiations with labor unions and possible work actions could disrupt operations and increase labor costs and operating expenses.
A certain portion of our work force has entered, or may in the future enter, into collective bargaining agreements, which on occasion may require renegotiation. The outcome of future negotiations relating to union representation or collective bargaining agreements may not be favorable to the Company in that they may increase our operating expenses and lower our net income as a result of higher wages or benefit expenses. In addition, negotiations with unions could divert management attention and disrupt operations, which may adversely affect our results of operations. If we are unable to negotiate acceptable collective bargaining agreements, we may have to address the threat of union-initiated work actions, including strikes. Depending on the nature of the threat or the type and duration of any work action, these actions could have a material adverse impact on our business, financial condition and results of operations.
Demand for our services is cyclical as the sectors and industries in which our clients operate are impacted by economic downturns, reductions in government or private spending and times of political uncertainty.
We provide full spectrum technical and professional solutions to clients operating in a number of sectors and industries, including programs for various national governments, including the U.S. federal government; aerospace; automotive; pharmaceuticals and biotechnology; infrastructure; environmental and nuclear; buildings; smart cities; power; water; transportation; telecom and other general industrial and consumer businesses and sectors. These sectors and industries and the resulting demand for our services have been, and we expect will continue to be, cyclical and subject to significant fluctuations due to a variety of factors beyond our control, including economic conditions and changes in client spending, particularly during periods of economic or political uncertainty.
Uncertain global economic and political conditions may negatively impact our clients’ ability and willingness to fund their projects, including their ability to raise capital and pay, or timely pay, our invoices. They may also cause our clients to reduce their capital expenditures, alter the mix of services purchased, seek more favorable price and other contract terms and otherwise slow their spending on our services. For example, in the public sector, declines in state and local tax revenues as well as other economic declines may result in lower state and local government spending. In addition, under such conditions, many of our competitors may be more inclined to take greater or unusual risks or accept terms and conditions in contracts that we might not deem acceptable. These conditions may reduce the demand for our services, which may have a material adverse impact on our business, financial condition and results of operations.
Additionally, uncertain economic and political conditions may make it difficult for our clients, our vendors, and us to accurately forecast and plan future business activities. For example, recent changes to U.S. policies related to global trade and tariffs have resulted in uncertainty surrounding the future of the global economy as well as retaliatory trade measures implemented by other countries. The increasing cost of steel and aluminum may impact client spending. We cannot predict the outcome of these changing trade policies or other unanticipated political conditions, nor can we predict the timing, strength or duration of any economic recovery or downturn worldwide or in our clients’ markets. In addition, our business has traditionally lagged recoveries in the general economy and, therefore, may not recover as quickly as the economy at large. Weak economic conditions, a failure to obtain expected benefits from any increased infrastructure spending, or a reduction in government spending could have a material adverse impact on our business, financial condition and results of operations. Furthermore, if a significant portion of our clients or projects are concentrated in a specific geographic area or industry, our business may be disproportionately affected by negative trends or economic downturns in those specific geographic areas or industries.
Regardless of economic or market conditions, investment decisions by our customers may vary by location or as a result of other factors like the availability of labor or relative construction cost. Because we are dependent on the timing and funding of new awards, we are therefore vulnerable to changes in our clients’ markets and investment decisions. As a result, our past results have varied and may continue to vary depending upon the demand for future projects in the markets and the locations in which we operate.
Our operations may be impacted by the United Kingdom’s exit from the European Union.
In June 2016, the U.K. held a referendum in which voters approved an exit from the E.U., commonly referred to as “Brexit.” The U.K. formally exited the E.U. on January 30, 2020, pursuant to a withdrawal agreement between the U.K. government and the E.U. The withdrawal agreement provides for a transition period from February through December 2020 to allow time for a future trade deal to be agreed upon. As a result of the U.K.’s exit from the E.U., there may be greater restrictions on imports and exports between the U.K. and E.U. countries and increased regulatory complexities. These changes may adversely affect our relationships with our existing and future customers, suppliers, employees, and subcontractors, or otherwise have an adverse effect on our business, financial condition and results of operations. The ongoing negotiations between the U.K. and the E.U. as to the terms upon which the U.K. will exit from the E.U. and the uncertainty as to their future trade agreement continues to create economic uncertainty, which may cause our customers to closely monitor their costs, terminate or reduce the scope of existing contracts, decrease or postpone currently planned contracts, or negotiate for more favorable deal terms, each of which may have a negative impact on our business, financial condition and results of operations.
Rising inflation, interest rates, and/or construction costs could reduce the demand for our services as well as decrease our profit on our existing contracts, in particular with respect to our fixed-price contracts.
Rising inflation, interest rates, or construction costs could reduce the demand for our services. In addition, we bear all of the risk of rising inflation with respect to those contracts that are fixed-price. Because a significant portion of our revenues are earned from cost-reimbursable type contracts (approximately 76% during fiscal 2020), the effects of inflation on our financial condition and results of operations over the past few years have been generally minor. However, if we expand our business into markets and geographic areas where fixed-price and lump-sum work is more prevalent, inflation may have a larger impact on our results of operations in the future. Therefore, increases in inflation, interest rates or construction costs could have a material adverse impact on our business, financial condition and results of operations.
Foreign exchange risks may affect our ability to realize a profit from certain projects.
Our reported financial condition and results of operations are exposed to the effects (both positive and negative) that fluctuating exchange rates have on the process of translating the financial statements of our international operations, which are denominated in currencies other than the U.S. dollar, into the U.S. dollar. While we generally attempt to denominate our contracts in the currencies of our expenditures, we do enter into contracts that expose us to currency risk, particularly to the extent contract revenue is denominated in a currency different than the contract costs. We attempt to minimize our exposure from currency risks by obtaining escalation provisions for projects in inflationary economies or entering into derivative (hedging) instruments, when there is currency risk exposure that is not naturally mitigated via our contracts. These actions, however, may not always eliminate currency risk exposure. The governments of certain countries have or may in the future impose restrictive exchange controls on local currencies and it may not be possible for us to engage in effective hedging transactions to mitigate the risks associated with fluctuations in a particular currency. Based on fluctuations in currency, the U.S. dollar value of our backlog may from time to time increase or decrease significantly. We may also be exposed to limitations on our ability to reinvest earnings from operations in one country to fund the financing requirements of our operations in other countries.
Our global presence could give rise to material fluctuations in our income tax rates.
We are subject to income taxes in the U.S. and numerous foreign jurisdictions. Significant judgment is required in determining our worldwide provision for income taxes. In the ordinary course of our business, there are many transactions and calculations where the ultimate tax determination is uncertain. We are regularly under audit by tax authorities. Although we believe that our tax estimates and tax positions are reasonable, they could be materially affected by many factors including the final outcome of tax audits and related litigation, the introduction of new tax accounting standards, legislation, regulations and related interpretations, our global mix of earnings, the realizability of deferred tax assets and changes in uncertain tax positions. An increase or decrease in our effective tax rate, or an ultimate determination that the Company owes more taxes than the amounts previously accrued, could have a material adverse impact on our financial condition and results of operations.
Our businesses could be materially and adversely affected by events outside of our control.
Extraordinary or force majeure events beyond our control, such as natural or man-made disasters, could negatively impact our ability to operate. As an example, from time to time we face unexpected severe weather conditions which may result in weather-related delays that are not always reimbursable under a fixed-price contract; evacuation of personnel and curtailment of services; increased labor and material costs in areas resulting from weather-related damage and subsequent increased demand for labor and materials for repairing and rebuilding; inability to deliver materials, equipment and personnel to job sites in accordance with contract schedules; and loss of productivity. We may remain obligated to perform our services after any such natural or man-made event, unless a force majeure clause or other contractual provision provides us with relief from our contractual obligations. If we are not able to react quickly to such events, or if a high concentration of our projects are in a specific geographic region that suffers from a natural or man-made catastrophe, our operations may be significantly affected, which could have a material adverse impact on our operations. In addition, if we cannot complete our contracts on time, we may be subject to potential liability claims by our clients which may reduce our profits.
Climate change and related environmental issues could have a material adverse impact on our business, financial condition and results of operations.
In 2020, the World Economic Forum identified failure to act on climate change and related environmental issues as one of the top ten risks in terms of impact and likelihood for the first time. In 2017, the Task-force on Climate-related Financial Disclosures (TCFD),which is an industry-led group tasked within bringing climate related financial reporting into the mainstream, estimated that the value of the global stock of manageable assets at risk from climate change between now and the year 2100 could be up to $43 trillion USD. The risk framework put forward by the TCFD encourages organizations to consider climate risks and their materiality in four domains (Market/technology; Reputation; Policy/legal; Physical) and across two climate scenarios (“Paris Agreement”, or low carbon scenario; and “Business As Usual (BAU)”, or high carbon scenario). As further described below, each domain could pose a material risk to the Company at a business and/or project level and could have a material adverse impact on our business, financial condition and results of operations:
•Market and technological shifts: We expect that climate-related market and technological shifts will likely be driven by urban development, population growth, quality of life expectations of an emerging middle class in historically developing countries and developments in digital technologies. This could create demand for: low and zero carbon energy, industrial processes and infrastructure; resilience services for natural environments, infrastructure and communities; and the application of “smart”, data-driven technologies.
•Reputation: Our reputation is influenced by our delivery performance, client engagement, innovation, price (of our labor and projects), regulatory compliance and risk management. We anticipate, particularly under our Paris Agreement (1.5°C) scenario, that our reputation with external and internal stakeholders could also be increasingly influenced by our values and practices regarding low/zero carbon transformation.
•Policy and legal: Policy and legal environments are expected to diverge sharply between our 4°C (BAU) and 1.5°C (Paris Agreement) scenarios, with the divergence mainly relating to greenhouse gas emissions and the extent to which low/zero carbon transitions are driven. We expect that some national and sub-national jurisdictions and some of our clients may advocate for the transition, regardless of the extent to which there is global alignment with the Paris Agreement. In contrast, both scenarios are expected to converge on climate change-related litigation and policy advocacy and regulatory support for climate resilience.
•Physical risks: There could be significant physical risks from climate change under both our 4°C and 1.5°C scenarios. These risks could be driven by increased temperature, increased storm intensities, sea level rise and changes in rainfall amount, seasonality and the intensity of extreme events. The types of change are similar under the two scenarios, but their expressions could be much more severe under the 4°C scenario.
Fluctuations in commodity prices may affect our customers’ investment decisions and therefore subject us to risks of cancellation, delays in existing work, or changes in the timing and funding of new awards.
Commodity prices can affect our customers in a number of ways. For example, for those customers that produce commodity products such as oil, gas, copper, or fertilizers, fluctuations in price can have a direct effect on their profitability and cash flow and, therefore, their willingness to continue to invest or make new capital investments. Furthermore, declines in commodity prices can negatively impact our business in regions whose economies are substantially dependent on commodity prices, such as the Middle East. To the extent commodity prices decline or fluctuate and our customers defer new investments or cancel or delay existing projects, the demand for our services decreases, which may have a material adverse impact on our business, financial condition and results of operations.
Commodity prices can also strongly affect the costs of projects. Rising commodity prices can negatively impact the potential returns on investments that are planned, as well as those in progress, and result in customers deferring new investments or canceling or delaying existing projects. Cancellations and delays have affected our past results and may continue to do so in significant and unpredictable ways and could have a material adverse impact on our business, financial condition and results of operations.
Our continued success is dependent upon our ability to hire, retain, and utilize qualified personnel.
The success of our business is dependent upon our ability to hire, retain and utilize qualified personnel, including engineers, architects, designers, craft personnel and corporate leadership professionals who have the required experience and expertise at a reasonable cost. The market for these and other personnel is competitive. From time to time, it may be difficult to attract and retain qualified individuals with the expertise, and in the timeframe, demanded by our clients, or to replace such personnel when needed in a timely manner. In certain geographic areas, for example, we may not be able to satisfy the demand for our services because of our inability to successfully hire and retain qualified personnel. Furthermore, some of our personnel hold government granted clearance that may be required to obtain government projects. If we were to lose some or all of these personnel, they would be difficult to replace. Loss of the services of, or failure to recruit, qualified technical and leadership personnel could limit our ability to successfully complete existing projects and compete for new projects.
In addition, in the event that any of our key personnel retire or otherwise leave the Company, we need to have appropriate succession plans in place and to successfully implement such plans, which requires devoting time and resources toward identifying and integrating new personnel into leadership roles and other key positions. If we cannot attract and retain qualified personnel or effectively implement appropriate succession plans, it could have a material adverse impact on our business, financial condition and results of operations.
The cost of providing our services, including the extent to which we utilize our workforce, affects our profitability. For example, the uncertainty of contract award timing can present difficulties in matching our workforce size with our contracts. If an expected contract award is delayed or not received, we could incur costs resulting from excess staff, reductions in staff, or redundancy of facilities that could have a material adverse impact on our business, financial condition and results of operations.
Our business strategy relies in part on acquisitions to sustain our growth. Acquisitions of other companies present certain risks and uncertainties.
Our business strategy involves growth through, among other things, the acquisition of other companies. Acquiring companies, including CH2M HILL Companies, Ltd., which we acquired in December 2017, KeyW, which we acquired in June 2019, and John Wood Group’s nuclear business, which we acquired in March 2020, presents a number of risks, including:
•Assumption of liabilities of an acquired business, including liabilities that were unknown at the time the acquisition was negotiated;
•Failure of the acquired business to comply with U.S. federal, state, local and foreign laws and regulations and/or contractual requirements with government clients;
•Valuation methodologies may not accurately capture the value of the acquired business;
•Failure to realize anticipated benefits, such as cost savings, synergies, business opportunities and growth opportunities;
•The loss of key customers or suppliers, including as a result of any actual or perceived conflicts of interest;
•Difficulties or delays in obtaining regulatory approvals, licenses and permits;
•Difficulties relating to combining previously separate entities into a single, integrated, and efficient business;
•The effects of diverting leadership’s attention from day-to-day operations to matters involving the integration of acquired companies;
•Potentially substantial transaction costs associated with business combinations;
•Potential impairment resulting from the overpayment for an acquisition or post-acquisition deterioration in an acquired business;
•Difficulties relating to assimilating the leadership, personnel, benefits, services, and systems of an acquired business and to assimilating marketing and other operational capabilities;
•Difficulties retaining key personnel of an acquired business;
•Increased burdens on our staff and on our administrative, internal control and operating systems, which may hinder our legal and regulatory compliance activities;
•Difficulties in applying and integrating our system of internal controls to an acquired business;
•Increased financial and accounting challenges and complexities in areas such as tax planning, treasury management, financial reporting and internal controls;
•The potential requirement for additional equity or debt financing, which may not be available, or if available, may not have favorable terms; and
•The risks discussed in this Item 1A. Risk Factors that may relate to the activities of the acquired business prior to the acquisition.
While we may obtain indemnification rights from the sellers of acquired businesses and/or insurance that could mitigate certain of these risks, such rights may be difficult to enforce, the losses may exceed any dedicated escrow funds and the indemnitors may not have the ability to financially support the indemnity, or the insurance coverage may be unavailable or insufficient to cover all losses.
If our leadership is unable to successfully integrate acquired companies or implement our growth strategy, our operating results could be harmed. In addition, even if the operations of an acquisition are integrated successfully, we may not realize the full benefits of an acquisition, including the synergies, cost savings, or sales or growth opportunities that we expect. These benefits may not be achieved within the anticipated time frame, or at all. Moreover, we cannot assure that we will continue to successfully expand or that growth or expansion will result in profitability.
In addition, there is no assurance that we will continue to locate suitable acquisition targets or that we will be able to consummate any such transactions on terms and conditions acceptable to us. Existing cash balances and cash flow from operations, together with borrowing capacity under our credit facilities, may be insufficient to make acquisitions. Future acquisitions may require us to obtain additional equity or debt financing, which may not be available on attractive terms, or at all. Acquisitions may also bring us into businesses we have not previously conducted and expose us to additional business risks that are different than those we have traditionally experienced.
Acquisitions and divestitures create various business risks and uncertainties during the pendency of the transaction.
Consummation of any merger or divestiture is subject to the satisfaction of customary conditions, including one or more of the following: (i) due diligence and its associated time and cost commitments, (ii) board and shareholder approval, (iii) regulatory approvals, (iv) the absence of any legal restraint that would prevent the consummation of the transaction, (v) the absence of material adverse conditions which can prevent the consummation of the transaction, and (vi) compliance with covenants and the accuracy of representations and warranties contained in the transaction agreement, among others. One or more of these conditions may not be fulfilled and, accordingly, the transaction may not be consummated or may be significantly delayed. In such case, our ongoing business, financial condition and results of operations may be materially adversely affected and the market price of our common stock
may decline, particularly to the extent that the market price reflects a market assumption that the transaction will be consummated or will be consummated within a particular timeframe.
Furthermore, most transactions require the Company to incur substantial expense associated with closing and if the transaction is not consummated, we will incur these expenses without realizing the expected benefits. The pursuit of the transaction will also require management attention and use of internal resources that would otherwise be focused on general business operations. In addition, customers’ uncertainty about the effect of the transaction may have an adverse effect on the ability to win customer contracts, or could cause existing clients to seek to change existing business relationships. Employee morale due to the uncertainties associated with the transaction could also be negatively affected. Any of the foregoing, or other risks arising in connection with a failure or delay in consummating a transaction, including the diversion of management attention or loss of other opportunities during the pendency of the transaction, could have a material adverse effect on our business, financial condition and results of operations.
Risks Related to Regulatory Compliance
Past and future environmental, health, and safety laws could impose significant additional costs and liabilities.
We are subject to a variety of environmental, health, and safety laws and regulations governing, among other things, discharges to air and water, the handling, storage and disposal of hazardous or waste materials and the remediation of contamination associated with the releases of hazardous substances, and human health and safety. These laws and regulations and the risk of attendant litigation can cause significant delays to a project and add significantly to its cost. Violations of these regulations could subject us and our management to civil and criminal penalties and other liabilities.
Various U.S. federal, state, local and foreign environmental laws and regulations may impose liability for property damage and costs of investigation and cleanup of hazardous or toxic substances on property currently or previously owned by us or arising out of our waste management or environmental remediation activities. These laws may impose responsibility and liability without regard to knowledge of or causation of the presence of contaminants. The liability under these laws may be joint and several. We have potential liabilities associated with our past waste management and other activities and with our current and prior ownership of various properties. The discovery of additional contaminants or the imposition of unforeseen clean-up obligations at these or other sites could have a material adverse impact on our financial condition and results of operations.
When we perform our services, our personnel and equipment may be exposed to radioactive and hazardous materials and conditions. We may be subject to liability claims by employees, customers and third parties as a result of such exposures. In addition, we may be subject to fines, penalties or other liabilities arising under environmental or safety laws. A claim, if not covered or only partially covered by insurance, could have a material adverse impact on our results of operations and financial condition.
Health, safety, and environmental laws and regulations and policies are reviewed periodically and any changes thereto could affect us in substantial and unpredictable ways. Such changes could, for example, relax or repeal laws and regulations relating to the environment, which could result in a decline in the demand for our environmental services and, in turn, could negatively impact our revenue. Changes in the environmental laws and regulations, remediation obligations, enforcement actions, stricter interpretations of existing requirements, future discovery of contamination or claims for damages to persons, property, natural resources or the environment could result in material costs and liabilities that we currently do not anticipate. If we fail to comply with any environmental, health, or safety laws or regulations, whether actual or alleged, we could be exposed to fines, penalties or potential litigation liabilities, including costs, settlements and judgments, any of which could adversely affect our business, financial condition and results of operations.
In addition, we and many of our clients operate in highly regulated environments, which may require us or our clients to obtain, and to comply with, federal, state and local government permits and approvals. Any of these permits or approvals may be subject to denial, revocation or modification under various circumstances. Failure to obtain or comply with, or the loss or modification of, the conditions of permits or approvals may subject us to penalties or other liabilities, which could have a material adverse impact on our business, financial condition and result of operations.
If we fail to comply with federal, state, local or foreign governmental requirements, our business may be adversely affected.
We are subject to U.S. federal, state, local and foreign laws and regulations that affect our business. For example, our global operations require importing and exporting goods and technology across international borders which requires full compliance with both export regulatory laws and International Trafficking in Arms Regulations (“ITAR”). Although we have policies and procedures to comply with U.S. and foreign international trade laws, the violation of such laws could subject the Company and its employees to civil or criminal penalties, including substantial monetary fines, or other adverse actions including denial of import or export privileges or debarment from participation in U.S. government contracts, and could damage our reputation and our ability to do business.
We could be adversely affected by violations of the U.S. Foreign Corrupt Practices Act and similar worldwide anti-bribery laws.
The U.S. Foreign Corrupt Practices Act (“FCPA”), the U.K. Bribery Act of 2010, and similar anti-bribery laws in other jurisdictions generally prohibit companies and their intermediaries from making improper payments for the purpose of obtaining or retaining business. Our policies mandate compliance with these anti-bribery laws, including the requirements to maintain accurate information and internal controls. We operate in many parts of the world that have experienced governmental corruption to some degree and in certain circumstances; strict compliance with anti-bribery laws may conflict with local customs and practices. Despite our training and compliance programs, there is no assurance that our internal control policies and procedures will protect us from acts committed by our employees or agents. If we are found to be liable for FCPA or other violations (either due to our own acts or our inadvertence, or due to the acts or inadvertence of others), we could suffer from civil and criminal penalties or other sanctions, including contract cancellations or debarment and loss of reputation, any of which could have a material adverse impact on our business, financial condition and results of operations.
We may be affected by market or regulatory responses to climate change.
Growing concerns about climate change may result in the imposition of additional environmental regulations. Legislation, international protocols, regulation or other restrictions on emissions could result in increased compliance costs for us and our clients and have other impacts on our clients, including those who are involved in the exploration, production or refining of fossil fuels, emit greenhouse gases through the combustion of fossil fuels or emit greenhouse gases through the mining, manufacture, utilization or production of materials or goods. Such policy changes could increase the costs of projects for our clients or, in some cases, prevent a project from going forward, thereby potentially reducing the need for our services, which would in turn have a material adverse impact on our business, financial condition and results of operations. However, these changes could also increase the pace of projects, such as carbon capture or storage projects, that could have a positive impact on our business. We cannot predict when or whether any of these various proposals may be enacted or what their effect will be on us or on our customers.
Risks Related to Our Indebtedness
We rely on cash provided by operations and liquidity under our credit facilities to fund our business. Negative conditions in the credit and financial markets and delays in receiving client payments could adversely affect our cost of borrowing and our business.
Although we finance much of our operations using cash provided by operations, at times we depend on the availability of credit to grow our business and to help fund business acquisitions. We are currently a borrower under several credit facilities. These facilities all contain customary covenants restricting, among other things, our ability to incur certain liens and indebtedness. We are also subject to certain financial covenants, including maintenance of a maximum consolidated leverage ratio. A breach of any covenant or our inability to comply with the required financial ratios could result in a default under one or more of our credit facilities and limit our ability to do further borrowing. Instability in the credit markets in the U.S. or abroad could cause the availability of credit to be relatively difficult or expensive to obtain at competitive rates, on commercially reasonable terms or in sufficient amounts. This situation could make it more difficult or more expensive for us to access funds, refinance our existing indebtedness, enter into agreements for new indebtedness, or obtain funding through the issuance of securities or such additional capital may not be available on terms acceptable to us, or at all. We may also enter into business acquisition agreements that require us to access credit, which if not available at the closing of the acquisition could result in a breach of the acquisition agreement and a resulting claim for damages by the sellers of such business. In addition, market conditions
could negatively impact our clients’ ability to fund their projects and, therefore, utilize our services, which could have a material adverse impact on our business, financial condition, and results of operations.
In addition, we are subject to the risk that the counterparties to our credit agreements may go bankrupt if they suffer catastrophic demand on their liquidity that will prevent them from fulfilling their contractual obligations to us. We also routinely enter into contracts with counterparties including vendors, suppliers and subcontractors that may be negatively impacted by events in the credit markets. If those counterparties are unable to perform their obligations to us or our clients, we may be required to provide additional services or make alternate arrangements on less favorable terms with other parties to ensure adequate performance and delivery of services to our clients. These circumstances could also lead to disputes and litigation with our partners or clients, which could have a material adverse impact on our reputation, business, financial condition and results of operations.
Some of our customers, suppliers and subcontractors depend on access to commercial financing and capital markets to fund their operations. Disruptions of the credit or capital markets could adversely affect our clients’ ability to finance projects and could result in contract cancellations or suspensions, project delays and payment delays or defaults by our clients. In addition, clients may be unable to fund new projects, may choose to make fewer capital expenditures or otherwise slow their spending on our services or to seek contract terms more favorable to them. Our government clients may face budget deficits that prohibit them from funding proposed and existing projects or that cause them to exercise their right to terminate our contracts with little or no prior notice. In addition, any financial difficulties suffered by our subcontractors or suppliers could increase our cost or adversely impact project schedules. These disruptions could materially impact our backlog and have a material adverse impact on our business, financial condition and results of operations.
In addition, we typically bill our clients for our services in arrears and are, therefore, subject to our clients delaying or failing to pay our invoices after we have already committed resources to their projects. In weak economic environments, we may experience increased delays and failures due to, among other reasons, our clients’ unwillingness to pay for alleged poor performance or to preserve their own working capital. If one or more clients delays in paying or fails to pay us a significant amount of our outstanding receivables, it could have a material adverse impact on our liquidity, financial condition and results of operations.
Furthermore, our cash balances and short-term investments are maintained in accounts held by major banks and financial institutions located primarily in North America, Europe, South America, Australia and Asia. Some of our accounts hold deposits in amounts that exceed available insurance. Although none of the financial institutions in which we hold our cash and investments have gone into bankruptcy or forced receivership, or have been seized by their governments, there is a risk that such events may occur in the future. If any such events were to occur, we would be at risk of not being able to access our cash, which may result in a temporary liquidity crisis that could impede our ability to fund our operations, which could have a material adverse impact on our business, financial condition and results of operations.
Maintaining adequate bonding and letter of credit capacity is necessary for us to successfully bid on and win some contracts.
In line with industry practice, we are often required to provide performance or payment bonds or letters of credit to our customers. These instruments indemnify the customer should we fail to perform our obligations under the contract. If a bond or a letter of credit is required for a particular project and we are unable to obtain an appropriate bond or letter of credit, we cannot pursue that project. Historically, we have had adequate bonding and letter of credit capacity but, as is typically the case, the issuance of a bond is at the surety’s sole discretion and the issuance of a letter of credit is based on the Company's credit-worthiness. Because of an overall lack of worldwide bonding capacity, we may find it difficult to find sureties who will provide required levels of bonding or such bonding may only be available at significant additional cost. There can be no assurance that our bonding capacity will continue to be available to us on reasonable terms. In addition, future projects may require us to obtain letters of credit that extend beyond the term of our existing credit facilities. Our inability to obtain adequate bonding and, as a result, to bid on new contracts that require such bonding or letter of credit could have a material adverse impact on our business, financial condition and results of operations.
Risks Related to Our Common Stock
Our quarterly results may fluctuate significantly, which could have a material negative effect on the price of our common stock.
Our quarterly operating results may fluctuate significantly or fall below the expectations of securities analysts, which could have a material adverse impact on the price of our common stock. Fluctuations are caused by a number of factors, including:
•Legal proceedings, disputes and/or government investigations;
•Fluctuations in the spending patterns of our government and commercial customers;
•The number and significance of projects executed during a quarter;
•Unanticipated changes in contract performance, particularly with contracts that have funding limits;
•The timing of resolving change orders, requests for equitable adjustments, and other contract adjustments;
•Delays incurred in connection with a project;
•Changes in prices of commodities or other supplies;
•Changes in foreign currency exchange rates;
•Weather conditions that delay work at project sites;
•The timing of expenses incurred in connection with acquisitions or other corporate initiatives;
•The decision by the Board of Directors to begin or cease paying a dividend, and the expectation that if the Company pays dividends, it would declare dividends at the same or higher levels in the future;
•Natural disasters or other crises;
•Staff levels and utilization rates;
•Changes in prices of services offered by our competitors; and
•General economic and political conditions.
There can be no assurance that we will pay dividends on our common stock.
Our Board of Directors initiated a quarterly cash dividend program in fiscal 2017 under which we have paid, and intend to continue paying, regular quarterly dividends. The declaration, amount and timing of such dividends are subject to capital availability and determinations by our Board of Directors that cash dividends are in the best interest of our stockholders and are in compliance with all respective laws and applicable agreements. Our ability to pay dividends will depend upon, among other factors, our cash balances and potential future capital requirements for strategic transactions, including acquisitions, debt service requirements, results of operations, financial condition and other factors that our Board of Directors may deem relevant. A reduction in or elimination of our dividend payments and/or our dividend program could have a material negative effect on our stock price.
In the event we issue stock as consideration for certain acquisitions we may make, we could dilute share ownership, and if we receive stock in connection with a divestiture, the value of stock is subject to fluctuation.
One method of acquiring companies or otherwise funding our corporate activities is through the issuance of additional equity securities. If we issue additional equity securities, such issuances could have the effect of diluting our earnings per share as well as our existing shareholders’ individual ownership percentages in the Company.
In addition, if we receive stock or other equity securities in connection with a sale or divestiture of a business, the value of such stock will fluctuate and/or be subject to trading restrictions. Stock price changes may result from, among other things, changes in the business, operations or prospects of the issuer prior to or following the transaction, litigation or regulatory considerations, general business, market, industry or economic conditions, the ability to sell all or a portion of the stock based on current market conditions, and other factors both within and beyond the control of the Company. In addition, if the stock received is valued in a currency other than U.S. dollars, the value of such stock will also fluctuate based on foreign currency rates. For example, in connection with the ECR sale, the Company still holds 51.3 million ordinary shares of Worley received as a portion of the purchase price. The value of such shares will fluctuate based on the trading price of the Worley shares on the Australian Securities Exchange and the exchange rate of the Australian dollar.
Delaware law and our charter documents may impede or discourage a takeover or change of control.
We are a Delaware corporation. Certain anti-takeover provisions of the Delaware general corporation law impose restrictions on the ability of others to acquire control of us. In addition, certain provisions of our charter documents may impede or discourage a takeover. For example:
•Only our Board of Directors can fill vacancies on the board;
•There are various restrictions on the ability of a shareholder to nominate a director for election; and
•Our Board of Directors can authorize the issuance of preferred shares.
These types of provisions, as well as our ability to adopt a shareholder rights agreement in the future, could make it more difficult for a third party to acquire control of us, even if the acquisition would be beneficial to our shareholders. Accordingly, shareholders may be limited in the ability to obtain a premium for their shares.
Item 1B. UNRESOLVED STAFF COMMENTS
None.
Item 2. PROPERTIES
Our properties consist primarily of office space within general, commercial office buildings located in major cities primarily in the following countries: United States; Azerbaijan; Australia; Canada; China; Czech Republic; Egypt; France; Germany; Hong Kong; India; Indonesia; Iraq; Ireland; Italy; Kazakhstan; Malaysia; The Netherlands; New Zealand; The Philippines; Poland; Qatar; Romania; Saudi Arabia; Singapore; Slovakia; South Africa; South Korea; Sweden; Taiwan (Province of China); Thailand; United Arab Emirates and United Kingdom. We also lease smaller offices located in certain other countries. Such space is used for operations (providing technical, professional, and other home office services), sales and administration. The total amount of space leased by us for all of our operations is approximately 7.7 million square feet. We continue to evaluate our real estate needs in connection with changes in the Company's use of its leased space as a result of the COVID-19 pandemic, and as part of the integration of our prior acquisitions.
Item 3. LEGAL PROCEEDINGS
The information required by this Item 3 is included in Note 18 — Contractual Guarantees, Litigation, Investigations and Insurance of Notes to Consolidated Financial Statements beginning on page F-1 of this Annual Report on Form 10-K and is incorporated herein by reference.
Item 4. MINE SAFETY DISCLOSURE
None.
PART II
Item 5. MARKET FOR REGISTRANT'S COMMON EQUITY, RELATED STOCKHOLDER MATTERS AND ISSUER PURCHASES OF EQUITY SECURITIES
Market Information
Our common stock is listed on the New York Stock Exchange under the ticker symbol "J".
Shareholders
According to the records of our transfer agent, there were 3,182 shareholders of record as of November 12, 2020.
Dividend Policy
Our Board of Directors initiated a quarterly cash dividend program in fiscal 2017 under which we have paid, and intend to continue paying, regular quarterly dividends. The declaration, amount and timing of such dividends are subject to capital availability and determinations by our Board of Directors that cash dividends are in the best interest of our stockholders and are in compliance with all respective laws and applicable agreements. Our ability to pay dividends will depend upon, among other factors, our cash balances and potential future capital requirements for strategic transactions, including acquisitions, debt service requirements, results of operations, financial condition and other factors that our Board of Directors may deem relevant.
Share Repurchases
On January 17, 2019, the Company’s Board of Directors authorized a share repurchase program of up to $1.0 billion of the Company’s common stock, to expire on January 16, 2022 (the "2019 Repurchase Authorization"). During fiscal 2019, the Company launched accelerated share repurchase programs by advancing a total of $500 million to two financial institutions in privately negotiated transactions (collectively, the "2019 ASR Programs"). The specific number of shares that the Company repurchased under the 2019 ASR Programs was determined based generally on a discount to the volume-weighted average price per share of the Company's common stock during a calculation period which ended on June 5, 2019 for the first $250 million in repurchases and on December 4, 2019 for the second $250 million in repurchases. The purchases were recorded as share retirements for purposes of calculating earnings per share.
The following table summarizes the activity under the 2019 Repurchase Authorization during fiscal 2020:
| | | | | | | | | | | | | | | | | | | | |
Amount Authorized
(2019 Repurchase Authorization) | | Average Price Per Share (1) | | Shares Repurchased | | Total Shares Retired |
| $1,000,000,000 | | $81.68 | | 4,129,003 | | 4,129,003 |
(1)Includes commissions paid and calculated at the average price per share
As a precautionary measure in light of the COVID-19 pandemic, the Company temporarily suspended purchases under the share repurchase plan in March 2020, with such suspension remaining in effect through the fiscal third quarter of 2020. During the fourth fiscal quarter of 2020, the Company resumed share repurchases on a limited basis. As of October 2, 2020, the Company has $57.9 million remaining under the 2019 Repurchase Authorization.
On January 16, 2020, the Company’s Board of Directors authorized an additional share repurchase program of up to $1.0 billion of the Company’s common stock, to expire on January 15, 2023 (the "2020 Repurchase Authorization"). There have been no repurchases under the 2020 Repurchase Authorization as of October 2, 2020.
The share repurchase programs do not obligate the Company to purchase any shares. Share repurchases may be executed through various means including, without limitation, accelerated share repurchases, open market transactions, privately negotiated transactions, purchases pursuant to a Rule 10b5-1 plan or otherwise. The authorization for the share repurchase programs may be terminated, increased or decreased by the Company’s Board of Directors in its discretion at any time. The timing, amount and manner of share repurchases may depend upon market conditions and economic circumstances, availability of investment opportunities, the availability and costs of financing, currency fluctuations, the market price of the Company's common stock, other uses of capital and other factors.
Unregistered Sales of Equity Securities.
None.
Performance Graph
The following graph and table shows the changes over the five-year period ended October 2, 2020 in the value of $100 as of the close of market on October 2, 2015 in (1) the common stock of Jacobs Engineering Group Inc., (2) the Standard & Poor’s 500 Stock Index and (3) the Standard & Poor's 1500 IT Consulting & Other Services Index.
The values of each investment are based on share price appreciation, with reinvestment of all dividends, provided any were paid. The investments are assumed to have occurred at the beginning of the period presented. The stock performance included in this graph is not necessarily indicative of future stock price performance.
| | | | | | | | | | | | | | | | | | | | | | | | | | | | | | | | | | | |
| | 2015 | | 2016 | | 2017 | | 2018 | | 2019 | | 2020 |
| Jacobs Engineering Group Inc. | 100.00 | | | 138.18 | | | 156.97 | | | 208.45 | | | 251.00 | | | 256.72 | |
| S&P 500 | 100.00 | | | 115.43 | | | 136.91 | | | 161.43 | | | 168.30 | | | 193.80 | |
| S&P 1500 IT Consulting & Other Services | 100.00 | | | 114.30 | | | 125.05 | | | 146.93 | | | 142.84 | | | 146.88 | |
Item 6. SELECTED FINANCIAL DATA
The following table presents selected financial data for each of the last five fiscal years. This selected financial data should be read in conjunction with the Consolidated Financial Statements and related notes beginning on page F-1 of this Annual Report on Form 10-K. On April 26, 2019, Jacobs completed the sale of its ECR business to Worley. As a result of the ECR sale, substantially all ECR-related assets and liabilities were sold (the "Disposal Group"). We determined that the Disposal Group should be reported as discontinued operations in accordance with ASC 210-05, Discontinued Operations because their disposal represented a strategic shift that had a major effect on our operations and financial results. As such, the financial results of the ECR business are reflected in our Consolidated Statements of Earnings as discontinued operations for all periods presented. Additionally, current and non-current assets and liabilities of the Disposal Group are reflected as held-for-sale in the Consolidated Balance Sheet as of September 28, 2018. Further, for the year ended September 27, 2019, a portion of the ECR business remained held by Jacobs and was classified as held for sale as of fiscal year 2019 in accordance with U.S. GAAP. For further discussion see Note 15- Sale of Energy, Chemicals and Resources ("ECR") Business to the consolidated financial statements. Dollar amounts are presented in thousands, except for per share information:
| | | | | | | | | | | | | | | | | | | | | | | | | | | | | |
| | 2020 (a) | | 2019 (b) | | 2018 (c) | | 2017 (d) | | 2016 (e) |
| Results of Operations: | | | | | | | | | |
| Revenues | $ | 13,566,975 | | $ | 12,737,868 | | $ | 10,579,773 | | $ | 6,330,126 | | $ | 6,257,478 |
| Net Earnings (Loss) Attributable to Jacobs from Continuing Operations | $ | 353,861 | | $ | 290,960 | | $ | (4,185) | | $ | 170,167 | | $ | 159,998 |
| Financial Position: | | | | | | | | | |
| Current ratio | 1.54 to 1 | | 1.34 to 1 | | 1.45 to 1 | | 1.56 to 1 | | 1.61 to 1 |
| Working capital | $ | 1,598,002 | | $ | 1,038,062 | | $ | 1,410,891 | | $ | 1,069,953 | | $ | 1,081,784 |
| Current assets | $ | 4,539,599 | | $ | 4,111,768 | | $ | 4,556,584 | | $ | 2,996,180 | | $ | 2,864,470 |
| Total assets | $ | 12,354,353 | | $ | 11,462,711 | | $ | 12,645,795 | | $ | 7,380,859 | | $ | 7,360,022 |
| Cash | $ | 862,424 | | $ | 631,068 | | $ | 634,870 | | $ | 607,821 | | $ | 507,169 |
| Long-term debt | $ | 1,676,941 | | $ | 1,201,245 | | $ | 2,144,167 | | $ | 235,000 | | $ | 385,330 |
| Total Jacobs stockholders’ equity | $ | 5,815,712 | | $ | 5,714,691 | | $ | 5,854,345 | | $ | 4,428,352 | | $ | 4,265,276 |
| Return on average equity | 6.14% | | 5.03% | | (0.08)% | | 3.91% | | 3.74% |
| Backlog: | $ | 23,818 | | $ | 22,569 | | $ | 19,955 | | $ | 13,147 | | $ | 11,535 |
| Per Share Information: | | | | | | | | | |
| Basic Net Earnings (Loss) from Continuing Operations Per Share | $ | 2.69 | | $ | 2.11 | | $ | (0.03) | | $ | 1.41 | | $ | 1.33 |
| Diluted Net Earnings (Loss) from Continuing Operations Per Share | $ | 2.67 | | $ | 2.09 | | $ | (0.03) | | $ | 1.40 | | $ | 1.32 |
| Stockholders’ equity | $ | 43.82 | | $ | 41.05 | | $ | 42.21 | | $ | 36.78 | | $ | 35.26 |
| Average Number of Shares of Common Stock and Common Stock Equivalents Outstanding (Diluted) | 132,721 | | 139,206 | | 137,536 | | 120,147 | | 121,483 |
| Common Shares Outstanding At Year End | 129,748 | | 132,879 | | 142,218 | | 120,386 | | 120,951 |
| Cash Dividends Declared Per Common Share | $ | 0.76 | | $ | 0.68 | | $ | 0.60 | | $ | 0.60 | | $ | — |
(a)Includes after-tax costs of $248.2 million, or $1.87 per diluted share from continuing operations, related to the Company's restructuring, transactions, and other initiatives during fiscal 2020. Also includes amortization of intangible assets of $68.3 million, or $0.51 per diluted share from continuing operations, and $56.9 million, or $0.43 per diluted share from continuing operations in fair value adjustments partly offset by dividend income related to our investment in Worley stock and certain foreign currency revaluations relating to ECR sale proceeds
(b)Includes after-tax costs of $259.8 million, or $1.87 per diluted share from continuing operations, related to the Company's restructuring, transactions, and other initiatives during fiscal 2019. Also includes amortization of intangible assets of $59.0 million, or $0.42 per diluted share from continuing operations, and $48.1 million, or $0.34 per diluted share from continuing operations in fair value adjustments partly offset by dividend income related to our investment in Worley stock and certain foreign currency revaluations relating to ECR sale proceeds
(c)Includes after-tax costs of $112.8 million, or $0.81 per diluted share from continuing operations, related to the Company's restructuring and other initiatives during fiscal 2018. Also included in fiscal 2018 are after-tax charges of $60.7 million, or $0.44 per diluted share, in professional fees and related costs associated with the CH2M acquisition and pending ECR sale, $259.2 million, or $1.86 per diluted share from continuing operations, in charges related to tax reform and amortization of intangible assets of $51.5 million, or $0.37 per diluted share from continuing operations
(d)Includes after-tax costs of $65.0 million, or $0.54 per diluted share from continuing operations, related to the Company's restructuring and other initiatives during fiscal 2017. Also included in the fourth quarter of fiscal 2017 are after-tax charges of $10.6 million, or $0.09 per diluted share from continuing operations, respectively, in professional fees and related costs associated with the CH2M acquisition. Also includes amortization of intangible assets of $33.5 million, or $0.28 per diluted share from continuing operations
(e)Includes after-tax costs of $75.2 million, or $0.62 per diluted share from continuing operations, related to the Company's restructuring initiatives during fiscal 2016. Also included in the fourth quarter of fiscal 2016 are (i) a loss on sale of our French subsidiary of $17.1 million or $0.14 per diluted share from continuing operations; and (ii) a non-cash write-off on an equity investment of $10.4 million or $0.09 per diluted share from continuing operations. Also includes amortization of intangible assets of $47.6 million, or $0.28 per diluted share from continuing operations.
Item 7. MANAGEMENT'S DISCUSSION AND ANALYSIS OF FINANCIAL CONDITION AND RESULTS OF OPERATIONS
Critical Accounting Policies and Estimates
In order to better understand the changes that occur to key elements of our financial condition, results of operations and cash flows, a reader of this Management’s Discussion and Analysis of Financial Condition and Results of Operations (“MD&A”) should be aware of the critical accounting policies we apply in preparing our consolidated financial statements.
The consolidated financial statements contained in this report were prepared in accordance with U.S. GAAP. The preparation of our consolidated financial statements and the financial statements of any business performing long-term professional services, engineering and construction-type contracts requires management to make certain estimates and judgments that affect both the entity’s results of operations and the carrying values of its assets and liabilities. Although our significant accounting policies are described in Note 2- Significant Accounting Policies of Notes to Consolidated Financial Statements beginning on page F-1 of this Annual Report on Form 10-K, the following discussion is intended to highlight and describe those accounting policies that are especially critical to the preparation of our consolidated financial statements.
Revenue Accounting for Contracts
Engineering, Procurement & Construction Contracts and Service Contracts
On September 29, 2018, the Company adopted ASC Topic 606, Revenue from Contracts with Customers, including the subsequent ASUs that amended and clarified the related guidance. The Company recognizes engineering, procurement, and construction contract revenue over time, as performance obligations are satisfied, due to the continuous transfer of control to the customer. Upon adoption of ASC Topic 606, contracts which include engineering, procurement and construction services are generally accounted for as a single deliverable (a single performance obligation) and are no longer segmented between types of services. In some instances, the Company’s services associated with a construction activity are limited only to specific tasks such as customer support, consulting or supervisory services. In these instances, the services are typically identified as separate performance obligations.
The Company recognizes revenue using the percentage-of-completion method, based primarily on contract costs incurred to date compared to total estimated contract costs. Estimated contract costs include the Company’s latest estimates using judgments with respect to labor hours and costs, materials, and subcontractor costs. The percentage-of-completion method (an input method) is the most representative depiction of the Company’s performance because it directly measures the value of the services transferred to the customer. Subcontractor materials, labor and equipment and, in certain cases, customer-furnished materials and labor and equipment are included in revenue and cost of revenue when management believes that the company is acting as a principal rather than as an agent (e.g., the company integrates the materials, labor and equipment into the deliverables promised to the customer or is otherwise primarily responsible for fulfillment and acceptability of the materials, labor and/or equipment). The Company recognizes revenue, but not profit, on certain uninstalled materials that are not specifically produced, fabricated, or constructed for a project. Revenue on these uninstalled materials is recognized when control is transferred. Changes to total estimated contract cost or losses, if any, are recognized in the period in which they are determined as assessed at the contract level. Pre-contract costs are expensed as incurred unless they are expected to be recovered from the client. Project mobilization costs are generally charged to project costs as incurred when they are an integrated part of the performance obligation being transferred to the client. Under the typical payment terms of our engineering, procurement and construction contracts, amounts are billed as work progresses in accordance with agreed-upon contractual terms at periodic intervals (e.g., biweekly or monthly) and customer payments on are typically due within 30 to 60 days of billing, depending on the contract.
For service contracts, the Company recognizes revenue over time using the cost-to-cost percentage-of-completion method. Service contracts that include multiple performance obligations are segmented between types of services. For contracts with multiple performance obligations, the Company allocates the transaction price to each performance obligation using an estimate of the stand-alone selling price of each distinct service in the contract. In some instances where the Company is standing ready to provide services, the Company recognizes revenue ratably over the service period. Under the typical payment terms of our service contracts, amounts are billed as work progresses in accordance with agreed-upon contractual terms, and customer payments are typically due within 30 to 60 days of billing, depending on the contract.
Direct costs of contracts include all costs incurred in connection with and directly for the benefit of client contracts, including depreciation and amortization relating to assets used in providing the services required by the related projects. The level of direct costs of contracts may fluctuate between reporting periods due to a variety of factors, including the amount of pass-through costs we incur during a period. On those projects where we are acting as principal for subcontract labor or third-party materials and equipment, we reflect the amounts of such items in both revenues and costs (and we refer to such costs as “pass-through costs”).
Variable Consideration
The nature of the Company’s contracts gives rise to several types of variable consideration, including claims and unpriced change orders; awards and incentive fees; and liquidated damages and penalties. The Company recognizes revenue for variable consideration when it is probable that a significant reversal in the amount of cumulative revenue recognized will not occur. The Company estimates the amount of revenue to be recognized on variable consideration using the expected value (i.e., the sum of a probability-weighted amount) or the most likely amount method, whichever is expected to better predict the amount. Factors considered in determining whether revenue associated with claims (including change orders in dispute and unapproved change orders in regard to both scope and price) should be recognized include the following: (a) the contract or other evidence provides a legal basis for the claim, (b) additional costs were caused by circumstances that were unforeseen at the contract date and not the result of deficiencies in the company’s performance, (c) claim-related costs are identifiable and considered reasonable in view of the work performed, and (d) evidence supporting the claim is objective and verifiable. If the requirements for recognizing revenue for claims or unapproved change orders are met, revenue is recorded only when the costs associated with the claims or unapproved change orders have been incurred and only up to the amount of cost incurred. Back charges to suppliers or subcontractors are recognized as a reduction of cost when it is determined that recovery of such cost is probable and the amounts can be reliably estimated. Disputed back charges are recognized when the same requirements described above for claims accounting have been satisfied.
The Company generally provides limited warranties for work performed under its engineering and construction contracts. The warranty periods typically extend for a limited duration following substantial completion of the Company’s work on the project. Historically, warranty claims have not resulted in material costs incurred for which the Company was not compensated for by the customer.
Practical Expedient
If the Company has a right to consideration from a customer in an amount that corresponds directly with the value of the Company’s performance completed to date (a service contract in which the company bills a fixed amount for each hour of service provided), the Company recognizes revenue in the amount to which it has a right to invoice for services performed.
The Company does not adjust the contract price for the effects of a significant financing component if the Company expects, at contract inception, that the period between when the Company transfers a service to a customer and when the customer pays for that service will be one year or less.
Joint Ventures and VIEs
As is common to the industry, we execute certain contracts jointly with third parties through various forms of joint ventures. Although the joint ventures own and hold the contracts with the clients, the services required by the contracts are typically performed by us and our joint venture partners, or by other subcontractors under subcontracting agreements with the joint ventures. Many of these joint ventures are formed for a specific project. The assets of our joint ventures generally consist almost entirely of cash and receivables (representing amounts due from clients), and the liabilities of our joint ventures generally consist almost entirely of amounts due to the joint venture partners (for services provided by the partners to the joint ventures under their individual subcontracts) and other subcontractors. In general, at any given time, the equity of our joint ventures represents the undistributed profits earned on contracts the joint ventures hold with clients. Very few of our joint ventures have employees or third-party debt or credit facilities. The debt held by the joint ventures is non-recourse to the general credit of Jacobs.
The assets of a joint venture are restricted for use to the obligations of the particular joint venture and are not available for general operations of the Company. Our risk of loss on these arrangements is usually shared with our partners. The liability of each partner is usually joint and several, which means that each partner may become liable for the entire risk of loss on the project. Furthermore, on some of our projects, the Company has granted guarantees which may encumber both our contracting subsidiary company and the Company for the entire risk of loss on the project. The Company is unable to estimate the maximum potential amount of future payments that we could be required to make under outstanding performance guarantees related to joint venture projects due to a number of factors, including but not limited to, the nature and extent of any contractual defaults by our joint venture partners, resource availability, potential performance delays caused by the defaults, the location of the projects, and the terms of the related contracts. See Note 18- Contractual Guarantees, Litigation, Investigations and Insurance for further discussion.
Our unconsolidated joint ventures (including equity method investments) are reviewed for impairment whenever events or changes in circumstances indicate that the carrying amount of the investment might not be recoverable, and impairment losses are recognized for such investments if there is a decline in fair value below carrying value that is considered to be other-than-temporary.
Many of the joint ventures are deemed to be variable interest entities (“VIE”) because they lack sufficient equity to finance the activities of the joint venture. The Company uses a qualitative approach to determine if the Company is the primary beneficiary of the VIE, which considers factors that indicate a party has the power to direct the activities that most significantly impact the joint venture’s economic performance. These factors include the composition of the governing board, how board decisions are approved, the powers granted to the operational manager(s) and partner that holds that position(s), and to a certain extent, the partner’s economic interest in the joint venture. The Company analyzes each joint venture initially to determine if it should be consolidated or unconsolidated.
•Consolidated if the Company is the primary beneficiary of a VIE, or holds the majority of voting interests of a non-VIE (and no significant participative rights are available to the other partners).
•Unconsolidated if the Company is not the primary beneficiary of a VIE, or does not hold the majority of voting interest of a non-VIE.
Share-Based Payments
We measure the value of services received from employees and directors in exchange for an award of an equity instrument based on the grant-date fair value of the award. The computed value is recognized as a non-cash cost on a straight-line basis over the period the individual provides services, which is typically the vesting period of the award with the exception of the value of awards containing an internal performance measure, such as EPS growth and ROIC, which is recognized on a straight-line basis over the vesting period subject to the probability of meeting the performance requirements and adjusted for the number of shares expected to be earned.
Accounting for Pension Plans
The accounting for pension plans requires the use of assumptions and estimates in order to calculate periodic pension cost and the value of the plans’ assets and liabilities. These assumptions include discount rates, investment returns and projected salary increases, among others. The actuarial assumptions used in determining the funded statuses of the plans are provided in Note 13 - Pension and Other Postretirement Benefit Plans of Notes to Consolidated Financial Statements beginning on page F-1 of this Annual Report on Form 10-K.
The expected rates of return on plan assets range from 2.3% to 7.5% for fiscal 2020 and 1.8% to 7% fiscal 2021. We believe the range of rates selected for fiscal 2020 reflects the long-term returns expected on the plans’ assets, considering recent market conditions, projected rates of inflation, the diversification of the plans’ assets, and the expected real rates of market returns. The discount rates used to compute plan liabilities decreased year over year with a range of 1.3% to 8.1% in fiscal 2019 and a range of 0.2% to 7.1% 2020. These assumptions represent the Company’s best estimate of the rates at which its pension obligations could be effectively settled.
Changes in the actuarial assumptions often have a material effect on the values assigned to plan assets and liabilities, and the associated pension expense. For example, if the discount rate used to value the net pension benefit obligation (“PBO”) at October 2, 2020 was higher by 0.5%, the PBO would have been lower at that date by approximately $212.4 million for non-U.S. plans, and by approximately $19.8 million for U.S. plans. If the expected return on plan assets was higher by 1.0%, the net periodic pension cost for fiscal 2020 would be lower by approximately $20.3 million for non-U.S. plans, and by approximately $3.4 million for U.S. plans. Differences between actuarial assumptions and actual performance (i.e., actuarial gains and losses) that are not recognized as a component of net periodic pension cost in the period in which such differences arise are recorded to accumulated other comprehensive income (loss) and are recognized as part of net periodic pension cost in future periods in accordance with U.S. GAAP. Management monitors trends in the marketplace within which our pension plans operate in an effort to assure the fairness of the actuarial assumptions used.
Contractual Guarantees, Litigation, Investigations, and Insurance
In the normal course of business, we make contractual commitments, some of which are supported by separate guarantees; and on occasion we are a party in a litigation or arbitration proceeding. The litigation in which we are involved primarily includes personal injury claims, professional liability claims, and breach of contract claims. Where we provide a separate guarantee, it is strictly in support of the underlying contractual commitment. Guarantees take various forms including surety bonds required by law, or standby letters of credit ("LOC") (also referred to as “bank guarantees”) or corporate guarantees given to induce a party to enter into a contract with a subsidiary. Standby LOCs are also used as security for advance payments or in various other transactions. The guarantees have various expiration dates ranging from an arbitrary date to completion of our work (e.g., engineering only) to completion of the overall project. We record in the Consolidated Balance Sheets amounts representing our estimated liability relating to such guarantees, litigation and insurance claims. Guarantees are accounted for in accordance with ASC 460-10, Guarantees, at fair value at the inception of the guarantee.
We maintain insurance coverage for most insurable aspects of our business and operations. Our insurance programs have varying coverage limits depending upon the type of insurance, and include certain conditions and exclusions which insurance companies may raise in response to any claim that the Company brings. We have also elected to retain a portion of losses and liabilities that occur through the use of various deductibles, limits, and retentions under our insurance programs. As a result, we may be subject to a future liability for which we are only partially insured or completely uninsured. We intend to mitigate any such future liability by continuing to exercise prudent business judgment in negotiating the terms and conditions of the contracts which the Company enters with its clients. Our insurers are also subject to business risk and, as a result, one or more of them may be unable to fulfill their insurance obligations due to insolvency or otherwise.
Additionally, as a contractor providing services to the U.S. federal government we are subject to many types of audits, investigations, and claims by, or on behalf of, the government including with respect to contract performance, pricing, cost allocations, procurement practices, labor practices, and socioeconomic obligations. Furthermore, our income, franchise, and similar tax returns and filings are also subject to audit and investigation by the Internal Revenue Service, most states within the United States, as well as by various government agencies representing jurisdictions outside the United States.
Our Consolidated Balance Sheets include amounts representing our probable estimated liability relating to such claims, guarantees, litigation, audits, and investigations. Our estimates of probable liabilities require us to make assumptions related to potential losses regarding our determination of amounts considered probable and estimable. We perform an analysis to determine the level of reserves to establish for insurance-related claims that are known and have been asserted against us, as well as for insurance-related claims that are believed to have been incurred based on actuarial analysis, but have not yet been reported to our claims administrators as of the respective balance sheet dates. We include any adjustments to such insurance reserves in our consolidated results of operations. Insurance recoveries are recorded as assets if recovery is probable and estimated liabilities are not reduced by expected insurance recoveries.
The Company believes, after consultation with counsel, that such guarantees, litigation, U.S. government contract-related audits, investigations and claims, and income tax audits and investigations should not have a material adverse effect on our consolidated financial statements, beyond amounts currently accrued.
Testing Goodwill for Possible Impairment
The goodwill carried on our Consolidated Balance Sheets is tested annually for possible impairment, and on an interim basis if indicators of possible impairment exist. For purposes of impairment testing, goodwill is assigned to the applicable reporting units based on the current reporting structure. In performing the annual impairment test, we evaluate our goodwill at the reporting unit level. The Company performs the annual goodwill impairment test for the reporting units at the beginning of the fourth quarter of its fiscal year.
U.S. GAAP does not prescribe a specific valuation method for estimating the fair value of reporting units. Any valuation technique used to estimate the fair value of a reporting unit requires the use of significant estimates and assumptions, including revenue growth rates, operating margins, discount rates and future market conditions, among others.
We used income and market approaches to test our goodwill for possible impairment which requires us to make estimates and judgments. Under the income approach, fair value is determined by using the discounted cash flows of our reporting units. The Company’s discount rate reflects a weighted average cost of capital (“WACC”) for a peer group of companies representative of the Company’s respective reporting units. Under the market approach, the fair values of our reporting units are determined by reference to guideline companies that are reasonably comparable to our reporting units; the fair values are estimated based on the valuation multiples of the invested capital associated with the guideline companies. In assessing whether there is an indication that the carrying value of goodwill has been impaired, we utilize the results of both valuation techniques and consider the range of fair values indicated.
It is possible that changes in market conditions, economy, facts and circumstances, judgments and assumptions used in estimating the fair value could change, resulting in possible impairment of goodwill in the future. The fair values resulting from the valuation techniques used are not necessarily representative of the values we might obtain in a sale of the reporting units to willing third parties.
We have determined that the fair value of our reporting units substantially exceeded their respective carrying values for the Consolidated Balance Sheets presented.
Impairment of Long-Lived Assets
Our long-lived assets other than goodwill principally consist of right-of-use lease assets, property, equipment and improvements, and finite-lived intangible assets. These long-lived assets are evaluated for impairment for each of our asset groups in accordance with ASC 360 by first identifying whether indicators of impairment exist. If such indicators are present, we assess long-lived asset groups for recoverability based on estimated future undiscounted cash flows. For asset groups where the recoverability test fails, the fair value of each asset group is then estimated and compared to its carrying amount. An impairment loss is recognized for the amount by which an asset group’s carrying value exceeds its fair value.
JACOBS ENGINEERING GROUP INC. AND SUBSIDIARIES
CONSOLIDATED STATEMENTS OF EARNINGS
For the Fiscal Years Ended October 2, 2020, September 27, 2019 and September 28, 2018
(In thousands, except per share information)
| | | | | | | | | | | | | | | | | |
| October 2, 2020 | | September 27, 2019 | | September 28, 2018 |
| Revenues | $ | 13,566,975 | | | $ | 12,737,868 | | | $ | 10,579,773 | |
| Direct cost of contracts | (10,980,307) | | | (10,260,840) | | | (8,421,223) | |
| Gross profit | 2,586,668 | | | 2,477,028 | | | 2,158,550 | |
| Selling, general and administrative expenses | (2,050,695) | | | (2,072,177) | | | (1,771,107) | |
| Operating Profit | 535,973 | | | 404,851 | | | 387,443 | |
| Other Income (Expense): | | | | | |
| Interest income | 4,729 | | | 9,487 | | | 8,984 | |
| Interest expense | (62,206) | | | (83,847) | | | (76,760) | |
| Miscellaneous (expense) income, net | (37,293) | | | 20,468 | | | 11,314 | |
| Total other expense, net | (94,770) | | | (53,892) | | | (56,462) | |
| Earnings from Continuing Operations Before Taxes | 441,203 | | | 350,959 | | | 330,981 | |
| Income Tax Expense for Continuing Operations | (55,320) | | | (36,954) | | | (325,632) | |
| Net Earnings of the Group from Continuing Operations | 385,883 | | | 314,005 | | | 5,349 | |
| Net Earnings of the Group from Discontinued Operations | 137,984 | | | 559,214 | | | 167,793 | |
| Net Earnings of the Group | 523,867 | | | 873,219 | | | 173,142 | |
| Net Earnings Attributable to Noncontrolling Interests from Continuing Operations | (32,022) | | | (23,045) | | | (9,534) | |
| Net Earnings (Loss) Attributable to Jacobs from Continuing Operations | 353,861 | | | 290,960 | | | (4,185) | |
| Net Earnings Attributable to Noncontrolling Interests from Discontinued Operations | — | | | (2,195) | | | (177) | |
| Net Earnings Attributable to Jacobs from Discontinued Operations | 137,984 | | | 557,019 | | | 167,616 | |
| Net Earnings Attributable to Jacobs | $ | 491,845 | | | $ | 847,979 | | | $ | 163,431 | |
| Net Earnings (Loss) Per Share: | | | | | |
| Basic Net Earnings (Loss) from Continuing Operations Per Share | $ | 2.69 | | | $ | 2.11 | | | $ | (0.03) | |
| Basic Net Earnings from Discontinued Operations Per Share | $ | 1.05 | | | $ | 4.03 | | | $ | 1.21 | |
| Basic Earnings Per Share | $ | 3.74 | | | $ | 6.14 | | | $ | 1.18 | |
| | | | | |
| Diluted Net Earnings (Loss) from Continuing Operations Per Share | $ | 2.67 | | | $ | 2.09 | | | $ | (0.03) | |
| Diluted Net Earnings from Discontinued Operations Per Share | $ | 1.04 | | | $ | 4.00 | | | $ | 1.21 | |
| Diluted Earnings Per Share | $ | 3.71 | | | $ | 6.08 | | | $ | 1.18 | |
2020 Overview
COVID-19 Pandemic. There are many risks and uncertainties regarding the COVID-19 pandemic, including the anticipated duration of the pandemic and the extent of local and worldwide social, political, and economic disruption it may cause. The Company’s operations for the last three quarters of fiscal 2020 were adversely impacted by COVID-19. While certain business units of both Critical Mission Solutions and People & Places Solutions have experienced, and may continue to experience, an increase in demand for certain of their services regarding new projects that may arise in response to the COVID-19 pandemic, it is still expected that COVID-19 is likely to continue to have an adverse impact on each of Critical Missions Solutions and People & Places Solutions in fiscal 2021, although to a lesser degree than what was seen in 2020.
Please refer to Item 1A - Risk Factors, for a discussion of risks and uncertainties related to COVID-19, including the potential impacts on the Company’s business, financial condition and results of operations.
Net earnings attributable to the Company from continuing operations for fiscal 2020 were $353.9 million (or $2.67 per diluted share), an increase of $62.9 million, or 21.6%, from $291.0 million (or $2.09 per diluted share) for the prior year. Included in the Company’s operating results for the current year were $56.9 million (or $0.43 per share) in after tax fair value losses recorded in miscellaneous income (expense), net, associated with our investment in Worley stock (net of Worley stock dividend) and certain foreign currency revaluations relating to the ECR sale and $248.2 million in after-tax Restructuring and other charges and transaction costs associated in part with the Company's fourth quarter fiscal 2020 transformation initiatives relating to real estate and other staffing programs which are discussed in Note 16- Restructuring and Other Charges. Also, fiscal 2020 results were impacted by charges associated with the Company's acquisition of John Wood Groups' nuclear consulting, remediation and program management business along with charges relating to the integration of the KeyW and CH2M acquisitions and the sale of ECR. Our fiscal 2019 results included $259.8 million (or $1.86 per share) in after-tax Restructuring and other charges and transactions costs associated with the Company's KeyW and CH2M acquisitions and the ECR sale. Also included in the fiscal 2019 net earnings from continuing operations are $48.1 million in after-tax fair value losses associated with our investment in Worley stock (net of Worley stock dividend) and certain foreign currency revaluations relating to ECR sale proceeds. Income tax expense for continuing operations for fiscal 2020 was $55.3 million, an increase of $18.4 million, or 49.7%, from $37.0 million in the prior year. Key drivers for this year-over-year increase in the effective tax rate include a reduction in valuation allowance releases in fiscal year 2020, as well as an increase in tax on foreign earnings in the U.S.
Net earnings attributable to Jacobs from discontinued operations for fiscal 2020 were $138.0 million (or $1.04 per diluted share), a decrease of $419.0 million, or 75.2%, from $557.0 million (or $4.00 per diluted share) for the prior year. Included in net earnings attributable to the Company from discontinued operations for the current year was an expense reduction for the settlement of the Nui Phao ("NPMC") legal matter described in Note 17- Commitments and Contingencies and Derivative Financial Instruments that was reimbursed by insurance, the recognition of the deferred gain for the delayed conveyance of the international entities and for the delivery of the ECR IT assets, as discussed in Note 15- Sale of Energy, Chemicals and Resources ("ECR") Business and adjustments for working capital and certain other items in connection with the ECR sale. Additionally, the year-over-year change was also driven by the gain on sale recognized in the fiscal 2019 period and the absence of normal operating results of the ECR business as reported in the prior year. Included in the current year results from discontinued operations is the pre-tax gain on sale of the ECR business of $110.2 million. Included in prior year results from discontinued operations is the pre-tax gain on the sale of the ECR business of $935.1 million, see Note 15- Sale of Energy, Chemicals and Resources ("ECR") Business.
On March 6, 2020, a subsidiary of Jacobs completed the acquisition of the nuclear consulting, remediation and program management business of John Wood Group for an enterprise value of £246 million, or approximately $317.9 million, less cash acquired of $24.3 million. On June 12, 2019, we acquired KeyW, a U.S. based national security solutions provider to the intelligence, cyber, and counterterrorism communities. On December 15, 2017, we acquired CH2M, a provider of international engineering, construction and technical services.
Backlog at October 2, 2020 was $23.8 billion, up $1.2 billion, from $22.6 billion for the prior year. New prospects and new sales remain strong and the Company continues to have a positive outlook for many of the industry groups and sectors in which our clients operate.
Results of Operations
Fiscal 2020 Compared to Fiscal 2019
Revenues for the year ended October 2, 2020 were $13.57 billion, an increase of $829.1 million, or 6.5%, from $12.74 billion for the prior year. The increase in revenues was due primarily to the a full year of revenues in fiscal 2020 from the KeyW acquisition completed in June 2019, impacts from the March 2020 John Wood Group nuclear business acquisition and growth in our legacy People & Places Solutions businesses, offset in part by impacts from the COVID 19 pandemic. Also, our revenues were impacted by an extra week of activity in fiscal 2020, see Note 1- Description of Business and Basis of Presentation in the notes to the consolidated financial statements.
Pass-through costs included in revenues for the year ended October 2, 2020 were $2.61 billion in comparison to $2.54 billion in the prior year. In general, pass-through costs are more significant on projects that have a higher content of field services activities. Pass-through costs are generally incurred at specific points during the life cycle of a project and are highly dependent on the needs of our individual clients and the nature of the clients’ projects. However, because we have hundreds of projects which start at various times within a fiscal year, the effect of pass-through costs on the level of direct costs of contracts can vary between fiscal years without there being a fundamental or significant change to the underlying business.
Gross profit for the year ended October 2, 2020 was $2.59 billion, up $109.6 million, or 4.4%, from $2.48 billion for the prior year. Our gross profit margins were 19.1% and 19.4% for the years ended October 2, 2020 and September 27, 2019, respectively. The increase in our gross profit was attributable to favorable impacts from the KeyW and John Wood Group nuclear business acquisitions, also impacted by the extra week of activity in fiscal 2020. The slight differences in year over year gross margin trends were attributable mainly to legacy portfolio mix and lower overhead rate impacts on revenue, with partial offsets from favorable margin trends from our recent KeyW and John Wood Group nuclear business acquisitions and as well as year over year impacts from lower overhead reimbursement rates resulting from our ongoing cost reduction programs partially offset by COVID-19 cost mitigation efforts.
See Segment Financial Information discussion for further information on the Company’s results of operations at the operating segment level.
Selling, general & administrative expenses for the year ended October 2, 2020 were $2.05 billion, a decrease of $21.5 million, or 1.0%, from $2.07 billion for the prior year. The decrease in SG&A expenses as compared to the prior year was due primarily to less expense relating to the Transition Services Agreement (the "TSA") with Worley, which expired in April 2020, although the parties agreed to extend certain of the services beyond the initial term, and reductions in personnel related and other overhead costs resulting from our ongoing cost reduction programs as well as COVID-19 cost mitigation efforts, partially offset by incremental SG&A expenses from the KeyW and John Wood Group nuclear business acquisitions and the extra week of activity in fiscal 2020. Also, included in the current year results were $325.1 million of restructuring and other charges and transaction costs associated in part with the Company's fourth quarter fiscal 2020 transformation initiatives relating to real estate and other staffing programs, and the Company's acquisition of John Wood Groups' nuclear business. In comparison, the prior year included $350.3 million of restructuring and other charges and transaction costs. Favorable impacts on SG&A expenses from foreign exchange were $3.2 million for the current year.
Net interest expense for the year ended October 2, 2020 was $57.5 million, a decrease of $16.9 million from $74.4 million for the prior year. The decrease in net interest expense year over year is primarily due to the paydown of debt subsequent to the ECR sale in the prior year third quarter.
Miscellaneous income (expense), net for the year ended October 2, 2020 was $(37.3) million, a decrease of $57.8 million as compared to $20.5 million in income for the prior year. The decrease from the prior year was due primarily to $74.5 million in pre-tax unrealized losses associated with changes in the fair value of our investment in Worley stock (net of Worley stock dividend) and certain foreign currency revaluations relating to the ECR sale in the current year, compared to $64.8 million in the prior year. Also included in miscellaneous (expense) income during the current year is $15.8 million in TSA-related income associated with the ECR sale compared to $35.4 million in the prior year, as discussed in Note 15- Sale of Energy, Chemicals and Resources ("ECR") Business. Further, miscellaneous income (expense), net for the year ended September 27, 2019 included a one-time gain on the settlement of the CH2M retiree medical plan of $35.0 million.
Net earnings attributable to Jacobs from discontinued operations for fiscal 2020 were $138.0 million (or $1.04 per diluted share), a decrease of $419.0 million, or 75.2%, from $557.0 million (or $4.00 per diluted share) for the prior year. Included in net earnings attributable to the Company from discontinued operations for the current year was an expense reduction for the settlement of the Nui Phao ("NPMC") legal matter described in Note 17- Commitments and Contingencies and Derivative Financial Instruments that was reimbursed by insurance, the recognition of the deferred gain
for the delayed conveyance of the international entities and for the delivery of the ECR IT assets, as discussed in Note 15- Sale of Energy, Chemicals and Resources ("ECR") Business and adjustments for working capital and certain other items in connection with the ECR sale. Additionally, the year-over-year change was also driven by the gain on sale recognized in the fiscal 2019 period and the absence of normal operating results of the ECR business as reported in the prior year. Included in the current year results from discontinued operations is the pre-tax gain on sale of the ECR business of $110.2 million. Included in prior year results from discontinued operations is the pre-tax gain on the sale of the ECR business of $935.1 million, see Note 15- Sale of Energy, Chemicals and Resources ("ECR") Business.
The Company’s consolidated effective income tax rate of 12.5% is lower than the U.S. statutory rate primarily due to a $16.9 million benefit from foreign valuation allowance releases, $26.5 million of foreign tax generated in the current year, a benefit of $7.3 million from the application of the Internal Revenue Code Section 179D, a reduction in uncertain tax positions of $11.3 million and benefits from tax rate changes and stock compensation. These decreases in tax expense were offset by $43.0 million of U.S. foreign inclusions within U.S. tax costs of foreign operations.
The following table reconciles total income tax expense on continuing operations using the statutory U.S. federal income tax rate to the consolidated income tax expense on continuing operations shown in the accompanying Consolidated Statements of Earnings for the years ended October 2, 2020 and September 27, 2019 (dollars in thousands):
| | | | | | | | | | | | | | | | | | | | | | | |
| | For the Years Ended |
| | October 2, 2020 | | % | | September 27, 2019 | | % |
| Statutory amount | $ | 92,652 | | | 21.0 | % | | $ | 73,701 | | | 21.0 | % |
| State taxes, net of the federal benefit | 7,254 | | 1.6 | % | | 10,183 | | | 2.9 | % |
| Exclusion of tax on non-controlling interests | (6,622) | | (1.5) | % | | (4,839) | | | (1.4) | % |
| Foreign: | | | | | | | |
| Difference in tax rates of foreign operations | (6,267) | | (1.4) | % | | 1,083 | | | 0.3 | % |
| Benefit from foreign valuation allowance release | (16,861) | | (3.8) | % | | (29,125) | | | (8.3) | % |
| | | | | | | |
| U.S. tax cost (benefit) of foreign operations | 42,992 | | | 9.7 | % | | (17,760) | | | (5.1) | % |
| Tax differential on foreign earnings | 19,864 | | | 4.5 | % | | (45,802) | | | (13.1) | % |
| Foreign tax credits | (26,471) | | (6.0) | % | | (15,682) | | | (4.5) | % |
| | | | | | | |
| Tax Rate Change | (6,811) | | | (1.5) | % | | — | | | — | |
| | | | | | | |
| Tax reform | — | | — | % | | 36,674 | | | 10.4 | % |
| Valuation allowance | — | | — | % | | (207) | | | (0.1) | % |
| Uncertain tax positions | (11,338) | | (2.6) | % | | (6,883) | | | (2.0) | % |
| Other items: | | | | | | | |
| IRS §179D deduction | (7,267) | | (1.6) | % | | (2,957) | | | (0.8) | % |
| Disallowed officer compensation | 5,081 | | 1.2 | % | | 5,568 | | | 1.6 | % |
| Stock compensation | (10,234) | | (2.3) | % | | (7,864) | | | (2.2) | % |
| Foreign partnership income/(loss) | — | | | — | % | | — | | | — | % |
| Other items – net | (788) | | (0.2) | % | | (4,938) | | | (1.4) | % |
| Total other items | (13,208) | | (3.0) | % | | (10,191) | | (2.8) | % |
| Taxes on income from continuing operations | $ | 55,320 | | | 12.5 | % | | $ | 36,954 | | | 10.5 | % |
The Company’s consolidated effective income tax rate for the year ended October 2, 2020 increased to 12.5% from 10.5% for fiscal 2019. Key drivers for this year over year increase in the effective tax rate include a reduction in valuation allowance releases in fiscal 2020, as well as an increase in tax on foreign earnings in the U.S.
Fiscal 2019 Compared to Fiscal 2018
Revenues for the year ended September 27, 2019, were $12.74 billion, an increase of $2.16 billion, or 20.4%, from $10.58 billion for the corresponding period in 2018. The increase in revenues was due primarily to the CH2M acquisition in December fiscal 2018 included in fiscal 2019 for the full year, impacts from the KeyW acquisition included in the fiscal 2019 results since closing in mid-June and growth in our legacy CMS and P&PS businesses.
Pass-through costs included in revenues for the year ended September 27, 2019 were $2.54 billion in comparison to $2.25 billion in the prior year. These year-over-year increases are due primarily to impacts from the CH2M acquisition included for the full year of fiscal 2019.
Gross profit for the year ended September 27, 2019 was $2.48 billion, an increase of $318.5 million, or 14.8% from $2.16 billion for the corresponding period in 2018. Our gross profit margins were 19.4% and 20.4% for the years ended September 27, 2019 and September 28, 2018, respectively. Revenue mix primarily drove the lower gross profit and margin for the year over year periods.
Selling, general & administrative expenses for the year ended September 27, 2019 were $2.07 billion, an increase of $0.30 billion, or 17.0%, from $1.77 billion for the corresponding period in 2018. The increase in SG&A expenses is due mainly to incremental SG&A expense from the CH2M and KeyW businesses acquired. Also, included in the 2019 results were $350.3 million of restructuring and other charges and transaction costs, as well as higher personnel related costs year over year due in part to costs to service the TSA with Worley. In comparison, the prior year included $230.5 million of restructuring and other charges and transaction costs.
Net interest expense for the year ended September 27, 2019 was $74.4 million, an increase of $6.6 million from $67.8 million for the corresponding period in 2018. The increase in net interest expense as compared to the corresponding period in 2018 was due primarily to higher levels of debt outstanding and our fixed rate notes having been outstanding for the full year of fiscal 2019 and only five months in fiscal 2018.
Miscellaneous income (expense), net for the year ended September 27, 2019 was $20.5 million, an increase of $9.2 million, as compared to $11.3 million for the corresponding period in 2018. The increase was due primarily to the gain on the settlement of the CH2M retiree medical plan of $35.0 million and income from the TSA with Worley of $35.4 million, offset by $64.8 million, net, relating to ECR related fair value adjustments (unrealized losses) and dividend income related to our investment in Worley stock and certain foreign currency revaluations relating to ECR sale proceeds.
Net earnings of the group from discontinued operations was $559.2 million for the year ended September 27, 2019, an increase of $391.4 million from $167.8 million for the corresponding period in 2018. Included in 2019 was the pre-tax gain on the sale of the ECR business of $935.1 million, offset in part by a charge for the final settlement of the Nui Phao legal matter. The 2018 fiscal year included a $21.0 million loss associated with the disposal of the Company's equity investment in its Guimar joint venture.
The Company’s consolidated effective income tax rate was lower than the U.S. statutory rate of 21.0% primarily due to a $29.1 million benefit from foreign valuation allowance releases in fiscal 2019, $15.7 million of foreign tax and other credits generated in fiscal 2019 and a reduction in the tax contingency reserves of $6.9 million. The decreases in tax expense were offset by a $36.7 million charge from the remeasurement of net deferred tax assets and other miscellaneous U.S. tax reform changes. The following table reconciles total income tax expense on continuing operations using the statutory U.S. federal income tax rate to the consolidated income tax expense on continuing operations shown in the accompanying Consolidated Statements of Earnings for the years ended September 27, 2019 and September 28, 2018 (dollars in thousands):
| | | | | | | | | | | | | | | | | | | | | | | |
| | For the Years Ended |
| | September 27, 2019 | | % | | September 28, 2018 | | % |
| Statutory amount | $ | 73,701 | | | 21.0 | % | | $ | 81,421 | | | 24.6 | % |
| State taxes, net of the federal benefit | 10,183 | | | 2.9 | % | | 15,772 | | | 4.8 | % |
| Exclusion of tax on non-controlling interests | (4,839) | | | (1.4) | % | | (2,389) | | | (0.7) | % |
| Foreign: | | | | | | | |
| Difference in tax rates of foreign operations | 1,083 | | | 0.3 | % | | 2,815 | | | 0.9 | % |
| Benefit from foreign valuation allowance release | (29,125) | | | (8.3) | % | | (5,088) | | | (1.5) | % |
| U.S. tax cost (benefit) of foreign operations | (17,760) | | | (5.1) | % | | 4,030 | | | 1.2 | % |
| Tax differential on foreign earnings | (45,802) | | | (13.1) | % | | 1,757 | | | 0.6 | % |
| Foreign tax credits | (15,682) | | | (4.5) | % | | (21,735) | | | (6.6) | % |
| Tax reform | 36,674 | | | 10.4 | % | | 155,756 | | | 47.1 | % |
| Valuation allowance | (207) | | | (0.1) | % | | 104,221 | | | 31.5 | % |
| Uncertain tax positions | (6,883) | | | (2.0) | % | | (1,402) | | | (0.4) | % |
| Other items: | | | | | | | |
| IRS §179D deduction | (2,957) | | | (0.8) | % | | (4,557) | | | (1.4) | % |
| Disallowed officer compensation | 5,568 | | | 1.6 | % | | 1,510 | | | 0.5 | % |
| Stock compensation | (7,864) | | | (2.2) | % | | (2,158) | | | (0.7) | % |
| Other items – net | (4,938) | | | (1.4) | % | | (2,564) | | | (0.8) | % |
| Total other items | (10,191) | | | (2.8) | % | | (7,769) | | | (2.4) | % |
| Taxes on income from continuing operations | $ | 36,954 | | | 10.5 | % | | $ | 325,632 | | | 98.4 | % |
The Company’s consolidated effective income tax rate for the year ended September 27, 2019 decreased to 10.5% from 98.4% for fiscal 2018. Key drivers for this year over year decrease in the effective tax rate include a reduction of $119.1 million associated with remeasurement of U.S. deferred tax items due to tax reform and a decrease in the amount charged for valuation allowance related to foreign tax credits of $104.4 million.
Segment Financial Information
The following tables present total revenues and segment operating profit for each reportable segment (in thousands) and includes a reconciliation of segment operating profit to total U.S. GAAP operating profit by including certain corporate-level expenses and Restructuring, transaction and other charges (in thousands). Prior period information has been recast to reflect the current period presentation.
| | | | | | | | | | | | | | | | | |
| For the Years Ended |
| October 2, 2020 | | September 27, 2019 | | September 28, 2018 |
| Revenues from External Customers: | | | | | |
| Critical Mission Solutions | $ | 4,965,952 | | | $ | 4,551,162 | | | $ | 3,725,365 | |
| People & Places Solutions | 8,601,023 | | | 8,186,706 | | | 6,854,408 | |
| Total | $ | 13,566,975 | | | $ | 12,737,868 | | | $ | 10,579,773 | |
| | | | | | | | | | | | | | | | | |
| For the Years Ended |
| October 2, 2020 | | September 27, 2019 | | September 28, 2018 |
| Segment Operating Profit: | | | | | |
| Critical Mission Solutions (1) | $ | 372,070 | | | $ | 310,043 | | | $ | 255,718 | |
| People & Places Solutions (2) | 740,707 | | | 714,394 | | | 527,900 | |
| Total Segment Operating Profit | 1,112,777 | | | 1,024,437 | | | 783,618 | |
| Other Corporate Expenses (3) | (249,391) | | | (264,351) | | | (161,788) | |
| Restructuring, Transaction and Other Charges | (327,413) | | | (355,235) | | | (234,387) | |
| Total U.S. GAAP Operating Profit | 535,973 | | | 404,851 | | | 387,443 | |
| | | | | |
| Total Other (Expense) Income, net (4) | (94,770) | | | (53,892) | | | (56,462) | |
| Earnings from Continuing Operations Before Taxes | $ | 441,203 | | | $ | 350,959 | | | $ | 330,981 | |
(1)Includes $15.0 million in charges during the year ended September 28, 2018 associated with a legal matter.
(2)Includes $25.0 million in charges associated with a certain project for the year ended September 27, 2019.
(3)Other corporate expenses include costs that were previously allocated to the ECR segment prior to discontinued operations presentation in connection with the ECR sale in the approximate amount of $— million, $14.8 million and $25.6 million for the years ended October 2, 2020, September 27, 2019 and September 28, 2018, respectively. Also includes intangibles amortization of $90.6 million, $79.1 million and $68.1 million for the years ended October 2, 2020, September 27, 2019 and September 28, 2018, respectively.
(4)For the years ended October 2, 2020 and September 27, 2019, other expenses includes revenues under the Company's TSA with Worley of $15.8 million and $35.4 million, respectively, $74.3 million and $64.8 million in fair value adjustments related to our investment in Worley stock (net of Worley Stock dividends) and certain foreign currency revaluations relating to ECR sale proceeds, respectively. Also included for the years ended October 2, 2020, September 27, 2019 and September 28, 2018 is amortization of deferred financing fees related to the CH2M acquisition of $0.7 million, $3.2 million and $1.8 million respectively. Lastly, includes loss on settlement of U.S. pension plan of $2.7 million for the year ended October 2, 2020 and includes gain on settlement of the CH2M retiree medical plans of $35.0 million for the year ended September 27, 2019.
In evaluating the Company’s performance by operating segment, the CODM reviews various metrics and statistical data for each Line Of Business ("LOB") but focuses primarily on revenues and operating profit. As discussed above, segment operating profit includes not only local SG&A expenses but the SG&A expenses of the Company’s support groups that have been allocated to the segments. In addition, the Company attributes each LOB’s specific incentive compensation plan costs to the LOBs. The revenues of the People & Places Solutions LOB are more affected by pass-through revenues than the Critical Mission Solutions LOB. The methods for recognizing revenue, incentive fees, project losses and change orders are consistent among the LOBs.
Critical Mission Solutions
| | | | | | | | | | | | | | | | | |
| For the Years Ended |
| October 2, 2020 | | September 27, 2019 | | September 28, 2018 |
| Revenue | $ | 4,965,952 | | | $ | 4,551,162 | | | $ | 3,725,365 | |
| Operating Profit | $ | 372,070 | | | $ | 310,043 | | | $ | 255,718 | |
Fiscal 2020 vs. 2019
Critical Mission Solutions (CMS) segment revenues for the year ended October 2, 2020 were $4.97 billion, up $414.8 million, or 9.1%, from $4.55 billion for the prior year. Our increase in revenue was primarily attributable to incremental revenue from the KeyW and John Wood Group nuclear business acquisitions, along with the extra week of activity in fiscal 2020. These favorable impacts more than offset unfavorable COVID-19 related revenue impacts mainly due to challenges from physical distancing requirements, client scheduling changes and other related factors. Impacts on revenues from unfavorable foreign currency translation were approximately $4.5 million for the year ended October 2, 2020.
Operating profit for the segment was $372.1 million for the year ended October 2, 2020, up $62.0 million, or 20.0%, from $310.0 million for the prior year. The increases from the prior year were primarily attributable to incremental operating profit from the KeyW and John Wood Group nuclear business acquisitions, the extra week of activity in fiscal 2020 and the favorable close out of a large program management contract in the first fiscal quarter of 2020. Impacts on operating profit from unfavorable foreign currency translation were approximately $0.4 million for the year ended October 2, 2020. Unfavorable revenue impacts from COVID-19 mentioned above were largely offset by the Company’s mitigating actions in discretionary operating spend and benefits costs, government assistance programs and other areas of improved operating performance.
Fiscal 2019 vs. 2018
CMS segment revenues for the year ended September 27, 2019 were $4.55 billion, up $825.8 million, or 22.2%, from $3.73 billion for the corresponding period in 2018. The increase in revenues was due in large part to nuclear services sector revenue resulting from the CH2M acquisition included for the full year of fiscal 2019 and also incremental revenues from the KeyW acquisition. Also, our CMS revenues were positively impacted by year-over-year revenue volume growth across the legacy portfolio, highlighted by increased spending by customers in the U.S. government business. Impacts on revenues from unfavorable foreign currency were approximately $29.7 million for fiscal year 2019.
Operating profit for the CMS segment was $310.0 million for the year ended September 27, 2019, up $54.3 million, or 21.2%, from $255.7 million for the corresponding period in 2018. In addition to incremental operating profit benefits from the CH2M and KeyW acquisitions, the increase from the prior year was primarily attributable to continued growth in profits from our U.S. governmental business. SG&A for the CMS segment increased for fiscal 2019 attributable mainly to incremental SG&A associated with the CH2M and KeyW acquisitions. Fiscal 2018 included charges of $15.0 million associated with a legal matter.
People & Places Solutions
| | | | | | | | | | | | | | | | | |
| For the Years Ended |
| October 2, 2020 | | September 27, 2019 | | September 28, 2018 |
| Revenue | $ | 8,601,023 | | | $ | 8,186,706 | | | $ | 6,854,408 | |
| Operating Profit | $ | 740,707 | | | $ | 714,394 | | | $ | 527,900 | |
Fiscal 2020 vs. 2019
Revenues for the People & Places Solutions (P&PS) segment for the year ended October 2, 2020 were $8.60 billion, up $414.3 million, or 5.1%, from $8.19 billion for the prior year. The increases in revenue were due in part to portfolio growth across our businesses, highlighted by strong investment in advanced facilities, water and transport infrastructure and project management/construction management ("PMCM") sectors, along with the extra week of activity in fiscal 2020. These favorable performance trends more than offset unfavorable COVID-19 related revenue impacts mainly due to challenges from physical distancing requirements, client scheduling changes and other related factors. Impacts on revenues from unfavorable foreign currency translation were approximately $26.2 million for fiscal 2020.
Operating profit for the segment for the year ended October 2, 2020 was $740.7 million, an increase of $26.3 million, or 3.7%, from $714.4 million for the comparative period in 2019. The year-over-year increase in operating profit was due primarily to positive impacts from the higher year-over-year revenues for the segment, along with the extra week of activity in fiscal 2020 and reductions in costs related to COVID-19 impacts and mitigation efforts. Impacts on operating profit from unfavorable foreign currency translation were approximately $6.1 million for fiscal 2020. Unfavorable revenue impacts from COVID-19 mentioned above were largely offset by the Company’s mitigating actions in discretionary operating spend and benefits costs, government assistance programs and other areas of improved operating performance.
Fiscal 2019 vs. 2018
Revenues for the P&PS segment for the year ended September 27, 2019 were $8.19 billion, an increase of $1.34 billion, or 19.6%, from $6.85 billion for the corresponding period in 2018. The increase in revenues was due in part to favorable impacts resulting from the CH2M acquisition included for the full year of fiscal 2019 together with revenue increases across all our businesses given the strong investment by customers in Life Sciences, Electronics, Water and Transport Infrastructure sectors. Impacts on revenues from unfavorable foreign currency were approximately $57.8 million for fiscal 2019.
Operating profit for the segment for the year ended September 27, 2019 was $714.4 million, up $186.5 million, or 35.3%, compared to $527.9 million for the corresponding period in 2018. The increase in operating profit was in part due to favorable impacts from the CH2M acquisition, together with positive impacts from the higher year over year revenues for the segment. Included in fiscal 2019 results was a $25.0 million charge associated with a project. SG&A for the P&PS segment increased for fiscal 2019, with this increase being attributable mainly to incremental SG&A
associated with the CH2M acquisition in December of fiscal 2018.
Other Corporate Expenses
Other corporate expenses were $249.4 million, $264.4 million and $161.8 million for the years ended October 2, 2020, September 27, 2019 and September 28, 2018, respectively. The decrease from fiscal 2019 to fiscal 2020 was due primarily to cost-reduction programs implemented through prior restructuring initiatives and the current year COVID-19 pandemic response. The increase from fiscal 2018 to fiscal 2019 was due primarily to higher intangible amortization expense from the KeyW and John Wood Group nuclear business acquisitions, as well as impacts from company benefit program enhancements. These increases were partly offset by employee related and other cost reductions across the Company's corporate functions. Fiscal 2019 also included approximately $70.2 million of year-to-date other current year cost allocation realignments that occurred in the first quarter of fiscal 2019 in conjunction with the CH2M acquisition. Prior periods were not restated for the cost allocation realignments.
Included in other corporate expenses in the above table are costs and expenses that relate to general corporate activities as well as corporate-managed benefit and insurance programs. Such costs and expenses include: (i) those elements of SG&A expenses relating to the business as a whole; (ii) those elements of our incentive compensation plans relating to corporate personnel whose other compensation costs are not allocated to the LOBs; (iii) the amortization of intangible assets acquired as part of business combinations; (iv) the quarterly variances between the Company’s actual costs of certain of its self-insured integrated risk and employee benefit programs and amounts charged to the LOBs; and (v) certain adjustments relating to costs associated with the Company’s international defined benefit pension plans. In addition, other corporate expenses may also include from time to time certain adjustments to contract margins (both positive and negative) associated with projects, as well as other items, where it has been determined that such adjustments are not indicative of the performance of the related LOB.
The Company currently holds a 24.5% interest in AWE Management Ltd (AWE ML) that is accounted for under the equity method, and the carrying value of the Company’s investment as of October 2, 2020 was approximately $38 million. As of October 2, 2020, AWE ML was under a contractual operating arrangement with the UK Ministry of Defence (MoD) with multiple years remaining under the arrangement. Subsequent to year end, on November 2, 2020, the MoD unexpectedly announced plans to change its current operating agreements with AWE ML that would result in the early termination of the current contract in 2021. The Company is currently evaluating this subsequent development, including the potential impact on our accounting for this equity method investment in future quarters.
Restructuring and Other Charges
For discussion regarding restructuring and other charges, see Note 16- Restructuring and Other Charges to the Consolidated Financial Statements.
Backlog Information
We include in backlog the total dollar amount of revenues we expect to record in the future as a result of performing work under contracts that have been awarded to us. Our policy with respect to Operations & Maintenance ("O&M") contracts, however, is to include in backlog the amount of revenues we expect to receive for one succeeding year, regardless of the remaining life of the contract. For national government programs (other than national government O&M contracts, which are subject to the same policy applicable to all other O&M contracts), our policy is to include in backlog the full contract award, whether funded or unfunded, excluding option periods. Because of variations in the nature, size, expected duration, funding commitments and the scope of services required by our contracts, the timing of when backlog will be recognized as revenues can vary greatly between individual contracts.
Consistent with industry practice, substantially all of our contracts are subject to cancellation or termination at the option of the client, including our U.S. government work. While management uses all information available to it to determine backlog, at any given time our backlog is subject to changes in the scope of services to be provided as well as increases or decreases in costs relating to the contracts included therein. Backlog is not necessarily an indicator of future revenues.
Because certain contracts (e.g., contracts relating to large Engineering, Procurement & Construction ("EPC") projects as well as national government programs) can cause large increases to backlog in the fiscal period in which we recognize the award, and because many of our contracts require us to provide services that span over several fiscal quarters (and sometimes over fiscal years), we evaluate our backlog generally on a year-over-year basis, but also on a sequential, quarter-over-quarter basis, where appropriate.
Please refer to Item 1A- Risk Factors, above, for a discussion of other factors that may cause backlog to ultimately convert into revenues at different amounts.
The following table summarizes our backlog for the years ended October 2, 2020, September 27, 2019 and September 28, 2018 (in millions):
| | | | | | | | | | | | | | | | | |
| October 2, 2020 | | September 27, 2019 | | September 28, 2018 |
| Critical Mission Solutions | $ | 9,104 | | | $ | 8,460 | | | $ | 7,130 | |
| People & Places Solutions | 14,714 | | | 14,109 | | | 12,825 | |
| Total | $ | 23,818 | | | $ | 22,569 | | | $ | 19,955 | |
The increase in backlog in Critical Mission Solutions for the years presented was primarily the result of new awards from the U.S. federal government and the acquisition of John Wood Group's nuclear consulting, remediation and program management business in fiscal 2020.
The increase in backlog in People & Places Solutions for the years presented was primarily the result of new awards in the U.K. and U.S. markets.
Backlog relating to work to be performed either directly or indirectly for the U.S. federal government and its agencies totaled approximately $8.5 billion (or 35.7% of total backlog), $8.8 billion (or 39.1% of total backlog) and $6.8 billion (or 34.1% of total backlog) at October 2, 2020, September 27, 2019 and September 28, 2018, respectively. Most of our federal government contracts require that services be provided beyond one year. In general, these contracts must be funded annually (i.e., the amounts to be spent under the contract must be appropriated by the U.S. Congress to the procuring agency, and then the agency must allot these sums to the specific contracts).
We estimate that approximately $7.48 billion, or 31.4%, of total backlog at October 2, 2020 will be realized as revenues within the next fiscal year.
Consolidated backlog differs from the Company’s remaining performance obligations as defined by ASC 606 primarily because of our national government contracts (other than national government O&M contracts). Our policy is to include in backlog the full contract award, whether funded or unfunded excluding the option periods while our remaining performance obligations represent a measure of the total dollar value of work to be performed on contracts awarded and in progress. Additionally, the Company includes our proportionate share of backlog related to unconsolidated joint ventures which is not included in our remaining performance obligations.
Liquidity and Capital Resources
At October 2, 2020, our principal sources of liquidity consisted of $862.4 million in cash and cash equivalents and $2.09 billion of available borrowing capacity under our $2.25 billion revolving credit agreement (the "Revolving Credit Facility"). We finance much of our operations and growth through cash generated by our operations.
The amount of cash and cash equivalents at October 2, 2020 represented an increase of $231.4 million from $631.1 million at September 27, 2019, the reasons for which are described below.
Our cash flow provided by operations of $806.8 million during fiscal 2020 was comparatively higher than the $366.4 million in cash flow used for operations for the prior year. This improvement was due primarily to favorable net cash earnings driven in part by improved operating profit performance and mitigating actions from the Company in response to the COVID-19 pandemic. Additionally, this favorable trend in cash from operations benefited from lower working capital levels, due mainly to higher levels of cash used in the prior year for income taxes payable largely attributable to taxes paid on the gain from the ECR sale and favorable cash flow impacts in accrued liabilities, including the deferral of certain payments associated mainly with COVID-19 government assistance programs in the U.S. and Europe, offset mainly by higher cash used in accounts payable.
Our cash used for investing activities for fiscal 2020 of $429.1 million was comparatively lower than the $2.2 billion cash provided by investing activities for the prior year. The change was due primarily to the impact in 2019 of $2.80 billion in cash proceeds associated with the ECR sale and cash paid for the KeyW acquisition of $575.1 million, net of cash acquired. On a comparative basis, cash used in investing activities included approximately $293.6 million in cash paid for the John Wood Group's nuclear business, net of cash acquired in the second quarter of fiscal 2020.
Our cash used for financing activities of $208.3 million in fiscal 2020 resulted mainly from share repurchases of $337.3 million and dividend payments to both shareholders and non-controlling interests totaling $144.0 million, offset by net proceeds from borrowings of $265.3 million. Cash used for financing activities was $2.0 billion in fiscal 2019 resulted mainly from net repayments of borrowings of $1.0 billion primarily related to repayments with cash received from the ECR sale, common stock repurchases of $853.7 million and dividend payments to both shareholders and non-controlling interests of $106.4 million.
At October 2, 2020, the Company had approximately $153.0 million in cash and cash equivalents held in the U.S. and $709.4 million held outside of the U.S. (primarily in the U.K., the Eurozone, Australia, India and the United Arab Emirates), which is used primarily for funding operations in those regions. Other than the tax cost of repatriating funds to the U.S. (see Note 7- Income Taxes of Notes to Consolidated Financial Statements beginning on page F-1 of this Annual Report on Form 10-K), there are no material impediments to repatriating these funds to the U.S.
In March 2020, the Company entered into a new unsecured term loan facility (the “2020 Term Loan Facility”) with a syndicate of financial institutions as lenders. The principal balance of the 2020 Term Loan Facility was $1.0 billion as of October 2, 2020. The terms and other important details are summarized in Note 9- Borrowings. The 2020 Term Loan Facility was entered into as part of our strategy to increase the portion of our long-term debt that is represented by term loan facilities. During fiscal 2020, the Company used proceeds of the 2020 Term Loan Facility to repay $200.0 million in short-term debt and all but $152.8 million in outstanding amounts under the Revolving Credit Facility.
The Company had $263.0 million in letters of credit outstanding at October 2, 2020. Of this amount, $2.3 million was issued under the Revolving Credit Facility and $260.7 million was issued under separate, committed and uncommitted letter-of-credit facilities.
On March 6, 2020, a subsidiary of Jacobs completed the acquisition of John Wood Group's nuclear consulting, remediation and program management business for an enterprise value of £246 million, or approximately $317.9 million, less cash acquired of $24.3 million. The Company has recorded its preliminary purchase accounting processes associated with the acquisitions, which are summarized in Note 14- Business Combinations.
On June 12, 2019, Jacobs completed the acquisition of KeyW by acquiring 100% of the outstanding shares of KeyW common stock. The Company paid total consideration of $902.6 million which was comprised of approximately $604.2 million in cash to the former stockholders and certain equity award holders of KeyW and the assumption of KeyW’s debt of $298.4 million. The Company repaid KeyW's outstanding debt by the end of the fourth fiscal quarter of 2019. The Company has recorded its final purchase accounting associated with the acquisition, which is summarized in Note 14- Business Combinations.
On April 26, 2019, Jacobs completed the sale of its ECR business to Worley for a purchase price of $3.4 billion consisting of (i) $2.8 billion in cash plus (ii) 58.2 million ordinary shares of Worley, subject to adjustments for changes in working capital and certain other items.
We believe we have adequate liquidity and capital resources to fund our projected cash requirements for the next twelve months based on the liquidity provided by our cash and cash equivalents on hand, our borrowing capacity and our continuing cash from operations. We further believe that our financial resources and discretionary spend controls, as well as near term benefits from government assistance programs, will allow us to continue managing the negative impacts of the COVID-19 pandemic on our business operations for the foreseeable future, which is expected to include reduced revenue from operating activities, based on current assumptions and expectations regarding the pandemic. We have taken actions to reduce spending more broadly across the Company, only proceeding with operating and capital spending that is critical. We have also ceased all non-essential hiring and reduced discretionary expenses, including certain employee benefits and compensation. In addition, as a precautionary measure, we temporarily suspended purchases under the share repurchase plan in March 2020 with such suspension remaining in effect through the third fiscal quarter of 2020. Looking ahead, we have developed contingency plans to reduce costs further if the situation deteriorates beyond or lasts longer than current assumptions and expectations.
We were in compliance with all of our debt covenants at October 2, 2020.
Contractual Obligations
The following table sets forth certain information about our contractual obligations as of October 2, 2020 (in thousands):
| | | | | | | | | | | | | | | | | | | | | | | | | | | | | |
| | Payments Due by Fiscal Period |
| | Total | | 1 Year or Less | | 1 - 3 Years | | 3 - 5 Years | | More than 5 Years |
| Debt obligations | $ | 1,678,620 | | | $ | — | | | $ | — | | | $ | 1,368,620 | | | $ | 310,000 | |
| Interest (1) | 188,238 | | | 36,844 | | | 73,689 | | | 53,854 | | | 23,851 | |
| Operating leases | 994,678 | | | 184,967 | | | 307,834 | | | 235,338 | | | 266,539 | |
| Unfunded portion of defined benefit pension plans (2) | 400,391 | | | 31,258 | | | 66,317 | | | 71,728 | | | 231,088 | |
| Obligations under nonqualified deferred compensation plans (3) | 171,130 | | | 12,614 | | | 26,762 | | | 28,946 | | | 102,808 | |
| Purchase obligations (4) | 2,842,462 | | | 2,297,161 | | | 545,301 | | | — | | | — | |
| Total | $ | 6,275,519 | | | $ | 2,562,844 | | | $ | 1,019,903 | | | $ | 1,758,486 | | | $ | 934,286 | |
(1)Determined based on borrowings outstanding at the end of fiscal 2020 using the interest rates in effect at that time, considering the effects of interest rate swap agreements, and for our outstanding long-term debt, concluding with the expiration date of the debt facilities as defined below.
(2)Assumes that future contributions will be consistent with amounts contributed in fiscal 2020, allowing for certain growth based on rates of inflation and salary increases, but limited to the amount recorded as of October 2, 2020. Actual contributions will depend on a variety of factors, including amounts required by local laws and regulations, and other funding requirements.
(3)Assumes that future payments will be consistent with amounts paid in fiscal 2020. Due to the non-qualified nature of the plans, and the fact that benefits are based in part on years of service, the payments included in the schedule were limited to the amount recorded as of October 2, 2020.
(4)Represents those liabilities estimated to be under firm contractual commitments as of October 2, 2020; primarily accounts payable, accrued payroll and accrued dividends.
Effects of Inflation and Changing Prices
The effects of inflation and changing prices on our business is discussed in Item 1A- Risk Factors, and is incorporated herein by reference.
Off-Balance Sheet Arrangements
We are party to financial instruments with off-balance sheet risk in the form of guarantees not reflected in our balance sheet that arise in the normal course of business. However, such off-balance sheet arrangements are not reasonably likely to have a material adverse effect on our financial condition, revenues or expenses, results of operations, liquidity, capital expenditures or resources. See Note 17- Commitments and Contingencies and Derivative Financial Instruments of Notes to Consolidated Financial Statements beginning on page F-1 of this Annual Report on Form 10-K.
New Accounting Pronouncements
ASU 2017-04, Simplifying the Test for Goodwill Impairment, is effective for fiscal years beginning after December 15, 2019 with early adoption permitted. ASU 2017-04 removes the second step of the goodwill impairment test, which requires a hypothetical purchase price allocation. An entity will now recognize a goodwill impairment charge for the amount by which a reporting unit's carrying value exceeds its fair value, not to exceed the amount of goodwill allocated to the reporting unit. Management does not expect the adoption of ASU 2017-04 to have any impact on the Company's financial position, results of operations or cash flows.
ASU No. 2016-13, Financial Instruments - Credit Losses (Topic 326): Measurement of Credit Losses on Financial Instruments requires entities to use a current lifetime expected credit loss methodology to measure impairments of certain financial assets. Using this methodology will result in earlier recognition of losses than under the current incurred loss approach, which requires waiting to recognize a loss until it is probable of having been incurred. There are other provisions within the standard that affect how impairments of other financial assets may be recorded and presented, and that expand disclosures. This standard will be effective for our interim and annual periods beginning with the first quarter of fiscal 2021, and must be applied on a modified retrospective basis. Management does not expect the adoption of ASU 326 to have a material impact on the Company's financial position, results of operations or cash flows.
Item 7A. QUANTITATIVE AND QUALITATIVE DISCLOSURES ABOUT MARKET RISK
We do not enter into derivative financial instruments for trading, speculation or other purposes that would expose the Company to market risk. In the normal course of business, our results of operations are exposed to risks associated with fluctuations in interest rates and currency exchange rates.
Interest Rate Risk
Please see the Note 9- Borrowings in Notes to Consolidated Financial Statements beginning on Page F-1 of this Annual Report on Form 10-K, which is incorporated herein by reference, for a discussion of the Revolving Credit Facility and Note Purchase Agreement.
Our Revolving Credit Facility, 2020 Term Loan Facility and certain other debt obligations are subject to variable rate interest which could be adversely affected by an increase in interest rates. As of October 2, 2020, we had an aggregate of $1.2 billion in outstanding borrowings under our Revolving Credit Facility and 2020 Term Loan Facility. Interest on amounts borrowed under these agreements is subject to adjustment based on the Company’s Consolidated Leverage Ratio (as defined in the credit agreements governing the Revolving Credit Facility and the 2020 Term Loan Facility). Depending on the Company’s Consolidated Leverage Ratio, borrowings under the Revolving Credit Facility and the 2020 Term Loan Facility bear interest at a Eurocurrency rate plus a margin of between 0.875% and 1.5% or a base rate plus a margin of between 0% and 0.5%. Additionally, if our consolidated leverage ratio exceeds a certain amount, the interest on the Senior Notes may increase by 75 basis points. However, as discussed in Note 17- Commitments and Contingencies and Derivative Financial Instruments, we have entered into swap agreements with an aggregate notional value of $911.5 million to convert the variable rate interest based liabilities associated with a corresponding amount of our debt into fixed interest rate liabilities, leaving $267.1 million in principal amount subject to variable interest rate risk.
For the year ended October 2, 2020, our weighted average floating rate borrowings were approximately $1.2 billion. If floating interest rates had increased by 1.00%, our interest expense for the year ended October 2, 2020 would have increased by approximately $12.2 million.
Foreign Currency Risk
In situations where our operations incur contract costs in currencies other than their functional currency, we sometimes enter into foreign exchange contracts to limit our exposure to fluctuating foreign currencies. We follow the provisions of ASC No. 815, Derivatives and Hedging in accounting for our derivative contracts. The Company has $521.5 million in notional value of exchange rate sensitive instruments at October 2, 2020. See Note 17- Commitments and Contingencies and Derivative Financial Instruments for discussion.
Item 8. FINANCIAL STATEMENTS AND SUPPLEMENTARY DATA
The information required by this Item 8 is submitted as a separate section beginning on page F-1 of this Annual Report on Form 10-K and is incorporated herein by reference.
Item 9. CHANGES IN AND DISAGREEMENTS WITH ACCOUNTANTS ON ACCOUNTING AND FINANCIAL DISCLOSURE
None.
Item 9A. CONTROLS AND PROCEDURES
Evaluation of Disclosure Controls and Procedures
Disclosure controls and procedures are those controls and procedures that are designed to ensure that information required to be disclosed in our reports filed or submitted under the Securities Exchange Act of 1934, as amended (the “Exchange Act”) are recorded, processed, summarized and reported within the time periods specified in the SEC’s rules and forms. Disclosure controls and procedures include, without limitation, controls and procedures designed to ensure that information required to be disclosed in our reports filed under the Exchange Act is accumulated and communicated to management, including our Chair and Chief Executive Officer (principal executive officer) and Chief Financial Officer (principal financial officer), to allow timely decisions regarding required disclosure.
The Company’s management, with the participation of its Chair and Chief Executive Officer (principal executive officer) and Chief Financial Officer (principal financial officer), evaluated the effectiveness of the Company’s disclosure controls and procedures as defined by Rule 13a-15(e) of the Exchange Act as of October 2, 2020, the end of the period covered by this Annual Report on Form 10-K (the “Evaluation Date”). Based on that evaluation, the Company’s management, with the participation of the Chief Executive Officer (principal executive officer) and Chief Financial Officer (principal financial officer) concluded that the Company’s disclosure controls and procedures as of the Evaluation Date were effective to ensure that information required to be disclosed by the Company in the reports that it files or submits under the Exchange Act is recorded, processed, summarized and reported within the time periods specified in the SEC’s rules and forms and that such information is accumulated and communicated to the Company’s management, including the Company’s Chair and Chief Executive Officer (principal executive officer) and Chief Financial Officer (principal financial officer), as appropriate to allow timely decisions regarding required disclosure.
Management’s Annual Report on Internal Control Over Financial Reporting
Management is responsible for establishing and maintaining for the Company adequate internal control over financial reporting, as defined in Rule 13a-15(f) under the Exchange Act. Management, with the participation of its Chair and Chief Executive Officer (principal executive officer) and Chief Financial Officer (principal financial officer), has assessed the effectiveness of the Company’s internal control over financial reporting as of the Evaluation Date based on the framework established in “Internal Control—Integrated Framework,” issued by the Committee of Sponsoring Organizations of the Treadway Commission (2013 framework). Based on this assessment, management has concluded that the Company’s internal control over financial reporting as of the Evaluation Date was effective.
The Company's independent registered public accounting firm, Ernst & Young LLP, that audited the Company's consolidated financial statements included in this Annual Report on Form 10-K, also audited the effectiveness of our internal control over financial reporting as of October 2, 2020, as stated in their report included in this Annual Report on Form 10-K.
Changes in Internal Control
There were no changes in the Company’s internal control over financial reporting during the Company’s fiscal quarter ended October 2, 2020 that have materially affected, or are reasonably likely to materially affect, the Company’s internal control over financial reporting.
Limitations on Effectiveness of Controls
The Company’s management, including its Chief Executive Officer and Chief Financial Officer, does not expect that its disclosure controls and procedures or its system of internal control over financial reporting will prevent or detect all errors and all fraud. A control system, no matter how well designed or operated, can provide only reasonable, but not absolute, assurance that the objectives of the system of internal control are met. The design of the Company’s control system reflects the fact that there are resource constraints, and that the benefits of such control systems must be considered relative to their costs. Further, because of the inherent limitations in all control systems, no evaluation of controls can provide absolute assurance that all control failures and instances of fraud, if any, within the Company have been detected. These inherent limitations include the realities that judgments in decision-making can be faulty and that breakdowns can occur because of simple error or mistake. Additionally, controls can be circumvented by the intentional acts of individuals, by collusion of two or more people, or by management override of the controls. The design of any system of controls is also based in part on certain assumptions about the likelihood of future events, and there can be no assurance that the design of any particular control will always succeed in achieving its objective under all potential future conditions.
Item 9B. OTHER INFORMATION
None.
PART III
Item 10. DIRECTORS, EXECUTIVE OFFICERS AND CORPORATE GOVERNANCE
Directors, Executive Officers, Promoters and Control Persons
The information required by Paragraph (a), and Paragraphs (c) through (g) of Item 401 of Regulation S-K (except for information required by Paragraph (e) of that Item to the extent the required information pertains to our executive officers) and Item 405 of Regulation S-K is set forth under the captions “Members of the Board of Directors,” “Corporate Governance” and “Delinquent Section 16(a) Reports” in our definitive proxy statement to be filed with the SEC pursuant to Regulation 14A within 120 days after the close of our fiscal year and is incorporated herein by reference. The information required by Paragraph (b) of Item 401 of Regulation S-K, as well as the information required by Paragraph (e) of that Item to the extent the required information pertains to our executive officers, is set forth in Part I, Item 1 of this Annual Report on Form 10-K under the heading “Information About Our Executive Officers.”
Code of Ethics
We have adopted a code of ethics for our Chief Executive Officer and senior financial officers; a code of business conduct and ethics for members of our Board of Directors and corporate governance guidelines. The full text of these codes of ethics and corporate governance guidelines are available at our website at www.jacobs.com. In the event we make any amendment to, or grant any waiver from, a provision of the code of ethics that applies to the principal executive officer, principal financial officer or principal accounting officer that requires disclosure under applicable SEC rules, we will disclose such amendment or waiver and the reasons therefor on our website. We will provide any person without charge a copy of any of the aforementioned codes of ethics upon receipt of a written request. Requests should be addressed to: Jacobs Engineering Group Inc., 1999 Bryan Street, Suite 1200, Dallas, Texas 75201, Attention: Corporate Secretary.
Corporate Governance
The information required by Items 407(d)(4) and (d)(5) of Regulation S-K is set forth under the caption “Corporate Governance” in our definitive proxy statement to be filed with the SEC pursuant to Regulation 14A within 120 days after the close of our fiscal year and is incorporated herein by reference.
Item 11. EXECUTIVE COMPENSATION
The information required by this Item is set forth under the captions “Corporate Governance,” “Compensation Committee Report,” “Compensation Discussion and Analysis” and “Executive Compensation” in our definitive proxy statement to be filed with the SEC pursuant to Regulation 14A within 120 days after the close of our fiscal year and is incorporated herein by reference.
Item 12. SECURITY OWNERSHIP OF CERTAIN BENEFICIAL OWNERS AND MANAGEMENT AND RELATED STOCKHOLDER MATTERS
The information required by this Item is set forth in our definitive proxy statement to be filed with the SEC pursuant to Regulation 14A within 120 days after the close of our fiscal year and is incorporated herein by reference.
Item 13. CERTAIN RELATIONSHIPS AND RELATED TRANSACTIONS AND DIRECTOR INDEPENDENCE
The information required by this Item is set forth under the captions “Members of The Board of Directors,” “Corporate Governance,” and “Certain Relationships and Related Transactions” in our definitive proxy statement to be filed with the SEC pursuant to Regulation 14A within 120 days after the close of our fiscal year and is incorporated herein by reference.
Item 14. PRINCIPAL ACCOUNTING FEES AND SERVICES
The information required by this Item is set forth under the captions “Report of the Audit Committee” and “Audit and Non-Audit Fees” in our definitive proxy statement to be filed with the SEC pursuant to Regulation 14A within 120 days after the close of our fiscal year and is incorporated herein by reference.
PART IV
EXHIBITS AND FINANCIAL STATEMENTS
Item 15. EXHIBITS AND FINANCIAL STATEMENT SCHEDULES
(a) Documents filed as part of this report:
(1)The Company’s Consolidated Financial Statements at October 2, 2020 and September 27, 2019 and for each of the three years in the period ended October 2, 2020, and the notes thereto, together with the report of the independent auditors on those Consolidated Financial Statements are hereby filed as part of this report, beginning on page F-1.
(2)Financial statement schedules – no financial statement schedules are presented as the required information is either not applicable, or is included in the consolidated financial statements or notes thereto.
(3)See Exhibit Index below.
(b) Exhibit Index:
| | | | | | | | |
| 2.1 | | | |
| | |
| 2.2 | | | |
| | |
| 3.1 | | | |
| | | |
| 3.2 | | | |
| | | |
4.1† | | |
| | |
| 10.1 | | | |
| | | |
| 10.2 | | | |
| | | |
| 10.3 | | | |
| | | |
| 10.4 | | | |
| | |
| 10.5 | | | |
| | | |
| 10.6 | | Credit Agreement, dated as of March 25, 2020, among Jacobs Engineering Group Inc. and Jacobs U.K. Limited, as borrowers, the lenders party thereto, Bank of America, N.A. as administrative agent, Bank of America, N.A., BNP Paribas and Wells Fargo Bank, N.A., as co-syndication agents, The Bank of Nova Scotia, HSBC Bank USA, National Association, USA, PNC Bank, National Association, TD Bank, N.A., Truist Bank and U.S. Bank National Association, as co-documentation agents, and BofA Securities, Inc., BNP Paribas Securities Corp. and Wells Fargo Securities, LLC, as joint lead arrangers and joint bookrunners. Filed as Exhibit 10.1 to the Registrant’s Current Report on Form 8-K on March 27, 2020 and incorporated herein by reference. |
| | |
| | | | | | | | |
| 10.7# | | |
| | | |
| 10.8# | | |
| | | |
| 10.9# | | |
| | | |
| 10.10# | | |
| | | |
| 10.11# | | |
| | | |
| 10.12# | |
|
| | | |
| 10.13# | |
|
| | |
| 10.14# | | |
| | | |
| 10.15# | | |
| | | |
| 10.16# | | |
| | | |
| 10.17# | | |
| | | |
| 10.18# | | |
| | | |
10.19#
| | |
| | |
10.20#
| | |
| | | |
| 10.21# | | |
| | | |
| 10.22# | | |
| | | |
| 10.23# | | |
| | | |
| 10.24# | | |
| | | |
| | | | | | | | |
| 10.25# | | |
| | | |
| 10.26# | | |
| | | |
| 10.27# | | |
| | |
| 10.28# | | |
| | |
| 10.29# | | |
| | |
| 10.30# | |
|
| | |
10.31#
| | |
| | |
10.32#
| | |
| | |
| 10.33# | | |
| | |
| 10.34# | | |
| | |
| 10.35# | | |
| | |
| 10.36 | | |
| | |
| 10.37# † | | |
| | |
| 21† | | |
| | | |
| 23† | | |
| | | |
| 31.1† | | |
| | | |
| 31.2† | | |
| | | |
| 32.1† | | |
| | | |
| | | | | | | | |
| 32.2† | | |
| | | |
| 101.INS† | | XBRL Instance Document |
| | | |
| 101.SCH† | | XBRL Taxonomy Extension Schema Document |
| | | |
| 101.CAL† | | XBRL Taxonomy Extension Calculation Linkbase Document |
| | | |
| 101.DEF† | | XBRL Taxonomy Extension Definition Linkbase Document |
| | | |
| 101.LAB† | | XBRL Taxonomy Extension Label Linkbase Document |
| | | |
| 101.PRE† | | XBRL Taxonomy Extension Presentation Linkbase Document |
| | |
| 104† | | XBRL Coverpage interactive data file |
| | | | | |
| # | Management contract or compensatory plan or arrangement. |
SIGNATURES
Pursuant to the requirements of Section 13 or 15(d) of the Securities Exchange Act of 1934, the Registrant has duly caused this report to be signed on its behalf by the undersigned, thereunto duly authorized.
| | | | | | | | | | | | | | | | | | | | |
| | | | | | | JACOBS ENGINEERING GROUP INC. |
| Dated: | | November 24, 2020 | | By: | | /S/ Steven J. Demetriou |
| | | | | | | Steven J. Demetriou |
| | | | | | | Chair of the Board and Chief Executive Officer (Principal Executive Officer) |
Pursuant to the requirements of the Securities Exchange Act of 1934, this report has been signed below by the following persons on behalf of the Registrant and in the capacities and on the dates indicated:
| | | | | | | | | | | | | | |
| Signature | | Title | | Date |
| /S/ Steven J. Demetriou | | Chair of the Board and Chief Executive Officer (Principal Executive Officer) | | November 24, 2020 |
| Steven J. Demetriou | | | | |
| /S/ Joseph R. Bronson | | Director | | November 24, 2020 |
| Joseph R. Bronson | | | | |
| /S/ Vincent K. Brooks | | Director | | November 24, 2020 |
| Vincent K. Brooks | | | | |
| /S/ Robert C. Davidson, Jr. | | Director | | November 24, 2020 |
| Robert C. Davidson, Jr. | | | | |
| /S/ Ralph E. Eberhart | | Director | | November 24, 2020 |
| Ralph E. Eberhart | | | | |
| /S/ Manny Fernandez | | Director | | November 24, 2020 |
| Manny Fernandez | | | | |
| /S/ Georgette D. Kiser | | Director | | November 24, 2020 |
| Georgette D. Kiser | | | | |
| /S/ Linda Fayne Levinson | | Director | | November 24, 2020 |
| Linda Fayne Levinson | | | | |
| /S/ Barbara L. Loughran | | Director | | November 24, 2020 |
| Barbara L. Loughran | | | | |
| /S/ Robert A. McNamara | | Director | | November 24, 2020 |
| Robert A. McNamara | | | | |
| /S/ Peter J. Robertson | | Director | | November 24, 2020 |
| Peter J. Robertson | | | | |
| /S/ Christopher M.T. Thompson | | Director | | November 24, 2020 |
| Christopher M.T. Thompson | | | | |
| /S/ Kevin C. Berryman | | Executive Vice President,
Chief Financial Officer
(Principal Financial Officer) | | November 24, 2020 |
| Kevin C. Berryman | | | | |
| /S/ William B. Allen | | Senior Vice President and Chief Accounting Officer
(Principal Accounting Officer) | | November 24, 2020 |
| William B. Allen | | | | |
JACOBS ENGINEERING GROUP INC. AND SUBSIDIARIES
CONSOLIDATED FINANCIAL STATEMENTS
WITH REPORTS OF INDEPENDENT REGISTERED PUBLIC ACCOUNTING FIRM
October 2, 2020
JACOBS ENGINEERING GROUP INC. AND SUBSIDIARIES
INDEX TO CONSOLIDATED FINANCIAL STATEMENTS
October 2, 2020
JACOBS ENGINEERING GROUP INC. AND SUBSIDIARIES
CONSOLIDATED BALANCE SHEETS
(In thousands, except share information)
| | | | | | | | | | | |
| October 2, 2020 | | September 27, 2019 |
| ASSETS | | | |
| Current Assets: | | | |
| Cash and cash equivalents | $ | 862,424 | | | $ | 631,068 | |
| Receivables and contract assets | 3,167,310 | | | 2,840,209 | |
| Prepaid expenses and other | 162,355 | | | 189,358 | |
| Investment in equity securities | 347,510 | | | 451,133 | |
| | | |
| Total current assets | 4,539,599 | | | 4,111,768 | |
| Property, Equipment and Improvements, net | 319,371 | | | 308,143 | |
| Other Noncurrent Assets: | | | |
| Goodwill | 5,639,091 | | | 5,432,544 | |
| Intangibles, net | 658,340 | | | 665,076 | |
| Deferred income tax assets | 211,047 | | | 514,633 | |
| Operating lease right-of-use assets | 576,915 | | | — | |
| Miscellaneous | 409,990 | | | 430,547 | |
| | | |
| Total other noncurrent assets | 7,495,383 | | | 7,042,800 | |
| $ | 12,354,353 | | | $ | 11,462,711 | |
| LIABILITIES AND STOCKHOLDERS’ EQUITY | | | |
| Current Liabilities: | | | |
| Short-term debt | $ | — | | | $ | 199,901 | |
| Accounts payable | 1,061,754 | | | 1,072,645 | |
| Accrued liabilities | 1,249,883 | | | 1,386,952 | |
| Operating lease liability | 164,312 | | | — | |
| Contract liabilities | 465,648 | | | 414,208 | |
| Total current liabilities | 2,941,597 | | | 3,073,706 | |
| Long-term debt | 1,676,941 | | | 1,201,245 | |
| Liabilities relating to defined benefit pension and retirement plans | 568,176 | | | 575,897 | |
| Deferred income tax liabilities | 3,366 | | | 233,111 | |
| Long-term operating lease liability | 735,202 | | | — | |
| Other deferred liabilities | 573,404 | | | 610,094 | |
| | | |
| Commitments and Contingencies | | | |
| Stockholders’ Equity: | | | |
| Capital stock: | | | |
Preferred stock, $1 par value, authorized - 1,000,000 shares; issued and outstanding - none | — | | | — | |
Common stock, $1 par value, authorized - 240,000,000 shares; issued and outstanding - 129,747,783 shares and 132,879,395 shares as of October 2, 2020 and September 27, 2019, respectively | 129,748 | | | 132,879 | |
| Additional paid-in capital | 2,598,446 | | | 2,559,450 | |
| Retained earnings | 4,020,575 | | | 3,939,174 | |
| Accumulated other comprehensive loss | (933,057) | | | (916,812) | |
| Total Jacobs stockholders’ equity | 5,815,712 | | | 5,714,691 | |
| Noncontrolling interests | 39,955 | | | 53,967 | |
| Total Group stockholders’ equity | 5,855,667 | | | 5,768,658 | |
| $ | 12,354,353 | | | $ | 11,462,711 | |
See the accompanying Notes to Consolidated Financial Statements.
JACOBS ENGINEERING GROUP INC. AND SUBSIDIARIES
CONSOLIDATED STATEMENTS OF EARNINGS
For the Fiscal Years Ended October 2, 2020, September 27, 2019 and September 28, 2018
(In thousands, except per share information)
| | | | | | | | | | | | | | | | | |
| October 2, 2020 | | September 27, 2019 | | September 28, 2018 |
| Revenues | $ | 13,566,975 | | | $ | 12,737,868 | | | $ | 10,579,773 | |
| Direct cost of contracts | (10,980,307) | | | (10,260,840) | | | (8,421,223) | |
| Gross profit | 2,586,668 | | | 2,477,028 | | | 2,158,550 | |
| Selling, general and administrative expenses | (2,050,695) | | | (2,072,177) | | | (1,771,107) | |
| Operating Profit | 535,973 | | | 404,851 | | | 387,443 | |
| Other Income (Expense): | | | | | |
| Interest income | 4,729 | | | 9,487 | | | 8,984 | |
| Interest expense | (62,206) | | | (83,847) | | | (76,760) | |
| | | | | |
| Miscellaneous (expense) income, net | (37,293) | | | 20,468 | | | 11,314 | |
| Total other expense, net | (94,770) | | | (53,892) | | | (56,462) | |
| Earnings from Continuing Operations Before Taxes | 441,203 | | | 350,959 | | | 330,981 | |
| Income Tax Expense for Continuing Operations | (55,320) | | | (36,954) | | | (325,632) | |
| Net Earnings of the Group from Continuing Operations | 385,883 | | | 314,005 | | | 5,349 | |
| Net Earnings of the Group from Discontinued Operations | 137,984 | | | 559,214 | | | 167,793 | |
| Net Earnings of the Group | 523,867 | | | 873,219 | | | 173,142 | |
| Net Earnings Attributable to Noncontrolling Interests from Continuing Operations | (32,022) | | | (23,045) | | | (9,534) | |
| Net Earnings (Loss) Attributable to Jacobs from Continuing Operations | 353,861 | | | 290,960 | | | (4,185) | |
| Net Earnings Attributable to Noncontrolling Interests from Discontinued Operations | — | | | (2,195) | | | (177) | |
| Net Earnings Attributable to Jacobs from Discontinued Operations | 137,984 | | | 557,019 | | | 167,616 | |
| Net Earnings Attributable to Jacobs | $ | 491,845 | | | $ | 847,979 | | | $ | 163,431 | |
| Net Earnings (Loss) Per Share: | | | | | |
| Basic Net Earnings (Loss) from Continuing Operations Per Share | $ | 2.69 | | | $ | 2.11 | | | $ | (0.03) | |
| Basic Net Earnings from Discontinued Operations Per Share | $ | 1.05 | | | $ | 4.03 | | | $ | 1.21 | |
| Basic Earnings Per Share | $ | 3.74 | | | $ | 6.14 | | | $ | 1.18 | |
| | | | | |
| Diluted Net Earnings (Loss) from Continuing Operations Per Share | $ | 2.67 | | | $ | 2.09 | | | $ | (0.03) | |
| Diluted Net Earnings from Discontinued Operations Per Share | $ | 1.04 | | | $ | 4.00 | | | $ | 1.21 | |
| Diluted Earnings Per Share | $ | 3.71 | | | $ | 6.08 | | | $ | 1.18 | |
See the accompanying Notes to Consolidated Financial Statements.
JACOBS ENGINEERING GROUP INC. AND SUBSIDIARIES
CONSOLIDATED STATEMENTS OF COMPREHENSIVE INCOME
For the Fiscal Years Ended October 2, 2020, September 27, 2019 and September 28, 2018
(In thousands)
| | | | | | | | | | | | | | | | | |
| October 2, 2020 | | September 27, 2019 | | September 28, 2018 |
| Net Earnings of the Group | $ | 523,867 | | | $ | 873,219 | | | $ | 173,142 | |
| Other Comprehensive Income (Loss): | | | | | |
| Foreign currency translation adjustment | 64,052 | | | 15,972 | | | (109,877) | |
| Gain (loss) on cash flow hedges | (21,883) | | | 1,369 | | | 118 | |
| Change in pension and retiree medical plan liabilities | (75,334) | | | (157,632) | | | (27,231) | |
| Other comprehensive income (loss) before taxes | (33,165) | | | (140,291) | | | (136,990) | |
| Income Tax (Expense) Benefit: | | | | | |
| Foreign currency translation adjustment | (3,722) | | | — | | | — | |
| Cash flow hedges | 7,285 | | | (568) | | | 859 | |
| Change in pension and retiree medical plan liabilities | 13,357 | | | 30,750 | | | (17,058) | |
| Income Tax (Expense) Benefit: | 16,920 | | | 30,182 | | | (16,199) | |
| Net other comprehensive income (loss) | (16,245) | | | (110,109) | | | (153,189) | |
| Net Comprehensive Income (Loss) of the Group | 507,622 | | | 763,110 | | | 19,953 | |
| Net (Earnings) Loss Attributable to Noncontrolling Interests | (32,022) | | | (25,240) | | | (9,711) | |
| Net Comprehensive Income (Loss) Attributable to Jacobs | $ | 475,600 | | | $ | 737,870 | | | $ | 10,242 | |
See the accompanying Notes to Consolidated Financial Statements including the Company's note on
Other Financial Information for a presentation of amounts reclassified to net income during the period.
JACOBS ENGINEERING GROUP INC. AND SUBSIDIARIES
CONSOLIDATED STATEMENTS OF STOCKHOLDERS’ EQUITY
For the Fiscal Years Ended October 2, 2020, September 27, 2019 and September 28, 2018
(In thousands)
| | | | | | | | | | | | | | | | | | | | | | | | | | | | | | | | | | | | | | | | | |
| Common Stock | | Additional
Paid-in
Capital | | Retained Earnings | | Accumulated Other Comprehensive
Income
(Loss) | | Total Jacobs Stockholders’ Equity | | Noncontrolling Interests | | Total Group Stockholders’ Equity |
| Balances at September 29, 2017 | $ | 120,386 | | | $ | 1,239,782 | | | $ | 3,721,698 | | | $ | (653,514) | | | $ | 4,428,352 | | | $ | 58,999 | | | $ | 4,487,351 | |
| Net earnings | — | | | — | | | 163,431 | | | — | | | 163,431 | | | 9,711 | | | 173,142 | |
| Foreign currency translation adjustments | — | | | — | | | — | | | (109,877) | | | (109,877) | | | — | | | (109,877) | |
Pension and retiree medical plan liability, net of deferred taxes of $17,058 | — | | | — | | | 10,160 | | | (44,289) | | | (34,129) | | | — | | | (34,129) | |
Gain on derivatives, net of deferred taxes of $(859) | — | | | — | | | — | | | 977 | | | 977 | | | — | | | 977 | |
| Noncontrolling interest acquired / consolidated | — | | | 3,456 | | | — | | | — | | | 3,456 | | | 33,690 | | | 37,146 | |
| Dividends | — | | | — | | | (85,608) | | | — | | | (85,608) | | | — | | | (85,608) | |
| Distributions to noncontrolling interests | — | | | — | | | 7,705 | | | — | | | 7,705 | | | (12,391) | | | (4,686) | |
| Stock based compensation | — | | | 81,196 | | | (1,954) | | | — | | | 79,242 | | | — | | | 79,242 | |
| Issuances of equity securities | 21,881 | | | 1,385,316 | | | (3,420) | | | — | | | 1,403,777 | | | — | | | 1,403,777 | |
| Repurchases of equity securities | (49) | | | (911) | | | (2,021) | | | — | | | (2,981) | | | — | | | (2,981) | |
| Balances at September 28, 2018 | $ | 142,218 | | | $ | 2,708,839 | | | $ | 3,809,991 | | | $ | (806,703) | | | $ | 5,854,345 | | | $ | 90,009 | | | $ | 5,944,354 | |
| Net earnings | — | | | — | | | 847,979 | | | — | | | 847,979 | | | 25,240 | | | 873,219 | |
Disposition of ECR business, net of deferred taxes of $5,402 | — | | | — | | | — | | | 112,764 | | | 112,764 | | | (45,727) | | | 67,037 | |
Adoption of ASC 606, net of deferred taxes of $(10,825) | — | | | — | | | (37,209) | | | — | | | (37,209) | | | — | | | (37,209) | |
| Foreign currency translation adjustments | — | | | — | | | — | | | (84,456) | | | (84,456) | | | — | | | (84,456) | |
Pension and retiree medical plan liability, net of deferred taxes of $25,348 | — | | | — | | | — | | | (139,218) | | | (139,218) | | | — | | | (139,218) | |
Gain on derivatives, net of deferred taxes of $568 | — | | | — | | | — | | | 801 | | | 801 | | | — | | | 801 | |
Noncontrolling interest acquired /
consolidated | — | | | (1,113) | | | — | | | — | | | (1,113) | | | — | | | (1,113) | |
| Dividends | — | | | — | | | (92,980) | | | — | | | (92,980) | | | — | | | (92,980) | |
| Distributions to noncontrolling interests | — | | | — | | | — | | | — | | | — | | | (15,555) | | | (15,555) | |
| Stock based compensation | — | | | 69,128 | | | 9 | | | — | | | 69,137 | | | — | | | 69,137 | |
| Issuances of equity securities including shares withheld for taxes | 1,681 | | | 43,508 | | | (6,872) | | | — | | | 38,317 | | | — | | | 38,317 | |
| Repurchases of equity securities | (11,020) | | | (260,912) | | | (581,744) | | | — | | | (853,676) | | | — | | | (853,676) | |
| Balances at September 27, 2019 | $ | 132,879 | | | $ | 2,559,450 | | | $ | 3,939,174 | | | $ | (916,812) | | | $ | 5,714,691 | | | $ | 53,967 | | | $ | 5,768,658 | |
| Net earnings | — | | | — | | | 491,845 | | | — | | | 491,845 | | | 32,022 | | | 523,867 | |
Foreign currency translation adjustments, net of deferred taxes of $3,722 | — | | | — | | | — | | | 60,330 | | | 60,330 | | | — | | | 60,330 | |
Pension and retiree medical plan liability, net of deferred taxes of $(13,357) | — | | | — | | | — | | | (61,977) | | | (61,977) | | | — | | | (61,977) | |
(Loss) Gain on derivatives, net of deferred taxes of $(7,285) | — | | | — | | | — | | | (14,598) | | | (14,598) | | | — | | | (14,598) | |
| | | | | | | | | | | | | |
| Dividends | — | | | — | | | (99,921) | | | — | | | (99,921) | | | — | | | (99,921) | |
| Noncontrolling interests - distributions and other | — | | | 5,002 | | | — | | | — | | | 5,002 | | | (46,034) | | | (41,032) | |
| Stock based compensation | — | | | 47,048 | | | 1,102 | | | — | | | 48,150 | | | — | | | 48,150 | |
| Issuances of equity securities including shares withheld for taxes | 998 | | | 17,890 | | | (9,447) | | | — | | | 9,441 | | | — | | | 9,441 | |
| Repurchases of equity securities | (4,129) | | | (30,944) | | | (302,178) | | | — | | | (337,251) | | | — | | | (337,251) | |
| | | | | | | | | | | | | |
| Balances at October 2, 2020 | $ | 129,748 | | | $ | 2,598,446 | | | $ | 4,020,575 | | | $ | (933,057) | | | $ | 5,815,712 | | | $ | 39,955 | | | $ | 5,855,667 | |
See the accompanying Notes to Consolidated Financial Statements.
JACOBS ENGINEERING GROUP INC. AND SUBSIDIARIES
CONSOLIDATED STATEMENTS OF CASH FLOWS
For the Fiscal Years Ended October 2, 2020, September 27, 2019 and September 28, 2018
(In thousands)
| | | | | | | | | | | | | | | | | |
| October 2, 2020 | | September 27, 2019 | | September 28, 2018 |
| Cash Flows from Operating Activities: | | | | | |
| Net earnings attributable to the Group | $ | 523,867 | | | $ | 873,219 | | | $ | 173,142 | |
| Adjustments to reconcile net earnings to net cash flows provided by (used for) operations: | | | | | |
| Depreciation and amortization: | | | | | |
| Property, equipment and improvements | 91,070 | | | 90,171 | | | 117,856 | |
| Intangible assets | 90,563 | | | 79,098 | | | 80,731 | |
| Gain on sale of ECR business | (110,236) | | | (935,110) | | | — | |
| Loss on disposal of other businesses and investments | — | | | 9,608 | | | 20,967 | |
| Loss on investment in equity securities | 103,623 | | | 78,108 | | | — | |
| Stock based compensation | 48,150 | | | 69,137 | | | 79,242 | |
| Equity in earnings of operating ventures, net of return on capital distributions | 9,172 | | | (8,784) | | | (2,639) | |
| Loss on disposals of assets, net | 766 | | | 6,222 | | | 17,491 | |
| Impairment of long-lived assets | 162,238 | | | — | | | — | |
| Loss (Gain) on pension and retiree medical plan changes | 4,598 | | | (33,087) | | | 5,414 | |
| Deferred income taxes | 82,275 | | | (105,939) | | | 288,126 | |
| Changes in assets and liabilities, excluding the effects of businesses acquired: |
| |
| | |
| Receivables and contract assets, net of contract liabilities | (107,784) | | | (67,894) | | | (428,930) | |
| Prepaid expenses and other current assets | (27,280) | | | (13,117) | | | (19,134) | |
| Accounts payable | (92,838) | | | 295,146 | | | 183,057 | |
| Income taxes payable | 35,194 | | | (294,995) | | | 68,970 | |
| Accrued liabilities | (27,849) | | | (305,716) | | | (37,746) | |
| Other deferred liabilities | (64,390) | | | (106,256) | | | (79,280) | |
| Other, net | 85,710 | | | 3,753 | | | 13,885 | |
| Net cash provided by (used for) operating activities | 806,849 | | | (366,436) | | | 481,152 | |
| Cash Flows from Investing Activities: |
| |
| | |
| Additions to property and equipment | (118,269) | | | (135,977) | | | (94,884) | |
| Disposals of property and equipment and other assets | 96 | | | 7,177 | | | 3,293 | |
| Capital contributions to equity investees, net of return of capital distributions | (12,278) | | | (8,761) | | | (5,416) | |
| Acquisitions of businesses, net of cash acquired | (293,580) | | | (575,110) | | | (1,488,336) | |
| Disposals of investment in equity securities | — | | | 64,708 | | | — | |
| (Payments) proceeds related to sales of businesses | (5,061) | | | 2,801,425 | | | 7,736 | |
| Purchases of noncontrolling interests | — | | | (1,113) | | | — | |
| Net cash (used for) provided by investing activities | (429,092) | | | 2,152,349 | | | (1,577,607) | |
| Cash Flows from Financing Activities: |
| |
| | |
| Proceeds from long-term borrowings | 2,986,661 | | | 2,782,193 | | | 5,784,355 | |
| Repayments of long-term borrowings | (2,521,467) | | | (3,996,970) | | | (4,572,182) | |
| Proceeds from short-term borrowings | 78 | | | 200,001 | | | 712 | |
| Repayments of short-term borrowings | (200,008) | | | (28,566) | | | (3,391) | |
| Debt issuance costs | (1,807) | | | (3,915) | | | — | |
| Proceeds from issuances of common stock | 37,235 | | | 64,958 | | | 53,584 | |
| Common stock repurchases | (337,251) | | | (853,676) | | | (2,981) | |
| Taxes paid on vested restricted stock | (27,794) | | | (26,641) | | | (31,108) | |
| Cash dividends, including to noncontrolling interests | (143,962) | | | (106,396) | | | (86,569) | |
| Net cash (used for) provided by financing activities | (208,315) | | | (1,969,012) | | | 1,142,420 | |
| Effect of Exchange Rate Changes | 61,914 | | | 20,809 | | | (26,758) | |
| Net Increase (Decrease) in Cash and Cash Equivalents | 231,356 | | | (162,290) | | | 19,207 | |
| Cash and Cash Equivalents at the Beginning of the Period | 631,068 | | | 793,358 | | | 774,151 | |
| Cash and Cash Equivalents at the End of the Period | 862,424 | | | 631,068 | | | 793,358 | |
| Less Cash and Cash Equivalents included in Assets held for Sale | — | | | — | | | (158,488) | |
| Cash and Cash Equivalents of Continuing Operations at the End of the Period | $ | 862,424 | | | $ | 631,068 | | | $ | 634,870 | |
See the accompanying Notes to Consolidated Financial Statements.
JACOBS ENGINEERING GROUP INC. AND SUBSIDIARIES
NOTES TO CONSOLIDATED FINANCIAL STATEMENTS
1.Description of Business and Basis of Presentation
Description of Business
Jacobs is a leading global professional services company that designs and deploys technology-centric solutions to solve many of the world’s most complex challenges. We operate in two lines of business: Critical Mission Solutions and People & Places Solutions.
We provide a broad range of technical, professional and construction services including engineering, design and architectural services; construction and construction management services; operations and maintenance services; and process, scientific and systems consulting services. We provide our services through offices and subsidiaries located primarily in North America, Europe, the Middle East, India, Australia, New Zealand and Asia. We provide our services under cost-reimbursable and fixed-price contracts, with our fixed-price contracts comprised mainly of professional services arrangements and in some limited cases, construction. The percentage of revenues realized from each of these types of contracts for the fiscal years ended October 2, 2020, September 27, 2019 and September 28, 2018 was as follows:
| | | | | | | | | | | | | | | | | |
| | For the Years Ended |
| | October 2, 2020 | | September 27, 2019 | | September 28, 2018 |
| Cost-reimbursable | 76% | | 76% | | 74% |
| Fixed-price | 24% | | 24% | | 26% |
Basis of Presentation, Definition of Fiscal Year, and Other Matters
The accompanying Consolidated Financial Statements have been prepared in accordance with accounting principles generally accepted in the United States ("U.S. GAAP") and include the accounts of Jacobs Engineering Group Inc. and its subsidiaries and affiliates which it controls. All intercompany accounts and transactions have been eliminated in consolidation. Certain prior year balances have been reclassified to conform to current year presentation.
The Company’s fiscal year ends on the Friday closest to September 30 (determined on the basis of the number of workdays) and, accordingly, an additional week of activity is added every five-to-six years. Fiscal 2020 included an extra week of activity.
Effective the beginning of fiscal first quarter 2020, the Company adopted ASU 2016-02, Leases ("ASC 842"), including the subsequent ASU's that amended and clarified the related guidance. The Company adopted ASC 842 using a modified retrospective approach, and accordingly the new guidance was applied to leases that existed or were entered into after the first day of adoption without adjusting the comparative periods presented. Please refer to Note 10- Leases for a discussion of our updated policies and disclosures related to leases.
Effective the beginning of fiscal first quarter 2019, the Company adopted ASC Topic 606, Revenue from Contracts with Customers, including the subsequent ASUs that amended and clarified the related guidance. The Company adopted ASC Topic 606 using the modified retrospective method, and accordingly the new guidance was applied retrospectively to contracts that were not completed or substantially completed as of September 29, 2018 (the date of initial application). Please refer to Note 3- Revenue Accounting for Contracts.
On March 6, 2020, a subsidiary of Jacobs completed the acquisition of the nuclear consulting, remediation and program management business of John Wood Group, a U.K.-based energy services company, for an enterprise value of £246 million, or approximately $317.9 million, less cash acquired of $24.3 million. The Company has recorded its preliminary purchase price allocation associated with the acquisition, which is summarized in Note 14- Business Combinations.
On June 12, 2019, Jacobs completed the acquisition of The KeyW Holding Corporation (“KeyW”), a U.S.-based national security solutions provider to the intelligence, cyber, and counterterrorism communities by acquiring 100% of the outstanding shares of KeyW common stock. The Company paid total consideration of $902.6 million which was comprised of approximately $604.2 million in cash to the former stockholders and certain equity award holders of KeyW and the assumption of KeyW’s debt of approximately $298.4 million. The Company repaid all of the assumed
JACOBS ENGINEERING GROUP INC. AND SUBSIDIARIES
NOTES TO CONSOLIDATED FINANCIAL STATEMENTS - (Continued)
KeyW debt by the end of the fourth fiscal quarter of 2019. The Company has recorded its final purchase price allocation associated with the acquisition, which is summarized in Note 14- Business Combinations.
On April 26, 2019, Jacobs completed the sale of its Energy, Chemicals and Resources ("ECR") business to Worley Limited, a company incorporated in Australia ("Worley"), for a purchase price of $3.4 billion consisting of (i) $2.8 billion in cash plus (ii) 58.2 million ordinary shares of Worley, subject to adjustments for changes in working capital and certain other items (the “ECR sale”). As a result of the ECR sale, substantially all ECR-related assets and liabilities have been sold (the "Disposal Group"). We determined that the Disposal Group should be reported as discontinued operations in accordance with ASC 210-05, Discontinued Operations because their disposal represents a strategic shift that had a major effect on our operations and financial results. As such, the financial results of the ECR business are reflected in our Consolidated Statements of Earnings as discontinued operations for all periods presented. As of the year ended September 27, 2019, a portion of the ECR business remained held by Jacobs and continued to be classified as held for sale in accordance with U.S. GAAP. As of October 2, 2020, all of the ECR business to be sold under the terms of the sale has been conveyed to Worley and as such, no amounts remain held for sale. For further discussion see Note 15- Sale of Energy, Chemicals and Resources ("ECR") Business to the consolidated financial statements.
On December 15, 2017, the Company completed the acquisition of CH2M HILL Companies, Ltd. ("CH2M"), an international provider of engineering, construction, and technical services, by acquiring 100% of the outstanding shares of CH2M common stock and preferred stock. The Company paid total consideration of approximately $1.8 billion in cash (excluding $315.2 million of cash acquired) and issued approximately $1.4 billion of Jacobs’ common stock, or 20.7 million shares, to the former stockholders and certain equity award holders of CH2M. In connection with the acquisition, the Company also assumed CH2M’s revolving credit facility and second lien notes, including a $20.0 million prepayment penalty, which totaled approximately $700 million of long-term debt. Immediately following the effective time of the acquisition, the Company repaid CH2M’s revolving credit facility and second lien notes including the related prepayment penalty. The Company has finalized its purchase accounting processes associated with the acquisition, which is summarized in Note 14- Business Combinations.
2.Significant Accounting Policies
Revenue Accounting for Contracts
Engineering, Procurement & Construction Contracts and Service Contracts
On September 29, 2018, the Company adopted ASC Topic 606, Revenue from Contracts with Customers, including the subsequent ASUs that amended and clarified the related guidance. The Company recognizes engineering, procurement, and construction contract revenue over time, as performance obligations are satisfied, due to the continuous transfer of control to the customer. Upon adoption of ASC Topic 606, contracts which include engineering, procurement and construction services are generally accounted for as a single deliverable (a single performance obligation) and are no longer segmented between types of services. In some instances, the Company’s services associated with a construction activity are limited to specific tasks such as customer support, consulting or supervisory services. In these instances, the services are typically identified as separate performance obligations.
The Company recognizes revenue using the percentage-of-completion method, based primarily on contract costs incurred to date compared to total estimated contract costs. The percentage-of-completion method (an input method) is the most representative depiction of the Company’s performance because it directly measures the value of the services transferred to the customer. Subcontractor materials, labor and equipment and, in certain cases, customer-furnished materials and labor and equipment are included in revenue and cost of revenue when management believes that the company is acting as a principal rather than as an agent (e.g., the company integrates the materials, labor and equipment into the deliverables promised to the customer or is otherwise primarily responsible for fulfillment and acceptability of the materials, labor and/or equipment). The Company recognizes revenue, but not profit, on certain uninstalled materials that are not specifically produced, fabricated, or constructed for a project. Revenue on these uninstalled materials is recognized when control is transferred. Changes to total estimated contract cost or losses, if any, are recognized in the period in which they are determined as assessed at the contract level. Pre-contract costs are expensed as incurred unless they are expected to be recovered from the client. Project mobilization costs are generally charged to project costs as incurred when they are an integrated part of the performance obligation being transferred to the client. Under the typical payment terms of our engineering, procurement and construction contracts, amounts are billed as work progresses in accordance with agreed-upon contractual terms at periodic intervals (e.g., biweekly or monthly) and customer payments are typically due within 30 to 60 days of billing, depending on the contract.
JACOBS ENGINEERING GROUP INC. AND SUBSIDIARIES
NOTES TO CONSOLIDATED FINANCIAL STATEMENTS - (Continued)
For service contracts, the Company recognizes revenue over time using the cost-to-cost percentage-of-completion method. Service contracts that include multiple performance obligations are segmented between types of services. For contracts with multiple performance obligations, the Company allocates the transaction price to each performance obligation using an estimate of the stand-alone selling price of each distinct service in the contract. In some instances where the Company is standing ready to provide services, the Company recognizes revenue ratably over the service period. Under the typical payment terms of our service contracts, amounts are billed as work progresses in accordance with agreed-upon contractual terms, and customer payments are typically due within 30 to 60 days of billing, depending on the contract.
Direct costs of contracts include all costs incurred in connection with and directly for the benefit of client contracts, including depreciation and amortization relating to assets used in providing the services required by the related projects. The level of direct costs of contracts may fluctuate between reporting periods due to a variety of factors, including the amount of pass-through costs we incur during a period. On those projects where we are acting as principal for subcontract labor or third-party materials and equipment, we reflect the amounts of such items in both revenues and costs (and we refer to such costs as “pass-through costs”).
Back charges to suppliers or subcontractors are recognized as a reduction of cost when it is determined that recovery of such cost is probable and the amounts can be reliably estimated. Disputed back charges are recognized when the same requirements described above have been satisfied.
Variable Consideration
The nature of the Company’s contracts gives rise to several types of variable consideration, including claims and unpriced change orders; awards and incentive fees; and liquidated damages and penalties. The Company recognizes revenue for variable consideration when it is probable that a significant reversal in the amount of cumulative revenue recognized will not occur. The Company estimates the amount of revenue to be recognized on variable consideration using the expected value (i.e., the sum of a probability-weighted amount) or the most likely amount method, whichever is expected to better predict the amount. Factors considered in determining whether revenue associated with claims (including change orders in dispute and unapproved change orders in regard to both scope and price) should be recognized include the following: (a) the contract or other evidence provides a legal basis for the claim, (b) additional costs were caused by circumstances that were unforeseen at the contract date and not the result of deficiencies in the company’s performance, (c) claim-related costs are identifiable and considered reasonable in view of the work performed, and (d) evidence supporting the claim is objective and verifiable. If the requirements for recognizing revenue for claims or unapproved change orders are met, revenue is recorded only when the costs associated with the claims or unapproved change orders have been incurred and only up to the amount of cost incurred.
The Company generally provides limited warranties for work performed under its engineering and construction contracts. The warranty periods typically extend for a limited duration following substantial completion of the Company’s work on the project. Historically, warranty claims have not resulted in material costs incurred for which the Company was not compensated for by the customer.
Practical Expedient
If the Company has a right to consideration from a customer in an amount that corresponds directly with the value of the Company’s performance completed to date (a service contract in which the company bills a fixed amount for each hour of service provided), the Company recognizes revenue in the amount to which it has a right to invoice for services performed.
The Company does not adjust the contract price for the effects of a significant financing component if the Company expects, at contract inception, that the period between when the Company transfers a service to a customer and when the customer pays for that service will be one year or less.
See Note 3- Revenue Accounting for Contracts for further discussion.
JACOBS ENGINEERING GROUP INC. AND SUBSIDIARIES
NOTES TO CONSOLIDATED FINANCIAL STATEMENTS - (Continued)
Joint Ventures and VIEs
As is common to the industry, we execute certain contracts jointly with third parties through various forms of joint ventures. Although the joint ventures own and hold the contracts with the clients, the services required by the contracts are typically performed by us and our joint venture partners, or by other subcontractors under subcontracting agreements with the joint ventures. Many of these joint ventures are formed for a specific project. The assets of our joint ventures generally consist almost entirely of cash and receivables (representing amounts due from clients), and the liabilities of our joint ventures generally consist almost entirely of amounts due to the joint venture partners (for services provided by the partners to the joint ventures under their individual subcontracts) and other subcontractors. In general, at any given time, the equity of our joint ventures represents the undistributed profits earned on contracts the joint ventures hold with clients. Very few of our joint ventures have employees or third-party debt or credit facilities. The debt held by the joint ventures is non-recourse to the general credit of Jacobs.
The assets of a joint venture are restricted for use to the obligations of the particular joint venture and are not available for general operations of the Company. Our risk of loss on these arrangements is usually shared with our partners. The liability of each partner is usually joint and several, which means that each partner may become liable for the entire risk of loss on the project. Furthermore, on some of our projects, the Company has granted guarantees which may encumber both our contracting subsidiary company and the Company for the entire risk of loss on the project. The Company is unable to estimate the maximum potential amount of future payments that we could be required to make under outstanding performance guarantees related to joint venture projects due to a number of factors, including but not limited to, the nature and extent of any contractual defaults by our joint venture partners, resource availability, potential performance delays caused by the defaults, the location of the projects, and the terms of the related contracts. See Note 18- Contractual Guarantees, Litigation, Investigations and Insurance for further discussion.
Most of the joint ventures are deemed to be variable interest entities (“VIE”) because they lack sufficient equity to finance the activities of the joint venture. The Company uses a qualitative approach to determine if the Company is the primary beneficiary of the VIE, which considers factors that indicate a party has the power to direct the activities that most significantly impact the joint venture’s economic performance. These factors include the composition of the governing board, how board decisions are approved, the powers granted to the operational manager(s) and partner that holds that position(s), and to a certain extent, the partner’s economic interest in the joint venture. The Company analyzes each joint venture initially to determine if it should be consolidated or unconsolidated.
•Consolidated if the Company is the primary beneficiary of a VIE, or holds the majority of voting interests of a non-VIE (and no significant participative rights are available to the other partners).
•Unconsolidated if the Company is not the primary beneficiary of a VIE, or does not hold the majority of voting interest of a non-VIE.
Our unconsolidated joint ventures (including equity method investments) are reviewed for impairment whenever events or changes in circumstances indicate that the carrying amount of the investment might not be recoverable, and impairment losses are recognized for such investments if there is a decline in fair value below carrying value that is considered to be other-than-temporary.
See Note 8- Joint Ventures and VIEs for further discussion.
Fair Value Measurements
Certain amounts included in the accompanying consolidated financial statements are presented at “fair value.” Fair value is defined as the price that would be received from selling an asset or paid to transfer a liability in an orderly transaction between market participants as of the date fair value is determined (the “measurement date”). When determining fair value, we consider the principal or most advantageous market in which we would transact, and we consider only those assumptions we believe a typical market participant would consider when pricing an asset or liability. In measuring fair value, we use the following inputs in the order of priority indicated:
Level 1 - Quoted prices in active markets for identical assets or liabilities.
Level 2 - Observable inputs other than quoted prices in active markets included in Level 1, such as (i) quoted prices for similar assets or liabilities; (ii) quoted prices in markets that have insufficient volume or infrequent transactions (e.g., less active markets); and (iii) model-driven valuations in which all significant inputs are observable or can be derived principally from, or corroborated with, observable market data for substantially the full term of the asset or liability.
JACOBS ENGINEERING GROUP INC. AND SUBSIDIARIES
NOTES TO CONSOLIDATED FINANCIAL STATEMENTS - (Continued)
Level 3 - Unobservable inputs to the valuation methodology that are significant to the fair value measurement.
The net carrying amounts of cash and cash equivalents, trade receivables and payables and short-term debt approximate fair value due to the short-term nature of these instruments. See Note 9- Borrowings for a discussion of the fair value of long-term debt.
Certain other assets and liabilities, such as forward contracts and interest rate swap agreements we purchased as cash-flow hedges discussed in Note 17- Commitments and Contingencies and Derivative Financial Instruments and the Company's investment in Worley ordinary shares discussed in Note 15- Sale of Energy, Chemicals and Resources are required to be carried in our Consolidated Financial Statements at Fair Value.
The fair value of the Company’s reporting units (used for purposes of determining whether there is an indication of possible impairment of the carrying value of goodwill) is determined using an income and market approach. Both approaches require us to make certain estimates and judgments. Under the income approach, fair value is determined by using the discounted cash flows of our reporting units. Under the market approach, the fair values of our reporting units are determined by reference to guideline companies that are reasonably comparable to our reporting units; the fair values are estimated based on the valuation multiples of the invested capital associated with the guideline companies. In assessing whether there is an indication that the carrying value of goodwill has been impaired, we utilize the results of both valuation techniques and consider the range of fair values indicated.
With respect to equity-based compensation (i.e., share-based payments), we estimate the fair value of stock options granted to employees and directors using the Black-Scholes option-pricing model. Like all option-pricing models, the Black-Scholes model requires the use of subjective assumptions including (i) the expected volatility of the market price of the underlying stock, and (ii) the expected term of the award, among others. Accordingly, changes in assumptions and any subsequent adjustments to those assumptions can cause different fair values to be assigned to our future stock option awards. For restricted stock awards (including restricted stock units) containing market conditions, compensation expense is based on the fair value of such awards using a Monte Carlo simulation. For restricted stock awards (including restricted stock units) containing service and performance conditions, compensation expense is based on the closing stock price on the date of grant.
The fair values of the assets owned by the various pension plans that the Company sponsors are determined based on the type of asset, consistent with U.S. GAAP. Equity securities are valued by using market observable data such as quoted prices. Publicly traded corporate equity securities are valued at the last reported sale price on the last business day of the year. Securities not traded on the last business day are valued at the last reported bid price. Fixed income investment funds categorized as Level 2 are valued by the trustee using pricing models that use verifiable observable market data (e.g., interest rates and yield curves observable at commonly quoted intervals), bids provided by brokers or dealers, or quoted prices of securities with similar characteristics. Real estate consists primarily of common or collective trusts, with underlying investments in real estate. These investments are valued using the best information available, including quoted market price, market prices for similar assets when available, internal cash flow estimates discounted at an appropriate interest rate, or independent appraisals, as appropriate. Management values insurance contracts and hedge funds using actuarial assumptions and certain values reported by fund managers.
The methodologies described above and elsewhere in these Notes to Consolidated Financial Statements may produce a fair value measure that may not be indicative of net realizable value or reflective of future fair values. Furthermore, while the Company believes its valuation methods are appropriate and consistent with other market participants, the use of different methodologies or assumptions to determine the fair value of certain financial instruments could result in a different fair value measurement.
Cash Equivalents
We consider all highly liquid investments with original maturities of less than three months to be cash equivalents. Cash equivalents at October 2, 2020 and September 27, 2019 consisted primarily of money market mutual funds and overnight bank deposits.
Receivables, Contract Assets and Contract Liabilities
Receivables include amounts billed, net and unbilled receivables. Amounts billed, net consist of amounts invoiced to clients in accordance with the terms of our client contracts and are shown net of an allowance for doubtful accounts. We anticipate that substantially all of such billed amounts will be collected over the next twelve months.
JACOBS ENGINEERING GROUP INC. AND SUBSIDIARIES
NOTES TO CONSOLIDATED FINANCIAL STATEMENTS - (Continued)
Unbilled receivables and other, which represent an unconditional right to payment subject only to the passage of time in connection with our client contracts, are reclassified to amounts billed when they are billed under the terms of the contract. Prior to adoption of ASC 606, receivables related to contractual milestones or achievement of performance-based targets were included in unbilled receivables. These are now included in contract assets. We anticipate that substantially all of such unbilled amounts will be billed and collected over the next twelve months.
Contract assets represent unbilled amounts where the right to payment is subject to more than merely the passage of time and includes performance-based incentives and services provided ahead of agreed contractual milestones. Contract assets are transferred to unbilled receivables when the right to consideration becomes unconditional and are transferred to amounts billed upon invoicing.
Contract liabilities represent amounts billed to clients in excess of revenue recognized to date. We anticipate that substantially all such amounts will be earned over the next twelve months.
In order to manage short-term liquidity and credit exposure, Jacobs may sell current customer receivables to third parties. When Jacobs sells customer receivables to third parties it accelerates the receipt of cash that would otherwise have been collected from customers and records these transactions as reductions to the receivable amounts. Jacobs does not maintain continuing involvement in these arrangements.
Property, Equipment, and Improvements
Property, equipment and improvements are carried at cost, and are shown net of accumulated depreciation and amortization in the accompanying Consolidated Balance Sheets. Depreciation and amortization is computed primarily by using the straight-line method over the estimated useful lives of the assets. The cost of leasehold improvements is amortized using the straight-line method over the lesser of the estimated useful life of the asset or the remaining term of the related lease. Estimated useful lives range from 20 to 40 years for buildings, from 3 to 10 years for equipment and from 4 to 10 years for leasehold improvements.
Goodwill and Other Intangible Assets
Goodwill represents the excess of the cost of an acquired business over the fair value of the net tangible and intangible assets acquired. Goodwill and intangible assets with indefinite lives are not amortized; instead, on an annual basis we test goodwill and intangible assets with indefinite lives for possible impairment. Intangible assets with finite lives are amortized on a straight-line basis over the useful lives of those assets.
Interim testing for impairment is performed if indicators of potential impairment exist. For purposes of impairment testing, goodwill is assigned to the applicable reporting units based on the current reporting structure. We have determined that our operating segments are also our reporting units based on management’s conclusion that the components comprising each of our operating segments share similar economic characteristics and meet the aggregation criteria in accordance with ASC 350.
When testing goodwill for impairment quantitatively, the Company first compares the fair value of each reporting unit with its carrying amount. If the carrying amount of a reporting unit exceeds its fair value, a second step is performed to measure the amount of potential impairment. In the second step, the Company compared the implied fair value of the reporting unit goodwill with the carrying amount of the reporting unit's goodwill. If the carrying amount of reporting unit goodwill exceeds the implied fair value of that goodwill, an impairment loss is recognized. During 2020, we completed our annual goodwill impairment test and quantitatively determined that none of our goodwill was impaired. We have determined that the fair value of our reporting units substantially exceeded their respective carrying values for the Consolidated Balance Sheets presented.
Impairment of Long-Lived Assets
Our long-lived assets other than goodwill principally consist of right-of-use lease assets, property, equipment and improvements, and finite-lived intangible assets. These long-lived assets are evaluated for impairment for each of our asset groups in accordance with ASC 360 by first identifying whether indicators of impairment exist. If such indicators are present, we assess long-lived asset groups for recoverability based on estimated future undiscounted cash flows. For asset groups where the recoverability test fails, the fair value of each asset group is then estimated and compared to its carrying amount. An impairment loss is recognized for the amount by which an asset group’s carrying value exceeds its fair value.
JACOBS ENGINEERING GROUP INC. AND SUBSIDIARIES
NOTES TO CONSOLIDATED FINANCIAL STATEMENTS - (Continued)
Foreign Currencies
In preparing our Consolidated Financial Statements, it is necessary to translate the financial statements of our subsidiaries operating outside the U.S., which are denominated in currencies other than the U.S. dollar, into the U.S. dollar. In accordance with U.S. GAAP, revenues and expenses of operations outside the U.S. are translated into U.S. dollars using weighted-average exchange rates for the applicable periods being translated while the assets and liabilities of operations outside the U.S. are generally translated into U.S. dollars using period-end exchange rates. The net effect of foreign currency translation adjustments is included in stockholders’ equity as a component of accumulated other comprehensive income (loss) in the accompanying Consolidated Balance Sheets.
Share-Based Payments
We measure the value of services received from employees and directors in exchange for an award of an equity instrument based on the grant-date fair value of the award. The computed value is recognized as a non-cash cost on a straight-line basis over the period the individual provides services, which is typically the vesting period of the award with the exception of awards containing an internal performance measure, such as Earnings Per Share growth and Return on Invested Capital, which is recognized on a straight-line basis over the vesting period subject to the probability of meeting the performance requirements and adjusted for the number of shares expected to be earned. The cost of these awards is recorded in selling, general and administrative expense in the accompanying Consolidated Statements of Earnings.
Concentrations of Credit Risk
Our cash balances and cash equivalents are maintained in accounts held by major banks and financial institutions located in North America, South America, Europe, the Middle East, India, Australia, Africa and Asia. In the normal course of business, and consistent with industry practices, we grant credit to our clients without requiring collateral. Concentrations of credit risk is the risk that, if we extend a significant amount of credit to clients in a specific geographic area or industry, we may experience disproportionately high levels of default if those clients are adversely affected by factors particular to their geographic area or industry. Concentrations of credit risk relative to trade receivables are limited due to our diverse client base, which includes the U.S. federal government and multi-national corporations operating in a broad range of industries and geographic areas. Additionally, in order to mitigate credit risk, we continually evaluate the credit worthiness of our major commercial clients.
Leases
On September 28, 2019 the Company adopted ASU 2016-02, Leases ("ASC 842"), along with ASU 2018-01, ASU 2018-10, ASU 2018-11, ASU 2018-20 and ASU 2019-01, which amended and clarified the related guidance. ASC 842 requires lessees to recognize assets and liabilities for most leases. The Company determines if an arrangement is a lease at contract inception. A lease exists when a contract conveys to the customer the right to control the use of an identified asset for a period of time in exchange for consideration. The definition of a lease embodies two conditions: (1) there is an identified asset in the contract, and (2) the customer has the right to control the use of the identified asset. Lessees are required to classify leases as either finance or operating leases. This classification will determine whether lease expense is recognized based on an effective interest method or on a straight-line basis over the term of the lease.
ASC 842 provided several optional practical expedients for use in transition to and ongoing application of ASC 842. The Company elected to utilize the package of practical expedients in ASC 842-10-65-1(f) that, upon adoption of ASC 842, allows entities to (1) not reassess whether any expired or existing contracts are or contain leases, (2) retain the classification of leases (e.g., operating or finance lease) existing as of the date of adoption and (3) not reassess initial direct costs for any existing leases. The Company did not elect the practical expedient pertaining to the use of hindsight. The Company elected to utilize the practical expedient in ASC 842-10-15-37 in which the Company has chosen to account for each separate lease component of a contract and its associated non-lease components as a single lease component.
The Company adopted ASC 842 using the modified retrospective method, and accordingly, the new guidance was applied to leases that existed as of September 28, 2019 (the date of initial application) without adjusting the comparative periods presented. As a result, as of September 28, 2019, the Company has recorded total right-of-use ("ROU") assets of $767.0 million, which is comprised of approximately $82.3 million in reclassifications of previously recorded lease incentives and deferred rent, offset by $141.4 million in restructured lease cease-use liability.
JACOBS ENGINEERING GROUP INC. AND SUBSIDIARIES
NOTES TO CONSOLIDATED FINANCIAL STATEMENTS - (Continued)
Additionally, the Company has recorded total current lease liabilities of $180.7 million, and total noncurrent lease liabilities of $810.1 million. The adoption of ASC 842 did not have a material impact on the Company’s results of operations or any impact on the Company’s cash flows.
The Company’s right-of use assets and lease liabilities relate to real estate, project assets used in connection with long-term construction contracts, IT assets and vehicles. The Company’s leases have remaining lease terms of one year to thirteen years. The Company’s lease obligations are primarily for the use of office space and are primarily operating leases. Certain of the Company’s leases contain renewal, extension, or termination options. The Company assesses each option on an individual basis and will only include options reasonably certain of exercise in the lease term. The Company generally considers the base term to be the term provided in the contract. None of the Company’s lease agreements contain material options to purchase the leased property, material residual value guarantees, or material restrictions or covenants.
Long-term project asset and vehicle leases (leases with terms greater than twelve months), along with all real estate and IT asset leases, are recorded on the consolidated balance sheet at the present value of the minimum lease payments not yet paid. Because the Company primarily acts as a lessee and the rates implicit in its leases are not readily determinable, the Company generally uses its incremental borrowing rate on the lease commencement date to calculate the present value of future lease payments. Certain leases include payments that are based solely on an index or rate. These variable lease payments are included in the calculation of the ROU asset and lease liability and are initially measured using the index or rate at the lease commencement date. Other variable lease payments, such as payments based on use and for property taxes, insurance, or common area maintenance that are based on actual assessments are excluded from the ROU asset and lease liability and are expensed as incurred. In addition to the present value of the future lease payments, the calculation of the ROU asset also includes any deferred rent, lease pre-payments and initial direct costs of obtaining the lease, such as commissions.
Certain lease contracts contain nonlease components such as maintenance and utilities. The Company has made an accounting policy election, as allowed under ASC 842-10-15-37 and discussed above, to capitalize both the lease component and nonlease components of its contracts as a single lease component for all of its right-of-use assets.
Short-term project asset and vehicle leases (project asset and vehicle leases with an initial term of twelve months or less or leases that are cancellable by the lessee and lessor without significant penalties) are not recorded on the consolidated balance sheet and are expensed on a straight-line basis over the lease term. The majority of the Company’s short-term leases relate to equipment used on construction projects. These leases are entered into at agreed upon hourly, daily, weekly or monthly rental rates for an unspecified duration and typically have a termination for convenience provision. Such equipment leases are considered short-term in nature unless it is reasonably certain that the equipment will be leased for a term greater than twelve months.
Pensions
We use certain assumptions and estimates in order to calculate periodic pension cost and the value of the assets and liabilities of our pension plans. These assumptions involve discount rates, investment returns and projected salary increases, among others. Changes in the actuarial assumptions may have a material effect on the plans’ liabilities and the projected pension expense.
We use a corridor approach to amortize actuarial gains and losses. Under this approach, net gains or losses in excess of ten percent of the larger of the pension benefit obligation or the market-related value of the assets are amortized on a straight-line basis. The period of amortization is the average remaining service of active participants who are expected to receive benefits under certain plans and the average remaining future lifetime of plan participants for certain plans.
We measure our defined benefit plan assets and obligations as of the end of the month closest to their fiscal year end, which is September 30, 2020 as the alternative measurement date in accordance with FASB guidance ASU 2015-04, Compensation Retirement Benefit (Topic 715): Practical Expedient for the Measurement Date of an Employer’s Defined Benefit Obligation and Plan Asset. This guidance allows employers with fiscal year ends that do not coincide with a calendar month end to make an accounting policy election to measure defined benefit plan assets and obligations as of the end of the month closest to their fiscal year end.
JACOBS ENGINEERING GROUP INC. AND SUBSIDIARIES
NOTES TO CONSOLIDATED FINANCIAL STATEMENTS - (Continued)
Income Taxes
We determine our consolidated income tax expense using the asset and liability method prescribed by U.S. GAAP. Under this method, deferred tax assets and liabilities are recognized for the temporary differences between the carrying amounts of assets and liabilities for financial reporting purposes and income tax purposes. Such deferred tax assets and liabilities are adjusted, as appropriate, to reflect changes in tax rates expected to be in effect when the temporary differences reverse. If and when we determine that a deferred tax asset will not be realized for its full amount, we will recognize and record a valuation allowance with a corresponding charge to earnings. Judgment is required in determining our provision for income taxes. In the normal course of business, we may engage in numerous transactions every day for which the ultimate tax outcome (including the period in which the transaction will ultimately be included in taxable income or deducted as an expense) is uncertain. Additionally, we file income, franchise, gross receipts and similar tax returns in many jurisdictions. Our tax returns are subject to audit and investigation by the Internal Revenue Service, most states in the U.S., and by various government agencies representing many jurisdictions outside the U.S.
Contractual Guarantees, Litigation, Investigations and Insurance
In the normal course of business we are subject to certain contractual guarantees and litigation. We record in the Consolidated Balance Sheets amounts representing our estimated liability relating to such guarantees, litigation and insurance claims. Guarantees are accounted for in accordance with ASC 460-10, Guarantees, at fair value at the inception of the guarantee. We perform an analysis to determine the level of reserves to establish for both insurance-related claims that are known and have been asserted against us as well as for insurance-related claims that are believed to have been incurred based on actuarial analysis, but have not yet been reported to our claims administrators as of the respective balance sheet dates. We include any adjustments to such insurance reserves in our Consolidated Statements of Earnings. In addition, as a contractor providing services to various agencies of the U.S. federal government, we are subject to many levels of audits, investigations, and claims by, or on behalf of, the U.S. federal government with respect to contract performance, pricing, costs, cost allocations and procurement practices. We adjust revenues based upon the amounts we expect to realize considering the effects of any client audits or governmental investigations.
Business Combinations
U.S. GAAP requires that the purchase price paid for business combinations accounted for using the acquisition method be allocated to the assets and liabilities acquired based on their respective Fair Values. Determining the Fair Value of contract assets and liabilities acquired often requires estimates and judgments regarding, among other things, the estimated cost to complete such contracts. The Company must also make certain estimates and judgments relating to other assets and liabilities acquired as well as any identifiable intangible assets acquired.
Use of Estimates and Assumptions
The preparation of financial statements in conformity with U.S. GAAP requires us to employ estimates and make assumptions that affect the reported amounts of certain assets and liabilities; the revenues and expenses reported for the periods covered by the financial statements; and certain amounts disclosed in these Notes to the Consolidated Financial Statements. Although such estimates and assumptions are based on management’s most recent assessment of the underlying facts and circumstances utilizing the most current information available and past experience, actual results could differ significantly from those estimates and assumptions. Our estimates, judgments and assumptions are evaluated periodically and adjusted accordingly.
New Accounting Pronouncements
ASU 2017-04, Simplifying the Test for Goodwill Impairment, is effective for fiscal years beginning after December 15, 2019 with early adoption permitted. ASU 2017-04 removes the second step of the goodwill impairment test, which requires a hypothetical purchase price allocation. An entity will now recognize a goodwill impairment charge for the amount by which a reporting unit's carrying value exceeds its fair value, not to exceed the amount of goodwill allocated to the reporting unit. Management does not expect the adoption of ASU 2017-04 to have any impact on the Company's financial position, results of operations or cash flows.
JACOBS ENGINEERING GROUP INC. AND SUBSIDIARIES
NOTES TO CONSOLIDATED FINANCIAL STATEMENTS - (Continued)
ASU No. 2016-13, Financial Instruments - Credit Losses (Topic 326): Measurement of Credit Losses on Financial Instruments requires entities to use a current lifetime expected credit loss methodology to measure impairments of certain financial assets. Using this methodology will result in earlier recognition of losses than under the current incurred loss approach, which requires waiting to recognize a loss until it is probable of having been incurred. There are other provisions within the standard that affect how impairments of other financial assets may be recorded and presented, and that expand disclosures. This standard will be effective for our interim and annual periods beginning with the first quarter of fiscal 2021, and must be applied on a modified retrospective basis. Management does not expect the adoption of ASU 326 to have a material impact on the Company's financial position, results of operations or cash flows.
JACOBS ENGINEERING GROUP INC. AND SUBSIDIARIES
NOTES TO CONSOLIDATED FINANCIAL STATEMENTS - (Continued)
3. Revenue Accounting for Contracts
Disaggregation of Revenues
Our revenues are principally derived from contracts to provide a diverse range of technical, professional, and construction services to a large number of industrial, commercial, and governmental clients. We provide a broad range of engineering, design, and architectural services; construction and construction management services; operations and maintenance services; and process, scientific, and systems consulting services. We provide our services through offices and subsidiaries located primarily in North America, South America, Europe, the Middle East, India, Australia, Africa, and Asia. We provide our services under cost-reimbursable and fixed-price contracts. Our contracts are with many different customers in numerous industries. Refer to Note 19- Segment Information for additional information on how we disaggregate our revenues by reportable segment.
The following table further disaggregates our revenue by geographic area for the years ended October 2, 2020, September 27, 2019 and September 28, 2018 (in thousands):
| | | | | | | | | | | | | | | | | |
| For the Years Ended |
| October 2, 2020 | | September 27, 2019 | | September 28, 2018 |
| Revenues: | | | | | |
| United States | $ | 10,158,508 | | | $ | 9,006,730 | | | $ | 6,908,988 | |
| Europe | 2,253,284 | | | 2,242,976 | | | 2,495,805 | |
| Canada | 227,067 | | | 213,172 | | | 189,865 | |
| Asia | 117,698 | | | 195,023 | | | 163,761 | |
| India | 50,618 | | | 62,543 | | | 52,533 | |
| Australia and New Zealand | 537,076 | | | 533,251 | | | 578,108 | |
| South America and Mexico | 11 | | | 7,416 | | | 17,656 | |
| Middle East and Africa | 222,713 | | | 476,757 | | | 173,057 | |
| Total | $ | 13,566,975 | | | $ | 12,737,868 | | | $ | 10,579,773 | |
The following table presents the revenues earned directly or indirectly from the U.S. federal government and its agencies, expressed as a percentage of total revenues:
| | | | | | | | | | | | | | |
| For the Years Ended |
| October 2, 2020 | | September 27, 2019 | | September 28, 2018 |
| 33% | | 27% | | 32% |
Contract Liabilities
Contract liabilities represent amounts billed to clients in excess of revenue recognized to date. Revenue recognized for the year ended October 2, 2020 that was included in the contract liability balance on September 27, 2019 was $410.0 million. Revenue recognized for the year ended September 27, 2019 that was included in the contract liability balance on September 28, 2018 was $350.3 million.
Remaining Performance Obligations
The Company’s remaining performance obligations as of October 2, 2020 represent a measure of the total dollar value of work to be performed on contracts awarded and in progress. The Company had approximately $14.6 billion in remaining performance obligations as of October 2, 2020. The Company expects to recognize 50% of our remaining performance obligations within the next twelve months and the remaining 50% thereafter.
Although remaining performance obligations reflect business that is considered to be firm, cancellations, scope adjustments, foreign currency exchange fluctuations or project deferrals may occur that impact their volume or the expected timing of their recognition. Remaining performance obligations are adjusted to reflect any known project
JACOBS ENGINEERING GROUP INC. AND SUBSIDIARIES
NOTES TO CONSOLIDATED FINANCIAL STATEMENTS - (Continued)
cancellations, revisions to project scope and cost, foreign currency exchange fluctuations and project deferrals, as appropriate.
4. Earnings Per Share and Certain Related Information
Basic and Diluted Earnings Per Share
Basic and diluted earnings per share (“EPS”) are computed using the two-class method, which is an earnings allocation method that determines EPS for common shares and participating securities. The undistributed earnings are allocated between common shares and participating securities as if all earnings had been distributed during the period. Participating securities and common shares have equal rights to undistributed earnings. Net earnings used for the purpose of determining basic and diluted EPS is determined by taking net earnings, less earnings available to participating securities.
JACOBS ENGINEERING GROUP INC. AND SUBSIDIARIES
NOTES TO CONSOLIDATED FINANCIAL STATEMENTS - (Continued)
The following table reconciles the denominator used to compute basic EPS to the denominator used to compute diluted EPS for the years ended October 2, 2020, September 27, 2019 and September 28, 2018 (in thousands):
| | | | | | | | | | | | | | | | | |
| For the Years Ended |
| October 2, 2020 | | September 27, 2019 | | September 28, 2018 |
| Numerator for Basic and Diluted EPS: | | | | | |
| Net earnings (loss) attributable to Jacobs from continuing operations | $ | 353,861 | | | $ | 290,960 | | | $ | (4,185) | |
| Net earnings from continuing operations allocated to participating securities | (72) | | | (415) | | | — | |
| Net earnings (loss) from continuing operations allocated to common stock for EPS calculation | $ | 353,789 | | | $ | 290,545 | | | $ | (4,185) | |
| | | | | |
| Net earnings attributable to Jacobs from discontinued operations | $ | 137,984 | | | $ | 557,019 | | | $ | 167,616 | |
| Net earnings from discontinued operations allocated to participating securities | (28) | | | (795) | | | (808) | |
| Net earnings from discontinued operations allocated to common stock for EPS calculation | $ | 137,956 | | | $ | 556,224 | | | $ | 166,808 | |
| | | | | |
| Net earnings allocated to common stock for EPS calculation | $ | 491,745 | | | $ | 846,769 | | | $ | 162,623 | |
| | | | | |
| Denominator for Basic and Diluted EPS: | | | | | |
| Weighted average basic shares | 131,541 | | | 138,104 | | | 138,182 | |
| Shares allocated to participating securities | (27) | | | (197) | | | (646) | |
| Shares used for calculating basic EPS attributable to common stock | 131,514 | | | 137,907 | | | 137,536 | |
| | | | | |
| Effect of dilutive securities: | | | | | |
| Stock compensation plans (1) | 1,207 | | | 1,299 | | | — | |
| Shares used for calculating diluted EPS attributable to common stock | 132,721 | | | 139,206 | | | 137,536 | |
| | | | | |
| Net Earnings Per Share: | | | | | |
| Basic Net Earnings (Loss) from Continuing Operations Per Share | $ | 2.69 | | | $ | 2.11 | | | $ | (0.03) | |
| Basic Net Earnings from Discontinued Operations Per Share | $ | 1.05 | | | $ | 4.03 | | | $ | 1.21 | |
| Basic EPS | $ | 3.74 | | | $ | 6.14 | | | $ | 1.18 | |
| Diluted Net Earnings (Loss) from Continuing Operations Per Share | $ | 2.67 | | | $ | 2.09 | | | $ | (0.03) | |
| Diluted Net Earnings from Discontinued Operations Per Share | $ | 1.04 | | | $ | 4.00 | | | $ | 1.21 | |
| Diluted EPS | $ | 3.71 | | | $ | 6.08 | | | $ | 1.18 | |
(1) For the fiscal 2018 period, because net earnings (loss) from continuing operations was a loss, the effect of antidilutive securities of 1,176 was excluded from the denominator in calculating diluted EPS.
JACOBS ENGINEERING GROUP INC. AND SUBSIDIARIES
NOTES TO CONSOLIDATED FINANCIAL STATEMENTS - (Continued)
Share Repurchases
On January 17, 2019, the Company’s Board of Directors authorized a share repurchase program of up to $1.0 billion of the Company’s common stock, to expire on January 16, 2022 (the "2019 Repurchase Authorization"). During fiscal 2019, the Company launched accelerated share repurchase programs by advancing a total of $500 million to two financial institutions in privately negotiated transactions (collectively, the "2019 ASR Programs"). The specific number of shares that the Company repurchased under the 2019 ASR Programs was determined based generally on a discount to the volume-weighted average price per share of the Company's common stock during a calculation period which ended on June 5, 2019 for the first $250 million in repurchases and on December 4, 2019 for the second $250 million in repurchases. The purchases were recorded as share retirements for purposes of calculating earnings per share.
The following table summarizes the activity under the 2019 Repurchase Authorization during fiscal 2020:
| | | | | | | | | | | | | | | | | | | | |
Amount Authorized
(2019 Repurchase Authorization) | | Average Price Per Share (1) | | Shares Repurchased | | Total Shares Retired |
| $1,000,000,000 | | $81.68 | | 4,129,003 | | 4,129,003 |
(1)Includes commissions paid and calculated at the average price per share
As a precautionary measure in light of the COVID-19 pandemic, the Company temporarily suspended purchases under the share repurchase plan in March 2020, with such suspension remaining in effect through the fiscal third quarter of 2020. During the fourth fiscal quarter of 2020, the Company resumed share repurchases on a limited basis. As of October 2, 2020, the Company has $57.9 million remaining under the 2019 Repurchase Authorization.
On January 16, 2020, the Company’s Board of Directors authorized an additional share repurchase program of up to $1.0 billion of the Company’s common stock, to expire on January 15, 2023 (the "2020 Repurchase Authorization"). There have been no repurchases under the 2020 Repurchase Authorization as of October 2, 2020.
The share repurchase programs do not obligate the Company to purchase any shares. Share repurchases may be executed through various means including, without limitation, accelerated share repurchases, open market transactions, privately negotiated transactions, purchases pursuant to a Rule 10b5-1 plan or otherwise. The authorization for the share repurchase programs may be terminated, increased or decreased by the Company’s Board of Directors in its discretion at any time. The timing, amount and manner of share repurchases may depend upon market conditions and economic circumstances, availability of investment opportunities, the availability and costs of financing, currency fluctuations, the market price of the Company's common stock, other uses of capital and other factors.
Common and Preferred Stock
Jacobs is authorized to issue two classes of capital stock designated “common stock” and “preferred stock” (each has a par value of $1.00 per share). The preferred stock may be issued in one or more series. The number of shares to be included in a series as well as each series’ designation, relative powers, dividend and other preferences, rights and qualifications, redemption provisions and restrictions are to be fixed by the Company’s Board of Directors at the time each series is issued. Except as may be provided by the Company’s Board of Directors in a preferred stock designation, or otherwise provided for by statute, the holders of shares of common stock have the exclusive right to vote for the election of directors and on all other matters requiring stockholder action. The holders of shares of common stock are entitled to dividends if and when declared by the Company’s Board of Directors from whatever assets are legally available for that purpose.
Dividends
On September 17, 2020, the Company’s Board of Directors declared a quarterly dividend of $0.19 per share of the Company’s common stock which was paid on October 30, 2020, to shareholders of record on the close of business on October 2, 2020. Future dividend declarations are subject to review and approval by the Company’s Board of Directors. Dividends paid through October 2, 2020 and the preceding fiscal year are as follows:
JACOBS ENGINEERING GROUP INC. AND SUBSIDIARIES
NOTES TO CONSOLIDATED FINANCIAL STATEMENTS - (Continued)
| | | | | | | | | | | | | | | | | | | | |
| Declaration Date | | Record Date | | Payment Date | | Cash Amount (per share) |
| July 9, 2020 | | July 24, 2020 | | August 21, 2020 | | $0.19 |
| May 5, 2020 | | May 20, 2020 | | June 17, 2020 | | $0.19 |
| January 16, 2020 | | January 31, 2020 | | February 28, 2020 | | $0.19 |
| September 19, 2019 | | October 4, 2019 | | November 1, 2019 | | $0.17 |
| July 11, 2019 | | July 26, 2019 | | August 23, 2019 | | $0.17 |
| May 2, 2019 | | May 17, 2019 | | June 14, 2019 | | $0.17 |
| January 17, 2019 | | February 15, 2019 | | March 15, 2019 | | $0.17 |
| | | | | | |
5. Goodwill and Intangibles
The carrying value of goodwill associated with continuing operations and appearing in the accompanying Consolidated Balance Sheets October 2, 2020 and September 27, 2019 was as follows (in millions):
| | | | | | | | | | | | | | | | | |
| Critical Mission Solutions | | People & Places Solutions | | Total |
| Balance September 27, 2019 | $ | 2,202 | | | $ | 3,231 | | | $ | 5,433 | |
| Acquired | 206 | | | — | | | 206 | |
| Post-Acquisition Adjustments | 2 | | | — | | | 2 | |
| Disposed | — | | | (6) | | | (6) | |
| Foreign Exchange Impact | (1) | | | 5 | | | 4 | |
| Balance October 2, 2020 | $ | 2,409 | | | $ | 3,230 | | | $ | 5,639 | |
The following table provides a roll-forward of the Company’s acquired intangibles in the accompanying Consolidated Balance Sheets for the year ended October 2, 2020 (in thousands):
| | | | | | | | | | | | | | | | | | | | | | | | | | | | | | | |
| | Customer Relationships, Contracts and Backlog | | Developed Technology | | Trade Names | | | | Other | | Total |
| Balances, September 27, 2019 | $ | 622,392 | | | $ | 40,833 | | | $ | 1,183 | | | | | $ | 668 | | | $ | 665,076 | |
| Acquired | 73,558 | | | 6,452 | | | — | | | | | — | | | 80,010 | |
| Transfer to lease right-of-use asset as a result of adoption of ASC 842 | — | | | — | | | — | | | | | (668) | | | (668) | |
| Amortization | (86,401) | | | (3,734) | | | (428) | | | | | — | | | (90,563) | |
| Foreign currency translation | 4,496 | | | 21 | | | (32) | | | | | — | | | 4,485 | |
| Balances, October 2, 2020 | $ | 614,045 | | | $ | 43,572 | | | $ | 723 | | | | | $ | — | | | $ | 658,340 | |
| Weighted Average Amortization Period (years) | 8 | | 11 | | 10 | | | | — | | | 8 |
The weighted average amortization period includes the effects of foreign currency translation.
The following table presents estimated amortization expense of intangible assets for fiscal 2021 and for the succeeding years. The amounts below include preliminary amortization estimates for the Wood Group opening balance sheet fair values that are still preliminary and are subject to change.
JACOBS ENGINEERING GROUP INC. AND SUBSIDIARIES
NOTES TO CONSOLIDATED FINANCIAL STATEMENTS - (Continued)
| | | | | | | | |
| Fiscal Year | | (in millions) |
| 2021 | | $ | 90.7 | |
| 2022 | | 89.7 | |
| 2023 | | 89.4 | |
| 2024 | | 89.2 | |
| 2025 | | 88.8 | |
| Thereafter | | 210.5 | |
| Total | | $ | 658.3 | |
JACOBS ENGINEERING GROUP INC. AND SUBSIDIARIES
NOTES TO CONSOLIDATED FINANCIAL STATEMENTS - (Continued)
6. Other Financial Information
Receivables and contract assets
The following table presents the components of receivables appearing in the accompanying Consolidated Balance Sheets at October 2, 2020 and September 27, 2019 as well as certain other related information (in thousands):
| | | | | | | | | | | |
| | October 2, 2020 | | September 27, 2019 |
| Components of receivables: | | | |
| Amounts billed, net | $ | 1,294,204 | | | $ | 1,222,339 | |
| Unbilled receivables and other | 1,449,184 | | | 1,216,028 | |
| Contract assets | 423,922 | | | 401,842 | |
| Total receivables and contract assets, net | $ | 3,167,310 | | | $ | 2,840,209 | |
| Other information about receivables: | | | |
| Amounts due from the United States federal government included above, net of advanced billings | $ | 600,207 | | | $ | 630,975 | |
Property, Equipment and Improvements, Net
The following table presents the components of our property, equipment and improvements, net at October 2, 2020 and September 27, 2019 (in thousands):
| | | | | | | | | | | |
| | October 2, 2020 | | September 27, 2019 |
| Land | $ | 966 | | | $ | 355 | |
| Buildings | 21,550 | | | 14,331 | |
| Equipment | 560,352 | | | 533,804 | |
| Leasehold improvements | 187,980 | | | 247,660 | |
| Construction in progress | 16,410 | | | 8,781 | |
| | 787,258 | | | 804,931 | |
| Accumulated depreciation and amortization | (467,887) | | | (496,788) | |
| | $ | 319,371 | | | $ | 308,143 | |
JACOBS ENGINEERING GROUP INC. AND SUBSIDIARIES
NOTES TO CONSOLIDATED FINANCIAL STATEMENTS - (Continued)
The following table presents our property, equipment and improvements, net by geographic area for the years ended October 2, 2020 and September 27, 2019 (in thousands):
| | | | | | | | | | | |
| For the Years Ended |
| October 2, 2020 | | September 27, 2019 |
| Property, equipment and improvements, net: | | | |
| United States | $ | 230,881 | | | $ | 230,476 | |
| Europe | 59,321 | | | 52,775 | |
| Canada | 2,599 | | | 3,199 | |
| Asia | 3,817 | | | 5,652 | |
| India | 10,710 | | | 2,379 | |
| Australia and New Zealand | 10,492 | | | 12,091 | |
| Middle East and Africa | 1,551 | | | 1,571 | |
| Total | $ | 319,371 | | | $ | 308,143 | |
See discussion in Note 10- Leases, regarding impairments recorded in the current year relating to the Company's real estate lease portfolio and related property, equipment and improvements, net.
Accrued Liabilities
The following table presents the components of “Accrued liabilities” shown in the accompanying Consolidated Balance Sheets at October 2, 2020 and September 27, 2019 (in thousands):
| | | | | | | | | | | |
| | October 2, 2020 | | September 27, 2019 |
| Accrued payroll and related liabilities | $ | 746,637 | | | $ | 677,313 | |
| Project-related accruals | 60,531 | | | 58,835 | |
| Non project-related accruals | 237,204 | | | 258,312 | |
| Insurance liabilities | 75,267 | | | 83,968 | |
| Sales and other similar taxes | 104,720 | | | 34,390 | |
| Deferred rent | — | | | 68,914 | |
| Dividends payable | 25,524 | | | 23,439 | |
| Deferred gain on ECR disposition (1) | — | | | 179,208 | |
| Current liabilities held for sale | — | | | 2,573 | |
| Total | $ | 1,249,883 | | | $ | 1,386,952 | |
(1) See Note 15- Sale of Energy, Chemicals and Resource ("ECR") Business for discussion regarding deferred gain.
JACOBS ENGINEERING GROUP INC. AND SUBSIDIARIES
NOTES TO CONSOLIDATED FINANCIAL STATEMENTS - (Continued)
Accumulated Other Comprehensive Income
The following table presents the Company's roll forward of accumulated income (loss) after-tax for the years ended October 2, 2020 and September 27, 2019 (in thousands):
| | | | | | | | | | | | | | | | | | | | | | | |
| Change in Pension and Retiree Medical Plan Liabilities | | Foreign Currency Translation Adjustment | | Gain/(Loss) on Cash Flow Hedges | | Total |
Balance at September 28, 2018 | $ | (309,867) | | | $ | (496,017) | | | $ | (819) | | | $ | (806,703) | |
| Other comprehensive income (loss) | (104,434) | | | (84,456) | | | 990 | | | (187,900) | |
| Reclassifications from other comprehensive income (loss) | (22,448) | | | 100,428 | | | (189) | | | 77,791 | |
Balance at September 27, 2019 | $ | (436,749) | | | $ | (480,045) | | | $ | (18) | | | $ | (916,812) | |
| Other comprehensive income (loss) | (61,994) | | | 60,330 | | | (17,569) | | | (19,233) | |
| Reclassifications from other comprehensive income (loss) | 17 | | | — | | | 2,971 | | | 2,988 | |
Balance at October 2, 2020 | $ | (498,726) | | | $ | (419,715) | | | $ | (14,616) | | | $ | (933,057) | |
JACOBS ENGINEERING GROUP INC. AND SUBSIDIARIES
NOTES TO CONSOLIDATED FINANCIAL STATEMENTS - (Continued)
7. Income Taxes
The following table presents the components of our consolidated income taxes for continuing operations for years ended October 2, 2020, September 27, 2019 and September 28, 2018 (in thousands):
| | | | | | | | | | | | | | | | | |
| | For the Years Ended |
| | October 2, 2020 | | September 27, 2019 | | September 28, 2018 |
| Current income tax (benefit) expense from continuing operations: | | | | | |
| Federal | $ | (37,030) | | | $ | 25,549 | | | $ | 49,829 | |
| State | (5,021) | | | 6,639 | | | (1,546) | |
| Foreign | 41,616 | | | 57,156 | | | 20,858 | |
| Total current tax expense from continuing operations | (435) | | | 89,344 | | | 69,141 | |
| Deferred income tax expense (benefit) from continuing operations: | | | | | |
| Federal | 53,485 | | | 6,607 | | | 230,358 | |
| State | 7,133 | | | 20,408 | | | 17,318 | |
| Foreign | (4,863) | | | (79,405) | | | 8,815 | |
| Total deferred tax expense (benefit) from continuing operations | 55,755 | | | (52,390) | | | 256,491 | |
| Consolidated income tax expense from continuing operations | $ | 55,320 | | | $ | 36,954 | | | $ | 325,632 | |
On December 22, 2017, the Tax Cuts and Jobs Act (the “Act”) was enacted in the United States and significantly revised the U.S. corporate income tax laws. Given the significance of the legislation, the SEC staff issued Staff Accounting Bulletin No. 118 (SAB 118), which allowed registrants to record provisional amounts during a one year “measurement period” like that used when accounting for business combinations. As of December 22, 2018, we completed our accounting for the tax effects of the enactment of the Act. For the deferred tax balances, we measured the U.S. deferred tax assets and liabilities based on the rates at which they are expected to reverse in the future, which is generally 21%. The Company’s revised measurement resulted in cumulative charges to income tax expense of $144.4 million during fiscal year 2018. Additionally, in fiscal year 2019, the Company recorded $24.4 million of tax expense associated with the valuation of U.S. net operating losses that were expected to be recovered at 35%, but were actually utilized at 21%.
The Act called for a one-time tax on deemed repatriation of foreign earnings. This one-time transition tax was based on our total post-1986 earnings and profits (E&P) of certain of our foreign subsidiaries. We recorded $14.3 million in cumulative transition taxes during the measurement period in fiscal year 2018, although the transition tax was expected to be offset by foreign tax credits in the future, resulting in no additional cash tax liability.
In fiscal 2018 the Company adopted ASU No 2018-02, Income Statement - Reporting Comprehensive Income (Topic 220): Reclassification of Certain Tax Effects from Accumulated Other Comprehensive Income. The guidance provides the option to reclassify to retained earnings tax effects related to items in accumulated other comprehensive income that the FASB refers to as having been stranded in accumulated other comprehensive income as a result of tax reform. As a result of adoption of ASU 2018-02, the Company reclassified $10.2 million in accumulated other comprehensive income to retained earnings relating to the fiscal 2018 year deferred tax activity for its U.S. pension plans resulting from the Act.
Deferred taxes reflect the tax effects of temporary differences between the amounts recorded as assets and liabilities for financial reporting purposes and the comparable amounts recorded for income tax purposes. Deferred tax assets and liabilities are measured using the enacted tax rates and laws that will be in effect when the differences are expected to reverse.
JACOBS ENGINEERING GROUP INC. AND SUBSIDIARIES
NOTES TO CONSOLIDATED FINANCIAL STATEMENTS - (Continued)
The following table presents the components of our net deferred tax assets at October 2, 2020 and September 27, 2019 (in thousands):
| | | | | | | | | | | |
| | October 2, 2020 | | September 27, 2019 |
| Deferred tax assets: | | | |
| Obligations relating to: | | | |
| Defined benefit pension plans | $ | 55,949 | | | $ | 56,854 | |
| Other employee benefit plans | 132,613 | | | 149,276 | |
| Net operating losses | 197,987 | | | 241,033 | |
| Foreign tax credit | 87,259 | | | 84,553 | |
| Other credits | 6,808 | | | 13,881 | |
| Contract revenues and costs | 70,733 | | | 51,579 | |
| Investments | 49,848 | | | 23,204 | |
| Lease liability | 154,979 | | | — | |
| Deferred rent | — | | | 21,847 | |
| Restructuring | 11,974 | | | 8,205 | |
| Valuation allowance | (140,578) | | | (153,257) | |
| Gross deferred tax assets | 627,572 | | | 497,175 | |
| Deferred tax liabilities: | | | |
| Depreciation and amortization | (240,097) | | | (177,002) | |
| Lease right of use asset | (89,824) | | | — | |
| Unremitted earnings | (17,295) | | | (29,761) | |
| Partnership investment | (66,082) | | | — | |
| Other, net | (6,593) | | | (8,890) | |
| Gross deferred tax liabilities | (419,891) | | | (215,653) | |
| Net deferred tax assets | $ | 207,681 | | | $ | 281,522 | |
A valuation allowance is recorded to reduce deferred tax assets to the amount that is more likely than not to be realized based on an assessment of positive and negative evidence, including estimates of future taxable income necessary to realize future deductible amounts. The valuation allowance was $140.6 million at October 2, 2020 and $153.3 million at September 27, 2019. Of the $12.7 million decrease in the valuation allowance, $15.1 million relates to a decrease for a change in judgment on the realizability of deferred tax assets in the U.K., which is offset by a $2.4 million increase attributable to current year activity.
At October 2, 2020 and September 27, 2019, the domestic and international net operating loss (NOL) carryforwards totaled $783.9 million and $945.1 million, resulting in an NOL deferred tax asset of $198.0 million and $241.0 million, respectively. The Company's net operating losses have various expiration periods between 2021 and indefinite periods. At October 2, 2020, the Company has foreign tax credit carryforwards of $87.3 million, expiring between 2022 and 2037.
The following table presents the income tax benefits from continuing operations realized from the exercise of non-qualified stock options and disqualifying dispositions of stock sold under our employee stock purchase plans for the years ended October 2, 2020, September 27, 2019 and September 28, 2018 (in millions):
| | | | | | | | | | | | | | |
| For the Years Ended |
| October 2, 2020 | | September 27, 2019 | | September 28, 2018 |
| $ | 10.2 | | | $ | 7.9 | | | $ | 2.2 | |
JACOBS ENGINEERING GROUP INC. AND SUBSIDIARIES
NOTES TO CONSOLIDATED FINANCIAL STATEMENTS - (Continued)
The following table reconciles total income tax expense from continuing operations using the statutory U.S. federal income tax rate to the consolidated income tax expense for continuing operations shown in the accompanying Consolidated Statements of Earnings for the years ended October 2, 2020, September 27, 2019 and September 28, 2018 (dollars in thousands):
| | | | | | | | | | | | | | | | | | | | | | | | | | | | | | | | | | | |
| | For the Years Ended |
| | October 2, 2020 | | % | | September 27, 2019 | | % | | September 28, 2018 | | % |
| Statutory amount | $ | 92,652 | | | 21.0 | % | | $ | 73,701 | | | 21.0 | % | | $ | 81,421 | | | 24.6 | % |
| State taxes, net of the federal benefit | 7,254 | | 1.6 | % | | 10,183 | | | 2.9 | % | | 15,772 | | | 4.8 | % |
| Exclusion of tax on non-controlling interests | (6,622) | | (1.5) | % | | (4,839) | | | (1.4) | % | | (2,389) | | | (0.7) | % |
| Foreign: | | | | | | | | | | | |
| Difference in tax rates of foreign operations | (6,267) | | (1.4) | % | | 1,083 | | | 0.3 | % | | 2,815 | | | 0.9 | % |
| Benefit from foreign valuation allowance release | (16,861) | | (3.8) | % | | (29,125) | | | (8.3) | % | | (5,088) | | | (1.5) | % |
| | | | | | | | | | | |
| U.S. tax cost (benefit) of foreign operations | 42,992 | | | 9.7 | % | | (17,760) | | | (5.1) | % | | 4,030 | | | 1.2 | % |
| Tax differential on foreign earnings | 19,864 | | | 4.5 | % | | (45,802) | | | (13.1) | % | | 1,757 | | | 0.6 | % |
| Foreign tax credits | (26,471) | | (6.0) | % | | (15,682) | | | (4.5) | % | | (21,735) | | | (6.6) | % |
| | | | | | | | | | | |
| Tax Rate Change | (6,811) | | | (1.5) | % | | — | | | — | | | — | | | — | |
| | | | | | | | | | | |
| Tax reform | — | | — | % | | 36,674 | | | 10.4 | % | | 155,756 | | | 47.1 | % |
| Valuation allowance | — | | — | % | | (207) | | | (0.1) | % | | 104,221 | | | 31.5 | % |
| Uncertain tax positions | (11,338) | | (2.6) | % | | (6,883) | | | (2.0) | % | | (1,402) | | | (0.4) | % |
| Other items: | | | | | | | | | | | |
| IRS §179D deduction | (7,267) | | (1.6) | % | | (2,957) | | | (0.8) | % | | (4,557) | | | (1.4) | % |
| Disallowed officer compensation | 5,081 | | 1.2 | % | | 5,568 | | | 1.6 | % | | 1,510 | | | 0.5 | % |
| Stock compensation | (10,234) | | (2.3) | % | | (7,864) | | | (2.2) | % | | (2,158) | | | (0.7) | % |
| | | | | | | | | | | |
| Other items – net | (788) | | (0.2) | % | | (4,938) | | | (1.4) | % | | (2,564) | | | (0.8) | % |
| Total other items | (13,208) | | (3.0) | % | | (10,191) | | | (2.8) | % | | (7,769) | | | (2.4) | % |
| Taxes on income from continuing operations | $ | 55,320 | | | 12.5 | % | | $ | 36,954 | | | 10.5 | % | | $ | 325,632 | | | 98.4 | % |
The following table presents income tax payments made during the years ended October 2, 2020, September 27, 2019 and September 28, 2018 (in millions):
| | | | | | | | | | | | | | |
| October 2, 2020 | | September 27, 2019 | | September 28, 2018 |
| $ | 39.8 | | | $ | 291.7 | | | $ | 44.3 | |
The following table presents the components of our consolidated earnings from continuing operations before taxes for the years ended October 2, 2020, September 27, 2019 and September 28, 2018 (in thousands):
| | | | | | | | | | | | | | | | | |
| | For the Years Ended |
| | October 2, 2020 | | September 27, 2019 | | September 28, 2018 |
| United States earnings | $ | 208,302 | | | $ | 225,898 | | | $ | 263,991 | |
| Foreign earnings | 232,901 | | | 125,061 | | | 66,990 | |
| | $ | 441,203 | | | $ | 350,959 | | | $ | 330,981 | |
The tax cost, net of applicable credits, have been provided on the undistributed earnings of the Company’s foreign subsidiaries. As of October 2, 2020, the estimated tax cost of repatriating earnings to the United States is approximately $16.2 million. The Company does not assert any earnings to be permanently reinvested.
The Company accounts for unrecognized tax benefits in accordance with ASC Topic 740, Income Taxes. It accounts for interest and penalties on unrecognized tax benefits as interest and penalties reported above the line (i.e., not as part of income tax expense). The Company’s liability for gross unrecognized tax benefits was $93.4 million and $85.2 million at October 2, 2020 and September 27, 2019, respectively, after ASU 2013-11 netting of $9.1 million and $19.2 million, respectively. If recognized, $86.2 million would affect the Company’s consolidated effective income tax rate. The Company had $40.4 million and $51.1 million in accrued interest and penalties at October 2, 2020 and September 27, 2019, respectively. The Company estimates that, within twelve months, we may realize a decrease in our uncertain tax positions
JACOBS ENGINEERING GROUP INC. AND SUBSIDIARIES
NOTES TO CONSOLIDATED FINANCIAL STATEMENTS - (Continued)
of approximately $5.5 million as a result of concluding various tax audits and closing tax years. As of October 2, 2020, the Company’s U.S. federal income tax returns for tax years 2013 and forward remain subject to examination.
The following table presents the reconciliation of the beginning and ending amount of unrecognized tax benefits for both continuing and discontinued operations, with ECR-sale related impacts removed in the Acquisitions/Divestitures row, for the years ended October 2, 2020, September 27, 2019 and September 28, 2018 (in thousands):
| | | | | | | | | | | | | | | | | |
| | For the Years Ended |
| | October 2, 2020 | | September 27, 2019 | | September 28, 2018 |
| Balance, beginning of year | $ | 104,355 | | | $ | 179,140 | | | $ | 38,580 | |
| Acquisitions/Divestitures | — | | | (31,004) | | | 137,912 | |
| Additions based on tax positions related to the current year | 1,064 | | | 7,455 | | | 9,780 | |
| Additions for tax positions of prior years | 7,472 | | | 1,994 | | | 5,561 | |
| Reductions for tax positions of prior years | (6,695) | | | (49,849) | | | (8,962) | |
| Settlement | (3,712) | | | (3,381) | | | (3,731) | |
| Balance, end of year | $ | 102,484 | | | $ | 104,355 | | | $ | 179,140 | |
On March 6, 2020, the Company completed the acquisition of John Wood Group's nuclear business, on June 12, 2019, the Company completed the acquisition of KeyW and on December 15, 2017 the Company completed the acquisition of CH2M. For income tax purposes, the transactions were accounted for as stock purchases. As a result of the acquisitions, the Company adjusted its U.S. GAAP opening balance sheet of John Wood Group, KeyW and CH2M to reflect estimates of the fair value of the net assets acquired. For income tax purposes, the tax attributes and basis of net assets acquired carryover without any step-up to fair value. For John Wood Group's nuclear business, the Company has made preliminary estimates and recorded deferred taxes associated with the purchase accounting. It is expected that the Company will make adjustments to the purchase accounting over the relevant measurement period as allowed by ASC 805. For KeyW, the Company completed its purchase accounting in the third quarter of the current fiscal year.
8. Joint Ventures and VIEs
For consolidated joint ventures, the entire amount of the revenue recognized for services performed and the costs associated with these services, including the services provided by the other joint venture partners, are included in the Company's result of operations. Likewise, the entire amount of each of the assets and liabilities are included in the Company’s consolidated balance sheet. There are no consolidated VIEs that have debt or credit facilities. Summary financial information of consolidated VIEs is as follows (in millions):
| | | | | | | | | | | |
| October 2, 2020 | | September 27, 2019 |
| Current assets | $ | 261.6 | | | $ | 192.6 | |
| Non-Current assets | 0.2 | | | — | |
| Total assets | $ | 261.8 | | | $ | 192.6 | |
| Current liabilities | $ | 190.3 | | | $ | 138.5 | |
| Non-current liabilities | — | | | — | |
| Total liabilities | $ | 190.3 | | | $ | 138.5 | |
| | | | | | | | | | | | | | | | | |
| For the Years Ended |
| October 2, 2020 | | September 27, 2019 | | September 28, 2018 |
| Revenue | $ | 912.9 | | | $ | 571.6 | | | $ | 481.4 | |
| Direct cost of contracts | (807.9) | | | (526.7) | | | (452.9) | |
| Gross profit | 105.0 | | | 44.9 | | | 28.5 | |
| Net earnings | $ | 72.6 | | | $ | 45.2 | | | $ | 28.4 | |
Unconsolidated joint ventures are accounted for under the equity method or proportionate consolidation. Proportionate consolidation is used for joint ventures that include unincorporated legal entities and activities of the joint
JACOBS ENGINEERING GROUP INC. AND SUBSIDIARIES
NOTES TO CONSOLIDATED FINANCIAL STATEMENTS - (Continued)
venture are construction-related. For those joint ventures accounted for under proportionate consolidation, only the Company’s pro rata share of assets, liabilities, revenue, and costs are included in the Company’s balance sheet and results of operations. For the proportionate consolidated VIEs, the carrying value of assets and liabilities was $64.1 million and $63.0 million as of October 2, 2020, respectively and $61.1 million and $63.7 million as of September 27, 2019, respectively. For those joint ventures accounted for under the equity method, the Company's investment balances for the joint venture is included in other noncurrent Assets: miscellaneous on the balance sheet and the Company’s pro rata share of net income is included in revenue. In limited cases, there are basis differences between the equity in the joint venture and Jacobs' investment created when Jacobs purchased their share of the joint venture. These basis differences are amortized based on an internal allocation to underlying net assets, excluding allocations to goodwill. As of October 2, 2020, the Company’s equity method investments exceeded its share of venture net assets by $71.1 million. Our investments in equity method joint ventures on the Consolidated Balance Sheets as of October 2, 2020 and September 27, 2019 were a net asset of $161.3 million and $157.9 million, respectively. During the years ended October 2, 2020, September 27, 2019, and September 28, 2018, we recognized income from equity method joint ventures of $82.2 million, $48.5 million, and $47.9 million, respectively.
Summary financial information of unconsolidated joint ventures accounted for under the equity method, as derived from their unaudited financial statements, is as follows (in millions):
| | | | | | | | | | | |
| October 2, 2020 | | September 27, 2019 |
| Current assets | $ | 1,697.0 | | | $ | 1,443.5 | |
| Non-Current assets | 34.9 | | | 29.9 | |
| Total assets | $ | 1,731.9 | | | $ | 1,473.4 | |
| Current liabilities | $ | 889.7 | | | $ | 692.1 | |
| Non-current liabilities | 631.0 | | | 473.6 | |
| Total liabilities | 1,520.7 | | | 1,165.7 | |
| Joint ventures' equity | 211.2 | | | 307.7 | |
| Total liabilities & joint venture equity | $ | 1,731.9 | | | $ | 1,473.4 | |
| | | | | | | | | | | | | | | | | |
| For the Years Ended |
| October 2, 2020 | | September 27, 2019 | | September 28, 2018 |
| Revenue | $ | 3,447.0 | | | $ | 3,533.1 | | | $ | 3,165.0 | |
| Direct cost of contracts | (3,126.6) | | | (3,176.2) | | | (2,902.5) | |
| Gross profit | $ | 320.4 | | | $ | 356.9 | | | $ | 262.5 | |
| Net earnings | $ | 245.3 | | | $ | 227.0 | | | $ | 221.1 | |
Accounts receivable from unconsolidated joint ventures accounted for under the equity method is $8.3 million and $19.5 million as of October 2, 2020 and September 27, 2019, respectively.
The Company currently holds a 24.5% interest in AWE Management Ltd (AWE ML) that is accounted for under the equity method, and the carrying value of the Company’s investment as of October 2, 2020 was approximately $38 million. As of October 2, 2020, AWE ML was under a contractual operating arrangement with the UK Ministry of Defence (MoD) with multiple years remaining under the arrangement. Subsequent to year end, on November 2, 2020, the MoD unexpectedly announced plans to change its current operating agreements with AWE ML that would result in the early termination of the current contract in 2021. The Company is currently evaluating this subsequent development, including the potential impact on our accounting for this equity method investment in future quarters.
9. Borrowings
Short-Term Debt
At September 27, 2019, short-term debt consisted of a bilateral term loan facility with an aggregate principal balance of $200.0 million (the "Bilateral Term Loan") and uncommitted credit arrangements with several banks providing short-term borrowing capacity and overdraft protection. Offset from the Bilateral Term Loan were deferred financing fees of $0.1 million. This loan was repaid during the second fiscal quarter of 2020.
JACOBS ENGINEERING GROUP INC. AND SUBSIDIARIES
NOTES TO CONSOLIDATED FINANCIAL STATEMENTS - (Continued)
Long-term Debt
The following table presents certain information regarding the Company’s long-term debt at October 2, 2020 and September 27, 2019 (dollars in thousands):
| | | | | | | | | | | | | | | | | | | | | | | |
| Interest Rate | | Maturity | | October 2, 2020 | | September 27, 2019 |
| Revolving Credit Facility | LIBOR + applicable margin (1) | | March 2024 | | $ | 152,794 | | | $ | 303,780 | |
| 2020 Term Loan Facility | LIBOR + applicable margin (2) | | March 2025 | | 1,025,826 | | | — | |
| 2017 Term Loan Facility | LIBOR + applicable margin (3) | | December 2020 | | — | | | 400,000 | |
| Fixed-rate notes due: | | | | | | | |
| Senior Notes, Series A | 4.27% | | May 2025 | | 190,000 | | | 190,000 | |
| Senior Notes, Series B | 4.42% | | May 2028 | | 180,000 | | | 180,000 | |
| Senior Notes, Series C | 4.52% | | May 2030 | | 130,000 | | | 130,000 | |
| Less: Deferred Financing Fees | | | | | (1,679) | | | (2,535) | |
| Total Long-term debt, net | | | | | $ | 1,676,941 | | | $ | 1,201,245 | |
(1)Depending on the Company’s Consolidated Leverage Ratio (as defined in the credit agreement governing the Revolving Credit Facility (defined below)), borrowings under the Revolving Credit Facility bear interest at either a eurocurrency rate plus a margin of between 0.875% and 1.5% or a base rate plus a margin of between 0% and 0.5%. The applicable LIBOR rates, including applicable margins, at October 2, 2020 and September 27, 2019 were approximately 1.39% and 2.97%.
(2)Depending on the Company’s Consolidated Leverage Ratio (as defined in the credit agreement governing the 2020 Term Loan Facility (defined below)), borrowings under the 2020 Term Loan Facility bear interest at either a eurocurrency rate plus a margin of between 0.875% and 1.5% or a base rate plus a margin of between 0% and 0.5%. The applicable LIBOR rate, including applicable margin, at October 2, 2020 was approximately 1.37%.
(3)Depending on the Company’s Consolidated Leverage Ratio (as defined in the credit agreement governing the 2017 Term Loan Facility (defined below)), borrowings under the 2017 Term Loan Facility bear interest at either a eurocurrency rate plus a margin of between 1.0% and 1.5% or a base rate plus a margin of between 0% and 0.5%. The applicable LIBOR rate, including applicable margin, at September 27, 2019 was approximately 3.05%.
On February 7, 2014, Jacobs and certain of its subsidiaries entered into a $1.6 billion long-term unsecured, revolving credit facility (as amended, the “2014 Revolving Credit Facility”) with a syndicate of U.S. and international banks and financial institutions. On March 27, 2019, the Company entered into a second amended and restated credit agreement (the "Revolving Credit Facility") which amended and restated the 2014 Revolving Credit Facility by, among other things, (a) extending the maturity date of the credit facility to March 27, 2024, (b) increasing the facility amount to $2.25 billion (with an accordion feature that allows a further increase of the facility amount up to $3.25 billion), (c) eliminating the covenants restricting investments, joint ventures and acquisitions by the Company and its subsidiaries and (d) adjusting the financial covenants to eliminate the net worth covenant upon the removal of the same covenant from the Company’s existing Note Purchase Agreement (defined below). We were in compliance with the covenants under the Revolving Credit Facility at October 2, 2020.
The Revolving Credit Facility permits the Company to borrow under two separate tranches in U.S. dollars, certain specified foreign currencies, and any other currency that may be approved in accordance with the terms of the Revolving Credit Facility. The Revolving Credit Facility also provides for a financial letter of credit sub facility of $400.0 million, permits performance letters of credit, and provides for a $50.0 million sub facility for swing line loans. Letters of credit are subject to fees based on the Company’s Consolidated Leverage Ratio. The Company pays a facility fee of between 0.08% and 0.20% per annum depending on the Company’s Consolidated Leverage Ratio.
JACOBS ENGINEERING GROUP INC. AND SUBSIDIARIES
NOTES TO CONSOLIDATED FINANCIAL STATEMENTS - (Continued)
On March 25, 2020, the Company entered into an unsecured term loan facility (the “2020 Term Loan Facility”) with a syndicate of financial institutions as lenders. Under the 2020 Term Loan Facility, the Company borrowed an aggregate principal amount of $730.0 million and one of the Company's U.K. subsidiaries borrowed an aggregate principal amount of £250.0 million. The proceeds of the term loans were used to repay the Bilateral Term Loan and for general corporate purposes. The 2020 Term Loan Facility contains affirmative and negative covenants and events of default customary for financings of this type that are consistent with those included in the Revolving Credit Facility. We were in compliance with the covenants under the 2020 Term Loan Facility at October 2, 2020. During fiscal 2020, the Company entered into interest rate and cross currency derivative contracts to swap a portion of our variable rate debt to fixed rate debt. See Note 17- Commitments and Contingencies and Derivative Financial Instruments for discussion regarding the Company's derivative instruments.
On September 28, 2017, the Company entered into a $1.5 billion unsecured delayed-draw term loan facility (as amended, the “2017 Term Loan Facility”) with a syndicate of financial institutions as lenders and letter of credit issuers. We incurred loans under the 2017 Term Loan Facility on December 15, 2017 in connection with the closing of the CH2M acquisition in order to pay cash consideration for the acquisition, and to pay fees and expenses related to the acquisition and the 2017 Term Loan Facility. The 2017 Term Loan Facility was repaid in full during the first fiscal quarter of 2020.
On March 12, 2018, Jacobs entered into a note purchase agreement (as amended, the "Note Purchase Agreement") with respect to the issuance and sale in a private placement transaction of $500.0 million in the aggregate principal amount of the Company’s senior notes in three series (collectively, the “Senior Notes”). The Note Purchase Agreement provides that if the Company's consolidated leverage ratio exceeds a certain amount, the interest on the Senior Notes may increase by 75 basis points. The Senior Notes may be prepaid at any time subject to a make-whole premium. The sale of the Senior Notes closed on May 15, 2018. The Company used the net proceeds from the offering of Senior Notes to repay certain existing indebtedness and for other general corporate purposes. The Note Purchase Agreement contains affirmative, negative and financial covenants customary for financings of this type, including, among other things, covenants to maintain a minimum consolidated net worth and maximum consolidated leverage ratio and limitations on certain liens, mergers, dispositions and transactions with affiliates. In addition, the Note Purchase Agreement contains customary events of default. We were in compliance with the covenants under the Note Purchase Agreement at October 2, 2020.
We believe the carrying value of the Revolving Credit Facility and the 2020 Term Loan Facility approximates fair value based on the interest rates and scheduled maturities applicable to the outstanding borrowings. The fair value of the Senior Notes is estimated to be $543.7 million at October 2, 2020, based on Level 2 inputs. The fair value is determined by discounting future cash flows using interest rates available for issuances with similar terms and average maturities.
The Company has issued $2.3 million in letters of credit under the Revolving Credit Facility, leaving $2.09 billion of available borrowing capacity under the Revolving Credit Facility at October 2, 2020. In addition, the Company had issued $260.7 million under separate, committed and uncommitted letter-of-credit facilities for total issued letters of credit of $263.0 million at October 2, 2020.
The following table presents the amount of interest paid by the Company during October 2, 2020, September 27, 2019 and September 28, 2018 (in thousands):
| | | | | | | | | | | | | | |
| For the Years Ended |
| October 2, 2020 | | September 27, 2019 | | September 28, 2018 |
| $58,257 | | $81,582 | | $68,467 |
10. Leases
The components of lease expense (reflected in selling, general and administrative expenses) for the year ended October 2, 2020 were as follows (in thousands):
JACOBS ENGINEERING GROUP INC. AND SUBSIDIARIES
NOTES TO CONSOLIDATED FINANCIAL STATEMENTS - (Continued)
| | | | | | | | | | |
| | | | Year Ended |
| Lease cost | | | | |
| | | | |
| | | | |
| | | | |
| Operating lease cost | | | | $ | 169,967 | |
| Variable lease cost | | | | 35,083 | |
| Sublease income | | | | (14,719) | |
| Total lease cost | | | | $ | 190,331 | |
Supplemental information related to the Company's leases for the year ended October 2, 2020 was as follows (in thousands):
| | | | | | | | |
| | Year Ended |
| Cash paid for amounts included in the measurements of lease liabilities | | $ | 195,345 | |
| | |
| | |
| | |
| Right-of-use assets obtained in exchange for new operating lease liabilities | | $ | 66,761 | |
| | |
| Weighted average remaining lease term - operating leases | | 7 years |
| | |
| Weighted average discount rate - operating leases | | 2.7% |
| | |
Total remaining lease payments under the Company's leases for each of the succeeding years is as follows (in thousands):
| | | | | | | | |
| Fiscal Year | | Operating Leases |
| 2021 | | $ | 184,967 | |
| 2022 | | 163,166 | |
| 2023 | | 144,668 | |
| 2024 | | 127,472 | |
| 2025 | | 107,866 | |
| Thereafter | | 266,539 | |
| | 994,678 | |
| Less Interest | | (95,164) | |
| | $ | 899,514 | |
Right-of-Use and Other Long-Lived Asset Impairment
In the fourth fiscal quarter of 2020, as a result and in consideration of the impacts of the COVID-19 pandemic and the changing nature of the Company's use of office space for its workforce, the Company evaluated its existing real estate lease portfolio as part of its transformation initiatives related to real estate and staffing programs. These initiatives during the fourth quarter resulted in the actual abandonment of certain leased office spaces and the establishment of a formal plan to sublease certain other leased spaces that will no longer be utilized by the Company. In connection with the Company’s actions related to these initiatives, the Company evaluated certain of its lease right-of-use assets and related property, equipment and leasehold improvements for impairment under ASC 360.
As a result of the analysis, the Company recognized an impairment loss during the fourth quarter of fiscal 2020 of $162 million, which is included in selling, general and administrative expenses in the accompanying statement of earnings for the fiscal year ended October 2, 2020. The impairment loss recorded includes $127 million related to right-of-use lease assets and $35 million related to other long-lived assets, including property, equipment and improvements and leasehold improvements.
The fair values for the asset groups relating to the impaired long-lived assets were estimated primarily using discounted cash flow models (income approach) with Level 3 inputs. The significant assumptions used in estimating fair value include the expected downtime prior to the commencement of future subleases, projected sublease income over the remaining lease periods and discount rates that reflects the level of risk associated with receiving future cash flows.
JACOBS ENGINEERING GROUP INC. AND SUBSIDIARIES
NOTES TO CONSOLIDATED FINANCIAL STATEMENTS - (Continued)
11. Employee Stock Purchase and Stock Incentive Plans
Employee Stock Purchase Plans
Under the 1989 ESPP and the GESPP, eligible employees who elect to participate in these plans are granted the right to purchase shares of the common stock of Jacobs at a discount that is limited to 5% of the per-share market value on the day shares are sold to employees. The following table summarizes the stock issuance activity under the 1989 ESPP and the GESPP for the fiscal years ended October 2, 2020, September 27, 2019 and September 28, 2018:
| | | | | | | | | | | | | | | | | |
| | For the Years Ended |
| | October 2, 2020 | | September 27, 2019 | | September 28, 2018 |
| Aggregate Purchase Price Paid for Shares Sold: | | | | | |
| Under the 1989 ESPP | $ | 25,364,252 | | | $ | 24,824,232 | | | $ | 21,590,858 | |
| Under the GESPP | 2,448,349 | | | 2,471,193 | | | 2,240,609 | |
| Total | $ | 27,812,601 | | | $ | 27,295,425 | | | $ | 23,831,467 | |
| Aggregate Number of Shares Sold: | | | | | |
| Under the 1989 ESPP | 304,018 | | | 354,580 | | | 357,899 | |
| Under the GESPP | 29,060 | | | 34,843 | | | 36,405 | |
| Total | 333,078 | | | 389,423 | | | 394,304 | |
On January 19, 2017, the Company’s stockholders approved an increase in the number of shares authorized by 4,350,000 shares for the 1989 ESPP and by 150,000 shares for the GESPP.
At October 2, 2020, there remains 3,529,357 shares reserved for issuance under the 1989 ESPP and 74,672 shares reserved for issuance under the GESPP.
Stock Incentive Plans
We also sponsor the 1999 Stock Incentive Plan, as amended and restated (the "SIP") and the 1999 Outside Director Stock Plan, as amended and restated (the "ODSP"). The 1999 SIP provides for the issuance of incentive stock options, non-qualified stock options, share appreciation rights ("SARs"), restricted stock and restricted stock units to employees. The 1999 ODSP provides for awards of shares of common stock, restricted stock, restricted stock units and grants of non-qualified stock options to our outside (i.e., nonemployee) directors. The following table sets forth certain information about the 1999 Plans:
| | | | | | | | | | | | | | | | | |
| | 1999 SIP | | 1999 ODSP | | Total |
| Number of shares authorized | 29,850,000 | | | 1,100,000 | | | 30,950,000 | |
| Number of remaining shares reserved for issuance at October 2, 2020 | 5,272,572 | | | 359,875 | | | 5,632,447 | |
| Number of shares relating to outstanding stock options at October 2, 2020 | 568,114 | | | 138,375 | | | 706,489 | |
| Number of shares available for future awards: | | | | | |
| At October 2, 2020 | 4,704,458 | | | 221,500 | | | 4,925,958 | |
| At September 27, 2019 | 4,963,761 | | | 256,252 | | | 5,220,013 | |
Effective September 28, 2012, all grants of shares under the 1999 SIP are issued on a fungible basis. An award other than an option or SAR are granted on a 1.92-to-1.00 basis (“Fungible”). An award of an option or SAR are granted on a 1-to-1 basis (“Not Fungible”).
JACOBS ENGINEERING GROUP INC. AND SUBSIDIARIES
NOTES TO CONSOLIDATED FINANCIAL STATEMENTS - (Continued)
The following table presents the fair value of shares (of restricted stock and restricted stock units) vested for the years ended October 2, 2020, September 27, 2019 and September 28, 2018 (in thousands):
| | | | | | | | | | | | | | | | | |
| | For the Years Ended |
| | October 2, 2020 | | September 27, 2019 | | September 28, 2018 |
| Restricted Stock and Restricted Stock Units (service condition) | $ | 29,209 | | | $ | 37,864 | | | $ | 64,121 | |
| Restricted Stock Units (service, market, and performance conditions at target) | 20,998 | | | 17,124 | | | 2,626 | |
| Total | $ | 50,207 | | | $ | 54,988 | | | $ | 66,747 | |
At October 2, 2020, the amount of compensation cost relating to non-vested awards not yet recognized in the financial statements is approximately $61.3 million. The majority of these unrecognized compensation costs will be recognized by the first quarter of fiscal 2022. The weighted average remaining contractual term of options currently exercisable is 2.1 years.
Stock Options
The following table summarizes the stock option activity for the years ended October 2, 2020, September 27, 2019 and September 28, 2018:
| | | | | | | | | | | |
| | Number of Stock Options | | Weighted Average
Exercise Price |
| Outstanding at September 29, 2017 | 2,516,825 | | | $ | 46.19 | |
| Exercised | (636,019) | | | $ | 46.93 | |
| Cancelled or expired | (114,047) | | | $ | 52.26 | |
| Outstanding at September 28, 2018 | 1,766,759 | | | $ | 45.53 | |
| Exercised | (828,529) | | | $ | 45.63 | |
| Cancelled or expired | (11,624) | | | $ | 42.10 | |
| Outstanding at September 27, 2019 | 926,606 | | | $ | 45.48 | |
| Exercised | (212,467) | | | $ | 44.05 | |
| Cancelled or expired | (7,650) | | | $ | 45.31 | |
| Outstanding at October 2, 2020 | 706,489 | | | $ | 45.91 | |
Cash received from the exercise of stock options, net of tax remitted, during the year ended October 2, 2020 was $9.4 million.
Stock options outstanding at October 2, 2020 consisted entirely of non-qualified stock options. The following table presents the total intrinsic value of stock options exercised for the fiscal years ended October 2, 2020, September 27, 2019 and September 28, 2018 (in thousands):
| | | | | | | | | | | | | | |
| For the Years Ended |
| October 2, 2020 | | September 27, 2019 | | September 28, 2018 |
| $9,986 | | $27,720 | | $13,931 |
JACOBS ENGINEERING GROUP INC. AND SUBSIDIARIES
NOTES TO CONSOLIDATED FINANCIAL STATEMENTS - (Continued)
The total intrinsic value of stock options exercisable at October 2, 2020 was approximately $34.1 million. The following table presents certain other information regarding our 1999 SIP and 1999 OSDP for the fiscal years ended October 2, 2020, September 27, 2019 and September 28, 2018:
| | | | | | | | | | | | | | | | | |
| | October 2, 2020 | | September 27, 2019 | | September 28, 2018 |
| At fiscal year end: | | | | | |
| Range of exercise prices for options exercisable | $32.51–$60.43 | | $32.51–$60.43 | | $32.51–$60.43 |
| Number of options exercisable | 706,489 | | | 860,114 | | | 1,557,900 | |
| For the fiscal year: | | | | | |
| Range of prices relating to options exercised | $37.03–$60.08 | | $36.88-$60.43 | | $35.93-$61.26 |
The following table presents certain information regarding stock options outstanding and stock options exercisable at October 2, 2020:
| | | | | | | | | | | | | | | | | | | | | | | | | | | | | |
| | October 2, 2020 |
| | Options Outstanding | | Options Exercisable |
| Range of Exercise Prices | Number | | Weighted Average Remaining Contractual Life (years) | | Weighted Average Price | | Number | | Weighted Average Exercise Price |
$32.51 - $37.03 | 36,500 | | | 1.63 | | $ | 36.97 | | | 36,500 | | | $ | 36.97 | |
$37.43 - $46.09 | 468,077 | | | 4.51 | | $ | 43.08 | | | 468,077 | | | $ | 43.08 | |
$47.11 - $55.13 | 173,537 | | | 2.72 | | $ | 53.05 | | | 173,537 | | | $ | 53.05 | |
$60.08 - $80.63 | 28,375 | | | 3.35 | | $ | 60.39 | | | 28,375 | | | $ | 60.39 | |
| | 706,489 | | | 3.88 | | $ | 45.91 | | | 706,489 | | | $ | 45.91 | |
The 1999 ODSP and the 1999 SIP allow participants to satisfy the exercise price of stock options by tendering shares of Jacobs common stock that have been owned by the participants for at least six months. Shares so tendered are retired and canceled, and are shown as repurchases of common stock in the accompanying Consolidated Statements of Stockholders’ Equity. The weighted average remaining contractual term of options currently exercisable is 3.88 years.
Restricted Stock
The following table presents the number of shares of restricted stock and restricted stock units issued as common stock under the 1999 SIP for the years ended October 2, 2020, September 27, 2019 and September 28, 2018:
| | | | | | | | | | | | | | | | | |
| | For the Years Ended |
| | October 2, 2020 | | September 27, 2019 | | September 28, 2018 |
| Restricted stock | — | | | — | | | — | |
| Restricted stock units (service condition) | 351,670 | | | 318,056 | | | 1,087,724 | |
| Restricted stock units (service and performance conditions) | 202,792 | | | 240,068 | | | 254,784 | |
The amount of restricted stock units issued for awards with performance and market conditions in the above table are issued based on performance against the target amount. The number of shares ultimately issued, which could be greater or less than target, will be based on achieving specific performance conditions related to the awards as well as achieving the service condition required for the restricted stock units to vest.
JACOBS ENGINEERING GROUP INC. AND SUBSIDIARIES
NOTES TO CONSOLIDATED FINANCIAL STATEMENTS - (Continued)
The following table presents the number and weighted average grant-date fair value of restricted stock and restricted stock units at October 2, 2020:
| | | | | | | | | | | |
| Number of Shares | | Weighted Average Grant-Date Fair Value |
| Outstanding at September 27, 2019 | 1,723,037 | | | $ | 65.80 | |
| Granted | 728,478 | | | $ | 85.61 | |
| Vested | (850,054) | | | $ | 60.37 | |
| Canceled | (75,935) | | | $ | 75.86 | |
| Outstanding at October 2, 2020 | 1,525,526 | | | $ | 77.88 | |
The following table presents the number of shares of restricted stock and restricted stock units canceled and withheld for taxes under the 1999 SIP for the years ended October 2, 2020, September 27, 2019 and September 28, 2018:
| | | | | | | | | | | | | | | | | |
| | For the Years Ended |
| | October 2, 2020 | | September 27, 2019 | | September 28, 2018 |
| Restricted stock | 34,417 | | | 105,301 | | | 284,254 | |
| Restricted stock units (service condition) | 183,099 | | | 295,122 | | | 336,516 | |
| Restricted stock units (service, market and performance conditions) | 160,781 | | | 183,654 | | | 95,063 | |
The amount of unvested restricted stock units canceled for awards with service and performance conditions in the above table is based on the service period achieved and performance against the target amount.
The restrictions attached to restricted stock and restricted stock units generally relate to the recipient’s ability to sell or otherwise transfer the stock or stock units. There are also restrictions that subject the stock and stock units to forfeiture back to the Company until earned by the recipient through continued employment or service.
The following table provides the number of restricted stock units outstanding at October 2, 2020 under the 1999 SIP. No shares of restricted stock were issued under the 1999 ODSP during such periods.
| | | | | |
| | October 2, 2020 |
| Restricted stock | — | |
| Restricted stock units (service condition) | 756,054 | |
| Restricted stock units (service, market and performance conditions) | 647,262 | |
The following table presents the number of shares of restricted stock and restricted stock units issued under the 1999 ODSP for the years ended October 2, 2020, September 27, 2019 and September 28, 2018:
| | | | | | | | | | | | | | | | | |
| | For the Years Ended |
| | October 2, 2020 | | September 27, 2019 | | September 28, 2018 |
| Restricted stock units (service condition) | 18,100 | | | 26,372 | | | 21,620 | |
The following table provides the number of shares of restricted stock and restricted stock units outstanding at October 2, 2020 under the 1999 ODSP:
| | | | | |
| | October 2, 2020 |
| Restricted stock | 34,000 | |
| Restricted stock units (service condition) | 88,210 | |
All shares granted under the 1999 ODSP are issued on a 1.92-to-1.00 basis.
JACOBS ENGINEERING GROUP INC. AND SUBSIDIARIES
NOTES TO CONSOLIDATED FINANCIAL STATEMENTS - (Continued)
12. Savings and Deferred Compensation Plans
Savings Plans
We sponsor various defined contribution savings plans which allow participants to make voluntary contributions by salary deduction. Such plans cover substantially all of our domestic, nonunion employees in the U.S. and are qualified under Section 401(k) of the U.S. Internal Revenue Code. Similar plans outside the U.S. cover various groups of employees of our international subsidiaries and affiliates. Several of these plans allow the Company to match, on a voluntary basis, a portion of the employee contributions. The following table presents the Company’s contributions to these savings plans for the years ended October 2, 2020, September 27, 2019 and September 28, 2018 (in thousands):
| | | | | | | | | | | | | | |
| October 2, 2020 | | September 27, 2019 | | September 28, 2018 |
| $ | 91,833 | | | $ | 114,006 | | | $ | 113,135 | |
Deferred Compensation Plans
Our Executive Security Plan, Executive Deferral Plans, Directors Deferral Plan, legacy CH2M Supplemental Executive Retirement and Retention Plan and legacy CH2M Deferred Compensation Plan are non-qualified deferred compensation programs that provide benefits payable to directors, officers, and certain key employees or their designated beneficiaries at specified future dates, upon retirement, or death. The plans are unfunded; therefore, benefits are paid from the general assets of the Company. Participants' cash deferrals earn a return based on the participants' selection of investments in several hypothetical investment options. Participants are also able to defer stock based compensation in the plans, which must remain invested in Company stock and are distributed in shares of Jacobs common stock. Since no investment diversification is permitted, changes in the fair value of Jacobs' common stock are not recognized. For the deferred compensation held in company stock, the number of shares needed to settle the liability is included in the denominator in both the basic and diluted earnings per share calculations. The following table presents the amount charged to expense for the Company’s deferred compensation plans for the years ended October 2, 2020, September 27, 2019 and September 28, 2018 (in thousands):
| | | | | | | | | | | | | | |
| October 2, 2020 | | September 27, 2019 | | September 28, 2018 |
| $ | 203 | | | $ | 2,395 | | | $ | 4,445 | |
The following table presents the amount relating to assets held as deferred compensation arrangement investments for the years ended October 2, 2020 and September 27, 2019 (in thousands):
| | | | | | | | | | | |
| | October 2, 2020 | | September 27, 2019 |
| Deferred compensation arrangement investments | $194,933 | | $219,948 |
Deferred compensation arrangement investments are comprised of the cash surrender value of life insurance policies and pooled-investment funds. The fair value of the pooled investment funds is derived using Level 2 inputs.
JACOBS ENGINEERING GROUP INC. AND SUBSIDIARIES
NOTES TO CONSOLIDATED FINANCIAL STATEMENTS - (Continued)
13. Pension and Other Postretirement Benefit Plans
Company-Only Sponsored Plans
We sponsor various defined benefit pension and other post retirement plans covering employees of certain U.S. and international subsidiaries. The pension plans provide pension benefits that are based on the employee’s compensation and years of service. Our funding policy varies by country and plan according to applicable local funding requirements and plan-specific funding agreements.
The accounting for pension and other post-retirement benefit plans requires the use of assumptions and estimates in order to calculate periodic benefit cost and the value of the plans’ assets and benefit obligations. These assumptions include discount rates, investment returns, and projected salary increases, among others. The discount rates used in valuing the plans' benefit obligations were determined with reference to high quality corporate and government bonds that are appropriately matched to the duration of each plan's obligations. The expected long-term rate of return on plan assets is generally based on using country-specific simulation models which select a single outcome for expected return based on the target asset allocation. The expected long-term rates of return used in the valuation are the annual average returns generated by these assumptions over a 20-year period for each asset class based on the expected long-term rate of return of the underlying assets.
As a result of the ECR sale, ECR-related pension assets and liabilities that have been sold are reported as discontinued operations in accordance with ASC 210-05, Discontinued Operations. Activity for the year ended September 27, 2019 is shown in the appropriate rows and the balances as of the sale date are shown in the Disposition of ECR Plans rows below.
The following table sets forth the changes in the plans’ combined net benefit obligation (segregated between plans existing within and outside the U.S.) for the years ended October 2, 2020 and September 27, 2019 (in thousands):
| | | | | | | | | | | | | | | | | | | | | | | |
| | U.S. Plans | | Non-U.S. Plans |
| | October 2, 2020 | | September 27, 2019 | | October 2, 2020 | | September 27, 2019 |
| Net benefit obligation at the beginning of the year | $ | 448,540 | | | $ | 448,402 | | | $ | 2,258,129 | | | $ | 2,149,246 | |
| Service cost | 409 | | | 2,784 | | | 5,710 | | | 7,171 | |
| Interest cost | 12,673 | | | 16,697 | | | 39,469 | | | 52,627 | |
| Participants’ contributions | — | | | 243 | | | 167 | | | 367 | |
| Actuarial (gains)/losses | 15,584 | | | 52,720 | | | 35,626 | | | 314,889 | |
| Benefits paid | (22,836) | | | (30,648) | | | (64,395) | | | (72,453) | |
| Curtailments/settlements/plan amendments | (16,450) | | | (39,388) | | | (4,782) | | | 30,124 | |
| | | | | | | |
| Disposition of ECR Plans | — | | | — | | | — | | | (99,504) | |
| Effect of exchange rate changes and other, net | — | | | (2,270) | | | 118,153 | | | (124,338) | |
| Net benefit obligation at the end of the year | $ | 437,920 | | | $ | 448,540 | | | $ | 2,388,077 | | | $ | 2,258,129 | |
The following table sets forth the changes in the combined Fair Value of the plans’ assets (segregated between plans existing within and outside the U.S.) for the years ended October 2, 2020 and September 27, 2019 (in thousands):
JACOBS ENGINEERING GROUP INC. AND SUBSIDIARIES
NOTES TO CONSOLIDATED FINANCIAL STATEMENTS - (Continued)
| | | | | | | | | | | | | | | | | | | | | | | |
| | U.S. Plans | | Non-U.S. Plans |
| | October 2, 2020 | | September 27, 2019 | | October 2, 2020 | | September 27, 2019 |
| Fair value of plan assets at the beginning of the year | $ | 390,210 | | | $ | 390,829 | | | $ | 1,916,637 | | | $ | 1,867,481 | |
| Actual return on plan assets | 33,345 | | | 31,140 | | | 61,221 | | | 280,785 | |
| Employer contributions | 88 | | | 10,668 | | | 33,192 | | | 32,063 | |
| Participants’ contributions | — | | | 243 | | | 167 | | | 367 | |
| Gross benefits paid | (22,836) | | | (30,648) | | | (64,395) | | | (72,453) | |
| Curtailments/settlements/plan amendments | (18,557) | | | (9,751) | | | (4,782) | | | (5,814) | |
| | | | | | | |
| Disposition of ECR Plans | — | | | — | | | — | | | (76,111) | |
| Effect of exchange rate changes and other, net | — | | | (2,271) | | | 101,316 | | | (109,681) | |
| Fair value of plan assets at the end of the year | $ | 382,250 | | | $ | 390,210 | | | $ | 2,043,356 | | | $ | 1,916,637 | |
During fiscal 2020, the Company incurred combined curtailment and settlement losses on our defined benefit plans of approximately $4.6 million primarily related to the Ireland and U.S. plans. During fiscal 2019, the Company incurred combined curtailment and settlement gains on its defined benefit plans of approximately $33.1 million primarily related to the CH2M retiree medical (further discussed below) and Ireland plans.
The following table reconciles the combined funded statuses of the plans recognized in the accompanying Consolidated Balance Sheets at October 2, 2020 and September 27, 2019 (segregated between plans existing within and outside the U.S.) (in thousands):
| | | | | | | | | | | | | | | | | | | | | | | |
| | U.S. Plans | | Non-U.S. Plans |
| | October 2, 2020 | | September 27, 2019 | | October 2, 2020 | | September 27, 2019 |
| Net benefit obligation at the end of the year | $ | 437,920 | | | $ | 448,540 | | | $ | 2,388,077 | | | $ | 2,258,129 | |
| Fair value of plan assets at the end of the year | 382,250 | | | 390,210 | | | 2,043,356 | | | 1,916,637 | |
| Underfunded amount recognized at the end of the year | $ | 55,670 | | | $ | 58,330 | | | $ | 344,721 | | | $ | 341,492 | |
The following table presents the accumulated benefit obligation at October 2, 2020 and September 27, 2019 (segregated between plans existing within and outside the U.S.) (in thousands):
| | | | | | | | | | | | | | | | | | | | | | | |
| | U.S. Plans | | Non-U.S. Plans |
| | October 2, 2020 | | September 27, 2019 | | October 2, 2020 | | September 27, 2019 |
| Accumulated benefit obligation at the end of the year | $ | 436,770 | | | $ | 447,609 | | | $ | 2,376,059 | | | $ | 2,244,710 | |
The following table presents the amounts recognized in the accompanying Consolidated Balance Sheets at October 2, 2020 and September 27, 2019 (segregated between plans existing within and outside the U.S.) (in thousands):
| | | | | | | | | | | | | | | | | | | | | | | |
| | U.S. Plans | | Non-U.S. Plans |
| | October 2, 2020 | | September 27, 2019 | | October 2, 2020 | | September 27, 2019 |
| Prepaid benefit cost included in noncurrent assets | $ | — | | | $ | — | | | $ | 1,037 | | | $ | 2,939 | |
| Accrued benefit cost included in current liabilities | 85 | | | 85 | | | 4,375 | | | 4,177 | |
| Accrued benefit cost included in noncurrent liabilities | 57,919 | | | 58,245 | | | 339,049 | | | 340,254 | |
| Net amount recognized at the end of the year | $ | 58,004 | | | $ | 58,330 | | | $ | 342,387 | | | $ | 341,492 | |
JACOBS ENGINEERING GROUP INC. AND SUBSIDIARIES
NOTES TO CONSOLIDATED FINANCIAL STATEMENTS - (Continued)
The following table presents the significant actuarial assumptions used in determining the funded statuses and the following year's benefit cost of the Company’s U.S. plans for the years ended October 2, 2020, September 27, 2019 and September 28, 2018:
| | | | | | | | | | | | | | | | | |
| | For the Years Ended |
| | October 2, 2020 | | September 27, 2019 | | September 28, 2018 |
| Discount rates | 2.0% to 2.7% | | 2.8% to 3.1% | | 3.9% to 4.2% |
| Rates of compensation increases | 3.5% | | 3.5% | | 3.5% |
| Expected long-term rates of return on assets | 4.6% to 4.7% | | 5.1% | | 5.8% to 5.9% |
The following table presents the significant actuarial assumptions used in determining the funded statuses and the following year's benefit cost of the Company’s non-U.S. plans for the years ended October 2, 2020, September 27, 2019 and September 28, 2018:
| | | | | | | | | | | | | | | | | |
| For the Years Ended |
| | October 2, 2020 | | September 27, 2019 | | September 28, 2018 |
| Discount rates | 0.4% to 6.6% | | 0.2% to 7.1% | | 1.3% to 8.1% |
| Rates of compensation increases | 2.7% to 7.5% | | 3.7% to 7.5% | | 3.8% to 7.5% |
| Expected long-term rates of return on assets | 1.8% to 7.0% | | 2.3% to 7.5% | | 3.8% to 7.5% |
The following table presents certain amounts relating to our U.S. plans recognized in accumulated other comprehensive (gain) loss at October 2, 2020, September 27, 2019 and September 28, 2018 (in thousands):
| | | | | | | | | | | | | | | | | |
| | October 2, 2020 | | September 27, 2019 | | September 28, 2018 |
| Arising during the period: | | | | | |
| Net actuarial (gain) loss | $ | (900) | | | $ | 36,108 | | | $ | (7,514) | |
| Prior service cost (benefit) | 1,589 | | — | | | — |
| Total | 689 | | 36,108 | | (7,514) |
| Reclassification adjustments: | | | | | |
| Net actuarial losses | (2,653) | | | (2,282) | | | (2,913) | |
| Prior service cost (benefit) | (244) | | | — | | | — | |
| Total | (2,897) | | | (2,282) | | | (2,913) | |
| Total | $ | (2,208) | | | $ | 33,826 | | | $ | (10,427) | |
The following table presents certain amounts relating to our non-U.S. plans recognized in accumulated other comprehensive (gain) loss at October 2, 2020, September 27, 2019 and September 28, 2018 (in thousands):
| | | | | | | | | | | | | | | | | |
| | October 2, 2020 | | September 27, 2019 | | September 28, 2018 |
| Arising during the period: | | | | | |
| Net actuarial (gain) loss | $ | 71,676 | | | $ | 83,368 | | | $ | 59,827 | |
| Net (gain) loss on Sale of ECR | — | | | (12,520) | | | — | |
| Prior service cost (benefit) | — | | | 29,829 | | | 215 | |
| Total | 71,676 | | | 100,677 | | | 60,042 | |
| Reclassification adjustments: | | | | | |
| Net actuarial losses | (6,322) | | | (6,546) | | | (5,507) | |
| Prior service cost | (1,169) | | | (1,075) | | | 181 | |
| Total | (7,491) | | | (7,621) | | | (5,326) | |
| Total | $ | 64,185 | | | $ | 93,056 | | | $ | 54,716 | |
JACOBS ENGINEERING GROUP INC. AND SUBSIDIARIES
NOTES TO CONSOLIDATED FINANCIAL STATEMENTS - (Continued)
The following table presents certain amounts relating to our plans recorded in accumulated other comprehensive loss that have not yet been recognized as components of net periodic benefit cost at October 2, 2020 and September 27, 2019 (segregated between U.S. and non-U.S. plans) (in thousands):
| | | | | | | | | | | | | | | | | | | | | | | |
| | U.S. Plans | | Non-U.S. Plans |
| | October 2, 2020 | | September 27, 2019 | | October 2, 2020 | | September 27, 2019 |
| Net actuarial loss | $ | 67,530 | | | $ | 71,083 | | | $ | 401,930 | | | $ | 365,661 | |
| Prior service cost | 1,345 | | | — | | | 27,921 | | | 28,346 | |
| Total | $ | 68,875 | | | $ | 71,083 | | | $ | 429,851 | | | $ | 394,007 | |
The following table presents the amount of accumulated comprehensive income that will be amortized against earnings as part of our net periodic benefit cost in fiscal 2021 based on 2020 exchange rates (segregated between U.S. and non-U.S. plans) (in thousands):
| | | | | | | | | | | |
| | U.S. Plans | | Non-U.S. Plans |
| Unrecognized net actuarial loss | $ | 4,249 | | | $ | 10,016 | |
| Unrecognized prior service cost | 431 | | | 1,431 | |
| Accumulated comprehensive loss to be recorded against earnings | $ | 4,680 | | | $ | 11,447 | |
We consider various factors in developing the estimates for the expected, long-term rates of return on plan assets. These factors include the projected, long-term rates of returns on the various types of assets in which the plans invest, as well as historical returns. In general, investment allocations are determined by each plan’s trustees and/or investment committees. The objectives of the plans’ investment policies are to (i) maximize returns while preserving capital; (ii) provide returns sufficient to meet the current and long-term obligations of the plan as the obligations become due; and (iii) maintain a diversified portfolio of assets so as to reduce the risk associated with having a disproportionate amount of the plans’ total assets invested in any one type of asset, issuer or geography. None of our pension plans hold Jacobs common stock directly (although some plans may hold shares indirectly through investments in mutual funds). The plans’ weighted average asset allocations at October 2, 2020 and September 27, 2019 (the measurement dates used in valuing the plans’ assets and liabilities) were as follows:
| | | | | | | | | | | | | | | | | | | | | | | |
| | U.S. Plans | | Non-U.S. Plans |
| | October 2, 2020 | | September 27, 2019 | | October 2, 2020 | | September 27, 2019 |
| Equity securities | 3 | % | | 3 | % | | 21 | % | | 20 | % |
| Debt securities | 58 | % | | 58 | % | | 56 | % | | 52 | % |
| Real estate investments | — | % | | — | % | | 7 | % | | 7 | % |
| Other | 39 | % | | 39 | % | | 17 | % | | 21 | % |
The following table presents the Fair Value of the Company’s Domestic U.S. plan assets at October 2, 2020, segregated by level of Fair Value measurement inputs within the Fair Value hierarchy promulgated by U.S. GAAP (in thousands):
| | | | | | | | | | | | | | | | | | | | | | | | | | | | | |
| | October 2, 2020 |
| | Fair Value, Determined Using Fair Value Measurement Inputs |
| | Level 1 | | Level 2 | | Level 3 | | Investments measured at Net Asset Value | | Total |
| Domestic equities | $ | 12,376 | | | $ | — | | | $ | — | | | $ | — | | | $ | 12,376 | |
| | | | | | | | | |
| Domestic bonds | 68,324 | | | 131,534 | | | — | | | — | | | 199,858 | |
| Overseas bonds | — | | | 19,223 | | | — | | | — | | | 19,223 | |
| Cash and equivalents | 18,226 | | | — | | | — | | | — | | | 18,226 | |
| Mutual funds | 132,567 | | | — | | | — | | | — | | | 132,567 | |
| | | | | | | | | |
| Total | $ | 231,493 | | | $ | 150,757 | | | $ | — | | | $ | — | | | $ | 382,250 | |
JACOBS ENGINEERING GROUP INC. AND SUBSIDIARIES
NOTES TO CONSOLIDATED FINANCIAL STATEMENTS - (Continued)
The following table presents the Fair Value of the Company’s non-U.S. plan assets at October 2, 2020, segregated by level of Fair Value measurement inputs within the Fair Value hierarchy promulgated by U.S. GAAP (in thousands):
| | | | | | | | | | | | | | | | | | | | | | | | | | | | | |
| | October 2, 2020 |
| | Fair Value, Determined Using Fair Value Measurement Inputs |
| | Level 1 | | Level 2 | | Level 3 | | Investments measured at Net Asset Value | | Total |
| Domestic equities | $ | — | | | $ | 103,036 | | | $ | — | | | $ | 5,745 | | | $ | 108,781 | |
| Overseas equities | — | | | 229,576 | | | — | | | 87,725 | | | 317,301 | |
| Domestic bonds | — | | | 34,469 | | | — | | | 1,175 | | | 35,644 | |
| Overseas bonds | — | | | 1,049,119 | | | — | | | 58,493 | | | 1,107,612 | |
| Cash and equivalents | 24,568 | | | — | | | — | | | — | | | 24,568 | |
| Real estate | — | | | 10,383 | | | 105,422 | | | — | | | 115,805 | |
| Insurance contracts | — | | | 4,402 | | | 67,709 | | | 17,909 | | | 90,020 | |
| | | | | | | | | |
| Hedge funds | — | | | — | | | 171,730 | | | 7,153 | | | 178,883 | |
| Mutual funds | — | | | 64,742 | | | — | | | — | | | 64,742 | |
| Total | $ | 24,568 | | | $ | 1,495,727 | | | $ | 344,861 | | | $ | 178,200 | | | $ | 2,043,356 | |
The following table presents the Fair Value of the Company’s U.S. plan assets at September 27, 2019, segregated by level of Fair Value measurement inputs within the Fair Value hierarchy promulgated by U.S. GAAP (in thousands):
| | | | | | | | | | | | | | | | | | | | | | | | | | | | | |
| | September 27, 2019 |
| | Fair Value, Determined Using Fair Value Measurement Inputs |
| | Level 1 | | Level 2 | | Level 3 | | Investments measured at Net Asset Value | | Total |
| Domestic equities | $ | 10,890 | | | $ | — | | | $ | — | | | $ | — | | | $ | 10,890 | |
| | | | | | | | | |
| Domestic bonds | 65,490 | | | 134,594 | | | — | | | — | | | 200,084 | |
| Overseas bonds | — | | | 20,020 | | | — | | | — | | | 20,020 | |
| Cash and equivalents | 28,972 | | | — | | | — | | | — | | | 28,972 | |
| Mutual funds | 130,244 | | | — | | | — | | | — | | | 130,244 | |
| | | | | | | | | |
| Total | $ | 235,596 | | | $ | 154,614 | | | $ | — | | | $ | — | | | $ | 390,210 | |
The following table presents the Fair Value of the Company’s non-U.S. plan assets at September 27, 2019, segregated by level of Fair Value measurement inputs within the Fair Value hierarchy promulgated by U.S. GAAP (in thousands):
JACOBS ENGINEERING GROUP INC. AND SUBSIDIARIES
NOTES TO CONSOLIDATED FINANCIAL STATEMENTS - (Continued)
| | | | | | | | | | | | | | | | | | | | | | | | | | | | | |
| | September 27, 2019 |
| | Fair Value, Determined Using Fair Value Measurement Inputs |
| | Level 1 | | Level 2 | | Level 3 | | Investments measured at Net Asset Value | | Total |
| Domestic equities | $ | — | | | $ | 17,255 | | | $ | — | | | $ | 19,413 | | | $ | 36,668 | |
| Overseas equities | — | | | 182,600 | | | — | | | 50,127 | | | 232,727 | |
| Domestic bonds | — | | | 306,225 | | | — | | | 34,408 | | | 340,633 | |
| Overseas bonds | — | | | 728,616 | | | — | | | 39,292 | | | 767,908 | |
| Cash and equivalents | 37,811 | | | (16) | | | — | | | — | | | 37,795 | |
| Real estate | — | | | 24,735 | | | 97,539 | | | 15,198 | | | 137,472 | |
| Insurance contracts | — | | | 4,478 | | | 72,788 | | | — | | | 77,266 | |
| Derivatives | — | | | — | | | — | | | — | | | — | |
| Hedge funds | — | | | — | | | 130,200 | | | 7,156 | | | 137,356 | |
| Mutual funds | — | | | 148,812 | | | — | | | — | | | 148,812 | |
| Total | $ | 37,811 | | | $ | 1,412,705 | | | $ | 300,527 | | | $ | 165,594 | | | $ | 1,916,637 | |
The following table summarizes the changes in the Fair Value of the Company’s non-U.S. Pension Plans’ Level 3 assets for the years ended September 27, 2019 and October 2, 2020 (in thousands):
| | | | | | | | | | | | | | | | | |
| | Real Estate | | Insurance Contracts | | Hedge Funds |
| Balance at Balance at September 28, 2018 | $ | 99,587 | | | $ | 95,782 | | | $ | 135,786 | |
| Purchases, sales, and settlements | (17,902) | | | (5,126) | | | (26,591) | |
| Realized and unrealized gains | 21,838 | | | 9,134 | | | 29,161 | |
| Disposition of ECR Assets | — | | | (22,885) | | | — | |
| Effect of exchange rate changes | (5,984) | | | (4,117) | | | (8,156) | |
| Balance at September 27, 2019 | $ | 97,539 | | | $ | 72,788 | | | $ | 130,200 | |
| Purchases, sales, and settlements | (475) | | | (7,375) | | | 29,999 | |
| Realized and unrealized gains (losses) | 3,337 | | | (1,399) | | | 5,435 | |
| Effect of exchange rate changes | 5,021 | | | 3,695 | | | 6,096 | |
| Balance at October 2, 2020 | $ | 105,422 | | | $ | 67,709 | | | $ | 171,730 | |
The following table presents the amount of cash contributions we anticipate making into the plans during fiscal 2021 (in thousands):
| | | | | | | | | | | |
| | U.S. Plans | | Non-U.S. Plans |
| Anticipated cash contributions | $ | — | | | $ | 31,258 | |
The following table presents the total benefit payments expected to be paid to plan participants during each of the next five fiscal years, and in total for the five years thereafter (in thousands):
| | | | | | | | | | | |
| | U.S. Plans | | Non-U.S. Pans |
| 2021 | $ | 34,757 | | | $ | 70,264 | |
| 2022 | 32,690 | | | 69,594 | |
| 2023 | 32,022 | | | 71,386 | |
| 2024 | 30,710 | | | 72,131 | |
| 2025 | 29,312 | | | 73,217 | |
| For the periods 2026 through 2030 | 129,516 | | | 406,156 | |
JACOBS ENGINEERING GROUP INC. AND SUBSIDIARIES
NOTES TO CONSOLIDATED FINANCIAL STATEMENTS - (Continued)
The following table presents the components of net periodic benefit cost for the Company’s U.S. plans recognized in the accompanying Consolidated Statements of Earnings for the years ended October 2, 2020, September 27, 2019 and September 28, 2018 (in thousands):
| | | | | | | | | | | | | | | | | |
| | October 2, 2020 | | September 27, 2019 | | September 28, 2018 |
| Service cost | $ | 409 | | | $ | 2,784 | | | $ | 4,765 | |
| Interest cost | 12,673 | | | 16,697 | | | 13,778 | |
| Expected return on plan assets | (17,670) | | | (21,508) | | | (19,663) | |
| Actuarial loss | 3,518 | | | 3,026 | | | 3,845 | |
| Prior service cost | 323 | | | — | | | — | |
| Net pension cost, before special items | $ | (747) | | | $ | 999 | | | $ | 2,725 | |
| Curtailment expense/Settlement (gain) loss | 3,436 | | | (35,020) | | | 4,146 | |
| Total net periodic pension cost recognized | $ | 2,689 | | | $ | (34,021) | | | $ | 6,871 | |
The following table presents the components of net periodic benefit cost for the Company’s Non-U.S. plans recognized in the accompanying Consolidated Statements of Earnings for the years ended October 2, 2020, September 27, 2019 and September 28, 2018 (in thousands):
| | | | | | | | | | | | | | | | | |
| | October 2, 2020 | | September 27, 2019 | | September 28, 2018 |
| Service cost | $ | 5,710 | | | $ | 7,171 | | | $ | 8,269 | |
| Interest cost | 39,469 | | | 52,627 | | | 49,324 | |
| Expected return on plan assets | (93,407) | | | (82,274) | | | (83,328) | |
| Actuarial loss | 7,578 | | | 7,854 | | | 6,655 | |
| Prior service cost | 1,405 | | | 1,263 | | | (257) | |
| Net pension cost, before special items | $ | (39,245) | | | $ | (13,359) | | | $ | (19,337) | |
| Curtailment expense/Settlement (gain) loss | 1,341 | | | 1,933 | | | 1,268 | |
| Total net periodic pension (income) cost recognized | $ | (37,904) | | | $ | (11,426) | | | $ | (18,069) | |
| Total net periodic pension (income) cost recognized from Discontinued Operations | $ | — | | | $ | 2,282 | | | $ | 3,606 | |
| Total net periodic pension (income) cost recognized from Continuing Operations | $ | (37,904) | | | $ | (13,708) | | | $ | (21,675) | |
As a result of the adoption of ASU 2017-07, Compensation- Retirement Benefits (Topic 715): Improving the Presentation of Net Periodic Pension Cost and Net Periodic Postretirement Benefit Cost in the first quarter of fiscal 2019, the service cost component of net periodic pension expense has been presented in the same line item as other compensation costs (direct cost of contracts and selling, general and administrative expenses) and the other components of net periodic pension expense have been reclassified from selling, general and administrative expense and direct cost of contracts and instead presented in miscellaneous income (expense), net on the Consolidated Statements of Earnings for the year ended September 28, 2018 in the amount of $24.2 million.
In the first quarter of fiscal 2019, the Company elected to discontinue the CH2M Hill Retiree Medical Plan and the OMI Retiree Medical Plan, effective December 31, 2018. Lump sum payments were made to participants in fiscal 2019, resulting in a plan settlement and related settlement gain of $35.0 million recognized in fiscal 2019.
On January 1, 2019, the CH2M Hill Pension Plan and the CH2M Hill IDC Pension Plan merged into the Company's Sverdrup Pension Plan. The newly combined plan is called the Jacobs Consolidated Pension Plan.
Due to a ruling by the High Court in the United Kingdom regarding equalization between men and women of a tranche of pension (the Guaranteed Minimum Pension) accrued between 1990 and 1997, Jacobs measured the estimated impact of this ruling in its consolidated financial statements, resulting in an increase of approximately $38.2 million in the ASC 715 balance sheet liability in fiscal 2019, with an offset to other comprehensive income, net of tax. Additionally, the Company recognized an additional $1.5 million in additional net periodic benefit cost during the year ended September 27, 2019 as a result of the ruling.
JACOBS ENGINEERING GROUP INC. AND SUBSIDIARIES
NOTES TO CONSOLIDATED FINANCIAL STATEMENTS - (Continued)
Multiemployer Plans
In the U.S. and various other countries, we contribute to trusteed pension plans covering hourly and certain salaried employees under industry-wide agreements. Contributions are based on the hours worked by employees covered under these agreements and are charged to direct costs of contracts on a current basis.
The majority of the contributions the Company makes to multiemployer pension plans are outside the U.S. With respect to these multiemployer plans, the Company's liability to fund these plans is generally limited to the contributions we are required to make under collective bargaining agreements.
Based on our review of our multiemployer pension plans under the guidance provided in ASU 2011-09— Compensation-Retirement Benefits-Multiemployer Plans, we have concluded that none of the multiemployer pension plans into which we contribute are individually significant to our Consolidated Financial Statements. Additionally, in fiscal year 2019, all Canadian and some US and European multiemployer plans were sold in connection with the ECR sale, which resulted in a year over year decrease in contributions made.
The following table presents the Company’s contributions to these multiemployer plans for the years ended October 2, 2020, September 27, 2019 and September 28, 2018 (in thousands):
| | | | | | | | | | | | | | | | | |
| | October 2, 2020 | | September 27, 2019 | | September 28, 2018 |
| Canada | $ | — | | | $ | 16,625 | | | $ | 36,354 | |
| Europe | 1,922 | | | 9,413 | | | 10,677 | |
| United States | 6,637 | | | 7,149 | | | 9,536 | |
| Contributions to multiemployer pension plans | $ | 8,559 | | | $ | 33,187 | | | $ | 56,567 | |
JACOBS ENGINEERING GROUP INC. AND SUBSIDIARIES
NOTES TO CONSOLIDATED FINANCIAL STATEMENTS - (Continued)
14. Business Combinations
John Wood Group's Nuclear Business
On March 6, 2020, a subsidiary of Jacobs completed the acquisition of the nuclear consulting, remediation and program management business of John Wood Group, a U.K.-based energy services company, for an enterprise value of £246 million, or approximately $317.9 million, less cash acquired of $24.3 million, as updated for additional working capital adjustments. The John Wood Group nuclear business allows Jacobs to further expand its lifecycle nuclear services business. The following summarizes the fair values of John Wood Group's assets acquired and liabilities assumed as of the acquisition date (in millions):
| | | | | |
| Assets | |
| Cash and cash equivalents | $ | 24.3 | |
| Receivables | 75.9 | |
| Other current assets | 5.2 | |
| Property, equipment and improvements, net | 8.3 | |
| Goodwill | 205.8 | |
| Identifiable intangible assets | 80.0 | |
| Miscellaneous | 19.4 | |
| Total Assets | $ | 418.9 | |
| |
| Liabilities | |
| Accounts payable, accrued expenses and other current liabilities | $ | 71.8 | |
| Long term liabilities | 29.2 | |
Total Liabilities | 101.0 |
| Net assets acquired | $ | 317.9 | |
The purchase price allocation is based upon preliminary information and is subject to change when additional information is obtained. Goodwill recognized results from a substantial assembled workforce, which does not qualify for separate recognition, as well as expected future synergies from combining operations. None of the goodwill recognized is expected to be deductible for tax purposes. The Company has not completed its final assessment of the fair values of John Wood Group's assets acquired and liabilities assumed. The final purchase price allocation could result in adjustments to certain assets and liabilities, including the residual amount allocated to goodwill.
Identified intangibles include customer relationships, contracts and backlog and developed technology. The customer relationships, contracts and backlog intangible represents the fair value of existing contracts, underlying customer relationships and backlog. The customer relationships, contracts and backlog intangible and the developed technology intangible have lives of 12 and 15 years, respectively.
Fair value measurements relating to the John Wood Group nuclear business are made primarily using Level 3 inputs including discounted cash flow techniques. Fair value is estimated using inputs primarily for the income approach, which include the use of both the multiple period excess earnings method and the relief from royalties method. The significant assumptions used in estimating fair value include (i) the estimated life the asset will contribute to cash flows, such as attrition rate of customers or remaining contractual terms, (ii) profitability and (iii) the estimated discount rate that reflects the level of risk associated with receiving future cash flows. Other personal property assets, such as furniture, fixtures and equipment, are valued using the cost approach, which is based on replacement or reproduction costs of the asset less depreciation.
No summarized unaudited pro forma results are provided for the John Wood Group nuclear business due to the immateriality of this acquisition relative to the Company's consolidated financial position and results of operations.
JACOBS ENGINEERING GROUP INC. AND SUBSIDIARIES
NOTES TO CONSOLIDATED FINANCIAL STATEMENTS - (Continued)
KeyW
On June 12, 2019, Jacobs completed the acquisition of The KeyW Holding Corporation (“KeyW”), a U.S. based national security solutions provider to the intelligence, cyber, and counterterrorism communities by acquiring 100% of the outstanding shares of KeyW common stock (the "KeyW acquisition"). The KeyW acquisition allows Jacobs to further expand its government services business. The Company paid total consideration of $902.6 million which was comprised of approximately $604.2 million in cash to the former stockholders and certain equity award holders of KeyW and the assumption of KeyW’s debt of $298.4 million. The Company repaid all of KeyW's debt by the end of the fourth fiscal quarter of 2019.
The following summarizes the fair values of KeyW assets and acquired liabilities assumed as of the acquisition date (in millions):
| | | | | |
| Assets | |
| Cash and cash equivalents | $ | 29.1 | |
| Receivables | 79.1 | |
| Inventories, net | 19.3 | |
| Prepaid expenses and other | 2.4 | |
| Property, equipment and improvements, net | 24.5 | |
| Deferred tax asset and other | 37.8 | |
| Goodwill | 615.6 | |
| Identifiable intangible assets | 179.0 | |
| Total Assets | $ | 986.8 | |
| |
| Liabilities | |
| Accounts payable | $ | 8.3 | |
| Accrued expenses | 69.1 | |
| Short term debt | 298.4 | |
| Other current liabilities | 3.9 | |
| |
| Other non-current liabilities | 2.9 | |
| Total Liabilities | 382.6 | |
| Net assets acquired | $ | 604.2 | |
Goodwill recognized results from a substantial assembled workforce, which does not qualify for separate recognition, as well as expected future synergies from combining operations. Goodwill of $136.3 million is expected to be deductible for tax purposes. The Company has completed its final assessment of the fair values of the acquired assets and liabilities of KeyW. Since the initial preliminary estimates reported in the third quarter of fiscal 2019, the Company has updated certain amounts reflected in the final purchase price allocation, as summarized in the fair values of KeyW assets acquired and liabilities assumed as of the acquisition date as set forth above.
Identified intangibles include customer relationships, contracts and backlog and developed technology. The customer relationships, contracts and backlog intangible represents the fair value of existing contracts, underlying customer relationships and backlog. The customer relationships, contracts and backlog intangible, and the developed technology intangible have lives of 10 and 12 years, respectively. Other intangible liabilities consist of the fair value of office leases and have a weighted average life of approximately 9 years.
Fair value measurements relating to the KeyW acquisition are made primarily using Level 3 inputs including discounted cash flow techniques. Fair value is estimated using inputs primarily for the income approach, which include the use of both the multiple period excess earnings method and the relief from royalties method. The significant assumptions used in estimating fair value include (i) the estimated life the asset will contribute to cash flows, such as attrition rate of customers or remaining contractual terms, (ii) profitability and (iii) the estimated discount rate that reflects the level of risk associated with receiving future cash flows. Other personal property assets, such as furniture, fixtures and equipment, are valued using the cost approach, which is based on replacement or reproduction costs of the asset less depreciation.
JACOBS ENGINEERING GROUP INC. AND SUBSIDIARIES
NOTES TO CONSOLIDATED FINANCIAL STATEMENTS - (Continued)
For purposes of our comparative fiscal 2020 and 2019 reporting requirements in this Form 10-K, the following presents summarized unaudited pro forma operating results of the Company for the year ended September 27, 2019 assuming that the June 12, 2019 acquisition of KeyW had occurred at the beginning of fiscal 2018 for pro forma purposes. These pro forma operating results are presented for illustrative purposes only and are not indicative of the operating results that would have been achieved had the related events occurred on such date (in millions, except per share data):
| | | | | | | | |
| | For the Year Ended |
| | September 27, 2019 |
| Revenues | | $ | 13,068.7 | |
| Net earnings of the Group from Continuing Operations | | $ | 326.0 | |
| Net earnings (loss) attributable to Jacobs from continuing operations | | $ | 303.0 | |
| Net earnings (loss) attributable to Jacobs from continuing operations per share: | | |
| Basic earnings (loss) from continuing operations per share | | $ | 2.19 | |
| Diluted earnings (loss) from continuing operations per share | | $ | 2.17 | |
Included in the table above are the unaudited pro forma operating results of continuing operations. Also, income tax expense (benefit) for the fiscal year pro forma period ended September 27, 2019 was $41.3 million.
CH2M
On December 15, 2017, the Company completed the acquisition of CH2M HILL Companies, Ltd. ("CH2M"), an international provider of engineering, construction and technical services, by acquiring 100% of the outstanding shares of CH2M common stock and preferred stock (the "CH2M acquisition"). The purpose of the CH2M acquisition was to further diversify the Company’s presence in the water, nuclear and environmental remediation sectors and to further the Company’s profitable growth strategy. The Company paid total consideration of approximately $1.8 billion in cash (excluding $315.2 million of cash acquired) and issued approximately $1.4 billion of Jacobs’ common stock, or 20.7 million shares, to the former stockholders and certain equity award holders of CH2M. In connection with the CH2M acquisition, the Company also assumed CH2M’s revolving credit facility and second lien notes, including a $20.0 million prepayment penalty, which totaled approximately $700 million of long-term debt. Immediately following the effective time of the CH2M acquisition, the Company repaid CH2M’s revolving credit facility and second lien notes including the related prepayment penalty.
The following summarizes the estimated fair values of CH2M assets acquired and liabilities assumed as of the acquisition date (in millions):
JACOBS ENGINEERING GROUP INC. AND SUBSIDIARIES
NOTES TO CONSOLIDATED FINANCIAL STATEMENTS - (Continued)
| | | | | |
Assets | |
| Cash and cash equivalents | $ | 315.2 | |
| Receivables | 1,120.6 | |
| Prepaid expenses and other | 72.7 | |
| Property, equipment and improvements, net | 175.1 | |
| Goodwill | 3,165.5 | |
| Identifiable intangible assets: | |
| Customer relationships, contracts and backlog | 412.3 | |
| Lease intangible assets | 4.4 | |
| Total identifiable intangible assets | 416.7 | |
| Miscellaneous | 530.8 | |
| Total Assets | $ | 5,796.6 | |
| |
| Liabilities | |
| Notes payable | $ | 2.2 | |
| Accounts payable | 309.6 | |
| Accrued liabilities | 787.4 | |
| Contract liabilities | 260.8 | |
| Identifiable intangible liabilities: | |
| Lease intangible liabilities | 9.6 | |
| Long-term debt | 706.0 | |
| Other deferred liabilities | 659.0 | |
| Total Liabilities | $ | 2,734.6 | |
| Noncontrolling interests | (37.3) | |
| Net assets acquired | $ | 3,024.7 | |
Goodwill recognized results from a substantial assembled workforce, which does not qualify for separate recognition, as well as expected future synergies from combining operations. None of the goodwill recognized is expected to be deductible for tax purposes. During the first quarter of fiscal 2019, the Company completed its final assessment of the fair values of the acquired assets and liabilities of CH2M. Accrued liabilities and other deferred liabilities include approximately $404.7 million related to estimates for various legal and other pre-acquisition contingent liabilities accounted for under ASC 450. See Note 18- Contractual Guarantees, Litigation, Investigations and Insurance relating to CH2M contingencies.
Customer relationships, contracts and backlog represent the fair value of existing contracts, the underlying customer relationships and backlog of consolidated subsidiaries and have lives ranging from 9 to 11 years (weighted average life of approximately 10 years). Other intangible assets and liabilities primarily consist of the fair value of office leases and have a weighted average life of approximately 10 years.
Fair value measurements relating to the CH2M acquisition are made using Level 3 inputs including discounted cash flow techniques. Fair value is estimated using inputs primarily from the income approach, which include the use of both the multiple period excess earnings method and the relief from royalties method. The significant assumptions used in estimating fair value include (i) the estimated life the asset will contribute to cash flows, such as attrition rate of customers or remaining contractual terms, (ii) profitability and (iii) the estimated discount rate that reflect the level of risk associated with receiving future cash flows. The estimated fair value of land has been determined using the market approach, which arrives at an indication of value by comparing the site being valued to sites that have been recently acquired in arm’s-length transactions. Personal property assets with an active and identifiable secondary market are valued using the market approach. Buildings and land improvements are valued using the cost approach using a direct cost model built on estimates of replacement cost. Other personal property assets such as furniture, fixtures and equipment are valued using the cost approach which is based on replacement or reproduction costs of the asset less depreciation.
JACOBS ENGINEERING GROUP INC. AND SUBSIDIARIES
NOTES TO CONSOLIDATED FINANCIAL STATEMENTS - (Continued)
From the acquisition date of December 15, 2017 through September 28, 2018, CH2M consolidated, including both continuing and discontinued operations, contributed approximately $3.8 billion in revenue and $185.9 million in pretax income included in the accompanying consolidated statement of earnings. Included in these results were approximately $99.3 million in pre-tax restructuring and transaction costs.
Transaction costs associated with the CH2M acquisition in the accompanying consolidated statements of earnings for the year ended September 28, 2018 are comprised of the following (in millions):
| | | | | |
| For the Year Ended |
| September 28, 2018 |
| Personnel costs | $ | 50.2 | |
| Professional services and other expenses | 27.5 | |
| Total | $ | 77.7 | |
Personnel costs above include change of control payments and related severance costs.
The following presents summarized unaudited pro forma operating results assuming that the Company had acquired CH2M at October 1, 2016. These pro forma operating results are presented for illustrative purposes only and are not indicative of the operating results that would have been achieved had the related events occurred (in millions). Additionally, these pro forma operating results have not been recast for the sale of our ECR business.
| | | | | |
| For the Year Ended |
| September 28, 2018 |
| Revenues | $ | 16,012.4 | |
| Net earnings | $ | 196.3 | |
| Net earnings (loss) attributable to Jacobs | $ | 184.5 | |
| Net earnings (loss) attributable to Jacobs per share: | |
| Basic earnings (loss) per share | $ | 1.28 | |
| Diluted earnings (loss) per share | $ | 1.27 | |
Included in the unaudited pro forma operating results are charges relating to transaction expenses, severance expense and other items that are removed from the year ended September 28, 2018 and are reflected in the year ended September 29, 2017 due to the assumed timing of the transaction. Also, income tax expense (benefit) for the twelve- month pro forma period ended September 28, 2018 was $409.7 million.
15. Sale of Energy, Chemicals and Resources ("ECR") Business
On April 26, 2019, Jacobs completed the sale of its ECR business to Worley for a purchase price of $3.4 billion consisting of (i) $2.8 billion in cash plus (ii) 58.2 million ordinary shares of Worley, subject to adjustments for changes in working capital and certain other items (the “ECR sale”). The stock and asset purchase agreement for the ECR sale contained a restriction on our ability to sell the Worley shares received in the transaction, which expired in the first fiscal quarter of 2020.
Discontinued Operations
As a result of the ECR sale, substantially all ECR-related assets and liabilities have been sold (the "Disposal Group"). We determined that the Disposal Group should be reported as discontinued operations in accordance with ASC 210-05, Discontinued Operations because their disposal represents a strategic shift that had a major effect on our operations and financial results. As such, the financial results of the ECR business are reflected in our Consolidated Statements of Earnings as discontinued operations for all periods presented. As of the year ended October 2, 2020, all of the ECR business to be sold under the terms of the sale has been conveyed to Worley and as such, no amounts remain held for sale.
JACOBS ENGINEERING GROUP INC. AND SUBSIDIARIES
NOTES TO CONSOLIDATED FINANCIAL STATEMENTS - (Continued)
Summarized Financial Information of Discontinued Operations
The following table represents earnings (loss) from discontinued operations, net of tax (in thousands):
| | | | | | | | | | | | | | | | | |
| For the Years Ended (1) |
| October 2, 2020 | | September 27, 2019 | | September 28, 2018 |
| Revenues | $ | 11,235 | | | $ | 2,725,699 | | | $ | 4,404,873 | |
| Direct cost of contracts | (6,152) | | | (2,338,113) | | | (3,756,263) | |
| Gross profit | 5,083 | | | 387,586 | | | 648,610 | |
| Selling, general and administrative expenses | 32,668 | | | (320,264) | | | (412,282) | |
| Operating Profit (Loss) | 37,751 | | | 67,322 | | | 236,328 | |
| Gain on sale of ECR business | 110,236 | | | 935,110 | | | — | |
| Other (expense) income, net | 515 | | | (47,390) | | | (12,604) | |
| Earnings Before Taxes from Discontinued Operations | 148,502 | | | 955,042 | | | 223,724 | |
| Income Tax Expense | (10,518) | | | (395,828) | | | (55,931) | |
| Net Earnings of the Group from Discontinued Operations | $ | 137,984 | | | $ | 559,214 | | | $ | 167,793 | |
(1) The ECR business was sold April 26, 2019, therefore the year ended September 27, 2019 includes only seven months of results.
Selling, general and administrative expenses includes a reduction for net insurance recoveries of approximately $40.0 million for the year ended October 2, 2020 recorded in connection with the Nui Phao ("NPMC") legal matter described in Note 18- Contractual Guarantees, Litigations, Investigations and Insurance. Additionally, the year ended September 27, 2019 includes a charge for the award and recovery of costs, estimated related interest and attorneys' fees related to the NPMC legal matter. For the year ended October 2, 2020, the gain on sale of $110.2 million relates mainly to the recognition of the deferred gain for the delayed transfer of the ECR-related assets and liabilities of the two international entities discussed below, adjustments for working capital and certain other items in connection with the ECR sale and additional income for the release of a deferred gain upon achievement of the IT Migration Date described below in connection with the delivery to Worley of certain IT application and hardware assets related to the ECR business. For the year ended September 27, 2019, other expense (income), net was comprised of $35.0 million in interest expense relating to the Nui Phao settlement, $6.0 million in foreign currency revaluations, $9.6 million in loss on the sale of a joint venture which is offset by $4.4 million in miscellaneous income. For the year ended September 28, 2018, other expense (income), net was comprised of an approximate $21.0 million loss on the sale of the Guimar joint venture, offset by $8.4 million in miscellaneous income.
The following tables represent the assets and liabilities held for sale (in thousands):
| | | | | |
| September 27, 2019 |
| Cash and cash equivalents | $ | — | |
| Receivables and contract assets | 871 | |
| Prepaid expenses and other | 81 | |
| Current assets held for sale (1) | $ | 952 | |
| | | | | |
| Property, Equipment and Improvements, net | $ | 1,643 | |
| Goodwill | 24,896 | |
| Intangibles, net | — | |
| Miscellaneous | 439 | |
| Noncurrent assets held for sale (1) | $ | 26,978 | |
JACOBS ENGINEERING GROUP INC. AND SUBSIDIARIES
NOTES TO CONSOLIDATED FINANCIAL STATEMENTS - (Continued)
| | | | | |
| Notes payable | $ | — | |
| Accounts payable | — | |
| Accrued liabilities | 2,495 | |
| Contract liabilities | 78 | |
| Current liabilities held for sale (1) | $ | 2,573 | |
(1)At September 27, 2019, current assets held for sale and noncurrent assets held for sale were included in the within prepaid expenses and other and miscellaneous, respectively. At September 27, 2019, current liabilities held for sale and noncurrent liabilities held for sale were included within accrued liabilities and other deferred liabilities, respectively.
The significant components included in our Consolidated Statements of Cash Flows for discontinued operations are as follows (in thousands):
| | | | | |
| For the Year Ended |
| September 27, 2019 |
| Depreciation and amortization: | |
| Property, equipment and improvements | $ | 2,110 | |
| Intangible assets | $ | 614 | |
| Additions to property and equipment | $ | (9,204) | |
| Stock based compensation | $ | 10,852 | |
Gain on Sale and Deferred Gain
As a result of the ECR sale, the Company recognized a pre-tax gain of $1.0 billion, $935.1 million of which was recognized in fiscal 2019 and $110.2 million of which is included in Net Earnings of the Group from Discontinued Operations on the consolidated statement of earnings for the year ended October 2, 2020, which is further discussed below.
Upon closing the ECR sale, the Company retained a noncontrolling interest (with significant influence) in P&PS-related activities in one international legal entity acquired by Worley. The fair value of the Company’s retained interest in the net assets and liabilities of this entity was estimated at $33.0 million and recorded at closing. For another international legal entity, the closing and transfer of ECR-related assets to Worley were set to occur at a future date. At the time of the ECR sale, the Company allocated proceeds received to these deferred closing items on a relative fair value basis and recognized a deferred gain of $34.4 million. During the second fiscal quarter of 2020, the delayed transfer of the ECR-related assets and liabilities of these two international entities occurred, and as a result, previously deferred gain amounts were recognized.
In addition to consideration received for the sale of the ECR business, the proceeds received included advanced consideration for the Company to deliver IT application and related hardware assets at a future date (“IT Migration Date”) to Worley upon completion of the interim transition services provided under the TSA, described further below. This deliverable of IT assets is considered to be a separate element of the ECR business sale transaction, and accordingly, we have allocated a portion of the proceeds received of $95.3 million on a relative fair value basis to this separate deliverable and recognized deferred income. Upon completion and acceptance of this deliverable by Worley in December 2019, the deferred proceeds were recognized in earnings from discontinued operations, along with expenses associated with any costs incurred and deferred by the Company for this deliverable.
Investment in Worley Stock
As discussed above, the Company received 58.2 million in ordinary shares of Worley in connection with the ECR sale. Pursuant to the purchase agreement for the ECR sale, 51.4 million of the shares were considered "restricted" during a lock-up period ending in December 2019. During the lock-up period, Jacobs could not, without Worley's consent, directly or indirectly dispose of the "restricted" shares. The remaining 6.8 million shares not considered "restricted" were sold in fiscal 2019, netting a loss of $4.9 million, which was recognized in miscellaneous income (expense), net. Dividend income and unrealized gains and losses on changes in fair value of Worley shares are recognized in miscellaneous income (expense), net in continuing operations.
JACOBS ENGINEERING GROUP INC. AND SUBSIDIARIES
NOTES TO CONSOLIDATED FINANCIAL STATEMENTS - (Continued)
The Company's investment in Worley is measured at fair value through net income as it is an equity investment with a readily determinable fair value based on quoted market prices. The 51.4 million ordinary shares currently held are recorded within investment in equity securities in the Company's Consolidated Balance Sheets at their estimated fair value, which is $347.5 million as of October 2, 2020 and $451.1 million as of September 27, 2019. For the years ended October 2, 2020 and September 27, 2019, the Company recognized a loss of $103.6 million and a loss of $78.1 million, respectively, associated with share price and currency changes on this investment, as well as dividend income related to the equity investment in the amount of $16.9 million and $5.2 million, respectively. Quoted market prices are available for these securities in an active market and therefore categorized as a Level 1 input.
Transition Services Agreement
Upon closing of the ECR sale, the Company entered into a Transition Services Agreement (the "TSA") with Worley pursuant to which the Company, on an interim basis, provided various services to Worley including executive consultation, corporate, information technology, and project services. The initial term of the TSA began immediately following the closing of the ECR sale on April 26, 2019 and expired in April 2020, although the parties mutually agreed to extend certain of the services for additional time periods beyond the initial term. All services under the TSA were terminated in October 2020. Pursuant to the terms of the TSA, the Company received payments for the interim services which approximate costs incurred to perform the services. The Company has recognized costs recorded in SG&A expense incurred to perform the TSA, offset by $15.8 million and $35.4 million in TSA related income for such services that is reported in miscellaneous income (expense) in continuing operations for the year ended October 2, 2020 and September 27, 2019, respectively, before inclusion of certain incremental outside service support costs agreed to be shared equally by the parties.
JACOBS ENGINEERING GROUP INC. AND SUBSIDIARIES
NOTES TO CONSOLIDATED FINANCIAL STATEMENTS - (Continued)
16. Restructuring and Other Charges
During fiscal 2020, the Company implemented certain restructuring and separation initiatives, including the Company's fourth quarter fiscal 2020 transformation initiatives relating to real estate and other staffing programs. The activities of these initiatives are expected to continue into fiscal 2023.
During fiscal 2019 and continuing into fiscal 2020, the Company implemented certain restructuring and separation initiatives associated with the ECR sale, the KeyW acquisition, and other related cost reduction initiatives. Additionally, in fiscal 2020, the Company implemented certain restructuring and separation initiatives associated with the acquisition of John Wood Group's nuclear business. The restructuring activities and related costs were comprised mainly of separation and lease abandonment and sublease programs, while the separation activities and costs were mainly related to the engagement of consulting services and internal personnel and other related costs dedicated to the Company’s ECR-business separation. The activities of these initiatives are expected to be substantially completed before the end of fiscal 2021.
During the fourth fiscal quarter of 2017, the Company implemented certain restructuring and pre-integration plans associated with the then-pending acquisition of CH2M, which closed on December 15, 2017. The restructuring activities and related costs under these plans were comprised mainly of severance and lease abandonment programs, while the integration activities and costs were mainly related to the engagement of professional services and internal personnel and other related costs dedicated to the Company’s integration management efforts. Following the closing of the CH2M acquisition, these activities have continued through fiscal 2020 and are expected to be substantially completed before the end of fiscal 2022.
Collectively, the above-mentioned restructuring activities are referred to as “Restructuring and other charges”.
The following table summarizes the impacts of the Restructuring and other charges by LOB in connection with the CH2M, KeyW and John Wood Group nuclear business acquisitions, the ECR sale and the Company's fourth quarter fiscal 2020 transformation initiatives relating to real estate and other staffing programs for the year ended October 2, 2020, the CH2M and KeyW acquisitions and the ECR sale for the year ended September 27, 2019 and the CH2M acquisition for the year ended September 28, 2018 (in thousands):
| | | | | | | | | | | | | | | | | |
| October 2, 2020 | | September 27, 2019 | | September 28, 2018 |
| Critical Mission Solutions | $ | 24,083 | | | $ | 17,989 | | | 20,254 | |
| People & Places Solutions | 170,631 | | | 108,835 | | | 56,238 | |
| Corporate | 129,469 | | | 184,646 | | | 77,148 | |
| Continuing Operations (1) | 324,183 | | | 311,470 | | | 153,640 | |
| Energy, Chemicals and Resources (included in Discontinued Operations) | — | | | (138) | | | 37,166 | |
| Total | $ | 324,183 | | | $ | 311,332 | | | $ | 190,806 | |
(1)For the years ended October 2, 2020, September 27, 2019 and September 28, 2018, amounts include $321.6 million, $337.0 million and $154.0 million, respectively, in items impacting operating profit, along with items recorded in other income (expense), net, which are the loss on settlement of the CH2M portion of the U.S. pension plan of $2.1 million for the year ended October 2, 2020, the gain on the settlement of the CH2M retiree medical plans of $35.0 million for the year ended September 27, 2019 and the write-off of fixed assets related to restructured leases of $10 million for the year ended September 27, 2019 and other miscellaneous adjustments of $(0.5) million, $0.5 million and $0.3 million for the years ended October 2, 2020, September 27, 2019 and September 28, 2018, respectively. See Note 19- Segment Information.
The activity in the Company’s accrual for the Restructuring and other charges including the program activities described above for the year ended October 2, 2020 is as follows (in thousands):
| | | | | |
| Balance at September 27, 2019 | $ | 162,702 | |
| Transfer to lease right-of-use asset as a result of adoption of ASC 842 (1) | (116,797) | |
| Net Charges | 324,183 | |
| Payments & Usage | (317,234) | |
| Balance at October 2, 2020 | $ | 52,854 | |
(1)In addition, there was $24.6 million in lease cease-use liabilities relating to 2015 restructuring initiatives which were reclassified to ROU asset balances in accordance with the adoption of ASC 842, see Note 10- Leases. The 2015 restructuring initiatives are no longer active and therefore activity associated with lease cease-use liabilities for those initiatives is not included in the table.
JACOBS ENGINEERING GROUP INC. AND SUBSIDIARIES
NOTES TO CONSOLIDATED FINANCIAL STATEMENTS - (Continued)
The following table summarizes the Restructuring and other charges by major type of costs for the years ended October 2, 2020, September 27, 2019 and September 28, 2018 (in thousands):
| | | | | | | | | | | | | | | | | |
| October 2, 2020 | | September 27, 2019 | | September 28, 2018 |
| Lease Abandonments and Impairments | $ | 151,150 | | | $ | 99,976 | | | $ | 61,526 | |
| Voluntary and Involuntary Terminations | 53,484 | | | 33,742 | | | 29,056 | |
| Outside Services | 88,476 | | | 133,148 | | | 35,987 | |
| Other (1) | 31,073 | | | 44,604 | | | 27,071 | |
| Total | $ | 324,183 | | | $ | 311,470 | | | $ | 153,640 | |
(1)Includes $35.0 million in pre-tax gains associated with the Company's CH2M retiree medical plan settlement during the year ended September 27, 2019.
Cumulative amounts since 2017 incurred to date under our various restructuring and other activities described above by each major type of cost as of October 2, 2020 are as follows (in thousands):
| | | | | |
| Lease Abandonments and Impairments | $ | 313,517 | |
| Voluntary and Involuntary Terminations | 128,969 | |
| Outside Services | 259,124 | |
| Other (1) | 100,314 | |
| Total | $ | 801,924 | |
(1)Includes $35.0 million in pre-tax gains associated with the Company's CH2M retiree medical plan settlement during the year ended September 27, 2019.
JACOBS ENGINEERING GROUP INC. AND SUBSIDIARIES
NOTES TO CONSOLIDATED FINANCIAL STATEMENTS - (Continued)
17. Commitments and Contingencies and Derivative Financial Instruments
Derivative Financial Instruments
The Company is exposed to interest rate risk under its variable rate borrowings and additionally, due to the nature of the Company's international operations, we are at times exposed to foreign currency risk. As such, we sometimes enter into foreign exchange contracts and interest rate contracts in order to limit our exposure to fluctuating foreign currencies and interest rates.
In fiscal 2020 we entered into interest rate swap agreements with a notional value of $783.7 million as of October 2, 2020 to manage the interest rate exposure on our variable rate loans. Additionally, we entered into a cross-currency swap agreement with a notional value of $127.8 million to manage the interest rate and foreign currency exposure on our USD borrowings by a European subsidiary. By entering into the swap agreements, the Company converted the LIBOR rate based liability into a fixed rate liability and, for the cross currency swap, our LIBOR rate based borrowing in USD to a fixed rate Euro liability, for periods ranging from three and a half to ten years. Under the interest rate swap agreements, the Company receives the one month LIBOR rate and pays monthly a fixed rate ranging from .704% to 1.116%, and under the cross currency swap agreement, the Company receives the one month LIBOR rate plus 0.875% in USD and pays monthly a Euro fixed rate of .726% to .746% for the term of the swaps. The swaps were designated as cash-flow hedges in accordance with ASC 815, Derivatives and Hedging. The fair value of the interest rate and cross currency swaps at October 2, 2020 was $(31.5) million, which is included in other deferred liabilities on the consolidated balance sheet. The unrealized net losses on these interest rate and cross currency swaps was $14.6 million, net of tax, and was included in accumulated other comprehensive income as of October 2, 2020.
Additionally, at October 2, 2020, the Company held foreign exchange forward contracts in currencies that support our operations, including British Pound, Euro, Australian Dollar and other currencies, with notional values of $393.7 million at October 2, 2020. The length of these contracts currently ranges from one to twelve months. The fair value of the foreign exchange contracts at October 2, 2020 was $53.5 million, which is included in current assets within receivables and contract assets on the consolidated balance sheet and with associated income statement impacts included in miscellaneous income (expense) in the consolidated statement of earnings.
The fair value measurements of these derivatives are being made using Level 2 inputs under ASC 820, Fair Value Measurement, as the measurements are based on observable inputs other than quoted prices in active markets. We are exposed to risk from credit-related losses resulting from nonperformance by counterparties to our financial instruments. We perform credit evaluations of our counterparties under forward exchange and interest rate contracts and expect all counterparties to meet their obligations. We have not experienced credit losses from our counterparties.
Letters of Credit
At October 2, 2020, the Company had issued and outstanding approximately $263.0 million in LOCs and $2.3 billion in surety bonds. Of the outstanding LOC amount, $2.3 million has been issued under the Revolving Credit Facility and $260.7 million are issued under separate, committed and uncommitted letter-of-credit facilities.
18. Contractual Guarantees, Litigation, Investigations and Insurance
In the normal course of business, we make contractual commitments some of which are supported by separate guarantees; and on occasion we are a party in a litigation or arbitration proceeding. The litigation or arbitration in which we are involved primarily includes personal injury claims, professional liability claims and breach of contract claims. Where we provide a separate guarantee it is strictly in support of the underlying contractual commitment. Guarantees take various forms including surety bonds required by law, or standby letters of credit ("LOC") (also referred to as “bank guarantees”) or corporate guarantees given to induce a party to enter into a contract with a subsidiary. Standby LOCs are also used as security for advance payments or in various other transactions. The guarantees have various expiration dates ranging from an arbitrary date to completion of our work (e.g., engineering only) to completion of the overall project. See Note 17- Commitments and Contingencies and Derivative Financial Instruments for more information surrounding LOCs and surety bonds.
JACOBS ENGINEERING GROUP INC. AND SUBSIDIARIES
NOTES TO CONSOLIDATED FINANCIAL STATEMENTS - (Continued)
We maintain insurance coverage for most insurable aspects of our business and operations. Our insurance programs have varying coverage limits depending upon the type of insurance, and include certain conditions and exclusions which insurance companies may raise in response to any claim that the Company brings. We have also elected to retain a portion of losses and liabilities that occur through the use of various deductibles, limits, and retentions under our insurance programs. As a result, we may be subject to a future liability for which we are only partially insured or completely uninsured. We intend to mitigate any such future liability by continuing to exercise prudent business judgment in negotiating the terms and conditions of the contracts which the Company enters with its clients. Our insurers are also subject to business risk and, as a result, one or more of them may be unable to fulfill their insurance obligations due to insolvency or otherwise.
Additionally, as a contractor providing services to the U.S. federal government we are subject to many types of audits, investigations and claims by, or on behalf of, the government including with respect to contract performance, pricing, cost allocations, procurement practices, labor practices and socioeconomic obligations. Furthermore, our income, franchise and similar tax returns and filings are also subject to audit and investigation by the Internal Revenue Service, most states within the U.S., as well as by various government agencies representing jurisdictions outside the U.S.
Our Consolidated Balance Sheets include amounts representing our probable estimated liability relating to such claims, guarantees, litigation, audits and investigations. We perform an analysis to determine the level of reserves to establish for insurance-related claims that are known and have been asserted against us, and for insurance-related claims that are believed to have been incurred based on actuarial analysis, but have not yet been reported to our claims administrators as of the respective balance sheet dates. We include any adjustments to such insurance reserves in our consolidated results of operations. Insurance recoveries are recorded as assets if recovery is probable and estimated liabilities are not reduced by expected insurance recoveries.
The Company believes, after consultation with counsel, that such guarantees, litigation, U.S. government contract-related audits, investigations and claims and income tax audits and investigations should not have a material adverse effect on our consolidated financial statements, beyond amounts currently accrued.
On September 30, 2015, Nui Phao Mining Company Limited (“NPMC”) commenced arbitration proceedings against Jacobs E&C Australia Pty Limited (“Jacobs E&C”) in Singapore before the Singapore International Arbitration Centre. Jacobs E&C was engaged by NPMC for the provision of management, design, engineering, and procurement services for a Nui Phao mine/mineral processing project in Vietnam as part of the Company’s former Energy, Chemicals & Resources (“ECR”) line of business. A three-week hearing on the merits concluded on December 15, 2017, and on March 28, 2019, the arbitration panel issued a decision finding against Jacobs E&C. On August 30, 2019, NPMC and Jacobs E&C settled all of the proceedings related to this matter. Under the terms of the settlement, Jacobs E&C made a payment to NPMC in the amount of $130.0 million in the fourth fiscal quarter of 2019. The settlement otherwise remains confidential. During the year ended October 2, 2020, the Company recognized the reduction of $40.0 million of selling, general and administrative expenses in discontinued operations as a result of the realization of related net insurance recoveries. Under the terms of the sale of the Company's ECR business to Worley on April 26, 2019, the Company retained liability with respect to this matter.
In 2012, CH2M HILL Australia Pty Limited, a subsidiary of CH2M, entered into a 50/50 integrated joint venture with Australian construction contractor UGL Infrastructure Pty Limited. The joint venture entered into a Consortium Agreement with General Electric and GE Electrical International Inc. The Consortium was awarded a subcontract by JKC Australia LNG Pty Limited ("JKC") for the engineering, procurement, construction and commissioning of a 360 MW Combined Cycle Power Plant for INPEX Operations Australia Pty Limited at Blaydin Point, Darwin, NT, Australia. In January 2017, the Consortium terminated the Subcontract because of JKC’s repudiatory breach and demobilized from the work site. JKC claimed the Consortium abandoned the work and itself purported to terminate the Subcontract. The Consortium and JKC are now in dispute over the termination. In August 2017, the Consortium filed an International Chamber of Commerce arbitration against JKC and is seeking compensatory damages in the amount of approximately $530.0 million for repudiatory breach or, in the alternative, seeking damages for unresolved contract claims and change orders. JKC is seeking damages in excess of $1.7 billion and has drawn on the bonds. In light of the COVID-19 pandemic, a November 2020 date for commencement of the hearing has been vacated and the hearing has been rescheduled for opening arguments in April and the remaining proceedings in July and August 2021. Although an earlier decision is possible, no decision is expected before 2022. In September 2018, JKC filed a declaratory judgment action in Western Australia alleging that the entities which executed parent company guaranties for the Consortium, including CH2M Hill Companies, Ltd., have an obligation to pay JKC’s ongoing costs to complete the project after termination. A hearing on that matter was held in March 2019, and a decision in favor of the Consortium was issued. JKC appealed the decision, a hearing on the
JACOBS ENGINEERING GROUP INC. AND SUBSIDIARIES
NOTES TO CONSOLIDATED FINANCIAL STATEMENTS - (Continued)
appeal took place in March 2020 and a decision was handed down on July 22, 2020 denying JKC’s appeal in its entirety. If the Consortium is found liable, these matters could have a material adverse effect on the Company’s business, financial condition, results of operations and /or cash flows, particularly in the short term. However, the Consortium has denied liability and is vigorously defending these claims and pursuing its affirmative claims against JKC, and based on the information currently available, the Company does not expect the resolution of this matter to have a material adverse effect on the Company’s business, financial condition, results of operations or cash flows, in excess of the current reserve for this matter. See Note 14- Business Combinations, for further information related to CH2M contingencies.
On December 22, 2008, a coal fly ash pond at the Kingston Power Plant of the Tennessee Valley Authority ("TVA") was breached, releasing fly ash waste into the Emory River and surrounding community. In February 2009, TVA awarded a contract to the Company to provide project management services associated with the clean-up. All remediation and dredging were completed in August 2013 by other contractors under direct contracts with TVA. The Company did not perform the remediation, and its scope was limited to program management services. Certain employees of the contractors performing the cleanup work on the project filed lawsuits against the Company beginning in August 2013, alleging they were injured due to the Company's failure to protect the plaintiffs from exposure to fly ash, and asserting related personal injuries. There are currently six separate cases pending against the Company. The primary case, Greg Adkisson, et al. v. Jacobs Engineering Group Inc., case No. 3:13-CV-505-TAV-HBG, filed in the U.S. District Court for the Eastern District of Tennessee, consists of 10 consolidated cases. This case and the related cases involve several hundred plaintiffs that have been filed against the Company by employees of the contractors that completed the remediation and dredging work. The cases are at various stages of litigation, and several of the cases are currently stayed pending resolution of other cases. Separately, in May 2019, Roane County and the cities of King and Herriman filed a claim against TVA and the Company alleging that they misled the public about risks associated with the released fly ash. In October 2020, the Court granted Jacobs and TVA’s motion to dismiss with prejudice the Roane County litigation based on the expiration of the applicable statute of limitations. In addition, in November 2019, a resident of Roane County filed a putative class action against TVA and the Company alleging they failed to adequately warn local residents about risks associated with the released fly ash. In February 2020, the Company learned that the district attorney in Roane County recommended that the Tennessee Bureau of Investigation investigate issues pertaining to clean up worker safety at Kingston, with that investigation still pending. There has been no finding of liability against the Company or that any of the alleged illnesses are the result of exposure to fly ash in any of the above matters. The Company disputes the claims asserted in all of the above matters and is vigorously defending these claims. The Company does not expect the resolution of these matters to have a material adverse effect on the Company's business, financial condition, results of operations or cash flows.
On October 31, 2019, the Company received a request from the Enforcement Division of the Securities and Exchange Commission (the "SEC") for the voluntary production of certain information and documents. The information and documents sought by the SEC primarily relate to the operations of a joint venture in Morocco which was at one time partially-owned by the Company (and subsequently divested), including in respect of possible corrupt practices. The Company is fully cooperating with the SEC and is producing the requested information and documents in its possession. The Company does not expect the resolution of this matter to have a material adverse effect on the Company's business, financial condition, results of operations or cash flows.
19. Segment Information
The Company's two operating segments and global lines of business ("LOBs") are as follows: Critical Mission Solutions ("CMS") and People & Places Solutions ("P&PS"), with the previous Energy, Chemicals and Resources ("ECR") LOB reported as discontinued operations. For further information on ECR, refer to Note 15- Sale of Energy, Chemicals and Resources ("ECR") Business.
The Company’s Chair and Chief Executive Officer is the Chief Operating Decision Maker (“CODM”) and can evaluate the performance of each of these segments and make appropriate resource allocations among each of the segments. For purposes of the Company’s goodwill impairment testing, it has been determined that the Company’s operating segments are also its reporting units based on management’s conclusion that the components comprising each of its operating segments share similar economic characteristics and meet the aggregation criteria for reporting units in accordance with ASC 350, Intangibles-Goodwill and Other.
Under this organization, the sales function is managed by LOB, and accordingly, the associated cost is embedded in the segments and reported to the respective head of each LOB. In addition, a portion of the costs of other support functions (e.g., finance, legal, human resources, and information technology) is allocated to each LOB using methodologies
JACOBS ENGINEERING GROUP INC. AND SUBSIDIARIES
NOTES TO CONSOLIDATED FINANCIAL STATEMENTS - (Continued)
which, we believe, effectively attribute the cost of these support functions to the revenue generating activities of the Company on a rational basis. The cost of the Company’s cash incentive plan, the Leadership Performance Plan ("LPP"), formerly named the Management Incentive Plan, and the expense associated with the Jacobs Engineering Group Inc. 1999 Stock Incentive Plan (“1999 SIP”) have likewise been charged to the LOBs except for those amounts determined to relate to the business as a whole (which amounts remain in other corporate expenses).
Financial information for each LOB is reviewed by the CODM to assess performance and make decisions regarding the allocation of resources. The Company generally does not track assets by LOB, nor does it provide such information to the CODM.
The CODM evaluates the operating performance of our LOBs using segment operating profit, which is defined as margin less “corporate charges” (e.g., the allocated amounts described above). The Company incurs certain Selling, General and Administrative costs (“SG&A”) that relate to its business as a whole which are not allocated to the LOBs.
The following tables present total revenues and segment operating profit for each reportable segment (in thousands) and includes a reconciliation of segment operating profit to total U.S. GAAP operating profit by including certain corporate-level expenses and expenses relating to the restructuring and other charges and transaction costs associated with the CH2M transaction and integration costs and the ECR sale (in thousands).
| | | | | | | | | | | | | | | | | |
| For the Years Ended |
| October 2, 2020 | | September 27, 2019 | | September 28, 2018 |
| Revenues from External Customers: | | | | | |
| Critical Mission Solutions | $ | 4,965,952 | | | $ | 4,551,162 | | | $ | 3,725,365 | |
| People & Places Solutions | 8,601,023 | | | 8,186,706 | | | 6,854,408 | |
| Total | $ | 13,566,975 | | | $ | 12,737,868 | | | $ | 10,579,773 | |
| | | | | | | | | | | | | | | | | |
| For the Years Ended |
| October 2, 2020 | | September 27, 2019 | | September 28, 2018 |
| Segment Operating Profit: | | | | | |
| Critical Mission Solutions (1) | $ | 372,070 | | | $ | 310,043 | | | $ | 255,718 | |
| People & Places Solutions (2) | 740,707 | | | 714,394 | | | 527,900 | |
| Total Segment Operating Profit | 1,112,777 | | | 1,024,437 | | | 783,618 | |
| Other Corporate Expenses (3) | (249,391) | | | (264,351) | | | (161,788) | |
| Restructuring, Transaction and Other Charges | (327,413) | | | (355,235) | | | (234,387) | |
| Total U.S. GAAP Operating Profit | 535,973 | | | 404,851 | | | 387,443 | |
| | | | | |
| Total Other (Expense) Income, net (4) | (94,770) | | | (53,892) | | | (56,462) | |
| Earnings from Continuing Operations Before Taxes | $ | 441,203 | | | $ | 350,959 | | | $ | 330,981 | |
(1)Includes $15.0 million in charges during the year ended September 28, 2018 associated with a legal matter.
(2)Includes $25.0 million in charges associated with a certain project for the year ended September 27, 2019.
(3)Other corporate expenses include costs that were previously allocated to the ECR segment prior to discontinued operations presentation in connection with the ECR sale in the approximate amount of $— million, $14.8 million and $25.6 million for the years ended October 2, 2020, September 27, 2019 and September 28, 2018, respectively. Also includes intangibles amortization of $90.6 million, $79.1 million and $68.1 million for the years ended October 2, 2020, September 27, 2019 and September 28, 2018, respectively.
(4)For the years ended October 2, 2020 and September 27, 2019, other expenses includes revenues under the Company's TSA with Worley of $15.8 million and $35.4 million, respectively, $74.3 million and $64.8 million in fair value adjustments related to our investment in Worley stock (net of Worley Stock dividends) and certain foreign currency revaluations relating to ECR sale proceeds, respectively. Also included for the years ended October 2, 2020, September 27, 2019 and September 28, 2018 is amortization of deferred financing fees related to the CH2M acquisition of $0.7 million, $3.2 million and $1.8 million respectively. Lastly, includes loss on settlement of U.S. pension plan of $2.7 million for the year ended October 2, 2020 and includes gain on settlement of the CH2M retiree medical plans of $35.0 million for the year ended September 27, 2019.
JACOBS ENGINEERING GROUP INC. AND SUBSIDIARIES
NOTES TO CONSOLIDATED FINANCIAL STATEMENTS - (Continued)
Included in other corporate expenses in the above table are costs and expenses which relate to general corporate activities as well as corporate-managed benefit and insurance programs. Such costs and expenses include: (i) those elements of SG&A expenses relating to the business as a whole; (ii) those elements of our incentive compensation plans relating to corporate personnel whose other compensation costs are not allocated to the LOBs; (iii) the amortization of intangible assets acquired as part of business combinations; (iv) the quarterly variances between the Company’s actual costs of certain of its self-insured integrated risk and employee benefit programs and amounts charged to the LOBs; and (v) certain adjustments relating to costs associated with the Company’s international defined benefit pension plans. In addition, other corporate expenses may also include from time to time certain adjustments to contract margins (both positive and negative) associated with projects where it has been determined, in the opinion of management, that such adjustments are not indicative of the performance of the related LOB.
20. Selected Quarterly Information — Unaudited
The following table presents selected quarterly financial information. (in thousands, except for per share amounts):
| | | | | | | | | | | | | | | | | | | | | | | | | | | | | |
| | First
Quarter | | Second
Quarter | | Third
Quarter | | Fourth
Quarter | | Fiscal
Year |
| October 2, 2020 | | | | | | | | | |
| Revenues | $ | 3,360,049 | | | $ | 3,427,180 | | | $ | 3,260,057 | | | $ | 3,519,689 | | | $ | 13,566,975 | |
| Operating profit (a) | $ | 151,345 | | (b) | $ | 167,778 | | (b) | $ | 194,376 | | (b) | $ | 22,474 | | (b) | $ | 535,973 | |
| Earnings (Loss) from Continuing Operations Before Taxes | $ | 254,169 | | | $ | (176,805) | | | $ | 303,681 | | | $ | 60,158 | | | $ | 441,203 | |
| Net Earnings (Loss) of the Group from Continuing Operations | $ | 185,680 | | | $ | (115,683) | | | $ | 236,007 | | | $ | 79,879 | | | $ | 385,883 | |
| Net Earnings (Loss) Attributable to Jacobs from Continuing Operations | $ | 179,423 | | (b) | $ | (121,967) | | (b) | $ | 226,886 | | (b) | $ | 69,519 | | (b) | $ | 353,861 | |
| Net Earnings (Loss) Attributable to Jacobs | $ | 257,010 | | (b) | $ | (92,087) | | (b) | $ | 244,929 | | (b) | $ | 81,993 | | (b) | $ | 491,845 | |
| Earnings per share: | | | | | | | | | |
| Basic Net Earnings (Loss) from Continuing Operations Per Share | $ | 1.35 | | | $ | (0.92) | | | $ | 1.74 | | | $ | 0.53 | | | $ | 2.69 | |
| Basic Net Earnings from Discontinued Operations Per Share | $ | 0.58 | | | $ | 0.23 | | | $ | 0.14 | | | $ | 0.10 | | | $ | 1.05 | |
| Basic Earnings (Loss) Per Share | $ | 1.93 | | | $ | (0.69) | | | $ | 1.88 | | | $ | 0.63 | | | $ | 3.74 | |
| Diluted Net Earnings (Loss) from Continuing Operations Per Share | $ | 1.33 | | (b) | $ | (0.92) | | (b) | $ | 1.73 | | (b) | $ | 0.53 | | (b) | $ | 2.67 | |
| Diluted Net Earnings (Loss) from Discontinued Operations Per Share | $ | 0.58 | | | $ | 0.23 | | | $ | 0.14 | | | $ | 0.09 | | (c) | $ | 1.04 | |
| Diluted Earnings (Loss) Per Share | $ | 1.91 | | | $ | (0.69) | | | $ | 1.87 | | | $ | 0.62 | | | $ | 3.71 | |
| September 27, 2019 | | | | | | | | | |
| Revenues | $ | 3,083,788 | | | $ | 3,091,596 | |
| $ | 3,169,622 | |
| $ | 3,392,862 | | | $ | 12,737,868 | |
| Operating profit (a) | $ | 113,130 | | (c) | $ | 102,681 | | (c) | $ | 89,954 | | (c) | $ | 99,086 | | (c) | $ | 404,851 | |
| Earnings from Continuing Operations Before Taxes | $ | 92,191 | | | $ | 111,832 | | | $ | 93,399 | | | $ | 53,537 | | | $ | 350,959 | |
| Net Earnings of the Group from Continuing Operations | $ | 69,433 | | | $ | 119,779 | | | $ | 95,380 | | | $ | 29,413 | | | $ | 314,005 | |
| Net Earnings Attributable to Jacobs from Continuing Operations | $ | 64,894 | | (c) | $ | 114,755 | | (c) | $ | 89,365 | | (c) | $ | 21,946 | | (c) | $ | 290,960 | |
| Net Earnings Attributable to Jacobs | $ | 124,296 | | (c) | $ | 56,917 | | (c) | $ | 524,442 | | (c) | $ | 142,324 | | (c) | $ | 847,979 | |
| Earnings per share: | | | | | | | | | |
| Basic Net Earnings from Continuing Operations Per Share | $ | 0.45 | | | $ | 0.83 | | | $ | 0.65 | | | $ | 0.16 | | | $ | 2.11 | |
| Basic Net Earnings (Loss) from Discontinued Operations Per Share | $ | 0.42 | | | $ | (0.42) | | | $ | 3.18 | | | $ | 0.89 | | | $ | 4.03 | |
| Basic Earnings Per Share | $ | 0.87 | | | $ | 0.41 | | | $ | 3.83 | | | $ | 1.06 | | | $ | 6.14 | |
| Diluted Net Earnings from Continuing Operations Per Share | $ | 0.45 | | (c) | $ | 0.82 | | (c) | $ | 0.65 | | (c) | $ | 0.16 | | (c) | $ | 2.09 | |
| Diluted Net Earnings (Loss) from Discontinued Operations Per Share | $ | 0.41 | | | $ | (0.41) | | | $ | 3.15 | | | $ | 0.88 | | (d) | $ | 4.00 | |
| Diluted Earnings Per Share | $ | 0.86 | | | $ | 0.41 | | | $ | 3.80 | | | $ | 1.04 | | | $ | 6.08 | |
(a)Operating profit represents revenues less (i) direct costs of contracts and (ii) selling, general and administrative expenses.
JACOBS ENGINEERING GROUP INC. AND SUBSIDIARIES
NOTES TO CONSOLIDATED FINANCIAL STATEMENTS - (Continued)
(b)Includes $85.2 million in operating profit and $(17.7) million in net earnings from continuing operations attributable to Jacobs, or $(0.13) per diluted share from continuing operations in the first quarter of fiscal 2020; includes $68.7 million in operating profit, $308.2 million in net loss from continuing operations attributable to Jacobs, or $2.31 per diluted share from continuing operations in the second quarter of fiscal 2020; includes $44.6 million in operating profit and $(61.6) million in net earnings from continuing operations attributable to Jacobs, or $(0.47) per diluted share from continuing operations in the third quarter of fiscal 2020; includes $235.4 million in operating profit and $144.8 million in both net earnings from continuing operations attributable to Jacobs, and net earnings attributable to Jacobs, or $1.10 per diluted share in the fourth quarter of fiscal 2020 related to restructuring, transaction and other charges (including the Company's fourth quarter fiscal 2020 transformation initiatives relating to real estate and other staffing programs), amortization of intangibles and fair value adjustments related to our investment in Worley stock (net of Worley stock dividend) and certain foreign currency revaluations relating to ECR sale. On a year to date basis, impacts on net earnings from continuing operations attributable to Jacobs were (i) $248.2 million in restructuring, transaction and other charges (includes $146.6 million related to charges for the Company's fourth quarter fiscal 2020 transformation initiatives relating to real estate and other staffing programs,), (ii) $68.3 million of intangible asset amortization and (iii) $56.9 million in fair value adjustments related to our investment in Worley stock (net of Worley stock dividend) and certain foreign currency revaluations relating to the ECR sale.
(c)Includes $47.2 million in operating profit and $46.8 million in net earnings from continuing operations attributable to Jacobs, or $0.33 per diluted share from continuing operations in the first quarter of fiscal 2019; includes $119.0 million in operating profit, $50.8 million in net earnings from continuing operations attributable to Jacobs, or $0.36 per diluted share from continuing operations in the second quarter of fiscal 2019; includes $142.8 million in operating profit and $103.8 million in net earnings from continuing operations attributable to Jacobs, or $0.75 per diluted share from continuing operations in the third quarter of fiscal 2019; includes $154.2 million in operating profit, $179.3 million in both net earnings from continuing operations attributable to Jacobs and net earnings attributable to Jacobs, or $1.32 per diluted share in the fourth quarter of fiscal 2019 related to restructuring, transaction and other charges, amortization of intangibles and fair value adjustments related to our investment in Worley stock (net of Worley stock dividend) and certain foreign currency revaluations relating to the ECR sale. On a year to date basis, impacts on net earnings from continuing operations attributable to Jacobs were (i) $259.8 million in restructuring, transaction and other charges, (ii) $59.0 million of intangible asset amortization and (iii) $48.6 million in fair value adjustments related to our investment in Worley stock (net of Worley stock dividend) and certain foreign currency revaluations relating to the ECR sale.
(d)For the three-month period ended September 27, 2019, diluted net earnings (loss) per share from discontinued operations included $89.7 million related to revisions to previous income tax expense estimates, $17.4 million in finalization of the pre-tax gain on the sale of our ECR business and $9.8 million related to the difference between Nui Phao loss contingency as originally recorded and fourth quarter 2019 settlement amount.
Report of Independent Registered Public Accounting Firm
To the Stockholders and the Board of Directors of Jacobs Engineering Group Inc.
Opinion on the Financial Statements
We have audited the accompanying consolidated balance sheets of Jacobs Engineering Group Inc. and subsidiaries (the Company) as of October 2, 2020 and September 27, 2019, the related consolidated statements of earnings, comprehensive income, stockholders' equity and cash flows for each of the three fiscal years in the period ended October 2, 2020, and the related notes (collectively referred to as the “consolidated financial statements”). In our opinion, the consolidated financial statements present fairly, in all material respects, the financial position of the Company at October 2, 2020 and September 27, 2019, and the results of its operations and its cash flows for each of the three fiscal years in the period ended October 2, 2020, in conformity with U.S. generally accepted accounting principles.
We also have audited, in accordance with the standards of the Public Company Accounting Oversight Board (United States) (PCAOB), the Company's internal control over financial reporting as of October 2, 2020, based on criteria established in Internal Control-Integrated Framework issued by the Committee of Sponsoring Organizations of the Treadway Commission (2013 framework), and our report dated November 24, 2020 expressed an unqualified opinion thereon.
Adoption of New Accounting Standards
As discussed in Note 2 to the consolidated financial statements, the Company changed its method of accounting for leases in 2020 to reflect the accounting method change due to the adoption of ASU 2016-02, Leases (Topic 842). As discussed in Note 2 to the consolidated financial statements, the Company changed its method of accounting for revenue recognition on contracts with customers in 2019 to reflect the accounting method change due to the adoption of ASU 2014-09, Revenue from Contracts with Customers (Topic 606).
Basis for Opinion
These financial statements are the responsibility of the Company's management. Our responsibility is to express an opinion on the Company’s financial statements based on our audits. We are a public accounting firm registered with the PCAOB and are required to be independent with respect to the Company in accordance with the U.S. federal securities laws and the applicable rules and regulations of the Securities and Exchange Commission and the PCAOB.
We conducted our audits in accordance with the standards of the PCAOB. Those standards require that we plan and perform the audit to obtain reasonable assurance about whether the financial statements are free of material misstatement, whether due to error or fraud. Our audits included performing procedures to assess the risks of material misstatement of the financial statements, whether due to error or fraud, and performing procedures that respond to those risks. Such procedures included examining, on a test basis, evidence regarding the amounts and disclosures in the financial statements. Our audits also included evaluating the accounting principles used and significant estimates made by management, as well as evaluating the overall presentation of the financial statements. We believe that our audits provide a reasonable basis for our opinion.
Critical Audit Matters
The critical audit matters communicated below are matters arising from the current period audit of the financial statements that were communicated or required to be communicated to the audit committee and that: (1) relate to accounts or disclosures that are material to the financial statements and (2) involved our especially challenging, subjective or complex judgments. The communication of critical audit matters does not alter in any way our opinion on the consolidated financial statements, taken as a whole, and we are not, by communicating the critical audit matters below, providing separate opinions on the critical audit matters or on the accounts or disclosures to which they relate.
| | | | | | | | |
| | Revenue Recognition for Fixed-Price Engineering, Procurement and Construction Contracts |
| Description of the Matter | | As described in Note 2 to the consolidated financial statements, the Company recognizes engineering, procurement and construction contract revenue over time, as performance obligations are satisfied, using the percentage-of-completion method (an input method) based primarily on contract costs incurred to date compared to total estimated contract costs. Revenue recognition under this method is judgmental, as it requires the Company to prepare estimates of total contract revenue and total contract costs, including costs to complete in-process contracts.
Auditing the Company’s estimates of total contract revenue and costs used to recognize revenue on fixed-price engineering, procurement and construction contracts involved significant auditor judgment, as it required the evaluation of subjective factors, such as assumptions related to estimated labor, forecasted material and subcontractor costs and variable consideration estimates related to incentive fees and unpriced change orders. These assumptions involved significant management judgment, which affects the measurement of revenue recognized by the Company.
|
| How We Addressed the Matter in Our Audit | | We tested certain of the Company’s controls over the estimation process that affect revenue recognized on fixed-price engineering, procurement and construction contracts. For example, we tested controls over management’s monitoring and review of project cost and variable consideration estimates, including the Company’s procedures to validate the completeness and accuracy of the data used to determine the estimates.
To test the Company’s contract estimates related to revenues recognized on fixed-price engineering, procurement, and construction projects, our audit procedures included selecting a sample of projects and, among other procedures, we obtained and inspected related contract agreements, amendments, and change orders to test the existence of customer arrangements and understand the scope and pricing of the related projects; observed selected project team status meetings at the Company and interviewed project team personnel to obtain an understanding of the status of operational performance and progress on the related projects; evaluated the reasonableness of the Company’s estimated costs to complete by obtaining and analyzing supporting documentation for a sample of cost estimate components; and compared contract profitability estimates in the current year to historical estimates and actual performance for the same projects.
|
| | Legal Contingencies |
| Description of the Matter | | As described in Note 17 to the consolidated financial statements, the Company is subject to litigation and arbitration proceedings, including a material legal contingency related to a dispute with JKC Australia LNG Pty Limited. Auditing the Company’s estimates related to legal contingencies was especially subjective due to the judgment required to evaluate information used by management to determine whether a probable loss exists and whether a loss can be reasonably estimated, and if so, the assumptions used by management to estimate the potential range of losses. Management’s assumptions had a significant effect on loss contingency accruals recorded.
|
| How We Addressed the Matter in Our Audit | | We tested the Company’s controls over the identification and evaluation of the completeness and valuation of contingent liabilities related to legal matters. For example, we tested controls over the Company’s assessment and valuation of loss contingencies, including their evaluation of whether a loss is probable, and measurement of the contingent liability associated with probable losses.
To test the Company’s accounting and disclosure for legal contingencies, we performed audit procedures that included, among others, inspecting legal claim documentation submitted by counterparties, assessing management’s assumptions regarding cost estimates related to potential loss contingencies, inspecting minutes of meetings of the board of directors, and obtaining audit inquiry responses from external and internal legal counsel related to loss contingencies.
|
| | | | | | | | |
| | Impairment of Right-of-Use and Other Long-Lived Assets
|
| Description of the Matter | | As described in Note 10 to the consolidated financial statements, the Company recognized long-lived asset impairment charges during 2020 related to right-of-use assets and related property, equipment and improvements associated with real estate lease space the Company has abandoned or identified for subleasing. The Company evaluates long-lived assets for impairment by first identifying whether indicators of impairment exist. If indicators are present for an asset group, the Company evaluates recoverability by comparing the estimated future undiscounted cash flows to the carrying amount of the asset group. If the asset group's carrying amount exceeds its estimated future undiscounted cash flows, the fair value of the asset group is then estimated by management and compared to its carrying amount. An impairment charge is recognized on a long-lived asset group when the carrying amount exceeds fair value.
Auditing management’s evaluation of long-lived asset impairment involved subjectivity due to the estimation required to assess significant assumptions utilized in estimating the fair value of asset groups based on discounted cash flow models, such as assumptions related to expected downtime prior to the commencement of future subleases, projected sublease income over the remaining lease periods, and discount rates.
|
| How We Addressed the Matter in Our Audit | | We obtained an understanding, evaluated the design and tested the operating effectiveness of controls over the Company’s long-lived asset impairment evaluation process, including controls over management’s review of significant assumptions used.
To test the Company’s long-lived asset impairment evaluation process, we performed audit procedures that included, among others, assessing the methodologies used, evaluating the significant assumptions discussed above and testing the completeness and accuracy of the underlying data used by the Company in its analysis. We inspected lease agreements related to impaired right-of-use assets and compared significant assumptions used by management as part of fair value estimates to current industry and economic trends and performed sensitivity analysis over significant assumptions, among other procedures. We involved our valuation specialists to assist in our evaluation of certain significant assumptions used on the calculation of fair value estimates specific to market participant real estate data. |
/s/ Ernst & Young LLP
We have served as the Company's auditor since 1987.
Dallas, Texas
November 24, 2020
REPORT OF INDEPENDENT REGISTERED PUBLIC ACCOUNTING FIRM
To the Stockholders and the Board of Directors of Jacobs Engineering Group Inc.
Opinion on Internal Control Over Financial Reporting
We have audited Jacobs Engineering Group Inc. and subsidiaries’ internal control over financial reporting as of October 2, 2020, based on criteria established in Internal Control-Integrated Framework issued by the Committee of Sponsoring Organizations of the Treadway Commission (2013 framework) (the COSO criteria). In our opinion, Jacobs Engineering Group Inc. and subsidiaries (the Company) maintained, in all material respects, effective internal control over financial reporting as of October 2, 2020, based on the COSO criteria.
We also have audited, in accordance with the standards of the Public Company Accounting Oversight Board (United States) (PCAOB), the consolidated balance sheets of the Company as of October 2, 2020 and September 27, 2019, the related consolidated statements of earnings, comprehensive income, stockholders’ equity and cash flows for each of the three fiscal years in the period ended October 2, 2020, and the related notes and our report dated November 24, 2020 expressed an unqualified opinion thereon.
Basis for Opinion
The Company’s management is responsible for maintaining effective internal control over financial reporting and for its assessment of the effectiveness of internal control over financial reporting included in the accompanying Management’s Annual Report on Internal Control Over Financial Reporting. Our responsibility is to express an opinion on the Company’s internal control over financial reporting based on our audit. We are a public accounting firm registered with the PCAOB and are required to be independent with respect to the Company in accordance with the U.S. federal securities laws and the applicable rules and regulations of the Securities and Exchange Commission and the PCAOB.
We conducted our audit in accordance with the standards of the PCAOB. Those standards require that we plan and perform the audit to obtain reasonable assurance about whether effective internal control over financial reporting was maintained in all material respects.
Our audit included obtaining an understanding of internal control over financial reporting, assessing the risk that a material weakness exists, testing and evaluating the design and operating effectiveness of internal control based on the assessed risk, and performing such other procedures as we considered necessary in the circumstances. We believe that our audit provides a reasonable basis for our opinion.
Definition and Limitations of Internal Control Over Financial Reporting
A company’s internal control over financial reporting is a process designed to provide reasonable assurance regarding the reliability of financial reporting and the preparation of financial statements for external purposes in accordance with generally accepted accounting principles. A company’s internal control over financial reporting includes those policies and procedures that (1) pertain to the maintenance of records that, in reasonable detail, accurately and fairly reflect the transactions and dispositions of the assets of the company; (2) provide reasonable assurance that transactions are recorded as necessary to permit preparation of financial statements in accordance with generally accepted accounting principles, and that receipts and expenditures of the company are being made only in accordance with authorizations of management and directors of the company; and (3) provide reasonable assurance regarding prevention or timely detection of unauthorized acquisition, use, or disposition of the company’s assets that could have a material effect on the financial statements.
Because of its inherent limitations, internal control over financial reporting may not prevent or detect misstatements. Also, projections of any evaluation of effectiveness to future periods are subject to the risk that controls may become inadequate because of changes in conditions, or that the degree of compliance with the policies or procedures may deteriorate.
/s/ Ernst & Young LLP
Dallas, Texas
November 24, 2020