FORM 18-K/A
Amendment No. 2
For Foreign Governments and Political Subdivisions Thereof
SECURITIES AND EXCHANGE COMMISSION
Washington, D.C. 20549
ANNUAL REPORT
of
THE REPUBLIC OF ITALY
(Name of Registrant)
Date of end of last fiscal year: December 31, 2011
SECURITIES REGISTERED*
(As of close of the fiscal year)
Title of Issues | Amounts as to which registration is effective |
Names of exchanges on which registered | ||
N/A* | N/A | N/A |
Name and address of Authorized Agent of the Registrant in the United States to
receive notices and communications from the Securities and Exchange Commission:
THE HONORABLE CLAUDIO BISOGNIERO
Italian Ambassador to the United States
3000 Whitehaven Street, N.W.
Washington, D.C. 20008
It is requested that copies of notices and communications from the Securities and Exchange Commission be sent to:
MICHAEL S. IMMORDINO
White & Case LLP
5 Old Broad Street
London EC2N 1DW
United Kingdom
* | The Republic of Italy files Annual Reports on Form 18-K voluntarily in order for The Republic of Italy to incorporate such Annual Reports into its shelf registration statements. The Republic of Italy is filing this amendment on Form 18-K/A (the Amendment) to its Annual Report for the year ended December 31, 2011 voluntarily. |
TABLE OF CONTENTS
This Amendment to the annual report of the Republic of Italy on Form 18-K for the year ended December 31, 2011 comprises:
(a) Pages numbered (i) to (iii) consecutively. | ||
(b) The following exhibits: | ||
Exhibit 1 Recent Developments Update, dated April 9, 2013 and prepared by the Italian Ministry of Economy and Finance | ||
Exhibit 2 Italys Major Structural ReformsProgress Report December 2011January 2013, dated January 11, 2013 and published by the Italian Ministry of Economy and Finance | ||
Exhibit 3 Italys Strategy for Growth and Fiscal Consolidation, dated February 7, 2013 and published by the Italian Ministry of Economy and Finance, Treasury Department | ||
Exhibit 4 Report to Parliament 2013, dated March 21, 2013 and published by the Italian Ministry of Economy and Finance |
This Amendment to the annual report is filed subject to the Instructions for Form 18-K for Foreign Governments and Political Subdivisions thereof.
ii
SIGNATURE
Pursuant to the requirements of the United States Securities Exchange Act of 1934, the registrant Republic of Italy has duly caused this Amendment No. 2 to the annual report to be signed on its behalf by the undersigned, thereunto duly authorized, in the City of Rome, Italy on the 9th day of April 2013.
REPUBLIC OF ITALY | ||||
By: | /s/ Dott.ssa Maria Cannata | |||
Name: | Dott.ssa Maria Cannata | |||
Title: | Director General Treasury Department Directorate II Ministry of Economy and Finance |
iii
Exhibit 1
Recent Developments Update dated April 9, 2013
The information included in this Exhibit 1 replaces and/or supplements the information about the Republic of Italy that is contained in Exhibit 1 to the Republic of Italys annual report on Form 18-K, for the fiscal year ended December 31, 2011 (as filed with the Securities and Exchange Commission on December 21, 2012 and amended on Form 18-K/A on January 28, 2013). To the extent that the information included in this Exhibit 1 differs from the information set forth in the annual report, you should rely on the information in this Exhibit 1.
The section of the Annual Report SUMMARY INFORMATIONEurocrisis on pages 1 through 2 of the Annual Report is hereby amended to add the following two paragraphs after the last paragraph of the subsection on page 2 of the Annual Report:
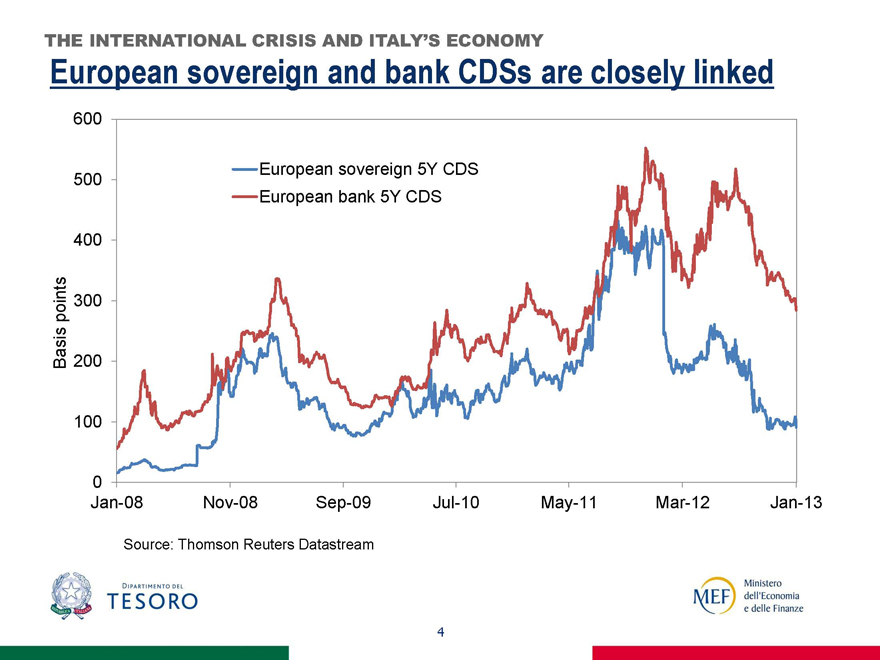
During 2012, several measures have been adopted to relieve the eurocrisis. In February 2012, EU Member States established the European Stability Mechanism (ESM), which has a large lending capacity, to help preserve the financial stability of Europes Monetary Union by providing assistance to Eurozone countries. See The Italian EconomyEU Measures to Address the EurocrisisThe ESM. In September 2012, the ECB stated that investors fears over the reversibility of the Euro are unfounded because the ECB is strongly committed to maintaining the singleness of the monetary policy among Eurozone countries, including through Outright Monetary Transactions, in order to address severe distortions in government bond markets. The ECB stated that these steps have been and will continue to be taken within the ECB mandate to maintain price stability over the medium term.
In a worst case scenario, if the eurocrisis were to deepen or extend, the EU Member States may determine further reforms in order to manage the crisis. A prolonged crisis in Europe or a new crisis in Italy could make the refinancing of debt by Italy more expensive.
The section SUMMARY INFORMATIONThe Italian Political System on page 2 of the Annual Report as subsequently amended by Amendment No. 1 to the Annual Report is hereby further amended to add the following new paragraphs and table on page 2 of the Annual Report:
The general Parliamentary elections held in February 2013 resulted in no party or coalition having a majority of both the Chamber of Deputies and the Senate. The center-left coalition, led by Mr. Pier Luigi Bersani, obtained the highest number of votes on a national level for the elections of the Chamber of Deputies and therefore was awarded with the majority of seats in the Chamber of Deputies. No political party or coalition obtained an absolute majority of seats in the Senate. The four principal parties/coalitions in the elections received the following seats in the Chamber of Deputies and the Senate:
Main Political Parties/Coalitions by Number of Seats in the Italian Parliament | ||||||
Chamber of Deputies |
Senate | |||||
Party/Coalition led by: |
Number of Seats: |
Party/Coalition led by: |
Number of Seats | |||
Mr. Pier Luigi Bersani |
345 | Mr. Pier Luigi Bersani |
123 | |||
Mr. Silvio Berlusconi |
125 | Mr. Silvio Berlusconi |
117 | |||
Mr. Giuseppe Piero Grillo |
109 | Mr. Giuseppe Piero Grillo |
54 | |||
Mr. Mario Monti |
47 | Mr. Mario Monti |
19 |
The President of the Republic is required to appoint a Prime Minister to form a new Government in Italy. Any such appointment is subject to an affirmative confidence vote in both the Chamber of Deputies and the Senate, and due to the election results it is unclear whether any of the parties or coalitions will reach an agreement to support a new Government. Since the composition of the new Government is unclear at this time, it is not possible to predict with precision the policy of the Government in the future. It is expected that the policies of the new Government will be substantially in line with the measures taken in 2012 and maintained to date in 2013. If an
1
agreement among the parties and coalitions to form a new Government is not reached, the President of the Republic is required to dismiss the two houses of Parliament and to set the date for new general Parliamentary elections. However, because the Italian Constitution does not permit a President of the Republic to dismiss the two houses of Parliament in the last six months of such Presidents mandate (known as the white semester) and President Mr. Giorgio Napolitanos mandate will expire on May 15, 2013, the dismissal of the two houses of Parliament can occur only when a new President of the Republic will be appointed. On April 15, 2013, the Parliament will convene to elect the new President of the Republic.
Until a new Government is formed, the current Prime Minister Mr. Mario Monti will continue to perform his duties. For additional information on the policy of and measures taken by the Government to address the Eurocrisis through and into 2013, see Exhibit 2Italys Major Structural ReformsProgress Report December 2011 January 2013, dated January 11, 2013 and Exhibit 3Italys Strategy for Growth and Fiscal Consolidation, dated February 7, 2013 to this Amendment.
The section SUMMARY INFORMATION on page 2 of the Annual Report is hereby supplemented by adding the following new subsection entitled Ratings of the Republic of Italys Indebtedness.
On March 8, 2013, Fitch Ratings downgraded the Republic of Italys long-term credit rating from A- to BBB+ with negative outlook.
The section REPUBLIC OF ITALYArea and PopulationGeography on page 3 of the Annual Report is hereby amended to include the following information after the first paragraph of that subsection:
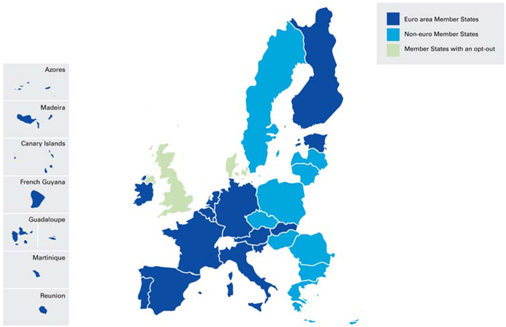
The following is a map of the European Union and the countries, including Italy, within the Euro area.
2
The following is a map of Italy.
The section THE ITALIAN ECONOMYGeneral of the Annual Report is hereby amended to include the following information after the third paragraph of that subsection on page 8 of the Annual Report:
The following table sets out key economic indicators (real GDP growth rate, GDP Deflator, EU harmonized consumer price index and unemployment rate) in Italy for the periods indicated.
Key Economic Indicators (2008-2012)
2008 | 2009 | 2010 | 2011 | 2012 | ||||||||||||||||
Real GDP growth rate (%)(1) |
(1.3 | ) | (5.5 | ) | 1.8 | 0.4 | (2.4 | ) | ||||||||||||
GDP Deflator |
2.5 | 2.1 | 0.4 | 1.3 | 1.6 | |||||||||||||||
EU Harmonized Consumer Price Index |
3.5 | 0.8 | 1.6 | 2.9 | 3.3 | |||||||||||||||
Unemployment rate (%)(2) |
6.7 | 7.8 | 8.4 | 8.4 | 10.7 |
(1) | Figures at purchasing power parity with 2005 prices. |
(2) | Unemployment rate does not include workers paid by Cassa Integrazione Guadagni, or Wage Supplementation Fund, which compensates workers who are temporarily laid off or who have had their hours cut. |
Source: Bank of Italy, Istat and Eurostat.
3
The section of the Annual Report THE ITALIAN ECONOMYGeneral starting from the table entitled Annual Per Cent Change in Real GDP (2007-2011) on page 8 of the Annual Report through and including the third paragraph on page 9 of the Annual Report is hereby replaced in its entirety with the following:
Annual Per Cent Change in Real GDP (2008-2012)
2008 | 2009 | 2010 | 2011 | 2012 | ||||||||||||||||
Italy |
(1.3 | ) | (5.5 | ) | 1.8 | 0.4 | (2.4 | ) | ||||||||||||
Euro area(1) |
0.4 | (4.4 | ) | 2.0 | 1.4 | (0.6 | ) |
(1) | The euro area represents the countries participating in the EMU. |
Source: Bank of Italy.
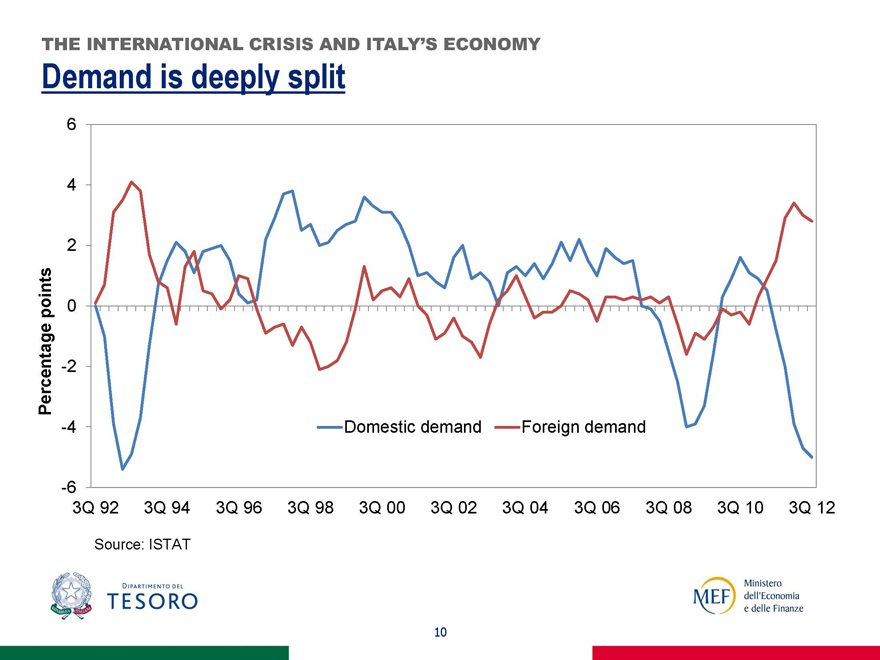
In 2008, as a result of the global financial and economic crisis, Italys real GDP decreased by 1.3 per cent mainly as a result of a steep decline in exports. Italy also recorded a decrease in domestic private consumption, largely attributable to the stagnation of Italian families purchasing power (the rise in nominal salaries was offset by inflation) and increasing propensity to save, and a decrease in gross fixed investments, especially in machinery and equipment and real estate. The uncertainty resulting from the financial crisis and its long term effects seriously affected consumer and business confidence and played a major role in the reduction of spending and investment.
In 2009, Italys real GDP decreased by 5.5 per cent, the largest decrease since the Second World War. A moderate recovery began in the second half of the year, mainly because of improved exports. In the same period, the industrial sector returned to moderate growth, the decline in the services sector came to a halt, but the decline in the construction sector continued. Domestic demand remained weak. Spending on capital goods, although increasing slightly in the second half of 2009 in response to tax incentives for purchases of machinery and equipment, was dampened by spare capacity and uncertainty about growth. The decline in consumer spending generally worsened, despite the measures introduced to support purchases of certain durable goods. Signs of an easing in the decline of the real property market appeared towards the end of 2009.
In 2010, the Italian economy grew and real GDP increased by 1.8 per cent compared to 2009. Domestic demand sustained the recovery. Private consumption contributed to the GDP growth by 0.6 per cent, fixed investment contributed to the GDP growth by 0.5 per cent and an increase in inventories contributed to the GDP growth by 0.7 per cent. Net exports provided a negative contribution to GDP growth by 0.4 per cent. The deterioration reflects the position on merchandise trade, which turned negative last year after being broadly in balance in 2009. It was largely due to only two sectors: energy raw materials, whose deficit grew mainly because of the rise in oil prices, and electronic apparatus, where the major factor was the significant increase in imports of photovoltaic cells.
In 2011, Italys real GDP grew by 0.4 per cent compared to 2010. Private consumption contributed to GDP growth by 0.1 per cent and net exports contributed to GDP growth by 1.4 per cent while fixed investment negatively contributed to GDP growth by 0.4 per cent. The growth in merchandise exports in 2011 was mainly due to sales to non-EU countries, particularly sales of machinery and equipment, basic metals and other metal products. Good export performances were also recorded by traditional products, pharmaceuticals and electronic products.
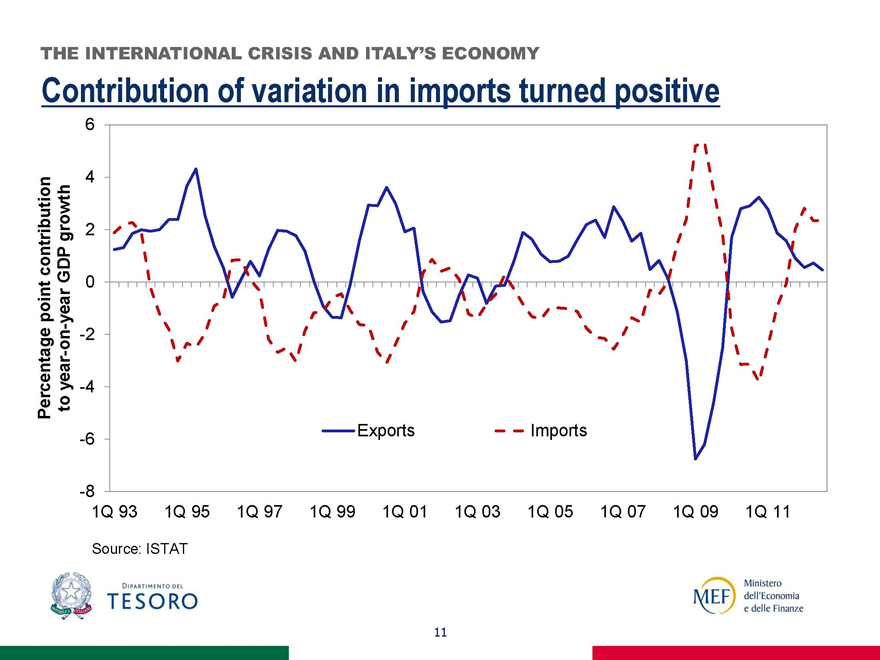
In 2012, Italys GDP decreased by 2.4 per cent compared to 2011. The decrease in real GDP in 2012 was due to an 8.0 per cent decrease in gross fixed investment, a 3.9 per cent decrease in total consumption and a 7.7 per cent decrease in imports, partly offset by a 2.3 per cent increase in exports.
The section THE ITALIAN ECONOMYEU Measures to Address the EurocrisisFinancial Assistance to EU Member StatesCollective Action Clauses on page 13 of the Annual Report is hereby replaced in its entirety with the following:
Following recommendations of the International Monetary Fund and the release of a draft model form of collective action clause, Italy introduced a form of collective action clause into the documentation of all of its New York law governed bonds issued since June 16, 2003.
The rights of bondholders have generally been individual rather than collective. As a result of each bondholder having individual rights, the restructuring or amending of a bond would legally have to be negotiated with each bondholder individually and any one bondholder that did not agree with restructuring or amendment terms could refuse to accept such terms or hold out for better terms thereby delaying the restructuring or amendment process and potentially forcing an issuer into costly litigation. These risks increase as the bondholder base is more geographically dispersed or is comprised of both individual and institutional investors.
4
In an effort to minimize these risks, issuers began including so-called collective action clauses into their bond documentation. These collective action clauses are intended to minimize the risk that one or a few hold out bondholders delay a restructuring or amendment where a majority of the other bondholders favor the terms of the restructuring or amendment, by permitting a qualified majority of the bondholders to accept the terms and bind the entire bondholder base to such terms.
The treaty instituting the ESM, as revised on February 2, 2012 (and ratified by Italy through Law No. 116 of July 23, 2012) required that all new government debt securities with a maturity of more than one year, issued on or after January 1, 2013, include the same collective action clauses as other countries in the Eurozone (the EU Collective Action Clauses). These standardized clauses for all euro area Member States, as set out in the document Common Terms of Reference dated February 17, 2012 developed and agreed by the European Economic and Financial Committee (EFC) and published on the EU Commissions website, allow a qualified majority of creditors to agree on certain reserved matter modifications to the most important terms and conditions of the bonds of a single series (including the financial terms) that are binding for all the holders of the bonds of that series with either (i) the affirmative vote of the holders of at least 75 per cent represented at a meeting or (ii) a written resolution signed by or on behalf of holders of at least 66 2/3 per cent of the aggregate principal amount of the outstanding bonds of that series and the consent of the Issuer. The EU Collective Action Clauses also include an aggregation clause enabling a majority of bondholders across multiple bond issues to agree on certain reserved matter modifications to the most important terms and conditions of all outstanding series of bonds (including the financial terms) that are binding for the holders of all outstanding series of bonds with (1) either (i) the affirmative vote of all holders of at least 75 per cent represented at separate meetings or (ii) a written resolution signed by or on behalf of all holders of at least 66 2/3 per cent of the aggregate principal amount of all outstanding series of bonds (taken in the aggregate) and (2) either (i) the affirmative vote of the holders of more than 66 2/3 per cent represented at a meeting or (ii) a written resolution signed by or on behalf of holders of more than 50 per cent of the aggregate principal amount of each outstanding series of bonds (taken individually) and the consent of the Issuer (so called Cross Series Modification Clauses). Italy, as all EU member states, has included the EU Collective Action Clauses and the Cross Series Modification Clauses in the documentation of all new bonds issued since January 1, 2013.
The section THE ITALIAN ECONOMY is hereby by amended by adding the following new subsection THE ITALIAN ECONOMYUpdate for the fiscal year ended December 31, 2012 on page 15 of the Annual Report immediately before the subsection Role of the Government in the Economy on page 15 of the Annual Report:
Update for the fiscal year ended December 31, 2012
Gross Domestic Product
In 2012, Italys nominal GDP amounted to 1,565,916 million (1,389,948 million in real terms at 2005 prices), a decrease of 0.8 per cent (2.4 per cent in real terms). The decrease in nominal GDP in 2012 was due to a 6.8 per cent decrease (8.0 per cent in real terms) in gross fixed investment, a 1.8 per cent decrease (3.9 per cent in real terms) in total consumption and a 4.9 per cent decrease (7.7 per cent in real terms) in imports, partly offset by a 4.3 per cent increase (2.3 per cent in real terms) in exports.
Private Sector Consumption
In 2012, private sector consumption in Italy decreased by 4.3 per cent in real terms compared to an increase of 0.1 per cent in real terms in 2011 and represented approximately 58.9 per cent of real GDP.
Public Sector Consumption
In 2012, public sector consumption in Italy decreased by 2.9 per cent in real terms compared to a decrease of 1.2 per cent in real terms in 2011. In 2012, public sector consumption represented approximately 20.4 per cent of real GDP.
Gross Fixed Investment
In 2012, gross fixed investment in Italy decreased by 8.0 per cent in real terms (6.8 per cent at current prices) and represented 18.2 per cent of nominal GDP and its decrease negatively contributed to real GDP growth by
5
1.6 per cent in nominal terms. The decrease in gross fixed investment in 2012 reflects the decrease in all components of gross fixed investment, particularly the decrease in expenditure for transport means of 12.2 per cent, for machinery of 10.6 per cent and the continued decrease in expenditure for construction of 6.2 per cent.
Net Exports
In 2012, exports of goods and services grew by 2.3 per cent in volume in real terms, with exports of goods increasing by approximately 2.0 per cent in real terms and exports of services increasing by approximately 4.5 per cent in real terms. In 2012, imports of goods and services decreased sharply by 7.7 per cent in real terms, with imports of goods decreasing by approximately 8.0 per cent in real terms and imports of services decreasing by approximately 5.0 per cent in real terms.
Principal Sectors of the Economy
In 2012, value added in real terms decreased by 2.0 per cent. The decrease in value added was mainly driven by a decrease in construction of 6.3 per cent in real terms, a decrease in agriculture, fishing and forestry of 4.4 per cent in real terms, a decrease in industry of 3.5 per cent in real terms (of which manufacturing decreased by 3.9 per cent in real terms) and a decrease in services of 1.2 per cent in real terms. The decrease in services was driven by a decrease of 2.0 per cent in real terms in commerce, transport, storage and hotels and restaurants, a decrease of 1.9 per cent in real terms in information and communication services, a decrease of 1.7 per cent in real terms in professional, scientific and technical services and public administration and support services, a decrease of 1.7 per cent in real terms in defense, education, healthcare and other social services, slightly offset by an increase of 1.2 per cent in real terms in arts, entertainment and recreation and repairs of household goods and other services and an increase of 0.3 per cent in real terms in financial and monetary intermediation services.
The section THE ITALIAN ECONOMYEmployment and LaborGeneral on page 20 of the Annual Report is hereby by amended by replacing the first two paragraphs of that subsection in their entirety with the following three paragraphs:
General. Job creation has been and continues to be a key objective of the Government. Employment, as measured by the average number of standard labor units employed during the year, decreased by approximately 0.3 per cent in 2012 after increasing 0.1 per cent in 2011. A standard labor unit is the amount of work undertaken by a full-time employee over the year and is used to measure the amount of work employed to produce goods and services.
The unemployment rate in Italy was 10.7 per cent in 2012, an increase of 2.3 per cent compared to 8.4 per cent 2011. In the euro area, the average unemployment rate was 11.4 per cent in 2012 compared to 10.2 per cent in 2011.
The participation rate (i.e. the rate of employment for the Italian population between the ages of 15 and 64) decreased to 56.8 per cent in 2012 compared to 62.2 per cent in 2011.
The section THE ITALIAN ECONOMYEmployment and LaborEmployment by sector on page 20 of the Annual Report is hereby by amended in its entirety by replacing it with the following:
Employment by sector. In 2012, approximately 68.5 per cent were employed in the service sector, 20.12 per cent were employed in the industrial sector (excluding construction), 7.65 per cent were employed in the construction sector and 3.7 per cent were employed in the agriculture, fishing and forestry sector.
The section THE ITALIAN ECONOMYEmployment and LaborEmployment by geographic area and gender on page 20 of the Annual Report is hereby by amended in its entirety by replacing it with the following:
Employment by geographic area and gender. In 2012, the unemployment rate in northern Italy was 7.4 per cent, an increase of 1.7 percentage points compared to 2011. In 2012, the unemployment rate in central Italy was 9.5 per cent, an increase of 1.9 percentage points compared to 2011. In 2012, the unemployment rate in southern Italy was 17.2 per cent, an increase of 3.6 percentage points compared to 2011.
In 2012, the unemployment rate of females in Italy was 11.9 per cent, an increase of 2.3 percentage points compared to 2011. In 2012, the unemployment rate of males in Italy was 9.9 per cent, an increase of 2.3 percentage points compared to 2011.
6
The section THE ITALIAN ECONOMYEmployment and Labor is hereby amended by adding the following new subsection THE ITALIAN ECONOMYEmployment and LaborEmployment of the population between the ages 15-24 on page 20 of the Annual Report immediately before the subsection THE ITALIAN ECONOMYEmployment and Labor Government programs and regulatory framework on page 20 of the Annual Report:
Employment of the population between the ages 15-24. The unemployment rate of the population in Italy between the ages 15-24 increased steadily from 21.3 per cent in 2008 to 35.3 per cent in 2012 (an increase of 6.2 per cent compared to 2011). The unemployment rate of the population between the ages 15-24 in the euro area increased from 16.0 per cent in 2008 to 23.1 per cent in 2012.
The following table shows the unemployment rate of the population between the ages 15-24 in Italy and the euro area for the periods provided.
Unemployment of the Population aged 15-24 (2008-2012)
2008 | 2009 | 2010 | 2011 | 2012 | ||||||||||||||||
Italy |
21.3 | 25.4 | 27.8 | 29.1 | 35.3 | |||||||||||||||
Euro area(1) |
16.0 | 20.3 | 20.9 | 20.8 | 23.1 |
(1) | The euro area represents the countries participating in the EMU, including Italy. |
Source: Eurostat and Istat.
The section MONETARY SYSTEMBanking RegulationCapitalization on pages 31 through 32 of the Annual Report is hereby by amended by adding the following new paragraph as the new last paragraph of the subsection on page 32 of the Annual Report:
On February 28, 2013, in an effort to strengthen the regulatory capital of Banca Monte dei Paschi di Siena, the Ministry of the Economy and Finance subscribed an aggregate amount equal to 4,071,000,000 of new financial instruments (the New Financial Instruments) provided for by articles 23-sexies et. seq of Law Decree No. 95 of July 6, 2012, as subsequently amended (Decree 95/2012) issued by MPS (of which 1,900,000,000 will replace the so-called Tremonti Bonds previously issued by MPS in 2009 and 171,000,000, having entitlement date on July 1, 2013, as early payment of the interest accrued on the Tremonti Bonds for the financial year 2012). The New Financial Instruments are convertible into ordinary shares of Banca Monte dei Paschi di Siena and can be taken into account in the calculation of its Core Tier 1 capital.
The section of the Annual Report THE EXTERNAL SECTOR OF THE ECONOMYGeographic Distribution of Trade on pages 35 through 36 of the Annual Report is hereby by amended by adding the following new paragraph as the last paragraph of the subsection on page 36 of the Annual Report:
In 2012, Italy recorded an increase in exports of 3.7% over 2011, even though it recorded a decrease in Italian exports to Eurozone countries of 1.5 per cent compared to 2011, in particular exports to Italys three largest Eurozone trading partners Germany, France and Spain decreased by 1.1 per cent, 1.0 per cent and 8.1 per cent, respectively in 2012. The increase in Italian exports resulted from a sharp increase in exports to non-EU countries of 9.2 per cent in 2012 compared to 2011 (an increase of 7.8 per cent net of energy exports compared to 2011), in part due to a 24.6 per cent increase in exports to OPEC countries, a 16.8 per cent increase in exports to the United States and a 19.1 per cent increase in exports to Japan.
The section THE EXTERNAL SECTOR OF THE ECONOMYGeographic Distribution of Trade on pages 35 through 36 of the Annual Report is hereby amended by adding the following footnote to the line item Other in the tables entitled Distribution of Trade (cif-fob)Exports on page 35 of the Annual Report and Distribution of Trade (cif-fob)Imports on page 36 of the Annual Report:
Other represents all other countries and/or regions with whom Italy trades; none of which country or region represents a material amount.
7
The section PUBLIC FINANCEMeasures of Fiscal Balance on pages 44 through 45 of the Annual Report is hereby amended by adding a new column for the year 2012 to the table entitled Selected Public Finance Indicators(*) on page 44 of the Annual Report as set out below:
2012 | ||||
( in millions, except percentages) | ||||
General government expenditure |
801,094 | |||
General government expenditure, as a percentage of GDP |
51.2 | |||
General government revenues |
753,648 | |||
General government revenues, as a percentage of GDP |
48.1 | |||
Net borrowing |
(47,446 | ) | ||
Net borrowing, as a percentage of GDP |
(3.0 | ) | ||
Primary balance |
39,271 | |||
Primary balance, as a percentage of GDP |
2.5 | |||
Public debt |
1,988,658 | |||
Public debt as a percentage of GDP |
127.0 | |||
GDP (nominal value) |
1,565,916 |
Source: Istat and Bank of Italy.
The section PUBLIC FINANCE on page 49 of the Annual Report is hereby amended by adding a new subsection entitled Report to Parliament 2013 on page 49 of the Annual Report as set out below:
On March 21, 2013, the Prime Minister, Mr. Mario Monti, and the Minister of Economy and Finance, Vittorio Grilli, submitted a report to Parliament to inform and update the Parliament on the revised estimates on macroeconomic outlook and the performance of the public accounts expected in 2013 and 2014. For additional information on these revised estimates, see Exhibit 4Report to Parliament 2013, dated March 21, 2013.
The section TABLES AND SUPPLEMENTARY INFORMATION as amended by pages 1 through 3 of Amendment No. 1 to the Annual Report through the addition of the subsection entitled External Bonds of the Treasury as of December 31, 2012 is hereby further amended by replacing the subsection External Bonds of the Treasury as of December 31, 2012 on pages 1 through 3 of Amendment No. 1 with the following new subsection External Bonds of the Treasury as of December 31, 2012:
External Bonds of the Treasury as of December 31, 2012
The following table shows the external bonds of the Treasury issued and outstanding as of December 31, 2012.
Original Currency Nominal Amount |
Interest Rate | Initial Public Offering Price (%) |
Date of Issue |
Maturity Date |
Amount Outstanding |
Equivalent in Euro |
||||||||||||||
United States |
||||||||||||||||||||
$3,500,000,000 |
6.875% | 98.73 | September 27, 1993 |
September 27, 2023 |
$ | 3,500,000,000 | | 2,652,720,934 | ||||||||||||
$2,000,000,000 |
4.375% | 99.69 | February 27, 2003 |
June 15, 2013 |
$ | 2,000,000,000 | | 1,515,840,534 | ||||||||||||
$2,000,000,000 |
5.375% | 98.44 | February 27, 2003 |
June 15, 2033 |
$ | 2,000,000,000 | | 1,515,840,534 | ||||||||||||
$4,000,000,000 |
4.50% | 99.41 | January 21, 2005 |
January 21, 2015 |
$ | 4,000,000,000 | | 3,031,681,067 | ||||||||||||
$2,000,000,000 |
4.75% | 99.34 | January 25, 2006 |
January 25, 2016 |
$ | 2,000,000,000 | | 1,515,840,534 | ||||||||||||
$3,000,000,000 |
5.25% | 99.85 | September 20, 2006 |
September 20, 2016 |
$ | 3,000,000,000 | | 2,273,760,800 | ||||||||||||
$2,000,000,000 |
5.38% | 99.37 | June 12, 2007 |
June 12, 2017 |
$ | 2,000,000,000 | | 1,515,840,534 | ||||||||||||
$2,500,000,000 |
3.13% | 99.672 | January 26, 2010 |
January 26, 2015 |
$ | 2,500,000,000 | | 1,894,800,667 | ||||||||||||
$2,000,000,000 |
2.13% | 99.74 | September 16, 2010 |
September 16, 2013 |
$ | 2,000,000,000 | | 1,515,840,534 | ||||||||||||
|
|
|
|
|||||||||||||||||
$ | 24,500,000,000 | | 17,432,166,136 | |||||||||||||||||
|
|
|
|
|||||||||||||||||
Euro(2) |
||||||||||||||||||||
60,000,000 |
|
libor 3m -16 b.p. |
|
99.61 | October 8, 1998 |
October 8, 2018 |
| 60,000,000 | | 60,000,000 | ||||||||||
300,000,000 |
|
((1+0.86* TEC10) ^0.25)-1; floor3%su86(3) %*TEC10 |
|
101.43 | October 15, 1998 |
October 15, 2018 |
| 300,000,000 | | 300,000,000 | ||||||||||
1,000,000,000 |
4.00% | 99.95 | May 6, 1999 |
May 6, 2019 |
| 1,000,000,000 | | 1,000,000,000 | ||||||||||||
1,000,000,000 |
|
80%*CMS30Y; floor:4.25% |
|
101.60 | June 28, 1999 |
June 28, 2029 |
| 905,000,000 | | 905,000,000 | ||||||||||
1,000,000,000 |
|
CMS30Y- 0.91%; Floor:0.00% |
|
100.75 | August 30, 1999 |
August 30, 2019 |
| 1,000,000,000 | | 1,000,000,000 | ||||||||||
150,000,000 |
Zero Coupon | 100.00 | February 20, 2001 |
February 19, 2031 |
| 150,000,000 | | 150,000,000 | ||||||||||||
3,000,000,000 |
5.750% | 100.04 | July 25, 2001 |
July 25, 2016 |
| 3,000,000,000 | | 3,000,000,000 | ||||||||||||
150,000,000 |
|
84.5% CMS 10Y |
|
100.00 | April 26, 2004 |
April 26, 2019 |
| 150,000,000 | | 150,000,000 |
8
Original Currency Nominal Amount |
Interest Rate | Initial Public Offering Price (%) |
Date of Issue |
Maturity Date |
Amount Outstanding |
Equivalent in Euro |
||||||||||||||
300,000,000 |
|
CMS10Y ;cap:6%(4) |
|
100.00 | May 31, 2005 |
May 31, 2035 |
| 300,000,000 | | 300,000,000 | ||||||||||
720,000,000 |
3.83% | 100.00 | June 2, 2005 |
June 2, 2029 |
| 720,000,000 | | 720,000,000 | ||||||||||||
395,000,000 |
|
3.523% (until 2010)( 5 ) |
|
100.00 | June 2, 2005 |
June 2, 2030 |
| 395,000,000 | | 395,000,000 | ||||||||||
200,000,000 |
|
85% *CMS10Y; cap:7,45% |
|
100.00 | June 8, 2005 |
June 8, 2020 |
| 200,000,000 | | 200,000,000 | ||||||||||
2,500,000,000 |
|
85% *CMS 10Y; floor 2%; cap 7% |
|
100.00 | June 15, 2005 |
June 15, 2020 |
| 2,500,000,000 | | 2,500,000,000 | ||||||||||
300,000,000 |
|
85.5% *CMS 10Y; floor 2%; cap 7% |
|
100.00 | June 28, 2005 |
June 28, 2021 |
| 300,000,000 | | 300,000,000 | ||||||||||
200,000,000 |
|
Max {0, Min [10*(CMS10 CMS2), 6mEuribor + 1.50%)]} |
|
100.00 | November 9, 2005 |
November 9, 2025 |
| 200,000,000 | | 200,000,000 | ||||||||||
900,000,000 |
|
6m Euribor + 0.04% |
|
99.38 | March 17, 2006 |
March 17, 2021 |
| 900,000,000 | | 900,000,000 | ||||||||||
1,000,000,000 |
|
6m Euribor + 0.60% |
|
99.85 | March 22, 2006 |
March 22, 2018 |
| 1,000,000,000 | | 1,000,000,000 | ||||||||||
192,000,000 |
|
Zero Coupon |
|
100.00 | March 28, 2006 |
March 28, 2036 |
| 192,000,000 | | 192,000,000 | ||||||||||
300,000,000 |
|
6m Euribor + 0.075% |
|
100.00 | March 30, 2006 |
March 29, 2026 |
| 300,000,000 | | 300,000,000 | ||||||||||
215,000,000 |
|
5.07% / 10y CMS |
|
100.00 | May 11, 2006 |
May 11, 2026 |
| 215,000,000 | | 215,000,000 | ||||||||||
1,000,000,000 |
|
1.85% Inflation Indexed |
|
99.80 | January 5, 2007 |
September 15, 2057 |
| 1,107,000,000 | | 1,107,000,000 | ||||||||||
250,000,000 |
|
2.00% Inflation Indexed |
|
99.02 | March 30, 2007 |
September 15, 2062 |
| 277,000,000 | | 277,000,000 | ||||||||||
160,000,000 |
4.49% | 99.86 | April 5, 2007 |
April 5, 2027 |
| 160,000,000 | | 160,000,000 | ||||||||||||
500,000,000 |
|
2.20% Inflation Indexed |
|
98.86 | January 23, 2008 |
September 15, 2058 |
| 544,220,000 | | 544,220,000 | ||||||||||
258,000,000 |
5.26% | 99.79 | March 16, 2009 |
March 16, 2026 |
| 258,000,000 | | 258,000,000 | ||||||||||||
300,000,000 |
3.00% | 99,733 | May 29, 2009 |
November 29, 2013 |
| 300,000,000 | | 300,000,000 | ||||||||||||
250,000,000 |
4.85% | 98.50 | June 11, 2010 |
June 11, 2060 |
| 250,000,000 | | 250,000,000 | ||||||||||||
125,000,000 |
4.10% | 99.46 | September 6, 2010 |
November 1, 2023 |
| 125,000,000 | | 125,000,000 | ||||||||||||
125,000,000 |
4.20% | 99.38 | September 6, 2010 |
March 3, 2025 |
| 125,000,000 | | 125,000,000 | ||||||||||||
250,000,000 |
2.75% | 99.85 | November 11, 2010 |
November 11, 2018 |
| 250,000,000 | | 250,000,000 | ||||||||||||
125,000,000 |
2.85% | 99.90 | November 22, 2010 |
November 22, 2014 |
| 125,000,000 | | 125,000,000 | ||||||||||||
250,000,000 |
3.70% | 99.66 | November 22, 2010 |
May 22, 2018 |
| 250,000,000 | | 250,000,000 | ||||||||||||
125,000,000 |
3.75% | 99.89 | November 22, 2010 |
September 1, 2018 |
| 125,000,000 | | 125,000,000 | ||||||||||||
150,000,000 |
3.80% | 99.65 | December 23, 2010 |
January 23, 2017 |
| 150,000,000 | | 150,000,000 | ||||||||||||
150,000,000 |
4.45% | 99.40 | December 23, 2010 |
December 12, 2021 |
| 150,000,000 | | 150,000,000 | ||||||||||||
517,000,000 |
|
2.85% Inflation Indexed |
|
99.482 | January 4, 2011 |
September 1, 2022 |
| 517,000,000 | | 517,000,000 | ||||||||||
450,000,000 |
4.45% | 99.59 | February 26, 2011 |
August 24, 2020 |
| 450,000,000 | | 450,000,000 | ||||||||||||
2,156,000,000 |
6.58% | 100 | July 1, 2011 |
December 31, 2027 |
| 2,156,000,000 | | 2,156,000,000 | ||||||||||||
250,000,000 |
5.00% | 99.196 | September 22, 2011 |
September 22, 2017 |
| 250,000,000 | | 250,000,000 | ||||||||||||
230,000,000 |
|
4.20% Inflation Indexed |
|
100 | February 1, 2012 |
July 25, 2042 |
| 230,000,000 | | 230,000,000 | ||||||||||
437,500,000 |
3.66% | 100 | February 13, 2012 |
December 31, 2026 |
| 437,500,000 | | 437,500,000 | ||||||||||||
300,000,000 |
|
Zero Coupon |
|
99.78 | September 25, 2012 |
January 25, 2013 |
| 300,000,000 | | 300,000,000 | ||||||||||
300,000,000 |
|
Zero Coupon |
|
99.78 | September 25, 2012 |
January 25, 2013 |
| 300,000,000 | | 300,000,000 | ||||||||||
100,000,000 |
|
Zero Coupon |
|
99.71 | October 10, 2012 |
February 21, 2013 |
| 100,000,000 | | 100,000,000 | ||||||||||
|
|
|
|
|||||||||||||||||
| 22,723,720,000 | | 22,723,720,000 | |||||||||||||||||
|
|
|
|
|||||||||||||||||
Euro Ispa Bonds(6) |
||||||||||||||||||||
1,000,000,000 |
4.50% | 99.387 | February 6, 2004 |
July 31, 2014 |
| 1,000,000,000 | | 1,000,000,000 | ||||||||||||
750,000,000 |
|
2.25% Inflation Indexed |
|
99.368 | February 6, 2004 |
July 31, 2019 |
| 900,000,000 | | 900,000,000 | ||||||||||
3,250,000,000 |
5.13% | 98.934 | February 6, 2004 |
July 31, 2024 |
| 3,250,000,000 | | 3,250,000,000 | ||||||||||||
2,200,000,000 |
5.20% | 105.125 | February 6, 2004 |
July 31, 2034 |
| 2,200,000,000 | | 2,200,000,000 | ||||||||||||
850,000,000 |
|
Euribor 12 M + spread 0.23% (amortizing) |
|
100 | March 4, 2005 |
July 31, 2045 |
| 850,000,000 | | 850,000,000 | ||||||||||
1,000,000,000 |
|
Euribor 12 M + spread 0.235% (amortizing) |
|
100 | April 25, 2005 |
July 31, 2045 |
| 1,000,000,000 | | 1,000,000,000 | ||||||||||
300,000,000 |
|
3.5% (cap at 6.0%) |
|
100 | June 30, 2005 |
July 31, 2035 |
| 300,000,000 | | 300,000,000 | ||||||||||
100,000,000 |
|
3.5% (cap at 6.1%) |
|
100 | June 30, 2005 |
July 31, 2035 |
| 100,000,000 | | 100,000,000 | ||||||||||
|
|
|
|
|||||||||||||||||
| 9,600,000,000 | | 9,600,000,000 | |||||||||||||||||
|
|
|
|
|||||||||||||||||
Swiss Franc(7)(*) |
||||||||||||||||||||
ChF 2,000,000,000 |
2.50% | 100.09 | February 2, 2005 |
March 2, 2015 |
ChF | 2,000,000,000 | | 1,656,726,309 |
9
Original Currency Nominal Amount |
Interest Rate | Initial Public Offering Price (%) |
Date of Issue |
Maturity Date |
Amount Outstanding |
Equivalent in Euro |
||||||||||||||
ChF 1,000,000,000 |
2.50% | 99.336 | January 30, 2006 |
January 30, 2018 |
ChF | 1,000,000,000 | | 828,363,154.4 | ||||||||||||
|
|
|
|
|||||||||||||||||
ChF | 3,000,000,000 | | 2,485,089,463 | |||||||||||||||||
|
|
|
|
|||||||||||||||||
Pound Sterling(8)(*) |
||||||||||||||||||||
£400,000,000 |
10.50% | 100.875 | April 28, 1989 |
April 28, 2014 |
£ | 400,000,000 | | 490,136,012.7 | ||||||||||||
£1,500,000,000 |
6.00% | 98.565 | August 4, 1998 |
August 4, 2028 |
£ | 1,500,000,000 | | 1,838,010,048 | ||||||||||||
£250,000,000 |
5.25% | 99.476 | July 29, 2004 |
December 7, 2034 |
£ | 250,000,000 | | 306,335,008 | ||||||||||||
£300,000,000 |
|
3m aGbp Libor + 0,45 bp % |
|
100.00 | April 28, 2010 |
April 28, 2015 |
£ | 300,000,000 | | 367,602,009.6 | ||||||||||
|
|
|
|
|||||||||||||||||
£ | 2,450,000,000 | | 3,002,083,078 | |||||||||||||||||
|
|
|
|
|||||||||||||||||
Norwegian Kroner(9)(*) |
||||||||||||||||||||
NOK 2,000,000,000 |
4.34% | 100.00 | June 23, 2003 |
June 23, 2015 |
NOK | 2,000,000,000 | | 272,171,794.8 | ||||||||||||
|
|
|
|
|||||||||||||||||
NOK | 2,000,000,000 | | 272,171,794.8 | |||||||||||||||||
|
|
|
|
|||||||||||||||||
Japanese Yen(10)(*) |
||||||||||||||||||||
¥125,000,000,000 |
5.50% | 100.00 | December 15, 1994 |
December 15, 2014 |
¥ | 125,000,000,000 | | 1,100,255,259 | ||||||||||||
¥125,000,000,000 |
4.50% | 100.00 | June 8, 1995 |
June 8, 2015 |
¥ | 125,000,000,000 | | 1,100,255,259 | ||||||||||||
¥100,000,000,000 |
3.70% | 100.00 | November 14, 1996 |
November 14, 2016 |
¥ | 100,000,000,000 | | 880,204,207.4 | ||||||||||||
¥100,000,000,000 |
3.45% | 99.80 | March 24, 1997 |
March 24, 2017 |
¥ | 100,000,000,000 | | 880,204,207.4 | ||||||||||||
¥25,000,000,000 |
2.87% | 100.00 | May 18, 2006 |
May 18, 2036 |
¥ | 25,000,000,000 | | 220,051,051.8 | ||||||||||||
¥50,000,000,000 |
|
3mJpy libor +12 bp% |
|
100.00 | April 24, 2008 |
April 24, 2018 |
¥ | 50,000,000,000 | | 440,102,103.7 | ||||||||||
¥30,000,000,000 |
|
3m Jpy libor +40 bp% |
|
100.00 | July 8, 2009 |
July 8, 2019 |
¥ | 30,000,000,000 | | 264,061,262.2 | ||||||||||
¥30,000,000,000 |
|
3m Jpy libor +37 bp% |
|
100.00 | September 18, 2009 |
September 18, 2019 |
¥ | 30,000,000,000 | | 264,061,262.2 | ||||||||||
|
|
|
|
|||||||||||||||||
¥ | 585,000,000,000 | | 5,149,194,613 | |||||||||||||||||
|
|
|
|
|||||||||||||||||
Czech Koruna(11)(*) |
||||||||||||||||||||
CZK 2,490,000,000 |
4.36% | 100.00 | October 3, 2007 |
October 3, 2017 |
CZK | 2,490,000,000 | | 99,002,027.75 | ||||||||||||
CZK 2,490,000,000 |
4.40% | 100.00 | October 3, 2007 |
October 3, 2019 |
CZK | 2,490,000,000 | | 99,002,027.75 | ||||||||||||
CZK 2,490,000,000 |
4.41% | 100.00 | October 3, 2007 |
October 3, 2019 |
CZK | 2,490,000,000 | | 99,002,027.75 | ||||||||||||
|
|
|
|
|||||||||||||||||
CZK | 7,470,000,000 | | 297,006,083.3 | |||||||||||||||||
|
|
|
|
|||||||||||||||||
TOTAL OUTSTANDING |
| 60,961,431,169 | ||||||||||||||||||
|
|
(1) | U.S. dollar amounts have been converted into euro at $1.3194/1.00, the exchange rate prevailing at Dec. 31, 2012. |
(2) | External debt denominated in currencies of countries that have adopted the euro have been converted into euro at the fixed rate at which those currencies were converted into euro upon their issuing countries becoming members of the European Monetary Union. |
(3) | Starting from 2004 the bonds pay interest at the fixed rate of 3.965%. |
(4) | 12mEuribor+0.10% from May 2005 to May 2007; CMS10Y from June 2007 to 2035. |
(5) | After 2010 the bonds will yield a floating rate calculated as follows: 3.523% + 3 * Min [ Max (3.50%rate swap 20Y; 0.0%); 1.50%] |
(6) | Bonds issued by Infrastrutture S.p.A. |
(7) | Swiss Franc amounts have been converted into euro at ChF1.2072/1.00, the exchange rate prevailing at Dec. 31, 2012. |
(8) | Pounds Sterling amounts have been converted into euro at £0.81610/1.00, the exchange rate prevailing at Dec. 31, 2012. |
(9) | Norwegian Kroner amounts have been converted into euro at NOK7.3483/1.00, the exchange rate prevailing at Dec. 31, 2012. |
(10) | Japanese Yen amounts have been converted into euro at ¥113.61/1.00, the exchange rate prevailing at Dec. 31, 2012. |
(11) | Czech Koruna amounts have been converted into euro at C25.151/1.00, the exchange rate prevailing at Dec. 31, 2012. |
(*) | The above exchange rates are based on the official exchange rates of the Bank of Italy. |
Source: Ministry of Economy and Finance
10
Exhibit 2
MINISTERO DELLECONOMIA E DELLE FINANZE
|
MINISTERO DELLECONOMIA E DELLE FINANZE
|
MINISTERO DELLECONOMIA E DELLE FINANZE
|
MINISTERO DELLECONOMIA E DELLE FINANZE
|
MINISTERO DELLECONOMIA E DELLE FINANZE
|
MINISTERO DELLECONOMIA E DELLE FINANZE
|
MINISTERO DELLECONOMIA E DELLE FINANZE
|
MINISTERO DELLECONOMIA E DELLE FINANZE
|
MINISTERO DELLECONOMIA E DELLE FINANZE
|
MINISTERO DELLECONOMIA E DELLE FINANZE
|
MINISTERO DELLECONOMIA E DELLE FINANZE
|
MINISTERO DELLECONOMIA E DELLE FINANZE
|
MINISTERO DELLECONOMIA E DELLE FINANZE
|
MINISTERO DELLECONOMIA E DELLE FINANZE
|
MINISTERO DELLECONOMIA E DELLE FINANZE
|
MINISTERO DELLECONOMIA E DELLE FINANZE
|
EXHIBIT 3
REPUBBLICA ITALIANA
Dipartimento del TESORO
Italys Strategy for Growth and Fiscal Consolidation
February 7, 2013
Italian Ministry of Economy and Finance, Treasury Department
Ministero dellEconomia e delle Finanze
THE INTERNATIONAL CRISIS AND ITALYS ECONOMY
Why is Italys economy expected to turn around in 2013?
Monetary and credit conditions: interest rate spreads narrowing and credit growth likely to start improving.
Fiscal multiplier effect: 2.8pp fiscal correction in structural terms in 2012, but only 0.9pp in 2013 on current projections.
Stabilisation of business and consumer confidence.
Some strengthening in global demand.
No major structural imbalances (aside from high debt/GDP) means that growth can rapidly go back to potential.
Dipartimento del TESORO
MEF Ministero dellEconomia e delle Finanze
2
THE INTERNATIONAL CRISIS AND ITALYS ECONOMY
Differentials between govt bond yields and sovereign CDS
4,0 3,0 2,0 % 1,0 0,0 -1,0 -2,0
Italy Germany Differential (RHS)
Average (RHS)
5,0 4,5 4,0 3,5 3,0 2,5 % 2,0 1,5 1,0 0,5 0,0
Jul-10 Jan-11 Jul-11 Jan-12 Jul-12 Jan-13
Source: Thomson Reuters
Dipartimento del TESORO
MEF Ministero dellEconomia e delle Finanze
3
THE INTERNATIONAL CRISIS AND ITALYS ECONOMY
European sovereign and bank CDSs are closely linked
600 500 400 300 200 100 0
European sovereign 5Y CDS
European bank 5Y CDS
Basis points
Jan-08 Nov-08 Sep-09 Jul-10 May-11 Mar-12 Jan-13
Source: Thomson Reuters Datastream
Dipartimento del TESORO
MEF Ministero dellEconomia e delle Finanze
4
THE INTERNATIONAL CRISIS AND ITALYS ECONOMY
Rapid slowdown in credit growth: how soon will it turn?
32 27 22 17 12 7 2 -3 -8 % year-on-year
Euro area Germany
Spain France Italy
Dec-04 Dec-05 Dec-06 Dec-07 Dec-08 Dec-09 Dec-10 Dec-11 Dec-12
Source: ECB
Dipartimento del TESORO
MEF Ministero dellEconomia e delle Finanze
5
THE INTERNATIONAL CRISIS AND ITALYS ECONOMY
Interest rates on loans: is the gap about to narrow?
6 5 4 % 3 2 1
Germany Spain France Italy Euro area
Dec-03 Dec-04 Dec-05 Dec-06 Dec-07 Dec-08 Dec-09 Dec-10 Dec-11 Dec-12
Source: ECB
Dipartimento del TESORO
MEF Ministero dellEconomia e delle Finanze
6
THE INTERNATIONAL CRISIS AND ITALYS ECONOMY
Credit standards are back in line with the EA
Diffusion index
0,6
Loans to non-financial corporations - Italy
0,5
0,4
Loans to non-financial corporations - EA
0,3
0,2
0,1
0,0
-0,1
Diffusion index
Apr-05
Apr-06
Apr-07
Apr-08
Apr-09
Apr-10
Apr-11
Apr-12
Apr-13
Source: Bank of Italy, ECB
Dipartimento del TESORO
MEF Ministero dellEconomia e delle Finanze
7
THE INTERNATIONAL CRISIS AND ITALYS ECONOMY
Rise in deposits has reduced the bank funding gap
€ bn
800
750
700
650
600
550
500
450
400
350
300
MFI Deposits
Nov-07
May-08
Nov-08
May-09
Nov-09
May-10
Nov-10
May-11
Nov-11
May-12
Nov-12
Source: Bank of Italy
Dipartimento del TESORO
MEF Ministero dellEconomia e delle Finanze
8
THE INTERNATIONAL CRISIS AND ITALYS ECONOMY
Industrial production: stabilisation and then recovery?
Index
115
110
105
100
95
90
85
80
75
70
15
10
5
0
-5
% year-on-year
-10
-15
-20
-25
-30
Business Confidence in Industry
Industrial Production WDA (RHS)
Jan-01
Jan-03
Jan-05
Jan-07
Jan-09
Jan-11
Jan-13
Source: ISTAT
Dipartimento del TESORO
MEF Ministero dellEconomia e delle Finanze
9
THE INTERNATIONAL CRISIS AND ITALYS ECONOMY
Demand is deeply split
Percentage points
6
4
2
0
-2
-4
-6
Domestic demand
Foreign demand
3Q 92
3Q 94
3Q 96
3Q 98
3Q 00
3Q 02
3Q 04
3Q 06
3Q 08
3Q 10
3Q 12
Source: ISTAT
Dipartimento del TESORO
MEF Ministero dellEconomia e delle Finanze
10
THE INTERNATIONAL CRISIS AND ITALYS ECONOMY
Contribution of variation in imports turned positive
Percentage point contribution to year-on-year GDP growth
6
4
2
0
-2
-4
-6
-8
Exports
Imports
1Q 93
1Q 95
1Q 97
1Q 99
1Q 01
1Q 03
1Q 05
1Q 07
1Q 09
1Q 11
Source: ISTAT
Dipartimento del TESORO
MEF Ministero dellEconomia e delle Finanze
11
THE INTERNATIONAL CRISIS AND ITALYS ECONOMY
Household income and consumption to recover gradually
% year-on-year
9
7
5
3
1
-1
-3
-5
Real disposable income
Real Private Consumption
Saving rate (RHS)
16
14
12
10
8 %
6
4
2
0
3Q 00 3Q 01 3Q 02 3Q 03 3Q 04 3Q 05 3Q 06 3Q 07 3Q 08 3Q 09 3Q 10 3Q 11 3Q 12
Source: ISTAT
Dipartimento del TESORO
MEF Ministero dellEconomia e delle Finanze
12
THE INTERNATIONAL CRISIS AND ITALYS ECONOMY
Energy and VAT-induced inflation on the mend
% year - on - year
5,0
4,0
3,0
2,0
1,0
0,0
-1,0
-2,0
Differential
Euro area, HICP
IT, HICP
Feb-07
Aug-07
Feb-08
Aug-08
Feb-09
Aug-09
Feb-10
Aug-10
Feb-11
Aug-11
Feb-12
Aug-12
Feb-13
source: Eurostat, Istat
Dipartimento del TESORO
MEF Ministero dellEconomia e delle Finanze
13
THE INTERNATIONAL CRISIS AND ITALYS ECONOMY
Official macroeconomic projections (September 2012)
(% change yoy) 2011 2012 2013 2014 2015
Real GDP 0.4 -2.4 -0.2 1.1 1.3
Domestic demand net of inventories -0.5 -3.6 -0.6 0.7 1.0
Inventories -0.5 -0.9 0.1 0.1 0.0
Net export 1.4 2.3 0.2 0.2 0.2
Nominal GDP 1.7 -1.0 1.2 3.0 3.2
GDP deflator 1.3 1.4 1.4 1.9 1.9
Labour cost 1.2 1.1 0.9 1.2 1.2
Productivity (on GDP) 0.3 -1.2 0.1 0.6 0.7
Unit labour cost (on GDP) 0.9 2.3 0.8 0.5 0.5
Employment (FTE) 0.1 -1.2 -0.3 0.4 0.6
Unemployment rate 8.4 10.8 11.4 11.3 10.9
Current account balance -3.1 -1.4 -1.3 -1.1 -1.0
Source: Update of 2012 Economic and Financial Document, September 20, 2012
Note: National account data for 2011 take into account revisions according to ISTATs release on October 4.
Dipartimento del TESORO
MEF Ministero dellEconomia e delle Finanze
14
MACROECONOMIC IMBALANCES AND COMPETITIVENESS
No major imbalances (apart from high public debt)
No major macroeconomic imbalances: no major bubbles in the housing market, low household debt, fundamentally sound banking system, no major external imbalances.
No increase in discretionary spending during the crisis: prudent fiscal policy; automatic stabilisers allowed to work.
Competitiveness issues are contained; although admittedly high public debt/GDP is a major hurdle.
Dipartimento del TESORO
MEF Ministero dellEconomia e delle Finanze
15
MACROECONOMIC IMBALANCES AND COMPETITIVENESS
No major macroeconomic imbalances
External imbalances
Internal imbalances
Current account 3 year variation % GDP -4/+6%
Net international investment position % GDP -35%
REER on CPI % GDP +/-5 (EA); +/-11% (Non EA)
Export market share 5 year variation -6%
Nominal ULC 3 year variation +9 (EA); +12% (Non EA)
House price index Year/year Variation 6%
Private credit flow % GDP 15%
Private debt % GDP 160%
Public Debt % GDP 60%
Unemployment rate 3 year level 10%
Financial sector total non-consolidated liabilities Year/year variation 16.5%
BE -0.3 65.7 -0.5 -10.2 6.2 -0.1 11.6 236.0 98.0 7.8 4.7
DE 5.9 32.6 -3.9 -8.4 5.9 1.4 4.8 128.0 81.0 6.9 2.1
IE 0.0 -96.0 -9.1 -12.2 -12.8 -15.2 4.0 310.0 106.0 13.3 -0.6
EL -10.4 -86.1 3.1 -18.7 4.1 -5.1 -5.5 125.0 171.0 13.2 -3.4
ES -4.3 -91.7 -1.3 -7.6 -2.1 -10.0 -4.1 218.0 69.0 19.9 3.7
FR -1.6 -15.9 -3.2 -11.2 6.0 3.8 4.0 160.0 86.0 9.6 7.3
IT -2.9 -20.6 -2.1 -18.4 4.4 -2.0 2.6 129.0 121.0 8.2 3.8
LU 7.5 107.8 0.8 -10.1 12.5 1.5 2.5 326.0 18.0 4.8 11.3
NL 7.5 35.5 -1.6 -8.2 5.8 -4.0 0.7 225.0 66.0 4.2 7.2
AT 2.2 -2.3 -1.0 -12.7 5.9 -8.0 4.1 161.0 72.0 4.4 -0.3
PT -9.1 -105.0 -1.9 -9.5 0.9 -3.6 -3.2 249.0 108.0 11.9 -0.7
FI 0.6 13.1 -1.3 -22.9 9.1 -0.3 4.6 179.0 49.0 8.1 30.8
DK 5.0 24.5 -1.7 -16.9 4.7 -4.9 -2.2 238.0 47.0 7.0 4.7
SE 6.6 -8.3 3.9 -11.6 1.2 1.0 6.3 232.0 38.0 8.1 3.6
UK -2.2 -17.3 -7.1 -24.2 8.1 -5.4 1.0 205.0 85.0 7.8 8.5
Source: MEF elaboration on Alert Mechanism Report 2013 (European Commission, November 2012)
Dipartimento del TESORO
MEF Ministero dellEconomia e delle Finanze
16
MACROECONOMIC IMBALANCES AND COMPETITIVENESS
Modest deterioration in competitiveness over time
Current account
Net international investment position
REER
Export market share
ULC
House price index
Private credit flow
Private debt
Public debt
Unemployment rate
Financial sector liabilities
2001 0.4 -5.8 -5.7 -18.5 4.8 5.4 8.4 87.0 108.0 10.0 -3.0
2002 -0.1 -12.4 -2.0 -14.2 7.0 6.5 6.4 90.0 105.0 9.2 3.9
2003 -0.3 -13.6 8.8 -13.4 10.7 7.4 7.0 93.0 104.0 8.6 11.6
2004 -0.5 -15.8 9.9 -7.4 9.8 7.1 8.3 98.0 103.0 8.3 7.2
2005 -0.7 -16.8 6.9 -5.2 8.7 5.2 9.4 104.0 106.0 8.1 12.1
2006 -0.9 -22.2 1.1 -12.5 6.5 3.2 10.9 110.0 106.0 7.5 10.5
2007 -1.2 -24.5 0.7 -9.3 6.1 2.6 13.1 118.0 103.0 6.9 0.5
2008 -1.9 -24.1 3.2 -16.3 8.3 -0.4 6.7 122.0 106.0 6.5 -2.7
2009 -2.0 -25.3 3.9 -17.9 10.5 -0.3 1.3 128.0 116.0 6.9 5.7
2010 -2.8 -24.0 -0.9 -19.2 8.1 -1.5 3.8 129.0 119.0 7.6 1.7
2011 -2.9 -20.6 -2.1 -18.4 4.4 -2.0 2.6 129.0 121.0 8.2 3.8
Threshold
+6 %/ -4 %
-35%
+/-5 %euro area; +/-11 % non euro area
-6%
+/-9 % euro area; +/-12 % non euro area
6%
15%
160%
60%
10%
16.5%
Source: MEF elaboration on Alert Mechanism Report 2013 (European Commission, November 2012)
Dipartimento del TESORO
MEF Ministero dellEconomia e delle Finanze
17
THE INTERNATIONAL CRISIS AND ITALYS ECONOMY
Real house price: no need for further correction
Indices 2000=100
210
190
170
150
130
110
90
70
Germany
France
Italy
UK
Spain
Ireland
Euro Area
2000
2001
2002
2003
2004
2005
2006
2007
2008
2009
2010
2011
2012
Note: Data for Germany, France, Italy, UK and the Euro area are available for the first 3 quarters of 2012. Source: OECD
Dipartimento del TESORO
MEF Ministero dellEconomia e delle Finanze
18
MACROECONOMIC IMBALANCES AND COMPETITIVENESS
Is competitiveness really deteriorating in line with ULC?
Indices 2000=100
140
130
120
110
100
90
Germany
Ireland
Greece
Spain
France
Italy
Portugal
2000
2001
2002
2003
2004
2005
2006
2007
2008
2009
2010
2011
Source: Italian Ministry of Economy and Finance calculation on Eurostat data
Dipartimento del TESORO
MEF Ministero dellEconomia e delle Finanze
19
MACROECONOMIC IMBALANCES AND COMPETITIVENESS
Unit labour costs: key Italian features versus EU partners
Excessive growth in ULC: mainly due to unfavourable developments in labour productivity.
Limited downward adjustment in wages: not enough to compensate for poor productivity growth and to address unemployment challenges.
Wage dynamics: (a) changing composition of employment, (b) severance payments included in labour costs, (c) time lag in renewing collective agreements, (d) extended working life of higher-paid older workers due to pension reforms.
Dipartimento del TESORO
MEF Ministero dellEconomia e delle Finanze
20
MACROECONOMIC IMBALANCES AND COMPETITIVENESS
Private wage growth likely to ease further
% year-on-year
10
8
6
4
2
0
-2
-4
Total economy Public sector
Private sector
Compensation per employees per full-time equivalent
93
94
95
96
97
98
99
00
01 02 03 04 05 06 07 08
09 10 11 12 13
Source: ISTAT
Note: MEF calculation on 2012 and 2013 data
Dipartimento del TESORO
MEF Ministero dellEconomia e delle Finanze
21
MACROECONOMIC IMBALANCES AND COMPETITIVENESS
Sharp improvement in Italys trade balance
€ bn
80
60
40
20
0
-20
-40
Total trade balance
Total trade balance excl. energy
1992
1994
1996
1998
2000
2002
2004
2006
2008
2010
2012
Source: ISTAT. MEF calculation on 2012 total trade balance.
Note: Energy includes oil and natural gas. Total trade balance excl. energy refers to the period January-November 2012.
Dipartimento del TESORO
MEF Ministero dellEconomia e delle Finanze
22
MACROECONOMIC IMBALANCES AND COMPETITIVENESS
Current account deficit narrowing fast
% of GDP
2,0
1,5
1,0
0,5
0,0
-0,5
-1,0
-1,5
-2,0
Goods
Services
Incomes
Transfers
Current Account (RHS)
4,0
3,0
2,0
1,0
0,0
-1,0
-2,0
-3,0
-4,0
% of GDP
2000
2001
2002 2003
2004 2005
2006 2007
2008 2009 2010 2011
2012
Source: Bank of Italy Note: 2012 data are estimates as reported in the Update of 2012 Economic and Financial Document, September 20, 2012.
Dipartimento del TESORO
MEF Ministero dellEconomia e delle Finanze
23
MACROECONOMIC IMBALANCES AND COMPETITIVENESS
Current account and savings by sector
% of GDP
8
6
4
2
0
-2
-4
-6
-8
Corporate (LHS)
Housholds (LHS)
General Government (LHS)
% of GDP
0,5
0
-0,5
-1
-1,5
-2
-2,5
-3
-3,5
-4
2000
2001
2002
2003
2004
2005
2006
2007
2008
2009
2010
2011
2012
Source: ISTAT and Bank of Italy
Dipartimento del TESORO
MEF Ministero dellEconomia e delle Finanze
24
MACROECONOMIC IMBALANCES AND COMPETITIVENESS
How much of the adjustment is structural?
% of GDP
2
1
0
-1
-2
-3
-4
-5
Headline vs underlying current account
Underlying Current Account - (EU Commission methodology)
1999
2000
2001
2002
2003
2004
2005
2006
2007
2008
2009
2010
2011
2012
2013
2014
Note: The underlying current account is derived according to the methodology described in: Salto M., A. Turrini, 2010, Comparing alternative methodologies for real exchange rate assessment, European Economy, Economic Papers, n. 427.
Source: EU Commission, AMECO DATABASE, 2012 Autumn Forecast.
Dipartimento del TESORO
MEF Ministero dellEconomia e delle Finanze
25
FISCAL CONSOLIDATION
Key public finance projections (September 2012)
% of GDP 2010 2011 2012 2013 2014 2015
Net Borrowing Requirement -4.6 -3.9 -2.6 -1.8 -1.5 -1.3
Cyclically-adjusted NBR -3.6 -3.6 -0.9 0.0 -0.2 -0.4
Change in Cyclically-adjusted NBR -0.4 0.0 -2.8 -0.9 0.3 0.2
Primary Balance 0.1 1.0 2.9 3.8 4.4 4.8
Public Debt 119.2 120.7 126.4 126.1 123.1 119.9
Public Debt (net support to Euro Zone) 118.9 119.9 123.3 122.3 119.3 116.1
Source: Update of 2012 Economic and Financial Document, September 20, 2012
Dipartimento del TESORO
MEF Ministero dellEconomia e delle Finanze
26
FISCAL CONSOLIDATION
Primary surplus close to 5% of GDP in 2015
% of GDP
10 8 6 4 2 0 -2 -4 -6 -8 -10 -12 -14
Net borrowing (LHS)
Primary balance (LHS)
Debt/GDP (including aid) (RHS)
Debt/GDP (net of aid) (RHS)
130 125 120 115 110 105 100 95 90 85
% of GDP
90 91 92 93 94 95 96 97 98 99 00 01 02 03 04 05 06 07 08 09 10 11 12 13 14 15
Source: Update of 2012 Economic and Financial Document, September 20, 2012
Dipartimento del TESORO
MEF Ministero dellEconomia e delle Finanze
27
FISCAL CONSOLIDATION
2011-2012 measures: a rebalancing over time
100
Higher net revenues
Lower net expenditure
90
80
70
60
%
50
40
30
20
10
0
2012
2013
2014
2015
Source: MEF estimates
Dipartimento del TESORO
MEF Ministero dellEconomia e delle Finanze
28
FISCAL CONSOLIDATION
Moderate increase in interest payments (forward rates)
14
14
Interest payments (LHS)
Average yield at issuance
Average yield as % debt *
12
* Proxied by interest expenditure divided by the debt level of the previous year
12
10
10
8
8
% of GDP
6
6
4
4
%
2
2
0
0
1993
1994
1995
1996
1997
1998
1999
2000
2001
2002
2003
2004
2005
2006
2007
2008
2009
2010
2011
2012
2013
2014
2015
Source: Ministry of Economy and Finance. Figures for interest payments in 2012-2015 are official estimates (Update 2012 DEF)
Dipartimento del TESORO
MEF Ministero dellEconomia e delle Finanze
29
FISCAL CONSOLIDATION
Lengthened maturity of public debt reduces risks
8
7
Average life
Duration
6
5
years
4
3
2
1
0
1994
1996
1998
2000
2002
2004
2006
2008
2010
Dec-12
Source: Update of 2012 Economic and Financial Document, September 20, 2012
Dipartimento del TESORO
MEF Ministero dellEconomia e delle Finanze
30
FISCAL CONSOLIDATION
Italian public debt held by foreign investors
60
55
50
% of annualized GDP
45
40
35
30
2009
2010
2011
2012
Source: Bank of Italy
Dipartimento del TESORO
MEF Ministero dellEconomia e delle Finanze
31
FISCAL CONSOLIDATION
Compliance with EU debt rule: not far away
8
7
Debt Isoquants
(BB=Debt benchmark)
Primary balance, % of GDP
6
Compliance
BB 2016 (116,8)
5
2015
Pb: 4.8%, g-r: -2.0%
4
3
2012
BB 2018 (111,3)
Pb: 2.8%, g-r: -5.3%
No compliance
2
1
-6
-5
-4
-3
-2
-1
0
Nominal growth - interest rate differential (g-r), %
Dipartimento del TESORO
MEF Ministero dellEconomia e delle Finanze
32
FISCAL CONSOLIDATION
According to the EU Commission, no sustainability gap
LTC (% of GDP)
10 S2=0 S2=2 S2=4 S2=6 S2=8 S2=10 S2=12 S2=14
08 06 04 02 00 -02
Sustainability gap S2>0
No Sustainability gap S2<0
Unfavourable long-term projections
Favourable long-term projections
LU BE SI FI MT SK CY
RO AT LT NL CZ
SE DE BG EU DK UK ES
EA PL FR EE HU LV IT
Favorable initial fiscal position
Unfavorable initial fiscal position
LBP (% of GDP)
-08 -06 -04 -02 00 02 04 06
Source: European Commission, Fiscal Sustainability Report 2012, EUROPEAN ECONOMY, 08/2012
Dipartimento del TESORO
MEF Ministero dellEconomia e delle Finanze
33
FISCAL CONSOLIDATION
Reduction in the stock of public debt: mapping public assets
Local government debt is only 6% of GDP. However, 54% of real estate assets and stockholdings are at local level.
Very difficult to get a reliable, complete and updated valuation: 1/3 of GDP= tentative estimate of value of recorded assets.
Buildings: Only 53% of administrations have provided detailed information about their assets. 530,000 real estate units for 222mn sqm of which 70% is for institutional use and 9% for residential use (47% in terms of units). 80% of units are owned by local government. Market value is estimated at about 340bn (21.7% of GDP).
Dipartimento del TESORO
MEF Ministero dellEconomia e delle Finanze
34
FISCAL CONSOLIDATION
Reduction of the stock of public debt: few marketable assets
Land: 760,000 plots of land for a total of more than 1.3mn ha, 98% held by local government (82% municipalities). Market value is estimated at about 30bn (1.9% of GDP).
Stockholdings: About 7,000 companies of which 80% owned by local government. Market value estimated at about 150bn (9.6% of GDP) of which 85.8bn owned by the Ministry of Economy and Finance (1/2 is National Railways). The three major quoted companies (about 12bn) are perceived as strategic; for others there is no market appetite; moreover quoted companies have far off-peak values.
Dipartimento del TESORO
MEF Ministero dellEconomia e delle Finanze
35
FISCAL CONSOLIDATION
Reduction in the stock of public debt: coming soon
€8.0bn from sale to CDP of SACE, SIMEST and Fintecna. Further payments are expected by early 2013. Proceeds go to the Public Debt Sinking Fund or to pay off commercial debt.
Real estate assets will be transferred from central and local government to real estate funds, which have mandates to create value and/or dismiss assets.
The Government expects proceeds from dismissals to reduce public debt by at least 1pp of GDP per year. 3-5bn of state-owned assets ready for 2013; the rest requires strong cooperation with local government.
Dipartimento del TESORO
MEF Ministero dellEconomia e delle Finanze
36
RECENT BUDGET MEASURES
Going for growth and fiscal consolidation
Freeing up resources of about €10bn in 2013, €10.7bn in 2014 and €10.1bn in 2015 respectively.
Use of resources for about €12.3bn in 2013, €10.6bn in 2014 and €9.7bn in 2015.
Rebalancing revenues/expenditure to favour growth and fiscal consolidation.
Reduction in taxes on labour.
Dipartimento del TESORO
MEF Ministero dellEconomia e delle Finanze
37
RECENT BUDGET MEASURES
Key measures for fiscal consolidation
Cut in NHS spending for goods and services and medical devices.
Further cuts in transfers to local governments in 2013-2015.
Introduction of the Tobin Tax on transactions involving equities with a proportional tax rate of 0.1% (0.2% for OTC financial transactions) paid by buyers, to be aligned with European legislation once it is decided; different treatment on derivatives (lump sum with a maximum fee of €200 for transactions above €1Mn) for both buyers and sellers.
Dipartimento del TESORO
MEF Ministero dellEconomia e delle Finanze
38
RECENT BUDGET MEASURES
Key measures to support growth (1)
Increase in the ordinary VAT rate from 21 to 22% as of July 2013, while the lower VAT rate remains at 10%.
Higher tax allowances for families with children: From 2013 the tax credit is €1,220 (currently €900) for each child under the age of 3 and €950 (€800) for those older than 3.
Reduction in taxes on labour: effective 2013, tax deductions for employers on IRAP to increase from €4,600 to €7,500. Even higher deductions for women, workers under 35, and firms located in disadvantaged Regions.
Dipartimento del TESORO
MEF Ministero dellEconomia e delle Finanze
39
RECENT BUDGET MEASURES
Key measures to support growth (2)
Small enterprises and self-employed entrepreneurs can rely on a new fund for IRAP tax exemptions.
A special fund is designed to favour investments in R&D by SMEs, using resources previously allocated on a generic basis to firms. The fund also finances a reduction in the tax wedge.
A new fund, financed with proceeds from the fight against tax evasion, to reduce the tax burden on households and firms.
Infrastructure projects: additional financing of the Lyon-Turin high-speed train line and MOSE, the dam system for Venice.
Dipartimento del TESORO
40
MEF Ministero dellEconomia e delle Finanze
FISCAL CONSOLIDATION
Constitutional reform: a new fiscal framework
Balanced budget rule included in the Constitution: it will enter into force in FY 2014.
In December 2012, Parliament approved the reinforced law defining the mechanism by which the balanced budget will be achieved and clarifying the functions of the independent body (established by Constitutional amendment) within the Parliament in charge of monitoring public finances and checking compliance with fiscal rules.
Dipartimento del TESORO
41
MEF Ministero dellEconomia e delle Finanze
FISCAL CONSOLIDATION
The Government proposal for a reform of the tax system
Reform of cadastral rents: adequacy between official and actual real estate values.
Fight against tax elusion and avoidance: reshuffling of tax expenditures for small businesses and low income tax payers.
Tax framework for enterprises: changes in the IRAP tax base and a single, combined payment of IRAP, IRES and IVA for small firms.
Sanctions proportional to gravity of violation: more room for judicial settlement procedures, reorganisation in tax collection.
Dipartimento del TESORO
42
MEF Ministero dellEconomia e delle Finanze
FISCAL CONSOLIDATION
Reduction in the cost of doing politics
Reduced financing of political parties as well as appointees at regional level; reduction in the number of regional counselors.
Increased financial controls and sanctions for Regions that do not respect the rules (80% cut in central Government financing, excluding health care and transport funding).
Greater transparency in balance sheets of local political groups and regional politicians income and personal wealth. Stricter criteria regarding politicians compensation and pension.
Plan to achieve a balance budget within 5 years in case of excessive deficit in provinces and municipalities.
Dipartimento del TESORO
43
MEF Ministero dellEconomia e delle Finanze
FISCAL CONSOLIDATION
Public sector shrinking since 2007
Since 2007 the number of public employees and their compensation has declined by 4.3% and 2.3%, respectively.
Related cost of labour has decreased by 3.3%.
This is the result of 2010 and 2011 policy changes: extension of freeze in turnover and suspension of national wage bargaining.
Dipartimento del TESORO
44
MEF Ministero dellEconomia e delle Finanze
FISCAL CONSOLIDATION
Lower tax wedge on labour
Higher tax allowances for families with children: From 2013 the tax credit is €1,220 (currently €900) for each child under the age of 3 and €950 (€800) for those older than 3.
Reduction in taxes on labour: effective 2013, tax deduction for employers on IRAP to increase from €4,600 to €7,500. Even higher deductions for women, workers under 35, and firms located in disadvantaged Regions.
Dipartimento del TESORO
45
MEF Ministero dellEconomia e delle Finanze
PENSION REFORM
Key achievements of the pension reform
Enhances the medium and long-term sustainability of Italys pension system.
Guarantees fairness across and intra generations.
Increases the minimum retirement age and contribution period required to be entitled to pension benefits.
Links retirement age and contributory periods to changes in life expectancy.
Improves transparency by merging entities providing pensions (INPDAP and ENPALS into INPS).
Dipartimento del TESORO
46
MEF Ministero dellEconomia e delle Finanze
PENSION REFORM
Major structural savings
About €7.6bn total cumulative savings (net of taxation) in 2014, increasing to almost €22bn in 2020.
In 2012-13, indexation freeze of pension benefits higher than 3 times the minimum provision (€3.1bn savings in 2014).
Overall revision of the pension system, including early retirement schemes (€2.9bn in 2014, up to €15.7bn in 2020).
Higher social contribution rates for farmers and self-employed from 20% to 24% in 2018 (€1.5bn in 2014, up to €3.2bn in 2020).
Dipartimento del TESORO
47
MEF Ministero dellEconomia e delle Finanze
PENSION REFORM
Sizeable effect on pension spending as % of GDP
19%
18%
17%
16%
15%
14%
13%
12%
2007 2010 2013 2016 2019 2022 2025 2028 2031 2034 2037 2040 2043 2046 2049 2052 2055 2058
Current Legislation
Legislation before DL. 201/2011
Legislation before DL. 98/2011
Legislation before DL. 78/2010
Legislation before L. 243/2004
Source: Update of 2012 Economic and Financial Document, September 20, 2012. Demographic projections from ISTAT, central demographic scenario 2012
Dipartimento del TESORO
48
MEF Ministero dellEconomia e delle Finanze
PENSION REFORM
Social adequacy assured
Net replacement rate for old age retirement - males*
100
90
80
70
60
50
40
2010 2020 2030 2040 2050 2060
Employees
Self-employed
Current Legislation
Net replacement rate for old age retirement - females*
100
90
80
70
60
50
40
2010 2020 2030 2040 2050 2060
Employees
Self-employed
Legislation before DL 98/2011
Source: Medium-long term trends for pension, health and long-term care, Report no.13, 2012, State Accounting Office (*) Net replacement rates are net of tax and contributions. Assumption on minimum pension requirement: age/contributory years proportional to age of entry in the labour market. For further information please refer to Box 6.1 in Medium-long term trends for pension, health and long-term care, Report no.13, 2012, State Accounting Office.
Dipartimento del TESORO
49
MEF Ministero dellEconomia e delle Finanze
PENSION REFORM
A significant lengthening of the retirement age (OECD)
Years
5
4
3
2
1
0
A. Projected increase in the average effective exit age, 2010-2020
Cyprus Luxembourg Latvia Netherlands Ireland Belgium Bulgaria Greece Estonia Sweden United Kingdom Denmark Portugal Lithuania Czech Republic Romania Finland Germany Austria EU27 Malta Slovak Republic Spain Poland France Hungary Slovenia Italy
Years
5
4
3
2
1
0
Percentage Points
20
15
10
5
0
B. Projected increase in the participation rate of 55-64-year-olds, 2010-2020
Bulgaria Romania Sweden Luxembourg Estonia Cyprus Poland Czech Republic Latvia Lithuania Netherlands Slovak Republic Finland United Kingdom Denmark Austria Malta Portugal Germany Ireland Belgium Greece EU27 France Slovenia Hungary Spain Italy
Percentage Points
20
15
10
5
0
Source: OECD
Dipartimento del TESORO
50
MEF Ministero dellEconomia e delle Finanze
SPENDING REVIEW
Towards a leaner and more efficient public administration
In July, the Government adopted measures with savings estimated at €4.6bn in 2012, €10.8bn in 2013, €11.6bn in 2014 and €12.1bn in 2015.
Public procurement will be managed by Consip or regional centralised-purchasing agencies only.
Number of civil servants will decrease by 10% (20% at managerial level).
The majority of rents paid by the Public Administration are frozen until end-2014 and are to be renegotiated with a 15% discount.
Dipartimento del TESORO
51
MEF Ministero dellEconomia e delle Finanze
FIGHT AGAINST CORRUPTION
Rule of law strengthened
Ban from public office for people convicted in final judgment or subjected to judicial measures.
Revision of norms against corruption and introduction of two new legal offenses to contrast acts of preferential treatment by public officials.
Increase in penalties for managers or other corporate stakeholders for doing or omitting acts in contrast with their obligations or loyal duties entailing damages to their company.
More severe penalties, especially in cases of judicial corruption.
Dipartimento del TESORO
52
MEF Ministero dellEconomia e delle Finanze
FIGHT AGAINST CORRUPTION
Rule of law: stricter procedures and more control
The Commission for the evaluation, transparency and integrity of the Public Administration (CIVIT) becomes the National Anti-Corruption Authority.
Creation of a National Anti-Corruption Plan and Anti-mafia list for businesses to prevent and fight corruption at national and international level.
Incompatibility of public employment with external assignment; code of conduct for public employees.
Stricter individuation of eligibility criteria for public positions at central, regional and local level.
Dipartimento del TESORO
53
MEF Ministero dellEconomia e delle Finanze
FIGHT AGAINST TAX EVASION
An aggressive stance in fighting tax evasion
The legal threshold for cash payments is lowered to € 1,000.
A softer regime for controls will apply to tax payers who are compliant with so-called sectoral studies.
Cheating on the Revenue Agency is now a criminal offence.
Focus on large tax payers and VAT frauds.
Synergies with the Social Security Institute (INPS) in order to crack down on undeclared economic activity.
Dipartimento del TESORO
54
MEF Ministero dellEconomia e delle Finanze
FIGHT AGAINST TAX EVASION
Increasing success in the fight against tax evasion
Euro billion
14
12,7
13,0
12
11,0
10
9,1
8
7,0
6,4
6
4,4
4
3,7
2,8
2,5
2,8
2,1
2
0
2001
2002
2003
2004
2005
2006
2007
2008
2009
2010
2011
2012
Source: Ministry of Economy and Finance - Revenue Agency Note: 2012 data are provisional
Dipartimento del TESORO
55
MEF Ministero dellEconomia e delle Finanze
LIBERALISATION, COMPETITION AND COMPETITIVENESS
Greater consumer protection
Liberalisation of opening hours for retailers.
Higher competition and strengthening of consumer protection in the financial sector. Strengthening of Antitrust Authority. Vigilance powers in water and postal sectors given to Energy and Communication Authorities respectively.
Protection from deceptive and aggressive trade practices extended to businesses with less than 10 employees.
Dipartimento del TESORO
56
MEF Ministero dellEconomia e delle Finanze
LIBERALISATION, COMPETITION AND COMPETITIVENESS
Lighter administrative burden and PA payments
Reduction in the administrative burden for firms: elimination of ex-ante controls, limits, permits, licenses for start-ups. Substantial simplification for SMEs.
Possibility of setting up a limited liability company with reduced capital stock and a simplified framework for people under 35.
Commercial payments by the public administration within 30 days (60 days only in exceptional cases). Interest rate on arrears is 8% over the rate set by ECB for lending operations.
Dipartimento del TESORO
57
MEF
Ministero
dellEconomia
e delle Finanze
LIBERALISATION, COMPETITION AND COMPETITIVENESS
Enhanced competition
Local public services: strengthened role of the Antitrust Authority for local public services.
Gas and electricity sector: gradual delinking of prices from the oil market and unbundling of the gas network.
Transport sector: strengthened competition; liberalisation of fuel and non-oil distribution in petrol stations.
Professional services: abolition of minimum fees, easier access to professions with reduction in compulsory traineeship, increase in the number of pharmacies and notaries.
Dipartimento del TESORO
58
MEF
Ministero
dellEconomia
e delle Finanze
LIBERALISATION, COMPETITION AND COMPETITIVENESS
Reforms by sectors
OECD Product Market Regulation
Indicator - Italy
4,0
2008
2012
3,5
3,0
2,5
2,0
1,5
1,0
0,5
0,0
Market Regulation
Total
Gas
Post
Railways
Telecom
Total
Total
Accountants
Architects
Engeneering
Legal
Product
Utilities
Retail
Professions
PMR
Utilities
Retail
Liberal Professions
Dipartimento del TESORO
59
MEF
Ministero
dellEconomia
e delle Finanze
LIBERALISATION, COMPETITION AND COMPETITIVENESS
Mark-up by sector
Index 2000=100, 3-term moving average
108
Agricolture
Industry excluding construction
106
Construction
Retail sales, hotel, transports and communication
Credit, insurance, real estate and other professional services
104
Education, health and other services
102
100
98
96
94
2000-1
2001-1
2002-1
2003-1
2004-1
2005-1 2006-1 2007-1 2008-1 2009-1 2010-1 2011-1 2012-1
Dipartimento del TESORO
60
MEF
Ministero
dellEconomia
e delle Finanze
LIBERALISATION, COMPETITION AND COMPETITIVENESS
Growth Decree 2.0: the Digital Agenda
Digital Agenda for the development of digital services for citizens especially in sectors of education and health care.
Mandatory transmission of documents in electronic form within the Public Administration (PA) and between the PA and private citizens (also for civil justice).
Enhanced powers of the Agency for Digital Italy to promote major strategic projects. The Agency will prepare the National Plan for Smart cities on an annual basis.
Research projects and innovation linked to strategic issues in line with European Horizon 2020.
Dipartimento del TESORO
61
MEF
Ministero
dellEconomia
e delle Finanze
LIBERALISATION, COMPETITION AND COMPETITIVENESS
Growth Decree 2.0: innovative start-ups
Start-ups must invest at least 30% in R&D, researchers must constitute no less than 1/3 of total employees, or hold a patent to be considered innovative.
Tax deductions for investors (private and institutional) in innovative start-ups.
Start-ups can hire workers with a fixed-term contract for a period between 6 months and 3 years.
Start-ups operating in Italy can use services provided by ICE and Desk Italia free of charge .
Dipartimento del TESORO
62
MEF
Ministero
dellEconomia
e delle Finanze
COHESION PLAN
Cohesion funds: 37% used, 5.5pp above target
60
% Expenditure on initial amount
% Expenditure on CAP1* new amount
50
% Expenditure on CAP2* new amount
% Expenditure on CAP3* new amount
Targets**
40
37
34
%
30
31,5
20
10
0
f m a m j j a s o n d j f m a m j j a s o n d j f m a m j j a s o n d j f m a m j j a s o n d
2009 2010
2011 2012
Implementation is measured as % share of certified expenditure at a certain date by the responsible authorities of programmes for the available financial funds.
The new amount results from the reduction in national co-financing during the three phases of the Cohesion Action Plan (interventions described in http://www.dps.tesoro.it/pac_2012.asp and in http://www.coesioneterritoriale.gov.it/fondi/piano-di-azione-coesione/). ** Targets December 31 fixed by the European Regulation. Targets May 31 and October 31 defined at national level to speed up and improve the effectiveness of measures. QSN Committee, 02/27/2012.
Source: MISE
Dipartimento del TESORO
63
MEF
Ministero
dellEconomia
e delle Finanze
NATIONAL HEALTH SYSTEM (NHS)
Towards more efficient public expenditure
Introduction of 24 hour primary healthcare support units digitally connected with hospitals and other health structures.
Doctors employed in public hospitals can pursue private professional activity only if digitally connected to NHS administrative units. This connection is also used to record payments.
Obsolete drugs will be eliminated from the official NHS list and unnecessary medical examinations reduced.
Dipartimento del TESORO
64
MEF
Ministero
dellEconomia
e delle Finanze
JUDICIAL SYSTEM
Making bankruptcy procedure easier
Bankruptcy procedure: adaptation of existing procedures to a system similar to Chapter 11 in the US. Increasing protection of the entrepreneur under strains (concordato preventivo); payment of creditors due for the entire amount and before other creditors; maturity of credits, covered with collateral on assets, can be extended by one year.
Trial length: trials can last no more than 6 years, of which 3 in the first stage, 2 in Appeal Court and 1 in Supreme Court. Every additional year triggers a compensation between €500 and €1,500.
Dipartimento del TESORO
65
MEF
Ministero
dellEconomia
e delle Finanze
JUDICIAL SYSTEM
Reform of Civil Justice
Reorganisation of judicial districts to close small courts and reduce public expenditure.
Introduction of sanctions for non-acceptable appeals to reduce the backlog of cases brought to court.
Administrative communications by certified electronic mailing to speed up procedures.
Digitalisation of civil justice proceedings.
Dipartimento del TESORO
66
MEF
Ministero
dellEconomia
e delle Finanze
LABOUR MARKET REFORM
A more dynamic and inclusive labour market
More (regulated) flexibility on the hiring side, discouraging the abuse of temporary contracts and making open-ended work contracts more appealing to companies.
More flexibility on the firing side, facilitating more efficient allocation of workers among sectors.
More comprehensive unemployment benefits (ASPI).
More efficient active labour market policies improving services and incentives to work.
Dipartimento del TESORO
67
MEF
Ministero
dellEconomia
e delle Finanze
LABOUR MARKET REFORM
Access to the labour market: apprenticeships
Apprenticeship becomes the preferential channel for young people (up to 29 years old) to enter the labour market.
Employers benefit from fiscal incentives for a 3-year period. In order to hire new apprentices, at least 30% of apprenticeship contracts signed over the previous 3 years must have been transformed into open-ended ones.
Dipartimento del TESORO
68
MEF
Ministero
dellEconomia
e delle Finanze
LABOUR MARKET REFORM
A brand new safety net: ASPI
Eligibility: all workers with ³ 2-year social security contributions and 52 working weeks over the past 2 years.
Duration (effective Jan 2016): 12 months for workers younger than 55 and 18 months for those ³ 55.
Amount: replacement rate is 75% of gross earnings up to €1,180 (annually increased with CPI) +25% on the remaining income up to a cap; 15% reduction after six and twelve months.
Funding: ASPI is partly funded by the State budget and partly through increased contributions paid by employers for non-regular contracts, which can be reimbursed in case of conversion of fixed-term contracts into regular ones.
Dipartimento del TESORO
69
MEF
Ministero
dellEconomia
e delle Finanze
LABOUR MARKET REFORM
Employment protection legislation: big revision
In case of discriminatory dismissals: no change in terms for reintegration of the employee.
For unfair disciplinary dismissals: it is now up to the judge to choose between reintegration (for the most serious cases) or indemnity (from 12 up to 24 months of full salary).
For unfair dismissals for economic reasons, the judge can grant an indemnity (between 12 and 24 monthly payments) or reintegration of the employee in case no fair reasons for dismissal are recognised.
Dipartimento del TESORO
70
MEF
Ministero
dellEconomia
e delle Finanze
LABOUR MARKET REFORM
National agreement to help boost labour productivity
Shared agreement among Italian trade unions and employers associations to help boost labour productivity by providing for labour contracts that better reflect the needs of individual companies.
A special fund is designed to cover the reduction in taxes on productivity-linked wage increases set at local level.
A pact between generations is introduced, allowing for senior workers to stay at work longer by smoothing the retirement transition and increasing the employment of young workers.
Dipartimento del TESORO
71
MEF
Ministero
dellEconomia
e delle Finanze
LABOUR AND PRODUCT MARKET REFORMS
1998-2012 progress: Italy outperforms other EU countries
EPL
3.5
3.0
2.5
2.0
1.5
1.0
0.5
0.5 1.0 1.5 2.0 2.5 3.0
Spain 2007 Spain 2003 Italy 1998 Spain 1998
France 2007 France 2003 France 1998
Germany 2007 Germany 2003 Germany 1998
Italy 2012 Italy 2007 Italy 2003
UK 2007 UK 2003 UK 1998
EPL PMR
Main European countries
Source: OECD and MEF
Dipartimento del TESORO
72
MEF
Ministero
dellEconomia
e delle Finanze
The current presentation as well as a note on reforms are updated regularly. You can find them at:
http://www.dt.mef.gov.it/en/analisi_programmazione_ economico_finanziaria/strategia_crescita/
Dipartimento del TESORO
73
MEF
Ministero
dellEconomia
e delle Finanze
Exhibit 4
Report to Parliament
2013
(pursuant to Art.10bis paragraph 6 of Law No.196/2009)
Submitted by the Prime Minister
Mario Monti
and
by Minister of the Economy and Finance
Vittorio Grilli
To the Cabinet on March 21, 2013
RELAZIONE AL PARLAMENTO 2013
SUMMARY
The purpose of this Government report is to inform Parliament of the updated macroeconomic growth outlook and the performance of public accounts in 2013-2014. The 2013 Economic and Financial Document, to be submitted to Parliament by April 10, will address these issues in greater detail and will provide projections over the entire legislature.
Vigorous efforts have been made over the past two-years to rebalance public accounts in order to achieve a balanced budget. In 2012 Italy achieved a substantial structural improvement in its public accounts and further budget consolidation is expected in 2013. Moreover, in 2012 general government net borrowing as a percentage of GDP (not adjusted for the cycle) was broadly in line with the Commissions recommendations.
However, the current economic situation, where significant weakness remains evident, requires combining fiscal consolidation and financial stability with further measures to support and stimulate growth and employment.
To this end, the Government intends to go ahead with an urgent package of measures that can inject liquidity into the economy by speeding up payments in arrears owed by general government bodies to their suppliers. They amount to about 20 billion euros in the second half of 2013 and an additional 20 billion euros in 2014.
It is a one-off package, agreed upon with the European authorities, whose purpose is not to fund new expenditure, but to remove hitches preventing payment flows from general government bodies to the private sector.
General government bodies which will receive central government transfers to allow them to pay suppliers will be called on to adopt credible spending-cut plans that can ensure debt repayment over a given time period. This will probably result in future expenditure being rescheduled.
This initiative is in line with fiscal requirements set at EU level. Moreover, in the future, a faster and more solid economic recovery will favourably contribute to the sustainability of Italys public finances.
THE MACROECONOMIC SCENARIO
In 2012 GDP declined by 2.4 per cent, in line with forecasts published in the Update of the 2012 Economic and Financial Document. In the final quarter of last year, however, the economy performed worse than expected, with a sudden drop in GDP (- 0.9 per cent over the previous quarter), which led to a one percentage point negative carry-over into 2013. Therefore, forecasts for 2013 had to be revised downwards.
Despite a few initial signs of improvement in the economy, including a recovery of exports and a gradual stabilisation of the financial situation, prospects for the first half of 2013 remain uncertain. A further drop in GDP is expected for the first quarter of 2013. In addition, domestic demand remains very weak, so in the absence of supporting measures any improvement will be slow in emerging.
MINISTERO DELLECONOMIA E DELLE FINANZE | 2 |
RELAZIONE AL PARLAMENTO 2013
An immediate injection of liquidity into the economy, achieved by speeding up the payment of general government payables in arrears, could boost demand as early as in the second half of this year.
TABLE 1: MACROECONOMIC SCENARIO
2011 | 2012 | 2013 | 2014 | |||||||||||||
INTERNATIONAL EXOGENOUS VARIABLES |
||||||||||||||||
International trade |
6,0 | 2,8 | 3,6 | 5,5 | ||||||||||||
Oil price (Brent FOB dollars/barrel) |
111,3 | 111,6 | 113,5 | 106,4 | ||||||||||||
Dollar/euro exchange rate |
1,392 | 1,286 | 1,350 | 1,350 | ||||||||||||
|
|
|
|
|
|
|
|
|||||||||
ITALIAN MACRO VARIABLES (VOLUMES) |
||||||||||||||||
GDP |
0,4 | -2,4 | -1,3 | 1,3 | ||||||||||||
Imports |
0,5 | -7,7 | -0,3 | 4,7 | ||||||||||||
Final national consumption |
-0,2 | -3,9 | -1,7 | 0,9 | ||||||||||||
- Expenditure of resident households |
0,1 | -4,3 | -1,7 | 1,4 | ||||||||||||
- General government expenditure and NPISH |
-1,2 | -2,9 | -1,7 | -0,4 | ||||||||||||
Gross fixed investment |
-1,8 | -8,0 | -2,6 | 4,1 | ||||||||||||
- Machinery and equipment |
-1,0 | -9,9 | -3,0 | 5,1 | ||||||||||||
- Construction |
-2,6 | -6,2 | -2,2 | 3,1 | ||||||||||||
Exports |
5,9 | 2,3 | 2,2 | 3,3 | ||||||||||||
memo item: current account balance in % of GDP |
-3,1 | -0,6 | 0,1 | -0,2 | ||||||||||||
|
|
|
|
|
|
|
|
|||||||||
CONTRIBUTION TO GDP GROWTH (*) |
||||||||||||||||
Net exports |
1,4 | 3,0 | 0,7 | -0,2 | ||||||||||||
Inventories |
-0,5 | -0,6 | -0,1 | 0,1 | ||||||||||||
Domestic demand net of stocks |
-0,5 | -4,8 | -1,9 | 1,4 | ||||||||||||
|
|
|
|
|
|
|
|
|||||||||
PRICES |
||||||||||||||||
Imports deflator |
7,6 | 3,1 | 0,7 | 1,7 | ||||||||||||
Exports deflator |
4,1 | 1,9 | 1,2 | 2,1 | ||||||||||||
GDP deflator |
1,3 | 1,6 | 1,8 | 1,9 | ||||||||||||
Nominal GDP |
1,7 | -0,8 | 0,5 | 3,2 | ||||||||||||
Consumption deflator |
2,9 | 2,8 | 2,0 | 2,0 | ||||||||||||
Inflation (planned) |
2,0 | 1,5 | 1,5 | 1,5 | ||||||||||||
HCPI net of imported energy products (**) |
2,6 | 3,0 | 2,0 | 1,8 | ||||||||||||
|
|
|
|
|
|
|
|
|||||||||
LABOUR MARKET |
||||||||||||||||
Labour cost |
1,3 | 1,0 | 1,0 | 1,2 | ||||||||||||
Productivity (measured on GDP) |
0,2 | -1,3 | -1,0 | 0,7 | ||||||||||||
ULC (measured on GDP) |
1,0 | 2,3 | 2,0 | 0,5 | ||||||||||||
Employment (FTE) |
0,1 | -1,1 | -0,3 | 0,6 | ||||||||||||
Unemployment rate |
8,4 | 10,7 | 11,6 | 11,8 | ||||||||||||
15-64 Employment rate |
56,9 | 56,7 | 56,5 | 56,8 | ||||||||||||
|
|
|
|
|
|
|
|
|||||||||
Memo item: nominal GDP (values in millions of euros) |
1.578.497 | 1.565.916 | 1.573.233 | 1.624.012 | ||||||||||||
|
|
|
|
|
|
|
|
(*) | Possible inaccuracies are due to rounding. |
(**) | Source: ISTAT. |
In assessing the impact of this package of measures on the real economy, it has been taken into due consideration that a part of the payments to firms will immediately flow to banks, as a share of the payables portfolio has already been sold to them (pro solvendo or pro soluto). Though this dampens the direct impact the package may have on the economy, it helps to reduce tensions within the banking system, thereby benefiting the economy, albeit indirectly; a drop in interest rates to clients is expected as well as an easing of tensions on credit supply. The part of the liquidity injection which will go directly to firms will be used to step up investment plans or to improve working capital management (including, for example, payment of arrears to staff). In addition, the measure will help reduce the risk of closure for firms, a phenomenon that has grown worse in the last few months. As a result, a clear improvement in the performance of domestic demand and employment is expected with the adoption of such a package, as compared to the current situation.
3 | MINISTERO DELLECONOMIA E DELLE FINANZE |
RELAZIONE AL PARLAMENTO 2013
The GDP growth profile is expected to show some stabilisation in the second quarter before growing again in the second half of the year. However, due to the negative carry-over from 2012 and the expected contraction in the first half of the year, annual GDP growth will likely remain negative at -1.3 per cent. By contrast, in 2014 GDP growth is expected to exceed 1 per cent, substantially above the growth rate that would have been projected without the adoption of the above-mentioned measures.
PUBLIC FINANCE SCENARIO
New public finance estimates for 2013-2014, based on the new macroeconomic scenario, show general government net borrowing worsening by 0.6 and 0.3 per cent of GDP in 2013 and 2014, respectively.
These differences are mainly due to:
a) | tax revenues declining by 15,700 million euros in 2013, or 1.0 percentage point of GDP, half of which is due to the carry-over effect of lower revenues recorded in 2012 and by 10,000 million euros in 2014; |
b) | debt servicing costs declining by about 5,300 million euros in 2013 and 6,500 million euros in 2014, as a result of lower interest rates compared to that forecasted in the Update of the 2012 Economic and Financial Document; |
c) | expenditure net of interest payments declining by about 2,400 million euros in both 2013 and 2014, resulting from the carry-over effect of expenditure savings recorded in 2012, compared to forecasts. |
Table 2 does not consider effects on the net borrowing requirement derived from the speeding up of payables in arrears (with the exception of interest payments).
Planned measures envisage, inter alia, the payment of debt relating to investment expenditure amounting to 0.5 per cent of GDP (highlighted at the bottom of Table 2), and therefore the projected net borrowing for 2013 is projected at 2.9 per cent of GDP, in line with European budgetary requirements. More details will be provided within the Economic and Financial Document.
MINISTERO DELLECONOMIA E DELLE FINANZE | 4 |
RELAZIONE AL PARLAMENTO 2013
TABLE 2: GENERAL GOVERNMENTS ACCOUNTS (in millions and as a percentage of GDP)
End-of-year | Forecasts | % of GDP | ||||||||||||||||||||||||||||||||||
2011 | 2012 | 2013 | 2014 | 2010 | 2011 | 2012 | 2013 | 2014 | ||||||||||||||||||||||||||||
EXPENDITURE |
||||||||||||||||||||||||||||||||||||
Compensation of empoyees |
169.209 | 165.366 | 163.587 | 161.909 | 11,1 | 10,7 | 10,6 | 10,4 | 10,0 | |||||||||||||||||||||||||||
- Gross compensation |
118.632 | 115.607 | 114.364 | 113.191 | 7,8 | 7,5 | 7,4 | 7,3 | 7,0 | |||||||||||||||||||||||||||
Social security contributions employer |
50.577 | 49.759 | 49.223 | 48.718 | 3,3 | 3,2 | 3,2 | 3,1 | 3,0 | |||||||||||||||||||||||||||
Intermediate consumption |
135.879 | 132.279 | 128.561 | 129.609 | 8,7 | 8,6 | 8,4 | 8,2 | 8,0 | |||||||||||||||||||||||||||
Welfare benefits |
304.262 | 311.413 | 319.920 | 329.790 | 19,2 | 19,3 | 19,9 | 20,3 | 20,3 | |||||||||||||||||||||||||||
- retirement benefits |
243.608 | 249.471 | 255.200 | 262.520 | 15,3 | 15,4 | 15,9 | 16,2 | 16,2 | |||||||||||||||||||||||||||
- Other welfare benefits |
60.654 | 61.942 | 64.720 | 67.270 | 3,9 | 3,8 | 4,0 | 4,1 | 4,1 | |||||||||||||||||||||||||||
Contributions to production |
16.461 | 17.600 | 15.483 | 14.797 | 1,1 | 1,0 | 1,1 | 1,0 | 0,9 | |||||||||||||||||||||||||||
Direct and indirect taxation |
18.856 | 18.300 | 18.246 | 18.386 | 1,2 | 1,2 | 1,2 | 1,2 | 1,1 | |||||||||||||||||||||||||||
Trasfers to EU budget (fourth resource) |
12.658 | 12.112 | 13.600 | 14.000 | 0,7 | 0,8 | 0,8 | 0,9 | 0,9 | |||||||||||||||||||||||||||
Other current expenditure |
12.288 | 9.538 | 10.925 | 9.475 | 1,0 | 0,8 | 0,6 | 0,7 | 0,6 | |||||||||||||||||||||||||||
Total current expenditure |
669.613 | 666.608 | 670.322 | 677.966 | 43,1 | 42,4 | 42,6 | 42,6 | 41,7 | |||||||||||||||||||||||||||
(net of interest) |
||||||||||||||||||||||||||||||||||||
interest |
78.351 | 86.717 | 83.892 | 88.984 | 4,6 | 5,0 | 5,5 | 5,3 | 5,5 | |||||||||||||||||||||||||||
Total current expenditure correnti |
747.964 | 753.325 | 754.214 | 766.950 | 47,7 | 47,4 | 48,1 | 47,9 | 47,2 | |||||||||||||||||||||||||||
p.m. health expenditure |
111.593 | 110.842 | 111.108 | 113.029 | 7,3 | 7,1 | 7,1 | 7,1 | 7,0 | |||||||||||||||||||||||||||
Gross fixed investment |
32.317 | 30.409 | 29.757 | 29.806 | 2,2 | 2,0 | 1,9 | 1,9 | 1,8 | |||||||||||||||||||||||||||
Divestments (-) |
1.142 | 1.210 | 1.500 | 1.450 | 0,1 | 0,1 | 0,1 | 0,1 | 0,1 | |||||||||||||||||||||||||||
Contribution to investment |
18.507 | 17.477 | 18.419 | 16.302 | 1,1 | 1,2 | 1,1 | 1,2 | 1,0 | |||||||||||||||||||||||||||
Other capital outlays |
-1.566 | 1.093 | 1.374 | 1.772 | 0,1 | -0,1 | 0,1 | 0,1 | 0,1 | |||||||||||||||||||||||||||
- of which: Frequency auction |
3.827 | 0 | 0,2 | |||||||||||||||||||||||||||||||||
Total capital expenditure |
48.116 | 47.769 | 48.050 | 46.430 | 3,3 | 3,0 | 3,1 | 3,1 | 2,9 | |||||||||||||||||||||||||||
TOTAL EXPENDITURE |
796.080 | 801.094 | 802.264 | 813.380 | 51,1 | 50,4 | 51,2 | 51,0 | 50,1 | |||||||||||||||||||||||||||
(net of interest) |
717.729 | 714.377 | 718.372 | 724.396 | 46,5 | 45,5 | 45,6 | 45,7 | 44,6 | |||||||||||||||||||||||||||
|
|
|
|
|
|
|
|
|
|
|
|
|
|
|
|
|
|
|||||||||||||||||||
REVENUES |
||||||||||||||||||||||||||||||||||||
Tax revenues |
448.222 | 471.482 | 477.317 | 492.967 | 28,6 | 28,4 | 30,1 | 30,3 | 30,4 | |||||||||||||||||||||||||||
- Direct taxation |
226.142 | 237.928 | 236.136 | 243.454 | 14,6 | 14,3 | 15,2 | 15,0 | 15,0 | |||||||||||||||||||||||||||
- Indirect taxation |
222.080 | 233.554 | 241.181 | 249.513 | 14,0 | 14,1 | 14,9 | 15,3 | 15,4 | |||||||||||||||||||||||||||
Social security contribution |
216.963 | 216.669 | 220.420 | 225.251 | 13,7 | 13,7 | 13,8 | 14,0 | 13,9 | |||||||||||||||||||||||||||
- Actual |
212.701 | 212.422 | 216.106 | 220.877 | 13,5 | 13,5 | 13,6 | 13,7 | 13,6 | |||||||||||||||||||||||||||
- Imputed |
4.262 | 4.247 | 4.314 | 4.374 | 0,3 | 0,3 | 0,3 | 0,3 | 0,3 | |||||||||||||||||||||||||||
Other current revenues |
59.761 | 59.155 | 60.533 | 61.738 | 3,8 | 3,8 | 3,8 | 3,8 | 3,8 | |||||||||||||||||||||||||||
Total current revenues |
724.946 | 747.306 | 758.270 | 779.956 | 46,1 | 45,9 | 47,7 | 48,2 | 48,0 | |||||||||||||||||||||||||||
Capital account taxes |
6.981 | 1.375 | 824 | 932 | 0,2 | 0,4 | 0,1 | 0,1 | 0,1 | |||||||||||||||||||||||||||
Other capital taxes |
4.353 | 4.967 | 4.829 | 4.096 | 0,2 | 0,3 | 0,3 | 0,3 | 0,3 | |||||||||||||||||||||||||||
TOTAL REVENUES |
736.280 | 753.648 | 763.923 | 784.984 | 46,6 | 46,6 | 48,1 | 48,6 | 48,3 | |||||||||||||||||||||||||||
Tax burden |
42,6 | 44,0 | 44,4 | 44,3 | ||||||||||||||||||||||||||||||||
|
|
|
|
|
|
|
|
|
|
|
|
|
|
|
|
|
|
|||||||||||||||||||
Current balance |
-23.018 | -6.019 | 4.056 | 13.006 | ||||||||||||||||||||||||||||||||
as % of GDP |
-1,5 | -0,4 | 0,3 | 0,8 | ||||||||||||||||||||||||||||||||
Primary balance |
18.551 | 39.271 | 45.551 | 60.588 | ||||||||||||||||||||||||||||||||
as % of GDP |
1,2 | 2,5 | 2,9 | 3,7 | ||||||||||||||||||||||||||||||||
Net borrowing |
-59.800 | -47.446 | -38.341 | -28.396 | ||||||||||||||||||||||||||||||||
As % of GDP |
-3,8 | -3,0 | -2,4 | -1,7 | ||||||||||||||||||||||||||||||||
Increase in capital expenditure due to payments of arrears to suppliers and part of EU national cofinancing |
7,850 | 0 | 0.5 | 0.0 | ||||||||||||||||||||||||||||||||
|
|
|
|
|
|
|
|
|
|
|
|
|
|
|
|
|
|
|||||||||||||||||||
PIL ( x 1.000 ) |
1.578,5 | 1.565,9 | 1.573,2 | 1.624,0 | ||||||||||||||||||||||||||||||||
|
|
|
|
|
|
|
|
|
|
|
|
|
|
|
|
|
|
5 | MINISTERO DELLECONOMIA E DELLE FINANZE |
RELAZIONE AL PARLAMENTO 2013
MEASURES TO SPEED UP PAYMENT OF ARREARS TO SUPPLIERS
The package of measures that are to be adopted is aimed at injecting liquidity into the economy by accelerating the payment of general governments payables to private firms and individuals. The entities involved are: central government agencies, local authorities and National Health Service entities. Payments will be made according to different arrangements depending on the type of payables and sectors involved.
More specifically, the measures to accelerate payments will relate to:
| local authorities (Regional and local authorities), through: |
| an easing of constraints of the internal stability pact so as to unlock access to any available operating surpluses; |
| the exclusion from the stability pact of the Regions of payments made to local authorities on expenditure arrears offset by revenue arrears of municipal and provincial authorities; |
| setting up revolving funds to provide liquidity to local authorities (Regional as well as other local authorities) with the requirement that sums be repaid over a fixed (as well as certain and sustainable) period of time; |
| waiver of spending in 2013 related to national co-financing of EU structural funds; |
| health sector debts, through cash advances to pay debts relating to transactions already recorded in previous accounting periods for the purpose of calculating net borrowing. These will subsequently be repaid on the basis of financially sustainable spending reduction plans. |
| past tax refunds owed by the Government, through the use of Treasury cash on hand. |
IMPACT ON THE GOVERNMENT BUDGET
The package of measures aimed at accelerating the payment of general governments payables to private firms and individuals produces a variety of effects depending on the type of payables and the sectors involved. More specifically, the estimated effects on the Government budget result in a worsening of the net balance to be financed, on top of the impact of the new year-on-year scenario. The impact in terms of net balance to be financed may be prudentially estimated at 25 billion euros yearly, in both 2013 and 2014.
These effects on the Government budget result, in particular, from the setting up of revolving funds to provide the liquidity needed by local authorities and the health sector to pay off their debts.
MINISTERO DELLECONOMIA E DELLE FINANZE | 6 |
FF!RK841QWC26`ONL;@AK;;A
M@>XT(((^-4,O`&2XE5V24+MN+$$7O8@^W4$6-)GM\K7XS+2*KE3C339[4YED
MSWGR/XHQ8[-M_E)YR1I=F:VH+>DD98R5[ALL(%Z&97,$Q[FLDL5%33XF0^5D
M"3CIXWQY+6QIGMM<:@68-OUOM:,JU[:K22>%8(BF7$ZS)_7C6]U/4W4C;I\R
MN"MK]15#S02H
%?I=[K$55'*-^
M?=/I9V3\UZ4Y\SEO2`(0?XG_`"KHH[]Z+O2VO=3HHKBZ'1Y_)5$S0:F[JL[1
M5PT+.N+NPBUE;$8YR,:Z1-F%#'%YD6A^&
M/PSS_P`;LVF@T@X%_P`PZ.$%-'?,&T\;/QWJ*0N9SA2HKTB@D,19$KT)+*Q%
M]!M8U$'ZH_5$W.3^C!=.,0^5>['IO;V^`[#VWIKP7!1<5%ZDMFSF'F;P_=7V
M>)[T]74C5#4Z**G114Z**G112=\V_,+'\8[N/PMGX#M#S/=1ZY:2JNI8,MB*
M];B-*DPK/4;*T>*)$K(X8CR$'&:>27L@F-]QR=J;BOTSDY^(>4F.SBT)W%1O
MD.T@$(@U)-[`FP'4Z4DS^;@Q,@8$8W9[`6!.U!?H68Z`:=KGL-:370
4Y.(>Z7N]\4;?09%_ZX=E;@XV['<*Q$L&26=TN,O\R66EH "D#EKB@E2CV#
M5.O?J3H!YAKWT7$;A+7L]:<59O\`>O9M_)O1?OM*:D(;E7JQV[$H[?MHB.OK
MR2XQ[
M`>A96[,LW,QG/)[9?(?+(XKAY5+Y(3J6^"I"$01IVA8U];TE)_!7ICXP7U*X
MW[-[GAXG#0.9^5=7;XQ898#2N=:D+/LRB3S.QVM(;:=.Q,UWE3Z=*B[CU+]D
M700/.K9LOQB<%=9/A^H!KXPO2L]UEL;*V`Z"-CL+FQ)D.]SQ&<6DK<*G/#0G4Z:"LM=H8UMK9PN:*5##Y:+YY?B0W3
M<[IWWD\I(ZL0YV#4]%1T_,JOJN2L1AP6M%RE$2B)1$HB41*(E$2B)1$HB41*
M(E$2B)1$HB41*(E$2B)1$HB41*(E$2B)1$HB41*(E$2B)1$HB41*(E$2B)1$
MHB41*(E$2B)1$HB41*(E$2B)1%\K^8Y^[7^J:ZN]D^(KLSVV_6'I53&.@?R]
M9N`_[LA=W_4MU22NB>*[;4CL)HBT)U[>/IHBZB4KE!U[-'/Q412]OSH\-6G#
MZ(GAV$Z\3Y>ZB*G?,G4E#I_O+'P );=XGC,5"=+/C=ELP7
MX+<=2G/"CPE+6PT`TVZEI"N;0<=#K6YGN\Q(Q^S[>TT#XR`=.-&K>=L2PCQ>
MT[6SKK';MB)X5(`-?-XU3]UW;CQMI^D3J9W`=D1XZ,=VHRJ.RY,>>BQU/W"T
M28L5/CQ_IV'5RI"$-E.AYE=M5!FG@8:X=]!E?'XE>GN7P;\[WB8_#QD=H^ZB
M<#0D`-=4Z>)>8=;G5/3G)#Q*EH@\Q\12G%\\EUQ]U;CBM5.*_P`L-%'B1VUA
MSDY.>[DD/`N7TS[99';6UM*P59'#%'0=!#>/B-%?@]PQC'VGO/NQD+K*_!M]
MCQRSM.AMM:2JYW&5>.*U'G;4E-IU!3P*5$&KJ=UMH??^U)&IKY@M>O\`,=S#
MCMZTQ<9/,]XUZ/:*S7MB&]+^TX2HJ7:I*M">SF2P=#YQ60JAKQ!6*3[P+I:N>Q6Y]RR^Q0K
M[,VXSN>N[/9+
V/RXJ(!0AJVLW,RF64E"5I;:TTK#_`'Q9.Q>6+)!0N?T>
M)?0+\)N^!O/8N.-P\NFAB$;JFOKM\9)I0<5;>@A^WY'%G0TEUV"84^."IQ*/
M'9<0\VMU3*VGD.)4"I)2H%/`]M2['RLBGAN#6@=\O0LG=Q8F/+V-]``.S=;2
M-H>OE/C7H^=-.=1MP=G]KS;[LR+1S1Z]-*A[^E90FSJO^W6DG@5
M6^6YIYE>$H'T%)UJYL=:'FXU*UW<)'M=Q+B1XCTJIM?S3\'RBO1=ELT1*(FH
M':=*(MMWYH_2!^(\:(N!(7H4<1H2!KKW\?BX4103=W"$D`Z_.[./;^#NHBDQ
MDCXT(YAJ$Z=H[2LZ=E$5'6\.4-XMB>69%(=:98L..7V[NN/2!$:0BVVV7-)=
ME?\`U=)+&G,.()%2VZF%O:7#W<*GT*O>[>PER^[K&Q8"3[PT>=>>UDEP=OMS
ME7EU2EN9)D64Y6[S/KE*#LR
;\?;Q'&J15T3Q7!?93R@>4_Z=]$75RFPELD?FJ^0T10?<&]
M4+/E2C]50_%0+LTT/R*5&0L#UA_=W5T>TN%%+[<=E?ND/`M(\X5/F3L@*4
MKL4TL.A/'11:*E\IU]%=0SDC?6FH'I47>>M;./B]*Q^?>@8TJT;A;:9>E#X1
M<+5<+.^Z6FD1BY9[DS>$`OH^G>>3`6XOCP2VGE[ZP=^*#"FUR<&1'LGYN4_.
MM;'Q=XJ6WSV/R=/4:YVO^8LBCH_R9&7]+6Q>2(<9<<3A=MMC_@/.O-H?M#ZH
M;C:G71XBG4F..<]@5J!P`K*;NPRC+_NVQ@8:ED8!6:W]AW1;Y78\1KJ!BY&@S&&X7AQ,EDVZ\L.AJ-ZC,5SVP\A'K%`
MU/&K'Y2U=9]X$SW<'25\J^EGN0F9N7X8[3LR#)#8N80.L-K\ZSM.BF8W.A8W
M*;<0I"[+>H[0:)+?@0Y:66%`GB260D\?+636'<#:,IU+1_WE0N@W/?1'HNG^
MDJXNOYI^#Y14W5NELT1*(E$7!D?,<_2_%1%!-T7R-.COU!^`^:B*3^12`EM9
M/8.?]7NHNC?M533F4ILH==*N5MII6B@="E:D@E0[M4)1J1Y!7G=N++-[AQHI
MCA;7[PST5H=6]O'7Y0%@)=7F=#<#J$WYS%)0XQD.[60QH"VYCD]A5KQ^1]GL
M&!)=/.8:F8GJM=C?8*Q([P9#+E:'7UU]-OPZXF/;?PW1B-O+(6L-*4)^3J5"
MUC*Y$>]7)*EE=PEN1T)4>),J5RMAOR*#+9T\U4Q+0,`\"JK9#CVE]?O]HL)'
MRJKSH[8".KOI12V2E#?4EL='T/>$;BXZ]H?*0VD`U,]G?\S8[_?X/[UJ]>_-
M@M/AHWH1^?M3+?Z5A/\`E7I7/_MWOWKGZYK/\\3XU\?\?V;?JCT+:KA=THB4
M1*(E$2B)1$HB41*(E$2B)1$HB41*(E$2B)1$HB41*(E$2B)1$HB41*(E$2B)
M1$HB41*(E$2B)1$HB41*(E$2B)1$HB41*(E$2B)1$HB41*(MUC_>(_[]C_:H
MKAWLGQ'T+LSVV_6'I54;O;\*OEJD5=%<1Y&J0KR'Y`3\?&B+KI`U3H>_F_5-
M$4-3V?HR.\`>GNU[J(I6Y`SJM9T_(/Q:CS5WC;S&BAKL=G$)&\>8#RU5/>7Q
M>?VD]@22I6O#5)64*^,*KFY8&VSW"E13TJ)?ZUB2>.BLH^]*QYNX[8X?D2FF
MEN6/-D-*6I+I<3&R"USXQ0A31'('$!(5S<.P5B9\44?O&VS
FK.+0LHYK-N.$N(#3K:D-7&T"*@.%?T2R
M?9^!;X`=M6X^%>X:[:\UKTMG'HK^GA
M4#68+0S.E$I4[(4L-@Z`K"DK2M*=.TJ2NJBNA'V48FU#@K(83GO
A8D^U%X=F[][239/(;A<][\#N3Y1H&5.W;-[?,6IM"0$`*]I=4=
M.S@.ZM2^V^W`7KC5KMQ6?GO(Z+3Y;;@DS'?#AYWFK79VVI\MTRBRPW/
MVCGZ:OUC6]9_MGQE;:'^T?&OBNJZI1$HB41*(E$2B)1$HB41*(E$2B)1$HB4
M1*(E$2B)1$HB41*(E$2B)1$HB41*(E$2B)1$HB41*(E$2B)1$HB41*(E$2B)
M1$HB41*(E$2B)1$HB41;C/[=C]^S_M4UP?9/B/H7:/[1OUAZ54A*6$
'EX4*Z2H+ROG.9`U[>ARL=^]^SEO'^DS/8[:I,>5>U6RSM.-)CJ^BN5X@>)XGB\
MQ\,Q^8$I!*3H=-`:MMOV]+<2YG@*S=^!W;ISO?#CI916&,%Q^3ATCJ6%9*>=
MEW:?)*D%!G,M,
.T+WN^=<[>8+$;6
M[/S_`#BPV-A+<63/>2YD%W8A)?$6(/:)*(Z)!<4E&A(3IJ.VJNL8/>;B*UI6
MC@L>^\#<,6WM@9/.2&DK'R$>(L'@/2O5OVJPBV[:[8[?X!:X\.%9\1Q.PX]'
MAPF%1845NVVJ+#/LD=:E+8C(:;(2@DE(X&LJ[.U[#&P6W2!Z5\[.[,V[-;CO
M<@XU-Q.]U?&311`VX'KO<9"4J/L-N1$1P]4OS%JY^578E80UZ2%5.+G_``UL
M/`%35PTV%N!UU\ZMS>]-W53@^QD/![8MUBXYQ=8=F#D6XLQ)#5IBA$VX+=CE
M"Y,FV/M,^"YX924E8&M8B_%#O1N)VB+&)U)9&4_IHL3OB?WBW%;.;91NI*YE
M#_2BQ=\MDA2FV$J0&VDIC]RN9*D*4IU6FFB>4.*U;VX,SNU?Q=ZQ^75:H;
MYQNYF\WM2"I^751?L-
8Z5HNDL@;\%;SR03<9\FZN.A1XL0T
MH:C@)X^KX)3P[U:TSMVT6P
F@Z>3Q!77CVGTFLD5-`M*+E*(E$2B)1$HB41*(
ME$2B)1$HB41*(E$2B)1$HB41*(E$2B)1$HB41*(E$2B)1$HB41*(E$2B)1$H
MB41*(E$2B)1$HB41*(E$2B)1$HB41*(E$2B+5/SD_I)^45U=[)\17:/[1OUA
MZ5NWN8`'1S$:\PXIYNXC\G6J2Z%=$\5([(Y8;\8N%7J%.A*%:#4G77@3H>RN
M'@F)SAT`J'N7M$3F'B116A_><;I/8?L#<\:B.14W[4!=3)&TT
ZHPT8OTE[01?"+#SN+6R=(`AF%XKEZ=E7I3SB./.X3*Y5+'[0C
M4Z5E3LF/EP<;OZ<`OGH^+O<;