UNITED STATES
SECURITIES AND EXCHANGE COMMISSION
WASHINGTON, D.C. 20549
FORM
CURRENT REPORT PURSUANT TO SECTION 13 OR 15 (d)
OF THE SECURITIES EXCHANGE ACT OF 1934
Date of Report:
(Date of earliest event reported)
(Exact name of registrant as specified in its charter)
(State of Incorporation) | (Commission File Number) | (IRS employer Identification No.) |
(Address of principal executive offices) | (Zip Code) |
(Registrant’s telephone number)
Check the appropriate box below if the Form 8-K filing is intended to simultaneously satisfy the filing obligation of the registrant under any of the following provisions:
Securities registered pursuant to Section 12(b) of the Act:
Title of each class |
| Trading symbol(s) |
| Name of each exchange |
Indicate by check mark whether the registrant is an emerging growth company as defined in Rule 405 of the Securities Act of 1933 (§230.405 of this chapter) or Rule 12b-2 of the Securities Exchange Act of 1934 (§240.12b-2 of this chapter).
Emerging growth company
If an emerging growth company, indicate by check mark if the registrant has elected not to use the extended transition period for complying with any new or revised financial accounting standards provided pursuant to Section 13(a) of the Exchange Act. ☐
Item 7.01. Regulation FD Disclosure.
Exhibit 99.1 of this Form 8-K contains the prepared remarks for IBM’s Chairman and Chief Executive Officer Arvind Krishna and Chief Financial Officer Jim Kavanaugh’s fourth-quarter and full-year 2022 earnings presentation to investors on January 25, 2023.
The slides for IBM’s Chairman and Chief Executive Officer Arvind Krishna and Chief Financial Officer Jim Kavanaugh’s fourth-quarter and full-year 2022 earnings presentation on January 25, 2023, are Exhibit 99.2 to this Form 8-K.
Reconciliations of non-GAAP financial measures discussed in the earnings presentation to the most directly comparable financial measures calculated and presented in accordance with GAAP are included in Exhibit 99.2 of this Form 8-K.
The information in this Item 7.01, including the corresponding Exhibits 99.1 and 99.2, is being furnished with the Commission and shall not be deemed “filed” for purposes of Section 18 of the Securities Exchange Act of 1934.
Item 9.01. Financial Statements and Exhibits.
(d) Exhibits
The following exhibits are being furnished as part of this report:
Exhibit No. | Description of Exhibit | |
99.1 99.2 | Prepared Remarks of Earnings Presentation on January 25, 2023 Earnings Presentation of the Registrant, dated January 25, 2023 | |
The following exhibit is being filed as part of this report:
Exhibit No. | Description of Exhibit | |
104 | Cover Page Interactive Data File (embedded within the Inline XBRL Document) | |
IBM’s web site (www.ibm.com) contains a significant amount of information about IBM, including financial and other information for investors (www.ibm.com/investor/). IBM encourages investors to visit its various web sites from time to time, as information is updated and new information is posted.
2
SIGNATURE
Pursuant to the requirements of the Securities Exchange Act of 1934, the registrant has duly caused this report to be signed on its behalf by the undersigned, hereunto duly authorized.
Date: January 26, 2023 | ||
By: | /s/ Robert F. Del Bene | |
Robert F. Del Bene | ||
Vice President and Controller |
3
Exhibit 99.1
IBM 4Q22 Earnings Prepared Remarks
Introduction
Thank you. This is Patricia Murphy, and I’d like to welcome you to IBM’s fourth quarter 2022 earnings presentation. I’m here today with Arvind Krishna, IBM’s Chairman and Chief Executive Officer, and Jim Kavanaugh, IBM’s Senior Vice President and Chief Financial Officer. We’ll post today’s prepared remarks on the IBM investor website within a couple of hours, and a replay will be available by this time tomorrow.
To provide additional information to our investors, our presentation includes certain non-GAAP measures. For example, all of our references to revenue growth are at constant currency. We have provided reconciliation charts for these and other non-GAAP measures at the end of the presentation, which is posted to our investor website.
Finally, some comments made in this presentation may be considered forward looking under the Private Securities Litigation Reform Act of 1995. These statements involve factors that could cause our actual results to differ materially. Additional information about these factors is included in the company’s SEC filings.
So with that, I’ll turn the call over to Arvind.
CEO Perspective
Thank you for joining us. Our fourth quarter and full year results demonstrate the execution of our hybrid cloud and AI strategy. We delivered strong revenue growth in our business. The growth was broad-based across our Software, Consulting and Infrastructure segments, as well as across geographies.
Our clients recognize that technology continues to be a fundamental source of competitive advantage. Over the last several quarters it has become clear that technology is playing a significant role in boosting productivity in the face of inflation, demographic shifts, supply chain challenges and sustainability requirements.
We entered 2022 a more focused company and took steps to reinforce our position. We strengthened our consulting expertise and expanded strategic partnerships. To bolster our software portfolio, we invested in hybrid cloud and AI capabilities. We also delivered significant innovations in infrastructure with our z16 and Power platforms. All of this was brought to market with a more technical and experiential sales approach.
Looking back on the year, we are pleased with the progress we made. We delivered revenue growth above our mid-single digit model, and we delivered solid free cash flow. But I’ll acknowledge there is more to do. This year, we’ll unlock more productivity, expand our strategic partnerships and put more investment in specific growth markets. For 2023, we see revenue growth in line with our mid-single digit model range, and about ten-and-a-half billion dollars of free cash flow. This keeps us on a path of sustainable growth.
Hybrid Cloud and AI Progress
I will now provide some color on the progress we are making in the execution of our strategy. Our perspective is clear - hybrid cloud and AI are the two most transformative technologies for businesses today. These technologies work together to drive business outcomes.
Hybrid cloud is where the world is going. Containers are the preferred destination for applications. Hybrid cloud offers more value than relying on a singular public cloud. It enables organizations to drive business value across multiple clouds, on premise or at the edge. This includes scale, security, ease of use, flexibility of deployment, seamless experiences and faster innovation cycles.
Our platform, built on Red Hat, is the leading container platform, allowing clients to harness the power of open-source software innovations. IBM software and infrastructure technologies have been optimized for this platform. Our consultants and others leverage their extensive technical and business expertise to accelerate clients’ digital transformation journeys.
Clients are realizing real value from working with IBM’s hybrid cloud platform approach. For example, we worked with the Canadian Imperial Bank of Commerce, CIBC, to adopt a hybrid cloud approach. Using Red Hat technology, CIBC manages and scales its infrastructure with greater speed and flexibility. They can now develop applications in a private cloud and quickly deploy them to a public cloud. They delivered hundreds of new applications and reduced provisioning time by 95 percent and deployment time by 50 percent. We are helping Delta Airlines leverage hybrid cloud to modernize applications, automate operations and integrate security. IBM Consulting deployed Red Hat on Amazon Web
Services and IBM Cloud Paks to provide a consistent platform. Delta now has more levers it can use to boost developer productivity, reduce time-to-market and improve employee satisfaction. CIBC and Delta are both great examples of the value hybrid cloud can provide.
Let’s now talk about artificial intelligence, or AI. AI is projected to contribute $16 trillion to the global economy by 2030, including a massive boost in productivity by infusing AI into every enterprise process. We have been co-creating with many clients to deploy AI at scale. We automated the drive-thru experience for quick-serve restaurants. We accelerated the rollout of COVID-19 vaccines by automating the processes that assist millions of customers with inquiries and appointments. By applying AI and automation we have helped security analysts reduce the time to respond to threats from hours or days, to minutes. Recently, the U.S Patent and Trademark Office partnered with IBM to leverage a host of AI capabilities that make it easier for people to glean insights from their vast database of patents. The BBC is now using our AIOps software to automate the management of its IT infrastructure.
For businesses, deploying AI can be challenging because it takes time to train each model. But by using large language models, companies can now create multiple models using the same data set. This means businesses can deploy AI with a fraction of the time and resources. That is why we are investing in large language or foundation models for our clients and have infused these capabilities across our AI portfolio.
Our partner ecosystem plays a critical role in the execution of our strategy. In the fourth quarter, we made a series of new IBM Software offerings available as-a-Service in the AWS marketplace. Likewise, Red Hat continued the expansion of its offerings in hyperscaler marketplaces, making Ansible Automation Platform available on both Azure and AWS.
Adobe and Salesforce are also leveraging open-source innovation based on Red Hat technologies in their offerings. Business with our strategic partners continues to grow, with SAP, Microsoft and AWS all over a billion dollars in revenue for the year. We’ve had great success with our strategic partners, and as we enter the new year, we are expanding and better enabling our broader ecosystem. We recently launched PartnerPlus, a new simplified program that increases our reach and scale through new and existing IBM partners.
We remain focused on delivering new innovations that matter to our clients. In the fourth quarter, we introduced Red Hat Device Edge, a lightweight solution to flexibly deploy traditional or containerized workloads on small devices such as robots, IoT gateways, points of sale and public transport. We also formed a collaboration with the Japanese consortium Rapidus to leverage the depth of our intellectual property on advanced semiconductors. We unveiled Osprey, a 433-qubit quantum processor that brings us closer to delivering our goal of building a 1,000-qubit system later this year. At the same time, we continue to acquire companies to complement our organic innovation. In the fourth quarter we acquired Octo, which improves our footprint in the US Federal market. This caps a year with eight acquisitions across Software and Consulting.
As sustainability becomes more of a priority, companies need digital technologies to analyze data, creating a baseline and improve the way they operate. Our software has helped IBM reduce its own carbon footprint. Across IBM’s global real estate presence, we were able to reduce carbon emissions by over 61 percent when compared to 2010. Using IBM Sustainability Software, we have simplified and automated our sustainability reporting processes and reduced reporting costs by 30 percent.
Let me wrap by saying I am pleased with the progress we have made with our portfolio, our go-to-market and our ecosystem. I’m confident in our ability to leverage hybrid cloud and AI to help clients turn business challenges into opportunities. Our strategy continues to strongly resonate with clients and partners, and this gives us a solid foundation to build upon in this year. While there is more to be done, we enter the new year as a more capable and nimble company, well-equipped to meet our clients’ needs.
I will now turn it over to Jim, who will give you more detailed information on our performance and expectations.
Financial Highlights
Thanks Arvind. I’ll start with the financial highlights of the fourth quarter. We delivered $16.7 billion in revenue, $3.8 billion of operating pre-tax income and operating earnings per share of $3.60. In our seasonally strongest quarter, we generated $5.2 billion of free cash flow.
Our revenue for the quarter was up over six percent at constant currency. While the dollar weakened a bit from 90 days ago, it still impacted our reported revenue by over $1 billion – and 6.3 points of growth. As always, I’ll focus my comments on constant currency. And I’ll remind you that we wrapped on the separation of Kyndryl at the beginning of November. The one-month contribution to our fourth quarter revenue growth was offset by the impact of our divested health business.
Revenue growth this quarter was again broad based. Software revenue was up eight percent and Consulting up nine percent. These are our growth vectors and represent over 70 percent of our revenue. Infrastructure was up seven percent. Within each of these segments, our growth was pervasive. We also had good growth across our geographies, with mid-single digit growth or better in Americas, EMEA and Asia Pacific. And for the year, we gained share overall. We had strong transactional growth in software and hardware to close the year. At the same time, our recurring revenue, which provides a solid base of revenue and profit, also grew – led by software. I’ll remind you that on an annual basis, about half of our revenue is recurring.
Over the last year, we’ve seen the results of a more focused hybrid cloud and AI strategy. Our approach to hybrid cloud is platform centric. As we land the platform, we get a multiplier effect across Software, Consulting and Infrastructure. For the year, our hybrid cloud revenue was over $22
billion – up 17 percent from 2021.
Looking at our profit metrics for the quarter, we expanded operating pre-tax margin by 170 basis points. This reflects a strong portfolio mix and improving Software and Consulting margins. These same dynamics drove a 60-basis point increase in operating gross margin. Our expense was down year to year, driven by currency dynamics. Within our base expense, the work we’re doing to digitally transform our operations provides flexibility to continue to invest in innovation and in talent. Our operating tax rate was 14 percent, which is flat versus last year. And our operating earnings per share of $3.60 was up over seven percent.
Turning to free cash flow, we generated $5.2 billion in the quarter and $9.3 billion for the year. Our full-year free cash flow is up $2.8 billion from 2021. As we talked about all year, we have a few drivers of our free cash flow growth. First, I’ll remind you 2021’s cash flow results included Kyndryl-related activity – including the impact of spin charges and capex. Second, we had working capital improvements driven by efficiencies in our collections and mainframe cycle dynamics. Despite strong collections, the combination of revenue performance above our model and the timing of the transactions in the quarter led to higher-than-expected working capital at the end of the year. This impacted our free cash flow performance versus expectations. Our year-to-year free cash flow growth also includes a modest tailwind from cash tax payments and lower payments for structural actions, partially offset by increased capex investment for today’s IBM.
In terms of cash uses for the year, we invested $2.3 billion dollars to acquire eight companies across software and consulting, mitigated by over a billion dollars in proceeds from divested businesses, and we returned nearly six billion dollars to shareholders in the form of dividends. From a
balance sheet perspective, we ended the year in a strong liquidity position with cash of $8.8 billion. This is up over a billion dollars year to year. And our debt balance is down nearly a billion dollars.
Our balance sheet remains strong, and I’d say the same for our retirement-related plans. At year end, our worldwide tax-qualified plans are funded at 114 percent, with the U.S. at 125 percent. Both are up year to year. You’ll recall back in September, we took another step to reduce the risk profile of our plans. We transferred a portion of our U.S. qualified defined benefit plan obligations to insurers, without changing the benefits payable to plan participants. This resulted in a significant non-cash charge in our GAAP results in the third quarter, and we’ll see a benefit in our non-operating charges going forward. You can see the benefit of this and other pension assumptions to the 2023 retirement-related costs in our supplemental charts.
Software
Turning to the segments, Software revenue grew eight percent, fueled by growth in both Hybrid Platform & Solutions and Transaction Processing. We concluded the year with seasonally strong transactional performance as well as a solid and growing recurring revenue base in Software.
In Hybrid Platform & Solutions, revenue was up ten percent with pervasive growth across our business areas – Red Hat, Automation, Data & AI and Security. Our platform-based approach to hybrid cloud and AI is resonating with clients. As a proof point, OpenShift, our industry-leading hybrid cloud platform, now has $1 billion in annual recurring revenue. And we’ve modernized and optimized our software capabilities, including through Cloud Paks, across Automation, Data & AI and Security for that platform.
Red Hat revenue grew 15 percent in the quarter led by strength in OpenShift and Ansible, both growing double digits and gaining market share. Automation revenue was up nine percent. Growth was led by Business Automation, Application Servers and Integration as clients look to automate business workflows and improve applications. Data & AI revenue grew eight percent, with enterprise needs to organize, store and manage their data. This performance reflects demand in areas including Data Management, Data Fabric and Asset & Supply Chain Management. Security delivered ten percent revenue growth. We’re helping clients detect, prevent and respond to security incidents – which led to strength across Threat Management, Data Security and Identity. Across these businesses, the Annual Recurring Revenue, or ARR, for Hybrid Platform & Solutions is $13.3 billion. And for all of Software, hybrid cloud revenue is now more than $9.3 billion over the last year, up 16 percent.
In Transaction Processing, revenue was up three percent. Demand for this mission-critical software has followed increases in zSystems installed-base capacity over the last couple of product cycles. And strong renewal rates continued this quarter. Both are evidence of the importance of this platform in a hybrid cloud environment.
Moving to Software profit, our pre-tax margin was up two points this quarter, contributing to a full-year margin of nearly 25 percent.
Consulting
Consulting revenue grew nine percent. Clients are leveraging IBM’s hybrid cloud leadership and deep industry expertise to navigate the complexity of their digital transformation journeys. Revenue growth was broad based across all business lines and geographies. And I’ll remind you that this is on top of the 16 percent growth Consulting delivered in the fourth quarter of 2021.
Strong demand for our offerings led to signings growth of 17 percent. With this, fourth quarter had the best quarterly book-to-bill of the year, and we sequentially improved our trailing-twelve-month book-to-bill ratio to 1.1. Clients are partnering with IBM Consulting as they decide what applications to modernize and how to migrate those applications across hybrid, multi-cloud environments.
Over the last twelve months, Consulting delivered nine billion dollars in hybrid cloud revenue, which is up 23 percent. This quarter, our Red Hat practice was again a meaningful contributor to this growth. Revenue from strategic partnerships also grew at a strong double-digit rate. We continue to see momentum in this space. In aggregate, our strategic partnership bookings were up over 50 percent, with Azure and AWS more than doubling.
Turning to our lines of business, Business Transformation revenue grew seven percent. Growth in Business Transformation was once again driven by data and client experience transformations, along with supply chain and finance optimizations. Our partnerships with key ISV partners like SAP, Salesforce and Adobe enable IBM Consulting to transform critical workloads at scale. In Technology Consulting, where we architect and implement clients’ cloud platforms and strategies, revenue was up ten
percent. Growth was led by cloud application development practices. Red Hat engagements along with our strategic hyperscaler partnerships contributed to the growth. Application Operations revenue grew 12 percent. We help clients to optimize their operations and reduce cost by taking over the management of applications in hybrid and multi-cloud environments. Our incumbency and understanding of clients’ applications are key differentiators.
Moving to Consulting profit, our pre-tax margin was 11 percent for the quarter and nearly nine percent for the year. The fourth quarter margin is up nearly two points year to year and over one point sequentially. We are starting to see the benefit from pricing actions and productivity, and our acquisitions have become more accretive.
Infrastructure
Turning to the Infrastructure segment, revenue grew seven percent driven by Hybrid Infrastructure, which was up 11 percent. Within Hybrid Infrastructure, zSystems revenue grew 21 percent this quarter. Among the new z16 capabilities, clients are leveraging cyber-resiliency to comply with business regulations and proactively avoid outages in their operations. And the new on-chip AI accelerator, for example, has been helping mitigate risk and detect fraud in credit card application processing. Our Distributed Infrastructure revenue was up five percent. This performance was fueled by strength in Power, following the extension of Power10 innovation throughout the product line. Infrastructure Support performance was flat, including the impact from client adoption of new hardware with the latest z16 product cycle.
Moving to Infrastructure profit, pre-tax margin was down less than a point in the quarter, and for the full year our pre-tax margin was nearly 15 percent.
Summary
Now let me bring it back up to the IBM level to wrap up. At our investor briefing fifteen months ago, we laid out our hybrid cloud and AI strategy, and our priorities of revenue growth and free cash flow generation. Since then, we’ve been focused on our portfolio, our go-to-market model, our ecosystem and our capital allocation – to execute that strategy and create value through focus. We’ve now just completed the first year as Today’s IBM.
Our 2022 revenue was up nearly 12 percent, including nearly four points of incremental Kyndryl contribution. That’s above our model of mid-single digit growth. Over 70 percent of our revenue was in our growth vectors of Software and Consulting, and about half of our revenue is recurring. With this high value mix and contribution from the incremental Kyndryl revenue, we expanded our full-year operating pre-tax margin by two-and-a-half points. And our free cash flow was $9.3 billion, up $2.8 billion from the prior year. We invested organically and inorganically, and returned significant value to shareholders through dividends.
Now, there were some external factors that we faced this past year that impacted our profit and cash. We exited a profitable business in Russia, we are dealing with a much stronger dollar, and we are operating in a highly inflationary environment, which put pressure on our margins – especially in Consulting.
Putting it all together, we are pleased with the fundamentals of our business and the progress we have made in executing our strategy. Our 2022 performance demonstrates that we now have a higher-growth, higher-value company with higher return on invested capital and a strong and growing free cash flow.
For 2023, we again expect solid growth in our two most important measures of success – revenue and free cash flow. Arvind talked about the important role technology plays in this environment, and how our solutions are closely aligned to the needs of our clients. With this, we expect constant currency revenue growth for the year to be in line with our mid-single digit model. As we enter this year, I think it’s prudent to expect the low end of the mid-single digit model. And for free cash flow, we’d expect to generate about ten-and-a-half billion dollars in 2023 – which is up over a billion dollars year to year.
Let me spend a minute on our expectations for constant currency revenue and pre-tax profit performance by segment. In Software, with continued momentum in our recurring revenue stream in both Hybrid Platform & Solutions and Transaction Processing, we expect revenue growth in line with Software’s mid-single digit model. This revenue growth generates operating leverage, and we’d expect Software pre-tax margin to expand by about two points year to year. Consulting’s model is to deliver high single-digit revenue. We’re coming off a strong year with revenue growth of 15 percent, as we help clients with their digital transformations. This momentum and strong book-to-bill ratio support Consulting revenue growth at the high end of its model, despite the tough compare. We expect to expand Consulting pre-tax margin by at least a point as we continue to realize more of the price increases and improved utilization. Infrastructure revenue is roughly flat over the mid-term model horizon, with performance in any year reflecting product cycle dynamics. We’re entering the year three quarters into the z16 cycle, and will also wrap on Power10. As a result, we expect 2023 Infrastructure revenue below its model, and pre-tax margin in the low teens. For perspective, Infrastructure should impact IBM’s overall revenue growth by over a point.
With these segment dynamics, we would expect IBM’s operating pre-tax margin to expand by about a half a point – that’s in line with our model. And our tax rate should be in the mid-to-high-teens range.
Let me comment on a few items within our expectations. First, as I said, currency was a significant headwind in 2022, impacting revenue by three-and-a-half billion dollars. With the movement of spot rates over the last 90 days, currency translation would be fairly neutral to revenue in 2023, with a headwind in the first half flipping to a tailwind in the second. But, I’ll remind you that we had over $650 million of hedging gains in 2022 which will not repeat in 2023, resulting in an impact to our profit and cash on a year to year basis.
Second, as you know we have taken a number of significant portfolio actions over the last couple of years, which has resulted in some stranded costs in our business. We expect to address these remaining stranded costs early in the year and anticipate a charge of about $300 million in the first quarter. We would start to see benefits in the second half and pay back by the end of the year.
And then third, we regularly review the useful lives of our assets. Due to advances in technology, we are making an accounting change to extend the useful life of our server and networking equipment, effective the first of January. Based on our year-end asset base, we expect this change to benefit 2023 pre-tax profit by over $200 million, primarily in our Infrastructure segment. Given this is a change to depreciation, there’s no benefit to cash.
Looking at the first quarter, our constant currency revenue growth should be fairly consistent with the full year. Reported growth will also include about a three point currency headwind at current spot rates. With
operating leverage, we’d expect operating pre-tax margin to expand 50 to 100 basis points in the first quarter, and that’s before the charge I just mentioned for the remaining stranded costs. Given the timing of currency and stranded cost dynamics, we’d expect about one-third of our net income in the first half and about two-thirds in the second half.
To sum it all up, we have made a lot of progress this past year. While there is always more work to do, we’re confident in the fundamentals of our business and how we’re positioned as we enter the new year.
Patricia, let’s go to the Q&A.
Closing
Thank you, Jim. Before we begin the Q&A, I’d like to mention a couple of items. First, supplemental information for the quarter and the year is provided at the end of the presentation. And then second, as always, I’d ask you to refrain from multi-part questions.
Operator, let’s please open it up for questions.
IBM 4Q 2022 Earnings January 25, 2023 ibm.com/investor |
Forward - looking statements and non - GAAP information Certain comments made in this presentation may be characterized as forward looking under the Private Securities Litigation Reform Act of 1995. Forward - looking statements are based on the company’s current assumptions regarding future business and financial performance. Those statements by their nature address matters that are uncertain to different degrees. Those statements involve a number of factors that could cause actual results to differ materially. Additional information concerning these factors is contained in the Company’s filings with the SEC. Copies are available from the SEC, from the IBM website, or from IBM Investor Relations. Any forward - looking statement made during this presentation speaks only as of the date on which it is made. The company assumes no obligation to update or revise any forward - looking statements except as required by law; these charts and the associated remarks and comments are integrally related and are intended to be presented and understood together. Unless otherwise specified, results are presented on a continuing operations basis. All references to revenue impacts from sales to Kyndryl are incremental sales post - separation. In an effort to provide additional and useful information regarding the company’s financial results and other financial information as determined by generally accepted accounting principles (GAAP), the company also discusses, in its earnings press release and presentation materials, certain non - GAAP information including operating earnings and other “operating” financial measures, consolidated free cash flow, net cash from operating activities excluding IBM Financing receivables, and adjustments for currency. The rationale for management’s use of this non - GAAP information is included as Exhibit 99.2 to the company’s Form 8 - K submitted to the SEC on January 25, 2023. The reconciliation of non - GAAP information to GAAP is included in the press release within Exhibit 99.1 to the company’s Form 8 - K submitted to the SEC on January 25, 2023, as well as on the slides entitled “Non - GAAP supplemental materials” in this presentation. To provide better transparency, the company also discusses management performance metrics including hybrid cloud revenue, annual recurring revenue, signings, and book - to - bill. The metrics are used to monitor the performance of the business and are viewed as useful decision - making information for management and stakeholders. The rationale for management’s use of these performance metrics and their calculation are included in the Management Discussion section of the company’s 2021 Annual Report, which is Exhibit 13 to the Form 10 - K submitted with the SEC on February 22, 2022. For other related information please visit the Company’s investor relations website at: https://www.ibm.com/investor/events/earnings - 4q22 2 |
3 Arvind Krishna Chairman and Chief Executive Officer James Kavanaugh SVP, Finance & Operations, Chief Financial Officer |
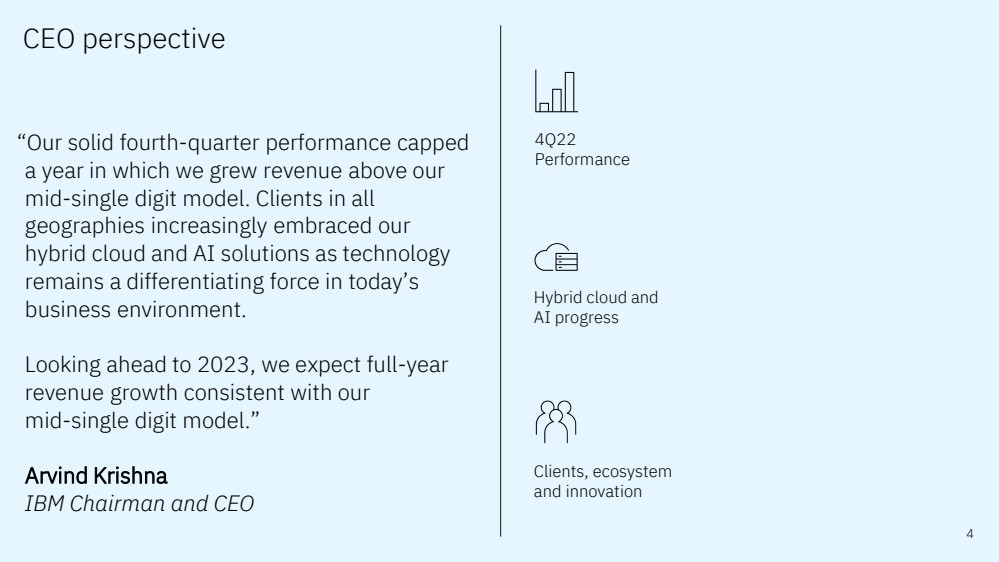
“Our solid fourth - quarter performance capped a year in which we grew revenue above our mid - single digit model. Clients in all geographies increasingly embraced our hybrid cloud and AI solutions as technology remains a differentiating force in today’s business environment. Looking ahead to 2023, we expect full - year revenue growth consistent with our mid - single digit model.” Arvind Krishna IBM Chairman and CEO 4 4Q22 Performance Clients, ecosystem and innovation Hybrid cloud and AI progress CEO perspective |
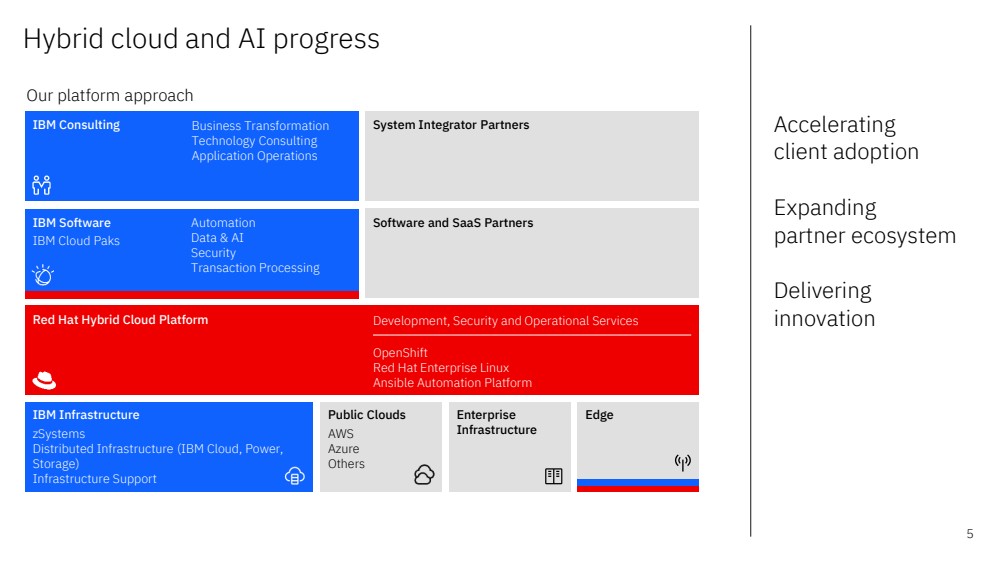
5 Hybrid cloud and AI progress Our platform approach Accelerating client adoption Expanding partner ecosystem Delivering innovation Red Hat Hybrid Cloud Platform Development, Security and Operational Services Public Clouds AWS Azure Others Enterprise Infrastructure Edge IBM Infrastructure zSystems Distributed Infrastructure (IBM Cloud, Power, Storage) Infrastructure Support Business Transformation Technology Consulting Application Operations IBM Consulting System Integrator Partners Software and SaaS Partners IBM Software Automation Data & AI Security Transaction Processing IBM Cloud Paks OpenShift Red Hat Enterprise Linux Ansible Automation Platform |
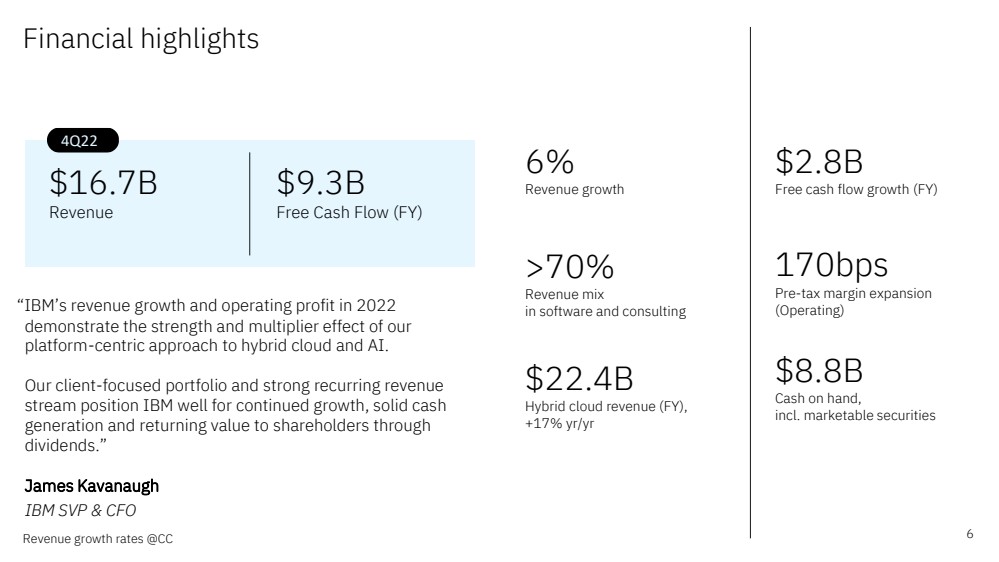
$16.7B Revenue $9 ..3 B Free Cash Flow (FY) 4Q22 Financial highlights Revenue growth rates @CC 6 6% R evenue growth >70% R evenue mix in software and consulting $22.4B Hybrid cloud revenue (FY), +17% yr/yr $2.8B Free cash flow growth (FY) 170bps Pre - tax margin expansion (Operating) $8.8B C ash on hand, incl. marketable securities “IBM’s revenue growth and operating profit in 2022 demonstrate the strength and multiplier effect of our platform - centric approach to hybrid cloud and AI. Our client - focused portfolio and strong recurring revenue stream position IBM well for continued growth, solid cash generation and returning value to shareholders through dividends.” James Kavanaugh IBM SVP & CFO |
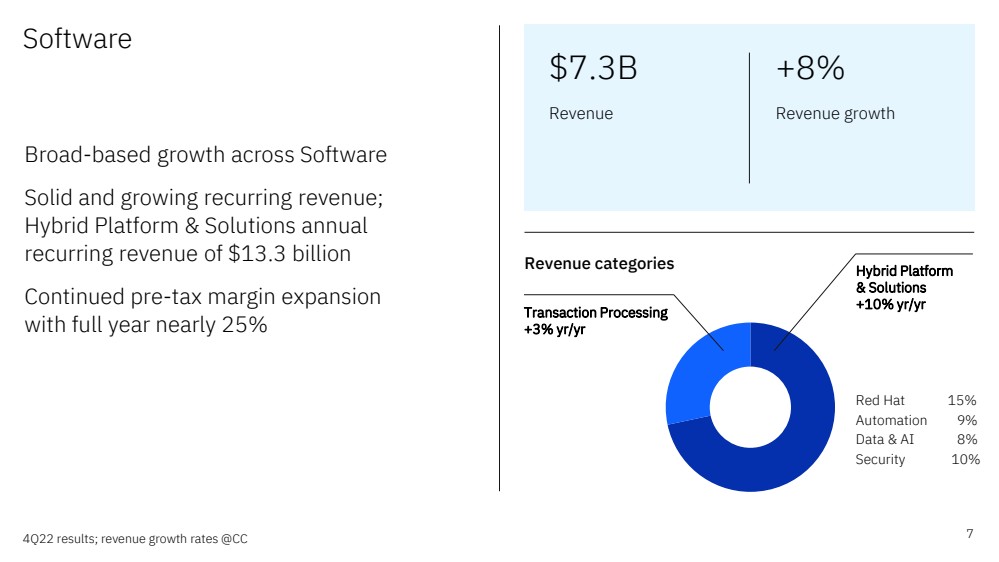
Broad - based growth across Software Solid and growing recurring revenue; Hybrid Platform & Solutions annual recurring revenue of $13.3 billion Continued pre - tax margin expansion with full year nearly 25% 7 $7.3B Revenue Revenue categories Transaction Processing +3% yr/ yr +8% Revenue growth Hybrid Platform & Solutions +10% yr/ yr Red Hat 15% Automation 9% Data & AI 8% Security 10% Software 4Q22 results; revenue growth rates @CC |
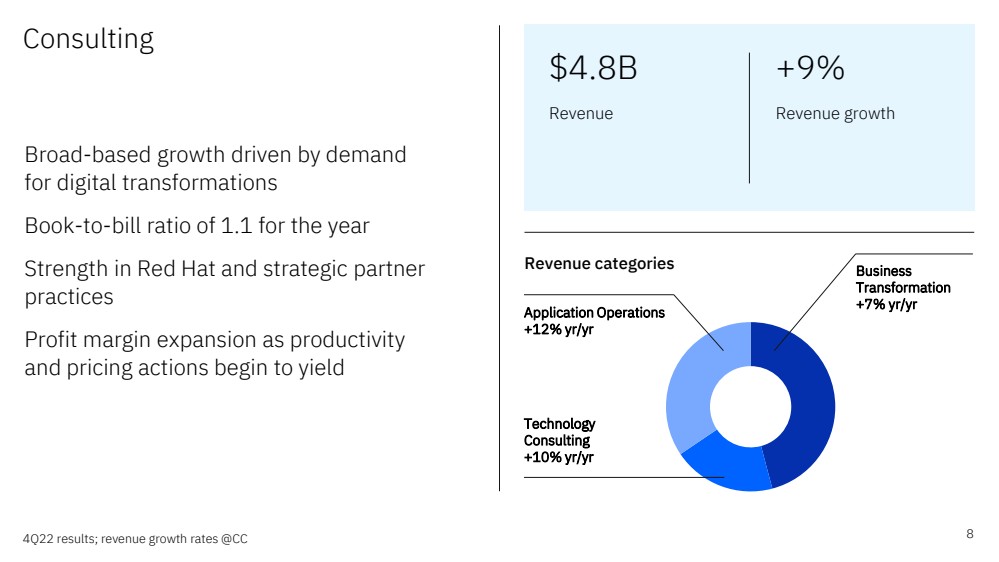
8 $4.8B Revenue Revenue categories Application Operations +12% yr/yr +9% Revenue growth Broad - based growth driven by demand for digital transformations Book - to - bill ratio of 1.1 for the year Strength in Red Hat and strategic partner practices Profit margin expansion as productivity and pricing actions begin to yield Technology Consulting +10% yr/yr Business Transformation +7% yr/yr Consulting 4Q22 results; revenue growth rates @CC |
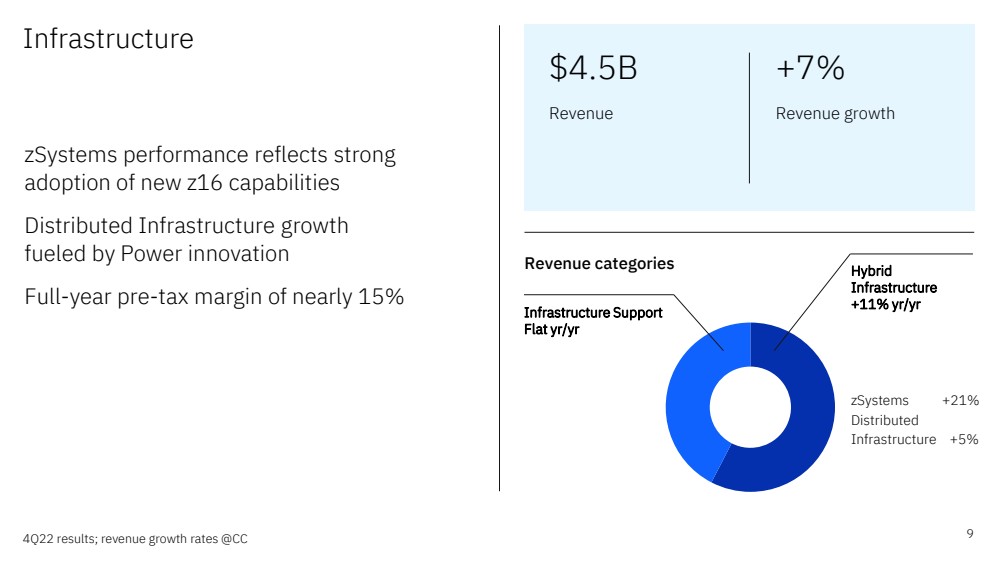
9 $4.5B Revenue Revenue categories Infrastructure Support Flat yr/ yr +7% Revenue growth Hybrid Infrastructure +11% yr/ yr zSystems +21% Distributed Infrastructure +5% zSystems performance reflects strong adoption of new z16 capabilities Distributed Infrastructure growth fueled by Power innovation Full - year pre - tax margin of nearly 15% Infrastructure 4Q22 results; revenue growth rates @CC |
10 Summary 2022 Positions IBM for Sustainable Growth More focused company aligned to clients’ needs Continued progress across portfolio, go - to - market, ecosystem Investments in talent and innovation Higher - growth, higher - value business 2023 Expectations Revenue growth @CC in line with mid - single digit model Free cash flow of ~$10 ½ billion, up >$1 billion yr / yr |
ibm.com/investor |
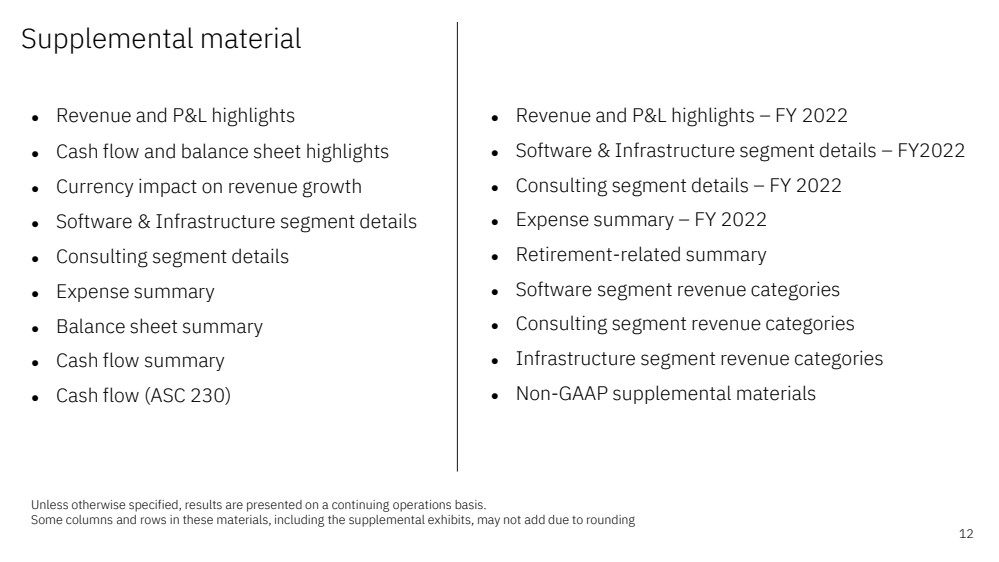
12 Supplemental material ● Revenue and P&L highlights ● Cash flow and balance sheet highlights ● Currency impact on revenue growth ● Software & Infrastructure segment details ● Consulting segment details ● Expense summary ● Balance sheet summary ● Cash flow summary ● Cash flow (ASC 230) Unless otherwise specified, results are presented on a continuing operations basis. Some columns and rows in these materials, including the supplemental exhibits, may not add due to rounding ● Revenue and P&L highlights – FY 2022 ● Software & Infrastructure segment details – FY2022 ● Consulting segment details – FY 2022 ● Expense summary – FY 2022 ● Retirement - related summary ● Software segment revenue categories ● Consulting segment revenue categories ● Infrastructure segment revenue categories ● Non - GAAP supplemental materials |
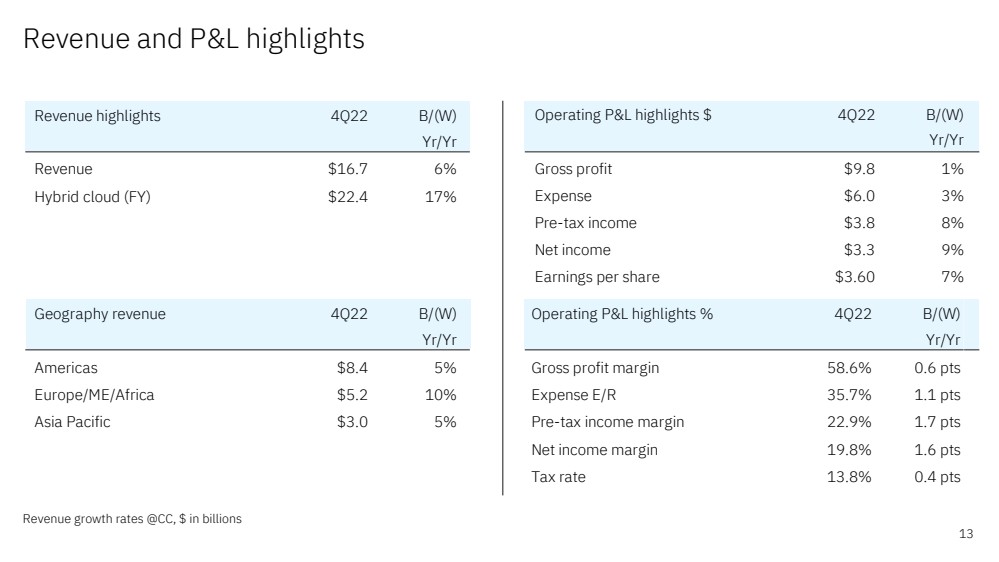
13 Revenue and P&L highlights Revenue growth rates @CC, $ in billions Revenue highlights 4Q22 B/(W) Yr/Yr Revenue $16.7 6% Hybrid cloud (FY) $22.4 17% Operating P&L highlights % 4Q22 B/(W) Yr/Yr Gross profit margin 58.6% 0.6 pts Expense E/R 35.7% 1.1 pts Pre-tax income margin 22.9% 1.7 pts Net income margin 19.8% 1.6 pts Tax rate 13.8% 0.4 pts Geography revenue 4Q22 B/(W) Yr/Yr Americas $8.4 5% Europe/ME/Africa $5.2 10% Asia Pacific $3.0 5% Operating P&L highlights $ 4Q22 B/(W) Yr/Yr Gross profit $9.8 1% Expense $6.0 3% Pre-tax income $3.8 8% Net income $3.3 9% Earnings per share $3.60 7% |
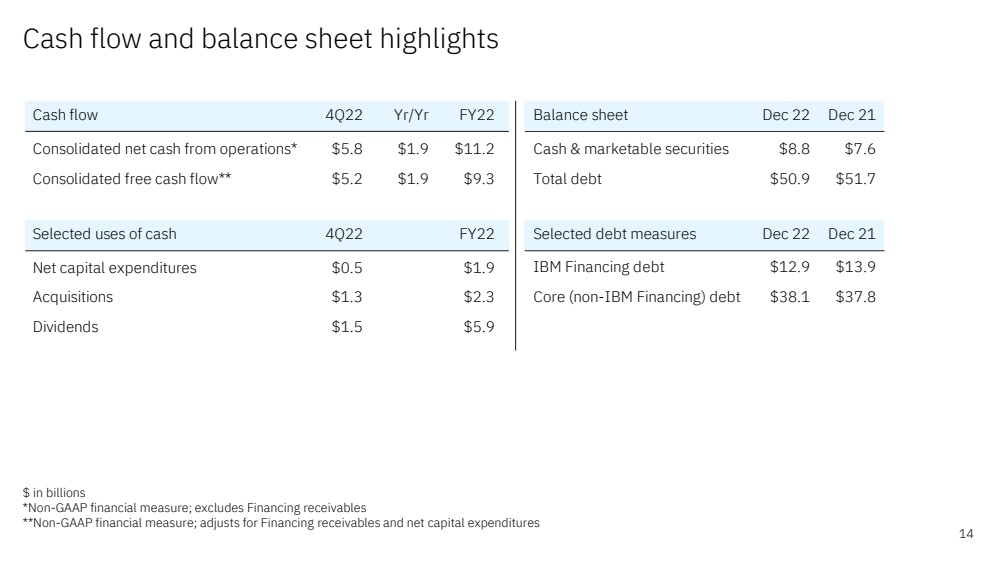
14 Cash flow and balance sheet highlights $ in billions *Non - GAAP financial measure; excludes Financing receivables **Non - GAAP financial measure; adjusts for Financing receivables and net capital expenditures Balance sheet Dec 22 Dec 21 Cash & marketable securities $8.8 $7.6 Total debt $50.9 $51.7 Selected debt measures Dec 22 Dec 21 IBM Financing debt $12.9 $13.9 Core (non-IBM Financing) debt $38.1 $37.8 Cash flow 4Q22 Yr/Yr FY22 Consolidated net cash from operations* $5.8 $1.9 $11.2 Consolidated free cash flow** $5.2 $1.9 $9.3 Selected uses of cash 4Q22 FY22 Net capital expenditures $0.5 $1.9 Acquisitions $1.3 $2.3 Dividends $1.5 $5.9 |
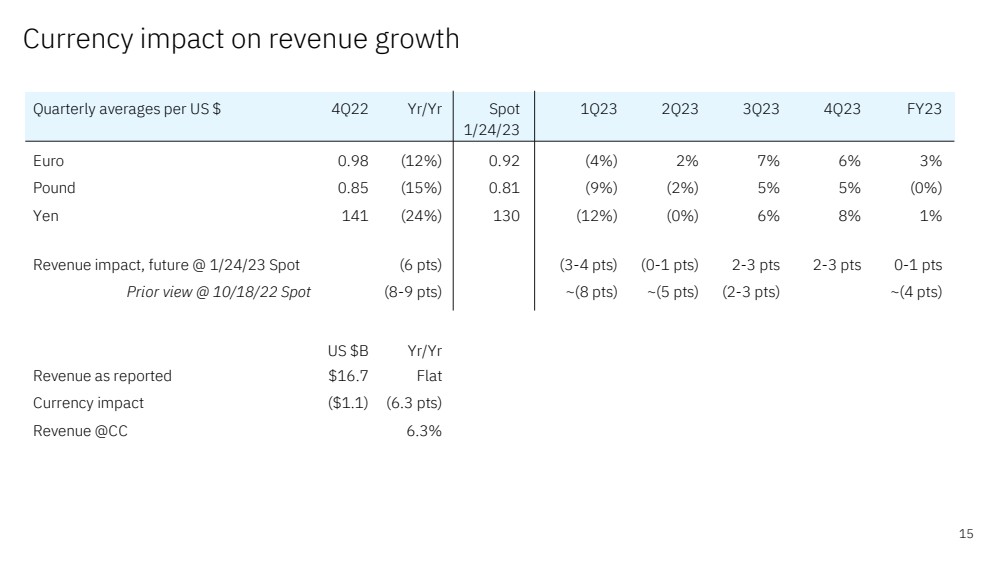
15 Currency impact on revenue growth Quarterly averages per US $ 4Q22 Yr/Yr Spot 1Q23 2Q23 3Q23 4Q23 FY23 1/24/23 Euro 0.98 (12%) 0.92 (4%) 2% 7% 6% 3% Pound 0.85 (15%) 0.81 (9%) (2%) 5% 5% (0%) Yen 141 (24%) 130 (12%) (0%) 6% 8% 1% Revenue impact, future @ 1/24/23 Spot (6 pts) (3-4 pts) (0-1 pts) 2-3 pts 2-3 pts 0-1 pts Prior view @ 10/18/22 Spot (8-9 pts) ~(8 pts) ~(5 pts) (2-3 pts) ~(4 pts) US $B Yr/Yr Revenue as reported $16.7 Flat Currency impact ($1.1) (6.3 pts) Revenue @CC 6.3% |
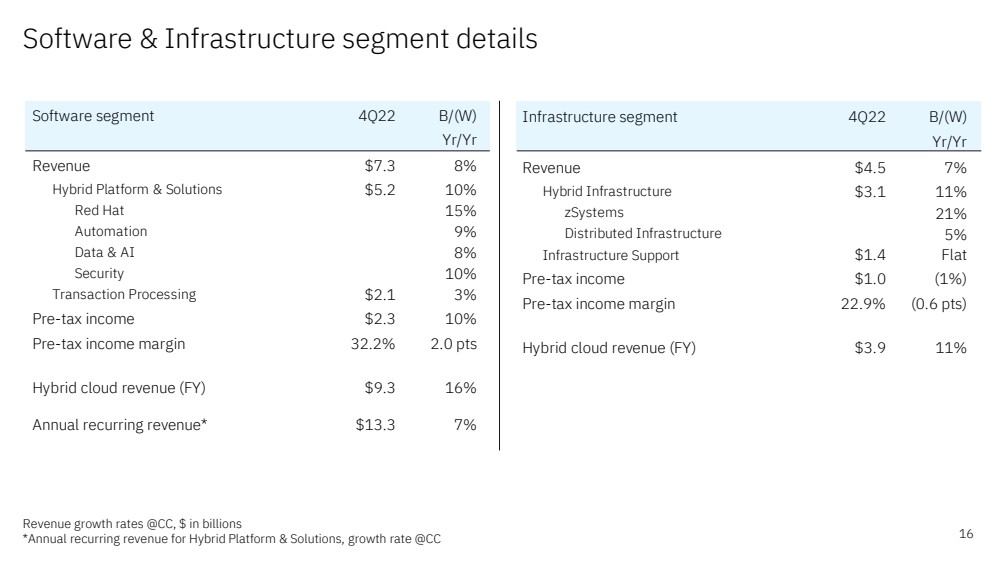
16 Software & Infrastructure segment details Revenue growth rates @CC, $ in billions *Annual recurring revenue for Hybrid Platform & Solutions, growth rate @CC Software segment 4Q22 B/(W) Yr/Yr Revenue $7.3 8% Hybrid Platform & Solutions $5.2 10% Red Hat 15% Automation 9% Data & AI 8% Security 10% Transaction Processing $2.1 3% Pre-tax income $2.3 10% Pre-tax income margin 32.2% 2.0 pts Hybrid cloud revenue (FY) $9.3 16% Annual recurring revenue* $13.3 7% Infrastructure segment 4Q22 B/(W) Yr/Yr Revenue $4.5 7% Hybrid Infrastructure $3.1 11% zSystems 21% Distributed Infrastructure 5% Infrastructure Support $1.4 Flat Pre-tax income $1.0 (1%) Pre-tax income margin 22.9% (0.6 pts) Hybrid cloud revenue (FY) $3.9 11% |
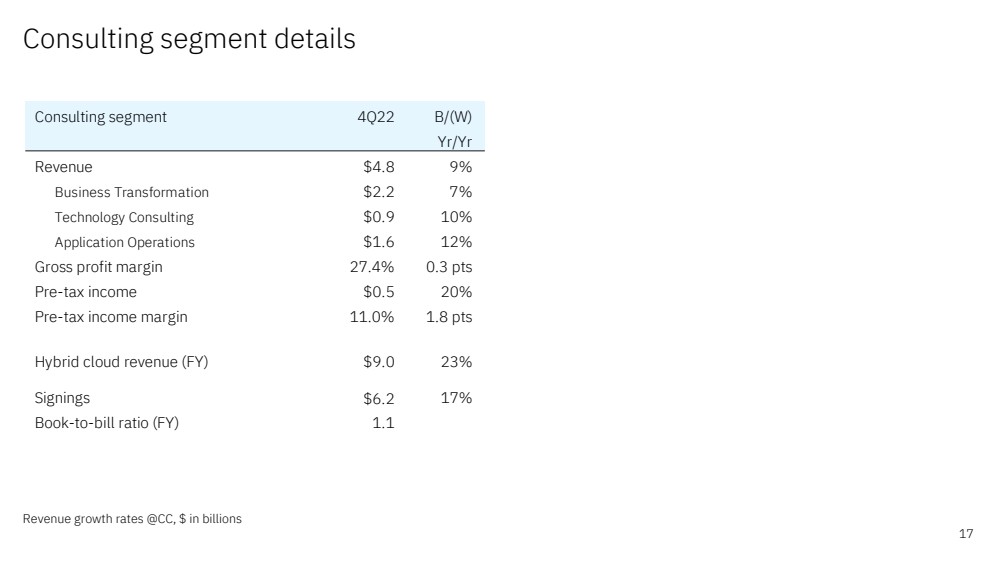
17 Consulting segment details Consulting segment 4Q22 B/(W) Yr/Yr Revenue $4.8 9% Business Transformation $2.2 7% Technology Consulting $0.9 10% Application Operations $1.6 12% Gross profit margin 27.4% 0.3 pts Pre-tax income $0.5 20% Pre-tax income margin 11.0% 1.8 pts Hybrid cloud revenue (FY) $9.0 23% Signings $6.2 17% Book-to-bill ratio (FY) 1.1 Revenue growth rates @CC, $ in billions |
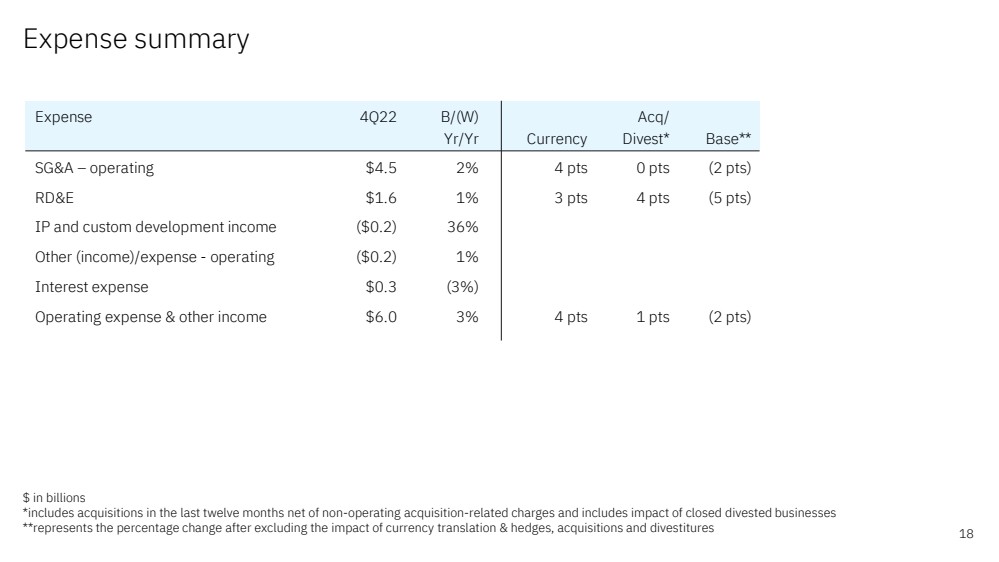
18 Expense summary $ in billions *includes acquisitions in the last twelve months net of non - operating acquisition - related charges and includes impact of closed divested businesses **represents the percentage change after excluding the impact of currency translation & hedges, acquisitions and divestitures Expense 4Q22 B/(W) Acq/ Yr/Yr Currency Divest* Base** SG&A – operating $4.5 2% 4 pts 0 pts (2 pts) RD&E $1.6 1% 3 pts 4 pts (5 pts) IP and custom development income ($0.2) 36% Other (income)/expense - operating ($0.2) 1% Interest expense $0.3 (3%) Operating expense & other income $6.0 3% 4 pts 1 pts (2 pts) |
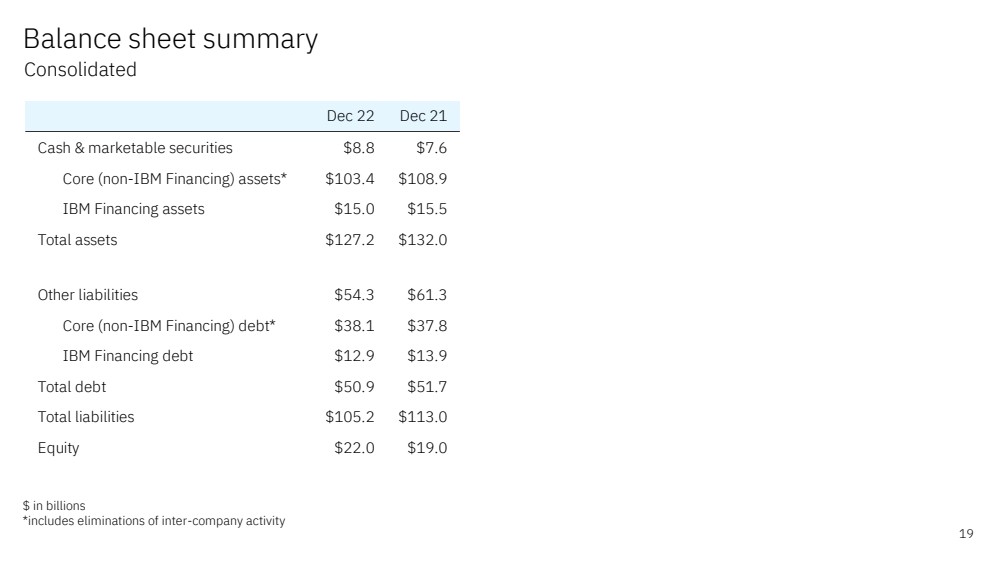
19 Balance sheet summary $ in billions *includes eliminations of inter - company activity Consolidated Dec 22 Dec 21 Cash & marketable securities $8.8 $7.6 Core (non-IBM Financing) assets* $103.4 $108.9 IBM Financing assets $15.0 $15.5 Total assets $127.2 $132.0 Other liabilities $54.3 $61.3 Core (non-IBM Financing) debt* $38.1 $37.8 IBM Financing debt $12.9 $13.9 Total debt $50.9 $51.7 Total liabilities $105.2 $113.0 Equity $22.0 $19.0 |
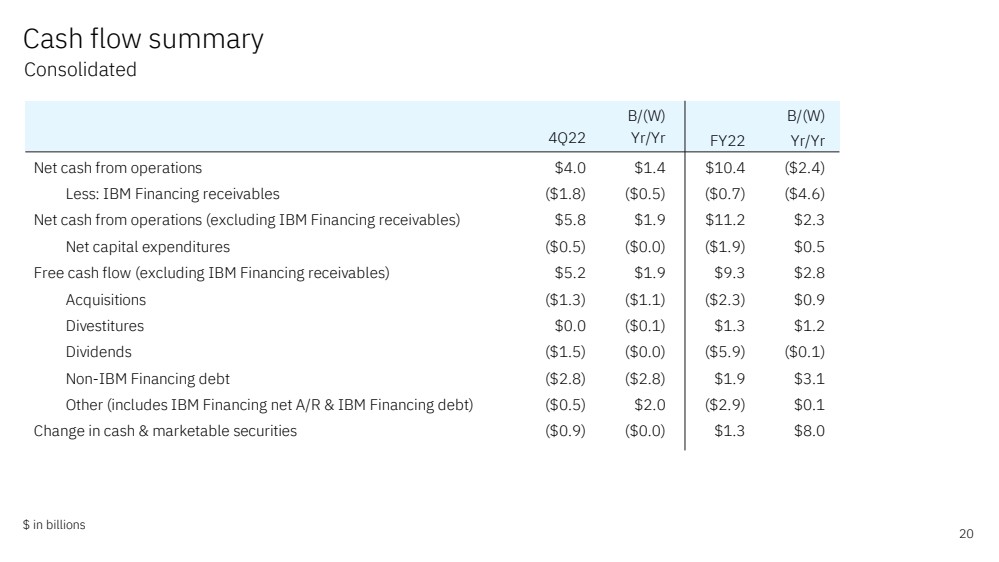
20 Cash flow summary $ in billions Consolidated B/(W) B/(W) 4Q22 Yr/Yr FY22 Yr/Yr Net cash from operations $4.0 $1.4 $10.4 ($2.4) Less: IBM Financing receivables ($1.8) ($0.5) ($0.7) ($4.6) Net cash from operations (excluding IBM Financing receivables) $5.8 $1.9 $11.2 $2.3 Net capital expenditures ($0.5) ($0.0) ($1.9) $0.5 Free cash flow (excluding IBM Financing receivables) $5.2 $1.9 $9.3 $2.8 Acquisitions ($1.3) ($1.1) ($2.3) $0.9 Divestitures $0.0 ($0.1) $1.3 $1.2 Dividends ($1.5) ($0.0) ($5.9) ($0.1) Non-IBM Financing debt ($2.8) ($2.8) $1.9 $3.1 Other (includes IBM Financing net A/R & IBM Financing debt) ($0.5) $2.0 ($2.9) $0.1 Change in cash & marketable securities ($0.9) ($0.0) $1.3 $8.0 |
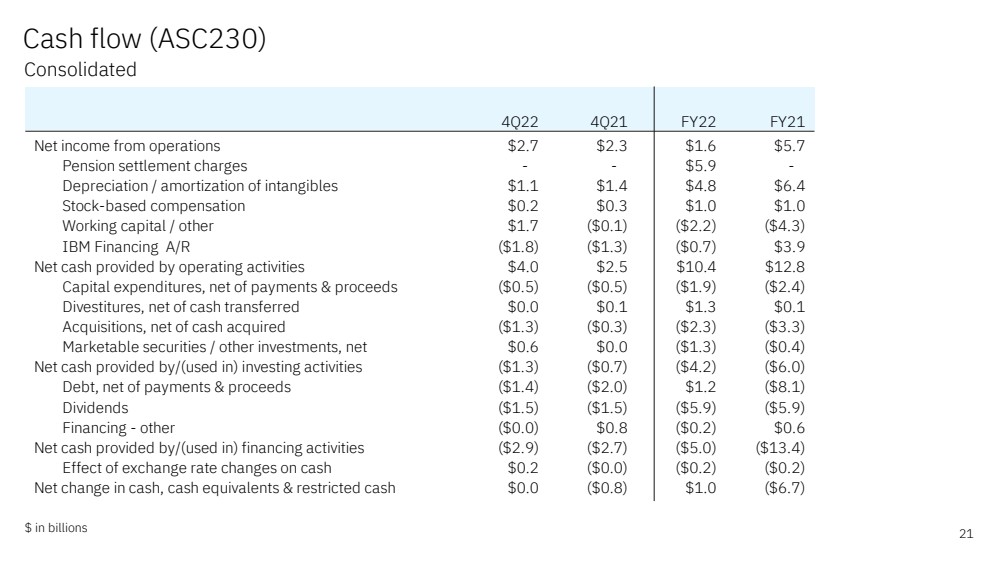
21 Cash flow (ASC230) Consolidated $ in billions 4Q22 4Q21 FY22 FY21 Net income from operations $2.7 $2.3 $1.6 $5.7 Pension settlement charges - - $5.9 - Depreciation / amortization of intangibles $1.1 $1.4 $4.8 $6.4 Stock-based compensation $0.2 $0.3 $1.0 $1.0 Working capital / other $1.7 ($0.1) ($2.2) ($4.3) IBM Financing A/R ($1.8) ($1.3) ($0.7) $3.9 Net cash provided by operating activities $4.0 $2.5 $10.4 $12.8 Capital expenditures, net of payments & proceeds ($0.5) ($0.5) ($1.9) ($2.4) Divestitures, net of cash transferred $0.0 $0.1 $1.3 $0.1 Acquisitions, net of cash acquired ($1.3) ($0.3) ($2.3) ($3.3) Marketable securities / other investments, net $0.6 $0.0 ($1.3) ($0.4) Net cash provided by/(used in) investing activities ($1.3) ($0.7) ($4.2) ($6.0) Debt, net of payments & proceeds ($1.4) ($2.0) $1.2 ($8.1) Dividends ($1.5) ($1.5) ($5.9) ($5.9) Financing - other ($0.0) $0.8 ($0.2) $0.6 Net cash provided by/(used in) financing activities ($2.9) ($2.7) ($5.0) ($13.4) Effect of exchange rate changes on cash $0.2 ($0.0) ($0.2) ($0.2) Net change in cash, cash equivalents & restricted cash $0.0 ($0.8) $1.0 ($6.7) |
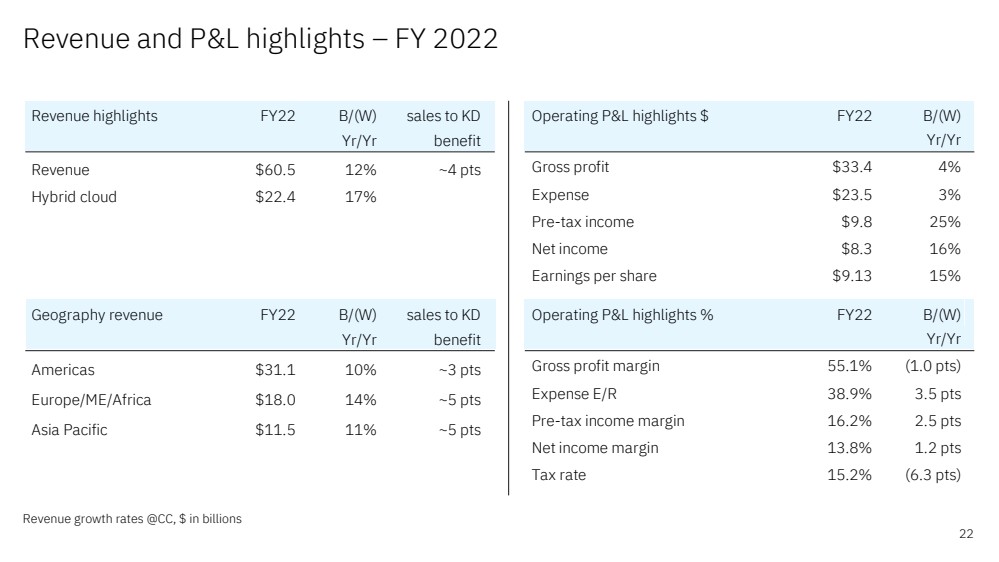
22 Revenue and P&L highlights – FY 2022 Revenue growth rates @CC, $ in billions Revenue highlights FY22 B/(W) sales to KD Yr/Yr benefit Revenue $60.5 12% ~4 pts Hybrid cloud $22.4 17% Geography revenue FY22 B/(W) sales to KD Yr/Yr benefit Americas $31.1 10% ~3 pts Europe/ME/Africa $18.0 14% ~5 pts Asia Pacific $11.5 11% ~5 pts Operating P&L highlights $ FY22 B/(W) Yr/Yr Gross profit $33.4 4% Expense $23.5 3% Pre-tax income $9.8 25% Net income $8.3 16% Earnings per share $9.13 15% Operating P&L highlights % FY22 B/(W) Yr/Yr Gross profit margin 55.1% (1.0 pts) Expense E/R 38.9% 3.5 pts Pre-tax income margin 16.2% 2.5 pts Net income margin 13.8% 1.2 pts Tax rate 15.2% (6.3 pts) |
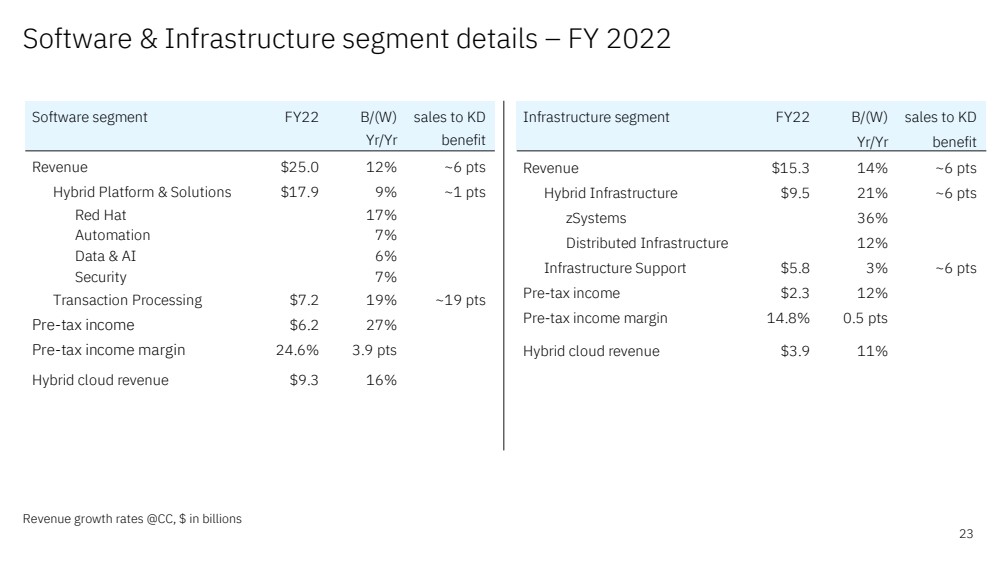
23 Software & Infrastructure segment details – FY 2022 Software segment FY22 B/(W) sales to KD Yr/Yr benefit Revenue $25.0 12% ~6 pts Hybrid Platform & Solutions $17.9 9% ~1 pts Red Hat 17% Automation 7% Data & AI 6% Security 7% Transaction Processing $7.2 19% ~19 pts Pre-tax income $6.2 27% Pre-tax income margin 24.6% 3.9 pts Hybrid cloud revenue $9.3 16% Infrastructure segment FY22 B/(W) sales to KD Yr/Yr benefit Revenue $15.3 14% ~6 pts Hybrid Infrastructure $9.5 21% ~6 pts zSystems 36% Distributed Infrastructure 12% Infrastructure Support $5.8 3% ~6 pts Pre-tax income $2.3 12% Pre-tax income margin 14.8% 0.5 pts Hybrid cloud revenue $3.9 11% Revenue growth rates @CC, $ in billions |
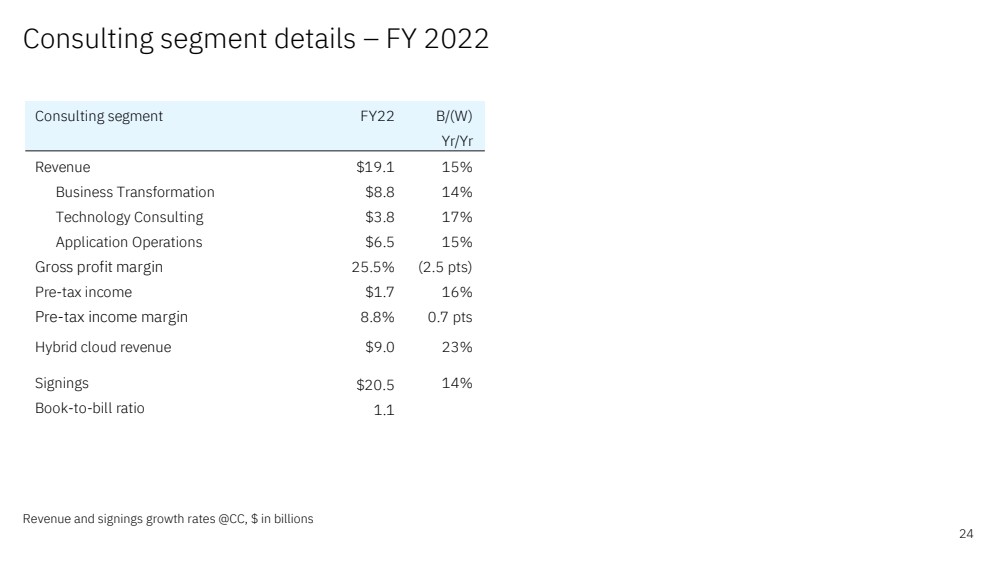
24 Consulting segment details – FY 2022 Revenue and signings growth rates @CC, $ in billions Consulting segment FY22 B/(W) Yr/Yr Revenue $19.1 15% Business Transformation $8.8 14% Technology Consulting $3.8 17% Application Operations $6.5 15% Gross profit margin 25.5% (2.5 pts) Pre-tax income $1.7 16% Pre-tax income margin 8.8% 0.7 pts Hybrid cloud revenue $9.0 23% Signings $20.5 14% Book-to-bill ratio 1.1 |
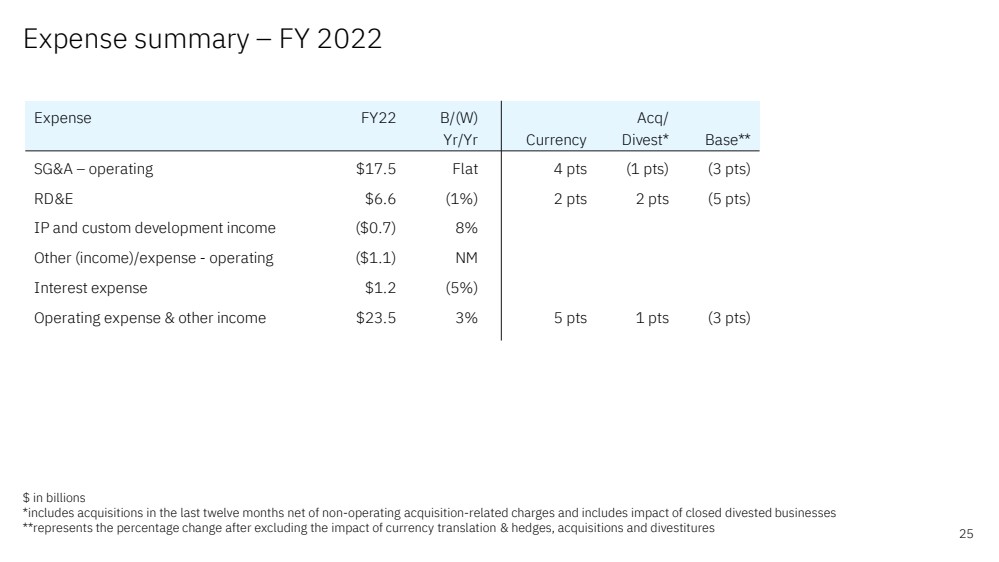
25 Expense summary – FY 2022 $ in billions *includes acquisitions in the last twelve months net of non - operating acquisition - related charges and includes impact of closed divested businesses **represents the percentage change after excluding the impact of currency translation & hedges, acquisitions and divestitures Expense FY22 B/(W) Acq/ Yr/Yr Currency Divest* Base** SG&A – operating $17.5 Flat 4 pts (1 pts) (3 pts) RD&E $6.6 (1%) 2 pts 2 pts (5 pts) IP and custom development income ($0.7) 8% Other (income)/expense - operating ($1.1) NM Interest expense $1.2 (5%) Operating expense & other income $23.5 3% 5 pts 1 pts (3 pts) |
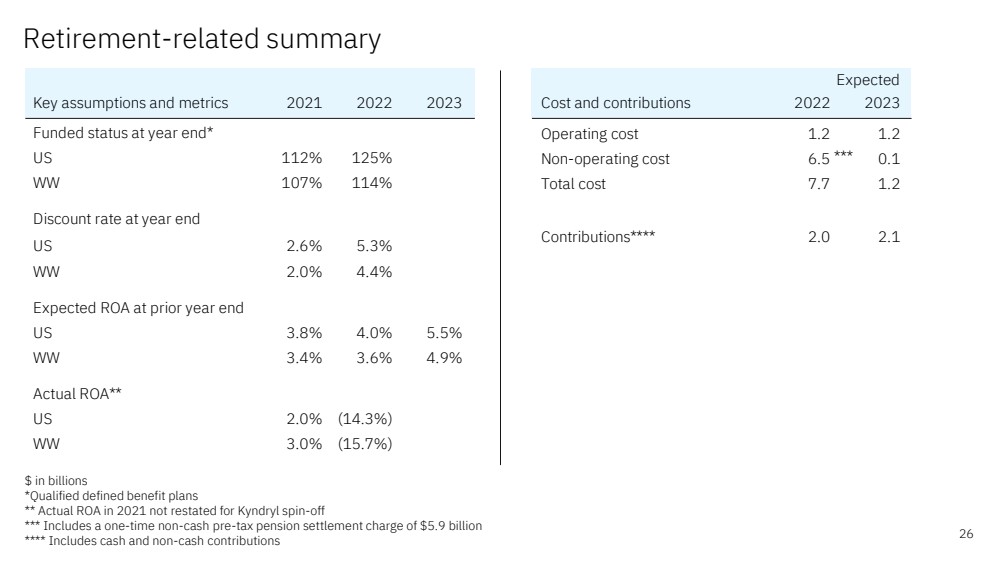
26 Retirement - related summary $ in billions *Qualified defined benefit plans ** Actual ROA in 2021 not restated for Kyndryl spin - off *** Includes a one - time non - cash pre - tax pension settlement charge of $5.9 billion **** Includes cash and non - cash contributions Key assumptions and metrics 2021 2022 2023 Funded status at year end* US 112% 125% WW 107% 114% Discount rate at year end US 2.6% 5.3% WW 2.0% 4.4% Expected ROA at prior year end US 3.8% 4.0% 5.5% WW 3.4% 3.6% 4.9% Actual ROA** US 2.0% (14.3%) WW 3.0% (15.7%) Expected Cost and contributions 2022 2023 Operating cost 1.2 1.2 Non-operating cost 6.5 0.1 Total cost 7.7 1.2 Contributions**** 2.0 2.1 *** |
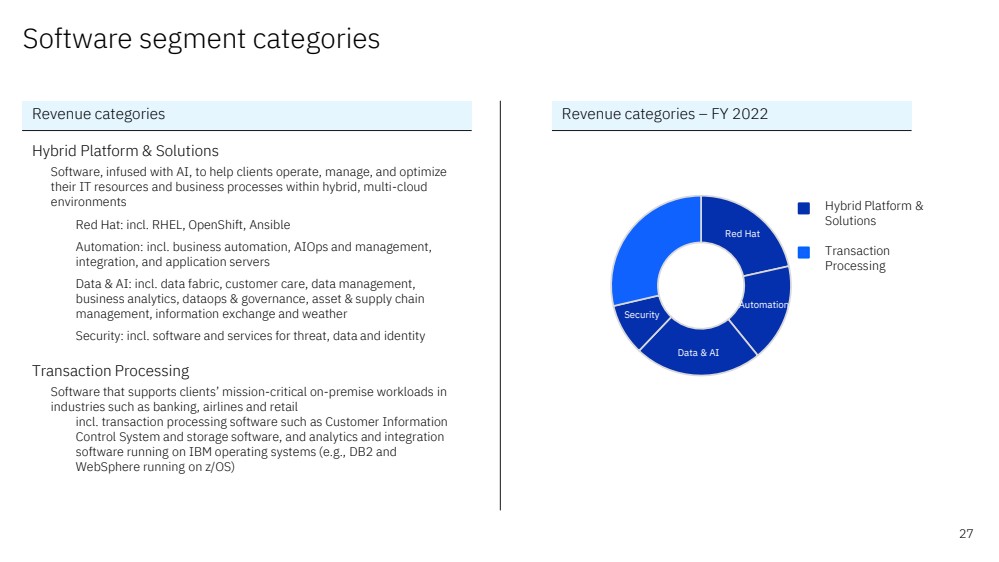
Red Hat Automation Data & AI Security Hybrid Platform & Solutions Software, infused with AI, to help clients operate, manage, and optimize their IT resources and business processes within hybrid, multi - cloud environments Red Hat: incl. RHEL, OpenShift, Ansible Automation: incl. business automation, AIOps and management, integration, and application servers Data & AI: incl. data fabric, customer care, data management, business analytics, dataops & governance, asset & supply chain management, information exchange and weather Security: incl. software and services for threat, data and identity Transaction Processing Software that supports clients’ mission - critical on - premise workloads in industries such as banking, airlines and retail incl. transaction processing software such as Customer Information Control System and storage software, and analytics and integration software running on IBM operating systems (e.g., DB2 and WebSphere running on z/OS) 27 Software segment categories Revenue categories Revenue categories – FY 2022 Hybrid Platform & Solutions Transaction Processing |
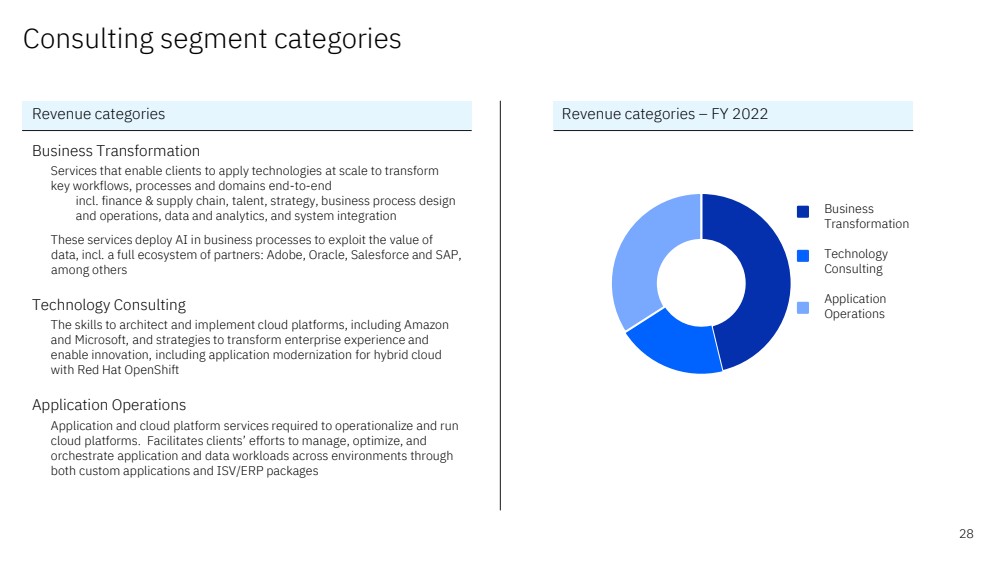
28 Consulting segment categories Revenue categories Business Transformation Services that enable clients to apply technologies at scale to transform key workflows, processes and domains end - to - end incl. finance & supply chain, talent, strategy, business process design and operations, data and analytics, and system integration These services deploy AI in business processes to exploit the value of data, incl. a full ecosystem of partners: Adobe, Oracle, Salesforce and SAP , among others Technology Consulting The skills to architect and implement cloud platforms, including Amazon and Microsoft, and strategies to transform enterprise experience and enable innovation, including application modernization for hybrid cloud with Red Hat OpenShift Application Operations Application and cloud platform services required to operationalize and run cloud platforms. Facilitates clients’ efforts to manage, optimize, and orchestrate application and data workloads across environments through both custom applications and ISV/ERP packages Business Transformation Technology Consulting Application Operations Revenue categories – FY 2022 |
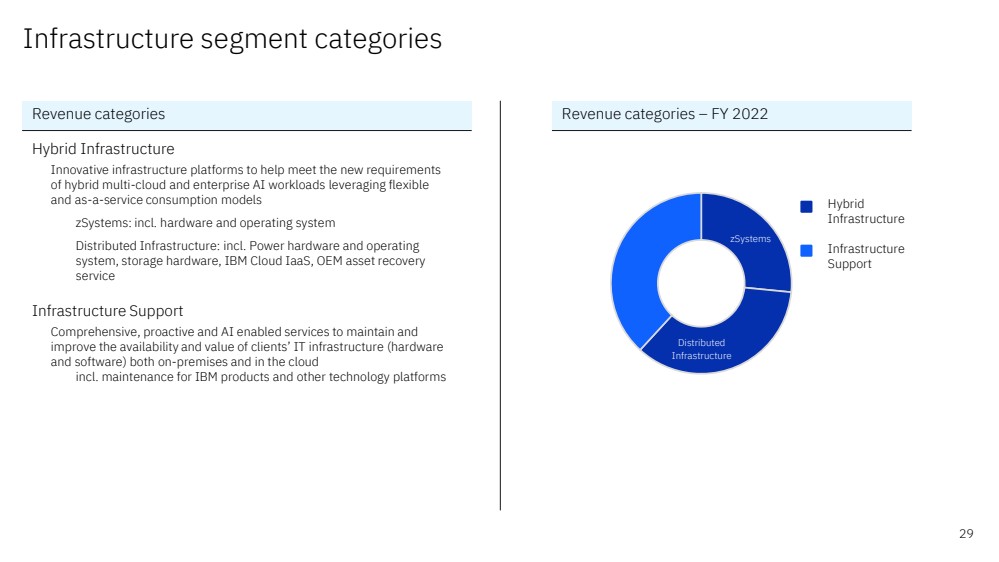
29 Infrastructure segment categories Revenue categories Revenue categories – FY 2022 Hybrid Infrastructure Innovative infrastructure platforms to help meet the new requirements of hybrid multi - cloud and enterprise AI workloads leveraging flexible and as - a - service consumption models zSystems : incl. hardware and operating system Distributed Infrastructure : incl. Power hardware and operating system, storage hardware, IBM Cloud IaaS, OEM asset recovery service Infrastructure Support Comprehensive, proactive and AI enabled services to maintain and improve the availability and value of clients’ IT infrastructure (hardware and software) both on - premises and in the cloud incl. maintenance for IBM products and other technology platforms zSystems Distributed Infrastructure Hybrid Infrastructure Infrastructure Support |
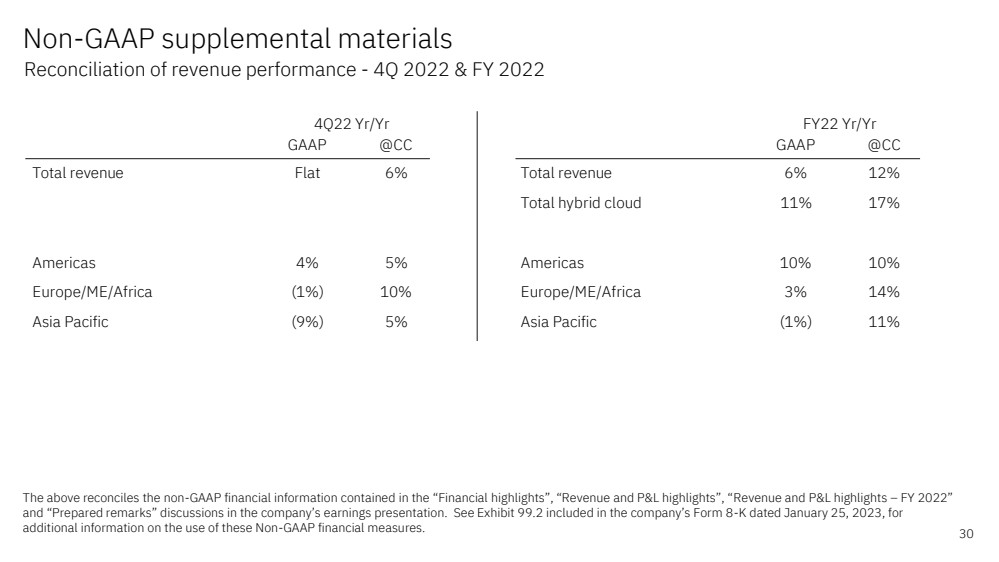
30 Non - GAAP supplemental materials The above reconciles the non - GAAP financial information contained in the “Financial highlights”, “Revenue and P&L highlights”, “ Revenue and P&L highlights – FY 2022” and “Prepared remarks” discussions in the company’s earnings presentation. See Exhibit 99.2 included in the company’s Form 8 - K dated January 25, 2023, for additional information on the use of these Non - GAAP financial measures. Reconciliation of revenue performance - 4Q 2022 & FY 2022 GAAP @CC Total revenue Flat 6% Americas 4% 5% Europe/ME/Africa (1%) 10% Asia Pacific (9%) 5% 4Q22 Yr/Yr GAAP @CC Total revenue 6% 12% Total hybrid cloud 11% 17% Americas 10% 10% Europe/ME/Africa 3% 14% Asia Pacific (1%) 11% FY22 Yr/Yr |
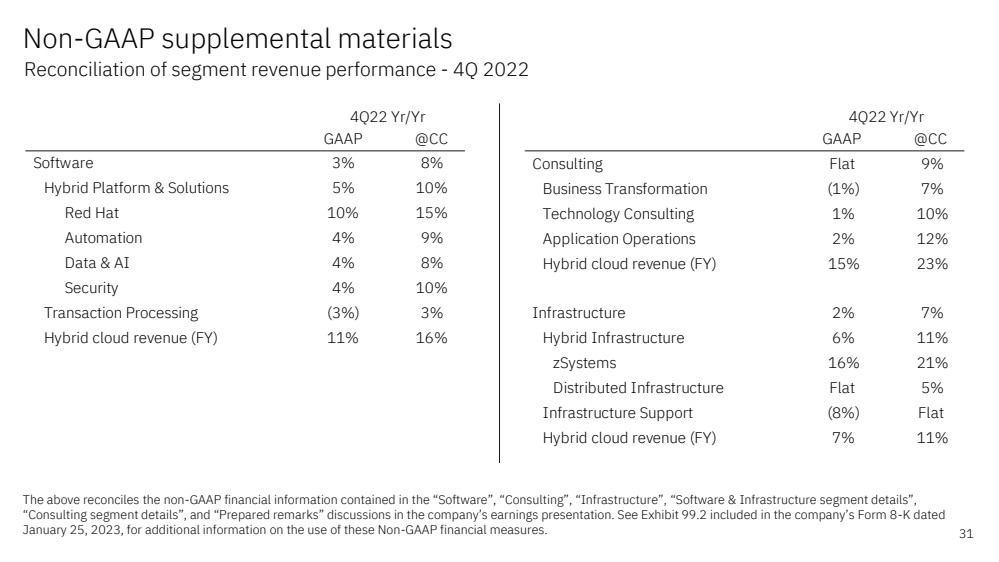
31 Non - GAAP supplemental materials The above reconciles the non - GAAP financial information contained in the “Software”, “Consulting”, “Infrastructure”, “Software & Infrastructure segment details”, “Consulting segment details”, and “Prepared remarks” discussions in the company’s earnings presentation. See Exhibit 99.2 included in the company’s Form 8 - K d ated January 25, 2023, for additional information on the use of these Non - GAAP financial measures. Reconciliation of segment revenue performance - 4Q 2022 GAAP @CC Software 3% 8% Hybrid Platform & Solutions 5% 10% Red Hat 10% 15% Automation 4% 9% Data & AI 4% 8% Security 4% 10% Transaction Processing (3%) 3% Hybrid cloud revenue (FY) 11% 16% 4Q22 Yr/Yr GAAP @CC Consulting Flat 9% Business Transformation (1%) 7% Technology Consulting 1% 10% Application Operations 2% 12% Hybrid cloud revenue (FY) 15% 23% Infrastructure 2% 7% Hybrid Infrastructure 6% 11% zSystems 16% 21% Distributed Infrastructure Flat 5% Infrastructure Support (8%) Flat Hybrid cloud revenue (FY) 7% 11% 4Q22 Yr/Yr |
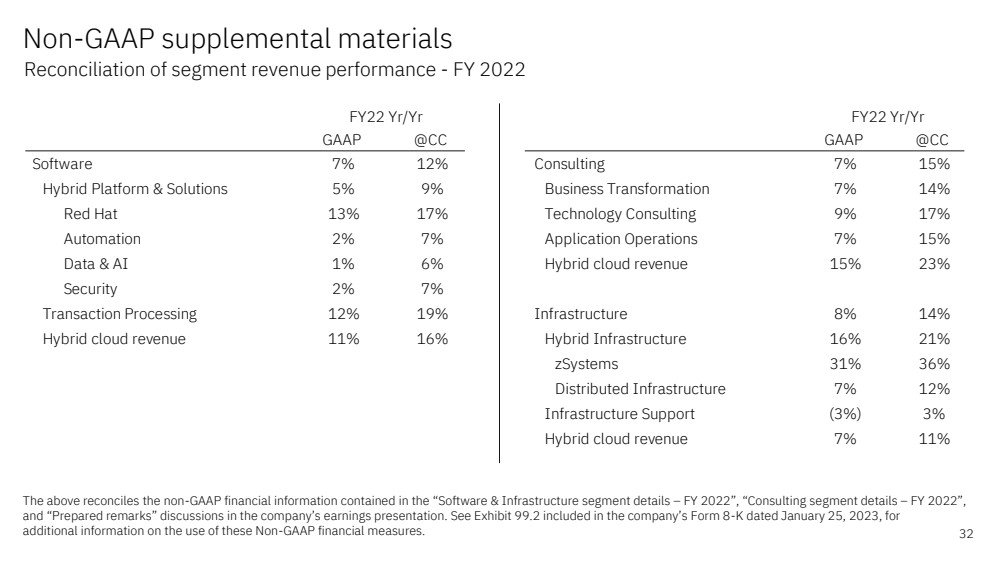
32 Non - GAAP supplemental materials The above reconciles the non - GAAP financial information contained in the “Software & Infrastructure segment details – FY 2022”, “Consulting segment details – FY 2022”, and “Prepared remarks” discussions in the company’s earnings presentation. See Exhibit 99.2 included in the company’s Form 8 - K d ated January 25, 2023, for additional information on the use of these Non - GAAP financial measures. Reconciliation of segment revenue performance - FY 2022 GAAP @CC Software 7% 12% Hybrid Platform & Solutions 5% 9% Red Hat 13% 17% Automation 2% 7% Data & AI 1% 6% Security 2% 7% Transaction Processing 12% 19% Hybrid cloud revenue 11% 16% FY22 Yr/Yr GAAP @CC Consulting 7% 15% Business Transformation 7% 14% Technology Consulting 9% 17% Application Operations 7% 15% Hybrid cloud revenue 15% 23% Infrastructure 8% 14% Hybrid Infrastructure 16% 21% zSystems 31% 36% Distributed Infrastructure 7% 12% Infrastructure Support (3%) 3% Hybrid cloud revenue 7% 11% FY22 Yr/Yr |
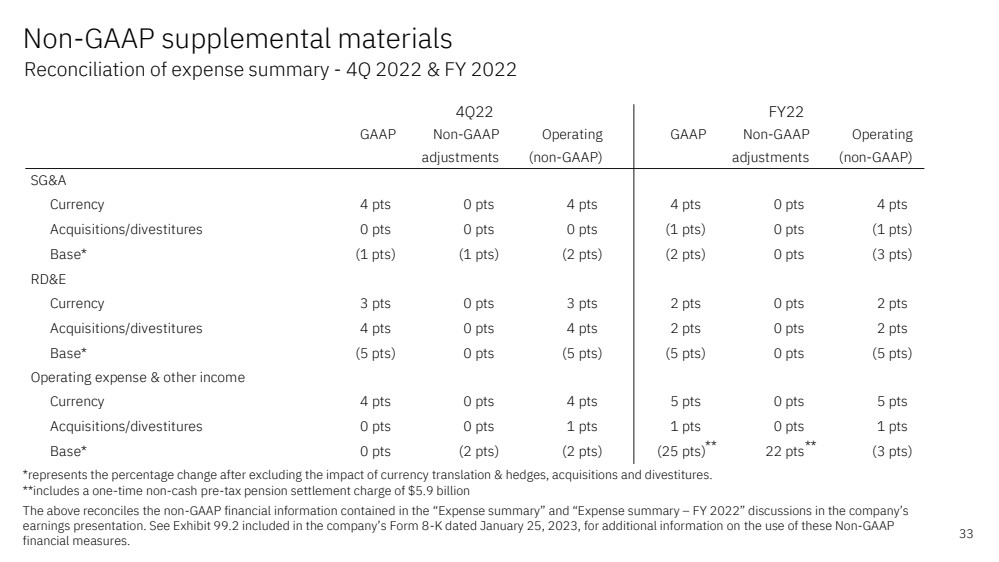
33 Non - GAAP supplemental materials *r epresents the percentage change after excluding the impact of currency translation & hedges, acquisitions and divestitures. ** includes a one - time non - cash pre - tax pension settlement charge of $5.9 billion The above reconciles the non - GAAP financial information contained in the “Expense summary” and “Expense summary – FY 2022” discussions in the company’s earnings presentation. See Exhibit 99.2 included in the company’s Form 8 - K dated January 25, 2023, for additional information on the use of these Non - GAAP financial measures. Reconciliation of expense summary - 4Q 2022 & FY 2022 GAAP Non-GAAP Operating GAAP Non-GAAP Operating adjustments (non-GAAP) adjustments (non-GAAP) SG&A Currency 4 pts 0 pts 4 pts 4 pts 0 pts 4 pts Acquisitions/divestitures 0 pts 0 pts 0 pts (1 pts) 0 pts (1 pts) Base* (1 pts) (1 pts) (2 pts) (2 pts) 0 pts (3 pts) RD&E Currency 3 pts 0 pts 3 pts 2 pts 0 pts 2 pts Acquisitions/divestitures 4 pts 0 pts 4 pts 2 pts 0 pts 2 pts Base* (5 pts) 0 pts (5 pts) (5 pts) 0 pts (5 pts) Operating expense & other income Currency 4 pts 0 pts 4 pts 5 pts 0 pts 5 pts Acquisitions/divestitures 0 pts 0 pts 1 pts 1 pts 0 pts 1 pts Base* 0 pts (2 pts) (2 pts) (25 pts) 22 pts (3 pts) 4Q22 FY22 ** ** |
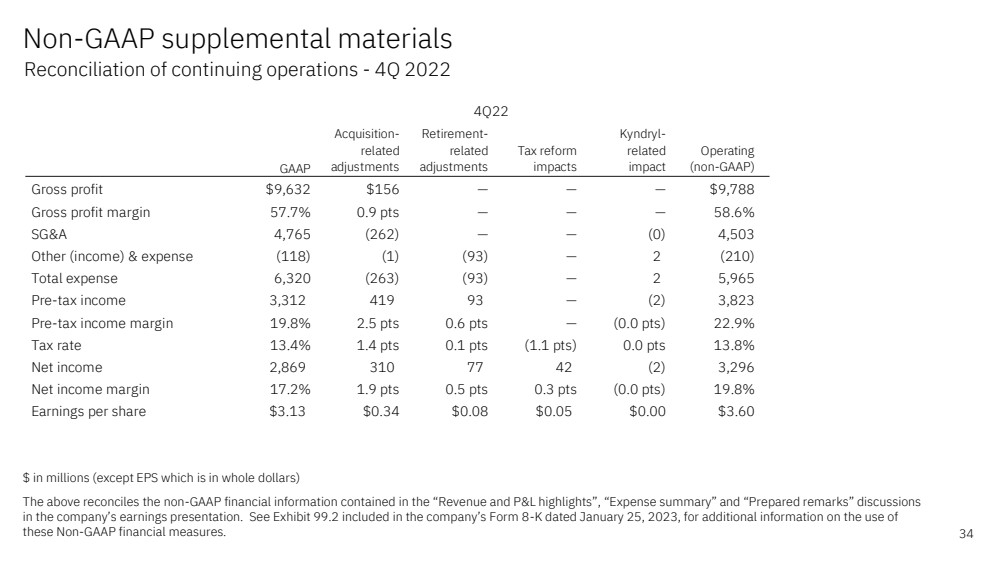
34 Non - GAAP supplemental materials $ in millions (except EPS which is in whole dollars) The above reconciles the non - GAAP financial information contained in the “Revenue and P&L highlights”, “Expense summary” and “Pr epared remarks” discussions in the company’s earnings presentation. See Exhibit 99.2 included in the company’s Form 8 - K dated January 25, 2023, for additio nal information on the use of these Non - GAAP financial measures .. Reconciliation of continuing operations - 4Q 2022 GAAP Acquisition- related adjustments Retirement- related adjustments Tax reform impacts Kyndryl- related impact Operating (non-GAAP) Gross profit $9,632 $156 — — — $9,788 Gross profit margin 57.7% 0.9 pts — — — 58.6% SG&A 4,765 (262) — — (0) 4,503 Other (income) & expense (118) (1) (93) — 2 (210) Total expense 6,320 (263) (93) — 2 5,965 Pre-tax income 3,312 419 93 — (2) 3,823 Pre-tax income margin 19.8% 2.5 pts 0.6 pts — (0.0 pts) 22.9% Tax rate 13.4% 1.4 pts 0.1 pts (1.1 pts) 0.0 pts 13.8% Net income 2,869 310 77 42 (2) 3,296 Net income margin 17.2% 1.9 pts 0.5 pts 0.3 pts (0.0 pts) 19.8% Earnings per share $3.13 $0.34 $0.08 $0.05 $0.00 $3.60 4Q22 |
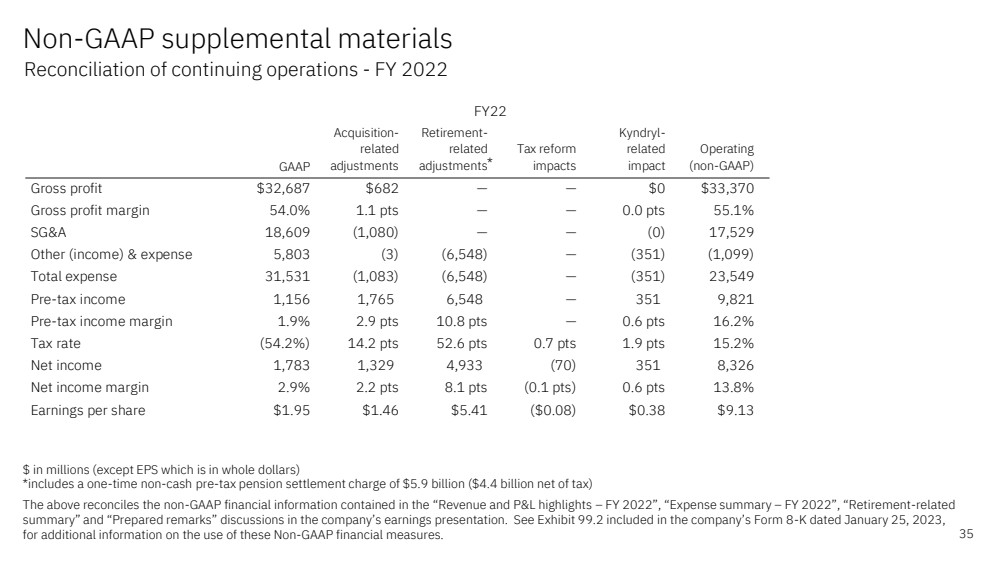
35 Non - GAAP supplemental materials $ in millions (except EPS which is in whole dollars) *includes a one - time non - cash pre - tax pension settlement charge of $5.9 billion ($4.4 billion net of tax) The above reconciles the non - GAAP financial information contained in the “Revenue and P&L highlights – FY 2022”, “Expense summar y – FY 2022”, “Retirement - related summary” and “Prepared remarks” discussions in the company’s earnings presentation. See Exhibit 99.2 included in the company’s Form 8 - K dated January 25, 2023, for additional information on the use of these Non - GAAP financial measures .. Reconciliation of continuing operations - FY 2022 GAAP Acquisition- related adjustments Retirement- related adjustments Tax reform impacts Kyndryl- related impact Operating (non-GAAP) Gross profit $32,687 $682 — — $0 $33,370 Gross profit margin 54.0% 1.1 pts — — 0.0 pts 55.1% SG&A 18,609 (1,080) — — (0) 17,529 Other (income) & expense 5,803 (3) (6,548) — (351) (1,099) Total expense 31,531 (1,083) (6,548) — (351) 23,549 Pre-tax income 1,156 1,765 6,548 — 351 9,821 Pre-tax income margin 1.9% 2.9 pts 10.8 pts — 0.6 pts 16.2% Tax rate (54.2%) 14.2 pts 52.6 pts 0.7 pts 1.9 pts 15.2% Net income 1,783 1,329 4,933 (70) 351 8,326 Net income margin 2.9% 2.2 pts 8.1 pts (0.1 pts) 0.6 pts 13.8% Earnings per share $1.95 $1.46 $5.41 ($0.08) $0.38 $9.13 FY22 * |
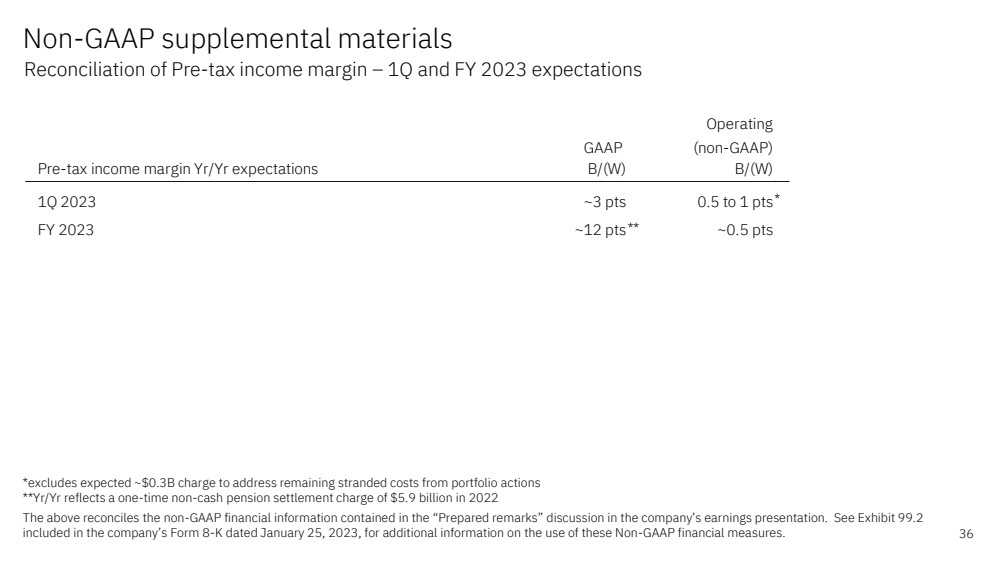
36 Non - GAAP supplemental materials *excludes expected ~$0.3B charge to address remaining stranded costs from portfolio actions ** Yr / Yr reflects a one - time non - cash pension settlement charge of $5.9 billion in 2022 The above reconciles the non - GAAP financial information contained in the “Prepared remarks” discussion in the company’s earnings presentation. See Exhibit 99.2 included in the company’s Form 8 - K dated January 25, 2023, for additional information on the use of these Non - GAAP financial mea sures .. Reconciliation of Pre - tax income margin – 1Q and FY 2023 expectations Operating GAAP (non-GAAP) Pre-tax income margin Yr/Yr expectations B/(W) B/(W) 1Q 2023 ~3 pts 0.5 to 1 pts FY 2023 ~12 pts ~0.5 pts ** * |
ibm.com /investor |
A_'WQAXAU[XK?#'X6>'O$%YX2L_%D=]J&HZYIH07@M
MK:-6\BW=U81LY<9?!( XZUY9\1?@AHO@;]HSX.V?B?4-4^*WA[Q%+?:9#IWC
MF9=3DTNY2);A;JWD90PSY(5@V< \$5T_[;NHZ+INN?"BWUFZOO!]C_:5Q)#X
MXT6WFGOM'E2$;884B#?ZY2RDNCQA5.4/!&=\(_&WP5_X6GI.M:S\8]:\>>.F
M1M/T:Y\9P&PBMO-P&CM8Q:V\(DDP 3@NW0'G% '9:QJ'B+]H'XX>,/!.F^+M
M6\&>"_!,=K#J,WAV1(+_ %*_GC,HC\\JQBBCCVY"89F;K@4:+J/B+]G_ ..7
MA'P1J?B[5O&G@OQM%=1Z;-XAD2>_TV_MT$IC\]54RQ21[L!\LK+UP:R-(\5:
M)^S7^TO\2W\ A:=X8T'6-*\8#2]3AUN26PN;4R1M;3B)))9%57;SC 8P"2H!VX
M4-74:S=S^.FOW7_A(]/TA/#>G0S3S:#>R)]H2[+21/;[4>4%0%E5#G8S F@#
MZ&FOXX+ZVM&CG:2X5V5TA=HUVXSN<#:I.> Q&><9P:E6"-)7D6-5D?&YPH!;
M'3)[U\U+;:_?>'+6+2?#]YIEI;Z?XAMXETJTNK>WG)AC\B6."0;X0[%@D9[J
M=A((-)XJ\$:]X>TVZM_"VG7NFVM[H.ERZIY%I/,)I%NU^U%D1E>2 WTX>"KY=)
MXMV5T:R\YI# S$-NRL8E4'!YRS48[G9X6UN3PU=2ZG%86T5MX9N]*U"81%+A
M\/:7@Q]ED92&82KNV! VU0: /H9O">G2>*7\0/$9-0:T2RRYR@C21I%('][<
MQYK7=%D1D=0RL,%6&017C'Q@DT)_BKX2MO$]G BHH YOQ3X TGQ=>V=[=F]M;^T1XHKS3;Z:TF$;E2\9:)E)4E%.#
MGE01@C-3>#/ VB?#[26TO0+-K#3S(TPM_/DD16;[Q4.QVY.6(& 6+,>6).]1
M0 4444 %%%% !1110 4444 %%%% !1110 4444 %%%% !1110 5PGQ(^&<'Q
M$UWP?+?VME?:3I-[/ :\O$5\32J/DI\T;?.]_\O(Z:<* 6<,?D'
M3G.UK_PMTKQ$?%!N;B\3_A(K:WM;KRG0;$AW;3'E3@G>Z%X;O;JTG=]=>*]G%N TC1P_93'D@G :49QR177W7Q;\&Z9I>BW^J>)
M=+T:'6+9+JR74[N.W>6-E!!"NP_O+GT)%:>S@9>VJ'HG]K0_W7_(?XT?VM#_
M '7_ "'^-<[#K.GW,UW%%?6TLMH%:X1)E+0AEW*7 /RY7D9ZCFL/5/BGX,T1
MM.74/%FB61U&-9K/[1J$2?:(VX5TRWS*20 PX.13]E$7MIG??VM#_=?\A_C1
M_:T/]U_R'^-<)XE^)GA'P9.(-?\ %&CZ+.55_*O[^*%MK9VMAF!VG:W/3Y3Z
M5M1ZO837D=I'>V\EW)!]I2!95+M%D#S N E
M0,[=IW8 .X9] ^$=A'JGC_6O$BZUXEUR1].@L)+S5M&33;:0+([JJKY,3R.
MFYLMM*@/C.<@>Q446#FTL>'Z#JUCX*UKQSHOB;0-4U6^UCQ ][;)!HTUW%J$
M$BQ"'$@0Q#RPH4[V79Y>3@$$\'\0M5\1ZS+?VT\6M6ES8>+K6Z'AW1O"TLD3
MVD-]$WVMKD0L96:)?,+1N#GY=I((KZLHHL/F/FOQUX?UK6[#XS:18:?J\=U?
M:KI^J0,FFR%+RSCALO.6)W3RI'(BE7RLDDC!7!K/\1Z99>(M!\>Z[
*-&M]=\/E5MGTG1)(XKU.5872/<,7 5I/+"E3&SE@S E3ZAXSTOQ
M'J5I:OX9UVWT2_MYA(RWMB+NVNDP08Y%#(XZ@AD=2"!G<,J0#S30?B)H/A'P
MU>S^&-
LJ$I+L9595DV.5RJY
MP< 8Q7SW:_%^^EU>[N-+UTQ0ZKX>UN[6WN=?^VWD=Q %:$O:^6J6DBCS?W<9
M.0IW E": /K&JMOJEI=WMW9PW,4MU:;/M$*."\6X97<.V1R*^==?\0ZWX-MY
M+>W\1:I]BO\ 1-*U#4+Z\NC,]D);Q8KJYC9\^4/*9B0,(FW<%7!KK_@Y)IJ>
M-?B6= U=_$%G&]B(9Y;\WOS?9C\GG,S,^#_>8D9QGC /9:;)(L2%W8(@Y+,
M< 5\QVGQ U"+PU8W^E^*;K4O$5[X=U*\\0V;7GG?V=<1VQ=7$)R+8QS?N@H"
M@Y.0Q&1B>/-:M]9\!:U9Z9XPO]>TRX\)C4]8E75FF^R7:RP[&+AOW/F*T^8A
MM3$60HP<@'UA#J5I<7US917,4EW;*C30*X+QA\["PZC.TX]<&K-?/_B?Q+J$
MFO7FD:9XBO3H[7OARV@N;:ZWNT%Q)*)2LW)/F*JY<'/<$'FH=/EU;1-2DNX_
M$>M71TWQO#H,$-W?/+&;&419BD5CB1@9B1*^9!M7YL @@'ONG:E::O:+=6-S
M%=VS,RB6%PRDJQ5AD>C @^X-6:^7+CX@6>O0>%M'U#Q]-X?\1W<]U/=WDNM_
M8T@L8[Z9%Q&759)9-@B0$'A68YV8.I\-_%OB?6_'^FR7FNZ9!J,NJW]OJ>CR
M:_--/]GC,H2-=/\ LX2 IMA82!QN!^9GWK0!]'T444 %%%% !1110!YAJO\
MRO75QXF\4:KJ
M5WIVMWG@*77[)KR&73;H+<6HT]ER("@>2$7'E[P%*\98$ UZ#\!-+CTKP]XA
M6VTV[TO3YM?O)K*"\MI;=C S+L94D 8(1]WCI@#&* /3:8((UE:41J)6 #.
M-Q Z FGT4 %%%% !1110 4444 >8:K_RG.MNZ>=;LK1N)6B,H)906P_//0$@R^%_AJ- \4S^(+S7=0U[4WLQ
MIZ37T=NA2 /OP3#$F]L@?,V< <8RQ(!C2_&ZTLOB-'X4NX-/CEN))X;=+?5X
M9[P/%$TI::V49B1E1MK;B>FY5S53Q'\;I8O!%IJFC:29=1U+PO=>(K.*ZF"Q
MQB)(FV.0#D_O@>.NTCC-7++X&V=EK5E=KXAU?[%8ZI
<4 >ST444 %%%% !1110 4444 %%%% 'F&J_P#)S7A;_L4-7_\ 2W3:]/KS
M#5?^3FO"W_8H:O\ ^ENFUZ?0 4444 %%%% !1110 4444 %%%% !1110!\7?
M\%%]28:1X:L0WR/
]?,.I
MV?CKQ5X5.LZQ:WNGF'4+'1]1L[K3KBY2:TMUD^T3_9HW1Y8I;EP3M/S11@_,
MN0=GPQX&NK^3P=9S_;]3\-MKE_.8$TNZTRTM[?[(1''Y+RNP@\T$H)"%)8!5
MVA<@'T149@C,RRF-3*HVARHW >F:^?=*\):GHDVB>(K;0M1EU]O%&L+>2A9%
MGGL6^VM%&[GD0DK!LS\H)0KR>>%LK/7KC2_$\6E:1J%E'JWA8,]KI&@ZC9>7
M?B92R22RLQFN CL#+\K-@]<< 'U[%!' &$<:QAB6(0 9)ZGZT20QS%#)&KE&
MW*6 .T^H]#7SYXI\'R>'/$>L6-GHM[#X!:_TFZU"QL+65X9HBERMQMC0$N-Z
MVIE50
2^M'A$CM+&?E+ 9PJMG'
MJ/6OU.K\(XTKQK9I:#ORQ2_%O]3[;)X.&&UZMA1117P9[@4444 %%%% !111
M0 4444 %%%% !1110 4444 %%%% !1110 4444 %%%% !1110 4444 %%%%
M!1110 4444 %9^M>(-+\-V9N]6U*STNU'6>]G6%!_P "8@5H5Q/C7PM
A:Q!XAT6PU2V65+:]@2XB$R;'V.H9=RGH<$<4 7J*** "BBB@ HHHH *
M*** /,-5_P"3FO"W_8H:O_Z6Z;7I]>8:K_RR45XWX#_:.36O'MOX$
M\:>#]7^''C&[A>XT^SU62&XM=2C09?[-
)K3P\FA)=Z?:>$/MCSBX$L@FEN%LE,P4*(MAD'E'YP
2=8XPRYG.V,[BN%
M7
GBG5[J;2?#