UNITED STATES | ||||
SECURITIES AND EXCHANGE COMMISSION | ||||
WASHINGTON, D.C. 20549 | ||||
FORM 10-K | ||||
( x ) | ANNUAL REPORT PURSUANT TO SECTION 13 OR 15(d) OF THE SECURITIES EXCHANGE ACT OF 1934 | |||
FOR THE FISCAL YEAR ENDED DECEMBER 31, 2018 | ||||
OR | ||||
( ) | TRANSITION REPORT PURSUANT TO SECTION 13 OR 15(d) OF THE SECURITIES EXCHANGE ACT OF 1934 | |||
For the transition period from to | ||||
COMMISSION FILE NUMBER 1-07094 | ||||
EASTGROUP PROPERTIES, INC.
(EXACT NAME OF REGISTRANT AS SPECIFIED IN ITS CHARTER)
MARYLAND | 13-2711135 |
(State or other jurisdiction | (I.R.S. Employer |
of incorporation or organization) | Identification No.) |
400 W PARKWAY PLACE | |
SUITE 100 | |
RIDGELAND, MISSISSIPPI | 39157 |
(Address of principal executive offices) | (Zip code) |
Registrant’s telephone number: (601) 354-3555 | |
SECURITIES REGISTERED PURSUANT TO SECTION 12(b) OF THE ACT: | |
Title of each class | Name of exchange on which registered |
Common Stock, $.0001 par value | New York Stock Exchange |
SECURITIES REGISTERED PURSUANT TO SECTION 12(g) OF THE ACT: NONE | |
Indicate by check mark if the Registrant is a well-known seasoned issuer, as defined in Rule 405 of the Securities Act. YES (x) NO ( )
Indicate by check mark if the Registrant is not required to file reports pursuant to Section 13 or Section 15(d) of the Exchange Act. YES ( ) NO (x)
1
Indicate by check mark whether the Registrant (1) has filed all reports required to be filed by Section 13 or 15(d) of the Securities Exchange Act of 1934 during the preceding 12 months (or for such shorter period that the Registrant was required to file such reports), and (2) has been subject to such filing requirements for the past 90 days. YES (x) NO ( )
Indicate by check mark whether the Registrant has submitted electronically every Interactive Data File required to be submitted pursuant to Rule 405 of Regulation S-T during the preceding 12 months (or for such shorter period that the registrant was required to submit such files). YES (x) NO ( )
Indicate by check mark if disclosure of delinquent filers pursuant to Item 405 of Regulation S-K is not contained herein, and will not be contained, to the best of Registrant's knowledge, in definitive proxy or information statements incorporated by reference in Part III of this Form 10-K or any amendment to this Form 10-K. (x)
Indicate by check mark whether the Registrant is a large accelerated filer, an accelerated filer, a non-accelerated filer, a smaller reporting company, or an emerging growth company. See definitions of “large accelerated filer,” “accelerated filer,” “smaller reporting company,” and "emerging growth company" in Rule 12b-2 of the Exchange Act.
Large Accelerated Filer (x) | Accelerated Filer ( ) | Non-accelerated Filer ( ) | ||
Smaller Reporting Company ( ) | Emerging Growth Company ( ) | |||
If an emerging growth company, indicate by check mark if the registrant has elected not to use the extended transition period for complying with any new or revised financial accounting standards provided pursuant to Section 13(a) of the Exchange Act. ( )
Indicate by check mark whether the Registrant is a shell company (as defined in Rule 12b-2 of the Exchange Act). YES ( ) NO (x)
State the aggregate market value of the voting and non-voting common equity held by non-affiliates computed by reference to the price at which the common equity was last sold, or the average bid and asked price of such common equity, as of June 29, 2018, the last business day of the Registrant's most recently completed second fiscal quarter: $3,331,265,000.
The number of shares of common stock, $.0001 par value, outstanding as of February 13, 2019 was 36,479,324.
DOCUMENTS INCORPORATED BY REFERENCE
Portions of the Registrant’s Proxy Statement relating to its 2019 Annual Meeting of Stockholders are incorporated by reference into Part III. The Registrant intends to file such Proxy Statement with the Securities and Exchange Commission not later than 120 days after the end of the fiscal year ended December 31, 2018.
2
Page | ||
PART I | ||
PART II | ||
PART III | ||
PART IV | ||
3
FORWARD-LOOKING STATEMENTS
This Annual Report on Form 10-K includes “forward-looking statements” (within the meaning of the federal securities laws, Section 27A of the Securities Act of 1933, as amended (the “Securities Act”), and Section 21E of the Exchange Act of 1934, as amended (the “Exchange Act”)) that reflect EastGroup Properties, Inc.'s (the "Company" or "EastGroup") expectations and projections about the Company’s future results, performance, prospects and opportunities. The Company has attempted to identify these forward-looking statements by the use of words such as “may,” “will,” “seek,” “expects,” “anticipates,” “believes,” “targets,” “intends,” “should,” “estimates,” “could,” “continue,” “assume,” “projects,” “plans” or similar expressions. These forward-looking statements are based on information currently available to the Company and are subject to a number of known and unknown risks, uncertainties and other factors that may cause the Company’s actual results, performance or achievements to be materially different from any future results, performance or achievements expressed or implied by these forward-looking statements. These factors include, among other things, those discussed below. The Company intends for all such forward-looking statements to be covered by the safe harbor provisions for forward-looking statements contained in Section 27A of the Securities Act and Section 21E of the Exchange Act, as applicable by law. The Company does not undertake publicly to update or revise any forward-looking statements, whether as a result of changes in underlying assumptions or new information, future events or otherwise, except as may be required to satisfy the Company’s obligations under federal securities law.
The following are some, but not all, of the risks, uncertainties and other factors that could cause the Company’s actual results to differ materially from those presented in the Company’s forward-looking statements (the Company refers to itself as "we," "us" or "our" in the following):
• | international, national, regional and local economic conditions; |
• | the general level of interest rates and ability to raise equity capital on attractive terms; |
• | financing risks, including the risks that our cash flows from operations may be insufficient to meet required payments of principal and interest and we may be unable to refinance our existing debt upon maturity or obtain new financing on attractive terms or at all; |
• | the competitive environment in which the Company operates; |
• | fluctuations of occupancy or rental rates; |
• | potential defaults (including bankruptcies or insolvency) on or non-renewal of leases by tenants; |
• | potential changes in the law or governmental regulations and interpretations of those laws and regulations, including changes in real estate laws or real estate investment trust (“REIT”) or corporate income tax laws, and potential increases in real property tax rates; |
• | our ability to maintain our qualification as a REIT; |
• | acquisition and development risks, including failure of such acquisitions and development projects to perform in accordance with projections; |
• | natural disasters such as fires, floods, tornadoes, hurricanes and earthquakes; |
• | the terms of governmental regulations that affect us and interpretations of those regulations, including the costs of compliance with those regulations, changes in real estate and zoning laws and increases in real property tax rates; |
• | credit risk in the event of non-performance by the counterparties to the interest rate swaps; |
• | lack of or insufficient amounts of insurance; |
• | litigation, including costs associated with prosecuting or defending claims and any adverse outcomes; |
• | our ability to retain key personnel; |
• | the consequences of future terrorist attacks or civil unrest; and |
• | environmental liabilities, including costs, fines or penalties that may be incurred due to necessary remediation of contamination of properties presently owned or previously owned by us. |
All forward-looking statements should be read in light of the risks identified in Part I, Item 1A. Risk Factors within the Company's Annual Report on Form 10-K for the year ended December 31, 2018. In addition, the Company's current and continuing qualification as a real estate investment trust, or REIT, involves the application of highly technical and complex provisions of the Internal Revenue Code of 1986, as amended, or the Code, and depends on the Company's ability to meet the various requirements imposed by the Code through actual operating results, distribution levels and diversity of stock ownership.
4
PART I
ITEM 1. BUSINESS.
The Company
EastGroup Properties, Inc., which we refer to in this Annual Report as the "Company" or "EastGroup," is an internally-managed equity real estate investment trust ("REIT") first organized in 1969. EastGroup is focused on the development, acquisition and operation of industrial properties in major Sunbelt markets throughout the United States, primarily in the states of Florida, Texas, Arizona, California and North Carolina. EastGroup’s strategy for growth is based on ownership of premier distribution facilities generally clustered near major transportation features in supply-constrained submarkets. EastGroup is a Maryland corporation, and its common stock is publicly traded on the New York Stock Exchange (“NYSE”) under the symbol “EGP.” The Company has elected to be taxed and intends to continue to qualify as a REIT under the Internal Revenue Code of 1986, as amended (the "Code").
Available Information
The Company maintains a website at www.eastgroup.net. The Company posts its annual reports on Form 10-K, quarterly reports on Form 10-Q, current reports on Form 8-K and amendments to those reports filed or furnished pursuant to Section 13(a) of the Securities Exchange Act of 1934, as amended, as soon as reasonably practicable after it electronically files or furnishes such materials to the Securities and Exchange Commission (the "SEC"). In addition, the Company's website includes items related to corporate governance matters, including, among other things, the Company's corporate governance guidelines, charters of various committees of the Board of Directors, and the Company's code of business conduct and ethics applicable to all employees, officers and directors. The Company intends to disclose on its website any amendment to, or waiver of, any provision of this code of business conduct and ethics applicable to the Company's directors and executive officers that would otherwise be required to be disclosed under the rules of the SEC or the New York Stock Exchange. Copies of these reports and corporate governance documents may be obtained, free of charge, from the Company's website. Any shareholder also may obtain copies of these documents, free of charge, by sending a request in writing to: Investor Relations, EastGroup Properties, Inc., 400 W. Parkway Place, Suite 100, Ridgeland, MS 39157.
The SEC also maintains a website that contains reports, proxy and information statements, and other information we file with the SEC at www.sec.gov.
Administration
EastGroup maintains its principal executive office and headquarters in Ridgeland, Mississippi. The Company also has regional offices in Atlanta, Dallas and Los Angeles and asset management offices in Orlando, Charlotte, Houston and Phoenix. EastGroup has property management offices in Jacksonville, Tampa, Ft. Lauderdale and San Antonio. Offices at these locations allow the Company to provide property management services to all of its Florida, Texas (except Austin and El Paso), Arizona and North Carolina properties, which together account for 77% of the Company’s total portfolio on a square foot basis. In addition, the Company currently provides property administration (accounting of operations) for its entire portfolio. The regional offices in Georgia, Texas and California provide oversight of the Company's development program. As of February 13, 2019, EastGroup had 72 full-time employees and 3 part-time employees.
Business Overview
EastGroup's goal is to maximize shareholder value by being a leading provider in its markets of functional, flexible and quality business distribution space for location sensitive customers (primarily in the 15,000 to 50,000 square foot range). The Company develops, acquires and operates distribution facilities, the majority of which are clustered around major transportation features in supply-constrained submarkets in major Sunbelt regions. The Company's core markets are in the states of Florida, Texas, Arizona, California and North Carolina.
As of December 31, 2018, EastGroup owned 377 industrial properties and one office building in 10 states. As of that same date, the Company's portfolio, including development projects and value-add properties in lease-up and under construction, included approximately 41.5 million square feet consisting of 335 business distribution buildings containing 36.4 million square feet, 14 bulk distribution buildings containing 3.7 million square feet, and 28 business service buildings containing 1.4 million square feet. As of December 31, 2018, EastGroup's operating portfolio was 97.3% leased to approximately 1,500 tenants, with no single tenant accounting for more than approximately 1.1% of the Company's income from real estate operations. As of February 13, 2019, the properties development and value-add program at year-end were approximately 45% leased.
During 2018, EastGroup increased its holdings in real estate properties through its acquisition and development programs. The Company purchased 627,000 square feet of operating and value-add properties and 83 acres of land for a total of $87 million. Also during 2018, the Company began construction of 12 development projects containing 1.7 million square feet and transferred 14
5
projects, which contain 1.7 million square feet and had costs of $135.0 million at the date of transfer, from its development and value-add program to real estate properties.
During 2018, EastGroup completed dispositions including 339,000 square feet of operating properties and 11 acres of land, which generated gross proceeds of $25.4 million.
Typically, the Company initially funds its development and acquisition programs through its unsecured bank credit facilities. In June 2018, the Company expanded the borrowing capacity under its credit facilities from $335 million to $395 million. As market conditions permit, EastGroup also issues equity or employs fixed-rate debt, including variable-rate debt that has been swapped to an effectively fixed rate through the use of interest rate swaps, to replace short-term bank borrowings. In June 2018, Moody's Investors Service affirmed the Company's issuer rating of Baa2 with a stable outlook. A security rating is not a recommendation to buy, sell, or hold securities and may be subject to revision or withdrawal at any time by the assigning rating agency. Each rating should be evaluated independently of any other rating. For future debt issuances, the Company intends to issue primarily unsecured fixed-rate debt, including variable-rate debt that has been swapped to an effectively fixed rate through the use of interest rate swaps. The Company may also access the public debt market in the future as a means to raise capital.
EastGroup holds its properties as long-term investments but may determine to sell certain properties that no longer meet its investment criteria. The Company may provide financing to a prospective purchaser in connection with such sales of property if market conditions require. In addition, the Company may provide financing to a partner or co-owner in connection with an acquisition of real estate in certain situations.
Subject to the requirements necessary to maintain EastGroup’s qualifications as a REIT, the Company may acquire securities of entities engaged in real estate activities or securities of other issuers, including for the purpose of exercising control over those entities.
The Company intends to continue to qualify as a REIT under the Code. To maintain its status as a REIT, the Company is required to, among other things, distribute at least 90% of its ordinary taxable income to its stockholders. If the Company has a capital gain, it has the option of (i) deferring recognition of the capital gain through a tax-deferred exchange, (ii) declaring and paying a capital gain dividend on any recognized net capital gain resulting in no corporate level tax, or (iii) retaining and paying corporate income tax on its net long-term capital gain, with shareholders reporting their proportional share of the undistributed long-term capital gain and receiving a credit or refund of their share of the tax paid by the Company.
EastGroup has no present intention of acting as an underwriter of offerings of securities of other issuers. The strategies and policies set forth above were determined and are subject to review by EastGroup's Board of Directors, which may change such strategies or policies based upon its evaluation of the state of the real estate market, the performance of EastGroup's assets, capital and credit market conditions, and other relevant factors. EastGroup provides annual reports to its stockholders, which contain financial statements audited by the Company’s independent registered public accounting firm.
Competition
The market for the leasing of industrial real estate is competitive. We experience competition for tenants from other existing assets in proximity to our buildings as well as from new development. Institutional investors, other REITs and local real estate operators generally own such properties; however, no single competitor or small group of competitors is dominant in our current markets. Even so, as a result of competition, we may have to provide concessions, incur charges for tenant improvements or offer other inducements, all of which may have an adverse impact on our results of operations. The market for the acquisition of industrial real estate is also competitive. We compete for real property investments with other REITs and institutional investors such as pension funds and their advisors, private real estate investment funds, insurance company investment accounts, private investment companies, individuals and other entities engaged in real estate investment activities.
Environmental Property Matters
Under various federal, state and local laws, ordinances and regulations, an owner of real estate may be liable for the costs of removal or remediation of certain hazardous or toxic substances on or in such property. Many such laws impose liability without regard to whether the owner knows of, or was responsible for, the presence of such hazardous or toxic substances. The presence of such substances, or the failure to properly remediate such substances, may adversely affect the owner’s ability to sell or rent such property or to use such property as collateral in its borrowings. EastGroup’s properties have been subjected to Phase I Environmental Site Assessments (ESAs) by independent environmental consultants and, as necessary, have been subjected to Phase II ESAs. These reports have not revealed any potential significant environmental liability. Management of EastGroup is not aware of any environmental liability that would have a material adverse effect on EastGroup’s business, assets, financial position or results of operations. See "Item 1A. Risk Factors" in this Annual Report for additional information.
6
Environmental, Social and Governance (ESG) Matters
At EastGroup, protecting the environment is important to the Company's employees, families, customers and communities. The Company strives to support sustainability through its commitment to build high performance and environmentally responsible properties. Through EastGroup’s continued efforts, numerous properties have been Leadership in Energy and Environmental Design (LEED) and ENERGY STAR certified with the remainder reflecting the Company’s commitment to pursue environmentally conscious performance and standards. The Company's continued commitment to sustainability best practices creates long-term value for the environment, the Company and shareholders.
EastGroup and its employees are committed to social responsibility and participate in various charitable service organizations in the Company's business communities. EastGroup's employees volunteer for numerous charities, and the Company coordinates volunteer opportunities for its employees and allows time away from work in order to encourage participation and increase social engagement in all of the communities in which we operate.
SUPPLEMENTAL MATERIAL U.S. FEDERAL INCOME TAX CONSIDERATIONS
This summary updates and supersedes the discussion contained under the caption “Material United States Federal Income Tax Considerations” in (i) the prospectus within our Registration Statement on Form S-3 filed with the SEC on March 6, 2017 (the “Prospectus”) and (ii) the prospectus supplement that supplements the Prospectus filed with the SEC on February 15, 2018, and should be read in conjunction therewith and is subject to qualifications set forth therein.
The following summary addresses U.S. federal income tax considerations related to our election to be subject to taxation as a REIT and the ownership and disposition of our common stock or preferred stock that we anticipate being material to holders of such securities. Except to the limited extent discussed below, this summary does not address any foreign, state, or local tax consequences of holding our common stock, or preferred stock. The provisions of the Internal Revenue Code of 1986, as amended (the “Code”) concerning the U.S. federal income tax treatment of a REIT and its shareholders and security holders are highly technical and complex; the following discussion sets forth only certain aspects of those provisions. This summary is intended to provide you with general information only, it is not intended as a substitute for careful tax planning, and it is not tax advice.
This summary is based on provisions of the Code, applicable final and temporary Treasury Regulations, judicial decisions, and administrative rulings and practice, all in effect as of the date of this prospectus, and should not be construed as legal or tax advice. No assurance can be given that future legislative or administrative changes or judicial decisions will not affect the accuracy of the descriptions or conclusions contained in this summary. In addition, any such changes may be retroactive and apply to transactions entered into prior to the date of their enactment, promulgation or release. We do not expect to seek a ruling from the IRS regarding any of the U.S. federal income tax issues discussed in this prospectus, and no assurance can be given that the IRS will not challenge any of the positions we take and that such a challenge will not succeed. This discussion does not purport to address all aspects of U.S. federal income taxation that may be relevant to you in light of your particular investment circumstances, or if you are a type of investor subject to special tax rules. This discussion also does not consider tax considerations that may be relevant with respect to securities we may issue, or selling security holders may sell, other than our common stock and preferred stock described below. Each time we or selling security holders sell securities, we will provide a prospectus supplement that will contain specific information about the terms of that sale and may add to or update the discussion below as appropriate.
PROSPECTIVE PURCHASERS OF OUR SECURITIES ARE URGED TO CONSULT THEIR TAX ADVISORS PRIOR TO ANY INVESTMENT IN OUR COMMON STOCK OR PREFERRED STOCK CONCERNING THE POTENTIAL U.S. FEDERAL, STATE, LOCAL AND FOREIGN TAX CONSEQUENCES OF THE INVESTMENT WITH SPECIFIC REFERENCE TO THEIR OWN TAX SITUATIONS. PROSPECTIVE PURCHASERS ALSO ARE URGED TO REFER TO THE APPLICABLE PROSPECTUS SUPPLEMENT FOR ANY AMENDMENTS OR CHANGES TO THIS SUMMARY.
Except as otherwise noted, references in this discussion of “Supplemental Material U.S. Federal Income Tax Considerations” to “we,” “our,” “us” and “our company” refer to EastGroup Properties, Inc.
Taxation of our Company
We have elected to be taxed as a REIT under Sections 856 through 860 of the Code. We believe that we have been organized and operated in conformity with the requirements for qualification and taxation as a REIT under the Code beginning with our taxable year ended November 30, 1969 and that our intended manner of operation will enable us to continue to meet the requirements for qualification and taxation as a REIT for U.S. federal income tax purposes.
7
In connection with the filing of this prospectus, our tax counsel, Goodwin Procter LLP, is rendering an opinion to us to the effect that, commencing with our taxable year ended December 31, 2014, we have been organized in conformity with the requirements for qualification and taxation as a REIT under the Code and our prior, current and proposed ownership, organization and method of operations have allowed and will continue to allow us to satisfy the requirements for qualification and taxation as a REIT under the Code commencing with our taxable year ended December 31, 2014 and for subsequent taxable years. The opinion of Goodwin Procter LLP is based upon various assumptions and our representations as to our past and contemplated future ownership, investments, distributions, share valuations and operations, among other things. The opinion of Goodwin Procter LLP is expressly conditioned upon the accuracy of these and other assumptions and upon our representations, which Goodwin Procter LLP has not verified and will not verify. Moreover, our qualification and taxation as a REIT will depend upon our ability to meet, through actual annual operating results, distribution levels, and diversity of stock ownership, the various and complex REIT qualification tests imposed under the Code, the results of which have not been and will not be reviewed or verified by Goodwin Procter LLP. See “-Qualification as a REIT” below. Accordingly, no assurance can be given that we have satisfied or will satisfy the requirements for qualification and taxation as a REIT. The opinion of Goodwin Procter LLP is based upon the law in effect as of the date of the opinion (or, with respect to past years, the law in effect for such years), which is subject to change either prospectively or retroactively. Opinions of counsel impose no obligation on counsel to advise us or the holders of our stock of any subsequent change in the matters stated, represented or assumed, or of any subsequent change in the applicable law. Changes in applicable law could modify the conclusions expressed in the opinion. Unlike a ruling from the IRS, an opinion of Goodwin Procter LLP is not binding on the IRS and no assurance can be given that the IRS could not successfully challenge our qualification as a REIT.
If we qualify as a REIT, we generally will be allowed to deduct dividends paid to our shareholders, and, as a result, we generally will not be subject to U.S. federal income tax on that portion of our ordinary income and net capital gain that we currently distribute to our shareholders. We intend to make distributions to our shareholders on a regular basis as necessary to avoid material U.S. federal income tax and to comply with the REIT requirements. See “—Qualification as a REIT—Annual Distribution Requirements” below.
Notwithstanding the foregoing, even if we qualify for taxation as a REIT, we nonetheless may be subject to U.S. federal income tax or excise tax in certain circumstances, including the following:
Ÿ | we will be required to pay U.S. federal income tax on our undistributed REIT taxable income, including net capital gain; |
Ÿ | we may be subject to tax at the highest U.S. federal corporate income tax rate on certain income from “foreclosure property” (generally, property acquired by reason of default on a lease or indebtedness held by us); |
Ÿ | we will be subject to a 100% U.S. federal income tax on net income from “prohibited transactions” (generally, certain sales or other dispositions of property, sometimes referred to as “dealer property,” held primarily for sale to customers in the ordinary course of business, other than foreclosure property) unless the gain is realized in a “taxable REIT subsidiary,” or TRS, or such property has been held by us for at least two years and certain other requirements are satisfied; |
Ÿ | if we fail to satisfy either the 75% gross income test or the 95% gross income test (discussed below), but nonetheless maintain our qualification as a REIT pursuant to certain relief provisions, we will be subject to a 100% U.S. federal income tax on the greater of (i) the amount by which we fail the 75% gross income test or (ii) the amount by which we fail the 95% gross income test, in either case, multiplied by a fraction intended to reflect our profitability; |
Ÿ | if we fail to satisfy any of the asset tests, and the failure is not a failure of the 5% or the 10% asset test that qualifies under the De Minimis Exception but the failure does qualify under the General Exception, both as described below under “-Qualification as a REIT-Asset Tests,” then we will have to pay an excise tax equal to the greater of (i) $50,000 and (ii) an amount determined by multiplying the net income generated during a specified period by the assets that caused the failure by the highest U.S. federal corporate income tax rate; |
Ÿ | if we fail to satisfy any REIT requirements other than the gross income test or asset test requirements, described below under “-Qualification as a REIT-Income Tests” and “-Qualification as a REIT-Asset Tests,” respectively, and we qualify for a reasonable cause exception, then we will have to pay a penalty equal to $50,000 for each such failure; |
Ÿ | we will be subject to a 4% excise tax on certain undistributed amounts if certain distribution requirements are not satisfied; |
8
Ÿ | we may be required to pay monetary penalties to the IRS in certain circumstances, including if we fail to meet record-keeping requirements intended to monitor our compliance with rules relating to the composition of a REIT’s shareholders, as described below in “-Recordkeeping Requirements;” |
Ÿ | if we dispose of an asset acquired by us from a C corporation in a transaction in which we took the C corporation’s tax basis in the asset, we may be subject to tax at the highest U.S. federal corporate income tax rate on the appreciation inherent in such asset as of the date of acquisition by us; |
Ÿ | we will be required to pay a 100% tax on any redetermined rents, redetermined deductions, excess interest and redetermined TRS service income. In general, redetermined rents are rents from real property that are overstated as a result of services furnished by our TRS. Redetermined deductions and excess interest generally represent amounts that are deducted by a TRS for amounts paid to us that are in excess of the amounts that would have been deducted based on arm’s-length negotiations. Redetermined TRS service income generally means the additional gross income a TRS would recognize if it were paid an arm’s length fee for services provided to, or on behalf of, us; and |
Ÿ | income earned by our TRS or any other subsidiaries that are taxable as C corporations will be subject to regular U.S. federal corporate income tax. |
No assurance can be given that the amount of any such U.S. federal income or excise taxes will not be substantial. In addition, we and our subsidiaries may be subject to a variety of taxes, including payroll taxes and state, local and foreign income, property and other taxes on assets and operations. We could also be subject to tax in situations and on transactions not presently contemplated.
Qualification as a REIT
In General
The REIT provisions of the Code apply to a domestic corporation, trust or association (i) that is managed by one or more trustees or directors, (ii) the beneficial ownership of which is evidenced by transferable shares or by transferable certificates of beneficial interest, (iii) that properly elects to be taxed as a REIT and such election has not been terminated or revoked, (iv) that is neither a financial institution nor an insurance company, (v) that uses a calendar year for U.S. federal income tax purposes, and (vi) that meets the additional requirements discussed below. The discussion below summarizes current law except where expressly noted otherwise. We do not believe any differences between the current requirements for qualification as a REIT and the requirements in effect for any prior year have prevented us from qualifying as a REIT for any period.
Ownership Tests
In order to continue to qualify as a REIT, (i) the beneficial ownership of our stock must be held by 100 or more persons during at least 335 days of a 12-month taxable year (or during a proportionate part of a taxable year of less than 12 months) for each of our taxable years and (ii) during the last half of each taxable year, no more than 50% in value of our stock may be owned, directly or indirectly, by or for five or fewer individuals (the “5/50 Test”). Stock ownership for purposes of the 5/50 Test is determined by applying the constructive ownership provisions of Section 544(a) of the Code, subject to certain modifications. The term “individual” for purposes of the 5/50 Test includes a private foundation, a trust providing for the payment of supplemental unemployment compensation benefits, and a portion of a trust permanently set aside or to be used exclusively for charitable purposes. A “qualified trust” described in Section 401(a) of the Code and exempt from tax under Section 501(a) of the Code generally is not treated as an individual; rather, stock held by it is generally treated as owned proportionately by its beneficiaries.
We believe that we have satisfied and will continue to satisfy the above ownership requirements. In addition, our charter restricts ownership and transfers of our stock that would violate these requirements, although these restrictions may not be effective in all circumstances to prevent a violation. We will be deemed to
have satisfied the 5/50 Test for a particular taxable year if we have complied with all the requirements for ascertaining the ownership of our outstanding stock in that taxable year and have no reason to know that we have violated the 5/50 Test.
Income Tests
In order to maintain qualification as a REIT, we must annually satisfy two gross income requirements:
(1) First, at least 75% of our gross income (excluding gross income from prohibited transactions and certain other income and gains as described below) for each taxable year must be derived, directly or indirectly, from investments relating to real property or mortgages on real property or from certain types of temporary investments (or any combination thereof). Qualifying income for purposes of this 75% gross income test generally includes: (a) rents from real property, (b) interest on obligations secured by mortgages on real property or on interests in real property, (c) dividends or other distributions on, and gain from the sale of, shares
9
in other REITs, (d) gain from the sale of real estate assets (but not including certain debt instruments of publicly offered REITs that are not secured by mortgages on real property or interests on real property and gain from prohibited transactions), (e) income and gain derived from foreclosure property, and (f) income from certain types of temporary investments; and
(2) Second, in general, at least 95% of our gross income (excluding gross income from prohibited transactions and certain other income and gains as described below) for each taxable year must be derived from the real property investments described above and from other types of dividends and interest, gain from the sale or disposition of stock or securities that are not dealer property, or any combination of the above.
Rents we receive will qualify as rents from real property in satisfying the gross income requirements for a REIT described above only if several conditions are met. First, the amount of rent generally must not be based in whole or in part on the income or profits of any person. However, an amount received or accrued generally will not be excluded from the term “rents from real property” solely by reason of being based on a fixed percentage or percentages of receipts or sales. Second, rents received from a “related party tenant” will not qualify as rents from real property in satisfying the gross income tests unless the tenant is a TRS and either (i) at least 90% of the property is leased to unrelated tenants and the rent paid by the TRS is substantially comparable to the rent paid by the unrelated tenants for comparable space, or (ii) the property leased is a “qualified lodging facility,” as defined in Section 856(d)(9)(D) of the Code, or a “qualified health care property,” as defined in Section 856(e)(6)(D)(i), and certain other conditions are satisfied. A tenant is a related party tenant if the REIT, or an actual or constructive owner of 10% or more of the REIT, actually or constructively owns 10% or more of the tenant. Third, if rent attributable to personal property, leased in connection with a lease of real property, is greater than 15% of the total rent received under the lease (determined based on the fair market value as of the beginning and end of the taxable year), then the portion of rent attributable to the personal property will not qualify as rents from real property.
Generally, for rents to qualify as rents from real property for the purpose of satisfying the gross income tests, we may provide directly only an insignificant amount of services, unless those services are “usually or customarily rendered” in connection with the rental of real property and not otherwise considered “rendered to the occupant” under the applicable tax rules. Accordingly, we may not provide “impermissible services” to tenants (except through an independent contractor from whom we derive no revenue and that meets other requirements or through a TRS) without giving rise to “impermissible tenant service income.” Impermissible tenant service income is deemed to be at least 150% of the direct cost to us of providing the service. If the impermissible tenant service income exceeds 1% of our total income from a property, then all of the income from that property will fail to qualify as rents from real property. If the total amount of impermissible tenant service income from a property does not exceed 1% of our total income from the property, the services will not disqualify any other income from the property that qualifies as rents from real property, but the impermissible tenant service income will not qualify as rents from real property.
We do not intend to charge significant rent that is based in whole or in part on the income or profits of any person, derive significant rents from related party tenants, derive rent attributable to personal property leased in connection with real property that exceeds 15% of the total rents from that property, or derive impermissible tenant service income that exceeds 1% of our total income from any property if the treatment of the rents from such property as nonqualified rents could cause us to fail to qualify as a REIT.
Distributions that we receive from a TRS will be classified as dividend income to the extent of the earnings and profits of the TRS. Such distributions will generally constitute qualifying income for purposes of the 95% gross income test, but not under the 75% gross income test unless attributable to investments of certain new capital during the one-year period beginning on the date of receipt of the new capital (as described below under “Qualification as a REIT-Income Tests-Qualified temporary investment income”). Any dividends received by us from a REIT will be qualifying income for purposes of both the 75% and 95% gross income tests.
If we fail to satisfy one or both of the 75% or the 95% gross income tests, we may nevertheless qualify as a REIT for a particular year if we are entitled to relief under certain provisions of the Code. Those relief provisions generally will be available if our failure to meet such tests is due to reasonable cause and not due to willful neglect and we file a schedule describing each item of our gross income for such year(s) in accordance with the applicable Treasury Regulations. It is not possible, however, to state whether in all circumstances we would be entitled to the benefit of these relief provisions. As discussed above in “-Taxation of Our Company,” even if these relief provisions were to apply, we would be subject to U.S. federal corporate income tax to the extent we fail to meet the 75% or 95% gross income tests.
Foreclosure property. Foreclosure property is real property (including interests in real property) and any personal property incident to such real property (1) that is acquired by a REIT as a result of the REIT having bid on the property at foreclosure, or having otherwise reduced the property to ownership or possession by agreement or process of law, after there was a default (or default was imminent) on a lease of the property or a mortgage loan held by the REIT and secured by the property, (2) for which the related loan or lease was made, entered into or acquired by the REIT at a time when default was not imminent or anticipated and
10
(3) for which such REIT makes an election to treat the property as foreclosure property. REITs generally are subject to tax at the highest U.S. federal corporate income tax rate on any net income from foreclosure property, including any gain from the disposition of the foreclosure property, other than income that would otherwise be qualifying income for purposes of the 75% gross income test. Any gain from the sale of property for which a foreclosure property election has been made will not be subject to the 100% tax on gains from prohibited transactions described above, even if the property is held primarily for sale to customers in the ordinary course of a trade or business.
Hedging transactions. We may enter into hedging transactions with respect to one or more of our assets or liabilities. Hedging transactions could take a variety of forms, including interest rate swaps or cap agreements, options, futures contracts, forward rate agreements or similar financial instruments. Except to the extent as may be provided by future Treasury Regulations, any income from a hedging transaction which is (1) clearly identified as such before the close of the day on which it was acquired, originated or entered into, and (2) accompanied by a substantially contemporaneous identification of the item being hedged, including gain from the disposition or termination of such a transaction, will not constitute gross income for purposes of the 75% and 95% gross income tests, provided that the hedging transaction is entered into (i) in the normal course of our business primarily to manage risk of interest rate or price changes or currency fluctuations with respect to indebtedness incurred or to be incurred by us to acquire or carry real estate assets, (ii) primarily to manage the risk of currency fluctuations with respect to any item of income or gain that would be qualifying income under the 75% or 95% gross income tests (or any property which generates such income or gain), or (iii) to hedge against transactions described in clause (i) or (ii) and is entered into in connection with the extinguishment of debt or a sale of property that is being hedged against by the transaction described in clause (i) or (ii). To the extent we enter into other types of hedging transactions or do not make proper identifications, as applicable, the income from those transactions is likely to be treated as non-qualifying income for purposes of both the 75% and 95% gross income tests. We intend to structure, monitor and document our hedging transactions so that such transactions do not jeopardize our ability to qualify as a REIT. No assurances can be given, however, that our hedging activities will not give rise to income that does not qualify for purposes of either or both of the gross income tests and that such income will not adversely affect our ability to satisfy REIT qualification requirements.
Qualified temporary investment income. Income derived from certain types of temporary stock and debt investments made with the proceeds of certain stock and debt offerings (but not including proceeds received pursuant to a dividend reinvestment plan), not otherwise treated as qualifying income for the 75% gross income test, generally will nonetheless constitute qualifying income for purposes of the 75% gross income test for the year following such an offering. More specifically, qualifying income for purposes of the 75% gross income test includes “qualified temporary investment income,” which generally means any income that is attributable to stock or a debt instrument, is attributable to the temporary investment of new equity capital and certain debt capital, and is received or accrued during the one-year period beginning on the date on which the REIT receives such new capital. After the one-year period following a qualifying equity or debt offering, income from investments of the proceeds of such offering will be qualifying income for purposes of the 75% gross income test only if derived from one of the other qualifying sources enumerated above.
Asset Tests
At the close of each quarter of each taxable year, we must also satisfy five tests relating to the nature of our assets. First, real estate assets, cash and cash items, and government securities must represent at least 75% of the value of our total assets. Real estate assets include interests in real property (such as land, buildings, leasehold interests in real property and personal property leased with real property if the rents attributable to the personal property would be rents from real property under the income tests discussed above), interests in mortgages on real property or on interest in real property, shares in other qualifying REITs, debt instruments issued by publicly offered REITs, and stock or debt instruments held for less than one year that are purchased with the proceeds from an offering of shares of our stock or certain long-term debt. Second, not more than 25% of our total assets may be represented by securities other than those in the 75% asset class. Third, of the investments that are not included in the 75% asset class and are not securities of our TRSs, (i) the value of any one issuer’s securities owned by us may not exceed 5% of the value of our total assets and (ii) we may not own more than 10% by vote or by value of any one issuer’s outstanding securities. For purposes of the 10% value test, debt instruments issued by a partnership are not classified as “securities” to the extent of our interest as a partner in such partnership (based on our proportionate share of the partnership’s equity interests and certain debt securities) or if at least 75% of the partnership’s gross income, excluding income from prohibited transactions, is qualifying income for purposes of the 75% gross income test. For purposes of the 10% value test, the term “securities” also does not include certain instruments, such as debt securities issued by another REIT, certain “straight debt” securities (for example, qualifying debt securities of a corporation of which we own no more than a de minimis amount of equity interest), loans to individuals or estates, and accrued obligations to pay rent. Fourth, securities of our TRSs cannot represent more than 20% of the value of our total assets. Fifth, not more than 25% of the value of our total assets may be represented by debt instruments of publicly offered REITs that are not secured by mortgages on real property or interest in real property. Although we believe we have met these asset tests and we intend to continue to meet them, no assurance can be given that we have met them or will be able to do so. For purposes of these asset tests, we are treated as holding our proportionate share of our subsidiary partnerships’ assets. Also, for purposes of these asset tests, pursuant to an IRS ruling, we generally may treat shares of certain money market mutual funds as “cash items.”
11
We will monitor the status of our assets for purposes of the various asset tests and will endeavor to manage our portfolio in order to comply at all times with such tests. If we fail to satisfy the asset tests at the end of a calendar quarter, other than our first calendar quarter as a REIT, we will not lose our REIT status if one of the following exceptions applies:
Ÿ | we satisfied the asset tests at the end of the preceding calendar quarter and the discrepancy between the value of our assets and the asset test requirements arose from changes in the market values of our assets and was not wholly or partly caused by the acquisition of one or more non-qualifying assets; or |
Ÿ | we eliminate any discrepancy within 30 days after the close of the calendar quarter in which it arose. |
Moreover, if we fail to satisfy the asset tests at the end of a calendar quarter during a taxable year, we will not lose our REIT status if one of the following additional exceptions applies:
Ÿ | De Minimis Exception: the failure is due to a violation of the 5% or 10% asset tests referenced above and is “de minimis” (meaning that the failure is one that arises from our ownership of assets the total value of which does not exceed the lesser of 1% of the total value of our assets at the end of the quarter in which the failure occurred and $10 million), and we either dispose of the assets that caused the failure or otherwise satisfy the asset tests within six months after the last day of the quarter in which our identification of the failure occurred; or |
Ÿ | General Exception: all of the following requirements are satisfied: (i) the failure does not qualify for the above De Minimis Exception, (ii) the failure is due to reasonable cause and not willful neglect, (iii) we file a schedule in accordance with the applicable Treasury Regulations providing a description of each asset that caused the failure, and (iv) we either dispose of the assets that caused the failure or otherwise satisfy the asset tests within six months after the last day of the quarter in which our identification of the failure occurred. A REIT that utilizes this general relief provision must pay an excise tax equal to the greater of (a) $50,000 or (b) the product of the net income generated during a specified period by the asset that caused the failure and the highest U.S. federal corporate income tax rate. |
Annual Distribution Requirements
In order to qualify as a REIT, each taxable year we must distribute dividends (other than capital gain dividends) to our shareholders in an amount at least equal to (A) the sum of (i) 90% of our “REIT taxable income” (determined without regard to the dividends paid deduction and excluding net capital gains), and (ii) 90% of the net income (after tax), if any, from foreclosure property, minus (B) the sum of certain items of non-cash income. We generally must pay such distributions in the taxable year to which they relate (or be treated as having paid such distributions in such year, as described further below under “Taxation of U.S. Shareholders -- Distributions”), or in the following taxable year if declared before we timely file our tax return for such year and if paid on or before the first regular dividend payment after such declaration. Subject to certain requirements, we may satisfy all or part of our distribution requirement by paying taxable stock dividends.
To the extent that we do not distribute all of our net capital gain and REIT taxable income, we will be subject to regular U.S. federal corporate income tax, and potentially, state and local tax, on these retained amounts. Furthermore, if we should fail to distribute during each calendar year at least the sum of (i) 85% of our “ordinary income,” as defined in Section 4981(e)(1) of the Code, for such year, (ii) 95% of our “capital gain net income,” as defined in Section 4981(e)(2) of the Code, for such year, and (iii) 100% of any corresponding undistributed amounts from prior periods, we will be subject to a 4% nondeductible federal excise tax on the excess of such required distribution over the sum of amounts actually distributed plus retained income from such taxable year on which we paid corporate income tax.
Under certain circumstances, we may be able to rectify a failure to meet the distribution requirement for a year by paying “deficiency dividends” to our shareholders in a later year that may be included in our deduction for dividends paid for the earlier year. Thus, we may be able to avoid being taxed on amounts distributed as deficiency dividends; however, we will be required to pay interest based upon the amount of any deduction taken for deficiency dividends.
For taxable years beginning before January 1, 2015, in order for our distributions to have satisfied the annual distribution requirements for REITs and provided us with a REIT-level tax deduction, the distributions must not have been “preferential dividends.” A dividend is not a preferential dividend if the distribution is (i) pro rata among all outstanding shares of stock within a particular class, and (ii) in accordance with the preferences among different classes of stock as set forth in our organizational documents. The preferential dividend rule for publicly offered REITs was repealed for distributions made in taxable years beginning after December 31, 2014. As such, we are no longer subject to these preferential dividend requirements. Any non-publicly offered REIT in which we invest would be subject to the preferential dividend rule regardless of the date of the distribution.
12
Pursuant to an IRS ruling, the prohibition on preferential dividends applicable to taxable years beginning before January 1, 2015 did not prohibit REITs from offering shares under a distribution reinvestment plan at discounts of up to 5% of fair market value, but a discount in excess of 5% of the fair market value of the shares would have been considered a preferential dividend. We believe that our distribution reinvestment plan has complied with those requirements.
We may retain and pay income tax on net long-term capital gains we received during the tax year. To the extent we so elect, (i) each shareholder must include in its income (as long-term capital gain) its proportionate share of our undistributed long-term capital gains, (ii) each shareholder is deemed to have paid, and receives a credit for, its proportionate share of the tax paid by us on the undistributed long-term capital gains, and (iii) each shareholder’s basis in its stock is increased by the included amount of the undistributed long-term capital gains less their share of the tax paid by us.
To qualify as a REIT, we may not have, at the end of any taxable year, any undistributed earnings and profits accumulated in any non-REIT taxable year. We believe that we have not had any non-REIT earnings and profits at the end of any taxable year covered by this rule, and we intend to distribute any non-REIT earnings and profits that we accumulate before the end of any taxable year in which we accumulate such earnings and profits.
Failure to Qualify
If we fail to qualify as a REIT and such failure is not an asset test or gross income test failure subject to the cure provisions described above, or for taxable years beginning before January 1, 2015 the result of preferential dividends, we generally will be eligible for a relief provision if the failure is due to reasonable cause and not willful neglect and we pay a penalty of $50,000 with respect to such failure.
If we fail to qualify for taxation as a REIT in any taxable year and no relief provisions apply, we generally will be subject to regular U.S. federal corporate income tax on our taxable income. Distributions to our shareholders in any year in which we fail to qualify as a REIT will not be deductible by us nor will they be required to be made. In such event, to the extent of our current or accumulated earnings and profits, all distributions to our shareholders will be taxable as dividend income. Subject to certain limitations in the Code, corporate shareholders may be eligible for the dividends received deduction, and individual, trust and estate shareholders may be eligible to treat the dividends received from us as qualified dividend income taxable as net capital gains, under the provisions of Section 1(h)(11) of the Code. However, non-corporate shareholders (including individuals) will not be able to deduct 20% of certain dividends they receive from us. Unless entitled to relief under specific statutory provisions, we also will be ineligible to elect to be taxed as a REIT again prior to the fifth taxable year following the first year in which we failed to qualify as a REIT under the Code.
Our qualification as a REIT for U.S. federal income tax purposes will depend on our continuing to meet the various requirements summarized above governing the ownership of our outstanding stock, the nature of our assets, the sources of our income, and the amount of our distributions to our shareholders. Although we intend to operate in a manner that will enable us to comply with such requirements, there can be no certainty that such intention will be realized. In addition, because the relevant laws may change, compliance with one or more of the REIT requirements may become impossible or impracticable for us.
Prohibited Transaction Tax
Any gain realized by us on the sale of any property held (other than foreclosure property) as inventory or other property held primarily for sale to customers in the ordinary course of business, including our share of any such gain realized by our subsidiary partnerships, will be treated as income from a “prohibited transaction” that is subject to a 100% penalty tax. Whether property is held as inventory or primarily for sale to customers in the ordinary course of a trade or business depends upon all the facts and circumstances with respect to the particular transaction. However, the Code provides a “safe harbor” pursuant to which sales of properties held for at least two years and meeting certain other requirements will not give rise to prohibited transaction income.
We generally intend to hold properties for investment, but we have made and will make sales of properties consistent with our strategic objectives. We believe our past sales in open tax years are not considered prohibited transactions. However, we have made and we may make sales at a gain that do not satisfy the safe harbor requirements described above. There can be no assurance that the IRS will not contend that one or more of these sales are subject to the 100% penalty tax. The 100% penalty tax will not apply to gains from the sale of property realized through a U.S. TRS or other U.S. taxable corporation, although such income will be subject to regular U.S. federal corporate income tax.
Recordkeeping Requirements
To avoid a monetary penalty, we must request on an annual basis information from certain of our shareholders designed to disclose the actual ownership of our outstanding stock. We intend to comply with these requirements.
13
Qualified REIT Subsidiaries and Disregarded Entities
If a REIT owns a subsidiary that is a “qualified REIT subsidiary,” or QRS, or if a REIT owns 100% of the membership interests in a domestic limited liability company or other domestic unincorporated entity that does not elect to be treated as a corporation for U.S. federal income tax purposes, the separate existence of the QRS, limited liability company or other unincorporated entity generally will be disregarded for U.S. federal income tax purposes. Generally, a QRS is a corporation, other than a TRS, all of the stock of which is owned by a REIT. All assets, liabilities, and items of income, deduction, and credit of the QRS or disregarded entity will be treated as assets, liabilities, and items of income, deduction, and credit of its owner. To the extent we own a QRS or a disregarded entity, neither will be subject to U.S. federal corporate income taxation, although such entities may be subject to state and local taxation in some states or foreign taxes if they do business or own property outside the United States.
Taxation of Subsidiary Partnerships
We have held and may in the future hold investments through entities that are classified as partnerships for U.S. federal income tax purposes. Under the Code, a partnership generally is not subject to U.S. federal income tax, but is required to file a partnership tax information return each year. In general, the character of each partner’s share of each item of income, gain, loss, deduction, credit, and tax preference is determined at the partnership level. Each partner is then allocated a distributive share of such items and is required to take such items into account in determining the partner’s income. Each partner includes such amount in income for any taxable year of the partnership ending within or with the taxable year of the partner, without regard to whether the partner has received or will receive any cash distributions from the partnership. Cash distributions, if any, from a partnership to a partner generally are not taxable unless and to the extent they exceed the partner’s basis in its partnership interest immediately before the distribution. Any amounts in excess of such tax basis will generally be treated as a sale of such partner’s interest in the partnership.
While generally the rules described above mean that a partnership is not subject to U.S. federal income tax, new rules applicable to U.S. federal income tax audits of partnerships effective for taxable years beginning after December 31, 2017 may require the partnership to pay the hypothetical increase in partner-level taxes (including interest and penalties) resulting from an adjustment of partnership tax items on audit or in other tax proceedings (an “imputed underpayment”), unless the partnership elects an alternative method under which the taxes resulting from the adjustment (and interest and penalties) are assessed at the partner level (often referred to as a “push-out election”), subject to a higher rate of interest than otherwise would apply. Treasury Regulations provide that when a push-out election affects a partner that is a REIT, such REIT may be able to use deficiency dividend procedures with respect to adjustments resulting from such election. It is possible that partnerships in which we directly and indirectly invest may be subject to U.S. federal income tax, interest and penalties in the event of a U.S. federal income tax audit as a result of these law changes, and as a result, we could be required to bear the economic costs of taxes attributable to our partners.
For purposes of the REIT income and assets tests, a REIT that is a partner in a partnership will be deemed to own its proportionate share of the assets of the partnership and will be deemed to earn its proportionate share of the partnership’s income. The assets and gross income of the partnership retain the same character in the hands of the REIT for purposes of the gross income and asset tests applicable to REITs. Our proportionate share of the assets and items of income of any subsidiary partnership, including such partnership’s share of the assets and liabilities and items of income with respect to any partnership or disregarded entity in which it holds an interest, will be treated as our assets and liabilities and items of income for purposes of applying the REIT asset and income tests.
We may form joint ventures taxed as partnerships and our joint venture partners may contribute property to such subsidiary partnerships. If our partner contributes appreciated property (i.e., property with a value in excess of adjusted tax basis) in exchange for a partnership interest, the subsidiary partnership’s initial tax basis in the property acquired generally will be less than the purchase price of the property. Although the partnership tax rules of Section 704(c) of the Code would generally attempt to provide us as the non-contributing partner with the depreciation deductions comparable to what we would receive if the subsidiary partnership purchased the appreciated assets for cash in a taxable transaction (and obtained an initial tax basis equal to the purchase price), absent certain elections, which would accelerate income to the contributor, the depreciation would be limited to tax basis. Consequently, our depreciation deductions for such properties may be less, and our tax gain on a sale of such properties may be more, than the deductions or gain, respectively, that we would have if the subsidiary partnership acquired these properties in taxable transactions. Alternatively, if we contribute appreciated property to a subsidiary partnership, such partnership may elect to use a method of allocation under Section 704(c) of the Code that accelerates income to us.
The discussion above assumes that any subsidiary partnerships in which we invest will be treated as “partnerships” for U.S. federal income tax purposes. Generally, a domestic unincorporated entity with two or more owners is treated as a partnership for U.S. federal income tax purposes unless it affirmatively elects to be treated as a corporation. However, certain “publicly traded partnerships” are treated as corporations for U.S. federal income tax purposes. Pursuant to Section 7704 of the Code, a partnership that does not elect to be treated as a corporation nevertheless will be treated as a corporation for U.S. federal income tax purposes if it is a “publicly traded partnership,” it does not derive at least 90% of its gross income from certain specified sources of “qualifying income” within the meaning of that provision and it meets certain other requirements. A “publicly traded partnership” is any
14
partnership (i) the interests in which are traded on an established securities market or (ii) the interests in which are readily tradable on a “secondary market or the substantial equivalent thereof.” Under the relevant Treasury Regulations, interests in a partnership will not be considered readily tradable on a secondary market or on the substantial equivalent of a secondary market if the partnership qualifies for specified “safe harbors,” which are based on the specific facts and circumstances relating to the partnership. For example, interests in a partnership are not readily tradable on a secondary market or the substantial equivalent thereof if (i) all interests in the partnership were issued in a transaction (or transactions) that was not required to be registered under the Securities Act, and (ii) the partnership does not have more than 100 partners at any time during the taxable year of the partnership (determined by counting indirect partners who held their partnership interest through certain flow-through entities). If any subsidiary partnership were a publicly traded partnership, it would be taxed as a corporation unless at least 90% of its gross income consists of “qualifying income” under Section 7704 of the Code. Qualifying income is generally real property rents and other types of passive income, and the income requirements applicable to us to qualify as a REIT under the Code and the definition of qualifying income under the publicly traded partnership rules are very similar. We intend to operate so that any subsidiary partnerships in which we invest will satisfy at least one of the above-mentioned safe harbors, and/or comply with the qualifying income exception, so as to avoid being taxed as a corporation under these rules. However, we may not control all of the subsidiary partnerships in which we may invest, and treatment of a subsidiary partnership as a corporation could prevent us from qualifying as a REIT.
Investments in Certain Debt Instruments
We may acquire mortgage, mezzanine, bridge loans and other debt investments. If a mortgage loan is secured by both real property and personal property, then such mortgage shall be treated as a wholly qualifying real estate asset and all interest shall be treated as mortgage interest for purposes of the 75% gross income test, provided that the fair market value of such personal property does not exceed 15% of the total fair market value of all such property on the date that we committed to acquire or modify the loan (or on the date of disposition for purposes of whether gain from a disposition of the mortgage is qualifying income for purposes of the 75% gross income test), even if the real property collateral value is less than the outstanding balance of the loan. However, if a mortgage loan that is secured by both real property and personal property does not satisfy the 15% test articulated in the previous sentence or if such mortgage loan is entered into or acquired in taxable years beginning before January 1, 2016, then such mortgage may not be a qualifying real estate asset in its entirety for purposes of the 75% asset test and/or a portion of the interest income from such mortgage may not constitute qualifying mortgage interest for purposes of the 75% gross income test if the amount of the loan outstanding exceeds the fair market value of the real property collateral on the date that we committed to acquire or modify the loan.
To the extent that we derive interest income from a mortgage loan where all or a portion of the amount of interest payable is contingent, such income generally will qualify for purposes of the gross income tests only if it is based upon the gross receipts or sales, and not the net income or profits, of the borrower. This limitation does not apply, however, where the borrower leases substantially all of its interest in the property to tenants or subtenants, to the extent that the rental income derived by the borrower would qualify as rents from real property had we earned the income directly.
The application of the REIT provisions of the Code to certain mezzanine loans, which are loans secured by equity interests in an entity that directly or indirectly owns real property rather than by a direct mortgage of the real property, is not entirely clear. A safe harbor in IRS Revenue Procedure 2003-65 provides that if a mezzanine loan meets certain requirements then it will be treated by the IRS as a qualifying real estate asset for purposes of the REIT asset tests and interest income derived from it will be treated as qualifying mortgage interest for purposes of the 75% gross income test. However, to the extent that mezzanine loans do not meet all of the requirements for reliance on the safe harbor set forth in IRS Revenue Procedure 2003-65, all or a portion of such mezzanine loans may not qualify as real estate assets for purposes of the REIT asset tests and the interest income derived therefrom may not be qualifying income for purposes of the 75% gross income test, which could adversely affect our REIT qualification if we acquired such loans. As such, the REIT provisions of the Code may limit our ability to acquire mortgage, mezzanine or other loans that we might otherwise desire to acquire.
Investments in debt instruments may require recognition of taxable income prior to receipt of cash from such investments and may cause portions of gain to be treated as ordinary income. For example, we may purchase debt instruments at a discount from face value. To the extent we purchase any instruments at a discount in connection with their original issuances, the discount will be “original issue discount,” or OID, if it exceeds certain de minimis amounts, which must be accrued on a constant yield method even though we may not receive the corresponding cash payment until maturity. To the extent debt instruments are purchased by us at a discount after their original issuances, the discount may represent “market discount.” Unlike OID, market discount is not required to be included in income on a constant yield method. However, if we sell a debt instrument with market discount, we will be required to treat gain up to an amount equal to the market discount that has accrued while we held the debt instrument as ordinary income. Additionally, any principal payments we receive in respect of our debt instruments must be treated as ordinary income to the extent of any accrued market discount. If we ultimately collect less on a debt instrument than our purchase price and any OID or accrued market discount that we have included in income, there may be limitations on our ability to use any losses resulting from that debt instrument. We may acquire distressed debt instruments that are subsequently modified by agreement with
15
the borrower. Under applicable Treasury Regulations, these modifications may be treated as a taxable event in which we exchange the old debt instrument for a new debt instrument, the value of which may be treated as equal to the face amount of the new debt instrument. Because distressed debt instruments are often acquired at a substantial discount from face value, the difference between our amount realized and our tax basis in the old note could be significant, resulting in significant income without any corresponding receipt of cash. Similarly, if we acquire a distressed debt instrument and subsequently foreclose, we could have taxable income to the extent that the fair market value of the property we receive exceeds our tax basis in the debt instrument. Such a scenario could also result in significant taxable income without any receipt of cash. In the event that any debt instruments acquired by us are delinquent as to mandatory principal and interest payments, or in the event payments with respect to a particular debt instrument are not made when due, we may nonetheless be required to continue to recognize the unpaid interest as taxable income.
We generally will be required to include certain amounts in income for U.S. federal income tax purposes no later than the time such amounts are reflected on certain financial statements. The application of this rule may require the accrual of income with respect to our debt instruments earlier than would be the case under the general tax rules described in the preceding paragraph.
Investments in TRSs
We own a subsidiary that has elected to be treated as a TRS for U.S. federal income tax purposes, and we may form additional TRSs. A TRS of ours is a corporation in which we directly or indirectly own stock and that jointly elects with us to be treated as a TRS under Section 856(l) of the Code. In addition, if a TRS owns, directly or indirectly, securities representing 35% or more of the vote or value of a subsidiary corporation, that subsidiary will also be treated as a TRS of ours. A domestic TRS (or a foreign TRS with income from a U.S. business) pays U.S. federal, state, and local income taxes at the full applicable corporate rates on its taxable income prior to payment of any dividends. A TRS owning property outside of the U.S. may pay foreign taxes. The taxes owed by a TRS could be substantial. To the extent that any of our TRSs is required to pay U.S. federal, state, local or foreign taxes, the cash available for distribution by us will be reduced accordingly.
A TRS is permitted to engage in certain kinds of activities that cannot be performed directly by us without jeopardizing our qualification as a REIT. However, several provisions regarding the arrangements between a REIT and its TRS ensure that a TRS will be subject to an appropriate level of U.S. federal income taxation. For example, we will be obligated to pay a 100% penalty tax on some payments that we receive or on certain expenses deducted by the TRS if the economic arrangements among us, our tenants, and/or the TRS are not comparable to similar arrangements among unrelated parties.
Taxation of U.S. Shareholders
The term “U.S. shareholder” means a beneficial owner of our common stock or preferred stock that, for U.S. federal income tax purposes, is (i) a citizen or resident of the United States, (ii) a corporation or other entity treated as a corporation for U.S. federal income tax purposes, created or organized in or under the laws of the United States, any of its states or the District of Columbia, (iii) an estate, the income of which is subject to U.S. federal income taxation regardless of its source, or (iv) a trust (a) that is subject to the primary supervision of a United States court and the control of one or more U.S. persons or (b) that has a valid election in effect under the applicable Treasury Regulations to be treated as a U.S. person under the Code.
In addition, as used herein, the term U.S. shareholder does not include any individuals or entities that are subject to special treatment under the Code, such as (i) insurance companies; (ii) tax-exempt organizations (except to the limited extent discussed below); (iii) financial institutions or broker-dealers; (iv) U.S. expatriates; (v) persons who mark-to-market our common stock or preferred stock; (vi) subchapter S corporations; (vii) U.S. shareholders whose functional currency is not the U.S. dollar; (viii) regulated investment companies; (ix) holders who receive our common stock or preferred stock through the exercise of employee stock options or otherwise as compensation; (x) persons holding shares of our common stock or preferred stock as part of a “straddle,” “hedge,” “conversion transaction,” “synthetic security” or other integrated investment; (xi) persons subject to the alternative minimum tax provisions of the Code; (xii) persons holding our common stock or preferred stock through a partnership or similar pass-through entity; and (xiii) persons holding a 10% or more (by vote or value) beneficial interest in our stock. If a partnership, including any entity treated as a partnership for U.S. federal income tax purposes, holds our stock, the U.S. federal income tax treatment of a partner in the partnership will generally depend on the status of the partner and the activities of the partnership. If you are a partner in a partnership holding our stock, you are urged to consult your tax advisor regarding the consequences of the ownership and disposition of shares of our stock by the partnership. This summary assumes that shareholders hold our stock as capital assets for U.S. federal income tax purposes, which generally means property held for investment.
Certain accrual method taxpayers are required to include certain amounts in income for U.S. federal income tax purposes no later than the time such amounts are reflected on certain financial statements. This summary does not address the impact of those rules.
Distributions
Distributions by us, other than capital gain dividends, will constitute ordinary dividends to the extent of our current or accumulated earnings and profits as determined for U.S. federal income tax purposes. Distributions on our preferred stock will be treated as
16
made out of any available earnings and profits in priority to distributions on our common stock. In general, these dividends will be taxable as ordinary income and will not be eligible for the dividends-received deduction for corporate shareholders. However, for taxable years beginning after December 31, 2017 and before January 1, 2026, individuals and other non-corporate taxpayers generally may deduct 20% of dividends received from us, other than capital gain dividends or dividends treated as qualified dividend income, subject to certain limitations. Our ordinary dividends generally will not qualify as “qualified dividend income” currently taxed as net capital gain for U.S. shareholders that are individuals, trusts or estates. However, provided we properly designate the distributions, distributions to U.S. shareholders that are individuals, trusts or estates generally will constitute qualified dividend income taxed as net capital gains to the extent the U.S. shareholder satisfies certain holding period requirements and to the extent the dividends are attributable to (i) qualified dividend income we receive from other corporations during the taxable year, including from our TRSs, and (ii) our undistributed earnings or built-in gains taxed at the corporate level during the immediately preceding taxable year. We do not anticipate distributing a significant amount of qualified dividend income.
The discussion in this section applies equally to distributions payable in cash and taxable stock distributions. The Code provides that certain distributions payable in stock will be treated as taxable stock dividends. In addition, shares acquired through a distribution reinvestment plan are treated as taxable stock dividends. Certain features, typically with respect to preferred stock, such as certain redemption premiums and conversion ratio adjustments that have the effect of increasing the affected shareholders’ interest in our earnings or assets, also may be treated as taxable stock dividends for U.S. federal income tax purposes. Taxable U.S. shareholders receiving taxable dividends of stock will be required to include as dividend income the fair market value of the stock received plus any cash or other property received in the distribution, to the extent of our current and accumulated earnings and profits for U.S. federal income tax purposes. As a result, a U.S. shareholder may be required to pay tax with respect to such dividends in excess of the cash received. If a U.S. shareholder sells the stock it receives as a dividend, the sales proceeds may be less than the amount included in income with respect to the dividend, depending on the market price of the stock at the time of the sale.
To the extent that we make a distribution in excess of our current and accumulated earnings and profits (a “return of capital distribution”), a U.S. shareholder will first apply the distribution to reduce the shareholder’s tax basis in our stock, and the return of capital distribution will be tax-free to that extent. To the extent that a return of capital distribution exceeds a U.S. shareholder’s tax basis in its stock, the distribution will be taxable as capital gain realized from the sale of such stock. Under proposed Treasury Regulations, a shareholder would apply a return of capital distribution pro rata, on a share-by-share basis, to each share of stock held by the shareholder with the class of stock upon which the return of capital distribution is made.
Dividends declared by us in October, November or December and payable to a shareholder of record on a specified date in any such month shall be treated both as paid by us and as received by the shareholder on December 31 of the year to the extent of our remaining current and accumulated earnings and profits for such year, provided that the dividend is actually paid by us during January of the following calendar year.
We will be treated as having sufficient earnings and profits to treat as a dividend any distribution up to the amount required to be distributed in order to avoid imposition of the 4% excise tax generally applicable to REITs if certain distribution requirements are not met. Moreover, any deficiency dividend will be treated as an ordinary or a capital gain dividend, as the case may be, regardless of our earnings and profits at the time the distribution is actually made. As a result, shareholders may be required to treat certain distributions as taxable dividends that would otherwise result in a tax-free return of capital.
Distributions that are properly designated as capital gain dividends will be taxed as long-term capital gains (to the extent they do not exceed our actual net capital gain for the taxable year) without regard to the period for which the shareholder has held its stock. However, corporate shareholders may be required to treat up to 20% of certain capital gain dividends as ordinary income. In addition, U.S. shareholders may be required to treat a portion of any capital gain dividend as “unrecaptured Section 1250 gain,” taxable at a maximum rate of 25%, if we incur such gain. Capital gain dividends are not eligible for the dividends-received deduction for corporations.
The REIT provisions of the Code do not require us to distribute our long-term capital gain, and we may elect to retain and pay income tax on our net long-term capital gains received during the taxable year. If we so elect for a taxable year, our shareholders would include in income as long-term capital gains their proportionate share of retained net long-term capital gains for the taxable year as we may designate. A U.S. shareholder would be deemed to have paid its share of the tax paid by us on such undistributed capital gains, which would be credited or refunded to the shareholder. The U.S. shareholder’s basis in its stock would be increased by the amount of undistributed long-term capital gains (less the capital gains tax paid by us) included in the U.S. shareholder’s long-term capital gains.
17
Passive Activity Loss and Investment Interest Limitations; No Pass-Through of Losses
Dividends paid by us and gain from the disposition of our common stock or preferred stock will not be treated as passive activity income and, therefore, U.S. shareholders will not be able to apply any “passive losses” against such income. With respect to non-corporate U.S. shareholders, our dividends (to the extent they do not constitute a return of capital) that are taxed at ordinary income rates will generally be treated as investment income for purposes of the investment interest limitation; however, net capital gain from the disposition of our common stock or preferred stock (or distributions treated as such), capital gain dividends, and dividends taxed at net capital gains rates generally will be excluded from investment income except to the extent the U.S. shareholder elects to treat such amounts as ordinary income for U.S. federal income tax purposes. U.S. shareholders may not include in their own U.S. federal income tax returns any of our net operating or net capital losses.
Sale or Disposition of Stock
In general, any gain or loss realized upon a taxable disposition of shares of our common stock or preferred stock by a shareholder that is not a dealer in securities will be a long-term capital gain or loss if the stock has been held for more than one year; otherwise it will be a short-term capital gain or loss. However, any loss upon a sale or exchange of the stock by a shareholder who has held such stock for six months or less (after applying certain holding period rules) will be treated as a long-term capital loss to the extent of our distributions or undistributed capital gains required to be treated by such shareholder as long-term capital gain. All or a portion of any loss realized upon a taxable disposition of shares of our common stock or preferred stock may be disallowed if the taxpayer purchases other shares of our common stock within 30 days before or after the disposition.
A redemption by us of any redeemable preferred stock we may issue could be treated either as a taxable disposition of shares or as a dividend, depending on the applicable facts and circumstances. In the event we issue any redeemable preferred stock, the prospectus supplement will discuss the tax consequences of owning such securities in greater detail.
Taxation of U.S. Tax-Exempt Shareholders
In General
In general, a tax-exempt organization is exempt from U.S. federal income tax on its income, except to the extent of its “unrelated business taxable income” or UBTI, which is defined by the Code as the gross income derived from any trade or business which is regularly carried on by a tax-exempt entity and unrelated to its exempt purposes, less any directly connected deductions and subject to certain modifications. For this purpose, the Code generally excludes from UBTI any gain or loss from the sale or other disposition of property (other than stock in trade or property held primarily for sale in the ordinary course of a trade or business), dividends, interest, rents from real property, and certain other items. However, a portion of any such gains, dividends, interest, rents, and other items generally is UBTI to the extent derived from debt-financed property not related to the tax-exempt entity’s exempt purpose, based on the amount of “acquisition indebtedness” with respect to such debt-financed property. A U.S. tax-exempt shareholder that is subject to tax on its UBTI will be required to separately compute its taxable income and loss for each unrelated trade or business activity for purposes of determining its UBTI. Before making an investment in shares of our common stock or preferred stock, a tax-exempt shareholder should consult its tax advisors with regard to UBTI and the suitability of the investment in our stock.
Distributions we make to a tax-exempt employee pension trust or other domestic tax-exempt shareholder or gains from the disposition of our common stock or preferred stock held as capital assets generally will not constitute UBTI unless the exempt organization’s stock is debt-financed property (e.g., the shareholder has incurred “acquisition indebtedness” with respect to such stock). However, if we are a “pension-held REIT,” this general rule may not apply to distributions to certain pension trusts that are qualified trusts (as defined above) and that hold more than 10% (by value) of our stock. We will be treated as a “pension-held REIT” if (i) treating qualified trusts as individuals would cause us to fail the 5/50 Test (as defined above) and (ii) we are “predominantly held” by qualified trusts. We will be “predominantly held” by qualified trusts if either (i) a single qualified trust holds more than 25% by value of our stock or (ii) one or more qualified trusts, each owning more than 10% by value of our stock, hold in the aggregate more than 50% by value of our stock. In the event we are a pension-held REIT, the percentage of any dividend received from us treated as UBTI would be equal to the ratio of (a) the gross UBTI (less certain associated expenses) earned by us (treating us as if we were a qualified trust and, therefore, subject to tax on UBTI) to (b) our total gross income (less certain associated expenses). A de minimis exception applies where the ratio set forth in the preceding sentence is less than 5% for any year; in that case, no dividends are treated as UBTI. We cannot assure you that we will not be treated as a pension-held REIT.
Special Issues
Social clubs, voluntary employee benefit associations and supplemental unemployment benefit trusts that are exempt from taxation under paragraphs (7), (9) and (17), respectively, of Section 501(c) of the Code are subject to different UBTI rules, which generally will require them to characterize distributions from us as UBTI.
18
Taxation of Non-U.S. Shareholders
The rules governing U.S. federal income taxation of beneficial owners of our stock who are not U.S. persons, such as nonresident alien individuals, foreign corporations, and foreign trusts and estates (“non-U.S. shareholders”), are complex. This section is only a partial discussion of such rules. This discussion does not attempt to address the considerations that may be relevant for non-U.S. shareholders that are partnerships or other pass-through entities, that hold their common stock or preferred stock through intermediate entities, that have special statuses (such as sovereigns), or that otherwise are subject to special rules under the Code. This discussion also generally is limited to investments in classes of our stock that are regularly traded on an established securities market.
Distributions
A non-U.S. shareholder that receives a distribution that is not attributable to gain from our sale or exchange of “United States real property interests” (as defined below) and that we do not designate as a capital gain dividend or retained capital gain generally will recognize ordinary dividend income to the extent that we pay the distribution out of our current or accumulated earnings and profits. A U.S. federal withholding tax equal to 30% of the gross amount of the distribution ordinarily will apply unless an applicable tax treaty reduces or eliminates the tax. Under many treaties, lower withholding rates do not apply to dividends from REITs or are available in limited circumstances. However, if a distribution is treated as effectively connected with the non-U.S. shareholder’s conduct of a U.S. trade or business, the non-U.S. shareholder generally will be subject to U.S. federal income tax on the distribution at graduated rates (in the same manner as U.S. shareholders are taxed on distributions) and also may be subject to the 30% branch profits tax in the case of a corporate non-U.S. shareholder. We generally plan to withhold U.S. income tax at the rate of 30% on the gross amount of any distribution paid to a non-U.S. shareholder (including any portion of any dividend that is payable in our stock) unless either (i) a lower treaty rate or special provision of the Code (e.g., Section 892) applies and the non-U.S. shareholder provides to us any required IRS Form W-8 (for example, an IRS Form W-8BEN) evidencing eligibility for that reduced rate or (ii) the non-U.S. shareholder provides with us an IRS Form W-8ECI claiming that the distribution is effectively connected income, or (iii) we determined that a different withholding rate is appropriate (such as because we can determine at the time of distribution that the distribution is a capital gain dividend or is attributable to gain from the sale or exchange of “United States real property interests”).
A non-U.S. shareholder generally will not incur U.S. federal income tax (but will be subject to withholding as described below) on a return of capital distribution in excess of our current and accumulated earnings and profits that is not attributable to the gain from our disposition of a “United States real property interest” if the excess portion of the distribution does not exceed the adjusted basis of the non-U.S. shareholder’s stock. Instead, the excess portion of the distribution will reduce the adjusted basis of the stock. However, a non-U.S. shareholder will be subject to tax on such a distribution that exceeds both our current and accumulated earnings and profits and the non-U.S. shareholder’s adjusted basis in the stock if the non-U.S. shareholder otherwise would be subject to tax on gain from the sale or disposition of its stock, as described below. Because we generally cannot determine at the time we make a distribution whether or not the distribution will exceed our current and accumulated earnings and profits, we normally will withhold tax on the entire amount of any distribution at the same rate as we would withhold on a dividend.
We may be required to withhold 15% of any distribution that exceeds our current and accumulated earnings and profits even if a lower treaty rate applies to dividends or the non-U.S. shareholder is not liable for tax on the receipt of that distribution. Consequently, to the extent that we do not withhold at a rate of 30% on the entire amount of any distribution, we generally expect to withhold at a rate of 15% on the portion of the distribution that we do not withhold at a rate of 30%,. unless we conclude that an exemption or different rate applies.
A non-U.S. shareholder may seek a refund from the IRS if the non-U.S. shareholder’s withholdings and any other tax payments exceed its U.S. federal income tax liability for the year.
Subject to the exception discussed below for 10% or smaller holders of classes of stock of a corporation that are regularly traded on an established securities market located in the United States and the special rules for “qualified shareholders” or “qualified foreign pension funds” discussed below, a non-U.S. shareholder will incur tax on distributions that are attributable to gain from our sale or exchange of “United States real property interests” under special provisions of the Foreign Investment in Real Property Tax Act of 1980, or FIRPTA, regardless of whether we designate such distributions as capital gain dividend. The term “United States real property interests” includes interests in U.S. real property and stock in U.S. corporations at least 50% of whose assets consist of interests in U.S. real property. Under those rules, a non-U.S. shareholder is taxed on distributions attributable to gain from sales of United States real property interests as if the gain were effectively connected with the non-U.S. shareholder’s conduct of a U.S. trade or business. A non-U.S. shareholder thus would be taxed on such a distribution at the normal capital gain rates applicable to U.S. shareholders, subject to any applicable alternative minimum tax. A corporate non-U.S. shareholder not entitled to treaty relief or exemption also may be subject to the 30% branch profits tax on such a distribution. We will be required to withhold and remit to the IRS 21% of any distributions to non-U.S. shareholders attributable to gain from our sale or exchange
19
of United States real property interests (“FIRPTA Withholding”). A non-U.S. shareholder may receive a credit against its tax liability for the amount we withhold.
A non-U.S. shareholder that owns, actually or constructively, no more than 10% of our common stock (or preferred stock) at all times during the one-year period ending on the date of a distribution with respect to such stock should not be subject to FIRPTA, branch profits tax or FIRPTA Withholding with respect to a distribution on that stock that is attributable to gain from our sale or exchange of United States real property interests, provided that the class of stock in question continues to be regularly traded on an established securities market located in the United States. In the case of any such distribution that was a capital gain dividend made to such non-U.S. shareholder, the distribution will be treated as an ordinary dividend subject to the general withholding rules discussed above, which generally impose a withholding tax equal to 30% of the gross amount of each dividend distribution (unless reduced by treaty).
Distributions that are designated by us as capital gain dividends but that are not attributable to the disposition of a United States real property interest, generally should not be subject to U.S. federal income taxation unless:
(i) | such distribution is effectively connected with the non-U.S. shareholder’s U.S. trade or business and, if certain treaties apply, is attributable to a U.S. permanent establishment maintained by the non-U.S. shareholder, in which case the non-U.S. shareholder will be subject to tax on a net basis in a manner similar to the taxation of U.S. shareholders with respect to such gain, except that a holder that is a foreign corporation may also be subject to the additional 30% branch profits tax; or | |
(ii) | the non-U.S. shareholder is a nonresident alien individual who is present in the United States for 183 days or more during the taxable year and meets certain other criteria, in which case such nonresident alien individual generally will be subject to a 30% tax on the individual’s net U.S. source capital gain. | |
Notwithstanding that such non-FIRPTA capital gain dividend may not be subject to U.S. federal income taxation, as noted above we generally plan to withhold U.S. federal income tax at the rate of 30% on the gross amount of any dividend distribution paid to a non-U.S. shareholder and we may be required to withhold not less than 21% of any such capital gain dividends (or amounts we could have designated as such). Distributions can be designated as capital gain dividends to the extent of our net capital gain for the taxable year of the distribution. The amount withheld is creditable against the non-U.S. shareholder’s U.S. federal income tax liability.
Although the law is not clear on the matter, it appears that amounts designated by us as undistributed capital gains generally should be treated with respect to non-U.S. shareholders in the same manner as actual distributions by us of capital gain dividends. Under that approach, non-U.S. shareholders would be able to offset as a credit against their U.S. federal income tax liability resulting therefrom an amount equal to their proportionate share of the tax paid by us on the undistributed capital gains and to receive from the IRS a refund to the extent their proportionate share of this tax paid by us exceeds their actual U.S. federal income tax liability.
Dispositions
If gain on the sale of our common stock or preferred stock were taxed under FIRPTA, a non-U.S. shareholder would be taxed on that gain in the same manner as U.S. shareholders with respect to that gain, subject to any applicable alternative minimum tax. A non-U.S. shareholder generally will not incur tax under FIRPTA on a sale or other disposition of our common stock or preferred stock if we are a “domestically controlled qualified investment entity,” which requires that, during the five-year period ending on the date of the distribution or disposition, non-U.S. shareholders hold, directly or indirectly, less than 50% in value of our stock and we are qualified as a REIT. For such testing periods that end on or after December 18, 2015, a person holding less than 5% of our regularly traded classes of stock for five years has been, and will be, treated as a U.S. person unless we have actual knowledge that such person is not a U.S. person. Because our common stock is publicly traded, we cannot assure you that we are or will be in the future a domestically controlled qualified investment entity. However, gain recognized by a non-U.S. shareholder from a sale of our common stock or preferred stock that is regularly traded on an established securities market will not be subject to tax under FIRPTA if (i) our stock is considered regularly traded under applicable Treasury Regulations on an established securities market, such as the NYSE, and (ii) the non-U.S. shareholder owned, actually and constructively, 10% or less of the value of such class of stock at all times during the specified testing period ending on the date of the disposition. The testing period referred to in the previous sentence is the shorter of (x) the period during which the non-U.S. shareholder held the stock and (y) the five-year period ending on the date of the disposition. We believe that our common stock is currently regularly traded on an established securities market. Non-U.S. shareholders should consult their tax advisors as to the availability of the exception for holders of less than 10% of our stock in the case of a class of our stock that is not regularly traded on an established securities market.
In addition, even if we are a domestically controlled qualified investment entity, upon a disposition of our common stock or preferred stock, a non-U.S. shareholder may be treated as having gain from the sale or exchange of a United States real property
20
interest if the non-U.S. shareholder (i) disposes of an interest in our common stock or preferred stock during the 30-day period preceding the ex-dividend date of a distribution, any portion of which, but for the disposition, would have been treated as gain from the sale or exchange of a United States real property interest, and (ii) directly or indirectly acquires, enters into a contract or option to acquire, or is deemed to acquire, other shares of our common stock or preferred stock within 30 days before or after such ex-dividend date. The foregoing rule does not apply if the exception described above for dispositions by 10% or smaller holders of regularly traded classes of stock is satisfied.
Furthermore, a non-U.S. shareholder generally will incur tax on gain not subject to FIRPTA if (i) the gain is effectively connected with the non-U.S. shareholder’s U.S. trade or business and, if certain treaties apply, is attributable to a U.S. permanent establishment maintained by the non-U.S. shareholder, in which case the non-U.S. shareholder will be subject to the same treatment as U.S. shareholders with respect to such gain and may be subject to the 30% branch profits tax in the case of a non-U.S. corporation, or (ii) the non-U.S. shareholder is a nonresident alien individual who was present in the United States for 183 days or more during the taxable year and has a “tax home” in the United States, in which case the non-U.S. shareholder will generally incur a 30% tax on his or her net U.S. source capital gains.
Purchasers of our common stock or preferred stock from a non-U.S. shareholder generally will be required to withhold and remit to the IRS 15% of the purchase price unless at the time of purchase (i) any class of our stock is regularly traded on an established securities market (subject to certain limits if the shares of stock sold are not themselves part of such a regularly traded class) or (ii) we are a domestically controlled qualified investment entity. The non-U.S. shareholder may receive a credit against his or her U.S. tax liability for the amount withheld.
Special FIRPTA Rules
To the extent our stock is held directly (or indirectly through one or more partnerships) by a “qualified shareholder,” it will not be treated as a United States real property interest for such qualified shareholder. Thus, gain treated as gain from the sale or exchange of our stock (including distributions treated as gain from the sale or exchange of our stock) will not be subject to tax unless such gain is treated as effectively connected with the qualified shareholder’s conduct of a U.S. trade or business. Further, to the extent such treatment applies, any distribution to such shareholder will not be treated as gain recognized from the sale or exchange of a United States real property interest (and capital gain dividends and non-dividend distributions to such shareholder may be treated as ordinary dividends). For these purposes, a qualified shareholder is generally a non-U.S. shareholder that (i)(A) is eligible for treaty benefits under an income tax treaty with the United States that includes an exchange of information program and the principal class of interests of which is listed and regularly traded on one or more stock exchanges as defined by the treaty, or (B) is a foreign limited partnership organized in a jurisdiction with an exchange of information agreement with the United States and that has a class of regularly traded limited partnership units (having a value greater than 50% of the value of all partnership units) on the NYSE or Nasdaq, (ii) is a “qualified collective investment vehicle” (within the meaning of Section 897(k)(3)(B) of the Code) and (iii) maintains records of persons holding 5% or more of the class of interests described in clauses (i)(A) or (i)(B) above. However, in the case of a qualified shareholder having one or more “applicable investors,” the exception described in the first sentence of this paragraph will not apply to the applicable percentage of the qualified shareholder’s stock (with “applicable percentage” generally meaning the percentage of the value of the interests in the qualified shareholder held by applicable investors after applying certain constructive ownership rules). The applicable percentage of the amount realized by a qualified shareholder on the disposition of our stock or with respect to a distribution from us attributable to gain from the sale or exchange of a United States real property interest will be treated as amounts realized from the disposition of United States real property interest. Such treatment shall also apply to applicable investors in respect of distributions treated as a sale or exchange of stock with respect to a qualified shareholder. For these purposes, an “applicable investor” is a person (other than a qualified shareholder) who generally holds an interest in the qualified shareholder and holds more than 10% of our stock applying certain constructive ownership rules.
For FIRPTA purposes, neither a “qualified foreign pension fund” nor an entity all of the interests of which are held by a qualified foreign pension fund is treated as a non-U.S. shareholder. Accordingly, the U.S. federal income tax treatment of ordinary dividends received by qualified foreign pension funds and their wholly owned non-U.S. subsidiaries will be determined without regard to the FIRPTA rules discussed above, and their gain from the sale or exchange of our stock, as well as our capital gain dividends and distributions treated as gain from the sale or exchange of our stock, will not be subject to U.S. federal income tax unless such gain is treated as effectively connected with the qualified foreign pension fund’s (or the wholly owned subsidiary’s) conduct of a U.S. trade or business. A “qualified foreign pension fund” is an organization or arrangement (i) created or organized in a foreign country, (ii) established to provide retirement or pension benefits to current or former employees (including self-employed individuals) or their designees by either (A) a foreign country as a result of services rendered by such employees to their employers, or (B) one or more employers in consideration for services rendered by such employees to such employers, (iii) which does not have a single participant or beneficiary that has a right to more than 5% of its assets or income, (iv) which is subject to government regulation and with respect to which annual information about its beneficiaries is provided, or is otherwise available, to relevant local tax authorities, and (v) with respect to which, under its local laws, (A) contributions that would otherwise be subject to tax are deductible
21
or excluded from its gross income or taxed at a reduced rate, or (B) taxation of its investment income is deferred, or such income is excluded from its gross income or taxed at a reduced rate.
U.S. Federal Income Tax Returns
If a non-U.S. shareholder is subject to taxation under FIRPTA on proceeds from the sale of our common stock or preferred stock or on distributions, the non-U.S. shareholder will be required to file a U.S. federal income tax return.
Information Reporting Requirements and Backup Withholding Tax Applicable to Shareholders
U.S. Shareholders. In general, information reporting requirements will apply to payments of distributions on our stock and payments of the proceeds of the sale of our stock to some shareholders. Further, the payor will be required to backup withhold on any payments at the current rate of 24% if:
(1) the payee fails to furnish a taxpayer identification number, or TIN, to the payor or establish an exemption from backup withholding;
(2) the IRS notifies the payor that the TIN furnished by the payee is incorrect; or
(3) the payee fails to certify under the penalty of perjury that the payee is not subject to backup withholding under the Code; or
(4) there has been a notified payee underreporting with respect to dividends described in Code Section 3406(c).
Some U.S. shareholders, including corporations and tax-exempt organizations, will be exempt from backup withholding. Any amounts withheld under the backup withholding rules from a payment to a shareholder will be allowed as a credit against the shareholder’s U.S. federal income tax and may entitle the shareholder to a refund, provided that the required information is furnished to the IRS on a timely basis.
Non-U.S. Shareholders. Information reporting requirements and backup withholding may apply to (i) payments of distributions on our stock to a non-U.S. shareholder and (ii) proceeds a non-U.S. shareholder receives upon the sale, exchange, redemption, retirement or other disposition of our stock. Information reporting and backup withholding will generally not apply if an appropriate IRS Form W-8 is duly provided by such non-U.S. shareholder or the shareholder otherwise establishes an exemption, provided that the withholding agent does not have actual knowledge or reason to know that the shareholder is a U.S. person or that the claimed exemption is not in fact satisfied. Even without having executed an appropriate IRS Form W-8 or substantially similar form, however, in some cases information reporting and backup withholding will not apply to proceeds received through a broker’s foreign office that a non-U.S. shareholder receives upon the sale, exchange, redemption, retirement or other disposition of our stock. However, this exemption does not apply to brokers that are U.S. persons and certain foreign brokers with substantial U.S. ownership or operations. Any amount withheld under the backup withholding rules is allowable as a credit against such shareholder’s U.S. federal income tax liability (which might entitle such holder to a refund), provided that such holder furnishes the required information to the IRS. Payments not subject to information reporting requirements may nonetheless be subject to other reporting requirements.
Foreign Account Tax Compliance Act Withholding Rules
The Foreign Account Tax Compliance Act, or FATCA, provisions of the Code, subject to administrative guidance and certain intergovernmental agreements entered into thereunder, impose a 30% withholding tax on certain types of payments made to ‘‘foreign financial institutions’’ (as specifically defined in the Code) and certain other non-U.S. entities unless (i) the foreign financial institution (as the beneficial owner or as an intermediary for the beneficial owners) undertakes certain diligence and reporting obligations or (ii) the foreign non-financial entity (as the beneficial owner or, in certain cases, as an intermediary for the beneficial owners) either certifies it does not have any substantial United States owners or furnishes identifying information regarding each substantial United States owner. If the payee is a foreign financial institution that is not subject to special treatment under certain intergovernmental agreements, it must enter into an agreement with the United States Treasury requiring, among other things, that it undertakes to identify accounts held by certain United States persons or United States-owned foreign entities, annually report certain information about such accounts, and withhold 30% on payments to account holders whose actions prevent them from complying with these reporting and other requirements. The compliance requirements under FATCA are complex and special requirements may apply to certain categories of payees. Withholding under this legislation may apply with respect to certain types of passive income from sources within the United States, which include dividend income from our stock. However, FATCA withholding will not apply to amounts treated as income effectively connected with the conduct of a trade or business within the United States or (ii) distributions and proceeds from a sale or other disposition of our stock.
22
Medicare Tax
A U.S. shareholder that is an individual is subject to a 3.8% tax on the lesser of (1) his or her “net investment income” for the relevant taxable year and (2) the excess of his or her modified adjusted gross income for the taxable year over a certain threshold (currently between $125,000 and $250,000, depending on the individual’s U.S. federal income tax filing status). A similar regime applies to certain estates and trusts. Net investment income generally would include dividends on our common stock and preferred stock (without regard to the 20% deduction allowed by Section 199A of the Code) and gain from the sale of our common stock and preferred stock. If you are a U.S. person that is an individual, an estate or a trust, you are urged to consult your tax advisors regarding the applicability of this tax to your income and gains in respect of your investment in our common stock and preferred stock.
Recent Tax Legislation
The recently enacted legislation informally knows as the Tax Cuts and Jobs Act, or TCJA, is generally applicable for tax years beginning after December 31, 2017 and made significant changes to the Code, including a number of provisions of the Code that affect the taxation of businesses and their owners, including REITs, their shareholders and holders of their debt securities. Among other changes not reflected in the discussion above, the TCJA (i) reduces the U.S. federal income tax rates on ordinary income of individuals, trusts and estates for taxable years beginning before January 1, 2026 and on corporations indefinitely, (ii) limits the deductibility of interest expense, and (iii) limits the use of net operating losses. The effect of the TCJA on us and our shareholders is still uncertain, and administrative guidance will be required in order to fully evaluate the effect of many provisions. Any technical corrections with respect to the TCJA could have an adverse effect on us or our shareholders.
Additional Legislative or Other Actions Affecting REITs
The rules dealing with U.S. federal income taxation are constantly under review by persons involved in the legislative process and by the IRS and the U.S. Treasury Department and it is possible that there could be future changes that could adversely impact our shareholders. No assurance can be given as to whether, when, or in what form the U.S. federal income tax laws applicable to us and our shareholders may be enacted. Changes to the U.S. federal tax laws and interpretations of federal tax laws could adversely affect an investment in our common stock or preferred stock.
State, Local and Foreign Tax
We may be subject to state, local and foreign tax in states, localities and foreign countries in which we do business or own property. The tax treatment applicable to us and our shareholders in such jurisdictions may differ from the U.S. federal income tax treatment described above. The TCJA also disallows itemized deductions for taxable years beginning before January 1, 2026 for individuals for state and local income, property and sales taxes in excess of a combined limit of $10,000 ($5,000 for a married individual filing a separate return) per year.
ITEM 1A. RISK FACTORS.
In addition to the other information contained or incorporated by reference in this document, readers should carefully consider the following risk factors. Any of these risks or the occurrence of any one or more of the uncertainties described below could have a material adverse effect on the Company's financial condition and the performance of its business. Additional risks and uncertainties not presently known to the Company or that the Company currently deems immaterial also may impair its business operations. The Company refers to itself as "we", "us" or "our" in the following risk factors.
Real Estate Industry Risks
We face risks associated with local real estate conditions in areas where we own properties. We may be adversely affected by general economic conditions and local real estate conditions. For example, an oversupply of industrial properties in a local area or a decline in the attractiveness of our properties to tenants would have a negative effect on us. Other factors that may affect general economic conditions or local real estate conditions include:
• | population and demographic trends; |
• | employment and personal income trends; |
• | income and other tax laws; |
• | changes in interest rates and availability and costs of financing; |
• | increased operating costs, including insurance premiums, utilities and real estate taxes, due to inflation and other factors which may not necessarily be offset by increased rents; |
• | changes in the price of oil; and |
• | construction costs. |
23
We may be unable to compete for properties and tenants. The real estate business is highly competitive. We compete for interests in properties with other real estate investors and purchasers, some of whom have greater financial resources, revenues and geographical diversity than we have. Furthermore, we compete for tenants with other property owners. All of our industrial properties are subject to significant local competition. We also compete with a wide variety of institutions and other investors for capital funds necessary to support our investment activities and asset growth.
We are subject to significant regulation that constrains our activities. Local zoning and land use laws, environmental statutes and other governmental requirements restrict our expansion, rehabilitation and reconstruction activities. These regulations may prevent us from taking advantage of economic opportunities. Legislation such as the Americans with Disabilities Act may require us to modify our properties, and noncompliance could result in the imposition of fines or an award of damages to private litigants. Future legislation may impose additional requirements. We cannot predict what requirements may be enacted or what changes may be implemented to existing legislation.
Risks Associated with Our Properties
We may be unable to lease space on favorable terms or at all. When a lease expires, a tenant may elect not to renew it. We may not be able to re-lease the property on favorable terms, if we are able to re-lease the property at all. The terms of renewal or re-lease (including the cost of required renovations and/or concessions to tenants) may be less favorable to us than the prior lease. We also routinely develop properties with no pre-leasing. If we are unable to lease all or a substantial portion of our properties, or if the rental rates upon such leasing are significantly lower than expected rates, our cash generated before debt repayments and capital expenditures and our ability to make expected distributions to stockholders may be adversely affected.
We have been and may continue to be affected negatively by tenant bankruptcies and leasing delays. At any time, a tenant may experience a downturn in its business that may weaken its financial condition. Similarly, a general decline in the economy may result in a decline in the demand for space at our industrial properties. As a result, our tenants may delay lease commencement, fail to make rental payments when due, or declare bankruptcy. Any such event could result in the termination of that tenant’s lease and losses to us, and distributions to investors may decrease. We receive a substantial portion of our income as rents under mid-term and long-term leases. If tenants are unable to comply with the terms of their leases for any reason, including because of rising costs or falling sales, we may deem it advisable to modify lease terms to allow tenants to pay a lower rent or a smaller share of taxes, insurance and other operating costs. If a tenant becomes insolvent or bankrupt, we cannot be sure that we could recover the premises from the tenant promptly or from a trustee or debtor-in-possession in any bankruptcy proceeding relating to the tenant. We also cannot be sure that we would receive rent in the proceeding sufficient to cover our expenses with respect to the premises. If a tenant becomes bankrupt, the federal bankruptcy code will apply and, in some instances, may restrict the amount and recoverability of our claims against the tenant. A tenant’s default on its obligations to us could adversely affect our financial condition and the cash we have available for distribution.
We face risks associated with our property development. We intend to continue to develop properties where market conditions warrant such investment. Once made, our investments may not produce results in accordance with our expectations. Risks associated with our current and future development and construction activities include:
• | the availability of favorable financing alternatives; |
• | the risk that we may not be able to obtain land on which to develop or that due to the increased cost of land, our activities may not be as profitable; |
• | construction costs exceeding original estimates due to rising interest rates and increases in the costs of materials and labor; |
• | construction and lease-up delays resulting in increased debt service, fixed expenses and construction costs; |
• | expenditure of funds and devotion of management's time to projects that we do not complete; |
• | fluctuations of occupancy and rental rates at newly completed properties, which depend on a number of factors, including market and economic conditions, resulting in lower than projected rental rates and a corresponding lower return on our investment; and |
• | complications (including building moratoriums and anti-growth legislation) in obtaining necessary zoning, occupancy and other governmental permits. |
We face risks associated with property acquisitions. We acquire individual properties and portfolios of properties and intend to continue to do so. Our acquisition activities and their success are subject to the following risks:
• | when we are able to locate a desired property, competition from other real estate investors may significantly increase the purchase price; |
• | acquired properties may fail to perform as expected; |
• | the actual costs of repositioning or redeveloping acquired properties may be higher than our estimates; |
24
• | acquired properties may be located in new markets where we face risks associated with an incomplete knowledge or understanding of the local market, a limited number of established business relationships in the area and a relative unfamiliarity with local governmental and permitting procedures; |
• | we may be unable to quickly and efficiently integrate new acquisitions, particularly acquisitions of portfolios of properties, into our existing operations, and as a result, our results of operations and financial condition could be adversely affected; and |
• | we may acquire properties subject to liabilities and without any recourse, or with only limited recourse, to the transferor with respect to unknown liabilities. As a result, if a claim were asserted against us based upon ownership of those properties, we might have to pay substantial sums to settle it, which could adversely affect our cash flow. |
Coverage under our existing insurance policies may be inadequate to cover losses. We generally maintain insurance policies related to our business, including casualty, general liability and other policies, covering our business operations, employees and assets as appropriate for the markets where our properties and business operations are located. However, we would be required to bear all losses that are not adequately covered by insurance. In addition, there may be certain losses that are not generally insured against or that are not generally fully insured against because it is not deemed economically feasible or prudent to do so, including losses due to floods, wind, earthquakes, acts of war, acts of terrorism or riots. If an uninsured loss or a loss in excess of insured limits occurs with respect to one or more of our properties, then we could lose the capital we invested in the properties, as well as the anticipated future revenue from the properties. In addition, if the damaged properties are subject to recourse indebtedness, we would continue to be liable for the indebtedness, even if these properties were irreparably damaged.
We face risks due to lack of geographic and real estate sector diversity. Substantially all of our properties are located in the Sunbelt region of the United States with an emphasis in the states of Florida, Texas, Arizona, California and North Carolina. As of December 31, 2018, our two largest markets were Houston and Tampa. We owned operating properties totaling 5.5 million square feet in Houston and 4.2 million square feet in Tampa, which represent 14.1% and 10.7%, respectively, of the Company's total Real estate properties on a square foot basis. A downturn in general economic conditions and local real estate conditions in these geographic regions, as a result of oversupply of or reduced demand for industrial properties, local business climate, business layoffs and changing demographics, would have a particularly strong adverse effect on us. Our investments in real estate assets are concentrated in the industrial distribution sector. This concentration may expose us to the risk of economic downturns in this sector to a greater extent than if our business activities included other sectors of the real estate industry.
We face risks due to the illiquidity of real estate which may limit our ability to vary our portfolio. Real estate investments are relatively illiquid. Our ability to vary our portfolio in response to changes in economic and other conditions will therefore be limited. In addition, because of our status as a REIT, the Internal Revenue Code limits our ability to sell our properties. If we must sell an investment, we cannot ensure that we will be able to dispose of the investment on terms favorable to the Company.
We are subject to environmental laws and regulations. Current and previous real estate owners and operators may be required under various federal, state and local laws, ordinances and regulations to investigate and clean up hazardous substances released at the properties they own or operate. They may also be liable to the government or to third parties for substantial property or natural resource damage, investigation costs and cleanup costs. Such laws often impose liability without regard to whether the owner or operator knew of, or was responsible for, the release or presence of such hazardous substances. In addition, some environmental laws create a lien on the contaminated site in favor of the government for damages and costs the government incurs in connection with the contamination. Contamination may adversely affect the owner’s ability to use, sell or lease real estate or to borrow using the real estate as collateral. We have no way of determining at this time the magnitude of any potential liability to which we may be subject arising out of environmental conditions or violations with respect to the properties we currently or formerly owned. Environmental laws today can impose liability on a previous owner or operator of a property that owned or operated the property at a time when hazardous or toxic substances were disposed of, released from, or present at the property. A conveyance of the property, therefore, may not relieve the owner or operator from liability. Although ESAs have been conducted at our properties to identify potential sources of contamination at the properties, such ESAs do not reveal all environmental liabilities or compliance concerns that could arise from the properties. Moreover, material environmental liabilities or compliance concerns may exist, of which we are currently unaware, that in the future may have a material adverse effect on our business, assets or results of operations.
Compliance with new laws or regulations related to climate change, including compliance with “green” building codes, may require us to make improvements to our existing properties. Proposed legislation could also increase the costs of energy and utilities. The cost of the proposed legislation may adversely affect our financial position, results of operations and cash flows. We may be adversely affected by floods, hurricanes and other climate related events.
25
Financing Risks
We face risks associated with the use of debt to fund acquisitions and developments, including refinancing risk. We are subject to the risks normally associated with debt financing, including the risk that our cash flow will be insufficient to meet required payments of principal and interest. In addition, certain of our debt will have significant outstanding principal balances on their maturity dates, commonly known as “balloon payments.” Therefore, we will likely need to refinance at least a portion of our outstanding debt as it matures. There is a risk that we may not be able to refinance existing debt or that the terms of any refinancing will not be as favorable as the terms of the existing debt.
We face risks associated with our dependence on external sources of capital. In order to qualify as a REIT, we are required each year to distribute to our stockholders at least 90% of our ordinary taxable income, and we are subject to tax on our income to the extent it is not distributed. Because of this distribution requirement, we may not be able to fund all future capital needs from cash retained from operations. As a result, to fund capital needs, we rely on third-party sources of capital, which we may not be able to obtain on favorable terms, if at all. Our access to third-party sources of capital depends upon a number of factors, including (i) general market conditions; (ii) the market’s perception of our growth potential; (iii) our current and potential future earnings and cash distributions; and (iv) the market price of our capital stock. Additional debt financing may substantially increase our debt-to-total market capitalization ratio. Additional equity financing may dilute the holdings of our current stockholders.
Covenants in our credit agreements could limit our flexibility and adversely affect our financial condition. The terms of our various credit agreements and other indebtedness require us to comply with a number of customary financial and other covenants, such as maintaining debt service coverage and leverage ratios and maintaining insurance coverage. These covenants may limit our flexibility in our operations, and breaches of these covenants could result in defaults under the instruments governing the applicable indebtedness even if we had satisfied our payment obligations. If we are unable to refinance our indebtedness at maturity or meet our payment obligations, the amount of our distributable cash flow and our financial condition would be adversely affected.
Adverse changes in our credit ratings could impair our ability to obtain additional debt and equity financing on favorable terms, if at all. Our credit ratings are based on our operating performance, liquidity and leverage ratios, overall financial position and other factors employed by the credit rating agencies in their rating analysis of us. Our credit ratings can affect the amount and type of capital we can access, as well as the terms of any financings we may obtain. There can be no assurance that we will be able to maintain our current credit ratings. In the event our current credit ratings deteriorate, it may be more difficult or expensive to obtain additional financing or refinance existing obligations and commitments. Also, a downgrade in our credit ratings would trigger additional costs or other potentially negative consequences under our current and future credit facilities and debt instruments.
Increases in interest rates would increase our interest expense. At December 31, 2018, we had $195.7 million of variable-rate debt outstanding not protected by interest rate hedge contracts. We may incur additional variable-rate debt in the future. If interest rates increase, then so would the interest expense on our unhedged variable-rate debt, which would adversely affect our financial condition and results of operations. From time to time, we manage our exposure to interest rate risk with interest rate hedge contracts that effectively fix or cap a portion of our variable-rate debt. In addition, we refinance fixed-rate debt at times when we believe rates and terms are appropriate. Our efforts to manage these exposures may not be successful. Our use of interest rate hedge contracts to manage risk associated with interest rate volatility may expose us to additional risks, including a risk that a counterparty to a hedge contract may fail to honor its obligations. Developing an effective interest rate risk strategy is complex and no strategy can completely insulate us from risks associated with interest rate fluctuations. There can be no assurance that our hedging activities will have the desired beneficial impact on our results of operations or financial condition. Termination of interest rate hedge contracts typically involves costs, such as transaction fees or breakage costs.
A lack of any limitation on our debt could result in our becoming more highly leveraged. Our governing documents do not limit the amount of indebtedness we may incur. Accordingly, we may incur additional debt and would do so, for example, if it were necessary to maintain our status as a REIT. We might become more highly leveraged as a result, and our financial condition and cash available for distribution to stockholders might be negatively affected and the risk of default on our indebtedness could increase.
Other Risks
The market value of our common stock could decrease based on our performance and market perception and conditions. The market value of our common stock may be affected by the market’s perception of our operating results, growth potential, and current and future cash dividends and may also be affected by the real estate market value of our underlying assets. The market price of our common stock may be influenced by the dividend on our common stock relative to market interest rates. Rising interest rates may lead potential buyers of our common stock to expect a higher dividend rate, which would adversely affect the market price of our common stock. In addition, rising interest rates would result in increased expense, thereby adversely affecting cash flow and our ability to service our indebtedness and pay dividends.
26
The state of the economy or other adverse changes in general or local economic conditions may adversely affect our operating results and financial condition. Turmoil in the global financial markets may have an adverse impact on the availability of credit to businesses generally and could lead to a further weakening of the U.S. and global economies. Currently these conditions have not impaired our ability to access credit markets and finance our operations. However, our ability to access the capital markets may be restricted at a time when we would like, or need, to raise financing, which could have an impact on our flexibility to react to changing economic and business conditions. Furthermore, deteriorating economic conditions including business layoffs, downsizing, industry slowdowns and other similar factors that affect our customers could continue to negatively impact commercial real estate fundamentals and result in lower occupancy, lower rental rates and declining values in our real estate portfolio and in the collateral securing any loan investments we may make. Additionally, an adverse economic situation could have an impact on our lenders or customers, causing them to fail to meet their obligations to us. No assurances can be given that the effects of an adverse economic situation will not have a material adverse effect on our business, financial condition and results of operations.
We may fail to qualify as a REIT. If we fail to qualify as a REIT, we will not be allowed to deduct distributions to stockholders in computing our taxable income and will be subject to federal income tax at regular corporate rates. In addition, we may be barred from qualification as a REIT for the four years following disqualification. The additional tax incurred at regular corporate rates would significantly reduce the cash flow available for distribution to stockholders and for debt service. Furthermore, we would no longer be required by the Internal Revenue Code to make any distributions to our stockholders as a condition of REIT qualification. Any distributions to stockholders would be taxable as ordinary income to the extent of our current and accumulated earnings and profits. Corporate distributees, however, may be eligible for the dividends received deduction on the distributions, subject to limitations under the Internal Revenue Code. To qualify as a REIT, we must comply with certain highly technical and complex requirements. We cannot be certain we have complied with these requirements because there are few judicial and administrative interpretations of these provisions. In addition, facts and circumstances that may be beyond our control may affect our ability to qualify as a REIT. We cannot assure you that new legislation, regulations, administrative interpretations or court decisions will not change the tax laws significantly with respect to our qualification as a REIT or with respect to the federal income tax consequences of qualification. We cannot assure you that we will remain qualified as a REIT.
Legislative or regulatory action with respect to tax laws and regulations could adversely affect the Company and our stockholders. On December 22, 2017, H.R. 1, informally titled the Tax Cuts and Jobs Act, was enacted. The TCJA made major changes to the Code, including a number of provisions of the Code that affect the taxation of REITs and their stockholders. The long-term effect of the significant changes made by the TCJA remains uncertain, and additional administrative guidance will be required in order to fully evaluate the effect of many provisions. The effect of any technical corrections with respect to the TCJA could have an adverse effect on the Company and our stockholders. We are also subject to state and local tax laws and regulations. Changes in state and local tax laws or regulations may result in an increase in our tax liability. A shortfall in tax revenues for states and municipalities in which we operate may lead to an increase in the frequency and size of such changes. If such changes occur, we may be required to pay additional taxes on our assets or income. These increased tax costs could adversely affect our financial condition, results of operations and the amount of cash available for the payment of dividends.
In addition, in recent years, numerous legislative, judicial and administrative changes have been made to the federal income tax laws applicable to investments in REITs and similar entities. Additional changes to tax laws are likely to continue to occur in the future, and we cannot assure our stockholders that any such changes will not adversely affect the taxation of a stockholder. We cannot assure you that future changes to tax laws and regulations will not have an adverse effect on an investment in our stock.
To maintain our status as a REIT, we limit the amount of shares any one stockholder can own. The Internal Revenue Code imposes certain limitations on the ownership of the stock of a REIT. For example, not more than 50% in value of our outstanding shares of capital stock may be owned, directly or indirectly, by five or fewer individuals (as defined in the Code) during the last half of any taxable year. To protect our REIT status, our charter prohibits any holder from acquiring more than 9.8% (in value or in number, whichever is more restrictive) of our outstanding equity stock (defined as all of our classes of capital stock, except our excess stock (of which there is none outstanding)) unless our Board of Directors grants a waiver. The ownership limit may limit the opportunity for stockholders to receive a premium for their shares of common stock that might otherwise exist if an investor were attempting to assemble a block of shares in excess of 9.8% of the outstanding shares of equity stock or otherwise effect a change in control.
Certain tax and anti-takeover provisions of our charter and bylaws may inhibit a change of our control. Certain provisions contained in our charter and bylaws and the Maryland General Corporation Law may discourage a third party from making a tender offer or acquisition proposal to us. If this were to happen, it could delay, deter or prevent a change in control or the removal of existing management. These provisions also may delay or prevent our stockholders from receiving a premium for their common shares over then-prevailing market prices. These provisions include:
• | the REIT ownership limit described above; |
27
• | special meetings of our stockholders may be called only by the chairman of the board, the chief executive officer, the president, a majority of the board or by stockholders possessing a majority of all the votes entitled to be cast at the meeting; |
• | our Board of Directors may authorize and issue securities without stockholder approval; and |
• | advance-notice requirements for proposals to be presented at stockholder meetings. |
In addition, Maryland law provides protection for Maryland corporations against unsolicited takeovers by limiting, among other things, the duties of the directors in unsolicited takeover situations. The duties of directors of Maryland corporations do not require them to (a) accept, recommend or respond to any proposal by a person seeking to acquire control of the corporation, (b) authorize the corporation to redeem any rights under, or modify or render inapplicable, any stockholders rights plan, (c) make a determination under the Maryland Business Combination Act or the Maryland Control Share Acquisition Act, or (d) act or fail to act solely because of the effect of the act or failure to act may have on an acquisition or potential acquisition of control of the corporation or the amount or type of consideration that may be offered or paid to the stockholders in an acquisition. Moreover, under Maryland law the act of a director of a Maryland corporation relating to or affecting an acquisition or potential acquisition of control is not subject to any higher duty or greater scrutiny than is applied to any other act of a director. Maryland law also contains a statutory presumption that an act of a director of a Maryland corporation satisfies the applicable standards of conduct for directors under Maryland law.
The Maryland Business Combination Act provides that unless exempted, a Maryland corporation may not engage in business combinations, including mergers, dispositions of 10 percent or more of its assets, certain issuances of shares of stock and other specified transactions, with an "interested stockholder" or an affiliate of an interested stockholder for five years after the most recent date on which the interested stockholder became an interested stockholder, and thereafter unless specified criteria are met. An interested stockholder is generally a person owning or controlling, directly or indirectly, 10 percent or more of the voting power of the outstanding stock of the Maryland corporation. These provisions of Maryland law do not apply, however, to business combinations that are approved or exempted by a board of directors prior to the time that the interested stockholder becomes an interested stockholder. Pursuant to the statute, our Board of Directors has by resolution exempted business combinations between us and any other person and such resolution may not be revoked, altered or amended without prior stockholder approval.
The Maryland Control Share Acquisition Act provides that "control shares" of a corporation acquired in a "control share acquisition" shall have no voting rights except to the extent approved by a vote of two-thirds of the votes eligible to cast on the matter. "Control Shares" means shares of stock that, if aggregated with all other shares of stock previously acquired by the acquirer, would entitle the acquirer to exercise voting power in electing directors within one of the following ranges of the voting power: one-tenth or more but less than one-third, one-third or more but less than a majority, or a majority or more of all voting power. A "control share acquisition" means the acquisition of control shares, subject to certain exceptions.
If voting rights of control shares acquired in a control share acquisition are not approved at a stockholders' meeting, then subject to certain conditions and limitations, the issuer may redeem any or all of the control shares for fair value. If voting rights of such control shares are approved at a stockholders' meeting and the acquirer becomes entitled to vote a majority of the shares of stock entitled to vote, all other stockholders may exercise appraisal rights. Our bylaws contain a provision exempting from the Maryland Control Share Acquisition Act any and all acquisitions by any person of our stock. Our bylaws prohibit the repeal, amendment or alteration of this provision without the approval by the Company’s stockholders; however, there can be no assurance that this provision will not be amended or eliminated at some time in the future.
The Company faces risks in attracting and retaining key personnel. Many of our senior executives have strong industry reputations, which aid us in identifying acquisition and development opportunities and negotiating with tenants and sellers of properties. The loss of the services of these key personnel could affect our operations because of diminished relationships with existing and prospective tenants, property sellers and industry personnel. In addition, attracting new or replacement personnel may be difficult in a competitive market.
We have severance and change in control agreements with certain of our officers that may deter changes in control of the Company. If, within a certain time period (as set in the officer’s agreement) following a change in control, we terminate the officer's employment other than for cause, or if the officer elects to terminate his or her employment with us for reasons specified in the agreement, we will make a severance payment equal to the officer's average annual compensation times an amount specified in the officer's agreement, together with the officer's base salary and vacation pay that have accrued but are unpaid through the date of termination. These agreements may deter a change in control because of the increased cost for a third party to acquire control of us.
We rely on information technology in our operations, and any material failure, inadequacy, interruption or security failure of that technology could harm our business. We rely on information technology networks and systems, including the internet, to process,
28
transmit and store electronic information, and to manage or support a variety of business processes, including financial transactions and records, and maintaining personal identifying information and customer and lease data. We purchase some of our information technology from vendors, on whom our systems depend. We rely on commercially available systems, software, tools and monitoring to provide security for the processing, transmission and storage of confidential customer data, including individually identifiable information relating to financial accounts. Although we have taken steps to protect the security of our information systems and the data maintained in those systems, it is possible that our safety and security measures will not prevent the systems' improper functioning or damage, or the improper access or disclosure of personally identifiable information such as in the event of cyber-attacks. Security breaches, including physical or electronic break-ins, computer viruses, attacks by hackers and similar breaches, can create system disruptions, shutdowns or unauthorized disclosure of confidential information. In some cases, it may be difficult to anticipate or immediately detect such incidents and the damage they cause. Any failure to maintain proper function, security and availability of our information systems could interrupt our operations, damage our reputation, subject us to liability claims or regulatory penalties and could have a materially adverse effect on our business, financial condition and results of operations.
We may be impacted by changes in U.S. social, political, regulatory and economic conditions or laws and policies. Any changes to U.S. tax laws, foreign trade, manufacturing, and development and investment in the territories and countries where our customers operate could adversely affect our operating results and our business.
ITEM 1B. UNRESOLVED STAFF COMMENTS.
None.
ITEM 2. PROPERTIES.
EastGroup owned 377 industrial properties and one office building at December 31, 2018. These properties are located primarily in the Sunbelt states of Florida, Texas, Arizona, California and North Carolina, and the majority are clustered around major transportation features in supply constrained submarkets. As of February 13, 2019, EastGroup’s portfolio was 97.3% leased and 96.8% occupied by approximately 1,500 tenants, with no single tenant accounting for more than approximately 1.1% of the Company's income from real estate operations. The Company has developed approximately 46% of its total portfolio (on a square foot basis), including real estate properties and development and value-add properties in lease-up and under construction. The Company’s focus is the ownership of business distribution space (88% of the total portfolio) with the remainder in bulk distribution space (9%) and business service space (3%). Business distribution space properties are typically multi-tenant buildings with a building depth of 200 feet or less, clear height of 24-30 feet, office finish of 10-25% and truck courts with a depth of 100-120 feet. See Consolidated Financial Statement Schedule III – Real Estate Properties and Accumulated Depreciation for a detailed listing of the Company’s properties.
At December 31, 2018, EastGroup did not own any single property with a book value that was 10% or more of total book value or with gross revenues that were 10% or more of total gross revenues.
The Company's lease expirations for the next ten years are detailed below:
Years Ending December 31, | Number of Leases Expiring | Total Area of Leases Expiring (in Square Feet) | Annualized Current Base Rent of Leases Expiring (1) | % of Total Base Rent of Leases Expiring | |||||||
2019 (2) | 296 | 4,429,000 | $ | 28,660,000 | 12.6% | ||||||
2020 | 300 | 6,243,000 | $ | 37,247,000 | 16.3% | ||||||
2021 | 296 | 7,340,000 | $ | 44,134,000 | 19.3% | ||||||
2022 | 206 | 5,618,000 | $ | 34,081,000 | 14.9% | ||||||
2023 | 179 | 4,544,000 | $ | 27,361,000 | 12.0% | ||||||
2024 | 110 | 4,180,000 | $ | 22,504,000 | 9.9% | ||||||
2025 | 36 | 2,057,000 | $ | 12,329,000 | 5.4% | ||||||
2026 | 30 | 1,054,000 | $ | 6,295,000 | 2.8% | ||||||
2027 | 16 | 848,000 | $ | 5,790,000 | 2.5% | ||||||
2028 and beyond | 34 | 1,860,000 | $ | 9,891,000 | 4.3% | ||||||
(1) | Represents the monthly cash rental rates, excluding tenant expense reimbursements, as of December 31, 2018, multiplied by 12 months. |
(2) | Includes month-to-month leases. |
29
ITEM 3. LEGAL PROCEEDINGS.
The Company is not presently involved in any material litigation nor, to its knowledge, is any material litigation threatened against the Company or its properties, other than routine litigation arising in the ordinary course of business or which is expected to be covered by the Company’s liability insurance. The Company cannot predict the outcome of any litigation with certainty, and some lawsuits, claims or proceedings may be disposed of unfavorably to the Company, which could materially affect its financial condition or results of operations.
ITEM 4. MINE SAFETY DISCLOSURES.
Not applicable.
30
PART II. OTHER INFORMATION
ITEM 5. MARKET FOR REGISTRANT'S COMMON EQUITY, RELATED STOCKHOLDER MATTERS AND ISSUER PURCHASES OF EQUITY SECURITIES.
The Company’s shares of common stock are listed for trading on the NYSE under the symbol “EGP.” As of February 13, 2019, there were 450 holders of record of the Company's 36,479,324 outstanding shares of common stock. The Company distributed all of its 2018 and 2017 taxable income to its stockholders. Accordingly, no significant provisions for income taxes were necessary. The following table summarizes the federal income tax treatment for all distributions by the Company for the years 2018 and 2017.
Federal Income Tax Treatment of Share Distributions
Years Ended December 31, | ||||||
2018 | 2017 | |||||
Common Share Distributions: | (Per share) | |||||
Ordinary dividends | $ | 2.14305 | 2.49146 | |||
Nondividend distributions | — | 0.02686 | ||||
Unrecaptured Section 1250 capital gain | — | — | ||||
Other capital gain | — | 0.00168 | ||||
Total Common Distributions | $ | 2.14305 | 2.52000 | |||
Purchases of Equity Securities by the Issuer and Affiliated Purchasers
No shares of common stock were purchased by the Company or withheld by the Company to satisfy any tax withholding obligations during the three-month period ended December 31, 2018.
31
Performance Graph
The following graph compares, over the five years ended December 31, 2018, the cumulative total shareholder return on EastGroup’s common stock with the cumulative total return of the Standard & Poor’s 500 Total Return Index (S&P 500 Total Return) and the FTSE Equity REIT index prepared by the National Association of Real Estate Investment Trusts (FTSE Nareit Equity REITs).
The performance graph and related information shall not be deemed “soliciting material” or be deemed to be “filed” with the SEC, nor shall such information be incorporated by reference into any future filing, except to the extent that the Company specifically incorporates it by reference into such filing.
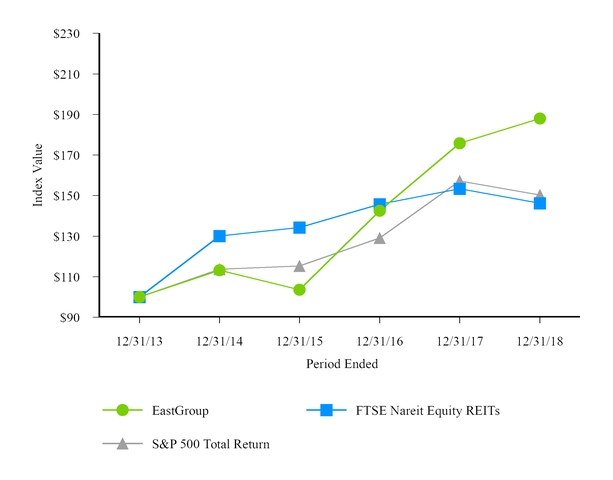
Fiscal years ended December 31, | ||||||||||||||||||
2013 | 2014 | 2015 | 2016 | 2017 | 2018 | |||||||||||||
EastGroup | $ | 100.00 | 113.22 | 103.61 | 142.51 | 175.79 | 187.97 | |||||||||||
FTSE Nareit Equity REITs | 100.00 | 130.14 | 134.30 | 145.74 | 153.36 | 146.27 | ||||||||||||
S&P 500 Total Return | 100.00 | 113.69 | 115.26 | 129.05 | 157.22 | 150.33 | ||||||||||||
The information above assumes that the value of the investment in shares of EastGroup’s common stock and each index was $100 on December 31, 2013, and that all dividends were reinvested.
32
ITEM 6. SELECTED FINANCIAL DATA.
The following table sets forth selected financial and operating data on a historical basis for the Company. The following data should be read in conjunction with the Company’s financial statements and notes thereto and Management’s Discussion and Analysis of Financial Condition and Results of Operations included elsewhere in this Annual Report on Form 10-K. The Company’s historical operating results may not be comparable to the Company’s future operating results.
Years Ended December 31, | |||||||||||||||
2018 | 2017 | 2016 | 2015 | 2014 | |||||||||||
OPERATING DATA | (In thousands, except per share data) | ||||||||||||||
REVENUES | |||||||||||||||
Income from real estate operations | $ | 299,018 | 274,031 | 252,961 | 234,918 | 219,706 | |||||||||
Other revenue | 1,374 | 119 | 86 | 90 | 123 | ||||||||||
300,392 | 274,150 | 253,047 | 235,008 | 219,829 | |||||||||||
Expenses | |||||||||||||||
Expenses from real estate operations | 86,394 | 80,108 | 74,347 | 67,402 | 62,797 | ||||||||||
Depreciation and amortization | 91,704 | 83,874 | 77,935 | 73,290 | 70,314 | ||||||||||
General and administrative | 13,738 | 14,972 | 13,232 | 15,091 | 12,726 | ||||||||||
Acquisition costs | — | — | 161 | 164 | 210 | ||||||||||
191,836 | 178,954 | 165,675 | 155,947 | 146,047 | |||||||||||
Operating income | 108,556 | 95,196 | 87,372 | 79,061 | 73,782 | ||||||||||
Other income (expense) | |||||||||||||||
Interest expense | (35,106 | ) | (34,775 | ) | (35,213 | ) | (34,666 | ) | (35,486 | ) | |||||
Gain, net of loss, on sales of real estate investments | 14,273 | 21,855 | 42,170 | 2,903 | 9,188 | ||||||||||
Other | 913 | 1,313 | 1,765 | 1,101 | 989 | ||||||||||
Net income | 88,636 | 83,589 | 96,094 | 48,399 | 48,473 | ||||||||||
Net income attributable to noncontrolling interest in joint ventures | (130 | ) | (406 | ) | (585 | ) | (533 | ) | (532 | ) | |||||
Net income attributable to EastGroup Properties, Inc. common stockholders | 88,506 | 83,183 | 95,509 | 47,866 | 47,941 | ||||||||||
Other comprehensive income (loss) - Cash flow hedges | 1,353 | 3,353 | 5,451 | (1,099 | ) | (3,986 | ) | ||||||||
TOTAL COMPREHENSIVE INCOME | $ | 89,859 | 86,536 | 100,960 | 46,767 | 43,955 | |||||||||
BASIC PER COMMON SHARE DATA FOR NET INCOME ATTRIBUTABLE TO EASTGROUP PROPERTIES, INC. COMMON STOCKHOLDERS | |||||||||||||||
Net income attributable to common stockholders | $ | 2.50 | 2.45 | 2.93 | 1.49 | 1.53 | |||||||||
Weighted average shares outstanding | 35,439 | 33,996 | 32,563 | 32,091 | 31,341 | ||||||||||
DILUTED PER COMMON SHARE DATA FOR NET INCOME ATTRIBUTABLE TO EASTGROUP PROPERTIES, INC. COMMON STOCKHOLDERS | |||||||||||||||
Net income attributable to common stockholders | $ | 2.49 | 2.44 | 2.93 | 1.49 | 1.52 | |||||||||
Weighted average shares outstanding | 35,506 | 34,047 | 32,628 | 32,196 | 31,452 | ||||||||||
OTHER PER SHARE DATA | |||||||||||||||
Book value, at end of year | $ | 24.74 | 21.56 | 19.13 | 17.11 | 17.72 | |||||||||
Common distributions declared | 2.72 | 2.52 | 2.44 | 2.34 | 2.22 | ||||||||||
Common distributions paid | 2.00 | 2.52 | 2.44 | 2.34 | 2.22 | ||||||||||
BALANCE SHEET DATA (AT END OF YEAR) | |||||||||||||||
Real estate investments, at cost (1) | $ | 2,827,609 | 2,591,358 | 2,419,461 | 2,232,344 | 2,087,821 | |||||||||
Real estate investments, net of accumulated depreciation (1) | 2,012,694 | 1,841,757 | 1,725,211 | 1,574,890 | 1,487,295 | ||||||||||
Total assets | 2,131,705 | 1,953,221 | 1,825,764 | 1,661,904 | 1,572,112 | ||||||||||
Unsecured bank credit facilities, unsecured debt and secured debt | 1,105,787 | 1,108,282 | 1,101,333 | 1,027,909 | 929,465 | ||||||||||
Total liabilities | 1,227,002 | 1,202,091 | 1,183,898 | 1,102,703 | 996,497 | ||||||||||
Noncontrolling interest in joint ventures | 1,644 | 1,658 | 4,205 | 4,339 | 4,486 | ||||||||||
Total stockholders’ equity | 903,059 | 749,472 | 637,661 | 554,862 | 571,129 | ||||||||||
(1) | Includes mortgage loans receivable and unconsolidated investment. See Notes 3 and 4 in the Notes to Consolidated Financial Statements. |
33
ITEM 7. MANAGEMENT'S DISCUSSION AND ANALYSIS OF FINANCIAL CONDITION AND RESULTS OF OPERATIONS.
The following discussion and analysis of results of operations and financial condition should be read in conjunction with the consolidated financial statements and notes thereto appearing elsewhere in this Annual Report on Form 10-K.
OVERVIEW
EastGroup’s goal is to maximize shareholder value by being a leading provider in its markets of functional, flexible and quality business distribution space for location sensitive customers (primarily in the 15,000 to 50,000 square foot range). The Company develops, acquires and operates distribution facilities, the majority of which are clustered around major transportation features in supply-constrained submarkets in major Sunbelt regions. The Company’s core markets are in the states of Florida, Texas, Arizona, California and North Carolina.
The Company believes its current operating cash flow and unsecured bank credit facilities provide the capacity to fund the operations of the Company, and the Company also believes it can issue common and/or preferred equity and obtain debt financing. During 2018, EastGroup issued 1,706,474 shares of common stock through its continuous common equity program, providing net proceeds to the Company of $157 million. Also during 2018, the Company closed $60 million of senior unsecured private placement notes and replaced its $300 million and $35 million unsecured bank credit facilities with new $350 million and $45 million facilities. EastGroup's financing and equity issuances are further described in Liquidity and Capital Resources.
The Company’s primary revenue is rental income. During 2018, the Company executed leases on 7,365,000 square feet, which represents 18.8% of EastGroup’s total of 39,231,000 square feet as of December 31, 2018. For new and renewal leases signed during 2018, average rental rates increased by 15.8% as compared to the former leases on the same spaces.
Property net operating income (PNOI) excluding income from lease terminations from same properties, defined as operating properties owned during the entire current and prior year reporting periods (January 1, 2017 through December 31, 2018), increased 3.8% for 2018 compared to 2017.
EastGroup’s portfolio was 97.3% leased at December 31, 2018 compared to 97.0% at December 31, 2017. Leases scheduled to expire in 2019 were 11.3% of the portfolio on a square foot basis at December 31, 2018. As of February 13, 2019, leases scheduled to expire during the remainder of 2019 were 9.4% of the portfolio on a square foot basis.
The Company generates new sources of leasing revenue through its development and acquisition programs. The Company mitigates risks associated with development through a Board-approved maximum level of land held for development and by adjusting development start dates according to leasing activity.
During 2018, EastGroup acquired 627,000 square feet of operating and value-add properties in Atlanta, Chino (Los Angeles), San Diego, Austin and Dallas and 83 acres of land in Dallas, San Antonio and Phoenix for a total of $87 million. The Company began construction of 12 development projects containing 1,697,000 square feet in Miami, Orlando, Ft. Myers, Atlanta, Dallas, Houston, San Antonio and Charlotte. Also in 2018, the Company transferred 14 development projects and value-add acquisitions (1,719,000 square feet) in Orlando, Tampa, Ft. Lauderdale, Ft. Myers, Charlotte, Atlanta, Houston, San Antonio, Phoenix and Tucson from its development and value-add program to real estate properties with costs of $135.0 million at the date of transfer. As of December 31, 2018, EastGroup's development program consisted of 17 projects (2,264,000 square feet) located in 11 cities. The projected total cost for the development projects, which were collectively 45% leased as of February 13, 2019, is $206 million, of which $56 million remained to be invested as of December 31, 2018.
During 2018, EastGroup sold 339,000 square feet of operating properties and 11 acres of land, generating gross sales proceeds of $25.4 million. The Company recognized $14,273,000 in Gain, net of loss, on sales of real estate investments and $86,000 in Gain, net of loss, on sales of non-operating real estate (included in Other on the Consolidated Statements of Income and Comprehensive Income) during 2018.
Typically, the Company initially funds its development and acquisition programs through its $395 million unsecured bank credit facilities (as discussed in Liquidity and Capital Resources). As market conditions permit, EastGroup issues equity and/or employs fixed-rate debt, including variable-rate debt that has been swapped to an effectively fixed rate through the use of interest rate swaps, to replace short-term bank borrowings. In June 2018, Moody's Investors Service affirmed the Company's issuer rating of Baa2 with a stable outlook. A security rating is not a recommendation to buy, sell or hold securities and may be subject to revision or withdrawal at any time by the assigning rating agency. Each rating should be evaluated independently of any other rating. For future debt issuances, the Company intends to issue primarily unsecured fixed-rate debt, including variable-rate debt that has been
34
swapped to an effectively fixed rate through the use of interest rate swaps. The Company may also access the public debt market in the future as a means to raise capital.
EastGroup has one reportable segment–industrial properties. These properties are primarily located in major Sunbelt regions of the United States. The Company's properties have similar economic characteristics and as a result, have been aggregated into one reportable segment.
The Company’s chief decision makers use two primary measures of operating results in making decisions: (1) property net operating income (PNOI), defined as Income from real estate operations less Expenses from real estate operations (including market-based internal management fee expense) plus the Company's share of income and property operating expenses from its less-than-wholly-owned real estate investments, and (2) funds from operations attributable to common stockholders (FFO), defined as net income (loss) attributable to common stockholders computed in accordance with U.S. generally accepted accounting principles (GAAP), excluding gains or losses from sales of depreciable real estate property and impairment losses, plus real estate related depreciation and amortization, and after adjustments for unconsolidated partnerships and joint ventures. The Company calculates FFO based on the National Association of Real Estate Investment Trusts’ (Nareit) definition.
PNOI is a supplemental industry reporting measurement used to evaluate the performance of the Company’s real estate investments. The Company believes the exclusion of depreciation and amortization in the industry’s calculation of PNOI provides a supplemental indicator of the properties’ performance since real estate values have historically risen or fallen with market conditions. PNOI as calculated by the Company may not be comparable to similarly titled but differently calculated measures for other real estate investment trusts (REITs). The major factors influencing PNOI are occupancy levels, acquisitions and sales, development projects that achieve stabilized operations, rental rate increases or decreases, and the recoverability of operating expenses. The Company’s success depends largely upon its ability to lease space and to recover from tenants the operating costs associated with those leases.
PNOI was calculated as follows for the three fiscal years ended December 31, 2018, 2017 and 2016.
Years Ended December 31, | |||||||||
2018 | 2017 | 2016 | |||||||
(In thousands) | |||||||||
Income from real estate operations | $ | 299,018 | 274,031 | 252,961 | |||||
Expenses from real estate operations | (86,394 | ) | (80,108 | ) | (74,347 | ) | |||
Noncontrolling interest in PNOI of consolidated 80% joint ventures | (314 | ) | (633 | ) | (823 | ) | |||
PNOI from 50% owned unconsolidated investment | 869 | 897 | 906 | ||||||
PROPERTY NET OPERATING INCOME (PNOI) | $ | 213,179 | 194,187 | 178,697 | |||||
Income from real estate operations is comprised of rental income, expense reimbursement pass-through income and other real estate income including lease termination fees. Expenses from real estate operations is comprised of property taxes, insurance, utilities, repair and maintenance expenses, management fees, other operating costs and bad debt expense. Generally, the Company’s most significant operating expenses are property taxes and insurance. Tenant leases may be net leases in which the total operating expenses are recoverable, modified gross leases in which some of the operating expenses are recoverable, or gross leases in which no expenses are recoverable (gross leases represent only a small portion of the Company’s total leases). Increases in property operating expenses are fully recoverable under net leases and recoverable to a high degree under modified gross leases. Modified gross leases often include base year amounts and expense increases over these amounts are recoverable. The Company’s exposure to property operating expenses is primarily due to vacancies and leases for occupied space that limit the amount of expenses that can be recovered.
The following table presents reconciliations of Net Income to PNOI for the three fiscal years ended December 31, 2018, 2017 and 2016.
35
Years Ended December 31, | |||||||||
2018 | 2017 | 2016 | |||||||
(In thousands) | |||||||||
NET INCOME | $ | 88,636 | 83,589 | 96,094 | |||||
Net (gain) on sales of real estate investments | (14,273 | ) | (21,855 | ) | (42,170 | ) | |||
Net (gain) on sales of non-operating real estate | (86 | ) | (293 | ) | (733 | ) | |||
Net loss on other | 70 | — | — | ||||||
Interest income | (156 | ) | (247 | ) | (255 | ) | |||
Other revenue | (1,374 | ) | (119 | ) | (86 | ) | |||
Interest rate swap ineffectiveness | — | — | 5 | ||||||
Depreciation and amortization | 91,704 | 83,874 | 77,935 | ||||||
Company's share of depreciation from unconsolidated investment | 128 | 124 | 124 | ||||||
Interest expense | 35,106 | 34,775 | 35,213 | ||||||
General and administrative expense | 13,738 | 14,972 | 13,232 | ||||||
Acquisition costs | — | — | 161 | ||||||
Noncontrolling interest in PNOI of consolidated 80% joint ventures | (314 | ) | (633 | ) | (823 | ) | |||
PROPERTY NET OPERATING INCOME (PNOI) | $ | 213,179 | 194,187 | 178,697 | |||||
The Company believes FFO is a meaningful supplemental measure of operating performance for equity REITs. The Company believes excluding depreciation and amortization in the calculation of FFO is appropriate since real estate values have historically increased or decreased based on market conditions. FFO is not considered as an alternative to net income (determined in accordance with GAAP) as an indication of the Company’s financial performance, nor is it a measure of the Company’s liquidity or indicative of funds available to provide for the Company’s cash needs, including its ability to make distributions. In addition, FFO, as reported by the Company, may not be comparable to FFO reported by other REITs that do not define the term in accordance with the current Nareit definition. The Company’s key drivers affecting FFO are changes in PNOI (as discussed above), interest rates, the amount of leverage the Company employs and general and administrative expenses. The following table presents reconciliations of Net Income Attributable to EastGroup Properties, Inc. Common Stockholders to FFO Attributable to Common Stockholders for the three fiscal years ended December 31, 2018, 2017 and 2016.
Years Ended December 31, | |||||||||
2018 | 2017 | 2016 | |||||||
(In thousands, except per share data) | |||||||||
NET INCOME ATTRIBUTABLE TO EASTGROUP PROPERTIES, INC. COMMON STOCKHOLDERS | $ | 88,506 | 83,183 | 95,509 | |||||
Depreciation and amortization | 91,704 | 83,874 | 77,935 | ||||||
Company's share of depreciation from unconsolidated investment | 128 | 124 | 124 | ||||||
Depreciation and amortization from noncontrolling interest | (182 | ) | (224 | ) | (214 | ) | |||
Net (gain) on sales of real estate investments | (14,273 | ) | (21,855 | ) | (42,170 | ) | |||
FUNDS FROM OPERATIONS (FFO) ATTRIBUTABLE TO COMMON STOCKHOLDERS | $ | 165,883 | 145,102 | 131,184 | |||||
Net income attributable to common stockholders per diluted share | $ | 2.49 | 2.44 | 2.93 | |||||
Funds from operations (FFO) attributable to common stockholders per diluted share | 4.67 | 4.26 | 4.02 | ||||||
Diluted shares for earnings per share and funds from operations | 35,506 | 34,047 | 32,628 | ||||||
The Company analyzes the following performance trends in evaluating the revenues and expenses of the Company:
• | The FFO change per share represents the increase or decrease in FFO per share from the current year compared to the prior year. For 2018, FFO was $4.67 per share compared with $4.26 per share for 2017, an increase of 9.6%. |
• | For the year ended December 31, 2018, PNOI increased by $18,992,000, or 9.8%, compared to 2017. PNOI increased $11,900,000 from newly developed and value-add properties, $6,712,000 from same property operations and $2,134,000 |
36
from 2017 and 2018 acquisitions; PNOI from operating properties sold in 2017 and 2018 decreased $1,831,000 for 2018 compared to 2017.
• | The same property net operating income change represents the PNOI increase or decrease for the same operating properties owned during the entire current and prior year reporting periods (January 1, 2017 through December 31, 2018). PNOI, excluding income from lease terminations, from same properties increased 3.8% for the year ended December 31, 2018, compared to 2017. |
• | Same property average occupancy represents the average month-end percentage of leased square footage for which the lease term has commenced as compared to the total leasable square footage for the same operating properties owned during the entire current and prior year reporting periods (January 1, 2017 through December 31, 2018). Same property average occupancy for the year ended December 31, 2018, was 96.9% compared to 96.6% for 2017. |
• | Occupancy is the percentage of leased square footage for which the lease term has commenced as compared to the total leasable square footage as of the close of the reporting period. Occupancy at December 31, 2018 was 96.8%. Quarter-end occupancy ranged from 95.7% to 96.4% over the previous four quarters ended December 31, 2017 to September 30, 2018. |
• | Rental rate change represents the rental rate increase or decrease on new and renewal leases compared to the prior leases on the same space. For the year 2018, rental rate increases on new and renewal leases (18.8% of total square footage) averaged 15.8%. |
• | Lease termination fee income is included in Income from real estate operations. For the year 2018, lease termination fee income was $294,000 compared to $468,000 for 2017. |
• | Bad debt expense is included in Expenses from real estate operations. The Company recorded net bad debt expense of $784,000 in 2018 and $499,000 in 2017. |
CRITICAL ACCOUNTING POLICIES AND ESTIMATES
The Company’s management considers the following accounting policies and estimates to be critical to the reported operations of the Company.
Real Estate Properties
The Financial Accounting Standards Board (FASB) Codification provides guidance on how to properly determine the allocation of the purchase price among the individual components of both the tangible and intangible assets based on their respective fair values. Goodwill for business combinations is recorded when the purchase price exceeds the fair value of the assets and liabilities acquired. Factors considered by management in allocating the cost of the properties acquired include an estimate of carrying costs during the expected lease-up periods considering current market conditions and costs to execute similar leases. The allocation to tangible assets (land, building and improvements) is based upon management’s determination of the value of the property as if it were vacant using discounted cash flow models. The Company determines whether any financing assumed is above or below market based upon comparison to similar financing terms for similar properties. The cost of the properties acquired may be adjusted based on indebtedness assumed from the seller that is determined to be above or below market rates.
The purchase price is also allocated among the following categories of intangible assets: the above or below market component of in-place leases, the value of in-place leases, and the value of customer relationships. The value allocable to the above or below market component of an acquired in-place lease is determined based upon the present value (using a discount rate reflecting the risks associated with the acquired leases) of the difference between (i) the contractual amounts to be paid pursuant to the lease over its remaining term, and (ii) management’s estimate of the amounts that would be paid using fair market rates over the remaining term of the lease. The amounts allocated to above and below market leases are included in Other assets and Other liabilities, respectively, on the Consolidated Balance Sheets and are amortized to rental income over the remaining terms of the respective leases. The total amount of intangible assets is further allocated to in-place lease values and customer relationship values based upon management’s assessment of their respective values. These intangible assets are included in Other assets on the Consolidated Balance Sheets and are amortized over the remaining term of the existing lease, or the anticipated life of the customer relationship, as applicable.
For properties under development and value-add properties acquired in the development stage, costs associated with development (i.e., land, construction costs, interest expense, property taxes and other costs associated with development) are aggregated into the total capitalized costs of the property. Included in these costs are management’s estimates for the portions of internal costs
37
(primarily personnel costs) deemed related to such development activities. The internal costs are allocated to specific development projects based on development activity.
FINANCIAL CONDITION
EastGroup’s Total Assets were $2,131,705,000 at December 31, 2018, an increase of $178,484,000 from December 31, 2017. Total Liabilities increased $24,911,000 to $1,227,002,000, and Total Equity increased $153,573,000 to $904,703,000 during the same period. The following paragraphs explain these changes in detail.
Assets
Real Estate Properties
Real estate properties increased $216,747,000 during the year ended December 31, 2018. The increase was primarily due to: (i) the transfer of 14 properties from Development and value-add properties to Real estate properties, as detailed under Development and Value-Add Properties below; (ii) the purchase of the operating properties detailed below; and (iii) capital improvements at the Company's properties. These increases were partially offset by the operating property sales discussed below.
During 2018, EastGroup acquired the following operating properties:
REAL ESTATE PROPERTIES ACQUIRED IN 2018 | Location | Size | Date Acquired | Cost (1) | |||||||
(Square feet) | (In thousands) | ||||||||||
Gwinnett 316 | Atlanta, GA | 65,000 | 04/24/2018 | $ | 4,147 | ||||||
Eucalyptus Distribution Center | Chino, CA | 182,000 | 06/20/2018 | 22,890 | |||||||
Allen Station I & II | Dallas, TX | 220,000 | 08/29/2018 | 23,424 | |||||||
Greenhill Distribution Center | Austin, TX | 45,000 | 12/04/2018 | 4,076 | |||||||
Total Real Estate Property Acquisitions | 512,000 | $ | 54,537 | ||||||||
(1) | Total cost of the operating properties acquired was $57,053,000, of which $54,537,000 was allocated to Real estate properties as indicated above. The Company allocated $18,540,000 of the total purchase price to land using third party land valuations for the Atlanta, Dallas, Austin and Chino (Los Angeles) markets. The market values are considered to be Level 3 inputs as defined by ASC 820, Fair Value Measurement (see Note 18 in the Notes to Consolidated Financial Statements for additional information on ASC 820). Intangibles associated with the purchases of real estate were allocated as follows: $4,224,000 to in-place lease intangibles and $21,000 to above market leases (both included in Other assets on the Consolidated Balance Sheets), and $1,729,000 to below market leases (included in Other liabilities on the Consolidated Balance Sheets). |
During the year ended December 31, 2018, the Company made capital improvements of $37,920,000 on existing and acquired properties (included in the Capital Expenditures table under Results of Operations). Also, the Company incurred costs of $8,556,000 on development projects subsequent to transfer to Real estate properties; the Company records these expenditures as development costs on the Consolidated Statements of Cash Flows.
EastGroup sold the following operating properties during 2018: World Houston 18 in Houston, 56 Commerce Park in Tampa and 35th Avenue Distribution Center in Phoenix. The properties (339,000 square feet combined) were sold for $22.9 million and the Company recognized gains on the sales of $14.3 million.
Development and Value-Add Properties
EastGroup’s investment in Development and value-add properties at December 31, 2018 consisted of properties in lease-up and under construction of $149,860,000 and prospective development (primarily land) of $113,804,000. The Company’s total investment in Development and value-add properties at December 31, 2018 was $263,664,000 compared to $242,014,000 at December 31, 2017. Total capital invested for development and value-add properties during 2018 was $167,667,000, which primarily consisted of costs of $134,957,000 and $21,736,000 as detailed in the Development and Value-Add Properties Activity table below and costs of $8,556,000 on projects subsequent to transfer to Real estate properties. The capitalized costs incurred on development projects subsequent to transfer to Real estate properties include capital improvements at the properties and do not include other capitalized costs associated with development (i.e., interest expense, property taxes and internal personnel costs).
EastGroup capitalized internal development costs of $4,696,000 during the year ended December 31, 2018, compared to $4,754,000 during 2017.
38
During 2018, the Company acquired one value-add property, Siempre Viva Distribution Center in San Diego. At the time of acquisition, Siempre Viva was classified in the lease-up phase and was occupied by the seller under a short-term lease that expired during the third quarter of 2018. EastGroup successfully re-leased the multi-tenant distribution center, which became 100% occupied on January 1, 2019. The total cost for the property acquired by the Company was $14,033,000, of which $13,934,000 was allocated to Development and value-add properties. EastGroup allocated $4,723,000 of the total purchase price to land using third party land valuations for the San Diego market. The market values are considered to be Level 3 inputs as defined by ASC 820, Fair Value Measurement (see Note 18 for additional information on ASC 820). Intangibles associated with the purchase were allocated as follows: $126,000 to in-place lease intangibles (included in Other assets on the Consolidated Balance Sheets), and $27,000 to below market leases (included in Other liabilities on the Consolidated Balance Sheets). These costs are amortized over the remaining lives of the associated leases in place at the time of acquisition. Costs associated with the value-add property acquisitions, except for the amounts allocated to the acquired lease intangibles, are included in the Development and Value-Add Properties Activity table below.
Also during 2018, EastGroup purchased 83 acres of development land in Dallas, San Antonio and Phoenix for $15,507,000. Costs associated with these acquisitions are included in the Development and Value-Add Properties Activity table. These increases were offset by the sale of 11 acres of land for $2,577,000 and the transfer of 14 development projects to Real estate properties during 2018 with a total investment of $135,043,000 as of the date of transfer.
39
DEVELOPMENT AND VALUE-ADD PROPERTIES ACTIVITY | Costs Incurred | |||||||||||||||||
Costs Transferred in 2018 (1) | For the Year Ended 12/31/18 | Cumulative as of 12/31/18 | Estimated Total Costs (2) | Anticipated Building Conversion Date | ||||||||||||||
(In thousands) | ||||||||||||||||||
LEASE-UP | Building Size (Square feet) | |||||||||||||||||
Siempre Viva, San Diego, CA | 115,000 | $ | — | 14,075 | 14,075 | 14,400 | 01/19 | |||||||||||
CreekView 121 3 & 4, Dallas, TX | 158,000 | — | 3,489 | 13,800 | 16,200 | 03/19 | ||||||||||||
Falcon Field, Phoenix, AZ | 96,000 | — | 5,285 | 8,232 | 9,400 | 05/19 | ||||||||||||
Gateway 1, Miami, FL | 200,000 | 9,110 | 11,131 | 20,241 | 25,000 | 05/19 | ||||||||||||
Broadmoor 2, Atlanta, GA | 111,000 | 705 | 5,709 | 6,414 | 7,400 | 11/19 | ||||||||||||
Total Lease-Up | 680,000 | 9,815 | 39,689 | 62,762 | 72,400 | |||||||||||||
UNDER CONSTRUCTION | ||||||||||||||||||
Horizon XI, Orlando, FL | 135,000 | 3,171 | 5,552 | 8,723 | 10,400 | 01/20 | ||||||||||||
Settlers Crossing 1, Austin, TX | 77,000 | — | 4,704 | 6,260 | 7,400 | 01/20 | ||||||||||||
Settlers Crossing 2, Austin, TX | 83,000 | — | 5,442 | 7,115 | 8,400 | 01/20 | ||||||||||||
SunCoast 5, Ft. Myers, FL | 81,000 | 2,704 | 3,831 | 6,535 | 7,700 | 01/20 | ||||||||||||
Airport Commerce Center 3, Charlotte, NC | 96,000 | — | 4,060 | 5,793 | 7,300 | 02/20 | ||||||||||||
Parc North 5, Dallas, TX | 100,000 | 1,683 | 5,270 | 6,953 | 9,200 | 02/20 | ||||||||||||
Steele Creek V, Charlotte, NC | 54,000 | 1,366 | 1,948 | 3,314 | 5,800 | 03/20 | ||||||||||||
Horizon VI, Orlando, FL | 148,000 | 3,418 | 4,807 | 8,225 | 12,700 | 04/20 | ||||||||||||
Ten West Crossing 8, Houston, TX | 132,000 | 1,947 | 4,643 | 6,590 | 10,900 | 04/20 | ||||||||||||
Tri-County Crossing 1 & 2, San Antonio, TX | 203,000 | 2,012 | 6,883 | 8,895 | 14,600 | 04/20 | ||||||||||||
Eisenhauer Point 7 & 8, San Antonio, TX | 336,000 | 4,916 | 8,174 | 13,090 | 24,500 | 05/20 | ||||||||||||
CreekView 121 5 & 6, Dallas, TX | 139,000 | 3,675 | 1,930 | 5,605 | 14,900 | 07/20 | ||||||||||||
Total Under Construction | 1,584,000 | 24,892 | 57,244 | 87,098 | 133,800 | |||||||||||||
PROSPECTIVE DEVELOPMENT (PRIMARILY LAND) | Estimated Building Size (Square feet) | |||||||||||||||||
Phoenix, AZ | 315,000 | — | 6,809 | 6,809 | ||||||||||||||
Ft. Myers, FL | 488,000 | (2,704 | ) | 1,914 | 13,322 | |||||||||||||
Miami, FL | 650,000 | (9,110 | ) | 14,565 | 36,331 | |||||||||||||
Orlando, FL | 214,000 | (6,589 | ) | 1,188 | 5,719 | |||||||||||||
Tampa, FL | 32,000 | — | — | 1,560 | ||||||||||||||
Atlanta, GA | 100,000 | (705 | ) | 224 | 726 | |||||||||||||
Jackson, MS | 28,000 | — | — | 706 | ||||||||||||||
Charlotte, NC | 600,000 | (1,366 | ) | 1,846 | 7,209 | |||||||||||||
Austin, TX | 180,000 | — | 722 | 3,742 | ||||||||||||||
Dallas, TX | 612,000 | (5,358 | ) | 7,954 | 12,192 | |||||||||||||
Houston, TX (3) | 1,123,000 | (2,969 | ) | (1,782 | ) | 16,439 | ||||||||||||
San Antonio, TX | 908,000 | (6,928 | ) | 4,584 | 9,049 | |||||||||||||
Total Prospective Development | 5,250,000 | (35,729 | ) | 38,024 | 113,804 | |||||||||||||
7,514,000 | $ | (1,022 | ) | 134,957 | 263,664 | |||||||||||||
DEVELOPMENT AND VALUE-ADD PROPERTIES TRANSFERRED TO REAL ESTATE PROPERTIES DURING 2018 | Building Size (Square feet) | Building Conversion Date | ||||||||||||||||
Alamo Ridge IV, San Antonio, TX | 97,000 | $ | — | 320 | 7,417 | 03/18 | ||||||||||||
Oak Creek VII, Tampa, FL | 116,000 | — | 601 | 6,732 | 03/18 | |||||||||||||
Weston, Ft. Lauderdale, FL | 134,000 | — | 222 | 15,742 | 03/18 | |||||||||||||
Progress Center 1 & 2, Atlanta, GA | 132,000 | — | 143 | 10,476 | 04/18 | |||||||||||||
Horizon X, Orlando, FL | 104,000 | — | 3,352 | 6,902 | 05/18 | |||||||||||||
SunCoast 4, Ft. Myers, FL | 93,000 | — | 71 | 9,191 | 05/18 | |||||||||||||
Country Club V, Tucson, AZ | 305,000 | — | 7,078 | 21,029 | 06/18 | |||||||||||||
Eisenhauer Point 3, San Antonio, TX | 71,000 | — | 231 | 6,390 | 06/18 | |||||||||||||
Kyrene 202 III, IV & V, Phoenix, AZ | 166,000 | — | 1,146 | 12,689 | 09/18 | |||||||||||||
Steele Creek VII, Charlotte, NC | 120,000 | — | 795 | 8,592 | 09/18 | |||||||||||||
Eisenhauer Point 6, San Antonio, TX | 85,000 | — | 1,356 | 5,406 | 10/18 | |||||||||||||
Horizon XII, Orlando, FL | 140,000 | — | 653 | 11,883 | 10/18 | |||||||||||||
Eisenhauer Point 5, San Antonio, TX | 98,000 | — | 2,012 | 7,816 | 11/18 | |||||||||||||
West Road 5, Houston, TX | 58,000 | 1,022 | 3,756 | 4,778 | 11/18 | |||||||||||||
Total Transferred to Real Estate Properties | 1,719,000 | $ | 1,022 | 21,736 | 135,043 | (4) | ||||||||||||
Footnotes for the Development and Value-Add Properties Activity table are on the following page.
40
(1) | Represents costs transferred from Prospective Development (primarily land) to Under Construction during the period. Negative amounts represent land inventory costs transferred to Under Construction. |
(2) | Included in these costs are development obligations of $52.4 million and tenant improvement obligations of $13.6 million on properties under development. |
(3) | Negative amount represents land inventory costs transferred to Under Construction and land sold on 3/28/18. |
(4) | Represents cumulative costs at the date of transfer. |
Accumulated Depreciation
Accumulated depreciation on real estate, development and value-add properties increased $65,314,000 during 2018 due primarily to depreciation expense of $76,007,000, offset by the sale of 339,000 square feet of operating properties during the period.
Other Assets
Other assets increased $5,202,000 during 2018. A summary of Other assets follows:
December 31, | ||||||
2018 | 2017 | |||||
(In thousands) | ||||||
Leasing costs (principally commissions) | $ | 78,985 | 72,722 | |||
Accumulated amortization of leasing costs | (30,185 | ) | (27,973 | ) | ||
Leasing costs (principally commissions), net of accumulated amortization | 48,800 | 44,749 | ||||
Straight-line rents receivable | 36,365 | 31,609 | ||||
Allowance for doubtful accounts on straight-line rents receivable | (343 | ) | (48 | ) | ||
Straight-line rents receivable, net of allowance for doubtful accounts | 36,022 | 31,561 | ||||
Accounts receivable | 6,033 | 6,004 | ||||
Allowance for doubtful accounts on accounts receivable | (600 | ) | (577 | ) | ||
Accounts receivable, net of allowance for doubtful accounts | 5,433 | 5,427 | ||||
Acquired in-place lease intangibles | 21,696 | 20,690 | ||||
Accumulated amortization of acquired in-place lease intangibles | (9,833 | ) | (8,974 | ) | ||
Acquired in-place lease intangibles, net of accumulated amortization | 11,863 | 11,716 | ||||
Acquired above market lease intangibles | 1,465 | 1,550 | ||||
Accumulated amortization of acquired above market lease intangibles | (902 | ) | (794 | ) | ||
Acquired above market lease intangibles, net of accumulated amortization | 563 | 756 | ||||
Mortgage loans receivable | 2,594 | 4,581 | ||||
Interest rate swap assets | 6,701 | 6,034 | ||||
Goodwill | 990 | 990 | ||||
Prepaid expenses and other assets | 8,265 | 10,215 | ||||
Total Other assets | $ | 121,231 | 116,029 | |||
Liabilities
Unsecured bank credit facilities decreased $1,783,000 during 2018, mainly due to repayments of $448,709,000 and new debt issuance costs incurred during the period, partially offset by borrowings of $448,100,000 and the amortization of debt issuance costs during the period. The Company’s credit facilities are described in greater detail under Liquidity and Capital Resources.
Unsecured debt increased $10,339,000 during 2018, primarily due to the closing of $60 million of senior unsecured private placement notes in April 2018 and the amortization of debt issuance costs. These increases were offset by the repayment of a $50 million senior unsecured term loan in June 2018 and new debt issuance costs incurred during the period. The borrowings and repayments on Unsecured debt are described in greater detail under Liquidity and Capital Resources.
41
Secured debt decreased $11,051,000 during the year ended December 31, 2018. The decrease primarily resulted from regularly scheduled principal payments of $11,289,000 and amortization of premiums on Secured debt, offset by the amortization of debt issuance costs during the period.
Accounts payable and accrued expenses increased $21,596,000 during 2018. A summary of the Company’s Accounts payable and accrued expenses follows:
December 31, | ||||||
2018 | 2017 | |||||
(In thousands) | ||||||
Property taxes payable | $ | 10,718 | 12,081 | |||
Development costs payable | 15,410 | 9,699 | ||||
Real estate improvements and capitalized leasing costs payable | 3,911 | 3,957 | ||||
Interest payable | 4,067 | 3,744 | ||||
Dividends payable | 27,738 | 1,365 | ||||
Book overdraft (1) | 15,048 | 20,902 | ||||
Other payables and accrued expenses | 9,671 | 13,219 | ||||
Total Accounts payable and accrued expenses | $ | 86,563 | 64,967 | |||
(1) Represents checks written before the end of the period which have not cleared the bank; therefore, the bank has not yet advanced cash to the Company. When the checks clear the bank, they will be funded through the Company's working cash line of credit. See Note 1(p) in the Notes to Consolidated Financial Statements.
Other liabilities increased $5,810,000 during 2018. A summary of the Company’s Other liabilities follows:
December 31, | ||||||
2018 | 2017 | |||||
(In thousands) | ||||||
Security deposits | $ | 18,432 | 16,668 | |||
Prepaid rent and other deferred income | 12,728 | 9,352 | ||||
Acquired below market lease intangibles | 5,891 | 4,135 | ||||
Accumulated amortization of acquired below market lease intangibles | (3,028 | ) | (2,147 | ) | ||
Acquired below market lease intangibles, net of accumulated amortization | 2,863 | 1,988 | ||||
Interest rate swap liabilities | — | 695 | ||||
Prepaid tenant improvement reimbursements | 614 | 124 | ||||
Other liabilities | 15 | 15 | ||||
Total Other liabilities | $ | 34,652 | 28,842 | |||
Equity
Additional paid-in capital increased $161,394,000 during 2018 primarily due to the issuance of common stock under the Company's continuous common equity program (as discussed in Liquidity and Capital Resources) and stock-based compensation (as discussed in Note 11 in the Notes to Consolidated Financial Statements). EastGroup issued 1,706,474 shares of common stock under its continuous common equity program with net proceeds to the Company of $157,319,000, which increased Additional paid-in capital by $157,318,000 and Common stock by $1,000.
During 2018, Distributions in excess of earnings increased $9,161,000 as a result of dividends on common stock of $97,667,000 exceeding Net Income Attributable to EastGroup Properties, Inc. Common Stockholders of $88,506,000.
Accumulated other comprehensive income increased $1,353,000 during 2018. The increase resulted from the change in fair value of the Company's interest rate swaps (cash flow hedges) which are further discussed in Notes 12 and 13 in the Notes to Consolidated Financial Statements.
42
RESULTS OF OPERATIONS
2018 Compared to 2017
Net Income Attributable to EastGroup Properties, Inc. Common Stockholders for 2018 was $88,506,000 ($2.50 per basic and $2.49 per diluted share) compared to $83,183,000 ($2.45 per basic and $2.44 per diluted share) for 2017.
PNOI increased by $18,992,000 ($.53 per diluted share) for 2018 as compared to 2017. EastGroup recognized net gains on sales of real estate investments and non-operating real estate of $14,359,000 ($.40 per diluted share) compared to $22,148,000 ($.65 per diluted share) during 2017. In addition, Depreciation and amortization expense increased by $7,830,000 ($.22 per diluted share), and General and administrative expense decreased by $1,234,000 ($.03 per diluted share) during 2018 compared to 2017. During 2018, EastGroup recognized gain on casualties and involuntary conversion of $1,245,000 ($.04 per diluted share), compared to zero during 2017.
PNOI increased by $18,992,000, or 9.8%, for 2018 compared to 2017. PNOI increased $11,900,000 from newly developed and value-add properties, $6,712,000 from same property operations and $2,134,000 from 2017 and 2018 acquisitions; PNOI from operating properties sold in 2017 and 2018 decreased $1,831,000 for 2018 compared to 2017. For the year 2018, lease termination fee income was $294,000 compared to $468,000 for 2017. The Company recorded net bad debt expense of $784,000 in 2018 and $499,000 in 2017. Straight-lining of rent increased Income from real estate operations by $5,116,000 and $3,723,000 in 2018 and 2017, respectively.
The Company signed 132 leases with certain free rent concessions on 3,800,000 square feet during 2018 with total free rent concessions of $5,944,000 over the lives of the leases, compared to 138 leases with free rent concessions on 3,919,000 square feet with total free rent concessions of $5,672,000 over the lives of the leases in 2017.
The Company’s percentage of leased square footage was 97.3% at December 31, 2018, compared to 97.0% at December 31, 2017. Occupancy at the end of 2018 was 96.8% compared to 96.4% at the end of 2017.
Same property average occupancy represents the average month-end percentage of leased square footage for which the lease term has commenced as compared to the total leasable square footage for the same operating properties owned during the entire current and prior year reporting periods (January 1, 2017 through December 31, 2018). Same property average occupancy for the year ended December 31, 2018, was 96.9% compared to 96.6% for 2017.
The same property average rental rate calculated in accordance with GAAP represents the average annual rental rates of leases in place for the same operating properties owned during the entire current and prior year reporting periods. The same property average rental rate was $5.94 per square foot for the year ended December 31, 2018, compared to $5.74 per square foot for 2017.
43
Interest Expense increased $331,000 for 2018 compared to 2017. The following table presents the components of Interest Expense for 2018 and 2017:
Years Ended December 31, | |||||||||
2018 | 2017 | Increase (Decrease) | |||||||
(In thousands) | |||||||||
VARIABLE RATE INTEREST EXPENSE | |||||||||
Unsecured bank credit facilities interest - variable rate (excluding amortization of facility fees and debt issuance costs) | $ | 3,736 | 2,379 | 1,357 | |||||
Amortization of facility fees - unsecured bank credit facilities | 736 | 670 | 66 | ||||||
Amortization of debt issuance costs - unsecured bank credit facilities | 508 | 451 | 57 | ||||||
Total variable rate interest expense | 4,980 | 3,500 | 1,480 | ||||||
FIXED RATE INTEREST EXPENSE | |||||||||
Unsecured bank credit facilities interest - fixed rate (1) (2) (excluding amortization of facility fees and debt issuance costs) | 1,001 | 1,616 | (615 | ) | |||||
Unsecured debt interest (1) (excluding amortization of debt issuance costs) | 24,544 | 22,425 | 2,119 | ||||||
Secured debt interest (excluding amortization of debt issuance costs) | 10,071 | 12,201 | (2,130 | ) | |||||
Amortization of debt issuance costs - unsecured debt | 564 | 479 | 85 | ||||||
Amortization of debt issuance costs - secured debt | 280 | 319 | (39 | ) | |||||
Total fixed rate interest expense | 36,460 | 37,040 | (580 | ) | |||||
Total interest | 41,440 | 40,540 | 900 | ||||||
Less capitalized interest | (6,334 | ) | (5,765 | ) | (569 | ) | |||
TOTAL INTEREST EXPENSE | $ | 35,106 | 34,775 | 331 | |||||
(1) | Includes interest on the Company's unsecured bank credit facilities and unsecured debt with fixed interest rates per the debt agreements or effectively fixed interest rates due to interest rate swaps, as discussed in Note 13 in the Notes to Consolidated Financial Statements. |
(2) | The Company had designated an interest rate swap to an $80 million unsecured bank credit facility draw that effectively fixed the interest rate on the $80 million draw to 2.020% through the interest rate swap's maturity date. This swap matured on August 15, 2018, and the $80 million draw has reverted to the variable interest rate associated with the Company's unsecured bank credit facilities. |
EastGroup's variable rate interest expense increased by $1,480,000 for 2018 as compared to 2017 primarily due to increases in the Company's weighted average interest rate and average borrowings on its unsecured bank credit facilities as shown in the following table:
Years Ended December 31, | ||||||||||
2018 | 2017 | Increase (Decrease) | ||||||||
(In thousands, except rates of interest) | ||||||||||
Average borrowings on unsecured bank credit facilities - variable rate | $ | 141,223 | 114,751 | 26,472 | ||||||
Weighted average variable interest rates (excluding amortization of facility fees and debt issuance costs) | 2.64 | % | 2.07 | % | ||||||
The Company's fixed rate interest expense decreased by $580,000 for 2018 as compared to 2017 as a result of the secured debt, unsecured debt and fixed rate unsecured bank credit facilities activity described below.
Secured debt interest decreased by $2,130,000 in 2018 as compared to 2017 as a result of regularly scheduled principal payments and debt repayments. Regularly scheduled principal payments on secured debt were $11,289,000 during 2018 and $13,139,000 in 2017. The Company did not repay any secured debt in 2018. The details of the secured debt repaid in 2017 are shown in the following table:
SECURED DEBT REPAID IN 2017 | Interest Rate | Date Repaid | Payoff Amount | |||||
(In thousands) | ||||||||
Arion 16, Broadway VI, Chino, East University I & II, Northpark I-IV, Santan 10 II, 55th Avenue and World Houston 1 & 2, 21 & 23 | 5.57% | 08/07/2017 | $ | 45,069 | ||||
44
EastGroup did not obtain any new secured debt during 2017 or 2018.
Interest expense from fixed rate unsecured debt increased by $2,119,000 during 2018 as compared to 2017 as a result of the Company's unsecured debt activity described below. The details of the unsecured debt obtained in 2017 and 2018 are shown in the following table:
NEW UNSECURED DEBT IN 2017 and 2018 | Effective Interest Rate | Date Obtained | Maturity Date | Amount | ||||||
(In thousands) | ||||||||||
$60 Million Senior Unsecured Notes | 3.460% | 12/13/2017 | 12/13/2024 | $ | 60,000 | |||||
$60 Million Senior Unsecured Notes | 3.930% | 04/10/2018 | 04/10/2028 | 60,000 | ||||||
Weighted Average/Total Amount for 2017 and 2018 | 3.695% | $ | 120,000 | |||||||
The increase in interest expense from the new unsecured debt was partially offset by the refinancing of two unsecured loans and the repayment of a $50 million unsecured term loan. In December 2017, the Company refinanced a $75 million unsecured term loan, resulting in a 30 basis point reduction in the loan's interest rate. The loan, which has a maturity date of December 20, 2020, now has an effectively fixed interest rate of 3.452%. In February 2018, EastGroup refinanced a $65 million unsecured term loan, resulting in a 55 basis point reduction in the loan's interest rate. The loan, which has a maturity date of April 1, 2023, now has an effectively fixed interest rate of 2.313%. In June 2018, the Company repaid (with no penalty) a $50 million senior unsecured term loan with an effective interest rate of 3.91% and an original maturity date of December 21, 2018.
Interest expense from fixed rate unsecured bank credit facilities decreased by $615,000 during 2018 as compared to 2017 due to the August 15, 2018 maturity of an interest rate swap designated to an $80 million draw on the Company's unsecured bank credit facilities. See footnote (2) in the interest expense summary table above for additional details.
Interest costs during the period of construction of real estate properties are capitalized and offset against interest expense. Capitalized interest increased by $569,000 for 2018 as compared to 2017. The increase is due to changes in development spending and borrowing rates.
Depreciation and amortization expense increased $7,830,000 for 2018 compared to 2017 primarily due to the operating properties acquired by the Company during 2017 and 2018 and the properties transferred from Development and value-add properties in 2017 and 2018, partially offset by operating properties sold in 2017 and 2018.
Gain, net of loss, on sales of real estate investments, which includes gains and losses on the sales of operating properties, decreased $7,582,000 for 2018 as compared to 2017. Net gain on sales of non-operating real estate (included in Other on the Consolidated Statements of Income and Comprehensive Income) decreased $207,000 for 2018 as compared to 2017. The Company's 2017 and 2018 sales transactions are described below in Real Estate Sold and Held for Sale/Discontinued Operations.
45
Real Estate Improvements
Real estate improvements for EastGroup’s operating properties for the years ended December 31, 2018 and 2017 were as follows:
Estimated Useful Life | Years Ended December 31, | |||||||
2018 | 2017 | |||||||
(In thousands) | ||||||||
Upgrade on Acquisitions | 40 yrs | $ | 294 | 161 | ||||
Tenant Improvements: | ||||||||
New Tenants | Lease Life | 12,896 | 11,413 | |||||
Renewal Tenants | Lease Life | 2,926 | 3,357 | |||||
Other: | ||||||||
Building Improvements | 5-40 yrs | 9,012 | 3,362 | |||||
Roofs | 5-15 yrs | 9,053 | 6,197 | |||||
Parking Lots | 3-5 yrs | 2,878 | 1,880 | |||||
Other | 5 yrs | 861 | 1,101 | |||||
Total Real Estate Improvements (1) | $ | 37,920 | 27,471 | |||||
(1) | Reconciliation of Total Real Estate Improvements to Real Estate Improvements on the Consolidated Statements of Cash Flows: |
Years Ended December 31, | |||||||
2018 | 2017 | ||||||
(In thousands) | |||||||
Total Real Estate Improvements | $ | 37,920 | 27,471 | ||||
Change in Real Estate Property Payables | 581 | (1,313 | ) | ||||
Change in Construction in Progress | (999 | ) | 1,227 | ||||
Real Estate Improvements on the Consolidated Statements of Cash Flows | $ | 37,502 | 27,385 | ||||
Capitalized Leasing Costs
The Company’s leasing costs (principally commissions) are capitalized and included in Other assets. The costs are amortized over the terms of the associated leases, and the amortization is included in Depreciation and amortization expense. Capitalized leasing costs for the years ended December 31, 2018 and 2017 were as follows:
Estimated Useful Life | Years Ended December 31, | |||||||
2018 | 2017 | |||||||
(In thousands) | ||||||||
Development and Value-Add | Lease Life | $ | 4,843 | 5,571 | ||||
New Tenants | Lease Life | 5,880 | 5,782 | |||||
Renewal Tenants | Lease Life | 5,038 | 4,907 | |||||
Total Capitalized Leasing Costs | $ | 15,761 | 16,260 | |||||
Amortization of Leasing Costs | $ | 11,493 | 10,329 | |||||
Real Estate Sold and Held for Sale/Discontinued Operations
The Company considers a real estate property to be held for sale when it meets the criteria established under ASC 360, Property, Plant and Equipment, including when it is probable that the property will be sold within a year. Real estate properties held for sale are reported at the lower of the carrying amount or fair value less estimated costs to sell and are not depreciated while they are held for sale.
In accordance with FASB Accounting Standards Update (ASU) 2014-08, Presentation of Financial Statements (Topic 205) and Property, Plant, and Equipment (Topic 360), Reporting Discontinued Operations and Disclosures of Disposals of Components of an Entity, the Company would report a disposal of a component of an entity or a group of components of an entity in discontinued operations if the disposal represents a strategic shift that has (or will have) a major effect on an entity's operations and financial results when the component or group of components meets the criteria to be classified as held for sale or when the component or group of components is disposed of by sale or other than by sale. In addition, the Company would provide additional disclosures
46
about both discontinued operations and the disposal of an individually significant component of an entity that does not qualify for discontinued operations presentation in the financial statements. EastGroup performs an analysis of properties sold to determine whether the sales qualify for discontinued operations presentation.
The Company did not classify any properties as held for sale as of December 31, 2018 and 2017.
The Company does not consider its sales in 2017 and 2018 to be disposals of a component of an entity or a group of components of an entity representing a strategic shift that has (or will have) a major effect on the entity's operations and financial results.
In 2018, EastGroup sold the following operating properties: World Houston 18 in Houston; 56 Commerce Park in Tampa; and 35th Avenue Distribution Center in Phoenix. The properties contain a combined 339,000 square feet and were sold for $22.9 million. EastGroup recognized gains on the sales of $14.3 million. The Company also sold 11 acres of land in Houston for $2.6 million and recognized a gain on the sale of $86,000.
During 2017, Eastgroup sold Stemmons Circle in Dallas and Techway Southwest I-IV in Houston. The properties, which contain 514,000 square feet, were sold for $38.0 million and the Company recognized gains on the sales of $21.9 million. The Company also sold 19 acres of land in El Paso and Dallas for $3,778,000 and recognized net gains of $293,000.
The gains and losses on the sales of land are included in Other on the Consolidated Statements of Income and Comprehensive Income, and the gains and losses on the sales of operating properties are included in Gain, net of loss, on sales of real estate investments. See Notes 1(f) and 2 in the Notes to Consolidated Financial Statements for more information related to discontinued operations and gains and losses on sales of real estate investments.
2017 Compared to 2016
Net Income Attributable to EastGroup Properties, Inc. Common Stockholders for 2017 was $83,183,000 ($2.45 per basic and $2.44 per diluted share) compared to $95,509,000 ($2.93 per basic and diluted share) for 2016.
PNOI increased by $15,490,000 ($.45 per diluted share) for 2017 as compared to 2016. EastGroup recognized net gains on sales of real estate investments and non-operating real estate of $22,148,000 ($.65 per diluted share) compared to $42,903,000 ($1.31 per diluted share) during 2016. In addition, Depreciation and amortization expense increased by $5,939,000 ($.17 per diluted share), and General and administrative expense increased by $1,740,000 ($.05 per share) during 2017 compared to 2016.
PNOI increased by $15,490,000, or 8.7%, for 2017 compared to 2016. PNOI increased $10,327,000 from newly developed and value-add properties, $4,765,000 from same property operations and $3,355,000 from 2016 and 2017 acquisitions; PNOI decreased $2,767,000 from operating properties sold in 2016 and 2017. For the year 2017, lease termination fee income was $468,000 compared to $812,000 for 2016. The Company recorded net bad debt expense of $499,000 in 2017 and $992,000 in 2016. Straight-lining of rent increased Income from real estate operations by $3,723,000 and $2,839,000 in 2017 and 2016, respectively.
The Company signed 138 leases with certain free rent concessions on 3,919,000 square feet during 2017 with total free rent concessions of $5,672,000 over the lives of the leases, compared to 143 leases with free rent concessions on 4,176,000 square feet with total free rent concessions of $5,286,000 over the lives of the leases in 2016.
The Company’s percentage of leased square footage was 97.0% at December 31, 2017, compared to 97.3% at December 31, 2016. Occupancy at the end of 2017 was 96.4% compared to 96.8% at the end of 2016.
Same property average occupancy for the year ended December 31, 2017, was 96.8% compared to 96.5% for 2016. The same property average rental rate was $5.79 per square foot for the year ended December 31, 2017, compared to $5.57 per square foot for 2016.
47
Interest expense decreased $438,000 in 2017 compared to 2016. The following table presents the components of Interest expense for 2017 and 2016:
Years Ended December 31, | |||||||||
2017 | 2016 | Increase (Decrease) | |||||||
(In thousands) | |||||||||
VARIABLE RATE INTEREST EXPENSE | |||||||||
Unsecured bank credit facilities interest - variable rate (excluding amortization of facility fees and debt issuance costs) | $ | 2,379 | 1,583 | 796 | |||||
Amortization of facility fees - unsecured bank credit facilities | 670 | 670 | — | ||||||
Amortization of debt issuance costs - unsecured bank credit facilities | 451 | 450 | 1 | ||||||
Total variable rate interest expense | 3,500 | 2,703 | 797 | ||||||
FIXED RATE INTEREST EXPENSE | |||||||||
Unsecured bank credit facilities interest - fixed rate (1) (excluding amortization of facility fees and debt issuance costs) | 1,616 | 614 | 1,002 | ||||||
Unsecured debt interest (1) (excluding amortization of debt issuance costs) | 22,425 | 19,245 | 3,180 | ||||||
Secured debt interest (excluding amortization of debt issuance costs) | 12,201 | 16,907 | (4,706 | ) | |||||
Amortization of debt issuance costs - unsecured debt | 479 | 700 | (221 | ) | |||||
Amortization of debt issuance costs - secured debt | 319 | 384 | (65 | ) | |||||
Total fixed rate interest expense | 37,040 | 37,850 | (810 | ) | |||||
Total interest | 40,540 | 40,553 | (13 | ) | |||||
Less capitalized interest | (5,765 | ) | (5,340 | ) | (425 | ) | |||
TOTAL INTEREST EXPENSE | $ | 34,775 | 35,213 | (438 | ) | ||||
(1) | Includes interest on the Company's unsecured bank credit facilities and unsecured debt with fixed interest rates per the debt agreements or effectively fixed interest rates due to interest rate swaps, as discussed in Note 13 in the Notes to Consolidated Financial Statements. |
EastGroup's variable rate interest expense increased by $797,000 for 2017 as compared to 2016 primarily due to increases in the Company's weighted average interest rate and average borrowings on its unsecured bank credit facilities as shown in the following table:
Years Ended December 31, | ||||||||||
2017 | 2016 | Increase (Decrease) | ||||||||
(In thousands, except rates of interest) | ||||||||||
Average borrowings on unsecured bank credit facilities - variable rate | $ | 114,751 | 106,352 | 8,399 | ||||||
Weighted average variable interest rates (excluding amortization of facility fees and debt issuance costs) | 2.07 | % | 1.49 | % | ||||||
The Company's fixed rate interest expense decreased by $810,000 for 2017 as compared to 2016 as a result of the secured debt, fixed rate unsecured bank credit facilities and unsecured debt activity described below.
Secured debt interest decreased by $4,706,000 in 2017 as compared to 2016 as a result of regularly scheduled principal payments and debt repayments. Regularly scheduled principal payments on secured debt were $13,139,000 during 2017 and $17,037,000 in 2016. The details of the secured debt repaid in 2016 and 2017 are shown in the following table:
48
SECURED DEBT REPAID IN 2016 AND 2017 | Interest Rate | Date Repaid | Payoff Amount | |||||
(In thousands) | ||||||||
Huntwood and Wiegman I | 5.68% | 08/05/2016 | $ | 24,543 | ||||
Alamo Downs, Arion 1-15 & 17, Rampart I-IV, Santan 10 I and World Houston 16 | 5.97% | 09/06/2016 | 51,194 | |||||
Weighted Average/Total Amount for 2016 | 5.88% | $ | 75,737 | |||||
Arion 16, Broadway VI, Chino, East University I & II, Northpark I-IV, Santan 10 II, 55th Avenue and World Houston 1 & 2, 21 & 23 | 5.57% | 08/07/2017 | $ | 45,069 | ||||
Weighted Average/Total Amount for 2016 and 2017 | 5.76% | $ | 120,806 | |||||
EastGroup did not obtain any new secured debt during 2016 or 2017.
The decrease in secured debt interest expense was partially offset by increases in interest expense from unsecured debt and fixed rate unsecured bank credit facilities.
The Company's interest expense from unsecured debt increased by $3,180,000 during 2017 as compared to 2016 as a result of the Company's unsecured debt activity described below. The details of the unsecured debt obtained in 2016 and 2017 are shown in the following table:
NEW UNSECURED DEBT IN 2016 and 2017 | Effective Interest Rate | Date Obtained | Maturity Date | Amount | ||||||
(In thousands) | ||||||||||
$65 Million Unsecured Term Loan (1) | 2.863% | 04/01/2016 | 04/01/2023 | $ | 65,000 | |||||
$40 Million Unsecured Term Loan (2) | 2.335% | 07/29/2016 | 07/30/2021 | 40,000 | ||||||
$60 Million Senior Unsecured Notes | 3.480% | 12/15/2016 | 12/15/2024 | 60,000 | ||||||
$40 Million Senior Unsecured Notes | 3.750% | 12/15/2016 | 12/15/2026 | 40,000 | ||||||
Weighted Average/Total Amount for 2016 | 3.114% | $ | 205,000 | |||||||
$60 Million Senior Unsecured Notes | 3.460% | 12/13/2017 | 12/13/2024 | $ | 60,000 | |||||
Weighted Average/Total Amount for 2016 and 2017 | 3.192% | $ | 265,000 | |||||||
(1) | The interest rate on this unsecured term loan is comprised of LIBOR plus 165 basis points subject to a pricing grid for changes in the Company's coverage ratings. The Company entered into an interest rate swap to convert the loan's LIBOR rate to a fixed interest rate, providing the Company a weighted average effective interest rate on the term loan of 2.863% as of December 31, 2017. In February 2018, the Company refinanced this term loan, changing the rate to LIBOR plus 110 basis points which equates to an effective fixed interest rate of 2.313% at December 31, 2018. See Note 13 in the Notes to Consolidated Financial Statements for additional information on the interest rate swaps. |
(2) | The interest rate on this unsecured term loan is comprised of LIBOR plus 110 basis points subject to a pricing grid for changes in the Company's coverage ratings. The Company entered into an interest rate swap to convert the loan's LIBOR rate to a fixed interest rate, providing the Company a weighted average effective interest rate on the term loan of 2.335% as of December 31, 2017. See Note 13 in the Notes to Consolidated Financial Statements for additional information on the interest rate swaps. |
Additionally, in December 2017, the Company refinanced a $75 million unsecured term loan, resulting in a 30 basis point reduction in the loan's interest rate. The loan, which has a maturity date of December 20, 2020, now has an effectively fixed interest rate of 3.452%.
The Company's interest expense from fixed rate unsecured bank credit facilities increased by $1,002,000 during 2017 as compared to 2016. In August 2016, EastGroup repaid (with no penalty) an $80 million unsecured term loan with an effectively fixed interest rate of 2.770% and an original maturity date of August 15, 2018. On the same day, the Company borrowed $80 million through its $300 million unsecured bank credit facility. The Company re-designated the interest rate swap that was previously applied to the $80 million unsecured term loan to the $80 million unsecured bank credit facility borrowing. The $80 million unsecured bank credit facility draw had an effectively fixed interest rate of 2.020% through the interest rate swap's maturity date of August 15, 2018. Since maturity, the $80 million draw has reverted to the variable interest rate associated with the Company's unsecured bank credit facilities
Interest costs during the period of construction of real estate properties are capitalized and offset against interest expense. Capitalized interest increased by $425,000 for 2017 as compared to 2016.
49
Depreciation and amortization expense increased $5,939,000 for 2017 compared to 2016 primarily due to the operating properties acquired by the Company during 2016 and 2017 and the properties transferred from Development and value-add properties in 2016 and 2017, partially offset by operating properties sold in 2016 and 2017.
Gain, net of loss, on sales of real estate investments, which includes gains and losses on the sales of operating properties, decreased $20,315,000 for 2017 as compared to 2016. Gain, net of loss, on sales of non-operating real estate (included in Other on the Consolidated Statements of Income and Comprehensive Income) decreased $440,000 for 2017 as compared to 2016. The Company's 2016 and 2017 sales transactions are described below in Real Estate Sold and Held for Sale/Discontinued Operations.
Real Estate Improvements
Real Estate Improvements for EastGroup’s operating properties for the years ended December 31, 2017 and 2016 were as follows:
Estimated Useful Life | Years Ended December 31, | |||||||
2017 | 2016 | |||||||
(In thousands) | ||||||||
Upgrade on Acquisitions | 40 yrs | $ | 161 | 394 | ||||
Tenant Improvements: | ||||||||
New Tenants | Lease Life | 11,413 | 9,976 | |||||
Renewal Tenants | Lease Life | 3,357 | 2,748 | |||||
Other: | ||||||||
Building Improvements | 5-40 yrs | 3,362 | 5,113 | |||||
Roofs | 5-15 yrs | 6,197 | 2,785 | |||||
Parking Lots | 3-5 yrs | 1,880 | 1,377 | |||||
Other | 5 yrs | 1,101 | 764 | |||||
Total Real Estate Improvements (1) | $ | 27,471 | 23,157 | |||||
(1) | Reconciliation of Total Real Estate Improvements to Real Estate Improvements on the Consolidated Statements of Cash Flows: |
Years Ended December 31, | |||||||
2017 | 2016 | ||||||
(In thousands) | |||||||
Total Real Estate Improvements | $ | 27,471 | 23,157 | ||||
Change in Real Estate Property Payables | (1,313 | ) | 621 | ||||
Change in Construction in Progress | 1,227 | 31 | |||||
Real Estate Improvements on the Consolidated Statements of Cash Flows | $ | 27,385 | 23,809 | ||||
Capitalized Leasing Costs
The Company’s leasing costs (principally commissions) are capitalized and included in Other assets. The costs are amortized over the terms of the associated leases, and the amortization is included in Depreciation and amortization expense. Capitalized leasing costs for the years ended December 31, 2017 and 2016 were as follows:
Estimated Useful Life | Years Ended December 31, | |||||||
2017 | 2016 | |||||||
(In thousands) | ||||||||
Development and Value-Add | Lease Life | $ | 5,571 | 4,217 | ||||
New Tenants | Lease Life | 5,782 | 5,273 | |||||
Renewal Tenants | Lease Life | 4,907 | 4,978 | |||||
Total Capitalized Leasing Costs | $ | 16,260 | 14,468 | |||||
Amortization of Leasing Costs | $ | 10,329 | 9,932 | |||||
50
Real Estate Held for Sale/Discontinued Operations
The Company did not classify any properties as held for sale as of December 31, 2017 and 2016.
The Company does not consider its sales in 2016 and 2017 to be disposals of a component of an entity or a group of components of an entity representing a strategic shift that has (or will have) a major effect on the entity's operations and financial results.
In 2017, Eastgroup sold Stemmons Circle and Techway Southwest I-IV. The properties, which contain 514,000 square feet and are located in Houston and Dallas, were sold for $38.0 million and the Company recognized net gains on the sales of $21.9 million. The Company also sold 19 acres of land in El Paso and Dallas for $3,778,000 and recognized net gains of $293,000.
During 2016, EastGroup sold the following operating properties: Northwest Point Distribution and Service Centers, North Stemmons II and III, America Plaza, Lockwood Distribution Center, West Loop Distribution Center 1 & 2, two of its four Interstate Commons Distribution Center buildings, Castilian Research Center and Memphis I. The properties, which contain 1,256,000 square feet and are located in Houston, Dallas, Phoenix, Santa Barbara and Memphis, were sold for $75.7 million and the Company recognized net gains on the sales of $42.2 million. The Company also sold 25 acres of land in Dallas, Orlando and Houston for $5.4 million and recognized net gains on sales of $733,000.
The gains and losses on the sales of land are included in Other on the Consolidated Statements of Income and Comprehensive Income, and the gains and losses on the sales of operating properties are included in Gain, net of loss, on sales of real estate investments. See Notes 1(f) and 2 in the Notes to Consolidated Financial Statements for more information related to discontinued operations and gains and losses on sales of real estate investments.
RECENT ACCOUNTING PRONOUNCEMENTS
EastGroup has evaluated all ASUs recently released by the FASB through the date the financial statements were issued and determined that the following ASUs apply to the Company.
In May 2014, the FASB issued ASU 2014-09, Revenue from Contracts with Customers, which requires an entity to recognize the amount of revenue to which it expects to be entitled for the transfer of promised goods or services to customers. The FASB issued further guidance in ASU 2016-12, Revenue from Contracts with Customers (Topic 606): Narrow-Scope Improvements and Practical Expedients, that provides clarifying guidance in certain narrow areas and adds some practical expedients. The new standard was effective for the Company on January 1, 2018, and the Company used the modified retrospective approach upon adoption. The adoption of ASU 2014-09 did not have a material impact on the Company's financial condition or results of operations.
In January 2016, the FASB issued ASU 2016-01, Financial Instruments - Overall (Subtopic 825-10): Recognition and Measurement of Financial Assets and Financial Liabilities,which requires public business entities to use the exit price notion when measuring the fair value of financial instruments for disclosure purposes, requires separate presentation of financial assets and financial liabilities by measurement category and form of financial asset, and eliminates the requirement for public business entities to disclose the methods and significant assumptions used to estimate the fair value that is required to be disclosed for financial instruments measured at amortized costs on the balance sheet. EastGroup adopted ASU 2016-01 effective January 1, 2018. The adoption of ASU 2016-01 did not have a material impact on the Company's financial condition or results of operations.
In February 2016, the FASB issued ASU 2016-02, Leases (Topic 842), which requires lessees to recognize the following for all leases (with the exception of short-term leases) at the commencement date: (1) a lease liability, which is a lessee's obligation to make lease payments arising from a lease, measured on a discounted basis; and (2) a right-of-use asset, which is an asset that represents the lessee's right to use, or control the use of, a specified asset for the lease term. The Company is a lessee on a limited number of leases, including office and ground leases, and while the adoption of ASU 2016-02 will impact the Company's accounting for office and ground leases, the Company anticipates the impact will not be material to its overall financial condition and results of operations. The Company anticipates the right-of-use asset and lease liability values for its office and ground leases will be less than 1% of Total assets. Lessor accounting is largely unchanged under ASU 2016-02. The Company's primary revenue is rental income; as such, the Company is a lessor on a significant number of leases. The Company believes it will continue to account for its leases in substantially the same manner. The most significant change for the Company related to lessor accounting includes the new standard's narrow definition of initial direct costs for leases. The new definition will result in certain costs (primarily legal costs related to lease negotiations) being expensed rather than capitalized upon adoption of the new standard. EastGroup estimates the new definition of initial direct costs will result in an increase of expenses, and therefore a decrease in earnings, of approximately $200,000 on an annual basis. EastGroup has elected the practical expedient permitting lessors to make an accounting policy election by class of underlying asset to not separate non-lease components of a contract from the lease component to which they relate when specific criteria are met (the Company believes its leases meet the criteria). Public business
51
entities are required to apply the amendments in ASU 2016-02 for fiscal years beginning after December 15, 2018, including interim periods within those fiscal years. EastGroup adopted ASU 2016-02 effective January 1, 2019. The Company is continuing the process of evaluating and quantifying the effect that ASU 2016-02 will have on its consolidated financial statements and related disclosures beginning with the Form 10-Q for the period ending March 31, 2019.
In May 2017, the FASB issued ASU 2017-09, Compensation - Stock Compensation (Topic 718): Scope of Modification Accounting, which clarifies what constitutes a modification of a share-based payment award. The ASU is intended to provide clarity and reduce both diversity in practice and cost and complexity when applying the guidance in Topic 718 to a change to the terms or conditions of a share-based payment award. ASU 2017-09 is effective for public entities for annual periods beginning after December 15, 2017, and interim periods within those fiscal years. The Company adopted ASU 2017-09 on January 1, 2018; the adoption of ASU 2017-09 did not have a material impact on its financial condition or results of operations, as the Company has not had any modifications to share-based payment awards. However, if the Company does have a modification to an award in the future, it will follow the guidance in ASU 2017-09.
In August 2017, the FASB issued ASU 2017-12, Derivatives and Hedging (Topic 815): Targeted Improvements to Accounting for Hedging Activities. The ASU is intended to better align a company's financial reporting for hedging activities with the economic objectives of those activities. The transition method is a modified retrospective approach that will require the Company to recognize the cumulative effect of initially applying the ASU as an adjustment to Accumulated other comprehensive income with a corresponding adjustment to the opening balance of retained earnings as of the beginning of the fiscal year the entity adopts the ASU. The primary provision in the ASU that will require an adjustment to beginning retained earnings is the change in timing and income statement presentation for ineffectiveness related to cash flow and net investment hedges. As a result of the transition guidance in the ASU, cumulative ineffectiveness that has previously been recognized on cash flow and net investment hedges that are still outstanding and designated as of the date of adoption will be adjusted and removed from beginning retained earnings and placed in Accumulated other comprehensive income. ASU 2017-12 is effective for public business entities for annual periods beginning after December 15, 2018, and interim periods within those fiscal years. The Company adopted ASU 2017-12 on January 1, 2019; the adoption of ASU 2017-12 did not have a material impact on its financial condition, results of operations or disclosures.
In August 2018, the FASB issued ASU 2018-13, Fair Value Measurement (Topic 820): Disclosure Framework - Changes to the Disclosure Requirements for Fair Value Measurement. The ASU is intended to improve the effectiveness of fair value measurement disclosures. ASU 2018-13 is effective for all entities for annual periods beginning after December 15, 2019, and interim periods within those fiscal years. Early adoption is permitted; however, the Company plans to adopt ASU 2018-13 on January 1, 2020. EastGroup does not expect the adoption to have a material impact on its financial condition, results of operations or disclosures.
In October 2018, the FASB issued ASU 2018-16, Derivatives and Hedging (Topic 815): Inclusion of the Secured Overnight Financing Rate (SOFR) Overnight Index Swap (OIS) Rate as a Benchmark Interest Rate for Hedge Accounting Purposes. The ASU applies to all entities that elect to apply hedge accounting to benchmark interest rates under Topic 815 and permits the use of the OIS rate based on SOFR as a United States (U.S.) benchmark rate for hedge accounting purposes under Topic 815 in addition to the interest rates on direct Treasury obligations of the U.S. government, the London Inter-bank Offered Rate (LIBOR) swap rate, the OIS rate based on the Fed Funds Effective Rate, and the Securities Industry and Financial Markets Association (SIFMA) Municipal Swap Rate. ASU 2018-16 is effective upon adoption of ASU 2017-12. The Company adopted ASU 2017-12 and ASU 2018-16 on January 1, 2019, and the Company believes the adoption of both ASUs did not have a material impact on its financial condition, results of operation or disclosures.
LIQUIDITY AND CAPITAL RESOURCES
Net cash provided by operating activities was $164,731,000 for the year ended December 31, 2018. The primary other sources of cash were from borrowings on unsecured bank credit facilities; proceeds from common stock offerings; proceeds from unsecured debt; and net proceeds from sales of real estate investments and non-operating real estate. The Company distributed $71,294,000 in common stock dividends during 2018. Other primary uses of cash were for repayments on unsecured bank credit facilities, unsecured debt and secured debt; development of properties; purchases of real estate; and capital improvements at various properties.
Total debt at December 31, 2018 and 2017 is detailed below. The Company’s unsecured bank credit facilities and unsecured debt instruments have certain restrictive covenants, such as maintaining debt service coverage and leverage ratios and maintaining insurance coverage, and the Company was in compliance with all of its debt covenants at December 31, 2018 and 2017.
52
December 31, | ||||||
2018 | 2017 | |||||
(In thousands) | ||||||
Unsecured bank credit facilities - variable rate, carrying amount | $ | 195,730 | 116,339 | |||
Unsecured bank credit facilities - fixed rate, carrying amount (1) (2) | — | 80,000 | ||||
Unamortized debt issuance costs | (1,804 | ) | (630 | ) | ||
Unsecured bank credit facilities | 193,926 | 195,709 | ||||
Unsecured debt - fixed rate, carrying amount (1) | 725,000 | 715,000 | ||||
Unamortized debt issuance costs | (1,600 | ) | (1,939 | ) | ||
Unsecured debt | 723,400 | 713,061 | ||||
Secured debt - fixed rate, carrying amount (1) | 189,038 | 200,354 | ||||
Unamortized debt issuance costs | (577 | ) | (842 | ) | ||
Secured debt | 188,461 | 199,512 | ||||
Total debt | $ | 1,105,787 | 1,108,282 | |||
(1) | These loans have a fixed interest rate or an effectively fixed interest rate due to interest rate swaps. |
(2) | The Company had designated an interest rate swap to an $80 million unsecured bank credit facility draw that effectively fixed the interest rate on the $80 million draw to 2.020% through the interest rate swap's maturity date. This swap matured on August 15, 2018, and the $80 million draw has reverted to the variable interest rate associated with the Company's unsecured bank credit facilities. |
Until June 14, 2018, EastGroup had $300 million and $35 million unsecured bank credit facilities with margins over LIBOR of 100 basis points, facility fees of 20 basis points and maturity dates of July 30, 2019. The Company amended and restated these credit facilities on June 14, 2018, expanding the capacity to $350 million and $45 million, as detailed below.
The $350 million unsecured bank credit facility is with a group of nine banks and has a maturity date of July 30, 2022. The credit facility contains options for two six-month extensions (at the Company's election) and a $150 million accordion (with agreement by all parties). The interest rate on each tranche is usually reset on a monthly basis and as of December 31, 2018, was LIBOR plus 100 basis points with an annual facility fee of 20 basis points. The margin and facility fee are subject to changes in the Company's credit ratings. The Company also designated on its $350 million unsecured bank credit facility an interest rate swap to an $80 million unsecured bank credit facility draw that effectively fixed the interest rate on the $80 million draw to 2.020% through the interest rate swap's maturity date. This swap matured on August 15, 2018, and the $80 million draw has reverted to the variable interest rate associated with the Company's unsecured bank credit facilities. As of December 31, 2018, the Company had $187,000,000 of variable rate borrowings outstanding on this unsecured bank credit facility with a weighted average interest rate of 3.508%. The Company has a standby letter of credit of $674,000 pledged on this facility.
The Company's $45 million unsecured bank credit facility has a maturity date of July 30, 2022, or such later date as designated by the bank; the Company also has two six-month extensions available if the extension options in the $350 million facility are exercised. The interest rate is reset on a daily basis and as of December 31, 2018, was LIBOR plus 100 basis points with an annual facility fee of 20 basis points. The margin and facility fee are subject to changes in the Company's credit ratings. As of December 31, 2018, the interest rate was 3.503% on a balance of $8,730,000.
As market conditions permit, EastGroup issues equity and/or employs fixed-rate debt, including variable-rate debt that has been swapped to an effectively fixed rate through the use of interest rate swaps, to replace the short-term bank borrowings. The Company believes its current operating cash flow and unsecured bank credit facilities provide the capacity to fund the operations of the Company. The Company also believes it can obtain debt financing and issue common and/or preferred equity. For future debt issuances, the Company intends to issue primarily unsecured fixed-rate debt, including variable-rate debt that has been swapped to an effectively fixed rate through the use of interest rate swaps. The Company may also access the public debt market in the future as a means to raise capital.
In February 2018, the Company refinanced a $65 million unsecured term loan, resulting in a 55 basis point reduction in the loan's interest rate. The loan, which has a maturity date of April 1, 2023, now has an effectively fixed interest rate of 2.313%. The refinancing will provide a net annual savings to the Company of approximately $340,000.
53
In April 2018, the Company closed $60 million of senior unsecured private placement notes with an insurance company. The notes have a ten-year term and a fixed interest rate of 3.93% with semi-annual interest payments. The notes will not be and have not been registered under the Securities Act of 1933, as amended, and may not be offered or sold in the United States absent registration or an applicable exemption from the registration requirements.
In June 2018, the Company repaid (with no penalty) a $50 million senior unsecured term loan with an interest rate of 3.91% and an original maturity date of December 21, 2018.
On March 6, 2017, EastGroup entered into sales agreements (the March 2017 Sales Agreements) in connection with its continuous equity program with each of BNY Mellon Capital Markets, LLC; Merrill Lynch, Pierce, Fenner & Smith Incorporated; Jefferies LLC; and Raymond James & Associates, Inc. to sell up to an aggregate of 10,000,000 shares of its common stock from time to time. On February 15, 2018, the Company entered into sales agreements with BTIG, LLC; Robert W. Baird & Co. Incorporated and Wells Fargo Securities, LLC, which are substantially similar to the March 2017 Sales Agreements. Pursuant to the agreements, the shares may be offered and sold in transactions that are deemed to be "at the market" offerings as defined in Rule 415 of the Securities Act of 1933, as amended. The Company has sold an aggregate of 5,305,134 shares of common stock under the sales agency financing agreements, and as of February 14, 2019, EastGroup may offer and sell an additional 4,694,866 shares of common stock through the sales agents.
During the twelve months ended December 31, 2018, EastGroup issued and sold 1,706,474 shares of common stock under its continuous equity program at an average price of $93.26 per share with gross proceeds to the Company of $159,138,000. The Company incurred offering-related costs of $1,819,000 during the twelve months, resulting in net proceeds to the Company of $157,319,000.
54
Contractual Obligations
EastGroup’s fixed, non-cancelable obligations as of December 31, 2018 were as follows:
Payments Due by Period | |||||||||||||||
Total | Less Than 1 Year | 1-3 Years | 3-5 Years | More Than 5 Years | |||||||||||
(In thousands) | |||||||||||||||
Unsecured Bank Credit Facilities (1) (2) | $ | 195,730 | — | — | 195,730 | — | |||||||||
Interest on Unsecured Bank Credit Facilities (3) | 27,729 | 7,656 | 15,311 | 4,762 | — | ||||||||||
Unsecured Debt (1) | 725,000 | 75,000 | 145,000 | 190,000 | 315,000 | ||||||||||
Interest on Unsecured Debt | 116,884 | 23,343 | 39,617 | 28,921 | 25,003 | ||||||||||
Secured Debt (1) | 189,038 | 55,567 | 98,659 | 32,888 | 1,924 | ||||||||||
Interest on Secured Debt | 16,351 | 7,553 | 8,328 | 269 | 201 | ||||||||||
Dividends Payable (4) | 26,178 | 26,178 | — | — | — | ||||||||||
Operating Lease Obligations: | |||||||||||||||
Office Leases | 1,707 | 382 | 736 | 589 | — | ||||||||||
Ground Leases | 13,298 | 791 | 1,582 | 1,582 | 9,343 | ||||||||||
Real Estate Property Obligations (5) | 2,398 | 2,398 | — | — | — | ||||||||||
Development and Value-Add Obligations (6) | 52,366 | 52,366 | — | — | — | ||||||||||
Tenant Improvements (7) | 19,487 | 19,487 | — | — | — | ||||||||||
Purchase Obligations | 900 | 300 | 600 | — | — | ||||||||||
Total | $ | 1,387,066 | 271,021 | 309,833 | 454,741 | 351,471 | |||||||||
(1) | These amounts are included on the Consolidated Balance Sheets net of unamortized debt issuance costs. |
(2) | The Company’s balances under its unsecured bank credit facilities change depending on the Company’s cash needs and, as such, both the principal amounts and the interest rates are subject to variability. At December 31, 2018, the weighted average interest rate was 3.508% on the $195,730,000 of variable-rate debt that matures in July 2022. The $350 million unsecured credit facility has options for two six-month extensions (at the Company's election) and a $150 million accordion (with agreement by all parties). The $45 million unsecured credit facility automatically extends for two six-month terms if the extension options in the $350 million revolving facility are exercised. As of December 31, 2018, the interest rate on the $350 million facility was LIBOR plus 100 basis points (weighted average interest rate of 3.508%) with an annual facility fee of 20 basis points, and the interest rate on the $45 million facility, which resets on a daily basis, was LIBOR plus 100 basis points (3.503%) with an annual facility fee of 20 basis points. The margin and facility fee are subject to changes in the Company's credit ratings. |
(3) | Represents an estimate of interest due on the Company's unsecured bank credit facilities based on the outstanding unsecured credit facilities as of December 31, 2018 and interest rates and maturity dates on the facilities as of December 31, 2018 as discussed in note 2 above. |
(4) | Represents dividends declared during December 2018, which were paid in January 2019. Dividends Payable excludes dividends payable on unvested restricted stock of $1,560,000, which are subject to continued service and will be paid upon vesting in future periods. |
(5) | Represents commitments on real estate properties, except for tenant improvement obligations. |
(6) | Represents commitments on properties in the Company's development and value-add program, except for tenant improvement obligations. |
(7) | Represents tenant improvement allowance obligations. |
The Company anticipates that its current cash balance, operating cash flows, borrowings under its unsecured bank credit facilities, proceeds from new debt and/or proceeds from the issuance of equity instruments will be adequate for (i) operating and administrative expenses, (ii) normal repair and maintenance expenses at its properties, (iii) debt service obligations, (iv) maintaining compliance with its debt covenants, (v) distributions to stockholders, (vi) capital improvements, (vii) purchases of properties, (viii) development, and (ix) any other normal business activities of the Company, both in the short-term and long-term.
Off-Balance Sheet Arrangements
The Company has no material off-balance sheet arrangements that have had or are reasonably likely to have a material current or future effect on its financial condition, changes in financial condition, revenues or expenses, results of operations, liquidity, capital expenditures or capital resources.
55
INFLATION AND OTHER ECONOMIC CONSIDERATIONS
Most of the Company's leases include scheduled rent increases. Additionally, most of the Company's leases require the tenants to pay their pro rata share of operating expenses, including real estate taxes, insurance and common area maintenance, thereby reducing the Company's exposure to increases in operating expenses resulting from inflation. In the event inflation causes increases in the Company’s general and administrative expenses or the level of interest rates, such increased costs would not be passed through to tenants and could adversely affect the Company’s results of operations.
EastGroup's financial results are affected by general economic conditions in the markets in which the Company's properties are located. The state of the economy, or other adverse changes in general or local economic conditions, could result in the inability of some of the Company's existing tenants to make lease payments and may therefore increase bad debt expense. It may also impact the Company’s ability to (i) renew leases or re-lease space as leases expire, or (ii) lease development space. In addition, an economic downturn or recession could also lead to an increase in overall vacancy rates or a decline in rents the Company can charge to re-lease properties upon expiration of current leases. In all of these cases, EastGroup’s cash flows would be adversely affected.
ITEM 7A. QUANTITATIVE AND QUALITATIVE DISCLOSURES ABOUT MARKET RISK.
The Company is exposed to interest rate changes primarily as a result of its unsecured bank credit facilities and long-term debt maturities. This debt is used to maintain liquidity and fund capital expenditures and expansion of the Company’s real estate investment portfolio and operations. The Company’s objective for interest rate risk management is to limit the impact of interest rate changes on earnings and cash flows and to lower its overall borrowing costs. The Company has two variable rate unsecured bank credit facilities as discussed under Liquidity and Capital Resources. As market conditions permit, EastGroup issues equity and/or employs fixed-rate debt, including variable-rate debt that has been swapped to an effectively fixed rate through the use of interest rate swaps, to replace the short-term bank borrowings. The Company's interest rate swaps are discussed in Note 13 in the Notes to Consolidated Financial Statements. The table below presents the principal payments due and weighted average interest rates, which include the impact of interest rate swaps, for both the fixed-rate and variable-rate debt as of December 31, 2018.
2019 | 2020 | 2021 | 2022 | 2023 | Thereafter | Total | Fair Value | ||||||||||||||||
Unsecured bank credit facilities - variable rate (in thousands) | $ | — | — | — | 195,730 | (1) | — | — | 195,730 | 196,423 (2) | |||||||||||||
Weighted average interest rate | — | — | — | 3.51 | % | (3) | — | — | 3.51 | % | |||||||||||||
Unsecured debt - fixed rate (in thousands) | $ | 75,000 | 105,000 | 40,000 | 75,000 | 115,000 | 315,000 | 725,000 | 718,364 (4) | ||||||||||||||
Weighted average interest rate | 2.85 | % | 3.55 | % | 2.34 | % | 3.03 | % | 2.96 | % | 3.74 | % | 3.34 | % | |||||||||
Secured debt - fixed rate (in thousands) | $ | 55,567 | 9,096 | 89,563 | 32,769 | 119 | 1,924 | 189,038 | 191,742 (4) | ||||||||||||||
Weighted average interest rate | 7.01 | % | 4.43 | % | 4.55 | % | 4.09 | % | 3.85 | % | 3.85 | % | 5.18 | % | |||||||||
(1) | The variable-rate unsecured bank credit facilities mature in July 2022 and as of December 31, 2018, have balances of $187,000,000 on the $350 million unsecured bank credit facility and $8,730,000 on the $45 million unsecured bank credit facility. |
(2) | The fair value of the Company’s variable-rate debt is estimated by discounting expected cash flows at current market rates, excluding the effects of debt issuance costs. |
(3) | Represents the weighted average interest rate for the Company's variable rate unsecured bank credit facilities as of December 31, 2018. |
(4) | The fair value of the Company’s fixed-rate debt, including variable-rate debt that has been swapped to an effectively fixed rate through the use of interest rate swaps, is estimated by discounting expected cash flows at the rates currently offered to the Company for debt of the same remaining maturities, as advised by the Company’s bankers, excluding the effects of debt issuance costs. |
As the table above incorporates only those exposures that existed as of December 31, 2018, it does not consider those exposures or positions that could arise after that date. If the weighted average interest rate on the variable-rate unsecured bank credit facilities, as shown above, changes by 10% or approximately 35 basis points, interest expense and cash flows would increase or decrease by approximately $687,000 annually. This does not include variable-rate debt that has been effectively fixed through the use of interest rate swaps.
56
ITEM 8. FINANCIAL STATEMENTS AND SUPPLEMENTARY DATA.
The information required by this Item 8 is hereby incorporated by reference to the Company’s Consolidated Financial Statements beginning on page 59 of this Annual Report on Form 10-K.
ITEM 9. CHANGES IN AND DISAGREEMENTS WITH ACCOUNTANTS ON ACCOUNTING AND FINANCIAL DISCLOSURE.
None.
ITEM 9A. CONTROLS AND PROCEDURES.
(i) | Disclosure Controls and Procedures. |
The Company carried out an evaluation, under the supervision and with the participation of the Company’s management, including the Company’s Chief Executive Officer and Chief Financial Officer, of the effectiveness of the design and operation of the Company’s disclosure controls and procedures pursuant to Exchange Act Rule 13a-15. Based upon that evaluation, the Chief Executive Officer and Chief Financial Officer concluded that, as of December 31, 2018, the Company’s disclosure controls and procedures were effective in timely alerting them to material information relating to the Company (including its consolidated subsidiaries) required to be included in the Company’s periodic SEC filings.
(ii) | Internal Control Over Financial Reporting. |
(a) | Management's annual report on internal control over financial reporting. |
Management is responsible for establishing and maintaining adequate internal control over financial reporting, as such term is defined in Exchange Act Rule 13a-15(f). EastGroup’s Management Report on Internal Control Over Financial Reporting is set forth in Part IV, Item 15 of this Form 10-K on page 62 and is incorporated herein by reference.
(b) | Report of the independent registered public accounting firm. |
The report of KPMG LLP, the Company's independent registered public accounting firm, on the Company's internal control over financial reporting is set forth in Part IV, Item 15 of this Form 10-K on page 63 and is incorporated herein by reference.
(c) | Changes in internal control over financial reporting. |
There was no change in the Company's internal control over financial reporting during the Company's fourth fiscal quarter ended December 31, 2018 that has materially affected, or is reasonably likely to materially affect, the Company's internal control over financial reporting.
ITEM 9B. OTHER INFORMATION.
Not applicable.
57
PART III
ITEM 10. DIRECTORS, EXECUTIVE OFFICERS AND CORPORATE GOVERNANCE.
The information required by Item 10 will be included in the Company’s definitive proxy statement to be filed with the SEC relating to the Company’s 2019 Annual Meeting of Stockholders and is incorporated herein by reference.
ITEM 11. EXECUTIVE COMPENSATION.
The information required by Item 11 will be included in the Company’s definitive proxy statement to be filed with the SEC relating to the Company’s 2019 Annual Meeting of Stockholders and is incorporated herein by reference.
ITEM 12. SECURITY OWNERSHIP OF CERTAIN BENEFICIAL OWNERS AND MANAGEMENT AND RELATED STOCKHOLDER MATTERS.
The information required by Item 12 will be included in the Company’s definitive proxy statement to be filed with the SEC relating to the Company’s 2019 Annual Meeting of Stockholders and is incorporated herein by reference.
ITEM 13. CERTAIN RELATIONSHIPS AND RELATED TRANSACTIONS, AND DIRECTOR INDEPENDENCE.
The information required by Item 13 will be included in the Company’s definitive proxy statement to be filed with the SEC relating to the Company’s 2019 Annual Meeting of Stockholders and is incorporated herein by reference.
ITEM 14. PRINCIPAL ACCOUNTING FEES AND SERVICES.
The information required by Item 14 will be included in the Company’s definitive proxy statement to be filed with the SEC relating to the Company’s 2019 Annual Meeting of Stockholders and is incorporated herein by reference.
58
PART IV
ITEM 15. EXHIBITS AND FINANCIAL STATEMENT SCHEDULES.
Financial Statements | Page | |
The following documents are filed as part of this Annual Report on Form 10-K: | ||
Financial Statement Schedules | Page | |
The following documents are filed as part of this Annual Report on Form 10-K: | ||
All other schedules for which provision is made in the applicable accounting regulations of the SEC are not required under the related instructions or are inapplicable, and therefore have been omitted, or the required information is included in the Notes to Consolidated Financial Statements. | ||
59
Exhibits | ||
The following exhibits are included in this Annual Report on Form 10-K for the fiscal year ended December 31, 2018: | ||
Exhibit Number | Description |
Articles of Incorporation of EastGroup Properties, Inc. (incorporated by reference to Appendix B to the Company’s Definitive Proxy Statement on Form DEF 14A (File No. 001-07094) filed April 4, 1997). | |
Amended and Restated Bylaws of EastGroup Properties, Inc. (incorporated by reference to Exhibit 3.1 to the Company’s Current Report on Form 8-K (File No. 001-07094) filed March 3, 2017). | |
EastGroup Properties, Inc. 2004 Equity Incentive Plan (incorporated by reference to Appendix D to the Company’s Definitive Proxy Statement on Form DEF 14A (File No. 001-07094) filed April 21, 2004). | |
Amendment No. 1 to the EastGroup Properties, Inc. 2004 Equity Incentive Plan (incorporated by reference to Exhibit 10(f) to the Company’s Annual Report on Form 10-K (File No. 001-07094) filed February 28, 2007). | |
Amendment No. 2 to the EastGroup Properties, Inc. 2004 Equity Incentive Plan (incorporated by reference to Exhibit 10(d) to the Company’s Form 8-K (File No. 001-07094) filed January 8, 2007). | |
EastGroup Properties, Inc. 2013 Equity Incentive Plan, as amended and restated as of March 3, 2017 (incorporated by reference to Exhibit 10.1 to the Company's Form 8-K (File No. 001-07094) filed March 3, 2017). | |
Form of Severance and Change in Control Agreement entered into by and between the Company and each of Marshall A. Loeb, Brent W. Wood and John F. Coleman (incorporated by reference to Exhibit 10.1 to the Company’s Current Report on Form 8-K (File No. 001-07094) filed May 18, 2016). | |
Form of Severance and Change in Control Agreement by and between the Company and each of Ryan M. Collins, C. Bruce Corkern and R. Reid Dunbar (incorporated by reference to Exhibit 10.2 to the Company’s Current Report on Form 8-K (File No. 001-07094) filed May 18, 2016). | |
Separation Agreement, effective as of February 21, 2017, by and between the Company and William D. Petsas (incorporated by reference to Exhibit 10.1 to the Company’s Current Report on Form 8-K (File No. 001-07094) filed February 21, 2017). | |
EastGroup Properties, Inc. Director Compensation Program Including the Independent Director Compensation Policy pursuant to the 2013 Equity Incentive Plan (incorporated by reference to Exhibit 10(g) to the Company’s Annual Report on Form 10-K (File No. 001-07094) filed February 14, 2018). | |
Note Purchase Agreement, dated as of August 28, 2013, by and among EastGroup Properties, L.P., the Company and each of the Purchasers of the Notes party thereto (incorporated by reference to Exhibit 10.1 to the Company’s Current Report on Form 8-K (File No. 001-07094) filed August 30, 2013). | |
Fourth Amended and Restated Credit Agreement, dated as of June 14, 2018, by and among EastGroup Properties, L.P.; the Company; PNC Bank, National Association, as Administrative Agent; Regions Bank as Syndication Agent; U.S. Bank National Association, Wells Fargo Bank, National Association and Bank of America, N.A., as Co-Documentation Agents; PNC Capital Markets LLC and Regions Capital Markets, as Joint Lead Arrangers and Joint Bookrunners; and the Lenders thereunder (incorporated by reference to Exhibit 10.1 to the Company’s Current Report on Form 8-K (File No. 001-07094) filed June 14, 2018). | |
Subsidiaries of the Company (filed herewith). | |
Consent of KPMG LLP (filed herewith). | |
Powers of attorney (included on signature page hereto). | |
Rule 13a-14(a)/15d-14(a) Certifications (pursuant to Section 302 of the Sarbanes-Oxley Act of 2002) of Marshall A. Loeb, Chief Executive Officer (filed herewith). | |
Rule 13a-14(a)/15d-14(a) Certifications (pursuant to Section 302 of the Sarbanes-Oxley Act of 2002) of Brent W. Wood, Chief Financial Officer (filed herewith). | |
Section 1350 Certifications (pursuant to Section 906 of the Sarbanes-Oxley Act of 2002) of Marshall A. Loeb, Chief Executive Officer (furnished herewith). | |
Section 1350 Certifications (pursuant to Section 906 of the Sarbanes-Oxley Act of 2002) of Brent W. Wood, Chief Financial Officer (furnished herewith). | |
101.1 | The following materials from the Company’s Annual Report on Form 10-K for the year ended December 31, 2018, formatted in XBRL (eXtensible Business Reporting Language): (i) consolidated balance sheets, (ii) consolidated statements of income and comprehensive income, (iii) consolidated statements of changes in equity, (iv) consolidated statements of cash flows, and (v) the notes to these consolidated financial statements. |
* | Indicates a management contract or any compensatory plan, contract or arrangement. |
60
REPORT OF INDEPENDENT REGISTERED PUBLIC ACCOUNTING FIRM
TO THE STOCKHOLDERS AND BOARD OF DIRECTORS
EASTGROUP PROPERTIES, INC.:
Opinion on the Consolidated Financial Statements
We have audited the accompanying consolidated balance sheets of EastGroup Properties, Inc. and subsidiaries (the Company) as of December 31, 2018 and 2017, the related consolidated statements of income and comprehensive income, changes in equity, and cash flows for each of the years in the three-year period ended December 31, 2018, and the related notes and financial statement schedules III and IV (collectively, the consolidated financial statements). In our opinion, the consolidated financial statements present fairly, in all material respects, the financial position of the Company as of December 31, 2018 and 2017, and the results of its operations and its cash flows for each of the years in the three-year period ended December 31, 2018, in conformity with U.S. generally accepted accounting principles.
We also have audited, in accordance with the standards of the Public Company Accounting Oversight Board (United States) (PCAOB), the Company’s internal control over financial reporting as of December 31, 2018, based on criteria established in Internal Control – Integrated Framework (2013) issued by the Committee of Sponsoring Organizations of the Treadway Commission, and our report dated February 14, 2019 expressed an unqualified opinion on the effectiveness of the Company’s internal control over financial reporting.
Basis for Opinion
These consolidated financial statements are the responsibility of the Company’s management. Our responsibility is to express an opinion on these consolidated financial statements based on our audits. We are a public accounting firm registered with the PCAOB and are required to be independent with respect to the Company in accordance with the U.S. federal securities laws and the applicable rules and regulations of the Securities and Exchange Commission and the PCAOB.
We conducted our audits in accordance with the standards of the PCAOB. Those standards require that we plan and perform the audit to obtain reasonable assurance about whether the consolidated financial statements are free of material misstatement, whether due to error or fraud. Our audits included performing procedures to assess the risks of material misstatement of the consolidated financial statements, whether due to error or fraud, and performing procedures that respond to those risks. Such procedures included examining, on a test basis, evidence regarding the amounts and disclosures in the consolidated financial statements. Our audits also included evaluating the accounting principles used and significant estimates made by management, as well as evaluating the overall presentation of the consolidated financial statements. We believe that our audits provide a reasonable basis for our opinion.
(Signed) KPMG LLP | |
We have served as the Company's auditor since 1970. | |
Jackson, Mississippi | |
February 14, 2019 | |
61
MANAGEMENT REPORT ON INTERNAL CONTROL OVER FINANCIAL REPORTING
EastGroup’s management is responsible for establishing and maintaining adequate internal control over financial reporting, as such term is defined in Exchange Act Rule 13a-15(f). Under the supervision and with the participation of management, including the Chief Executive Officer and Chief Financial Officer, EastGroup conducted an evaluation of the effectiveness of internal control over financial reporting based on the framework in Internal Control – Integrated Framework (2013) issued by the Committee of Sponsoring Organizations of the Treadway Commission. The design of any system of internal control over financial reporting is based in part upon certain assumptions about the likelihood of future events, and there can be no assurance that any design will succeed in achieving its stated goals under all potential future conditions. Based on EastGroup’s evaluation under the framework in Internal Control – Integrated Framework (2013), management concluded that our internal control over financial reporting was effective as of December 31, 2018.
/s/ EASTGROUP PROPERTIES, INC. | |
Ridgeland, Mississippi | |
February 14, 2019 | |
62
REPORT OF INDEPENDENT REGISTERED PUBLIC ACCOUNTING FIRM
TO THE STOCKHOLDERS AND BOARD OF DIRECTORS
EASTGROUP PROPERTIES, INC.:
Opinion on Internal Control Over Financial Reporting
We have audited EastGroup Properties, Inc. and subsidiaries’ (the Company) internal control over financial reporting as of December 31, 2018, based on the criteria established in Internal Control – Integrated Framework (2013) issued by the Committee of Sponsoring Organizations of the Treadway Commission. In our opinion, the Company maintained, in all material respects, effective internal control over financial reporting as of December 31, 2018, based on the criteria established in Internal Control – Integrated Framework (2013) issued by the Committee of Sponsoring Organizations of the Treadway Commission.
We also have audited, in accordance with the standards of the Public Company Accounting Oversight Board (United States) (PCAOB), the consolidated balance sheets of the Company as of December 31, 2018 and 2017, and the related consolidated statements of income and comprehensive income, changes in equity, and cash flows for each of the years in the three-year period ended December 31, 2018, and the related notes and financial statement schedules III and IV (collectively, the consolidated financial statements), and our report dated February 14, 2019 expressed an unqualified opinion on those consolidated financial statements.
Basis for Opinion
The Company’s management is responsible for maintaining effective internal control over financial reporting and for its assessment of the effectiveness of internal control over financial reporting, included in the accompanying Management Report on Internal Control over Financial Reporting. Our responsibility is to express an opinion on the Company’s internal control over financial reporting based on our audit. We are a public accounting firm registered with the PCAOB and are required to be independent with respect to the Company in accordance with the U.S. federal securities laws and the applicable rules and regulations of the Securities and Exchange Commission and the PCAOB.
We conducted our audit in accordance with the standards of the PCAOB. Those standards require that we plan and perform the audit to obtain reasonable assurance about whether effective internal control over financial reporting was maintained in all material respects. Our audit of internal control over financial reporting included obtaining an understanding of internal control over financial reporting, assessing the risk that a material weakness exists, and testing and evaluating the design and operating effectiveness of internal control based on the assessed risk. Our audit also included performing such other procedures as we considered necessary in the circumstances. We believe that our audit provides a reasonable basis for our opinion.
Definition and Limitations of Internal Control Over Financial Reporting
A company’s internal control over financial reporting is a process designed to provide reasonable assurance regarding the reliability of financial reporting and the preparation of financial statements for external purposes in accordance with generally accepted accounting principles. A company’s internal control over financial reporting includes those policies and procedures that (1) pertain to the maintenance of records that, in reasonable detail, accurately and fairly reflect the transactions and dispositions of the assets of the company; (2) provide reasonable assurance that transactions are recorded as necessary to permit preparation of financial statements in accordance with generally accepted accounting principles, and that receipts and expenditures of the company are being made only in accordance with authorizations of management and directors of the company; and (3) provide reasonable assurance regarding prevention or timely detection of unauthorized acquisition, use, or disposition of the company’s assets that could have a material effect on the financial statements.
Because of its inherent limitations, internal control over financial reporting may not prevent or detect misstatements. Also, projections of any evaluation of effectiveness to future periods are subject to the risk that controls may become inadequate because of changes in conditions, or that the degree of compliance with the policies or procedures may deteriorate.
(Signed) KPMG LLP | |
Jackson, Mississippi | |
February 14, 2019 | |
63
EASTGROUP PROPERTIES, INC. AND SUBSIDIARIES
CONSOLIDATED BALANCE SHEETS
December 31, | ||||||
2018 | 2017 | |||||
(In thousands, except share and per share data) | ||||||
ASSETS | ||||||
Real estate properties | $ | 2,553,481 | 2,336,734 | |||
Development and value-add properties | 263,664 | 242,014 | ||||
2,817,145 | 2,578,748 | |||||
Less accumulated depreciation | (814,915 | ) | (749,601 | ) | ||
2,002,230 | 1,829,147 | |||||
Unconsolidated investment | 7,870 | 8,029 | ||||
Cash | 374 | 16 | ||||
Other assets | 121,231 | 116,029 | ||||
TOTAL ASSETS | $ | 2,131,705 | 1,953,221 | |||
LIABILITIES AND EQUITY | ||||||
LIABILITIES | ||||||
Unsecured bank credit facilities | $ | 193,926 | 195,709 | |||
Unsecured debt | 723,400 | 713,061 | ||||
Secured debt | 188,461 | 199,512 | ||||
Accounts payable and accrued expenses | 86,563 | 64,967 | ||||
Other liabilities | 34,652 | 28,842 | ||||
Total Liabilities | 1,227,002 | 1,202,091 | ||||
EQUITY | ||||||
Stockholders’ Equity: | ||||||
Common stock; $.0001 par value; 70,000,000 shares authorized; 36,501,356 shares issued and outstanding at December 31, 2018 and 34,758,167 at December 31, 2017 | 4 | 3 | ||||
Excess shares; $.0001 par value; 30,000,000 shares authorized; no shares issued | — | — | ||||
Additional paid-in capital | 1,222,547 | 1,061,153 | ||||
Distributions in excess of earnings | (326,193 | ) | (317,032 | ) | ||
Accumulated other comprehensive income | 6,701 | 5,348 | ||||
Total Stockholders’ Equity | 903,059 | 749,472 | ||||
Noncontrolling interest in joint ventures | 1,644 | 1,658 | ||||
Total Equity | 904,703 | 751,130 | ||||
TOTAL LIABILITIES AND EQUITY | $ | 2,131,705 | 1,953,221 | |||
See accompanying Notes to Consolidated Financial Statements.
64
EASTGROUP PROPERTIES, INC. AND SUBSIDIARIES
CONSOLIDATED STATEMENTS OF INCOME AND COMPREHENSIVE INCOME
Years Ended December 31, | |||||||||
2018 | 2017 | 2016 | |||||||
(In thousands, except per share data) | |||||||||
REVENUES | |||||||||
Income from real estate operations | $ | 299,018 | 274,031 | 252,961 | |||||
Other revenue | 1,374 | 119 | 86 | ||||||
300,392 | 274,150 | 253,047 | |||||||
EXPENSES | |||||||||
Expenses from real estate operations | 86,394 | 80,108 | 74,347 | ||||||
Depreciation and amortization | 91,704 | 83,874 | 77,935 | ||||||
General and administrative | 13,738 | 14,972 | 13,232 | ||||||
Acquisition costs | — | — | 161 | ||||||
191,836 | 178,954 | 165,675 | |||||||
OPERATING INCOME | 108,556 | 95,196 | 87,372 | ||||||
OTHER INCOME (EXPENSE) | |||||||||
Interest expense | (35,106 | ) | (34,775 | ) | (35,213 | ) | |||
Gain, net of loss, on sales of real estate investments | 14,273 | 21,855 | 42,170 | ||||||
Other | 913 | 1,313 | 1,765 | ||||||
NET INCOME | 88,636 | 83,589 | 96,094 | ||||||
Net income attributable to noncontrolling interest in joint ventures | (130 | ) | (406 | ) | (585 | ) | |||
NET INCOME ATTRIBUTABLE TO EASTGROUP PROPERTIES, INC. COMMON STOCKHOLDERS | 88,506 | 83,183 | 95,509 | ||||||
Other comprehensive income - cash flow hedges | 1,353 | 3,353 | 5,451 | ||||||
TOTAL COMPREHENSIVE INCOME | $ | 89,859 | 86,536 | 100,960 | |||||
BASIC PER COMMON SHARE DATA FOR NET INCOME ATTRIBUTABLE TO EASTGROUP PROPERTIES, INC. COMMON STOCKHOLDERS | |||||||||
Net income attributable to common stockholders | $ | 2.50 | 2.45 | 2.93 | |||||
Weighted average shares outstanding | 35,439 | 33,996 | 32,563 | ||||||
DILUTED PER COMMON SHARE DATA FOR NET INCOME ATTRIBUTABLE TO EASTGROUP PROPERTIES, INC. COMMON STOCKHOLDERS | |||||||||
Net income attributable to common stockholders | $ | 2.49 | 2.44 | 2.93 | |||||
Weighted average shares outstanding | 35,506 | 34,047 | 32,628 | ||||||
See accompanying Notes to Consolidated Financial Statements.
65
EASTGROUP PROPERTIES, INC. AND SUBSIDIARIES
CONSOLIDATED STATEMENTS OF CHANGES IN EQUITY
Common Stock | Additional Paid-In Capital | Distributions In Excess Of Earnings | Accumulated Other Comprehensive Income (Loss) | Noncontrolling Interest in Joint Ventures | Total | |||||||||||||
(In thousands, except share and per share data) | ||||||||||||||||||
Balance, December 31, 2015 | $ | 3 | 887,207 | (328,892 | ) | (3,456 | ) | 4,339 | 559,201 | |||||||||
Net income | — | — | 95,509 | — | 585 | 96,094 | ||||||||||||
Net unrealized change in fair value of cash flow hedges | — | — | — | 5,451 | — | 5,451 | ||||||||||||
Common dividends declared – $2.44 per share | — | — | (80,272 | ) | — | — | (80,272 | ) | ||||||||||
Stock-based compensation, net of forfeitures | — | 5,831 | — | — | — | 5,831 | ||||||||||||
Issuance of 875,052 shares of common stock, common stock offering, net of expenses | — | 59,283 | — | — | — | 59,283 | ||||||||||||
Issuance of 3,326 shares of common stock, dividend reinvestment plan | — | 228 | — | — | — | 228 | ||||||||||||
Withheld 57,316 shares of common stock to satisfy tax withholding obligations in connection with the vesting of restricted stock | — | (3,231 | ) | — | — | — | (3,231 | ) | ||||||||||
Distributions to noncontrolling interest | — | — | — | — | (719 | ) | (719 | ) | ||||||||||
Balance, December 31, 2016 | 3 | 949,318 | (313,655 | ) | 1,995 | 4,205 | 641,866 | |||||||||||
Net income | — | — | 83,183 | — | 406 | 83,589 | ||||||||||||
Net unrealized change in fair value of cash flow hedges | — | — | — | 3,353 | — | 3,353 | ||||||||||||
Common dividends declared – $2.52 per share | — | — | (86,560 | ) | — | — | (86,560 | ) | ||||||||||
Stock-based compensation, net of forfeitures | — | 7,012 | — | — | — | 7,012 | ||||||||||||
Issuance of 1,370,457 shares of common stock, common stock offering, net of expenses | — | 109,207 | — | — | — | 109,207 | ||||||||||||
Issuance of 2,744 shares of common stock, dividend reinvestment plan | — | 228 | — | — | — | 228 | ||||||||||||
Withheld 33,695 shares of common stock to satisfy tax withholding obligations in connection with the vesting of restricted stock | — | (2,505 | ) | — | — | — | (2,505 | ) | ||||||||||
Purchase of noncontrolling interest in joint venture | — | (2,107 | ) | — | — | (2,597 | ) | (4,704 | ) | |||||||||
Distributions to noncontrolling interest | — | — | — | — | (478 | ) | (478 | ) | ||||||||||
Contributions from noncontrolling interest | — | — | — | — | 122 | 122 | ||||||||||||
Balance, December 31, 2017 | 3 | 1,061,153 | (317,032 | ) | 5,348 | 1,658 | 751,130 | |||||||||||
Net income | — | — | 88,506 | — | 130 | 88,636 | ||||||||||||
Net unrealized change in fair value of cash flow hedges | — | — | — | 1,353 | — | 1,353 | ||||||||||||
Common dividends declared – $2.72 per share | — | — | (97,667 | ) | — | — | (97,667 | ) | ||||||||||
Stock-based compensation, net of forfeitures | — | 6,103 | — | — | — | 6,103 | ||||||||||||
Issuance of 1,706,474 shares of common stock, common stock offering, net of expenses | 1 | 157,318 | — | — | — | 157,319 | ||||||||||||
Issuance of 1,844 shares of common stock, dividend reinvestment plan | — | 164 | — | — | — | 164 | ||||||||||||
Withheld 23,824 shares of common stock to satisfy tax withholding obligations in connection with the vesting of restricted stock | — | (2,055 | ) | — | — | — | (2,055 | ) | ||||||||||
Purchase of noncontrolling interest in joint venture | — | (136 | ) | — | — | — | (136 | ) | ||||||||||
Distributions to noncontrolling interest | — | — | — | — | (194 | ) | (194 | ) | ||||||||||
Contributions from noncontrolling interest | — | — | — | — | 50 | 50 | ||||||||||||
Balance, December 31, 2018 | $ | 4 | 1,222,547 | (326,193 | ) | 6,701 | 1,644 | 904,703 | ||||||||||
See accompanying Notes to Consolidated Financial Statements.
66
EASTGROUP PROPERTIES, INC. AND SUBSIDIARIES
CONSOLIDATED STATEMENTS OF CASH FLOWS
Years Ended December 31, | |||||||||
2018 | 2017 | 2016 | |||||||
(In thousands) | |||||||||
OPERATING ACTIVITIES | |||||||||
Net income | $ | 88,636 | 83,589 | 96,094 | |||||
Adjustments to reconcile net income to net cash provided by operating activities: | |||||||||
Depreciation and amortization | 91,704 | 83,874 | 77,935 | ||||||
Stock-based compensation expense | 5,283 | 5,521 | 4,590 | ||||||
Net gain on sales of real estate investments and non-operating real estate | (14,359 | ) | (22,148 | ) | (42,903 | ) | |||
Gain on casualties and involuntary conversion | (1,245 | ) | — | — | |||||
Changes in operating assets and liabilities: | |||||||||
Accrued income and other assets | (4,091 | ) | (5,034 | ) | (2,883 | ) | |||
Accounts payable, accrued expenses and prepaid rent | (2,682 | ) | 8,333 | 5,736 | |||||
Other | 1,485 | 879 | 295 | ||||||
NET CASH PROVIDED BY OPERATING ACTIVITIES | 164,731 | 155,014 | 138,864 | ||||||
INVESTING ACTIVITIES | |||||||||
Development and value-add properties | (167,667 | ) | (124,938 | ) | (203,765 | ) | |||
Purchases of real estate | (57,152 | ) | (55,195 | ) | (27,668 | ) | |||
Real estate improvements | (37,502 | ) | (27,385 | ) | (23,809 | ) | |||
Net proceeds from sales of real estate investments and non-operating real estate | 24,508 | 42,710 | 78,780 | ||||||
Proceeds from casualties and involuntary conversion | 1,635 | — | — | ||||||
Repayments on mortgage loans receivable | 1,987 | 171 | 123 | ||||||
Changes in accrued development costs | 5,711 | (144 | ) | 3,629 | |||||
Changes in other assets and other liabilities | (12,955 | ) | (14,645 | ) | (13,762 | ) | |||
NET CASH USED IN INVESTING ACTIVITIES | (241,435 | ) | (179,426 | ) | (186,472 | ) | |||
FINANCING ACTIVITIES | |||||||||
Proceeds from unsecured bank credit facilities | 448,100 | 391,617 | 608,349 | ||||||
Repayments on unsecured bank credit facilities | (448,709 | ) | (387,298 | ) | (567,165 | ) | |||
Proceeds from unsecured debt | 60,000 | 60,000 | 205,000 | ||||||
Repayments on unsecured debt | (50,000 | ) | — | (80,000 | ) | ||||
Repayments on secured debt | (11,289 | ) | (58,209 | ) | (92,773 | ) | |||
Debt issuance costs | (1,922 | ) | (380 | ) | (1,487 | ) | |||
Distributions paid to stockholders (not including dividends accrued) | (71,294 | ) | (86,725 | ) | (80,899 | ) | |||
Proceeds from common stock offerings | 157,319 | 109,207 | 59,283 | ||||||
Proceeds from dividend reinvestment plan | 221 | 228 | 236 | ||||||
Other | (5,364 | ) | (4,534 | ) | (2,462 | ) | |||
NET CASH PROVIDED BY FINANCING ACTIVITIES | 77,062 | 23,906 | 48,082 | ||||||
INCREASE (DECREASE) IN CASH AND CASH EQUIVALENTS | 358 | (506 | ) | 474 | |||||
CASH AND CASH EQUIVALENTS AT BEGINNING OF YEAR | 16 | 522 | 48 | ||||||
CASH AND CASH EQUIVALENTS AT END OF YEAR | $ | 374 | 16 | 522 | |||||
SUPPLEMENTAL CASH FLOW INFORMATION | |||||||||
Cash paid for interest, net of amount capitalized of $6,334, $5,765, and $5,340 for 2018, 2017 and 2016, respectively | $ | 33,458 | 33,634 | 33,595 | |||||
See accompanying Notes to Consolidated Financial Statements.
67
EASTGROUP PROPERTIES, INC. AND SUBSIDIARIES
NOTES TO CONSOLIDATED FINANCIAL STATEMENTS
DECEMBER 31, 2018, 2017 and 2016
(1) | SIGNIFICANT ACCOUNTING POLICIES |
(a) | Principles of Consolidation |
The consolidated financial statements include the accounts of EastGroup Properties, Inc. ("EastGroup" or "the Company"), its wholly owned subsidiaries and its investment in any joint ventures in which the Company has a controlling interest.
At December 31, 2016, the Company had a controlling interest in one joint venture, the 80% owned University Business Center. During the fourth quarter of 2017, EastGroup closed the acquisition of the 20% noncontrolling interest in two of the four University Business Center buildings; the Company now owns 100% of University Business Center 125 and 175. As of December 31, 2018 and 2017, EastGroup had an 80% controlling interest in University Business Center 120 and 130.
The Company records 100% of the assets, liabilities, revenues and expenses of the buildings held in joint ventures with the noncontrolling interests provided for in accordance with the joint venture agreements.
The equity method of accounting is used for the Company’s 50% undivided tenant-in-common interest in Industry Distribution Center II. All significant intercompany transactions and accounts have been eliminated in consolidation.
(b) | Income Taxes |
EastGroup, a Maryland corporation, has qualified as a real estate investment trust (REIT) under Sections 856-860 of the Internal Revenue Code and intends to continue to qualify as such. To maintain its status as a REIT, the Company is required to distribute at least 90% of its ordinary taxable income to its stockholders. If the Company has a capital gain, it has the option of (i) deferring recognition of the capital gain through a tax-deferred exchange, (ii) declaring and paying a capital gain dividend on any recognized net capital gain resulting in no corporate level tax, or (iii) retaining and paying corporate income tax on its net long-term capital gain, with the shareholders reporting their proportional share of the undistributed long-term capital gain and receiving a credit or refund of their share of the tax paid by the Company. The Company distributed all of its 2018, 2017 and 2016 taxable income to its stockholders. Accordingly, no significant provisions for income taxes were necessary. The following table summarizes the federal income tax treatment for all distributions by the Company for the years ended 2018, 2017 and 2016.
Federal Income Tax Treatment of Share Distributions
Years Ended December 31, | |||||||||
2018 | 2017 | 2016 | |||||||
Common Share Distributions: | (Per share) | ||||||||
Ordinary dividends | $ | 2.14305 | 2.49146 | 2.10494 | |||||
Nondividend distributions | — | 0.02686 | 0.05202 | ||||||
Unrecaptured Section 1250 capital gain | — | — | 0.12872 | ||||||
Other capital gain | — | 0.00168 | 0.15432 | ||||||
Total Common Share Distributions | $ | 2.14305 | 2.52000 | 2.44000 | |||||
EastGroup applies the principles of Financial Accounting Standards Board (FASB) Accounting Standards Codification (ASC) 740, Income Taxes, when evaluating and accounting for uncertainty in income taxes. With few exceptions, the Company’s 2014 and earlier tax years are closed for examination by U.S. federal, state and local tax authorities. In accordance with the provisions of ASC 740, the Company had no significant uncertain tax positions as of December 31, 2018 and 2017.
The Company’s income may differ for tax and financial reporting purposes principally because of (i) the timing of the deduction for the provision for possible losses and losses on investments, (ii) the timing of the recognition of gains or losses from the sale of investments, (iii) different income recognition methods for rental income, (iv) different depreciation methods and lives, (v) real estate properties having a different basis for tax and financial reporting purposes, (vi) mortgage loans having a different basis for tax and financial reporting purposes, thereby producing different gains upon collection of these loans, and (vii) differences in book and tax allowances and timing for stock-based compensation expense.
(c) | Income Recognition |
Minimum rental income from real estate operations is recognized on a straight-line basis. The straight-line rent calculation on leases includes the effects of rent concessions and scheduled rent increases, and the calculated straight-line rent income is recognized over the lives of the individual leases. The Company maintains allowances for doubtful accounts receivable, including straight-
68
EASTGROUP PROPERTIES, INC. AND SUBSIDIARIES
NOTES TO CONSOLIDATED FINANCIAL STATEMENTS
line rents receivable, based upon estimates determined by management. Management specifically analyzes aged receivables, customer credit-worthiness and current economic trends when evaluating the adequacy of the allowance for doubtful accounts.
Revenue is recognized on payments received from tenants for early terminations after all criteria have been met in accordance with ASC 840, Leases.
The Company recognizes gains on sales of real estate in accordance with the principles set forth in the Codification. For each transaction, the Company evaluates whether the guidance in ASC 606, Revenue from Contracts with Customers, or ASC 610, Other Income - Gains and Losses from the Derecognition of Nonfinancial Assets, is applicable. Upon closing of real estate transactions, the provisions of the Codification require consideration of whether the seller has a controlling financial interest in the entity that holds the nonfinancial asset after the transaction. In addition, the seller evaluates whether a contract exists under ASC 606 and whether the counterparty obtained control of each nonfinancial asset that is sold. If a contract exists and the counterparty obtained control of each nonfinancial asset, the seller derecognizes the asset at the close of the transaction. If the requirements for recognizing gains have not been met, the sale and related costs are recorded, but the gain is deferred and recognized in the future when the criteria for gain recognition have been met.
The Company recognizes interest income on mortgage loans on the accrual method unless a significant uncertainty of collection exists. If a significant uncertainty exists, interest income is recognized as collected. If applicable, discounts on mortgage loans receivable are amortized over the lives of the loans using a method that does not differ materially from the interest method. The Company evaluates the collectibility of both interest and principal on each of its loans to determine whether the loans are impaired. A loan is considered to be impaired when, based on current information and events, it is probable that the Company will be unable to collect all amounts due according to the existing contractual terms. When a loan is considered to be impaired, the amount of loss is calculated by comparing the recorded investment to the value determined by discounting the expected future cash flows at the loan’s effective interest rate or to the fair value of the underlying collateral (if the loan is collateralized) less costs to sell. As of December 31, 2018 and 2017, there was no significant uncertainty of collection; therefore, interest income was recognized. As of December 31, 2018 and 2017, the Company determined that no allowance for collectibility of the mortgage loans receivable was necessary.
(d) | Real Estate Properties |
EastGroup has one reportable segment–industrial properties. These properties are primarily located in major Sunbelt regions of the United States. The Company's properties have similar economic characteristics and as a result, have been aggregated into one reportable segment.
The Company reviews long-lived assets for impairment whenever events or changes in circumstances indicate the carrying amount of an asset may not be recoverable. Recoverability of assets to be held and used is measured by a comparison of the carrying amount of an asset to future undiscounted net cash flows (including estimated future expenditures necessary to substantially complete the asset) expected to be generated by the asset. If the carrying amount of an asset exceeds its estimated future cash flows, an impairment charge is recognized for the amount by which the carrying amount of the asset exceeds the fair value of the asset. As of December 31, 2018 and 2017, the Company did not identify any impairment charges which should be recorded.
Depreciation of buildings and other improvements is computed using the straight-line method over estimated useful lives of generally 40 years for buildings and 3 to 15 years for improvements. Building improvements are capitalized, while maintenance and repair expenses are charged to expense as incurred. Significant renovations and improvements that improve or extend the useful life of the assets are capitalized. Depreciation expense was $76,007,000, $69,010,000 and $63,793,000 for 2018, 2017 and 2016, respectively.
(e) | Development and Value-Add Properties |
For properties under development and value-add properties (defined in Note 2) acquired in the development stage, costs associated with development (i.e., land, construction costs, interest expense, property taxes and other direct and indirect costs associated with development) are aggregated into the total capitalized costs of the property. Included in these costs are management’s estimates for the portions of internal costs (primarily personnel costs) deemed related to such development activities. The internal costs are allocated to specific development projects based on development activity. As the property becomes occupied, depreciation commences on the occupied portion of the building, and costs are capitalized only for the portion of the building that remains vacant. Effective January 1, 2018, the Company began transferring properties from the development program to Real estate properties at the earlier of 90% occupancy or one year after completion of the shell construction (formerly, the Company transferred at the earlier of 80% occupancy or one year after completion of the shell construction). This change did not materially impact the comparability of the Company's financial statements. Upon transfer, capitalization of development costs, including interest expense, property taxes and internal personnel costs, ceases and depreciation commences on the entire property (excluding the land).
69
EASTGROUP PROPERTIES, INC. AND SUBSIDIARIES
NOTES TO CONSOLIDATED FINANCIAL STATEMENTS
(f) | Real Estate Held for Sale |
The Company considers a real estate property to be held for sale when it meets the criteria established under ASC 360, Property, Plant and Equipment, including when it is probable that the property will be sold within a year. Real estate properties held for sale are reported at the lower of the carrying amount or fair value less estimated costs to sell and are not depreciated while they are held for sale.
In accordance with FASB Accounting Standards Update (ASU) 2014-08, Presentation of Financial Statements (Topic 205) and Property, Plant, and Equipment (Topic 360), Reporting Discontinued Operations and Disclosures of Disposals of Components of an Entity, the Company would report a disposal of a component of an entity or a group of components of an entity in discontinued operations if the disposal represents a strategic shift that has (or will have) a major effect on an entity's operations and financial results when the component or group of components meets the criteria to be classified as held for sale or when the component or group of components is disposed of by sale or other than by sale. In addition, the Company would provide additional disclosures about both discontinued operations and the disposal of an individually significant component of an entity that does not qualify for discontinued operations presentation in the financial statements. EastGroup performs an analysis of properties sold to determine whether the sales qualify for discontinued operations presentation.
(g) | Derivative Instruments and Hedging Activities |
EastGroup applies ASC 815, Derivatives and Hedging, which requires all entities with derivative instruments to disclose information regarding how and why the entity uses derivative instruments and how derivative instruments and related hedged items affect the entity’s financial position, financial performance and cash flows. See Note 13 for a discussion of the Company's derivative instruments and hedging activities.
(h) | Cash Equivalents |
The Company considers all highly liquid investments with a maturity of three months or less when purchased to be cash equivalents.
(i) | Amortization |
Debt origination costs are deferred and amortized over the term of each loan using the effective interest method. Amortization of debt issuance costs was $1,352,000, $1,250,000 and $1,534,000 for 2018, 2017 and 2016, respectively. Amortization of facility fees was $736,000, $670,000 and $670,000 for 2018, 2017 and 2016, respectively.
Leasing costs are deferred and amortized using the straight-line method over the term of the lease. Leasing costs paid during the period are included in Changes in other assets and other liabilities in the Investing Activities section on the Consolidated Statements of Cash Flows. Leasing costs amortization expense was $11,493,000, $10,329,000 and $9,932,000 for 2018, 2017 and 2016, respectively.
Amortization expense for in-place lease intangibles is disclosed below in Real Estate Property Acquisitions and Acquired Intangibles.
(j) | Real Estate Property Acquisitions and Acquired Intangibles |
Upon acquisition of real estate properties, EastGroup applies the principles of ASC 805, Business Combinations. Prior to the Company's adoption of ASU 2017-01, Business Combinations (Topic 805): Clarifying the Definition of a Business, effective October 1, 2016, acquisition-related costs were recognized as expenses in the periods in which the costs were incurred and the services were received.
Beginning with acquisitions after October 1, 2016, the Company follows the guidance in ASU 2017-01, which provides a framework for determining whether transactions should be accounted for as acquisitions (or disposals) of assets or businesses. Under the guidance, companies are required to utilize an initial screening test to determine whether substantially all of the fair value of the gross assets acquired (or disposed of) is concentrated in a single identifiable asset or a group of similar identifiable assets; if so, the set is not a business. EastGroup determined that its real estate property acquisitions in 2018, 2017 and the fourth quarter of 2016 are considered to be acquisitions of groups of similar identifiable assets; therefore, the acquisitions are not considered to be acquisitions of a business. As a result, the Company has capitalized acquisition costs related to its 2018, 2017 and fourth quarter 2016 acquisitions.
The FASB Codification also provides guidance on how to properly determine the allocation of the purchase price among the individual components of both the tangible and intangible assets based on their respective fair values. Goodwill for business combinations is recorded when the purchase price exceeds the fair value of the assets and liabilities acquired. Factors considered by management in allocating the cost of the properties acquired include an estimate of carrying costs during the expected lease-up periods considering current market conditions and costs to execute similar leases. The allocation to tangible assets (land,
70
EASTGROUP PROPERTIES, INC. AND SUBSIDIARIES
NOTES TO CONSOLIDATED FINANCIAL STATEMENTS
building and improvements) is based upon management’s determination of the value of the property as if it were vacant using discounted cash flow models. The Company determines whether any financing assumed is above or below market based upon comparison to similar financing terms for similar properties. The cost of the properties acquired may be adjusted based on indebtedness assumed from the seller that is determined to be above or below market rates.
The purchase price is also allocated among the following categories of intangible assets: the above or below market component of in-place leases, the value of in-place leases, and the value of customer relationships. The value allocable to the above or below market component of an acquired in-place lease is determined based upon the present value (using a discount rate reflecting the risks associated with the acquired leases) of the difference between (i) the contractual amounts to be paid pursuant to the lease over its remaining term, and (ii) management’s estimate of the amounts that would be paid using fair market rates over the remaining term of the lease. The amounts allocated to above and below market leases are included in Other assets and Other liabilities, respectively, on the Consolidated Balance Sheets and are amortized to rental income over the remaining terms of the respective leases. The total amount of intangible assets is further allocated to in-place lease values and customer relationship values based upon management’s assessment of their respective values. These intangible assets are included in Other assets on the Consolidated Balance Sheets and are amortized over the remaining term of the existing lease, or the anticipated life of the customer relationship, as applicable.
Amortization of above and below market leases increased rental income by $667,000, $529,000 and $488,000 in 2018, 2017 and 2016, respectively. Amortization expense for in-place lease intangibles was $4,204,000, $4,535,000 and $4,210,000 for 2018, 2017 and 2016, respectively.
Projected amortization of in-place lease intangibles for the next five years as of December 31, 2018 is as follows:
Years Ending December 31, | (In thousands) | |||
2019 | $ | 3,614 | ||
2020 | 2,862 | |||
2021 | 2,006 | |||
2022 | 1,161 | |||
2023 | 870 | |||
During 2018, the Company acquired the following operating properties: Gwinnett 316 in Atlanta; Eucalyptus Distribution Center in Chino (Los Angeles); Allen Station I & II in Dallas; and Greenhill Distribution Center in Austin. The Company also acquired one value-add property, Siempre Viva Distribution Center in San Diego. At the time of acquisition, Siempre Viva was classified in the lease-up phase. The total cost for the properties acquired by the Company was $71,086,000, of which $54,537,000 was allocated to Real estate properties and $13,934,000 was allocated to Development and value-add properties. EastGroup allocated $23,263,000 of the total purchase price to land using third party land valuations for the Atlanta, Dallas, Austin, San Diego and Chino (Los Angeles) markets. The market values are considered to be Level 3 inputs as defined by ASC 820, Fair Value Measurement (see Note 18 for additional information on ASC 820). Intangibles associated with the purchase of real estate were allocated as follows: $4,350,000 to in-place lease intangibles and $21,000 to above market leases (included in Other assets on the Consolidated Balance Sheets), and $1,756,000 to below market leases (included in Other liabilities on the Consolidated Balance Sheets). These costs are amortized over the remaining lives of the associated leases in place at the time of acquisition.
During 2017, the Company acquired the following operating properties: Shiloh 400, Broadmoor Commerce Park and Hurricane Shoals 1 & 2 in Atlanta and Southpark Corporate Center 5-7 in Austin. The Company also acquired one development stage property, Progress Center 1 & 2 in Atlanta. At the time of acquisition, Progress Center 1 & 2 was classified in the lease-up phase of development. The total cost for the properties acquired by the Company was $65,243,000, of which $51,539,000 was allocated to Real estate properties and $10,312,000 was allocated to Development and value-add properties. EastGroup allocated $11,281,000 of the total purchase price to land using third party land valuations for the Atlanta and Austin markets. The market values are considered to be Level 3 inputs as defined by ASC 820, Fair Value Measurement (see Note 18 for additional information on ASC 820). Intangibles associated with the purchase of real estate were allocated as follows: $3,662,000 to in-place lease intangibles and $115,000 to above market leases and $385,000 to below market leases.
During 2016, the Company acquired the following development-stage properties: Parc North in Ft. Worth (Dallas), Weston Commerce Park in Weston (South Florida), and Jones Corporate Park in Las Vegas. At the time of acquisition, the properties were classified as under construction or in the lease-up phase of development. Also in 2016, the Company acquired Flagler Center, a three-building business distribution complex in Jacksonville, Florida. The properties purchased in 2016 were acquired for a total cost of $112,158,000, of which $22,228,000 was allocated to Real estate properties and $84,490,000 was allocated to Development
71
EASTGROUP PROPERTIES, INC. AND SUBSIDIARIES
NOTES TO CONSOLIDATED FINANCIAL STATEMENTS
and value-add properties. EastGroup allocated $29,164,000 of the total purchase price to land using third party land valuations for the Dallas, South Florida, Las Vegas and Jacksonville markets. The market values are considered to be Level 3 inputs as defined by ASC 820. Intangibles associated with the purchase of real estate were allocated as follows: $5,941,000 to in-place lease intangibles, $393,000 to above market leases and $894,000 to below market leases.
The Company periodically reviews the recoverability of goodwill (at least annually) and the recoverability of other intangibles (on a quarterly basis) for possible impairment. In management’s opinion, no impairment of goodwill and other intangibles existed at December 31, 2018 and 2017.
(k) | Stock-Based Compensation |
In May 2004, the stockholders of the Company approved the EastGroup Properties, Inc. 2004 Equity Incentive Plan ("the 2004 Plan"), which was further amended by the Board of Directors in September 2005 and December 2006. This plan authorized the issuance of common stock to employees in the form of options, stock appreciation rights, restricted stock, deferred stock units, performance shares, bonus stock or stock in lieu of cash compensation.
In April 2013, the Board of Directors adopted the EastGroup Properties, Inc. 2013 Equity Incentive Plan (the “2013 Equity Plan”) upon the recommendation of the Compensation Committee; the 2013 Equity Plan was approved by the Company's stockholders and became effective May 29, 2013. The 2013 Equity Plan was further amended by the Board of Directors in March 2017. The 2013 Equity Plan replaced the 2004 Plan and the 2005 Directors Equity Incentive Plan. Typically, the Company issues new shares to fulfill stock grants or upon the exercise of stock options.
EastGroup applies the provisions of ASC 718, Compensation – Stock Compensation, to account for its stock-based compensation plans. ASC 718 requires that the compensation cost relating to share-based payment transactions be recognized in the financial statements and that the cost be measured on the fair value of the equity or liability instruments issued. The cost for market-based awards and awards that only require service are expensed on a straight-line basis over the requisite service periods. The cost for performance-based awards is determined using the graded vesting attribution method which recognizes each separate vesting portion of the award as a separate award on a straight-line basis over the requisite service period. This method accelerates the expensing of the award compared to the straight-line method.
The total compensation expense for service and performance based awards is based upon the fair market value of the shares on the grant date. The grant date fair value for awards that have been granted and are subject to a future market condition (total shareholder return) are determined using a simulation pricing model developed to specifically accommodate the unique features of the awards.
During the restricted period for awards no longer subject to contingencies, the Company accrues dividends and holds the certificates for the shares; however, the employee can vote the shares. Share certificates and dividends are delivered to the employee as they vest.
(l) | Earnings Per Share |
The Company applies ASC 260, Earnings Per Share, which requires companies to present basic and diluted earnings per share ("EPS"). Basic EPS represents the amount of earnings for the period attributable to each share of common stock outstanding during the reporting period. The Company’s basic EPS is calculated by dividing Net Income Attributable to EastGroup Properties, Inc. Common Stockholders by the weighted average number of common shares outstanding. The weighted average number of common shares outstanding does not include any potentially dilutive securities or any unvested restricted shares of common stock. These unvested restricted shares, although classified as issued and outstanding, are considered forfeitable until the restrictions lapse and will not be included in the basic EPS calculation until the shares are vested.
Diluted EPS represents the amount of earnings for the period attributable to each share of common stock outstanding during the reporting period and to each share that would have been outstanding assuming the issuance of common shares for all dilutive potential common shares outstanding during the reporting period. The Company calculates diluted EPS by dividing Net Income Attributable to EastGroup Properties, Inc. Common Stockholders by the weighted average number of common shares outstanding plus the dilutive effect of unvested restricted stock. The dilutive effect of unvested restricted stock is determined using the treasury stock method.
(m) | Use of Estimates |
The preparation of financial statements in conformity with U.S. generally accepted accounting principles (GAAP) requires management to make estimates and assumptions that affect the reported amounts of assets, liabilities, revenues and expenses during the reporting period and to disclose material contingent assets and liabilities at the date of the financial statements. Actual results could differ from those estimates.
72
EASTGROUP PROPERTIES, INC. AND SUBSIDIARIES
NOTES TO CONSOLIDATED FINANCIAL STATEMENTS
(n) | Risks and Uncertainties |
The state of the overall economy can significantly impact the Company’s operational performance and thus impact its financial position. Should EastGroup experience a significant decline in operational performance, it may affect the Company’s ability to make distributions to its shareholders, service debt, or meet other financial obligations.
(o) | Recent Accounting Pronouncements |
EastGroup has evaluated all ASUs recently released by the FASB through the date the financial statements were issued and determined that the following ASUs apply to the Company.
In May 2014, the FASB issued ASU 2014-09, Revenue from Contracts with Customers, which requires an entity to recognize the amount of revenue to which it expects to be entitled for the transfer of promised goods or services to customers. The FASB issued further guidance in ASU 2016-12, Revenue from Contracts with Customers (Topic 606): Narrow-Scope Improvements and Practical Expedients, that provides clarifying guidance in certain narrow areas and adds some practical expedients. The new standard was effective for the Company on January 1, 2018, and the Company used the modified retrospective approach upon adoption. The adoption of ASU 2014-09 did not have a material impact on the Company's financial condition or results of operations.
In January 2016, the FASB issued ASU 2016-01, Financial Instruments - Overall (Subtopic 825-10): Recognition and Measurement of Financial Assets and Financial Liabilities,which requires public business entities to use the exit price notion when measuring the fair value of financial instruments for disclosure purposes, requires separate presentation of financial assets and financial liabilities by measurement category and form of financial asset, and eliminates the requirement for public business entities to disclose the methods and significant assumptions used to estimate the fair value that is required to be disclosed for financial instruments measured at amortized costs on the balance sheet. EastGroup adopted ASU 2016-01 effective January 1, 2018. The adoption of ASU 2016-01 did not have a material impact on the Company's financial condition or results of operations.
In February 2016, the FASB issued ASU 2016-02, Leases (Topic 842), which requires lessees to recognize the following for all leases (with the exception of short-term leases) at the commencement date: (1) a lease liability, which is a lessee's obligation to make lease payments arising from a lease, measured on a discounted basis; and (2) a right-of-use asset, which is an asset that represents the lessee's right to use, or control the use of, a specified asset for the lease term. The Company is a lessee on a limited number of leases, including office and ground leases, and while the adoption of ASU 2016-02 will impact the Company's accounting for office and ground leases, the Company anticipates the impact will not be material to its overall financial condition and results of operations. The Company anticipates the right-of-use asset and lease liability values for its office and ground leases will be less than 1% of Total assets. Lessor accounting is largely unchanged under ASU 2016-02. The Company's primary revenue is rental income; as such, the Company is a lessor on a significant number of leases. The Company believes it will continue to account for its leases in substantially the same manner. The most significant change for the Company related to lessor accounting includes the new standard's narrow definition of initial direct costs for leases. The new definition will result in certain costs (primarily legal costs related to lease negotiations) being expensed rather than capitalized upon adoption of the new standard. EastGroup estimates the new definition of initial direct costs will result in an increase of expenses, and therefore a decrease in earnings, of approximately $200,000 on an annual basis. EastGroup has elected the practical expedient permitting lessors to make an accounting policy election by class of underlying asset to not separate non-lease components of a contract from the lease component to which they relate when specific criteria are met (the Company believes its leases meet the criteria). Public business entities are required to apply the amendments in ASU 2016-02 for fiscal years beginning after December 15, 2018, including interim periods within those fiscal years. EastGroup adopted ASU 2016-02 effective January 1, 2019. The Company is continuing the process of evaluating and quantifying the effect that ASU 2016-02 will have on its consolidated financial statements and related disclosures beginning with the Form 10-Q for the period ending March 31, 2019.
In May 2017, the FASB issued ASU 2017-09, Compensation - Stock Compensation (Topic 718): Scope of Modification Accounting, which clarifies what constitutes a modification of a share-based payment award. The ASU is intended to provide clarity and reduce both diversity in practice and cost and complexity when applying the guidance in Topic 718 to a change to the terms or conditions of a share-based payment award. ASU 2017-09 is effective for public entities for annual periods beginning after December 15, 2017, and interim periods within those fiscal years. The Company adopted ASU 2017-09 on January 1, 2018; the adoption of ASU 2017-09 did not have a material impact on its financial condition or results of operations, as the Company has not had any modifications to share-based payment awards. However, if the Company does have a modification to an award in the future, it will follow the guidance in ASU 2017-09.
In August 2017, the FASB issued ASU 2017-12, Derivatives and Hedging (Topic 815): Targeted Improvements to Accounting for Hedging Activities. The ASU is intended to better align a company's financial reporting for hedging activities with the economic objectives of those activities. The transition method is a modified retrospective approach that will require the Company to recognize
73
EASTGROUP PROPERTIES, INC. AND SUBSIDIARIES
NOTES TO CONSOLIDATED FINANCIAL STATEMENTS
the cumulative effect of initially applying the ASU as an adjustment to Accumulated other comprehensive income with a corresponding adjustment to the opening balance of retained earnings as of the beginning of the fiscal year the entity adopts the ASU. The primary provision in the ASU that will require an adjustment to beginning retained earnings is the change in timing and income statement presentation for ineffectiveness related to cash flow and net investment hedges. As a result of the transition guidance in the ASU, cumulative ineffectiveness that has previously been recognized on cash flow and net investment hedges that are still outstanding and designated as of the date of adoption will be adjusted and removed from beginning retained earnings and placed in Accumulated other comprehensive income. ASU 2017-12 is effective for public business entities for annual periods beginning after December 15, 2018, and interim periods within those fiscal years. The Company adopted ASU 2017-12 on January 1, 2019; the adoption of ASU 2017-12 did not have a material impact on its financial condition, results of operations or disclosures.
In August 2018, the FASB issued ASU 2018-13, Fair Value Measurement (Topic 820): Disclosure Framework - Changes to the Disclosure Requirements for Fair Value Measurement. The ASU is intended to improve the effectiveness of fair value measurement disclosures. ASU 2018-13 is effective for all entities for annual periods beginning after December 15, 2019, and interim periods within those fiscal years. Early adoption is permitted; however, the Company plans to adopt ASU 2018-13 on January 1, 2020. EastGroup does not expect the adoption to have a material impact on its financial condition, results of operations or disclosures.
In October 2018, the FASB issued ASU 2018-16, Derivatives and Hedging (Topic 815): Inclusion of the Secured Overnight Financing Rate (SOFR) Overnight Index Swap (OIS) Rate as a Benchmark Interest Rate for Hedge Accounting Purposes. The ASU applies to all entities that elect to apply hedge accounting to benchmark interest rates under Topic 815 and permits the use of the OIS rate based on SOFR as a United States (U.S.) benchmark rate for hedge accounting purposes under Topic 815 in addition to the interest rates on direct Treasury obligations of the U.S. government, the London Inter-bank Offered Rate (LIBOR) swap rate, the OIS rate based on the Fed Funds Effective Rate, and the Securities Industry and Financial Markets Association (SIFMA) Municipal Swap Rate. ASU 2018-16 is effective upon adoption of ASU 2017-12. The Company adopted ASU 2017-12 and ASU 2018-16 on January 1, 2019, and the Company believes the adoption of both ASUs did not have a material impact on its financial condition, results of operation or disclosures.
(p) | Classification of Book Overdraft on Consolidated Statements of Cash Flows |
The Company classifies changes in book overdraft in which the bank has not advanced cash to the Company to cover outstanding checks as an operating activity. Such amounts are included in Accounts payable, accrued expenses and prepaid rent in the Operating Activities section on the Consolidated Statements of Cash Flows.
(q) | Reclassifications |
Certain reclassifications have been made in the 2017 and 2016 consolidated financial statements to conform to the 2018 presentation.
(2) | REAL ESTATE PROPERTIES |
The Company’s Real estate properties and Development and value-add properties at December 31, 2018 and 2017 were as follows:
December 31, | ||||||
2018 | 2017 | |||||
(In thousands) | ||||||
Real estate properties: | ||||||
Land | $ | 380,684 | 345,424 | |||
Buildings and building improvements | 1,732,592 | 1,587,130 | ||||
Tenant and other improvements | 440,205 | 404,180 | ||||
Development and value-add properties (1) | 263,664 | 242,014 | ||||
2,817,145 | 2,578,748 | |||||
Less accumulated depreciation | (814,915 | ) | (749,601 | ) | ||
$ | 2,002,230 | 1,829,147 | ||||
(1) | Value-add properties are defined as properties that are either acquired but not stabilized or can be converted to a higher and better use. Acquired properties meeting either of the following two conditions are considered value-add properties: (1) Less than 75% occupied as of the acquisition date (or will be less than 75% occupied within one year of acquisition date based on near term lease roll), or (2) 20% or greater of the acquisition cost will be spent to redevelop the property. |
EastGroup acquired operating properties during 2018, 2017 and 2016 as discussed in Note 1(j).
The Company sold operating properties during 2018, 2017 and 2016 as shown in the table below. The results of operations and gains and losses on sales for the properties sold during the periods presented are reported in continuing operations on the
74
EASTGROUP PROPERTIES, INC. AND SUBSIDIARIES
NOTES TO CONSOLIDATED FINANCIAL STATEMENTS
Consolidated Statements of Income and Comprehensive Income. The gains and losses on sales are included in Gain, net of loss, on sales of real estate investments.
The Company did not classify any properties as held for sale as of December 31, 2018 and 2017.
Sales of Real Estate
A summary of Gain, net of loss, on sales of real estate investments for the years ended December 31, 2018, 2017 and 2016 follows:
Real Estate Properties | Location | Size (in Square Feet) | Date Sold | Net Sales Price | Basis | Recognized Gain (Loss) | |||||||||||
(In thousands) | |||||||||||||||||
2018 | |||||||||||||||||
World Houston 18 | Houston, TX | 33,000 | 01/26/2018 | $ | 2,289 | 1,211 | 1,078 | ||||||||||
56 Commerce Park | Tampa, FL | 181,000 | 03/20/2018 | 12,032 | 2,888 | 9,144 | |||||||||||
35th Avenue Distribution Center | Phoenix, AZ | 125,000 | 07/26/2018 | 7,683 | 3,632 | 4,051 | |||||||||||
Total for 2018 | $ | 22,004 | 7,731 | 14,273 | |||||||||||||
2017 | |||||||||||||||||
Stemmons Circle | Dallas, TX | 99,000 | 05/12/2017 | $ | 5,051 | 1,329 | 3,722 | ||||||||||
Techway Southwest I-IV | Houston, TX | 415,000 | 06/19/2017 | 32,506 | 14,373 | 18,133 | |||||||||||
Total for 2017 | $ | 37,557 | 15,702 | 21,855 | |||||||||||||
2016 | |||||||||||||||||
Northwest Point Distribution and Service Centers | Houston, TX | 232,000 | 02/12/2016 | $ | 15,189 | 5,080 | 10,109 | ||||||||||
North Stemmons III | Dallas, TX | 60,000 | 03/04/2016 | 3,131 | 1,908 | 1,223 | |||||||||||
North Stemmons II | Dallas, TX | 26,000 | 04/12/2016 | 1,203 | 765 | 438 | |||||||||||
Lockwood Distribution Center | Houston, TX | 392,000 | 04/18/2016 | 14,024 | 4,154 | 9,870 | |||||||||||
West Loop Distribution Center 1 & 2 | Houston, TX | 161,000 | 04/19/2016 | 13,154 | 3,564 | 9,590 | |||||||||||
America Plaza | Houston, TX | 121,000 | 04/28/2016 | 7,938 | 3,378 | 4,560 | |||||||||||
Interstate Commons Distribution Center 1 & 2 | Phoenix, AZ | 142,000 | 05/31/2016 | 9,906 | 3,568 | 6,338 | |||||||||||
Castilian Research Center (1) | Santa Barbara, CA | 30,000 | 06/28/2016 | 7,698 | 7,513 | 185 | |||||||||||
Memphis I | Memphis, TN | 92,000 | 12/16/2016 | 1,482 | 1,625 | (143 | ) | ||||||||||
Total for 2016 | $ | 73,725 | 31,555 | 42,170 | |||||||||||||
(1) | EastGroup owned 80% of Castilian Research Center through a joint venture. The information shown for this transaction also includes the 20% attributable to the Company's noncontrolling interest partner. |
The table above includes sales of operating properties; the Company also sold parcels of land during the years presented. During the year ended December 31, 2018, the Company sold a parcel of land in Houston generating gross proceeds of $2,577,000 and recognized a gain of $86,000. During the year ended December 31, 2017, EastGroup sold parcels of land in El Paso and Dallas for $3,778,000 and recognized a net gain of $293,000. During the year ended December 31, 2016, EastGroup sold parcels of land in Houston, Dallas and Orlando for $5,400,000 and recognized net gains of $733,000. The net gains on sales of land are included in Other on the Consolidated Statements of Income and Comprehensive Income.
Development and Value-Add Properties
The Company’s development and value-add program as of December 31, 2018, was comprised of the properties detailed in the table below. Costs incurred include capitalization of interest costs during the period of construction. The interest costs capitalized on development projects for 2018 were $6,334,000 compared to $5,765,000 for 2017 and $5,340,000 for 2016. In addition, EastGroup capitalized internal development costs of $4,696,000 during the year ended December 31, 2018, compared to $4,754,000 during 2017 and $3,789,000 in 2016.
Total capital invested for development and value-add properties during 2018 was $167,667,000, which primarily consisted of costs of $134,957,000 and $21,736,000 as detailed in the Development and Value-Add Properties Activity table below and costs of $8,556,000 on projects subsequent to transfer to Real estate properties. The capitalized costs incurred on development projects subsequent to transfer to Real estate properties include capital improvements at the properties and do not include other capitalized costs associated with development (i.e., interest expense, property taxes and internal personnel costs).
75
EASTGROUP PROPERTIES, INC. AND SUBSIDIARIES
NOTES TO CONSOLIDATED FINANCIAL STATEMENTS
DEVELOPMENT AND VALUE-ADD PROPERTIES ACTIVITY | Costs Incurred | Anticipated Building Conversion Date | ||||||||||||||||
Costs Transferred in 2018 (1) | For the Year Ended 12/31/18 | Cumulative as of 12/31/18 | Estimated Total Costs (2) | |||||||||||||||
(In thousands) | ||||||||||||||||||
(Unaudited) | (Unaudited) | (Unaudited) | ||||||||||||||||
LEASE-UP | Building Size (Square feet) | |||||||||||||||||
Siempre Viva, San Diego, CA | 115,000 | $ | — | 14,075 | 14,075 | 14,400 | 01/19 | |||||||||||
CreekView 121 3 & 4, Dallas, TX | 158,000 | — | 3,489 | 13,800 | 16,200 | 03/19 | ||||||||||||
Falcon Field, Phoenix, AZ | 96,000 | — | 5,285 | 8,232 | 9,400 | 05/19 | ||||||||||||
Gateway 1, Miami, FL | 200,000 | 9,110 | 11,131 | 20,241 | 25,000 | 05/19 | ||||||||||||
Broadmoor 2, Atlanta, GA | 111,000 | 705 | 5,709 | 6,414 | 7,400 | 11/19 | ||||||||||||
Total Lease-Up | 680,000 | 9,815 | 39,689 | 62,762 | 72,400 | |||||||||||||
UNDER CONSTRUCTION | ||||||||||||||||||
Horizon XI, Orlando, FL | 135,000 | 3,171 | 5,552 | 8,723 | 10,400 | 01/20 | ||||||||||||
Settlers Crossing 1, Austin, TX | 77,000 | — | 4,704 | 6,260 | 7,400 | 01/20 | ||||||||||||
Settlers Crossing 2, Austin, TX | 83,000 | — | 5,442 | 7,115 | 8,400 | 01/20 | ||||||||||||
SunCoast 5, Ft. Myers, FL | 81,000 | 2,704 | 3,831 | 6,535 | 7,700 | 01/20 | ||||||||||||
Airport Commerce Center 3, Charlotte, NC | 96,000 | — | 4,060 | 5,793 | 7,300 | 02/20 | ||||||||||||
Parc North 5, Dallas, TX | 100,000 | 1,683 | 5,270 | 6,953 | 9,200 | 02/20 | ||||||||||||
Steele Creek V, Charlotte, NC | 54,000 | 1,366 | 1,948 | 3,314 | 5,800 | 03/20 | ||||||||||||
Horizon VI, Orlando, FL | 148,000 | 3,418 | 4,807 | 8,225 | 12,700 | 04/20 | ||||||||||||
Ten West Crossing 8, Houston, TX | 132,000 | 1,947 | 4,643 | 6,590 | 10,900 | 04/20 | ||||||||||||
Tri-County Crossing 1 & 2, San Antonio, TX | 203,000 | 2,012 | 6,883 | 8,895 | 14,600 | 04/20 | ||||||||||||
Eisenhauer Point 7 & 8, San Antonio, TX | 336,000 | 4,916 | 8,174 | 13,090 | 24,500 | 05/20 | ||||||||||||
CreekView 121 5 & 6, Dallas, TX | 139,000 | 3,675 | 1,930 | 5,605 | 14,900 | 07/20 | ||||||||||||
Total Under Construction | 1,584,000 | 24,892 | 57,244 | 87,098 | 133,800 | |||||||||||||
PROSPECTIVE DEVELOPMENT (PRIMARILY LAND) | Estimated Building Size (Square feet) | |||||||||||||||||
Phoenix, AZ | 315,000 | — | 6,809 | 6,809 | ||||||||||||||
Ft. Myers, FL | 488,000 | (2,704 | ) | 1,914 | 13,322 | |||||||||||||
Miami, FL | 650,000 | (9,110 | ) | 14,565 | 36,331 | |||||||||||||
Orlando, FL | 214,000 | (6,589 | ) | 1,188 | 5,719 | |||||||||||||
Tampa, FL | 32,000 | — | — | 1,560 | ||||||||||||||
Atlanta, GA | 100,000 | (705 | ) | 224 | 726 | |||||||||||||
Jackson, MS | 28,000 | — | — | 706 | ||||||||||||||
Charlotte, NC | 600,000 | (1,366 | ) | 1,846 | 7,209 | |||||||||||||
Austin, TX | 180,000 | — | 722 | 3,742 | ||||||||||||||
Dallas, TX | 612,000 | (5,358 | ) | 7,954 | 12,192 | |||||||||||||
Houston, TX (3) | 1,123,000 | (2,969 | ) | (1,782 | ) | 16,439 | ||||||||||||
San Antonio, TX | 908,000 | (6,928 | ) | 4,584 | 9,049 | |||||||||||||
Total Prospective Development | 5,250,000 | (35,729 | ) | 38,024 | 113,804 | |||||||||||||
7,514,000 | $ | (1,022 | ) | 134,957 | 263,664 | |||||||||||||
DEVELOPMENT AND VALUE-ADD PROPERTIES TRANSFERRED TO REAL ESTATE PROPERTIES DURING 2018 | Building Size (Square feet) | Building Conversion Date | ||||||||||||||||
Alamo Ridge IV, San Antonio, TX | 97,000 | $ | — | 320 | 7,417 | 03/18 | ||||||||||||
Oak Creek VII, Tampa, FL | 116,000 | — | 601 | 6,732 | 03/18 | |||||||||||||
Weston, Ft. Lauderdale, FL | 134,000 | — | 222 | 15,742 | 03/18 | |||||||||||||
Progress Center 1 & 2, Atlanta, GA | 132,000 | — | 143 | 10,476 | 04/18 | |||||||||||||
Horizon X, Orlando, FL | 104,000 | — | 3,352 | 6,902 | 05/18 | |||||||||||||
SunCoast 4, Ft. Myers, FL | 93,000 | — | 71 | 9,191 | 05/18 | |||||||||||||
Country Club V, Tucson, AZ | 305,000 | — | 7,078 | 21,029 | 06/18 | |||||||||||||
Eisenhauer Point 3, San Antonio, TX | 71,000 | — | 231 | 6,390 | 06/18 | |||||||||||||
Kyrene 202 III, IV & V, Phoenix, AZ | 166,000 | — | 1,146 | 12,689 | 09/18 | |||||||||||||
Steele Creek VII, Charlotte, NC | 120,000 | — | 795 | 8,592 | 09/18 | |||||||||||||
Eisenhauer Point 6, San Antonio, TX | 85,000 | — | 1,356 | 5,406 | 10/18 | |||||||||||||
Horizon XII, Orlando, FL | 140,000 | — | 653 | 11,883 | 10/18 | |||||||||||||
Eisenhauer Point 5, San Antonio, TX | 98,000 | — | 2,012 | 7,816 | 11/18 | |||||||||||||
West Road 5, Houston, TX | 58,000 | 1,022 | 3,756 | 4,778 | 11/18 | |||||||||||||
Total Transferred to Real Estate Properties | 1,719,000 | $ | 1,022 | 21,736 | 135,043 | (4) | ||||||||||||
Footnotes for the Development and Value-Add Properties Activity table are on the following page.
76
EASTGROUP PROPERTIES, INC. AND SUBSIDIARIES
NOTES TO CONSOLIDATED FINANCIAL STATEMENTS
(1) | Represents costs transferred from Prospective Development (primarily land) to Under Construction during the period. Negative amounts represent land inventory costs transferred to Under Construction. |
(2) | Included in these costs are development obligations of $52.4 million and tenant improvement obligations of $13.6 million on properties under development. |
(3) | Negative amount represents land inventory costs transferred to Under Construction and land sold on 3/28/18. |
(4) | Represents cumulative costs at the date of transfer. |
Future Minimum Rental Receipts Under Non-Cancelable Leases
The following schedule indicates approximate future minimum rental receipts under non-cancelable leases for real estate properties by year as of December 31, 2018:
Years Ending December 31, | (In thousands) | |||
2019 | $ | 226,330 | ||
2020 | 195,850 | |||
2021 | 151,564 | |||
2022 | 112,007 | |||
2023 | 82,262 | |||
Thereafter | 163,499 | |||
Total minimum receipts | $ | 931,512 | ||
Ground Leases
As of December 31, 2018, the Company owned two properties in Florida, two properties in Texas and one property in Arizona that are subject to ground leases. These leases have terms of 40 to 50 years, expiration dates of August 2031 to November 2037, and renewal options of 15 to 35 years, except for the one lease in Arizona which is automatically and perpetually renewed annually. Total ground lease expenditures for the years ended December 31, 2018, 2017 and 2016 were $783,000, $760,000 and $756,000, respectively. Payments are subject to increases at 3 to 10 year intervals based upon the agreed or appraised fair market value of the leased premises on the adjustment date or the Consumer Price Index percentage increase since the base rent date. The following schedule indicates approximate future minimum ground lease payments for these properties by year as of December 31, 2018:
Future Minimum Ground Lease Payments
Years Ending December 31, | (In thousands) | |||
2019 | $ | 791 | ||
2020 | 791 | |||
2021 | 791 | |||
2022 | 791 | |||
2023 | 791 | |||
Thereafter | 9,343 | |||
Total minimum payments | $ | 13,298 | ||
(3) | UNCONSOLIDATED INVESTMENT |
The Company owns a 50% undivided tenant-in-common interest in Industry Distribution Center II, a 309,000 square foot warehouse distribution building in the City of Industry (Los Angeles), California. The building was constructed in 1998 and is 100% leased through December 2021 to a single tenant who owns the other 50% interest in the property. This investment is accounted for under the equity method of accounting and had a carrying value of $7,870,000 at December 31, 2018, and $8,029,000 at December 31, 2017.
77
EASTGROUP PROPERTIES, INC. AND SUBSIDIARIES
NOTES TO CONSOLIDATED FINANCIAL STATEMENTS
(4) | MORTGAGE LOANS RECEIVABLE |
As of December 31, 2016, the Company had two mortgage loans receivable, both of which were classified as first mortgage loans, with effective interest rates of 5.25% and maturity dates in October 2017. During 2017, the loan agreements were amended and restated. As of December 31, 2017, EastGroup had two mortgage loans receivable, both of which were classified as first mortgage loans, with effective interest rates of 5.15% and maturity dates in December 2022. In March of 2018, one of the notes was repaid in full. As of December 31, 2018, the Company had one mortgage loan receivable which was classified as a first mortgage loan with an effective interest rate of 5.15% and a maturity date in December 2022. Mortgage loans receivable are included in Other assets on the Consolidated Balance Sheets. See Note 5 for a summary of Other assets.
(5) | OTHER ASSETS |
A summary of the Company’s Other assets follows:
December 31, | ||||||
2018 | 2017 | |||||
(In thousands) | ||||||
Leasing costs (principally commissions) | $ | 78,985 | 72,722 | |||
Accumulated amortization of leasing costs | (30,185 | ) | (27,973 | ) | ||
Leasing costs (principally commissions), net of accumulated amortization | 48,800 | 44,749 | ||||
Straight-line rents receivable | 36,365 | 31,609 | ||||
Allowance for doubtful accounts on straight-line rents receivable | (343 | ) | (48 | ) | ||
Straight-line rents receivable, net of allowance for doubtful accounts | 36,022 | 31,561 | ||||
Accounts receivable | 6,033 | 6,004 | ||||
Allowance for doubtful accounts on accounts receivable | (600 | ) | (577 | ) | ||
Accounts receivable, net of allowance for doubtful accounts | 5,433 | 5,427 | ||||
Acquired in-place lease intangibles | 21,696 | 20,690 | ||||
Accumulated amortization of acquired in-place lease intangibles | (9,833 | ) | (8,974 | ) | ||
Acquired in-place lease intangibles, net of accumulated amortization | 11,863 | 11,716 | ||||
Acquired above market lease intangibles | 1,465 | 1,550 | ||||
Accumulated amortization of acquired above market lease intangibles | (902 | ) | (794 | ) | ||
Acquired above market lease intangibles, net of accumulated amortization | 563 | 756 | ||||
Mortgage loans receivable | 2,594 | 4,581 | ||||
Interest rate swap assets | 6,701 | 6,034 | ||||
Goodwill | 990 | 990 | ||||
Prepaid expenses and other assets | 8,265 | 10,215 | ||||
Total Other assets | $ | 121,231 | 116,029 | |||
78
EASTGROUP PROPERTIES, INC. AND SUBSIDIARIES
NOTES TO CONSOLIDATED FINANCIAL STATEMENTS
(6) | UNSECURED BANK CREDIT FACILITIES |
Until June 14, 2018, EastGroup had $300 million and $35 million unsecured bank credit facilities with margins over LIBOR of 100 basis points, facility fees of 20 basis points and maturity dates of July 30, 2019. The Company amended and restated these credit facilities on June 14, 2018, expanding the capacity to $350 million and $45 million, as detailed below.
The $350 million unsecured bank credit facility is with a group of nine banks and has a maturity date of July 30, 2022. The credit facility contains options for two six-month extensions (at the Company's election) and a $150 million accordion (with agreement by all parties). The interest rate on each tranche is usually reset on a monthly basis and as of December 31, 2018, was LIBOR plus 100 basis points with an annual facility fee of 20 basis points. The margin and facility fee are subject to changes in the Company's credit ratings. The Company had designated an interest rate swap to an $80 million unsecured bank credit facility draw that effectively fixed the interest rate on the $80 million draw to 2.020% through the interest rate swap's maturity date. This swap matured on August 15, 2018, and the $80 million draw has reverted to the variable interest rate associated with the Company's unsecured bank credit facilities. As of December 31, 2018, the Company had $187,000,000 of variable rate borrowings outstanding on this unsecured bank credit facility with a weighted average interest rate of 3.508%. The Company has a standby letter of credit of $674,000 pledged on this facility.
The Company's $45 million unsecured bank credit facility has a maturity date of July 30, 2022, or such later date as designated by the bank; the Company also has two six-month extensions available if the extension options in the $350 million facility are exercised. The interest rate is reset on a daily basis and as of December 31, 2018, was LIBOR plus 100 basis points with an annual facility fee of 20 basis points. The margin and facility fee are subject to changes in the Company's credit ratings. As of December 31, 2018, the interest rate was 3.503% on a balance of $8,730,000.
Average unsecured bank credit facilities borrowings were $141,223,000 in 2018, $114,751,000 in 2017 and $106,352,000 in 2016, with weighted average interest rates (excluding amortization of facility fees and debt issuance costs) of 2.64% in 2018, 2.07% in 2017 and 1.49% in 2016. Amortization of facility fees was $736,000, $670,000 and $670,000 for 2018, 2017 and 2016, respectively. Amortization of debt issuance costs for the Company's unsecured bank credit facilities was $508,000, $451,000 and $450,000 for 2018, 2017 and 2016, respectively.
The Company’s unsecured bank credit facilities have certain restrictive covenants, such as maintaining debt service coverage and leverage ratios and maintaining insurance coverage, and the Company was in compliance with all of its financial debt covenants at December 31, 2018.
See Note 7 for a detail of the outstanding balances of the Company's Unsecured bank credit facilities as of December 31, 2018 and 2017.
79
EASTGROUP PROPERTIES, INC. AND SUBSIDIARIES
NOTES TO CONSOLIDATED FINANCIAL STATEMENTS
(7) | UNSECURED AND SECURED DEBT |
The Company's debt is detailed below. EastGroup presents debt issuance costs as reductions of Unsecured bank credit facilities, Unsecured debt and Secured debt on the Consolidated Balance Sheets as detailed below.
December 31, 2018 | December 31, 2017 | |||||
(In thousands) | ||||||
Unsecured bank credit facilities - variable rate, carrying amount | $ | 195,730 | 116,339 | |||
Unsecured bank credit facilities - fixed rate, carrying amount (1) (2) | — | 80,000 | ||||
Unamortized debt issuance costs | (1,804 | ) | (630 | ) | ||
Unsecured bank credit facilities | 193,926 | 195,709 | ||||
Unsecured debt - fixed rate, carrying amount (1) | 725,000 | 715,000 | ||||
Unamortized debt issuance costs | (1,600 | ) | (1,939 | ) | ||
Unsecured debt | 723,400 | 713,061 | ||||
Secured debt - fixed rate, carrying amount (1) | 189,038 | 200,354 | ||||
Unamortized debt issuance costs | (577 | ) | (842 | ) | ||
Secured debt | 188,461 | 199,512 | ||||
Total debt | $ | 1,105,787 | 1,108,282 | |||
(1) | These loans have a fixed interest rate or an effectively fixed interest rate due to interest rate swaps. |
(2) | The Company had designated an interest rate swap to an $80 million unsecured bank credit facility draw that effectively fixed the interest rate on the $80 million draw to 2.020% through the interest rate swap's maturity date. This swap matured on August 15, 2018, and the $80 million draw has reverted to the variable interest rate associated with the Company's unsecured bank credit facilities. |
A summary of the carrying amount of Unsecured debt follows:
Balance at December 31, | |||||||||||
Margin Above LIBOR | Interest Rate | Maturity Date | 2018 | 2017 | |||||||
(In thousands) | |||||||||||
$50 Million Unsecured Term Loan | Not applicable | 3.910% | 12/21/2018 | $ | — | 50,000 | |||||
$75 Million Unsecured Term Loan (1) | 1.150% | 2.846% | 07/31/2019 | 75,000 | 75,000 | ||||||
$75 Million Unsecured Term Loan (1) | 1.100% | 3.452% | 12/20/2020 | 75,000 | 75,000 | ||||||
$40 Million Unsecured Term Loan (1) | 1.100% | 2.335% | 07/30/2021 | 40,000 | 40,000 | ||||||
$75 Million Unsecured Term Loan (1) | 1.400% | 3.031% | 02/28/2022 | 75,000 | 75,000 | ||||||
$65 Million Unsecured Term Loan (1) | 1.100% | 2.313% | 04/01/2023 | 65,000 | 65,000 | ||||||
$100 Million Senior Unsecured Notes: | |||||||||||
$30 Million Notes | Not applicable | 3.800% | 08/28/2020 | 30,000 | 30,000 | ||||||
$50 Million Notes | Not applicable | 3.800% | 08/28/2023 | 50,000 | 50,000 | ||||||
$20 Million Notes | Not applicable | 3.800% | 08/28/2025 | 20,000 | 20,000 | ||||||
$60 Million Senior Unsecured Notes | Not applicable | 3.460% | 12/13/2024 | 60,000 | 60,000 | ||||||
$100 Million Senior Unsecured Notes: | |||||||||||
$60 Million Notes | Not applicable | 3.480% | 12/15/2024 | 60,000 | 60,000 | ||||||
$40 Million Notes | Not applicable | 3.750% | 12/15/2026 | 40,000 | 40,000 | ||||||
$25 Million Senior Unsecured Notes | Not applicable | 3.970% | 10/01/2025 | 25,000 | 25,000 | ||||||
$50 Million Senior Unsecured Notes | Not applicable | 3.990% | 10/07/2025 | 50,000 | 50,000 | ||||||
$60 Million Senior Unsecured Notes | Not applicable | 3.930% | 04/10/2028 | 60,000 | — | ||||||
$ | 725,000 | 715,000 | |||||||||
(1) | The interest rates on these unsecured term loans are comprised of LIBOR plus a margin which is subject to a pricing grid for changes in the Company's coverage ratings. The Company entered into interest rate swap agreements (further described in Note 13) to convert the loans' LIBOR rates to effectively fixed interest rates. The interest rates in the table above are the effectively fixed interest rates for the loans, including the effects of the interest rate swaps, as of December 31, 2018. |
80
EASTGROUP PROPERTIES, INC. AND SUBSIDIARIES
NOTES TO CONSOLIDATED FINANCIAL STATEMENTS
In February 2018, the Company refinanced a $65 million unsecured term loan, resulting in a 55 basis point reduction in the loan's interest rate. The loan, which has a maturity date of April 1, 2023, now has an effectively fixed interest rate of 2.313%.
In April, the Company closed $60 million of senior unsecured private placement notes with an insurance company. The notes have a ten-year term and a fixed interest rate of 3.93% with semi-annual interest payments. The notes will not be and have not been registered under the Securities Act of 1933, as amended, and may not be offered or sold in the United States absent registration or an applicable exemption from the registration requirements.
In June, the Company repaid (with no penalty) a $50 million senior unsecured term loan with an interest rate of 3.91% and an original maturity date of December 21, 2018.
The Company’s unsecured debt instruments have certain restrictive covenants, such as maintaining debt service coverage and leverage ratios and maintaining insurance coverage, and the Company was in compliance with all of its financial debt covenants at December 31, 2018.
A summary of the carrying amount of Secured debt follows:
Interest Rate | Monthly P&I Payment | Maturity Date | Carrying Amount of Securing Real Estate at December 31, 2018 | Balance at December 31, | |||||||||||||
Property | 2018 | 2017 | |||||||||||||||
(In thousands) | |||||||||||||||||
Dominguez, Industry I & III, Kingsview, Shaw, Walnut and Washington | 7.50% | 539,747 | 05/05/2019 | $ | 45,420 | 46,725 | 49,580 | ||||||||||
Blue Heron II | 5.39% | 16,176 | 02/29/2020 | 4,555 | 233 | 409 | |||||||||||
40th Avenue, Beltway Crossing V, Centennial Park, Executive Airport, Interchange Park I, Ocean View, Wetmore 5-8 and World Houston 26, 28, 29 & 30 | 4.39% | 463,778 | 01/05/2021 | 66,493 | 52,115 | 55,317 | |||||||||||
Colorado Crossing, Interstate I-III, Rojas, Steele Creek 1 & 2, Venture and World Houston 3-9 (1) | 4.75% | 420,045 | 06/05/2021 | 53,820 | 47,445 | 50,161 | |||||||||||
Arion 18, Beltway Crossing VI & VII, Commerce Park II & III, Concord, Interstate V-VII, Lakeview, Ridge Creek II, Southridge IV & V and World Houston 32 | 4.09% | 329,796 | 01/05/2022 | 54,679 | 40,046 | 42,315 | |||||||||||
Ramona | 3.85% | 16,287 | 11/30/2026 | 8,890 | 2,474 | 2,572 | |||||||||||
$ | 233,857 | 189,038 | 200,354 | ||||||||||||||
(1) | Subsequent to December 31, 2018, the Company executed a collateral release for World Houston 5; this property is no longer considered to be collateral securing this loan. |
The Company currently intends to repay its debt obligations, both in the short-term and long-term, through its operating cash flows, borrowings under its unsecured bank credit facilities, proceeds from new debt (primarily unsecured), and/or proceeds from the issuance of equity instruments.
Scheduled principal payments on long-term debt, including Unsecured debt and Secured debt (not including Unsecured bank credit facilities), due during the next five years as of December 31, 2018 are as follows:
Years Ending December 31, | (In thousands) | |||
2019 | $ | 130,567 | ||
2020 | 114,096 | |||
2021 | 129,563 | |||
2022 | 107,769 | |||
2023 | 115,119 | |||
81
EASTGROUP PROPERTIES, INC. AND SUBSIDIARIES
NOTES TO CONSOLIDATED FINANCIAL STATEMENTS
(8) | ACCOUNTS PAYABLE AND ACCRUED EXPENSES |
A summary of the Company’s Accounts payable and accrued expenses follows:
December 31, | ||||||
2018 | 2017 | |||||
(In thousands) | ||||||
Property taxes payable | $ | 10,718 | 12,081 | |||
Development costs payable | 15,410 | 9,699 | ||||
Real estate improvements and capitalized leasing costs payable | 3,911 | 3,957 | ||||
Interest payable | 4,067 | 3,744 | ||||
Dividends payable | 27,738 | 1,365 | ||||
Book overdraft (1) | 15,048 | 20,902 | ||||
Other payables and accrued expenses | 9,671 | 13,219 | ||||
Total Accounts payable and accrued expenses | $ | 86,563 | 64,967 | |||
(1) Represents checks written before the end of the period which have not cleared the bank; therefore, the bank has not yet advanced cash to the Company. When the checks clear the bank, they will be funded through the Company's working cash line of credit. See Note 1(p).
(9) | OTHER LIABILITIES |
A summary of the Company’s Other liabilities follows:
December 31, | ||||||
2018 | 2017 | |||||
(In thousands) | ||||||
Security deposits | $ | 18,432 | 16,668 | |||
Prepaid rent and other deferred income | 12,728 | 9,352 | ||||
Acquired below-market lease intangibles | 5,891 | 4,135 | ||||
Accumulated amortization of below-market lease intangibles | (3,028 | ) | (2,147 | ) | ||
Acquired below-market lease intangibles, net of accumulated amortization | 2,863 | 1,988 | ||||
Interest rate swap liabilities | — | 695 | ||||
Prepaid tenant improvement reimbursements | 614 | 124 | ||||
Other liabilities | 15 | 15 | ||||
Total Other liabilities | $ | 34,652 | 28,842 | |||
82
EASTGROUP PROPERTIES, INC. AND SUBSIDIARIES
NOTES TO CONSOLIDATED FINANCIAL STATEMENTS
(10) | COMMON STOCK ACTIVITY |
The following table presents the common stock activity for the three years ended December 31, 2018:
Years Ended December 31, | ||||||||
2018 | 2017 | 2016 | ||||||
Common Stock (in shares) | ||||||||
Shares outstanding at beginning of year | 34,758,167 | 33,332,213 | 32,421,460 | |||||
Common stock offerings | 1,706,474 | 1,370,457 | 875,052 | |||||
Dividend reinvestment plan | 1,844 | 2,744 | 3,326 | |||||
Incentive restricted stock granted | 50,217 | 93,285 | 80,529 | |||||
Incentive restricted stock forfeited | — | (16,000 | ) | (910 | ) | |||
Director common stock awarded | 8,478 | 8,881 | 10,072 | |||||
Director restricted stock granted | — | 282 | — | |||||
Restricted stock withheld for tax obligations | (23,824 | ) | (33,695 | ) | (57,316 | ) | ||
Shares outstanding at end of year | 36,501,356 | 34,758,167 | 33,332,213 | |||||
Common Stock Issuances
The following table presents the common stock issuance activity for the three years ended December 31, 2018:
Years Ended December 31, | Number of Shares of Common Stock Issued | Net Proceeds | |||||
(In thousands) | |||||||
2018 | 1,706,474 | $ | 157,319 | ||||
2017 | 1,370,457 | 109,207 | |||||
2016 | 875,052 | 59,283 | |||||
Dividend Reinvestment Plan
The Company has a dividend reinvestment plan that allows stockholders to reinvest cash distributions in new shares of the Company.
(11) | STOCK-BASED COMPENSATION |
EastGroup applies the provisions of ASC 718, Compensation – Stock Compensation, to account for its stock-based compensation plans. ASC 718 requires that the compensation cost relating to share-based payment transactions be recognized in the financial statements and that the cost be measured on the fair value of the equity or liability instruments issued.
Equity Incentive Plan
In May 2004, the stockholders of the Company approved the EastGroup Properties, Inc. 2004 Equity Incentive Plan (the “2004 Plan”) that authorized the issuance of up to 1,900,000 shares of common stock to employees in the form of options, stock appreciation rights, restricted stock, deferred stock units, performance shares, bonus stock or stock in lieu of cash compensation. The 2004 Plan was further amended by the Board of Directors in September 2005 and December 2006.
In April 2013, the Board of Directors adopted the EastGroup Properties, Inc. 2013 Equity Incentive Plan (the “2013 Equity Plan”) upon the recommendation of the Compensation Committee; the 2013 Equity Plan was approved by the Company's stockholders and became effective May 29, 2013. The 2013 Equity Plan was further amended by the Board of Directors in March 2017. The 2013 Equity Plan replaced the 2004 Plan and the 2005 Directors Equity Incentive Plan. The 2013 Equity Plan permits the grant of awards to employees and directors with respect to 2,000,000 shares of common stock.
There were 1,629,281, 1,671,981 and 1,752,345 total shares available for grant under the 2013 Equity Plan as of December 31, 2018, 2017 and 2016, respectively. Typically, the Company issues new shares to fulfill stock grants.
Stock-based compensation cost for employees was $5,322,000, $6,309,000 and $5,184,000 for 2018, 2017 and 2016, respectively, of which $1,173,000, $1,458,000 and $1,183,000 were capitalized as part of the Company’s development costs for the respective years.
83
EASTGROUP PROPERTIES, INC. AND SUBSIDIARIES
NOTES TO CONSOLIDATED FINANCIAL STATEMENTS
Employee Equity Awards
The Company's restricted stock program is designed to provide incentives for management to achieve goals established by the Compensation Committee of the Company's Board of Directors (the Committee). The awards act as a retention device, as they vest over time, allowing participants to benefit from dividends on shares as well as potential stock appreciation. Equity awards align management's interests with the long-term interests of shareholders. The vesting periods of the Company’s restricted stock plans vary, as determined by the Compensation Committee. Restricted stock is granted to executive officers subject to both continued service and the satisfaction of certain annual performance goals and multi-year market conditions as determined by the Compensation Committee. Restricted stock is granted to non-executive officers subject only to continued service. The cost for market-based awards and awards that only require service is amortized on a straight-line basis over the requisite service periods. The total compensation expense for service and performance based awards is based upon the fair market value of the shares on the grant date.
In the second quarter of 2017, the Committee approved an equity compensation plan for certain of its executive officers based upon certain annual performance measures for 2017, including funds from operations (FFO) per share, same property net operating income change, general and administrative costs, and fixed charge coverage. During the first quarter of 2018, the Committee measured the Company's performance for 2017 against bright-line tests established by the Committee on the grant date of May 10, 2017, and determined that 21,097 shares were earned. These shares, which have a grant date fair value of $78.18, vested 20% on the date shares were determined and will vest 20% per year on each January 1 for the subsequent four years. On the grant date of May 10, 2017, the Company began recognizing expense for its estimate of the shares that may have been earned pursuant to these awards; the shares are being expensed using the graded vesting attribution method which recognizes each separate vesting portion of the award as a separate award on a straight-line basis over the requisite service period.
Also in the second quarter of 2017, the Committee approved an equity compensation plan for certain of its executive officers based upon the achievement of individual goals for each of the officers included in the plan. On March 1, 2018, the Committee evaluated the performance of the officers and, in its discretion, awarded 4,554 shares with a grant date fair value of $80.93. These shares vested 20% on the date shares were determined and awarded and will vest 20% per year on each January 1 for the subsequent four years. The Company began recognizing expense for the shares awarded on the grant date of March 1, 2018, and the shares will be expensed on a straight-line basis over the remaining service period.
Also in the second quarter of 2017, the Committee approved a long-term equity compensation plan for certain of the Company’s executive officers that includes three components based on total shareholder return and one component based only on continued service as of the vesting dates.
The three long-term equity compensation plan components based on total shareholder return are subject to bright-line tests that will compare the Company's total shareholder return to the Nareit Equity Index and to the member companies of the Nareit industrial index. The first plan measured the bright-line tests over the one-year period ended December 31, 2017. During the first quarter of 2018, the Committee measured the Company's performance for the one-year period against bright-line tests established by the Committee on the grant date of May 10, 2017. The number of shares determined on the measurement date was 4,257. These shares vested 100% on March 1, 2018, the date the earned shares were determined. On the grant date of May 10, 2017, the Company began recognizing expense for this plan based on the grant date fair value of the awards which was determined using a simulation pricing model developed to specifically accommodate the unique features of the award.
The second plan will measure the bright-line tests over the two-year period ended December 31, 2018. During the first quarter of 2019, the Committee will measure the Company's performance for the two-year period against bright-line tests established by the Committee on the grant date of May 10, 2017. The number of shares to be earned on the measurement date could range from zero to 9,460. These shares would vest 100% on the date the earned shares are determined. On the grant date of May 10, 2017, the Company began recognizing expense for this plan based on the grant date fair value of the awards which was determined using a simulation pricing model developed to specifically accommodate the unique features of the award.
The third plan will measure the bright-line tests over the three-year period ending December 31, 2019. During the first quarter of 2020, the Committee will measure the Company's performance for the three-year period against bright-line tests established by the Committee on the grant date of May 10, 2017. The number of shares to be earned on the measurement date could range from zero to 18,917. These shares would vest 75% on the date the earned shares are determined in the first quarter of 2020 and 25% on January 1, 2021. On the grant date of May 10, 2017, the Company began recognizing expense for this plan based on the grant date fair value of the awards which was determined using a simulation pricing model developed to specifically accommodate the unique features of the award.
The component of the long-term equity compensation plan based only on continued service as of the vesting dates was awarded on May 10, 2017. On that date, 5,406 shares were granted to certain executive officers subject only to continued service as of the
84
EASTGROUP PROPERTIES, INC. AND SUBSIDIARIES
NOTES TO CONSOLIDATED FINANCIAL STATEMENTS
vesting dates. These shares, which have a grant date fair value of $78.18 per share, vested 25% in the first quarter of 2018 and will vest 25% on January 1 in years 2019, 2020 and 2021. The shares are being expensed on a straight-line basis over the remaining service period.
In the second quarter of 2018, the Committee approved an equity compensation plan for the Company's executive officers based upon certain annual performance measures for 2018, including FFO per share, same property net operating income change, general and administrative costs, and fixed charge coverage. During the first quarter of 2019, the Committee will measure the Company's performance for 2018 against bright-line tests established by the Committee on the grant date of June 1, 2018. The number of shares that may be earned for the achievement of the annual performance measures could range from zero to 24,690. These shares, which have a grant date fair value of $95.19, would vest 20% on the date shares are determined and 20% per year on each January 1 for the subsequent four years. On the grant date of June 1, 2018, the Company began recognizing expense for its estimate of the shares that may be earned pursuant to these awards; the shares are being expensed using the graded vesting attribution method which recognizes each separate vesting portion of the award as a separate award on a straight-line basis over the requisite service period.
Also in the second quarter of 2018, the Committee approved an equity compensation plan for EastGroup's executive officers based upon the achievement of individual goals for each of the officers included in the plan. Any shares issued pursuant to the individual goals in this compensation plan will be determined by the Committee in its discretion and issued in the first quarter of 2019. The number of shares to be issued on the grant date for the achievement of individual goals could range from zero to 6,173. These shares would vest 20% on the date shares are determined and awarded and 20% per year on each January 1 for the subsequent four years. The Company will begin recognizing the expense for any shares awarded on the grant date in the first quarter of 2019, and the shares will be expensed on a straight-line basis over the remaining service period.
Also in the second quarter of 2018, the Committee approved a long-term equity compensation plan for the Company’s executive officers that includes one component based on total shareholder return and one component based only on continued service as of the vesting dates.
The component of the long-term equity compensation plan based on total shareholder return is subject to bright-line tests that will compare the Company's total shareholder return to the Nareit Equity Index and to the member companies of the Nareit industrial index. The plan will measure the bright-line tests over the three-year period ending December 31, 2020. During the first quarter of 2021, the Committee will measure the Company's performance for the three-year period against bright-line tests established by the Committee on the grant date of June 1, 2018. The number of shares to be earned on the measurement date could range from zero to 27,596. These shares would vest 75% on the date the earned shares are determined in the first quarter of 2021 and 25% on January 1, 2022. On the grant date of June 1, 2018, the Company began recognizing expense for this plan based on the grant date fair value of the awards which was determined using a simulation pricing model developed to specifically accommodate the unique features of the award.
The component of the long-term equity compensation plan based only on continued service as of the vesting dates was awarded on June 1, 2018. On that date, 7,884 shares were granted to the Company's executive officers subject only to continued service as of the vesting dates. These shares, which have a grant date fair value of $95.19, will vest 25% in the first quarter of 2019 and 25% on January 1 in years 2020, 2021 and 2022. The shares are being expensed on a straight-line basis over the remaining service period.
Also during the second quarter of 2018, 12,425 shares were granted to certain non-executive officers subject only to continued service as of the vesting dates. These shares, which have a grant date fair value of $95.17, will vest 20% on January 1 in years 2019, 2020, 2021, 2022 and 2023. The shares are being expensed on a straight-line basis over the remaining service period.
During the restricted period for awards no longer subject to contingencies, the Company accrues dividends and holds the certificates for the shares; however, the employee can vote the shares. For shares subject to contingencies, dividends are accrued based upon the number of shares expected to be awarded. Share certificates and dividends are delivered to the employee as they vest. As of December 31, 2018, there was $5,785,000 of unrecognized compensation cost related to unvested restricted stock compensation for employees and directors that is expected to be recognized over a weighted average period of 2.5 years.
Following is a summary of the total restricted shares granted, forfeited and delivered (vested) to employees with the related weighted average grant date fair value share prices for 2018, 2017 and 2016. Of the shares that vested in 2018, 2017 and 2016, 23,824 shares, 33,695 shares and 57,316 shares, respectively, were withheld by the Company to satisfy the tax obligations for those employees who elected this option as permitted under the applicable equity plan. As of the grant date, the fair value of shares that were granted during 2018, 2017 and 2016 was $4,223,000, $7,155,000 and $4,736,000, respectively. As of the vesting date, the fair value of shares that vested during 2018, 2017 and 2016 was $5,149,000, $6,441,000 and $10,013,000, respectively.
85
EASTGROUP PROPERTIES, INC. AND SUBSIDIARIES
NOTES TO CONSOLIDATED FINANCIAL STATEMENTS
Restricted Stock Activity: | Years Ended December 31, | |||||||||||||||||||
2018 | 2017 | 2016 | ||||||||||||||||||
Shares | Weighted Average Grant Date Fair Value | Shares | Weighted Average Grant Date Fair Value | Shares | Weighted Average Grant Date Fair Value | |||||||||||||||
Unvested at beginning of year | 152,644 | $ | 63.18 | 162,087 | $ | 51.97 | 260,698 | $ | 52.68 | |||||||||||
Granted (1) | 50,217 | 84.09 | 93,285 | 76.70 | 80,529 | 58.81 | ||||||||||||||
Forfeited | — | — | (16,000 | ) | 36.98 | (910 | ) | 52.89 | ||||||||||||
Vested | (59,547 | ) | 63.77 | (86,728 | ) | 61.62 | (178,230 | ) | 56.09 | |||||||||||
Unvested at end of year | 143,314 | 70.26 | 152,644 | 63.18 | 162,087 | 51.97 | ||||||||||||||
(1) Does not include the restricted shares that may be earned if the performance goals established in 2017 for long-term performance and in 2018 for annual and long-term performance are achieved. Depending on the actual level of achievement of the goals at the end of the open performance periods, the number of shares earned could range from zero to 86,836.
Following is a vesting schedule of the total unvested shares as of December 31, 2018:
Unvested Shares Vesting Schedule | Number of Shares | ||
2019 | 53,826 | ||
2020 | 50,650 | ||
2021 | 23,167 | ||
2022 | 13,186 | ||
2023 | 2,485 | ||
Total Unvested Shares | 143,314 | ||
Directors Equity Awards
The Company has a directors equity plan that was approved by stockholders and adopted in 2013 (the "2013 Equity Plan"). The Board of Directors has adopted a policy under the 2013 Equity Plan pursuant to which awards will be made to non-employee Directors. The current policy provides that the Company shall automatically award an annual retainer share award to each non-employee Director who has been elected or reelected as a member of the Board of Directors at the Annual Meeting. The number of shares shall be equal to $86,000 divided by the fair market value of a share on the date of such election. If a non-employee Director is elected or appointed to the Board of Directors other than at an Annual Meeting of the Company, the annual retainer share award shall be pro rated. The policy also provides that each new non-employee Director appointed or elected will receive an automatic award of restricted shares of Common Stock on the effective date of election or appointment equal to $25,000 divided by the fair market value of the Company's Common Stock on such date. These restricted shares will vest over a four-year period upon the performance of future service as a Director, subject to certain exceptions.
Directors were issued 8,478 shares, 8,881 shares and 10,072 shares of common stock as annual retainer awards for 2018, 2017 and 2016, respectively.
During the third quarter of 2017, 282 shares were granted to a newly elected non-employee Director subject only to continued service as of the vesting date. The shares, which have a grant date fair value of $88.86 per share, vested 25% on September 8, 2018, and will vest 25% per year on September 8 in years 2019, 2020 and 2021. The shares are being expensed on a straight-line basis over the remaining service period.
During 2013, 417 shares were granted to a newly elected non-employee Director subject only to continued service as of the vesting date. The shares, which have a grant date fair value of $59.97 per share, vested 25% on each of December 6, 2014, 2015, 2016 and 2017.
As of the vesting date, the fair value of shares that vested during 2018, 2017 and 2016 was $7,000, $9,000 and $8,000, respectively. Stock-based compensation expense for directors was $1,134,000, $670,000 and $589,000 for 2018, 2017 and 2016, respectively.
86
EASTGROUP PROPERTIES, INC. AND SUBSIDIARIES
NOTES TO CONSOLIDATED FINANCIAL STATEMENTS
(12) | COMPREHENSIVE INCOME |
Total Comprehensive Income is comprised of net income plus all other changes in equity from non-owner sources and is presented on the Consolidated Statements of Income and Comprehensive Income. The components of Accumulated other comprehensive income (loss) for 2018, 2017 and 2016 are presented in the Company’s Consolidated Statements of Changes in Equity and are summarized below. See Note 13 for information regarding the Company’s interest rate swaps.
Years Ended December 31, | |||||||||
2018 | 2017 | 2016 | |||||||
ACCUMULATED OTHER COMPREHENSIVE INCOME (LOSS): | (In thousands) | ||||||||
Balance at beginning of year | $ | 5,348 | 1,995 | (3,456 | ) | ||||
Change in fair value of interest rate swaps - cash flow hedges | 1,353 | 3,353 | 5,451 | ||||||
Balance at end of year | $ | 6,701 | 5,348 | 1,995 | |||||
(13) | DERIVATIVE INSTRUMENTS AND HEDGING ACTIVITIES |
The Company is exposed to certain risks arising from both its business operations and economic conditions. The Company principally manages its exposures to a wide variety of business and operational risks through management of its core business activities. The Company manages economic risk, including interest rate, liquidity and credit risk primarily by managing the amount, sources and duration of its debt funding and, to a limited extent, the use of derivative instruments.
Specifically, the Company has entered into derivative instruments to manage exposures that arise from business activities that result in the payment of future known and uncertain cash amounts, the value of which are determined by interest rates. The Company's derivative instruments, described below, are used to manage differences in the amount, timing and duration of the Company's known or expected cash payments principally related to certain of the Company's borrowings.
The Company's objective in using interest rate derivatives is to change variable interest rates to fixed interest rates by using interest rate swaps. Interest rate swaps designated as cash flow hedges involve the receipt of variable-rate amounts from a counterparty in exchange for the Company making fixed-rate payments over the life of the agreements without exchange of the underlying notional amount.
As of December 31, 2018, EastGroup had six interest rate swaps outstanding, all of which are used to hedge the variable cash flows associated with unsecured loans. All of the Company's interest rate swaps convert the related loans' LIBOR rate components to effectively fixed interest rates, and the Company has concluded that each of the hedging relationships is highly effective.
The effective portion of changes in the fair value of derivatives designated and qualifying as cash flow hedges is recorded in Other comprehensive income (loss) and is subsequently reclassified into earnings through interest expense as interest payments are made in the period that the hedged forecasted transaction affects earnings. The ineffective portion of the change in fair value of the derivatives, which is immaterial for the periods reported, is recognized directly in earnings (included in Other on the Consolidated Statements of Income and Comprehensive Income).
Amounts reported in Other comprehensive income (loss) related to derivatives will be reclassified to Interest expense as interest payments are made or received on the Company's variable-rate debt. The Company estimates the swap interest receipts will be $2,532,000 over the next twelve months. These receipts approximate the expected cash interest receipts due from counterparties for the swaps. Since the interest payments and receipts on the swaps in combination with the associated debt have been effectively fixed, this estimate is not in addition to the Company's total expected combined interest payments or expense for the next twelve months.
The Company's valuation methodology for over-the-counter ("OTC") derivatives is to discount cash flows based on Overnight Index Swap ("OIS") rates. Uncollateralized or partially-collateralized trades are discounted at OIS, but include appropriate economic adjustments for funding costs (i.e., a LIBOR-OIS basis adjustment to approximate uncollateralized cost of funds) and credit risk. The Company calculates its derivative values using mid-market prices.
In July 2017, the Financial Conduct Authority (the authority that regulates LIBOR) announced it intends to stop compelling banks to submit rates for the calculation of LIBOR after 2021. The Alternative Reference Rates Committee ("ARRC") has proposed that the Secured Overnight Financing Rate ("SOFR") is the rate that represents best practice as the alternative to USD-LIBOR for use in derivatives and other financial contracts that are currently indexed to USD-LIBOR. ARRC has proposed a paced market transition plan to SOFR from USD-LIBOR and organizations are currently working on industry wide and company specific transition plans
87
EASTGROUP PROPERTIES, INC. AND SUBSIDIARIES
NOTES TO CONSOLIDATED FINANCIAL STATEMENTS
as it relates to derivatives and cash markets exposed to USD-LIBOR. The Company has material contracts that are indexed to USD-LIBOR and is monitoring this activity and evaluating the related risks.
As of December 31, 2018 and 2017, the Company had the following outstanding interest rate derivatives that are designated as cash flow hedges of interest rate risk:
Interest Rate Derivative | Notional Amount as of December 31, 2018 | Notional Amount as of December 31, 2017 | ||
(In thousands) | ||||
Interest Rate Swap | — | $80,000 | ||
Interest Rate Swap | $75,000 | $75,000 | ||
Interest Rate Swap | $75,000 | $75,000 | ||
Interest Rate Swap | $65,000 | $65,000 | ||
Interest Rate Swap | $60,000 | $60,000 | ||
Interest Rate Swap | $40,000 | $40,000 | ||
Interest Rate Swap | $15,000 | $15,000 | ||
The table below presents the fair value of the Company's derivative financial instruments as well as their classification on the Consolidated Balance Sheets as of December 31, 2018 and 2017. See Note 18 for additional information on the fair value of the Company's interest rate swaps.
Derivatives As of December 31, 2018 | Derivatives As of December 31, 2017 | ||||||||||
Balance Sheet Location | Fair Value | Balance Sheet Location | Fair Value | ||||||||
(In thousands) | |||||||||||
Derivatives designated as cash flow hedges: | |||||||||||
Interest rate swap assets | Other assets | $ | 6,701 | Other assets | $ | 6,034 | |||||
Interest rate swap liabilities | Other liabilities | — | Other liabilities | 695 | |||||||
The table below presents the effect of the Company's derivative financial instruments on the Consolidated Statements of Income and Comprehensive Income for the years ended December 31, 2018, 2017 and 2016:
Years Ended December 31, | |||||||||
2018 | 2017 | 2016 | |||||||
(In thousands) | |||||||||
DERIVATIVES IN CASH FLOW HEDGING RELATIONSHIPS | |||||||||
Interest Rate Swaps: | |||||||||
Amount of income (loss) recognized in Other comprehensive income (loss) on derivatives | $ | 2,757 | 1,437 | 1,410 | |||||
Amount of (income) loss reclassified from Accumulated other comprehensive income (loss) into Interest expense | (1,404 | ) | 1,916 | 4,041 | |||||
See Note 12 for additional information on the Company's Accumulated other comprehensive income (loss) resulting from its interest rate swaps.
Derivative financial agreements expose the Company to credit risk in the event of non-performance by the counterparties under the terms of the interest rate hedge agreements. The Company believes it minimizes the credit risk by transacting with financial institutions the Company regards as credit-worthy.
The Company has an agreement with its derivative counterparties containing a provision stating that the Company could be declared in default on its derivative obligations if the Company defaults on any of its indebtedness, including default where repayment of the indebtedness has not been accelerated by the lender. As of December 31, 2018, the fair value of derivatives in a net liability position related to these agreements was $0.
88
EASTGROUP PROPERTIES, INC. AND SUBSIDIARIES
NOTES TO CONSOLIDATED FINANCIAL STATEMENTS
(14) | EARNINGS PER SHARE |
The Company applies ASC 260, Earnings Per Share, which requires companies to present basic and diluted EPS. Reconciliation of the numerators and denominators in the basic and diluted EPS computations is as follows:
2018 | 2017 | 2016 | |||||||
(In thousands) | |||||||||
BASIC EPS COMPUTATION FOR NET INCOME ATTRIBUTABLE TO EASTGROUP PROPERTIES, INC. COMMON STOCKHOLDERS | |||||||||
Numerator – net income attributable to common stockholders | $ | 88,506 | 83,183 | 95,509 | |||||
Denominator – weighted average shares outstanding | 35,439 | 33,996 | 32,563 | ||||||
DILUTED EPS COMPUTATION FOR NET INCOME ATTRIBUTABLE TO EASTGROUP PROPERTIES, INC. COMMON STOCKHOLDERS | |||||||||
Numerator – net income attributable to common stockholders | $ | 88,506 | 83,183 | 95,509 | |||||
Denominator: | |||||||||
Weighted average shares outstanding | 35,439 | 33,996 | 32,563 | ||||||
Unvested restricted stock | 67 | 51 | 65 | ||||||
Total Shares | 35,506 | 34,047 | 32,628 | ||||||
(15) | QUARTERLY RESULTS OF OPERATIONS – UNAUDITED |
2018 Quarter Ended | 2017 Quarter Ended | |||||||||||||||||||||||
Mar 31 | Jun 30 | Sep 30 | Dec 31 | Mar 31 | Jun 30 | Sep 30 | Dec 31 | |||||||||||||||||
(In thousands, except per share data) | ||||||||||||||||||||||||
Revenues | $ | 83,179 | 75,107 | 79,593 | 78,196 | 66,409 | 90,004 | 69,001 | 71,944 | |||||||||||||||
Expenses | (54,431 | ) | (56,843 | ) | (56,552 | ) | (59,613 | ) | (53,436 | ) | (53,027 | ) | (53,029 | ) | (54,277 | ) | ||||||||
Net income | 28,748 | 18,264 | 23,041 | 18,583 | 12,973 | 36,977 | 15,972 | 17,667 | ||||||||||||||||
Net income attributable to noncontrolling interest in joint ventures | (35 | ) | (37 | ) | (31 | ) | (27 | ) | (154 | ) | (87 | ) | (88 | ) | (77 | ) | ||||||||
Net income attributable to EastGroup Properties, Inc. common stockholders | $ | 28,713 | 18,227 | 23,010 | 18,556 | 12,819 | 36,890 | 15,884 | 17,590 | |||||||||||||||
BASIC PER SHARE DATA FOR NET INCOME ATTRIBUTABLE TO EASTGROUP PROPERTIES, INC. COMMON STOCKHOLDERS (1) | ||||||||||||||||||||||||
Net income attributable to common stockholders | $ | 0.83 | 0.52 | 0.64 | 0.51 | 0.38 | 1.09 | 0.46 | 0.51 | |||||||||||||||
Weighted average shares outstanding | 34,689 | 35,196 | 35,716 | 36,135 | 33,361 | 33,987 | 34,215 | 34,406 | ||||||||||||||||
DILUTED PER SHARE DATA FOR NET INCOME ATTRIBUTABLE TO EASTGROUP PROPERTIES, INC. COMMON STOCKHOLDERS (1) | ||||||||||||||||||||||||
Net income attributable to common stockholders | $ | 0.83 | 0.52 | 0.64 | 0.51 | 0.38 | 1.08 | 0.46 | 0.51 | |||||||||||||||
Weighted average shares outstanding | 34,736 | 35,259 | 35,798 | 36,232 | 33,409 | 34,040 | 34,290 | 34,505 | ||||||||||||||||
(1) | The above quarterly earnings per share calculations are based on the weighted average number of shares of common stock outstanding during each quarter for basic earnings per share and the weighted average number of outstanding shares of common stock and common stock share equivalents during each quarter for diluted earnings per share. The annual earnings per share calculations in the Consolidated Statements of Income and Comprehensive Income are based on the weighted average number of shares of common stock outstanding during each year for basic earnings per share and the weighted average number of outstanding shares of common stock and common stock share equivalents during each year for diluted earnings per share. The sum of quarterly financial data may vary from the annual data due to rounding. |
89
EASTGROUP PROPERTIES, INC. AND SUBSIDIARIES
NOTES TO CONSOLIDATED FINANCIAL STATEMENTS
(16) | DEFINED CONTRIBUTION PLAN |
EastGroup maintains a 401(k) plan for its employees. The Company makes matching contributions of 50% of the employee’s contribution (limited to 10% of compensation as defined by the plan) and may also make annual discretionary contributions. The Company’s total expense for this plan was $769,000, $672,000 and $675,000 for 2018, 2017 and 2016, respectively.
(17) | LEGAL MATTERS |
The Company is not presently involved in any material litigation nor, to its knowledge, is any material litigation threatened against the Company or its properties, other than routine litigation arising in the ordinary course of business. An action is pending against the Company and certain of the Company’s officers relating to the Company’s November 2016 purchase of a land parcel, alleging breach of contract and other claims in law and in equity. The Company has asserted numerous affirmative defenses and believes the lawsuit lacks merit. While discovery is ongoing, as are efforts to reach a mediated resolution of the dispute, in an effort to resolve this litigation, the Company made a settlement offer for $497,000 and has reserved such amount as of December 31, 2018.
(18) | FAIR VALUE OF FINANCIAL INSTRUMENTS |
ASC 820, Fair Value Measurement, defines fair value as the price that would be received to sell an asset or paid to transfer a liability in an orderly transaction between market participants at the measurement date. ASC 820 also provides guidance for using fair value to measure financial assets and liabilities. The Codification requires disclosure of the level within the fair value hierarchy in which the fair value measurements fall, including measurements using quoted prices in active markets for identical assets or liabilities (Level 1), quoted prices for similar instruments in active markets or quoted prices for identical or similar instruments in markets that are not active (Level 2), and significant valuation assumptions that are not readily observable in the market (Level 3).
The following table presents the carrying amounts and estimated fair values of the Company’s financial instruments in accordance with ASC 820 at December 31, 2018 and 2017.
December 31, | ||||||||||||
2018 | 2017 | |||||||||||
Carrying Amount (1) | Fair Value | Carrying Amount (1) | Fair Value | |||||||||
(In thousands) | ||||||||||||
Financial Assets: | ||||||||||||
Cash and cash equivalents | $ | 374 | 374 | 16 | 16 | |||||||
Mortgage loans receivable | 2,594 | 2,571 | 4,581 | 4,569 | ||||||||
Interest rate swap assets | 6,701 | 6,701 | 6,034 | 6,034 | ||||||||
Financial Liabilities: | ||||||||||||
Unsecured bank credit facilities - variable rate (2) | 195,730 | 196,423 | 116,339 | 116,277 | ||||||||
Unsecured bank credit facilities - fixed rate (2) | — | — | 80,000 | 80,003 | ||||||||
Unsecured debt (2) | 725,000 | 718,364 | 715,000 | 703,871 | ||||||||
Secured debt (2) | 189,038 | 191,742 | 200,354 | 206,408 | ||||||||
Interest rate swap liabilities | — | — | 695 | 695 | ||||||||
(1) | Carrying amounts shown in the table are included in the Consolidated Balance Sheets under the indicated captions, except as indicated in the notes below. |
(2) | Carrying amounts and fair values shown in the table exclude debt issuance costs (see Notes 6 and 7 for additional information). |
The following methods and assumptions were used to estimate the fair value of each class of financial instruments:
Cash and cash equivalents: The carrying amounts approximate fair value due to the short maturity of those instruments.
Mortgage loans receivable (included in Other assets on the Consolidated Balance Sheets): The fair value is estimated by discounting the future cash flows using the current rates at which similar loans would be made to borrowers with similar credit ratings and for the same remaining maturities (Level 2 input).
Interest rate swap assets (included in Other assets on the Consolidated Balances Sheets): The instruments are recorded at fair value based on models using inputs, such as interest rate yield curves, LIBOR swap curves and OIS curves, observable for
90
EASTGROUP PROPERTIES, INC. AND SUBSIDIARIES
NOTES TO CONSOLIDATED FINANCIAL STATEMENTS
substantially the full term of the contract (Level 2 input). See Note 13 for additional information on the Company's interest rate swaps.
Unsecured bank credit facilities: The fair value of the Company’s unsecured bank credit facilities is estimated by discounting expected cash flows at current market rates (Level 2 input), excluding the effects of debt issuance costs.
Unsecured debt: The fair value of the Company’s unsecured debt is estimated by discounting expected cash flows at the rates currently offered to the Company for debt of the same remaining maturities, as advised by the Company’s bankers (Level 2 input), excluding the effects of debt issuance costs.
Secured debt: The fair value of the Company’s secured debt is estimated by discounting expected cash flows at the rates currently offered to the Company for debt of the same remaining maturities, as advised by the Company’s bankers (Level 2 input), excluding the effects of debt issuance costs.
Interest rate swap liabilities (included in Other liabilities on the Consolidated Balance Sheets): The instruments are recorded at fair value based on models using inputs, such as interest rate yield curves, LIBOR swap curves and OIS curves, observable for substantially the full term of the contract (Level 2 input). See Note 13 for additional information on the Company's interest rate swaps.
(19) | SUBSEQUENT EVENTS |
On January 29, 2019, EastGroup closed the sale of World Houston 5, a 51,000 square foot, non-EastGroup developed, single-tenant building in Houston, for $3.8 million. The transaction generated a gain on sale which will be recognized in the first quarter of 2019.
Subsequent to December 31, 2018, the Company executed a commitment letter for $80 million of senior unsecured private placement notes with an insurance company. The notes, which are expected to close in March 2019, have a 10-year term and a fixed interest rate of 4.27% with semi-annual interest payments. The notes will not be and have not been registered under the Securities Act of 1933, as amended, and may not be offered or sold in the United States absent registration or an applicable exemption from the registration requirements.
91
SCHEDULE III | |||||||||||||||||||||||||||||
REAL ESTATE PROPERTIES AND ACCUMULATED DEPRECIATION | |||||||||||||||||||||||||||||
DECEMBER 31, 2018 (In thousands, except footnotes) | |||||||||||||||||||||||||||||
Description | Encumbrances | Initial Cost to the Company | Costs Capitalized Subsequent to Acquisition | Gross Amount Carried at Close of Period | Accumulated Depreciation | Year Acquired | Year Constructed | ||||||||||||||||||||||
Land | Buildings and Improvements | Land | Buildings and Improvements | Total | |||||||||||||||||||||||||
Real Estate Properties (c): | |||||||||||||||||||||||||||||
Industrial: | |||||||||||||||||||||||||||||
FLORIDA | |||||||||||||||||||||||||||||
Tampa | |||||||||||||||||||||||||||||
Jetport Commerce Park | $ | — | 1,575 | 6,591 | 6,154 | 1,575 | 12,745 | 14,320 | 8,861 | 1993-99 | 1974-85 | ||||||||||||||||||
Westport Commerce Center | — | 980 | 3,800 | 2,854 | 980 | 6,654 | 7,634 | 4,781 | 1994 | 1983/87 | |||||||||||||||||||
Benjamin Distribution Center I & II | — | 843 | 3,963 | 1,624 | 883 | 5,547 | 6,430 | 3,956 | 1997 | 1996 | |||||||||||||||||||
Benjamin Distribution Center III | — | 407 | 1,503 | 654 | 407 | 2,157 | 2,564 | 1,603 | 1999 | 1988 | |||||||||||||||||||
Palm River Center | — | 1,190 | 4,625 | 2,737 | 1,190 | 7,362 | 8,552 | 5,012 | 1997/98 | 1990/97/98 | |||||||||||||||||||
Palm River North I & III | — | 1,005 | 4,688 | 2,611 | 1,005 | 7,299 | 8,304 | 4,418 | 1998 | 2000 | |||||||||||||||||||
Palm River North II | — | 634 | 4,418 | 406 | 634 | 4,824 | 5,458 | 3,469 | 1997/98 | 1999 | |||||||||||||||||||
Palm River South I | — | 655 | 3,187 | 651 | 655 | 3,838 | 4,493 | 1,918 | 2000 | 2005 | |||||||||||||||||||
Palm River South II | — | 655 | — | 4,411 | 655 | 4,411 | 5,066 | 2,225 | 2000 | 2006 | |||||||||||||||||||
Walden Distribution Center I | — | 337 | 3,318 | 634 | 337 | 3,952 | 4,289 | 2,208 | 1997/98 | 2001 | |||||||||||||||||||
Walden Distribution Center II | — | 465 | 3,738 | 1,492 | 465 | 5,230 | 5,695 | 2,960 | 1998 | 1998 | |||||||||||||||||||
Oak Creek Distribution Center I | — | 1,109 | 6,126 | 1,378 | 1,109 | 7,504 | 8,613 | 4,252 | 1998 | 1998 | |||||||||||||||||||
Oak Creek Distribution Center II | — | 647 | 3,603 | 1,712 | 647 | 5,315 | 5,962 | 2,710 | 2003 | 2001 | |||||||||||||||||||
Oak Creek Distribution Center III | — | 439 | — | 3,200 | 556 | 3,083 | 3,639 | 1,252 | 2005 | 2007 | |||||||||||||||||||
Oak Creek Distribution Center IV | — | 682 | 6,472 | 825 | 682 | 7,297 | 7,979 | 3,008 | 2005 | 2001 | |||||||||||||||||||
Oak Creek Distribution Center V | — | 724 | — | 5,961 | 916 | 5,769 | 6,685 | 2,422 | 2005 | 2007 | |||||||||||||||||||
Oak Creek Distribution Center VI | — | 642 | — | 5,377 | 812 | 5,207 | 6,019 | 1,839 | 2005 | 2008 | |||||||||||||||||||
Oak Creek Distribution Center VII | — | 740 | — | 6,396 | 740 | 6,396 | 7,136 | 200 | 2005 | 2017 | |||||||||||||||||||
Oak Creek Distribution Center VIII | — | 843 | — | 6,236 | 1,051 | 6,028 | 7,079 | 632 | 2005 | 2015 | |||||||||||||||||||
Oak Creek Distribution Center IX | — | 618 | — | 5,104 | 781 | 4,941 | 5,722 | 1,471 | 2005 | 2009 | |||||||||||||||||||
Oak Creek Distribution Center A | — | 185 | — | 1,493 | 185 | 1,493 | 1,678 | 518 | 2005 | 2008 | |||||||||||||||||||
Oak Creek Distribution Center B | — | 227 | — | 1,549 | 227 | 1,549 | 1,776 | 540 | 2005 | 2008 | |||||||||||||||||||
Airport Commerce Center | — | 1,257 | 4,012 | 997 | 1,257 | 5,009 | 6,266 | 2,851 | 1998 | 1998 | |||||||||||||||||||
Westlake Distribution Center | — | 1,333 | 6,998 | 2,595 | 1,333 | 9,593 | 10,926 | 5,696 | 1998 | 1998/99 | |||||||||||||||||||
Expressway Commerce Center I | — | 915 | 5,346 | 1,573 | 915 | 6,919 | 7,834 | 3,517 | 2002 | 2004 | |||||||||||||||||||
Expressway Commerce Center II | — | 1,013 | 3,247 | 785 | 1,013 | 4,032 | 5,045 | 2,031 | 2003 | 2001 | |||||||||||||||||||
Silo Bend Distribution Center | — | 4,131 | 27,497 | 2,714 | 4,132 | 30,210 | 34,342 | 6,982 | 2011 | 1987/90 | |||||||||||||||||||
92
SCHEDULE III | |||||||||||||||||||||||||||||
REAL ESTATE PROPERTIES AND ACCUMULATED DEPRECIATION | |||||||||||||||||||||||||||||
DECEMBER 31, 2018 (In thousands, except footnotes) | |||||||||||||||||||||||||||||
Description | Encumbrances | Initial Cost to the Company | Costs Capitalized Subsequent to Acquisition | Gross Amount Carried at Close of Period | Accumulated Depreciation | Year Acquired | Year Constructed | ||||||||||||||||||||||
Land | Buildings and Improvements | Land | Buildings and Improvements | Total | |||||||||||||||||||||||||
Tampa East Distribution Center | — | 791 | 4,758 | 651 | 791 | 5,409 | 6,200 | 1,449 | 2011 | 1984 | |||||||||||||||||||
Tampa West Distribution Center | — | 2,139 | 8,502 | 1,263 | 2,140 | 9,764 | 11,904 | 2,555 | 2011 | 1975/93/94 | |||||||||||||||||||
Madison Distribution Center | — | 495 | 2,779 | 428 | 495 | 3,207 | 3,702 | 881 | 2012 | 2007 | |||||||||||||||||||
Madison Distribution Center II & III | — | 624 | — | 7,004 | 624 | 7,004 | 7,628 | 939 | 2012 | 2015 | |||||||||||||||||||
Madison Distribution Center IV & V | — | 565 | — | 8,212 | 565 | 8,212 | 8,777 | 638 | 2012 | 2016 | |||||||||||||||||||
Orlando | |||||||||||||||||||||||||||||
Chancellor Center | — | 291 | 1,711 | 511 | 291 | 2,222 | 2,513 | 1,346 | 1996/97 | 1996/97 | |||||||||||||||||||
Exchange Distribution Center I | — | 603 | 2,414 | 2,289 | 603 | 4,703 | 5,306 | 3,430 | 1994 | 1975 | |||||||||||||||||||
Exchange Distribution Center II | — | 300 | 945 | 482 | 300 | 1,427 | 1,727 | 862 | 2002 | 1976 | |||||||||||||||||||
Exchange Distribution Center III | — | 320 | 997 | 408 | 320 | 1,405 | 1,725 | 938 | 2002 | 1980 | |||||||||||||||||||
Sunbelt Distribution Center | — | 1,472 | 5,745 | 5,952 | 1,472 | 11,697 | 13,169 | 8,930 | 1989/97/98 | 1974/87/97/98 | |||||||||||||||||||
John Young Commerce Center I | — | 497 | 2,444 | 1,433 | 497 | 3,877 | 4,374 | 2,243 | 1997/98 | 1997/98 | |||||||||||||||||||
John Young Commerce Center II | — | 512 | 3,613 | 532 | 512 | 4,145 | 4,657 | 2,747 | 1998 | 1999 | |||||||||||||||||||
Altamonte Commerce Center I | — | 1,498 | 2,661 | 2,746 | 1,498 | 5,407 | 6,905 | 4,000 | 1999 | 1980/82 | |||||||||||||||||||
Altamonte Commerce Center II | — | 745 | 2,618 | 1,294 | 745 | 3,912 | 4,657 | 2,322 | 2003 | 1975 | |||||||||||||||||||
Sunport Center I | — | 555 | 1,977 | 1,019 | 555 | 2,996 | 3,551 | 1,622 | 1999 | 1999 | |||||||||||||||||||
Sunport Center II | — | 597 | 3,271 | 1,881 | 597 | 5,152 | 5,749 | 3,528 | 1999 | 2001 | |||||||||||||||||||
Sunport Center III | — | 642 | 3,121 | 1,057 | 642 | 4,178 | 4,820 | 2,320 | 1999 | 2002 | |||||||||||||||||||
Sunport Center IV | — | 642 | 2,917 | 1,814 | 642 | 4,731 | 5,373 | 2,548 | 1999 | 2004 | |||||||||||||||||||
Sunport Center V | — | 750 | 2,509 | 2,386 | 750 | 4,895 | 5,645 | 2,818 | 1999 | 2005 | |||||||||||||||||||
Sunport Center VI | — | 672 | — | 3,719 | 672 | 3,719 | 4,391 | 1,461 | 1999 | 2006 | |||||||||||||||||||
Southridge Commerce Park I | — | 373 | — | 4,942 | 373 | 4,942 | 5,315 | 2,934 | 2003 | 2006 | |||||||||||||||||||
Southridge Commerce Park II | — | 342 | — | 4,527 | 342 | 4,527 | 4,869 | 2,300 | 2003 | 2007 | |||||||||||||||||||
Southridge Commerce Park III | — | 547 | — | 5,683 | 547 | 5,683 | 6,230 | 2,290 | 2003 | 2007 | |||||||||||||||||||
Southridge Commerce Park IV (h) | 2,641 | 506 | — | 4,645 | 506 | 4,645 | 5,151 | 1,961 | 2003 | 2006 | |||||||||||||||||||
Southridge Commerce Park V (h) | 2,510 | 382 | — | 4,514 | 382 | 4,514 | 4,896 | 2,169 | 2003 | 2006 | |||||||||||||||||||
Southridge Commerce Park VI | — | 571 | — | 5,344 | 571 | 5,344 | 5,915 | 2,048 | 2003 | 2007 | |||||||||||||||||||
Southridge Commerce Park VII | — | 520 | — | 6,741 | 520 | 6,741 | 7,261 | 2,568 | 2003 | 2008 | |||||||||||||||||||
Southridge Commerce Park VIII | — | 531 | — | 6,353 | 531 | 6,353 | 6,884 | 2,058 | 2003 | 2008 | |||||||||||||||||||
Southridge Commerce Park IX | — | 468 | — | 6,460 | 468 | 6,460 | 6,928 | 1,692 | 2003 | 2012 | |||||||||||||||||||
Southridge Commerce Park X | — | 414 | — | 4,879 | 414 | 4,879 | 5,293 | 986 | 2003 | 2012 | |||||||||||||||||||
93
SCHEDULE III | |||||||||||||||||||||||||||||
REAL ESTATE PROPERTIES AND ACCUMULATED DEPRECIATION | |||||||||||||||||||||||||||||
DECEMBER 31, 2018 (In thousands, except footnotes) | |||||||||||||||||||||||||||||
Description | Encumbrances | Initial Cost to the Company | Costs Capitalized Subsequent to Acquisition | Gross Amount Carried at Close of Period | Accumulated Depreciation | Year Acquired | Year Constructed | ||||||||||||||||||||||
Land | Buildings and Improvements | Land | Buildings and Improvements | Total | |||||||||||||||||||||||||
Southridge Commerce Park XI | — | 513 | — | 5,939 | 513 | 5,939 | 6,452 | 1,361 | 2003 | 2012 | |||||||||||||||||||
Southridge Commerce Park XII | — | 2,025 | — | 16,896 | 2,025 | 16,896 | 18,921 | 5,140 | 2005 | 2008 | |||||||||||||||||||
Horizon Commerce Park I | — | 991 | — | 6,528 | 991 | 6,528 | 7,519 | 1,199 | 2008 | 2014 | |||||||||||||||||||
Horizon Commerce Park II | — | 1,111 | — | 7,205 | 1,111 | 7,205 | 8,316 | 1,086 | 2008 | 2014 | |||||||||||||||||||
Horizon Commerce Park III | — | 991 | — | 6,480 | 991 | 6,480 | 7,471 | 706 | 2008 | 2016 | |||||||||||||||||||
Horizon Commerce Park IV | — | 1,097 | — | 8,549 | 1,097 | 8,549 | 9,646 | 998 | 2008 | 2015 | |||||||||||||||||||
Horizon Commerce Park V | — | 1,108 | — | 8,598 | 1,108 | 8,598 | 9,706 | 533 | 2008 | 2017 | |||||||||||||||||||
Horizon Commerce Park VII | — | 962 | — | 7,471 | 962 | 7,471 | 8,433 | 631 | 2008 | 2017 | |||||||||||||||||||
Horizon Commerce Park X | — | 846 | — | 6,601 | 846 | 6,601 | 7,447 | 179 | 2009 | 2018 | |||||||||||||||||||
Horizon Commerce Park XII | — | 1,416 | — | 10,572 | 1,416 | 10,572 | 11,988 | 275 | 2009 | 2017 | |||||||||||||||||||
Jacksonville | |||||||||||||||||||||||||||||
Deerwood Distribution Center | — | 1,147 | 1,799 | 3,397 | 1,147 | 5,196 | 6,343 | 3,474 | 1989 | 1978 | |||||||||||||||||||
Phillips Distribution Center | — | 1,375 | 2,961 | 4,554 | 1,375 | 7,515 | 8,890 | 5,441 | 1994 | 1984/95 | |||||||||||||||||||
Lake Pointe Business Park | — | 3,442 | 6,450 | 9,200 | 3,442 | 15,650 | 19,092 | 11,689 | 1993 | 1986/87 | |||||||||||||||||||
Ellis Distribution Center | — | 540 | 7,513 | 1,909 | 540 | 9,422 | 9,962 | 5,081 | 1997 | 1977 | |||||||||||||||||||
Westside Distribution Center | — | 2,011 | 15,374 | 8,677 | 2,011 | 24,051 | 26,062 | 12,855 | 1997/2008 | 1984/85 | |||||||||||||||||||
Beach Commerce Center | — | 476 | 1,899 | 849 | 476 | 2,748 | 3,224 | 1,456 | 2000 | 2000 | |||||||||||||||||||
Interstate Distribution Center | — | 1,879 | 5,700 | 1,938 | 1,879 | 7,638 | 9,517 | 4,314 | 2005 | 1990 | |||||||||||||||||||
Flagler Center | — | 7,317 | 14,912 | 452 | 7,317 | 15,364 | 22,681 | 1,167 | 2016 | 1997 & 2005 | |||||||||||||||||||
Ft. Lauderdale/Palm Beach area | |||||||||||||||||||||||||||||
Linpro Commerce Center | — | 613 | 2,243 | 3,248 | 616 | 5,488 | 6,104 | 3,355 | 1996 | 1986 | |||||||||||||||||||
Cypress Creek Business Park | — | — | 2,465 | 2,524 | — | 4,989 | 4,989 | 3,144 | 1997 | 1986 | |||||||||||||||||||
Lockhart Distribution Center | — | — | 3,489 | 2,958 | — | 6,447 | 6,447 | 4,471 | 1997 | 1986 | |||||||||||||||||||
Interstate Commerce Center | — | 485 | 2,652 | 1,695 | 485 | 4,347 | 4,832 | 2,179 | 1998 | 1988 | |||||||||||||||||||
Executive Airport Distribution Ctr (f) | 6,456 | 1,991 | 4,857 | 5,303 | 1,991 | 10,160 | 12,151 | 5,096 | 2001 | 2004/06 | |||||||||||||||||||
Sample 95 Business Park | — | 2,202 | 8,785 | 3,617 | 2,202 | 12,402 | 14,604 | 8,240 | 1996/98 | 1990/99 | |||||||||||||||||||
Blue Heron Distribution Center | — | 975 | 3,626 | 1,980 | 975 | 5,606 | 6,581 | 3,722 | 1999 | 1986 | |||||||||||||||||||
Blue Heron Distribution Center II | 233 | 1,385 | 4,222 | 1,665 | 1,385 | 5,887 | 7,272 | 2,717 | 2004 | 1988 | |||||||||||||||||||
Blue Heron Distribution Center III | — | 450 | — | 2,805 | 450 | 2,805 | 3,255 | 977 | 2004 | 2009 | |||||||||||||||||||
Weston Commerce Park | — | 4,163 | 9,951 | 1,691 | 4,163 | 11,642 | 15,805 | 669 | 2016 | 1998 | |||||||||||||||||||
94
SCHEDULE III | |||||||||||||||||||||||||||||
REAL ESTATE PROPERTIES AND ACCUMULATED DEPRECIATION | |||||||||||||||||||||||||||||
DECEMBER 31, 2018 (In thousands, except footnotes) | |||||||||||||||||||||||||||||
Description | Encumbrances | Initial Cost to the Company | Costs Capitalized Subsequent to Acquisition | Gross Amount Carried at Close of Period | Accumulated Depreciation | Year Acquired | Year Constructed | ||||||||||||||||||||||
Land | Buildings and Improvements | Land | Buildings and Improvements | Total | |||||||||||||||||||||||||
Ft. Myers | |||||||||||||||||||||||||||||
SunCoast Commerce Center I | — | 911 | — | 4,815 | 928 | 4,798 | 5,726 | 1,857 | 2005 | 2008 | |||||||||||||||||||
SunCoast Commerce Center II | — | 911 | — | 4,999 | 928 | 4,982 | 5,910 | 2,107 | 2005 | 2007 | |||||||||||||||||||
SunCoast Commerce Center III | — | 1,720 | — | 6,673 | 1,763 | 6,630 | 8,393 | 2,407 | 2006 | 2008 | |||||||||||||||||||
SunCoast Commerce Center IV | — | 1,733 | — | 7,537 | 1,762 | 7,508 | 9,270 | 335 | 2006 | 2017 | |||||||||||||||||||
CALIFORNIA | |||||||||||||||||||||||||||||
San Francisco area | |||||||||||||||||||||||||||||
Wiegman Distribution Center I | — | 2,197 | 8,788 | 2,137 | 2,308 | 10,814 | 13,122 | 6,561 | 1996 | 1986/87 | |||||||||||||||||||
Wiegman Distribution Center II | — | 2,579 | 4,316 | 152 | 2,579 | 4,468 | 7,047 | 824 | 2012 | 1998 | |||||||||||||||||||
Huntwood Distribution Center | — | 3,842 | 15,368 | 3,236 | 3,842 | 18,604 | 22,446 | 11,421 | 1996 | 1988 | |||||||||||||||||||
San Clemente Distribution Center | — | 893 | 2,004 | 944 | 893 | 2,948 | 3,841 | 1,944 | 1997 | 1978 | |||||||||||||||||||
Yosemite Distribution Center | — | 259 | 7,058 | 1,520 | 259 | 8,578 | 8,837 | 4,913 | 1999 | 1974/87 | |||||||||||||||||||
Los Angeles area | |||||||||||||||||||||||||||||
Eucalyptus Distribution Center | — | 11,392 | 11,498 | 7 | 11,392 | 11,505 | 22,897 | 234 | 2018 | 1988 | |||||||||||||||||||
Kingsview Industrial Center (e) | 2,264 | 643 | 2,573 | 883 | 643 | 3,456 | 4,099 | 2,074 | 1996 | 1980 | |||||||||||||||||||
Dominguez Distribution Center (e) | 6,188 | 2,006 | 8,025 | 1,170 | 2,006 | 9,195 | 11,201 | 5,723 | 1996 | 1977 | |||||||||||||||||||
Main Street Distribution Center | — | 1,606 | 4,103 | 831 | 1,606 | 4,934 | 6,540 | 2,877 | 1999 | 1999 | |||||||||||||||||||
Walnut Business Center (e) | 5,940 | 2,885 | 5,274 | 2,593 | 2,885 | 7,867 | 10,752 | 4,478 | 1996 | 1966/90 | |||||||||||||||||||
Washington Distribution Center (e) | 4,025 | 1,636 | 4,900 | 751 | 1,636 | 5,651 | 7,287 | 3,286 | 1997 | 1996/97 | |||||||||||||||||||
Chino Distribution Center | — | 2,544 | 10,175 | 1,623 | 2,544 | 11,798 | 14,342 | 8,401 | 1998 | 1980 | |||||||||||||||||||
Ramona Distribution Center | 2,474 | 3,761 | 5,751 | 25 | 3,761 | 5,776 | 9,537 | 647 | 2014 | 1984 | |||||||||||||||||||
Industry Distribution Center I (e) | 15,111 | 10,230 | 12,373 | 4,750 | 10,230 | 17,123 | 27,353 | 9,392 | 1998 | 1959 | |||||||||||||||||||
Industry Distribution Center III (e) | 1,577 | — | 3,012 | (157 | ) | — | 2,855 | 2,855 | 2,855 | 2007 | 1992 | ||||||||||||||||||
Chestnut Business Center | — | 1,674 | 3,465 | 359 | 1,674 | 3,824 | 5,498 | 1,999 | 1998 | 1999 | |||||||||||||||||||
Los Angeles Corporate Center | — | 1,363 | 5,453 | 3,340 | 1,363 | 8,793 | 10,156 | 6,034 | 1996 | 1986 | |||||||||||||||||||
Santa Barbara | |||||||||||||||||||||||||||||
University Business Center | — | 5,517 | 22,067 | 12,835 | 5,520 | 34,899 | 40,419 | 18,641 | 1996 | 1987/88 | |||||||||||||||||||
Fresno | |||||||||||||||||||||||||||||
Shaw Commerce Center (e) | 11,620 | 2,465 | 11,627 | 6,943 | 2,465 | 18,570 | 21,035 | 11,354 | 1998 | 1978/81/87 | |||||||||||||||||||
95
SCHEDULE III | |||||||||||||||||||||||||||||
REAL ESTATE PROPERTIES AND ACCUMULATED DEPRECIATION | |||||||||||||||||||||||||||||
DECEMBER 31, 2018 (In thousands, except footnotes) | |||||||||||||||||||||||||||||
Description | Encumbrances | Initial Cost to the Company | Costs Capitalized Subsequent to Acquisition | Gross Amount Carried at Close of Period | Accumulated Depreciation | Year Acquired | Year Constructed | ||||||||||||||||||||||
Land | Buildings and Improvements | Land | Buildings and Improvements | Total | |||||||||||||||||||||||||
San Diego | |||||||||||||||||||||||||||||
Eastlake Distribution Center | — | 3,046 | 6,888 | 1,811 | 3,046 | 8,699 | 11,745 | 5,487 | 1997 | 1989 | |||||||||||||||||||
Ocean View Corporate Center (f) | 7,784 | 6,577 | 7,105 | 970 | 6,577 | 8,075 | 14,652 | 2,892 | 2010 | 2005 | |||||||||||||||||||
TEXAS | |||||||||||||||||||||||||||||
Dallas | |||||||||||||||||||||||||||||
Allen Station I & II | — | 5,815 | 17,612 | 202 | 5,815 | 17,814 | 23,629 | 272 | 2018 | 2001 | |||||||||||||||||||
Interstate Warehouse I & II (g) | 5,173 | 1,746 | 4,941 | 3,791 | 1,746 | 8,732 | 10,478 | 6,596 | 1988 | 1978 | |||||||||||||||||||
Interstate Warehouse III (g) | 2,027 | 519 | 2,008 | 1,578 | 519 | 3,586 | 4,105 | 2,283 | 2000 | 1979 | |||||||||||||||||||
Interstate Warehouse IV | — | 416 | 2,481 | 596 | 416 | 3,077 | 3,493 | 1,625 | 2004 | 2002 | |||||||||||||||||||
Interstate Warehouse V, VI, & VII (h) | 4,307 | 1,824 | 4,106 | 2,471 | 1,824 | 6,577 | 8,401 | 3,322 | 2009 | 1979/80/81 | |||||||||||||||||||
Venture Warehouses (g) | 3,935 | 1,452 | 3,762 | 2,755 | 1,452 | 6,517 | 7,969 | 5,316 | 1988 | 1979 | |||||||||||||||||||
ParkView Commerce Center 1-3 | — | 2,663 | — | 18,718 | 2,663 | 18,718 | 21,381 | 1,982 | 2014 | 2015 | |||||||||||||||||||
Shady Trail Distribution Center | — | 635 | 3,621 | 1,265 | 635 | 4,886 | 5,521 | 2,573 | 2003 | 1998 | |||||||||||||||||||
Valwood Distribution Center | — | 4,361 | 34,405 | 3,267 | 4,361 | 37,672 | 42,033 | 9,180 | 2012 | 1986/87/97/98 | |||||||||||||||||||
Northfield Distribution Center | — | 12,470 | 50,713 | 3,868 | 12,471 | 54,580 | 67,051 | 13,009 | 2013 | 1999-2001/03/04/08 | |||||||||||||||||||
Parc North 1-4 | — | 4,615 | 26,358 | 5,937 | 4,615 | 32,295 | 36,910 | 2,289 | 2016 | 2016 | |||||||||||||||||||
CreekView 121 1 & 2 | — | 3,275 | — | 14,614 | 3,275 | 14,614 | 17,889 | 1,041 | 2015/16 | 2017 | |||||||||||||||||||
Houston | |||||||||||||||||||||||||||||
World Houston Int'l Business Ctr 1 & 2 | — | 660 | 5,893 | 2,133 | 660 | 8,026 | 8,686 | 4,983 | 1998 | 1996 | |||||||||||||||||||
World Houston Int'l Business Ctr 3, 4 & 5 (g) | 4,445 | 1,025 | 6,413 | 1,564 | 1,025 | 7,977 | 9,002 | 4,946 | 1998 | 1998 | |||||||||||||||||||
World Houston Int'l Business Ctr 6 (g) | 1,729 | 425 | 2,423 | 655 | 425 | 3,078 | 3,503 | 1,934 | 1998 | 1998 | |||||||||||||||||||
World Houston Int'l Business Ctr 7 & 8 (g) | 5,043 | 680 | 4,584 | 4,947 | 680 | 9,531 | 10,211 | 5,978 | 1998 | 1998 | |||||||||||||||||||
World Houston Int'l Business Ctr 9 (g) | 3,582 | 800 | 4,355 | 2,099 | 800 | 6,454 | 7,254 | 3,220 | 1998 | 1998 | |||||||||||||||||||
World Houston Int'l Business Ctr 10 | — | 933 | 4,779 | 824 | 933 | 5,603 | 6,536 | 2,665 | 2001 | 1999 | |||||||||||||||||||
World Houston Int'l Business Ctr 11 | — | 638 | 3,764 | 1,760 | 638 | 5,524 | 6,162 | 2,911 | 1999 | 1999 | |||||||||||||||||||
World Houston Int'l Business Ctr 12 | — | 340 | 2,419 | 383 | 340 | 2,802 | 3,142 | 1,673 | 2000 | 2002 | |||||||||||||||||||
World Houston Int'l Business Ctr 13 | — | 282 | 2,569 | 427 | 282 | 2,996 | 3,278 | 2,002 | 2000 | 2002 | |||||||||||||||||||
World Houston Int'l Business Ctr 14 | — | 722 | 2,629 | 1,124 | 722 | 3,753 | 4,475 | 2,015 | 2000 | 2003 | |||||||||||||||||||
World Houston Int'l Business Ctr 15 | — | 731 | — | 6,268 | 731 | 6,268 | 6,999 | 3,404 | 2000 | 2007 | |||||||||||||||||||
96
SCHEDULE III | |||||||||||||||||||||||||||||
REAL ESTATE PROPERTIES AND ACCUMULATED DEPRECIATION | |||||||||||||||||||||||||||||
DECEMBER 31, 2018 (In thousands, except footnotes) | |||||||||||||||||||||||||||||
Description | Encumbrances | Initial Cost to the Company | Costs Capitalized Subsequent to Acquisition | Gross Amount Carried at Close of Period | Accumulated Depreciation | Year Acquired | Year Constructed | ||||||||||||||||||||||
Land | Buildings and Improvements | Land | Buildings and Improvements | Total | |||||||||||||||||||||||||
World Houston Int'l Business Ctr 16 | — | 519 | 4,248 | 1,505 | 519 | 5,753 | 6,272 | 3,294 | 2000 | 2005 | |||||||||||||||||||
World Houston Int'l Business Ctr 17 | — | 373 | 1,945 | 799 | 373 | 2,744 | 3,117 | 1,484 | 2000 | 2004 | |||||||||||||||||||
World Houston Int'l Business Ctr 19 | — | 373 | 2,256 | 1,126 | 373 | 3,382 | 3,755 | 2,023 | 2000 | 2004 | |||||||||||||||||||
World Houston Int'l Business Ctr 20 | — | 1,008 | 1,948 | 2,053 | 1,008 | 4,001 | 5,009 | 2,146 | 2000 | 2004 | |||||||||||||||||||
World Houston Int'l Business Ctr 21 | — | 436 | — | 3,982 | 436 | 3,982 | 4,418 | 1,622 | 2000/03 | 2006 | |||||||||||||||||||
World Houston Int'l Business Ctr 22 | — | 436 | — | 4,542 | 436 | 4,542 | 4,978 | 2,224 | 2000 | 2007 | |||||||||||||||||||
World Houston Int'l Business Ctr 23 | — | 910 | — | 7,354 | 910 | 7,354 | 8,264 | 3,150 | 2000 | 2007 | |||||||||||||||||||
World Houston Int'l Business Ctr 24 | — | 837 | — | 5,983 | 838 | 5,982 | 6,820 | 2,526 | 2005 | 2008 | |||||||||||||||||||
World Houston Int'l Business Ctr 25 | — | 508 | — | 4,032 | 508 | 4,032 | 4,540 | 1,608 | 2005 | 2008 | |||||||||||||||||||
World Houston Int'l Business Ctr 26 (f) | 1,934 | 445 | — | 3,194 | 445 | 3,194 | 3,639 | 1,191 | 2005 | 2008 | |||||||||||||||||||
World Houston Int'l Business Ctr 27 | — | 837 | — | 5,011 | 838 | 5,010 | 5,848 | 1,985 | 2005 | 2008 | |||||||||||||||||||
World Houston Int'l Business Ctr 28 (f) | 2,771 | 550 | — | 4,665 | 550 | 4,665 | 5,215 | 1,809 | 2005 | 2009 | |||||||||||||||||||
World Houston Int'l Business Ctr 29 (f) | 2,635 | 782 | — | 4,177 | 974 | 3,985 | 4,959 | 1,350 | 2007 | 2009 | |||||||||||||||||||
World Houston Int'l Business Ctr 30 (f) | 3,636 | 981 | — | 5,863 | 1,222 | 5,622 | 6,844 | 2,234 | 2007 | 2009 | |||||||||||||||||||
World Houston Int'l Business Ctr 31A | — | 684 | — | 4,092 | 684 | 4,092 | 4,776 | 1,714 | 2008 | 2011 | |||||||||||||||||||
World Houston Int'l Business Ctr 31B | — | 546 | — | 3,551 | 546 | 3,551 | 4,097 | 1,280 | 2008 | 2012 | |||||||||||||||||||
World Houston Int'l Business Ctr 32 (h) | 3,528 | 1,225 | — | 5,655 | 1,526 | 5,354 | 6,880 | 1,404 | 2007 | 2012 | |||||||||||||||||||
World Houston Int'l Business Ctr 33 | — | 1,166 | — | 7,867 | 1,166 | 7,867 | 9,033 | 1,687 | 2011 | 2013 | |||||||||||||||||||
World Houston Int'l Business Ctr 34 | — | 439 | — | 3,373 | 439 | 3,373 | 3,812 | 820 | 2005 | 2012 | |||||||||||||||||||
World Houston Int'l Business Ctr 35 | — | 340 | — | 2,476 | 340 | 2,476 | 2,816 | 509 | 2005 | 2012 | |||||||||||||||||||
World Houston Int'l Business Ctr 36 | — | 684 | — | 4,882 | 684 | 4,882 | 5,566 | 1,126 | 2011 | 2013 | |||||||||||||||||||
World Houston Int'l Business Ctr 37 | — | 759 | — | 6,400 | 759 | 6,400 | 7,159 | 1,470 | 2011 | 2013 | |||||||||||||||||||
World Houston Int'l Business Ctr 38 | — | 1,053 | — | 7,324 | 1,053 | 7,324 | 8,377 | 1,668 | 2011 | 2013 | |||||||||||||||||||
World Houston Int'l Business Ctr 39 | — | 620 | — | 5,203 | 621 | 5,202 | 5,823 | 840 | 2011 | 2014 | |||||||||||||||||||
World Houston Int'l Business Ctr 40 | — | 1,072 | — | 9,347 | 1,072 | 9,347 | 10,419 | 1,343 | 2011 | 2014 | |||||||||||||||||||
World Houston Int'l Business Ctr 41 | — | 649 | — | 5,950 | 649 | 5,950 | 6,599 | 831 | 2011 | 2014 | |||||||||||||||||||
World Houston Int'l Business Ctr 42 | — | 571 | — | 4,814 | 571 | 4,814 | 5,385 | 575 | 2011 | 2015 | |||||||||||||||||||
Central Green Distribution Center | — | 566 | 4,031 | 1,041 | 566 | 5,072 | 5,638 | 2,534 | 1999 | 1998 | |||||||||||||||||||
Glenmont Business Park | — | 936 | 6,161 | 2,983 | 937 | 9,143 | 10,080 | 5,699 | 1998 | 1999/2000 | |||||||||||||||||||
Beltway Crossing Business Park I | — | 458 | 5,712 | 2,758 | 458 | 8,470 | 8,928 | 5,058 | 2002 | 2001 | |||||||||||||||||||
Beltway Crossing Business Park II | — | 415 | — | 2,997 | 415 | 2,997 | 3,412 | 1,365 | 2005 | 2007 | |||||||||||||||||||
97
SCHEDULE III | |||||||||||||||||||||||||||||
REAL ESTATE PROPERTIES AND ACCUMULATED DEPRECIATION | |||||||||||||||||||||||||||||
DECEMBER 31, 2018 (In thousands, except footnotes) | |||||||||||||||||||||||||||||
Description | Encumbrances | Initial Cost to the Company | Costs Capitalized Subsequent to Acquisition | Gross Amount Carried at Close of Period | Accumulated Depreciation | Year Acquired | Year Constructed | ||||||||||||||||||||||
Land | Buildings and Improvements | Land | Buildings and Improvements | Total | |||||||||||||||||||||||||
Beltway Crossing Business Park III | — | 460 | — | 3,361 | 460 | 3,361 | 3,821 | 1,456 | 2005 | 2008 | |||||||||||||||||||
Beltway Crossing Business Park IV | — | 460 | — | 3,089 | 460 | 3,089 | 3,549 | 1,394 | 2005 | 2008 | |||||||||||||||||||
Beltway Crossing Business Park V (f) | 3,159 | 701 | — | 5,244 | 701 | 5,244 | 5,945 | 2,203 | 2005 | 2008 | |||||||||||||||||||
Beltway Crossing Business Park VI (h) | 3,531 | 618 | — | 6,268 | 618 | 6,268 | 6,886 | 2,114 | 2005 | 2008 | |||||||||||||||||||
Beltway Crossing Business Park VII (h) | 3,452 | 765 | — | 5,968 | 765 | 5,968 | 6,733 | 2,528 | 2005 | 2009 | |||||||||||||||||||
Beltway Crossing Business Park VIII | — | 721 | — | 5,516 | 721 | 5,516 | 6,237 | 1,653 | 2005 | 2011 | |||||||||||||||||||
Beltway Crossing Business Park IX | — | 418 | — | 2,137 | 418 | 2,137 | 2,555 | 549 | 2007 | 2012 | |||||||||||||||||||
Beltway Crossing Business Park X | — | 733 | — | 3,902 | 733 | 3,902 | 4,635 | 922 | 2007 | 2012 | |||||||||||||||||||
Beltway Crossing Business Park XI | — | 690 | — | 4,133 | 690 | 4,133 | 4,823 | 841 | 2007 | 2013 | |||||||||||||||||||
West Road Business Park I | — | 621 | — | 4,031 | 541 | 4,111 | 4,652 | 806 | 2012 | 2014 | |||||||||||||||||||
West Road Business Park II | — | 981 | — | 4,819 | 854 | 4,946 | 5,800 | 793 | 2012 | 2014 | |||||||||||||||||||
West Road Business Park III | — | 597 | — | 4,222 | 520 | 4,299 | 4,819 | 379 | 2012 | 2015 | |||||||||||||||||||
West Road Business Park IV | — | 621 | — | 4,622 | 541 | 4,702 | 5,243 | 664 | 2012 | 2015 | |||||||||||||||||||
West Road Business Park V | — | 484 | — | 4,367 | 421 | 4,430 | 4,851 | 67 | 2012 | 2018 | |||||||||||||||||||
Ten West Crossing 1 | — | 566 | — | 2,997 | 566 | 2,997 | 3,563 | 665 | 2012 | 2013 | |||||||||||||||||||
Ten West Crossing 2 | — | 829 | — | 4,385 | 833 | 4,381 | 5,214 | 1,241 | 2012 | 2013 | |||||||||||||||||||
Ten West Crossing 3 | — | 609 | — | 4,362 | 613 | 4,358 | 4,971 | 1,147 | 2012 | 2013 | |||||||||||||||||||
Ten West Crossing 4 | — | 694 | — | 4,512 | 699 | 4,507 | 5,206 | 1,132 | 2012 | 2014 | |||||||||||||||||||
Ten West Crossing 5 | — | 933 | — | 5,872 | 940 | 5,865 | 6,805 | 1,074 | 2012 | 2014 | |||||||||||||||||||
Ten West Crossing 6 | — | 640 | — | 4,648 | 644 | 4,644 | 5,288 | 777 | 2012 | 2014 | |||||||||||||||||||
Ten West Crossing 7 | — | 584 | — | 5,321 | 589 | 5,316 | 5,905 | 606 | 2012 | 2015 | |||||||||||||||||||
El Paso | |||||||||||||||||||||||||||||
Butterfield Trail | — | — | 20,725 | 9,018 | — | 29,743 | 29,743 | 19,472 | 1997/2000 | 1987/95 | |||||||||||||||||||
Rojas Commerce Park (g) | 4,114 | 900 | 3,659 | 3,774 | 900 | 7,433 | 8,333 | 5,255 | 1999 | 1986 | |||||||||||||||||||
Americas Ten Business Center I | — | 526 | 2,778 | 1,741 | 526 | 4,519 | 5,045 | 2,284 | 2001 | 2003 | |||||||||||||||||||
San Antonio | |||||||||||||||||||||||||||||
Alamo Downs Distribution Center | — | 1,342 | 6,338 | 1,663 | 1,342 | 8,001 | 9,343 | 4,527 | 2004 | 1986/2002 | |||||||||||||||||||
Arion Business Park 1-13, 15 | — | 4,143 | 31,432 | 7,590 | 4,143 | 39,022 | 43,165 | 18,996 | 2005 | 1988-2000/06 | |||||||||||||||||||
Arion Business Park 14 | — | 423 | — | 3,479 | 423 | 3,479 | 3,902 | 1,518 | 2005 | 2006 | |||||||||||||||||||
Arion Business Park 16 | — | 427 | — | 3,712 | 427 | 3,712 | 4,139 | 1,459 | 2005 | 2007 | |||||||||||||||||||
Arion Business Park 17 | — | 616 | — | 4,270 | 616 | 4,270 | 4,886 | 2,409 | 2005 | 2007 | |||||||||||||||||||
98
SCHEDULE III | |||||||||||||||||||||||||||||
REAL ESTATE PROPERTIES AND ACCUMULATED DEPRECIATION | |||||||||||||||||||||||||||||
DECEMBER 31, 2018 (In thousands, except footnotes) | |||||||||||||||||||||||||||||
Description | Encumbrances | Initial Cost to the Company | Costs Capitalized Subsequent to Acquisition | Gross Amount Carried at Close of Period | Accumulated Depreciation | Year Acquired | Year Constructed | ||||||||||||||||||||||
Land | Buildings and Improvements | Land | Buildings and Improvements | Total | |||||||||||||||||||||||||
Arion Business Park 18 (h) | 1,444 | 418 | — | 2,399 | 418 | 2,399 | 2,817 | 1,118 | 2005 | 2008 | |||||||||||||||||||
Wetmore Business Center 1-4 | — | 1,494 | 10,804 | 3,616 | 1,494 | 14,420 | 15,914 | 7,644 | 2005 | 1998/99 | |||||||||||||||||||
Wetmore Business Center 5 (f) | 2,270 | 412 | — | 3,861 | 412 | 3,861 | 4,273 | 1,725 | 2006 | 2008 | |||||||||||||||||||
Wetmore Business Center 6 (f) | 2,299 | 505 | — | 3,822 | 505 | 3,822 | 4,327 | 1,535 | 2006 | 2008 | |||||||||||||||||||
Wetmore Business Center 7 (f) | 2,369 | 546 | — | 3,912 | 546 | 3,912 | 4,458 | 1,423 | 2006 | 2008 | |||||||||||||||||||
Wetmore Business Center 8 (f) | 4,986 | 1,056 | — | 8,327 | 1,056 | 8,327 | 9,383 | 2,901 | 2006 | 2008 | |||||||||||||||||||
Fairgrounds Business Park | — | 1,644 | 8,209 | 2,457 | 1,644 | 10,666 | 12,310 | 5,395 | 2007 | 1985/86 | |||||||||||||||||||
Rittiman Distribution Center | — | 1,083 | 6,649 | 337 | 1,083 | 6,986 | 8,069 | 1,568 | 2011 | 2000 | |||||||||||||||||||
Thousand Oaks Distribution Center 1 | — | 607 | — | 4,320 | 607 | 4,320 | 4,927 | 1,468 | 2008 | 2012 | |||||||||||||||||||
Thousand Oaks Distribution Center 2 | — | 794 | — | 4,739 | 794 | 4,739 | 5,533 | 1,310 | 2008 | 2012 | |||||||||||||||||||
Thousand Oaks Distribution Center 3 | — | 772 | — | 4,460 | 772 | 4,460 | 5,232 | 1,180 | 2008 | 2013 | |||||||||||||||||||
Thousand Oaks Distribution Center 4 | — | 753 | — | 4,691 | 753 | 4,691 | 5,444 | 544 | 2013 | 2015 | |||||||||||||||||||
Alamo Ridge Business Park I | — | 623 | — | 8,113 | 623 | 8,113 | 8,736 | 1,366 | 2007 | 2015 | |||||||||||||||||||
Alamo Ridge Business Park II | — | 402 | — | 5,359 | 402 | 5,359 | 5,761 | 623 | 2007 | 2015 | |||||||||||||||||||
Alamo Ridge Business Park III | — | 907 | — | 10,129 | 907 | 10,129 | 11,036 | 691 | 2007 | 2017 | |||||||||||||||||||
Alamo Ridge Business Park IV | — | 354 | — | 7,462 | 355 | 7,461 | 7,816 | 344 | 2007 | 2017 | |||||||||||||||||||
Eisenhauer Point Business Park 1 & 2 | — | 1,881 | — | 14,717 | 1,881 | 14,717 | 16,598 | 1,382 | 2015 | 2016 | |||||||||||||||||||
Eisenhauer Point Business Park 3 | — | 577 | — | 6,094 | 577 | 6,094 | 6,671 | 303 | 2015 | 2017 | |||||||||||||||||||
Eisenhauer Point Business Park 4 | — | 555 | — | 4,816 | 555 | 4,816 | 5,371 | 287 | 2015 | 2017 | |||||||||||||||||||
Eisenhauer Point Business Park 5 | — | 818 | — | 7,017 | 818 | 7,017 | 7,835 | 209 | 2015 | 2018 | |||||||||||||||||||
Eisenhauer Point Business Park 6 | — | 569 | — | 4,859 | 569 | 4,859 | 5,428 | 53 | 2015 | 2018 | |||||||||||||||||||
Austin | |||||||||||||||||||||||||||||
Colorado Crossing Distribution Center (g) | 12,112 | 4,602 | 19,757 | 173 | 4,594 | 19,938 | 24,532 | 4,782 | 2014 | 2009 | |||||||||||||||||||
Greenhill Distribution Center | — | 802 | 3,273 | — | 802 | 3,273 | 4,075 | 10 | 2018 | 1999 | |||||||||||||||||||
Southpark Corporate Center 3 & 4 | — | 2,670 | 14,756 | 1,467 | 2,670 | 16,223 | 18,893 | 2,856 | 2015 | 1995 | |||||||||||||||||||
Southpark Corporate Center 5-7 | — | 1,301 | 7,589 | 812 | 1,301 | 8,401 | 9,702 | 679 | 2017 | 1995 | |||||||||||||||||||
Springdale Business Center | — | 2,824 | 8,398 | 339 | 2,824 | 8,737 | 11,561 | 1,414 | 2015 | 2000 | |||||||||||||||||||
ARIZONA | |||||||||||||||||||||||||||||
Phoenix area | |||||||||||||||||||||||||||||
Broadway Industrial Park I | — | 837 | 3,349 | 1,075 | 837 | 4,424 | 5,261 | 2,933 | 1996 | 1971 | |||||||||||||||||||
Broadway Industrial Park II | — | 455 | 482 | 306 | 455 | 788 | 1,243 | 470 | 1999 | 1971 | |||||||||||||||||||
99
SCHEDULE III | |||||||||||||||||||||||||||||
REAL ESTATE PROPERTIES AND ACCUMULATED DEPRECIATION | |||||||||||||||||||||||||||||
DECEMBER 31, 2018 (In thousands, except footnotes) | |||||||||||||||||||||||||||||
Description | Encumbrances | Initial Cost to the Company | Costs Capitalized Subsequent to Acquisition | Gross Amount Carried at Close of Period | Accumulated Depreciation | Year Acquired | Year Constructed | ||||||||||||||||||||||
Land | Buildings and Improvements | Land | Buildings and Improvements | Total | |||||||||||||||||||||||||
Broadway Industrial Park III | — | 775 | 1,742 | 543 | 775 | 2,285 | 3,060 | 1,456 | 2000 | 1983 | |||||||||||||||||||
Broadway Industrial Park IV | — | 380 | 1,652 | 789 | 380 | 2,441 | 2,821 | 1,641 | 2000 | 1986 | |||||||||||||||||||
Broadway Industrial Park V | — | 353 | 1,090 | 728 | 353 | 1,818 | 2,171 | 738 | 2002 | 1980 | |||||||||||||||||||
Broadway Industrial Park VI | — | 599 | 1,855 | 758 | 599 | 2,613 | 3,212 | 1,680 | 2002 | 1979 | |||||||||||||||||||
Broadway Industrial Park VII | — | 450 | 650 | 243 | 450 | 893 | 1,343 | 261 | 2011 | 1999 | |||||||||||||||||||
Kyrene Distribution Center | — | 1,490 | 4,453 | 1,868 | 1,490 | 6,321 | 7,811 | 4,050 | 1999 | 1981/2001 | |||||||||||||||||||
Southpark Distribution Center | — | 918 | 2,738 | 1,934 | 918 | 4,672 | 5,590 | 2,111 | 2001 | 2000 | |||||||||||||||||||
Santan 10 Distribution Center I | — | 846 | 2,647 | 658 | 846 | 3,305 | 4,151 | 1,571 | 2001 | 2005 | |||||||||||||||||||
Santan 10 Distribution Center II | — | 1,088 | — | 5,163 | 1,088 | 5,163 | 6,251 | 2,351 | 2004 | 2007 | |||||||||||||||||||
Chandler Freeways | — | 1,525 | — | 7,381 | 1,525 | 7,381 | 8,906 | 1,428 | 2012 | 2013 | |||||||||||||||||||
Kyrene 202 Business Park I | — | 653 | — | 5,777 | 653 | 5,777 | 6,430 | 816 | 2011 | 2014 | |||||||||||||||||||
Kyrene 202 Business Park II | — | 387 | — | 3,414 | 387 | 3,414 | 3,801 | 473 | 2011 | 2014 | |||||||||||||||||||
Kyrene 202 Business Park III, IV, & V | — | 1,244 | — | 11,684 | 1,244 | 11,684 | 12,928 | 340 | 2011 | 2018 | |||||||||||||||||||
Kyrene 202 Business Park VI | — | 936 | — | 8,333 | 936 | 8,333 | 9,269 | 781 | 2011 | 2015 | |||||||||||||||||||
Metro Business Park | — | 1,927 | 7,708 | 7,457 | 1,927 | 15,165 | 17,092 | 10,834 | 1996 | 1977/79 | |||||||||||||||||||
51st Avenue Distribution Center | — | 300 | 2,029 | 1,085 | 300 | 3,114 | 3,414 | 2,089 | 1998 | 1987 | |||||||||||||||||||
East University Distribution Center I and II | — | 1,120 | 4,482 | 1,915 | 1,120 | 6,397 | 7,517 | 4,416 | 1998 | 1987/89 | |||||||||||||||||||
East University Distribution Center III | — | 444 | 698 | 423 | 444 | 1,121 | 1,565 | 411 | 2010 | 1981 | |||||||||||||||||||
55th Avenue Distribution Center | — | 912 | 3,717 | 1,116 | 917 | 4,828 | 5,745 | 3,477 | 1998 | 1987 | |||||||||||||||||||
Interstate Commons Distribution Center I | — | 311 | 1,416 | 718 | 311 | 2,134 | 2,445 | 1,417 | 1999 | 1988 | |||||||||||||||||||
Interstate Commons Distribution Center III | — | 242 | — | 3,075 | 242 | 3,075 | 3,317 | 1,118 | 2000 | 2008 | |||||||||||||||||||
Airport Commons Distribution Center | — | 1,000 | 1,510 | 1,605 | 1,000 | 3,115 | 4,115 | 2,007 | 2003 | 1971 | |||||||||||||||||||
40th Avenue Distribution Center (f) | 3,594 | 703 | — | 6,061 | 703 | 6,061 | 6,764 | 2,276 | 2004 | 2008 | |||||||||||||||||||
Sky Harbor Business Park | — | 5,839 | — | 21,855 | 5,839 | 21,855 | 27,694 | 7,795 | 2006 | 2008 | |||||||||||||||||||
Sky Harbor Business Park 6 | — | 807 | — | 2,177 | 807 | 2,177 | 2,984 | 265 | 2014 | 2015 | |||||||||||||||||||
Ten Sky Harbor Business Center | — | 1,568 | — | 5,125 | 1,569 | 5,124 | 6,693 | 329 | 2015 | 2016 | |||||||||||||||||||
Tucson | |||||||||||||||||||||||||||||
Country Club Commerce Center I | — | 506 | 3,564 | 3,766 | 693 | 7,143 | 7,836 | 2,911 | 1997/2003 | 1994/2003 | |||||||||||||||||||
Country Club Commerce Center II | — | 442 | 3,381 | 1,061 | 709 | 4,175 | 4,884 | 1,329 | 2007 | 2000 | |||||||||||||||||||
Country Club Commerce Center III & IV | — | 1,407 | — | 12,127 | 1,575 | 11,959 | 13,534 | 4,579 | 2007 | 2009 | |||||||||||||||||||
100
SCHEDULE III | |||||||||||||||||||||||||||||
REAL ESTATE PROPERTIES AND ACCUMULATED DEPRECIATION | |||||||||||||||||||||||||||||
DECEMBER 31, 2018 (In thousands, except footnotes) | |||||||||||||||||||||||||||||
Description | Encumbrances | Initial Cost to the Company | Costs Capitalized Subsequent to Acquisition | Gross Amount Carried at Close of Period | Accumulated Depreciation | Year Acquired | Year Constructed | ||||||||||||||||||||||
Land | Buildings and Improvements | Land | Buildings and Improvements | Total | |||||||||||||||||||||||||
Country Club Commerce Center V | — | 2,885 | — | 21,633 | 2,886 | 21,632 | 24,518 | 384 | 2016 | 2018 | |||||||||||||||||||
Airport Distribution Center | — | 1,403 | 4,672 | 1,834 | 1,403 | 6,506 | 7,909 | 3,970 | 1998/2000 | 1995 | |||||||||||||||||||
Southpointe Distribution Center | — | — | 3,982 | 2,950 | — | 6,932 | 6,932 | 4,562 | 1999 | 1989 | |||||||||||||||||||
Benan Distribution Center | — | 707 | 1,842 | 697 | 707 | 2,539 | 3,246 | 1,482 | 2005 | 2001 | |||||||||||||||||||
NORTH CAROLINA | |||||||||||||||||||||||||||||
Charlotte area | |||||||||||||||||||||||||||||
NorthPark Business Park | — | 2,758 | 15,932 | 5,026 | 2,758 | 20,958 | 23,716 | 10,071 | 2006 | 1987-89 | |||||||||||||||||||
Lindbergh Business Park | — | 470 | 3,401 | 555 | 470 | 3,956 | 4,426 | 1,716 | 2007 | 2001/03 | |||||||||||||||||||
Commerce Park Center I | — | 765 | 4,303 | 1,064 | 765 | 5,367 | 6,132 | 2,179 | 2007 | 1983 | |||||||||||||||||||
Commerce Park Center II (h) | 1,150 | 335 | 1,603 | 304 | 335 | 1,907 | 2,242 | 697 | 2010 | 1987 | |||||||||||||||||||
Commerce Park Center III (h) | 1,925 | 558 | 2,225 | 971 | 558 | 3,196 | 3,754 | 1,095 | 2010 | 1981 | |||||||||||||||||||
Nations Ford Business Park | — | 3,924 | 16,171 | 4,130 | 3,924 | 20,301 | 24,225 | 9,497 | 2007 | 1989/94 | |||||||||||||||||||
Airport Commerce Center | — | 1,454 | 10,136 | 2,394 | 1,454 | 12,530 | 13,984 | 4,742 | 2008 | 2001/02 | |||||||||||||||||||
Interchange Park I (f) | 5,071 | 986 | 7,949 | 608 | 986 | 8,557 | 9,543 | 2,998 | 2008 | 1989 | |||||||||||||||||||
Interchange Park II | — | 746 | 1,456 | 65 | 746 | 1,521 | 2,267 | 276 | 2013 | 2000 | |||||||||||||||||||
Ridge Creek Distribution Center I | — | 1,284 | 13,163 | 1,067 | 1,284 | 14,230 | 15,514 | 4,525 | 2008 | 2006 | |||||||||||||||||||
Ridge Creek Distribution Center II (h) | 8,534 | 3,033 | 11,497 | 2,116 | 3,033 | 13,613 | 16,646 | 3,197 | 2011 | 2003 | |||||||||||||||||||
Ridge Creek Distribution Center III | — | 2,459 | 11,147 | 538 | 2,459 | 11,685 | 14,144 | 1,830 | 2014 | 2013 | |||||||||||||||||||
Lakeview Business Center (h) | 3,785 | 1,392 | 5,068 | 922 | 1,392 | 5,990 | 7,382 | 1,711 | 2011 | 1996 | |||||||||||||||||||
Steele Creek Commerce Park I (g) | 2,621 | 993 | — | 4,315 | 1,010 | 4,298 | 5,308 | 969 | 2013 | 2014 | |||||||||||||||||||
Steele Creek Commerce Park II (g) | 2,666 | 941 | — | 4,459 | 957 | 4,443 | 5,400 | 1,000 | 2013 | 2014 | |||||||||||||||||||
Steele Creek Commerce Park III | — | 1,464 | — | 6,412 | 1,469 | 6,407 | 7,876 | 1,190 | 2013 | 2014 | |||||||||||||||||||
Steele Creek Commerce Park IV | — | 684 | — | 3,945 | 687 | 3,942 | 4,629 | 684 | 2013 | 2015 | |||||||||||||||||||
Steele Creek Commerce Park VI | — | 867 | — | 6,978 | 869 | 6,976 | 7,845 | 534 | 2013/14 | 2016 | |||||||||||||||||||
Steele Creek Commerce Park VII | — | 1,207 | — | 7,936 | 1,210 | 7,933 | 9,143 | 181 | 2013/14/15 | 2017 | |||||||||||||||||||
Waterford Distribution Center | — | 654 | 3,392 | 822 | 654 | 4,214 | 4,868 | 1,425 | 2008 | 2000 | |||||||||||||||||||
GEORGIA | |||||||||||||||||||||||||||||
Atlanta | |||||||||||||||||||||||||||||
Shiloh 400 Business Center I & II | — | 3,092 | 14,216 | 1,874 | 3,092 | 16,090 | 19,182 | 1,356 | 2017 | 2008 | |||||||||||||||||||
Broadmoor Commerce Park I | — | 1,307 | 3,560 | 587 | 1,307 | 4,147 | 5,454 | 541 | 2017 | 1999 | |||||||||||||||||||
Gwinnett 316 | — | 531 | 3,617 | 21 | 531 | 3,638 | 4,169 | 77 | 2018 | 1990 | |||||||||||||||||||
101
SCHEDULE III | |||||||||||||||||||||||||||||
REAL ESTATE PROPERTIES AND ACCUMULATED DEPRECIATION | |||||||||||||||||||||||||||||
DECEMBER 31, 2018 (In thousands, except footnotes) | |||||||||||||||||||||||||||||
Description | Encumbrances | Initial Cost to the Company | Costs Capitalized Subsequent to Acquisition | Gross Amount Carried at Close of Period | Accumulated Depreciation | Year Acquired | Year Constructed | ||||||||||||||||||||||
Land | Buildings and Improvements | Land | Buildings and Improvements | Total | |||||||||||||||||||||||||
Hurricane Shoals I & II | — | 4,284 | 12,449 | 1,822 | 4,284 | 14,271 | 18,555 | 517 | 2017 | 2017 | |||||||||||||||||||
Progress Center I & II | — | 1,297 | 9,015 | 209 | 1,297 | 9,224 | 10,521 | 457 | 2017 | 2017 | |||||||||||||||||||
LOUISIANA | |||||||||||||||||||||||||||||
New Orleans | |||||||||||||||||||||||||||||
Elmwood Business Park | — | 2,861 | 6,337 | 5,533 | 2,861 | 11,870 | 14,731 | 8,253 | 1997 | 1979 | |||||||||||||||||||
Riverbend Business Park | — | 2,557 | 17,623 | 8,835 | 2,557 | 26,458 | 29,015 | 15,659 | 1997 | 1984 | |||||||||||||||||||
COLORADO | |||||||||||||||||||||||||||||
Denver | |||||||||||||||||||||||||||||
Rampart Distribution Center I | — | 1,023 | 3,861 | 2,314 | 1,023 | 6,175 | 7,198 | 4,590 | 1988 | 1987 | |||||||||||||||||||
Rampart Distribution Center II | — | 230 | 2,977 | 1,589 | 230 | 4,566 | 4,796 | 2,888 | 1996/97 | 1997 | |||||||||||||||||||
Rampart Distribution Center III | — | 1,098 | 3,884 | 2,434 | 1,098 | 6,318 | 7,416 | 3,323 | 1997/98 | 1999 | |||||||||||||||||||
Rampart Distribution Center IV | — | 590 | — | 8,340 | 590 | 8,340 | 8,930 | 969 | 2012 | 2014 | |||||||||||||||||||
Concord Distribution Center (h) | 3,237 | 1,051 | 4,773 | 490 | 1,051 | 5,263 | 6,314 | 2,107 | 2007 | 2000 | |||||||||||||||||||
Centennial Park (f) | 3,151 | 750 | 3,319 | 1,861 | 750 | 5,180 | 5,930 | 1,957 | 2007 | 1990 | |||||||||||||||||||
NEVADA | |||||||||||||||||||||||||||||
Las Vegas | |||||||||||||||||||||||||||||
Arville Distribution Center | — | 4,933 | 5,094 | 442 | 4,933 | 5,536 | 10,469 | 1,967 | 2009 | 1997 | |||||||||||||||||||
Jones Corporate Park | — | 13,068 | 26,325 | 1,913 | 13,068 | 28,238 | 41,306 | 1,687 | 2016 | 2016 | |||||||||||||||||||
MISSISSIPPI | |||||||||||||||||||||||||||||
Jackson area | |||||||||||||||||||||||||||||
Interchange Business Park | — | 343 | 5,007 | 4,682 | 343 | 9,689 | 10,032 | 5,908 | 1997 | 1981 | |||||||||||||||||||
Tower Automotive | — | — | 9,958 | 1,937 | 17 | 11,878 | 11,895 | 5,255 | 2001 | 2002 | |||||||||||||||||||
Metro Airport Commerce Center I | — | 303 | 1,479 | 1,254 | 303 | 2,733 | 3,036 | 1,610 | 2001 | 2003 | |||||||||||||||||||
189,038 | 378,543 | 1,077,934 | 1,097,004 | 380,684 | 2,172,797 | 2,553,481 | 814,731 | ||||||||||||||||||||||
102
SCHEDULE III | |||||||||||||||||||||||||||||
REAL ESTATE PROPERTIES AND ACCUMULATED DEPRECIATION | |||||||||||||||||||||||||||||
DECEMBER 31, 2018 (In thousands, except footnotes) | |||||||||||||||||||||||||||||
Description | Encumbrances | Initial Cost to the Company | Costs Capitalized Subsequent to Acquisition | Gross Amount Carried at Close of Period | Accumulated Depreciation | Year Acquired | Year Constructed | ||||||||||||||||||||||
Land | Buildings and Improvements | Land | Buildings and Improvements | Total | |||||||||||||||||||||||||
Development and Value-Add Properties (d): | |||||||||||||||||||||||||||||
CALIFORNIA | |||||||||||||||||||||||||||||
Siempre Viva Distribution Center | — | 4,723 | 9,211 | 141 | 4,723 | 9,352 | 14,075 | 115 | 2018 | 2003 | |||||||||||||||||||
FLORIDA | |||||||||||||||||||||||||||||
Oak Creek Distribution Center land | — | 841 | — | 719 | 707 | 853 | 1,560 | — | 2005 | n/a | |||||||||||||||||||
SunCoast Commerce Center land | — | 7,648 | — | 5,674 | 7,978 | 5,344 | 13,322 | — | 2006 | n/a | |||||||||||||||||||
SunCoast Commerce Center V | — | 1,511 | — | 5,024 | 1,594 | 4,941 | 6,535 | — | 2006 | n/a | |||||||||||||||||||
Horizon Commerce Park land | — | 3,339 | — | 2,380 | 2,240 | 3,479 | 5,719 | — | 2008/09 | n/a | |||||||||||||||||||
Horizon Commerce Park VI | — | 1,099 | — | 7,126 | 1,099 | 7,126 | 8,225 | — | 2008/09 | n/a | |||||||||||||||||||
Horizon Commerce Park XI | — | 1,101 | — | 7,622 | 1,101 | 7,622 | 8,723 | — | 2008/09 | n/a | |||||||||||||||||||
Gateway Commerce Park I | — | 5,746 | — | 14,495 | 5,746 | 14,495 | 20,241 | — | 2016 | 2018 | |||||||||||||||||||
Gateway Commerce Park land | — | 21,132 | — | 15,199 | 21,132 | 15,199 | 36,331 | — | 2016 | n/a | |||||||||||||||||||
TEXAS | |||||||||||||||||||||||||||||
CreekView 121 3 & 4 | — | 2,600 | — | 11,200 | 2,600 | 11,200 | 13,800 | 35 | 2015/16 | 2018 | |||||||||||||||||||
CreekView 121 5 & 6 | — | 2,681 | — | 2,924 | 2,681 | 2,924 | 5,605 | — | 2015/16 | n/a | |||||||||||||||||||
CreekView 121 land | — | 2,640 | — | 946 | 2,640 | 946 | 3,586 | — | 2015/16 | n/a | |||||||||||||||||||
LakePort 2499 Land | — | 5,700 | — | 354 | 5,700 | 354 | 6,054 | — | 2018 | n/a | |||||||||||||||||||
Parc North 5 | — | 1,286 | — | 5,667 | 1,286 | 5,667 | 6,953 | — | 2016 | n/a | |||||||||||||||||||
Parc North land | — | 1,233 | — | 1,319 | 1,233 | 1,319 | 2,552 | — | 2016 | n/a | |||||||||||||||||||
Lee Road Land | — | 2,989 | — | (300 | ) | 1,960 | 729 | 2,689 | — | 2007 | n/a | ||||||||||||||||||
Ten West Crossing 8 | — | 1,126 | — | 5,464 | 1,135 | 5,455 | 6,590 | — | 2012 | n/a | |||||||||||||||||||
World Houston Int'l Business Ctr land - 2011 expansion | — | 1,636 | — | 4,356 | 2,921 | 3,071 | 5,992 | — | 2011 | n/a | |||||||||||||||||||
World Houston Int'l Business Ctr land - 2015 expansion | — | 6,041 | — | 1,717 | 6,041 | 1,717 | 7,758 | — | 2015 | n/a | |||||||||||||||||||
Eisenhauer Point 7 & 8 | — | 999 | — | 12,091 | 2,593 | 10,497 | 13,090 | — | 2016 | n/a | |||||||||||||||||||
Eisenhauer Point Land | — | 632 | — | 521 | 632 | 521 | 1,153 | — | 2016 | n/a | |||||||||||||||||||
Ridgeview 35 Land | — | 3,273 | — | 101 | 3,273 | 101 | 3,374 | — | 2018 | n/a | |||||||||||||||||||
Tri-County Crossing 1 and 2 | — | 1,623 | — | 7,272 | 1,623 | 7,272 | 8,895 | — | 2017 | n/a | |||||||||||||||||||
Tri-County Crossing land | — | 3,637 | — | 885 | 3,637 | 885 | 4,522 | — | 2017 | n/a | |||||||||||||||||||
Settlers Crossing 1 | — | 1,211 | — | 5,049 | 1,211 | 5,049 | 6,260 | — | 2017 | n/a | |||||||||||||||||||
Settlers Crossing 2 | — | 1,306 | — | 5,809 | 1,306 | 5,809 | 7,115 | — | 2017 | n/a | |||||||||||||||||||
Settlers Crossing land | — | 2,774 | — | 968 | 2,774 | 968 | 3,742 | — | 2017 | n/a | |||||||||||||||||||
103
SCHEDULE III | |||||||||||||||||||||||||||||
REAL ESTATE PROPERTIES AND ACCUMULATED DEPRECIATION | |||||||||||||||||||||||||||||
DECEMBER 31, 2018 (In thousands, except footnotes) | |||||||||||||||||||||||||||||
Description | Encumbrances | Initial Cost to the Company | Costs Capitalized Subsequent to Acquisition | Gross Amount Carried at Close of Period | Accumulated Depreciation | Year Acquired | Year Constructed | ||||||||||||||||||||||
Land | Buildings and Improvements | Land | Buildings and Improvements | Total | |||||||||||||||||||||||||
ARIZONA | |||||||||||||||||||||||||||||
Falcon Field Business Center | — | 1,312 | — | 6,920 | 1,312 | 6,920 | 8,232 | 34 | 2015 | 2018 | |||||||||||||||||||
Gilbert Crossroads Land | — | 6,534 | — | 275 | 6,534 | 275 | 6,809 | — | 2018 | n/a | |||||||||||||||||||
NORTH CAROLINA | |||||||||||||||||||||||||||||
Airport Commerce Center III | — | 855 | — | 4,938 | 855 | 4,938 | 5,793 | — | 2008 | n/a | |||||||||||||||||||
Steele Creek Commerce Park 5 | — | 611 | — | 2,703 | 611 | 2,703 | 3,314 | — | 2013 | n/a | |||||||||||||||||||
Steele Creek Commerce Park Land | — | 4,574 | — | 2,635 | 4,592 | 2,617 | 7,209 | — | 2016/17 | n/a | |||||||||||||||||||
GEORGIA | |||||||||||||||||||||||||||||
Broadmoor Commerce Park 2 | — | 519 | — | 5,895 | 519 | 5,895 | 6,414 | — | 2017 | 2018 | |||||||||||||||||||
Hurricane Shoals Land | — | 497 | — | 229 | 497 | 229 | 726 | — | 2017 | n/a | |||||||||||||||||||
MISSISSIPPI | |||||||||||||||||||||||||||||
Metro Airport Commerce Center II land | — | 307 | — | 399 | 307 | 399 | 706 | — | 2001 | n/a | |||||||||||||||||||
— | 105,736 | 9,211 | 148,717 | 106,793 | 156,871 | 263,664 | 184 | ||||||||||||||||||||||
Total real estate owned (a)(b) | $ | 189,038 | 484,279 | 1,087,145 | 1,245,721 | 487,477 | 2,329,668 | 2,817,145 | 814,915 | ||||||||||||||||||||
See accompanying Report of Independent Registered Public Accounting Firm. | |||||||||||||||||||||||||||||
104
(a) Changes in Real Estate Properties follow:
Years Ended December 31, | |||||||||
2018 | 2017 | 2016 | |||||||
(In thousands) | |||||||||
Balance at beginning of year | $ | 2,578,748 | 2,407,029 | 2,219,465 | |||||
Purchases of real estate properties | 54,537 | 51,802 | 22,228 | ||||||
Development of real estate properties and value-add properties | 167,667 | 124,938 | 203,765 | ||||||
Improvements to real estate properties | 36,921 | 28,698 | 23,188 | ||||||
Carrying amount of investments sold | (18,372 | ) | (32,787 | ) | (61,121 | ) | |||
Write-off of improvements | (2,356 | ) | (932 | ) | (496 | ) | |||
Balance at end of year (1) | $ | 2,817,145 | 2,578,748 | 2,407,029 | |||||
(1) | Includes 20% noncontrolling interest in University Business Center of $3,296,000 and $3,217,000 at December 31, 2018 and 2017, respectively. |
Changes in the accumulated depreciation on real estate properties follow:
Years Ended December 31, | |||||||||
2018 | 2017 | 2016 | |||||||
(In thousands) | |||||||||
Balance at beginning of year | $ | 749,601 | 694,250 | 657,454 | |||||
Depreciation expense | 76,007 | 69,010 | 63,793 | ||||||
Accumulated depreciation on assets sold | (8,670 | ) | (12,735 | ) | (26,501 | ) | |||
Other | (2,023 | ) | (924 | ) | (496 | ) | |||
Balance at end of year | $ | 814,915 | 749,601 | 694,250 | |||||
(b) | The estimated aggregate cost of real estate properties at December 31, 2018 for federal income tax purposes was approximately $2,771,697,000 before estimated accumulated tax depreciation of $573,441,000. The federal income tax return for the year ended December 31, 2018, has not been filed and accordingly, this estimate is based on preliminary data. |
(c) | The Company computes depreciation using the straight-line method over the estimated useful lives of the buildings (generally 40 years) and improvements (generally 3 to 15 years). |
(d) | Effective January 1, 2018, the Company began transferring development projects from Development and value-add properties to Real estate properties at the earlier of 90% occupancy or one year after completion of the shell construction. Prior to 2018, the Company transferred development projects to Real estate properties the earlier of 80% occupancy or one year after completion of the shell construction. |
(e) | EastGroup has a $46,725,000 non-recourse first mortgage loan with an insurance company secured by Dominguez, Industry I & III, Kingsview, Shaw, Walnut and Washington. |
(f) | EastGroup has a $52,115,000 non-recourse first mortgage loan with an insurance company secured by 40th Avenue, Beltway Crossing V, Centennial Park, Executive Airport, Interchange Park I, Ocean View, Wetmore 5-8 and World Houston 26, 28, 29 & 30. |
(g) | EastGroup has a $47,445,000 non-recourse first mortgage loan with an insurance company secured by Colorado Crossing, Interstate I-III, Rojas, Steele Creek 1 & 2, Venture and World Houston 3-9. Subsequent to December 31, 2018, the Company executed a collateral release for World Houston 5; this property is no longer considered to be collateral securing this loan. |
(h) | EastGroup has a $40,046,000 non-recourse first mortgage loan with an insurance company secured by Arion 18, Beltway Crossing VI & VII, Commerce Park II & III, Concord, Interstate V-VII, Lakeview, Ridge Creek II, Southridge IV & V and World Houston 32. |
105
SCHEDULE IV
MORTGAGE LOANS ON REAL ESTATE
December 31, 2018
Number of Loans | Interest Rate | Maturity Date | Periodic Payment Terms | ||||||
First mortgage loan: | |||||||||
JCB Limited - California | 1 | 5.15 | % | December 2022 | Principal and interest due monthly | ||||
Total mortgage loans (a) | 1 | ||||||||
Face Amount of Mortgages Dec. 31, 2018 | Carrying Amount of Mortgages | Principal Amount of Loans Subject to Delinquent Principal or Interest (b) | |||||||
(In thousands) | |||||||||
First mortgage loans: | |||||||||
JCB Limited - California | $ | 2,594 | 2,594 | — | |||||
Total mortgage loans | $ | 2,594 | 2,594 | (c)(d) | — | ||||
(a) | Reference is made to allowance for possible losses on mortgage loans receivable in the Notes to Consolidated Financial Statements. |
(b) | Interest in arrears for three months or less is disregarded in computing principal amount of loans subject to delinquent interest. |
(c) | Changes in mortgage loans follow: |
Years Ended December 31, | |||||||||
2018 | 2017 | 2016 | |||||||
(In thousands) | |||||||||
Balance at beginning of year | $ | 4,581 | 4,752 | 4,875 | |||||
Payments on mortgage loans receivable | (1,987 | ) | (171 | ) | (123 | ) | |||
Balance at end of year | $ | 2,594 | 4,581 | 4,752 | |||||
(d) The aggregate cost for federal income tax purposes is approximately $2.59 million. The federal income tax return for the year ended December 31, 2018, has not been filed and, accordingly, the income tax basis of mortgage loans as of December 31, 2018, is based on preliminary data.
See accompanying Report of Independent Registered Public Accounting Firm.
106
ITEM 16. FORM 10-K SUMMARY.
None.
107
SIGNATURES
Pursuant to the requirements of Section 13 or 15(d) of the Securities Exchange Act of 1934, the Registrant has duly caused this report to be signed on its behalf by the undersigned, thereunto duly authorized.
EASTGROUP PROPERTIES, INC. | ||
By: /s/ MARSHALL A. LOEB | ||
Marshall A. Loeb, Chief Executive Officer, President and Director | ||
February 14, 2019 | ||
We, the undersigned officers and directors of EastGroup Properties, Inc., hereby severally constitute and appoint Brent W. Wood as our true and lawful attorney, with full power to sign for us and in our names in the capacities indicated below, any and all amendments to this Annual Report on Form 10-K and generally to do all such things in our name and behalf in such capacity to enable EastGroup Properties, Inc. to comply with the applicable provisions of the Securities Exchange Act of 1934, as amended, and we hereby ratify and confirm our signatures as they may be signed by our said attorney to any and all such amendments.
Pursuant to the requirements of the Securities Exchange Act of 1934, this report has been signed below by the following persons on behalf of the Registrant and in the capacities and on the dates indicated.
/s/ D. Pike Aloian | /s/ H. C. Bailey, Jr. | |
D. Pike Aloian, Director | H. C. Bailey, Jr., Director | |
February 14, 2019 | February 14, 2019 | |
/s/ H. Eric Bolton, Jr. | /s/ Donald F. Colleran | |
H. Eric Bolton, Jr., Director | Donald F. Colleran, Director | |
February 14, 2019 | February 14, 2019 | |
/s/ Hayden C. Eaves III | /s/ Fredric H. Gould | |
Hayden C. Eaves III, Director | Fredric H. Gould, Director | |
February 14, 2019 | February 14, 2019 | |
/s/ Mary Elizabeth McCormick | /s/ Leland R. Speed | |
Mary Elizabeth McCormick, Director | Leland R. Speed, Chairman Emeritus of the Board | |
February 14, 2019 | February 14, 2019 | |
/s/ David H. Hoster II | ||
David H. Hoster II, Chairman of the Board | ||
February 14, 2019 | ||
108
/s/ MARSHALL A. LOEB | |
Marshall A. Loeb, Chief Executive Officer, | |
President and Director | |
(Principal Executive Officer) | |
February 14, 2019 | |
/s/ BRUCE CORKERN | |
Bruce Corkern, Sr. Vice-President, Chief Accounting Officer | |
and Secretary | |
(Principal Accounting Officer) | |
February 14, 2019 | |
/s/ BRENT W. WOOD | |
Brent W. Wood, Executive Vice-President, | |
Chief Financial Officer and Treasurer | |
(Principal Financial Officer) | |
February 14, 2019 | |
109