UNITED STATES
SECURITIES AND EXCHANGE COMMISSION
Washington, D.C. 20549
FORM 10-K
ANNUAL REPORT PURSUANT TO SECTION 13 OR 15(d) OF THE SECURITIES EXCHANGE ACT OF 1934 | |
For the fiscal year ended October 27, 2019
or
TRANSITION REPORT PURSUANT TO SECTION 13 OR 15(d) OF THE SECURITIES EXCHANGE ACT OF 1934 | |
For the transition period from ____________________ to _________________________
Commission File Number: 1-2402
(Exact name of registrant as specified in its charter)
(State or other jurisdiction of incorporation or organization) | (I.R.S. Employer Identification No.) | |
(Address of principal executive offices) | (Zip Code) | ||
Registrant’s telephone number, including area code (507 ) 437-5611
Securities registered pursuant to Section 12(b) of the Act:
Title of each class | Trading Symbol | Name of each exchange on which registered | ||||
$0.01465 | par value | |||||
Securities registered pursuant to Section 12(g) of the Act: None
Indicate by check mark if the registrant is a well-known seasoned issuer, as defined in Rule 405 of the Securities Act. Yes ☒ No ☐
Indicate by check mark if the registrant is not required to file reports pursuant to Section 13 or Section 15(d) of the Act. Yes ☐
Indicate by check mark whether the registrant (1) has filed all reports required to be filed by Section 13 or 15(d) of the Securities Exchange Act of 1934 during the preceding 12 months, and (2) has been subject to such filing requirements for the past 90 days. Yes ☒ No ☐
Indicate by check mark whether the registrant has submitted electronically every Interactive Data File required to be submitted pursuant to Rule 405 of Regulations S-T during the preceding 12 months (or for such shorter period that the registrant was required to submit such files). Yes ☒ No ☐
Indicate by check mark whether the registrant is a large accelerated filer, an accelerated filer, a non-accelerated filer, smaller reporting company, or an emerging growth company. See the definitions of “large accelerated filer,” “accelerated filer”, “smaller reporting company”, and “emerging growth company” in Rule 12b-2 of the Exchange Act.
☒ | Accelerated filer | ☐ | |
Non-accelerated filer | ☐ | Smaller reporting company | |
Emerging growth company | |||
If an emerging growth company, indicate by check mark if the registrant has elected not to use the extended transition period for complying with any new or revised financial accounting standards provided pursuant to Section 13(a) of the Exchange Act. ☐
Indicate by check mark whether the registrant is a shell company (as defined in Rule 12b-2 of the Act). Yes ☐ No ☒
The aggregate market value of the voting and non-voting common stock held by non-affiliates of the registrant as of April 28, 2019, was $11,072,534,818 based on the closing price of $39.94 on the last business day of the registrant’s most recently completed second fiscal quarter.
As of November 29, 2019, the number of shares outstanding of each of the registrant’s classes of common stock was as follows:
Common Stock, $0.01465 – Par Value 534,736,743 shares
Common Stock Non-Voting, $0.01 Par Value – 0 shares
DOCUMENTS INCORPORATED BY REFERENCE
1
HORMEL FOODS CORPORATION
TABLE OF CONTENTS
2
PART I
Item 1. BUSINESS
General Development of Business
Hormel Foods Corporation, a Delaware corporation (the Company), was founded by George A. Hormel in 1891 in Austin, Minnesota, as Geo. A. Hormel & Company. The Company started as a processor of meat and food products and continues in this line of business. The Company’s name was changed to Hormel Foods Corporation on January 31, 1995. The Company is primarily engaged in the production of a variety of meat and food products and the marketing of those products throughout the United States and internationally. Although pork and turkey remain the major raw materials for its products, the Company has emphasized for several years the manufacturing and distribution of branded, value-added consumer items rather than the commodity fresh meat business. The Company has continually expanded its product portfolio through organic growth and acquisitions.
Internationally, the Company markets its products through Hormel Foods International Corporation (HFIC), a wholly owned subsidiary. HFIC has a global presence in the international marketplace through joint ventures and placement of personnel in strategic foreign locations such as Australia, Brazil, Canada, China, Japan, and the Philippines. HFIC has a minority position in a food company in the Philippines (The Purefoods-Hormel Company, Inc., 40% holding).
On April 15, 2019, the Company completed the sale of CytoSport, Inc. (CytoSport), which includes the Muscle Milk® and Evolve® brands, to PepsiCo, Inc., and received final proceeds of $479.8 million. The divestiture resulted in a pretax gain of $16.5 million recognized in Selling, General and Administrative expense and a tax benefit of $17.0 million recognized within the Provision for Income Taxes on the Consolidated Statements of Operations.
On December 3, 2018, the Company completed the sale of its Fremont, Nebraska, processing facility to Wholestone Farms, LLC, for a final purchase price of $30.6 million.
On November 27, 2017, the Company acquired Columbus Manufacturing, Inc. (Columbus), an authentic premium deli meat and salami company, from Chicago-based Arbor Investments, for a final purchase price of $857.4 million. The transaction was funded with cash on hand along with borrowing $375.0 million under a term loan facility and $375.0 million under a revolving credit facility. Columbus specializes in authentic premium deli meat and salami and allows the Company to enhance its scale in the deli by broadening its portfolio of products, customers, and consumers.
On August 22, 2017, the Company acquired Cidade do Sol (Ceratti) for a final purchase price of $103.3 million. The transaction was funded by the Company with cash on hand. The acquisition of the Ceratti® brand allows the Company to establish a full in-country presence in the fast-growing Brazilian market with a premium brand.
On August 16, 2017, the Company acquired Fontanini Italian Meats and Sausages (Fontanini), a branded foodservice business, from Capitol Wholesale Meats, Inc. for a final purchase price of $425.7 million. The transaction was funded by the Company with cash on hand and by utilizing short-term financing. Fontanini specializes in authentic Italian meats and sausages, as well as a variety of other premium meat products including pizza toppings and meatballs and allows the Company to expand its foodservice business.
On January 3, 2017, the Company completed the sale of Clougherty Packing, LLC, parent company of Farmer John and Saag’s Specialty Meats, along with PFFJ, LLC, farm operations in California, Arizona, and Wyoming. The closing price was $145.0 million in cash.
On May 26, 2016, the Company acquired Justin’s, LLC (Justin’s) of Boulder, Colorado, for a purchase price of $280.9 million. The purchase price was funded by the Company with cash on hand and by utilizing short-term financing. This acquisition allowed the Company to enhance its presence in the specialty natural and organic nut butter category.
On May 9, 2016, the Company completed the sale of Diamond Crystal Brands resulting in proceeds of $110.1 million, net of selling costs.
On July 13, 2015, the Company acquired Applegate Farms, LLC (Applegate) of Bridgewater, New Jersey, for a final purchase price of $774.1 million in cash. The purchase price was funded by the Company with cash on hand and by utilizing short-term financing. This acquisition allows the Company to expand the breadth of its protein offerings to provide consumers more choice in this fast growing category.
The Company had no other significant change in the type of products produced or services rendered, or in the markets or methods of distribution, since the beginning of the 2019 fiscal year. The Company has not been involved in any bankruptcy, receivership, or similar proceedings during its history.
3
Segments
The Company develops, processes, and distributes a wide array of food products in a variety of markets. The Company reports results in the following four segments: Grocery Products, Refrigerated Foods, Jennie-O Turkey Store, and International & Other. At the beginning of fiscal 2019, the Hormel Deli Solutions division combined all deli businesses, including the Jennie-O Turkey Store deli division, into one division within the Refrigerated Foods segment. In addition, the ingredients business was realigned from the Grocery Products segment to the Refrigerated Foods segment. Segment results for fiscal years prior to 2019 have been adjusted to reflect these changes. Net sales to unaffiliated customers, operating profit, total assets, and the presentation of certain other financial information by segment, are reported in Note P - Segment Reporting of the Notes to Consolidated Financial Statements and in the Management's Discussion and Analysis of Financial Condition and Results of Operations.
Description of Business
Products and Distribution
The Company’s products primarily consist of meat and other food products sold across multiple distribution channels such as U.S. Retail, U.S. Foodservice, U.S. Deli, and International. Total revenues contributed by classes of similar products and sales channels for the last three fiscal years are reported in Note P - Segment Reporting of the Notes to Consolidated Financial Statements.
Domestically, the Company sells its products in all 50 states. The Company’s products are sold through its sales personnel, operating in assigned territories or as dedicated teams serving major customers, coordinated from sales offices located in most of the larger U.S. cities. The Company also utilizes independent brokers and distributors. Distribution of products to customers is primarily by common carrier.
Through HFIC, the Company markets its products in various locations throughout the world. Some of the larger markets include Australia, Brazil, Canada, China, England, Japan, Mexico, Micronesia, the Philippines, Singapore, and South Korea. The distribution of export sales to customers is by common carrier, while the China and Brazil operations own and operate their own delivery systems. The Company, through HFIC, has licensed companies to manufacture various products internationally on a royalty basis, with the primary licensees being Danish Crown UK Ltd. and CJ CheilJedang Corporation.
As of October 27, 2019, the Company had approximately 970 direct sales representatives engaged in selling its products globally.
Raw Materials
The Company has, for the past several years, been concentrating on branded products for consumers with year-round demand to minimize the seasonal variation experienced with commodity-type products. Pork continues to be the primary raw material for Company products. The Company’s expanding line of branded products has reduced, but not eliminated, the sensitivity of Company results to raw material supply and price fluctuations.
The majority of the hogs harvested for the Company are purchased under supply contracts from producers located principally in Minnesota and Iowa. The cost of hogs and the utilization of the Company’s facilities are affected by both the level and the methods of pork production in the United States. The Company uses supply contracts to ensure a stable supply of raw materials. The Company’s contracts are based on market-based formulas and/or markets of certain swine production inputs, to better balance input costs with customer pricing, and all contract costs are fully reflected in the Company’s reported financial statements. In fiscal 2019, the Company purchased 93 percent of its hogs under supply contracts.
In fiscal 2019, Jennie-O Turkey Store raised turkeys representing approximately 79 percent of the volume needed to meet its raw material requirements for branded turkey products and whole birds. Turkeys not sourced within the Company are contracted with independent turkey growers. Jennie-O Turkey Store’s turkey-raising farms are located throughout Minnesota and Wisconsin.
Production costs in raising hogs and turkeys are subject primarily to fluctuations in grain prices and fuel costs. To manage this risk, the Company hedges a portion of its anticipated purchases of grain using futures contracts.
The Company purchases other commodity based raw materials such as beef, pork, and chicken for use across all segments. Raw materials are obtained from various suppliers and manufacturers. The Company has long standing relationships with its sources of raw materials and expects to have an adequate supply for its present needs.
Additionally, the cost and supply of avocados, peanuts, and whey are impacted by the changing market forces of supply and demand, which can impact the cost of the Company’s products. The Company uses long-term supply contracts and forward buying in an attempt to manage these risks.
Manufacturing
The Company manufactures its products through various harvest and processing facilities along with custom manufacturers.
4
Environmental Matters
In addition to creating economic value, the Company is committed to building social value. The Company recently launched its corporate responsibility platform, Our Food JourneyTM. This journey consists of producing food responsibly for customers and consumers around the world by focusing on investing in people and partners, improving communities around the world, and creating products to improve the lives of others. The capital expenditures associated with these commitments are not material with respect to the Company’s capital expenditures, earnings, or competitive position.
Patents and Trademarks
There are numerous patents and trademarks important to the Company’s business. The Company holds 34 U.S. issued and 9 foreign patents. Most of the trademarks the Company uses are registered in the U.S. and other countries. Some of the more significant owned or licensed trademarks used by the Company or its affiliates are:
HORMEL, ALWAYS TENDER, APPLEGATE, AUSTIN BLUES, BACON 1, BLACK LABEL, BREAD READY, BURKE, CAFÉ H, CERATTI, CHI-CHI’S, COLUMBUS, COMPLEATS, CURE 81, DAN’S PRIZE, DI LUSSO, DINTY MOORE, DON MIGUEL, DOÑA MARIA, EMBASA, FAST ‘N EASY, FIRE BRAISED, FONTANINI, HERDEZ, HORMEL GATHERINGS, HORMEL VITAL CUISINE, HOUSE OF TSANG, JENNIE-O, JUSTIN’S, LA VICTORIA, LAYOUT, LLOYD’S, MARY KITCHEN, NATURAL CHOICE, OLD SMOKEHOUSE, OVEN READY, PILLOW PACK, ROSA GRANDE, SKIPPY, SPAM, SPECIAL RECIPE, THICK & EASY, VALLEY FRESH, and WHOLLY.
The Company’s patents expire after a term that is typically 20 years from the date of filing, with earlier expiration possible based on the Company’s decision to pay required maintenance fees. As long as the Company continues to use its trademarks, they are renewed indefinitely.
Customers and Backlog Orders
During fiscal 2019, sales to Walmart Inc. (Walmart) represented approximately 13.5 percent of the Company’s revenues (measured as gross sales less returns and allowances), compared to 13.6 percent in fiscal 2018. Walmart is a customer for all four segments of the Company. The five largest customers in each segment make up approximately the following percentage of segment sales: 45 percent of Grocery Products, 35 percent of Refrigerated Foods, 52 percent of Jennie-O Turkey Store, and 16 percent of International & Other. The loss of one or more of the top customers in any of these segments could have a material adverse effect on the results of such segment. Backlog orders are not significant due to the perishable nature of a large portion of the products. Orders are accepted and shipped on a current basis.
Competition
The production and sale of meat and food products in the United States and internationally is highly competitive. The Company competes with manufacturers of pork and turkey products, as well as national and regional producers of other meat and protein sources, such as beef, chicken, fish, peanut butter, and whey. The Company believes its largest domestic competitors for its Refrigerated Foods segment in 2019 were Tyson Foods, Inc. and Smithfield Foods, Inc.; for its Grocery Products segment, Conagra Brands, Inc., General Mills, Inc., Campbell Soup Co., J. M. Smucker Co., and Treehouse Foods Inc.; and for Jennie-O Turkey Store, Cargill, Inc. and Butterball, LLC.
All segments compete on the basis of price, product quality and attributes, brand identification, breadth of product line, and customer service. Through aggressive marketing and strong quality assurance programs, the Company’s strategy is to provide higher quality products that possess strong brand recognition, which then supports higher value perceptions from customers.
Employees
As of October 27, 2019, the Company had approximately 18,800 active domestic and foreign employees.
Available Information
The Company makes available its annual report on Form 10-K, quarterly reports on Form 10-Q, current reports on Form 8-K, and amendments to those reports filed or furnished pursuant to Section 13(a) or 15(d) of the Securities Exchange Act of 1934 on its website at www.hormelfoods.com. These reports are accessible under the caption, “Investors – Filings & Reports – SEC Filings” on the Company’s website and are available as soon as reasonably practicable after such material is electronically filed with or furnished to the Securities and Exchange Commission (SEC). These filings are also available on the SEC's website at www.sec.gov. The documents are available in print, free of charge, to any stockholder who requests them.
5
Information About Executive Officers
CURRENT OFFICE AND PREVIOUS | ||||||
NAME | AGE | FIVE YEARS EXPERIENCE | DATES | |||
James P. Snee | 52 | Chairman of the Board, President and Chief Executive Officer | 11/20/17 to Present | |||
President and Chief Executive Officer | 10/31/16 to 11/19/17 | |||||
President and Chief Operating Officer | 10/26/15 to 10/30/16 | |||||
Group Vice President/President Hormel Foods International Corporation | 10/29/12 to 10/25/15 | |||||
James N. Sheehan | 64 | Executive Vice President and Chief Financial Officer | 01/29/19 to Present | |||
Senior Vice President and Chief Financial Officer | 10/31/16 to 01/28/19 | |||||
Vice President and Chief Accounting Officer | 05/30/16 to 10/30/16 | |||||
Vice President and Controller | 05/01/00 to 05/29/16 | |||||
Deanna T. Brady | 54 | Executive Vice President (Refrigerated Foods) | 10/28/19 to Present | |||
Group Vice President/President Consumer Product Sales | 10/26/15 to 10/27/19 | |||||
Group Vice President (Foodservice) | 10/28/13 to 10/25/15 | |||||
Thomas R. Day | 61 | Executive Vice President (Refrigerated Foods) | 2/12/18 to Present | |||
(retires 01/26/20) | ||||||
Group Vice President (Refrigerated Foods) | 10/28/13 to 2/11/18 | |||||
Glenn R. Leitch | 59 | Executive Vice President (Supply Chain) | 12/04/17 to Present | |||
Group Vice President/President Jennie-O Turkey Store, Inc. | 10/31/11 to 12/03/17 | |||||
PJ Connor | 50 | Group Vice President/President Consumer Product Sales | 10/28/19 to Present | |||
Vice President (Senior Vice President Consumer Product Sales) | 10/31/11 to 10/27/19 | |||||
Luis G. Marconi | 53 | Group Vice President (Grocery Products) | 10/31/16 to Present | |||
Vice President (Grocery Products Marketing) | 03/05/12 to 10/30/16 | |||||
James M. Splinter | 57 | Group Vice President (Corporate Strategy) | 10/31/16 to Present | |||
Group Vice President (Grocery Products) | 11/01/10 to 10/30/16 | |||||
Larry L. Vorpahl | 56 | Group Vice President/President Hormel Foods International Corporation | 10/26/15 to Present | |||
Group Vice President/President Consumer Products Sales | 10/31/05 to 10/25/15 | |||||
Mark A. Coffey | 57 | Senior Vice President (Supply Chain and Manufacturing) | 03/28/17 to Present | |||
Vice President (Supply Chain) | 02/06/17 to 03/27/17 | |||||
Vice President (Affiliated Businesses) | 10/31/11 to 02/05/17 | |||||
Janet L. Hogan | 55 | Senior Vice President (Human Resources) | 03/28/17 to Present | |||
Vice President (Human Resources) | 01/18/17 to 03/27/17 | |||||
Senior Vice President (Human Resources), ProQuest LLC | 02/02/16 to 01/17/17 | |||||
Executive Vice President, Chief Human Resources Officer, Oshkosh Corporation | 05/02/14 to 02/01/16 | |||||
Steven J. Lykken | 49 | Senior Vice President/President Jennie-O Turkey Store, Inc. | 12/04/17 to Present | |||
President Applegate Farms, LLC | 04/11/16 to 12/03/17 | |||||
Chief Operating Officer Applegate Farms, LLC | 08/17/15 to 04/10/16 | |||||
Senior Vice President Jennie-O Turkey Store, Inc. (Commodity/ Supply Chain) | 06/06/11 to 08/16/15 | |||||
Lori J. Marco | 52 | Senior Vice President (External Affairs) and General Counsel | 03/30/15 to Present | |||
Vice President (External Affairs) and General Counsel | 01/24/11 to 03/29/15 | |||||
Kevin L. Myers, Ph.D. | 54 | Senior Vice President (Research and Development and Quality Control) | 03/30/15 to Present | |||
Vice President (Research and Development) | 10/28/13 to 03/29/15 | |||||
Jana L. Haynes | 47 | Vice President and Controller | 05/30/16 to Present | |||
Director of Investor Relations | 10/28/13 to 05/29/16 | |||||
Gary L. Jamison | 54 | Vice President and Treasurer | 5/30/16 to Present | |||
Vice President and Chief Financial Officer Jennie-O Turkey Store, Inc. | 12/31/12 to 05/29/16 | |||||
No family relationship exists among the executive officers.
Executive officers are designated annually by the Board of Directors at the first meeting following the Annual Meeting of Stockholders. Vacancies may be filled and additional officers elected at any time. The May 2018 bylaw amendments delegated the authority to appoint and remove Vice Presidents (other than Executive Vice Presidents, Group Vice Presidents, and Senior Vice Presidents) to the Company’s Chief Executive Officer.
6
Item 1A. RISK FACTORS
The Company’s operations are subject to the general risks of the food industry. The food products manufacturing industry is subject to the risks posed by:
▪ | food spoilage; |
▪ | food contamination caused by disease-producing organisms or pathogens, such as Listeria monocytogenes, Salmonella, and pathogenic E coli.; |
▪ | food allergens; |
▪ | nutritional and health-related concerns; |
▪ | federal, state, and local food processing controls; |
▪ | consumer product liability claims; |
▪ | product tampering; and |
▪ | the possible unavailability and/or expense of liability insurance. |
The pathogens that may cause food contamination are found generally in livestock and in the environment and thus may be present in our products. These pathogens can also be introduced to our products as a result of improper handling or cooking by customers or consumers. We do not have control over handling procedures once our products have been shipped for distribution. If one or more of these risks were to materialize, the Company’s brand and business reputation could be negatively impacted. In addition, revenues could decrease, costs of doing business could increase, and the Company’s operating results could be adversely affected.
Deterioration of economic conditions could harm the Company’s business. The Company's business may be adversely affected by changes in national or global economic conditions, including inflation, interest rates, availability of capital, energy availability and costs (including fuel surcharges), and the effects of governmental initiatives to manage economic conditions. Decreases in consumer spending rates and shifts in consumer product preferences could also negatively impact the Company.
Volatility in financial markets and the deterioration of national and global economic conditions could impact the Company’s operations as follows:
▪ | The financial stability of our customers and suppliers may be compromised, which could result in additional bad debts for the Company or non-performance by suppliers; and |
▪ | The value of our investments in debt and equity securities may decline, including most significantly the Company’s trading securities held as part of a rabbi trust to fund supplemental executive retirement plans and deferred income plans, and the Company’s assets held in pension plans. |
The Company utilizes hedging programs to manage its exposure to various commodity market risks, which qualify for hedge accounting for financial reporting purposes. Volatile fluctuations in market conditions could cause these instruments to become ineffective, which could require any gains or losses associated with these instruments to be reported in the Company’s earnings each period. These instruments may limit the Company’s ability to benefit from market gains if commodity prices become more favorable than those secured under the Company’s hedging programs.
Additionally, if a highly pathogenic human disease outbreak developed in the United States, it may negatively impact the national economy, demand for Company products, and/or the Company’s workforce availability, and the Company’s financial results could suffer. The Company has developed contingency plans to address infectious disease scenarios and the potential impact on its operations, and will continue to update these plans as necessary. There can be no assurance given, however, these plans will be effective in eliminating the negative effects of any such diseases on the Company’s operating results.
Outbreaks of disease among livestock and poultry flocks could harm the Company’s revenues and operating margins.
The Company is subject to risks associated with the outbreak of disease in pork and beef livestock, and poultry flocks, including African swine fever (ASF), Bovine Spongiform Encephalopathy (BSE), pneumo-virus, Porcine Circovirus 2 (PCV2), Porcine Reproduction & Respiratory Syndrome (PRRS), Foot-and-Mouth Disease (FMD), Porcine Epidemic Diarrhea Virus (PEDv), and Highly Pathogenic Avian Influenza (HPAI). The outbreak of such diseases could adversely affect the Company’s supply of raw materials, increase the cost of production, reduce utilization of the Company’s harvest facilities, and reduce operating margins. Additionally, the outbreak of disease may hinder the Company’s ability to market and sell products both domestically and internationally.
Most recently, the outbreak of ASF in China has eliminated over 30 percent of that country's hog herd compared to last year, according to the Ministry of Agriculture and Rural Affairs of the People's Republic of China. The disease has also spread to additional countries in Asia and Europe. If an outbreak of ASF were to occur in the United States, the Company's supply of hogs and pork could be materially impacted.
The Company has developed business continuity plans for various disease scenarios and will continue to update these plans as necessary. There can be no assurance given, however, that these plans will be effective in eliminating the negative effects of any such diseases on the Company’s operating results.
7
Fluctuations in commodity prices and availability of pork, poultry, beef, feed grains, avocados, peanuts, energy, and whey could harm the Company’s earnings. The Company’s results of operations and financial condition are largely dependent upon the cost and supply of pork, poultry, beef, feed grains, avocados, peanuts, and whey as well as energy costs and the selling prices for many of our products, which are determined by constantly changing market forces of supply and demand.
The live hog industry has evolved to large, vertically-integrated operations using long-term supply agreements. This has resulted in fewer hogs being available on the cash spot market. Consequently, the Company uses long-term supply contracts based on market-based formulas or the cost of production to ensure a stable supply of raw materials while minimizing extreme fluctuations in costs over the long-term. This may result, in the short-term, in higher live hog costs compared to the cash spot market depending on the relationship of the cash spot market to contract prices. Market-based pricing on certain product lines, and lead time required to implement pricing adjustments, may prevent all or part of these cost increases from being recovered, and these higher costs could adversely affect our short-term financial results.
Jennie-O Turkey Store raises turkeys and contracts with turkey growers to meet its raw material requirements for whole birds and processed turkey products. Results in these operations are affected by the cost and supply of feed grains, which fluctuate due to climate conditions, production forecasts, and supply and demand conditions at local, regional, national, and worldwide markets. The Company attempts to manage some of its short-term exposure to fluctuations in feed prices by forward buying, using futures contracts, and pursuing pricing advances. However, these strategies may not be adequate to overcome sustained increases in market prices due to alternate uses for feed grains or other changes in these market conditions.
The supplies of natural and organic proteins may impact the Company’s ability to ensure a continuing supply of these products. To mitigate this risk, the Company partners with multiple long-term suppliers.
International trade barriers and other restrictions could result in decreased foreign demand and increased domestic supply of proteins, thereby potentially lowering prices. The Company occasionally utilizes in-country production to limit this exposure.
Market demand for the Company’s products may fluctuate. The Company faces competition from producers of alternative meats and protein sources, including pork, beef, turkey, chicken, fish, nut butters, whey, and plant-based proteins. The factors on which the Company competes include:
▪ | price; |
▪ | product quality and attributes; |
▪ | brand identification; |
▪ | breadth of product line; and |
▪ | customer service. |
Demand for the Company’s products is also affected by competitors’ promotional spending, the effectiveness of the Company’s advertising and marketing programs, and consumer perceptions. Failure to identify and react to changes in food trends such as sustainability of product sources and animal welfare could lead to, among other things, reduced demand for the Company’s brands and products. The Company may be unable to compete successfully on any or all of these factors in the future.
The Company’s operations are subject to the general risks associated with acquisitions and divestitures. The Company has made several acquisitions and divestitures in recent years that align with the Company’s strategic initiative of delivering long-term value to shareholders. The Company regularly reviews strategic opportunities to grow through acquisitions and to divest non-strategic assets. Potential risks associated with these transactions include the the inability to consummate a transaction on favorable terms, the diversion of management's attention from other business concerns, the potential loss of key employees and customers of current or acquired companies, the inability to integrate or divest operations successfully, the possible assumption of unknown liabilities, potential disputes with buyers or sellers, potential impairment charges if purchase assumptions are not achieved, and the inherent risks in entering markets or lines of business in which the Company has limited or no prior experience. Any or all of these risks could impact the Company’s financial results and business reputation. In addition, acquisitions outside the United States may present unique challenges and increase the Company's exposure to the risks associated with foreign operations.
The Company is subject to disruption of operations at co-packers or other suppliers. Disruption of operations at co‑packers or other suppliers may impact the Company’s product or raw material supply, which could have an adverse effect on the Company’s financial results. Additionally, actions taken to mitigate the impact of any potential disruption, including increasing inventory in anticipation of a potential production or supply interruption, may adversely affect the Company’s financial results.
The Company’s operations are subject to the general risks of litigation. The Company is involved on an ongoing basis in litigation arising in the ordinary course of business. Trends in litigation may include class actions involving employees, consumers, competitors, suppliers, shareholders, or injured persons, and claims relating to product liability, contract disputes, intellectual property, advertising, labeling, wage and hour laws, employment practices, or environmental matters. Litigation trends and the outcome of litigation cannot be predicted with certainty and adverse litigation trends and outcomes could negatively affect the Company’s financial results.
The Company is subject to the loss of a material contract. The Company is a party to several supply, distribution, contract packaging, and other material contracts. The loss of a material contract could adversely affect the Company’s financial results.
8
Government regulation, present and future, exposes the Company to potential sanctions and compliance costs that could adversely affect the Company’s business. The Company’s operations are subject to extensive regulation by the U.S. Department of Homeland Security, the U.S. Department of Agriculture, the U.S. Food and Drug Administration, federal and state taxing authorities, and other federal, state, and local authorities who oversee workforce immigration laws, tax regulations, animal welfare, food safety standards, and the processing, packaging, storage, distribution, advertising, and labeling of the Company’s products. The Company’s manufacturing facilities and products are subject to continuous inspection by federal, state, and local authorities. Claims or enforcement proceedings could be brought against the Company in the future. The availability of government inspectors due to a government furlough could also cause disruption to the Company’s manufacturing facilities. Additionally, the Company is subject to new or modified laws, regulations, and accounting standards. The Company’s failure or inability to comply with such requirements could subject the Company to civil remedies, including fines, injunctions, recalls, or seizures, as well as potential criminal sanctions.
The Company is subject to stringent environmental regulation and potentially subject to environmental litigation, proceedings, and investigations. The Company’s past and present business operations and ownership and operation of real property are subject to stringent federal, state, and local environmental laws and regulations pertaining to the discharge of materials into the environment and the handling and disposition of wastes (including solid and hazardous wastes) or otherwise relating to protection of the environment. Compliance with these laws and regulations, as well as any modifications, is material to the Company’s business. Some of the Company’s facilities have been in operation for many years and, over time, the Company and other prior operators of these facilities may have generated and disposed of wastes that now may be considered hazardous. Future discovery of contamination of property underlying or in the vicinity of the Company’s present or former properties or manufacturing facilities and/or waste disposal sites could require the Company to incur additional expenses related to additional investigation, assessment or other requirements. The occurrence of any of these events, the implementation of new laws and regulations, or stricter interpretation of existing laws or regulations could adversely affect the Company’s financial results.
The Company’s foreign operations pose additional risks to the Company’s business. The Company operates its business and markets its products internationally. The Company’s foreign operations are subject to the risks described above, as well as risks related to fluctuations in currency values, foreign currency exchange controls, compliance with foreign laws, compliance with applicable U.S. laws, including the Foreign Corrupt Practices Act, and other economic or political uncertainties. International sales are subject to risks related to general economic conditions, imposition of tariffs, quotas, trade barriers and other restrictions, enforcement of remedies in foreign jurisdictions and compliance with applicable foreign laws, and other economic and political uncertainties. All of these risks could result in increased costs or decreased revenues, which could adversely affect the Company’s financial results.
The Company may be adversely impacted if the Company is unable to protect information technology systems against, or effectively respond to, cyber-attacks or security breaches. Information technology systems are an important part of the Company’s business operations. Attempted cyber-attack and other cyber incidents are occurring more frequently and are being made by groups and individuals with a wide range of motives and expertise.
In addition, the Company is in the middle of a transformation project (Project Orion) to achieve better analytics, customer service, and process efficiencies through the use of Oracle Cloud Solutions. This project is expected to improve the efficiency and effectiveness of certain financial and business transaction processes and the underlying systems environment. Implementation is expected to occur in phases over the next several years, beginning in fiscal 2020. Such an implementation is a major undertaking from a financial, management, and personnel perspective. The implementation of the enterprise resource planning system may prove to be more difficult, costly, or time consuming than expected, and there can be no assurance that this system will be beneficial to the extent anticipated.
In an attempt to mitigate these risks, the Company has implemented and continues to evaluate security initiatives and business continuity plans.
Deterioration of labor relations or increases in labor costs could harm the Company’s Business. As of October 27, 2019, the Company had approximately 18,800 employees worldwide, of which approximately 3,310 were represented by labor unions, principally the United Food and Commercial Workers Union. A significant increase in labor costs or a deterioration of labor relations at any of the Company’s facilities or contracted hog processing facilities resulting in work slowdowns or stoppages could harm the Company’s financial results. The union contract at one of the Company's facilities will expire during fiscal 2020, covering less than 200 employees. Negotiations are expected to begin in December 2019.
Item 1B. UNRESOLVED STAFF COMMENTS
None.
9
Item 2. PROPERTIES
The Company's global headquarters are located in Austin, Minnesota. The Company has various processing plants, warehouses, and operational facilities, mainly in the states of Iowa, Minnesota, Illinois, and Wisconsin. The Company maintains a national sales force through strategic placement of sales offices throughout the United States. Properties are also maintained internationally to support global processing and sales. The majority of Company property is owned. Leased property is used as needed for Company production and sales. Property leases range in duration from one to twelve years.
Area* (Square feet) | Refrigerated Foods | Grocery Products | Jennie-O Turkey Store | International & Other | Corporate | Total | ||||||||||||
Processing Plants | 4,528,000 | 1,648,000 | 1,987,000 | 1,243,000 | 9,406,000 | |||||||||||||
Warehouse/Distribution Centers | 497,000 | 832,000 | 140,000 | 79,000 | 1,548,000 | |||||||||||||
Live Production | 815,000 | 313,000 | 1,128,000 | |||||||||||||||
Administrative/Sales/Research | 65,000 | 6,000 | 66,000 | 34,000 | 559,000 | 730,000 | ||||||||||||
Total | 5,905,000 | 2,486,000 | 2,506,000 | 1,356,000 | 559,000 | 12,812,000 | ||||||||||||
*Many of the Company’s properties are utilized by more than one segment. These facilities are reflected in the principal segment for presentation purposes. Additionally, turkey growout facilities are excluded.
The Company believes its operating facilities are well maintained and suitable for current production volumes. The Company regularly engages in construction and other capital improvement projects with a focus on value-added capacity projects and automation.
Item 3. LEGAL PROCEEDINGS
The Company is a party to various legal proceedings related to the ongoing operation of its business, including claims both by and against the Company. At any time, such proceedings typically involve claims related to product liability, intellectual property, contract disputes, wage and hour laws, employment practices, or other actions brought by employees, consumers, competitors, or suppliers. Resolution of any currently known matters, either individually or in the aggregate, is not expected to have a material effect on the Company’s financial condition, results of operations, or liquidity.
Item 4. MINE SAFETY DISCLOSURES
Not applicable.
10
PART II
Item 5. MARKET FOR REGISTRANT’S COMMON EQUITY, RELATED STOCKHOLDER MATTERS AND ISSUER PURCHASES OF EQUITY SECURITIES
Market information
Hormel Foods Corporation’s common stock is traded on the New York Stock Exchange under the symbol HRL. The CUSIP number is 440452100.
Holders
There are approximately 12,600 record stockholders and 136,000 stockholders whose shares are held in street name by brokerage firms and financial institutions.
There were no issuer purchases of equity securities in the fourth quarter of fiscal 2019. The maximum number of shares that may yet be purchased under the plans or programs as of October 27, 2019 is 4,758,235. On January 29, 2013, the Company's Board of Directors authorized the repurchase of 10,000,000 shares of its common stock with no expiration date. On January 26, 2016, the Board of Directors approved a two-for-one split of the Company’s common stock to be effective January 27, 2016. As part of the stock split resolution, the number of shares remaining to be repurchased was adjusted proportionately.
Dividends
The Company has paid dividends for 365 consecutive quarters. The annual dividend rate for fiscal 2020 was increased 11 percent percent to $0.93 per share, representing the 54th consecutive annual dividend increase. The Company is dedicated to returning excess cash flow to shareholders through dividend payments.
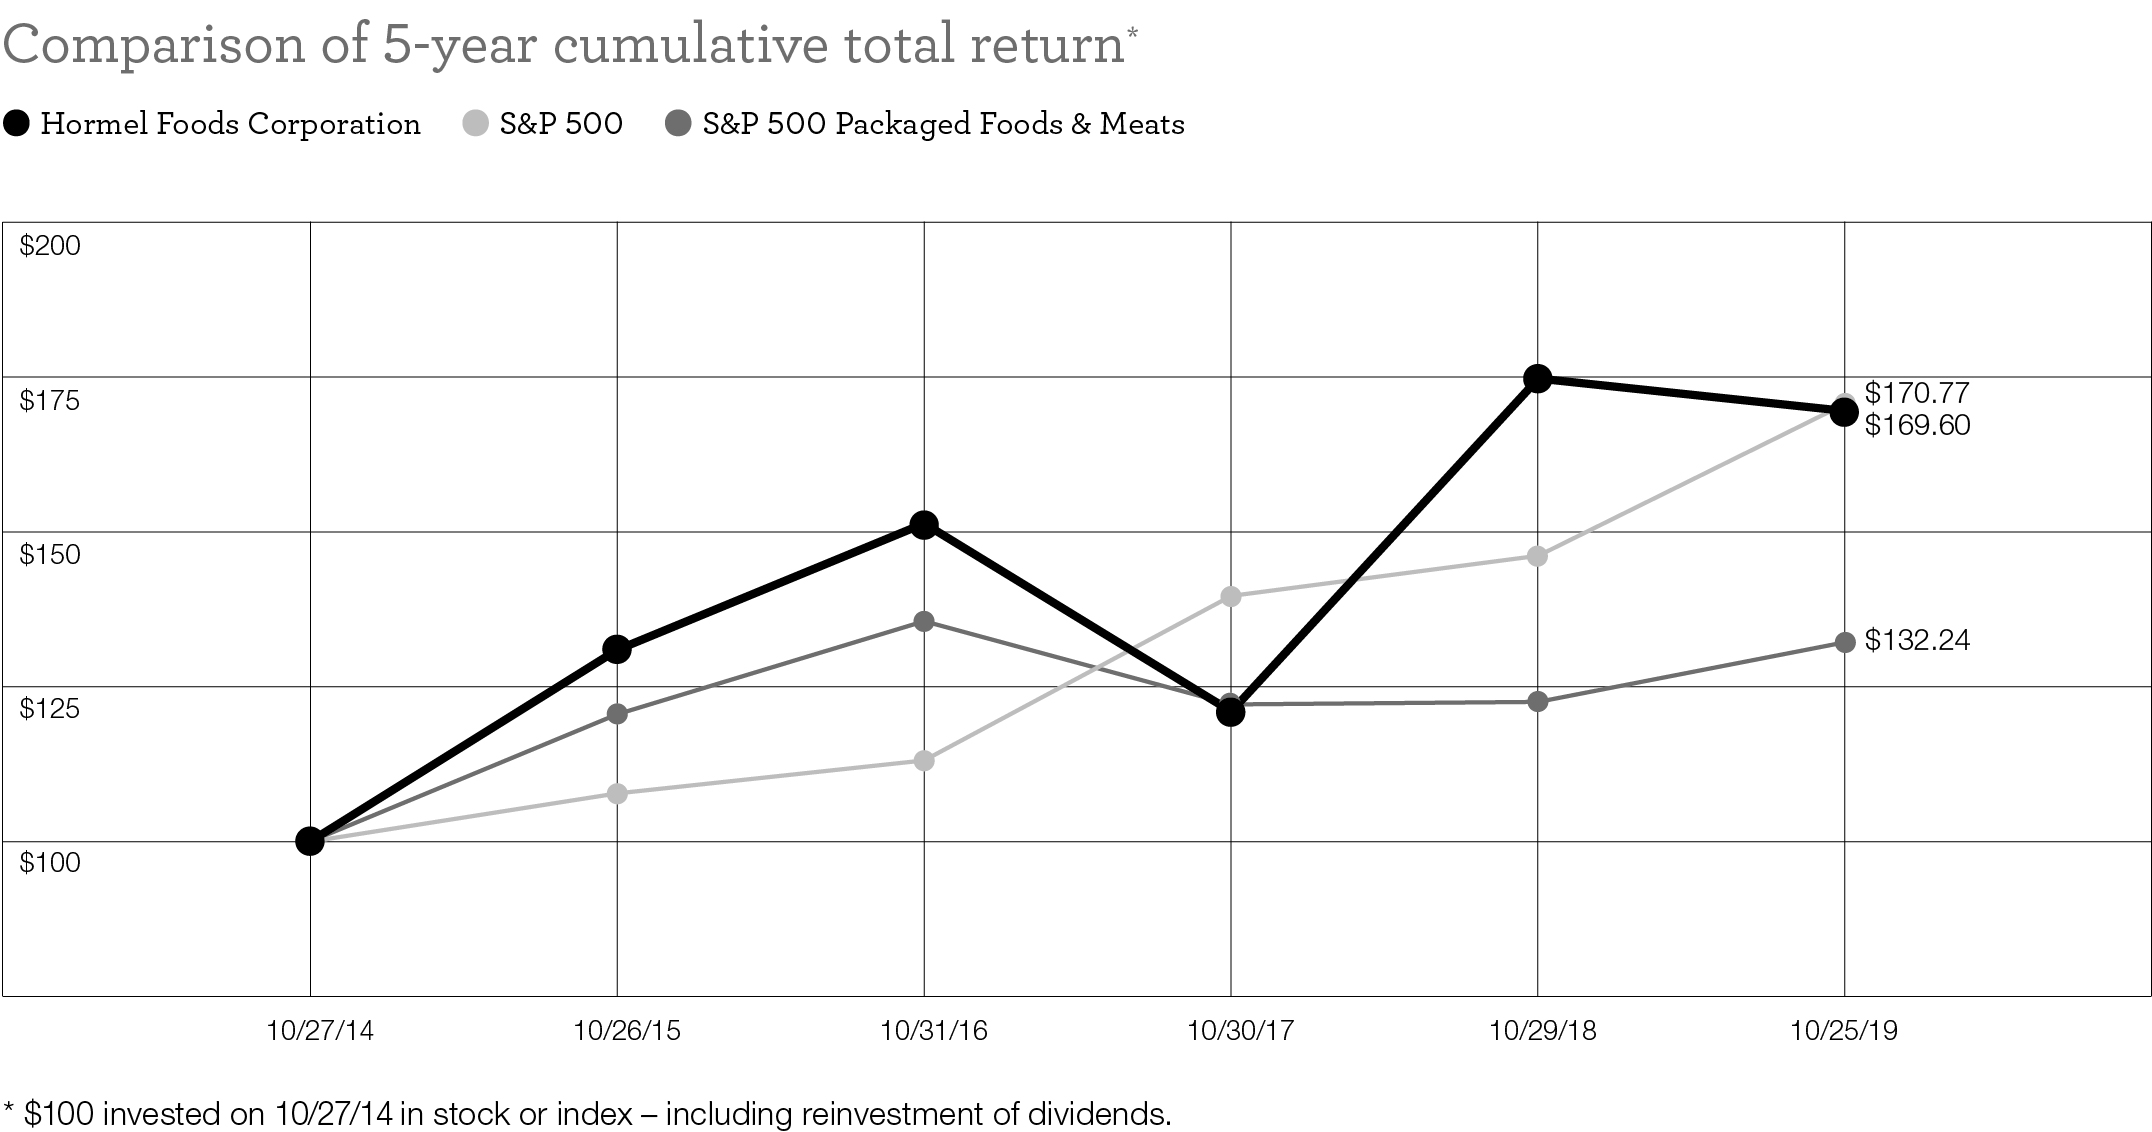
Shareholder return performance graph
The following graph shows a comparison of cumulative total shareholder return, calculated on a dividend-reinvested basis, for the Company, the S&P 500 Index, and the S&P 500 Packaged Foods & Meats Index for the five years ended October 27, 2019. The graph assumes $100 was invested in each, as of the market close on October 27, 2014. Note that historic stock price performance is not necessarily indicative of future stock price performance.
11
Item 6. SELECTED FINANCIAL DATA
The information set forth below for the five years ended October 27, 2019, is not necessarily indicative of results of future operations. To fully understand factors that may affect the comparability of the information presented below, this information should be read in conjunction with Part I-Item 1 Business, Part II-Item 7 Management’s Discussion and Analysis of Financial Condition and Results of Operations, and the consolidated financial statements and related notes thereto included in Part II-Item 8 Financial Statements and Supplementary Data of this Form 10-K.
(in thousands, except per share amounts) | 2019 | 2018 | 2017 | 2016* | 2015** | |||||||||||||||
Operations | ||||||||||||||||||||
Net Sales | $ | 9,497,317 | $ | 9,545,700 | $ | 9,167,519 | $ | 9,523,224 | $ | 9,263,863 | ||||||||||
Net Earnings Attributable to Hormel Foods Corporation | 978,806 | 1,012,140 | 846,735 | 890,052 | 686,088 | |||||||||||||||
% of net sales | 10.31 | % | 10.60 | % | 9.24 | % | 9.35 | % | 7.41 | % | ||||||||||
EBIT(1) | 1,195,923 | 1,179,519 | 1,276,374 | 1,312,918 | 1,055,612 | |||||||||||||||
% of net sales | 12.59 | % | 12.36 | % | 13.92 | % | 13.79 | % | 11.39 | % | ||||||||||
EBITDA(2) | 1,361,132 | 1,341,377 | 1,407,351 | 1,444,886 | 1,189,046 | |||||||||||||||
% of net sales | 14.33 | % | 14.05 | % | 15.35 | % | 15.17 | % | 12.84 | % | ||||||||||
Return on Invested Capital(3) | 15.63 | % | 16.24 | % | 16.30 | % | 18.89 | % | 15.47 | % | ||||||||||
Financial Position | ||||||||||||||||||||
Total Assets | $ | 8,109,004 | $ | 8,142,292 | $ | 6,975,908 | $ | 6,370,067 | $ | 6,139,831 | ||||||||||
Long-term Obligations, including capital leases | 269,713 | 624,840 | 250,000 | 250,000 | 250,000 | |||||||||||||||
Hormel Foods Corporation Shareholders’ Investment | 5,921,458 | 5,600,811 | 4,935,907 | 4,448,006 | 3,998,198 | |||||||||||||||
Cash Flows | ||||||||||||||||||||
Capital Expenditures | 293,838 | 389,607 | 221,286 | 255,524 | 144,063 | |||||||||||||||
Acquisitions of Businesses | — | 857,668 | 520,463 | 280,889 | 770,587 | |||||||||||||||
Proceeds from Sale of Business | 479,806 | — | 135,944 | 110,149 | — | |||||||||||||||
Share Repurchase | 174,246 | 46,898 | 94,487 | 87,885 | 24,928 | |||||||||||||||
Dividends Paid | 437,053 | 388,107 | 346,010 | 296,493 | 250,834 | |||||||||||||||
Common Stock | ||||||||||||||||||||
Weighted-Average Shares Outstanding – Basic | 534,578 | 530,742 | 528,363 | 529,290 | 528,143 | |||||||||||||||
Weighted-Average Shares Outstanding – Diluted | 545,232 | 543,869 | 539,116 | 542,473 | 541,002 | |||||||||||||||
Earnings Per Share – Basic | $ | 1.83 | $ | 1.91 | $ | 1.60 | $ | 1.68 | $ | 1.30 | ||||||||||
Earnings Per Share – Diluted | 1.80 | 1.86 | 1.57 | 1.64 | 1.27 | |||||||||||||||
Dividends Declared per Share | 0.84 | 0.75 | 0.68 | 0.58 | 0.50 | |||||||||||||||
Hormel Foods Corporation Shareholders’ Investment per Share | 11.08 | 10.49 | 9.34 | 8.42 | 7.57 | |||||||||||||||
The Company provides EBIT, EBITDA, and Return on Invested Capital because these measures are useful to management and investors as indicators of operating strength relative to prior years and are commonly used to benchmark the Company’s performance. These measures are calculated as follows:
(in thousands) | 2019 | 2018 | 2017 | 2016* | 2015** | |||||||||||||||
(1) EBIT: | ||||||||||||||||||||
Net Earnings Attributable to Hormel Foods Corporation | $ | 978,806 | $ | 1,012,140 | $ | 846,735 | $ | 890,052 | $ | 686,088 | ||||||||||
Plus: Income Tax Expense | 230,567 | 168,702 | 431,542 | 426,698 | 369,879 | |||||||||||||||
Plus: Interest Expense | 18,070 | 26,494 | 12,683 | 12,871 | 13,111 | |||||||||||||||
Less: Interest and Investment Income*** | 31,520 | 27,817 | 14,586 | 16,703 | 13,466 | |||||||||||||||
EBIT | $ | 1,195,923 | $ | 1,179,519 | $ | 1,276,374 | $ | 1,312,918 | $ | 1,055,612 | ||||||||||
(2) EBITDA: | ||||||||||||||||||||
EBIT per (1) above | 1,195,923 | 1,179,519 | 1,276,374 | 1,312,918 | 1,055,612 | |||||||||||||||
Plus: Depreciation and Amortization | 165,209 | 161,858 | 130,977 | 131,968 | 133,434 | |||||||||||||||
EBITDA | $ | 1,361,132 | $ | 1,341,377 | $ | 1,407,351 | $ | 1,444,886 | $ | 1,189,046 | ||||||||||
(3) Return on Invested Capital: | ||||||||||||||||||||
EBIT per (1) above | 1,195,923 | 1,179,519 | 1,276,374 | 1,312,918 | 1,055,612 | |||||||||||||||
X (1 – Effective Tax Rate****) | 80.93 | % | 85.71 | % | 66.24 | % | 67.59 | % | 64.97 | % | ||||||||||
After-tax EBIT | $ | 967,860 | $ | 1,010,966 | $ | 845,470 | $ | 887,401 | $ | 685,831 | ||||||||||
Divided by: | ||||||||||||||||||||
Total Debt, including capital leases | 269,713 | 624,840 | 250,000 | 250,000 | 435,000 | |||||||||||||||
Hormel Foods Corporation Shareholders’ Investment | 5,921,458 | 5,600,811 | 4,935,907 | 4,448,006 | 3,998,198 | |||||||||||||||
Total Debt and Shareholders’ Investment | $ | 6,191,171 | $ | 6,225,651 | $ | 5,185,907 | $ | 4,698,006 | $ | 4,433,198 | ||||||||||
Return on Invested Capital | 15.63 | % | 16.24 | % | 16.30 | % | 18.89 | % | 15.47 | % | ||||||||||
* Fiscal 2016 included 53 weeks.
** Shares and per share figures have been restated to reflect the two-for-one stock split distributed on February 9, 2016.
*** Adjusted due to the adoption of Accounting Standards Update (ASU) 2017-07, Compensation - Retirement Benefits: Improving the Presentation of Net Periodic Pension Cost and Net Periodic Postretirement Benefit Cost (Topic 715). See Note A - Summary of Significant Accounting Policies.
**** Excluding earnings attributable to noncontrolling interests.
12
Item 7. MANAGEMENT’S DISCUSSION AND ANALYSIS OF FINANCIAL CONDITION
AND RESULTS OF OPERATIONS
Executive Overview
Fiscal 2019: Sales for the year were $9.5 billion, a 1 percent decline from last year. Sales decreased primarily due to the divestiture of CytoSport. Organic net sales1 were up 1 percent. (1See explanation of non-GAAP financial measures in the Consolidated Results section). Pretax earnings increased 2 percent to $1,209.7 million. Profit growth from the value-added businesses in Refrigerated Foods and lower selling, general and administrative expenses more than offset a significant decline in commodity profits and lower equity in earnings of affiliates. A higher effective tax rate drove net earnings attributable to the Company lower by 3 percent to $978.8 million, compared to net earnings of $1,012.1 million last year. The effective tax rate in fiscal 2019 increased primarily due to the impact of the Tax Cuts and Jobs Act (Tax Act) recognized in fiscal 2018. Diluted earnings per share for fiscal 2019 were $1.80, a 3 percent decrease compared to $1.86 per share last year.
Refrigerated Foods segment results exceeded last year due to growth from the value-added businesses, including strong results from foodservice products such as Hormel® FirebraisedTM meats and pizza toppings. Retail sales of Hormel® Black Label® convenience bacon and Columbus® deli items also contributed to overall growth, helping to offset a significant decline in commodity profits. The Jennie-O Turkey Store segment was negatively impacted by lost retail distribution due to two voluntary product recalls in the first quarter of fiscal 2019 and low commodity prices resulting from continued industry oversupply. Grocery Products segment financial performance was down due to lower Skippy® peanut butter pricing and a reduction in MegaMex Foods, LLC (MegaMex) equity in earnings compared to fiscal 2018. International & Other segment results declined primarily by the impact of tariffs and global trade uncertainty affecting fresh pork exports.
Our Company continued to reinvest into the business through capital expenditures while returning cash back to shareholders in the form of dividends and share repurchases. Capital expenditures were $293.8 million in fiscal 2019. Notable projects included the preliminary phases of the Burke pizza toppings plant expansion, a new dry sausage facility in Nebraska, Project Orion, and many other items to support growth of branded products. The annual dividend for 2020 will be $0.93 per share and marks the 54th consecutive year of dividend increases, representing an increase of 11 percent after a 12 percent increase in fiscal 2019. We repurchased 4.3 million shares of common stock in fiscal 2019, spending $174.2 million.
In December, the Company completed the sale of its Fremont, Nebraska, processing facility to Wholestone Farms, LLC, for $30.6 million. Additionally, in April, the Company completed the sale of its CytoSport business to PepsiCo, Inc., for $479.8 million.
Fiscal 2020 Outlook: We expect to grow sales and pretax profits in fiscal 2020. Our branded, value-added businesses within Refrigerated Foods continue to be well-positioned for growth in the foodservice, retail, and deli channels. Positive momentum in brands such as Hormel® Bacon 1TM, Hormel® Natural Choice®, Applegate®, Columbus® and Hormel® Fire BraisedTM should help mitigate the risk of higher input prices and volatility due to African swine fever. Operational improvements, continued industry recovery, and regained lean ground turkey distribution at Jennie-O Turkey Store are expected to return the segment to growth. The International & Other segment plans to grow sales and earnings while managing through challenges due to African swine fever and global trade uncertainty. We expect contributions from branded items such as the SPAM® family of products, Wholly® guacamole dips, Herdez® salsas and sauces, and Skippy® peanut butter to help offset the impact of the CytoSport sale to the Grocery Products segment in fiscal 2019. Additionally, we expect continued cost reductions from our supply chain organization and will begin implementation of Project Orion during fiscal 2020.
We plan to support our numerous iconic brands with continued advertising in fiscal 2020. Strong cash flow, along with a solid balance sheet, will enable us to continue to return cash to shareholders while investing capital into our value-added businesses. We will open a new $150 million expansion at our Burke facility in the third quarter of fiscal 2020, which will provide much needed capacity to grow our pizza toppings business in foodservice.
Results of Operations
OVERVIEW
The Company is a processor of branded and unbranded food products for retail, foodservice, deli, and commercial customers. At the beginning of fiscal 2019, the Hormel Deli Solutions division combined all deli businesses, including the Jennie-O Turkey Store deli division, into one division within the Refrigerated Foods segment. In addition, the ingredients business was realigned from the Grocery Products segment to the Refrigerated Foods segment. Periods presented herein have been recast to reflect this change. Periods presented have also been adjusted due to the adoption of Accounting Standards Update (ASU) 2017-07, Compensation - Retirement Benefits: Improving the Presentation of Net Periodic Pension Cost and Net Periodic Postretirement Benefit Cost (Topic 715). See Note A - Summary of Significant Accounting Policies for more information.
13
The Company operates in the following four reportable segments:
Segment | Business Conducted |
Grocery Products | This segment consists primarily of the processing, marketing, and sale of shelf-stable food products sold predominantly in the retail market, along with the sale of nutritional and private label shelf-stable products to retail, foodservice, and industrial customers. This segment also includes the results from the Company’s MegaMex Foods, LLC (MegaMex) joint venture. |
Refrigerated Foods | This segment consists primarily of the processing, marketing, and sale of branded and unbranded pork, beef, chicken, and turkey products for retail, foodservice, deli, and commercial customers. |
Jennie-O Turkey Store | This segment consists primarily of the processing, marketing, and sale of branded and unbranded turkey products for retail, foodservice, and commercial customers. |
International & Other | This segment includes Hormel Foods International, which manufactures, markets, and sells Company products internationally. This segment also includes the results from the Company’s international joint ventures and royalty arrangements. |
The Company’s fiscal year consisted of 52 weeks in fiscal years 2019, 2018, and 2017.
FISCAL YEARS 2019 AND 2018
CONSOLIDATED RESULTS
Net Earnings and Diluted Earnings Per Share
Fourth Quarter Ended | Year Ended | |||||||||||||||||||||
(in thousands, except per share amounts) | October 27, 2019 | October 28, 2018 | % Change | October 27, 2019 | October 28, 2018 | % Change | ||||||||||||||||
Net Earnings | $ | 255,503 | $ | 261,406 | (2.3 | ) | $ | 978,806 | $ | 1,012,140 | (3.3 | ) | ||||||||||
Diluted Earnings Per Share | 0.47 | 0.48 | (2.1 | ) | 1.80 | 1.86 | (3.2 | ) | ||||||||||||||
Volume and Net Sales
Fourth Quarter Ended | Year Ended | |||||||||||||||||||||
(in thousands) | October 27, 2019 | October 28, 2018 | % Change | October 27, 2019 | October 28, 2018 | % Change | ||||||||||||||||
Volume (lbs.) | 1,236,877 | 1,265,292 | (2.2 | ) | 4,737,281 | 4,798,178 | (1.3 | ) | ||||||||||||||
Organic Volume(1) | 1,236,877 | 1,226,641 | 0.8 | 4,737,281 | 4,721,637 | 0.3 | ||||||||||||||||
Net Sales | $ | 2,501,513 | $ | 2,524,697 | (0.9 | ) | $ | 9,497,317 | $ | 9,545,700 | (0.5 | ) | ||||||||||
Organic Net Sales(1) | 2,501,513 | 2,451,049 | 2.1 | 9,497,317 | 9,399,603 | 1.0 | ||||||||||||||||
(1) COMPARISON OF U.S. GAAP TO NON-GAAP FINANCIAL MEASUREMENTS
The non-GAAP adjusted financial measurements of organic volume and organic net sales are presented to provide investors additional information to facilitate the comparison of past and present operations. The Company believes these non-GAAP financial measurements provide useful information to investors because they are the measurements used to evaluate performance on a comparable year-over-year basis. Non-GAAP measurements are not intended to be a substitute for U.S. GAAP measurements in analyzing financial performance. These non-GAAP measurements are not in accordance with generally accepted accounting principles and may be different from non-GAAP measures used by other companies.
Organic net sales and organic volume are defined as net sales and volume excluding the impact of acquisitions and divestitures. Organic net sales and organic volume exclude the impacts of the CytoSport divestiture (April 2019) in the Grocery Products and International & Other segments. The tables below show the calculations to reconcile from the GAAP measures to the non-GAAP adjusted measures in the fourth quarter and year-to-date of fiscal 2019 and fiscal 2018.
14
Reconciliation of Non-GAAP Measures
4th Quarter
Volume (lbs.)
FY19 | FY 2018 | ||||||||||||||
(in thousands) | Reported (GAAP) | Reported (GAAP) | Divestitures | Organic (Non-GAAP) | Organic % change | ||||||||||
Grocery Products | 313,489 | 346,214 | (37,394 | ) | 308,820 | 1.5 | |||||||||
Refrigerated Foods | 598,474 | 592,298 | — | 592,298 | 1.0 | ||||||||||
Jennie-O Turkey Store | 242,421 | 231,180 | — | 231,180 | 4.9 | ||||||||||
International & Other | 82,493 | 95,600 | (1,257 | ) | 94,343 | (12.6 | ) | ||||||||
Total Volume | 1,236,877 | 1,265,292 | (38,651 | ) | 1,226,641 | 0.8 | |||||||||
Net Sales
FY 2019 | FY 2018 | ||||||||||||||||||
(in thousands) | Reported (GAAP) | Reported (GAAP) | Divestitures | Organic (Non-GAAP) | Organic % change | ||||||||||||||
Grocery Products | $ | 584,085 | $ | 648,244 | $ | (71,415 | ) | $ | 576,829 | 1.3 | |||||||||
Refrigerated Foods | 1,373,009 | 1,321,784 | — | 1,321,784 | 3.9 | ||||||||||||||
Jennie-O Turkey Store | 398,512 | 388,278 | — | 388,278 | 2.6 | ||||||||||||||
International & Other | 145,907 | 166,391 | (2,233 | ) | 164,158 | (11.1 | ) | ||||||||||||
Total Net Sales | $ | 2,501,513 | $ | 2,524,697 | $ | (73,648 | ) | $ | 2,451,049 | 2.1 | |||||||||
Full Year
Volume (lbs.)
FY 2019 | FY 2018 | ||||||||||||||
(in thousands) | Reported (GAAP) | Reported (GAAP) | Divestitures | Organic (Non-GAAP) | Organic % change | ||||||||||
Grocery Products | 1,283,492 | 1,328,693 | (73,915 | ) | 1,254,778 | 2.3 | |||||||||
Refrigerated Foods | 2,325,156 | 2,327,140 | — | 2,327,140 | (0.1 | ) | |||||||||
Jennie-O Turkey Store | 789,337 | 784,655 | — | 784,655 | 0.6 | ||||||||||
International & Other | 339,296 | 357,690 | (2,626 | ) | 355,064 | (4.4 | ) | ||||||||
Total Volume | 4,737,281 | 4,798,178 | (76,541 | ) | 4,721,637 | 0.3 | |||||||||
Net Sales
FY 2019 | FY 2018 | ||||||||||||||||||
(in thousands) | Reported (GAAP) | Reported (GAAP) | Divestitures | Organic (Non-GAAP) | Organic % change | ||||||||||||||
Grocery Products | $ | 2,369,317 | $ | 2,480,367 | $ | (141,401 | ) | $ | 2,338,966 | 1.3 | |||||||||
Refrigerated Foods | 5,210,741 | 5,109,881 | — | 5,109,881 | 2.0 | ||||||||||||||
Jennie-O Turkey Store | 1,323,783 | 1,331,013 | — | 1,331,013 | (0.5 | ) | |||||||||||||
International & Other | 593,476 | 624,439 | (4,696 | ) | 619,743 | (4.2 | ) | ||||||||||||
Total Net Sales | $ | 9,497,317 | $ | 9,545,700 | $ | (146,097 | ) | $ | 9,399,603 | 1.0 | |||||||||
The decrease in net sales for the fourth quarter of fiscal 2019 was related primarily to the divestiture of CytoSport. Organic net sales increased 2 percent as increased sales of whole-bird and commodity business at Jennie-O Turkey Store, Hormel® Black Label® bacon, the SPAM® family of products, and Hormel® Bacon 1TM cooked bacon more than offset lower retail sales at Jennie-O Turkey Store and lower sales of Skippy® peanut butter.
For fiscal 2019, the decrease in net sales was related primarily to the divestiture of CytoSport. Organic net sales grew 1 percent over last year driven by strong value-added sales in Refrigerated Foods, led by Hormel® Bacon 1TM cooked bacon, Hormel® Fire BraisedTM products, and Hormel® Natural Choice® items, despite weak retail sales of Jennie-O Turkey Store products and declines in international pork exports.
In fiscal 2020, the Company expects net sales growth with contributions from value-added products and innovation. Momentum in Refrigerated Foods across the foodservice and retail channels is expected to continue, with meaningful growth coming from brands such as Hormel® Natural Choice®, Applegate®, Hormel® Bacon 1TM, and Hormel® Fire BraisedTM. The deli division is expected to continue to grow the Columbus® brand. The International & Other segment plans to show growth in China, Brazil, and through increased branded export sales of SPAM® luncheon meat and Skippy® peanut butter. Jennie-O Turkey Store is expecting sales growth due to increases in turkey commodity markets and regained distribution of Jennie-O® branded products. Growth from products such as Wholly® guacamole dips, Herdez® salsas and sauces, the SPAM® family of products, and Skippy® P.B. and Jelly Minis in the Grocery Products segment should offset the impact of the CytoSport divestiture.
15
Cost of Products Sold
Fourth Quarter Ended | Year Ended | |||||||||||||||||||
October 27, | October 28, | October 27, | October 28, | |||||||||||||||||
(in thousands) | 2019 | 2018 | % Change | 2019 | 2018 | % Change | ||||||||||||||
Cost of Products Sold | $ | 2,007,790 | $ | 1,991,369 | 0.8 | $ | 7,612,669 | $ | 7,566,227 | 0.6 | ||||||||||
Cost of products sold for the fourth quarter and full year increased as higher raw material and operational costs more than offset the impact from the divestiture of CytoSport and supply chain cost savings.
Gross Profit
Fourth Quarter Ended | Year Ended | |||||||||||||||||||||
October 27, | October 28, | October 27, | October 28, | |||||||||||||||||||
(in thousands) | 2019 | 2018 | % Change | 2019 | 2018 | % Change | ||||||||||||||||
Gross Profit | $ | 493,723 | $ | 533,328 | (7.4 | ) | $ | 1,884,648 | $ | 1,979,473 | (4.8 | ) | ||||||||||
Percentage of Net Sales | 19.7 | % | 21.1 | % | 19.8 | % | 20.7 | % | ||||||||||||||
Consolidated gross profit as a percentage of net sales declined in the fourth quarter due to reduced commodity profitability in Refrigerated Foods and weaker margins for the International & Other segment. For the full year, reduced commodity profitability in Refrigerated Foods, weaker sales mix at Jennie-O Turkey Store, and lower Skippy® peanut butter pricing in Grocery Products drove the decline in gross profit as a percentage of net sales.
In fiscal 2020, protein input costs are expected to be higher and demonstrate volatility. This could negatively impact the Refrigerated Foods, Grocery Products, and International & Other segments until pricing can be passed through. Positive mix shift and, higher pricing, if necessary, are expected to mitigate higher input costs. Jennie-O Turkey Store should benefit from improvements to operations, higher commodity markets, and improved sales mix. The global trade environment, potential impact of African swine fever, and market volatility pose the largest threats to the Company's profitability.
Selling, General and Administrative (SG&A)
Fourth Quarter Ended | Year Ended | |||||||||||||||||||||
October 27, | October 28, | October 27, | October 28, | |||||||||||||||||||
(in thousands) | 2019 | 2018 | % Change | 2019 | 2018 | % Change | ||||||||||||||||
SG&A | $ | 183,795 | $ | 205,287 | (10.5 | ) | $ | 727,584 | $ | 841,205 | (13.5 | ) | ||||||||||
Percentage of Net Sales | 7.3 | % | 8.1 | % | 7.7 | % | 8.8 | % | ||||||||||||||
For the fourth quarter of fiscal 2019, SG&A expenses decreased primarily due to the CytoSport divestiture. For fiscal 2019, SG&A expenses declined due to the impacts from the CytoSport divestiture and a legal settlement. Selling expenses were also favorable compared to fiscal 2018.
Due to the CytoSport divestiture, advertising investments in the fourth quarter and full year declined.
In fiscal 2020, the Company intends to continue building brand awareness through advertising investments in key brands such as Hormel® Natural Choice®, Hormel® Black Label®, SPAM®, Skippy®, Wholly®, Herdez®, and Jennie-O®.
Research and development continues to be a vital part of the Company's strategy to extend existing brands and expand into new branded items. Research and development expenses were $8.4 million and $32.5 million for the fiscal 2019 fourth quarter and year, respectively, compared to $8.7 million and $33.8 million for the corresponding periods in fiscal 2018.
Goodwill/Intangible Impairment
An impairment charge related to the CytoSport trademark totaling $17.3 million was recorded in the fourth quarter of fiscal 2018.
Equity in Earnings of Affiliates
Fourth Quarter Ended | Year Ended | ||||||||||||||||||||
October 27, | October 28, | October 27, | October 28, | ||||||||||||||||||
(in thousands) | 2019 | 2018 | % Change | 2019 | 2018 | % Change | |||||||||||||||
Equity in Earnings of Affiliates | $ | 11,068 | $ | 8,814 | 25.6 | $ | 39,201 | $ | 58,972 | (33.5 | ) | ||||||||||
Results for the fourth quarter increased due to improved results from MegaMex. For fiscal 2019, equity in earnings of affiliates was lower due to significantly higher avocado costs negatively impacting MegaMex earnings in the third quarter of 2019 and the effect of a non-operating tax benefit recognized in the first quarter of fiscal 2018.
16
The Company accounts for its majority-owned operations under the consolidation method. Investments in which the Company owns a minority interest, and for which there are no other indicators of control, are accounted for under the equity or cost method. These investments, along with receivables from other affiliates, are included in the Consolidated Statements of Financial Position as investments in and receivables from affiliates. The composition of this line item at October 27, 2019, was as follows:
(in thousands) | Investments/Receivables | ||
Country | |||
United States | $ | 218,592 | |
Foreign | 70,565 | ||
Total | $ | 289,157 | |
Effective Tax Rate
Fourth Quarter Ended | Year Ended | |||||||||||
October 27, | October 28, | October 27, | October 28, | |||||||||
2019 | 2018 | 2019 | 2018 | |||||||||
Effective Tax Rate | 21.0 | % | 18.7 | % | 19.1 | % | 14.3 | % | ||||
The effective tax rate for both the fourth quarter and fiscal year reflects the impact of The Tax Cuts and Jobs Act, signed into law on December 22, 2017. Fiscal 2018 included a net tax benefit of $72.9 million representing a benefit of $81.2 million from re-measuring the Company’s net U.S. deferred tax liabilities, partially offset by the Company’s accrual for the transition tax and other U.S. tax law changes of $8.3 million. In addition to tax reform, the tax impacts of the CytoSport divestiture and stock-based compensation were the main drivers of the Company's fiscal 2019 effective tax rates for the fourth quarter and fiscal year compared to the prior year. For additional information, refer to Note K - Income Taxes.
The Company expects the effective tax rate in fiscal 2020 to be between 20.5 and 22.5 percent.
SEGMENT RESULTS
Net sales and operating profits for each of the Company’s reportable segments are set forth below. The Company is an integrated enterprise, characterized by substantial intersegment cooperation, cost allocations, and sharing of assets. Therefore, the Company does not represent that these segments, if operated independently, would report the operating profit and other financial information shown below. Additional segment financial information can be found in Note P - Segment Reporting.
Fourth Quarter Ended | Year Ended | |||||||||||||||||||||
October 27, | October 28, | October 27, | October 28, | |||||||||||||||||||
(in thousands) | 2019 | 2018 | % Change | 2019 | 2018 | % Change | ||||||||||||||||
Net Sales | ||||||||||||||||||||||
Grocery Products | $ | 584,085 | $ | 648,244 | (9.9 | ) | $ | 2,369,317 | $ | 2,480,367 | (4.5 | ) | ||||||||||
Refrigerated Foods | 1,373,009 | 1,321,784 | 3.9 | 5,210,741 | 5,109,881 | 2.0 | ||||||||||||||||
Jennie-O Turkey Store | 398,512 | 388,278 | 2.6 | 1,323,783 | 1,331,013 | (0.5 | ) | |||||||||||||||
International & Other | 145,907 | 166,391 | (12.3 | ) | 593,476 | 624,439 | (5.0 | ) | ||||||||||||||
Total Net Sales | $ | 2,501,513 | $ | 2,524,697 | (0.9 | ) | $ | 9,497,317 | $ | 9,545,700 | (0.5 | ) | ||||||||||
Segment Profit | ||||||||||||||||||||||
Grocery Products | $ | 80,923 | $ | 79,082 | 2.3 | $ | 339,497 | $ | 353,266 | (3.9 | ) | |||||||||||
Refrigerated Foods | 189,287 | 194,573 | (2.7 | ) | 681,763 | 670,948 | 1.6 | |||||||||||||||
Jennie-O Turkey Store | 41,031 | 38,744 | 5.9 | 117,962 | 131,846 | (10.5 | ) | |||||||||||||||
International & Other | 17,455 | 24,802 | (29.6 | ) | 75,513 | 88,953 | (15.1 | ) | ||||||||||||||
Total Segment Profit | 328,696 | 337,201 | (2.5 | ) | 1,214,735 | 1,245,013 | (2.4 | ) | ||||||||||||||
Net Unallocated Expense | 5,065 | 15,787 | 67.9 | 5,362 | 64,171 | (91.6 | ) | |||||||||||||||
Noncontrolling Interest | 63 | 90 | (30.0 | ) | 342 | 442 | (22.6 | ) | ||||||||||||||
Earnings Before Income Taxes | $ | 323,694 | $ | 321,504 | 0.7 | $ | 1,209,715 | $ | 1,181,284 | 2.4 | ||||||||||||
17
Grocery Products
Fourth Quarter Ended | Year Ended | |||||||||||||||||||||
October 27, | October 28, | October 27, | October 28, | |||||||||||||||||||
(in thousands) | 2019 | 2018 | % Change | 2019 | 2018 | % Change | ||||||||||||||||
Volume (lbs.) | 313,489 | 346,214 | (9.5 | ) | 1,283,492 | 1,328,693 | (3.4 | ) | ||||||||||||||
Net Sales | $ | 584,085 | $ | 648,244 | (9.9 | ) | $ | 2,369,317 | $ | 2,480,367 | (4.5 | ) | ||||||||||
Segment Profit | 80,923 | 79,082 | 2.3 | 339,497 | 353,266 | (3.9 | ) | |||||||||||||||
Net sales increases in the fourth quarter of MegaMex items, including Don Miguel® branded items and Herdez® salsas and sauces, and from the SPAM® family of products were unable to offset the impact of the CytoSport divestiture and lower Skippy® peanut butter sales. For fiscal 2019, net sales declined due to the CytoSport divestiture.
Segment profit for the fourth quarter improved due to positive performances from the center store portfolio and MegaMex joint venture which offset lower pricing on Skippy® peanut butter spreads and the divestiture of CytoSport. The segment incurred a $17.3 million non-cash impairment in the fourth quarter of 2018 related to the CytoSport business. For fiscal year 2019, segment profit decreased as a result of lower Skippy® peanut butter pricing and declines in MegaMex earnings.
Looking ahead to fiscal 2020, the Company anticipates continued positive momentum from MegaMex, including Herdez® salsas and sauces and Wholly® guacamole dips, the center store portfolio, including the SPAM® family of products, and improvement from Skippy® peanut butter. These positive catalysts should help to partially offset the impact of the CytoSport divestiture.
Refrigerated Foods
Fourth Quarter Ended | Year Ended | |||||||||||||||||||||
October 27, | October 28, | October 27, | October 28, | |||||||||||||||||||
(in thousands) | 2019 | 2018 | % Change | 2019 | 2018 | % Change | ||||||||||||||||
Volume (lbs.) | 598,474 | 592,298 | 1.0 | 2,325,156 | 2,327,140 | (0.1 | ) | |||||||||||||||
Net Sales | $ | 1,373,009 | $ | 1,321,784 | 3.9 | $ | 5,210,741 | $ | 5,109,881 | 2.0 | ||||||||||||
Segment Profit | 189,287 | 194,573 | (2.7 | ) | 681,763 | 670,948 | 1.6 | |||||||||||||||
Volume and sales increased for the fourth quarter on strong demand for foodservice items such as Hormel® Bacon 1TM cooked bacon, pizza toppings, and Hormel® Fire BraisedTM products. Retail sales of Hormel® Black Label® bacon, Applegate® products, Hormel® Natural Choice® products, Hormel Gatherings® party trays, and Columbus® branded deli items also contributed to the increase. For fiscal 2019, the value-added businesses drove growth, including foodservice brands such as Hormel® FirebraisedTM and Hormel® Natural Choice®, Hormel® Black Label® retail convenience bacon, and Columbus® branded deli items.
Segment profit declined for the fourth quarter as record value-added profits did not offset a 46 percent decline in commodity profits and higher operational expenses. For the full year, segment profit increased as value-added profit growth more than offset a significant decline in commodity profits.
In fiscal 2020, the Company anticipates value-added sales and profit growth in the foodservice, retail, and deli channels. Pork markets are expected to be volatile and pork input costs are expected to be higher due to the impact of African swine fever. This could lead to short-term periods of margin expansion or compression.
Jennie-O Turkey Store
Fourth Quarter Ended | Year Ended | ||||||||||||||||||||
October 27, | October 30, | October 27, | October 30, | ||||||||||||||||||
(in thousands) | 2019 | 2018 | % Change | 2019 | 2018 | % Change | |||||||||||||||
Volume (lbs.) | 242,421 | 231,180 | 4.9 | 789,337 | 784,655 | 0.6 | |||||||||||||||
Net Sales | $ | 398,512 | $ | 388,278 | 2.6 | $ | 1,323,783 | $ | 1,331,013 | (0.5 | ) | ||||||||||
Segment Profit | 41,031 | 38,744 | 5.9 | 117,962 | 131,846 | (10.5 | ) | ||||||||||||||
For the fourth quarter, volume and sales increased as growth from the whole-bird and commodity businesses more than offset lower retail sales. Jennie-O® lean ground turkey results improved during the fourth quarter due to the successful execution of advertising and promotional activities in select markets. Net sales for fiscal 2019 declined, as improved commodity and whole-bird sales did not offset a decline in retail sales.
Segment profit for the fourth quarter increased, driven by operational improvements and lower freight expense. For fiscal 2019, lower retail sales, higher-than-expected plant startup expenses, and higher feed costs negatively impacted profitability.
Jennie-O Turkey Store expects operational improvements, continued industry recovery, and regained lean ground turkey distribution to return the segment to growth in 2020.
18
International & Other
Fourth Quarter Ended | Year Ended | |||||||||||||||||||||
October 27, | October 28, | October 27, | October 28, | |||||||||||||||||||
(in thousands) | 2019 | 2018 | % Change | 2019 | 2018 | % Change | ||||||||||||||||
Volume (lbs.) | 82,493 | 95,600 | (13.7 | ) | 339,296 | 357,690 | (5.1 | ) | ||||||||||||||
Net Sales | $ | 145,907 | $ | 166,391 | (12.3 | ) | $ | 593,476 | $ | 624,439 | (5.0 | ) | ||||||||||
Segment Profit | 17,455 | 24,802 | (29.6 | ) | 75,513 | 88,953 | (15.1 | ) | ||||||||||||||
Volume, sales, and profit for the fourth quarter of 2019 declined significantly driven by weakness in branded and fresh pork exports and the Company's multinational business in Brazil. Higher pork prices due to African swine fever led to higher input costs in China and Brazil.
For fiscal 2019, volume, sales, and segment profit declined due to weak fresh pork exports which were impact by tariffs and global trade uncertainty. This more than offset strong results from the China business.
Looking ahead to 2020, the International & Other segment anticipates volume, sales, and earnings growth driven by branded exports. Cost inflation in China and Brazil as well as global trade uncertainty remain a risk.
Unallocated Income and Expense
The Company does not allocate investment income, interest expense, or interest income to its segments when measuring performance. The Company also retains various other income and unallocated expenses at the corporate level. Equity in Earnings of Affiliates is included in segment profit; however, earnings attributable to the Company’s noncontrolling interests are excluded. These items are included in the segment table for the purpose of reconciling segment results to Earnings Before Income Taxes.
Fourth Quarter Ended | Year Ended | |||||||||||
October 27, | October 28, | October 27, | October 28, | |||||||||
(in thousands) | 2019 | 2018 | 2019 | 2018 | ||||||||
Net Unallocated Expense | 5,065 | 15,787 | 5,362 | 64,171 | ||||||||
Noncontrolling Interest | 63 | 90 | 342 | 442 | ||||||||
Net Unallocated Expense was lower for the fourth quarter due to lower employee related and interest expenses. Net Unallocated Expense for fiscal 2019 decreased due to a one-time gain resulting from the CytoSport divestiture, lower selling and employee-related expenses, and the benefit from a legal settlement.
FISCAL YEARS 2018 AND 2017
Periods presented have been adjusted due to the adoption of Accounting Standards Update (ASU) 2017-07, Compensation - Retirement Benefits: Improving the Presentation of Net Periodic Pension Cost and Net Periodic Postretirement Benefit Cost (Topic 715). See Note A - Summary of Significant Accounting Policies for more information.
Periods presented also reflect the segment reorganization announced at the beginning of fiscal 2019, which moved the Jennie-O Turkey Store deli division from the Jennie-O Turkey Store segment and the ingredients business from the Grocery Products segment to the Refrigerated Foods segment.
CONSOLIDATED RESULTS
Net Earnings and Diluted Earnings Per Share
Fourth Quarter Ended | Year Ended | |||||||||||||||||||
(in thousands, except per share amounts) | October 28, 2018 | October 29, 2017 | % Change | October 28, 2018 | October 29, 2017 | % Change | ||||||||||||||
Net Earnings | $ | 261,406 | $ | 218,154 | 19.8 | $ | 1,012,140 | $ | 846,735 | 19.5 | ||||||||||
Diluted Earnings Per Share | 0.48 | 0.41 | 17.1 | 1.86 | 1.57 | 18.5 | ||||||||||||||
19
Volume and Net Sales
Fourth Quarter Ended | Year Ended | |||||||||||||||||||||
(in thousands) | October 28, 2018 | October 29, 2017 | % Change | October 28, 2018 | October 29, 2017 | % Change | ||||||||||||||||
Volume (lbs.) | 1,265,292 | 1,275,270 | (0.8 | ) | 4,798,178 | 4,770,485 | 0.6 | |||||||||||||||
Organic Volume(1) | 1,232,728 | 1,275,270 | (3.3 | ) | 4,622,170 | 4,690,031 | (1.4 | ) | ||||||||||||||
Net Sales | $ | 2,524,697 | $ | 2,492,608 | 1.3 | $ | 9,545,700 | $ | 9,167,519 | 4.1 | ||||||||||||
Organic Net Sales(1) | 2,407,405 | 2,492,608 | (3.4 | ) | 8,984,841 | 9,067,288 | (0.9 | ) | ||||||||||||||
(1) COMPARISON OF U.S. GAAP TO NON-GAAP FINANCIAL MEASUREMENTS
The non-GAAP adjusted financial measurements of organic volume and organic net sales are presented to provide investors additional information to facilitate the comparison of past and present operations. The Company believes these non-GAAP financial measurements provide useful information to investors because they are the measurements used to evaluate performance on a comparable year-over-year basis. Non-GAAP measurements are not intended to be a substitute for U.S. GAAP measurements in analyzing financial performance. These non-GAAP measurements are not in accordance with generally accepted accounting principles and may be different from non-GAAP measures used by other companies.
Organic net sales and organic volume are defined as net sales and volume excluding the impact of acquisitions and divestitures. Organic net sales and organic volume exclude the impacts of the acquisition of Columbus Craft Meats (November 2017), the acquisition of Fontanini Italian Meats and Sausages (August 2017), and the divestiture of Farmer John (January 2017) in Refrigerated Foods and the acquisition of Ceratti (August 2017) in International & Other. The tables below show the calculations to reconcile from the non-GAAP adjusted measures to the GAAP measures in the fourth quarter and full year of fiscal 2018.
Adjusted segment profit and adjusted earnings per share exclude the impact of a non-cash impairment charge associated with the CytoSport business which was recognized in the Grocery Products segment. The tables below show the calculations to reconcile from the non-GAAP adjusted measures to the GAAP measures in the fourth quarter and full year of fiscal 2018. The effective tax rate was used to determine the tax effect of the impairment.
4th Quarter
Volume (lbs.)
FY 2018 | FY 2017 | ||||||||||||||
(in thousands) | Reported (GAAP) | Acquisitions | Organic (Non-GAAP) | Reported (GAAP) | Organic % Change | ||||||||||
Grocery Products | 346,214 | — | 346,214 | 359,976 | (3.8 | ) | |||||||||
Refrigerated Foods | 592,298 | (22,757 | ) | 569,541 | 583,526 | (2.4 | ) | ||||||||
Jennie-O Turkey Store | 231,180 | — | 231,180 | 240,354 | (3.8 | ) | |||||||||
International & Other | 95,600 | (9,807 | ) | 85,793 | 91,414 | (6.1 | ) | ||||||||
Total Volume | 1,265,292 | (32,564 | ) | 1,232,728 | 1,275,270 | (3.3 | ) | ||||||||
Net Sales
FY 2018 | FY 2017 | ||||||||||||||||||
(in thousands) | Reported (GAAP) | Acquisitions | Organic (Non-GAAP) | Reported (GAAP) | Organic % Change | ||||||||||||||
Grocery Products | $ | 648,244 | $ | — | $ | 648,244 | $ | 671,689 | (3.5 | ) | |||||||||
Refrigerated Foods | 1,321,784 | (102,262 | ) | 1,219,522 | 1,262,051 | (3.4 | ) | ||||||||||||
Jennie-O Turkey Store | 388,278 | — | 388,278 | 403,738 | (3.8 | ) | |||||||||||||
International & Other | 166,391 | (15,030 | ) | 151,361 | 155,130 | (2.4 | ) | ||||||||||||
Total Net Sales | $ | 2,524,697 | $ | (117,292 | ) | $ | 2,407,405 | $ | 2,492,608 | (3.4 | ) | ||||||||
Full Year
Volume (lbs.)
FY 2018 | FY 2017 | ||||||||||||||||||||
(in thousands) | Reported (GAAP) | Acquisitions | Organic (Non-GAAP) | Reported (GAAP) | Divestitures | Organic (Non-GAAP) | Organic % Change | ||||||||||||||
Grocery Products | 1,328,693 | — | 1,328,693 | 1,352,108 | — | 1,352,108 | (1.7 | ) | |||||||||||||
Refrigerated Foods | 2,327,140 | (130,301 | ) | 2,196,839 | 2,315,252 | (80,454 | ) | 2,234,798 | (1.7 | ) | |||||||||||
Jennie-O Turkey Store | 784,655 | — | 784,655 | 778,230 | — | 778,230 | 0.8 | ||||||||||||||
International & Other | 357,690 | (45,707 | ) | 311,983 | 324,895 | — | 324,895 | (4.0 | ) | ||||||||||||
Total Volume | 4,798,178 | (176,008 | ) | 4,622,170 | 4,770,485 | (80,454 | ) | 4,690,031 | (1.4 | ) | |||||||||||
20
Net Sales
FY 2018 | FY 2017 | ||||||||||||||||||||||||||
(in thousands) | Reported (GAAP) | Acquisitions | Organic (Non-GAAP) | Reported (GAAP) | Divestitures | Organic (Non-GAAP) | Organic % Change | ||||||||||||||||||||
Grocery Products | $ | 2,480,367 | $ | — | $ | 2,480,367 | $ | 2,507,503 | $ | — | $ | 2,507,503 | (1.1 | ) | |||||||||||||
Refrigerated Foods | 5,109,881 | (485,960 | ) | 4,623,921 | 4,759,839 | (100,231 | ) | 4,659,608 | (0.8 | ) | |||||||||||||||||
Jennie-O Turkey Store | 1,331,013 | — | 1,331,013 | 1,355,163 | — | 1,355,163 | (1.8 | ) | |||||||||||||||||||
International & Other | 624,439 | (74,899 | ) | 549,540 | 545,014 | — | 545,014 | 0.8 | |||||||||||||||||||
Total Net Sales | $ | 9,545,700 | $ | (560,859 | ) | $ | 8,984,841 | $ | 9,167,519 | $ | (100,231 | ) | $ | 9,067,288 | (0.9 | ) | |||||||||||
4th Quarter and Full Year
Segment Profit and Diluted Earnings Per Share
FY 2018 | ||||||
Grocery Products | ||||||
(in thousands) | 4th Quarter | Full Year | ||||
Non-GAAP Adjusted Segment Profit | $ | 96,361 | $ | 370,545 | ||
CytoSport Impairment | (17,279 | ) | (17,279 | ) | ||
GAAP Segment Profit | $ | 79,082 | $ | 353,266 | ||
Total Company | ||||||
4th Quarter | Full Year | |||||
Non-GAAP Adjusted Diluted EPS | $ | 0.51 | $ | 1.89 | ||
CytoSport Impairment | (0.03 | ) | (0.03 | ) | ||
GAAP Diluted EPS | $ | 0.48 | $ | 1.86 | ||
The increase in net sales for the fourth quarter of fiscal 2018 was driven by the inclusion of sales from the acquisitions of the Columbus, Fontanini, and Ceratti. Higher sales of Wholly® guacamole dips, Hormel® Natural Choice® products, Hormel® pepperoni, and foodservice sales of Jennie-O® turkey breast and Austin Blues® smoked barbecue products were more than offset by declines due to lower whole bird sales at Jennie-O Turkey Store, declines in the Company's contract manufacturing business in Grocery Products, and lower hog harvest volumes.
For fiscal 2018, the increase in net sales was primarily related to the inclusion of the Columbus, Fontanini, and Ceratti acquisitions, more than offsetting declines at Jennie-O Turkey Store, the Company's contract manufacturing business and CytoSport in Grocery Products.
Cost of Products Sold
Fourth Quarter Ended | Year Ended | |||||||||||||||||||
October 28, | October 29, | October 28, | October 29, | |||||||||||||||||
(in thousands) | 2018 | 2017 | % Change | 2018 | 2017 | % Change | ||||||||||||||
Cost of Products Sold | $ | 1,991,369 | $ | 1,981,681 | 0.5 | $ | 7,566,227 | $ | 7,170,883 | 5.5 | ||||||||||
The cost of products sold for the fourth quarter and fiscal year of fiscal 2018 were higher as a result of the inclusion of the Columbus, Fontanini, and Ceratti acquisitions along with higher freight costs, especially in the Refrigerated Foods and Jennie-O Turkey Store segments.
Gross Profit
Fourth Quarter Ended | Year Ended | ||||||||||||||||||||
October 28, | October 29, | October 28, | October 29, | ||||||||||||||||||
(in thousands) | 2018 | 2017 | % Change | 2018 | 2017 | % Change | |||||||||||||||
Gross Profit | $ | 533,328 | $ | 510,927 | 4.4 | $ | 1,979,473 | $ | 1,996,636 | (0.9 | ) | ||||||||||
Percentage of Net Sales | 21.1 | % | 20.5 | % | 20.7 | % | 21.8 | % | |||||||||||||
Consolidated gross profit as a percentage of net sales declined due to reduced commodity profitability, higher freight costs, and input cost volatility.
21
Selling, General and Administrative (SG&A)
Fourth Quarter Ended | Year Ended | |||||||||||||||||||
October 28, | October 29, | October 28, | October 29, | |||||||||||||||||
(in thousands) | 2018 | 2017 | % Change | 2018 | 2017 | % Change | ||||||||||||||
SG&A | $ | 205,287 | $ | 193,949 | 5.8 | $ | 841,205 | $ | 759,304 | 10.8 | ||||||||||
Percentage of Net Sales | 8.1 | % | 7.8 | % | 8.8 | % | 8.3 | % | ||||||||||||
For the fourth quarter and fiscal 2018, SG&A expenses increased due to the inclusion of the Columbus, Fontanini, and Ceratti acquisitions, higher advertising investments, and higher employee-related expenses.
Research and development expenses were $8.7 million and $33.8 million for the fiscal 2018 fourth quarter and year, respectively, compared to $8.2 million and $34.2 million for the corresponding periods in fiscal 2017.
Goodwill/Intangible Impairment
An impairment charge related to the CytoSport trademark totaling $17.3 million was recorded in the fourth quarter of fiscal 2018. Impairment charges related to an indefinite-lived intangible asset of $0.2 million were recorded in the fourth quarter of fiscal 2017.
Equity in Earnings of Affiliates
Fourth Quarter Ended | Year Ended | ||||||||||||||||||||
October 28, | October 29, | October 28, | October 29, | ||||||||||||||||||
(in thousands) | 2018 | 2017 | % Change | 2018 | 2017 | % Change | |||||||||||||||
Equity in Earnings of Affiliates | $ | 8,814 | $ | 12,214 | (27.8 | ) | $ | 58,972 | $ | 39,590 | 49.0 | ||||||||||
Results for the fourth quarter and fiscal 2018 were negatively impacted by increases in advertising and freight costs at MegaMex. For fiscal 2018, strong MegaMex results and tax reform drove the significant increase over the prior year.
The Company accounts for its majority-owned operations under the consolidation method. Investments in which the Company owns a minority interest, and for which there are no other indicators of control, are accounted for under the equity or cost method. These investments, along with receivables from other affiliates, are included in the Consolidated Statements of Financial Position as investments in and receivables from affiliates. The composition of this line item at October 28, 2018, was as follows:
(in thousands) | Investments/Receivables | ||
Country | |||
United States | $ | 205,148 | |
Foreign | 68,005 | ||
Total | $ | 273,153 | |
Effective Tax Rate
Fourth Quarter Ended | Year Ended | |||||||||||
October 28, | October 29, | October 28, | October 29, | |||||||||
2018 | 2017 | 2018 | 2017 | |||||||||
Effective Tax Rate | 18.7 | % | 33.8 | % | 14.3 | % | 33.7 | % | ||||
The lower effective tax rate for both the fourth quarter and fiscal year reflects the impact of The Tax Cuts and Jobs Act, signed into law on December 22, 2017. For fiscal 2018, the Company recorded a net tax benefit of $72.9 million. This provisional net tax benefit arises from a benefit of $81.2 million from re-measuring the Company’s net U.S. deferred tax liabilities, partially offset by the Company’s accrual for the transition tax and other U.S. tax law changes of $8.3 million. These one-time tax events and reduction in the federal statutory tax rate were the main drivers of the Company's effective tax rates for the fourth quarter and fiscal year of 18.7 percent and 14.3 percent, respectively, compared to 33.8 percent and 33.7 percent for the respective periods last year. For additional information, refer to Note K - Income Taxes.
22
SEGMENT RESULTS
Net sales and operating profits for each of the Company’s reportable segments are set forth below. The Company is an integrated enterprise, characterized by substantial intersegment cooperation, cost allocations, and sharing of assets. Therefore, the Company does not represent that these segments, if operated independently, would report the operating profit and other financial information shown below. (Additional segment financial information can be found in Note P - Segment Reporting.)
Fourth Quarter Ended | Year Ended | |||||||||||||||||||||
October 28, | October 29, | October 28, | October 29, | |||||||||||||||||||
(in thousands) | 2018 | 2017 | % Change | 2018 | 2017 | % Change | ||||||||||||||||
Net Sales | ||||||||||||||||||||||
Grocery Products | $ | 648,244 | $ | 671,689 | (3.5 | ) | $ | 2,480,367 | $ | 2,507,503 | (1.1 | ) | ||||||||||
Refrigerated Foods | 1,321,784 | 1,262,051 | 4.7 | 5,109,881 | 4,759,839 | 7.4 | ||||||||||||||||
Jennie-O Turkey Store | 388,278 | 403,738 | (3.8 | ) | 1,331,013 | 1,355,163 | (1.8 | ) | ||||||||||||||
International & Other | 166,391 | 155,130 | 7.3 | 624,439 | 545,014 | 14.6 | ||||||||||||||||
Total Net Sales | $ | 2,524,697 | $ | 2,492,608 | 1.3 | $ | 9,545,700 | $ | 9,167,519 | 4.1 | ||||||||||||
Segment Profit | ||||||||||||||||||||||
Grocery Products | $ | 79,082 | $ | 100,457 | (21.3 | ) | $ | 353,266 | $ | 373,330 | (5.4 | ) | ||||||||||
Refrigerated Foods | 194,573 | 166,253 | 17.0 | 670,948 | 666,125 | 0.7 | ||||||||||||||||
Jennie-O Turkey Store | 38,744 | 54,121 | (28.4 | ) | 131,846 | 183,433 | (28.1 | ) | ||||||||||||||
International & Other | 24,802 | 23,113 | 7.3 | 88,953 | 85,304 | 4.3 | ||||||||||||||||
Total Segment Profit | 337,201 | 343,944 | (2.0 | ) | 1,245,013 | 1,308,192 | (4.8 | ) | ||||||||||||||
Net Unallocated Expense | 15,787 | 14,144 | 11.6 | 64,171 | 29,915 | 114.5 | ||||||||||||||||
Noncontrolling Interest | 90 | 209 | (56.9 | ) | 442 | 368 | 20.1 | |||||||||||||||
Earnings Before Income Taxes | $ | 321,504 | $ | 330,009 | (2.6 | ) | $ | 1,181,284 | $ | 1,278,645 | (7.6 | ) | ||||||||||
Grocery Products
Fourth Quarter Ended | Year Ended | |||||||||||||||||||||
October 28, | October 29, | October 28, | October 29, | |||||||||||||||||||
(in thousands) | 2018 | 2017 | % Change | 2018 | 2017 | % Change | ||||||||||||||||
Volume (lbs.) | 346,214 | 359,976 | (3.8 | ) | 1,328,693 | 1,352,108 | (1.7 | ) | ||||||||||||||
Net Sales | $ | 648,244 | $ | 671,689 | (3.5 | ) | $ | 2,480,367 | $ | 2,507,503 | (1.1 | ) | ||||||||||
Segment Profit | 79,082 | 100,457 | (21.3 | ) | 353,266 | 373,330 | (5.4 | ) | ||||||||||||||
Net sales improvement in Wholly® guacamole dips and Herdez® salsas in the fourth quarter of fiscal 2018 were unable to offset declines in contract manufacturing. For fiscal 2018, the net sales decrease was driven by declines across the Company's contract manufacturing business and the CytoSport portfolio.
For the fourth quarter and fiscal year, segment profit decreased as a result of declines in contract manufacturing, a $17.3 million impairment of the CytoSport trademark, and increased freight.
Refrigerated Foods
Fourth Quarter Ended | Year Ended | |||||||||||||||||||
October 28, | October 29, | October 28, | October 29, | |||||||||||||||||
(in thousands) | 2018 | 2017 | % Change | 2018 | 2017 | % Change | ||||||||||||||
Volume (lbs.) | 592,298 | 583,526 | 1.5 | 2,327,140 | 2,315,252 | 0.5 | ||||||||||||||
Net Sales | $ | 1,321,784 | $ | 1,262,051 | 4.7 | $ | 5,109,881 | $ | 4,759,839 | 7.4 | ||||||||||
Segment Profit | 194,573 | 166,253 | 17.0 | 670,948 | 666,125 | 0.7 | ||||||||||||||
For the fourth quarter and fiscal 2018, volume and net sales increases were driven by the Columbus and Fontanini acquisitions in addition to strong retail sales of Hormel® pepperoni, Applegate® natural and organic products, and Hormel® Natural Choice® products, and foodservice sales of Austin Blues® authentic barbecue products. Lower hog harvest volumes offset some of these gains.
For the fourth quarter and fiscal year, Refrigerated Foods delivered increases in segment profit as the benefit from acquisitions and strong performances from the value-added businesses overcame significant declines in commodity profits, a double-digit increase in per-unit freight costs, and higher advertising investments.
23
Jennie-O Turkey Store
Fourth Quarter Ended | Year Ended | |||||||||||||||||||||
October 28, | October 29, | October 28, | October 29, | |||||||||||||||||||
(in thousands) | 2018 | 2017 | % Change | 2018 | 2017 | % Change | ||||||||||||||||
Volume (lbs.) | 231,180 | 240,354 | (3.8 | ) | 784,655 | 778,230 | 0.8 | |||||||||||||||
Net Sales | $ | 388,278 | $ | 403,738 | (3.8 | ) | $ | 1,331,013 | $ | 1,355,163 | (1.8 | ) | ||||||||||
Segment Profit | 38,744 | 54,121 | (28.4 | ) | 131,846 | 183,433 | (28.1 | ) | ||||||||||||||
For the fourth quarter and fiscal 2018, volume and sales decreased primarily due to lower whole bird sales.
Segment profit for the fourth quarter and 2018 decreased as a result of lower profits from whole bird and commodity sales, increased freight costs, and increased advertising investments.
International & Other
Fourth Quarter Ended | Year Ended | |||||||||||||||||||
October 28, | October 29, | October 28, | October 29, | |||||||||||||||||
(in thousands) | 2018 | 2017 | % Change | 2018 | 2017 | % Change | ||||||||||||||
Volume (lbs.) | 95,600 | 91,414 | 4.6 | 357,690 | 324,895 | 10.1 | ||||||||||||||
Net Sales | $ | 166,391 | $ | 155,130 | 7.3 | $ | 624,439 | $ | 545,014 | 14.6 | ||||||||||
Segment Profit | 24,802 | 23,113 | 7.3 | 88,953 | 85,304 | 4.3 | ||||||||||||||
Volume and sales increases for the quarter and fiscal year were driven by the addition of the Ceratti business and stronger branded exports, partially offset by lower fresh pork exports due to tariffs.
Segment profit increased for both the fourth quarter and fiscal year primarily reflecting improved profitability for the China business due to favorable input costs, the inclusion of the Ceratti business, and stronger exports of branded items. Global trade uncertainty negatively impacted the profitability of pork exports.
Unallocated Income and Expense
The Company does not allocate investment income, interest expense, or interest income to its segments when measuring performance. The Company also retains various other income and unallocated expenses at the corporate level. Equity in earnings of affiliates is included in segment profit; however, earnings attributable to the Company’s noncontrolling interests are excluded. These items are included in the segment table for the purpose of reconciling segment results to earnings before income taxes.
Fourth Quarter Ended | Year Ended | |||||||||||
October 28, | October 29, | October 28, | October 29, | |||||||||
(in thousands) | 2018 | 2017 | 2018 | 2017 | ||||||||
Net Unallocated Expense | 15,787 | 14,144 | 64,171 | 29,915 | ||||||||
Noncontrolling Interest | 90 | 209 | 442 | 368 | ||||||||
Net unallocated expense was higher for the fourth quarter and fiscal year, primarily due to the additional debt related to the Columbus acquisition, higher employee related expenses, and the universal stock option grant.
Liquidity and Capital Resources
Cash and Cash Equivalents were $672.9 million for fiscal 2019 compared to $459.1 million and $444.1 million for 2018 and 2017, respectively.
During fiscal 2019, cash provided by operating activities was $923.0 million compared to $1,241.7 million in fiscal 2018 and $1,033.9 million in fiscal 2017. The decrease in fiscal 2019 was primarily due to an increase in working capital and a higher tax rate.
Cash provided by investing activities was $220.2 million in fiscal 2019 compared to cash used in investing activities of $1,235.4 million in fiscal 2018 and $587.2 million in fiscal 2017. Fiscal 2019 included $479.8 million from the sale of CytoSport and $30.6 million from the sale of the Fremont, Nebraska, processing facility. Fiscal 2018 included $857.4 million to purchase Columbus. Fiscal 2017 included $520.5 million to purchase Fontanini and Ceratti, partially offset by the sale of Farmer John for $135.9 million. Capital expenditures in fiscal 2019, 2018, and 2017 were $293.8 million, $389.6 million, and $221.3 million, respectively. Projects in fiscal 2019 included the preliminary phases of the Burke pizza toppings plant expansion, a new dry sausage facility in Nebraska, Project Orion, and many other items to support growth of branded products. Projects in fiscal 2018 included the expansion of value-added capacity at Dold Foods in Wichita, Kansas, a highly automated whole bird facility in Melrose, Minnesota, as well as ongoing investments for food and employee safety. Projects in fiscal 2017 included completion of the Company’s plant in Jiaxing, China, the Jennie-O Turkey Store whole bird facility in Melrose, Minnesota, and the bacon expansion
24
in Wichita, Kansas. Capital expenditures for fiscal 2020 are estimated to be approximately $360.0 million. The largest projects expected in fiscal 2020 include a new dry sausage production facility in Nebraska, Project Orion, and the completion of the Burke pizza toppings plant.
Cash used in financing activities was $926.2 million in fiscal 2019 compared to cash provided by financing activities of $11.6 million in fiscal 2018 and cash used in financing activities of $418.8 million in fiscal 2017. Cash used in financing activities in fiscal 2019 included repayment of the $375.0 million term loan used to fund the acquisition of Columbus in fiscal 2018.
The Company repurchased $174.2 million of its common stock in fiscal 2019 compared to $46.9 million and $94.5 million repurchased during fiscal 2018 and 2017, respectively. During fiscal 2019, the Company repurchased 4.3 million shares of its common stock at an average price per share of $40.44. For additional information pertaining to the Company's share repurchase plan, see Part II, Item 5 "Market for Registrant's Common Equity, Related Stockholder Matters and Issuer Purchases of Equity Securities".
Cash dividends paid to the Company’s shareholders continues to be an ongoing financing activity for the Company, with $437.1 million in dividends paid in fiscal 2019 compared to $388.1 million in the fiscal 2018 and $346.0 million in fiscal 2017. The dividend rate was $0.84 per share in fiscal 2019, which reflected a 12.0 percent increase over the fiscal 2018 rate of $0.75 per share. The Company has paid dividends for 365 consecutive quarters. The annual dividend rate for fiscal 2020 was increased 11% percent to $0.93 per share, representing the 54th consecutive annual dividend increase.
Cash flows from operating activities continue to provide the Company with its principal source of liquidity. The Company does not anticipate a significant risk to cash flows from this source in the foreseeable future because the Company operates in a relatively stable industry and has strong brands across many categories and channels.
The Company is dedicated to returning excess cash flow to shareholders through dividend payments. Growing the business through innovation and evaluating opportunities for strategic acquisitions remains a focus for the Company. Reinvestments in the business to ensure employee and food safety are a top priority. Capital spending to enhance and expand current operations will also be a significant cash outflow in fiscal 2020.
Contractual Obligations and Commercial Commitments
The following table outlines the Company’s future contractual financial obligations as of October 27, 2019, (for additional information regarding these obligations, see Note F - Long-term Debt and Other Borrowing Arrangements and Note N - Commitments and Contingencies):
Payments Due by Periods | ||||||||||||||||||||
Contractual Obligations (in thousands) | Total | Less Than 1 Year | 1-3 Years | 3-5 Years | More Than 5 Years | |||||||||||||||
Purchase Obligations: | ||||||||||||||||||||
Hog, turkey, and raw material commitments(1) | $ | 2,919,870 | $ | 719,995 | $ | 1,091,856 | $ | 772,202 | $ | 335,817 | ||||||||||
Grain commitments(1) | 117,641 | 109,517 | 8,124 | — | — | |||||||||||||||
Turkey grow-out contracts(2) | 175,926 | 21,957 | 40,267 | 34,630 | 79,072 | |||||||||||||||
Current and Long-term Debt | 250,000 | — | 250,000 | — | — | |||||||||||||||
Interest Payments on Long-term Debt(3) | 15,072 | 10,312 | 4,760 | — | — | |||||||||||||||
Capital Leases | 22,563 | 1,834 | 3,496 | 3,418 | 13,815 | |||||||||||||||
Operating Leases | 67,590 | 15,603 | 18,421 | 11,793 | 21,773 | |||||||||||||||
Other Long-term Liabilities(4) (5) | 66,493 | 6,194 | 12,077 | 11,349 | 36,873 | |||||||||||||||
Total Contractual Cash Obligations | $ | 3,635,155 | $ | 885,412 | $ | 1,429,001 | $ | 833,392 | $ | 487,350 | ||||||||||
(1) In the normal course of business, the Company commits to purchase fixed quantities of livestock, grain, and raw materials from producers to ensure a steady supply of production inputs. Some of these contracts are based on market prices at the time of delivery, for which the Company has estimated the purchase commitment using current market prices as of October 27, 2019.
(2) The Company utilizes grow-out contracts with independent farmers to raise turkeys for the Company. Under these contracts, the turkeys, feed, and other supplies are owned by the Company. The farmers provide the required labor and facilities and receive a fee per pound when the turkeys are delivered. Some of the facilities are sub-leased by the Company to the independent farmers. As of October 27, 2019, the Company had approximately 100 active contracts ranging from one to twenty-five years in duration. The grow-out activity is assumed to continue through the term of these active contracts. Amounts in the table represent the Company’s obligation based on turkeys expected to be delivered from these farmers.
(3) See Note F - Long-term Debt and Other Borrowing Arrangements.
(4) Other Long-term Liabilities represent payments under the Company’s deferred compensation plans. Excluded from the table above are payments under the Company’s defined benefit pension and other post-retirement benefit plans. (See estimated benefit payments for the next ten fiscal years in Note G - Pension and Other Post-retirement Benefits)
(5) As discussed in Note K - Income Taxes, the total liability for unrecognized tax benefits, including interest and penalties, at October 27, 2019, was $22.5 million, which is not included in the table above as the ultimate amount or timing of settlement of the Company's reserves for income taxes cannot be reasonably estimated.
The Company believes its financial resources, including a revolving credit facility for $400 million and anticipated funds from operations, will be adequate to meet all current commitments.
25
Off-Balance Sheet Arrangements
As of October 27, 2019, the Company had $44.8 million of standby letters of credit issued on its behalf. The standby letters of credit are primarily related to the Company’s self-insured workers compensation programs. However, this amount includes revocable standby letters of credit totaling $2.7 million for obligations of an affiliated party that may arise under workers compensation claims. Letters of credit are not reflected in the Company’s Consolidated Statements of Financial Position.
Trademarks
References to the Company’s brands or products in italics within this report represent valuable trademarks owned or licensed by
Hormel Foods, LLC or other subsidiaries of Hormel Foods Corporation.
Critical Accounting Policies
This discussion and analysis of financial condition and results of operations is based upon the Company's consolidated financial statements, which have been prepared in accordance with U.S. generally accepted accounting principles (U.S. GAAP). The preparation of these financial statements requires the Company to make estimates, judgments, and assumptions that can have a meaningful effect on the reporting of consolidated financial statements. See Note A for a discussion of significant accounting policies.
Critical accounting policies are defined as those reflective of significant judgments, estimates, and uncertainties, which may result in materially different results under different assumptions and conditions. The Company believes the following are its critical accounting policies:
Revenue Recognition: The Company recognizes sales at the point in time when the performance obligation has been satisfied, and control of the product has transferred to the customer. Obligations for the Company are usually fulfilled once shipped product is received or picked up by the customer. Revenue is recorded net of applicable provisions for discounts, returns, and allowances.
The Company offers various sales incentives to customers and consumers. Incentives offered off-invoice include prompt pay allowances, will call allowances, spoilage allowances, and temporary price reductions. These incentives are recognized as reductions of revenue at the time title passes. Coupons are used as an incentive for consumers to purchase various products. The coupons reduce revenues at the time they are offered, based on estimated redemption rates. Promotional contracts are performed by customers to promote the Company’s products to consumers. These incentives reduce revenues at the time of performance through direct payments and accrued promotional funds. Accrued promotional funds are unpaid liabilities for promotional contracts in process or completed at the end of a quarter or fiscal year. Promotional contractual accruals are based on agreements with customers for defined performance. The liability relating to these agreements is based on a review of the outstanding contracts on which performance has taken place but which the promotional payments relating to such contracts remain unpaid as of the end of the fiscal year. The level of customer performance and the historical spend rate versus contracted rates are estimates used to determine these liabilities.
Inventory Valuation: The Company values inventories at the lower of cost or net realizable value. For pork inventories, when the carcasses are disassembled and transferred from primal processing to various manufacturing departments, the primal values, as adjusted by the Company for product specifications and further processing, become the basis for calculating inventory values. Turkey raw materials are represented by the deboned meat quantities. The Company values these raw materials using a concept referred to as the “meat cost pool.” The meat cost pool is determined by combining the cost to grow turkeys with processing costs, less any net sales revenue from by-products created from the processing and not used in producing Company products. The Company has developed a series of ratios using historical data and current market conditions (which themselves involve estimates and judgment determinations by the Company) to allocate the meat cost pool to each meat component. Substantially all inventoriable expenses, meat, packaging, and supplies are valued by the average cost method.
Goodwill and Other Indefinite-Lived Intangibles: Estimating the fair value of the Company’s goodwill reporting units and intangible assets requires significant judgment upon initial valuation. Determining the useful life of an intangible asset also requires judgment. Certain acquired brands are expected to have indefinite lives based on their history and the Company’s plans to continue to support and build the brands. Other acquired assets such as customer relationships, are expected to have determinable useful lives.
Indefinite-lived intangible assets are originally recorded at their estimated fair values at the date of acquisition and the residual of the purchase price is recorded to goodwill. Goodwill and other indefinite-lived intangible assets are allocated to reporting units that will receive the related sales and income. Goodwill and indefinite-lived intangible assets are tested annually for impairment, or more frequently if impairment indicators arise.
In conducting the annual impairment test for goodwill, the Company has the option to first assess qualitative factors to determine whether it is more likely than not (> 50% likelihood) the fair value of any reporting unit is less than its carrying amount. If a qualitative assessment determines an impairment is more likely than not, the Company is required to perform a quantitative impairment test. Otherwise, no further analysis is required. Alternatively, the Company may elect not to perform the qualitative assessment and proceed directly to the quantitative impairment test.
26
In conducting a qualitative assessment, the Company analyzes actual and projected growth trends for net sales, gross margin, and segment profit for each reporting unit, as well as historical performance versus plan and the results of prior quantitative tests performed. Additionally, the Company assesses critical areas that may impact its business, including macroeconomic conditions and the related impact, market-related exposures, any plans to market for sale all or a portion of their business, competitive changes, new or discontinued product lines, changes in key personnel, or any potential risks to their projected financial results.
If performed, the quantitative goodwill impairment test is performed at the reporting unit level. First, the fair value of each reporting unit is compared to its corresponding carrying value, including goodwill. The fair value of each reporting unit is estimated using discounted cash flow valuations (Level 3), which incorporate assumptions regarding future growth rates, terminal values, and discount rates. The estimates and assumptions used consider historical performance and are consistent with the assumptions used in determining future profit plans for each reporting unit, which are approved by the Company’s Board of Directors. If the quantitative assessment results in the carrying value exceeding the fair value of any reporting unit, then the results from the quantitative analysis will be relied upon to determine both the existence and amount of goodwill impairment. An impairment loss will be recognized for the amount by which the reporting unit’s carrying amount exceeds its fair value, not to exceed the carrying amount of goodwill in that reporting unit.
During the fourth quarter of fiscal 2019, the Company completed its annual goodwill impairment tests and elected to perform a qualitative assessment. As a result of the qualitative testing no goodwill impairment charges were recorded. No goodwill impairment charges were recorded during fiscal years 2018 and 2017.
In conducting the annual impairment test for its indefinite-lived intangible assets, the Company first performs a qualitative assessment to determine whether it is more likely than not (> 50% likelihood) that an indefinite-lived intangible asset is impaired. If the Company concludes this is the case, then a quantitative test for impairment must be performed. Otherwise, the Company does not need to perform a quantitative test.
In conducting the initial qualitative assessment, the Company analyzes growth rates for historical and projected net sales and the results of prior quantitative tests performed. Additionally, the Company assesses critical areas that may impact its intangible assets or the applicable royalty rates to determine if there are factors that could indicate impairment of the asset.
If performed, the quantitative impairment test compares the fair value to the carrying value of the indefinite-lived intangible asset. The fair value of indefinite-lived intangible assets is primarily determined on the basis of estimated discounted value, using the relief from royalty method (Level 3). This method incorporates assumptions regarding future sales projections, discount rates, and royalty rates. If the carrying value exceeds fair value, the indefinite-lived intangible asset is considered impaired and an impairment charge is recorded. Even if not required, the Company periodically elects to perform the quantitative test in order to confirm the qualitative assessment.
During the fourth quarter of fiscal 2019, the Company completed its annual indefinite-live impairment tests and elected to perform a qualitative assessment. During the qualitative review, it was revealed that further assessment in the form of a quantitative test was necessary for certain indefinite-lived intangible assets with a combined carrying value less than $100 million. No impairment charges were recorded for 2019, however, these assets were determined to have fair values exceeding their carrying value by less than a 10 percent margin. Management has implemented strategies to address the nominal excess value, however, adverse events in the future could result in a decline in fair value that could trigger a future impairment charge for a portion of these indefinite-lived intangible assets. A 10 percent decline in sales or a 10 percent increase in the discount rate would result in an immaterial impairment.
During fiscal 2018, a $17.3 million intangible asset impairment charge was recorded for the CytoSport trademark. See additional discussion regarding the Company’s goodwill and intangible assets in Note E - Goodwill and Intangible Assets. During fiscal years 2018 and 2017, there were no other material impairment charges recorded.
Pension and Other Post-retirement Benefits: The Company incurs expenses relating to employee benefits, such as noncontributory defined benefit pension plans and post-retirement health care benefits. In accounting for these employment costs and the associated liabilities, management must make a variety of assumptions and estimates including mortality rates, discount rates, compensation increases, expected return on plan assets, and health care cost trend rates. The Company considers historical data as well as current facts and circumstances when determining these estimates. The Company uses third-party specialists to assist management in the determination of these estimates and the calculation of certain employee benefit expenses and the outstanding obligation.
Benefit plan assets are stated at fair value. Due to the lack of readily available market prices, private equity investments are valued by models using a combination of available market data and unobservable inputs that consider earnings multiples, discounted cash flows, and other qualitative and quantitative factors. Other benefit plan investments are measured at Net Asset Value (NAV) per share of the fund's underlying investments as a practical expedient. These valuations are subject to judgments and assumptions of the funds which may prove to be incorrect, resulting in risks of incorrect valuation of these investments. The Company seeks to mitigate these risks by evaluating the appropriateness of the funds’ judgments and assumptions by reviewing the financial data included in the funds’ financial statements for reasonableness. The Company also holds quarterly meetings with the investment adviser to review fund performance, which include comparisons to the relevant indices. On an annual basis, the Company performs pricing tests on certain underlying investments to gain additional assurance of the reliability of values
27
received from the fund manager. See Note G - Pension and Other Post-retirement Benefits of the Notes to Consolidated Financial Statements for additional information.
Income Taxes: The Company records income taxes in accordance with the liability method of accounting. Deferred taxes are recognized for the estimated taxes ultimately payable or recoverable based on enacted tax law. Changes in enacted tax rates are reflected in the tax provision as they occur.
The Company computes its provision for income taxes based on the statutory tax rates and tax planning opportunities available to it in the various jurisdictions in which it operates. Judgment is required in evaluating the Company’s tax positions and determining its annual tax provision. While the Company considers all of its tax positions fully supportable, the Company is occasionally challenged by various tax authorities regarding the amount of taxes due. The Company recognizes a tax position in its financial statements when it is more likely than not the position will be sustained upon examination, based on the technical merits of the position. This position is then measured at the largest amount of benefit that is greater than 50 percent likely of being realized upon ultimate settlement. A change in judgment related to the expected ultimate resolution of uncertain tax positions will be recognized in earnings in the quarter of such change.
Contingent Liabilities: At any time, the Company may be subject to investigations, legal proceedings, or claims related to the ongoing operation of its business, including claims both by and against the Company. Such proceedings typically involve claims related to product liability, contract disputes, wage and hour laws, employment practices, or other actions brought by employees, consumers, competitors, or suppliers. The Company routinely assesses the likelihood of any adverse outcomes related to these matters on a case by case basis, as well as the potential ranges of losses and fees. The Company establishes accruals for its potential exposure, as appropriate, for claims against the Company when losses become probable and reasonably estimable. Where the Company is able to reasonably estimate a range of potential losses, the Company records the amount within that range which constitutes the Company’s best estimate. The Company also discloses the nature and range of loss for claims against the Company when losses are reasonably possible and material. These accruals and disclosures are determined based on the facts and circumstances related to the individual cases and require estimates and judgments regarding the interpretation of facts and laws, as well as the effectiveness of strategies or factors beyond our control.
Forward-Looking Statements
This report contains “forward-looking” information within the meaning of the federal securities laws. The “forward-looking” information may include statements concerning the Company’s outlook for the future as well as other statements of beliefs, future plans, strategies, or anticipated events and similar expressions concerning matters that are not historical facts.
The Private Securities Litigation Reform Act of 1995 (the Reform Act) provides a "safe harbor" for forward-looking statements to encourage companies to provide prospective information. The Company is filing this cautionary statement in connection with the Reform Act. When used in the Company’s Annual Report to Stockholders, other filings by the Company with the U.S. Securities and Exchange Commission, the Company's press releases, and oral statements made by the Company's representatives, the words or phrases "should result," "believe," "intend," "plan," "are expected to," "targeted," "will continue," "will approximate," "is anticipated," "estimate," "project," or similar expressions are intended to identify forward-looking statements within the meaning of the Reform Act. Such statements are subject to certain risks and uncertainties that could cause actual results to differ materially from historical earnings and those anticipated or projected.
In connection with the “safe harbor” provisions of the Reform Act, the Company is identifying risk factors that could affect financial performance and cause the Company’s actual results to differ materially from opinions or statements expressed with respect to future periods. The following discussion of risk factors contains certain cautionary statements regarding the Company’s business, which should be considered by investors and others. Such risk factors should be considered in conjunction with any discussions of operations or results by the Company or its representatives, including any forward-looking discussion, as well as comments contained in press releases, presentations to securities analysts or investors, or other communications by the Company.
In making these statements, the Company is not undertaking, and specifically declines to undertake, any obligation to address or update each or any factor in future filings or communications regarding the Company’s business or results, and is not undertaking to address how any of these factors may have caused changes to discussions or information contained in previous filings or communications. Though the Company has attempted to list comprehensively these important cautionary risk factors, the Company wishes to caution investors and others that other factors may in the future prove to be important in affecting the Company’s business or results of operations.
The Company cautions readers not to place undue reliance on forward-looking statements, which represent current views as of the date made. Forward-looking statements are inherently at risk to any changes in the national and worldwide economic environment, which could include, among other things, economic conditions, political developments, currency exchange rates, interest and inflation rates, accounting standards, taxes, and laws and regulations affecting the Company and its markets.
28
Item 7A. QUANTITATIVE AND QUALITATIVE DISCLOSURES ABOUT MARKET RISK
Hog Markets: The Company’s earnings are affected by fluctuations in the live hog market. To minimize the impact on earnings and ensure a steady supply of quality hogs, the Company has entered into contracts with producers for the purchase of hogs at formula-based prices over periods of up to 10 years. Hogs purchased under contract accounted for 93 percent and 96 percent of the total hogs purchased by the Company during fiscal 2019 and 2018, respectively. The majority of these contracts use market-based formulas based on hog futures, hog primal values, or industry reported hog markets. Other contracts use a formula based on the cost of production, which can fluctuate independently from hog markets. The Company’s value-added branded portfolio helps mitigate changes in hog and pork market prices. Therefore, a hypothetical 10 percent change in the cash hog market would have had an immaterial effect on the Company’s results of operations.
The Company utilizes a hedge program to reduce exposure and offset the fluctuations in the Company’s future direct hog purchases. This program utilizes lean hog futures which are accounted for under cash flow hedge accounting. The fair value of the Company’s open futures contracts in this program as of October 27, 2019, was $5.8 million, before tax, compared to $0.7 million, before tax, as of October 28, 2018. The Company measures its market risk exposure on its lean hog futures contracts using a sensitivity analysis, which considers a hypothetical 10 percent change in the market prices for lean hogs. A 10 percent decrease in the market price for lean hogs would have negatively impacted the fair value of the Company’s October 27, 2019, open lean hog contracts by $19.5 million, which in turn would lower the Company’s future cost on purchased hogs by a similar amount.
Turkey Production Costs: The Company raises or contracts for live turkeys to meet the majority of its raw material supply requirements. Production costs in raising turkeys are subject primarily to fluctuations in feed prices and, to a lesser extent, fuel costs. Under normal, long-term market conditions, changes in the cost to produce turkeys are offset by proportional changes in the turkey market.
The Company utilizes a hedge program to reduce exposure and offset the fluctuation in the Company’s future direct grain purchases. This program utilizes corn futures for Jennie-O Turkey Store, and these contracts are accounted for under cash flow hedge accounting. The fair value of the Company’s open futures contracts as of October 27, 2019, was $(2.2) million, before tax, compared to $(1.3) million, before tax, as of October 28, 2018. The Company measures its market risk exposure on its grain futures contracts using a sensitivity analysis, which considers a hypothetical 10 percent change in the market prices for grain. A 10 percent decrease in the market price for grain would have negatively impacted the fair value of the Company’s October 27, 2019, open grain contracts by $9.5 million, which in turn would lower the Company’s future cost on purchased grain by a similar amount.
Other Input Costs: The costs of raw materials, packaging materials, freight, fuel, and energy may cause the Company's results to fluctuate significantly. To manage input cost volatility, the Company pursues cost saving measures, forward pricing, derivatives, and pricing actions when necessary.
Investments: The Company has corporate-owned life insurance policies classified as trading securities as part of a rabbi trust to fund certain supplemental executive retirement plans and deferred income plans. As of October 27, 2019, the balance of these securities totaled $157.5 million compared to $137.3 million as of October 28, 2018. A majority of these securities represent fixed income funds. The Company is subject to market risk due to fluctuations in the value of the remaining investments as unrealized gains and losses associated with these securities are included in the Company’s net earnings on a mark-to-market basis. A 10 percent decline in the value of the investments not held in fixed income funds would have a negative impact to the Company’s pretax earnings of approximately $7.0 million, while a 10 percent increase in value would have a positive impact of the same amount.
International Assets: The fair values of certain Company assets are subject to fluctuations in foreign currencies. The Company’s net asset position in foreign currencies as of October 27, 2019, was $543.8 million, compared to $687.7 million as of October 28, 2018, with most of the exposure existing in Chinese yuan and Brazilian real. Changes in currency exchange rates impact the fair values of the Company assets either currently through the Consolidated Statements of Operations within Interest and Investment Income or through the Consolidated Statements of Financial Position within Accumulated Other Comprehensive Loss.
The Company measures its foreign currency exchange risk by using a 10 percent sensitivity analysis on the Company’s primary foreign net asset position, the Chinese yuan and the Brazilian real, as of October 27, 2019. A 10 percent strengthening in the value of the yuan relative to the U.S. dollar would result in other comprehensive income of approximately $33.7 million pretax. A 10 percent weakening in the value of the yuan relative to the U.S. dollar would result in other comprehensive loss of approximately $27.6 million pretax. A 10 percent strengthening in the value of the real relative to the U.S. dollar would result in other comprehensive income of approximately $13.0 million pretax. A 10 percent weakening in the value of the real relative to the U.S. dollar would result in other comprehensive loss of approximately $10.7 million pretax.
Item 8. FINANCIAL STATEMENTS AND SUPPLEMENTARY DATA
29
Report of Management
Management’s Responsibility for Financial Statements
The accompanying financial statements were prepared by the management of Hormel Foods Corporation which is responsible for their integrity and objectivity. These statements have been prepared in accordance with U.S. generally accepted accounting principles appropriate in the circumstances and, as such, include amounts that are based on our best estimates and judgments.
Hormel Foods Corporation has developed a system of internal controls designed to assure that the records reflect the transactions of the Company and that the established policies and procedures are adhered to. This system is augmented by well-communicated written policies and procedures, a strong program of internal audit, and well-qualified personnel.
These financial statements have been audited by Ernst & Young LLP, an independent registered public accounting firm, and their report is included herein. The audit was conducted in accordance with the standards of the Public Company Accounting Oversight Board (United States) and includes a review of the Company’s accounting and financial controls and tests of transactions.
The Audit Committee of the Board of Directors, composed solely of outside directors, meets periodically with the independent auditors, management, and the internal auditors to assure that each is carrying out its responsibilities. Both Ernst & Young LLP and our internal auditors have full and free access to the Audit Committee, with or without the presence of management, to discuss the results of their audit work and their opinions on the adequacy of internal controls and the quality of financial reporting.
Management’s Report on Internal Control Over Financial Reporting
Management of Hormel Foods Corporation is responsible for establishing and maintaining adequate internal control over financial reporting for the Company, as such term is defined in Exchange Act Rule 13a–15(f). The Company’s internal control system is designed to provide reasonable assurance regarding the reliability of financial reporting and the preparation of financial statements for external purposes in accordance with generally accepted accounting standards. Under the supervision, and with the participation of management, including the Chief Executive Officer and Chief Financial Officer, we conducted an evaluation of the effectiveness of our internal control over financial reporting based on the framework in Internal Control - Integrated Framework issued by the Committee of Sponsoring Organizations of the Treadway Commission (2013 framework).
Based on our evaluation under the framework in Internal Control - Integrated Framework, we concluded that our internal control over financial reporting was effective as of October 27, 2019. Our internal control over financial reporting as of October 27, 2019, has been audited by Ernst & Young LLP, an independent registered public accounting firm, as stated in their report which is included herein.
/s/ James P. Snee | /s/ James N. Sheehan |
Chairman of the Board, | Executive Vice President |
President and Chief Executive Officer | and Chief Financial Officer |
30
Report of Independent Registered Public Accounting Firm
To the Shareholders and the Board of Directors of Hormel Foods Corporation
Opinion on Internal Control Over Financial Reporting
We have audited Hormel Foods Corporation’s internal control over financial reporting as of October 27, 2019, based on criteria established in Internal Control-Integrated Framework issued by the Committee of Sponsoring Organizations of the Treadway Commission (2013 framework) (the COSO criteria). In our opinion, Hormel Foods Corporation (the Company) maintained, in all material respects, effective internal control over financial reporting as of October 27, 2019, based on the COSO criteria.
We also have audited, in accordance with the standards of the Public Company Accounting Oversight Board (United States) (PCAOB), the accompanying consolidated statements of financial position of Hormel Foods Corporation (the Company) as of October 27, 2019 and October 28, 2018, the related consolidated statements of operations, comprehensive income, changes in shareholders’ investment, and cash flows for each of the three years in the period ended October 27, 2019 and the related notes and financial statement schedule listed in the index at Item 15 and our report dated December 6, 2019 expressed an unqualified opinion thereon.
Basis for Opinion
The Company’s management is responsible for maintaining effective internal control over financial reporting and for its assessment of the effectiveness of internal control over financial reporting included in the accompanying Management’s Report on Internal Control over Financial Reporting. Our responsibility is to express an opinion on the Company’s internal control over financial reporting based on our audit. We are a public accounting firm registered with the PCAOB and are required to be independent with respect to the Company in accordance with the U.S. federal securities laws and the applicable rules and regulations of the Securities and Exchange Commission and the PCAOB.
We conducted our audit in accordance with the standards of the PCAOB. Those standards require that we plan and perform the audit to obtain reasonable assurance about whether effective internal control over financial reporting was maintained in all material respects.
Our audit included obtaining an understanding of internal control over financial reporting, assessing the risk that a material weakness exists, testing and evaluating the design and operating effectiveness of internal control based on the assessed risk, and performing such other procedures as we considered necessary in the circumstances. We believe that our audit provides a reasonable basis for our opinion.
Definition and Limitations of Internal Control Over Financial Reporting
A company’s internal control over financial reporting is a process designed to provide reasonable assurance regarding the reliability of financial reporting and the preparation of financial statements for external purposes in accordance with generally accepted accounting principles. A company’s internal control over financial reporting includes those policies and procedures that (1) pertain to the maintenance of records that, in reasonable detail, accurately and fairly reflect the transactions and dispositions of the assets of the company; (2) provide reasonable assurance that transactions are recorded as necessary to permit preparation of financial statements in accordance with generally accepted accounting principles, and that receipts and expenditures of the company are being made only in accordance with authorizations of management and directors of the company; and (3) provide reasonable assurance regarding prevention or timely detection of unauthorized acquisition, use, or disposition of the company’s assets that could have a material effect on the financial statements.
Because of its inherent limitations, internal control over financial reporting may not prevent or detect misstatements. Also, projections of any evaluation of effectiveness to future periods are subject to the risk that controls may become inadequate because of changes in conditions, or that the degree of compliance with the policies or procedures may deteriorate.
/s/ Ernst & Young LLP
Minneapolis, Minnesota
December 6, 2019
31
Report of Independent Registered Public Accounting Firm
To the Shareholders and the Board of Directors of Hormel Foods Corporation
Opinion on the Financial Statements
We have audited the accompanying consolidated statements of financial position of Hormel Foods Corporation (the Company) as of October 27, 2019 and October 28, 2018, the related consolidated statements of operations, comprehensive income, changes in shareholders’ investment, and cash flows for each of the three years in the period ended October 27, 2019 and the related notes and financial statement schedule listed in the index at Item 15 (collectively referred to as the consolidated financial statements). In our opinion, the consolidated financial statements present fairly, in all material respects, the financial position of the Company at October 27, 2019 and October 28, 2018, and the results of its operations and its cash flows for each of the three years in the period ended October 27, 2019, in conformity with U.S. generally accepted accounting principles.
We also have audited, in accordance with the standards of the Public Company Accounting Oversight Board (United States) (PCAOB), the Company's internal control over financial reporting as of October 27, 2019, based on criteria established in Internal Control-Integrated Framework issued by the Committee of Sponsoring Organizations of the Treadway Commission (2013 framework), and our report dated December 6, 2019 expressed an unqualified opinion thereon.
Basis for Opinion
These financial statements are the responsibility of the Company's management. Our responsibility is to express an opinion on the Company’s financial statements based on our audits. We are a public accounting firm registered with the PCAOB and are required to be independent with respect to the Company in accordance with the U.S. federal securities laws and the applicable rules and regulations of the Securities and Exchange Commission and the PCAOB.
We conducted our audits in accordance with the standards of the PCAOB. Those standards require that we plan and perform the audit to obtain reasonable assurance about whether the financial statements are free of material misstatement, whether due to error or fraud. Our audits included performing procedures to assess the risks of material misstatement of the financial statements, whether due to error or fraud, and performing procedures that respond to those risks. Such procedures included examining, on a test basis, evidence regarding the amounts and disclosures in the financial statements. Our audits also included evaluating the accounting principles used and significant estimates made by management, as well as evaluating the overall presentation of the financial statements. We believe that our audits provide a reasonable basis for our opinion.
Critical Audit Matters
The critical audit matters communicated below are matters arising from the current period audit of the financial statements that were communicated or required to be communicated to the audit committee and that: (1) relate to accounts or disclosures that are material to the financial statements and (2) involved our especially challenging, subjective or complex judgments. The communication of critical audit matters does not alter in any way our opinion on the consolidated financial statements, taken as a whole, and we are not, by communicating the critical audit matters below, providing separate opinions on the critical audit matters or on the accounts or disclosures to which they relate.
32
Valuation of Alternative Investments - Pension Assets | ||||
Description of the Matter | At October 27, 2019, the Company had $1.5 billion in plan assets related to the defined benefit pension plans. Approximately 43% of the total pension assets are in global stocks - collective investment funds, private equity funds, real estate - domestic funds, and hedge funds. These types of investments are referred to as “alternative investments.” As documented in Note G of the financial statements, these alternative investments are valued at net asset value (NAV) or are valued using significant unobservable inputs. | |||
Auditing the fair value of these alternative investments is challenging because of the higher estimation uncertainty of the inputs to the fair value calculations, including the underlying NAVs, discounted cash flow valuations, comparable market valuations, and adjustments for currency, credit liquidity and other risks. Additionally, certain information regarding the fair value of these alternative investments is based on unaudited information available to management at the time of valuation. | ||||
How We Addressed the Matter in Our Audit | We obtained an understanding, evaluated the design and tested the operating effectiveness of controls addressing the risk of material misstatement relating to valuation of alternative investments. This included testing management's review controls over the valuation of alternative investments, for example, a review of fund performance in comparison to the selected benchmark and meetings with the investment advisor on a quarterly basis to review market performance and fund returns in comparison with relevant indices and the investment policy. We also tested management's independent price testing of underlying investments performed for certain investments on an annual basis. | |||
Our audit procedures included, among others, inquiring of management and the investment advisor regarding changes to the investment portfolio and investment strategies. We confirmed the fair value of the investments and ownership interest directly with the fund managers. We inspected the trust statement for observable transactions near year end to compare to the estimated fair value. We also obtained the latest audited financial statements for certain investments, performed a rollforward of the investment balance to compute an estimated market return on investment, and compared the market return to relevant benchmarks. | ||||
Valuation of Indefinite-Lived Intangible Assets - Trade Names | ||||
Description of the Matter | At October 27, 2019, the Company’s indefinite-lived intangible assets relating to brands, tradenames, and trademarks were $956.8 million. As explained in Note D of the financial statements, indefinite-lived intangible assets are tested by management for impairment at least annually. Due to the lack of excess value of certain trade names with combined carrying values representing less than $100 million, the Company elected to test these assets using a quantitative analysis. | |||
Auditing management’s quantitative indefinite-lived intangible asset impairment test was complex and highly judgmental due to the significant measurement uncertainty in determining the fair value of the asset which was subject to a quantitative impairment test. For example, the fair value estimate was sensitive to significant assumptions including future net sales projections, royalty rates, and discount rates, which are affected by expected future market or economic conditions and industry and company-specific qualitative factors. | ||||
How We Addressed the Matter in Our Audit | We obtained an understanding, evaluated the design and tested the operating effectiveness of controls over the Company’s indefinite lived intangible assets quantitative impairment test. This included evaluating controls over management's review of the forecasting process used to develop future net sales projections, as well as controls over the review of the other significant assumptions. We also tested management's controls to validate that the data used in the valuation was complete and accurate. | |||
Our audit procedures included, among others, assessing methodologies and testing the significant assumptions discussed above and the underlying data used by the Company in its analysis. We compared the significant assumptions used by management to forecasts used in the Company’s annual operating plans, current industry and economic trends, and other relevant factors. We assessed the historical accuracy of management’s estimates and performed sensitivity analyses of significant assumptions to evaluate the changes in the fair value of the trade names that would result from changes in the assumptions. Finally, we compared the fair values for each trade name subject to the quantitative impairment assessment to their carrying values in order to conclude on whether impairment charges were necessary. | ||||
/s/ Ernst & Young LLP
We have served as the Company's auditor since 1931.
Minneapolis, Minnesota
December 6, 2019
33
Consolidated Statements of Financial Position
See Notes to Consolidated Financial Statements.
October 27, | October 28, | |||||||
(in thousands, except share and per share amounts) | 2019 | 2018 | ||||||
Assets | ||||||||
Current Assets | ||||||||
Cash and Cash Equivalents | $ | $ | ||||||
Short-term Marketable Securities | ||||||||
Accounts Receivable (Net of Allowance for Doubtful Accounts of $4,063 at October 27, 2019, and $4,051 at October 28, 2018) | ||||||||
Inventories | ||||||||
Income Taxes Receivable | ||||||||
Prepaid Expenses | ||||||||
Other Current Assets | ||||||||
Total Current Assets | ||||||||
Goodwill | ||||||||
Other Intangibles | ||||||||
Pension Assets | ||||||||
Investments In and Receivables from Affiliates | ||||||||
Other Assets | ||||||||
Property, Plant and Equipment | ||||||||
Land | ||||||||
Buildings | ||||||||
Equipment | ||||||||
Construction in Progress | ||||||||
Less: Allowance for Depreciation | ( | ) | ( | ) | ||||
Net Property, Plant and Equipment | ||||||||
Total Assets | $ | $ | ||||||
Liabilities and Shareholders’ Investment | ||||||||
Current Liabilities | ||||||||
Accounts Payable | $ | $ | ||||||
Accrued Expenses | ||||||||
Accrued Workers Compensation | ||||||||
Accrued Marketing Expenses | ||||||||
Employee Related Expenses | ||||||||
Taxes Payable | ||||||||
Interest and Dividends Payable | ||||||||
Total Current Liabilities | ||||||||
Long-term Debt – Less Current Maturities | ||||||||
Pension and Post-retirement Benefits | ||||||||
Other Long-term Liabilities | ||||||||
Deferred Income Taxes | ||||||||
Shareholders’ Investment | ||||||||
Preferred Stock, Par Value $0.01 a Share — Authorized 160,000,000 Shares; Issued — None | ||||||||
Common Stock, Nonvoting, Par Value $0.01 a Share — Authorized 400,000,000 Shares; Issued — None | ||||||||
Common Stock, Par Value $0.01465 a Share — Authorized 1,600,000,000 Shares; Issued 534,488,746 Shares October 27, 2019 Issued 534,135,484 Shares October 28, 2018 | ||||||||
Additional Paid-in Capital | ||||||||
Accumulated Other Comprehensive Loss | ( | ) | ( | ) | ||||
Retained Earnings | ||||||||
Hormel Foods Corporation Shareholders’ Investment | ||||||||
Noncontrolling Interest | ||||||||
Total Shareholders’ Investment | ||||||||
Total Liabilities and Shareholders’ Investment | $ | $ | ||||||
34
Consolidated Statements of Operations
Fiscal Year Ended | ||||||||||||
October 27, | October 28, | October 29, | ||||||||||
(in thousands, except per share amounts) | 2019 | 2018* | 2017* | |||||||||
Net sales | $ | $ | $ | |||||||||
Cost of Products Sold | ||||||||||||
Gross Profit | ||||||||||||
Selling, General and Administrative | ||||||||||||
Goodwill/Intangible Impairment | ||||||||||||
Equity in Earnings of Affiliates | ||||||||||||
Operating Income | ||||||||||||
Other Income and Expense: | ||||||||||||
Interest and Investment Income | ||||||||||||
Interest Expense | ( | ) | ( | ) | ( | ) | ||||||
Earnings Before Income Taxes | ||||||||||||
Provision for Income Taxes | ||||||||||||
Net Earnings | ||||||||||||
Less: Net Earnings Attributable to Noncontrolling Interest | ||||||||||||
Net Earnings Attributable to Hormel Foods Corporation | $ | $ | $ | |||||||||
Net Earnings Per Share: | ||||||||||||
Basic | $ | $ | $ | |||||||||
Diluted | $ | $ | $ | |||||||||
Weighted-average Shares Outstanding: | ||||||||||||
Basic | ||||||||||||
Diluted | ||||||||||||
*Adjusted due to the adoption of Accounting Standards Update (ASU) 2017-07, Compensation - Retirement Benefits: Improving the Presentation of Net Periodic Pension Cost and Net Periodic Postretirement Benefit Cost (Topic 715). See Note A - Summary of Significant Accounting Policies.
See Notes to Consolidated Financial Statements.
35
Consolidated Statements of Comprehensive Income
Fiscal Year Ended | ||||||||||||
October 27, | October 28, | October 29, | ||||||||||
(in thousands) | 2019 | 2018 | 2017 | |||||||||
Net Earnings | $ | $ | $ | |||||||||
Other Comprehensive Income (Loss), Net of Tax: | ||||||||||||
Foreign Currency Translation | ( | ) | ( | ) | ( | ) | ||||||
Pension and Other Benefits | ( | ) | ||||||||||
Deferred Hedging | ( | ) | ( | ) | ||||||||
Total Other Comprehensive Income (Loss) | ( | ) | ||||||||||
Comprehensive Income | ||||||||||||
Less: Comprehensive Income Attributable to Noncontrolling Interest | ||||||||||||
Comprehensive Income Attributable to Hormel Foods Corporation | $ | $ | $ | |||||||||
See Notes to Consolidated Financial Statements.
36
Consolidated Statements of Changes in Shareholders’ Investment
Hormel Foods Corporation Shareholders | ||||||||||||||||||||||||||||||||||
(in thousands, except per | Common Stock | Treasury Stock | Additional Paid-In Capital | Retained Earnings | Accumulated Other Comprehensive Income (Loss) | Non-controlling Interest | Total Shareholders’ Investment | |||||||||||||||||||||||||||
share amounts) | Shares | Amount | Shares | Amount | ||||||||||||||||||||||||||||||
Balance at October 30, 2016 | $ | $ | $ | $ | $ | ( | ) | $ | $ | |||||||||||||||||||||||||
Net Earnings | ||||||||||||||||||||||||||||||||||
Other Comprehensive Income (Loss) | ||||||||||||||||||||||||||||||||||
Purchases of Common Stock | ( | ) | ( | ) | ( | ) | ||||||||||||||||||||||||||||
Stock-based Compensation Expense | ||||||||||||||||||||||||||||||||||
Exercise of Stock Options/ Restricted Shares | ||||||||||||||||||||||||||||||||||
Shares Retired | ( | ) | ( | ) | ( | ) | ( | ) | — | |||||||||||||||||||||||||
Declared Cash Dividends — $0.68 per Share | ( | ) | ( | ) | ||||||||||||||||||||||||||||||
Balance at October 29, 2017 | $ | $ | $ | $ | $ | ( | ) | $ | $ | |||||||||||||||||||||||||
Net Earnings | ||||||||||||||||||||||||||||||||||
Other Comprehensive Income (Loss) | ( | ) | ||||||||||||||||||||||||||||||||
Purchases of Common Stock | ( | ) | ( | ) | ( | ) | ||||||||||||||||||||||||||||
Stock-based Compensation Expense | ||||||||||||||||||||||||||||||||||
Exercise of Stock Options/ Restricted Shares | ||||||||||||||||||||||||||||||||||
Shares Retired | ( | ) | ( | ) | ( | ) | ( | ) | — | |||||||||||||||||||||||||
Declared Cash Dividends — $0.75 per Share | ( | ) | ( | ) | ||||||||||||||||||||||||||||||
Balance at October 28, 2018 | $ | $ | $ | $ | $ | ( | ) | $ | $ | |||||||||||||||||||||||||
Net Earnings | ||||||||||||||||||||||||||||||||||
Other Comprehensive Income (Loss) | ( | ) | ( | ) | ( | ) | ||||||||||||||||||||||||||||
Purchases of Common Stock | ( | ) | ( | ) | ( | ) | ||||||||||||||||||||||||||||
Stock-based Compensation Expense | ||||||||||||||||||||||||||||||||||
Exercise of Stock Options/ Restricted Shares | ||||||||||||||||||||||||||||||||||
Shares Retired | ( | ) | ( | ) | ( | ) | ( | ) | — | |||||||||||||||||||||||||
Cumulative Effect Adjustment from the Adoption of: | ||||||||||||||||||||||||||||||||||
ASU 2016-16 | ( | ) | ( | ) | ||||||||||||||||||||||||||||||
ASU 2017-12 | ( | ) | — | |||||||||||||||||||||||||||||||
ASU 2018-02 | ( | ) | ( | ) | ||||||||||||||||||||||||||||||
Declared Cash Dividends — $0.84 per Share | ( | ) | ( | ) | ||||||||||||||||||||||||||||||
Balance at October 27, 2019 | $ | $ | $ | $ | $ | ( | ) | $ | $ | |||||||||||||||||||||||||
See Notes to Consolidated Financial Statements
37
Consolidated Statements of Cash Flows
Fiscal Year Ended | ||||||||||||
October 27, | October 28, | October 29, | ||||||||||
(in thousands) | 2019 | 2018 | 2017 | |||||||||
Operating Activities | ||||||||||||
Net Earnings | $ | $ | $ | |||||||||
Adjustments to Reconcile to Net Cash Provided by Operating Activities: | ||||||||||||
Depreciation | ||||||||||||
Amortization | ||||||||||||
Goodwill/Intangible Impairment | ||||||||||||
Equity in Earnings of Affiliates | ( | ) | ( | ) | ( | ) | ||||||
Distributions Received from Equity Method Investees | ||||||||||||
Provision for Deferred Income Taxes | ( | ) | ||||||||||
(Gain) Loss on Property/Equipment Sales and Plant Facilities | ( | ) | ( | ) | ||||||||
Gain on Sale of Business | ( | ) | ||||||||||
Gain on Insurance Proceeds | ( | ) | ||||||||||
Non-cash Investment Activities | ( | ) | ( | ) | ( | ) | ||||||
Stock-based Compensation Expense | ||||||||||||
Changes in Operating Assets and Liabilities, Net of Acquisitions: | ||||||||||||
(Increase) Decrease in Accounts Receivable | ( | ) | ( | ) | ||||||||
(Increase) Decrease in Inventories | ( | ) | ( | ) | ||||||||
(Increase) Decrease in Prepaid Expenses and Other Current Assets | ( | ) | ( | ) | ( | ) | ||||||
(Decrease) Increase in Pension and Post-retirement Benefits | ( | ) | ( | ) | ( | ) | ||||||
(Decrease) Increase in Accounts Payable and Accrued Expenses | ( | ) | ( | ) | ||||||||
(Decrease) Increase in Net Income Taxes Payable | ( | ) | ||||||||||
Net Cash Provided by Operating Activities | $ | $ | $ | |||||||||
Investing Activities | ||||||||||||
Net (Purchase) Sale of Securities | $ | ( | ) | $ | $ | |||||||
Proceeds from Sale of Business | ||||||||||||
Acquisitions of Businesses/Intangibles | ( | ) | ( | ) | ||||||||
Purchases of Property/Equipment | ( | ) | ( | ) | ( | ) | ||||||
Proceeds from Sales of Property/Equipment | ||||||||||||
(Increase) Decrease in Investments, Equity in Affiliates, and Other Assets | ( | ) | ( | ) | ||||||||
Proceeds from Company-owned Life Insurance | ||||||||||||
Proceeds from Insurance Recoveries | ||||||||||||
Net Cash Provided by (Used in) Investing Activities | $ | $ | ( | ) | $ | ( | ) | |||||
Financing Activities | ||||||||||||
Proceeds from Long-term Debt | $ | $ | $ | |||||||||
Principal Payments on Long-term Debt | ( | ) | ( | ) | ||||||||
Dividends Paid on Common Stock | ( | ) | ( | ) | ( | ) | ||||||
Share Repurchase | ( | ) | ( | ) | ( | ) | ||||||
Proceeds from Exercise of Stock Options | ||||||||||||
Net Cash (Used in) Provided by Financing Activities | $ | ( | ) | $ | $ | ( | ) | |||||
Effect of Exchange Rate Changes on Cash | ( | ) | ( | ) | ||||||||
Increase in Cash and Cash Equivalents | ||||||||||||
Cash and Cash Equivalents at Beginning of Year | ||||||||||||
Cash and Cash Equivalents at End of Year | $ | $ | $ | |||||||||
See Notes to Consolidated Financial Statements.
38
Notes to Consolidated Financial Statements
Note A
Summary of Significant Accounting Policies
Principles of Consolidation: The consolidated financial statements include the accounts of Hormel Foods Corporation (the Company) and all of its majority-owned subsidiaries after elimination of intercompany accounts, transactions, and profits.
Use of Estimates: The preparation of financial statements in conformity with U.S. generally accepted accounting principles (U.S. GAAP) requires management to make estimates and assumptions that affect the amounts reported in the financial statements and accompanying notes. Actual results could differ from those estimates.
Cash and Cash Equivalents: The Company considers all investments with an original maturity of three months or less on their acquisition date to be cash equivalents. The Company’s cash equivalents as of October 27, 2019, and October 28, 2018, consisted primarily of bank deposits, money market funds rated AAA, or other highly liquid investment accounts. The Net Asset Value (NAV) of the Company’s money market funds is based on the market value of the securities in the portfolio.
Fair Value Measurements: Pursuant to the provisions of Accounting Standards Codification (ASC) 820, Fair Value Measurements and Disclosures (ASC 820), the Company measures certain assets and liabilities at fair value or discloses the fair value of certain assets and liabilities recorded at cost in the consolidated financial statements. Fair value is calculated as the price that would be received to sell an asset or paid to transfer a liability in an orderly transaction between market participants at the measurement date (an exit price). ASC 820 establishes a fair value hierarchy which requires assets and liabilities measured at fair value to be categorized into one of three levels based on the inputs used in the valuation. The Company classifies assets and liabilities in their entirety based on the lowest level of input significant to the fair value measurement. The three levels are defined as follows:
Level 1: Observable inputs based on quoted prices (unadjusted) in active markets for identical assets or liabilities.
Level 2: Observable inputs, other than those included in Level 1, based on quoted prices for similar assets and liabilities in active markets, or quoted prices for identical assets and liabilities in inactive markets.
Level 3: Unobservable inputs that reflect an entity’s own assumptions about what inputs a market participant would use in pricing the asset or liability based on the best information available in the circumstances.
See additional discussion regarding the Company’s fair value measurements in Note G - Pension and Other Post-retirement Benefits, Note H - Derivatives and Hedging, and Note M - Fair Value Measurements.
Inventories: Inventories are stated at the lower of cost or net realizable value. Cost is determined principally under the average cost method. Adjustments to the Company’s lower of cost or net realizable value inventory reserve are reflected in Cost of Products Sold in the Consolidated Statements of Operations.
Property, Plant and Equipment: Property, Plant and Equipment are stated at cost. The Company uses the straight-line method in computing depreciation. The annual provisions for depreciation have been computed principally using the following ranges of asset lives: buildings 20 to 40 years, and equipment 3 to 14 years.
Impairment of Long-Lived Assets and Definite-Lived Intangible Assets: Definite-lived intangible assets are amortized over their estimated useful lives. The Company reviews long-lived assets and definite-lived intangible assets for impairment annually, or more frequently when events or changes in circumstances indicate that the carrying amount of an asset may not be recoverable. If impairment indicators are present and the estimated future undiscounted cash flows are less than the carrying
39
Goodwill and Other Indefinite-Lived Intangibles: Indefinite-lived intangible assets are originally recorded at their estimated fair values at date of acquisition and the residual of the purchase price is recorded to goodwill. Goodwill and other indefinite-lived intangible assets are allocated to reporting units that will receive the related sales and income. Goodwill and indefinite-lived intangible assets are tested annually for impairment or more frequently if impairment indicators arise.
In conducting the annual impairment test for goodwill, the Company has the option to first assess qualitative factors to determine whether it is more likely than not (> 50% likelihood) the fair value of any reporting unit is less than its carrying amount. If the Company elects to perform a qualitative assessment and determines an impairment is more likely than not, the Company is required to perform a quantitative impairment test. Otherwise, no further analysis is required. Alternatively, the Company may elect to proceed directly to the quantitative impairment test.
In conducting a qualitative assessment, the Company analyzes actual and projected growth trends for net sales, gross margin, and segment profit for each reporting unit, as well as historical performance versus plan and the results of prior quantitative tests. Additionally, the Company assesses factors that may impact the business's financial results such as macroeconomic conditions and the related impact, market-related exposures, plans to market for sale all or a portion of the business, competitive changes, new or discontinued product lines, and changes in key personnel.
If performed, the quantitative goodwill impairment test is performed at the reporting unit level. First, the fair value of each reporting unit is compared to its corresponding carrying value, including goodwill. The fair value of each reporting unit is estimated using discounted cash flow valuations (Level 3), which incorporate assumptions regarding future growth rates, terminal values, and discount rates. The estimates and assumptions used consider historical performance and are consistent with the assumptions used in determining future profit plans for each reporting unit, which are approved by the Company’s Board of Directors. If the quantitative assessment results in the carrying value exceeding the fair value of any reporting unit, the results from the quantitative analysis will be relied upon to determine both the existence and amount of goodwill impairment. An impairment loss will be recognized for the amount by which the reporting unit’s carrying amount exceeds its fair value, not to exceed the carrying amount of goodwill in that reporting unit.
During the fourth quarter of fiscal 2019, the Company completed its annual goodwill impairment tests and elected to perform a qualitative assessment. As a result of the qualitative testing during fiscal 2019 and 2018, and quantitative testing during fiscal 2017, no impairment charges were recorded.
In conducting the annual impairment test for its indefinite-lived intangible assets, the Company first performs a qualitative assessment to determine whether it is more likely than not (> 50% likelihood) an indefinite-lived intangible asset is impaired. If the Company concludes this is the case, a quantitative test for impairment must be performed. Otherwise, the Company does not need to perform a quantitative test.
In conducting the qualitative assessment, the Company analyzes growth rates for historical and projected net sales and the results of prior quantitative tests. Additionally, each reporting unit assesses critical items that may impact their intangible assets or the applicable royalty rates to determine if there are factors that could indicate impairment of the asset.
If performed, the quantitative impairment test compares the fair value and carrying value of the indefinite-lived intangible asset. The fair value of indefinite-lived intangible assets is primarily determined on the basis of estimated discounted value using the relief from royalty method (Level 3), which incorporates assumptions regarding future sales projections, discount rates, and royalty rates. If the carrying value exceeds fair value, the indefinite-lived intangible asset is considered impaired and an impairment charge is recorded for the difference. Even if not required, the Company periodically elects to perform the quantitative test in order to confirm the qualitative assessment.
During the fourth quarter of fiscal 2019, the Company completed its annual indefinite-lived asset impairment tests and elected to perform a qualitative assessment. As a result of the review, it was revealed that further assessment in the form of a quantitative test was necessary for two indefinite-lived intangible assets. No impairment charges were recorded for fiscal 2019. During fiscal 2018, a $17.3 million intangible asset impairment charge was recorded for the CytoSport trademark. See additional discussion regarding the Company’s goodwill and intangible assets in Note E - Goodwill and Intangible Assets. During fiscal years 2018 and 2017, there were no other material impairment charges recorded.
Pension and Other Post-retirement Benefits: The Company has elected to use the corridor approach to recognize expenses related to its defined benefit pension and other post-retirement benefit plans. Under the corridor approach, actuarial gains or losses resulting from experience and changes in assumptions are deferred and amortized over future periods. For the defined benefit pension plans, the unrecognized gains and losses are amortized when the net gain or loss exceeds 10.0% of the greater of the projected benefit obligation or the fair value of plan assets at the beginning of the year. For the other post-retirement plans, the unrecognized gains and losses are amortized when the net gain or loss exceeds 10.0% of the accumulated pension benefit obligation at the beginning of the year. For plans with active employees, net gains or losses in excess of the corridor are amortized over the average remaining service period of participating employees expected to receive benefits under those plans.
40
For plans with only retiree participants, net gains or losses in excess of the corridor are amortized over the average remaining life of the retirees receiving benefits under those plans.
Contingent Liabilities: The Company may be subject to investigations, legal proceedings, or claims related to the ongoing operation of its business, including claims both by and against the Company. Such proceedings typically involve claims related to product liability, contract disputes, wage and hour laws, employment practices, or other actions brought by employees, consumers, competitors, or suppliers. The Company establishes accruals for its potential exposure for claims when losses become probable and reasonably estimable. Where the Company is able to reasonably estimate a range of potential losses, the Company records the amount within that range which constitutes the Company’s best estimate. The Company also discloses the nature of and range of loss for claims against the Company when losses are reasonably possible and material.
Foreign Currency Translation: Assets and liabilities denominated in foreign currency are translated at the current exchange rate as of the date of the Consolidated Statements of Financial Position. Amounts in the Consolidated Statements of Operations are translated at the average monthly exchange rate. Translation adjustments resulting from fluctuations in exchange rates are recorded as a component of Accumulated Other Comprehensive Loss in Shareholders’ Investment.
When calculating foreign currency translation, the Company deemed its foreign investments to be permanent in nature and has not provided for taxes on currency translation adjustments arising from converting the investment in a foreign currency to U.S. dollars.
Equity Method Investments: The Company has a number of investments in joint ventures where its voting interests are in excess of 20 percent but not greater than 50 percent and for which there are no other indicators of control. The Company accounts for such investments under the equity method of accounting and its underlying share of each investee’s equity is reported in the Consolidated Statements of Financial Position as part of Investments In and Receivables from Affiliates.
Allowance for Doubtful Accounts: The Company estimates the Allowance for Doubtful Accounts based on a combination of factors, including the age of its Accounts Receivable balances, customer history, collection experience, and current market factors. Additionally, a specific reserve may be established if the Company becomes aware of a customer’s inability to meet its financial obligations.
Shipping and Handling Costs: The Company’s shipping and handling expenses are included in Cost of Products Sold on the Consolidated Statements of Operations.
Income Taxes: The Company records income taxes in accordance with the liability method of accounting. Deferred taxes are recognized for the estimated taxes ultimately payable or recoverable based on enacted tax law. Changes in enacted tax rates are reflected in the tax provision as they occur.
41
In accordance with ASC 740, Income Taxes, the Company recognizes a tax position in its financial statements when it is more likely than not that the position will be sustained upon examination based on the technical merits of the position. That position is then measured at the largest amount of benefit that is greater than 50 percent likely of being realized upon ultimate settlement.
Employee Stock Options: The Company records stock-based compensation expense in accordance with ASC 718, Compensation – Stock Compensation. For options subject to graded vesting, the Company recognizes stock-based compensation expense ratably over the shorter of the vesting period or requisite service period. Stock-based compensation expense for grants made to retirement-eligible employees is recognized on the date of grant. The Company estimates forfeitures at the time of grant based on historical experience and revises in subsequent periods if actual forfeitures differ.
Supplemental Cash Flow Information: Non-cash investment activities presented on the Consolidated Statements of Cash Flows primarily consist of unrealized gains or losses on the Company’s rabbi trust. The noted investments are included in Other Assets on the Consolidated Statements of Financial Position. Changes in the value of these investments are presented in the Consolidated Statements of Operations as Interest and Investment Income.
Accounting Changes and Recent Accounting Pronouncements
New Accounting Pronouncements adopted in current fiscal year
In May 2014, the FASB issued ASU 2014-09, Revenue from Contracts with Customers (Topic 606). This topic converges the guidance within U.S. GAAP and international financial reporting standards and supersedes ASC 605, Revenue Recognition. The new standard requires companies to recognize revenue to depict the transfer of goods or services to customers in amounts that reflect the consideration to which the company expects to be entitled in exchange for those goods or services. The new standard provides enhanced disclosures about revenue, guidance for transactions which were not previously addressed, and improves guidance for multiple-element arrangements. The new guidance was effective for annual reporting periods beginning after December 15, 2017. The updated guidance is to be applied either retrospectively or by using a cumulative effect adjustment. The Company adopted the provisions of the new standard using the full retrospective method at the beginning of fiscal 2019. Refer to Note B - Revenue Recognition for additional disclosures.
In October 2016, the FASB issued ASU 2016-16, Income Taxes - Intra-Entity Transfers of Assets Other Than Inventory (Topic 740). The updated guidance requires the recognition of the income tax consequences of an intra-entity asset transfer, other than transfers of inventory, when the transfer occurs. For intra-entity transfers of inventory, the income tax effects will continue to be deferred until the inventory has been sold to a third party. The updated guidance was effective for reporting periods beginning after December 15, 2017, with early adoption permitted only within the first interim period of a fiscal year. The guidance is required to be applied on a modified retrospective basis through a cumulative effect adjustment directly to retained earnings as of the beginning of the period of adoption. The Company adopted the updated provisions at the beginning of fiscal 2019, resulting in a reclassification from prepaid tax assets to deferred tax assets. In addition, due to the impact of the lower tax rate on deferred tax balances resulting from the Tax Cuts and Jobs Act (Tax Act), the Company recognized a cumulative effect adjustment to Retained Earnings of $10.5 million.
In March 2017, the FASB issued ASU 2017-07, Compensation - Retirement Benefits: Improving the Presentation of Net Periodic Pension Cost and Net Periodic Postretirement Benefit Cost (Topic 715). The updated guidance requires an employer to report the service cost component of net periodic pension cost and net periodic post-retirement benefit cost in the same line item as other compensation costs. Other components of net periodic pension cost and net periodic post-retirement benefit cost must be presented in the income statement separately from the service cost component and outside income from operations. Additionally, only the service cost component is eligible for capitalization. This guidance was effective for fiscal years, and interim periods within those fiscal years, beginning after December 15, 2017. The updated guidance should be applied retrospectively for the presentation of components of net benefit cost and prospectively for the capitalization of the service cost component of net benefit cost. The Company adopted the updated provisions at the beginning of fiscal 2019. The Company elected to utilize a practical expedient which allows the Company to use historical amounts disclosed in the Pension and Other Post-retirement Benefits footnote as an estimation basis for retrospectively applying the requirements to separately report the other components in the Consolidated Statements of Operations. Due to the retrospective adoption, the Company reclassified
42
$19.0 million and $3.7 million of non-service cost components of net periodic benefit costs from Operating Income to Interest and Investment Income on the Consolidated Statements of Operations for the years ended October 28, 2018 and October 29, 2017.
In August 2017, the FASB issued ASU 2017-12, Derivatives and Hedging - Targeted Improvements to Accounting for Hedging Activities (Topic 815). The updated guidance expands an entity’s ability to hedge nonfinancial and financial risk components and reduce complexity in fair value hedges of interest rate risk. The guidance eliminates the requirement to separately measure and report hedge ineffectiveness and generally requires the entire change in the fair value of a hedging instrument to be presented in the same income statement line as the hedged item. The guidance also eases certain documentation and assessment requirements and modifies the accounting for components excluded from the assessment of hedge effectiveness. Entities will apply the amendments to cash flow and net investment hedge relationships that exist on the date of adoption using a modified retrospective approach. The presentation and disclosure requirements apply prospectively. The updated guidance is effective for fiscal years beginning after December 15, 2018, including interim periods within those years. Early adoption is permitted in any interim or annual period. The Company early adopted the updated guidance at the beginning of fiscal 2019; therefore, eliminating the requirement to separately measure and report hedge ineffectiveness. The Company applied the amendment to cash flow hedge relationships existing on the date of adoption using a modified retrospective approach. Presentation and disclosure requirements were applied on a prospective basis. The adoption resulted in an immaterial adjustment from Retained Earnings to Accumulated Other Comprehensive Loss.
In February 2018, the FASB issued ASU 2018-02, Income Statement - Reporting Comprehensive Income (Topic 220). The updated guidance allows entities to reclassify stranded income tax effects resulting from the Tax Act from Accumulated Other comprehensive income to retained earnings in their consolidated financial statements. Under the Tax Act, deferred taxes were adjusted to reflect the reduction of the historical corporate income tax rate to the newly enacted corporate income tax rate, which left the tax effects on items within Accumulated Other Comprehensive Loss stranded at an inappropriate tax rate. The updated guidance is effective for fiscal years beginning after December 15, 2018, including interim periods within those years. Early adoption is permitted in any interim period and should be applied either in the period of adoption or retrospectively to each period (or periods) in which the effect of the change in the U.S. federal corporate income tax rate in the Tax Act is recognized. The Company early adopted the updated provisions at the beginning of fiscal 2019, resulting in a reclassification of $53.8 million from Accumulated Other Comprehensive Loss to Retained Earnings.
In July 2018, the FASB issued ASU 2018-09, Codification Improvements. This amendment makes changes to a variety of topics to clarify, correct errors in, or make minor improvements to the Accounting Standards Codification (ASC). The transition and effective date guidance is based on the facts and circumstances of each amendment. Some of the amendments do not require transition guidance and will be effective upon issuance of ASU 2018-09. The amendments effective upon issuance did not have a material impact on the Company's consolidated financial statements. A majority of the amendments do have transition guidance with effective dates for annual periods beginning after December 15, 2018. The Company early adopted the remaining amendments in the fourth quarter of fiscal 2019. The adoption did not have an impact on the Company’s consolidated financial statements.
In August 2018, the FASB issued ASU No. 2018-15, Intangibles - Goodwill and Other - Internal-Use Software: Customer’s Accounting for Implementation Costs Incurred in a Cloud Computing Arrangement That Is a Service Contract (Topic 350). The amendments in the update align the requirements for capitalizing implementation costs incurred in a hosting arrangement that is a service contract with the requirements for capitalizing implementation costs incurred to develop or obtain internal-use software (and hosting arrangements that include an internal-use software license). The amendments are effective for fiscal years beginning after December 15, 2019, and for interim periods within those fiscal years and is to be applied either retrospectively or prospectively to all implementation costs incurred after the adoption date. Early adoption is permitted, including adoption in any interim period. The Company early adopted the updated provisions on a prospective basis at the beginning of fiscal 2019. Subsequent to adoption, the Company has capitalized $27.6 million in cloud implementation costs, primarily associated with the transition to Oracle Cloud Solutions.
New Accounting Pronouncements not yet adopted
In February 2016, the FASB issued ASU 2016-02, Leases (Topic 842). The updated guidance requires lessees to recognize a right-of-use asset and lease liability for all leases with terms of more than 12 months. Recognition, measurement, and presentation of expenses will depend on the classification as a finance or operating lease. The update also requires expanded quantitative and qualitative disclosures. Accounting guidance for lessors is largely unchanged. The requirements of the new standard are effective for fiscal years beginning after December 15, 2018, including interim periods within those fiscal years. The Company will adopt the provisions of this new accounting standard at the beginning of fiscal 2020. For transition purposes, the Company elected the package of practical expedients to not reassess prior conclusions related to contracts containing leases, lease classification, and initial direct costs. In July 2018, the FASB issued ASU 2018-11, which provides an optional transition method allowing entities the option to use the effective date as the date of initial application on transition. The Company elected this transition method, and as a result, the Company will not adjust its comparative period financial information or make the new required lease disclosures for periods before the effective date. The Company elected to not separate lease and non-lease components. The Company did not elect the hindsight practical expedient. In connection with the adoption of the new lease accounting standard, the Company completed scoping reviews and developed business processes, accounting policies and internal controls. The Company implemented new lease accounting software to provide a centralized repository and assist in the preparation of the standard's additional reporting requirements. Based on the assessment to-date, the Company expects an
43
increase of approximately $110 million to $120 million to assets and an offsetting increase to liabilities on the Consolidated Statements of Financial Position. The Company expects the lease standard to have an immaterial impact on the Consolidated Statements of Operations and the Consolidated Statements of Cash Flows.
In June 2016, the FASB issued ASU 2016-13, Financial Instruments - Credit Losses: Measurement of Credit Losses on Financial Instruments (Topic 326). The update provides guidance on the measurement of credit losses for most financial assets and certain other instruments that are not measured at fair value through net income. The amendment replaces the current incurred loss impairment approach with a methodology to reflect expected credit losses and requires consideration of a broader range of reasonable and supportable information to explain credit loss estimates. The updated guidance is to be applied on a modified retrospective approach and is effective for fiscal years, and interim periods within those fiscal years, beginning after December 15, 2019. Early adoption is permitted for all entities for fiscal years beginning after December 15, 2018, and interim periods therein. The Company is currently assessing the timing and impact of adopting the updated provisions.
In August 2018, the FASB issued ASU 2018-13, Fair Value Measurement - Disclosure Framework (Topic 820).
The updated guidance requires entities to disclose changes in unrealized gains and losses for the period included in other comprehensive income for recurring Level 3 fair value measurements and the range and weighted average of significant unobservable inputs used to develop Level 3 fair value measurements. Amendments in this guidance also require disclosure of transfers into and out of Level 3 of the fair value hierarchy, purchases and issues of Level 3 assets and liabilities, and clarify that the measurement uncertainty disclosure is about the uncertainty in measurement as of the reporting date. The guidance removes requirements to disclose the amounts and reasons for transfers between Level 1 and Level 2, policy for timing between of transfers between levels, and the valuation processes for Level 3 fair value measurements. The updated guidance is effective for fiscal years, and interim periods within those fiscal years, beginning after December 15, 2019. Early adoption is permitted for any removed or modified disclosures. The Company is currently assessing the timing and impact of adopting the updated provisions.
In August 2018, the FASB issued ASU 2018-14, Compensation - Retirement Benefits - Defined Benefit Plans (Topic 715). The updated guidance requires additional disclosures of weighted-average interest crediting rates for cash balance plans and an explanation of the reasons for significant gains and losses related to changes in the benefit obligation. Amendments in the guidance also clarify the requirement to disclose the projected benefit obligation (PBO) and fair value of plan assets for plans with PBOs in excess of plan assets. The same disclosure is needed for the accumulated benefit obligation (ABO) and fair value of plan assets for plans with ABOs in excess of plan assets. The guidance removes certain previous disclosure requirements no longer considered cost beneficial. The amendments are effective for fiscal years ending after December 15, 2020, with early adoption permitted. The Company is currently assessing the timing and impact of adopting the updated provisions.
Note B
Revenue Recognition
Revenue from Contracts with Customers: Effective October 29, 2018, the Company adopted ASC 606, Revenue from Contracts with Customers using the full retrospective adoption method. The impact of adopting this guidance was immaterial to the Company’s financial statements and related disclosures. Under ASC 606, a contract with a customer is an agreement which both parties have approved, that creates enforceable rights and obligations, has commercial substance, where payment terms are identified, and collectability is probable. The Company’s customer contracts predominantly contain a single performance obligation to fulfill customer orders for the purchase of specified products. A performance obligation is a promise in a contract to transfer a distinct good or service to the customer. Revenue from product sales is primarily identified by purchase orders (“contracts”) which in some cases are governed by a master sales agreement. The purchase orders in combination with the invoice typically specify quantity and product(s) ordered, shipping terms, and certain aspects of the transaction price including discounts. Contracts are at standalone pricing or governed by pricing lists or brackets. The Company's revenue is recognized at the point in time when performance obligations have been satisfied, and control of the product has transferred to the customer. This is typically once the shipped product is received or picked up by the customer. Revenues are recognized at the net consideration the Company expects to receive in exchange for the goods. The amount of net consideration recognized includes estimates of variable consideration, including costs for trade promotion programs, consumer incentives, and allowances and discounts associated with distressed or potentially unsaleable products.
A majority of the Company’s revenue is short-term in nature with shipments within one year from order date. The Company's payment terms generally range between 7 to 45 days and vary by sales channel and other factors.
The Company promotes products through advertising, consumer incentives, and trade promotions. These programs include discounts, slotting fees, coupons, rebates, and in-store display incentives. Customer trade promotion and consumer incentive activities are recorded as a reduction to the sale price based on amounts estimated as variable consideration. The Company
44
estimates variable consideration at the expected value method to determine the total consideration which the Company expects to be entitled. Estimated amounts are included in the transaction price to the extent it is probable that a significant reversal of cumulative revenue recognized will not occur when the uncertainty associated with the variable consideration is resolved. The Company’s estimates of variable consideration and determination of whether to include estimated amounts in the transaction price are based largely on an assessment of anticipated performance and all information (historical, current and forecasted) that is reasonably available.
The Company elected to account for shipping and handling costs as contract fulfillment costs, and exclude taxes imposed on and collected from customers in revenue producing transactions (e.g., sales, use, and value added taxes) from the transaction price.
Disaggregation of Revenue: The Company discloses revenue by reportable segment, sales channel, and class of similar product in Note P - Segment Reporting.
Contract Balances: The Company does not have significant deferred revenue or unbilled receivable balances as a result of transactions with customers.
Contract Costs: The Company elected to apply the practical expedient to not capitalize contract costs to obtain contracts with duration of one year or less, which are expensed and included in the Consolidated Statements of Operations.
Note C
Acquisitions and Divestitures
Divestiture: On April 15, 2019, the Company completed the sale of CytoSport, Inc. (Cytosport), which includes the Muscle Milk® and Evolve® brands, to PepsiCo, Inc., and received final proceeds of $479.8 million. The divestiture resulted in a pretax gain of $16.5 million recognized in Selling, General and Administrative expense and a tax benefit of $17.0 million recognized within the Provision for Income Taxes on the Consolidated Statements of Operations.
CytoSport's results of operations through the date of divestiture are included within Earnings Before Income Taxes in the Consolidated Statements of Operations and are reflected within the Grocery Products and International & Other segments (See Note P - Segment Reporting).
Acquisition: On November 27, 2017, the Company acquired Columbus Manufacturing, Inc. (Columbus), an authentic premium deli meat and salami company, from Arbor Investments for a final purchase price of $857.4 million. The transaction was funded with cash on hand and by borrowing $375.0 million under a term loan facility and $375.0 million under a revolving credit facility.
Columbus specializes in authentic premium deli meat and salami. This acquisition allows the Company to enhance its scale in the deli by broadening its portfolio of products, customers, and consumers.
The acquisition was accounted for as a business combination using the acquisition method. The Company obtained an independent appraisal. A final allocation of the purchase price to the acquired assets, liabilities, and goodwill is presented in the table below.
(in thousands) | |||
Accounts Receivable | $ | ||
Inventory | |||
Prepaid and Other Assets | |||
Other Assets | |||
Property, Plant and Equipment | |||
Intangible Assets | |||
Goodwill | |||
Current Liabilities | ( | ) | |
Deferred Taxes | ( | ) | |
Purchase Price | $ | ||
Goodwill is calculated as the excess of the purchase price over the fair value of the net assets recognized. The $610.6 million of goodwill recorded as part of the acquisition primarily reflects the value of the potential to expand presence in the deli channel and serve as the catalyst for uniting all of the Company's deli businesses into one customer-facing organization. The goodwill and intangible assets have been allocated to the Refrigerated Foods segment.
Operating results for this acquisition have been included in the Company’s Consolidated Statements of Operations from the date of acquisition and are reflected in the Refrigerated Foods segment.
45
On August 22, 2017, the Company acquired Cidade do Sol (Ceratti) for a final purchase price of $103.3 million. The transaction was funded by the Company with cash on hand. The Company completed a final allocation of the fair value of Ceratti based on the acquisition method of accounting and third party valuation appraisals. Refer to Note E - Goodwill and Intangible Assets for amounts assigned to goodwill and intangible assets.
Ceratti is a growing, branded, value-added meats company in Brazil offering more than 70 products in 15 categories including authentic meats such as mortadella, sausage, and salami for Brazilian retail and foodservice markets under the popular Ceratti® brand. The acquisition of the Ceratti® brand allows the Company to establish a full in-country presence in the fast-growing Brazilian market with a premium brand.
Operating results for this acquisition have been included in the Company’s Consolidated Statements of Operations from the date of acquisition and are reflected in the International & Other segment.
On August 16, 2017, the Company acquired Fontanini Italian Meats and Sausages (Fontanini), a branded foodservice business, from Capitol Wholesale Meats, Inc. for a final purchase price of $425.7 million. The transaction was funded with cash on hand and by utilizing short-term financing. The transaction provided a cash flow benefit resulting from the amortization of the tax basis of assets, the net present value of which is approximately $64.7 million. The Company completed a final allocation of the fair value of Fontanini based on the acquisition method of accounting and third party valuation appraisals. Refer to Note E - Goodwill and Intangible Assets for amounts assigned to goodwill and intangible assets.
Fontanini specializes in authentic Italian meats and sausages, as well as a variety of other premium meat products including pizza toppings and meatballs and allows the Company to expand the foodservice business.
Note D
Inventories
Principal components of inventories are:
(in thousands) | October 27, 2019 | October 28, 2018 | ||||||
Finished Products | $ | $ | ||||||
Raw Materials and Work-in-Process | ||||||||
Operating Supplies | ||||||||
Maintenance Materials and Parts | ||||||||
Total | $ | $ | ||||||
46
Note E
Goodwill and Intangible Assets
Goodwill: The changes in the carrying amount of goodwill for the fiscal years ended October 27, 2019, and October 28, 2018, are presented in the table below. Beginning balances for fiscal 2019 have been reclassified to conform to the current year presentation between segments. See Note P - Segment Reporting and Note C - Acquisitions and Divestitures for additional information. The reduction in goodwill during fiscal 2019 is due to the divestiture of CytoSport on April 15, 2019. Additions in fiscal 2018 relate to the acquisition of Columbus.
(in thousands) | Grocery Products | Refrigerated Foods | Jennie-O Turkey Store | International & Other | Total | |||||||||||||||
Balance at October 29, 2017 | $ | $ | $ | $ | $ | |||||||||||||||
Goodwill Acquired | ||||||||||||||||||||
Foreign Currency Translation | ( | ) | ( | ) | ||||||||||||||||
Purchase Adjustments | ||||||||||||||||||||
Reported Balance at October 28, 2018 | $ | $ | $ | $ | $ | |||||||||||||||
Segment Reclassification | ( | ) | ( | ) | ||||||||||||||||
Adjusted Balance at October 28, 2018 | $ | $ | $ | $ | $ | |||||||||||||||
Goodwill Sold | ( | ) | ( | ) | ( | ) | ||||||||||||||
Foreign Currency Translation | ( | ) | ( | ) | ||||||||||||||||
Balance as of October 27, 2019 | $ | $ | $ | $ | $ | |||||||||||||||
Intangible Assets: The carrying amounts for indefinite-lived intangible assets are presented in the table below. The decrease primarily represents the fair value of trademarks sold as part of the CytoSport divestiture of $147.9 million in fiscal 2019.
October 27, | October 28, | |||||||
(in thousands) | 2019 | 2018 | ||||||
Brands/Tradenames/Trademarks | $ | $ | ||||||
Other Intangibles | ||||||||
Foreign Currency Translation | ( | ) | ( | ) | ||||
Total | $ | $ | ||||||
The gross carrying amount and accumulated amortization for definite-lived intangible assets are presented in the table below. In fiscal 2019, customer relationships of $13.4 million were sold as part of the divestiture of CytoSport. In fiscal 2018, customer relationships of $29.4 million were acquired related to Columbus.
October 27, 2019 | October 28, 2018 | |||||||||||||||||||||
Gross | Weighted- | Gross | Weighted- | |||||||||||||||||||
Carrying | Accumulated | Avg Life | Carrying | Accumulated | Avg Life | |||||||||||||||||
(in thousands) | Amount | Amortization | (in Years) | Amount | Amortization | (in Years) | ||||||||||||||||
Customer Lists/Relationships | $ | $ | ( | ) | $ | $ | ( | ) | ||||||||||||||
Other Intangibles | ( | ) | ( | ) | ||||||||||||||||||
Foreign Currency Translation | ( | ) | — | ( | ) | — | ||||||||||||||||
Total | $ | $ | ( | ) | $ | $ | ( | ) | ||||||||||||||
Amortization expense for the last three fiscal years was as follows:
(in millions) | ||||
2019 | $ | |||
2018 | ||||
2017 | ||||
Estimated annual amortization expense for the five fiscal years after October 27, 2019, is as follows:
(in millions) | ||||
2020 | $ | |||
2021 | ||||
2022 | ||||
2023 | ||||
2024 | ||||
47
During the fourth quarter of fiscal years 2019, 2018, and 2017, the Company completed the required annual impairment tests of indefinite-lived intangible assets and goodwill. An impairment was indicated for the CytoSport trademark in the Grocery Products segment, resulting in a charge of $17.3 million in fiscal 2018. No other impairment was indicated. Useful lives of intangible assets were also reviewed during this process, with no material changes identified.
Note F
Long-term Debt and Other Borrowing Arrangements
Long-term Debt consists of:
(in thousands) | October 27, 2019 | October 28, 2018 | ||||||
Term Loan | $ | $ | ||||||
Senior Unsecured Notes, with Interest at 4.125%, Interest Due Semi-annually through April 2021 Maturity Date | ||||||||
Less: Current Maturities | ||||||||
Total | $ | $ | ||||||
The Company has a $400.0 million unsecured revolving line of credit which matures in June 2021. The unsecured revolving line of credit bears interest at a variable rate based on LIBOR and a fixed fee is paid for the availability of this credit line. As of October 27, 2019, and October 28, 2018, the Company had no outstanding draws from this line of credit.
With the acquisition of Columbus Manufacturing Inc. in November 2017, the Company obtained a two-year $375.0 million term loan which was due in full in November 2019. The term loan was paid in full in April 2019.
The Company is required by certain covenants in its debt agreements to maintain specified levels of financial ratios and financial position. At the end of the current fiscal year, the Company was in compliance with all of these covenants.
Total interest paid in the last three fiscal years is as follows:
(in millions) | ||||
2019 | $ | |||
2018 | ||||
2017 | ||||
Note G
Pension and Other Post-retirement Benefits
The Company has several defined benefit plans and defined contribution plans covering most employees. Benefits for defined benefit pension plans covering hourly employees are provided based on stated amounts for each year of service, while plan benefits covering salaried employees are based on final average compensation. Total costs associated with the Company’s defined contribution benefit plans in fiscal years 2019, 2018, and 2017, were $43.0 million, $44.2 million, and $45.2 million, respectively.
Certain groups of employees are eligible for post-retirement health or welfare benefits. Benefits for retired employees vary for each group depending on respective retirement dates and applicable plan coverage in effect. Contribution requirements for retired employees are governed by the Retiree Health Care Payment Program and may change each year as the cost to provide coverage is determined.
48
Net periodic cost of defined benefit plans included the following:
Pension Benefits | Post-retirement Benefits | |||||||||||||||||||||||
(in thousands) | 2019 | 2018 | 2017 | 2019 | 2018 | 2017 | ||||||||||||||||||
Service Cost | $ | $ | $ | $ | $ | $ | ||||||||||||||||||
Interest Cost | ||||||||||||||||||||||||
Expected Return on Plan Assets | ( | ) | ( | ) | ( | ) | ||||||||||||||||||
Amortization of Prior Service Cost | ( | ) | ( | ) | ( | ) | ( | ) | ( | ) | ( | ) | ||||||||||||
Recognized Actuarial Loss (Gain) | ||||||||||||||||||||||||
Curtailment (Gain) Charge | ||||||||||||||||||||||||
Net Periodic Cost | $ | $ | $ | $ | $ | $ | ||||||||||||||||||
Non-service cost components of net pension and post-retirement benefit cost are presented within Interest and Investment Income on the Consolidated Statements of Operations.
Actuarial gains and losses and any adjustments resulting from plan amendments are deferred and amortized to expense over periods ranging from 9 -23 years for pension benefits and 5 -16 years for post-retirement benefits. The following amounts have not been recognized in net periodic pension cost and are included in Accumulated Other Comprehensive Loss:
Pension Benefits | Post-retirement Benefits | |||||||||||||||
(in thousands) | 2019 | 2018 | 2019 | 2018 | ||||||||||||
Unrecognized Prior Service Credit | $ | $ | $ | $ | ||||||||||||
Unrecognized Actuarial Losses | ( | ) | ( | ) | ( | ) | ( | ) | ||||||||
The following amounts are expected to be recognized in net periodic benefit expense in fiscal 2020:
(in thousands) | Pension Benefits | Post- retirement Benefits | ||||||
Amortized Prior Service Credit | $ | ( | ) | $ | ( | ) | ||
Recognized Actuarial Losses | ||||||||
The following is a reconciliation of the beginning and ending balances of the benefit obligation, the fair value of plan assets, and the funded status of the plans as of the October 27, 2019, and the October 28, 2018, measurement dates:
Pension Benefits | Post-retirement Benefits | |||||||||||||||
(in thousands) | 2019 | 2018 | 2019 | 2018 | ||||||||||||
Change in Benefit Obligation | ||||||||||||||||
Benefit Obligation at Beginning of Year | $ | $ | $ | $ | ||||||||||||
Service Cost | ||||||||||||||||
Interest Cost | ||||||||||||||||
Actuarial (Gain) Loss | ( | ) | ( | ) | ||||||||||||
Plan Amendments | ||||||||||||||||
Curtailment (Gain) Loss | ( | ) | ||||||||||||||
Participant Contributions | ||||||||||||||||
Medicare Part D Subsidy | ||||||||||||||||
Benefits Paid | ( | ) | ( | ) | ( | ) | ( | ) | ||||||||
Benefit Obligation at End of Year | $ | $ | $ | $ | ||||||||||||
Pension Benefits | Post-retirement Benefits | |||||||||||||||
(in thousands) | 2019 | 2018 | 2019 | 2018 | ||||||||||||
Change in Plan Assets | ||||||||||||||||
Fair Value of Plan Assets at Beginning of Year | $ | $ | $ | $ | ||||||||||||
Actual Return on Plan Assets | ( | ) | ||||||||||||||
Participant Contributions | ||||||||||||||||
Employer Contributions | ||||||||||||||||
Benefits Paid | ( | ) | ( | ) | ( | ) | ( | ) | ||||||||
Fair Value of Plan Assets at End of Year | $ | $ | $ | $ | ||||||||||||
Funded Status at End of Year | $ | ( | ) | $ | ( | ) | $ | ( | ) | $ | ( | ) | ||||
49
Amounts recognized in the Consolidated Statements of Financial Position as of October 27, 2019, and October 28, 2018, are as follows:
Pension Benefits | Post-retirement Benefits | |||||||||||||||
(in thousands) | 2019 | 2018 | 2019 | 2018 | ||||||||||||
Pension Assets | $ | $ | $ | $ | ||||||||||||
Employee-related Expenses | ( | ) | ( | ) | ( | ) | ( | ) | ||||||||
Pension and Post-retirement Benefits | ( | ) | ( | ) | ( | ) | ( | ) | ||||||||
Net Amount Recognized | $ | ( | ) | $ | ( | ) | $ | ( | ) | $ | ( | ) | ||||
The accumulated benefit obligation for all pension plans was $1.6 billion as of October 27, 2019, and $1.3 billion as of October 28, 2018. The following table provides information for pension plans with accumulated benefit obligations in excess of plan assets:
(in thousands) | 2019 | 2018 | ||||||
Projected Benefit Obligation | $ | $ | ||||||
Accumulated Benefit Obligation | ||||||||
Fair Value of Plan Assets | — | — | ||||||
Weighted-average assumptions used to determine benefit obligations are as follows:
2019 | 2018 | |||||
Discount Rate | % | % | ||||
Rate of Future Compensation Increase (For Plans that Base Benefits on Final Compensation Level) | % | % | ||||
Weighted-average assumptions used to determine net periodic benefit costs are as follows:
2019 | 2018 | 2017 | |||||||
Discount Rate | % | % | % | ||||||
Rate of Future Compensation Increase (for Plans that Base Benefits on Final Compensation Level) | % | % | % | ||||||
Expected Long-term Return on Plan Assets | % | % | % | ||||||
The expected long-term rate of return on plan assets is based on fair value and is developed in consultation with outside advisors. A range is determined based on the composition of the asset portfolio, historical long-term rates of return, and estimates of future performance.
For measurement purposes, an 8.0 % annual rate of increase in the per capita cost of covered health care benefits for pre-Medicare and post-Medicare retirees’ coverage is assumed for 2020. The pre-Medicare and post-Medicare rate is assumed to decrease to 5.0 % for 2025 , and remain steady thereafter.
The assumed discount rate, expected long-term rate of return on plan assets, rate of future compensation increase, and health care cost trend rate have a significant impact on the amounts reported for the benefit plans. A one-percentage-point change in these rates would have the following effects:
1-Percentage-Point | ||||||||||||||||
Expense | Benefit Obligation | |||||||||||||||
(in thousands) | Increase | Decrease | Increase | Decrease | ||||||||||||
Pension Benefits | ||||||||||||||||
Discount Rate | $ | ( | ) | $ | $ | ( | ) | $ | ||||||||
Expected Long-term Rate of Return on Plan Assets | ( | ) | — | — | ||||||||||||
Rate of Future Compensation Increase | ( | ) | ( | ) | ||||||||||||
Post-retirement Benefits | ||||||||||||||||
Discount Rate | $ | $ | $ | ( | ) | $ | ||||||||||
Health Care Cost Trend Rate | ( | ) | ( | ) | ||||||||||||
The Company’s funding policy is to make annual contributions of not less than the minimum required by applicable regulations. The Company expects to make contributions of $29.7 million during fiscal 2020 that represent benefit payments for unfunded plans.
50
Benefits expected to be paid over the next ten fiscal years are as follows:
(in thousands) | Pension Benefits | Post-retirement Benefits | ||||||
2020 | $ | $ | ||||||
2021 | ||||||||
2022 | ||||||||
2023 | ||||||||
2024 | ||||||||
2025-2029 | ||||||||
The investment strategy for defined benefit pension plan assets attempts to minimize the long-term cost of pension benefits, reduce the volatility of pension expense, and achieve a healthy funded status for the plans. The Company establishes target allocations in consultation with outside advisors through the use of asset-liability modeling in an effort to match the duration of the plan assets with the duration of the Company’s projected benefit liability. In fiscal 2019, the Company revised its target allocations to consolidate similar asset classes and employ additional risk management strategies.
The actual and target weighted-average asset allocations for the Company’s pension plan assets as of the plan measurement date are as follows:
2019 | |||||
Asset Category | Actual % | Target Range % | |||
Fixed Income | 35-60 | ||||
Global Stocks | 20-55 | ||||
Private Equity | 0-10 | ||||
Real Estate | 0-10 | ||||
Hedge Funds | 0-10 | ||||
Cash and Cash Equivalents | — | ||||
2018 | |||||
Asset Category | Actual % | Target Range % | |||
Large Capitalization Equity | 12-22 | ||||
Small Capitalization Equity | 3-13 | ||||
International Equity | 10-20 | ||||
Global Equity | 5-20 | ||||
Private Equity | 0-15 | ||||
Total Equity Securities | 50-75 | ||||
Fixed Income | 25-45 | ||||
Real Estate | 0-10 | ||||
Cash and Cash Equivalents | — | ||||
The following tables show the categories of defined benefit pension plan assets and the level under which fair values were determined in the fair value hierarchy. Assets measured at fair value using the net asset value (NAV) per share practical expedient are not required to be classified in the fair value hierarchy. These amounts are provided to permit reconciliation to the total fair value of plan assets.
51
Fair Value Measurements as of October 27, 2019 | ||||||||||||||||
(in thousands) | Total Fair Value | Quoted Prices in Active Markets for Identical Assets (Level 1) | Significant Other Observable Inputs (Level 2) | Significant Unobservable Inputs (Level 3) | ||||||||||||
Plan Assets in Fair Value Hierarchy | ||||||||||||||||
Cash Equivalents(1) | $ | $ | $ | $ | — | |||||||||||
Private Equity(2) | ||||||||||||||||
Domestic | — | — | ||||||||||||||
International | — | — | ||||||||||||||
Fixed Income(3) | ||||||||||||||||
US Government Issues | — | |||||||||||||||
Municipal Issues | — | — | ||||||||||||||
Corporate Issues – Domestic | — | — | ||||||||||||||
Corporate Issues – Foreign | — | — | ||||||||||||||
Global Stocks - Mutual Funds(4) | — | — | ||||||||||||||
Plan Assets in Fair Value Hierarchy | $ | $ | $ | $ | ||||||||||||
Plan Assets at Net Asset Value | ||||||||||||||||
Real Estate – Domestic(5) | $ | |||||||||||||||
Global Stocks - Collective Investment Funds(6) | ||||||||||||||||
Hedge Funds(7) | ||||||||||||||||
Plan Assets at Net Asset Value | $ | |||||||||||||||
Total Plan Assets at Fair Value | $ | |||||||||||||||
Fair Value Measurements as of October 28, 2018 | ||||||||||||||||
(in thousands) | Total Fair Value | Quoted Prices in Active Markets for Identical Assets (Level 1) | Significant Other Observable Inputs (Level 2) | Significant Unobservable Inputs (Level 3) | ||||||||||||
Plan Assets in Fair Value Hierarchy | ||||||||||||||||
Cash Equivalents(1) | $ | $ | $ | — | $ | — | ||||||||||
Large Capitalization Equity(8) | ||||||||||||||||
Domestic | — | — | ||||||||||||||
Foreign | — | — | ||||||||||||||
Small Capitalization Equity(9) | ||||||||||||||||
Domestic | — | — | ||||||||||||||
Foreign | — | — | ||||||||||||||
Private Equity(2) | ||||||||||||||||
Domestic | — | — | ||||||||||||||
International | — | — | ||||||||||||||
Fixed Income(3) | ||||||||||||||||
US Government Issues | — | |||||||||||||||
Municipal Issues | — | — | ||||||||||||||
Corporate Issues – Domestic | — | — | ||||||||||||||
Corporate Issues – Foreign | — | — | ||||||||||||||
Plan Assets in Fair Value Hierarchy | $ | $ | $ | $ | ||||||||||||
Plan Assets at Net Asset Value | ||||||||||||||||
Large Capitalization Equity – Domestic(10) | $ | |||||||||||||||
International Equity – Mutual Fund(11) | ||||||||||||||||
International Equity – Collective Trust(12) | ||||||||||||||||
Global Equity – Mutual Fund(13) | ||||||||||||||||
Real Estate – Domestic(5) | ||||||||||||||||
Plan Assets at Net Asset Value | $ | |||||||||||||||
Total Plan Assets at Fair Value | $ | |||||||||||||||
The following is a description of the valuation methodologies used for instruments measured at fair value, including the general classification of such instruments:
(1) Cash Equivalents: These Level 1 and Level 2 investments consist primarily of highly liquid money market mutual funds traded in active markets in addition to highly liquid futures and T-bills with an observable daily settlement price.
52
(2) Private Equity: These Level 3 investments consist of various collective investment funds, which are managed by a third party, invested in a well-diversified portfolio of equity investments from top performing, high quality firms focused on U.S. and foreign small to mid-markets, venture capitalists, and entrepreneurs with a concentration in areas of innovation. Investment strategies include buyouts, growth capital, buildups, and distressed, as well as early stages of company development mainly in the U.S. The fair value of these funds is based on the fair value of the underlying investments.
(3) Fixed Income: The Level 1 investments include U.S. Treasury bonds and notes, which are valued at the closing price reported on the active market in which the individual securities are traded. The Level 2 investments consist principally of U.S. government securities, which are valued daily using institutional bond quote sources and mortgage-backed securities pricing sources and municipal, domestic, and foreign securities, which are valued daily using institutional bond quote sources.
(4) Global Stocks - Mutual Fund: These Level 1 investments include open-ended mutual funds consisting of a mix of U.S. common stocks and foreign common stocks, which is valued at closing price reported on the active market in which the fund is traded. The investment strategy is to obtain long term capital appreciation by focusing on companies generating above average earnings growth and are leading growth businesses in the marketplace. There are no restrictions on redemptions.
(5) Real Estate - domestic: These investments include ownership in open-ended real estate funds, which manage diversified portfolios of commercial properties within the office, residential, retail, and industrial property sectors. Investment strategies aim to acquire, own, hold, or dispose of investments with the goal of achieving current income and/or capital appreciation. The real estate investments are valued at the NAV of shares held by the Master Trust. Requests to redeem shares are granted on a quarterly basis with either 45 or 90 days advance notice, subject to availability of cash.
(6) Global Stocks - Collective Investment Funds: These investments include commingled funds consisting of a mix of U.S. common stocks and foreign common stocks. The collective investment funds are valued at the NAV of shares held by the Master Trust. The investment strategy is to obtain long term capital appreciation by focusing on companies generating above average earnings growth and are leading growth businesses in the marketplace. All funds are daily liquid with the exception of one that is available on the first business day of the month for subscriptions and withdrawals.
(7) Hedge Funds: These investments are designed to provide diversification to an overall institutional portfolio and, in particular, provide protection against equity market downturns. They are comprised of CTAs/Managed Futures, Global Marcro (Discretionary and/or Quant), and Long Volatility/Tail Risk Hedging strategies. The hedge funds are valued at the NAV of shares held by the Master Trust. Requests to redeem shares are granted daily, monthly or quarterly.
(8) Large Capitalization Equity: The Level 1 investments include a mix of predominately U.S. common stocks and foreign common stocks, which are valued at the closing price reported on the active market in which the individual securities are traded.
(9) Small Capitalization Equity: The Level 1 investments include a mix of predominately U.S. common stocks and foreign common stocks, which are valued at the closing price reported on the active market in which the individual securities are traded.
(10) Large Capitalization Equity – Domestic: The collective investment is valued at the publicly available NAV of shares held by the Master Trust at year end. The investment objective is to maintain a portfolio of equity securities that approximate the weighted total rate of return within the Standard & Poor’s 500 stock index. There are no restrictions on redemptions.
(11) International Equity – Mutual Funds: The mutual funds are valued at the publicly available NAV of shares held by the Master Trust at year end. The investment seeks long term growth of principal and income by investing in medium to large well established companies. There are no restrictions on redemptions.
(12) International Equity – Collective Trust: The collective investment funds are valued at the NAV of shares held by the Master Trust at year end. The investment objective of this fund is to generate a long term return through investments in quoted international equities. Redemptions can be made on a monthly basis as of the first business day of each month.
(13) Global Equity – Mutual Fund: This investment includes an open-ended mutual fund consisting of a mix of U.S. common stocks and foreign common stocks, which is valued at the publicly available NAV of shares held by the Master Trust at year end. The investment strategy is to obtain long term capital appreciation by focusing on companies generating above average earnings growth and are leading growth businesses in the marketplace. There are no restrictions on redemptions.
A reconciliation of the beginning and ending balance of the investments measured at fair value using significant unobservable inputs (Level 3) is as follows:
(in thousands) | 2019 | 2018 | ||||||
Beginning Balance | $ | $ | ||||||
Purchases, Issuances, and Settlements (Net) | ( | ) | ( | ) | ||||
Unrealized Gains (Losses) | ||||||||
Realized Gains | ||||||||
Interest and Dividend Income | ||||||||
Ending Balance | $ | $ | ||||||
The Company has commitments totaling $125.0 million for the private equity investments within the pension plans. The unfunded private equity commitment balance for each investment category as of October 27, 2019, and October 28, 2018 is as follows:
(in thousands) | 2019 | 2018 | ||||||
Domestic Equity | $ | $ | ||||||
International Equity | ||||||||
Unfunded Commitment Balance | $ | $ | ||||||
Funding for future private equity capital calls will come from existing pension plan assets and not from additional cash contributions into the Company’s pension plans.
53
Note H
Derivatives and Hedging
The Company uses hedging programs to manage price risk associated with commodity purchases. These programs utilize futures and options contracts to manage the Company’s exposure to price fluctuations in the commodities markets. The Company has determined its designated hedging programs to be highly effective in offsetting the changes in fair value or cash flows generated by the items hedged. Effectiveness testing is performed on a quarterly basis to ascertain a high level of effectiveness for cash flow and fair value hedging programs.
Cash Flow Hedges: The Company designates corn and lean hog futures and options used to offset price fluctuations in the Company’s future direct grain and hog purchases as cash flow hedges. Effective gains or losses related to these cash flow hedges are reported in Accumulated Other Comprehensive Loss and reclassified into earnings, through Cost of Products Sold, in the period or periods in which the hedged transactions affect earnings. The Company typically does not hedge its grain exposure beyond the next two upcoming fiscal years and its hog exposure beyond the next fiscal year.
Fair Value Hedges: The Company designates the futures it uses to minimize the price risk assumed when fixed forward priced contracts are offered to the Company’s commodity suppliers as fair value hedges. The intent of the program is to make the forward priced commodities cost nearly the same as cash market purchases at the date of delivery. Changes in the fair value of the futures contracts, along with the gain or loss on the hedged purchase commitment, are marked-to-market through earnings and recorded on the Consolidated Statements of Financial Position as a Current Asset and Liability, respectively. Effective gains or losses related to these fair value hedges are recognized through Cost of Products Sold in the period or periods in which the hedged transactions affect earnings.
Other Derivatives: The Company holds certain futures and options contract positions as part of a merchandising program and to manage the Company’s exposure to fluctuations in commodity markets. The Company has not applied hedge accounting to these positions. Activity related to derivatives not designated as hedges is immaterial to the consolidated financial statements.
Volume: As of October 27, 2019, and October 28, 2018, the Company had the following outstanding commodity futures and options contracts related to its hedging programs:
Volume | ||
Commodity Contracts | October 27, 2019 | October 28, 2018 |
Corn | ||
Lean Hogs | ||
Fair Value of Derivatives: The fair values of the Company’s derivative instruments (in thousands) as of October 27, 2019, and October 28, 2018, were as follows:
Fair Value(1) | ||||||||||
Derivatives Designated as Hedges | Location on Consolidated Statements of Financial Position | October 27, 2019 | October 28, 2018 | |||||||
Commodity Contracts | Other Current Assets | $ | $ | ( | ) | |||||
(1) Amounts represent the gross fair value of derivative assets and liabilities. The Company nets the derivative assets and liabilities for each of its hedging programs, including cash collateral, when a master netting arrangement exists between the Company and the counterparty to the derivative contract. The amount or timing of cash collateral balances may impact the classification of the derivative in the Consolidated Statements of Financial Position. See Note M - Fair Value Measurements for a discussion of these net amounts as reported in the Consolidated Statements of Financial Position.
Fair Value Hedge - Assets (Liabilities): The carrying amount of the Company’s fair value hedge assets (liabilities) (in thousands) as of October 27, 2019, and October 28, 2018, were as follows:
Location on Consolidated Statements of Financial Position | Carrying Amount of the Hedged Assets/(Liabilities) | |||||||
October 27, 2019 | October 28, 2018 | |||||||
Accounts Payable | $ | ( | ) | $ | ( | ) | ||
Accumulated Other Comprehensive Loss Impact: In fiscal 2019, the Company adopted the amended guidance of ASC 815, Derivatives and Hedging. As a result, hedge ineffectiveness related to effective relationships is now deferred in Accumulated Other Comprehensive Loss until the hedged item impacts earnings. Prior to fiscal 2019, gains or losses on the derivative instrument in excess of the cumulative change in the cash flows of the hedged item, if any (i.e, the ineffective portion) were recognized in the Consolidated Statements of Operations during the current period. As of October 27, 2019, the Company has included in Accumulated Other Comprehensive Loss, hedging gains of $3.2 million (before tax) relating to its positions. The Company expects to recognize the majority of these gains over the next 12 months.
54
The effect of Accumulated Other Comprehensive Loss for gains or losses (before tax, in thousands) related to the Company's derivative instruments for the fiscal years ended October 27, 2019, and October 28, 2018, was as follows:
Gain/(Loss) Recognized in AOCL(1) | Location on Consolidated Statements of Operations | Gain/(Loss) Reclassified from AOCL into Earnings(1) | Gain/(Loss) Recognized in Earnings (Ineffective Portion) | |||||||||||||||||||||||
Fiscal Year Ended | Fiscal Year Ended | Fiscal Year Ended | ||||||||||||||||||||||||
Cash Flow Hedges | October 27, 2019 | October 28, 2018 | October 27, 2019 | October 28, 2018 | October 27, 2019 | October 28, 2018 | ||||||||||||||||||||
Commodity Contracts | $ | $ | ( | ) | Cost of Products Sold | $ | ( | ) | $ | ( | ) | $ | — | $ | ( | ) | ||||||||||
(1) See Note J - Accumulated Other Comprehensive Loss for the after-tax impact of these gains or losses on Net Earnings.
Consolidated Statements of Operations Impact: The effect on the Consolidated Statements of Operations for gains or losses (before tax, in thousands) related to the Company's derivative instruments for the fiscal years ended, were as follows:
Cost of Products Sold | |||||||||||
October 27, 2019 | October 28, 2018 | October 29, 2017 | |||||||||
Consolidated Statements of Operations | $ | $ | $ | ||||||||
Cash Flow Hedges - Commodity Contracts | |||||||||||
Gain (Loss) Reclassified from AOCL | $ | ( | ) | $ | ( | ) | $ | ||||
Amortization of Excluded Component from Options | ( | ) | |||||||||
Gain (Loss) due to Ineffectiveness | — | ( | ) | ||||||||
Fair Value Hedges - Commodity Contracts | |||||||||||
Gain (Loss) on Commodity Futures(1) | ( | ) | |||||||||
Gain (Loss) due to Ineffectiveness | — | ( | ) | ||||||||
Total Gain (Loss) Recognized in Earnings | $ | $ | ( | ) | $ | ||||||
(1) Amounts represent losses on commodity contracts designated as fair value hedges that were closed during the quarter, which were offset by a corresponding gain on the underlying hedged purchase commitment. Additional gains or losses related to changes in the fair value of open commodity contracts, along with the offsetting gain or loss on the hedged purchase commitment, are also marked-to-market through earnings with no impact on a net basis.
Note I
Investments In and Receivables From Affiliates
The Company accounts for its majority-owned operations under the consolidation method. Investments in which the Company owns a minority interest and for which there are no other indicators of control, are accounted for under the equity or cost method. These investments, along with any related receivables from affiliates, are included in the Consolidated Statements of Financial Position as Investments In and Receivables From Affiliates.
Investments In and Receivables from Affiliates consists of the following:
(in thousands) | Segment | % Owned | October 27, 2019 | October 28, 2018 | ||||||||
MegaMex Foods, LLC | Grocery Products | $ | $ | |||||||||
Foreign Joint Ventures | International & Other | Various (26 – 40%) | ||||||||||
Total | $ | $ | ||||||||||
Equity in Earnings of Affiliates consists of the following:
(in thousands) | Segment | 2019 | 2018 | 2017 | ||||||||||
MegaMex Foods, LLC | Grocery Products | $ | $ | $ | ||||||||||
Foreign Joint Ventures | International & Other | |||||||||||||
Total | $ | $ | $ | |||||||||||
Dividends received from affiliates for the fiscal years ended October 27, 2019, October 28, 2018, and October 29, 2017, were $22.5 million, $30.0 million, and $27.5 million, respectively.
55
The Company recognized a basis difference of $21.3 million associated with the formation of MegaMex Foods, LLC, of which $12.7 million is remaining as of October 27, 2019. This difference is being amortized through Equity in Earnings of Affiliates.
Note J
Accumulated Other Comprehensive Loss
Components of Accumulated Other Comprehensive Loss are as follows:
(in thousands) | Foreign Currency Translation | Pension & Other Post-retirement Benefits | Deferred Hedging Gain (Loss) | Accumulated Other Comprehensive Loss | ||||||||||||||
Balance at October 30, 2016 | $ | ( | ) | $ | ( | ) | $ | $ | ( | ) | ||||||||
Unrecognized Gains (Losses) | ||||||||||||||||||
Gross | ( | ) | ( | ) | ||||||||||||||
Tax Effect | — | ( | ) | ( | ) | |||||||||||||
Reclassification into Net Earnings | ||||||||||||||||||
Gross | — | (1) | ( | ) | (2) | |||||||||||||
Tax Effect | — | ( | ) | ( | ) | |||||||||||||
Net of Tax Amount | ( | ) | ( | ) | ||||||||||||||
Balance at October 29, 2017 | $ | ( | ) | $ | ( | ) | $ | $ | ( | ) | ||||||||
Unrecognized Gains (Losses) | ||||||||||||||||||
Gross | ( | ) | ( | ) | ( | ) | ||||||||||||
Tax Effect | — | ( | ) | ( | ) | |||||||||||||
Reclassification into Net Earnings | ||||||||||||||||||
Gross | — | (1) | (2) | |||||||||||||||
Tax Effect | — | ( | ) | ( | ) | ( | ) | |||||||||||
Net of Tax Amount | ( | ) | ( | ) | ||||||||||||||
Reported Balance at October 28, 2018 | $ | ( | ) | $ | ( | ) | $ | ( | ) | $ | ( | ) | ||||||
Impact of Adoption of ASU | ||||||||||||||||||
ASU 2017-12 | — | — | ( | ) | (3) | ( | ) | |||||||||||
ASU 2018-02 | — | ( | ) | (3) | — | ( | ) | |||||||||||
Adjusted Balance at October 28, 2018 | ( | ) | ( | ) | ( | ) | ( | ) | ||||||||||
Unrecognized Gains (Losses) | ||||||||||||||||||
Gross | ( | ) | ( | ) | ( | ) | ||||||||||||
Tax Effect | — | ( | ) | |||||||||||||||
Reclassification into Net Earnings | ||||||||||||||||||
Gross | — | (1) | (2) | |||||||||||||||
Tax Effect | — | ( | ) | ( | ) | ( | ) | |||||||||||
Net of Tax Amount | ( | ) | ( | ) | ( | ) | ||||||||||||
Balance at October 27, 2019 | $ | ( | ) | $ | ( | ) | $ | $ | ( | ) | ||||||||
(1) Included in computation of net periodic cost. See Note G - Pension and Other Post-Retirement Benefits for additional details.
(2) Included in cost of products sold in the Consolidated Statements of Operations.
(3) Cumulative effect from the adoption of Accounting Standards Updates. See Note A - Significant Accounting Policies for additional details.
Note K
Income Taxes
On December 22, 2017, the United States enacted comprehensive tax legislation into law, H.R. 1, commonly referred to as The Tax Cuts and Jobs Act (Tax Act). Except for certain provisions, the Tax Act was effective for tax years beginning on or after January 1, 2018. As a fiscal year U.S. taxpayer, the majority of the provisions, such as eliminating the domestic manufacturing deduction, creating new taxes on certain foreign sourced income, and introducing new limitations on certain business deductions, became effective for the Company in fiscal 2019. The global intangible low taxed income (GILTI) and foreign derived intangible income (FDII) provisions became effective for fiscal 2019 and resulted in an immaterial impact to the Company. For fiscal 2018, the most significant impacts included lowering of the U.S. federal corporate income tax rate, remeasuring certain net deferred tax liabilities, and the transition tax on the deemed repatriation of certain foreign earnings. The phase-in of the lower
56
federal corporate income tax rate resulted in a 21.0 percent tax rate for fiscal 2019 and a blended tax rate of 23.4 percent for fiscal 2018, as compared to the pretax reform federal corporate income tax rate of 35.0 percent. The tax rate will continue to be 21.0 percent in subsequent fiscal years.
In March 2018, the FASB issued ASU 2018-05, which provides guidance for companies related to the Tax Act. ASU 2018-05 allows for a measurement period of up to one year after the enactment date of the Tax Act to finalize the recording of the related tax impacts. The Company made reasonable estimates to record a net tax benefit of $72.9 million during fiscal 2018. This provisional net tax benefit included a benefit of $81.2 million from re-measuring the Company's net U.S. deferred tax liabilities, partially offset by the Company's accrual for the transition tax and other U.S. tax law changes of $8.3 million. The Company completed its provisional tax analysis during the first quarter of 2019 and did not record any significant adjustments to the provisional amounts booked in fiscal 2018.
With respect to the new Tax Act provision on GILTI, the Company has elected to treat GILTI as a period cost.
The components of the Provision for Income Taxes are as follows:
(in thousands) | 2019 | 2018 | 2017 | |||||||||
Current | ||||||||||||
U.S. Federal | $ | $ | $ | |||||||||
State | ||||||||||||
Foreign | ||||||||||||
Total Current | ||||||||||||
Deferred | ||||||||||||
U.S. Federal | ( | ) | ||||||||||
State | ||||||||||||
Foreign | ( | ) | ( | ) | ||||||||
Total Deferred | ( | ) | ||||||||||
Total Provision for Income Taxes | $ | $ | $ | |||||||||
Deferred Income Taxes reflect the net tax effects of temporary differences between the carrying amounts of assets and liabilities for financial reporting purposes and the amounts used for income tax purposes. Significant components of the deferred income tax liabilities and assets are as follows:
(in thousands) | October 27, 2019 | October 28, 2018 | ||||||
Deferred Tax Liabilities | ||||||||
Goodwill and Intangible Assets | $ | ( | ) | $ | ( | ) | ||
Tax over Book Depreciation and Basis Differences | ( | ) | ( | ) | ||||
Other, net | ( | ) | ( | ) | ||||
Deferred Tax Assets | ||||||||
Pension and Other Post-retirement Benefits | ||||||||
Employee Compensation Related Liabilities | ||||||||
Marketing and Promotional Accruals | ||||||||
Other, net | ||||||||
Net Deferred Tax (Liabilities) Assets | $ | ( | ) | $ | ( | ) | ||
Reconciliation of the statutory federal income tax rate to the Company’s effective tax rate is as follows:
2019 | 2018 | 2017 | |||||||
U.S. Statutory Rate | % | % | % | ||||||
State Taxes on Income, Net of Federal Tax Benefit | |||||||||
Domestic Production Activities Deduction | ( | ) | ( | ) | |||||
Divestitures | ( | ) | |||||||
Provisional Tax Law Change | ( | ) | |||||||
Stock-based Compensation | ( | ) | ( | ) | |||||
All Other, net | ( | ) | ( | ) | ( | ) | |||
Effective Tax Rate | % | % | % | ||||||
In fiscal 2019, the Company recorded a net tax benefit of $17.5 million related to the divestiture of CytoSport.
As of October 27, 2019, the Company had $126.0 million of undistributed earnings from non-U.S. subsidiaries. The Company maintains all earnings are permanently reinvested. Accordingly, no additional income taxes have been provided for withholding tax, state tax, or other taxes.
57
Total income taxes paid during fiscal years 2019, 2018, and 2017 were $221.4 million, $147.5 million, and $336.0 million, respectively.
The following table sets forth changes in the unrecognized tax benefits, excluding interest and penalties, for fiscal years 2018 and 2019.
(in thousands) | ||||
Balance as of October 29, 2017 | $ | |||
Tax Positions Related to the Current Period | ||||
Increases | ||||
Tax Positions Related to Prior Periods | ||||
Increases | ||||
Decreases | ( | ) | ||
Settlements | ( | ) | ||
Decreases Related to a Lapse of Applicable Statute of Limitations | ( | ) | ||
Balance as of October 28, 2018 | $ | |||
Tax Positions Related to the Current Period | ||||
Increases | ||||
Tax Positions Related to Prior Periods | ||||
Increases | ||||
Decreases | ( | ) | ||
Settlements | ( | ) | ||
Decreases Related to a Lapse of Applicable Statute of Limitations | ( | ) | ||
Balance as of October 27, 2019 | $ | |||
The amount of unrecognized tax benefits, including interest and penalties, is recorded in Other Long-term Liabilities. If recognized as of October 27, 2019, and October 28, 2018, $22.5 million and $26.3 million, respectively, would impact the Company’s effective tax rate. The Company includes accrued interest and penalties related to uncertain tax positions in income tax expense, with losses of $0.1 million and $0.6 million included in expense for fiscal 2019 and 2018, respectively. The amount of accrued interest and penalties at October 27, 2019, and October 28, 2018, associated with unrecognized tax benefits was $6.2 million and $6.5 million, respectively.
The Company is regularly audited by federal and state taxing authorities. The United States Internal Revenue Service (I.R.S.) concluded their examination of fiscal 2017 in the second quarter of fiscal 2019. The Company has elected to participate in the Compliance Assurance Process (CAP) for fiscal years through 2021. The objective of CAP is to contemporaneously work with the I.R.S. to achieve federal tax compliance and resolve all or most of the issues prior to filing of the tax return. The Company may elect to continue participating in CAP for future tax years; the Company may withdraw from the program at any time.
The Company is in various stages of audit by several state taxing authorities on a variety of fiscal years, as far back as 2011. While it is reasonably possible that one or more of these audits may be completed within the next 12 months and the related unrecognized tax benefits may change based on the status of the examinations, it is not possible to reasonably estimate the effect of any amount of such change to previously recorded uncertain tax positions.
Note L
Stock-Based Compensation
The Company issues stock options and restricted shares as part of its stock incentive plans for employees and non-employee directors. Stock-based compensation expense for fiscal years 2019, 2018, and 2017, was $19.7 million, $20.6 million, and $15.6 million, respectively.
At October 27, 2019, there was $27.6 million of total unrecognized compensation expense from stock-based compensation arrangements granted under the plans. This compensation is expected to be recognized over a weighted-average period of approximately 2.6 years. During fiscal years 2019, 2018, and 2017, cash received from stock option exercises was $59.9 million, $71.8 million, and $21.7 million, respectively.
Shares issued for option exercises and restricted shares may be either authorized but unissued shares, or shares of treasury stock. The number of shares available for future grants was 14.9 million at October 27, 2019, 16.1 million at October 28, 2018, and 46.7 million at October 29, 2017.
Stock Options: The Company’s policy is to grant options with the exercise price equal to the market price of the common stock on the date of grant. Options typically vest over four years and expire ten years after the date of the grant. The Company
58
recognizes stock-based compensation expense ratably over the shorter of the requisite service period or vesting period. The fair value of stock-based compensation granted to retirement-eligible individuals is expensed at the time of grant.
Effective with fiscal 2020 grants, the Company has determined the equity award value for eligible employees will be delivered fifty percent in stock options as described above and fifty percent in time-vested restricted stock units with a three-year cliff vesting.
During the third quarter of fiscal 2018, the Company made a one-time grant of 200 stock options to each active, full-time employee and 100 stock options to each active, part-time employee of the Company on April 30, 2018. The options vest in five years and expire ten years after the grant date.
A reconciliation of the number of options outstanding and exercisable (in thousands) as of October 27, 2019, and changes during the fiscal year then ended, is as follows:
Shares | Weighted-Average Exercise Price | Weighted-Average Remaining Contractual Term (Years) | Aggregate Intrinsic Value | ||||||||||
Outstanding at October 28, 2018 | $ | ||||||||||||
Granted | |||||||||||||
Exercised | |||||||||||||
Forfeited | |||||||||||||
Expired | |||||||||||||
Outstanding at October 27, 2019 | $ | $ | |||||||||||
Exercisable at October 27, 2019 | $ | $ | |||||||||||
The weighted-average grant date fair value of stock options granted and the total intrinsic value of options exercised (in thousands) during each of the past three fiscal years is as follows:
Fiscal Year Ended | ||||||||||||
October 27, | October 28, | October 29, | ||||||||||
2019 | 2018 | 2017 | ||||||||||
Weighted-average Grant Date Fair Value | $ | $ | $ | |||||||||
Intrinsic Value of Exercised Options | ||||||||||||
The fair value of each option award is calculated on the date of grant using the Black-Scholes valuation model utilizing the following weighted-average assumptions:
Fiscal Year Ended | |||||||||
October 27, | October 28, | October 29, | |||||||
2019 | 2018 | 2017 | |||||||
Risk-free Interest Rate | % | % | % | ||||||
Dividend Yield | % | % | % | ||||||
Stock Price Volatility | % | % | % | ||||||
Expected Option Life | |||||||||
As part of the annual valuation process, the Company reassesses the appropriateness of the inputs used in the valuation models. The Company establishes the risk-free interest rate using stripped U.S. Treasury yields as of the grant date where the remaining term is approximately the expected life of the option. The dividend yield is based on the dividend rate approved by the Company’s Board of Directors and the stock price on the grant date. The expected volatility assumption is based primarily on historical volatility. As a reasonableness test, implied volatility from exchange traded options is also examined to validate the volatility range obtained from the historical analysis. The expected life assumption is based on an analysis of past exercise behavior by option holders. In performing the valuations for option grants, the Company has not stratified option holders as exercise behavior has historically been consistent across all employee and non-employee director groups.
Restricted Shares: Restricted shares awarded to non-employee directors on February 1 are subject to a restricted period which expires at the date of the Company’s next annual stockholders meeting. Newly elected directors receive a prorated award of restricted shares of the Company's common stock, which expires on the date of the Company's second succeeding annual stockholders meeting.
59
A reconciliation of the restricted shares (in thousands) as of October 27, 2019, and changes during the fiscal year then ended, is as follows:
Shares | Weighted- Average Grant Date Fair Value | ||||||
Restricted at October 28, 2018 | $ | ||||||
Granted | |||||||
Vested | |||||||
Restricted at October 27, 2019 | $ | ||||||
The weighted-average grant date fair value of restricted shares granted, the total fair value (in thousands) of restricted shares granted, and the fair value (in thousands) of shares that have vested during each of the past three fiscal years is as follows:
Fiscal Year Ended | ||||||||||||
October 27, | October 28, | October 29, | ||||||||||
2019 | 2018 | 2017 | ||||||||||
Weighted-average Grant Date Fair Value | $ | $ | $ | |||||||||
Fair Value of Restricted Shares Granted | ||||||||||||
Fair Value of Shares Vested | $ | $ | $ | |||||||||
Note M
Fair Value Measurements
Pursuant to the provisions of ASC 820, the Company’s financial assets and liabilities carried at fair value on a recurring basis in the consolidated financial statements as of October 27, 2019, and October 28, 2018, and their level within the fair value hierarchy are presented in the table below.
Fair Value Measurements at October 27, 2019 | ||||||||||||||||
Total Fair Value | Quoted Prices in Active Markets for Identical Assets (Level 1) | Significant Other Observable Inputs (Level 2) | Significant Unobservable Inputs (Level 3) | |||||||||||||
(in thousands) | ||||||||||||||||
Assets at Fair Value | ||||||||||||||||
Cash and Cash Equivalents(1) | $ | $ | $ | $ | ||||||||||||
Short-term Marketable Securities(2) | ||||||||||||||||
Other Trading Securities(3) | ||||||||||||||||
Commodity Derivatives(4) | ||||||||||||||||
Total Assets at Fair Value | $ | $ | $ | $ | ||||||||||||
Liabilities at Fair Value | ||||||||||||||||
Deferred Compensation(3) | $ | $ | $ | $ | ||||||||||||
Total Liabilities at Fair Value | $ | $ | $ | $ | ||||||||||||
Fair Value Measurements at October 28, 2018 | ||||||||||||||||
Total Fair Value | Quoted Prices in Active Markets for Identical Assets (Level 1) | Significant Other Observable Inputs (Level 2) | Significant Unobservable Inputs (Level 3) | |||||||||||||
(in thousands) | ||||||||||||||||
Assets at Fair Value | ||||||||||||||||
Cash and Cash Equivalents(1) | $ | $ | $ | $ | ||||||||||||
Other Trading Securities(3) | ||||||||||||||||
Commodity Derivatives(4) | ||||||||||||||||
Total Assets at Fair Value | $ | $ | $ | $ | ||||||||||||
Liabilities at Fair Value | ||||||||||||||||
Deferred Compensation(3) | $ | $ | $ | $ | ||||||||||||
Total Liabilities at Fair Value | $ | $ | $ | $ | ||||||||||||
The following methods and assumptions were used to estimate the fair value of the financial assets and liabilities above:
(1) | The Company’s cash equivalents considered Level 1 consist primarily of bank deposits, money market funds rated AAA, or other highly liquid investment accounts, and have a maturity date of three months or less. Cash equivalents considered Level 2 are funds holding agency bonds or securities booked at amortized cost. |
60
(2) | The Company holds securities as part of a portfolio maintained to generate investment income and to provide cash for operations of the Company, if necessary. The portfolio is managed by a third party who is responsible for daily trading activities and all assets within the portfolio are highly liquid. The cash, U.S. government securities, and money market funds rated AAA held by the portfolio are classified as Level 1. The current investment portfolio also includes corporate bonds and other asset backed securities for which there is an active, quoted market. Market prices are obtained from a variety of industry providers, large financial institutions, and other third-party sources to calculate a representative daily market value, and therefore, these securities are classified as Level 2. |
(3) | A majority of the funds held in the rabbi trust relate to the supplemental executive retirement plans and have been invested in fixed income funds managed by a third party. The declared rate on these funds is set based on a formula using the yield of the general account investment portfolio supporting the fund, adjusted for expenses and other charges. The rate is guaranteed for one year at issue and may be reset annually on the policy anniversary, subject to a guaranteed minimum rate. As the value is based on adjusted market rates and the fixed rate is only reset on an annual basis, these funds are classified as Level 2. The funds held in the rabbi trust are included in Other Assets on the Consolidated Statements of Financial Position. The remaining funds held are also managed by a third-party insurance policy, the values of which represent their cash surrender value based on the fair value of the underlying investments in the account and include equity securities, money market accounts, bond funds, or other portfolios for which there is an active quoted market. Therefore, these policies are also classified as Level 2. The Company also offers a fixed rate investment option to participants. The rate earned on these investments is adjusted annually based on a specified percentage of the I.R.S. applicable federal rates. These balances are classified as Level 2. The related deferred compensation liabilities are included in Other Long-term Liabilities on the Consolidated Statements of Financial Position with investment options generally mirroring those funds held by the rabbi trust. Therefore, these investment balances are classified as Level 2. |
(4) The Company’s commodity derivatives represent futures contracts and options used in its hedging or other programs to offset price fluctuations associated with purchases of corn, soybean meal, and hogs, and to minimize the price risk assumed when forward priced contracts are offered to the Company’s commodity suppliers. The Company’s futures contracts for corn and soybean meal are traded on the Chicago Board of Trade, while futures contracts for lean hogs are traded on the Chicago Mercantile Exchange. These are active markets with quoted prices available, and these contracts are classified as Level 1. Over-the-counter (OTC) derivative instruments are valued using discounted cashflow models, observable market inputs, and other mathematical pricing models. The Company’s lean hog option contracts are OTC instruments whose value is calculated using the Black-Scholes pricing model, lean hog future prices quoted from the Chicago Mercantile Exchange, and other adjustments to inputs that are observable in active markets. As the value of these instruments is driven by observable prices in active markets they are classified as Level 2. All derivatives are reviewed for potential credit risk and risk of nonperformance. The Company nets the derivative assets and liabilities for each of its hedging programs, including cash collateral, when a master netting arrangement exists between the Company and the counterparty to the derivative contract. The net balance for each program is included in Other current assets or Accounts payable, as appropriate, in the Consolidated Statements of Financial Position. As of October 27, 2019, the Company has recognized the right to reclaim net cash collateral of $6.5 million from various counterparties (including $10.5 million of realized gains on closed positions offset by cash owed of $4.0 million). As of October 28, 2018, the Company had recognized the right to reclaim net cash collateral of $4.6 million from various counterparties (including cash of $4.7 million less $0.1 of realized losses).
The Company’s financial assets and liabilities include accounts receivable, accounts payable, and other liabilities, for which carrying value approximates fair value. The Company does not carry its long-term debt at fair value in its Consolidated Statements of Financial Position. The fair value of long-term debt, utilizing discounted cash flows (Level 2), was $257.7 million as of October 27, 2019, and $631.3 million as of October 28, 2018.
Note N
Commitments and Contingencies
In order to ensure a steady supply of hogs and turkeys, and to keep the cost of products stable, the Company has entered into contracts with producers for the purchase of hogs and turkeys at formula-based prices over periods up to 10 years. The Company has also entered into grow-out contracts with independent farmers to raise turkeys for the Company for periods up to 25 years. Under these arrangements, the Company owns the livestock, feed, and other supplies while the independent farmers provide facilities and labor. The Company has also contracted for the purchase of corn, soybean meal, feed ingredients, and other raw materials from independent suppliers for periods up to five years . Under these contracts, the Company is committed to make purchases, assuming current price levels, as follows:
(in thousands) | October 27, 2019 | ||
2020 | $ | ||
2021 | |||
2022 | |||
2023 | |||
2024 | |||
Later Years | |||
Total | $ | ||
Purchases under these contracts for fiscal years 2019, 2018, and 2017 were $1.0 billion, $1.3 billion, and $1.4 billion, respectively.
61
The Company has noncancelable operating and capital lease commitments on facilities and equipment at October 27, 2019, as follows:
(in thousands) | Operating | Capital | ||||
2020 | $ | $ | ||||
2021 | ||||||
2022 | ||||||
2023 | ||||||
2024 | ||||||
Later Years | ||||||
Total Future Payments | $ | $ | ||||
Less: Interest | ||||||
Present Value of Future Minimum Capital Lease Payments | $ | |||||
The Company expensed $23.1 million, $22.9 million, and $19.2 million for rent in fiscal years 2019, 2018, and 2017, respectively.
As of October 27, 2019, the Company has $44.8 million of standby letters of credit issued on its behalf. The standby letters of credit are primarily related to the Company’s self-insured workers compensation programs. However, that amount includes revocable standby letters of credit totaling $2.7 million for obligations of an affiliated party that may arise under workers compensation claims. Letters of credit are not reflected in the Company’s Consolidated Statements of Financial Position.
The Company is involved in litigation on an ongoing basis arising in the ordinary course of business. In the opinion of management, the outcome of litigation currently pending will not materially affect the Company’s results of operations, financial condition, or liquidity.
Note O
Earnings Per Share Data
The reported Net Earnings Attributable to the Company were used when computing Basic and Diluted Earnings Per Share for all years presented. A reconciliation of the shares used in the computation is as follows:
(in thousands) | 2019 | 2018 | 2017 | ||||||
Basic Weighted-average Shares Outstanding | |||||||||
Dilutive Potential Common Shares | |||||||||
Diluted Weighted-average Shares Outstanding | |||||||||
For fiscal years 2019, 2018, and 2017, a total of 2.8 million, 7.3 million, and 3.7 million weighted-average outstanding stock options, respectively, were not included in the computation of dilutive potential common shares since their inclusion would have had an antidilutive effect on Earnings Per Share.
Note P
Segment Reporting
The Company develops, processes, and distributes a wide array of food products in a variety of markets. The Company reports its results in the following four segments: Grocery Products, Refrigerated Foods, Jennie-O Turkey Store, and International & Other. At the beginning of fiscal 2019, the Hormel Deli Solutions division combined all deli businesses, including the Jennie-O Turkey Store deli division, into one division within the Refrigerated Foods segment. In addition, the ingredients business was realigned from the Grocery Products segment to the Refrigerated Foods segment. Periods presented herein have been adjusted to reflect these changes.
The Grocery Products segment consists primarily of the processing, marketing, and sale of shelf-stable food products sold predominantly in the retail market, along with the sale of nutritional and private label shelf-stable products to retail, foodservice, and industrial customers. This segment also includes the results from the Company’s MegaMex joint venture.
62
The Refrigerated Foods segment consists primarily of the processing, marketing, and sale of branded and unbranded pork, beef, and poultry products for retail, foodservice, deli, and commercial customers.
The Jennie-O Turkey Store segment consists primarily of the processing, marketing, and sale of branded and unbranded turkey products for retail, foodservice, and commercial customers.
The International & Other segment includes Hormel Foods International which manufactures, markets, and sells Company products internationally. This segment also includes the results from the Company’s international joint ventures and royalty arrangements.
Intersegment sales are recorded at prices that approximate cost and are eliminated in the Consolidated Statements of Operations. The Company does not allocate investment income, interest expense, and interest income to its segments when measuring performance. The Company also retains various other income and expenses at the corporate level. Equity in earnings of affiliates is included in segment profit; however, earnings attributable to the Company’s noncontrolling interests are excluded. These items are included below as Net Unallocated Expense and Noncontrolling Interest when reconciling to Earnings Before Income Taxes.
Sales and operating profits for each of the Company’s reportable segments and reconciliation to earnings before income taxes are set forth below. The Company is an integrated enterprise, characterized by substantial intersegment cooperation, cost allocations, and sharing of assets. Therefore, the Company does not represent that these segments, if operated independently, would report the profit and other financial information shown below.
63
Fiscal Year | ||||||||||||
(in thousands) | 2019 | 2018 | 2017 | |||||||||
Sales to Unaffiliated Customers | ||||||||||||
Grocery Products | $ | $ | $ | |||||||||
Refrigerated Foods | ||||||||||||
Jennie-O Turkey Store | ||||||||||||
International & Other | ||||||||||||
Total | $ | $ | $ | |||||||||
Intersegment Sales | ||||||||||||
Grocery Products | $ | $ | $ | |||||||||
Refrigerated Foods | ||||||||||||
Jennie-O Turkey Store | ||||||||||||
International & Other | $ | |||||||||||
Total | ||||||||||||
Intersegment Elimination | ( | ) | ( | ) | ( | ) | ||||||
Total | $ | — | $ | — | $ | — | ||||||
Net Sales | ||||||||||||
Grocery Products | $ | $ | $ | |||||||||
Refrigerated Foods | ||||||||||||
Jennie-O Turkey Store | ||||||||||||
International & Other | ||||||||||||
Intersegment Elimination | ( | ) | ( | ) | ( | ) | ||||||
Total | $ | $ | $ | |||||||||
Segment Profit | ||||||||||||
Grocery Products | $ | $ | $ | |||||||||
Refrigerated Foods | ||||||||||||
Jennie-O Turkey Store | ||||||||||||
International & Other | ||||||||||||
Total Segment Profit | $ | $ | ||||||||||
Net Unallocated Expense | ||||||||||||
Noncontrolling Interest | ||||||||||||
Earnings Before Income Taxes | $ | $ | $ | |||||||||
Assets | ||||||||||||
Grocery Products | $ | $ | $ | |||||||||
Refrigerated Foods | ||||||||||||
Jennie-O Turkey Store | ||||||||||||
International & Other | ||||||||||||
Corporate | ||||||||||||
Total | $ | $ | $ | |||||||||
Additions to Property, Plant & Equipment | ||||||||||||
Grocery Products | $ | $ | $ | |||||||||
Refrigerated Foods | ||||||||||||
Jennie-O Turkey Store | ||||||||||||
International & Other | ||||||||||||
Corporate | ||||||||||||
Total | $ | $ | $ | |||||||||
Depreciation and Amortization | ||||||||||||
Grocery Products | $ | $ | $ | |||||||||
Refrigerated Foods | ||||||||||||
Jennie-O Turkey Store | ||||||||||||
International & Other | ||||||||||||
Corporate | ||||||||||||
Total | $ | $ | $ | |||||||||
64
Revenue has been disaggregated into the categories below to show how sales channels affect the nature, amount, timing, and uncertainty of revenue and cash flows. The amount of total revenues contributed by sales channel for the last three fiscal years are as follows:
Fiscal Year Ended | ||||||||||||
(in thousands) | October 27, 2019 | October 28, 2018 | October 29, 2017 | |||||||||
U.S. Retail | $ | $ | $ | |||||||||
U.S. Foodservice | ||||||||||||
U.S. Deli | ||||||||||||
International | ||||||||||||
Total | $ | $ | $ | |||||||||
The Company’s products primarily consist of meat and other food products. The amount of total revenues contributed by classes of similar products for the last three fiscal years are as follows:
Fiscal Year Ended | ||||||||||||
(in thousands) | October 27, 2019 | October 28, 2018 | October 29, 2017 | |||||||||
Perishable | $ | $ | $ | |||||||||
Poultry | ||||||||||||
Shelf-stable | ||||||||||||
Miscellaneous | ||||||||||||
Total | $ | $ | $ | |||||||||
Perishable includes fresh meats, frozen items, refrigerated meal solutions, sausages, hams, guacamole, and bacon (excluding Jennie-O Turkey Store products). Shelf-stable includes canned luncheon meats, peanut butter, chilies, shelf-stable microwaveable meals, hash, stews, meat spreads, flour and corn tortillas, salsas, tortilla chips, and other items that do not require refrigeration. The Poultry category is composed primarily of Jennie-O Turkey Store products. The Miscellaneous category primarily consists of nutritional food products and supplements, dessert and drink mixes, and industrial gelatin products. The reduction in the Miscellaneous category during fiscal 2019 is due to the divestiture of CytoSport on April 15, 2019.
Revenues from external customers are classified as domestic or foreign based on the destination where title passes. No individual foreign country is material to the consolidated results. Additionally, the Company’s long-lived assets located in foreign countries are not significant. Total revenues attributed to the U.S. and all foreign countries in total for the last three fiscal years are as follows:
Fiscal Year Ended | ||||||||||||
(in thousands) | October 27, 2019 | October 28, 2018 | October 29, 2017 | |||||||||
United States | $ | $ | $ | |||||||||
Foreign | ||||||||||||
Total | $ | $ | $ | |||||||||
In fiscal 2019, sales to Walmart Inc. (Walmart) represented $1.4 billion or 13.5 % of the Company’s consolidated revenues (measured as gross sales less returns and allowances). In fiscal 2018, sales to Walmart represented $1.4 billion or 13.6 % of the Company’s consolidated revenues. Walmart is a customer for all four segments of the Company.
65
Note Q
Quarterly Results of Operations (Unaudited)
The following tabulations reflect the unaudited quarterly results of operations for the years ended October 27, 2019, and October 28, 2018.
(in thousands, except per share data) | Net Sales | Gross Profit(3) | Net Earnings | Net Earnings Attributable to Hormel Foods Corporation(1) | Basic Earnings Per Share | Diluted Earnings Per Share(2) | ||||||||||||||||||
2019 | ||||||||||||||||||||||||
First Quarter | $ | $ | $ | $ | $ | $ | ||||||||||||||||||
Second Quarter | ||||||||||||||||||||||||
Third Quarter | ||||||||||||||||||||||||
Fourth Quarter | ||||||||||||||||||||||||
2018 | ||||||||||||||||||||||||
First Quarter | $ | $ | $ | $ | $ | $ | ||||||||||||||||||
Second Quarter | ||||||||||||||||||||||||
Third Quarter | ||||||||||||||||||||||||
Fourth Quarter | ||||||||||||||||||||||||
(1) Excludes net earnings attributable to the Company’s noncontrolling interests.
(2) Quarterly amounts are independently computed and may not add to the annual amounts.
(3) Fiscal 2018 adjusted due to the adoption of ASU 2017-07. See Note A - Summary of Significant Accounting Policies.
Item 9. CHANGES IN AND DISAGREEMENTS WITH ACCOUNTANTS ON ACCOUNTING AND FINANCIAL DISCLOSURE
None.
Item 9A. CONTROLS AND PROCEDURES
Disclosure Controls and Procedures
As of the end of the period covered by this report (the Evaluation Date), the Company carried out an evaluation, under the supervision and with the participation of management, including the Chief Executive Officer and the Chief Financial Officer, of the effectiveness of the design and operation of our disclosure controls and procedures (as defined in Rule 13a-15(e) of the Securities Exchange Act of 1934, as amended (the Exchange Act)). In designing and evaluating the disclosure controls and procedures, management recognized any controls and procedures, no matter how well designed and operated, can provide only reasonable assurance of achieving the desired control objectives. Based on that evaluation, our Chief Executive Officer and Chief Financial Officer concluded, as of the Evaluation Date, our disclosure controls and procedures were effective to provide reasonable assurance the information we are required to disclose in reports we file or submit under the Exchange Act is recorded, processed, summarized, and reported within the time periods specified in Securities and Exchange Commission rules and forms, and such information is accumulated and communicated to our management, including our Chief Executive Officer and Chief Financial Officer, as appropriate, to allow timely decisions regarding required disclosure.
Internal Control over Financial Reporting
During the fourth quarter of fiscal year 2019, there has been no change in the Company’s internal control over financial reporting (as defined in Rule 13a-15(f) under the Exchange Act) that has materially affected, or is reasonably likely to materially affect, the Company’s internal control over financial reporting.
Item 9B. OTHER INFORMATION
None.
66
PART III
Item 10. DIRECTORS, EXECUTIVE OFFICERS AND CORPORATE GOVERNANCE
Information under “Item 1 – Election of Directors”, “Board Independence”, and information under “Board of Director and Committee Meetings” in the definitive proxy statement for the Annual Meeting of Stockholders to be held January 28, 2020, is incorporated herein by reference.
Information concerning Executive Officers is set forth in Part I, Item 1(f) of this Annual Report on Form 10-K, pursuant to Instruction to Item 401 of Regulation S-K.
Information under “Delinquent Section 16(a) Reports,” in the definitive proxy statement for the Annual Meeting of Stockholders to be held January 28, 2020, is incorporated herein by reference.
The Company has adopted a Code of Ethical Business Conduct in compliance with applicable rules of the Securities and Exchange Commission that applies to its principal executive officer, its principal financial officer, and its principal accounting officer or controller, or persons performing similar functions. A copy of the Code of Ethical Business Conduct is available on the Company’s website at www.hormelfoods.com, free of charge, under the caption, “Investors – Governance – Governance Documents.” The Company intends to satisfy any disclosure requirement under Item 5.05 of Form 8-K regarding an amendment to, or waiver from, a provision of this Code of Ethical Business Conduct by posting such information on the Company’s website at the address and location specified above.
Item 11. EXECUTIVE COMPENSATION
Information commencing with “Executive Compensation” through "CEO Pay Ratio Disclosure”, and information under “Compensation of Directors” in the definitive proxy statement for the Annual Meeting of Stockholders to be held January 28, 2020, is incorporated herein by reference.
Item 12. SECURITY OWNERSHIP OF CERTAIN BENEFICIAL OWNERS AND MANAGEMENT AND RELATED STOCKHOLDER MATTERS
Information regarding the Company's equity compensation plans as of October 27, 2019, is shown below:
Plan Category | Number of Securities to be Issued Upon Exercise of Outstanding Options, Warrants and Rights | Weighted-Average Exercise Price of Outstanding Options, Warrants and Rights | Number of Securities Remaining Available for Future Issuance under Equity Compensation Plans (Excluding Securities Reflected in Column (a)) | |||
(a) | (b) | (c) | ||||
Equity compensation plans approved by security holders | 25,993,836 | $26.49 | 14,945,886 | |||
Equity compensation plans not approved by security holders | — | — | - | |||
Total | 25,993,836 | $26.49 | 14,945,886 | |||
Information under “Security Ownership of Certain Beneficial Owners” and “Security Ownership of Management” in the definitive proxy statement for the Annual Meeting of Stockholders to be held January 28, 2020, is incorporated herein by reference.
Item 13. CERTAIN RELATIONSHIPS AND RELATED TRANSACTIONS, AND DIRECTOR INDEPENDENCE
Information under “Related Party Transactions” and “Board Independence” in the definitive proxy statement for the Annual Meeting of Stockholders to be held January 28, 2020, is incorporated herein by reference.
67
Item 14. PRINCIPAL ACCOUNTING FEES AND SERVICES
Information under “Independent Registered Public Accounting Firm Fees” and “Audit Committee Preapproval Policies and Procedures” in the definitive proxy statement for the Annual Meeting of Stockholders to be held January 28, 2020, is incorporated herein by reference.
PART IV
Item 15. EXHIBITS, FINANCIAL STATEMENT SCHEDULES
The following consolidated financial statements of Hormel Foods Corporation for the fiscal year ended October 27, 2019, are filed as part of this report:
Consolidated Statements of Financial Position–October 27, 2019, and October 28, 2018.
Consolidated Statements of Operations–Fiscal Years Ended October 27, 2019, October 28, 2018, and October 29, 2017.
Consolidated Statements of Comprehensive Income–Fiscal Years Ended October 27, 2019, October 28, 2018, and October 29, 2017.
Consolidated Statements of Changes in Shareholders’ Investment–Fiscal Years Ended October 27, 2019, October 28, 2018, and October 29, 2017.
Consolidated Statements of Cash Flows–Fiscal Years Ended October 27, 2019, October 28, 2018, and October 29, 2017.
Notes to Consolidated Financial Statements
Report of Management
Report of Independent Registered Public Accounting Firm
FINANCIAL STATEMENT SCHEDULES
The following consolidated financial statement schedule of Hormel Foods Corporation required is submitted herewith:
Schedule II – Valuation and Qualifying Accounts and Reserves–Fiscal Years Ended October 27, 2019, October 28, 2018, and October 29, 2017.
FINANCIAL STATEMENTS AND SCHEDULES OMITTED
All other financial statements and schedules for which provision is made in the applicable accounting regulations of the Securities and Exchange Commission are not required under the related instructions or are inapplicable, and therefore have been omitted.
68
SCHEDULE II – VALUATION AND QUALIFYING ACCOUNTS AND RESERVES
HORMEL FOODS CORPORATION
(In Thousands)
Additions/(Benefits) | ||||||||||||||||||||||
Classification | Balance at Beginning of Period | Charged to Cost and Expenses | Charged to Other Accounts Describe | Deductions- Describe | Balance at End of Period | |||||||||||||||||
Valuation reserve deduction from assets account: | ||||||||||||||||||||||
Fiscal year ended October 27, 2019 Allowance for doubtful accounts receivable | $ | (1) | ||||||||||||||||||||
$ | $ | ( | ) | ( | ) | (2) | $ | |||||||||||||||
Fiscal year ended October 28, 2018 Allowance for doubtful accounts receivable | $ | ( | ) | (3) | $ | (1) | ||||||||||||||||
$ | $ | (4) | ( | ) | (2) | $ | ||||||||||||||||
Fiscal year ended October 29, 2017 Allowance for doubtful accounts receivable | $ | (1) | ||||||||||||||||||||
$ | $ | $ | (5) | ( | ) | (2) | $ | |||||||||||||||
(1) Uncollectible accounts written off.
(2) Recoveries on accounts previously written off.
(3) Consolidation of the Fontanini and Columbus reserves.
(4) Increase in the reserve due to the inclusion of Columbus accounts receivable.
(5) Increase in the reserve due to the inclusion of Fontanini accounts receivable.
69
LIST OF EXHIBITS | ||||
HORMEL FOODS CORPORATION | ||||
NUMBER | DESCRIPTION OF DOCUMENT | |
3.1(1) | ||
3.2(1) | ||
4.1(1) | ||
4.2(1) | ||
4.3(2) | ||
4.4 | Pursuant to Item 601(b)(4)(iii) of Regulation S-K, copies of instruments defining the rights of holders of certain long-term debt are not filed. Hormel agrees to furnish copies thereof to the Securities and Exchange Commission upon request. | |
10.1(1)(3) | ||
10.2(1)(3) | ||
10.3(1)(3) | ||
10.4(1)(3) | ||
10.5(1)(3) | ||
10.6(1)(3) | ||
10.7(1)(3) | ||
10.8(1)(3) | ||
10.9(1)(3) | ||
10.10(1)(3) | ||
10.11(1)(3) | ||
10.12(1)(3) | ||
10.13(1)(3) | ||
10.14(1)(3) | ||
70
NUMBER | DESCRIPTION OF DOCUMENT | |
10.15(2)(3) | ||
21.1(2) | ||
23.1(2) | ||
24.1(2) | ||
31.1(2) | ||
31.2(2) | ||
32.1(2) | ||
99.3(1) | ||
101(2) | The following financial statements from the Company's Annual Report on Form 10-K for the fiscal year ended October 27, 2019, formatted in Inline XBRL: (i) Consolidated Statements of Financial Position, (ii) Consolidated Statements of Operations, (iii) Consolidated Statements of Comprehensive Income, (iv) Consolidated Statements of Changes in Shareholders’ Investment, (v) Consolidated Statements of Cash Flows, and (vi) Notes to Consolidated Financial Statements, tagged as blocks of text and including detailed tags. | |
104(2) | The cover page from the Company's Annual Report on Form 10-K for the fiscal year ended October 27, 2019, formatted in Inline XBRL (included as Exhibit 101). | |
(1) | Document has previously been filed with the Securities and Exchange Commission and is incorporated herein by reference. | |
(2) | These exhibits transmitted via EDGAR. | |
(3) | Management contract or compensatory plan or arrangement. | |
Item 16. FORM 10-K SUMMARY
Not applicable.
71
SIGNATURES
Pursuant to the requirements of Section 13 or 15(d) of the Securities Exchange Act of 1934, the registrant has duly caused this report to be signed on its behalf by the undersigned, thereunto duly authorized.
HORMEL FOODS CORPORATION | ||||
By: | /s/ JAMES P. SNEE | December 6, 2019 | ||
JAMES P. SNEE, Chairman of the Board, | Date | |||
President and Chief Executive Officer | ||||
Pursuant to the requirements of the Securities Exchange Act of 1934, this report has been signed below by the following persons on behalf of the registrant and in the capacities and on the dates indicated.
Name | Date | Title | ||
/s/ JAMES P. SNEE | 12/6/2019 | Chairman of the Board, President and Chief Executive | ||
JAMES P. SNEE | Officer | |||
(Principal Executive Officer) | ||||
/s/ JAMES N. SHEEHAN | 12/6/2019 | Executive Vice President and Chief Financial Officer | ||
JAMES N. SHEEHAN | (Principal Financial Officer) | |||
/s/ JANA L. HAYNES | 12/6/2019 | Vice President and Controller | ||
JANA L. HAYNES | (Principal Accounting Officer) | |||
/s/ PRAMA BHATT* | 12/6/2019 | Director | ||
PRAMA BHATT | ||||
12/6/2019 | Director | |||
GARY C. BHOJWANI | ||||
/s/ TERRELL K. CREWS* | 12/6/2019 | Director | ||
TERRELL K. CREWS | ||||
/s/ GLENN S. FORBES* | 12/6/2019 | Director | ||
GLENN S. FORBES | ||||
/s/ STEPHEN M. LACY* | 12/6/2019 | Director | ||
STEPHEN M. LACY | ||||
/s/ ELSA A. MURANO* | 12/6/2019 | Director | ||
ELSA A. MURANO | ||||
/s/ ROBERT C. NAKASONE* | 12/6/2019 | Director | ||
ROBERT C. NAKASONE | ||||
/s/ SUSAN K. NESTEGARD* | 12/6/2019 | Director | ||
SUSAN K. NESTEGARD | ||||
/s/ WILLIAM A. NEWLANDS* | 12/6/2019 | Director | ||
WILLIAM A. NEWLANDS | ||||
/s/ DAKOTA A. PIPPINS* | 12/6/2019 | Director | ||
DAKOTA A. PIPPINS | ||||
/s/ CHRISTOPHER J. POLICINSKI* | 12/6/2019 | Director | ||
CHRISTOPHER J. POLICINSKI | ||||
/s/ JOSE L. PRADO* | 12/6/2019 | Director | ||
JOSE L. PRADO | ||||
/s/ SALLY J. SMITH* | 12/6/2019 | Director | ||
SALLY J. SMITH | ||||
/s/ STEVEN A. WHITE* | 12/6/2019 | Director | ||
STEVEN A. WHITE | ||||
*By: /s/ JANA L. HAYNES | 12/6/2019 | |||
JANA L. HAYNES | ||||
as Attorney-In-Fact | ||||
72