0000046080false2022FYfalseP2Yhttp://fasb.org/us-gaap/2022#SellingGeneralAndAdministrativeExpense111http://fasb.org/us-gaap/2022#AccruedLiabilitiesCurrenthttp://fasb.org/us-gaap/2022#AccruedLiabilitiesCurrenthttp://fasb.org/us-gaap/2022#OtherNonoperatingIncomeExpensehttp://fasb.org/us-gaap/2022#PrepaidExpenseAndOtherAssetsCurrent http://hasbro.com/20221225#AssetsNoncurrentExcludingPropertyPlantAndEquipmentAndFinanceLeaseRightOfUseAssetAfterAccumulatedDepreciationAndAmortizationhttp://fasb.org/us-gaap/2022#AccruedLiabilitiesCurrent http://fasb.org/us-gaap/2022#OtherLiabilitiesNoncurrentP3YP3Yhttp://fasb.org/us-gaap/2022#AccruedLiabilitiesCurrenthttp://fasb.org/us-gaap/2022#OtherLiabilitiesNoncurrenthttp://fasb.org/us-gaap/2022#PropertyPlantAndEquipmentAndFinanceLeaseRightOfUseAssetAfterAccumulatedDepreciationAndAmortization00000460802021-12-272022-12-2500000460802022-06-24iso4217:USD00000460802023-02-16xbrli:shares00000460802022-12-2500000460802021-12-26iso4217:USDxbrli:shares00000460802020-12-282021-12-2600000460802019-12-302020-12-2700000460802020-12-2700000460802019-12-290000046080us-gaap:CommonStockMember2019-12-290000046080us-gaap:AdditionalPaidInCapitalMember2019-12-290000046080us-gaap:RetainedEarningsMember2019-12-290000046080us-gaap:AccumulatedOtherComprehensiveIncomeMember2019-12-290000046080us-gaap:TreasuryStockCommonMember2019-12-290000046080us-gaap:NoncontrollingInterestMember2019-12-290000046080us-gaap:NoncontrollingInterestMember2019-12-302020-12-270000046080us-gaap:RetainedEarningsMember2019-12-302020-12-270000046080us-gaap:AdditionalPaidInCapitalMember2019-12-302020-12-270000046080us-gaap:AccumulatedOtherComprehensiveIncomeMember2019-12-302020-12-270000046080us-gaap:TreasuryStockCommonMember2019-12-302020-12-270000046080us-gaap:CommonStockMember2020-12-270000046080us-gaap:AdditionalPaidInCapitalMember2020-12-270000046080us-gaap:RetainedEarningsMember2020-12-270000046080us-gaap:AccumulatedOtherComprehensiveIncomeMember2020-12-270000046080us-gaap:TreasuryStockCommonMember2020-12-270000046080us-gaap:NoncontrollingInterestMember2020-12-270000046080us-gaap:RetainedEarningsMember2020-12-282021-12-260000046080us-gaap:NoncontrollingInterestMember2020-12-282021-12-260000046080us-gaap:AdditionalPaidInCapitalMember2020-12-282021-12-260000046080us-gaap:AccumulatedOtherComprehensiveIncomeMember2020-12-282021-12-260000046080us-gaap:TreasuryStockCommonMember2020-12-282021-12-260000046080us-gaap:CommonStockMember2021-12-260000046080us-gaap:AdditionalPaidInCapitalMember2021-12-260000046080us-gaap:RetainedEarningsMember2021-12-260000046080us-gaap:AccumulatedOtherComprehensiveIncomeMember2021-12-260000046080us-gaap:TreasuryStockCommonMember2021-12-260000046080us-gaap:NoncontrollingInterestMember2021-12-260000046080us-gaap:RetainedEarningsMember2021-12-272022-12-250000046080us-gaap:NoncontrollingInterestMember2021-12-272022-12-250000046080us-gaap:AdditionalPaidInCapitalMember2021-12-272022-12-250000046080us-gaap:AccumulatedOtherComprehensiveIncomeMember2021-12-272022-12-250000046080us-gaap:TreasuryStockCommonMember2021-12-272022-12-250000046080us-gaap:CommonStockMember2021-12-272022-12-250000046080us-gaap:CommonStockMember2022-12-250000046080us-gaap:AdditionalPaidInCapitalMember2022-12-250000046080us-gaap:RetainedEarningsMember2022-12-250000046080us-gaap:AccumulatedOtherComprehensiveIncomeMember2022-12-250000046080us-gaap:TreasuryStockCommonMember2022-12-250000046080us-gaap:NoncontrollingInterestMember2022-12-250000046080has:Blueprint20Member2021-12-272022-12-250000046080has:EntertainmentSegmentMemberhas:Blueprint20Member2021-12-272022-12-250000046080has:OperationalExcellenceProgramMember2021-12-272022-12-250000046080has:DDBeyondMember2022-05-192022-05-190000046080has:DDBeyondMember2022-05-190000046080has:TheNetworkJointVentureMember2021-09-272021-12-260000046080has:TheNetworkJointVentureMember2020-12-282021-12-260000046080has:AstleyBakerDaviesLimitedMember2022-12-25xbrli:pure0000046080srt:MinimumMemberus-gaap:LandImprovementsMember2021-12-272022-12-250000046080srt:MaximumMemberus-gaap:LandImprovementsMember2021-12-272022-12-250000046080srt:MinimumMemberus-gaap:BuildingAndBuildingImprovementsMember2021-12-272022-12-250000046080srt:MaximumMemberus-gaap:BuildingAndBuildingImprovementsMember2021-12-272022-12-250000046080srt:MinimumMemberus-gaap:MachineryAndEquipmentMember2021-12-272022-12-250000046080us-gaap:MachineryAndEquipmentMembersrt:MaximumMember2021-12-272022-12-250000046080srt:MaximumMemberus-gaap:ToolsDiesAndMoldsMember2021-12-272022-12-2500000460802022-06-272022-09-2500000460802022-09-262022-12-2500000460802020-12-282021-03-28has:segment0000046080us-gaap:DisposalGroupDisposedOfBySaleNotDiscontinuedOperationsMemberhas:EOneMusicMember2021-06-282021-09-260000046080us-gaap:DisposalGroupDisposedOfBySaleNotDiscontinuedOperationsMemberhas:EOneMusicMember2020-12-282021-12-260000046080srt:MinimumMember2021-12-272022-12-250000046080srt:MaximumMember2021-12-272022-12-250000046080has:EntertainmentAndProductionAssetsMember2019-12-302020-03-290000046080has:EntertainmentAndProductionAssetsMember2020-09-282020-12-270000046080has:ProductionFinancingFacilitiesMember2021-12-272022-12-250000046080has:DigitalGameMember2021-12-272022-12-250000046080us-gaap:ShippingAndHandlingMember2021-12-272022-12-250000046080us-gaap:ShippingAndHandlingMember2020-12-282021-12-260000046080us-gaap:ShippingAndHandlingMember2019-12-302020-12-2700000460802022-12-262022-12-2500000460802024-01-012022-12-2500000460802024-12-302022-12-25has:brand_category0000046080has:EOneAcquisitionMember2019-12-302019-12-300000046080us-gaap:SeniorNotesMemberhas:EOneAcquisitionMember2019-11-300000046080has:EOneAcquisitionMember2019-11-012019-11-300000046080has:EOneAcquisitionMember2019-11-300000046080has:EOneAcquisitionMemberus-gaap:UnsecuredDebtMemberhas:A10BillionTermLoanAgreementMember2019-11-300000046080has:EOneAcquisitionMember2019-12-300000046080has:EOneAcquisitionMember2019-12-302020-12-270000046080has:EntertainmentSegmentMemberhas:EOneAcquisitionMember2019-12-302020-12-270000046080us-gaap:AccumulatedDefinedBenefitPlansAdjustmentMember2021-12-260000046080us-gaap:AccumulatedGainLossNetCashFlowHedgeParentMember2021-12-260000046080us-gaap:AccumulatedNetUnrealizedInvestmentGainLossMember2021-12-260000046080us-gaap:AccumulatedTranslationAdjustmentMember2021-12-260000046080us-gaap:AccumulatedDefinedBenefitPlansAdjustmentMember2021-12-272022-12-250000046080us-gaap:AccumulatedGainLossNetCashFlowHedgeParentMember2021-12-272022-12-250000046080us-gaap:AccumulatedNetUnrealizedInvestmentGainLossMember2021-12-272022-12-250000046080us-gaap:AccumulatedTranslationAdjustmentMember2021-12-272022-12-250000046080us-gaap:AccumulatedDefinedBenefitPlansAdjustmentMember2022-12-250000046080us-gaap:AccumulatedGainLossNetCashFlowHedgeParentMember2022-12-250000046080us-gaap:AccumulatedNetUnrealizedInvestmentGainLossMember2022-12-250000046080us-gaap:AccumulatedTranslationAdjustmentMember2022-12-250000046080us-gaap:AccumulatedDefinedBenefitPlansAdjustmentMember2020-12-270000046080us-gaap:AccumulatedGainLossNetCashFlowHedgeParentMember2020-12-270000046080us-gaap:AccumulatedNetUnrealizedInvestmentGainLossMember2020-12-270000046080us-gaap:AccumulatedTranslationAdjustmentMember2020-12-270000046080us-gaap:AccumulatedDefinedBenefitPlansAdjustmentMember2020-12-282021-12-260000046080us-gaap:AccumulatedGainLossNetCashFlowHedgeParentMember2020-12-282021-12-260000046080us-gaap:AccumulatedNetUnrealizedInvestmentGainLossMember2020-12-282021-12-260000046080us-gaap:AccumulatedTranslationAdjustmentMember2020-12-282021-12-260000046080us-gaap:AccumulatedDefinedBenefitPlansAdjustmentMember2019-12-290000046080us-gaap:AccumulatedGainLossNetCashFlowHedgeParentMember2019-12-290000046080us-gaap:AccumulatedNetUnrealizedInvestmentGainLossMember2019-12-290000046080us-gaap:AccumulatedTranslationAdjustmentMember2019-12-290000046080us-gaap:AccumulatedDefinedBenefitPlansAdjustmentMember2019-12-302020-12-270000046080us-gaap:AccumulatedGainLossNetCashFlowHedgeParentMember2019-12-302020-12-270000046080us-gaap:AccumulatedNetUnrealizedInvestmentGainLossMember2019-12-302020-12-270000046080us-gaap:AccumulatedTranslationAdjustmentMember2019-12-302020-12-270000046080us-gaap:AccumulatedGainLossNetCashFlowHedgeParentMemberus-gaap:ForeignExchangeForwardMember2022-12-250000046080has:Notes315Due2021Member2021-03-280000046080has:Notes510Due2044Member2022-12-250000046080us-gaap:AccumulatedGainLossNetCashFlowHedgeParentMemberus-gaap:InterestRateContractMember2022-12-250000046080us-gaap:AccumulatedGainLossNetCashFlowHedgeParentMemberus-gaap:ReclassificationOutOfAccumulatedOtherComprehensiveIncomeMemberus-gaap:InterestRateContractMember2021-12-272022-12-250000046080us-gaap:AccumulatedGainLossNetCashFlowHedgeParentMemberus-gaap:ReclassificationOutOfAccumulatedOtherComprehensiveIncomeMemberus-gaap:InterestRateContractMember2020-12-282021-12-260000046080us-gaap:AccumulatedGainLossNetCashFlowHedgeParentMemberus-gaap:ReclassificationOutOfAccumulatedOtherComprehensiveIncomeMemberus-gaap:InterestRateContractMember2019-12-302020-12-270000046080us-gaap:LandImprovementsMember2022-12-250000046080us-gaap:LandImprovementsMember2021-12-260000046080us-gaap:BuildingAndBuildingImprovementsMember2022-12-250000046080us-gaap:BuildingAndBuildingImprovementsMember2021-12-260000046080us-gaap:MachineryAndEquipmentMember2022-12-250000046080us-gaap:MachineryAndEquipmentMember2021-12-260000046080has:LandAndImprovementsBuildingsAndImprovementsAndMachineryEquipmentAndSoftwareMember2022-12-250000046080has:LandAndImprovementsBuildingsAndImprovementsAndMachineryEquipmentAndSoftwareMember2021-12-260000046080us-gaap:ToolsDiesAndMoldsMember2022-12-250000046080us-gaap:ToolsDiesAndMoldsMember2021-12-260000046080has:ConsumerProductsMember2021-12-260000046080has:WizardsOfTheCoastAndDigitalGamingMember2021-12-260000046080has:EntertainmentSegmentMember2021-12-260000046080has:ConsumerProductsMember2021-12-272022-12-250000046080has:WizardsOfTheCoastAndDigitalGamingMember2021-12-272022-12-250000046080has:EntertainmentSegmentMember2021-12-272022-12-250000046080has:ConsumerProductsMember2022-12-250000046080has:WizardsOfTheCoastAndDigitalGamingMember2022-12-250000046080has:EntertainmentSegmentMember2022-12-250000046080has:ConsumerProductsMember2020-12-270000046080has:WizardsOfTheCoastAndDigitalGamingMember2020-12-270000046080has:EntertainmentSegmentMember2020-12-270000046080has:ConsumerProductsMember2020-12-282021-12-260000046080has:WizardsOfTheCoastAndDigitalGamingMember2020-12-282021-12-260000046080has:EntertainmentSegmentMember2020-12-282021-12-260000046080has:DDBeyondMemberhas:WizardsOfTheCoastAndDigitalGamingMember2022-05-190000046080has:EOneMusicMemberus-gaap:DisposalGroupHeldforsaleNotDiscontinuedOperationsMember2021-06-270000046080has:EOneMusicMemberus-gaap:DisposalGroupHeldforsaleNotDiscontinuedOperationsMember2021-03-292021-06-270000046080has:TheNetworkJointVentureMember2009-10-310000046080has:TheNetworkJointVentureMember2009-10-012009-10-310000046080has:DiscoveryCommunicationsIncMemberhas:TheNetworkJointVentureMember2014-09-230000046080has:TheNetworkJointVentureMember2014-09-230000046080has:TheNetworkJointVentureMember2022-12-250000046080has:TheNetworkJointVentureMember2021-12-260000046080us-gaap:OtherExpenseMemberhas:TheNetworkJointVentureMember2021-12-272022-12-250000046080us-gaap:OtherExpenseMemberhas:TheNetworkJointVentureMember2020-12-282021-12-260000046080us-gaap:OtherExpenseMemberhas:TheNetworkJointVentureMember2019-12-302020-12-270000046080us-gaap:OtherLiabilitiesMemberhas:TheNetworkJointVentureMember2021-12-260000046080us-gaap:OtherLiabilitiesMemberhas:TheNetworkJointVentureMember2022-12-250000046080us-gaap:OtherLiabilitiesMemberhas:TheNetworkJointVentureMember2021-12-272022-12-250000046080us-gaap:OtherLiabilitiesMemberhas:TheNetworkJointVentureMember2021-09-272021-12-260000046080has:TheNetworkJointVentureMember2021-12-272022-12-250000046080has:TheNetworkJointVentureMember2019-12-302020-12-270000046080has:TheNetworkJointVentureMember2009-10-312009-10-31has:royalty_installment_payment0000046080has:ProductionInvestmentMember2021-12-272022-12-250000046080has:ContentInvestmentMember2021-12-272022-12-250000046080us-gaap:LineOfCreditMemberus-gaap:RevolvingCreditFacilityMember2022-12-250000046080us-gaap:LineOfCreditMemberhas:UnsecuredUncommittedLinesOfCreditMember2022-12-250000046080us-gaap:LineOfCreditMemberhas:UnsecuredUncommittedLinesOfCreditMember2021-12-260000046080us-gaap:LineOfCreditMemberus-gaap:RevolvingCreditFacilityMember2021-12-260000046080has:ThreeYearTermLoanFacilityMemberus-gaap:UnsecuredDebtMember2019-09-012019-09-290000046080has:ThreeYearTermLoanFacilityMemberus-gaap:UnsecuredDebtMember2019-09-300000046080has:FiveYearTermLoanFacilityMemberus-gaap:UnsecuredDebtMember2019-09-012019-09-290000046080has:FiveYearTermLoanFacilityMemberus-gaap:UnsecuredDebtMember2019-09-300000046080us-gaap:UnsecuredDebtMemberhas:A10BillionTermLoanAgreementMember2019-12-302019-12-300000046080has:ThreeYearTermLoanFacilityMemberus-gaap:UnsecuredDebtMember2021-12-272022-12-250000046080has:FiveYearTermLoanFacilityMemberus-gaap:UnsecuredDebtMember2021-12-272022-12-250000046080us-gaap:LineOfCreditMemberus-gaap:RevolvingCreditFacilityMember2021-12-272022-12-250000046080has:CommercialPaperProgramMember2022-12-250000046080has:CommercialPaperProgramMember2021-12-272022-12-250000046080has:RevolvingProductionCreditFacilityMemberus-gaap:RevolvingCreditFacilityMember2021-11-300000046080has:Notes3.90Due2029Member2022-12-250000046080has:Notes3.90Due2029Member2021-12-260000046080has:Notes3.55Due2026Member2022-12-250000046080has:Notes3.55Due2026Member2021-12-260000046080has:Notes3.00Due2024Member2022-12-250000046080has:Notes3.00Due2024Member2021-12-260000046080has:Notes6.35Due2040Member2022-12-250000046080has:Notes6.35Due2040Member2021-12-260000046080has:Notes3.50Due2027Member2022-12-250000046080has:Notes3.50Due2027Member2021-12-260000046080has:Notes510Due2044Member2021-12-260000046080has:Debentures6.60Due2028Member2022-12-250000046080has:Debentures6.60Due2028Member2021-12-260000046080has:VariableRateNotesDue2024Member2022-12-250000046080has:VariableRateNotesDue2024Member2021-12-260000046080has:ProductionFinancingFacilitiesMember2022-12-250000046080has:ProductionFinancingFacilitiesMember2021-12-260000046080has:VariableRateNotesDue2024Member2021-12-272022-03-270000046080us-gaap:SeniorNotesMember2019-11-300000046080has:Notes2.60Due2022Memberus-gaap:SeniorNotesMember2019-11-300000046080us-gaap:SeniorNotesMemberhas:Notes3.00Due2024Member2019-11-300000046080us-gaap:SeniorNotesMemberhas:Notes3.55Due2026Member2019-11-300000046080us-gaap:SeniorNotesMemberhas:Notes3.90Due2029Member2019-11-300000046080srt:MinimumMemberus-gaap:SeniorNotesMember2019-11-012019-11-300000046080us-gaap:SeniorNotesMembersrt:MaximumMember2019-11-012019-11-300000046080has:Notes2.60Due2022Memberus-gaap:SeniorNotesMember2021-06-282021-09-260000046080us-gaap:UsTreasuryUstInterestRateMemberus-gaap:SeniorNotesMemberhas:Notes3.00Due2024Member2019-11-012019-11-300000046080us-gaap:UsTreasuryUstInterestRateMemberus-gaap:SeniorNotesMemberhas:Notes3.55Due2026Member2019-11-012019-11-300000046080us-gaap:UsTreasuryUstInterestRateMemberus-gaap:SeniorNotesMemberhas:Notes3.90Due2029Member2019-11-012019-11-300000046080us-gaap:SeniorNotesMember2019-11-012019-11-300000046080us-gaap:UnsecuredDebtMemberhas:A10BillionTermLoanAgreementMember2019-09-300000046080us-gaap:UnsecuredDebtMemberhas:A10BillionTermLoanAgreementMember2020-12-282021-12-260000046080has:ThreeYearTermLoanFacilityMemberus-gaap:UnsecuredDebtMember2020-12-282021-12-260000046080has:FiveYearTermLoanFacilityMemberus-gaap:UnsecuredDebtMember2020-12-282021-12-260000046080has:FiveYearTermLoanFacilityMembersrt:MinimumMemberus-gaap:UnsecuredDebtMemberus-gaap:EurodollarMember2019-09-012019-09-290000046080has:FiveYearTermLoanFacilityMembersrt:MaximumMemberus-gaap:UnsecuredDebtMemberus-gaap:EurodollarMember2019-09-012019-09-290000046080has:FiveYearTermLoanFacilityMemberus-gaap:BaseRateMembersrt:MinimumMemberus-gaap:UnsecuredDebtMember2019-09-012019-09-290000046080has:FiveYearTermLoanFacilityMemberus-gaap:BaseRateMembersrt:MaximumMemberus-gaap:UnsecuredDebtMember2019-09-012019-09-290000046080has:FiveYearTermLoanFacilityMemberus-gaap:UnsecuredDebtMemberus-gaap:DebtInstrumentRedemptionPeriodOneMember2019-09-300000046080has:FiveYearTermLoanFacilityMemberus-gaap:UnsecuredDebtMemberus-gaap:DebtInstrumentRedemptionPeriodOneMember2019-09-012019-09-290000046080has:FiveYearTermLoanFacilityMemberus-gaap:DebtInstrumentRedemptionPeriodTwoMemberus-gaap:UnsecuredDebtMember2019-09-300000046080srt:MaximumMemberus-gaap:UnsecuredDebtMemberhas:A10BillionTermLoanAgreementMember2019-09-300000046080srt:MinimumMemberus-gaap:UnsecuredDebtMemberhas:A10BillionTermLoanAgreementMember2019-09-300000046080has:DebtInstrumentsExcludingProductionFinancingFacilitiesMember2022-12-250000046080country:CA2022-12-25iso4217:CAD0000046080country:US2022-12-250000046080srt:MinimumMember2022-12-250000046080srt:MaximumMember2022-12-2500000460802018-05-3100000460802022-04-012022-12-250000046080us-gaap:FairValueMeasurementsRecurringMember2022-12-250000046080us-gaap:FairValueMeasurementsRecurringMemberus-gaap:FairValueInputsLevel1Member2022-12-250000046080us-gaap:FairValueMeasurementsRecurringMemberus-gaap:FairValueInputsLevel2Member2022-12-250000046080us-gaap:FairValueMeasurementsRecurringMemberus-gaap:FairValueInputsLevel3Member2022-12-250000046080us-gaap:FairValueMeasurementsRecurringMember2021-12-260000046080us-gaap:FairValueMeasurementsRecurringMemberus-gaap:FairValueInputsLevel1Member2021-12-260000046080us-gaap:FairValueMeasurementsRecurringMemberus-gaap:FairValueInputsLevel2Member2021-12-260000046080us-gaap:FairValueMeasurementsRecurringMemberus-gaap:FairValueInputsLevel3Member2021-12-260000046080us-gaap:ResearchAndDevelopmentExpenseMember2021-12-272022-12-250000046080us-gaap:ResearchAndDevelopmentExpenseMember2020-12-282021-12-260000046080us-gaap:ResearchAndDevelopmentExpenseMember2019-12-302020-12-270000046080has:SellingDistributionAndAdministrationMember2021-12-272022-12-250000046080has:SellingDistributionAndAdministrationMember2020-12-282021-12-260000046080has:SellingDistributionAndAdministrationMember2019-12-302020-12-270000046080has:SellingDistributionAndAdministrationMemberhas:FormerCEOMember2020-12-282021-12-260000046080has:StockPerformanceAwardsMember2021-12-272022-12-250000046080has:StockPerformanceAwardsMember2020-12-282021-12-260000046080has:StockPerformanceAwardsMember2019-12-302020-12-270000046080us-gaap:RestrictedStockUnitsRSUMember2021-12-272022-12-250000046080us-gaap:RestrictedStockUnitsRSUMember2020-12-282021-12-260000046080us-gaap:RestrictedStockUnitsRSUMember2019-12-302020-12-270000046080us-gaap:EmployeeStockOptionMember2021-12-272022-12-250000046080us-gaap:EmployeeStockOptionMember2020-12-282021-12-260000046080us-gaap:EmployeeStockOptionMember2019-12-302020-12-270000046080has:StockOptionsNonEmployeeMember2021-12-272022-12-250000046080has:StockOptionsNonEmployeeMember2020-12-282021-12-260000046080has:StockOptionsNonEmployeeMember2019-12-302020-12-270000046080has:StockPerformanceAwardsMember2021-12-260000046080has:StockPerformanceAwardsMember2020-12-270000046080has:StockPerformanceAwardsMember2019-12-290000046080has:StockPerformanceAwardsMember2022-12-250000046080has:StockPerformanceAwardsMemberhas:FormerCEOMember2020-12-282021-12-260000046080us-gaap:RestrictedStockMember2021-12-272022-12-250000046080us-gaap:RestrictedStockMember2020-12-282021-12-260000046080us-gaap:RestrictedStockMember2019-12-302020-12-270000046080has:FormerCEOMemberus-gaap:RestrictedStockMember2020-12-282021-12-260000046080us-gaap:RestrictedStockMember2022-12-250000046080us-gaap:RestrictedStockUnitsRSUMember2021-12-260000046080us-gaap:RestrictedStockUnitsRSUMember2020-12-270000046080us-gaap:RestrictedStockUnitsRSUMember2019-12-290000046080us-gaap:RestrictedStockUnitsRSUMember2022-12-250000046080us-gaap:EmployeeStockOptionMember2021-12-260000046080us-gaap:EmployeeStockOptionMember2020-12-270000046080us-gaap:EmployeeStockOptionMember2019-12-290000046080us-gaap:EmployeeStockOptionMember2022-12-250000046080us-gaap:EmployeeStockOptionMemberus-gaap:ShareBasedPaymentArrangementNonemployeeMember2021-12-272022-12-250000046080us-gaap:EmployeeStockOptionMemberus-gaap:ShareBasedPaymentArrangementNonemployeeMember2020-12-282021-12-260000046080us-gaap:EmployeeStockOptionMemberus-gaap:ShareBasedPaymentArrangementNonemployeeMember2019-12-302020-12-270000046080us-gaap:PensionPlansDefinedBenefitMember2021-12-272022-12-250000046080us-gaap:PensionPlansDefinedBenefitMember2020-12-282021-12-260000046080us-gaap:PensionPlansDefinedBenefitMember2019-12-302020-12-27has:defined_benefit_pension_plan0000046080us-gaap:PensionPlansDefinedBenefitMembercountry:US2022-12-250000046080us-gaap:PensionPlansDefinedBenefitMember2020-02-012020-02-290000046080us-gaap:PensionPlansDefinedBenefitMember2019-05-012019-05-310000046080us-gaap:PensionPlansDefinedBenefitMember2019-12-012019-12-310000046080us-gaap:PensionPlansDefinedBenefitMemberus-gaap:UnfundedPlanMember2022-12-2500000460802020-01-012020-01-010000046080us-gaap:PensionPlansDefinedBenefitMembercountry:US2021-12-260000046080us-gaap:PensionPlansDefinedBenefitMembercountry:US2020-12-270000046080us-gaap:PostemploymentRetirementBenefitsMembercountry:US2021-12-260000046080us-gaap:PostemploymentRetirementBenefitsMembercountry:US2020-12-270000046080us-gaap:PensionPlansDefinedBenefitMembercountry:US2021-12-272022-12-250000046080us-gaap:PensionPlansDefinedBenefitMembercountry:US2020-12-282021-12-260000046080us-gaap:PostemploymentRetirementBenefitsMembercountry:US2021-12-272022-12-250000046080us-gaap:PostemploymentRetirementBenefitsMembercountry:US2020-12-282021-12-260000046080us-gaap:PostemploymentRetirementBenefitsMembercountry:US2022-12-250000046080us-gaap:PensionPlansDefinedBenefitMember2022-12-250000046080us-gaap:PensionPlansDefinedBenefitMember2021-12-260000046080us-gaap:PostemploymentRetirementBenefitsMember2022-12-250000046080us-gaap:PostemploymentRetirementBenefitsMember2021-12-260000046080us-gaap:PostemploymentRetirementBenefitsMember2021-12-272022-12-250000046080us-gaap:PostemploymentRetirementBenefitsMember2020-12-282021-12-260000046080us-gaap:PostemploymentRetirementBenefitsMember2019-12-302020-12-270000046080us-gaap:PostemploymentRetirementBenefitsMember2020-12-270000046080us-gaap:ForeignPlanMember2022-12-250000046080us-gaap:ForeignPlanMember2021-12-260000046080us-gaap:ForeignPlanMember2021-12-272022-12-250000046080us-gaap:ForeignPlanMember2020-12-282021-12-260000046080us-gaap:ForeignPlanMember2019-12-302020-12-270000046080has:ForeignCurrencyForwardContractInventoryPurchasesMemberus-gaap:CashFlowHedgingMemberus-gaap:DesignatedAsHedgingInstrumentMember2022-12-250000046080has:ForeignCurrencyForwardContractInventoryPurchasesMemberus-gaap:CashFlowHedgingMemberus-gaap:DesignatedAsHedgingInstrumentMember2021-12-260000046080us-gaap:CashFlowHedgingMemberus-gaap:DesignatedAsHedgingInstrumentMemberus-gaap:SalesMember2022-12-250000046080us-gaap:CashFlowHedgingMemberus-gaap:DesignatedAsHedgingInstrumentMemberus-gaap:SalesMember2021-12-260000046080has:ForeignCurrencyForwardContractProductionFinancingAndOtherMemberus-gaap:CashFlowHedgingMemberus-gaap:DesignatedAsHedgingInstrumentMember2022-12-250000046080has:ForeignCurrencyForwardContractProductionFinancingAndOtherMemberus-gaap:CashFlowHedgingMemberus-gaap:DesignatedAsHedgingInstrumentMember2021-12-260000046080us-gaap:CashFlowHedgingMemberus-gaap:DesignatedAsHedgingInstrumentMember2022-12-250000046080us-gaap:CashFlowHedgingMemberus-gaap:DesignatedAsHedgingInstrumentMember2021-12-260000046080us-gaap:DesignatedAsHedgingInstrumentMemberus-gaap:PrepaidExpensesAndOtherCurrentAssetsMember2022-12-250000046080us-gaap:DesignatedAsHedgingInstrumentMemberus-gaap:PrepaidExpensesAndOtherCurrentAssetsMember2021-12-260000046080us-gaap:OtherAssetsMemberus-gaap:DesignatedAsHedgingInstrumentMember2022-12-250000046080us-gaap:OtherAssetsMemberus-gaap:DesignatedAsHedgingInstrumentMember2021-12-260000046080us-gaap:AccruedLiabilitiesMemberus-gaap:DesignatedAsHedgingInstrumentMember2022-12-250000046080us-gaap:AccruedLiabilitiesMemberus-gaap:DesignatedAsHedgingInstrumentMember2021-12-260000046080us-gaap:ForeignExchangeForwardMemberus-gaap:CashFlowHedgingMemberus-gaap:CostOfSalesMember2021-12-272022-12-250000046080us-gaap:ForeignExchangeForwardMemberus-gaap:CashFlowHedgingMemberus-gaap:CostOfSalesMember2020-12-282021-12-260000046080us-gaap:ForeignExchangeForwardMemberus-gaap:CashFlowHedgingMemberus-gaap:CostOfSalesMember2019-12-302020-12-270000046080us-gaap:ForeignExchangeForwardMemberus-gaap:CashFlowHedgingMemberus-gaap:SalesMember2021-12-272022-12-250000046080us-gaap:ForeignExchangeForwardMemberus-gaap:CashFlowHedgingMemberus-gaap:SalesMember2020-12-282021-12-260000046080us-gaap:ForeignExchangeForwardMemberus-gaap:CashFlowHedgingMemberus-gaap:SalesMember2019-12-302020-12-270000046080has:RoyaltyExpenseMemberus-gaap:ForeignExchangeForwardMemberus-gaap:CashFlowHedgingMember2021-12-272022-12-250000046080has:RoyaltyExpenseMemberus-gaap:ForeignExchangeForwardMemberus-gaap:CashFlowHedgingMember2020-12-282021-12-260000046080has:RoyaltyExpenseMemberus-gaap:ForeignExchangeForwardMemberus-gaap:CashFlowHedgingMember2019-12-302020-12-270000046080us-gaap:ForeignExchangeForwardMemberus-gaap:CashFlowHedgingMember2021-12-272022-12-250000046080us-gaap:ForeignExchangeForwardMemberus-gaap:CashFlowHedgingMember2020-12-282021-12-260000046080us-gaap:ForeignExchangeForwardMemberus-gaap:CashFlowHedgingMember2019-12-302020-12-270000046080us-gaap:NondesignatedMemberhas:ForeignCurrencyForwardContract5Memberus-gaap:FairValueHedgingMember2022-12-250000046080us-gaap:NondesignatedMemberhas:ForeignCurrencyForwardContract5Memberus-gaap:FairValueHedgingMember2021-12-260000046080us-gaap:NondesignatedMemberus-gaap:PrepaidExpensesAndOtherCurrentAssetsMember2022-12-250000046080us-gaap:NondesignatedMemberus-gaap:PrepaidExpensesAndOtherCurrentAssetsMember2021-12-260000046080us-gaap:ForeignExchangeForwardMemberus-gaap:DesignatedAsHedgingInstrumentMemberus-gaap:PrepaidExpensesAndOtherCurrentAssetsMember2022-12-250000046080us-gaap:ForeignExchangeForwardMemberus-gaap:DesignatedAsHedgingInstrumentMemberus-gaap:PrepaidExpensesAndOtherCurrentAssetsMember2021-12-260000046080us-gaap:AccruedLiabilitiesMemberus-gaap:NondesignatedMember2022-12-250000046080us-gaap:AccruedLiabilitiesMemberus-gaap:NondesignatedMember2021-12-260000046080us-gaap:AccruedLiabilitiesMemberus-gaap:ForeignExchangeForwardMemberus-gaap:DesignatedAsHedgingInstrumentMember2022-12-250000046080us-gaap:AccruedLiabilitiesMemberus-gaap:ForeignExchangeForwardMemberus-gaap:DesignatedAsHedgingInstrumentMember2021-12-260000046080us-gaap:NondesignatedMember2022-12-250000046080us-gaap:NondesignatedMember2021-12-260000046080us-gaap:ForeignExchangeForwardMemberus-gaap:FairValueHedgingMember2021-12-272022-12-250000046080us-gaap:ForeignExchangeForwardMemberus-gaap:FairValueHedgingMember2020-12-282021-12-260000046080us-gaap:ForeignExchangeForwardMemberus-gaap:FairValueHedgingMember2019-12-302020-12-270000046080has:A2018And2020RestructuringActionsMember2022-12-250000046080has:A2018And2020RestructuringActionsMember2021-12-272022-12-250000046080has:OperationalExcellenceProgramMember2021-12-272022-12-250000046080has:OperationalExcellenceProgramMember2022-12-250000046080has:RoyaltiesMember2022-12-250000046080has:EntertainmentProjectsOrContentAgreementsMember2022-12-250000046080has:TaxSharingAgreementMember2022-12-250000046080has:CartamundiManufacturingAgreementMember2022-12-250000046080has:ConsumerProductsMemberus-gaap:OperatingSegmentsMember2021-12-272022-12-250000046080has:ConsumerProductsMemberus-gaap:OperatingSegmentsMember2022-12-250000046080us-gaap:OperatingSegmentsMemberhas:WizardsOfTheCoastAndDigitalGamingMember2021-12-272022-12-250000046080us-gaap:OperatingSegmentsMemberhas:WizardsOfTheCoastAndDigitalGamingMember2022-12-250000046080has:EntertainmentSegmentMemberus-gaap:OperatingSegmentsMember2021-12-272022-12-250000046080has:EntertainmentSegmentMemberus-gaap:OperatingSegmentsMember2022-12-250000046080us-gaap:CorporateNonSegmentMember2021-12-272022-12-250000046080us-gaap:CorporateNonSegmentMember2022-12-250000046080has:ConsumerProductsMemberus-gaap:OperatingSegmentsMember2020-12-282021-12-260000046080has:ConsumerProductsMemberus-gaap:OperatingSegmentsMember2021-12-260000046080us-gaap:OperatingSegmentsMemberhas:WizardsOfTheCoastAndDigitalGamingMember2020-12-282021-12-260000046080us-gaap:OperatingSegmentsMemberhas:WizardsOfTheCoastAndDigitalGamingMember2021-12-260000046080has:EntertainmentSegmentMemberus-gaap:OperatingSegmentsMember2020-12-282021-12-260000046080has:EntertainmentSegmentMemberus-gaap:OperatingSegmentsMember2021-12-260000046080us-gaap:CorporateNonSegmentMember2020-12-282021-12-260000046080us-gaap:CorporateNonSegmentMember2021-12-260000046080has:ConsumerProductsMemberus-gaap:OperatingSegmentsMember2019-12-302020-12-270000046080has:ConsumerProductsMemberus-gaap:OperatingSegmentsMember2020-12-270000046080us-gaap:OperatingSegmentsMemberhas:WizardsOfTheCoastAndDigitalGamingMember2019-12-302020-12-270000046080us-gaap:OperatingSegmentsMemberhas:WizardsOfTheCoastAndDigitalGamingMember2020-12-270000046080has:EntertainmentSegmentMemberus-gaap:OperatingSegmentsMember2019-12-302020-12-270000046080has:EntertainmentSegmentMemberus-gaap:OperatingSegmentsMember2020-12-270000046080us-gaap:CorporateNonSegmentMember2019-12-302020-12-270000046080us-gaap:CorporateNonSegmentMember2020-12-270000046080srt:NorthAmericaMembersrt:ReportableGeographicalComponentsMember2021-12-272022-12-250000046080srt:NorthAmericaMembersrt:ReportableGeographicalComponentsMember2020-12-282021-12-260000046080srt:NorthAmericaMembersrt:ReportableGeographicalComponentsMember2019-12-302020-12-270000046080srt:EuropeMembersrt:ReportableGeographicalComponentsMember2021-12-272022-12-250000046080srt:EuropeMembersrt:ReportableGeographicalComponentsMember2020-12-282021-12-260000046080srt:EuropeMembersrt:ReportableGeographicalComponentsMember2019-12-302020-12-270000046080srt:ReportableGeographicalComponentsMembersrt:AsiaPacificMember2021-12-272022-12-250000046080srt:ReportableGeographicalComponentsMembersrt:AsiaPacificMember2020-12-282021-12-260000046080srt:ReportableGeographicalComponentsMembersrt:AsiaPacificMember2019-12-302020-12-270000046080srt:ReportableGeographicalComponentsMembersrt:LatinAmericaMember2021-12-272022-12-250000046080srt:ReportableGeographicalComponentsMembersrt:LatinAmericaMember2020-12-282021-12-260000046080srt:ReportableGeographicalComponentsMembersrt:LatinAmericaMember2019-12-302020-12-270000046080srt:ReportableGeographicalComponentsMember2021-12-272022-12-250000046080srt:ReportableGeographicalComponentsMember2020-12-282021-12-260000046080srt:ReportableGeographicalComponentsMember2019-12-302020-12-270000046080has:TabletopGamingMemberhas:WizardsOfTheCoastAndDigitalGamingMember2021-12-272022-12-250000046080has:TabletopGamingMemberhas:WizardsOfTheCoastAndDigitalGamingMember2020-12-282021-12-260000046080has:TabletopGamingMemberhas:WizardsOfTheCoastAndDigitalGamingMember2019-12-302020-12-270000046080has:DigitalAndLicensingGamingMemberhas:WizardsOfTheCoastAndDigitalGamingMember2021-12-272022-12-250000046080has:DigitalAndLicensingGamingMemberhas:WizardsOfTheCoastAndDigitalGamingMember2020-12-282021-12-260000046080has:DigitalAndLicensingGamingMemberhas:WizardsOfTheCoastAndDigitalGamingMember2019-12-302020-12-270000046080has:WizardsOfTheCoastAndDigitalGamingMember2019-12-302020-12-270000046080has:EntertainmentSegmentMemberhas:FilmandTVMember2021-12-272022-12-250000046080has:EntertainmentSegmentMemberhas:FilmandTVMember2020-12-282021-12-260000046080has:EntertainmentSegmentMemberhas:FilmandTVMember2019-12-302020-12-270000046080has:EntertainmentSegmentMemberhas:ClassOfPrincipalProductFamilyBrandsMember2021-12-272022-12-250000046080has:EntertainmentSegmentMemberhas:ClassOfPrincipalProductFamilyBrandsMember2020-12-282021-12-260000046080has:EntertainmentSegmentMemberhas:ClassOfPrincipalProductFamilyBrandsMember2019-12-302020-12-270000046080has:EntertainmentSegmentMemberhas:MusicAndOtherMember2021-12-272022-12-250000046080has:EntertainmentSegmentMemberhas:MusicAndOtherMember2020-12-282021-12-260000046080has:EntertainmentSegmentMemberhas:MusicAndOtherMember2019-12-302020-12-270000046080has:EntertainmentSegmentMember2019-12-302020-12-270000046080has:ClassOfPrincipalProductFranchiseBrandsMember2021-12-272022-12-250000046080has:ClassOfPrincipalProductFranchiseBrandsMember2020-12-282021-12-260000046080has:ClassOfPrincipalProductFranchiseBrandsMember2019-12-302020-12-270000046080has:ClassOfPrincipalpProductPartnerBrandsMember2021-12-272022-12-250000046080has:ClassOfPrincipalpProductPartnerBrandsMember2020-12-282021-12-260000046080has:ClassOfPrincipalpProductPartnerBrandsMember2019-12-302020-12-270000046080has:ClassofPrincipalProductHasbroGamingMember2021-12-272022-12-250000046080has:ClassofPrincipalProductHasbroGamingMember2020-12-282021-12-260000046080has:ClassofPrincipalProductHasbroGamingMember2019-12-302020-12-270000046080has:ClassOfPrincipalProductEmergingBrandsMember2021-12-272022-12-250000046080has:ClassOfPrincipalProductEmergingBrandsMember2020-12-282021-12-260000046080has:ClassOfPrincipalProductEmergingBrandsMember2019-12-302020-12-270000046080has:TVFilmEntertainmentMember2021-12-272022-12-250000046080has:TVFilmEntertainmentMember2020-12-282021-12-260000046080has:TVFilmEntertainmentMember2019-12-302020-12-270000046080has:PeppaPigMember2020-12-282021-12-260000046080has:GamingIncludingMagicTheGatheringAndMonopolyMember2021-12-272022-12-250000046080has:GamingIncludingMagicTheGatheringAndMonopolyMember2020-12-282021-12-260000046080has:GamingIncludingMagicTheGatheringAndMonopolyMember2019-12-302020-12-270000046080us-gaap:OperatingSegmentsMembercountry:US2021-12-272022-12-250000046080us-gaap:OperatingSegmentsMembercountry:US2020-12-282021-12-260000046080us-gaap:OperatingSegmentsMembercountry:US2019-12-302020-12-270000046080us-gaap:NonUsMemberus-gaap:OperatingSegmentsMember2021-12-272022-12-250000046080us-gaap:NonUsMemberus-gaap:OperatingSegmentsMember2020-12-282021-12-260000046080us-gaap:NonUsMemberus-gaap:OperatingSegmentsMember2019-12-302020-12-270000046080us-gaap:OperatingSegmentsMembercountry:US2022-12-250000046080us-gaap:OperatingSegmentsMembercountry:US2021-12-260000046080us-gaap:OperatingSegmentsMembercountry:US2020-12-270000046080us-gaap:NonUsMemberus-gaap:OperatingSegmentsMember2022-12-250000046080us-gaap:NonUsMemberus-gaap:OperatingSegmentsMember2021-12-260000046080us-gaap:NonUsMemberus-gaap:OperatingSegmentsMember2020-12-270000046080us-gaap:SalesRevenueNetMemberhas:WalMartStoresIncMemberus-gaap:CustomerConcentrationRiskMember2021-12-272022-12-250000046080us-gaap:SalesRevenueNetMemberhas:AmazoncomMemberus-gaap:CustomerConcentrationRiskMember2021-12-272022-12-250000046080us-gaap:SalesRevenueNetMemberhas:WalMartStoresIncMemberus-gaap:CustomerConcentrationRiskMember2020-12-282021-12-260000046080us-gaap:SalesRevenueNetMemberhas:AmazoncomMemberus-gaap:CustomerConcentrationRiskMember2020-12-282021-12-260000046080us-gaap:SalesRevenueNetMemberhas:WalMartStoresIncMemberus-gaap:CustomerConcentrationRiskMember2019-12-302020-12-270000046080us-gaap:SalesRevenueNetMemberhas:AmazoncomMemberus-gaap:CustomerConcentrationRiskMember2019-12-302020-12-270000046080has:EOneMusicMemberus-gaap:DisposalGroupHeldforsaleNotDiscontinuedOperationsMember2021-04-250000046080us-gaap:DisposalGroupDisposedOfBySaleNotDiscontinuedOperationsMemberhas:EOneMusicMember2021-06-292021-06-290000046080us-gaap:DisposalGroupDisposedOfBySaleNotDiscontinuedOperationsMemberhas:EOneMusicMember2021-06-290000046080us-gaap:DisposalGroupDisposedOfBySaleNotDiscontinuedOperationsMemberhas:EOneMusicMember2021-03-292021-06-270000046080us-gaap:DisposalGroupDisposedOfBySaleNotDiscontinuedOperationsMemberhas:EOneMusicMember2021-12-26
UNITED STATES SECURITIES AND EXCHANGE COMMISSION
Washington, D.C. 20549
Form 10-K
☒ ANNUAL REPORT PURSUANT TO SECTION 13 OR 15(d)
OF THE SECURITIES EXCHANGE ACT OF 1934
For the fiscal year ended December 25, 2022
Commission file number 1-6682
Hasbro, Inc.
(Exact Name of Registrant As Specified in its Charter)
| | | | | | | | |
| Rhode Island | 05-0155090 |
| (State of Incorporation) | (I.R.S. Employer Identification No.) |
| | |
| 1027 Newport Avenue | |
| Pawtucket, | Rhode Island | 02861 |
| (Address of Principal Executive Offices) | (Zip Code) |
Registrant’s telephone number, including area code (401) 431-8697
Securities registered pursuant to Section 12(b) of the Act:
| | | | | | | | |
| Title of each class | Trading Symbol(s) | Name of each exchange on which registered |
| Common Stock | HAS | The NASDAQ Global Select Market |
Securities registered pursuant to Section 12(g) of the Act:
None
Indicate by check mark if the registrant is a well-known seasoned issuer, as defined in Rule 405 of the Securities Act. Yes ☒ or No ☐.
Indicate by check mark if the registrant is not required to file reports pursuant to Section 13 or Section 15(d) of the Act. Yes ☐ or No ☒.
Indicate by check mark whether the registrant (1) has filed all reports required to be filed by Section 13 or 15(d) of the Securities Exchange Act of 1934 during the preceding 12 months (or for such shorter period that the registrant was required to file such reports), and (2) has been subject to such filing requirements for the past 90 days. Yes ☒ or No ☐.
Indicate by check mark whether the registrant has submitted electronically every Interactive Data File required to be submitted pursuant to Rule 405 of Regulation S-T (§ 232.405 of this chapter) during the preceding 12 months (or for such shorter period that the registrant was required to submit such files). Yes ☒ or No ☐.
Indicate by check mark whether the registrant is a large accelerated filer, an accelerated filer, a non-accelerated filer, a smaller reporting company, or an emerging growth company. See the definitions of “large accelerated filer,” “accelerated filer,” “smaller reporting company,” and “emerging growth company” in Rule 12b-2 of the Exchange Act.
| | | | | | | | | | | | | | | | | | | | | | | |
| Large Accelerated Filer | ☒ | Accelerated Filer | ☐ | Non-Accelerated Filer | ☐ | Smaller Reporting Company | ☐ |
| Emerging Growth Company | ☐ | | | | | | |
If an emerging growth company, indicate by check mark if the registrant has elected not to use the extended transition period for complying with any new or revised financial accounting standards provided pursuant to Section 13(a) of the Exchange Act. ☐
Indicate by check mark whether the registrant has filed a report on and attestation to its management’s assessment of the effectiveness of its internal control over financial reporting under Section 404(b) of the Sarbanes-Oxley Act (15 U.S.C. 7262(b)) by the registered public accounting firm that prepared or issued its audit report. ☒
If securities are registered pursuant to Section 12(b) of the Act, indicate by check mark whether the financial statements of the registrant included in the filing reflect the correction of an error to previously issued financial statements. ☐
Indicate by check mark whether any of those error corrections are restatements that required a recovery analysis of incentive-based compensation received by any of the registrant’s executive officers during the relevant recovery period pursuant to § 240.10D-1(b). ☐
Indicate by check mark whether the registrant is a shell company (as defined in Rule 12b-2 of the Act). Yes ☐ or No ☒.
The aggregate market value on June 24, 2022 (the last business day of the Company’s most recently completed second quarter) of the voting common stock held by non-affiliates of the registrant, computed by reference to the closing price of the stock on that date, was approximately $11,751,405,393. The registrant does not have non-voting common stock outstanding.
The number of shares of common stock outstanding as of February 16, 2023 was 138,219,857.
DOCUMENTS INCORPORATED BY REFERENCE
Portions of our definitive proxy statement for our 2023 Annual Meeting of Shareholders are incorporated by reference into Part III of this Report.
| | | | | | | | |
| | Page |
| | |
| | |
| | |
| | 28 |
| | 41 |
| | 41 |
| | 42 |
| | 42 |
| | |
| | |
| | 43 |
| | 43 |
| | 43 |
| | 70 |
| | 73 |
| | 124 |
| | 124 |
| | 126 |
| | 126 |
| | |
| | |
| | 127 |
| | 127 |
| | 127 |
| | 127 |
| | 127 |
| | |
| | |
| | 128 |
| | 128 |
| | 133 |
Special Note Regarding Forward-Looking Statements
From time to time, including in this Annual Report on Form 10-K (“Form 10-K”) and in our annual report to shareholders, we publish “forward-looking statements” within the meaning of the Private Securities Litigation Reform Act of 1995. These “forward-looking statements” may relate to matters such as: our business and marketing strategies; anticipated financial performance or business prospects in future periods; expected technological and product developments; relationships with business partners, customers and suppliers; purchasing patterns of our customers and consumers; efforts to expand ecommerce capabilities; the expected timing for scheduled new product introductions or our expectations concerning the future acceptance of products by customers; expected benefits and plans relating to acquired brands, properties and businesses; the development and timing of planned consumer and digital gaming products and entertainment releases; changes in the methods of content distribution, including increased reliance on streaming outlets; marketing and promotional efforts; goals relating to our Environmental Social Governance (ESG) activities; research and development activities; geographic plans, adequacy of supply; manufacturing capacity; expectations related to our manufacturing; the potential for tariffs and their impact on our business; impact of the coronavirus pandemic and other public health conditions; adequacy of our properties; expected benefits and cost-savings resulting from the Company’s Operational Excellence Program; expected benefits and cost-reductions from certain restructuring actions and divestiture of non-core businesses or assets; capital expenditures; working capital; liquidity; timing of and amount of repayment of indebtedness; capital allocation strategy, including plans for dividends and share repurchases; and other financial, tax, accounting and similar matters. Forward-looking statements are inherently subject to risks and uncertainties. The Private Securities Litigation Reform Act of 1995 provides a safe harbor for forward-looking statements. These statements may be identified by the use of forward-looking words or phrases such as “anticipate,” “believe,” “could,” “expect,” “intend,” “looking forward,” “may,” “planned,” “potential,” “should,” “will” and “would” or any variations of words with similar meanings. We note that a variety of factors could cause our actual results and experience to differ materially from the anticipated results or other expectations expressed or anticipated in our forward-looking statements. The factors listed in the risk factors below and in Part I, Item 1A. Risk Factors, of this Form 10-K are illustrative and other risks and uncertainties may arise as are or may be detailed from time to time in our public announcements and our filings with the Securities and Exchange Commission, such as on Forms 8-K, 10-Q and 10-K. We undertake no obligation to make any revisions to the forward-looking statements contained in this Form 10-K or in our annual report to shareholders to reflect events or circumstances occurring after the date of the filing of this report.
RISK FACTORS SUMMARY
We are subject to a variety of risks and uncertainties, which could have a material adverse effect on our business, financial condition, results of operations and cash flows. These include strategic, operational, global economic, financial, governmental, regulatory and legal risks related to our business. Risks that we deem material are described under “Risk Factors” in Item 1A of this Form 10-K. These risks include, but are not limited to, the following:
Strategic Risks
•We may not successfully implement and execute our Blueprint 2.0 strategy and transformation initiatives.
•Consumer interests change quickly, making it difficult to develop successful products and entertainment. Consumers may prefer the products and games offered by our competitors to those we offer, harming our business and results.
•A key to our future success will be our ability to further develop digital and technologically advanced products.
•Changes in viewing behaviors and formats in the entertainment industry may harm our business.
•We may lose rights to existing partner brands or fail to secure such rights in the future.
•Our third-party licenses may not be profitable and generate significant royalties for us if licensed material does not achieve sufficient market appeal.
•The industries in which we compete are highly competitive, with low barriers to entry.
•Acquisitions, dispositions and other investments we complete may not provide us with the benefits we expect, or the realization of such benefits may be significantly delayed. We may not achieve a successful sale or license of non-core assets, including certain film and television assets.
Operational Risks
•Our business may be harmed if we are not successful in transforming our supply chain operations.
•We may be unable to develop, introduce and ship products on a timely and cost-effective basis, or we may be unable to successfully navigate through global supply chain challenges.
•We may be unable to successfully adapt to the increasing importance of ecommerce and direct-to-consumer sales.
•Our retail customer base remains highly concentrated, making us susceptible to the success of their businesses.
•Our substantial business, sales and manufacturing outside the U.S. subjects us to risks of international operations.
•Our reliance on third-party manufacturers, particularly in China, presents risks to our business.
•Our digital game offerings and entertainment operations may be dependent on third-party studios, content producers and distribution channels.
•We may be unable to renew certain long-term licensing agreements for access to partner brands and the acquisition of content.
•We have had recent leadership changes and other employee changes. If we lose key management or other employees or are unable to attract and retain talented people with the skillsets we need for our diverse and changing business, our business may be harmed. Similarly, if new members of management and new employees are not successful that will negatively impact our business.
•We may be unable to hire and develop diverse talent, thereby making it difficult to compete.
•Our business may be harmed if we are unable to protect our critical intellectual property rights.
•If we do not successfully operate our information technology systems, or if our electronic data is compromised, our business may be harmed.
Global and Economic Risks
•The global coronavirus outbreak has had and may continue to have an adverse effect on our business, including harming our ability to source and ship products in a timely and cost-effective manner.
•Changes in U.S., global or regional economic conditions can harm our business, such as inflation and rising interest rates, as well as the markets in which we and our employees, consumers, customers, suppliers and manufacturers operate. Such changes can also adversely impact discretionary consumer spending.
Financial Risks
•Seasonality in our business may cause our quarterly and annual operating results to fluctuate.
•Impairment charges related to acquired assets or other investments could harm our results.
•Our financial performance can be impacted by changes in foreign currency rates due to our global business.
•Our indebtedness may limit our availability of cash, cause us to divert cash to fund debt service payments or make it more difficult to take certain other actions.
•We may be unable to obtain or service our external borrowings, or restrictions imposed by such borrowings may be burdensome.
•Our effective tax rate may vary due to changes in or differing tax law and rules in the territories we operate.
•We could lose certain licenses, incentives and tax credits if certain of our subsidiaries lose Canadian status.
Governmental, Regulatory and Legal Risks
•If we were to violate laws or regulations applicable to our business, our business could be harmed.
•Failure to achieve our sustainability goals may result in reputational damage.
•We could be the subject of product liability suits or product recalls, either of which could harm our business.
•Our entertainment business could become the subject to liability claims for media content.
•We are involved in other litigation and similar matters which may entail significant expense or otherwise adversely impact our business.
Additional risks and uncertainties not presently known to us or that we currently deem immaterial also may impair our business, financial condition, results of operations and cash flows.
PART I
Except as expressly indicated or unless the context otherwise requires, as used herein, “Hasbro”, the “Company”, “we”, or “us”, means Hasbro, Inc., a Rhode Island corporation organized on January 8, 1926, and its subsidiaries.
Item 1. Business.
Overview
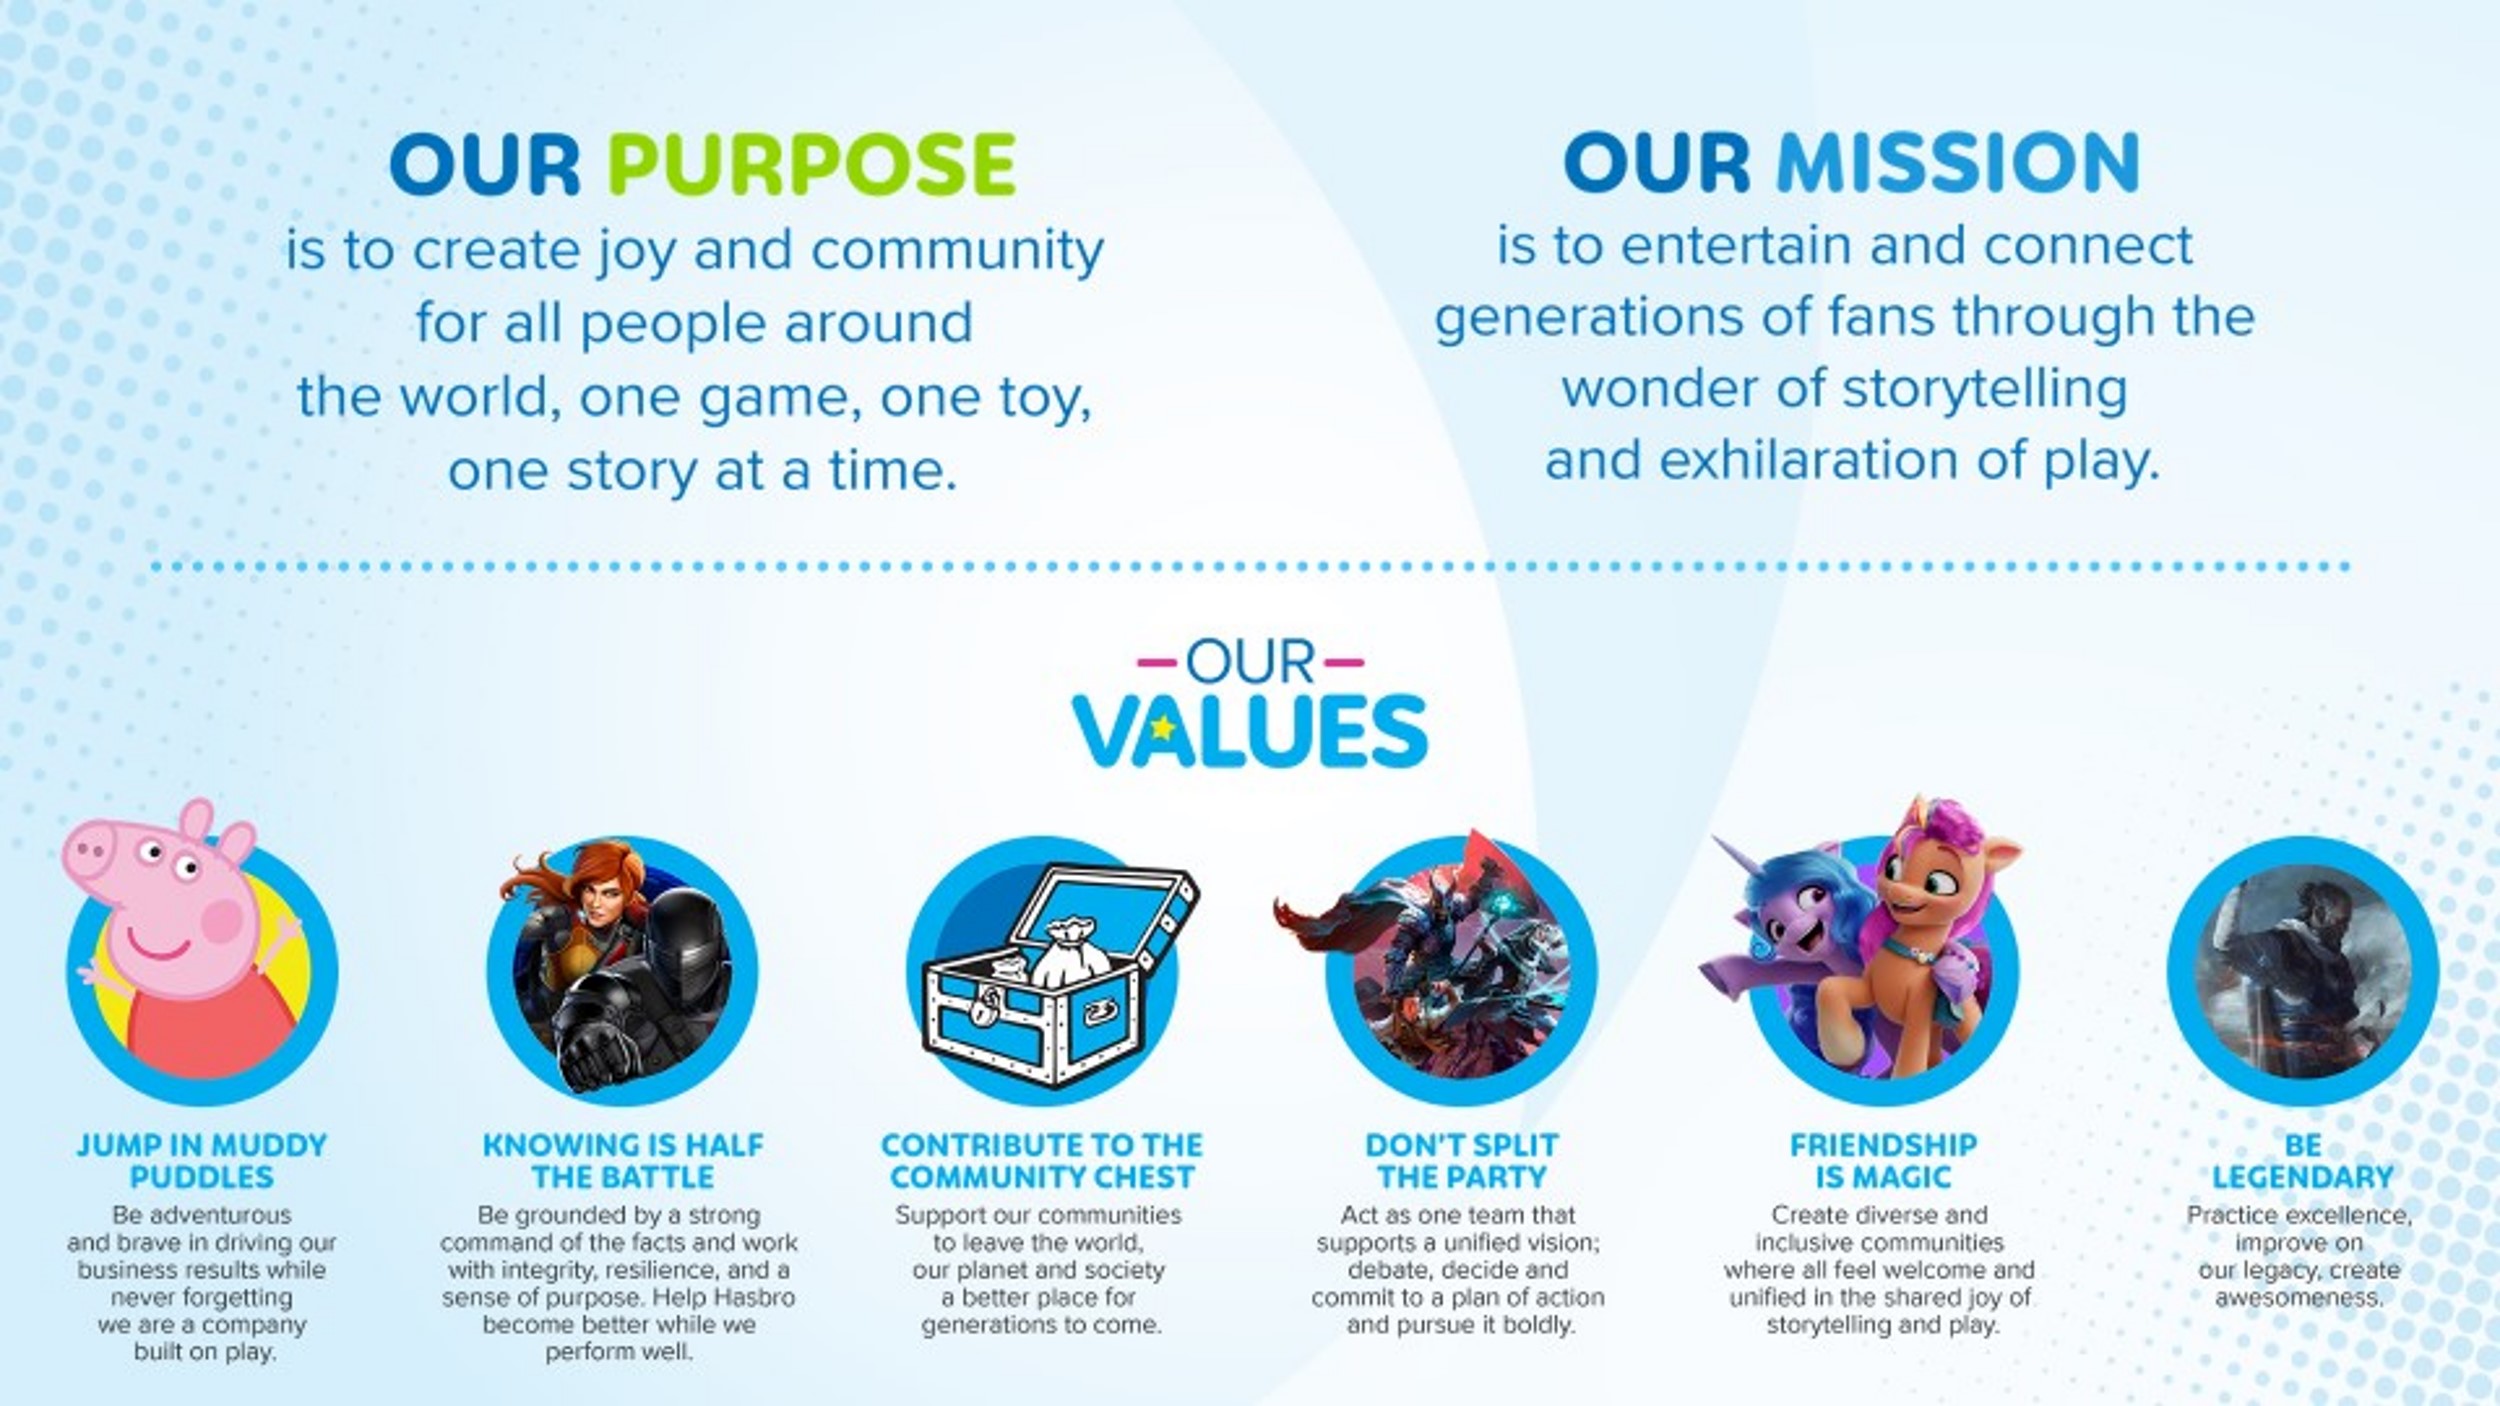
Hasbro, Inc. (“Hasbro”) is a global Branded Entertainment leader whose mission is to entertain and connect generations of fans through the wonder of storytelling and exhilaration of play. Hasbro delivers engaging brand experiences for global audiences through gaming, consumer products and entertainment, with a portfolio of iconic brands including MAGIC: THE GATHERING, DUNGEONS & DRAGONS, Hasbro Gaming, NERF, TRANSFORMERS, PLAY-DOH and PEPPA PIG, as well as premier partner brands.
Hasbro is guided by our purpose to create joy and community for all people around the world, one game, one toy, one story at a time.
For more than a decade, we have been consistently recognized for our corporate citizenship, including being named one of the 100 Best Corporate Citizens by 3BL Media, one of the World’s Most Ethical Companies by Ethisphere Institute and one of the 50 Most Community-Minded Companies in the U.S. by the Civic 50.
Recent Developments
Fiscal year 2022 was a challenging year for Hasbro. We navigated through a difficult global economy with high inflation and rising interest rates, a challenged toy and game industry, the continued effects of the coronavirus pandemic and leadership changes, as we embarked upon a multi-year transformational effort to support our revamped Blueprint 2.0 strategy described below.
Executive Leadership
Effective February 25, 2022 we appointed Christian (Chris) Cocks as Chief Executive Officer and a member of the Board of Directors. Mr. Cocks previously served as President and Chief Operating Officer of Hasbro’s Wizards of the Coast and Digital Gaming division.
In February 2022, we appointed Cynthia Williams as President of Wizards of the Coast and Digital Gaming. Ms. Williams joined us from Microsoft, where she most recently served as General Manager and Vice President, Gaming Ecosystem Commercial Team, and drove the expansion of Xbox Gaming and the acceleration of game-creator growth. Prior to joining Microsoft, Ms. Williams spent more than a decade at Amazon, where she led the global growth of their ecommerce direct-to-consumer business Fulfillment by Amazon.
In April 2022, we appointed Shane Azzi as our Chief Global Supply Chain Officer, and Matthew Austin as our Chief Commercial Officer. Mr. Azzi has more than 25 years of consumer packaged goods and diverse
supply chain experience, most recently with Kimberly-Clark. Mr. Austin was promoted from within Hasbro and is focused on leveraging our commercial operations with powerful, data-driven consumer insights and strategic partnership, across different channels, including e-commerce and direct fan experience.
In May 2022, we appointed Najuma Atkinson as our Chief People Officer, to lead our Global HR function. Ms. Atkinson joined us from Dell Technologies, where she served as Senior Vice President of Global HR Services.
In November 2022, we announced that Deborah Thomas informed Hasbro of her intent to retire from her position as Executive Vice President and Chief Financial Officer after 24 years of distinguished service and leadership with the Company. Hasbro initiated a search process to identify her successor and Ms. Thomas and Hasbro plan for her to remain as Chief Financial Officer until her successor is in place, and remain as an advisor to the Company for a period thereafter, to ensure a smooth transition.
In January 2023, we announced that Eric Nyman, President and Chief Operating Officer since February 2022, will be leaving the Company effective March 31, 2023.
Strategic Review
On October 4, 2022, following a several months long strategic review of our business led by our CEO, we announced a go-forward strategic plan guided by our new Blueprint 2.0, a consumer-centric framework for bringing compelling and expansive brand experiences to audiences around the world. During our review we identified opportunities to focus and scale our business, enhance operational excellence, including through specialized organizational programs and supply chain transformation, to drive growth and profit and enhance shareholder value. We plan to increase strategic investment on our most valuable and profitable franchises across toys, games, entertainment and licensing, and exit certain non-core aspects of the business.
Our Blueprint 2.0 transformation is guided by five strategic pillars: Brand, Insights and Entertainment; Direct and Digital; Licensing; Operational Excellence; and People.
Brand, Insights and Entertainment
•Focus on fewer, bigger, more profitable brands and driving market share in the key categories of preschool, games, creativity, outdoor and action brands.
•Develop our insights and analytics capabilities heavily focused on putting consumers at the center of everything we do, as we build multi-generational brands.
•Entertainment investments focused on Hasbro IP aligned with our Blueprint 2.0 strategy including merchandise and digital engagement opportunities with a focus on franchise brands.
Direct and Digital
•Invest in our Hasbro direct-to-consumer and digital business, inclusive of Hasbro PULSE, SECRET LAIR, Magic: The Gathering Arena and D&D Beyond. An example of this investment includes our acquisition of D&D Beyond (the "D&D Beyond Acquisition"), the premier digital content platform for DUNGEONS & DRAGONS, in the second quarter of 2022, in an all-cash transaction for a purchase price of $146.3 million. The D&D Beyond Acquisition is expected to substantially accelerate direct-to-fans capability for DUNGEONS & DRAGONS in physical and digital play.
•Continue to cultivate digital licensing relationships that activate our brands.
Licensing
•Scale licensing of our brands through a growing portfolio of partners from theme park operators to toy companies, for consumers to experience our brands and drive communities of friendship and fandom around them.
Operational Excellence
•Execute operational savings initiatives, including supply chain transformation, to improve operating results and reinvest in our business.
People
•Invest in our people at all levels of our organization and continue to foster a diverse and inclusive culture that drives accountability and focuses on profitability.
Hasbro Transformation Office
Under our new strategic plan, we launched the Hasbro Transformation Office (HTO), a team of leaders dedicated to running a disciplined, purpose-built company that is simpler, more efficient and redesigned to drive long-term sustainable growth in markets in which we compete. Our HTO aligns and delivers on our Operational Excellence program, an enterprise-wide cost-saving initiative intended to improve our business financially, operationally and culturally from our current state and designed to deliver $250 million to $300 million in run-rate cost savings by the end of 2025, $50 million of which was achieved in full-year 2022 with $20 million of actualized savings.
TV and Film Business
On November 17, 2022, we announced an authorization by Hasbro's Board of Directors to initiate a marketing for parts of our eOne TV and film business that do not directly support the Company’s Branded Entertainment strategy. In the event a transaction were to occur, Hasbro is expected to maintain the capability to develop and produce animation, digital shorts, scripted TV and theatrical films for audiences related to core Hasbro IP. The family brands business, including the brands PEPPA PIG and PJ MASKS, is not expected to be part of any transaction involving parts of the eOne film and television business. The Company anticipates that the process will take several months however, there can be no assurance that the process will result in a sale.
Workforce Reduction
In alignment with the objectives of our Operational Excellence program, on January 26, 2023, we announced the undertaking of certain organizational changes resulting in the elimination of approximately 1,000 positions from our global workforce in 2023, or approximately 15% of global full-time employees.
Coronavirus Pandemic
Since the onset of the novel coronavirus (COVID-19) pandemic in early 2020, our business has been adversely impacted by the challenges and risks associated with both the initial, and the continuing effects of the spread of the virus worldwide. Certain effects of the COVID-19 pandemic, including difficulties in shipping and distributing products due to constraints in port capacity, shipping containers and truck transportation, continued into 2022. These and other disruptions led to higher costs for both ocean and air freight and delays in the availability of products, which resulted in delayed sales and, in some cases, lost sales. In response to these and other challenges, we developed and executed plans to mitigate the negative impacts of COVID-19 to our business, which we believe helped to manage the adverse impacts to our financial results for fiscal year 2022. For example, the Company implemented certain price increases during 2022 and 2021, to mitigate product input and freight cost increases. Additionally, during the first half of 2022, the Company accelerated certain inventory purchases to ensure sufficient finished goods and raw material availability, ahead of expected periods of high consumer demand due to supply chain constraints. These purchases, however, did not see corresponding increases in sales as consumers were impacted by the economic environment, including lower discretionary consumer income due to higher inflation and rising interest rates, driving higher inventory balances within certain markets as compared to prior year. As a result, the Company launched incremental year-over-year advertising and promotional activity behind key holiday toy and game items to drive our newest innovation and reduce inventory on hand at Hasbro and at retail.
Since the initial COVID-19 outbreak, we have maintained sufficient liquidity and access to capital resources and we continue to closely monitor customer health and collectability of receivables.
The impact of coronavirus outbreak continues to be fluid and uncertain and it is still difficult to forecast the final or ongoing impact it could have on our future operations.
Please see Part I, Item 1A. Risk Factors, in this Form 10-K for further information.
Blueprint 2.0
Our strategic plan has long been centered around the Hasbro Blueprint, a framework for bringing compelling and expansive brand experiences to consumers and audiences around the world. With the evolution of our strategy comes a new Blueprint 2.0, a consumer-centric framework where our brands are transformed as story-led and play-led consumer franchises brought to life through games, play and experiences and offered across a multitude of platforms and media. Our commitment to disciplined, strategic investments, when activated across our Blueprint 2.0 differentiates Hasbro as a purpose-driven business with diversified capabilities focused on driving profitable growth and enhancing shareholder value.
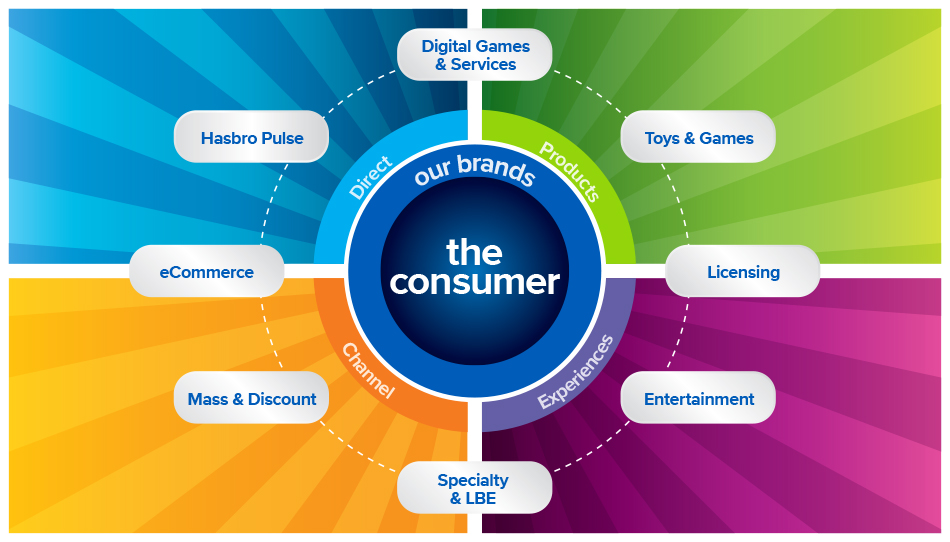
Hasbro's purpose of creating joy and community for all people around the world, one game, one toy, one story at a time starts with consumers and our fans, who represent multigenerational audiences that sit at the center of Blueprint 2.0. Understanding our fans, expanding our fan base and delivering for them is the key driver behind our evolution as a Branded Entertainment company. The development and execution of our brands are informed by our brand insights platform, a proprietary consumer insights and data analytics system which helps us understand the behavior of our consumers. We have learned that consumers will travel with a brand that they love across multiple forms and formats, including our core historical strength of toys and games and licensed consumer products, as well as digital gaming and story-led entertainment and experiences.
The value of Hasbro is fully activated when we can take a brand across multiple elements of Blueprint 2.0 including consumer products such as toys, games and licensed products; digital gaming; entertainment and experiences; and our Hasbro Direct business. The ability to build a brand and leverage in-house capabilities to create multiple categories of engagement with consumers and fans is unique to Hasbro and optimizes our economics today and in the future.
Below is a summary of key areas of focus for activating our brands across Blueprint 2.0.
•Toys and Games. We market and sell toys and games based on our owned and controlled brands globally at retail stores, through ecommerce platforms and through our fan-based direct-to-consumer platforms Hasbro PULSE and SECRET LAIR. Additionally, through license agreements with third parties, we develop and sell products based on popular third-party brands through these channels. Our toys and games include action figures, arts and crafts and creative play products, dolls, play sets, preschool toys, plush products, sports action blasters and accessories, vehicles and toy-related specialty products, games and many other consumer products which represent an array of internationally recognizable brands that capture the imagination of our consumers worldwide.
Within toys and games, as a leading producer of new and innovative gaming brands and play experiences, our gaming business continues to transform game play. To successfully execute our gaming strategy, we consider brands which capitalize on existing trends while evolving our approach using consumer insights and data analytics and offering gaming experiences addressed to consumer demand for face-to-face, trading card and digital game experiences played as board, off-the-board, digital, card, electronic, trading card and role-playing games.
Our subsidiary, Wizards of the Coast (“Wizards”), is a critical part of our gaming business, driving innovation and growth through its popular role-playing and fantasy card-collecting games such as MAGIC: THE GATHERING, Hasbro's first billion-dollar brand which benefited from numerous tent-pole set releases exceeding $100.0 million per set during 2022, and DUNGEONS & DRAGONS. Our iconic game brands include long-time favorites such as MONOPOLY, JENGA, CONNECT 4, THE GAME OF LIFE, SCRABBLE, CLUE and TRIVIAL PURSUIT, as well as many other well-known game brands.
•Licensed Consumer Products. As a complement to our toy and game business, we promote our brands through the out-licensing of our intellectual properties to third parties for promotional and merchandising uses in a wide range of consumer products. These include apparel, publishing, home goods and electronics, or in certain situations, toy products where the out-licensing of brands is more effective and profitable than developing and marketing the products ourselves. We also out-license our brands for uses in theme park attractions and other forms of location-based entertainment. In cases where we license our intellectual property to a third party, we enter into contracts with licensees that pay us either a sales-based or usage-based royalty, or a combination of both, for use of the brands, and, in some cases, the license arrangements are subject to minimum guaranteed amounts or fixed fees, over the term of the license. As we continue our Blueprint 2.0 transformation efforts focusing on fewer, bigger brands, we have begun out-licensing certain non-core brands which we believe may be more profitable through a licensing arrangement.
•Digital Gaming. A key element of Blueprint 2.0 is continued growth of our digital gaming business to further unlock the value of our brands through play and storytelling. This includes the D&D Beyond acquisition in 2022 and the ongoing development of digital games internally and through third parties. For example, we have developed and launched digital versions of the MAGIC: THE GATHERING card game, including Magic: The Gathering Arena and related mobile application, which also complement the Company's direct-to-customer relationships. Additionally, through Wizards we launched Dungeons & Dragons: Dark Alliance, a team-based action role-playing game, set in the DUNGEONS & DRAGONS world, released in the first half of 2021 for PC and gaming consoles. We also out-license certain of our brands to other third-party digital game developers who transform Hasbro brand-based characters and other intellectual properties, into digital gaming experiences.
•Entertainment. A critical driver of Blueprint 2.0 is to reinforce storylines associated with our brands through entertainment mediums, including television, film, digital content and other programming. Our entertainment business, through eOne, is a global independent studio specializing in the development, production, distribution and sales of entertainment content. With our cross-platform capabilities our entertainment business leverages film and television production and sales, digital content and children's programming to create compelling entertainment and drive creativity across brands with merchandising and licensing tie-ins.
◦Film and Television. Our go-forward focus is on the development, production and co-production of content based upon Hasbro brands. Our film content is exploited on a multi‑territory basis across all media channels, including cinema, home entertainment, broadcast and digital, including Subscription Video‑On‑Demand ("SVOD"). Our original television programming is sold to broadcasters on a series‑by‑series or individual show basis for broadcast on free television, pay television, SVOD and other digital platforms. Our programming spans a variety of genres, including scripted drama, non‑scripted reality and documentaries, and in multiple formats, including series, television films, mini‑series and specials.
In October 2017, we entered into an agreement with Paramount Pictures (“Paramount”) to produce and distribute live action and animated films, as well as television programming based on Hasbro brands. Hasbro plays an active role alongside Paramount in content development, production and distribution in addition to the financing of films created through these cooperative agreements. Under this relationship we plan to release Dungeons & Dragons: Honor Among Thieves, expected in early 2023 to be distributed by Paramount and eOne. In addition, under a
separate agreement entered with Paramount, we plan to release Transformers: Rise of the Beasts, a feature length film expected in Summer of 2023.
◦Family Brands Animation. Our family brands team develops, produces and distributes animation content for children’s properties on a worldwide basis which results in multiple touchpoints across Blueprint 2.0. The principal brands include MY LITTLE PONY and PEPPA PIG whose content entertains children worldwide and generates revenues through licensing and merchandising programs across multiple retail categories. These brands generate revenues from Advertising Video-On-Demand (“AVOD”) through platforms such as YouTube and SVOD revenues from the sale of content to video streaming platforms. Our portfolio of preschool brand driven content also includes PJ MASKS, BABY ALIVE and PLAY-DOH and the development of new preschool programs and properties.
•Hasbro Direct. We are investing in our Hasbro Direct business which is our "Fans Come First" approach to creating direct connections with our consumers and includes the following platforms:
◦Hasbro PULSE - Hasbro's ultimate fan ecommerce destination. At Hasbro Pulse our fans can find product offerings and experiences from our popular brands as well as access to views of behind-the-scenes material and insider details. In addition, Hasbro Pulse offers consumers access to product related livestreams such as fan oriented virtual conventions and product and merchandise reveals, as well as the opportunity to participate in HasLab, the Hasbro crowdfunding platform which brings limited-edition collectibles into the hands of fans.
◦SECRET LAIR - our internet-based storefront where MAGIC: THE GATHERING fans can purchase exclusive and limited versions of cards.
◦Magic: The Gathering Arena - the free-to-play online adaptation of the MAGIC: THE GATHERING card game.
◦D&D Beyond - the premier digital content platform for DUNGEONS & DRAGONS.
•Other Blueprint 2.0 Areas. Other aspects of our Blueprint 2.0 that help drive our storytelling experiences include digital content, location-based entertainment, and publishing.
◦Digital Content. We understand the importance of digital content to drive fan engagement, including in gaming and across other media, and of integrating such content with our products. Digital media encompasses digital gaming applications and the creation of digital environments for traditional products through the use of complementary digital applications, social media and websites which extend storylines and enhance play.
◦Location-Based Entertainment. Location-based entertainment (“LBE”) allows consumers to experience and share our brands. LBE includes licensing our brands to theme parks, water parks, hotels and resorts, family entertainment centers, retail, dining and entertainment, shows, exhibits and exhibitions. These experiences bring our brands to life and further immerse our consumers in our storytelling in a capital efficient manner.
◦Publishing. Licensing our brands to global publishers is another way to bring our brands to consumers in a meaningful way through various publishing formats, from puzzle and trivia books to children's stories, adult novels and comics.
•Blueprint 2.0 in Action. Some examples of our Blueprint 2.0 in action are described below.
◦PEPPA PIG is a franchise brand that we have expanded across multiple elements of Blueprint 2.0. Initially acquired in 2020 through the eOne acquisition, and brought to life through the launch of the first Hasbro toys and games for this leading preschool brand in August 2021. Although we shifted from licensed revenue when acquired, to in-sourced revenue for toys and games, we were able to grow related licensed consumer products revenue, and PEPPA PIG was one of our top growth brands overall in 2022. This growth highlights the awareness and global reach of the PEPPA PIG brand across these categories and others including digital content, publishing, location-based live entertainment and theme parks.
◦Within our gaming portfolio we have assembled one of the biggest, most profitable and fastest growing combinations of gaming brands across face-to-face, tabletop and digital platforms in the world. MAGIC: THE GATHERING, Hasbro's first billion-dollar brand, and DUNGEONS & DRAGONS are two prominent brands that have generated sustained growth with high fan enthusiasm and engagement. We have leveraged the power of these Wizards’ brands across Blueprint 2.0 for consumers as we continue their development and invest in their growth. In addition to popular tabletop and digital games, we have the theatrical release of the feature film Dungeons & Dragons: Honor Among Thieves, expected in March 2023 and we have new MAGIC: THE GATHERING and DUNGEONS & DRAGONS television series in development. We believe these efforts will harness the full potential of Blueprint 2.0 where programming attracts the existing multi-generational fan-base, helps to acquire new fans and supports our lineup of consumer products that include specialty games, apparel, accessories and collectibles, as well as publishing that spans children's books to adult novels. As location-based entertainment continues to expand at retail, it provides a platform where fans can play and further experience these brands.
◦Our Hasbro Direct business allows us to connect directly with consumers. With a focus on the adult fan and being developed based on the successes of Hasbro Pulse, our original direct-to-consumer fan-based ecommerce platform, we are currently developing a single destination where fans can access all things Hasbro including products, services and unique experiences. With the recent addition of D&D Beyond along with our Secret Lair web-based storefront for MAGIC: THE GATHERING cards and our Magic the Gathering: Arena digital game, we are expanding our capabilities beyond the traditional ecommerce outlet to serve our consumers and activate brands across Blueprint 2.0. Connecting with fans directly enables us to showcase and sell brands and gain a deeper understanding of our fans and what they want and expect from Hasbro.
Brand Portfolios
In 2022, we organized and marketed owned, controlled and licensed intellectual properties within our brand architecture under the following five brand portfolios:
•Franchise Brands
•Partner Brands
•Hasbro Gaming
•Emerging Brands
•TV/Film/Entertainment
| | | | | | | | |
| Brand Portfolio | Key Brands | Description and Significant Developments |
Franchise Brands | •MAGIC: THE GATHERING •NERF •PLAY-DOH •PEPPA PIG •TRANSFORMERS •MONOPOLY •MY LITTLE PONY •BABY ALIVE
| Includes our flagship owned or controlled brands, which we believe can deliver significant revenues, profits and growth over the long term. •In 2022, MAGIC: THE GATHERING benefited from a number of successful card set releases including Kamigawa: Neon Dynasty, Double Masters 2022, Dominaria United, Streets of New Capenna, Commander Legends: Battle for Baldur's Gate and The Brother's War. •The PEPPA PIG brand growth was supported by a full year of revenue from Hasbro’s own PEPPA PIG product line, launched in the second half of 2021. •In November 2022, partnering with Nickelodeon and Paramount, we released the computer-animated television series Transformers: EarthSpark on Paramount+, as well as a new related TRANSFORMERS product line. •PLAY-DOH holiday feature item Play-Doh Ice Cream Truck was a strong performer in 2022. |
| Partner Brands | •MARVEL, including SPIDER-MAN and THE AVENGERS(1) •LUCASFILMS' STAR WARS(1) •BEYBLADE •FORTNITE •GHOST BUSTERS •INDIANA JONES(1) (1)Owned by The Walt Disney Company (“Disney”).
| Includes those brands we license from other parties for which we develop toy and game products. Partner brand revenues fluctuate based primarily on the entertainment releases around these brands in any given year. •We hold global toy and game licensed merchandise rights for major Disney entertainment properties Marvel and Star Wars, each for multi-year terms. •Our products were also supported by numerous streaming and broadcast television series of our partners. |
| | | | | | | | |
Hasbro Gaming | •DUNGEONS & DRAGONS •DUEL MASTERS •JENGA •OPERATION •CONNECT 4 •CLUE •THE GAME OF LIFE •TWISTER •TRIVIAL PURSUIT •And many others | Includes the Company’s face-to-face and digital game experiences played as board, off-the-board, digital, card, electronic and role-playing games.
•In 2022, Hasbro acquired D&D Beyond, the premier digital content platform for DUNGEONS & DRAGONS.
•New fall introductions included: Connect 4 Spin, Wordle: The Party Game and Clue Escape.
|
| Emerging Brands | •PJ MASKS •FURREAL FRIENDS •POWER RANGERS •STARTING LINEUP •GI JOE •SUPER SOAKER •POTATO HEAD •PLAYSKOOL •LITTLEST PET SHOP | Includes those brands we own or control which have not yet grown to the significance of a franchise brand, many of which we believe could be potential franchise brands. We also launch new brands in this portfolio.
•During September 2022, Hasbro re-launched its line of sports collectibles from STARTING LINEUP with its NBA series and announced plans to expand the product line with an NFL partnership. |
| TV, Film & Entertainment | eOne programming includes:
Television Series •Yellowjackets •Cruel Summer •The Rookie •The Rookie: Feds Film •Deep Water •The Woman King eOne also has numerous TV and Film distribution rights including: •Stillwater •Fear The Walking Dead
| Includes all film, TV and other entertainment related revenues that are not Hasbro-branded. All Hasbro-branded content is included in the portfolios noted above. •On November 17, 2022, we announced that the Hasbro's Board of Directors authorized the initiation of a marketing process of certain parts of our eOne TV and film business not directly supporting the Company’s Branded Entertainment strategy. Hasbro will continue to develop and produce animation, digital shorts, scripted TV and theatrical films for audiences related to core Hasbro IP. |
Brand Portfolio Realignment
Effective for the first quarter 2023, we are realigning our brand portfolios to correspond with the evolution of our Blueprint 2.0 strategy. We plan to focus on fewer, bigger, more profitable brands that showcase our leadership in preschool, games, creativity, outdoor and action brands.
Our new product categories beginning in the first quarter of 2023 are as follows:
◦Franchise Brands - A refreshed group of our most profitable brands that includes PEPPA PIG, TRANSFORMERS, MAGIC: THE GATHERING, DUNGEONS & DRAGONS, PLAY-DOH, NERF and HASBRO GAMING as a whole.
◦Partner Brands - The Partner Brands category will continue to include those brands we license from other parties such as Disney's STAR WARS and MARVEL as well as other partners, for which we develop toy and game products, however we intend to concentrate on those key Partner Brands that give us the biggest growth potential and where we can lead and innovate in the category.
◦Portfolio Brands - Our Portfolio Brands category will include those brands we own or control which we feel have upside in revenue and profitability that have not yet grown to the significance of a franchise brand.
Reportable Segments
In 2022, our four reportable segments were:
•Consumer Products
•Wizards of the Coast and Digital Gaming
•Entertainment
•Corporate and Other
| | | | | |
| Segment | Description of Segment |
| Consumer Products | •Engages in the sourcing, marketing and sales of toy and game products around the world. Our Consumer Products business also promotes our brands through the out-licensing of our trademarks, characters and other brand and intellectual property rights to third parties, through the sale of branded consumer products such as toys and apparel. Additionally, through license agreements with third parties, we develop and sell products based on popular third-party brands. •Our toy and game products are supported by cross-functional teams including members of our global development and marketing groups. Our global development teams develop, design and engineer new products alongside the redesign of existing products, driven by our understanding of consumers and using marketplace insights while leveraging opportunistic toy and game lines and licenses. Our global marketing function establishes a cohesive brand direction and assists our selling entities in establishing local marketing programs. This strategy leverages efforts to increase consumer awareness of our brands through the Company's entertainment experiences, including film and television programming and digital gaming. •As of December 25, 2022, we had offices supporting our Consumer Products business in more than 35 countries contributing to sales in more than 120 countries. |
Wizards of the Coast and Digital Gaming | •Engages in the promotion of our brands through the development of trading card, role-playing and digital game experiences based on Hasbro and Wizards of the Coast properties. •Wizards of the Coast offerings include popular games such as the collectible card game MAGIC: THE GATHERING and the fantasy tabletop role-playing game DUNGEONS & DRAGONS, as well as other digital games developed for mobile devices, personal computers and video gaming consoles including Magic: The Gathering Arena. Additionally, we out-license certain of our brands to other third-party digital game developers who transform Hasbro brand-based characters and other intellectual properties, into digital gaming experiences. |
| Entertainment | •Engaged in the development, production, distribution and sale of world-class entertainment content including film, scripted and unscripted television, children's programming, digital content and live entertainment. •Film and TV operations produce film and television content which is sold worldwide to distributors, broadcasters, television networks and streaming platforms with an increasing focus on Hasbro branded entertainment. While maintaining ownership of the content rights, we sell content for specific time periods to generate broadcast license fees from television content and to collect minimum guarantees and overage participations from films. •Feature length film and television programming based on our owned and controlled brands provide both immersive storytelling and the ability for our consumers to enjoy these properties in different formats, which also drives product sales, results in increased licensing revenues, and expands overall brand awareness.
|
| Corporate and Other | •Provides management and administrative services to the Company's principal reporting segments described above. The segment consists of unallocated corporate expenses and administrative costs and activities not considered when evaluating segment performance as well as certain assets benefiting more than one segment. In addition, intersegment transactions are eliminated within the Corporate and Other segment. |
•Additional Segment Information.
◦To further extend our range of products in the various segments of our business, we sell a portion of our toy and game products to retailers on a direct import basis from the Far East. These sales are reflected in the revenue of the related segment, to which the sale relates.
◦Certain of our products are licensed to other companies for sale in selected countries where we do not otherwise have a direct business presence.
◦For more financial and geographic information regarding our segments, please see note 21 to our consolidated financial statements, included in Part II, Item 8. Financial Statements, of this Form 10-K.
Working Capital Requirements; Seasonality
Our working capital needs are financed through available cash and cash generated from operations, primarily through the sale of toys and games and secondarily through our consumer products licensing and entertainment operations, and, when necessary, by issuing commercial paper or borrowing under our revolving credit agreement. In the event the Company is not able to issue commercial paper, we intend to utilize our available lines of credit.
In addition, the Company’s Entertainment operating segment uses production financing to fund certain of its television and film productions which are typically arranged on an individual production basis by either special purpose production subsidiaries or through a senior revolving credit facility obtained in November 2021, dedicated to production financing.
Our customer order patterns may vary from year to year largely due to fluctuations in the degree of consumer acceptance of product lines, supply and product availability, marketing strategies and inventory policies of retailers, TV and film content releases, including the dates of theatrical releases of major motion pictures for which we offer products, and changes in overall economic conditions. As a result, a disproportionate volume of our net revenues from our consumer products business has historically been earned during the third and fourth quarters leading up to the retail industry’s holiday selling season, including Christmas.
Prior to the onset of the COVID-19 pandemic, quick response or just-in-time inventory management practices being used by retailers, along with growth in ecommerce resulted in the increasing trend of order placement for immediate delivery and fewer orders being placed well in advance of shipment. Retailers preferred timing their orders for fulfillment by suppliers closer to the time of purchase by consumers. To the extent that retailers did not sell as much of their year-end inventory purchases during the holiday selling season as they had anticipated, their demand for additional product earlier in the following fiscal year could be curtailed, thus negatively impacting the Company’s future revenues. However, more recently the Company's inventory levels and retailer order patterns reflect the impact of global supply chain disruptions, which began in late 2020 related to the COVID-19 pandemic and its after-effects. During the first half of 2022, the Company accelerated certain inventory purchases, to ensure sufficient finished goods and raw material availability ahead of expected periods of high consumer demand. However, during the third quarter of 2022, as the effects of supply chain disruptions began to subside, most notably in the U.S, and Europe, the accelerated inventory purchases did not see corresponding increases in sales as consumers were impacted by the economic environment, including lower discretionary consumer income due to higher inflation and rising interest rates, leading to higher inventory levels as compared to prior years. As a result, the Company launched incremental year-over-year promotional activity behind key holiday toy and game items to reduce inventory on hand and at retail and is continuing to manage inventory levels to ensure adequate supply of new product while clearing excess supply to mitigate the risk of inventory obsolescence. In 2022 and 2021, the second half of the year accounted for approximately 57% and 62% of full year revenues, respectively, with the third and fourth quarters accounting for approximately 28% and 29%, respectively, of full year net revenues in 2022 and 31% of full year revenues in each of the third and fourth quarters of 2021.
In 2021 and continuing into periods of 2022, supply chain constraints, including overcrowding of cargo ports and shipping container and truck transportation shortages led to higher costs for ocean, air and over the road freight and delays in the availability of products, due to extended inventory transit times.
Historically, we commit to the majority of our inventory production and advertising and marketing expenditures for a given year, prior to the peak fourth quarter retail selling season. Our accounts receivable balances typically increase during the third and fourth quarters as customers increase their purchases to meet expected consumer demand in the holiday season. Due to the concentrated timeframe of this selling period, payments for these
accounts receivable are generally not due until later in the fourth quarter or early in the first quarter of the subsequent year. The timing difference between expenses paid and revenues collected sometimes makes it necessary for us to borrow varying amounts during the year, however, we have had sufficient liquidity and capital resources throughout 2022 and 2021 and have not had to borrow under our revolving credit facility.
Our entertainment business is also subject to seasonal variations based on the timing of film, television, streaming and digital content releases, which are often determined based on the timing of prime television seasons, certain geographic release dates and competition in the market.
Product Development and Royalties
Development
Our success is dependent on continuous innovation in our play and entertainment offerings and requires ongoing development of new brands and products alongside the redesign of existing products to drive consumer interest and market acceptance. Our toy and game products are developed by a global development function, the costs of which are allocated to the selling entities which comprise our principal operating segments. These costs include activities related to the development, design and engineering of new products and their packaging and on the improvement or modification of ongoing products. Much of this work is performed by our internal staff of designers, artists, model makers and engineers.
Development and related costs associated with Wizards of the Coast products are specifically allocated to that line of business, including investments in tabletop and digital gaming initiatives as well as those planned for release in the coming years.
In addition to the design and development work performed by our own staff, we work with a number of independent toy and game designers, and compete for their designs and ideas with other toy and game manufacturers. Rights to such designs and ideas, when acquired or licensed by us, are usually exclusive and the agreements require us to pay the designer a royalty on our net sales of the item. These designer royalty agreements may also provide for advance royalties and minimum guarantees.
Royalties and Participations
We also produce an array of products under licenses based on our partners’ trademarks and copyrights for the names or likenesses of characters from movies, television shows and other entertainment media. We compete with other toy and game manufacturers for these licensed rights and we refer to our products produced under these arrangements as Partner Brands. Licensing fees for these rights are generally paid as a royalty on our net sales of the item. Licenses for the use of characters may be exclusive for specific products or product lines in specified territories, or may be non-exclusive, in which case our product offerings may be competing with the product offerings of other licensees. In many instances, advance royalties and minimum guarantees are required by these license agreements. Our royalty expense in any given year may vary depending upon product mix and the timing of movie releases and other entertainment media.
Our entertainment offerings also require us to pay royalties and participations to those involved in the creation of the content, such as producers, writers, directors and actors.
Marketing and Sales, Customer Concentration and Advertising
Marketing and Sales
While our global development function focuses on brand and product innovation and re-invention, our global marketing function establishes brand direction and messaging and assists the selling entities in establishing local marketing programs. The global marketing group works cross-functionally with the global development function to deliver unified, brand-specific consumer experiences. The costs of this group are allocated to the selling entities which comprise our principal operating segments. In addition to the global marketing function, our local selling entities employ sales and marketing functions responsible for local market activities and execution.
Our products are sold globally to a broad spectrum of customers, including mass-market retailers, distributors, wholesalers, discount stores, specialty hobby stores, drug stores, mail order houses, catalog stores, department stores and other traditional retailers, large and small, as well as ecommerce retailers and direct-to-customer through our fan-focused Hasbro Direct business. Our own sales forces account for the majority of sales of our products with remaining sales generated by independent distributors who, for the most part, sell our products in areas of the world where we do not otherwise maintain a direct presence. The majority of our product sales are to large chain stores, distributors, e-retailers and wholesalers.
Customer Concentration
During 2022, net revenues from our top five retail customers accounted for approximately 35% of our consolidated global net revenues, including our largest customers, Wal-Mart Stores, Inc. and Amazon.com who represented 11% and 10%, respectively, of consolidated global net revenues. Net revenues from the Company’s major customers are reported within the Consumer Products segment, Wizards of the Coast & Digital Gaming segment and the Entertainment segment. Ecommerce sales continues to represent a significant portion of overall sales to these customers as consumers are continuing to purchase more products online compared to pre-pandemic levels. Please see Part I, Item 1A. Risk Factors, of this Form 10-K for a further discussion of risks relating to customer concentration.
Advertising
We advertise many of our products extensively and brands through digital marketing and on television. Products are strategically cross promoted by spotlighting specific products alongside related offerings in a manner that promotes the sale of not only the selected item, but also those complementary products.
As described earlier, our Blueprint 2.0 strategy includes focusing on reinforcing storylines associated with our brands through several mediums, including television, film, digital gaming and live action experiences. Our brands obtain marketing and advertising support through entertainment appearing on major networks globally, theatrical releases as well as on various other digital platforms, such as Netflix and Apple TV. A recent example of this was the November 2022 release of the computer-animated television series Transformers: EarthSpark on Paramount+ in partnership with Nickelodeon and Paramount.
Many of our new toy and game products are introduced to major customers within one to two years leading up to their year of retail introduction. Our advertising expenditures are impacted by our product mix in any given year. For example, brands based on major motion picture releases generally require less advertising as a result of the promotional activities around the motion picture release, whereas leading into a major digital gaming launch, our Wizards of the Coast business will have substantial increases to advertising, marketing and promotional expenses to acquire players and promote gaming releases.
Producing, marketing and distributing films and television programming can involve significant costs and the timing of a film’s release can cause our financial results to vary. For instance, marketing costs are generally incurred before and throughout the theatrical release of a film and, to a lesser extent, other distribution windows, and are expensed as incurred. Therefore, we typically incur losses with respect to a particular film prior to and during the film’s theatrical release and profitability for the film may not be realized until after its theatrical release window.
Supply Chain and Manufacturing
Beginning in early 2020 with the onset of the COVID-19 pandemic, and continuing into 2022, we experienced disruptions to supply of our products, initially due to closures of third-party manufacturing facilities across several geographies, primarily in early 2020, and reductions in manufacturing facility operations across multiple geographies. Additionally, we experienced difficulties in shipping and distributing certain products due to supply chain constraints, including overcrowding of cargo ports and shipping container and truck transportation shortages which led to higher costs for ocean, air and over the road freight and delays in the availability of products, due to extended inventory transit times. These challenges have at times caused delays in the availability of products, which in some instances have led to delayed sales and in certain cases, lost sales. The impact to our business from these and other disruptions continued into 2022. However, despite these adverse manufacturing and supply chain conditions, at this time, we believe the manufacturing capacity of our third-party manufacturers, as well as the supply of components, accessories and completed products which we purchase from unaffiliated manufacturers, are adequate to meet the anticipated demand in 2023 for our products. Additionally, during 2021 and 2022 in response to global supply chain disruptions, we expanded shipping capacity, activated alternate ports in China and the U.S. and we have prioritized supply based on inventory and customer needs, including the utilization of air freight when needed. However, if global supply chain challenges worsen, or we or our suppliers suffer prolonged manufacturing disruptions due to public health conditions, such as the coronavirus, manufacturing capacity of our third-party manufacturers as well as supply of components, accessories and our products may be adversely impacted. See Part I, Item 1A. Risk Factors, of this Form 10-K for further information.
Beginning in late 2022, as part of Hasbro's new go-forward strategic plan we launched a multi-year initiative aimed at transforming our global supply chain into a best-in-class network which we expect to deliver competitive advantages through performance efficiency, operating model integration and organizational accountability. Aligned with the Operational Excellence pillar of our Blueprint 2.0 transformation, we are refining all aspects of our
integrated supply chain from planning and designing to sourcing and delivering, with a multi-year plan to deliver improved capabilities and provide a productivity pipeline to fuel growth at Hasbro.
During 2022, the majority of our products were manufactured in third-party facilities in the Far East, primarily China, Vietnam and India, using a Hong Kong based wholly-owned subsidiary operation for quality control and order coordination purposes. Within the U.S. and Ireland, we utilize two previously owned facilities now operated by Cartamundi, which are located in East Longmeadow, Massachusetts and Waterford, Ireland, to manufacture significant quantities of Hasbro game products. We have diversified our global sourcing mix and decreased our dependence on Chinese manufacturing in recent years by increasing production of our products in other countries, including Vietnam and India.
Most of our toys and games are manufactured from basic raw materials such as plastic, paper and cardboard, although certain products also use electronic components. All of these materials are readily available but may be subject to significant fluctuations in price. There are certain chemicals (including phthalates and BPA) that national, state and local governments have restricted or are seeking to restrict or limit the use of; however, we do not believe these restrictions have or will materially impact our business. We generally enter into agreements with suppliers at the beginning of a fiscal year that establish prices for that year. However, significant volatility in the prices of any of these materials may require renegotiation with our suppliers during the year.
Competition
We are a worldwide leader in the development, design, sale and marketing of toys and games and entertainment offerings, operating in a highly competitive business environment. We compete with several large toy and game companies in our product categories, as well as with many smaller United States and international toy and game designers, manufacturers and marketers. In certain instances, we also compete with large retailers, who offer such products under their own private labels, often at lower prices. In addition, we compete with digital gaming developers, who focus primarily on digital gaming products. We compete with other companies that offer TV and film content and branded entertainment specific to children and their families. Given the ease of entry into our business we view our primary competition as coming from toy and game companies, digital gaming providers and content providers who are creating play and entertainment experiences that compete with our brand-driven storytelling and product experiences for consumer attention and spending. Businesses that create compelling content can readily translate that content into a full range of product offerings. Competition is based primarily on meeting consumer preferences and on the quality and play value of our products and experiences. To a lesser extent, competition is also based on product pricing.
Our entertainment business competes with other companies that produce and distribute films, television programs and other entertainment content. For example, eOne, as an independent distributor and content producer, competes with other major U.S. and international studios that historically have released a large number of films annually and command a significant share of box office and streaming revenues and television airtime, as well as other independent film and television production or distribution companies. Many of the major U.S. studios are part of large, diversified corporate groups with a variety of other operations, including television networks and cable channels that can provide both in-house distribution capability and varied sources of earnings that may allow them to better offset fluctuations in the financial performance of their film and television operations. Some of these competitors have substantially greater marketing and financial resources than we do and may be able to compete aggressively on pricing in order to increase box office revenues and television airtime or streaming placement. In addition, the resources of the major studios may give them an advantage in acquiring other businesses or assets, including content libraries, that we might also be interested in acquiring. The competition we face may cause us to lose market share, achieve lower prices for our productions or pay more for third party content, any of which could harm our business. Additionally, the Discovery Family Channel, our cable television joint venture with Discovery Communications, Inc. in the U.S., competes with a number of other children’s television networks for viewers, advertising revenue and distribution fees.
In addition to contending with competition from other toy and game and entertainment and storytelling companies, we contend with the expanding variety of digital gaming and digital entertainment offerings available for children, while product life cycles of traditional toys and games have shortened. As a result, our products not only compete with those offerings produced by other toy and game manufacturers and companies offering branded family play and entertainment, we also compete, particularly in meeting the demands of older children, with entertainment offerings of many technology companies, such as makers of tablets, mobile devices, video games and other digital gaming products and screens, and social media companies.
The changing trends in consumer preferences with respect to entertainment and low barriers to entry as well as the emergence of new technologies and different mediums for viewing content, such as the growing number of streaming platform options, continually creates new opportunities for existing competitors and start-ups to develop products and offerings that compete with our entertainment and toy and game offerings.
Environment, Social and Governance Performance
Overview
At Hasbro, we believe strong Environment, Social and Governance (ESG) performance drives long-term value creation for our business and stakeholders. The following discusses ESG governance and our ESG focus areas and priorities.
Governance
ESG governance starts with our Board of Directors (Board), with specific oversight by our Nominating, Governance and Social Responsibility Committee of the Board (Governance Committee). ESG topics, such as climate, human rights and Diversity, Equity and Inclusion (DE&I), are regular agenda items at Governance Committee meetings. The Governance Committee analyzes these issues and makes recommendations to the full Board. In addition, the Audit Committee of our Board oversees SEC and public disclosures in specific areas like conflict minerals, climate and sustainability, and enterprise risk. Through our Compensation Committee, the Board considers ESG performance and priorities when determining the plan design for compensation, and overall performance of our senior executives. The full Board receives regular updates regarding our ESG progress.
In addition to Board-level governance, our CEO and the Executive Leadership Team (ELT) regularly review our ESG performance, progress and opportunities. Our ESG Committee, chaired by our Chief Purpose Officer and comprised of our ELT, meets several times a year to ensure rigorous management oversight of the Company’s ESG strategy, impact and performance. The Chief Purpose Officer, together with our Chief Legal Officer and other members of our ELT, set the direction for our global ESG strategy and performance, and ensure the integration of ESG throughout the organization and supply chain.
Building on Our Progress and Reaching New Heights
ESG at Hasbro is the framework for translating our Company’s Purpose into action – getting from “why” we exist to “how” we deliver sustainable, long-term value for our Company and stakeholders. We continue to integrate ESG across our business and are proud of our strategic initiatives that are intended to further our purpose and make a positive impact for our employees, consumers, investors, and planet.
Below are some ESG highlights from 2022:
Recent recognition for Hasbro’s leadership in promoting and advancing the interests of our stakeholders, our communities and our planet include:
Focus Area: Climate and Environment
Carbon Reduction:
•We recognize the impact our business can have on the environment and are working to reduce our footprint. We view sustainability challenges as opportunities to innovate and to continuously improve our product design and operational efficiencies. We believe the long-term viability and health of our operations and our supply chain, and the potential for environmental improvements, are important components to our business success.
•In January 2022, we committed to set greenhouse gas emission (GHG) reductions with a near-term 2030 goal, based on limiting emissions to keep global warming below 1.5°C above pre-industrial levels, and a long-term 2050 goal, based on net-zero emissions across our value chain. In joining the Science-Based Target Initiative (SBTi), we expect to leverage a globally accepted methodology for setting GHG reduction targets in line with the goals of the Paris Agreement.
•We continue to invest in renewable electricity. To address the carbon footprint associated with electricity consumption of our owned and operated facilities, Hasbro purchases Renewable Energy Certificates (RECs), each of which represent one megawatt hour (MWh) of renewable energy generated on the same grid as our electricity consumption. We purchase RECs to cover virtually 100% of the electricity consumed in each market where available. The amount of money we have spent in this area has been de minimis. For example, in fiscal years 2022, 2021 and 2020, we purchased $72K, $100K, and $45K of RECs, respectively.
Other key goals and objectives in this area include:
•Waste Reduction: Continue to minimize virgin plastic in single-use disposable toy and game packaging, where feasible.
•Circular Economy: Continue our industry-first toy recycling program (currently in 12 countries) in partnership with TerraCycle, a leader in product recycling outside of municipal recycling.
Climate Risk and Resilience:
•Managing the resilience of our business to the potential risks of climate change is a priority. We are working to further integrate climate risk and resilience into our overall enterprise risk management (ERM) process.
•In 2022, we initiated work to evaluate the integration of the Task Force on Climate-related Financial Disclosures (TCFD) framework into our existing ERM process across four key areas: governance, risk management, strategy and metrics & targets. The TCFD framework will identify potential climate risks, guide management of those potential risks and measure the effectiveness of our mitigation measures.
Focus Area: Human Rights and Ethical Sourcing
•Our Human Rights and Ethical Sourcing program launched over 30 years ago and is dedicated to ensuring that facilities involved in the production of our toys, games and licensed consumer products comply with Hasbro’s Global Business Ethics Principles. The program is designed to ensure fair and safe working conditions; fairness, dignity and respect for workers; and robust supplier engagement to ensure strong safety, health and environmental performance. While working on these issues with partners, suppliers, third-party factories and licensees is complex, we remain vigilant in our commitment to ensure workers in our supply chain are treated in accordance with our high ethical standards and applicable laws.
Key goals and objectives in this area include:
•Ensure 100% third-party suppliers and major subcontractors are audited on an annual basis through unannounced audits, supplemented by spot, oversight audits.
•Require 100% of third-party suppliers and major subcontractors to participate and complete the Hasbro Ethical Sourcing Academy, a 30-hour, e-learning social compliance course, which trains and reinforces Hasbro’s rigorous ethical sourcing requirements. This mandatory online training is in addition to monthly, in-person vendor workshops that the Hasbro Ethical Sourcing team hosts in our sourcing office locations around the world.
•Empower factory workers through our Worker Well-Being program, which provides life-enhancing skills training and knowledge on topics from nutrition and reproductive health to problem solving and financial literacy.
Human Capital Management
Overview
Our key human capital management objectives for our direct workforce are to attract, develop and retain diverse talent. The experience, dedication and diverse backgrounds of our employees are at the heart of our success, energizing everything we do, from developing innovative products to creating immersive game, consumer products and entertainment experiences. Our teams are inspired by our Purpose of creating joy and community for all people around the world. Our inclusive culture sets us up to deliver excellence, build impactful brands and expand our leadership in play, entertainment and beyond. As our organization continues to evolve, we remain steadfast in our ambition to provide a supportive and inclusive community where everyone can show up authentically as themselves and deliver their best work. The following discusses our governance of human capital management and our key focus areas and priorities.
Governance
Our governance of human capital management falls within the governance structure for ESG overall. The Governance Committee of the Board oversees the company’s human capital policies and practices, including the Company’s approach to promoting diversity, equity and inclusion in the workplace. The Compensation Committee of the Board oversees our compensation programs.
Our Chief People Officer, who reports to the CEO and is a member of our ELT, is responsible for developing and executing key aspects of our human capital strategy, including the attraction, acquisition, development and engagement of talent to deliver on the Company’s strategy, the design of competitive compensation and employee benefit programs. Our Chief Purpose Officer, together with other members of our ELT, are responsible for developing and executing our global ESG strategy, including our human rights and ethical sourcing programs for the workers across our supply and value chain.
Our CEO and Chief People Officer chair our internal DE&I Steering Committee, a committee comprised of global management leaders from various parts of the business. The DE&I Steering Committee is responsible for setting
and reviewing the Company’s DE&I strategy and performance and identifying any gaps and opportunities. Our Senior Vice President of DE&I and Multicultural Strategy is responsible for executing the strategy and presenting our DE&I progress to the Board twice yearly.
Employees
As of year-end 2022, we employed approximately 6,490 people worldwide, with approximately 53% of our employees in North America (45% in the United States; 8% in Canada), 22% in Europe, 18% in Asia Pacific, and 6% in Latin America (includes Mexico). As of year-end, approximately 53% of our global workforce was female, 45% of our employees in managerial roles (director level and above) were female, and racially/ethnically diverse employees represented approximately 22% of the Company's U.S. workforce, of which 15% were in managerial roles. For our U.S. workforce, we also disclose our diversity by job type (based on the EEO-1 filing), which is available in our publicly available ESG Progress Report 2021-2022. The contents of our ESG Progress Report are not incorporated herein. Approximately 11% of our employees globally are covered by unions or collective bargaining agreements.
Focus Area: Diversity, Equity, and Inclusion
We believe that the more inclusive we are as a company, the more effective our employees will be and the stronger our business will perform. Hasbro views DE&I as a strategic ESG priority that is linked to the success of our business and the growth of our brands. We want our work to move beyond traditional gender and demographic stereotypes and to celebrate people of all backgrounds and lived experiences. We know this work begins with our people, and we work diligently to foster an inclusive culture with a diverse workforce that reflects the consumers and communities we serve globally.
Recent steps we have taken to further build a culture of DE&I within our organization and within the industries and communities in which we operate include:
•On track to achieve our 2025 DE&I goals for the organization, including:
◦Increasing female representation in leadership (Director +) roles globally to 50%
◦Increasing ethnically and racially diverse employee representation in the U.S. to 25%
•Continued our work to foster a culture of inclusion through unconscious bias training and Employee Network events.
•Issued a DE&I spotlight report, as a part of our comprehensive ESG Progress Report 2021-2022, that outlines our commitments, strategies and progress in fostering DE&I.
Focus Area: Employee Engagement
At Hasbro, we support a number of Employee Resource Groups (ERGs). These groups reflect our diverse employee population and provide dynamic opportunities for employee engagement. Our ERGs give voice to member concerns, create opportunities for networking and leadership skills development, support employee recruitment and retention efforts and celebrate ethnic and cultural themes important to our global team. In addition to our ERGs, we established a Business Resource Group (BRG), which provides a channel for the employees to provide the business with input, guidance and perspective on strategic brand development and marketing initiatives early in the creation process related to race, ethnicity, gender identity, sexual orientation, veteran status and ability.
Focus Area: Compensation, Health, Safety & Well-being of Employees
Employee attraction, development and retention has long been a key Hasbro priority. We recognize and reward our employees with a total rewards package that includes competitive base pay, equity compensation (for certain levels), annual incentives, product discounts and other comprehensive benefits, including wellness programs that help people integrate work and life commitments. Competitive compensation is the cornerstone of our total rewards program. We regularly review salary ratios for men and women in similar roles to help maintain internal equity and market competitiveness across the globe. We review both industry and local market data at least annually to identify trends and market gaps to maintain the competitiveness of our compensation and employee benefit programs. When conducting our global compensation reviews, we analyze salary information by a variety of factors, including gender globally and ethnicity in the United States. When designing our compensation and employee benefit programs, we also look beyond the fundamentals of these important components and consider the bigger picture of how these programs contribute to the overall employee experience.
Employee health, safety and wellness are top priorities at Hasbro. We support our colleagues’ well-being, which includes mental, physical and financial wellness, through a number of programs, including:
◦Wellness programming in our major offices, facilitated by the global Employee Wellness Network.
◦Robust employee assistance programs, including virtual therapy sessions, that help employees experiencing stress or other mental health needs.
◦Childcare solutions, including in-home and back-up care, as well as back-up adult and elder care for employees balancing work with childcare or elder care needs.
◦Webinars for managers to help identify risk factors and types of mental health issues.
◦Financial wellness resources offered by third-party partners that can assist our employees with retirement and other financial planning services.
◦A commitment to flexible work arrangements to help employees with work-life balance and to take care of health needs.
◦Hybrid or remote work set-up for many of our employees to ensure a flexible and agile work environment.
Focus Area: Talent Development and Performance Management
We are committed to the continued development of our people. Strategic talent reviews and succession planning occur on a planned cadence annually – globally and across all business areas. The CEO and Chief People Officer convene meetings with senior company leadership and the Board to review top company talent. We provide opportunities for our employees to grow their careers. We invest in the development of our employees by providing in-house training and opportunities to participate in third-party programs, including specialized training as well as broader academic pursuits.
Focus Area: Philanthropy and Social Impact
Giving back to our local and global communities is core to our heritage and our culture. We empower our team members to give back through our volunteer program which grants four hours paid time off per month to volunteer in programs that support children, underserved communities, the environment and other important areas of impact. In addition, team-building company-sponsored volunteer projects and skills-based volunteer opportunities are organized throughout the year, supporting our employees the opportunity to make a meaningful difference in their communities around the world. Global Day of Joy is Hasbro’s annual, company-wide day of service and has become a cherished tradition. Global Day of Joy takes place every December, and employees from each Hasbro office participate in service projects to benefit a variety of organizations. In 2022, 84% of eligible employees around the world completed more than 350 service projects.
Trademarks, Copyrights and Patents
We seek to protect our products, for the most part, and in as many countries as practical, through registered trademarks, copyrights and patents to the extent that such protection is available, cost effective, and meaningful. The loss of such rights concerning any particular product is unlikely to result in significant harm to our business.
Government Regulation
Our toy and game products sold in the United States are subject to the provisions of The Consumer Product Safety Act, as amended by the Consumer Product Safety Improvement Act of 2008, (as amended, the “CPSIA”), The Federal Hazardous Substances Act (the “FHSA”), The Flammable Fabrics Act (the “FFA”), and the regulations promulgated thereunder. In addition, a few of our products, are also subject to regulation by the Food and Drug Administration.
The CPSIA empowers the Consumer Product Safety Commission (the “CPSC”) to take action against hazards presented by consumer products, including the formulation and implementation of regulations and uniform safety standards. The CPSC has the authority to seek to declare a product “a banned hazardous substance” under the CPSIA and to ban it from commerce. The CPSC can file an action to seize and condemn an “imminently hazardous consumer product” under the CPSIA and may also order equitable remedies such as recall, replacement, repair or refund for the product. The FHSA provides for the repurchase by the manufacturer of articles that are banned.
Consumer product safety laws also exist in some states and cities within the United States and in many international markets including Canada, Australia and Europe. We utilize independent third party laboratories that employ testing and other procedures intended to maintain compliance with the CPSIA, the FHSA, the FFA, other applicable domestic and international product standards, and our own standards. Any material product recall or other safety issue impacting our products could have an adverse effect on our results of operations or financial condition, depending on the product and scope of the recall, could damage our reputation and could negatively affect sales of our other products as well.
The Children’s Television Act of 1990 and the rules and regulations of the United States Federal Communications Commission, the rules and regulations of the Federal Trade Commission, as well as the laws of certain other countries, also place limitations on television commercials during children’s programming and on advertising in other forms to children, and on the collection of information from children, such as restrictions on collecting information from children under the age of thirteen subject to the provisions of the Children’s Online Privacy Protection Act.
In addition to laws restricting the collection of information from children, our business is subject to other regulations, such as the General Data Protection Regulation in the European Union, which restricts the collection, use, and retention of personal information, as well as data protection laws in the United States and other countries. Failure to comply with any of those restrictions can subject us to severe liabilities.
Further, we maintain programs to comply with various United States federal, state, local and international requirements relating to the environment, health, safety and other matters.
Our Canadian television and film operations benefit from certain funding and tax credits for certain productions in Canada. To continue to avail ourselves of these benefits, we plan to comply with applicable regulations and directives of the Investment Canada Act and the Minister of Canadian Heritage.
Our Executive Officers
The following persons are our executive officers. Such executive officers are elected annually. The position(s) and office(s) listed below are the principal position(s) and office(s) held by such persons with the Company. The persons listed below generally also serve as officers and directors of certain of our various subsidiaries at our request.
| | | | | | | | | | | |
| Name | Age | Position and Office Held | Period
Serving in
Current
Position |
| | | |
Christian Cocks(1) | 49 | Chief Executive Officer | Since 2022 |
Deborah M. Thomas(2) | 59 | Executive Vice President and Chief Financial Officer | Since 2013 |
Cynthia Williams (3) | 55 | President and Chief Operating Officer of Wizards of the Coast and Digital Gaming | Since 2022 |
Najuma Atkinson(4) | 51 | Chief People Officer | Since 2022 |
Tarrant Sibley(5) | 54 | Executive Vice President and Chief Legal Officer and Secretary | Since 2019 |
| | |
| | | |
| | | |
| | | |
| | | | | |
| (1) Prior thereto, President and Chief Operating Officer of Wizards of the Coast and Digital Gaming from 2021, and President of Wizards of the Coast from 2014 to 2021. |
| (2) Prior thereto, Senior Vice President and Chief Financial Officer from 2009 to 2013. In November 2022, we announced that Deborah Thomas informed Hasbro of her intent to retire from her position as Executive Vice President and Chief Financial Officer after 24 years of distinguished service and leadership with the Company once her successor is appointed. |
| (3) Prior thereto, Ms. Williams worked in different executive capacities at Microsoft Corporation, from 2018 to 2022, including most recently as General Manager and Vice President, Gaming Ecosystem Commercial Team. |
| (4) Prior to joining Hasbro in 2022, Ms. Atkinson served as Senior Vice President of Global HR Services at Dell Technologies, from 1999 to 2021. |
(5) Prior thereto, Senior Vice President, Chief Legal Officer and Secretary from 2018 to 2019 and Senior Vice President and Deputy General Counsel from 2010 to 2018. |
|
|
|
Availability of Information
Our internet address is http://www.hasbro.com. We make our annual report on Form 10-K, quarterly reports on Form 10-Q, current reports on Form 8-K, and amendments to those reports filed or furnished pursuant to Section 13(a) or 15(d) of the Securities Exchange Act of 1934, available free of charge on or through the investor section of our website as soon as reasonably practicable after we electronically file such material with, or furnish it to, the Securities and Exchange Commission.
Investors and others should note that we announce material financial information to our investors using our investor relations website at www.hasbro.com, under “Corporate — Investors”, SEC filings, press releases, public conference calls and webcasts. We use these channels as well as social media to communicate with our shareholders and the public about our Company, our products and other matters. It is possible that the information we post on social media could be deemed to be material information. Therefore, we encourage investors, the media, and others interested in our Company to review the information we post on the social media channels listed on our investor relations website. Hasbro has used, and intends to continue to use, our investor relations website, as a means of disclosing material non-public information and for complying with its disclosure obligations under Regulation FD. Further corporate governance information, including our articles of incorporation, bylaws, governance guidelines, committee charters, and code of business conduct and ethics, is also available on our investor relations website https://hasbro.gcs-web.com, under “Corporate — Investors — Corporate Governance.” The contents of our website are not intended to be incorporated by reference into this Form 10-K or in any other report or document we file with the SEC, and any references to our websites are intended to be inactive textual references only.
Item 1A. Risk Factors.
In evaluating our business, the material risks described below, as well as other information contained in this Annual Report on Form 10-K and in our other filings with the Securities and Exchange Commission should be considered carefully. Additional risks not presently known to us or that we currently deem immaterial may also adversely affect our business. The occurrence of any of these events or circumstances could individually or in the aggregate have a material adverse effect on our business, financial condition, cash flow or results of operations. This report contains forward-looking statements. Please refer to the cautionary statements made under the heading "Special Note Regarding Forward-Looking Statements" for more information on the qualifications and limitations on forward-looking statements.
Strategic Risks Related to Our Business
Our business will suffer if we are not successful in executing our Blueprint 2.0 strategy and transformation initiatives.
Our Blueprint 2.0 strategy focuses on fewer and bigger brands that we believe have the largest potential, while emphasizing bottom-line growth, operational discipline, enhanced focus on our fans and commitment to shareholder return. To support our strategy, in mid-2022, we formed the Hasbro Transformation Office ("HTO"), a team of leaders dedicated to designing and running a simple, efficient and effective business aligned with our Blueprint 2.0 strategy. The HTO is supporting our Operational Excellence Program to deliver $250-$300 million in annual run-rate cost savings by year-end 2025. There are no assurances that we will achieve these cost savings.
Failure to execute our strategic plan and transformation initiatives may harm our business. Our ability to successfully implement and execute these plans and initiatives in a timely basis, if at all, is dependent on many factors, including, among other things:
•our ability to successfully innovate, design, develop, price, commercialize and grow a select group of brands across our Blueprint 2.0 to global consumers in a wide array of markets;
•our ability to successfully grow our digital gaming and direct-to-consumer businesses;
•our ability to obtain and analyze data and insights from consumers to enable us to make informed decisions about priorities and consumer preferences;
•our ability to gain market share in focus categories: Action Figures & Accessories; Arts & Crafts; Games; Outdoor & Sports; Preschool Toys;
•our ability to simplify our supply chain logistics and manage inventory;
•the ability of our workforce to focus and execute on priority transformational projects across the business;
•the attraction and retention of key personnel with core skills and competencies in the areas of focus, including in tabletop and digital gaming, consumer products and entertainment focused on Hasbro IP;
•our ability to successfully license, divest, sell, or otherwise cease certain parts of the business that are not as profitable as other areas or are not core to the business, such as certain film and television assets of eOne; and
•the other risks identified in this report.
Consumer interests change rapidly and acceptance of products and entertainment offerings are influenced by outside factors, making it difficult to design and develop products, play patterns and entertainment offerings which are and will continue to be popular with children, families and audiences.
The interests of children, families, fans and audiences evolve quickly and can change dramatically from year to year and by geography. To be successful, we must correctly anticipate the types of products (including toys, games, collectibles and technologically advanced and digital games), play patterns and entertainment which will capture consumers’ interests and imagination, and quickly develop and introduce innovative products and engaging entertainment which can compete successfully for consumers’ limited time, attention and spending. Although we utilize our brand insights platform to gather data and analytics to help us make informed decisions, it is very difficult to predict consumer acceptance with certainty due to, among other things, the ever-increasing utilization of technology at younger and younger ages, social media and digital media in entertainment offerings, and the
increasing breadth of entertainment available to consumers. Evolving consumer tastes and shifting interests, coupled with an ever-changing and expanding pipeline of entertainment and consumer properties and products which compete for consumer interest and acceptance, create an environment in which some products and entertainment offerings can fail to achieve consumer acceptance, and other products and entertainment offerings can be popular during a certain period of time but then be rapidly replaced. As a result, our products and entertainment offerings can have short consumer life cycles.
Consumer acceptance of our or our partners’ entertainment offerings is also affected by outside factors, such as critical reviews, promotions, the quality and acceptance of films and television programs and content released into the marketplace at or near the same time, the availability of alternative forms of entertainment and leisure time activities, general economic conditions and public tastes generally, all of which could change rapidly and most of which are beyond our control. There can be no assurance that television programs and films we produce or distribute will obtain favorable reviews or ratings, that films we produce or distribute will be popular with consumers and perform well at the box office or in other distribution channels, or that broadcasters will license the rights to broadcast any of our television programs in development or renew licenses to broadcast programs in our library.
If we devote time and resources to developing and marketing products or entertainment that consumers do not accept, do not find interesting enough to buy in sufficient quantities to be profitable to us or do not purchase due to the pricing of a product, our revenues and profits may decline and our business performance may be harmed. Similarly, if our product offerings and entertainment fail to correctly anticipate consumer interests, our revenues and earnings will be reduced.
Our business will suffer if we are unable to develop digital and technologically advanced and innovative products.
A key component to the success of our Blueprint 2.0 strategy is to continue to innovate, develop and invest in digital gaming and technologically advanced and innovative products, particularly through our Wizards of the Coast and digital gaming business. We have invested substantially in this business segment and as a result it has seen significant growth over the past several years, and while primarily through growth in tabletop play, continued digital game development is a key growth factor for the future. If we are unable to continue to grow this business and ensure its integration with our other business segments, our business may be harmed. The digital gaming industry is highly competitive, including for talent, and costs associated with designing, developing and producing digital games and technologically advanced or sophisticated products tend to be higher than for many of our other more traditional products, such as board and trading card games and action figures, with no assurance of success. As a result, we face increased risk of not achieving sales sufficient to recover our costs and we may lose money on the development and sale of these products. Additionally, designing, developing and producing digital and technologically advanced or innovative products often relies on third parties and requires different competencies and follows different timelines than traditional toys and games. Delays in the design, development or production of our products could have a significant impact on our success. In addition, the pace of change in product offerings and consumer tastes in the electronics and digital gaming areas is potentially even greater than for our other products. If a digital game fails to gain consumer acceptance early in its life cycle, there are limited opportunities to gain such acceptance through secondary launches or distribution through alternative platforms. This pace of change or lack of consumer acceptance means that the window in which a digital gaming product can achieve and maintain consumer interest may be even shorter than traditional toys and games.
If we fail to respond to or capitalize on the rapid technological development in the entertainment industry, including changes in entertainment delivery formats, our business could be harmed.
The entertainment industry continues to experience frequent change driven by technological development and audience viewing preferences, including developments with respect to the formats through which films, television programming, and other episodic content are delivered to consumers. With rapid technological changes and dramatically expanded digital content offerings, the scale and scope of these changes have accelerated in recent years. For example, consumers are continuing to increase their access to television, film and other episodic content on streaming and digital content networks, such as Netflix, Amazon Prime Video, Hulu, Disney+, Apple TV+ and Paramount + to name a few. Similarly, as a result of the COVID-19 pandemic, some film releases continue to go direct to streaming channels as opposed to theaters or at the same time as theaters or have gone to streaming channels after only a short period of time in the theaters. Technological as well as other changes caused by the pandemic have caused significant disruption to the retail distribution of entertainment offerings and have caused, and could in the future cause, a negative impact on sales of our products and other forms of monetization of content, especially those which are reliant on box office success. We may lose opportunities to capitalize on changing market dynamics, technological innovations or consumer tastes if we do not adapt our content offerings or distribution capabilities in a timely manner. The overall effect that technological development and new digital
distribution platforms have on the revenue and profits we derive from our entertainment content, including from merchandise sales derived from such content, and the additional costs associated with changing markets, media platforms and technologies, is unpredictable. If we fail to accurately assess and effectively respond to changes in technology and consumer behavior in the entertainment industry, our business may be harmed.
The industries in which we compete are highly competitive. If we are unable to compete effectively with existing or new competitors, our revenues, market share and profitability could decline.
The play and entertainment industries are highly competitive. We compete in the U.S. and internationally with a wide array of large and small manufacturers, marketers, and sellers of toys and games, products which combine traditional and digital play, digital gaming products, and other entertainment and consumer products, as well as with retailers who offer such products under their own private labels often at lower prices. In addition, we compete with companies focused on building their brands across multiple product and consumer categories, including through entertainment offerings. Across our business, we face competitors who are constantly monitoring and attempting to anticipate consumer tastes and trends, seeking ideas which will appeal to consumers, and introducing new products that compete with our products for consumer acceptance and purchase.
In addition to existing competitors, the barriers to entry for new participants in the play and entertainment industry are low, and the increasing importance of digital media and the heightened connection between digital media and consumer interest, has further increased the ability for new participants to enter our markets, and has broadened the array of companies we compete with. New participants with a popular product idea or entertainment property can gain access to consumers and become a significant source of competition for our products in a very short period of time. These existing and new competitors may be able to respond more rapidly than us to changes in consumer preferences or may design products that are more desirable than ours. Our competitors’ products may achieve greater market acceptance than our products and potentially reduce demand for our products, lower our revenues and lower our profitability.
Our entertainment business faces global competition from major film studios and television production companies as well as other independent distributors and independent content producers. Many of these competitors release a large number of films annually and command a significant share of box office revenues, streaming revenues, and television airtime, as well as other independent film and television production or distribution companies. Some of these competitors have substantially greater marketing and financial resources than we do and may be able to compete aggressively on pricing in order to increase box office or streaming revenues, obtain distribution rights and obtain television airtime. In addition, the resources of the major studios may give them an advantage in acquiring other businesses or assets, including content libraries, that we might also be interested in acquiring. The competition we face may cause us to lose market share, achieve lower prices for our productions or pay more for third‑party content, any of which could harm our business.
We may not realize the full benefit of our licenses if the licensed material has less market appeal than expected or if revenue from the licensed products is not sufficient to earn out the minimum guaranteed royalties.
The success of entertainment properties for which we have a license, such as licenses we have with The Walt Disney Company, and the ability of us to successfully market and sell related products, can significantly affect our revenues and profitability. In some cases, we may only obtain an exclusive license for certain aspects of an IP or for certain territories, which means that some of our competitors also have the right to use the same IP for other categories or in different territories. If we produce a line of products based on a movie or television series, the success of the movie or series has a critical impact on the level of consumer interest in the associated products we are offering. In addition, competition in our industry for access to entertainment properties can lessen our ability to secure, maintain, and renew popular licenses to entertainment products on beneficial terms, if at all, and to attract and retain the talented employees necessary to design, develop and market successful products based on these properties.
The license agreements we enter to obtain these rights usually require us to pay minimum royalty guarantees that may be substantial, and in some cases may be greater than what we are ultimately able to recoup from actual sales, which could result in write-offs which, in turn, would harm our results of operations. Acquiring or renewing licenses may require the payment of minimum guaranteed royalties that we consider to be too high to be profitable, which may result in losing licenses that we currently hold when they become available for renewal, or not pursuing certain new licenses. Additionally, as a licensee of entertainment-based properties, we cannot guarantee that a particular property or brand will translate into successful toy, game or other family entertainment products, and underperformance of any such products may result in reduced revenues and operating profit for us.
We may not realize the anticipated benefits of acquisitions, dispositions or investments in joint ventures, or those benefits may be delayed or reduced in their realization.
We cannot be certain that the products and offerings of companies we may acquire, or acquire an interest in, will achieve or maintain popularity with consumers in the future or that any such acquired companies or investments will allow us to more effectively market our products, develop our competencies or grow our business. In some cases, we expect that the integration of the companies that we may acquire into our operations will create production, marketing and other operating, revenue or cost synergies which will produce greater revenue growth and profitability and, where applicable, cost savings, operating efficiencies and other advantages. However, we cannot be certain that these synergies, efficiencies and cost savings will be realized. Even if achieved, these benefits may be delayed, reduced or short-lived in their realization. In other cases, we may acquire or invest in companies that we believe have strong and creative management, in which case we may plan to operate them more autonomously rather than fully integrating them into our operations. We cannot be certain that the key talented individuals at these companies would continue to work for us after the acquisition or that they would develop popular and profitable products, entertainment or services in the future. Acquisitions of businesses and brands could also be adversely affected by changes in our business strategy. With our Blueprint 2.0 strategy, we may seek to sell, license or otherwise dispose of certain non-core assets, such as certain film and television assets. We may not achieve a successful sale, license or disposition of non-core assets. Additionally, we cannot guarantee that any acquisition, disposition or investment we may make will be successful or beneficial, and acquisitions, dispositions and investments can consume significant amounts of management attention and other resources, which may negatively impact other aspects of our business.
Operational Risks Related to our Business
If we are not successful in transforming our supply chain operations, our business may be harmed.
As part of our transformation efforts, we are in the process of optimizing our supply chain by improving our systems and sourcing to enable efficient product deployment, enhance product quality and safety, drive efficiency in transportation and our fulfilment centers, and strengthen our direct-to-consumer operations. This is a long-term project, with no assurance that we will achieve the anticipated efficiencies and benefits from such efforts. If the transformation of our supply chain operations is not successful, our business may be harmed. Further we may not achieve our anticipated cost savings, and we may face costly inefficiencies or other supply chain disruptions.
An inability to develop, introduce and ship planned products, product lines and new brands in a timely and cost-effective manner may damage our business.
In developing products, product lines and new brands we have anticipated dates for the associated product and brand introductions. When we state that we will introduce, or anticipate introducing, a particular product, product line or brand at a certain time in the future those expectations are based on completing the associated development, implementation, and marketing work in accordance with our currently anticipated development schedule. We cannot guarantee that we will be able to manufacture, source and ship new or continuing products in a timely manner and on a cost-effective basis to meet constantly changing consumer demands. This risk is heightened by our customers’ compressed shipping schedules and the seasonality of our business.
The risk is also exacerbated by the increasing sophistication of many of the brands and products we are designing and developing in terms of combining digital and traditional technologies, and providing greater innovation and product differentiation. Unforeseen delays or difficulties in the development process, significant increases in the planned cost of development, or changes in anticipated consumer demand for our products and new brands may cause the introduction date for products to be later than anticipated, may reduce or eliminate the profitability of such products, result in excess inventory, or, in some situations, may cause a product or new brand introduction to be discontinued.
If we are unable to navigate through global supply chain challenges, our business may be harmed.
During the past couple of years, we have faced global supply chain challenges with the production and delivery of some products being delayed due to logistics, including labor, trucking and container shortages, port congestion and other shipping disruptions. We have experienced increases in material costs and shortages for some of our products, due in part to higher wages being paid due to labor shortages in China and Vietnam, as well as periodic and unpredictable manufacturing shut-downs or slow-downs due to COVID-19. While we have taken actions to lessen the impact of these supply chain challenges, such as through the use of alternative ports and air freight, and accelerating inventory purchases in certain cases to ensure product availability for customers, such actions have resulted in higher costs and there can be no assurance that the actions taken will be effective. We have also increased prices in some cases to help offset increased costs. We can provide no assurance that we will be able to
increase prices in the future and we cannot assure that price increases we have already taken, will offset the entirety of additional costs we have incurred, and may incur in the future to mitigate the supply chain disruption. Further, if we are unable to negotiate favorable carrier agreements, deliver products on time or otherwise satisfy demand for our products, our business may be harmed.
If we are unable to adapt our business to the continued shift to ecommerce and direct-to-consumer, our business may be harmed.
Our ecommerce business, including through our direct-to-consumer ecommerce, fan-based platform PULSE, is accounting for a higher portion of the ultimate sales of our products to consumers than it has historically. In recent years, the increase in ecommerce sales has resulted in retailers holding less inventory, which has caused us to adjust our supply chain. If our technology and systems used to support ecommerce order processing, including through PULSE, are not effective, our ability to deliver products on time on a cost-effective basis may be adversely affected. Failure to continue to adapt our systems and supply chain and successfully fulfill ecommerce sales could harm our business. In 2022, ecommerce sales were adversely affected as more customers increased their willingness to shop in brick and mortar stores.
The concentration of our retail customer base and continued shift to ecommerce sales means that economic difficulties or changes in the purchasing or promotional policies or patterns of our major customers could have a significant impact on us.
We depend upon a relatively small retail customer base to sell the majority of our products. For the fiscal year ended December 25, 2022, Walmart, Inc. and Amazon.com, Inc. accounted for approximately 11% and 10%, respectively, of our consolidated net revenues. Similarly, sales of certain products of our Wizards business depend in part on the success of specialty hobby stores. Due to our customer concentration and customer base, if one or more of our major customers or specialty hobby stores were to experience difficulties in fulfilling their obligations to us, cease doing business with us, significantly reduce the amount of their purchases from us, favor competitors or new entrants, increase their direct competition with us by expanding their private-label business, change their purchasing patterns, impose unexpected fees on us, alter the manner in which they promote our products or the resources they devote to promoting and selling our products, or return substantial amounts of our products, our business may be harmed.
Our customers do not make binding long-term commitments to us regarding purchase volumes and make all purchases by delivering purchase orders. Any customer could reduce its overall purchase of our products and reduce the number and variety of our products that it carries and the shelf space allotted for our products. In addition, increased concentration among our customers could negatively impact our ability to negotiate higher sales prices for our products and could result in lower gross margins than would otherwise be obtained if there were less consolidation among our customers. Furthermore, as we experienced with the bankruptcy of certain of our retailers in the past, the failure or lack of success of a significant retail customer could negatively impact our revenues and profitability.
Our substantial business, sales and manufacturing operations outside the U.S. subject us to risks associated with international operations.
We operate facilities and sell products and entertainment offerings in numerous countries outside the U.S. Additionally, we utilize third-party manufacturers primarily located in the Far East, including China, Vietnam and India, to produce most of our products. These international operations, including operations in emerging markets, have unique consumer preferences and business climates, present additional challenges and are subject to risks that may significantly harm our sales, increase our costs or otherwise damage our business, including:
•Currency conversion risks and currency fluctuations;
•The imposition of tariffs, quotas, border adjustment taxes or other protectionist measures;
•Potential challenges to our transfer pricing determinations and other aspects of our cross-border transactions, which can materially increase our taxes and other costs of doing business;
•Political instability, civil unrest and economic instability, such as has been experienced between Russia and Ukraine, which has resulted in a suspension of our business activities in Russia;
•Greater difficulty enforcing intellectual property rights and weaker laws protecting such rights;
•Complications in complying with different laws in varying jurisdictions and in dealing with changes in governmental policies and the evolution of laws and regulations and related enforcement, as such laws and policies relate to our products and approval of entertainment;
•Difficulties understanding the retail climate, consumer trends, local customs and competitive conditions in foreign markets which may be quite different from the U.S.;
•Natural disasters and the greater difficulty and cost in recovering therefrom;
•Difficulties in moving materials and products from one country to another, including port congestion, strikes, labor shortages and other events causing transportation delays and interruptions;
•Increased investment and operational complexity to make our products compatible with systems in various countries and compliant with local laws; and
•Changes in international labor costs and other costs of doing business internationally.
Because of the importance of international sales, sourcing and manufacturing to our business, our financial condition and results of operations could be significantly harmed if any of the risks described above were to occur or if we are otherwise unsuccessful in managing our increasing global business and operating in an environment with these risks.
Our reliance on third-party manufacturers to produce our products, particularly in China, the U.S., Vietnam and India, presents risks to our business.
All our products are manufactured by third-party manufacturers, the majority of which are in China, with a significant amount of our product sourcing also coming from manufacturers the U.S., Vietnam and a lesser amount from India. Should changes be necessary, our external sources of manufacturing can be shifted, over a significant period of time, to alternative sources of supply. If we were prevented or delayed in obtaining products or components for a material portion of our product lines due to economic, political, civil, labor or other factors beyond our control, including work stoppages, slowdowns or strikes, natural disasters, adverse health conditions or pandemics, our ability to manufacture would be adversely affected and our operations may be substantially disrupted, potentially for a significant period of time. This delay could significantly reduce our revenues and profitability and harm our business while alternative sources of supply are secured.
Given that our toy and game manufacturing is conducted by third-party manufacturers, health conditions, such as the coronavirus, and other factors affecting social and economic activity where our manufacturers are located may affect the movement of people and products into and from those locations to our major markets, including North America and Europe. Further, increases in the costs of labor and other costs of doing business in markets where we manufacture, could also have a significant negative impact on our operations, revenues and earnings. Prolonged disputes or slowdowns at west coast or other ports can negatively impact both the time and cost of transporting goods into the U.S. Natural disasters or health pandemics, such as COVID-19, impacting our manufacturers had and can have a significant negative impact on our business.
Further, the imposition of tariffs, border adjustment taxes, trade sanctions or other regulations or economic penalties by the U.S. or the European Union against products imported by us from China or other foreign countries, or the loss of “normal trade relations” status with China or other foreign countries in which we operate, could significantly increase our cost of products imported into the U.S. or Europe, shift more orders from direct import to domestic sales, put additional shipping and warehousing burdens on us, delay the time of our sales to retailers, result in lost sales, and otherwise harm our business. Additionally, the suspension of the operations of a third-party manufacturer by government inspectors in China or another market in which we source products could result in delays to us in obtaining product and may harm sales.
We have been working over the last several years to reduce our reliance on manufacturing in China, such as by moving production of certain products to facilities in other countries like Vietnam, India and Mexico, as well as by increasing production of our products in other markets, including in the U.S. We plan to continue those efforts in future years, but cannot guarantee we will be as successful in these efforts as we plan. Furthermore, many of these newer production facilities, such as in Vietnam and India, raise other risks in that we are working with vendors who have not been manufacturing products like ours for as long as historical vendors in China. That means these new vendors must successfully develop the capability to manufacture our products to the quality and safety standards we require and within the tight timeframe required by our customers. Newer and less experienced vendors are more
susceptible to product quality, logistics and other issues, due in part to their less mature infrastructure or unfamiliarity with our product standards.
We require our third-party manufacturers to comply with our Global Business Ethics Principles, which are designed to prevent products manufactured for us from being produced under inhumane or exploitive conditions. Notwithstanding these requirements and our monitoring and testing of compliance with them, there is always a risk that one or more of our third-party manufacturers will not comply with our requirements and that we will not immediately discover such non-compliance. Any failure of our third-party manufacturers to comply with labor, consumer, product safety or other applicable requirements in manufacturing products for us could result in damage to our reputation, harm sales of our products and potentially create liability for us.
Our dependence on third-party relationships with studios, content producers and distribution channels to develop and distribute digital games and entertainment content is critical to our business.
We rely on third party relationships with studios, content producers and distribution channels to develop and distribute certain digital games and entertainment content. Our financial performance may be adversely affected by our relationships with these studios, content producers and distribution channels. Some of our content producers and digital gaming developers are affiliates of major studios that develop their own content or games. Some have their own distribution capability in the markets in which we operate, and some may decide, or be required by their respective parent companies, to use their intra‑company distribution or content production capabilities rather than contracting with us. Our business may be harmed if the studios, content producers and distribution channels with which we work stop or reduce the amount of work they do with us or otherwise demand less favorable terms to us.
We have entered into long-term output licensing agreements for the acquisition of content and these agreements may not be renewed on favorable terms or at all.
In some cases, we have entered into long-term agreements to acquire films with producers. These agreements require us to pay for films released by the relevant studio at rates typically calculated by reference to the film’s budget. In addition, we have entered into long term contracts for the acquisition of certain of our television programs. As these contracts expire, we may choose to renew, renegotiate or terminate them. These arrangements are also terminable by the counterparty under certain circumstances. If we are unable to renew or replace them on acceptable terms, we may not be able to replace this content with other film acquisitions. Even if these contracts are renewed or replaced, the terms on which we acquire content may be less favorable than the terms of our current agreements and the financial success or quantity of films and television programs we acquire through these long-term contracts may decrease. There can also be no assurance that revenues based on these long-term contracts will exceed the costs of acquiring the films or television programs.
Our success is dependent on the efforts and dedication of our officers and other employees.
Our officers and employees are at the heart of all our efforts. It is their skill, innovation and hard work that drive our success. We compete with many other potential employers in recruiting, hiring and retaining our management team and our many other skilled officers and employees around the world. In the digital gaming and entertainment industries, experienced personnel and top creative talent are in high demand and competition for their talent is intense. The increasing prevalence of remote and hybrid work creates further challenges in retaining employees as some employees desire more flexibility in their employment and the ability to work remotely or hybrid opens up more employment opportunities. Additionally, as we continue to transform our business to execute on our Blueprint 2.0 strategy, we have reduced our headcount and may otherwise lose employees due to our decision to eliminate or reduce the amount of work performed relative to non-core aspects our business. The impact of reductions in force or failing to retain key employees can be high due to increased risk of loss of important information, key knowledge and relationships, loss of creative talent, lost productivity, hiring and training costs, all of which could result in lower profitability or otherwise harm the business. We cannot guarantee that we will recruit, hire or retain the key personnel we need to succeed.
We have experienced significant changes in our leadership in a relatively short period of time. This includes the appointments of our new Chief Executive Officer, President of Wizards of the Coast and Digital Gaming, Global Supply Chain Officer, Chief Commercial Officer, Chief People Officer and Chief Transformation Officer, as well as the expected change in Chief Financial Officer following the upcoming retirement of Deborah Thomas, our current Chief Financial Officer, and the departure of our President and Chief Operating Officer. Our future success will depend on the leadership of our key executives and their ability to navigate the organization through our transformation efforts. Our loss of key management or other key employees, inability to drive success through our new leaders, or our inability to retain or hire talented people with the skill sets we need for our diverse and changing business, could significantly harm our business.
If we fail to develop diverse top talent, we may be unable to compete and our business may be harmed.
We promote a diverse and inclusive work environment. To compete successfully, we must continuously develop a diverse group of talented people. To that end, we have set goals and objectives with respect to hiring and retention of talented, diverse employees, which we believe will foster new ideas and perspectives that will benefit our business. Competition for diverse talent is intense. The recent restructuring changes in our business may make it more difficult to attract and retain diverse talent. We cannot guarantee we will achieve our goals or that our actions will result in expected benefits to our business.
Our business may be harmed if we are unable to protect our critical intellectual property rights.
Our intellectual property, including our trademarks and tradenames, copyrights, patents, and rights under our license agreements and other agreements that establish our intellectual property rights and maintain the confidentiality of our intellectual property, is of critical value. We rely on a combination of trade secret, copyright, trademark, patent and other proprietary rights laws to protect our rights to valuable intellectual property in the U.S. and around the world. From time to time, third parties have challenged, and may in the future try to challenge, our ownership of our intellectual property in the U.S. and around the world. In addition, our business is subject to the risk of third parties counterfeiting our products or infringing on our intellectual property rights, as well as the risk of unauthorized third parties copying and distributing our entertainment content or leaking portions of planned entertainment content. We may need to resort to litigation to protect our intellectual property rights, which could result in substantial costs and diversion of resources. Similarly, third parties may claim ownership over certain aspects of our products, productions or other intellectual property. Our failure to successfully protect our intellectual property rights could significantly harm our business and competitive position.
Failure to successfully operate our information systems and implement new technology effectively could disrupt our business or reduce our sales or profitability.
We rely extensively on various information technology systems and software applications to manage many aspects of our business, including product development, management of our supply chain, sale and delivery of our products, royalty and financial reporting and various other processes and transactions. As part of our transformation efforts, we are also upgrading some of our technology and systems. We are critically dependent on the integrity, security and consistent operations of these systems and related back-up systems. These systems are subject to damage or interruption from power outages, computer and telecommunications failures, computer viruses, malware and other cybersecurity breaches, catastrophic events such as hurricanes, fires, floods, earthquakes, tornadoes, acts of war or terrorism and usage errors by our employees or partners. The efficient operation and successful growth of our business depends on these information systems, including our ability to operate them effectively and to select and implement appropriate upgrades or new technologies and systems and adequate disaster recovery systems successfully. The failure of our information systems or third-party hosted technology to perform as designed or our failure to implement and operate them effectively could disrupt our business, require significant capital investments to remediate a problem or subject us to liability.
If our electronic data is compromised our business could be significantly harmed.
We and our business partners maintain significant amounts of data electronically in locations around the world and in the cloud. This data relates to all aspects of our business, including current and future products and entertainment under development, and also contains certain customer, consumer, supplier, partner and employee data. We maintain systems and processes designed to protect this data, but notwithstanding such protective measures, there is a risk of intrusion, cyber-attacks or tampering that could compromise the integrity and privacy of this data. Cyber-attacks continue to increase in their frequency, sophistication and intensity, and are becoming increasingly difficult to detect. They are often carried out by motivated, well-resourced, skilled and persistent actors, including nation states, organized crime groups, “hacktivists” and employees or contractors acting with malicious intent. Cyber-attacks could include the deployment of harmful malware and key loggers, ransomware, a denial-of-service attack, a malicious website, the use of social engineering and other means to affect the confidentiality, integrity and availability of our technology systems and data. Cyber-attacks could also include supply chain attacks, which could cause a delay in the manufacturing of our products. In addition, we provide confidential and proprietary information to our third-party business partners in certain cases where doing so is necessary to conduct our business. While we obtain assurances from those parties that they have systems and processes in place to protect such data, and where applicable, that they will take steps to assure the protections of such data by third parties, those partners may also be subject to data intrusion or otherwise compromise the protection of such data. The risk of data loss or breaches is heightened during uncertain economic times, changes in business strategy and reductions in force. Any compromise of the confidential data of our customers, consumers, suppliers, partners, employees or ourselves, or failure to prevent or mitigate the loss of or damage to this data through breach of our
information technology systems or other means could substantially disrupt our operations, harm our customers, consumers, employees and other business partners, damage our reputation, violate applicable laws and regulations, subject us to potentially significant costs and liabilities and result in a loss of business that could be material.
Global and Economic Risks Relating to our Business
The global coronavirus outbreak or other similar outbreaks of communicable infections, diseases, or public health pandemics in the markets in which we and our employees, consumers, customers, partners, licensees, suppliers and manufacturers operate, could substantially harm our business.
The global outbreak of the coronavirus which continues to adversely impact global populations, and any other variants or outbreaks of communicable infections, diseases or other adverse public health conditions in markets in which we, our employees, consumers, customers, partners, licensees, licensors, suppliers and manufacturers operate, has had and could in the future have a significant negative impact on our business, revenues and profitability. The occurrence of these types of events can result, and in the case of the coronavirus has resulted in, disruptions and damage to our business, due to, among other things:
•difficulties in shipping and distributing products due to ongoing port capacity, and labor, shipping container and truck transportation shortages, resulting in higher costs for both ocean and air freight and delays in the availability of products, which can result in delayed sales and in some cases result in lost sales;
•disruptions in supply of products, due to closures or reductions in operations at third-party manufacturing facilities across several geographies including, but not limited to, China, Vietnam, India, the United States and Ireland;
•adverse sales impact due to changes in consumer purchasing behavior and availability of products to consumers;
•uncertain inventory availability or difficulty in anticipating demand, which can result in too little or too much supply at a given time;
•interruptions, delays or postponements of entertainment productions and releases; and
•challenges of working remotely.
The impact of coronavirus outbreak continues to be fluid and uncertain, and while vaccines have been rolled out, it is still difficult to forecast the final impact it could have on our future operations. If our business experiences prolonged occurrence of adverse public health conditions due to the coronavirus or other similar outbreaks, we believe our business could be substantially harmed.
Inflation and other adverse economic conditions in the markets in which we and our employees, consumers, customers, suppliers and manufacturers operate could negatively impact our ability to produce and ship our products, and lower our revenues, margins and profitability.
Various economic conditions in the markets we, our employees, consumers, customers, suppliers and manufacturers operate, could have a significant negative impact on our revenues, profitability and business. The occurrence of adverse economic conditions can result in manufacturing and other work stoppages, slowdowns and delays; shortages or delays in production or shipment of products or raw materials; delayed or reduced purchases from customers and consumers; and other factors that cause increases in costs or delay in revenues.
Inflation, such as what consumers in the U.S. and other economies are experiencing, can cause significant increases in the costs of other products which are required by consumers, such as gasoline, home heating fuels, or groceries, may reduce household spending on the discretionary products and entertainment we offer. Weakened economic conditions, lowered employment levels or recessions in any of our major markets may also significantly reduce consumer purchases of our products and spending on entertainment. Economic conditions may also be negatively impacted by terrorist attacks, wars and other conflicts, natural disasters, increases in critical commodity prices or labor costs, or the prospect of such events. Such a weakened economic and business climate, as well as consumer uncertainty created by such a climate, could harm our revenues and profitability.
Our success and profitability not only depend on consumer demand for our products, but also on our ability to produce and sell those products at costs which allow for us to make a profit. Rising fuel and raw material prices, due to inflation or otherwise, for paperboard and other components such as resin used in plastics or electronic
components, increased transportation and shipping costs, and increased labor costs in the markets in which our products are manufactured all may increase the costs we incur to produce and transport our products, which in turn may reduce our margins, reduce our profitability and harm our business.
Changes in U.S., global or regional economic conditions could impact discretionary consumer spending and harm our business and financial performance.
Our financial performance is impacted by the level of discretionary consumer spending in the markets in which we operate. Recessions or even fear or anticipation of recessions, inflation, rising interest rates and mortgage rates, credit crises and other economic downturns, or disruptions in credit markets, in the U.S. and in other markets in which we operate can result in lower levels of economic activity, lower employment levels, less consumer disposable income, and lower consumer confidence. Similarly, reductions in the value of key assets held by consumers, such as their homes or stock market investments, can lower consumer confidence and consumer spending power. Any of these factors can reduce the amount which consumers spend on the purchase of our products and entertainment. This in turn can reduce our revenues and harm our financial performance and profitability.
Financial Risks Relating to our Business
Our quarterly and annual operating results may fluctuate due to seasonality in our business.
Sales of our toys, games and other entertainment products are extremely seasonal, with a majority of retail sales occurring during the period from September through December in anticipation of the holiday season. This seasonality for our consumer products business has increased over time, as retailers become more and more efficient in their control of inventory levels through quick response or just in time inventory management techniques, including the use of automated inventory replenishment programs. Further, ecommerce, including through our own PULSE ecommerce platform, continues to grow significantly and accounts for a higher portion of the ultimate sales of our products to consumers. Third-party ecommerce retailers tend to hold less inventory and take inventory closer to the time of sale to consumers than traditional retailers. As a result, customers are timing their orders so that they are being filled by suppliers, such as us, closer to the time of purchase by consumers. While these techniques reduce a retailer’s investment in inventory, they increase pressure on suppliers like us to fill orders promptly and thereby shift a significant portion of inventory risk and carrying costs to the supplier. This can also result in our losing significant revenues and earnings if our supply chain is unable to supply product to our customers when they want it. Tariffs can exacerbate this negative impact by causing retailers to shift from direct import to domestic orders, further pressuring our supply chain.
The level of inventory carried by retailers may also reduce or delay retail sales resulting in lower revenues for us. If we or our customers determine that one of our products is more popular at retail than was originally anticipated, we may not have sufficient time to produce and ship enough additional products to fully meet consumer demand. Additionally, the logistics of supplying more product within shorter time periods increases the risk that we will fail to achieve tight and compressed shipping schedules, which also may reduce our sales and harm our financial performance. These risks were exacerbated in 2021 and continued into early 2022 due to the global supply chain challenges we faced due to logistics, including labor, trucking and container shortages, port congestion and other shipping disruptions. To offset the risk of lack of supply, in 2022 we accelerated inventory purchases. These purchases, however, did not see corresponding increases in sales as consumers were impacted by the economic environment, including lower discretionary consumer income due to higher inflation and rising interest rates. The ability to accurately predict levels of inventory remains challenging in the current economic environment.
Our entertainment business is also subject to seasonal variations based on the timing of television, film, streaming and digital content releases. Release dates are determined by several factors, including the timing of holiday periods, geographical release dates and competition in the market, and more recently, the timing of release dates has been affected by the pandemic.
This seasonal patterns of our business requires significant use of working capital, mainly to manufacture or acquire inventory during the portion of the year prior to the holiday season, and requires accurate forecasting of demand for products during the holiday season in order to avoid losing potential sales of popular products or producing excess inventory of products that are less popular with consumers. Our failure to accurately predict and respond to consumer demand, resulting in under producing popular items and/or overproducing less popular items, would reduce our total sales and harm our results of operations.
As a result of the seasonal nature of our business, we would be significantly and adversely affected, in a manner disproportionate to the impact on a company with sales spread more evenly throughout the year, by unforeseen events such as a natural disaster, a terrorist attack, economic shock or pandemic that harms the retail environment
or consumer buying patterns during our key selling season, or by events such as strikes or port delays or other supply chain challenges that interfere with the shipment of goods, particularly from the Far East, during the critical months leading up to the holiday shopping season.
If we incurred any significant impairment charges, our net earnings would be reduced.
Declines in the profitability of acquired brands or businesses or our decision to reduce our focus or exit these brands or businesses, such as certain non-core entertainment assets of the business, may impact our ability to recover the carrying value of the related assets and could result in an impairment charge. Similarly, declines in our profitability may impact the fair value of our reporting units, which could result in a write-down of our goodwill and consequently harm our net earnings. In 2022, we had approximately $322.4 million of impairment charges in connection with the implementation of the Company's strategic review and adoption of the Blueprint 2.0 strategy. These charges consisted of a goodwill impairment loss of $11.8 million and asset impairments of $10.3 million related to the exit of non-core businesses within the Entertainment segment, a charge of $281.0 million related to a partial impairment of the Company's definite-lived Power Rangers intangible asset due to changes in entertainment strategy and plans, incurred incremental asset charges related to product cancellations, consisting of inventory reserves and asset write offs of $14.9 million within the Consumer Products segment, and other strategy related asset impairments of certain discontinued projects of $4.4 million within the Entertainment segment.
We may incur impairments if the films and television programs we acquire and produce do not perform well enough to recoup our acquisition, production, marketing and distribution costs.
We incur significant costs to acquire, produce and distribute entertainment content. Most agreements to acquire content for distribution require minimum guarantees against royalties. The minimum guarantees are derived from our estimate of net revenues that will be realized from our distribution of the title in the relevant markets, and actual results may differ from those estimates. If sales do not meet our original estimates, we may:
•not recognize the expected gross margin or net profit;
•not recoup our minimum guarantees or distribution expenses;
•record accelerated amortization and/or fair value write‑downs of minimum guarantees paid; or
•not recoup the additional funds and expenses invested to market films that we have produced or acquired.
With respect to content we produce, we are required to amortize capitalized production costs based on estimated ultimate revenue as we recognize revenues from the associated films or television productions. Unamortized production costs are evaluated for impairment each reporting period on a project‑by‑project basis. If estimated remaining revenue is not sufficient to recover the unamortized production costs, the unamortized production costs will be written down to fair value. In any given quarter, if we lower our previous forecast with respect to total anticipated revenue from any individual film or other project, we may be required to accelerate amortization or record impairment charges with respect to the unamortized costs, even if we have previously recorded impairment charges for such film or other project. Such impairment and accelerated amortization charges and write‑offs could harm our financial results.
Similarly, our business could be harmed by greater-than-expected costs, or unexpected delays or difficulties, associated with our investment in Discovery Family Channel, such as difficulties in increasing subscribers to the network or in building advertising revenues for Discovery Family Channel. For example, during the fourth quarter of 2021 we recorded an impairment loss of $74.1 million associated with our investment in the Discovery Family Channel.
Changes in foreign currency exchange rates can significantly impact our reported financial performance.
Our global operations mean we transact business in many different jurisdictions with many different currencies. As a result, if the exchange rate between the U.S. dollar and a local currency for an international market in which we have significant sales or operations changes, our financial results as reported in U.S. dollars, may be meaningfully impacted even if our business in the local currency is not significantly affected. In 2022, our sales were adversely impacted due to the strength of the U.S. dollar compared to certain foreign currencies in territories in which we operate. Similarly, our expenses can be significantly impacted, in U.S. dollar terms, by exchange rates, meaning the profitability of our business in U.S. dollar terms can be negatively impacted by exchange rate movements which we do not control. Depreciation in key currencies may have a significant negative impact on our revenues and earnings as they are reported in U.S. dollars.
Our indebtedness may limit our availability of cash, cause us to divert cash to fund debt service payments or make it more difficult to take certain other actions.
We incurred significant indebtedness to finance our acquisition of eOne in 2019. While we continue to pay down this indebtedness, the increase in our debt service obligations resulting from additional indebtedness could have a material adverse effect on our results of operations and financial condition. In particular, our increased indebtedness could:
•make it more difficult and/or costly for us to pay or refinance our debts as they become due, particularly during adverse economic and industry conditions, because a decrease in revenues or increase in costs could cause cash flow from operations to be insufficient to make scheduled debt service payments;
•require a substantial portion of our available cash to be used for debt service payments, thereby reducing the availability of our cash to fund working capital, capital expenditures, development projects, acquisitions or other strategic opportunities, dividend payments, share repurchases and other general corporate purposes;
•result in downgrades in the credit ratings on our indebtedness, which could limit our ability to borrow additional funds on favorable terms or at all (including in order to refinance our other debt), increase the interest rates under our credit facilities and under any new indebtedness we may incur;
•make it more difficult for us to raise capital to fund working capital, make capital expenditures, pay dividends, pursue strategic initiatives or for other purposes;
•result in higher interest expense, which could be further increased in case of current or future borrowings subject to variable rates of interest;
•require that materially adverse terms, conditions or covenants be placed on us under our debt instruments, which could include, for example, limitations on additional borrowings or limitations on our ability to create liens, pay dividends, repurchase our common stock or make investments, any of which could hinder our access to capital markets or our flexibility in the conduct of our business and make us more vulnerable to economic downturns and adverse competitive industry conditions; and
•jeopardize our ability to pay our indebtedness if our business experienced a severe downturn.
If we were unable to obtain or service our other external financings, or if the restrictions imposed by such financing were too burdensome, our business would be harmed.
Due to the seasonal nature of our business, in order to meet our working capital needs, particularly those in the third and fourth quarters, we may rely on our commercial paper program, revolving credit facility and our other credit facilities for working capital. We currently have a commercial paper program which, subject to market conditions, and availability under our committed revolving credit facility, allows us to issue up to $1,000.0 million in aggregate amount of commercial paper outstanding from time to time as a source of working capital funding and liquidity. We cannot guarantee that we will be able to issue commercial paper on favorable terms, or at all, at any given point in time.
We also have a revolving credit agreement which provides for a $1,500.0 million committed revolving credit facility. The credit agreement contains certain restrictive covenants setting forth leverage and coverage requirements, and certain other limitations typical of an investment grade facility. These restrictive covenants may limit our future actions as well as our financial, operating and strategic flexibility. Non-compliance with our debt covenants could result in us being unable to utilize borrowings under our revolving credit facility and other bank lines, a circumstance which potentially could occur when operating shortfalls would require supplementary borrowings to enable us to continue to fund our operations.
Not only may our individual financial performance impact our ability to access sources of external financing, but significant disruptions to credit markets in general may also harm our ability to obtain financing. In times of severe economic downturn and/or distress in the credit markets, it is possible that one or more sources of external financing may be unable or unwilling to provide funding to us. In such a situation, it may be that we would be unable to access funding under our existing credit facilities, and it might not be possible to find alternative sources of funding.
We also may choose to finance our capital needs, from time to time, through the issuance of debt securities. Our ability to issue such securities on satisfactory terms, if at all, will depend on the state of our business and financial condition, any ratings issued by major credit rating agencies, market interest rates, and the overall condition of the financial and credit markets at the time of the offering. The condition of the credit markets and prevailing interest rates have fluctuated significantly in the past and are likely to fluctuate in the future. Variations in these factors could make it difficult for us to sell debt securities or require us to offer higher interest rates in order to sell new debt securities. The failure to receive financing on desirable terms, or at all, could damage our ability to support our future operations or capital needs or engage in other business activities.
If we are unable to generate sufficient available cash flow to service our outstanding debt we would need to refinance our outstanding debt or face default. We cannot guarantee that we would be able to refinance debt on favorable terms, or at all.
Changes in, or differing interpretations of, income tax laws and rules, and changes in our geographic operating results, may impact our effective tax rate.
We are subject to income taxes in the U.S. and in various international tax jurisdictions. We also conduct business activities between our operating units in various jurisdictions and we are subject to transfer pricing rules in the countries in which we operate. There is some degree of uncertainty and subjectivity in complying with transfer pricing rules. Our effective tax rate could be impacted by changes in, or the interpretation of, tax laws, such as those imposed by the current U.S. administration and other jurisdictions in which we do business, or by changes in the amount of revenue and earnings we derive, or are determined to derive by tax authorities, from jurisdictions with differing tax rates.
In addition, we may be subject to tax examinations by federal, state, and international jurisdictions, and these examinations can result in significant tax findings if the tax authorities interpret the application of laws and rules differently than we do or disagree with the intercompany rates we are applying. We assess the likelihood of outcomes resulting from tax uncertainties. While we believe our estimates are reasonable, the ultimate outcome of these uncertain tax benefits, or results of possible current or future tax examinations, may differ from our estimates and may have a significant adverse impact on our business and operating results.
If we lose the Canadian status of Entertainment One Canada Ltd., we could lose licenses, incentives and tax credits.
Through our acquisition of eOne, we indirectly acquired the economic interests in Entertainment One Canada Ltd., a Canadian corporation (“EOCL”). EOCL is able to benefit from a number of licenses, incentive programs and Canadian government tax credits as a result of it being “Canadian controlled” as defined in the Investment Canada Act. We have taken measures to ensure that EOCL’s Canadian status is maintained. There can be no assurance, however, that we will be able to continue to maintain EOCL's Canadian status. The loss of EOCL’s Canadian status could harm our business, including the possible loss of future incentive programs and clawback of funding previously provided to EOCL.
Governmental and Legal Risks Relating to our Business
We are subject to various government regulations, violation of which could subject us to sanctions or otherwise harm our business. In addition, we could be the subject of future product liability suits or product recalls, which could harm our business.
We are subject to significant government regulations, including, in the U.S., under The Consumer Products Safety Act, The Federal Hazardous Substances Act, and The Flammable Fabrics Act, as well as under product safety and consumer protection statutes in our international markets. In addition, certain of our products are subject to regulation by the Food and Drug Administration or similar international authorities. Advertising to children is subject to regulation by the Federal Trade Commission, the Federal Communications Commission and a host of other agencies globally, and the collection of information from children under the age of 13 is subject to the provisions of the Children’s Online Privacy Protection Act and other privacy laws around the world. The collection of personally identifiable information from anyone, including adults, is under increasing regulation in many markets, such as the General Data Protection Regulation adopted by the European Union, and data protection laws in the United States and in a number of other counties. While we take all the steps we believe are necessary to comply with these acts and regulations, we cannot assure you that we will be in compliance and, if we fail to comply with these requirements or other regulations enacted in the future, we could be subject to fines, liabilities or sanctions which could have a significant negative impact on our business, financial condition and results of operations. We may also be subject to involuntary product recalls or may voluntarily conduct a product recall. While costs associated with product recalls have generally not been material to our business, the costs associated with future product recalls
individually or in the aggregate in any given fiscal year could be significant. In addition, any product recall, regardless of direct costs of the recall, may harm the reputation of our products and have a negative impact on our future revenues and results of operations.
As a large multinational corporation, we are subject to a host of governmental regulations throughout the world, including antitrust, employment, customs and tax requirements, anti-boycott regulations, environmental regulations and the Foreign Corrupt Practices Act. Complying with these regulations imposes costs on us which can reduce our profitability and our failure to successfully comply with any such legal requirements could subject us to monetary liabilities and other sanctions that could further harm our business and financial condition.
Our entertainment business involves risks of liability claims for media content, which could adversely affect our business, results of operations and financial condition.
As a distributor and producer of media content, we may face potential liability for defamation, invasion of privacy, negligence, copyright or trademark infringement, and other claims based on the nature and content of the materials distributed. These types of claims have been brought, sometimes successfully, against producers and distributors of media content. Any imposition of liability that is not covered by insurance or is in excess of insurance coverage could have a material adverse effect on our business, results of operation and financial condition.
Failure to achieve our sustainability goals could result in reputational damage.
We view sustainability challenges as opportunities to innovate and continuously improve our product design and operational efficiencies. We have set key goals and objectives in this area as described in our business section of this Form 10-K. Our reputation could be damaged if we fail to achieve our sustainability goals, or if we or others in our industry do not act, or are perceived not to act, responsibly with respect to the production and packaging of our products.
We are involved in litigation, arbitration or regulatory matters where the outcome is uncertain and which could entail significant expense.
As a large multinational corporation, we are subject to regulatory investigations, litigation and arbitration disputes, including potential liability from personal injury or property damage claims by the users of products that have been or may be developed by us, claims by third parties that our products infringe upon or misuse such third parties’ property or rights, or claims by former employees for employment related matters. Because the outcome of litigation, arbitration and regulatory investigations is inherently difficult to predict, it is possible that the outcome of any of these matters could entail significant cost for us and harm our business. The fact that we operate in a significant number of international markets also increases the risk that we may face legal and regulatory exposures as we attempt to comply with a large number of varying legal and regulatory requirements. Any successful claim against us could significantly harm our business, financial condition and results of operations.
Item 1B. Unresolved Staff Comments.
None.
Item 2. Properties.
Hasbro owns its corporate headquarters in Pawtucket, Rhode Island consisting of approximately 343,000 square feet, which is used by corporate functions as well as the Consumer Products and Entertainment segments. The Company also owns an adjacent building consisting of approximately 23,000 square feet and leases a building in East Providence, Rhode Island consisting of approximately 120,000 square feet, both of which are used by corporate functions. The Company's significant leased properties include a facility in Providence, Rhode Island consisting of approximately 136,000 square feet which is used primarily by the Consumer Products segment, as well as the Entertainment and Corporate and Other segments. In addition, the Company leases warehouse space aggregating approximately 3,270,000 square feet in Georgia, California, Texas, Illinois and Quebec that are used by the Consumer Products segment. The Company leases approximately 95,000 square feet in Toronto and 80,000 square feet in Burbank, California that are used by the Entertainment segment. The Company also leases approximately 126,000 square feet in Renton, Washington as well as 25,000 square feet in Austin, Texas used primarily by the Wizards of the Coast and Digital Gaming segment for office space. The Corporate and Other segment leases an aggregate of 81,700 square feet of office and warehouse space in Hong Kong as well as 48,000 square feet of office space leased in the People’s Republic of China.
Outside of the properties listed above, the Company leases or owns property in over 35 countries. The primary international locations for facilities in the Consumer Products segment are in Australia, Brazil, France, Germany, Mexico, Spain, the People’s Republic of China, and the United Kingdom, all of which are comprised of both office and warehouse space. In addition, the Company also leases offices in Switzerland and the Netherlands which are primarily used for corporate functions.
The above properties consist, in general, of brick, cinder block or concrete block buildings which the Company believes are in good condition and well maintained.
The Company believes that its facilities are adequate for its needs at this time, although as part of its ongoing business it does periodically assess if alternate facilities to one or more of the facilities mentioned above would provide business advantages or if certain facilities could be consolidated. The Company believes that, should it not be able to renew any of the leases related to its leased facilities, it could secure similar substitute properties without a material adverse impact on its operations.
Item 3. Legal Proceedings.
The Company is currently party to certain legal proceedings, none of which we believe to be material to our business or financial condition.
Item 4. Mine Safety Disclosures.
None
PART II
Item 5. Market for Registrant’s Common Equity, Related Stockholder Matters and Issuer Purchases of Equity Securities.
The Company’s common stock, par value $0.50 per share (the “Common Stock”), is traded on The NASDAQ Global Select Market under the symbol “HAS”. As of February 16, 2023, there were approximately 7,470 shareholders of record of the Company’s Common Stock.
Our practice has been to pay dividends on a quarterly basis. The declaration of dividends is subject to the discretion of the Board of Directors and depends on various factors, including our net income, financial condition, cash requirements, future prospects and other relevant factors. On February 9, 2023, our Board declared a dividend of $0.70 per share, which is payable on May 15, 2023 to shareowners of record on May 1, 2023.
Issuer Repurchases of Common Stock
In May 2018, the Company announced that its Board of Directors authorized the repurchase of up to an additional $500 million in Common Stock. Purchases of the Company’s Common Stock may be made from time to time, subject to market conditions. These shares may be repurchased in the open market or through privately negotiated transactions. The Company has no obligation to repurchase shares under this authorization. The timing, actual number and value of the shares that are repurchased, if any, will depend on a number of factors, including the price of the Company’s stock and the Company's generation of, and uses for, cash.
Following the Company’s acquisition of eOne, the Company temporarily suspended its share repurchase program to prioritize deleveraging. During 2022, given the Company’s progress toward reducing debt, the Company resumed its share repurchase activity and repurchased approximately 1.4 million shares of Hasbro Common Stock in the open market during the second and third quarters at a total cost of $125.0 million and at an average price of $87.46 per share. There were no repurchases of the Company’s Common Stock in the first and fourth quarters of 2022. At December 25, 2022, Hasbro had $241.6 million remaining available under these share repurchase authorizations.
Item 6. Reserved
Item 7. Management’s Discussion and Analysis of Financial Condition and Results of Operations.
OBJECTIVE
Our objective within the following discussion is to provide an analysis of the Company’s Financial Condition, Cash Flows and Results of Operations from management's perspective, which should be read in conjunction with the Company’s audited consolidated financial statements and notes thereto, included in Part II, Item 8. Financial Statements, of this Annual Report on Form 10-K.
This Management’s Discussion and Analysis of Financial Condition and Results of Operations contains forward-looking statements concerning the Company’s expectations and beliefs. See “Statement Regarding Forward-Looking Statements” and Part I, Item 1A. Risk Factors, of this Form 10-K for a discussion of other uncertainties, risks and assumptions associated with these statements.
Unless otherwise specifically indicated, all dollar or share amounts herein are expressed in millions of dollars or shares, except for per share amounts.
EXECUTIVE SUMMARY
Hasbro is a global Branded Entertainment leader whose mission is to entertain and connect generations of fans through the wonder of storytelling and exhilaration of play. Hasbro is guided by our Purpose to create joy and community for all people around the world, one game, one toy, one story at a time. Hasbro delivers immersive brand experiences for global audiences through gaming, consumer products and entertainment.
Our portfolio of iconic brands includes MAGIC: THE GATHERING, DUNGEONS & DRAGONS, Hasbro Gaming, NERF, TRANSFORMERS, PLAY-DOH and PEPPA PIG, as well as premier partner brands. For the past decade, we have been consistently recognized for our corporate citizenship, including being named one of the 100 Best Corporate Citizens by 3BL Media and one of the World’s Most Ethical Companies by Ethisphere Institute.
Our strategic plan is centered around our Blueprint 2.0, a framework for bringing compelling and expansive brand experiences to consumers and audiences around the world. Our brands are story-led consumer franchises brought to life through a wide array of consumer products, digital gaming and compelling content offered across a multitude of platforms and media.
Hasbro generates revenue and earns cash across our Blueprint 2.0 by developing, marketing, licensing, distributing and selling products, play and entertainment experiences, based on our global brands as well as other IP in a broad variety of categories. This includes: the marketing and sale of toys and games, including our owned and partner brands, innovative gaming brands and role-playing and fantasy card collecting games, through retail stores, ecommerce platforms and Hasbro Direct, our direct-to-consumer platform; the distribution, license and sale of digital games developed internally, such as Magic: The Gathering Arena and other digital games based on our IP that is licensed to third parties. Additionally, the Company generates revenue though the development, production, distribution and sales of entertainment content as well as out-licensing our brands for uses in consumer products, such as apparel and publishing, and for use in theme park attractions, other forms of location-based entertainment and within formats such as film and TV programming. As we continue our Blueprint 2.0 transformation efforts focusing on fewer, bigger brands, we have begun out-licensing certain non-core brands which we believe may be more profitable through a licensing arrangement.
See Part I, Item 1. Business, and note 21 to the consolidated financial statements included in Part II, Item 8. Financial Statements, of this Form 10-K for further information on our reportable segments.
The impact of changes in foreign currency exchange rates used to translate the consolidated statements of operations is quantified by translating the current period revenues at the prior period exchange rates and comparing this amount to the prior period reported revenues. The Company believes that the presentation of the impact of changes in exchange rates, which are beyond the Company’s control, is helpful to an investor’s understanding of the performance of the underlying business.
During each of the periods presented in this Form 10-K there were significant charges and benefits incurred which impacted operating results. These charges are detailed below in the Summary of Financial Performance.
2022 highlights
•Net revenues of $5,856.7 million decreased 9% from $6,420.4 million in 2021. The decline in net revenues includes an unfavorable foreign currency translation of $166.3 million.
◦Net revenues in the Consumer Products segment decreased 10% to $3,572.5 million; Wizards of the Coast and Digital Gaming segment increased 3% to $1,325.1 million; and Entertainment segment net revenues decreased 17% to $959.1 million.
◦TV/Film/Entertainment portfolio net revenues decreased 17%; Hasbro Gaming net revenues decreased 13%; Emerging Brands net revenues decreased 12%; Partner Brands net revenues decreased 9%; and Franchise Brands net revenues decreased 4%.
◦Hasbro’s total gaming portfolio, including the Hasbro Gaming portfolio as reported above, and all other gaming revenue, most notably MAGIC: THE GATHERING and MONOPOLY, totaled $2.0 billion, a decrease of 5%.
•Operating profit was $407.7 million, or 7.0% of net revenues in 2022 compared to operating profit of $763.3 million, or 11.9% of net revenues in 2021.
◦Operating Profit in the Wizards of the Coast and Digital Gaming segment decreased 2% to $538.3 million; Consumer Products segment decreased 46% to $217.3 million; Entertainment segment increased >100% to $22.7 million; and Corporate and Other operating losses increased >100% to $370.6 million.
•Net earnings attributable to Hasbro, Inc. declined in 2022 to $203.5 million, or $1.46 per diluted share, compared to $428.7 million, or $3.10 per diluted share in 2021.
2021 highlights
•Net revenues of $6,420.4 million increased 17% from $5,465.4 million in 2020. The increase in net revenues includes a favorable foreign currency translation of $54.7 million.
◦Net revenues in the Consumer Products segment increased 9% to $3,981.6 million; Wizards of the Coast and Digital Gaming segment increased 42% to $1,286.6 million; and Entertainment segment net revenues increased 27% to $1,152.2 million.
◦Emerging Brands net revenues increased 22%; TV/Film/Entertainment portfolio net revenues increased 24%; Franchise Brands net revenues increased 23%; Partner Brands net revenues increased 8%; and Hasbro Gaming net revenues increased 4%.
◦Hasbro’s total gaming portfolio, including the Hasbro Gaming portfolio as reported above, and all other gaming revenue, most notably MAGIC: THE GATHERING and MONOPOLY, increased 19%, and totaled $2,098.9 million.
•Operating profit was $763.3 million, or 11.9% of net revenues in 2021 compared to operating profit of $501.8 million, or 9.2% of net revenues in 2020.
◦Operating Profit in the Wizards of the Coast and Digital Gaming segment increased 30% to $547.0 million; Consumer Products segment increased 30% to $401.4 million; Entertainment segment operating losses decreased 35% to $91.8 million and Corporate and Other operating losses increased 9% to $93.3 million.
•Net earnings attributable to Hasbro, Inc. increased in 2021 to $428.7 million, or $3.10 per diluted share, compared to $222.5 million, or $1.62 per diluted share in 2020.
Summary of Financial Performance
A summary of the Company’s results of operations for 2022, 2021 and 2020 is illustrated below.
| | | | | | | | | | | | | | | | | |
| 2022 | | 2021 | | 2020 |
| Net revenues | $ | 5,856.7 | | | $ | 6,420.4 | | | $ | 5,465.4 | |
| Operating profit | 407.7 | | | 763.3 | | | 501.8 | |
| Earnings before income taxes | 261.5 | | | 581.9 | | | 322.1 | |
| Net earnings | 203.0 | | | 435.3 | | | 225.4 | |
| Net (loss) earnings attributable to noncontrolling interests | (0.5) | | | 6.6 | | | 2.9 | |
| Net earnings attributable to Hasbro, Inc. | 203.5 | | | 428.7 | | | 222.5 | |
| Diluted earnings per share | 1.46 | | | 3.10 | | | 1.62 | |
Results of Operations — Consolidated
The fiscal years ended December 25, 2022, December 26, 2021 and December 27, 2020 were each fifty-two week periods.
Net earnings attributable to Hasbro, Inc. decreased to $203.5 million for the fiscal year ended December 25, 2022 compared to $428.7 million for the fiscal year ended December 26, 2021, and were $222.5 million for the fiscal year ended December 27, 2020.
Diluted earnings per share attributable to Hasbro, Inc. were $1.46 in 2022, $3.10 in 2021 and $1.62 in 2020.
Net earnings and diluted earnings per share attributable to Hasbro, Inc. for each fiscal year in the three years ended December 25, 2022 include certain charges and benefits as described below.
2022
•In association with the Company's strategic review and subsequent Blueprint 2.0 strategy shift to focus on fewer, bigger brands, the Company incurred net charges of $253.0 million consisting of the following:
◦Net asset impairments and other net charges of $231.9 million, or $1.67 per diluted share, of which $215.2 million, or $1.55 per diluted share relates to the partial impairment of the Company's definite-lived Power Rangers intangible asset, $12.4 million, or $0.09 per diluted share, of incurred incremental asset charges related to product cancellations, consisting of inventory and asset write offs, and $4.3 million, or $0.03 per diluted share, of strategy-related asset impairments due to the cancellation of certain projects primarily within the Entertainment segment; and
◦A net loss on disposal of business of $21.1 million, or $0.15 per diluted share, comprised of a non-cash goodwill impairment loss of $11.8 million and other asset impairments of $9.3 million, related to the exit of non-core businesses within the Entertainment segment.
•In support of Blueprint 2.0, Hasbro announced an Operational Excellence program designed to deliver $250-$300 million in annualized run-rate cost savings by year-end 2025. In association with this program the Company incurred net charges of $89.2 million comprised of the following:
◦Net severance expense and other employee charges of $79.8 million, or $0.57 per diluted share, associated with cost-savings initiatives across the Company; and
◦Net charges of $9.4 million, or $0.07 per diluted share, of program related consultant and transformation office expenses.
•In association with the Company's acquisition of eOne, the Company incurred related expenses of $72.3 million, comprised of the following:
◦Net expenses of $59.4 million, or $0.43 per diluted share, of incremental intangible amortization costs related to the intangible assets acquired in the eOne acquisition; and
◦A net charge of $12.9 million, or $0.09 per diluted share, of stock based compensation expenses.
2021
•A net charge of $116.1 million, or $0.84 per diluted share, comprised of a non-cash goodwill impairment charge of $108.8 million and transaction expenses of $7.3 million, associated with the closing of the sale of eOne's music business (e-One Music). The goodwill impairment charge of $108.8 million is based on revalued assets and liabilities of eOne Music as of the second quarter of 2021 and finalized closing working capital adjustments made during the fourth quarter 2021.
•In association with the Company's acquisition of eOne, the Company incurred related expenses of $77.0 million, comprised of the following:
◦Net expenses of $70.4 million, or $0.51 per diluted share, of incremental intangible amortization costs related to the intangible assets acquired in the eOne acquisition; and
◦A net charge of $6.6 million, or $0.05 per diluted share, of stock based compensation expenses.
•Charges of $20.9 million, or $0.15 per diluted share, of additional stock compensation expense due to the contractual accelerated vesting of certain equity awards following the passing of the Company's former CEO in the fourth quarter of 2021.
•A net impairment charge of $41.3 million, or $0.30 per diluted share, associated with Hasbro's investment in the Discovery Family Channel, due to the impact of accelerating changes in the cable distribution industry. This charge was comprised of a pre-tax impairment of the investment held in Discovery of $74.1 million, which resulted in a pre-tax reduction to the Company’s Discovery option agreement liability of $20.1 million. See note 7 to the consolidated financial statements included in Part II, Item 8. Financial Statements, of this Form 10-K for further information on the Company’s Discovery option.
•A net charge of $39.4 million or $0.28 per diluted share of income tax expense as a result of revaluation of Hasbro’s UK tax attributes in accordance with the Finance Act of 2021 enacted by the United Kingdom on June 10, 2021. Effective April 1, 2023, the law increases the corporate income tax rate to 25% from 19%.
2020
•In association with the Company's acquisition of eOne, the Company incurred related expenses of $269.3 million, comprised of the following:
◦A net charge of $188.6 million, or $1.37 per diluted share, of acquisition and related costs; and
◦Net expenses of $80.7 million, or $0.59 per diluted share, of incremental intangible amortization costs related to the intangible assets acquired in the eOne acquisition.
•A net charge of $7.4 million, or $0.05 per diluted share, of severance charges associated with cost-savings initiatives within the Company's commercial and Music businesses.
•A net charge of $15.4 million, or $0.11 per diluted share, of income tax expense as a result of revaluation of Hasbro’s UK tax attributes in accordance with the Finance Act of 2020 enacted by the United Kingdom on July 22, 2020. Retroactive to April 1, 2020, the new law maintains the corporate income tax rate at 19% instead of the planned reduction to 17% that was previously enacted in the UK Finance Act of 2016.
Consolidated net revenues for the year ended December 25, 2022 declined 9% to $5,856.7 million from $6,420.4 million for the year ended December 26, 2021 and include an unfavorable foreign currency translation impact of $166.3 million as the result of foreign currency declines against the US dollar across the Company's regions.
Consolidated net revenues for the year ended December 26, 2021 grew 17% to $6,420.4 million from $5,465.4 million for the year ended December 27, 2020 and included a favorable foreign currency translation impact of $54.7 million.
The following table presents net revenues expressed in millions of dollars, by brand portfolio for each year in the three years ended December 25, 2022.
| | | | | | | | | | | | | | | | | |
| 2022
Net Revenues | %
Change | 2021
Net Revenues | %
Change | 2020
Net Revenues |
| Franchise Brands | $ | 2,830.6 | | -4 | % | $ | 2,955.6 | | 23 | % | $ | 2,394.3 | |
| Partner Brands | 1,052.0 | | -9 | % | 1,161.0 | | 8 | % | 1,079.4 | |
| Hasbro Gaming | 743.3 | | -13 | % | 851.4 | | 4 | % | 814.8 | |
| Emerging Brands | 402.1 | | -12 | % | 454.7 | | 22 | % | 372.2 | |
| TV/Film/Entertainment | 828.7 | | -17 | % | 997.7 | | 24 | % | 804.7 | |
Brand portfolio net revenues for the years ended December 26, 2021 and December 27, 2020 have been restated to reflect the elevation of PEPPA PIG from Emerging Brands to Franchise Brands, effective for the first quarter of 2022. As a result, net revenues of $162.9 million and $108.2 million, respectively, were reclassified from Emerging Brands to Franchise Brands.
2022 versus 2021
Net revenues declined in all brand portfolios in 2022 compared to 2021.
Franchise Brands: The Franchise Brands portfolio net revenues decreased 4% in 2022 compared to 2021. Higher net revenues from MAGIC: THE GATHERING products, due to record sales from set releases that include: Kamigawa: Neon Dynasty, Commander Legends: Battle for Baldur's Gate, Double Masters, Dominaria United, Streets of New Capenna and The Brothers War, reflected momentum in the brand, elevating MAGIC: THE GATHERING to the Company's first billion-dollar brand. In addition, the Franchise Brands portfolio benefited from higher sales of PEPPA PIG products, driven by the third quarter 2021 launch of the Company's first line of PEPPA PIG product line and higher sales of PLAY-DOH products. These net revenue increases were offset by lower net revenues from NERF and MONOPOLY products and to a lesser extent, lower net revenues from TRANSFORMERS and BABY ALIVE products.
Partner Brands: The Partner Brands portfolio net revenues declined 9% in 2022 compared to 2021. Within the Partner Brands portfolio, there are a number of brands which are reliant on related entertainment, including movie and television releases. As such, net revenues fluctuate from year-to-year by brand, depending on entertainment popularity, release dates and the success of related product line offerings. Historically these entertainment-based brands experience higher revenues during years in which major films or television programming is released.
In 2022, Partner Brands net revenue declines were driven by lower sales of the Company's products for DISNEY FROZEN and DISNEY PRINCESS as the related license neared the end of its term, lower sales of BEYBLADE products, and to a lesser extent, lower sales of GHOSTBUSTERS products. These net revenue decreases were partially offset by higher net revenues from the Company's products for MARVEL, led by momentum in the SPIDER-MAN franchise which benefited from entertainment releases including the children’s animated television series, Marvel's Spidey and His Amazing Friends as well as Marvel Studios' Spider-Man: No Way Home, released in December 2021. The Company's products for Marvel's AVENGERS benefited from the release of Marvel Studios' Doctor Strange in the Multiverse of Madness in May 2022 and the July 2022 release of Thor: Love and Thunder, while the Company's products for BLACK PANTHER were supported by the November 2022 release of Black Panther: Wakanda Forever. To a lesser extent, net revenues from the Company's line of STAR WARS products increased as a result of continued STAR WARS entertainment released on Disney+. In addition, Partner Brands net revenues benefited from the introduction of the Company's line of FORTNITE action figures during 2022.
Hasbro Gaming: The Hasbro Gaming portfolio net revenues declined 13% in 2022 compared to 2021 driven primarily by lower net revenues from the Dungeons & Dragons: Dark Alliance digital game launched during the second quarter 2021 with no comparable release in 2022, as well as lower net revenues from JENGA, LIFE and certain other Hasbro Gaming products. These decreases were partially offset by higher net revenues from AVALON HILL'S HeroQuest products during 2022.
Net revenues for Hasbro’s total gaming category, including the Hasbro Gaming portfolio as reported above, and all other gaming revenue, most notably MAGIC: THE GATHERING and MONOPOLY, which are included in the Franchise Brands portfolio, totaled $1,997.5 million in 2022, a decrease 5%, from $2,098.9 million in 2021.
Emerging Brands: The Emerging Brands portfolio net revenues declined 12% in 2022 compared to 2021 primarily driven by FURREAL FRIENDS and PJ MASKS products and to a lesser extent, core PLAYSKOOL and POTATO HEAD products.
TV/Film/Entertainment: Net revenues from the TV/Film/Entertainment portfolio declined 17% in 2022 compared to 2021. Lower net revenues in 2022 were driven by the sale of eOne Music during the third quarter of 2021, which represented $65.2 million or 6% of TV, Film and Entertainment portfolio net revenues during 2021. In addition to the sale of eOne Music, net revenue declines in 2022 were driven by the lower number of film deliveries in 2022 compared to 2021 due to timing shifts of certain films into 2023, and to a lesser extent, lower unscripted television deliveries in 2022. These decreases were partially offset by higher net revenues from scripted production deliveries, most notably, Cruel Summer season two, The Rookie seasons four and five and The Rookie: Feds season one.
2021 versus 2020
Net revenues grew in all brand portfolios in 2021 compared to 2020.
Franchise Brands: The Franchise Brands portfolio net revenues increased 23% in 2021 compared to 2020. The majority of the 2021 increase was driven by higher net revenues from MAGIC: THE GATHERING products, as a result of successful card sets released throughout the year, including multiple record setting releases and higher digital gaming net revenues from Magic: The Gathering Arena. To a lesser extent, higher net revenues from NERF products, most notably in the US, higher net revenues from PEPPA PIG products following the Company's launch of its first PEPPA PIG product line during the second half of 2021, higher net revenues from the MY LITTLE PONY brand, due to the release of the film My Little Pony: A New Generation and the launch of the associated product line contributed to the increase. In addition to these increases were higher net revenues from TRANSFORMERS products supported by the release of the final chapter of the animated television series trilogy, Transformers: War For Cybertron in July 2021 and higher net revenues from PLAY-DOH products.
Partner Brands: The Partner Brands portfolio net revenues increased 8% in 2021 compared to 2020. Net revenue increases from the Company's products for MARVEL, DISNEY PRINCESS and STAR WARS drove growth in the Partner Brands portfolio, and to a lesser extent, GHOSTBUSTERS products contributed to net revenue growth during 2021. The Company's products for MARVEL benefited from fan support, primarily in the U.S., across multiple properties including MARVEL LEGENDS, as well as from entertainment releases including the theatrical release of Spider-Man: No Way Home in December 2021, the launch of the preschool product line supporting the children’s animated television series, Spidey and His Amazing Friends, and by the introduction of products supported by the theatrical release of Shang-Chi and the Legend of the Ten Rings which premiered in September 2021. The Company's products for DISNEY PRINCESS and STAR WARS benefited throughout 2021 from supporting entertainment, including; Disney's Raya and the Last Dragon, which premiered in March 2021; the Disney Princess film library, available for streaming on Disney+; and the Disney+ streaming series Star Wars: The Mandalorian, season two.
These increases were partially offset by net revenue declines from DISNEY FROZEN and TROLLS products in 2021 compared to 2020, as a result of entertainment support in the prior year from the November 2019 theatrical release of Disney’s Frozen 2 and the Trolls World Tour film, released in April 2020.
Hasbro Gaming: The Hasbro Gaming portfolio net revenues increased 4% in 2021 compared to 2022. Higher net revenues from DUNGEONS & DRAGONS products and digital game and to a lesser extent, higher net revenues from DUEL MASTERS products and several other Hasbro Gaming brands, were partially offset by lower net revenues from JENGA, OPERATION and certain other Hasbro Gaming products. During 2020, due in part to the onset of the COVID-19 pandemic, the Hasbro Gaming portfolio experienced accelerated growth in sales of games, as families were playing more games while at home.
Net revenues for Hasbro’s total gaming category, including the Hasbro Gaming portfolio as reported above, and all other gaming revenue, most notably MAGIC: THE GATHERING and MONOPOLY, which are included in the Franchise Brands portfolio, totaled $2,098.9 million in 2021, a decrease 19%, from $1,763.8 million in 2020.
Emerging Brands: The Emerging Brands portfolio net revenues grew 22% in 2021 compared to 2020. Net revenue increases were primarily driven by the Company's launch of its first PJ MASKS products during the second half of 2021, as well as demand for certain fan-oriented products.
TV/Film/Entertainment: During 2021, net revenues from the TV/Film/Entertainment portfolio grew 24% compared to 2020. The shutdown of live action TV and film productions and theatrical releases, beginning late in the first quarter of 2020 as a result of the COVID-19 pandemic, had a significant impact on entertainment deliveries during the
second half of 2020 and into 2021. However, the Company's production studios were back to operating at pre-pandemic levels across all businesses by mid-2021.
The drivers of the net revenue increase during 2021 include higher scripted television production deliveries, most notably from Yellowjackets, Cruel Summer and The Rookie television series. In addition to these increases were higher deliveries from eOne's slate of unscripted programming, as well as higher film production revenues from 2021 releases that include Clifford the Big Red Dog, Come From Away and Finch. These increases were partially offset by lower 2021 film distribution revenues overall, due to the gap in available entertainment deliveries as described above, compared to 2020 which had a higher number of successful films which were released pre-pandemic.
SEGMENT RESULTS
The summary that follows provides a discussion of the results of operations of our four reportable segments: Consumer Products, Wizards of the Coast & Digital Gaming, Entertainment and Corporate and Other.
Net Revenues
The table below illustrates net revenues expressed in millions of dollars, derived from our principal operating segments in 2022, 2021 and 2020.
| | | | | | | | | | | | | | | | | |
| 2022
Net Revenues | %
Change | 2021
Net Revenues | %
Change | 2020
Net Revenues |
| Consumer Products | $ | 3,572.5 | | -10 | % | $ | 3,981.6 | | 9 | % | $ | 3,649.6 | |
| Wizards of the Coast & Digital Gaming | 1,325.1 | | 3 | % | 1,286.6 | | 42 | % | 906.7 | |
| Entertainment | 959.1 | | -17 | % | 1,152.2 | | 27 | % | 909.1 | |
Consumer Products Segment
The following table presents the Consumer Products segment net revenues by major geographic region for each fiscal year in the three years ended December 25, 2022.
| | | | | | | | | | | | | | | | | | | | | | | | | | | | | |
| 2022
Net Revenues | | %
Change | | 2021
Net Revenues | | %
Change | | 2020
Net Revenues |
| North America | $ | 2,064.8 | | | -11 | % | | $ | 2,315.9 | | | 9 | % | | $ | 2,116.2 | |
| Europe | 899.5 | | | -16 | % | | 1,067.7 | | | 8 | % | | 989.2 | |
| Asia Pacific | 293.4 | | | -5 | % | | 310.1 | | | 5 | % | | 295.6 | |
| Latin America | 314.8 | | | 9 | % | | 287.9 | | | 16 | % | | 248.6 | |
| Net Revenues | $ | 3,572.5 | | | -10 | % | | $ | 3,981.6 | | | 9 | % | | $ | 3,649.6 | |
2022 versus 2021
Consumer Products segment net revenues declined 10% in 2022 compared to 2021 and included the impact of an unfavorable $117.5 million foreign currency translation, most notably from the Company's European markets, and to a lesser extent, the Company's Asia Pacific and Latin American markets. Segment net revenues declined in all brand portfolios including Franchise Brands, Partner Brands and to a lesser extent, Hasbro Gaming and Emerging Brands during 2022 compared to 2021.
In addition to the unfavorable foreign exchange, the drivers of the net revenue decrease include lower sales of NERF, MONOPOLY, TRANSFORMERS and BABY ALIVE products, lower sales of the Company's products for DISNEY PRINCESS and DISNEY FROZEN as the related license neared the end of its term and lower sales of BEYBLADE products. In addition, lower sales of Hasbro Gaming products, primarily from the Company's tabletop gaming brands such as JENGA, LIFE and certain other Hasbro Gaming brands and lower net revenues from FURREAL FRIENDS products contributed to the decrease. These net revenue decreases were partially offset by higher sales of PEPPA PIG and PLAY-DOH products, and higher sales of the Company's products for MARVEL and STAR WARS products. Overall segment net revenue declines were primarily attributable to the challenging consumer discretionary environment in North America and to a lesser extent, the Company's European markets during 2022.
2021 versus 2020
Consumer Products segment net revenues increased 9% in 2021 compared to 2020 and included the impact of a favorable $23.8 million foreign currency translation. Segment net revenues increased from growth in Franchise Brands, Emerging Brands and, to a lesser extent, Partner Brands and were partially offset by lower net revenues from the Hasbro Gaming portfolio.
The drivers of the net revenue increase include higher sales of NERF products, higher sales of TRANSFORMERS products as well as higher sales of the Company's Partner Brands for MARVEL and DISNEY PRINCESS, which were supported by recent entertainment releases. Also contributing to the increase were higher sales of PEPPA PIG and PJ MASKS products, following the launch of the Company's own product lines for these brands during the second half of 2021. Partially offsetting these increases were lower sales of certain Partner Brands, notably, the Company's products for DISNEY FROZEN and TROLLS. Revenue grew across all geographic regions in 2021, most notably in the U.S. and Europe, and to a lesser extent, in the Company's Latin American and Asia Pacific markets.
Wizards of the Coast and Digital Gaming Segment
The following table presents Wizards of the Coast and Digital Gaming segment net revenues by category for each fiscal year in the three years ended December 25, 2022.
| | | | | | | | | | | | | | | | | | | | | | | | | | | | | |
| 2022
Net Revenues | | %
Change | | 2021
Net Revenues | | %
Change | | 2020
Net Revenues |
| Tabletop Gaming | $ | 1,067.0 | | | 12 | % | | $ | 950.6 | | | 44 | % | | $ | 659.6 | |
| Digital and Licensed Gaming | 258.1 | | | -23 | % | | 336.0 | | | 36 | % | | 247.1 | |
| Net Revenues | $ | 1,325.1 | | | 3 | % | | $ | 1,286.6 | | | 42 | % | | $ | 906.7 | |
2022 versus 2021
Wizards of the Coast and Digital Gaming segment net revenues increased 3% in 2022 compared to 2021 and included the impact of an unfavorable $27.9 million foreign currency translation. The net revenue increase in the Wizards of the Coast and Digital Gaming segment was attributable to higher net revenues from Wizards of the Coast tabletop gaming products, most notably, MAGIC: THE GATHERING, which has become the Company's first billion-dollar brand, driven by the number of strong performing card set releases in 2022. In total, 81% of segment net revenues were attributable to Wizards of the Coast tabletop games during 2022. The increase tabletop gaming net revenues was partially offset by lower digital and licensed gaming net revenues, primarily from Magic: The Gathering Arena and from Dungeons & Dragons: Dark Alliance, launched during the first half of 2021 and to a lesser extent, lower net revenues from certain other of the Company's licensed digital games during 2022.
2021 versus 2020
In 2021, net revenues from the Wizards of the Coast and Digital Gaming segment increased 42% compared to 2020 and included the impact of a favorable $10.7 million foreign currency translation. The net revenue increase was attributable to higher net revenues from Wizards of the Coast tabletop and digital gaming products, most notably, MAGIC: THE GATHERING, driven by the number of strong performing card set releases, and from DUNGEONS & DRAGONS and to a lesser extent, DUEL MASTERS tabletop games. In total, 74% of segment net revenues were attributable to Wizards of the Coast tabletop games. In addition to these increases were higher digital gaming sales from Magic: The Gathering Arena, including the launch on mobile, and net revenue contributions associated with the launch of Dungeons & Dragons: Dark Alliance during the second quarter 2021, as well as growth in certain other of the Company's licensed digital games.
Entertainment Segment
The following table presents Entertainment segment net revenues by category for each fiscal year in the three years ended December 25, 2022.
| | | | | | | | | | | | | | | | | | | | | | | | | | | | | |
| 2022
Net Revenues | | %
Change | | 2021
Net Revenues | | %
Change | | 2020
Net Revenues |
| Film and TV | $ | 837.6 | | | -10 | % | | $ | 932.5 | | | 33 | % | | $ | 700.5 | |
| Family Brands | 79.4 | | | -40 | % | | 132.9 | | | 54 | % | | 86.5 | |
| Music and Other | 42.1 | | | -51 | % | | 86.8 | | | -29 | % | | 122.1 | |
| Net Revenues | $ | 959.1 | | | -17 | % | | $ | 1,152.2 | | | 27 | % | | $ | 909.1 | |
*Music and Other category net revenues for the periods ended December 26, 2021 and December 27, 2020 include $65.2 million and $116.7 million, respectively, from eOne Music, which was sold by the Company early in the third fiscal quarter of 2021.
2022 versus 2021
Entertainment segment net revenues declined 17% in 2022 compared to 2021 and included the impact of an unfavorable $21.0 million foreign currency translation. The segment net revenue decrease primarily reflects the number of major film deliveries compared to 2021 where films such as Clifford The Big Red Dog, Mrs. Harris Goes to Paris and Come From Away were delivered, without a comparable number of major film deliveries in 2022, as well as lower net revenues from streaming content sales compared to 2021, which benefited from the September 2021 release of My Little Pony: A New Generation. To a lesser extent, lower transactional net revenues and lower net revenues from unscripted television deliveries compared to 2021 contributed to the decline. These decreases were partially offset by higher scripted television deliveries that include The Rookie seasons four and five, Cruel Summer season two, The Rookie: Feds season one and Yellowjackets season two.
2021 versus 2020
Entertainment segment net revenues grew 27% in 2021 compared to 2020 and included the impact of a favorable $20.1 million foreign currency translation. The segment net revenue increase was primarily driven by higher scripted programming and film production deliveries and to a lesser extent, increased deliveries of unscripted programming following the return of live-action entertainment production in late 2020 and throughout 2021. Also contributing to the increase were higher Family Brands net revenues from streaming content deals related to programming featuring the Company's brands, such as the Netflix release of My Little Pony: A New Generation. These increases were partially offset by the sale of the eOne Music business during the third quarter of 2021 and from lower film distribution revenues in 2021.
Operating Profit (Loss)
The table below illustrates operating profit expressed in millions of dollars and operating profit margins, derived from our principal operating segments in 2022, 2021 and 2020. For a reconciliation of segment operating profit to total Company operating profit, see note 21 to our consolidated financial statements which are included in Part II, Item 8. Financial Statements, of this Form 10-K.
| | | | | | | | | | | | | | | | | | | | | | | | | | |
| 2022 | % Net
Revenues | %
Change | 2021 | % Net
Revenues | %
Change | 2020 | % Net
Revenues |
| Consumer Products | $ | 217.3 | | 6.1 | % | -46 | % | $ | 401.4 | | 10.1 | % | 30 | % | $ | 308.1 | | 8.4 | % |
| Wizards of the Coast & Digital Gaming | 538.3 | | 40.6 | % | -2 | % | 547.0 | | 42.5 | % | 30 | % | 420.4 | | 46.4 | % |
| Entertainment | 22.7 | | 2.4 | % | >100% | (91.8) | | -8.0 | % | 35 | % | (141.1) | | -15.5 | % |
| Corporate and Other | (370.6) | | n/a | >100% | (93.3) | | n/a | -8 | % | (85.6) | | n/a |
| Total | 407.7 | | | | 763.3 | | | | 501.8 | | |
Effective for the first quarter of 2022, intangible amortization costs related to the intangible assets acquired in the eOne acquisition have been allocated between the Consumer Products and Entertainment segments to match the revenue generated from such intangible assets. In 2021 and 2020, comparable intangible amortization costs were recorded within the Entertainment segment.
Consumer Products Segment
2022 versus 2021
Consumer Products segment operating profit decreased $184.1 million to $217.3 million in 2022, compared to $401.4 million in 2021. Operating profit margin decreased to 6.1% of net revenues in 2022 from 10.1% of net revenues in 2021.
As noted above, to align with the revenue generated from the assets acquired in the eOne acquisition, Consumer Products segment operating profit in 2022 includes $37.7 million of incremental intangible asset amortization costs. In 2021, comparable costs were reported in the Entertainment segment results. Additionally, in connection with the Company's Blueprint 2.0 strategy shift, Consumer Products segment operating profit includes charges of $14.9 million of incremental asset charges related to product cancellations, consisting of inventory and asset write offs related to the Company's plans to focus on fewer, bigger brands. The remaining operating profit decrease in 2022 was driven by lower net revenues and higher sales allowances and obsolescence charges, as well as higher levels of closeout sales and warehousing costs associated with higher inventory levels. These negative effects were partially offset by the impact of the expiration of certain Consumer Products licensing agreements acquired through the eOne acquisition, which carried higher royalty expenses in prior periods and higher net revenues from licensing agreements related to certain of the Company's Franchise Brands, most notably TRANSFORMERS. In addition to these benefits were savings realized from the Company’s operational excellence program within cost of sales and distribution expense, price increases implemented in 2022 combined with lower product development costs, lower advertising and promotion expenses, and lower incentive compensation.
2021 versus 2020
Consumer Products segment operating profit increased $93.3 million to $401.4 million in 2021, compared to $308.1 million in 2020. Operating profit margin increased to 10.1% of net revenues in 2021 from 8.4% of net revenues in 2020. The increase in segment operating profit and profit margin was driven by higher segment net revenues as a result of increased sales volumes, product price increases and lower sales allowances and obsolescence charges. These benefits were partially offset by higher freight costs, increased royalty expenses from higher sales of the Company's Partner Brand products and higher advertising costs in support of the sales increase within the segment.
Wizards of the Coast and Digital Gaming Segment
2022 versus 2021
Wizards of the Coast and Digital Gaming segment operating profit decreased $8.7 million to $538.3 million in 2022, compared to $547.0 million in 2021. Operating profit margin decreased to 40.6% in 2022 from 42.5% in 2021. The decrease in segment operating profit in 2022 was the result of higher inventory costs and higher product development costs as we continue to invest in tabletop and digital gaming initiatives and talent to support long-term growth within the segment, as well as higher royalty expense due to the growth of MAGIC: THE GATHERING UNIVERSES BEYOND. These increases were partially offset by lower administrative expenses, including lower incentive compensation expenses and lower advertising expense and depreciation costs compared to 2021, where the Company incurred higher costs associated with the launch of the mobile version of Magic: The Gathering Arena and Dungeons & Dragons: Dark Alliance.
2021 versus 2020
Wizards of the Coast and Digital Gaming segment operating profit increased $126.6 million to $547.0 million in 2021, compared to $420.4 million in 2020. Operating profit margin was 42.5% in 2021 compared to 46.4% in 2020. The increase in segment operating profit in 2021 is due to higher net revenue volumes, partially offset by higher product development costs and higher advertising and marketing costs in support of segment digital gaming initiatives and tabletop set releases, as well as increased administrative expenses, including digital game depreciation expense and personnel costs. The decrease in segment operating profit margin is primarily due to higher expenses associated with the support of certain digital gaming initiatives and tabletop set releases during 2021.
Entertainment Segment
2022 versus 2021
Entertainment segment operating profit was $22.7 million, or 2.4% of segment net revenues in 2022, compared to operating losses of $91.8 million, or -8.0% of segment net revenues in 2021.
The improved operating results in 2022 were driven primarily by the non-cash impairment charge of $108.8 million in 2021 associated with the sale of eOne Music, the allocation of $37.7 million of intangible asset amortization costs to the Consumer Products segment during 2022, as well as lower royalty expenses and lower advertising expense attributable to the lower number of film releases compared to 2021. These impacts to segment operating results were partially offset by a loss on disposal of assets of $22.1 million and asset impairment charges of $4.1 million related to the Company's Blueprint 2.0 strategy to exit non-core businesses, the impact of the sale of the eOne Music business during 2021 described above and higher program amortization costs in proportion to entertainment revenues related to the mix of programming delivered in 2022.
2021 versus 2020
Entertainment segment operating losses were $91.8 million, or 8.0% of segment net revenues in 2021, compared to operating losses of $141.1 million, or 15.5% of segment net revenues in 2020.
The 2021 results were negatively impacted by a non-cash impairment charge of $108.8 million associated with the sale of eOne Music and $85.0 million of intangible amortization costs related to the intangible assets acquired in the eOne acquisition. The 2020 results were impacted by $133.2 million of acquisition and related costs including expense associated with the acceleration of eOne stock-based compensation and advisor fees settled at closing of the acquisition, as well as integration costs and impairment charges for certain definite-lived intangible and production assets acquired through the eOne acquisition; combined with $97.9 million of intangible amortization costs related to the intangible assets acquired in the eOne acquisition. Absent these charges, the 2021 results reflect increased deliveries compared to 2020, offset by higher content amortization and increased compensation expense.
Corporate and Other Segment
In the Corporate and Other segment, the operating losses were $370.6 million in 2022 compared to operating losses of $93.3 million in 2021 and operating losses of $85.6 million in 2020.
The Corporate and Other segment operating losses during 2022 were primarily related to impairment charges of $281.0 million related to the Company's Power Rangers intangible asset, severance charges of $94.1 million and transformation office and consultant fees of $12.3 million associated with Company's Blueprint 2.0 strategy shift and operational excellence program related cost-savings initiatives described above, as well as $14.6 million of expense associated with retention awards granted in connection with the eOne acquisition. These operating loss increases were partially offset by lower incentive compensation, royalty expenses and lower advertising costs.
Segment operating losses in 2021 were primarily driven by stock compensation expense of $20.9 million associated with the contractual accelerated vesting of certain equity awards as a result of the passing of the Company's former CEO, higher administrative expenses and advertising costs; including $9.5 million of transaction costs associated with the sale of eOne Music and higher compensation expense as well as retention costs of $7.6 million in relation to the eOne acquisition.
The Corporate and Other operating loss in 2020 was driven by charges related to the eOne acquisition; including acquisition and integration costs of $32.8 million and restructuring costs of $52.6 million, including impairment charges for certain definite-lived intangible assets driven by the change in strategy for the combined company’s entertainment assets. In addition to the charges associated with the eOne acquisition, the Company incurred $8.5 million of severance charges associated with cost-savings initiatives within the Company’s commercial and Film and TV businesses.
OPERATING COSTS AND EXPENSES
The Company’s operating expenses, stated as percentages of net revenues, are illustrated below for the fiscal years ended December 25, 2022, December 26, 2021 and December 27, 2020:
| | | | | | | | | | | |
| 2022 | 2021 | 2020 |
| Cost of sales | 32.6 | % | 30.0 | % | 31.5 | % |
| Program cost amortization | 9.5 | | 9.8 | | 7.1 | |
| Royalties | 8.4 | | 9.7 | | 10.4 | |
| Product development | 5.3 | | 4.9 | | 4.7 | |
| Advertising | 6.6 | | 7.9 | | 7.6 | |
| Amortization of intangibles | 1.8 | | 1.8 | | 2.6 | |
| Selling, distribution and administration | 28.4 | | 22.3 | | 22.9 | |
| Loss on disposal of business | 0.4 | | 1.7 | | — | |
| Acquisition and related costs | — | | — | | 4.0 | |
Operating expenses for 2022, 2021 and 2020 include benefits and expenses related to the following events:
2022
•During 2022, in association with actions taken following the Company's strategic review and subsequent Blueprint 2.0 strategy shift to focus on fewer, bigger brands, the Company incurred:
◦Asset impairments and charges of $300.3 million of which $281.0 relates to the partial impairment of the Company's definite-lived Power Rangers intangible asset recorded in Selling, Distribution and Administration within the Corporate and Other segment, $14.9 million of incurred incremental asset charges recorded within Cost of Sales related to product cancellations, consisting of inventory and asset write offs within the Consumer Products segment, and $4.4 million of strategy related asset impairments recorded within Program Cost Amortization, due to the cancellation of certain projects within the Entertainment segment; and
◦Charges of $22.1 million comprised of a non-cash goodwill impairment loss of $11.8 million and other asset impairments of $10.3 million related to the exit of non-core businesses within the Entertainment segment, included in Loss on Disposal of Business.
•In support of Blueprint 2.0, Hasbro announced an Operational Excellence program designed to deliver $250-$300 million in annualized run-rate cost savings by year-end 2025. In association with this program the Company incurred:
◦Severance and other employee charges of $94.1 million associated with cost-savings initiatives across the Company, included within Selling, Distribution and Administration; and
◦Program related consultant fees and transformation office expenses of $12.3 million included within Selling, Distribution and Administration.
•During 2022, the Company incurred incremental intangible amortization costs of $71.4 million related to the intangible assets acquired in the eOne acquisition. Beginning in 2022, these intangible amortization costs have been allocated between the Consumer Products and Entertainment segments, to match the revenue generated from such intangible assets.
•During 2022, the Company incurred $14.6 million of stock based compensation expense associated with retention awards granted in connection with the eOne acquisition. These expenses are included within Selling, Distribution and Administration within the Corporate and Other segment.
2021
•During 2021, in association with the sale of the eOne Music business, the Company incurred a loss of $118.3 million comprised of a goodwill impairment charge of $108.8 million included within Loss on Disposal of Business, and transaction costs of $9.5 million included within Selling, Distribution and Administration.
•During 2021, the Company incurred incremental intangible amortization costs of $85.0 million related to the intangible assets acquired in the eOne acquisition.
•During 2021, the Company incurred $20.9 million of stock based compensation expense associated with the accelerated vesting of certain equity awards as a result of the passing of its former CEO included within Selling, Distribution and Administration.
•During 2021, in association with the Company's acquisition of eOne, the Company incurred stock based compensation expense of $7.7 million for acquisition related equity grants, included within Selling, Distribution and Administration.
2020
•During 2020, in association with the Company's acquisition of eOne, the Company incurred related expenses of $218.6 million, comprised of $145.2 million of acquisition and integration costs and restructuring and related costs of $73.4 million, included within Acquisition and related costs.
•During 2020, the Company incurred incremental intangible amortization costs of $97.9 million related to the intangible assets acquired in the eOne acquisition.
•During 2020 the Company incurred $8.5 million of severance charges, associated with cost-savings initiatives recorded within Selling, Distribution and Administration.
Cost of Sales
Cost of sales primarily consists of purchased materials, labor, manufacturing overhead and other inventory-related costs such as obsolescence. Cost of sales decreased 1% to $1,911.8 million, or 32.6% of net revenues, for the year ended December 25, 2022 compared to $1,927.5 million, or 30.0% of net revenues, for the year ended December 26, 2021. The cost of sales decrease in dollars was driven by lower sales volumes, primarily within the Consumer Products segment, and most notably in North America, and to a lesser extent Europe and Asia Pacific markets during 2022 compared to 2021. These decreases were partially offset by cost of sales increases within the Wizards of the Coast and Digital Gaming segment, reflecting higher tabletop gaming sales during 2022. The cost of sales increase as a percent of net revenues was the result of higher product input costs including higher material costs and higher inventory obsolescence, sales allowances and closeout charges to address excess inventory, most notably within Europe and the U.S., partially offset by the benefit of implemented price increases and lower freight costs.
In 2021, cost of sales increased 12% to $1,927.5 million, or 30.0% of net revenues, for the year ended December 26, 2021 compared to $1,718.9 million, or 31.5% of net revenues, for the year ended December 27, 2020. The cost of sales increase in dollars was primarily due to higher sales volumes and higher inventory costs as a result of increased freight costs and, to a lesser extent, the impact of $10.0 million of foreign currency exchange. As a percent of net revenues, the cost of sales decrease was the result of a favorable product mix due to higher sales of Wizards of the Coast tabletop games and higher entertainment revenues, as well as lower sales allowances and obsolescence charges compared to 2020.
Program Cost Amortization
Program cost amortization totaled $555.5 million, or 9.5% of net revenues in 2022, compared to $628.6 million, or 9.8% of net revenues in 2021 and $387.1 million, or 7.1% of net revenues, in 2020. The majority of the Company's program costs are capitalized as incurred and amortized using the individual-film-forecast method. The Company also utilizes the percentage of completion methodology, primarily related to unscripted content. Program cost amortization reflects both the phasing of revenues associated with films and television programming, as well as the type of content being produced and distributed. The program cost amortization decrease during 2022 was driven by the volume and mix of programming revenues compared to 2021, partially offset by $4.1 million of asset impairment charges recorded during 2022, related to discontinued projects associated with the exit of non-core business within the Entertainment segment.
Program production cost amortization increased in dollars and as a percent of net revenues in 2021 as a result of the increase in TV and Film deliveries overall, and from the mix of programs delivered, some of which carry higher programming costs. In addition to these increases was amortization of film production costs associated with the My Little Pony: A New Generation film released on Netflix in 2021.
Royalty Expense
Royalty expense of $493.0 million, or 8.4% of net revenues, in 2022 compared to $620.4 million, or 9.7% of net revenues, in 2021 and $570.0 million, or 10.4% of net revenues, in 2020. Fluctuations in royalty expense generally relate to the volume of entertainment-driven products sold in a given period, especially if the Company is selling
product tied to one or more major motion picture releases in the period. Product lines related to Hasbro-owned or controlled brands supported by entertainment generally do not incur the same level of royalty expense as licensed properties, particularly products for STAR WARS and MARVEL properties and certain other licensed properties which carry higher royalty rates than other licensed properties. In 2022, the decrease in royalty expense was driven by lower sales of certain Partner Brands products which carry higher royalty rates and a change in product mix within the Consumer Products segment, and to a lesser extent, the mix of entertainment deliveries in 2022 reflecting lower film deliveries compared to 2021. In addition, lower royalty expense in 2022 reflects the impact of the sale of eOne Music during 2021 and the expiration of certain licensing agreements acquired through the eOne acquisition, resulting in lower royalty expenses compared to prior periods.
In 2021, higher royalty expense in dollars was driven primarily by higher sales of Partner Brand products as compared to 2020, and to a lesser extent, higher expense for guaranteed minimum royalty payments for certain brands. The decrease in royalty expense as a percentage of net revenues was due to product mix, most notably, higher sales of Wizards of the Coast products, Franchise Brands and higher sales of certain of the Company's Emerging Brands during 2021. See note 20 to the Company’s consolidated financial statements in Part II, Item 8. Financial Statements, of this Form 10-K for information on the Company's future royalty commitments as of December 25, 2022.
Product Development
Product development expense in 2022 totaled $307.9 million, or 5.3% of net revenues, compared to $315.7 million, or 4.9% of net revenues, in 2021. Product development expenditures reflect the Company’s investment in innovation and anticipated growth across our brand portfolio. The decrease in dollars compared to 2021 was driven by lower spending in line with the Company's global cost savings initiatives partially offset by higher spending in the Wizards of the Coast and Digital Gaming segment in support of the Company’s core initiatives.
Product development expense in 2021 totaled $315.7 million, or 4.9% of net revenues, compared to $259.5 million, or 4.7% of net revenues, in 2020. The increase in 2021 was primarily related to investments in the Wizards of the Coast & Digital Gaming segment, for both tabletop and digital gaming initiatives, such as for the development of MAGIC: THE GATHERING tabletop set releases and for the development of digital games such as Dungeons & Dragons: Dark Alliance, and to a lesser extent, increased investments in certain other mobile gaming projects and other product lines currently in development. As a percentage of net revenues, the increase in product development expense reflects lower net revenues overall during 2022 compared 2021.
Advertising Expense
Advertising expense in 2022 totaled $387.3 million, or 6.6% of net revenues, compared to $506.6 million or 7.9% of net revenues in 2021 and $412.7 million or 7.6% in 2020. The level of the Company’s advertising expense is generally impacted by revenue mix, the amount and type of theatrical releases and television programming delivered. The advertising expense decrease during 2022 was driven by lower expense within the Consumer Products segment, reflecting the implementation of the Company's Blueprint 2.0 strategy shift to focus on fewer, bigger brands and lower advertising expense in the Entertainment segment related to the sale of the eOne Music business and a shift in the type of entertainment releases delivered in 2022. In 2021, higher advertising expense was driven by support for the September 2021 release of My Little Pony: A New Generation and within the Wizards of the Coast and Digital Gaming segment, expense in support of the 2021 launch of the mobile version of Magic: The Gathering Arena and Dungeons & Dragons: Dark Alliance, with no comparable releases in 2022.
The advertising increase in 2021 reflects growth in revenues compared to 2020 and higher advertising costs in support of MAGIC: THE GATHERING tabletop gaming releases, higher advertising costs in support of the feature length film, My Little Pony: A New Generation, and for the Company’s digital gaming initiatives, most notably, Magic: The Gathering Arena and Dungeons & Dragons: Dark Alliance. These increases were partially offset by reduced promotional spend in the Entertainment segment due to fewer theatrical releases in 2021 compared to 2020.
Amortization of Intangible Assets
Amortization of intangible assets decreased to $105.3 million, or 1.8% of net revenues, in 2022 compared to $116.8 million, or 1.8% of net revenues, in 2021 and $144.7 million, or 2.6% of net revenues in 2020. The decrease in 2022 is the result of the discontinuation of amortization related to the eOne Music intangible assets following the sale of eOne Music during 2021. This decline was partially offset by additional expense associated with assets acquired through the D&D Beyond acquisition during 2022.
In 2021, the decrease primarily related to certain licensed property rights which became fully amortized in the fourth quarter of 2020 combined with the discontinuation of amortization related to the eOne Music intangible assets in the
second quarter of 2021, upon being classified as held for sale assets and subsequently sold in the third quarter of 2021.
Selling, Distribution and Administration Expenses
In addition to the following drivers, Selling, Distribution and Administration ("SD&A") expenses include certain charges noted under the Operating Costs and Expenses table above.
SD&A expenses increased to $1,666.1 million, or 28.4% of net revenues in 2022, from $1,432.7 million, or 22.3% of net revenues, in 2021. In 2022, selling, distribution and administration expense reflects lower incentive compensation expense, lower depreciation expense within the Wizards of the Coast business, most notably due to the release of Dungeons & Dragons: Dark Alliance in 2021, with no comparable releases in 2022 and lower shipping costs due to global supply chain improvements during the year. These decreases were wholly offset by the impairment charges and severance and other charges associated with the Company's strategic review noted previously, and higher warehousing expenses, primarily in the Consumer Products segment and, to a lesser extent, the Wizards of the Coast and Digital Gaming segment, as a result of higher inventory levels for the year ended December 25, 2022.
In 2021, SD&A increased to $1,432.7 million, or 22.3% of net revenues, from $1,252.1 million or 22.9% of net revenues in 2020. The increase in SD&A expenses was driven primarily by higher marketing and sales costs consistent with the increase in net revenues, higher compensation expense and increased freight and warehousing costs, primarily due to ongoing global supply chain disruptions. In addition, 2021 included higher depreciation expense associated with capitalized games held within the Wizards of the Coast business. These increases were partially offset by the divestiture of eOne Music and lower expense for credit losses during 2021.
Loss on Disposal of Business
In 2022, the loss on disposal of business of $22.1 million, or 0.4% of net revenues represents non-cash impairment charges associated with the exit of certain non-core businesses within the Entertainment segment. The loss on disposal of business of $108.8 million, or 1.7% of net revenues, represents a non-cash impairment charge associated with the disposition of eOne Music during 2021.
NON-OPERATING EXPENSE (INCOME)
Interest Expense
Interest expense totaled $171.0 million in 2022 compared to $179.7 million in 2021 and $201.1 million in 2020. The decrease in interest expense during 2022 primarily reflects long-term debt repayments made throughout 2021, primarily related to borrowings utilized for the eOne acquisition, partially offset by higher interest expense related to borrowings from the Company's production financing credit facilities. The decrease in 2021 compared to 2020 reflects the repayment of eOne acquisition related long-term borrowings during 2021 and lower interest rates. These 2021 decreases were partially offset by expense related to higher production financing borrowings compared to 2020.
Interest Income
Interest income was $11.8 million in 2022 compared to $5.4 million in 2021 and $7.4 million in 2020. Higher interest income in 2022 primarily reflects higher average interest rates in 2022 compared to 2021. Lower interest income in 2021 compared to 2020 is primarily the result of lower cash balances due to long-term debt repayments and lower average interest rates in 2021.
Other (Income) Expense, Net
Other (income) expense, net was $(13.0) million, $7.1 million and $(14.0) million in 2022, 2021 and 2020, respectively. The following table outlines major contributors to other (income) expense, net, expressed in millions of dollars.
| | | | | | | | | | | | | | | | | |
| 2022 | | 2021 | | 2020 |
| Earnings from Discovery Family Channel | (8.1) | | | (20.8) | | | (21.8) | |
| Foreign currency (gains) losses | $ | (5.3) | | | $ | (5.1) | | | $ | 2.1 | |
| Loss (gain) on investments | (1.1) | | | (3.8) | | | 7.3 | |
| Loss (gain) on PP&E | 0.4 | | | (0.2) | | | (4.9) | |
| Legal settlement | — | | | (26.7) | | | (3.2) | |
| Discovery Family Channel option | — | | | (20.1) | | | (1.5) | |
| | | | | |
| Discovery Family Channel impairment | — | | | 74.1 | | | — | |
| Other | 1.1 | | | 9.7 | | | 8.0 | |
| $ | (13.0) | | | 7.1 | | | (14.0) | |
•Earnings from the Discovery joint venture are comprised of the Company’s share in the results of the Discovery Family Channel (the "Network").
•Foreign currency (gains) losses reflect fluctuations of foreign currency translation across the Company's international markets against the U.S. dollar.
•The 2022 gain on investments primarily reflects an increase in fair value of the Company's available for sale investment as well as further recoupment of the 2020 loss on investments. During 2021, the gain on investments primarily reflects a recoupment of the 2020 loss on investments, which was driven by a partial write off of an investment in Quibi, a mobile streaming service, which was obtained as part of the eOne acquisition.
•The gain on PP&E in 2020 reflects a $6.1 million gain related to the sale of the Dragonvale software and brand.
•During the 2021, the Company realized a gain of $26.7 million from a legal settlement related to a historical eOne dispute.
•In relation to the Discovery joint venture, Hasbro and Discovery have a put/call option on the share of the Discovery Family Channel. The option’s fair value is periodically re-measured and in 2021, as a result of the Discovery Family Channel impairment, the adjustment of the option's fair value resulted in a $20.1 million gain. In 2020, the Company recorded a gain of $1.5 million due to the option’s value decrease.
•During 2021, the Company recorded an impairment loss of $74.1 million related to its investment in Discovery Family Channel. The Network projected a significant decline in affiliate revenue driven by changes in the cable distribution industry due to a decline in linear subscribers.
INCOME TAXES
Income tax expense totaled 22.4% of pre-tax earnings in 2022 compared with 25.2% in 2021 and 30.0% in 2020. Our effective tax rate is affected by recurring items, such as tax rates in foreign jurisdictions and the relative amounts of income we earn in those jurisdictions. It is also affected by discrete items that may occur in any given year but are not consistent from year to year. Income tax expense for 2022 includes a net discrete benefit primarily related to: (i) favorable return to provision adjustments; offset by (ii) a discrete expense recording a valuation allowance against net deferred tax assets due to Russia's on-going conflict with Ukraine. Income tax expense for 2021 includes a net discrete expense primarily related to: (i) a non-deductible impairment charge from the sale of eOne Music; and (ii) the remeasurement of UK net deferred tax liability as a result of the United Kingdom’s enactment of Finance Act 2021; offset by (iii) a benefit from the release of uncertain tax positions resulting from a change in management judgement and (iv) discrete tax planning benefits. Income tax expense for 2020 includes a discrete net tax benefit primarily related to: (i) eOne acquisition and related costs; (ii) the remeasurement of UK net deferred tax liability as a result of the United Kingdom’s enactment of Finance Act 2020; and (iii) an increase of uncertain tax positions based on changes in management judgment; offset by tax planning, including planning directly related to the eOne integration.
Subsequent to the United States passing the Tax Cuts and Jobs Act of 2017 (the Tax Act), the Company has greater flexibility to manage cash globally. The Company intends to repatriate the accumulated foreign earnings as needed from time to time. The Company still has significant cash needs outside the United States and continues to consistently monitor and analyze its global working capital and cash requirements. As of 2022, we have recorded $3.6 million of foreign withholding and U.S. state income tax liability. The Company will continue to record additional tax effects, if any, in the period that the on-going distribution analysis is completed and is able to make reasonable estimates.
NEW ACCOUNTING PRONOUNCEMENTS
As of December 25, 2022, there were no recently adopted accounting standards that had a material effect on the Company’s financial statements. The Company's significant accounting policies are summarized in note 1 to the consolidated financial statements included in Part II, Item 8. Financial Statements, of this Form 10-K.
Recently Issued Accounting Pronouncements
In March of 2020, the FASB issued Accounting Standards Update No. 2020-04 (ASU 2020-04) Reference Rate Reform (Topic 848): Facilitation of the Effects of Reference Rate Reform on Financial Reporting. The amendments in this update provided optional expedients and exceptions for applying U.S. GAAP to contracts, hedging relationships, and other transactions, for a limited period of time, to ease the potential burden of recognizing the effects of reference rate reform on financial reporting. The amendments in this update applied to contracts, hedging relationships and other transactions that reference the London Inter-Bank Offered Rate ("LIBOR") or another reference rate expected to be discontinued due to the global transition away from LIBOR and certain other interbank offered rates. The amendments in this Update were effective for all entities as of March 12, 2020 through December 31, 2022. The change from LIBOR to an alternate rate did not have a material impact on the Company's consolidated financial statements.
OTHER INFORMATION
Russian Sanctions
As a result of the military conflict in Ukraine, which has led to sanctions and other penalties being levied by the United States, European Union and other countries against Russia, the Company paused all shipments and new content distribution into Russia. The impact to the Company’s operating results includes a loss of both revenue and operating profit, as well as a tax charge associated with recording a valuation allowance against local deferred tax assets. As of December 25, 2022, the Company has exhausted all locally held inventories, recovered all receivables and released all reserves in Russia.
LIQUIDITY AND CAPITAL RESOURCES
The Company has historically generated a significant amount of cash from operations. In 2022, the Company primarily funded its operations and liquidity needs through cash on hand and from cash flows from operations, and when needed, used borrowings under its available lines of credit. In addition, the Company’s Entertainment operating segment used production financing to fund certain of its television and film productions which are typically arranged on an individual production basis by using either the Company's revolving film and television production credit facility or through special purpose production subsidiaries. For more information on the Company's production financing facilities, including expected future repayments, see notes 9 and 11 to the consolidated financial statements included in Part II, Item 8. Financial Statements, of this Form 10-K.
During 2023, the Company expects to continue to fund its working capital needs primarily through available cash, cash flows from operations and from production financing facilities and, if needed, by issuing commercial paper or borrowing under its revolving credit agreement. In the event that the Company is not able to issue commercial paper, the Company intends to utilize its available lines of credit. The Company believes that the funds available to it, including cash expected to be generated from operations, funds available through its commercial paper program or its available lines of credit and production financing, are adequate to meet its working capital needs for 2023, including the repayment of the current portion of long-term debt of $113.2 million, as shown on the consolidated balance sheets which represents the current portion of required quarterly principal amortization payments for our term loan facilities and other production financing facilities, each as described below. The Company may also issue debt or equity securities from time to time, to provide additional sources of liquidity when pursuing opportunities to enhance our long-term competitive position, while maintaining a strong balance sheet. However, unexpected events or circumstances such as material operating losses or increased capital or other expenditures, or the inability to otherwise access the commercial paper market, may reduce or eliminate the availability of external financial resources. In addition, significant disruptions to credit markets may also reduce or eliminate the availability of
external financial resources. Although the Company believes the risk of nonperformance by the counterparties to its financial facilities is not significant, in times of severe economic downturn in the credit markets, it is possible that one or more sources of external financing may be unable or unwilling to provide funding to the Company.
As of December 25, 2022, the Company’s cash and cash equivalents totaled $513.1 million, of which $14.5 million is restricted under the Company’s production financing facilities. Prior to 2017, deferred income taxes had not been provided on the majority of undistributed earnings of international subsidiaries as such earnings were indefinitely reinvested by the Company. Accordingly, such international cash balances were not available to fund cash requirements in the United States unless the Company was to change its reinvestment policy. The Company has maintained sufficient sources of cash in the United States to fund cash requirements without the need to repatriate any funds. The Tax Act provided significant changes to the U.S. tax system including the elimination of the ability to defer U.S. income tax on unrepatriated earnings by imposing a one-time mandatory deemed repatriation tax on undistributed foreign earnings. As of December 25, 2022, the Company had a total liability of $137.7 million related to this tax, $34.4 million is reflected in current liabilities while the remaining long-term payable related to the Tax Act of $103.3 million is presented within other liabilities, non-current on the consolidated balance sheets included in Part II, Item 8. Financial Statements, of this Form 10-K. As permitted by the Tax Act, the Company will pay the transition tax in annual interest-free installments through 2025 as follows: 2023: $34.4 million; 2024: $45.9 million; and 2025: $57.4 million. As a result, in the future, the related earnings in foreign jurisdictions will be made available with greater investment flexibility. The majority of the Company’s cash and cash equivalents held outside of the United States as of December 25, 2022 are denominated in the U.S. dollar.
The table below outlines key financial information pertaining to our consolidated balance sheets including the year-over-year changes, expressed in millions of dollars.
| | | | | | | | | | | | | | | | | | | | | | | | | | | | | |
| 2022 | | % | | 2021 | | % | | 2020 |
| Cash and cash equivalents, net of short-term borrowings (including restricted cash of $14.5, $35.8 and $73.2) | $ | 513.1 | | | -50 | % | | $ | 1,019.2 | | | -30 | % | | $ | 1,449.7 | |
| Accounts receivable, net | 1,132.4 | | | -25 | % | | 1,500.4 | | | 8 | % | | 1,391.7 | |
| Inventories | 676.8 | | | 23 | % | | 552.1 | | | 40 | % | | 395.6 | |
| Prepaid expenses and other current assets | 676.8 | | | 3 | % | | 656.4 | | | 8 | % | | 609.6 | |
| Other assets | 1,589.3 | | | 23 | % | | 1,297.0 | | | 3 | % | | 1,260.3 | |
| Accounts payable and accrued liabilities | 1,934.1 | | | -14 | % | | 2,255.0 | | | 15 | % | | 1,964.1 | |
| Other liabilities | 533.1 | | | -21 | % | | 670.7 | | | -16 | % | | 794.0 | |
Accounts receivable, net decreased 25% in 2022 compared to 2021. The decrease in accounts receivable was driven by lower sales and improved collections across the majority of the Company's markets during 2022. Days sales outstanding decreased from 68 days at December 26, 2021 to 61 days at December 25, 2022, primarily due to the decrease in revenues and mix of sales, primarily in the U.S. during 2022 as well as from the improved collections described above. In 2021, accounts receivable balances increased 8% as a result of higher sales, partially offset by improved collections, most notably in the Company's European and Latin American markets. Days sales outstanding decreased from 74 days at December 27, 2020 to 68 days at December 26, 2021, primarily due to the increase in revenues, mix of sales and improved collections during 2021.
Inventories increased 23% in 2022 compared to 2021 primarily reflecting accelerated inventory purchases attributable to the Company's Consumer Products and Wizards of the Coast businesses to mitigate the impact of certain global supply chain challenges experienced throughout 2021 and into 2022. Beginning late in 2022, certain global supply chain constraints began to subside resulting in reduced in transit times, most notably in the U.S. and Europe, which combined with lower than anticipated Consumer Products sales, contributed to the Company's higher inventory levels. In 2021, inventories increased 40% compared to 2020 reflecting increased lead-times from supply chain disruptions, as well as higher freight-in costs, primarily in the U.S. and Europe, impacting the Company's Consumer Products and Wizards of the Coast tabletop gaming businesses. This increase was partially offset by lower inventory levels in the Company's Asia Pacific and Latin American markets.
Prepaid expenses and other current assets increased 3% in 2022 compared to 2021. The increase was driven by higher accrued royalty and licensing balances, primarily attributable to the Company's Entertainment business as well as the reclassification of accrued income balances from long-term to current. These increases were partially offset by lower prepaid royalty balances in relation to the Company’s Marvel, POWER RANGERS and DISNEY PRINCESS royalty agreements, the disposal of certain Entertainment assets in relation to the exit of certain non-core businesses within the Entertainment segment and from lower prepaid income tax balances during 2022. In
2021, prepaid expenses and other current assets increased 8% compared to 2020 due to higher accrued tax credit balances related to film and television production costs, due to increased productions and timing of tax credit claims, as well as higher unrealized gains on foreign exchange contracts. These increases were partially offset by lower accrued income and prepaid expense balances associated with the sale of eOne Music, lower prepaid royalty balances in relation to the 2020 extension of Company’s Marvel and Lucasfilm royalty agreements and lower prepaid tax balances.
Other assets increased 23% in 2022 compared to 2021. The increase was primarily driven by higher deferred tax balances, higher investments in film and television productions and higher non-current receivable balances within the Entertainment segment. These increases were partially offset by a lower balance for the Company's investment in Discovery Family Channel, due to distributions received during 2022. Other assets increased 3% in 2021 compared to 2020. The increase was driven by higher investments in film and television productions, higher investments in content development and higher long-term accrued income balances related to certain of the Company's content distribution arrangements.
Accounts payable and accrued liabilities decreased 14% in 2022 compared to 2021. The drivers of the decrease include lower accounts payable balances associated with the Company's global cost savings initiatives and the timing of payments in 2022, lower incentive bonus accruals, lower accrued royalty balances as a result of partner brand product sales declines, lower accrued freight balances due to improving supply chain conditions within certain markets, as well as the disposal of certain Entertainment liabilities in relation to the exit of non-core businesses within the Entertainment segment. These decreases were partially offset by higher severance accrual balances related to certain cost savings initiatives mentioned above. Accounts payable and accrued liabilities increased 15% in 2021 compared to 2020 as a result of higher account payable balances driven by an extension of payable terms, higher accrued expenses for investments in content and productions, higher accrued freight balances due to increased costs as a result of supply chain disruptions and higher incentive compensation accruals. These increases were partially offset by lower accrued participations and residuals, lower balances of certain accounts payable and accrued liabilities associated with the sale of eOne Music and lower severance accruals from payments made in relation to restructuring actions taken in 2018 and eOne integration severance in 2020.
Other liabilities decreased 21% in 2022 compared to 2021. The decrease was driven by a lower transition tax liability balance reflecting the reclassification of the 2022 installment payment due April 2023, lower long-term lease liability balances, lower deferred tax balances reflecting the amortization of certain deferred tax liabilities and the impact of foreign exchange revaluation, primarily related to the British Pound. These decreases were partially offset by an increase to the liability for uncertain tax positions, primarily related to the capitalization of research and experimentation expenditures. Other liabilities decreased 16% in 2021 compared to 2020. The decrease was primarily driven by lower long-term lease liability balances, a lower transition tax liability balance and lower tax reserves. These decreases were partially offset by higher deferred compensation reserve balances.
Cash Flow
The following table summarizes the changes in the consolidated statement of cash flows included in Part II, Item 8. Financial Statements, of this Form 10-K, expressed in millions of dollars, for each of the years ended December 25, 2022, December 26, 2021 and December 27, 2020.
| | | | | | | | | | | | | | | | | |
| 2022 | | 2021 | | 2020 |
| Net cash provided by (used in): | | | | | |
| Operating Activities | $ | 372.9 | | | $ | 817.9 | | | $ | 976.3 | |
| Investing Activities | (313.0) | | | 242.0 | | | (4,500.2) | |
| Financing Activities | (553.3) | | | (1,459.8) | | | 405.9 | |
In 2022, 2021 and 2020, Hasbro generated $372.9 million, $817.9 million and $976.3 million of cash from its operating activities, respectively. Operating cash flows in 2022, 2021 and 2020 included $767.7 million, $697.3 million and $438.9 million, respectively, of cash used for television program and film production. The decrease in cash provided by operating activities during 2022 was attributable to lower earnings and higher working capital requirements, including cash utilized for accounts payable and higher spend for television program and film production. The decrease in net cash provided by operating activities during 2021, was primarily attributable to the increased spend for television program and film production, as well as an increase in working capital cash outflows associated with increased accounts receivable and inventory balances as noted above. These outflows were partially offset by higher earnings in 2021 and favorable changes in accounts payable terms in certain markets.
Net cash flows utilized for investing activities were $313.0 million in 2022 compared to net cash flows provided by investing activities of $242.0 million in 2021 and net cash flows utilized for investing activities of $4,500.2 million in 2020. Investing activities in 2022 reflect a cash payment of $146.3 million related to the D&D Beyond Acquisition during the second quarter of 2022. Investing activities in 2021 include $378.5 million of proceeds, net of cash sold, from the sale of eOne Music. Investing activities in 2020 reflect $4.4 billion of cash utilized to acquire eOne, net of cash acquired. The D&D Beyond Acquisition during 2022 was funded with cash on hand. The net proceeds received from the sale of eOne Music during 2021 were used for long-term debt repayments as part of the Company's plan to accelerate deleveraging, and for general corporate purposes to run the business. The cash used for the purchase of eOne in 2020 consisted of the net proceeds from the issuance of an aggregate principal amount of $2.4 billion in senior unsecured notes in November 2019, net proceeds $975.2 million from of the issuance of approximately 10.6 million shares of common stock in November 2019 and $1.0 billion in term loans drawn in the first quarter of 2020. Additions to property, plant and equipment were $174.2 million, $132.7 million and $125.8 million in 2022, 2021 and 2020, respectively. Of these additions, 44% in 2022, 52% in 2021 and 51% in 2020 were for purchases of tools, dies and molds related to the Company’s products. During the fiscal years ended December 25, 2022, December 26, 2021 and December 27, 2020, the depreciation of plant and equipment was $127.3 million, $163.3 million and $120.2 million, respectively. Fluctuations in depreciation of plant and equipment correlate with the percentage of additions to property, plant and equipment relating to tools, dies and molds which have shorter useful lives and accelerated depreciation.
Net cash (utilized) provided by financing activities was $(553.3) million, $(1,459.8) million, and $405.9 million in 2022, 2021 and 2020, respectively.
Net cash utilized for financing activities in 2022 included payments totaling $87.5 million related to the $1.0 billion in term loans described below, consisting of a $50.0 million principal and quarterly principal amortization payments of $37.5 million toward the Five-Year Tranche loan. In addition, cash utilized for financing activities included as drawdowns of $258.6 million and repayments of $231.5 million related to production financing loans and cash payments of $125.0 million to repurchases the Company's Common Stock.
Net cash utilized for financing activities in 2021 included repayment of $300.0 million aggregate principal amount of 3.15% Notes due 2021, during the first quarter; early repayment of $300.0 million aggregate principal of 2.60% Notes due 2022 and related debt extinguishment costs of $9.1 million during the third quarter; payments totaling $480 million related to the $1.0 billion in term loans consisting of $300.0 million for the remaining principal balance of the Three-Year Tranche loans and $150.0 million principal and quarterly principal amortization payments totaling $30 million toward the Five-Year Tranche loan; and drawdowns of $144.0 million and repayments of $140.1 million related to production financing loans.
Net cash provided by financing activities in 2020 included the drawdown of the Company's $1.0 billion in term loans, as well as drawdowns of $115.6 million related to production financing loans. Partially offsetting these cash inflows were production financing loan repayments of $159.8 million, payments of $47.4 million associated with the redemption of eOne stock awards that were accelerated as a result of the acquisition and payments totaling $122.5 million towards the $1.0 billion term loans described above.
Dividends paid were $385.3 million in 2022, $374.5 million in 2021 and $372.7 million in 2020 reflecting the Company's quarterly dividend rate increase from $0.68 per share in 2020 and 2021, to $0.70 per share in 2022. Net repayments of short-term borrowings were $141.7 million, $5.6 million and $8.6 million in 2022, 2021 and 2020, respectively. The Company generated cash from employee stock option transactions of $74.2 million, $30.6 million, and $16.6 million in 2022, 2021 and 2020, respectively. The Company paid withholding taxes related to share-based compensation of $24.0 million, $13.7 million and $6.0 million in 2022, 2021 and 2020, respectively.
Sources and Uses of Cash
The Company commits to inventory production, advertising and marketing expenditures in support of its consumer products business, prior to the peak fourth quarter retail selling season. Accounts receivable increase during the third and fourth quarter as customers increase their purchases to meet expected consumer demand in their holiday selling season. Due to the concentrated timeframe of this selling period, payments for these accounts receivable are generally not due until the fourth quarter or early in the first quarter of the subsequent year. This timing difference between expenditures and cash collections on accounts receivable sometimes makes it necessary for the Company to borrow amounts during the latter part of the year. In the Company's entertainment business, cash expenditures for productions are often made well in advance of sale and delivery of the content produced whereas trading card and digital gaming revenues have shorter collection periods, but product development expense often occurs years prior to release and revenue generation. During 2022, 2021 and 2020 the Company primarily used cash from
operations and, to a lesser extent, borrowings under available lines of credit, in particular production financing vehicles, to fund its working capital.
The Company has an agreement with a group of banks which provides for a commercial paper program (the "Program"). Under the Program, at the request of the Company and subject to market conditions, the banks may either purchase from the Company, or arrange for the sale by the Company, of unsecured commercial paper notes. The Company may issue notes from time to time up to an aggregate principal amount outstanding at any given time of $1.0 billion. The maturities of the notes may vary but may not exceed 397 days. The notes are sold under customary terms in the commercial paper market and are issued at a discount to par, or alternatively, sold at par and bear varying interest rates based on a fixed or floating rate basis. The interest rates vary based on market conditions and the ratings assigned to the notes by the credit rating agencies at the time of issuance. Subject to market conditions, the Company intends to utilize the Program as its primary short-term borrowing facility and does not intend to sell unsecured commercial paper notes in excess of the available amount under the revolving credit agreement discussed below. If, for any reason, the Company is unable to access the commercial paper market, the Company intends to use the revolving credit agreement to meet the Company's short-term liquidity needs. At December 25, 2022, the Company had no outstanding borrowings related to the Program.
The Company has a second amended and restated revolving credit agreement with Bank of America, N.A., as administrative agent, swing line lender and a letter of credit issuer and lender and certain other financial institutions, as lenders thereto (the "Amended Revolving Credit Agreement"), which provides the Company with commitments having a maximum aggregate principal amount of $1.5 billion. The Amended Revolving Credit Agreement also provides for a potential additional incremental commitment increase of up to $500.0 million subject to agreement of the lenders. The Amended Revolving Credit Agreement contains certain financial covenants setting forth leverage and coverage requirements, and certain other limitations typical of an investment grade facility, including with respect to liens, mergers and incurrence of indebtedness. The Amended Revolving Credit Agreement extends through September 20, 2024. The Company was in compliance with all covenants as of December 25, 2022. The Company had no borrowings outstanding under its committed revolving credit facility as of December 25, 2022. However, letters of credit outstanding under this facility as of December 25, 2022 were approximately $4.0 million. Amounts available and unused under the committed line, at December 25, 2022 were approximately $1.5 billion, inclusive of borrowings under the Company’s commercial paper program. The Company also has other uncommitted lines from various banks, of which approximately $8.7 million was utilized at December 25, 2022. Of the amount utilized under, or supported by, the uncommitted lines, approximately $7.9 million and $0.8 million represent letters of credit and outstanding short-term borrowings, respectively.
In September of 2019, the Company entered into a $1.0 billion Term Loan Agreement (the "Term Loan Agreement") with Bank of America N.A. ("Bank of America"), as administrative agent, and certain financial institutions as lenders, pursuant to which such lenders committed to provide, contingent upon the completion of the eOne acquisition and certain other customary conditions to funding, (1) a three-year senior unsecured term loan facility in an aggregate principal amount of $400.0 million (the “Three-Year Tranche”) and (2) a five-year senior unsecured term loan facility in an aggregate principal amount of $600.0 million (the “Five-Year Tranche” and together with the Three-Year Tranche, the “Term Loan Facilities”). On December 30, 2019, the Company completed the acquisition of eOne and on that date, borrowed the full amount of $1.0 billion under the Term Loan Facilities. As of December 25, 2022, the Company has fully repaid the Three-Year Tranche $400.0 million principal term loan, and of the Five-Year Tranche $600.0 million principal balance, the Company has repaid a total of $290.0 million in the following increments: $22.5 million in 2020; $180.0 million in 2021; and, $87.5 million in 2022.
The Company is subject to certain financial covenants contained in this agreement and, as of December 25, 2022, the Company was in compliance with these covenants. The terms of the Term Loan Facilities are described in note 11 to the consolidated financial statements included in Part II, Item 8. Financial Statements, of this Form 10-K.
During November 2019, in conjunction with the Company's acquisition of eOne, the Company issued an aggregate of $2.4 billion of senior unsecured debt securities (collectively, the "Notes") consisting of the following tranches: $300 million of notes due 2022 (the "2022 Notes") that bear interest at a fixed rate of 2.60%; $500 million of notes due 2024 (the "2024 Notes") that bear interest at a fixed rate of 3.00%; $675 million of notes due 2026 (the "2026 Notes") that bear interest at a fixed rate of 3.55%; and $900 million of notes due 2029 (the "2029 Notes") that bear interest at a fixed rate of 3.90%. During the third quarter of 2021, the Company repaid in full, its 2022 Notes in the aggregate principal amount of $300.0 million, including early redemption premiums and accrued interest of $10.8 million. The terms of the Notes are described in note 11 to the consolidated financial statements in Part II, Item 8. Financial Statements, of this Form 10-K.
The Company uses production financing facilities to fund its film and television productions which are arranged on an individual production basis by either special purpose production subsidiaries, each secured by the assets and
future revenues of such production subsidiaries, which are non-recourse to the Company's assets, or through a senior revolving credit facility obtained in November 2021, dedicated to production financing. The Company's senior revolving film and television production credit facility (the “RPCF”) with MUFG Union Bank, N.A., as administrative agent and lender and certain other financial institutions, as lenders thereto (the “Revolving Production Financing Agreement”) provides the Company with commitments having a maximum aggregate principal amount of $250.0 million. The Revolving Production Financing Agreement also provides the Company with the option to request a commitment increase up to an aggregate additional amount of $150.0 million subject to agreement of the lenders. The Revolving Production Financing Agreement extends through November 22, 2024. The Company uses the RPCF to fund certain of the Company’s original film and TV production costs. Borrowings under the RPCF are non-recourse to the Company's assets. The Company expects to utilize the revolving production financing facility for the majority of its future production financing needs. During 2022, the Company had total drawdowns of $258.6 million and repayments of $231.5 million towards these production financing facilities. As of December 25, 2022, the Company had outstanding production financing borrowings related to these facilities of $195.6 million, $53.2 million of which are recorded within the current portion of long-term debt and $142.4 million are recorded within short-term borrowings in the Company's consolidated balance sheets, included in Part II, Item 8. Financial Statements, of this Form 10-K.
The Company has principal amounts of long-term debt at December 25, 2022 of $3.8 billion due at varying times from 2024 through 2044. Of the total principal amount of long-term debt, $113.2 million is current at December 25, 2022 of which $60.0 million is related to principal amortization of the 5-year term loans due December 2024 and $53.2 million represents the Company's outstanding production financing facilities at December 25, 2022. In addition to the early repayment of the 2022 Notes described above, during the first quarter of 2021, the Company repaid in full, its 3.15% Notes in the aggregate principal amount of $300.0 million due in May 2021, including accrued interest. See note 11 and note 20 to the Company’s consolidated financial statements in Part II, Item 8. Financial Statements, of this Form 10-K for additional information on long-term debt and long-term debt interest repayment, respectively.
Under a multi-year game production agreement entered with Cartamundi, the Company has purchase commitments of $85.0 million in 2023. The Company also has various third-party, inventory and tooling purchase commitments related primarily to the Company's Consumer Products segment which may total approximately $367.7 million in 2023. These payments exclude inventory and tooling purchase liabilities included in accounts payable or accrued liabilities on the consolidated balance sheets as of December 25, 2022.
Share Repurchases and Dividends
The Company has a long history of returning cash to its shareholders through quarterly dividends and share repurchases. Hasbro increased its quarterly dividend rate from $0.68 per share to $0.70 per share effective for the dividend paid in May 2022. In addition to the dividend, the Company periodically returns cash to shareholders through its share repurchase program. As part of this initiative, since 2005 the Company’s Board of Directors (the "Board") adopted numerous share repurchase authorizations with a cumulative authorized repurchase amount of $4.3 billion. The most recent authorization was approved in May 2018 for $500 million. Following the Company's acquisition of eOne, the Company temporarily suspended its share repurchase program to prioritize deleveraging. During the second quarter of 2022, given the Company's progress towards reducing debt, the Company resumed its share repurchase activity and has since repurchased approximately 1.4 million shares at a total cost of $125.0 million and at an average price of $87.46 per share. At December 25, 2022, Hasbro had $241.6 million remaining available under these share repurchase authorizations. The Company has no obligation to repurchase shares under the authorization, and the timing, actual number, and value of the shares that are repurchased, if any, will depend on a number of factors, including the price of the Company’s stock and the Company's generation of, and uses for, cash.
The Company believes that cash from operations, and, if necessary, its committed line of credit and other borrowing facilities, will allow the Company to meet its obligations over the next twelve months.
Critical Accounting Policies and Significant Estimates
The Company prepares its consolidated financial statements in accordance with accounting principles generally accepted in the United States of America. As such, management is required to make certain estimates, judgments and assumptions that it believes are reasonable based on information available. These estimates and assumptions affect the reported amounts of assets and liabilities at the date of the consolidated financial statements and the reported amounts of revenues and expenses for the periods presented. The critical accounting policies which management believes are the most critical to aid in fully understanding and evaluating the Company’s reported
financial results include film and television production costs, recoverability of goodwill, intangible assets, income taxes and business combinations. Additionally, the Company identified the valuation of the Company’s equity method investment in Discovery Family Channel as a significant accounting estimate.
Film and Television Production Costs
The Company incurs certain costs in connection with the production of television programs and films which are capitalized as they are incurred, the majority of which are amortized using the individual-film-forecast method. These costs, which include direct production costs, development costs, acquisition and inventory costs as well as residuals and participations, are amortized in the proportion that the current year’s revenues bear to management’s estimate of total ultimate revenues as of the beginning of each fiscal year related to the film or television program. These capitalized costs are reported at the lower of cost, less accumulated amortization, or fair value, and reviewed for impairment when an event or change in circumstances occurs that indicates that impairment may exist. The fair value is determined using a discounted cash flow model which is primarily based on management’s future revenue and cost estimates.
The most significant estimates are those used in the determination of ultimate revenue in the individual-film-forecast method. Ultimate revenue estimates impact the timing of program production cost amortization in the consolidated statements of operations. Ultimate revenue includes revenue from all sources that are estimated to be earned related to a film or television program and include theatrical exhibition; first run program distribution fees; toy, game and other consumer product licensing fees; and other revenue sources, such as secondary market home entertainment formats and subscription video on demand services. Our ultimate revenue estimates for each film or television program are developed based on our estimates of expected future results. We review and revise these estimates at each reporting date to reflect the most current available information. When estimates for a film or television program are revised, the difference between the program production cost amortization determined using the revised estimate and any amounts previously expensed during that fiscal year, are included as an adjustment to program production cost amortization in the consolidated statements of operations in the period in which the estimates are revised. Prior period amounts are not adjusted for subsequent changes in estimates. Factors that can impact our revenue estimates include the historical performance of similar films and television programs, expected distribution platforms, factors unique to our television and film content and the success of our program-related toy, game and other merchandise.
Recoverability of Goodwill and Intangible Assets
The Company tests goodwill for impairment at least annually. If an event occurs or circumstances change that indicate that the carrying value of a reporting unit exceeds its fair value, the Company will perform an interim goodwill impairment test at that time. The Company may perform a qualitative assessment and bypass the quantitative impairment testing process, if it is not more likely than not that the carrying value of a reporting unit exceeds its fair value.
If it is more likely than not the carrying value exceeds its fair value, a quantitative goodwill impairment test is performed. When performing a quantitative impairment test, goodwill is tested for impairment by comparing the carrying value to the estimated fair value of the reporting unit which is calculated using an income approach. Other intangible assets with indefinite lives are tested for impairment by comparing their carrying value to their estimated fair value.
On May 19, 2022, the Company completed its acquisition of D&D Beyond for $146.3 million, which was funded with cash on hand. Based on the valuation of these assets, $64.7 million was allocated to goodwill within the Wizards of the Coast and Digital Gaming segment during the second quarter of 2022.
During the third quarter of 2022, the Company determined to exit certain non-core businesses within the Entertainment segment. A revaluation of the effected businesses resulted in a pre-tax non-cash goodwill impairment charge of $11.8 million, recorded within Loss on Assets Held for Sale in the Consolidated Statement of Operations, and within the Entertainment segment for the quarter ended September 25, 2022.
During the fourth quarter of 2022, the Company performed a qualitative goodwill assessment with respect to each of its reporting units. Based on its qualitative assessments, the Company determined it is not more likely than not that the carrying value exceeds the fair value for any of its reporting units and as a result, the Company concluded it was not necessary to perform a quantitative test for impairment of goodwill for any of its reporting units during 2022.
During the first quarter of 2021, the Company realigned its financial reporting structure creating the following three principal reporting segments: Consumer Products, Wizards of the Coast and Digital Gaming and Entertainment. As a result of these changes, the Company reallocated its goodwill among the revised reporting units based on the
change in relative fair values of the respective reporting units. See note 6 to the Company's consolidated financial statements in Part II, Item 8. Financial Statements, of this Form 10-K for details on the allocation of goodwill across the Company's new reporting structure.
In conjunction with the goodwill reallocation described above, during the first quarter of 2021, the Company performed a qualitative impairment test of goodwill balances held by the reporting units impacted by the segment realignment. The reporting units were tested as of December 28, 2020 and included our Europe, Asia Pacific, Global Consumer Products Licensing, Wizards of the Coast and Family Brands reporting units. Based on the results of the goodwill assessment, we determined that the fair values of each of these reporting units exceeded their carrying values, and as such, we concluded that there was no indication of goodwill impairment for these reporting units as of December 28, 2020.
In the third quarter 2021, the Company sold eOne Music for net proceeds of $397.0 million. The Company acquired eOne Music through its acquisition of eOne in fiscal 2020. Based on the value of the net assets held by eOne Music, which included certain goodwill and intangible assets allocated as described above, to the eOne reportable segment and attributable to eOne Music, the Company recorded a pre-tax non-cash goodwill impairment charge of $108.8 million within Loss on Disposal of Business on the Consolidated Statements of Operations for the year ended December 26, 2021. See note 6 to the Company's consolidated financial statements in Part II, Item 8. Financial Statements, of this Form 10-K for details on the eOne Music goodwill impairment.
During the fourth quarter of 2021, the Company performed a quantitative goodwill analysis with respect to each of its reporting units to determine the existence and extent of any impairment. The quantitative analysis concluded that the fair values of the Company’s reporting units exceeded their carrying values. As a result of these assessments, the Company concluded there was no impairment to any of its reporting units as of December 26, 2021 other than the Music impairment loss noted above.
The estimation of future cash flows utilized in the evaluation of the Company’s goodwill requires significant judgments and estimates with respect to future revenues related to the respective asset and the future cash outlays related to those revenues. Actual revenues and related cash flows or changes in anticipated revenues and related cash flows could result in a change in this assessment and result in an impairment charge. The estimation of discounted cash flows also requires the selection of an appropriate discount rate. The use of different assumptions would increase or decrease estimated discounted cash flows and could increase or decrease the related impairment charge.
Intangible assets, other than those with indefinite lives, are reviewed for indications of impairment whenever events or changes in circumstances indicate the carrying value may not be recoverable.
During the fourth quarter of 2022, following the decision to cancel certain projects in conjunction with the Company's Blueprint 2.0 strategy shift, it was determined that there was a partial impairment of the Company's definite-lived Power Rangers intangible asset. As a result of these cancelled projects, changes to anticipated revenues and related cash flows led to the determination that carrying values of these intangible assets exceeded their related estimated future cash flows, thus indicating impairment. As a result, charges of $281.0 million were recorded in the fourth quarter of 2022 within Selling, Distribution and Administration within the Corporate and Other segment.
During 2020, the Company determined that certain of its definite-lived intangible entertainment and production assets related to properties, from both the legacy Hasbro business as well as properties acquired through the eOne acquisition, were impaired. It was determined that the carrying values of these intangible assets exceeded their related future cash flows, thus indicating impairment. As a result, charges of $20.1 and $30.7 million were recorded in the first and fourth quarters of 2020, respectively, within acquisition and related costs in the Company's consolidated statement of operations, included in Part II, Item 8. Financial Statements, of this Form 10-K.
There were no other triggering events in 2022, 2021 or 2020 which would indicate the Company's intangible assets were impaired.
Income Taxes
The Company’s annual income tax rate is based on its income, statutory tax rates, changes in prior tax positions and tax planning opportunities available in the various jurisdictions in which it operates. Significant judgment and estimates are required to determine the Company’s annual tax rate and evaluate its tax positions. Despite the Company’s belief that its tax return positions are fully supportable, these positions are subject to challenge and estimated liabilities are established in the event that these positions are challenged, and the Company is not successful in defending these challenges. These estimated liabilities, as well as the related interest, are adjusted in light of changing facts and circumstances such as the progress of a tax audit.
In May 2019, a public referendum held in Switzerland approved the Swiss Federal Act on Tax Reform and AHV Financing (TRAF) proposals previously approved by the Swiss Parliament. The Swiss tax reform measures were effective on January 1, 2020. Changes in tax reform include the abolishment of preferential tax regimes for holding companies, domicile companies and mixed companies at the cantonal level. The enacted changes in Swiss federal and cantonal tax, including cantonal transitional provisions adopted in 2021, were not material to the Company’s financial statements.
In certain cases, tax law requires items to be included in the Company’s income tax returns at a different time than when these items are recognized in the consolidated financial statements or at a different amount than that which is recognized in the consolidated financial statements. Some of these differences are permanent, such as expenses that are not deductible on the Company’s tax returns, while other differences are temporary and will reverse over time, such as depreciation expense. These differences that will reverse over time are recorded as deferred tax assets and liabilities on the consolidated balance sheets. Deferred tax assets represent deductions that have been reflected in the consolidated financial statements but have not yet been reflected in the Company’s income tax returns. Valuation allowances are established against deferred tax assets to the extent that it is determined that the Company will have insufficient future taxable income, including capital gains, to fully realize the future deductions or capital losses. Deferred tax liabilities represent expenses recognized on the Company’s income tax return that have not yet been recognized in the Company’s consolidated financial statements or income recognized in the consolidated financial statements that has not yet been recognized in the Company’s income tax return.
Business Combinations
The Company accounts for business combination under FASB Accounting Standards Codification Topic 805, Business Combinations (“Topic 805”). Identifiable assets acquired, liabilities assumed and any noncontrolling interests in the acquiree are recognized and measured as of the acquisition date at fair value. Goodwill is recognized to the extent by which the aggregate of the acquisition-date fair value of the consideration transferred and any noncontrolling interests in the acquiree exceed the recognized basis of the identifiable assets acquired, net of assumed liabilities. Determining the fair value of assets acquired, liabilities assumed and noncontrolling interests requires management’s judgment and often involves the use of significant estimates and assumptions, including assumptions with respect to future cash flows, discount rates and asset lives among other items.
Valuation of Equity Method Investment in Discovery Family Channel
The Company owns an interest in a joint venture, Discovery Family Channel (“the Network”), with Discovery Communications, Inc. (“Discovery”). The Company has determined that it does not meet the control requirements to consolidate the Network and accounts for the investment using the equity method of accounting. The Network was established to create a cable television network in the United States dedicated to high-quality children’s and family entertainment. In October 2009, the Company purchased an initial 50% share in the Network for a payment of $300 million and certain future tax payments based on the value of certain tax benefits expected to be received by the Company. In September 2014, the Company and Discovery amended their relationship with respect to the Network and Discovery increased its equity interest in the Network to 60% while the Company retained a 40% equity interest in the Network. In connection with the amendment, the Company and Discovery entered into an option agreement related to the Company’s remaining 40% ownership in the Network, initially exercisable during the one-year period following December 31, 2021. During 2022, the Company and Discovery agreed to extend the option exercise window to March 31, 2025. The exercise price of the option agreement is based upon 80% of the then fair market value of the Network, subject to a fair market value floor.
The Company tests its equity method investment in the Network for impairment annually. If an event occurs or circumstances change that indicate that the carrying value may not be recoverable, the Company will perform an interim test at that time. The Company’s valuation of its equity method investment in the Network includes assumptions surrounding forecasted revenue and expenses, a discount rate and a terminal growth rate, which are used to estimate the fair value of the investment and involve a high degree of subjectivity given the volatility in consumer interest when choosing entertainment media.
During the fourth quarter of 2021, the Company reviewed its investment in the Network for impairment and concluded that the fair value of the Company's interest in the joint venture was less than its carrying value. Recent accelerating changes in the cable distribution industry, including technological changes and expanding options for digital content offerings, has resulted in the fragmentation of viewership, declines in subscribers to the traditional cable bundle, and pricing pressure. These factors led to a lower valuation of the Network as compared to its carrying value. As a result, the Company recorded an impairment loss of $74.1 million, related to its investment in the Network, which is included in other (income) expense, net in the consolidated statements of operations for the year ended December 26, 2021. As result of the Network's revaluation, during the fourth quarter of 2021, the Company recorded a gain of $20.1 million in relation to the Company's Discovery option agreement described above. During the fourth quarter of 2022, the Company reviewed its investment in the Network for impairment and concluded there was no impairment to its investment in the Network as of December 25, 2022.
Contractual Obligations and Commercial Commitments
In the normal course of its business, the Company enters into contracts related to obtaining rights to produce products under license, which may require the payment of minimum guarantees. In addition, the Company enters into contractual commitments to obtain film and television content distribution rights and minimum guarantee commitments related to the purchase of film and television rights for content to be delivered in the future. The Company has also entered into operating leases for certain facilities and equipment. In addition, the Company has $3,711.2 million in principal amount of long-term debt outstanding at December 25, 2022. See note 20 to the consolidated financial statements included in Part II, Item 8. Financial Statements, of this Form 10-K for further information on the Company's contractual obligations and commercial commitments.
Other Expected Future Payments
From time to time, the Company may be party to arrangements, contractual or otherwise, whereby the Company may not be able to estimate the ultimate timing or amount of the related payments. These amounts are described below:
•Included in other liabilities in the consolidated balance sheets at December 25, 2022, the Company has a liability of $69.1 million of potential tax, interest and penalties for uncertain tax positions that have been taken or are expected to be taken in various income tax returns. The Company does not know the ultimate resolution of these uncertain tax positions and as such, does not know the ultimate amount or timing of payments related to this liability.
•At December 25, 2022, the Company had letters of credit and related instruments of approximately $11.9 million.
The Company believes that cash from operations and funds available through its commercial paper program or lines of credit, as described above under "Liquidity and Capital Resources", will allow the Company to meet these and the other contractual obligations and commercial commitments described above.
Financial Risk Management
The Company is exposed to market risks attributable to fluctuations in foreign currency exchange rates primarily as the result of sourcing products priced in U.S. dollars, Hong Kong dollars and Euros while marketing and selling those products in more than twenty currencies. Results of operations may be affected primarily by changes in the value of the U.S. dollar, Euro, British pound sterling, Canadian dollar, Brazilian real, and Mexican peso and, to a lesser extent, other currencies in Latin American and Asia Pacific countries.
To manage this exposure, the Company has hedged a portion of its forecasted foreign currency transactions using foreign exchange forward contracts and foreign exchange option contracts. At December 25, 2022, the Company estimates that a hypothetical immediate 10% depreciation of the U.S. dollar against all foreign currencies included in these foreign exchange forward contracts could result in an approximate $21.8 million decrease in the fair value of these instruments. A decrease in the fair value of these instruments would be offset by increases in the value of the forecasted foreign currency transactions.
The Company is also exposed to foreign currency risk with respect to its net cash and cash equivalents or short-term borrowing positions in currencies other than the U.S. dollar. The Company believes, however, that the on-going risk on the net exposure should not be material to its financial condition. In addition, the Company’s revenues and costs have been and will likely continue to be affected by changes in foreign currency rates. A significant change in foreign exchange rates can materially impact the Company’s revenues and earnings due to translation of foreign-denominated revenues and expenses. The Company does not hedge against translation impacts of foreign
exchange. From time to time, affiliates of the Company may make or receive intercompany loans in currencies other than their functional currency. The Company manages this exposure at the time the loan is made by using foreign exchange contracts.
The Company reflects all derivatives at their fair value as an asset or liability on the consolidated balance sheets. The Company does not speculate in foreign currency exchange contracts. At December 25, 2022, these contracts had net unrealized gains of $5.0 million, of which $7.5 million are recorded in prepaid expenses and other current assets, $0.3 million are recorded in other assets, $2.8 million are recorded in accrued liabilities. Included in accumulated other comprehensive earnings at December 25, 2022 are deferred gains of $3.0 million, net of tax, related to these derivatives.
At December 25, 2022, the Company had fixed rate long-term debt of $3,484.9 million. In May 2014 the Company issued an aggregate $600.0 million of long-term debt which consisted of $300.0 million of 3.15% Notes, subsequently repaid in 2021, and $300.0 million of 5.10% Notes due 2044. Prior to the May 2014 debt issuance, the Company entered into forward-starting interest rate swap agreements with a total notional value of $500.0 million to hedge the anticipated underlying U.S. Treasury interest rate. These interest rate swaps were matched with this debt issuance and were designated and effective as hedges of the change in future interest payments. At the date of issuance, the Company terminated these swap agreements and their fair value at the date of issuance was recorded in accumulated other comprehensive loss and is being amortized through the consolidated statements of operations using an effective interest rate method over the life of the related debt. Included in accumulated other comprehensive loss at December 25, 2022 are deferred losses, net of tax, of $14.9 million related to these derivatives.
Industry Trends, the Economy and Inflation
The principal market for the Company’s toys and games and licensed consumer products, is the retail sector. Revenues from the Company’s top five retail customers, accounted for approximately 35% of its consolidated net revenues in 2022, 36% in 2021 and 35% of its consolidated net revenues in 2020. The Company monitors the creditworthiness of its customers and adjusts credit policies and limits as it deems appropriate.
The Company’s revenue pattern continues to show the second half of the year to be more significant to its overall business for the full year. In 2022, approximately 57% of the Company’s full year net revenues were recognized in the second half of the year. The Company expects that this concentration will continue. The concentration of sales in the second half of the year increases the risk of (a) underproduction of popular items, (b) overproduction of less popular items, and (c) failure to achieve tight and compressed shipping schedules. The business of the Company is characterized by customer order patterns which vary from year to year largely because of differences in the degree of consumer acceptance of a product line, product availability, marketing strategies, inventory levels, policies of retailers and differences in overall economic conditions. Larger retailers generally maintain lower inventories throughout the year and purchase a greater percentage of product within or close to the fourth quarter holiday consumer buying season, which includes Christmas.
Quick response inventory management practices being used by retailers as well as growth in ecommerce result in orders increasingly placed for immediate delivery and fewer orders placed well in advance of shipment. Retailers are timing their orders so that they are filled by suppliers closer to the time of purchase by consumers. To the extent that retailers do not sell as much of their year-end inventory purchases during this holiday selling season as they had anticipated, their demand for additional product earlier in the following fiscal year may be curtailed, thus negatively impacting the Company’s future revenues. In 2022, the Company's inventory levels increased 23% compared to 2021. This increase reflects the impact of global supply chain disruptions, which began in late 2020 and continued into 2022, related to the COVID-19 pandemic and its after-effects. During the first half of 2022, the Company accelerated certain inventory purchases to ensure sufficient finished goods and raw material availability ahead of expected periods of high consumer demand. However, during the third quarter of 2022, as the effects of supply chain disruptions began to subside, most notably in the U.S, and Europe, the accelerated inventory purchases did not see corresponding increases in sales as consumers were impacted by the economic environment, including lower discretionary consumer income due to higher inflation and rising interest rates, leading to higher inventory levels as compared to prior years. In response, during the third quarter the Company launched incremental year-over-year promotional activity behind key holiday toy and game items to reduce inventory on hand and at retail and is continuing to manage inventory levels through closeout sales and by monitoring consumer purchase patterns to ensure adequate supply of new product while clearing excess supply to mitigate the risk of inventory obsolescence.
In addition to these inventory management challenges, the bankruptcy or other lack of success of one of the Company’s significant retailers could negatively impact the Company’s future revenues.
Unlike the Company's retail sales patterns, revenue patterns from the Company's entertainment businesses fluctuate based on the timing and popularity of television, film, streaming and digital content releases. Release dates are determined by factors including the timing of holiday periods, geographical release dates and competition in the market. In addition, entertainment business operating results fluctuate due to expenses recorded in relation to film and television productions and content such as program amortization costs and advertising expenses, which are incurred and recognized, beginning prior to initial releases and then continue throughout the related distribution windows.
Inflation
The impact of inflation on the Company's business operations has been significant during 2022; however, due to mitigating actions taken by the Company, such as price increases where deemed necessary, the impact of general price inflation on our financial position and results of operations has been reduced. The Company monitors the impact of inflation to its business operations on an ongoing basis and may need to adjust its prices further to mitigate the impact of changes to the rate of inflation in future periods. However, future volatility of general price inflation could affect consumer purchases of our products and spending on entertainment. Additionally, the impact of inflation on costs and availability of materials, costs for shipping and warehousing and other operational overhead, could adversely affect the Company's financial results.
Other Information
The Company is not aware of any material amounts of potential exposure relating to environmental matters and does not believe its environmental compliance costs or liabilities to be material to its operating results or financial position.
Item 7A. Quantitative and Qualitative Disclosures About Market Risk.
The information required by this item is included in Part II, Item 7. Management’s Discussion and Analysis of Financial Condition and Results of Operation, of this Form 10-K and is incorporated herein by reference.
Item 8. Financial Statements and Supplementary Data.
Report of Independent Registered Public Accounting Firm
To the Shareholders and Board of Directors
Hasbro, Inc.:
Opinion on the Consolidated Financial Statements
We have audited the accompanying consolidated balance sheets of Hasbro, Inc. and subsidiaries (the Company) as of December 25, 2022 and December 26, 2021, the related consolidated statements of operations, comprehensive earnings, cash flows, and shareholders’ equity and redeemable noncontrolling interests for each of the years in the three-year period ended December 25, 2022, and the related notes and financial statement schedule II - valuation and qualifying accounts (collectively, the consolidated financial statements). In our opinion, the consolidated financial statements present fairly, in all material respects, the financial position of the Company as of December 25, 2022 and December 26, 2021, and the results of its operations and its cash flows for each of the years in the three-year period ended December 25, 2022, in conformity with U.S. generally accepted accounting principles.
We also have audited, in accordance with the standards of the Public Company Accounting Oversight Board (United States) (PCAOB), the Company’s internal control over financial reporting as of December 25, 2022, based on criteria established in Internal Control – Integrated Framework (2013) issued by the Committee of Sponsoring Organizations of the Treadway Commission, and our report dated February 22, 2023 expressed an unqualified opinion on the effectiveness of the Company’s internal control over financial reporting.
Basis for Opinion
These consolidated financial statements are the responsibility of the Company’s management. Our responsibility is to express an opinion on these consolidated financial statements based on our audits. We are a public accounting firm registered with the PCAOB and are required to be independent with respect to the Company in accordance with the U.S. federal securities laws and the applicable rules and regulations of the Securities and Exchange Commission and the PCAOB.
We conducted our audits in accordance with the standards of the PCAOB. Those standards require that we plan and perform the audit to obtain reasonable assurance about whether the consolidated financial statements are free of material misstatement, whether due to error or fraud. Our audits included performing procedures to assess the risks of material misstatement of the consolidated financial statements, whether due to error or fraud, and performing procedures that respond to those risks. Such procedures included examining, on a test basis, evidence regarding the amounts and disclosures in the consolidated financial statements. Our audits also included evaluating the accounting principles used and significant estimates made by management, as well as evaluating the overall presentation of the consolidated financial statements. We believe that our audits provide a reasonable basis for our opinion.
Critical Audit Matter
The critical audit matter communicated below is a matter arising from the current period audit of the consolidated financial statements that was communicated or required to be communicated to the audit committee and that: (1) relates to accounts or disclosures that are material to the consolidated financial statements and (2) involved our especially challenging, subjective, or complex judgments. The communication of a critical audit matter does not alter in any way our opinion on the consolidated financial statements, taken as a whole, and we are not, by communicating the critical audit matter below, providing a separate opinion on the critical audit matter or on the accounts or disclosures to which it relates.
Fair value of the Power Rangers definite-lived intangible asset
As discussed in Note 1 and 6 to the consolidated financial statements, the Company reviews intangible assets with definite lives for impairment whenever events or changes in circumstances occur that indicate that the carrying value may not be recoverable. The carrying value of definite-lived intangible assets as of December 25, 2022 was $738.9 million, a portion of which related to the Company’s Power Rangers definite-lived intangible asset. During the fourth quarter of 2022, the Company recognized an impairment charge of $281.0 million related to its Power Rangers definite-lived intangible asset.
We identified the evaluation of the fair value of the Power Rangers definite-lived intangible asset as a critical audit matter. A high degree of subjective auditor judgment was required to evaluate the forecasted revenue and
discount rate assumptions used to estimate fair value. The estimate of fair value was sensitive to changes in the discount rate. In addition, valuation professionals with specialized skills and knowledge were required to assess the discount rate.
The following are the primary procedures we performed to address this critical audit matter. We evaluated the design and tested the operating effectiveness of certain internal controls related to the definite-lived intangible asset impairment process. This included controls related to the development of the forecasted revenue and discount rate assumptions used to estimate fair value. We assessed the Company’s ability to accurately estimate forecasted revenue by comparing historical forecasts to actual results. We evaluated the reasonableness of forecasted revenue by comparing it to available external industry data and other internal information. We involved valuation professionals with specialized skills and knowledge, who assisted in:
•evaluating the discount rate by comparing it to a discount rate range that was independently developed using publicly available data for comparable entities
•developing an estimate of the fair value of the intangible asset using the Company’s assumption of forecasted cash flows and an independently developed discount rate, which was then compared to the Company’s fair value estimate.
/s/ KPMG LLP
We have not been able to determine the specific year that we began serving as the Company’s auditor, however, we are aware that we have served as the Company’s auditor since at least 1968.
Providence, Rhode Island
February 22, 2023
HASBRO, INC. AND SUBSIDIARIES
Consolidated Balance Sheets
December 25, 2022 and December 26, 2021
(Millions of Dollars Except Share Data)
| | | | | | | | | | | |
| 2022 | | 2021 |
| ASSETS |
| Current assets | | | |
Cash and cash equivalents including restricted cash of $14.5 in 2022 and $35.8 in 2021 | $ | 513.1 | | | 1,019.2 | |
Accounts receivable, less allowance for credit losses of $20.0 in 2022 and $22.9 in 2021 | 1,132.4 | | | 1,500.4 | |
| Inventories | 676.8 | | | 552.1 | |
| Prepaid expenses and other current assets | 676.8 | | | 656.4 | |
| Total current assets | 2,999.1 | | | 3,728.1 | |
| Property, plant and equipment, net | 422.8 | | | 421.1 | |
| Other assets | | | |
| Goodwill | 3,470.1 | | | 3,419.6 | |
| Other intangibles, net | 814.6 | | | 1,172.0 | |
| Other | 1,589.3 | | | 1,297.0 | |
| Total other assets | 5,874.0 | | | 5,888.6 | |
| Total assets | $ | 9,295.9 | | | 10,037.8 | |
| LIABILITIES, NONCONTROLLING INTERESTS AND SHAREHOLDERS’ EQUITY |
| Current liabilities | | | |
| Short-term borrowings | $ | 142.4 | | | 0.8 | |
| Current portion of long-term debt | 113.2 | | | 200.1 | |
| Accounts payable | 427.3 | | | 580.2 | |
| Accrued liabilities | 1,506.8 | | | 1,674.8 | |
| Total current liabilities | 2,189.7 | | | 2,455.9 | |
| Long-term debt | 3,711.2 | | | 3,824.2 | |
| Other liabilities | 533.1 | | | 670.7 | |
| Total liabilities | 6,434.0 | | | 6,950.8 | |
| Redeemable noncontrolling interests | — | | | 23.9 | |
| Shareholders’ equity | | | |
Preference stock of $2.50 par value. Authorized 5,000,000 shares; none issued | — | | | — | |
Common stock of $0.50 par value. Authorized 600,000,000 shares; issued 220,286,736 shares as of 2022 and 2021 | 110.1 | | | 110.1 | |
| Additional paid-in capital | 2,540.6 | | | 2,428.0 | |
| Retained earnings | 4,071.4 | | | 4,257.8 | |
| Accumulated other comprehensive loss | (254.9) | | | (235.3) | |
Treasury stock, at cost, 82,106,383 shares in 2022 and 82,066,136 shares in 2021 | (3,634.4) | | | (3,534.7) | |
| Noncontrolling interests | 29.1 | | | 37.2 | |
| Total shareholders’ equity | 2,861.9 | | | 3,063.1 | |
| Total liabilities, noncontrolling interests and shareholders’ equity | $ | 9,295.9 | | | 10,037.8 | |
See accompanying notes to consolidated financial statements.
HASBRO, INC. AND SUBSIDIARIES
Consolidated Statements of Operations
Fiscal Years Ended in December
(Millions of Dollars Except Per Share Data) | | | | | | | | | | | | | | | | | |
| 2022 | | 2021 | | 2020 |
| Net revenues | $ | 5,856.7 | | | 6,420.4 | | | 5,465.4 | |
| Costs and expenses: | | | | | |
| Cost of sales | 1,911.8 | | | 1,927.5 | | | 1,718.9 | |
| Program cost amortization | 555.5 | | | 628.6 | | | 387.1 | |
| Royalties | 493.0 | | | 620.4 | | | 570.0 | |
| Product development | 307.9 | | | 315.7 | | | 259.5 | |
| Advertising | 387.3 | | | 506.6 | | | 412.7 | |
| Amortization of intangible assets | 105.3 | | | 116.8 | | | 144.7 | |
| Selling, distribution and administration | 1,666.1 | | | 1,432.7 | | | 1,252.1 | |
| Loss on disposal of business | 22.1 | | | 108.8 | | | — | |
| Acquisition and related costs | — | | | — | | | 218.6 | |
| Total costs and expenses | 5,449.0 | | | 5,657.1 | | | 4,963.6 | |
| Operating profit | 407.7 | | | 763.3 | | | 501.8 | |
| Non-operating expense (income): | | | | | |
| Interest expense | 171.0 | | | 179.7 | | | 201.1 | |
| Interest income | (11.8) | | | (5.4) | | | (7.4) | |
| Other expense (income), net | (13.0) | | | 7.1 | | | (14.0) | |
Total non-operating expense, net | 146.2 | | | 181.4 | | | 179.7 | |
| Earnings before income taxes | 261.5 | | | 581.9 | | | 322.1 | |
| Income taxes | 58.5 | | | 146.6 | | | 96.7 | |
| Net earnings | 203.0 | | | 435.3 | | | 225.4 | |
| Net earnings attributable to noncontrolling interests | (0.5) | | | 6.6 | | | 2.9 | |
| Net earnings attributable to Hasbro, Inc. | $ | 203.5 | | | 428.7 | | | 222.5 | |
| | | | | |
| Per common share | | | | | |
| Net earnings attributable to Hasbro, Inc. | | | | | |
| Basic | $ | 1.47 | | | 3.11 | | | 1.62 | |
| Diluted | $ | 1.46 | | | 3.10 | | | 1.62 | |
| Cash dividends declared | $ | 2.80 | | | 2.72 | | | 2.72 | |
See accompanying notes to consolidated financial statements.
HASBRO, INC. AND SUBSIDIARIES
Consolidated Statements of Comprehensive Earnings
Fiscal Years Ended in December
(Millions of Dollars)
| | | | | | | | | | | | | | | | | |
| 2022 | | 2021 | | 2020 |
| Net earnings | $ | 203.0 | | | 435.3 | | | 225.4 | |
| Other comprehensive earnings (loss): | | | | | |
| Foreign currency translation adjustments, net of tax | (45.4) | | | (61.9) | | | 10.1 | |
| Unrealized holding (losses) gains on available-for-sale securities, net of tax | (0.3) | | | (0.1) | | | 0.6 | |
| Net gains on cash flow hedging activities, net of tax | 10.2 | | | 13.5 | | | 2.4 | |
| Changes in unrecognized pension amounts, net of tax | 30.8 | | | 3.4 | | | (6.6) | |
| Reclassifications to earnings, net of tax: | | | | | |
| Net (gains) losses on cash flow hedging activities | (16.2) | | | 2.6 | | | (19.3) | |
| Amortization of unrecognized pension and postretirement amounts | 1.3 | | | 2.2 | | | 2.0 | |
| | | | | |
| Other comprehensive loss, net of tax | (19.6) | | | (40.3) | | | (10.8) | |
| Total comprehensive earnings, net of tax | 183.4 | | | 395.0 | | | 214.6 | |
| Total comprehensive (loss) earnings attributable to noncontrolling Interests | (0.5) | | | 6.6 | | | 2.9 | |
| Total comprehensive earnings attributable to Hasbro, Inc. | $ | 183.9 | | | 388.4 | | | 211.7 | |
See accompanying notes to consolidated financial statements.
HASBRO, INC. AND SUBSIDIARIES
Consolidated Statements of Cash Flows
Fiscal Years Ended in December
(Millions of Dollars)
| | | | | | | | | | | | | | | | | |
| 2022 | | 2021 | | 2020 |
| Cash flows from operating activities | | | | | |
| Net earnings | $ | 203.0 | | | 435.3 | | | 225.4 | |
| Adjustments to reconcile net earnings to net cash provided by operating activities: | | | | | |
| Depreciation of property, plant and equipment | 127.3 | | | 163.3 | | | 120.2 | |
| Loss on disposal of business | 22.1 | | | 108.8 | | | — | |
| Impairment of intangibles and production assets | 281.0 | | | — | | | 71.5 | |
| Loss on Discovery investment | — | | | 74.1 | | | — | |
| Fair value adjustment on Discovery Option | — | | | (20.1) | | | (1.5) | |
| | | | | |
| Amortization of intangible assets | 105.3 | | | 116.8 | | | 144.7 | |
| Program cost amortization | 555.5 | | | 628.6 | | | 387.1 | |
| Deferred income taxes | (130.1) | | | 36.0 | | | 30.3 | |
| Stock-based compensation | 83.4 | | | 97.8 | | | 49.7 | |
| Other non-cash items | 3.2 | | | (1.5) | | | 9.0 | |
| Changes in operating assets and liabilities, net of acquired and disposed balances: | | | | | |
| Decrease (increase) in accounts receivable | 339.6 | | | (159.5) | | | 210.8 | |
| (Increase) decrease in inventories | (139.5) | | | (173.9) | | | 62.8 | |
| Decrease (increase) in prepaid expenses and other current assets | 17.0 | | | (30.6) | | | (7.5) | |
| Program spend, net | (767.7) | | | (697.3) | | | (438.9) | |
| Increase (decrease) in accounts payable and accrued liabilities | (278.7) | | | 313.2 | | | 49.3 | |
| Change in net deemed repatriation tax | (18.4) | | | (18.4) | | | (18.4) | |
| Other | (30.1) | | | (54.7) | | | 81.8 | |
| Net cash provided by operating activities | 372.9 | | | 817.9 | | | 976.3 | |
| Cash flows from investing activities | | | | | |
| Additions to property, plant and equipment | (174.2) | | | (132.7) | | | (125.8) | |
| Investments and acquisitions, net of cash acquired | (146.3) | | | — | | | (4,412.9) | |
| Proceeds from sale of business, net of cash | — | | | 378.5 | | | — | |
| | | | | |
| Other | 7.5 | | | (3.8) | | | 38.5 | |
| Net cash provided (utilized) by investing activities | (313.0) | | | 242.0 | | | (4,500.2) | |
| Cash flows from financing activities | | | | | |
| Net proceeds from borrowings | 3.8 | | | 144.0 | | | 1,112.6 | |
| Repayments of borrowings | (206.0) | | | (1,220.1) | | | (275.5) | |
| Net proceeds (repayments) of other short-term borrowings | 141.7 | | | (5.6) | | | (8.6) | |
| Purchases of common stock | (125.0) | | | — | | | — | |
| Stock-based compensation transactions | 74.2 | | | 30.6 | | | 16.6 | |
| Dividends paid | (385.3) | | | (374.5) | | | (372.7) | |
| Payments related to tax withholding for share-based compensation | (24.0) | | | (13.7) | | | (6.0) | |
| Redemption of equity instruments | — | | | — | | | (47.4) | |
| | | | | |
| | | | | |
| Debt extinguishment costs | — | | | (9.1) | | | — | |
| | | | | |
| Other | (32.7) | | | (11.4) | | | (13.1) | |
| Net cash (utilized) provided by financing activities | (553.3) | | | (1,459.8) | | | 405.9 | |
| Effect of exchange rate changes on cash | (12.7) | | | (30.6) | | | (12.7) | |
| Decrease in cash, cash equivalents and restricted cash | (506.1) | | | (430.5) | | | (3,130.7) | |
| Cash, cash equivalents and restricted cash at beginning of year | 1,019.2 | | | 1,449.7 | | | 4,580.4 | |
| Cash, cash equivalents and restricted cash at end of year | $ | 513.1 | | | 1,019.2 | | | 1,449.7 | |
| Supplemental information | | | | | |
| Interest paid | $ | 161.7 | | | 171.9 | | | 182.9 | |
| Income taxes paid | $ | 177.2 | | | 160.5 | | | 81.6 | |
See accompanying notes to consolidated financial statements.
HASBRO, INC. AND SUBSIDIARIES
Consolidated Statements of Shareholders’ Equity and Redeemable Noncontrolling Interests
(Millions of Dollars)
| | | | | | | | | | | | | | | | | | | | | | | | | | | | | | | | | | | | | | | | | | | | | | | | | | |
| Common
Stock | | Additional
Paid-in
Capital | | Retained
Earnings | | Accumulated
Other
Comprehensive
Loss | | Treasury
Stock | | Non-controlling Interests | | Total
Shareholders’
Equity | | | Redeemable
Non-controlling
Interests |
| Balance, December 29, 2019 | $ | 110.1 | | | 2,275.8 | | | 4,354.7 | | | (184.2) | | | (3,560.7) | | | — | | | $ | 2,995.7 | | | | $ | — | |
| Noncontrolling interests related to acquisition of eOne | — | | | — | | | — | | | — | | | — | | | 43.3 | | | 43.3 | | | | 26.2 | |
| Net earnings attributable to Hasbro, Inc. | — | | | — | | | 222.5 | | | — | | | — | | | — | | | 222.5 | | | | — | |
| Net earnings attributable to noncontrolling interests | — | | | — | | | — | | | — | | | — | | | 2.5 | | | 2.5 | | | | 0.4 | |
| Buyout of noncontrolling interest | — | | | 0.6 | | | — | | | — | | | — | | | — | | | 0.6 | | | | — | |
| Other comprehensive loss | — | | | — | | | — | | | (10.8) | | | — | | | — | | | (10.8) | | | | — | |
| Stock-based compensation transactions | — | | | 1.9 | | | — | | | — | | | 8.7 | | | — | | | 10.6 | | | | — | |
| | | | | | | | | | | | | | | | |
| Stock-based compensation expense | — | | | 49.4 | | | — | | | — | | | 0.3 | | | — | | | 49.7 | | | | — | |
| Dividends declared | — | | | — | | | (373.0) | | | — | | | — | | | — | | | (373.0) | | | | — | |
| Distributions paid to noncontrolling owners and other foreign exchange | — | | | 1.4 | | | — | | | — | | | — | | | (5.8) | | | (4.4) | | | | (2.2) | |
| Balance, December 27, 2020 | $ | 110.1 | | | 2,329.1 | | | 4,204.2 | | | (195.0) | | | (3,551.7) | | | 40.0 | | | $ | 2,936.7 | | | | $ | 24.4 | |
| Net earnings attributable to Hasbro, Inc. | — | | | — | | | 428.7 | | | — | | | — | | | — | | | 428.7 | | | | — | |
| Net earnings attributable to noncontrolling interests | — | | | — | | | — | | | — | | | — | | | 3.3 | | | 3.3 | | | | 3.3 | |
| Change in put option value | — | | | (1.3) | | | — | | | — | | | — | | | — | | | (1.3) | | | | — | |
| Other comprehensive loss | — | | | — | | | — | | | (40.3) | | | — | | | — | | | (40.3) | | | | — | |
| Stock-based compensation transactions | — | | | 1.2 | | | — | | | — | | | 15.6 | | | — | | | 16.8 | | | | — | |
| Stock-based compensation expense | — | | | 96.4 | | | — | | | — | | | 1.4 | | | — | | | 97.8 | | | | — | |
| Dividends declared | — | | | — | | | (375.1) | | | — | | | — | | | — | | | (375.1) | | | | — | |
| Distributions paid to noncontrolling owners and other foreign exchange | — | | | 2.6 | | | — | | | — | | | — | | | (6.1) | | | (3.5) | | | | (3.8) | |
| | | | | | | | | | | | | | | | |
| | | | | | | | | | | | | | | | |
| Balance, December 26, 2021 | $ | 110.1 | | | 2,428.0 | | | 4,257.8 | | | (235.3) | | | (3,534.7) | | | 37.2 | | | $ | 3,063.1 | | | | $ | 23.9 | |
| Net earnings attributable to Hasbro, Inc. | — | | | — | | | 203.5 | | | — | | | — | | | — | | | 203.5 | | | | — | |
| Net earnings (loss) attributable to noncontrolling interests | — | | | — | | | — | | | — | | | — | | | (1.1) | | | (1.1) | | | | 0.6 | |
| Change in put option value | — | | | (0.4) | | | — | | | — | | | — | | | — | | | (0.4) | | | | — | |
| Other comprehensive loss | — | | | — | | | — | | | (19.6) | | | — | | | — | | | (19.6) | | | | — | |
| Stock-based compensation transactions | — | | | 23.5 | | | — | | | — | | | 25.0 | | | — | | | 48.5 | | | | — | |
| Purchase of common stock | — | | | — | | | — | | | — | | | (125.0) | | | — | | | (125.0) | | | | — | |
| Stock-based compensation expense | — | | | 83.1 | | | — | | | — | | | 0.3 | | | — | | | 83.4 | | | | |
| Dividends declared | — | | | 1.9 | | | (389.9) | | | — | | | — | | | — | | | (388.0) | | | | — | |
| Distributions paid to noncontrolling owners and other foreign exchange | — | | | — | | | — | | | — | | | — | | | (2.5) | | | (2.5) | | | | (1.9) | |
| Buyout of redeemable noncontrolling interest | — | | | 4.5 | | | — | | | — | | | — | | | (4.5) | | | — | | | | (22.6) | |
| Balance, December 25, 2022 | $ | 110.1 | | | 2,540.6 | | | 4,071.4 | | | (254.9) | | | (3,634.4) | | | 29.1 | | | $ | 2,861.9 | | | | $ | — | |
See accompanying notes to consolidated financial statements.
HASBRO, INC. AND SUBSIDIARIES
Notes to Consolidated Financial Statements
(1) Summary of Significant Accounting Policies
Preparation of Consolidated Financial Statements
The preparation of the consolidated financial statements in conformity with accounting principles generally accepted in the United States of America requires management to make estimates and assumptions that affect the amounts reported in the consolidated financial statements and notes thereto. Actual results could differ from those estimates.
Principles of Consolidation
The consolidated financial statements include the accounts of Hasbro, Inc. and all majority-owned subsidiaries (“Hasbro” or the “Company”). Investments representing 20% to 50% ownership interests in other companies are accounted for using the equity method. For those majority-owned subsidiaries that are not 100% owned by Hasbro, the interests of the minority owners are accounted for as noncontrolling interests.
All intercompany balances and transactions have been eliminated.
Fiscal Year
Hasbro’s fiscal year ends on the last Sunday in December. The fiscal years ended December 25, 2022, December 26, 2021, and December 27, 2020 were all fifty-two week periods.
Blueprint 2.0 and Operational Excellence Charges
On October 4, 2022, the Company announced the results of its strategic review, Blueprint 2.0, a new customer-centric approach focusing on fewer, bigger brands, expanded licensing, branded entertainment, and high-margin growth in games, digital and direct. As the Company began implementing this new strategy, charges of $322.4 million were recorded for the year ended December 25, 2022, consisting of: a loss associated with the disposal of non-core businesses within the Entertainment segment of $21.1 million included within Loss on Disposal of Business; asset impairments and charges within the Corporate and Other segment of $281.3 million, of which $281.0 million relates to a partial impairment of the Company's definite-lived Power Rangers intangible asset, in Selling, Distribution and Administration; incurred incremental asset charges related to inventory reserve and asset write offs of $14.9 million in Cost of Sales within the Consumer Products segment; and, strategy related asset impairments within the Entertainment segment of $4.1 million related to the discontinuation of certain projects. The businesses exited do not constitute a material part of the Company's operations. See note 6 for further information.
In support of Blueprint 2.0, the Company also announced an Operational Excellence program. Charges of $106.4 million were recorded for the year ended December 25, 2022 related to this program, consisting of severance and other employee charges of $94.1 million and program related transformation office and consulting fees of $12.3 million included within Selling, Distribution, and Administration within the Corporate and Other segment.
D&D Beyond Acquisition
On May 19, 2022, the Company acquired D&D Beyond, a strategic, complementary acquisition of the premier digital content platform for DUNGEONS & DRAGONS, which has accelerated our direct-to-fans capability for DUNGEONS & DRAGONS in physical and digital play. The all-cash transaction in the amount of $146.3 million was funded with cash on hand. The allocation of assets acquired includes $81.4 million to intangible assets, $64.7 million to goodwill, with the remainder allocated to property, plant, and equipment.
Cash, Cash Equivalents and Restricted Cash
Cash and cash equivalents include all cash balances and highly liquid investments purchased with an initial maturity to the Company of three months or less. Under the Company's production financing facilities, certain of the Company's cash is restricted while the financing is outstanding. At December 25, 2022, $14.5 million of the Company's cash was restricted by such facilities. See Production Financing below and notes 9 and 11 for further details.
Marketable Securities
Included in marketable securities is common stock in a public company arising from a business relationship. This type of investment is also included in prepaid expenses and other current assets in the accompanying consolidated balance sheets.
HASBRO, INC. AND SUBSIDIARIES
Notes to Consolidated Financial Statements — (Continued)
Accounts Receivable and Allowance for Credit Losses
Credit is granted to customers predominantly on an unsecured basis. Credit limits and payment terms are established based on extensive evaluations made on an ongoing basis throughout the fiscal year with regard to the financial performance, cash generation, financing availability and liquidity status of each customer. The majority of customers are formally reviewed at least annually; more frequent reviews are performed based on the customer’s financial condition and the level of credit being extended. For customers on credit who are experiencing financial difficulties, management performs additional financial analyses before shipping orders. The Company uses a variety of financial transactions, based on availability and cost, to increase the collectability of certain of its accounts, including letters of credit, credit insurance, and requiring cash in advance of shipping.
The Company records an allowance for credit losses for accounts receivable based on management’s expected credit losses. Management's estimate of expected credit losses is based on its assessment of the business environment, customers’ financial condition, historical collection experience, accounts receivable aging and customer disputes.
Accounts receivable, net on the consolidated balance sheet represents amounts due from customers less the allowance for credit losses as well as allowances for discounts, rebates and returns.
Inventories
Inventories are valued at the lower of cost (first-in, first-out) or net realizable value. Based upon a consideration of quantities on hand, actual and projected sales volume, anticipated product selling price and product lines planned to be discontinued, slow-moving and obsolete inventory is written down to its estimated net realizable value. At both December 25, 2022 and December 26, 2021, substantially all inventory is comprised of finished goods.
Equity Method Investment
For the Company’s equity method investments, only the Company’s investment in and amounts due to and from the equity method investment are included in the consolidated balance sheets and only the Company’s share of the equity method investment’s earnings (losses) is included in other expense (income), net in the consolidated statements of operations. Dividends, cash distributions, loans or other cash received from the equity method investment, additional cash investments, loan repayments or other cash paid to the investee are included in the consolidated statements of cash flows.
The Company reviews its equity method investments for impairment on a periodic basis. If it has been determined that the fair value of the equity investment is less than its related carrying value and that this decline is other-than-temporary, the carrying value of the investment is adjusted downward to reflect these declines in value. The Company owns an interest in a joint venture, Discovery Family Channel (“the Network”), with Discovery Communications, Inc. (“Discovery”). The Company has determined that it does not meet the control requirements to consolidate the Network and accounts for the investment using the equity method of accounting.
During the fourth quarter of 2021, the Company reviewed its investment in the Network for impairment and concluded that the fair value of the Company's interest in the joint venture was less than its carrying value, and as such, recorded an impairment loss of $74.1 million, which is included in other expense (income), net in the consolidated statements of operations for the year ended December 26, 2021. This impairment was caused by the impact of accelerating changes in the cable distribution industry.
The Company and Discovery are also party to an option agreement with respect to the Network. The Company has recorded a liability for this option agreement at fair value which is included in other liabilities in the consolidated balance sheets. Unrealized gains and losses on this option are recognized in other expense (income), net in the consolidated statements of operations as they occur. In 2021, as a result of the impairment loss recognized on the investment in the Network, the Company adjusted the option's fair value resulting in a $20.1 million gain.
See notes 7 and 14 for additional information.
HASBRO, INC. AND SUBSIDIARIES
Notes to Consolidated Financial Statements — (Continued)
Noncontrolling Interests
The financial results and position of the noncontrolling interests acquired through the acquisition of eOne are included in their entirety in the Company’s consolidated statements of operations and consolidated balance sheets beginning with the first quarter of 2020. The value of the redeemable noncontrolling interests is presented in the consolidated balance sheets as temporary equity between liabilities and shareholders' equity. During 2022, the Company redeemed all outstanding redeemable noncontrolling interest in Renegade Entertainment, LLC, the only entity for which the Company previously held redeemable noncontrolling interest. During 2022, the Company's outstanding non-redeemable noncontrolling interest in Round Room Live, LLC was included with the disposition of certain non-core businesses associated with the Company's Blueprint 2.0 strategy shift. The value of the non-redeemable noncontrolling interests is presented in the consolidated balance sheets within total shareholders' equity. Earnings (losses) attributable to the redeemable noncontrolling interests and non-redeemable noncontrolling interests are presented as a separate line on the consolidated statements of operations which is necessary to identify those earnings (losses) specifically attributable to Hasbro. The Company's remaining non-redeemable noncontrolling interests as of December 25, 2022 is shown below.
| | | | | | | | | | | | | | | | | | | | | | | | | | |
| Name | | Country of Incorporation | | Ownership Interest | | Proportion Held | | Principal Activity |
| Astley Baker Davies Limited | | England and Wales | | Nonredeemable | | 70% | | Ownership of intellectual property |
| | | | | | | | |
| | | | | | | | |
Property, Plant and Equipment, Net
Property, plant and equipment are stated at cost less accumulated depreciation. Depreciation is computed using accelerated and straight-line methods to depreciate the cost of property, plant and equipment over their estimated useful lives. The principal lives, in years, used in determining depreciation rates of various assets are: land improvements 15 to 19, buildings and improvements 15 to 25 and machinery and equipment (including computer hardware and software) 3 to 12. Depreciation expense is classified in the consolidated statements of operations based on the nature of the property and equipment being depreciated. Tools, dies and molds are depreciated over their useful lives, which is generally three years, using an accelerated method. The Company generally owns all tools, dies and molds related to its products.
Property, plant and equipment, net is reviewed for impairment whenever events or circumstances indicate the carrying value may not be recoverable. Recoverability is measured by a comparison of the carrying amount of the asset or related asset group to future undiscounted cash flows expected to be generated by the asset or asset group. If such assets are considered to be impaired, the impairment to be recognized would be measured by the amount by which the carrying value of the assets exceeds their fair value wherein the fair value is the appraised value. Furthermore, assets to be disposed of are carried at the lower of the net book value or their estimated fair value less disposal costs.
Goodwill and Other Intangible Assets, Net
Goodwill results from acquisitions the Company has made over time. Substantially all of the Company's other intangible assets consist of the cost of acquired product rights. In establishing the value of such rights, the Company considers existing trademarks, copyrights, patents, license agreements and other product-related rights. These rights were valued on their acquisition dates based on the anticipated future cash flows from the underlying product lines. The Company has certain intangible assets related to the Tonka and Milton Bradley acquisitions that have indefinite lives.
Goodwill and intangible assets deemed to have indefinite lives are not amortized and are tested for impairment at least annually. The annual goodwill test begins with a qualitative assessment, where qualitative factors and their impact on critical inputs are assessed to determine whether it is more likely than not that the fair value of a reporting unit is less than its carrying value. If the Company determines that a reporting unit has an indication of impairment based on the qualitative assessment, it is required to perform a quantitative assessment.
During the third quarter of 2022, the Company determined to exit certain non-core businesses within the Entertainment segment. A revaluation of the effected businesses resulted in a pre-tax non-cash goodwill impairment charge of $11.8 million, recorded within Loss on Disposal of Business in the Consolidated Statement of Operations, and within the Entertainment segment for the year ended December 25, 2022.
During the fourth quarter of 2022 the Company performed a qualitative goodwill assessment with respect to each of its reporting units and determined that the fair values of the Company’s reporting units exceeded their
HASBRO, INC. AND SUBSIDIARIES
Notes to Consolidated Financial Statements — (Continued)
carrying values. As a result of this assessment, the Company concluded that, other than the Loss on Disposal goodwill impairment noted above, there was no other impairment to any of its reporting units. Accordingly, no goodwill impairment was recorded as a result of the qualitative test for the year ended December 25, 2022.
During the first quarter of 2021, the Company realigned its financial reporting structure creating its current three principal reporting segments: Consumer Products, Wizards of the Coast and Digital Gaming and Entertainment. As a result of these changes, the Company reallocated its goodwill among the revised reporting units based on the change in relative fair values of the respective reporting units. (See note 6 for details on the allocation of goodwill across the Company's reporting structure.)
In the third of quarter 2021, the Company sold eOne Music for net proceeds of $397.0 million. The Company acquired eOne Music through its acquisition of eOne in 2020. Based on the value of the net assets held by eOne Music, which included certain goodwill and intangible assets allocated to the eOne reportable segment and attributable to eOne Music, the Company recorded a pre-tax non-cash goodwill impairment charge of $108.8 million within Loss on Disposal of Business on the Consolidated Statements of Operations for the year ended December 26, 2021. See note 6 for details on the eOne Music goodwill impairment.
Prior to its 2021 annual impairment test, the Company had not performed a quantitative assessment of goodwill since 2013. Given the length of time since the last quantitative analysis, as well as the changes that have occurred within its goodwill balances since that time, the Company elected to perform a quantitative assessment of goodwill for each reporting unit in the fourth quarter of 2021. Based on the quantitative assessment with respect to each of its reporting units, the Company determined that the fair values of its reporting units exceeded their carrying values. As a result of this assessment, the Company concluded that there was no impairment to any of its reporting units. Accordingly, other than the Music goodwill impairment loss noted above, there was no goodwill impairment recorded for the year ended December 26, 2021.
The Company's intangible assets having definite lives are being amortized over periods ranging from two to nineteen years, primarily using the straight-line method.
The Company reviews intangible assets with definite lives for impairment whenever events or changes in circumstances indicate the carrying value may not be recoverable. Recoverability is measured by a comparison of the carrying amount of the asset to future undiscounted cash flows expected to be generated by the asset or asset group. If such assets were considered to be impaired, the impairment to be recognized would be measured by the amount by which the carrying value of the assets exceeds their fair value wherein that fair value is determined based on discounted cash flows.
During the fourth quarter of 2022, following the decision to cancel certain projects in conjunction with the Company's Blueprint 2.0 strategy shift, it was determined that there was a partial impairment of the Company's definite-lived Power Rangers intangible asset. As a result, a charge of $281.0 million was recorded during the fourth quarter of 2022 within Selling, Distribution and Administration in the Corporate and Other segment.
There were no other triggering events in 2022 or 2021 which would indicate the Company's intangible assets were impaired.
During 2020, the Company determined that certain of its definite-lived intangible entertainment and production assets related to properties, from both the legacy Hasbro business as well as properties acquired through the eOne acquisition, were impaired. It was determined that the carrying values of these intangible assets exceeded their related future cash flows. As a result, charges of $20.0 million and $30.7 million were recorded in the first and fourth quarters, respectively, within Acquisition and Related Costs in the Company's Consolidated Statement of Operations.
Financial Instruments
Hasbro’s financial instruments include cash and cash equivalents, accounts receivable, short-term borrowings, accounts payable and certain accrued liabilities. At December 25, 2022, the carrying cost of these instruments approximated their fair value. The Company’s financial instruments at December 25, 2022 also include long-term borrowings (see note 11 for carrying cost and related fair values) as well as certain assets and liabilities measured at fair value (see notes 14 and 18).
HASBRO, INC. AND SUBSIDIARIES
Notes to Consolidated Financial Statements — (Continued)
Production Financing
Production financing relates to financing facilities for certain of the Company's television and film productions. Production financing facilities are arranged on an individual production basis by either special purpose production subsidiaries, each secured by the assets and future revenues of such production subsidiaries, which are non-recourse to the Company's assets, or through a senior revolving credit facility obtained in November 2021, dedicated to production financing. These facilities typically have maturities of less than two years while the titles are in production, and are repaid once the production is delivered and all tax credits, broadcaster pre-sales and international sales have been received. In connection with the production of a television or film program, the Company records initial cash outflows within cash flows from operating activities due to its investment in the production and concurrently records cash inflows within cash flows from financing activities from the production financing it normally obtains. Under these facilities, certain of the Company's cash is restricted while the financing is outstanding. At December 25, 2022, $14.5 million of the Company's cash was restricted by such facilities. For further details, see note 11.
Revenue Recognition
Revenue is recognized when control of the promised goods, intellectual property or production is transferred to the customers or licensees, in an amount that reflects the consideration the Company expects to be entitled to in exchange for transferring those goods. The Company accounts for a contract when it has approval and commitment from both parties, the rights of the parties are identified, payment terms are identified, the contract has commercial substance, and collectability of consideration is probable.
The majority of the Company’s revenues are derived from sales of finished products to customers. Revenues from sales of finished products to customers accounted for 76%, 74% and 77% of the Company’s revenues for the years ended December 25, 2022, December 26, 2021 and December 27, 2020, respectively. When determining whether control of the finished products has transferred to the customer, the Company considers any future performance obligations. Generally, the Company has no post-shipment obligation on sales of finished products to customers and revenues from product sales are recognized upon passing of title to the customer, which is generally at the time of shipment. Any shipping and handling activities that are performed by the Company, whether before or after a customer has obtained control of the products, are considered activities to fulfill our obligation to transfer the products, and are recorded as incurred within selling, distribution, and administration expenses. The Company offers various discounts, rebates, allowances, returns, and markdowns to its customers (collectively, “allowances”), all of which are considered when determining the transaction price. Certain allowances are fixed and determinable at the time of sale and are recorded at the time of sale as a reduction to revenues. Other allowances can vary depending on future outcomes such as customer sales volume (“variable consideration”). The Company estimates the amount of variable consideration using the expected value method. In estimating the amount of variable consideration using the expected value method, the Company considers various factors including but not limited to: customer terms, historical experience, any expected deviations from historical experience, and existing or expected market conditions. The Company then records an estimate of variable consideration as a reduction to revenues at the time of sale. The Company adjusts its estimate of variable consideration at least quarterly or when facts and circumstances used in the estimation process may change. Historically, adjustments to estimated variable consideration have not been material.
The Company enters into contracts to license its intellectual property, which consists of its brands, in various channels including but not limited to: consumer products such as apparel or home goods, within formats such as online and digital games, within venues such as theme parks, or within formats such as television and film. The licensees pay the Company either a sales-based or usage-based royalty, or a combination of both, for use of the brands, in some cases subject to minimum guaranteed amounts or fixed fees. The license of the Company’s brands provide access to the intellectual property over the term of the license, generally without any other performance obligation of the Company other than keeping the intellectual property active, and is therefore considered a right-to-access license of symbolic intellectual property. The Company records sales-based or usage-based royalty revenues for right-to-access licenses at the occurrence of the licensees’ subsequent sale or usage. When the arrangement includes a minimum guarantee, the Company records the minimum guarantee on a ratable basis over the term of the license period and does not record the sales-based or usage-based royalty revenues until they exceed the minimum guarantee.
HASBRO, INC. AND SUBSIDIARIES
Notes to Consolidated Financial Statements — (Continued)
The Company also produces, sells and licenses television and film content for distribution to third parties in formats that include broadcast, digital streaming, transactional and theatrical. These are intellectual property licenses where the licensees pay either a fixed fee for the content license or a variable fee in the form of a sales based royalty. The content that the Company delivers to its licensees typically has stand-alone functionality, generally without any other performance obligation of the Company, and is therefore considered a right-to-use license of functional intellectual property. The Company records revenues for right-to-use licenses once the license period has commenced and the licensee has the ability to use the delivered content. In arrangements where the licensee pays the Company a fixed fee for multiple seasons or multiple series of programming, arrangement fees are recorded as revenues based upon their relative fair values. The Company also earns advertising revenues from certain content made available on free to consumer, streaming video on demand platforms where the Company earns a portion of the advertising revenues earned by the service provider. The performance obligation is met and revenue is recorded when the user accesses the Company’s content through the streaming platform.
The Company develops and hosts digital games featuring its brands within the games, such as Magic: The Gathering Arena and D&D Beyond. The Company does not charge a fee to the end users for the download of the games or the ability to play the games. The end users make in-application purchases of virtual currencies with such purchased virtual currencies to be used in the games. The Company records revenues from in-application purchases based on either the usage patterns of the players or the player’s estimated life, depending on the nature of the game item purchased in exchange for virtual currency. For items recognized over the player's estimated life, the Company currently recognizes digital game's revenues ratably within six months of purchase. The Company controls all aspects of the digital goods delivered to the consumer.
The Company also develops certain digital games available for online and offline play, such as Dungeons & Dragons: Dark Alliance, which are delivered to customers through digital downloads or as physical discs compatible for play through various gaming platforms. Initially these game purchases may come with future software updates to be delivered as needed, or additional downloadable content, delivered when made available by the Company. For these games, the Company allocates the revenue to the identified performance obligations. For the software license performance obligation, the Company recognizes revenue when control of the gaming license has been transferred to the customer, typically at the time of purchase. If applicable, revenue related to future downloadable content or software updates is recognized ratably over the estimated service period.
Costs of Sales
Cost of sales primarily consists of purchased materials, labor, tooling, manufacturing overheads and other inventory-related costs such as obsolescence.
Investment in Productions and Acquired Content Rights and Program Cost Amortization
The Company incurs costs in connection with the production of television programming and live action movies. The majority of these costs are capitalized by the Company as they are incurred and amortized using the individual-film-forecast method, whereby these costs are amortized in the proportion that the current year’s revenues bear to management’s estimate of total ultimate revenues as of the beginning of such period related to the program. Ultimate revenue estimates are periodically reviewed and adjustments, if any, will result in changes to amortization rates and estimated accruals for residuals and participations. Ultimate revenue includes estimates over a period not to exceed ten years following the date of release of the production. Ultimate revenue used in amortization of acquired content rights is estimated over the life of the acquired rights but no longer than a period of ten years. These capitalized costs are reported at the lower of cost, less accumulated amortization, or fair value, and reviewed for impairment when an event or change in circumstances occurs that indicates that impairment may exist. The fair value is determined using a discounted cash flow model which is primarily based on management’s future revenue and cost estimates. Certain of these agreements require the Company to pay minimum guaranteed advances ("MGs") for participations and residuals. MGs are recognized in the consolidated balance sheets when a liability arises, usually on delivery of the television or film program to the Company. The current portion of MGs are recorded as Payables and Accrued Liabilities and the long-term portion are recorded as Other Liabilities.
HASBRO, INC. AND SUBSIDIARIES
Notes to Consolidated Financial Statements — (Continued)
Royalties
The Company enters into license agreements with strategic partners, inventors, designers and others for the use of intellectual properties in its products. In addition, the Company enters into minimum guarantee royalty arrangements related to the purchase of film and television rights for content to be delivered in the future. These agreements may call for payment in advance or future payment of minimum guaranteed amounts. Amounts paid in advance are recorded as an asset and charged to expense when the related revenue is recognized in the consolidated statements of operations. If all or a portion of the minimum guaranteed amounts appear not to be recoverable through future use of the rights obtained under the license, the non-recoverable portion of the guaranty is charged to expense at that time.
Advertising
Production costs of commercials are expensed in the fiscal year during which the production is first aired. The costs of other advertising and promotion programs are expensed in the fiscal year incurred.
Shipping and Handling
Hasbro expenses costs related to the shipment and handling of goods to customers as incurred. For 2022, 2021 and 2020, these costs were $247.7 million, $264.1 million and $228.0 million, respectively, and are included in selling, distribution and administration expenses.
Operating Leases
The Company leases certain property, vehicles and other equipment through operating leases. Operating lease right-of-use assets are recorded within Property, Plant and Equipment and the related liabilities recorded within Accrued Liabilities and Other Liabilities on the Company’s consolidated balance sheets. The Company has no material finance leases.
Operating lease assets represent the Company’s right to use the underlying asset for the lease term and lease liabilities represent an obligation to make lease payments according to the terms of the lease. Operating lease assets and liabilities are recognized at the inception of the lease agreement based on the estimated present value of lease payments over the lease term, using our incremental borrowing rate based on information available on the lease commencement date. The Company capitalizes non-lease components for equipment leases, but expenses non-lease components as incurred for real estate leases. Leases with an expected term of 12 months or less are not capitalized. Lease expense under such leases is recorded straight line over the life of the lease. For further details on the Company's operating leases, see note 17.
Income Taxes
Hasbro uses the asset and liability approach for financial accounting and reporting of income taxes. Deferred income taxes reflect the net tax effect of temporary differences between the carrying amount of assets and liabilities for financial reporting purposes and the amounts used for income tax purposes. Deferred taxes are measured using rates expected to apply to taxable income in years in which those temporary differences are expected to reverse. The effect of a change in tax rates on deferred tax assets and liabilities is recognized in income in the period that includes the enactment date.
The Company recognizes deferred tax assets to the extent it believes that these assets are more likely than not to be realized. In making such a determination, all available positive and negative evidence is considered, including future reversals of existing taxable temporary differences, projected future taxable income, tax-planning strategies, and results of recent operations. The assumptions utilized in determining future taxable income require significant judgment and are consistent with the plans and estimates used to manage the underlying businesses. Actual operating results in future years could differ from current assumptions, judgments and estimates. However, the Company believes that it is more likely than not that most of the deferred tax assets recorded on our Consolidated Balance Sheets will ultimately be realized. A valuation allowance is recorded to reduce deferred tax assets to the net amount believed to be more likely than not to be realized. As of December 25, 2022, the valuation allowance of $189.8 million was primarily related to net operating losses acquired as part of the eOne acquisition. If it is determined that our deferred tax assets will be realizable in the future in excess of their net recorded amount, an adjustment would be made to the deferred tax asset valuation allowance, which would reduce the provision for income taxes.
HASBRO, INC. AND SUBSIDIARIES
Notes to Consolidated Financial Statements — (Continued)
The Company uses a two-step process for the measurement of uncertain tax positions that have been taken or are expected to be taken in a tax return. The first step is a determination of whether the tax position should be recognized in the consolidated financial statements. The second step determines the measurement of the tax position. The Company records potential interest and penalties on uncertain tax positions as a component of income tax expense.
Foreign Currency Translation
Foreign currency assets and liabilities are translated into U.S. dollars at period-end exchange rates, and revenues, costs and expenses are translated at weighted average exchange rates during each reporting period. Net earnings include gains or losses resulting from foreign currency transactions and, when required, translation gains and losses resulting from the use of the U.S. dollar as the functional currency in highly inflationary economies. Other gains and losses resulting from translation of financial statements are a component of other comprehensive earnings (loss).
Pension Plans, Postretirement and Postemployment Benefits
Pension expense and related amounts in the consolidated balance sheets are based on actuarial computations of current and future benefits. Actual results that differ from the actuarial assumptions are accumulated and, if outside a certain corridor, amortized over future periods and, therefore affect recognized expense in future periods. The corridor used for this purpose is equal to 10% of the greater of plan liabilities or market asset values, and future periods vary by plan, but generally equal the actuarially determined average expected future working lifetime of active plan participants. The Company’s policy is to fund amounts which are required by applicable regulations and which are tax deductible. The estimated amounts of future payments to be made under other retirement programs are being accrued currently over the period of active employment and are also included in pension expense. Hasbro has a contributory postretirement health and life insurance plan covering substantially all employees who retired under any of its United States defined benefit pension plans prior to January 1, 2020, and meet certain age and length of service requirements. During the fourth quarter of 2019, with the approval of the Compensation Committee of the Company's Board of Directors, the Company announced the elimination of the contributory post-retirement health and life insurance coverage for employees whose retirement eligibility begins after December 31, 2019. See note 16 for further discussion.
The cost of providing these benefits on behalf of employees who retired prior to 1993 has been substantially borne by the Company.
The cost of providing benefits on behalf of eligible employees who retire after 1992 is borne by the employee. The Company also has several plans covering certain groups of employees, which may provide benefits to such employees following their period of employment but prior to their retirement. The Company measures the costs of these obligations based on actuarial computations.
Stock-Based Compensation
The Company has a stock-based employee compensation plan for employees and non-employee members of the Company’s Board of Directors. Under this plan the Company may grant stock options at or above the fair market value of the Company’s stock, as well as restricted stock, restricted stock units and contingent stock performance awards. All awards are measured at fair value at the date of the grant and amortized as expense on a straight-line basis over the requisite service period of the award. For awards contingent upon Company performance, the measurement of the expense for these awards is based on the Company’s current estimate of its performance over the performance period. See note 15 for further discussion.
Dividend Equivalent Units
Beginning with employee stock incentive awards granted in 2022, the payment of cash dividends to shareholders also results in the crediting of Dividend Equivalent Units (“DEUs”) to holders of restricted stock units ("RSUs") and contingent stock performance awards ("PSUs") granted under the Company's Restated 2003 Stock Incentive Plan, as amended, for employees as defined and described in note 15. The DEUs are credited as additional RSUs or PSUs and settled concurrently with the vesting of associated awards. DEUs are forfeited in the event the underlying RSUs or PSU's do not vest. The dividend equivalent value of forfeitable DEUs is treated as a reduction of retained earnings or, if the Company is in a retained deficit position, as a reduction of additional paid-in capital.
HASBRO, INC. AND SUBSIDIARIES
Notes to Consolidated Financial Statements — (Continued)
Risk Management Contracts
Hasbro uses foreign currency forward and option contracts to mitigate the impact of currency rate fluctuations on firmly committed and projected future foreign currency transactions. These over-the-counter contracts, which hedge future purchases of inventory, product sales, television and film production costs and production financing as well as other cross-border currency requirements not denominated in the functional currency of the business unit, are primarily denominated in United States, Canadian and Hong Kong dollars as well as Euros and British pound sterling. All contracts are entered into with a number of counterparties, all of which are major financial institutions. The Company believes that a default by a counterparty would not have a material adverse effect on the financial condition of the Company. Hasbro does not enter into derivative financial instruments for speculative purposes.
At the inception of the contracts, Hasbro designates its derivatives as either cash flow or fair value hedges. The Company formally documents all relationships between hedging instruments and hedged items as well as its risk management objectives and strategies for undertaking various hedge transactions. All hedges designated as cash flow hedges are linked to forecasted transactions and the Company assesses, both at the inception of the hedge and on an on-going basis, the effectiveness of the derivatives used in hedging transactions in offsetting changes in the cash flows of the forecasted transaction.
The Company records all derivatives, such as foreign currency exchange contracts, on the consolidated balance sheets at fair value. Changes in the derivative fair values that are designated as cash flow hedges are deferred and recorded as a component of Accumulated Other Comprehensive Loss (“AOCE”) until the hedged transactions occur and are then recognized in the consolidated statements of operations. The Company’s foreign currency contracts hedging anticipated cash flows are designated as cash flow hedges. When it is determined that a derivative is not highly effective as a hedge, the Company discontinues hedge accounting prospectively. Any gain or loss deferred through that date remains in AOCE until the forecasted transaction occurs, at which time it is reclassified to the consolidated statements of operations. To the extent the transaction is no longer deemed probable of occurring, hedge accounting treatment is discontinued and amounts deferred would be reclassified to the consolidated statements of operations. In the event hedge accounting requirements are not met, gains and losses on such instruments are included in the consolidated statements of operations. The Company uses derivatives to economically hedge intercompany loans denominated in foreign currencies. The Company does not use hedge accounting for these contracts as changes in the fair value of these contracts are substantially offset by changes in the fair value of the intercompany loans.
Prior to the issuance of certain long-term Notes due 2021 and 2044, the Company entered into a forward-starting interest rate swap contract to hedge the anticipated U.S. Treasury interest rates on the anticipated debt issuance. These instruments, which were designated and effective as hedges, were terminated on the date of the related debt issuance and the then fair value of these instruments was recorded to AOCE and amortized through the consolidated statements of operations using an effective interest rate method over the life of the related debt.
Net Earnings Per Common Share
Basic net earnings per share is computed by dividing net earnings by the weighted average number of shares outstanding for the year as well as awards that have not been issued but all contingencies have been met. Diluted net earnings per share is similar except that the weighted average number of shares outstanding is increased by dilutive securities, and net earnings are adjusted, if necessary, for certain amounts related to dilutive securities. Dilutive securities include shares issuable upon exercise of stock options for which the market price exceeds the exercise price, less shares which could have been purchased by the Company with the related proceeds. Dilutive securities also include shares issuable under restricted stock unit award agreements. Options and restricted stock unit awards totaling 2.7 million, 2.2 million and 2.8 million for 2022, 2021, and 2020, respectively, were excluded from the calculation of diluted earnings per share because to include them would have been antidilutive.
HASBRO, INC. AND SUBSIDIARIES
Notes to Consolidated Financial Statements — (Continued)
A reconciliation of net earnings and average number of shares for each of the three fiscal years ended December 25, 2022 is as follows:
| | | | | | | | | | | | | | | | | | | | | | | | | | | | | | | | | | | |
| 2022 | | 2021 | | 2020 |
| (In millions, except per share data) | Basic | | Diluted | | Basic | | Diluted | | Basic | | Diluted |
| Net earnings attributable to Hasbro, Inc. | $ | 203.5 | | | 203.5 | | | 428.7 | | | 428.7 | | | 222.5 | | | 222.5 | |
| Average shares outstanding | 138.7 | | | 138.7 | | | 138.0 | | | 138.0 | | | 137.3 | | | 137.3 | |
| Effect of dilutive securities: | | | | | | | | | | | |
| Options and other share-based awards | — | | | 0.2 | | | — | | | 0.4 | | | — | | | 0.3 | |
| Equivalent shares | 138.7 | | | 138.9 | | | 138.0 | | | 138.4 | | | 137.3 | | | 137.6 | |
| Net earnings per share attributable to Hasbro, Inc. | $ | 1.47 | | | 1.46 | | | 3.11 | | | 3.10 | | | 1.62 | | | 1.62 | |
HASBRO, INC. AND SUBSIDIARIES
Notes to Consolidated Financial Statements — (Continued)
(2) Revenue Recognition
Contract Assets and Liabilities
In the ordinary course of business, the Company’s Consumer Products, Wizards of the Coast and Digital Gaming and Entertainment segments enter into contracts to license certain of the Company’s intellectual property, providing licensees right-to-use or access such intellectual property for use in the production and sale of consumer products and digital game development, and for use within content for distribution over streaming platforms and for television and film. The Company also licenses owned television and film content for distribution to third parties in formats that include broadcast, digital streaming and theatrical. Through these arrangements, the Company may receive advanced royalty payments from licensees, either in advance of a licensees’ subsequent sales to customers or, prior to the completion of the Company’s performance obligation. In addition, the Company’s Wizards of the Coast and Digital Gaming segment may receive advanced payments from end users of its digital games at the time of the initial purchase or through in-application purchases. These digital gaming revenues are recognized over a period of time, determined based on player usage patterns or the estimated playing life of the user or when additional downloadable content is made available. The Company defers revenues on all licensee and digital gaming advanced payments until the respective performance obligations are satisfied. The Company records the aggregate deferred revenues as contract liabilities, with the current portion recorded within Accrued Liabilities and the long-term portion recorded as Other Non-current Liabilities in the Company’s consolidated balance sheets. The Company records contract assets, primarily related to (1) minimum guarantees being recognized in advance of contractual invoicing, which are recognized ratably over the terms of the respective license periods, and (2) film and television distribution revenues recorded for content delivered, where payment will occur over the license term. The current portion of contract assets is recorded in Prepaid Expenses and Other Current Assets, respectively, and the long-term portion is recorded within Other Long-Term Assets.
The change in the carrying amount of contract assets and liabilities for the year ended December 25, 2022 is as follows:
| | | | | | | |
| (In millions) | December 25, 2022 | | |
| Assets | | | |
| Balance at beginning of the year | $ | 391.1 | | | |
| Recognized in current year | 1,064.8 | | | |
| | | |
| Amounts reclassified to accounts receivable | (855.1) | | | |
| Foreign currency impact | (6.4) | | | |
| Ending Balance | $ | 594.4 | | | |
| | | |
| Liabilities | | | |
| Balance at beginning of the year | $ | 121.2 | | | |
| Recognized in current year | 337.5 | | | |
| Amounts in beginning balance reclassified to revenue | (58.5) | | | |
| Current year amounts reclassified to revenue | (278.9) | | | |
| Dispositions | (4.0) | | | |
| Foreign currency impact | (4.3) | | | |
| Ending Balance | $ | 113.0 | | | |
Unsatisfied Performance Obligations
Unsatisfied performance obligations relate primarily to in-production television content to be delivered in the future under existing agreements with partnering content providers such as broadcasters, distributors, television networks and subscription video on demand services. As of December 25, 2022, unrecognized revenue attributable to unsatisfied performance obligations expected to be recognized in the future was $274.2 million. Of this amount, we expect to recognize approximately $225.8 million in 2023, $44.3 million in 2024, and $4.0 million in 2025. These amounts include only fixed consideration.
HASBRO, INC. AND SUBSIDIARIES
Notes to Consolidated Financial Statements — (Continued)
Accounts Receivable and Allowance for Credit Losses
The Company’s balance for accounts receivable on the consolidated balance sheets as of December 25, 2022 and December 26, 2021 are primarily from contracts with customers. The Company had no material expense for credit losses in the years ended December 25, 2022, December 26, 2021, or December 27, 2020.
Disaggregation of revenues
The Company disaggregates its revenues from contracts with customers by reportable segment: Consumer Products, Wizards of the Coast and Digital Gaming and Entertainment. The Company further disaggregates revenues within its Consumer Products segment by major geographic region: North America, Europe, Latin America, and Asia Pacific; within its Wizards of the Coast and Digital Gaming segment by category: Tabletop Gaming and Digital and Licensing Gaming; and within its Entertainment segment by category: Film & TV, Family Brands, and Music and Other. Finally, the Company disaggregates its revenues by brand portfolio into five brand categories: Franchise Brands, Partner Brands, Hasbro Gaming, Emerging Brands and TV/Film/Entertainment. We believe these collectively depict how the nature, amount, timing and uncertainty of revenue and cash flows are affected by economic factors. See note 21 for additional information on disaggregation of revenues.
In addition to the required disclosures below, see further discussion of the Company's revenue recognition policy in note 1.
(3) Business Combination
On December 30, 2019, the Company completed its acquisition of Entertainment One ("eOne"), a global independent studio that specializes in the development, acquisition, production, distribution and sales of entertainment content. The aggregate purchase price of $4.6 billion was comprised of $3.8 billion of cash consideration for shares outstanding and $0.8 billion related to the redemption of eOne's outstanding senior secured notes and the payoff of eOne's revolving credit facility. The Company financed the acquisition with proceeds from the following debt and equity financings: (1) the issuance of senior unsecured notes in an aggregate principal amount of $2.4 billion in November 2019, (2) the issuance of 10.6 million shares of common stock at a public offering price of $95.00 per share in November 2019 (resulting in net proceeds of $975.2 million) and (3) $1.0 billion in term loans provided by a term loan agreement, which were borrowed on the date of closing. See note 11 for further discussion of the issuance of the senior unsecured notes and term loan agreement.
eOne's results of operations and financial position have been included in the Company's consolidated financial statements and accompanying footnotes beginning on December 30, 2019, the date of the acquisition, and the start of the Company's fiscal year 2020.
The acquisition was accounted for as a business combination under FASB Accounting Standards Codification Topic 805, Business Combinations (“Topic 805”). Pursuant to Topic 805, the Company allocated the eOne purchase price to tangible and identifiable intangible assets acquired and liabilities assumed based on their estimated fair values as of the acquisition date. Goodwill in the amount of $3.2 billion was recorded as a result of the acquisition, which is the excess of the purchase price over those fair values and represents the value placed on the combined company’s brand building capabilities, storytelling capabilities and franchise economics in TV, film and other mediums to strengthen Hasbro brands. In addition, the acquisition goodwill depicts added benefits of long-term profitable growth through in-sourcing toy and game production for the acquired preschool brands and cost-synergies, as well as future revenue growth opportunities. The goodwill recorded as part of this acquisition was included within the Entertainment and Consumer Products segments for the year ended December 27, 2020. The goodwill associated with the acquisition will not be amortized for financial reporting purposes and will not be deductible for federal tax purposes. See note 6 for information on the Company's goodwill reallocation during the first quarter of 2021 and the goodwill impairment charge recorded in the second quarter of 2021 as a result of the sale of the eOne music business, which was completed during the third quarter of 2021.
In 2020, the Company incurred charges of $218.6 million related to the eOne acquisition recorded in acquisition and related costs within the Company’s Consolidated Statement of Operations, of which $133.2 million. were recorded within the Entertainment segment and the remaining charges were recorded within the Corporate and Other segment.
HASBRO, INC. AND SUBSIDIARIES
Notes to Consolidated Financial Statements — (Continued)
See note 3 to the consolidated financial statements included in Part ll, Item 8. Financial Statements, of the Company's Form 10-K for the year ended December 27, 2020 for further information on the Company's acquisition of eOne.
(4) Other Comprehensive Earnings (Loss)
Components of other comprehensive earnings (loss) are presented within the consolidated statements of comprehensive earnings. The following table presents the related tax effects on changes in other comprehensive earnings (loss) for each of the three fiscal years ended December 25, 2022.
| | | | | | | | | | | | | | | | | |
| (In millions) | 2022 | | 2021 | | 2020 |
| Other comprehensive earnings (loss), tax effect: | | | | | |
| Tax benefit (expense) on unrealized holding gains (losses) | $ | 0.1 | | | $ | — | | | (0.2) | |
| Tax expense on cash flow hedging activities | (1.3) | | | (1.0) | | | (3.4) | |
Tax (expense) benefit on foreign currency translation amounts | — | | | (7.2) | | | 2.1 | |
| Tax (expense) benefit on changes in unrecognized pension amounts | (5.9) | | | (1.5) | | | 2.6 | |
| Reclassifications to earnings, tax effect: | | | | | |
| Tax expense (benefit) on cash flow hedging activities | 1.6 | | | (0.5) | | | 4.3 | |
| Tax benefit on amortization of unrecognized pension and postretirement amounts reclassified to the consolidated statements of operations | (0.3) | | | (0.6) | | | (0.8) | |
| | | | | |
| Total tax effect on other comprehensive earnings (loss) | $ | (5.8) | | | (10.8) | | | 4.6 | |
HASBRO, INC. AND SUBSIDIARIES
Notes to Consolidated Financial Statements — (Continued)
Changes in the components of accumulated other comprehensive loss, net of tax for each of the three fiscal years ended December 25, 2022 are as follows:
| | | | | | | | | | | | | | | | | | | | | | | | | | | | | |
| (In millions) | Pension and
Postretirement
Amounts | | Gains
(Losses) on
Derivative
Instruments | | Unrealized
Holding
Gains (Losses) on
Available
for-Sale
Securities | | Foreign
Currency
Translation
Adjustments | | Total
Accumulated
Other
Comprehensive
Earnings (Loss) |
| 2022 | | | | | | | | | |
| Balance at December 26, 2021 | $ | (35.1) | | | (6.0) | | | 0.2 | | | (194.4) | | | (235.3) | |
| Current period other comprehensive earnings (loss) | 30.8 | | | 10.2 | | | (0.3) | | | (45.4) | | | (4.7) | |
| Reclassifications from AOCE to earnings | 1.3 | | | (16.2) | | | — | | | — | | | (14.9) | |
| Balance at December 25, 2022 | $ | (3.0) | | | (12.0) | | | (0.1) | | | (239.8) | | | (254.9) | |
| 2021 | | | | | | | | | |
| Balance at December 27, 2020 | $ | (40.7) | | | (22.1) | | | 0.3 | | | (132.5) | | | (195.0) | |
| | | | | | | | | |
| Current period other comprehensive earnings (loss) | 3.4 | | | 13.5 | | | (0.1) | | | (61.9) | | | (45.1) | |
| Reclassifications from AOCE to earnings | 2.2 | | | 2.6 | | | — | | | — | | | 4.8 | |
| Balance at December 26, 2021 | $ | (35.1) | | | (6.0) | | | 0.2 | | | (194.4) | | | (235.3) | |
| 2020 | | | | | | | | | |
| Balance at December 29, 2019 | $ | (36.1) | | | (5.2) | | | (0.3) | | | (142.6) | | | (184.2) | |
| Current period other comprehensive earnings (loss) | (6.6) | | | 2.4 | | | 0.5 | | | 10.1 | | | 6.4 | |
| Reclassifications from AOCE to earnings | 2.0 | | | (19.3) | | | — | | | — | | | (17.2) | |
| Balance at December 27, 2020 | $ | (40.7) | | | (22.1) | | | 0.3 | | | (132.5) | | | (195.0) | |
Gains (Losses) on Derivative Instruments
At December 25, 2022, the Company had remaining net deferred gains on foreign currency forward contracts, net of tax, of $3.0 million in AOCE. These instruments hedge payments related to inventory purchased in the fourth quarter of 2022 or forecasted to be purchased in 2023, intercompany expenses expected to be paid or received during 2023, television and movie production costs paid in 2022 or expected to be paid in 2023 or 2024, and cash receipts for sales made at the end of the fourth quarter of 2022 or forecasted to be made in 2023. These amounts will be reclassified into the consolidated statements of operations upon the sale of the related inventory or recognition of the related sales expenses.
In addition to foreign currency forward contracts, the Company entered into hedging contracts on future interest payments related to the 3.15% Notes, that were repaid in full in the aggregate principal amount of $300.0 million during the first quarter of 2021 (See note 11), and the 5.10% Notes due 2044. At the date of debt issuance, these contracts were terminated and the fair value on the date of settlement was deferred in AOCE and is being amortized to interest expense over the life of the related notes using the effective interest rate method. At December 25, 2022, deferred losses, net of tax, of $14.9 million related to these instruments remained in AOCE. For the year ended December 25, 2022, losses, net of tax of $0.7 million related to these hedging instruments were reclassified from AOCE to net earnings. For the years ended December 26, 2021 and December 27, 2020, losses, net of tax of $1.0 million and $1.4 million, respectively, related to these hedging instruments were reclassified from AOCE to net earnings.
Of the net deferred gains included in AOCE at December 25, 2022, the Company expects net gains of approximately $1.3 million to be reclassified to the consolidated statements of operations within the next 12 months. However, the amount ultimately realized in earnings is dependent on the fair value of the hedging instruments on the settlement dates.
HASBRO, INC. AND SUBSIDIARIES
Notes to Consolidated Financial Statements — (Continued)
See notes 16 and 18 for additional discussion on reclassifications from AOCE to earnings.
(5) Property, Plant and Equipment
| | | | | | | | | | | |
| (In millions) | 2022 | | 2021 |
| Land and improvements | $ | 3.1 | | | 3.2 | |
| Buildings and improvements | 221.1 | | | 220.3 | |
| Machinery, equipment and software | 672.4 | | | 604.7 | |
| 896.6 | | | 828.2 | |
| Less accumulated depreciation | 654.5 | | | 630.0 | |
| 242.1 | | | 198.2 | |
| Tools, dies and molds, net of accumulated depreciation | 62.4 | | | 63.6 | |
| 304.5 | | | 261.8 | |
| Right of use assets | 239.6 | | | 256.4 | |
| Less accumulated depreciation | 121.3 | | | 97.1 | |
| Total property, plant and equipment, net | $ | 422.8 | | | 421.1 | |
Expenditures for maintenance and repairs which do not materially extend the life of the assets are charged to operations as incurred. In 2022, 2021 and 2020 the Company recorded $127.3 million, $163.3 million and $120.2 million, respectively, of depreciation expense.
See note 17 for additional discussion on right of use assets.
(6) Goodwill and Intangible Assets
Goodwill
During the first quarter of 2021, the Company realigned its financial reporting structure creating the following three principal reporting segments: Consumer Products, Wizards of the Coast and Digital Gaming and Entertainment. In our realignment, some, but not all, of our reporting units were changed. As a result of these changes, the Company reallocated its goodwill among the revised reporting units based on the changes in relative fair values of the respective reporting units.
Changes in the carrying amount of goodwill, by operating segment, for the years ended December 25, 2022 and December 26, 2021 are as follows:
| | | | | | | | | | | | | | | | | | | | | | | | | | |
| (In millions) | Consumer Products | | Wizards of the Coast and Digital Gaming | | Entertainment | | | Total |
| 2022 | | | | | | | | |
| Balance at December 26, 2021 | $ | 1,584.9 | | | 307.3 | | | 1,527.4 | | | | 3,419.6 | |
| Acquired during the period | — | | | 64.7 | | | — | | | | 64.7 | |
| Impairment during the period | — | | | — | | | (11.8) | | | | (11.8) | |
| | | | | | | | |
| Foreign exchange translation | (0.2) | | | (0.5) | | | (1.7) | | | | (2.4) | |
| Balance at December 25, 2022 | $ | 1,584.7 | | | 371.5 | | | 1,513.9 | | | | 3,470.1 | |
| 2021 | | | | | | | | |
| Balance at December 27, 2020 | $ | 1,385.7 | | | 53.1 | | | 2,252.9 | | | | 3,691.7 | |
| Goodwill allocation | 199.4 | | | 254.2 | | | (453.6) | | | | — | |
| Goodwill associated with disposal of business | — | | | — | | | (162.2) | | | | (162.2) | |
| Impairment during the period | — | | | — | | | (108.8) | | | | (108.8) | |
| Foreign exchange translation | (0.2) | | | — | | | (0.9) | | | | (1.1) | |
| Balance at December 26, 2021 | $ | 1,584.9 | | | 307.3 | | | 1,527.4 | | | | 3,419.6 | |
HASBRO, INC. AND SUBSIDIARIES
Notes to Consolidated Financial Statements — (Continued)
A portion of the Company’s goodwill and other intangible assets reside in the Corporate segment of the business. For purposes of the goodwill impairment testing, these assets are allocated to the reporting units within the Company’s operating segments.
The Company performs an annual impairment assessment on goodwill. This annual impairment assessment is performed in the fourth quarter of the Company’s fiscal year. In addition, if an event occurs or circumstances change that indicate that the carrying value may not be recoverable, the Company will perform an interim impairment test at that time.
On May 19, 2022, the Company completed its acquisition of D&D Beyond for $146.3 million, which was funded with cash on hand. Based on the valuation of these assets, $64.7 million was allocated to goodwill within the Wizards of the Coast and Digital Gaming segment during the second quarter of 2022.
During the third quarter of 2022, the Company determined to exit certain non-core businesses within the Entertainment segment. A revaluation of the effected businesses resulted in a pre-tax non-cash goodwill impairment charge of $11.8 million, recorded within Loss on Disposal of Business in the Consolidated Statement of Operations, and within the Entertainment segment for the year ended December 25, 2022.
During the fourth quarter of 2022, the Company performed a qualitative goodwill assessment with respect to each of its reporting units and determined that the fair values of the Company’s reporting units exceeded their carrying values. As a result of this assessment, the Company concluded that, other than the Loss on Disposal goodwill impairment noted above, there was no other impairment to any of its reporting units. Accordingly, no goodwill impairment was recorded as a result of the qualitative test for the year ended December 25, 2022.
During the second quarter of 2021, the Company entered into a definitive agreement to sell the Entertainment One Music business ("eOne Music") for an aggregate sales price of $385.0 million, subject to certain closing adjustments related to working capital and net debt. Based on the value of the net assets held by eOne Music, which included goodwill and intangible assets allocated to eOne Music as part of the eOne acquisition, the Company recorded a pre-tax non-cash goodwill impairment charge of $108.8 million, during 2021, within Loss on Disposal of Business in the Consolidated Statements of Operations, and within the Entertainment segment. On June 29, 2021, during the Company's fiscal third quarter, the eOne Music sale was completed and associated goodwill and intangible assets were removed from the consolidated financial statements. There were no underlying business conditions that provided an indication of the existence of impairment.
During the fourth quarter of 2021 the Company performed a quantitative goodwill assessment with respect to each of its reporting units and determined that the fair values of the Company’s reporting units exceeded their carrying values. As a result of this assessment, the Company concluded that, other than the Music goodwill impairment loss noted above, there was no other impairment to any of its reporting units. Accordingly, no goodwill impairment was recorded as a result of the quantitative test for the year ended December 26, 2021.
Other Intangible Assets, Net
The following table represents a summary of the Company’s other intangible assets, net at December 25, 2022 and December 26, 2021:
| | | | | | | | | | | |
| (In millions) | 2022 | | 2021 |
| Acquired product rights | $ | 2,112.1 | | | 2,101.7 | |
| Licensed rights of entertainment properties | 45.0 | | | 45.0 | |
| Impairment | (281.0) | | | — | |
| Accumulated amortization | (1,137.2) | | | (1,050.4) | |
| Amortizable intangible assets | 738.9 | | | 1,096.3 | |
| Product rights with indefinite lives | 75.7 | | | 75.7 | |
| Total other intangibles assets, net | $ | 814.6 | | | 1,172.0 | |
Certain intangible assets relating to rights obtained in the Company’s acquisition of Milton Bradley in 1984 and Tonka in 1991 are not amortized. These rights were determined to have indefinite lives and are included as product rights with indefinite lives in the table above. The Company tests these assets for impairment on an annual basis in the fourth quarter of each year or when an event occurs or circumstances change that indicate that the carrying value may not be recoverable. The Company completed its annual impairment tests of definite-lived
HASBRO, INC. AND SUBSIDIARIES
Notes to Consolidated Financial Statements — (Continued)
intangible assets in the fourth quarter of 2022 and 2021, concluding that there was no impairment of these assets. The Company’s other intangible assets are amortized over their remaining useful lives, and accumulated amortization of these other intangibles is reflected in other intangible assets, net in the accompanying consolidated balance sheets.
Intangible assets are reviewed for indications of impairment whenever events or changes in circumstances indicate the carrying value may not be recoverable.
During the fourth quarter of 2022, following the Company's Blueprint 2.0 strategy shift with a focus on fewer, bigger, better brands, it was determined that there was a partial impairment of the Company's definite-lived Power Rangers intangible asset as the approach to prioritize other brands in film development resulted in lower than expected cash flow related to the brand. Using the discounted cash flow method under the income approach to determine fair value, changes to anticipated revenues and related cash flows led to the determination that the carrying value of this intangible asset exceeded its fair value, thus resulting in an impairment. Charges of $281.0 million were recorded in the fourth quarter of 2022 within Selling, Distribution and Administration within the Corporate and Other segment.
There were no other triggering events in 2022 or 2021 that would indicate the Company's intangible assets were impaired.
The Company will continue to incur amortization expense related to the use of acquired and licensed rights to produce various products. A portion of the amortization of these product rights will fluctuate depending on brand activation, related revenues during an annual period and future expectations, as well as rights reaching the end of their useful lives. The Company currently estimates amortization expense related to the above intangible assets for the next five years to be approximately:
| | | | | |
| (In millions) |
| 2023 | $ | 89.6 | |
| 2024 | 87.9 | |
| 2025 | 87.9 | |
| 2026 | 87.9 | |
| 2027 | 74.9 | |
(7) Equity Method Investment
The Company owns an interest in a joint venture, Discovery Family Channel (the “Network”), with Warner Bros. Discovery, Inc. ("Discovery"). The Company has determined that it does not meet the control requirements to consolidate the Network and accounts for the investment using the equity method of accounting. The Network was established to create a cable television network in the United States dedicated to high-quality children’s and family entertainment. In October 2009, the Company purchased an initial 50% share in the Network for a payment of $300.0 million and certain future tax payments based on the value of certain tax benefits expected to be received by the Company. On September 23, 2014, the Company and Discovery amended their relationship with respect to the Network and Discovery increased its equity interest in the Network to 60% while the Company retained a 40% equity interest in the Network.
As of December 25, 2022 and December 26, 2021, the Company’s investment in the Network totaled $120.8 million and $161.2 million, respectively. During the fourth quarter of 2021, the Company reviewed its investment with Discovery for impairment and concluded that the fair value of the Company's interest in the joint venture was less than its carrying value, and as such, recorded an impairment loss of $74.1 million, which is included in other (income) expense, net in the consolidated statements of operations for the year ended December 26, 2021. The Company utilized the discounted cash flow method under the income approach to estimate the fair value of the Network, which requires assumptions and estimates that include: future annual cash flows, income tax rates, discount rates, estimated growth rates, and other market factors. Accelerating changes in the cable distribution industry, including technological changes and expanding options for digital content offerings, has resulted in the fragmentation of viewership, declines in subscribers to the traditional cable bundle, and pricing pressure. These factors led to the lower valuation of the Network as compared to its carrying value. During the fourth quarter of 2022, the Company reviewed its investment with Discovery for impairment and determined that the fair value of the
HASBRO, INC. AND SUBSIDIARIES
Notes to Consolidated Financial Statements — (Continued)
Company's interest in the joint venture exceeded its carrying value, and as such, concluded that there was no impairment in its investment in the Network.
The Company’s share in the earnings of the Network for the years ended December 25, 2022, December 26, 2021 and December 27, 2020 totaled $8.1 million, $20.8 million and $21.8 million, respectively, and is included as a component of other expense (income), net in the consolidated statements of operations. The Company also enters into certain other transactions with the Network. During 2022, 2021 and 2020, these transactions were not material.
In connection with the September 23, 2014 amendment, the Company and Discovery entered into an option agreement to acquire the Company’s remaining 40% ownership in the Network, exercisable during the one-year period following December 31, 2021. During 2022 the Company and Discovery further amended the agreement by extending the option exercise window through March 2025. As of December 25, 2022, the Company had not exercised the option to acquire the remaining ownership in the Network. The exercise price of the option agreement is based upon 80% of the then fair market value of the Network, subject to a fair market value floor. At December 25, 2022 and December 26, 2021, the fair market value of this option was $1.7 million and was included as a component of other liabilities. During 2021, the Company recorded a gain of $20.1 million in other (income) expense, net relating to the change in fair value of this option, which was driven by an impairment loss recorded on the Company's investment in the Network during 2021. There were no material changes to the option's value in 2022 or 2020.
The Company also has a related liability due to Discovery under the existing tax sharing agreement. The balance of the associated liability, including imputed interest, was $14.4 million and $18.3 million at December 25, 2022 and December 26, 2021, respectively, and is included as a component of other liabilities in the accompanying consolidated balance sheets. During 2022 and 2021, the Company recognized income of $0.7 million and a loss of $2.1 million, respectively, related to this liability due to changes in the Company's 2021 and 2020 income tax rates that resulted in adjustments to future payments owed to the Network. During 2022, 2021 and 2020, the Company made payments to Discovery under this tax sharing agreement in the amount of $5.4 million, $5.3 million and $4.7 million, respectively. See note 20 for more information on estimated future payments in relation to the Company's Discovery tax sharing agreement.
The Company had a license agreement with the Network that required the payment of royalties by the Company to the Network based on a percentage of revenue derived from products related to television shows broadcast by the joint venture. The license included a minimum royalty guarantee of $125.0 million, which was paid in five annual installments of $25.0 million per year, commencing in 2009, which was earned out over approximately a 12-year period. As of December 25, 2022 the Company did not have a prepaid royalty balance related to this agreement as the licensing agreement ended in 2021. Beginning in 2021, the Company and the Network agreed that Hasbro would no longer provide the Network with new content. Previous to this amendment, the parties were subject to an agreement under which the Company would provide the Network with an exclusive first look in the U.S. to license certain types of programming developed by the Company based on its intellectual property. In the event the Network licenses the programming from the Company to air, it is required to pay the Company a license fee.
(8) Investments in Productions and Investments in Acquired Content Rights
Investments in productions and investments in acquired content rights are predominantly monetized on a title-by-title basis and are recorded within other assets in the Company's consolidated balance sheets, to the extent they are considered recoverable against future revenues. These amounts are being amortized to program cost amortization using a model that reflects the consumption of the asset as it is released through various channels including broadcast licenses, theatrical release and home entertainment. Amounts capitalized are reviewed periodically on an individual film basis and any portion of the unamortized amount that appears not to be recoverable from future net revenues is expensed as part of program cost amortization during the period the loss becomes evident.
HASBRO, INC. AND SUBSIDIARIES
Notes to Consolidated Financial Statements — (Continued)
Programming costs are included in other assets and consist of the following at December 25, 2022 and December 26, 2021:
| | | | | | | | | | | |
| (In millions) | 2022 | | 2021 |
| Investment in Films and Television Programs: | | | |
| Individual monetization | | | |
| Released, net of amortization | $ | 584.5 | | | $ | 481.7 | |
| Completed and not released | 23.3 | | | 18.5 | |
| In production | 199.4 | | | 151.6 | |
| Pre-production | 41.3 | | | 84.0 | |
| 848.5 | | | 735.8 | |
Film/TV group monetization | | | |
| Released, net of amortization | 25.8 | | | 32.2 | |
| | | |
| In production | 22.2 | | | 13.0 | |
| | | |
| 48.0 | | | 45.2 | |
| Investment in other programming: | | | |
| Released, net of amortization | 9.8 | | | 5.3 | |
| Completed and not released | — | | | 0.4 | |
| In production | 11.8 | | | 12.6 | |
| Pre-production | 3.3 | | | 1.7 | |
| 24.9 | | | 20.0 | |
| | | |
| Total program investments | $ | 921.4 | | | $ | 801.0 | |
The Company recorded $555.5 million of program cost amortization related to released programming during 2022, consisting of the following:
| | | | | | | | | | | | | | | | | | | | | | |
| (In millions) | | Investment in Production | | Investment in Content | | | | Total |
| Program cost amortization | | $ | 495.4 | | | $ | 60.1 | | | | | $ | 555.5 | |
Based on management’s total revenue estimates at December 25, 2022, the Company's expected future amortization expenses for capitalized programming costs over the next three years are as follows:
| | | | | | | | | | | | | | | | | | | | | | | | |
| (In millions) | | 2023 | | 2024 | | 2025 | | | | |
| Estimated Future Amortization Expense: | | | | | | | | | | |
| Individual monetization | | | | | | | | | | |
| Released | | $ | 114.6 | | | 67.4 | | | 58.3 | | | | | |
| Completed and not released | | 42.3 | | | n/a | | n/a | | | | |
| | | | | | | | | | |
| Film/TV group monetization | | | | | | | | | | |
| | | | | | | | | | |
| Released | | 28.8 | | | 15.0 | | | 14.8 | | | | | |
| | | | | | | | | | |
| Total | | $ | 185.7 | | | 82.4 | | | 73.1 | | | | | |
HASBRO, INC. AND SUBSIDIARIES
Notes to Consolidated Financial Statements — (Continued)
In the normal course of its business, the Company also enters into contracts related to obtaining right of first refusal ("first look deals") to purchase, distribute, or license certain entertainment projects or content. See note 20 for more information on the Company's expected future payments for first look deals.
(9) Financing Arrangements
At December 25, 2022, Hasbro had available an unsecured revolving credit agreement (see Amended Revolving Credit Agreement below) in the amount of $1.5 billion and unsecured uncommitted lines of credit from various banks approximating $101.5 million. Substantially all of the short term borrowings outstanding at the end of 2022 and 2021 represent borrowings made under, or supported by, these lines of credit. Borrowings under the lines of credit as of December 25, 2022 and December 26, 2021 were made in the form of production demand loans at various interest rates. The weighted average interest rates of the outstanding borrowings under the uncommitted lines of credit as of December 25, 2022 and December 26, 2021 were 3.3% and 3.9%, respectively. The Company had no borrowings outstanding under its committed line of credit at December 25, 2022 and December 26, 2021. During 2022 and 2021, Hasbro’s working capital needs were fulfilled by cash available and cash generated from operations.
During the second half of 2019, in preparation for the Company's acquisition of eOne, the Company completed the following debt and equity financings: (i) the issuance of senior unsecured Notes in an aggregate principal amount of $2.4 billion, (ii) the issuance of 10.6 million shares of common stock at a public offering price of $95.00 per share and (iii) $1.0 billion in term loans provided by a Term Loan Agreement (the “Term Loan Agreement”) entered into with Bank of America, N.A., as administrative agent, and certain financial institutions, as lenders, pursuant to which such lenders committed to provide, contingent on completion of the eOne acquisition and certain other customary conditions to funding, facilities consisting of a three-year senior unsecured term loan facility in an aggregate principal amount of $400.0 million and a five-year senior unsecured term loan facility in an aggregate principal amount of $600.0 million. On December 30, 2019, the Company completed the acquisition of eOne and on that date, borrowed the full amount of $1.0 billion under the Term Loan facilities. As of December 25, 2022, the Company has repaid the full aggregate principal amount of $400.0 million on the three-year term loan facility and $290.0 million of the aggregate principal amount on the five-year term loan facility. See note 11 for further discussion on the Term Loan Agreement.
The Company has a second amended and restated revolving credit agreement with Bank of America, as administrative agent, swing line lender and a letter of credit issuer and lender and certain other financial institutions, as lenders thereto (the "Amended Revolving Credit Agreement"), which provides the Company with commitments having a maximum aggregate principal amount of $1.5 billion. The Amended Revolving Credit Agreement also provides for a potential additional incremental commitment increase of up to $500.0 million subject to agreement of the lenders. The Amended Revolving Credit Agreement contains certain financial covenants setting forth leverage and coverage requirements, and certain other limitations typical of an investment grade facility, including with respect to liens, mergers and incurrence of indebtedness. The Amended Revolving Credit Agreement extends through September 20, 2024. The Company was in compliance with all covenants as of and for the year ended December 25, 2022. The Company had no borrowings outstanding under its committed revolving credit facility as of December 25, 2022.
The Company pays a commitment fee (0.125% as of December 25, 2022) based on the unused portion of the revolving credit facility and interest equal to a Base Rate or Eurocurrency Rate plus a spread on borrowings under the facility. The Base Rate is determined based on either the Federal Funds Rate plus a spread, or Prime Rate plus a spread. The commitment fee and the amount of the spread to the Base Rate or Eurocurrency Rate both vary based on the Company’s long-term debt ratings and the Company’s leverage. At December 25, 2022, the interest rate under the revolving credit facility was equal to Eurocurrency Rate plus 1.250%.
The Company also has an agreement with a group of banks providing a commercial paper program (the “Program”). Under the Program, at the Company’s request and subject to market conditions, the banks may either purchase from the Company, or arrange for the sale by the Company of, unsecured commercial paper notes. Borrowings under the Program are supported by the aforementioned unsecured committed line of credit and the Company may issue notes from time to time up to an aggregate principal amount outstanding at any given time of $1.0 billion. The maturities of the notes may vary but may not exceed 397 days. Subject to market conditions, the notes will be sold under customary terms in the commercial paper market and will be issued at a discount to par, or alternatively, will be sold at par and will bear varying interest rates based on a fixed or floating rate basis. The interest rates will vary based on market conditions and the ratings assigned to the notes by the credit rating
HASBRO, INC. AND SUBSIDIARIES
Notes to Consolidated Financial Statements — (Continued)
agencies at the time of issuance. At December 25, 2022 and December 26, 2021, the Company did not have any notes outstanding under the Program.
During November 2021, the Company secured a senior revolving film and television production credit facility (the “RPCF”) with MUFG Union Bank, N.A., as administrative agent and lender and certain other financial institutions, as lenders thereto (the “Revolving Production Financing Agreement”) which provides the Company with commitments having a maximum aggregate principal amount of $250.0 million. The Revolving Production Financing Agreement also provides the Company with the option to request a commitment increase up to an aggregate additional amount of $150.0 million subject to agreement of the lenders. The Revolving Production Financing Agreement extends through November 22, 2024. The Company uses the RPCF to fund certain of the Company’s original film and TV production costs. Borrowings under the RPCF are non-recourse to the Company's assets.
(10) Accrued Liabilities
Components of accrued liabilities for the fiscal years ended on December 25, 2022 and December 26, 2021 are as follows:
| | | | | | | | | | | |
| (In millions) | 2022 | | 2021 |
| Participations and residuals | $ | 300.2 | | | $ | 299.1 | |
| Royalties | 195.4 | | | 253.0 | |
| Deferred revenue | 111.3 | | | 114.1 | |
| Severance | 100.3 | | | 32.0 | |
| Dividends | 96.7 | | | 94.0 | |
| Cancellation charges | 89.2 | | | 74.1 | |
| Other Taxes | 82.1 | | | 95.0 | |
| Accrued expenses IIC & IIP | 80.8 | | | 74.9 | |
| Payroll and management incentives | 66.7 | | | 183.6 | |
| Advertising | 53.2 | | | 60.4 | |
| Accrued income taxes | 44.8 | | | 30.9 | |
| General vendor accruals | 44.3 | | | 29.8 | |
| Current lease liability | 39.6 | | | 43.9 | |
| Freight | 28.5 | | | 107.5 | |
| Other | 173.7 | | | 182.5 | |
| Total accrued liabilities | $ | 1,506.8 | | | $ | 1,674.8 | |
HASBRO, INC. AND SUBSIDIARIES
Notes to Consolidated Financial Statements — (Continued)
(11) Long-Term Debt
Components of long-term debt for the fiscal years ended on December 25, 2022 and December 26, 2021 are as follows:
| | | | | | | | | | | | | | | | | | | | | | | |
| (In millions) | 2022 | | 2021 |
| Carrying
Cost | | Fair Value | | Carrying
Cost | | Fair Value |
3.90% Notes Due 2029 | $ | 900.0 | | | 808.2 | | | $ | 900.0 | | | 991.7 | |
3.55% Notes Due 2026 | 675.0 | | | 635.3 | | | 675.0 | | | 725.6 | |
3.00% Notes Due 2024 | 500.0 | | | 482.2 | | | 500.0 | | | 521.2 | |
6.35% Notes Due 2040 | 500.0 | | | 498.4 | | | 500.0 | | | 692.8 | |
3.50% Notes Due 2027 | 500.0 | | | 465.8 | | | 500.0 | | | 539.2 | |
| | | | | | | |
5.10% Notes Due 2044 | 300.0 | | | 261.1 | | | 300.0 | | | 374.5 | |
| | | | | | | |
6.60% Debentures Due 2028 | 109.9 | | | 112.1 | | | 109.9 | | | 136.7 | |
| | | | | | | |
Variable % Notes Due December 30, 2024 (1) | 310.0 | | | 310.0 | | | 397.5 | | | 397.5 | |
| Production Financing Facilities | 53.2 | | | 53.2 | | | 170.1 | | | 170.1 | |
| Total long-term debt | $ | 3,848.1 | | | 3,626.3 | | | $ | 4,052.5 | | | 4,549.3 | |
| Less: Deferred debt expenses | 23.7 | | | — | | | 28.2 | | | — | |
| Less: Current portion | 113.2 | | | — | | | 200.1 | | | — | |
| Long-term debt | $ | 3,711.2 | | | 3,626.3 | | | $ | 3,824.2 | | | 4,549.3 | |
(1) During the first quarter of 2022, the Company repaid $50.0 million of the principal balance of the Variable % Notes Due December 30, 2024.
In November 2019, in conjunction with the Company's acquisition of eOne, the Company issued an aggregate of $2.4 billion of senior unsecured debt securities (the "Notes") consisting of the following tranches: $300.0 million of notes due 2022 (the "2022 Notes") that bear interest at a fixed rate of 2.60%, $500.0 million of notes due 2024 (the "2024 Notes") that bear interest at a fixed rate of 3.00%, $675.0 million of notes due 2026 (the "2026 Notes") that bear interest at a fixed rate of 3.55% and $900.0 million of notes due 2029 (the "2029 Notes") that bear interest at a fixed rate of 3.90%. Net proceeds from the issuance of the Notes, after deduction of $20.0 million of underwriting discount and fees, totaled $2.4 billion. These costs are being amortized over the life of the Notes outstanding, which range from five years to ten years from the date of issuance. During the third quarter of 2021, the Company repaid in full the $300.0 million of 2022 Notes and recorded $9.1 million of debt extinguishment costs within other expense (income) in the Consolidated Statements of Operations.
The Notes bear interest at the stated rates but may be subject to upward adjustment if the credit rating of the Company is reduced by Moody's or Standard & Poors. The adjustment can be from 0.25% to 2.00% based on the extent of the ratings decrease. The Company may redeem the Notes at its option at the greater of the principal amount of the Notes or the present value of the remaining scheduled payments discounted using the effective interest rate on applicable U.S. Treasury bills at the time of repurchase, plus (1) 25 basis points (in the case of the 2024 Notes); (2) 30 basis points (in the case of the 2026 Notes); and (3) 35 basis points (in the case of the 2029 Notes). In addition, on and after October 19, 2024 for the 2024 Notes, September 19, 2026 for the 2026 Notes and August 19, 2029 for the 2029 Notes, such series of Notes will be redeemable, in whole at any time or in part from time to time, at the Company's option at a redemption price equal to 100% of the principal amount of the Notes to be redeemed plus any accrued and unpaid interest.
In September 2019, the Company entered into the $1.0 billion Term Loan Agreement consisting of (1) a three-year senior unsecured term loan facility in an aggregate principal amount of $400.0 million (the “Three-Year Tranche”) and (2) a five-year senior unsecured term loan facility in an aggregate principal amount of $600.0 million (the “Five-Year Tranche” and together with the Three-Year Tranche, the “Term Loan Facilities”). The full amount of the Term Loan Facilities were drawn down on December 30, 2019, the closing date of the eOne acquisition. During 2021, the Company paid $480.0 million toward the $1.0 billion term loan notes consisting of the remaining $300.0 million of the principal balance of the Three-Year Tranche loans as well as $150.0 million principal balance and principal amortization payments totaling $30.0 million on the Five-Year Tranche loans. During 2022, the
HASBRO, INC. AND SUBSIDIARIES
Notes to Consolidated Financial Statements — (Continued)
Company made $50.0 million principal balance and principal amortization payments totaling $37.5 million on the Five-Year Tranche loans.
Loans under the Five-Year Tranche bear interest at the Company’s option, at either the Eurocurrency Rate or the Base Rate, plus a per annum applicable rate that fluctuates between 100.0 basis points and 187.5 basis points, in the case of loans priced at the Eurocurrency Rate, and between 0.0 basis points and 87.5 basis points, in the case of loans priced at the Base Rate, in each case, based upon the non-credit enhanced, senior unsecured long-term debt ratings of the Company by Fitch Ratings Inc., Moody’s Investor Service, Inc. and S&P Global Rankings, subject to certain provisions taking into account potential differences in ratings issued by the relevant rating agencies or a lack of ratings issued by such rating agencies. Loans under the Five-Year Tranche require principal amortization payments that are payable in equal quarterly installments of 5.0% per annum of the original principal amount thereof for each of the first two years after funding, increasing to 10.0% per annum of the original principal amount thereof for each subsequent year. The Term Loan Agreement contains affirmative and negative covenants typical of this type of facility, including: (i) restrictions on the Company’s and its domestic subsidiaries’ ability to allow liens on their assets, (ii) restrictions on the incurrence of indebtedness, (iii) restrictions on the Company’s and certain of its subsidiaries’ ability to engage in certain mergers, (iv) the requirement that the Company maintain a Consolidated Interest Coverage Ratio of no less than 3.00:1.00 as of the end of any fiscal quarter and (v) the requirement that the Company maintain a Consolidated Total Leverage Ratio of no more than, depending on the gross proceeds of equity securities issued after the effective date of the acquisition of eOne, 5.65:1.00 or 5.40:1.00 for each of the first, second and third fiscal quarters ended after the funding of the Term Loan Facilities, with periodic step downs to 3.50:1.00 for the fiscal quarter ending December 31, 2023 and thereafter. As of December 25, 2022, the Company was in compliance with the financial covenants contained in the Term Loan Agreement.
The Company may redeem its 5.10% notes due in 2044 (the "2044 Notes") at its option, at the greater of the principal amount of the notes or the present value of the remaining scheduled payments, discounted using the effective interest rate on applicable U.S. Treasury bills at the time of repurchase.
Current portion of long-term debt at December 25, 2022 of $113.2 million, as shown on the consolidated balance sheet, represents the current portion of required quarterly principal amortization payments for the 5-Year Tranche of the Term Loan Facilities and other production financing facilities. All of the Company’s other long-term borrowings have contractual maturities that occur subsequent to 2023 with the exception of certain of the Company’s production financing facilities and annual principal payments related to the Term Loan Facilities.
The Company's long-term borrowings have the following future contractual maturities:
| | | | | |
| Future long-term borrowings contractual payments | (In millions) |
| 2023* | $ | 60.0 | |
| 2024 | 750.0 | |
| 2025 | — | |
| 2026 | 675.0 | |
| 2027 | 500.0 | |
| 2028 and thereafter | 1,809.9 | |
| 3,794.9 | |
| Production financing facilities | 53.2 | |
| $ | 3,848.1 | |
* Represents the Company's required quarterly principal amortization payments for term loan facilities in 2023.
The fair values of the Company’s long-term debt are considered Level 3 fair values (see note 14 for further discussion of the fair value hierarchy) and are measured using the discounted future cash flows method. In addition to the debt terms, the valuation methodology includes an assumption of a discount rate that approximates the current yield on a similar debt security. This assumption is considered an unobservable input in that it reflects the Company’s own assumptions about the inputs that market participants would use in pricing the asset or liability. The Company believes that this is the best information available for use in the fair value measurement.
HASBRO, INC. AND SUBSIDIARIES
Notes to Consolidated Financial Statements — (Continued)
Production Financing
In addition to the Company's financial instruments, the Company uses production financing to fund certain of its television and film productions which are arranged on an individual production basis by either special purpose production subsidiaries, each secured by the assets and future revenues of such production subsidiaries, which are non-recourse to the Company's assets, or through a senior revolving credit facility obtained in November 2021, dedicated to production financing.
Production financing facilities typically have maturities of less than two years, while the titles are in production, and are repaid once delivered and all credits, broadcaster pre-sales and international sales have been received. The production financing facilities as of December 25, 2022 are as follows:
| | | | | | | | | | | |
| (In millions) | 2022 | | 2021 |
| | | |
| | | |
| | | |
| | | |
| | | |
| | | |
| | | |
| Production financing included in the consolidated balance sheet as: | | | |
| | | |
| | | |
| Current liabilities | $ | 195.6 | | | 170.1 | |
Interest is charged at bank prime rate plus a margin based on the risk of the respective production. The weighted average interest rate on all production financing as of December 25, 2022 was 3.3%.
The Company has Canadian dollar and U.S. dollar production credit facilities with various banks. The carrying amounts are denominated in the following currencies:
| | | | | | | | | | | | | | | | | |
| (In millions) | Canadian Facilities | | U.S. Facilities | | Total |
As of December 25, 2022 | $ | 53.2 | | | 142.4 | | | 195.6 | |
The following table represents the movements in production financing loans during 2022:
| | | | | | | | | |
| (In millions) | Production Financing | | | | |
| December 26, 2021 | $ | 170.1 | | | | | |
| Drawdowns | 258.5 | | | | | |
| Repayments | (231.5) | | | | | |
| Foreign exchange differences | (1.5) | | | | | |
Balance at December 25, 2022 | $ | 195.6 | | | | | |
The Company expects to repay all of its outstanding production financing loans in 2023.
(12) Income Taxes
The components of earnings before income taxes, determined by tax jurisdiction, are as follows:
| | | | | | | | | | | | | | | | | |
| (In millions) | 2022 | | 2021 | | 2020 |
| United States | $ | 17.0 | | | 236.8 | | | 191.5 | |
| International | 244.5 | | | 345.1 | | | 130.6 | |
| Total earnings before income taxes | $ | 261.5 | | | 581.9 | | | 322.1 | |
HASBRO, INC. AND SUBSIDIARIES
Notes to Consolidated Financial Statements — (Continued)
Income taxes attributable to earnings before income taxes are:
| | | | | | | | | | | | | | | | | |
| (In millions) | 2022 | | 2021 | | 2020 |
| Current | | | | | |
| United States | $ | 93.8 | | | 59.5 | | | 22.3 | |
| State and local | 18.0 | | | 15.4 | | | 6.2 | |
| International | 76.8 | | | 42.9 | | | 37.9 | |
| 188.6 | | | 117.8 | | | 66.4 | |
| Deferred | | | | | |
| United States | (105.7) | | | 7.1 | | | 27.2 | |
| State and local | (16.6) | | | (0.3) | | | (10.8) | |
| International | (7.8) | | | 22.0 | | | 13.9 | |
| (130.1) | | | 28.8 | | | 30.3 | |
| Total income taxes | $ | 58.5 | | | 146.6 | | | 96.7 | |
A reconciliation of the statutory United States federal income tax rate to Hasbro’s effective income tax rate is as follows:
| | | | | | | | | | | | | | | | | |
| 2022 | | 2021 | | 2020 |
| Statutory income tax rate | 21.0 | % | | 21.0 | % | | 21.0 | % |
| State and local income taxes, net | 1.2 | | | 1.5 | | | 2.2 | |
| Tax on international earnings | (4.0) | | | (1.1) | | | (3.5) | |
| Domestic tax on foreign earnings | (6.5) | | | (1.7) | | | (2.7) | |
| | | | | |
| Change in unrecognized tax benefits | 3.1 | | | (3.4) | | | 4.1 | |
| Change in valuation allowance | 9.7 | | | (1.6) | | | 4.5 | |
| Share-based compensation | 1.4 | | | (0.6) | | | (0.4) | |
| | | | | |
| Research and development tax credits | (3.5) | | | (1.1) | | | (1.6) | |
| Deferred tax rate change | — | | | 6.5 | | | 3.6 | |
| | | | | |
| Officers' compensation | 1.9 | | | 1.9 | | | 1.4 | |
| Loss on disposition of business | 1.5 | | | 3.9 | | | — | |
| Other, net | (3.4) | | | (0.1) | | | 1.4 | |
| 22.4 | % | | 25.2 | % | | 30.0 | % |
Certain reclassifications have been made to prior year presentation to conform to current year presentation.
HASBRO, INC. AND SUBSIDIARIES
Notes to Consolidated Financial Statements — (Continued)
The components of deferred income tax expense (benefit) arise from various temporary differences and relate to items included in the consolidated statements of operations as well as items recognized in other comprehensive earnings. The tax effects of temporary differences that give rise to significant portions of the deferred tax assets and liabilities at December 25, 2022 and December 26, 2021 are:
| | | | | | | | | | | |
| (In millions) | 2022 | | 2021 |
| Deferred tax assets: | | | |
| Accounts receivable | $ | 28.8 | | | 30.8 | |
| Inventories | 22.6 | | | 14.1 | |
| Loss and credit carryforwards | 175.3 | | | 179.1 | |
| Operating leases | 11.2 | | | 17.8 | |
| Operating expenses | 29.9 | | | 29.9 | |
| Pension | 9.1 | | | 16.3 | |
| Other compensation | 50.7 | | | 37.3 | |
| Postretirement benefits | 5.7 | | | 8.5 | |
| Interest rate hedge | 4.5 | | | 4.7 | |
| Tax sharing agreement | 0.3 | | | 1.5 | |
| Deferred revenue | 4.4 | | | 4.0 | |
| Capitalized research and experimentation | 81.2 | | | 26.1 | |
| Other | 11.7 | | | 13.5 | |
| Gross deferred tax assets | 435.4 | | | 383.6 | |
| Deferred tax liabilities: | | | |
| Depreciation and amortization of long-lived assets | 61.8 | | | 170.5 | |
| Equity method investment | 14.9 | | | 13.1 | |
| Operating leases | 9.3 | | | 15.1 | |
| Foreign exchange | — | | | 13.7 | |
| Prepaid expenses | 4.4 | | | 3.5 | |
| Other | 15.4 | | | 12.3 | |
| Gross deferred tax liabilities | 105.8 | | | 228.2 | |
| Valuation allowance | (189.8) | | | (171.2) | |
| Net deferred income taxes | $ | 139.8 | | | (15.8) | |
Certain reclassifications have been made to prior year presentation to conform to current year presentation.
The most significant amount of the loss and credit carryforwards relate to tax attributes of the acquired eOne entities that historically operated at losses in certain jurisdictions. At December 25, 2022, the Company has loss and credit carryforwards of $175.3 million, which is a decrease of $3.8 million from $179.1 million at December 26, 2021. Loss and credit carryforwards as of December 25, 2022 relate primarily to the U.S. and Canada. The Canadian loss carryforwards expire at various dates from 2031 to 2042. Some U.S. federal, state and international loss and credit carryforwards expire at various dates throughout 2023 while others have an indefinite carryforward period.
The recoverability of these future tax deductions and credits is evaluated by assessing the adequacy of future expected taxable income from all sources, including taxable income in prior carryback years, reversal of taxable temporary differences, forecasted operating earnings and available tax planning strategies. To the extent the Company does not consider it more likely than not that a deferred tax asset will be recovered, a valuation allowance is generally established. To the extent that a valuation allowance was established and it is subsequently determined that it is more likely than not that the deferred tax assets will be recovered, the change in the valuation allowance is recognized in the consolidated statements of income.
The Company has a valuation allowance for certain net deferred tax assets at December 25, 2022 of $189.8 million, which is an increase of $18.6 million from $171.2 million at December 26, 2021. The valuation allowance
HASBRO, INC. AND SUBSIDIARIES
Notes to Consolidated Financial Statements — (Continued)
pertains to certain U.S. state and international loss and credit carryforwards, some of which have no expiration and others that expire beginning in 2023, and other net deferred tax assets. The increase in the valuation allowance is primarily due a valuation allowance recorded in 2022 against net deferred tax assets in Russia, due to the on-going conflict in Ukraine, as well as increases in certain net deferred tax assets with no corresponding tax benefit.
At December 25, 2022 and December 26, 2021, the Company’s net deferred income taxes are recorded in the consolidated balance sheets as follows:
| | | | | | | | | | | |
| (In millions) | 2022 | | 2021 |
| Other assets | $ | 262.1 | | | 132.1 | |
| Other liabilities | (122.3) | | | (147.9) | |
| Net deferred income taxes | $ | 139.8 | | | (15.8) | |
We previously considered the earnings in our non-U.S. subsidiaries to be indefinitely reinvested and, accordingly, recorded no deferred income taxes. However, the Tax Cuts and Jobs Act (the "Tax Act") enacted on December 22, 2017 gave the Company more flexibility to manage cash globally. The Company still has significant cash needs outside the United States and continues to consistently monitor and analyze its global working capital and cash requirements. However, we intend to repatriate substantially all of our accumulated foreign earnings when appropriate. As of 2022, we have recorded $3.6 million of foreign withholding and U.S. state income tax liability. The Company has not finalized the timing of any actual cash distributions or the specific amounts and therefore we could still be subject to some additional foreign withholding taxes and U.S. state taxes. We will record these additional tax effects, if any, in the period that we complete our analysis and are able to make a reasonable estimate.
A reconciliation of unrecognized tax benefits, excluding potential interest and penalties, for the fiscal years ended December 25, 2022, December 26, 2021, and December 27, 2020 is as follows:
| | | | | | | | | | | | | | | | | |
| (In millions) | 2022 | | 2021 | | 2020 |
| Balance at beginning of year | $ | 50.6 | | | 67.8 | | | 36.7 | |
| Gross increases in prior period tax positions | 0.9 | | | 0.6 | | | 12.7 | |
| Gross increase from acquisition | — | | | — | | | 13.7 | |
| Gross decreases in prior period tax positions | (0.2) | | | (12.0) | | | — | |
| Gross increases in current period tax positions | 28.6 | | | 4.6 | | | 11.7 | |
| Decrease related to settlements with tax authorities | — | | | (2.7) | | | — | |
| Decreases from the expiration of statute of limitations | (2.1) | | | (7.7) | | | (7.0) | |
| Balance at end of year | $ | 77.8 | | | 50.6 | | | 67.8 | |
Unrecognized tax benefits as of December 25, 2022, December 26, 2021 and December 27, 2020, were $77.8 million, $50.6 million, and $67.8 million, respectively, and are recorded within other liabilities, prepaid expenses and other current assets, and other assets in the Company's consolidated balance sheets. If recognized, these tax benefits would have affected our income tax provision for fiscal years 2022, 2021, and 2020, by approximately $53.0 million, $46.0 million, and $57.0 million, respectively.
During 2022, 2021, and 2020, the Company recognized $2.2 million, $2.6 million, and $3.7 million, respectively, of potential interest and penalties, which are included as a component of income taxes in the accompanying consolidated statements of operations. At December 25, 2022, December 26, 2021, and December 27, 2020, the Company had accrued potential interest and penalties of $8.8 million, $7.3 million, and $11.6 million, respectively.
The Company and its subsidiaries file income tax returns in the United States and various state and international jurisdictions. In the normal course of business, the Company is regularly audited by U.S. federal, state and local and international tax authorities in various tax jurisdictions. The Company is no longer subject to U.S. federal income tax examinations for years before 2012. With few exceptions, the Company is no longer subject to U.S. state or local and non-U.S. income tax examinations by tax authorities in its major jurisdictions for years before
HASBRO, INC. AND SUBSIDIARIES
Notes to Consolidated Financial Statements — (Continued)
2016. The Company is currently under income tax examination by the Internal Revenue Service and in several U.S. state and local and non-U.S. jurisdictions.
The Company believes it is reasonably possible that a decrease of approximately $0.0 million - $10.0 million in gross unrecognized tax benefits may be necessary within the coming year as a result of expected tax return settlements and lapse of statute of limitations.
In May 2019, a public referendum held in Switzerland approved the Swiss Federal Act on Tax Reform and AHV Financing (TRAF) proposals previously approved by the Swiss Parliament. The Swiss tax reform measures were effective on January 1, 2020. Changes in tax reform include the abolishment of preferential tax regimes for holding companies, domicile companies and mixed companies at the cantonal level. The enacted changes in Swiss federal and cantonal tax, including cantonal transitional provisions adopted in 2021, were not material to the Company’s financial statements.
(13) Capital Stock
The Company has a long history of increasing shareholder value through its share repurchase program. Purchases of the Company’s common stock may be made from time to time, subject to market conditions, and may be made in the open market or through privately negotiated transactions. The Company has no obligation to repurchase shares under the authorization and the time, actual number, and the value of the shares which are repurchased will depend on a number of factors, including the price of the Company’s common stock. As part of this initiative, since 2005, the Company's Board of Directors adopted numerous share repurchase authorizations with a cumulative authorized repurchase amount of $4.3 billion. The most recent authorization for the repurchase of up to $500.0 million in common stock was approved in May 2018. As a result of the financing activities related to the eOne acquisition, the Company suspended its share repurchase program to prioritize deleveraging, and did not repurchase any shares during 2021 and 2020. In April 2022, given the Company's progress towards reducing debt, the Company resumed its share repurchase activity and has since repurchased approximately 1.4 million shares at a total cost of $125.0 million and at an average price of $87.46 per share. At December 25, 2022, $241.6 million remained under the current authorization.
(14) Fair Value of Financial Instruments
The Company measures certain financial instruments at fair value. The fair value hierarchy consists of three levels: Level 1 fair values are based on quoted market prices in active markets for identical assets or liabilities that the entity has the ability to access; Level 2 fair values are those based on quoted prices for similar assets or liabilities, quoted prices in markets that are not active, or other inputs that are observable or can be corroborated by observable data for substantially the full term of the assets or liabilities; and Level 3 fair values are based on inputs that are supported by little or no market activity and that are significant to the fair value of the assets or liabilities. There have been no transfers between levels within the fair value hierarchy.
Accounting standards permit entities to measure many financial instruments and certain other items at fair value and establish presentation and disclosure requirements designed to facilitate comparisons between entities that choose different measurement attributes for similar assets and liabilities. The Company elected the fair value option for certain available-for-sale investments using net asset value per share and during 2020, the Company liquidated these investments as part of its global cash management strategy. The Company recorded a net loss of $0.3 million on these investments in other (income) expense, net for the year ended December 27, 2020 relating to the change in fair value of such investments.
HASBRO, INC. AND SUBSIDIARIES
Notes to Consolidated Financial Statements — (Continued)
At December 25, 2022 and December 26, 2021, the Company had the following assets and liabilities measured at fair value in its consolidated balance sheets (excluding assets for which the fair value is measured using net asset value per share):
| | | | | | | | | | | | | | | | | | | | | | | |
| | | Fair Value Measurements Using |
| (In millions) | Fair
Value | | Quoted
Prices in
Active
Markets
for
Identical
Assets
(Level 1) | | Significant
Other
Observable
Inputs
(Level 2) | | Significant
Unobservable
Inputs
(Level 3) |
| December 25, 2022 | | | |
| Assets: | | | |
| Available-for-sale securities | $ | 1.7 | | | 1.7 | | | — | | | — | |
| Derivatives | 7.9 | | | — | | | 7.9 | | | — | |
| Total assets | $ | 9.6 | | | 1.7 | | | 7.9 | | | — | |
| Liabilities: | | | | | | | |
| Derivatives | $ | 2.9 | | | — | | | 2.9 | | | — | |
| Option agreement | 1.7 | | | — | | | — | | | 1.7 | |
| Total liabilities | $ | 4.6 | | | — | | | 2.9 | | | 1.7 | |
| December 26, 2021 | | | | | | | |
| Assets: | | | | | | | |
| Available-for-sale securities | $ | 1.9 | | | 1.9 | | | — | | | — | |
| Derivatives | 10.9 | | | — | | | 10.9 | | | — | |
| Total assets | $ | 12.8 | | | 1.9 | | | 10.9 | | | — | |
| Liabilities: | | | | | | | |
| Derivatives | $ | 2.6 | | | — | | | 2.6 | | | — | |
| Option agreement | 1.7 | | | — | | | — | | | 1.7 | |
| Total liabilities | $ | 4.3 | | | — | | | 2.6 | | | 1.7 | |
Available-for-sale securities include equity securities of one company quoted on an active public market.
The Company’s derivatives consist of foreign currency forward and option contracts. The Company uses current forward rates of the respective foreign currencies to measure the fair value of these contracts. The Company's option agreement relates to an equity method investment in Discovery Family Channel. The option agreement is included in other liabilities at December 25, 2022 and December 26, 2021, and is valued using an option pricing model based on the fair value of the related investment. Inputs used in the option pricing model include volatility and fair value of the underlying company which are considered unobservable inputs as they reflect the Company’s own assumptions about the inputs that market participants would use in pricing the asset or liability. The Company believes that this is the best information available for use in the fair value measurement. Due to the 2021 revaluation of the Discovery Family Channel and resulting impairment charges, the Company reduced the option's fair value by $20.1 million during the fourth quarter of 2021. See note 7 for more information on the Company's investment in the Discovery Family Channel.
The following is a reconciliation of the beginning and ending balances of the fair value measurements of the Company’s financial instruments which use significant unobservable inputs (Level 3):
| | | | | | | | | | | |
| (In millions) | 2022 | | 2021 |
| Balance at beginning of year | $ | (1.7) | | | $ | (20.6) | |
| Gain from change in fair value | — | | | 18.9 | |
| Balance at end of year | $ | (1.7) | | | $ | (1.7) | |
HASBRO, INC. AND SUBSIDIARIES
Notes to Consolidated Financial Statements — (Continued)
(15) Stock Options, Other Stock Awards and Warrants
The Company has reserved 10.5 million shares of its common stock for issuance upon exercise of options and other awards granted or to be granted under stock incentive plans for employees and for non-employee members of the Board of Directors (collectively, the “plans”). These awards generally vest and are expensed in equal annual amounts over three to five years. The plans provide that options be granted at exercise prices not less than the market value of the underlying common stock on the date the option is granted and options and share awards are adjusted for such changes as stock splits and stock dividends. Options are exercisable for periods of no more than seven years after date of grant. Upon exercise in the case of stock options, grant in the case of restricted stock or vesting in the case of performance based contingent stock and restricted stock unit grants, shares are issued out of available treasury shares. The Company’s current plan permits the granting of awards in the form of stock, stock appreciation rights, stock awards and cash awards in addition to stock options.
Total compensation expense related to stock options, restricted stock units, including those awards made to non-employee members of its Board of Directors, and stock performance awards for the years ended December 25, 2022, December 26, 2021 and December 27, 2020 was $81.3 million, $97.8 million and $49.7 million, respectively, and was recorded as follows:
| | | | | | | | | | | | | | | | | |
| (In millions) | 2022 | | 2021 | | 2020 |
| | | | | |
| Product development | $ | 4.8 | | | 3.7 | | | 3.3 | |
Selling, distribution and administration (a) | 76.5 | | | 94.1 | | | 46.4 | |
| Total stock compensation expense before income taxes | 81.3 | | | 97.8 | | | 49.7 | |
| Income tax benefit | 9.0 | | | 10.2 | | | 5.3 | |
| Total stock compensation expense after income taxes | $ | 72.3 | | | 87.6 | | | 44.4 | |
(a)The 2021 increase in compensation expense compared to 2020 reflects $20.9 million of additional expense associated with the contractual accelerated vesting of certain equity awards as a result of the passing of the Company's former CEO.
The following table represents total stock compensation expense, net of performance adjustments, by award type related to stock performance awards, restricted stock units, stock options and awards made to non-employee members of the Company’s Board of Directors, for the years ended December 25, 2022, December 26, 2021 and December 27, 2020:
| | | | | | | | | | | | | | | | | |
| (In millions) | 2022 | | 2021 | | 2020 |
| Stock performance awards | $ | 9.6 | | | 26.9 | | | 8.4 | |
| Restricted stock units | 60.7 | | | 50.9 | | | 28.5 | |
| Stock options | 8.9 | | | 18.4 | | | 11.0 | |
| Non-employee awards | 2.1 | | | 1.6 | | | 1.8 | |
| Total stock compensation expense before income taxes | 81.3 | | | 97.8 | | | 49.7 | |
| Income tax benefit | 9.0 | | | 10.2 | | | 5.3 | |
| Total compensation expense after income taxes | $ | 72.3 | | | 87.6 | | | 44.4 | |
HASBRO, INC. AND SUBSIDIARIES
Notes to Consolidated Financial Statements — (Continued)
Stock Performance Awards
In 2022, 2021 and 2020, as part of its annual equity grant to executive officers and certain other employees, the Company issued contingent stock performance awards (the “Stock Performance Awards”). These awards provide the recipients with the ability to earn shares of the Company’s common stock based on the Company’s achievement of stated cumulative operating performance targets over the three fiscal years ended December 2023, December 2022, and December 2022 for the 2022, 2021 and 2020 awards, respectively. Each Stock Performance Award granted in 2020 has a target number of shares of common stock associated with such award which may be earned by the recipient if the Company achieves the stated diluted earnings per share and revenue targets and for certain employees participating in the 2020 awards, the Stock Performance Awards include an additional target for the Company's return on invested capital. For the 2021 and 2022 awards, all employee awards will be measured on achieving diluted earnings per share, revenue and return on invested capital targets. The ultimate amount of the award may vary from 0% to 200% of the target number of shares, depending on the cumulative results achieved.
Information with respect to Stock Performance Awards for 2022, 2021 and 2020 is as follows:
| | | | | | | | | | | | | | | | | |
| (In millions, except per share data) | 2022 | | 2021 | | 2020 |
| Outstanding at beginning of year | 0.7 | | | 0.6 | | | 0.5 | |
| Granted | 0.4 | | | 0.2 | | | 0.4 | |
| Forfeited | (0.1) | | | — | | | (0.1) | |
| Canceled | — | | | (0.1) | | | (0.2) | |
| Vested | (0.2) | | | — | | | — | |
| Outstanding at end of year | 0.8 | | | 0.7 | | | 0.6 | |
| Weighted average grant-date fair value: | | | | | |
| Granted | $ | 88.77 | | | 96.06 | | | 56.49 | |
| Forfeited | $ | 80.77 | | | — | | | 80.31 | |
| Canceled | $ | — | | | 77.33 | | | 88.25 | |
| Vested | $ | 86.90 | | | — | | | 99.58 | |
| Outstanding at end of year | $ | 78.15 | | | 75.74 | | | 69.25 | |
Shares canceled in 2021 and 2020 represent Stock Performance Awards granted during 2019 and 2018, respectively, that were canceled based on the failure to meet the targets set forth by the agreements.
Stock Performance Awards are valued at the market value of the underlying common stock at the dates of grant and are expensed over the performance period. On a periodic basis, the Company reviews the actual and forecasted performance of the Company against the stated targets for each award. The total expense is adjusted upward or downward based on the expected number of shares to be issued as defined in the respective stock performance award agreement. If minimum targets as detailed under the award are not met, no additional compensation expense will be recognized and any previously recognized compensation expense will be reversed. During 2022, 2021 and 2020, the Company recognized expense, net of performance adjustments, of $9.6 million, $26.9 million and $8.4 million, respectively, relating to Stock Performance Awards. The expense recognized in 2021 included $7.6 million of additional stock expense associated with the contractual acceleration of outstanding performance share awards upon the passing of the Company's former CEO. At December 25, 2022, the amount of total unrecognized compensation cost related to these awards is approximately $26.5 million and the weighted average period over which this will be expensed is 22 months.
HASBRO, INC. AND SUBSIDIARIES
Notes to Consolidated Financial Statements — (Continued)
Restricted Stock Units
The Company, as part of its annual equity grant to executive officers and certain other employees, issues restricted stock or grants restricted stock units. These shares or units are nontransferable and subject to forfeiture for periods prescribed by the Company. These awards are valued at the market value of the underlying common stock at the date of grant and are subsequently amortized over the periods during which the restrictions lapse, generally three years. During 2022, 2021 and 2020, the Company recognized compensation expense, net of forfeitures, on these awards of $60.7 million, $50.9 million and $28.5 million, respectively. The expense recognized in 2021 included $6.0 million of additional stock expense associated with the contractual acceleration of outstanding restricted stock awards upon the passing of the Company's former CEO. At December 25, 2022, the amount of total unrecognized compensation cost related to restricted stock units is $61.8 million and the weighted average period over which this will be expensed is 23 months.
Information with respect to the remaining Restricted Stock Awards and Restricted Stock Units for 2022, 2021 and 2020 is as follows:
| | | | | | | | | | | | | | | | | |
| (In millions, except per share data) | 2022 | | 2021 | | 2020 |
| Outstanding at beginning of year | 1.1 | | | 1.0 | | | 0.5 | |
| Granted | 0.7 | | | 0.7 | | | 0.8 | |
| Forfeited | (0.1) | | | (0.1) | | | (0.1) | |
| Vested | (0.5) | | | (0.5) | | | (0.2) | |
| Outstanding at end of year | 1.2 | | | 1.1 | | | 1.0 | |
| Weighted average grant-date fair value: | | | | | |
| Granted | $ | 86.41 | | | 91.06 | | | 91.80 | |
| Forfeited | $ | 91.18 | | | 85.88 | | | 94.01 | |
| Vested | $ | 91.33 | | | 91.42 | | | 94.21 | |
| Outstanding at end of year | $ | 88.85 | | | 91.78 | | | 91.56 | |
Stock Options
Information with respect to stock options for each of the three fiscal years ended December 25, 2022 is as follows:
| | | | | | | | | | | | | | | | | |
| (In millions, except per share data) | 2022 | | 2021 | | 2020 |
| Outstanding at beginning of year | 2.9 | | | 2.8 | | | 2.4 | |
| Granted | 0.6 | | | 0.6 | | | 0.8 | |
| Exercised | (0.8) | | | (0.5) | | | (0.3) | |
| Expired or forfeited | (0.9) | | | — | | | (0.1) | |
| Outstanding at end of year | 1.8 | | | 2.9 | | | 2.8 | |
| Exercisable at end of year | 0.8 | | | 2.1 | | | 1.5 | |
| Weighted average exercise price: | | | | | |
| Granted | $ | 94.89 | | | 90.31 | | | 96.79 | |
| Exercised | $ | 85.60 | | | 65.12 | | | 55.82 | |
| Expired or forfeited | $ | 97.16 | | | 95.59 | | | 94.32 | |
| Outstanding at end of year | $ | 93.62 | | | 92.15 | | | 88.16 | |
| Exercisable at end of year | $ | 92.95 | | | 92.05 | | | 82.80 | |
With respect to the 1.8 million outstanding options and 0.8 million options exercisable at December 25, 2022, the weighted average remaining contractual life of these options was 4.61 years and 3.26 years, respectively, all of which have no intrinsic value.
The Company uses the Black-Scholes valuation model in determining the fair value of stock options. The expected life of the options used in this calculation is the period of time the options are expected to be outstanding
HASBRO, INC. AND SUBSIDIARIES
Notes to Consolidated Financial Statements — (Continued)
and has been determined based on historical exercise experience. The weighted average fair value of options granted in fiscal 2022, 2021 and 2020 was $22.12, $21.30 and $18.58, respectively. The fair value of each option grant is estimated on the date of grant using the Black-Scholes option pricing model with the following weighted average assumptions used for grants in the fiscal years 2022, 2021 and 2020:
| | | | | | | | | | | | | | | | | |
| 2022 | | 2021 | | 2020 |
| Risk-free interest rate | 1.79 | % | | 0.50 | % | | 1.38 | % |
| Expected dividend yield | 2.95 | % | | 3.01 | % | | 2.81 | % |
| Expected volatility | 37 | % | | 38 | % | | 30 | % |
| Expected option life | 4 years | | 4 years | | 4 years |
The intrinsic values, which represent the difference between the fair market value on the date of exercise and the exercise price of the option, for the options exercised in fiscal 2022, 2021 and 2020 were $13.6 million, $16.0 million and $9.7 million, respectively.
At December 25, 2022, the amount of total unrecognized compensation cost related to stock options was $10.6 million and the weighted average period over which this will be expensed is 23 months.
Non-Employee Awards
In 2022, 2021 and 2020, the Company granted 24,000, 17,000 and 30,000 shares of common stock, respectively, to its non-employee members of its Board of Directors. Of these shares, the receipt of 12,000 shares from the 2022 grant, 10,000 shares from the 2021 grant and 20,000 shares from the 2020 grant has been deferred to the date upon which the respective director ceases to be a member of the Company’s Board of Directors. These awards were valued at the market value of the underlying common stock at the date of grant and vested upon grant. In connection with these grants, compensation cost of $2.1 million was recorded in selling, distribution and administration expense in the year ended December 25, 2022, $1.6 million in the year ended December 26, 2021 and $1.8 million in the year December 27, 2020.
(16) Pension, Postretirement and Postemployment Benefits
Pension and Postretirement Benefits
The Company recognizes an asset or liability for each of its defined benefit pension plans equal to the difference between the projected benefit obligation of the plan and the fair value of the plan’s assets. Actuarial gains and losses and prior service costs that have not yet been included in income are recognized in the consolidated balance sheets in AOCE. Reclassifications to earnings from AOCE related to pension and postretirement plans are recorded to other (income) expense.
Expenses related to the Company’s defined benefit pension and defined contribution plans for 2022, 2021 and 2020 were approximately $45.5 million, $49.3 million and $44.7 million, respectively. Of these amounts, $39.5 million, $42.7 million and $38.4 million, respectively, related to defined contribution plans in the United States and certain international subsidiaries. The remainder of the expense relates to defined benefit pension plans discussed below.
United States Plans
Prior to 2008, substantially all United States employees were covered under at least one of several non-contributory defined benefit pension plans maintained by the Company. Benefits under the two major plans which principally covered non-union employees, were based primarily on salary and years of service. Benefits under the remaining plans are based primarily on fixed amounts for specified years of service. In 2007, for the two major plans covering its non-union employees, the Company froze benefits being accrued effective at the end of December 2007. Following the August 2015 sale of its manufacturing facility in East Longmeadow, MA, the Company elected to freeze benefits related to its major plan covering union employees. Effective January 1, 2016, the plan covering union employees merged with and into the Hasbro Inc. Pension Plan, and ceased to exist as a separate plan on that date.
In February 2018, the Compensation Committee of the Company’s Board of Directors approved a resolution to terminate the Company’s U.S. defined benefit pension plan (“U.S. Pension Plan”). During the first quarter of 2018
HASBRO, INC. AND SUBSIDIARIES
Notes to Consolidated Financial Statements — (Continued)
the Company commenced the U.S. Pension Plan termination process and received regulatory approval during the fourth quarter of 2018. During the second quarter of 2019, the Company settled all remaining benefits directly with vested participants electing a lump sum payout, and purchased a group annuity contract from Massachusetts Mutual Life Insurance Company to administer all future payments to remaining U.S. Pension Plan participants. The U.S. Pension Plan's net funded asset position was sufficient to cover the lump sum payments and the purchase of the group annuity contract and settle all other remaining benefit obligations with no additional cost to the Company. After the settlement of the benefit obligations and payment of expenses, the Company had excess assets in the U.S. Pension Plan of approximately $20.2 million. The Company elected to utilize the remaining surplus after payment of administrative expenses for the Company's future matching contributions under the Company's 401(k) plan. The Company made a transfer of $19.5 million to the Company’s 401(k) plan which occurred in February 2020, with the remainder transferred in November 2021. Upon settlement of the pension liability, which occurred in May 2019, the Company recognized a non-operating settlement charge of $110.8 million, with an additional settlement charge of $0.2 million in December 2019, related to pension losses, reclassified from accumulated other comprehensive loss to other (income) expense in the Company's consolidated statements of operations, adjusted for market conditions and settlement costs at benefit distribution.
During 2020, the Company merged its employee retirement agreements, which had beginning benefit liabilities of $14.8 million, with its remaining US pension plans.
At December 25, 2022, the measurement date, the Company's remaining plans were unfunded with an aggregate accumulated and projected benefit obligation of $30.3 million.
The Company also provides certain postretirement health care and life insurance benefits to eligible employees who retired prior to January 1, 2020 and have either attained age 65 with 5 years of service or age 55 with 10 years of service. The cost of providing these benefits on behalf of employees who retired prior to 1993 has been substantially borne by the Company. The cost of providing benefits to all eligible employees who retire after 1992 is borne by the employee. The plan is not funded. During the fourth quarter of 2019, with the approval of the Compensation Committee of the Company's Board of Directors, the Company announced the elimination of the contributory postretirement health and life insurance coverage for employees whose retirement eligibility begins after December 31, 2019.
As of December 25, 2022, the Company had unrecognized gains related to its remaining U.S. pension and post retirement plans of $1.6 million.
HASBRO, INC. AND SUBSIDIARIES
Notes to Consolidated Financial Statements — (Continued)
Reconciliations of the beginning and ending balances for the projected benefit obligation, the fair value of plan assets and the funded status are included below for the years ended December 25, 2022 and December 26, 2021.
| | | | | | | | | | | | | | | | | | | | | | | |
| Pension | | Postretirement |
| (In millions) | 2022 | | 2021 | | 2022 | | 2021 |
| Change in Projected Benefit Obligation | | | | | | | |
| Projected benefit obligation — beginning | $ | 41.6 | | | 46.0 | | | 28.1 | | | 29.9 | |
| | | | | | | |
| Interest cost | 1.1 | | | 1.1 | | | 0.8 | | | 0.8 | |
| Transfer in | — | | | — | | | — | | | — | |
| Actuarial (gain) loss | (9.3) | | | (1.1) | | | (7.6) | | | 0.4 | |
| Benefits paid | (3.1) | | | (3.1) | | | (1.7) | | | (1.8) | |
| Plan amendments | — | | | — | | | — | | | (1.2) | |
| | | | | | | |
| Settlements paid | — | | | (1.3) | | | — | | | — | |
| Projected benefit obligation — ending | $ | 30.3 | | | 41.6 | | | 19.6 | | | 28.1 | |
| Accumulated benefit obligation — ending | $ | 30.3 | | | 41.6 | | | 19.6 | | | 28.1 | |
| Change in Plan Assets | | | | | | | |
| Fair value of plan assets — beginning | $ | — | | | $ | — | | | — | | | — | |
| | | | | | | |
| | | | | | | |
| | | | | | | |
| | | | | | | |
| | | | | | | |
| | | | | | | |
| Fair value of plan assets — ending | $ | — | | | — | | | — | | | — | |
| Reconciliation of Funded Status | | | | | | | |
| Projected benefit obligation | $ | (30.3) | | | (41.6) | | | (19.6) | | | (28.1) | |
| Fair value of plan assets | — | | | — | | | — | | | — | |
| Funded status | (30.3) | | | (41.6) | | | (19.6) | | | (28.1) | |
| Unrecognized prior service cost (credit) | — | | | — | | | (0.9) | | | (1.2) | |
| Unrecognized net loss | 3.2 | | | 13.2 | | | (3.8) | | | 3.9 | |
| Net amount | $ | (27.1) | | | (28.4) | | | (24.3) | | | (25.4) | |
| Accrued liabilities | $ | (3.0) | | | (3.2) | | | (1.5) | | | (1.6) | |
| Other liabilities | (27.3) | | | (38.4) | | | (18.0) | | | (26.5) | |
| Accumulated other comprehensive (earnings) loss | 3.2 | | | 13.2 | | | (4.8) | | | 2.7 | |
| Net amount | $ | (27.1) | | | (28.4) | | | (24.3) | | | (25.4) | |
Assumptions used to determine the year-end pension and postretirement benefit obligations are as follows:
| | | | | | | | | | | |
| 2022 | | 2021 |
| Pension | | | |
| Weighted average discount rate | 5.61 | % | | 2.91 | % |
| Mortality table | PriH-2012/Scale
MP - 2021 | | PriH-2012/Scale
MP - 2021 |
| Postretirement | | | |
| Discount rate | 5.58 | % | | 3.03 | % |
| Health care cost trend rate assumed for next year | 7.00 | % | | 6.00 | % |
| Rate to which the cost trend rate is assumed to decline (ultimate trend rate) | 5.00 | % | | 5.00 | % |
| Year that the rate reaches the ultimate trend | 2031 | | 2025 |
HASBRO, INC. AND SUBSIDIARIES
Notes to Consolidated Financial Statements — (Continued)
The following presents detail of the components of the net periodic benefit cost for the three years ended December 25, 2022.
| | | | | | | | | | | | | | | | | |
| (In millions) | 2022 | | 2021 | | 2020 |
| Components of Net Periodic Cost | | | | | |
| Pension | | | | | |
| Service cost | $ | — | | | — | | | — | |
| Interest cost | 1.1 | | | 1.1 | | | 1.5 | |
| Expected return on assets | — | | | — | | | — | |
| | | | | |
| Amortization of actuarial loss | 0.8 | | | 1.0 | | | 0.7 | |
| Curtailment/Settlement losses | — | | | 0.5 | | | — | |
| Net periodic benefit cost | $ | 1.9 | | | 2.6 | | | 2.2 | |
| Postretirement | | | | | |
| Interest cost | 0.8 | | | 0.8 | | | 0.9 | |
| Amortization of service cost | (0.3) | | | — | | | — | |
| Amortization of actuarial loss | 0.1 | | | — | | | — | |
| Net periodic benefit cost | $ | 0.6 | | | 0.8 | | | 0.9 | |
Assumptions used to determine net periodic benefit cost of the pension plan and postretirement plan for each fiscal year follow:
| | | | | | | | | | | | | | | | | |
| 2022 | | 2021 | | 2020 |
| Pension | | | | | |
| Weighted average discount rate | 2.91 | % | | 2.51 | % | | 3.33 | % |
| Long-term rate of return on plan assets | N/A | | N/A | | N/A |
| Postretirement | | | | | |
| Discount rate | 3.03 | % | | 2.72 | % | | 3.46 | % |
| Health care cost trend rate assumed for next year | 6.00 | % | | 6.25 | % | | 6.25 | % |
| Rate to which the cost trend rate is assumed to decline (ultimate trend rate) | 5.00 | % | | 5.00 | % | | 5.00 | % |
| Year that the rate reaches the ultimate trend rate | 2025 | | 2025 | | 2024 |
Expected benefit payments under the defined benefit pension plans and the postretirement benefit plan for the next five years subsequent to 2022 and in the aggregate for the following five years are as follows:
| | | | | | | | | | | |
| (In millions) | Pension | | Postretirement |
| 2023 | $ | 3.1 | | | $ | 1.6 | |
| 2024 | 3.0 | | | 1.6 | |
| 2025 | 2.9 | | | 1.5 | |
| 2026 | 2.8 | | | 1.5 | |
| 2027 | 2.7 | | | 1.5 | |
| 2028-2032 | 12.3 | | | 6.8 | |
International Plans
Pension coverage for employees of Hasbro’s international subsidiaries is provided, to the extent deemed appropriate, through separate defined benefit and defined contribution plans. At December 25, 2022 and December 26, 2021, the defined benefit plans had total projected benefit obligations of $77.8 million and $121.6 million, respectively, and fair values of plan assets of $71.0 million and $94.8 million, respectively. Substantially all of the plan assets are invested in equity and fixed income securities. The pension expense related to these plans was $3.1 million, $4.0 million and $3.5 million in 2022, 2021 and 2020, respectively. In fiscal 2023, the Company expects
HASBRO, INC. AND SUBSIDIARIES
Notes to Consolidated Financial Statements — (Continued)
an immaterial amount of unrecognized net losses, amortization of prior service costs and unrecognized transition obligation to be included as a component of net periodic benefit cost.
Expected benefit payments under the international defined benefit pension plans for the five years subsequent to 2022 and in the aggregate for the five years thereafter are as follows: 2023: $2.3 million; 2024: $2.5 million; 2025: $2.6 million; 2026: $2.8 million; 2027: $3.0 million; and 2028 through 2032: $19.0 million.
Postemployment Benefits
Hasbro has several plans covering certain groups of employees, which may provide benefits to such employees following their period of active employment but prior to their retirement. These plans include certain severance plans which provide benefits to employees involuntarily terminated and certain plans which continue the Company’s health and life insurance contributions for employees who have left Hasbro’s employ under terms of its long-term disability plan.
(17) Leases
The Company occupies offices and uses certain equipment under various operating lease arrangements. The Company has no finance leases. The leases have remaining terms of 1 to 10 years, some of which include options to extend lease terms or options to terminate current lease terms at certain times, subject to notice requirements set out in the lease agreement. Payments under certain of the lease agreements may be subject to adjustment based on a consumer price index or other inflationary indices. The lease liability for such lease agreements as of the adoption date, was based on fixed payments as of the adoption date. Any adjustments to these payments based on the related indices will be recorded to expense as incurred. Leases with an expected term of 12 months or less are not capitalized. Lease expense under such leases is recorded straight line over the life of the lease. The Company capitalizes non-lease components for equipment leases, but expenses non-lease components as incurred for real estate leases.
The rent expense under such arrangements and similar arrangements that do not qualify as leases under ASU 2016-02, net of sublease income amounted to $93.9 million, $88.2 million and $90.6 million, respectively, for each of the years ended December 27, 2020, December 26, 2021 and December 25, 2022, and was not material to the Company’s financial statements nor were expenses related to short term leases (expected term less than twelve months) or variable lease payments during those same periods.
All leases expire prior to 2033. Real estate taxes, insurance and maintenance expenses are generally obligations of the Company. Operating leases often contain renewal options. In those locations in which the Company continues to operate, management expects that, in the normal course of business, leases that expire will be renewed or replaced by leases on other properties.
Information related to the Company's leases for the years ended December 25, 2022 and December 26, 2021 is as follows:
| | | | | | | | | | | |
| Year Ended | | Year Ended |
| (In millions) | December 25, 2022 | | December 26, 2021 |
| Cash paid for amounts included in the measurement of lease liabilities: | | | |
| Operating cash flows from operating leases | $ | 52.4 | | | $ | 53.4 | |
| Right-of-use assets obtained in exchange for lease obligations: | | | |
| Operating leases net of lease modifications | $ | 5.8 | | | $ | 28.4 | |
| | | |
| Weighted Average Remaining Lease Term: | | | |
| Operating leases | 4.4 years | | 5.6 years |
| Weighted Average Discount Rate: | | | |
| Operating leases | 3.4 | % | | 3.0 | % |
HASBRO, INC. AND SUBSIDIARIES
Notes to Consolidated Financial Statements — (Continued)
The following is a reconciliation of future undiscounted cash flows to the operating liabilities, and the related right of use assets, included in our Consolidated Balance Sheets as of December 25, 2022:
| | | | | |
| Year Ended |
| (In millions) | December 25, 2022 |
| 2023 | $ | 44.8 | |
| 2024 | 31.8 | |
| 2025 | 25.9 | |
| 2026 | 20.4 | |
| 2027 | 12.3 | |
| 2028 and thereafter | 14.1 | |
| Total future lease payments | 149.3 | |
| Less imputed interest | 17.8 | |
| Present value of future operating lease payments | 131.5 | |
Less current portion of operating lease liabilities (1) | 39.6 | |
Non-current operating lease liability (2) | 91.9 | |
Operating lease right-of-use assets, net (3) | $ | 118.3 | |
| |
(1) Included in Accrued liabilities on the consolidated balance sheets | |
(2) Included in Other liabilities on the consolidated balance sheets | |
(3) Included in Property, plant and equipment on the consolidated balance sheets | |
At December 25, 2022, the Company was party to certain operating lease agreements commencing during 2023 and as such, are not included in the Company's consolidated balance sheets as of December 25, 2022. These lease agreements have terms extending into 2029 and the total future expected undiscounted payments for these leases are $65.2 million.
(18) Derivative Financial Instruments
Hasbro uses foreign currency forward and option contracts to mitigate the impact of currency rate fluctuations on firmly committed and projected future foreign currency transactions. These over-the-counter contracts, which hedge future currency requirements related to purchases of inventory, product sales, television and film production cost and production financing facilities (see note 11) as well as other cross-border transactions not denominated in the functional currency of the business unit, are primarily denominated in United States and Hong Kong dollars, and Euros. All contracts are entered into with a number of counterparties, all of which are major financial institutions. The Company believes that a default by a single counterparty would not have a material adverse effect on the financial condition of the Company. Hasbro does not enter into derivative financial instruments for speculative purposes.
Cash Flow Hedges
All of the Company’s designated foreign currency forward contracts are considered to be cash flow hedges. These instruments hedge a portion of the Company’s currency requirements associated with anticipated inventory purchases, product sales, certain production financing loans and other cross-border transactions, primarily in years 2023 and to a lesser extent, 2024.
HASBRO, INC. AND SUBSIDIARIES
Notes to Consolidated Financial Statements — (Continued)
At December 25, 2022 and December 26, 2021, the notional amounts and fair values of the Company’s foreign currency forward and option contracts designated as cash flow hedging instruments were as follows:
| | | | | | | | | | | | | | | | | | | | | | | |
| 2022 | | 2021 |
| (In millions) | Notional
Amount | | Fair
Value | | Notional
Amount | | Fair
Value |
| Hedged transaction | | | | | | | |
| Inventory purchases | $ | 166.3 | | | (2.7) | | | 199.1 | | | 10.4 | |
| Sales | 99.2 | | | 1.2 | | | 104.5 | | | (1.9) | |
| Production financing and other | 116.8 | | | 1.5 | | | 217.0 | | | 2.3 | |
| Total | $ | 382.3 | | | — | | | 520.6 | | | 10.8 | |
The Company has a master agreement with each of its counterparties that allows for the netting of outstanding forward contracts. The fair values of the Company’s foreign currency forward contracts designated as cash flow hedges are recorded in the consolidated balance sheets at December 25, 2022 and December 26, 2021 as follows:
| | | | | | | | | | | |
| (In millions) | 2022 | | 2021 |
| Prepaid expenses and other current assets | | | |
| Unrealized gains | $ | 4.3 | | | 13.8 | |
| Unrealized losses | (1.8) | | | (3.1) | |
| Net unrealized gains | $ | 2.5 | | | 10.7 | |
| Other assets | | | |
| Unrealized gains | $ | 0.3 | | | 0.2 | |
| Unrealized losses | — | | | — | |
| Net unrealized gains | $ | 0.3 | | | 0.2 | |
| Accrued liabilities | | | |
| Unrealized gains | $ | 1.6 | | | — | |
| Unrealized losses | (4.4) | | | (0.1) | |
| Net unrealized losses | $ | (2.8) | | | (0.1) | |
| | | |
| | | |
| | | |
| | | |
| | | |
| | | |
| | | |
| | | |
Net gains (losses) on cash flow hedging activities have been reclassified from other comprehensive earnings (loss) to net earnings for the years ended December 25, 2022, December 26, 2021 and December 27, 2020 as follows:
| | | | | | | | | | | | | | | | | |
| (In millions) | 2022 | | 2021 | | 2020 |
| Consolidated Statements of Operations Classification | | | | | |
| Cost of sales | $ | 17.3 | | | (4.7) | | | 21.2 | |
| Net revenues | 2.3 | | | 1.0 | | | 2.9 | |
| Other | (0.9) | | | 2.0 | | | 1.2 | |
| Net realized (losses) gains | $ | 18.7 | | | (1.7) | | | 25.3 | |
Undesignated Hedges
The Company also enters into foreign currency forward contracts to minimize the impact of changes in the fair value of intercompany loans due to foreign currency changes. The Company does not use hedge accounting for these contracts as changes in the fair values of these contracts are substantially offset by changes in the fair value of the intercompany loans. Additionally, to manage transactional exposure to fair value movements on certain monetary assets and liabilities denominated in foreign currencies, the Company has implemented a balance sheet hedging program. The Company does not use hedge accounting for these contracts as changes in the fair values of these contracts are offset by changes in the fair value of the balance sheet items. As of December 25, 2022 and
HASBRO, INC. AND SUBSIDIARIES
Notes to Consolidated Financial Statements — (Continued)
December 26, 2021, the total notional amounts of the Company’s undesignated derivative instruments were $765.6 million and $632.0 million, respectively.
At December 25, 2022 and December 26, 2021, the fair value of the Company’s undesignated derivative financial instruments are recorded in the consolidated balance sheets as follows:
| | | | | | | | | | | |
| (In millions) | 2022 | | 2021 |
| Prepaid expenses and other current assets | | | |
| Unrealized gains | $ | 10.9 | | | — | |
| Unrealized losses | (5.9) | | | — | |
| Net unrealized gains | $ | 5.0 | | | — | |
| | | |
| Accrued liabilities | | | |
| Unrealized gains | $ | — | | | 3.5 | |
| Unrealized losses | — | | | (6.0) | |
| Net unrealized losses | $ | — | | | (2.5) | |
| Total unrealized (losses) gains, net | $ | 5.0 | | | (2.5) | |
The Company recorded net gains (losses) of $42.1 million, $4.6 million and $(27.7) million on these instruments to other (income) expense, net for 2022, 2021 and 2020, respectively, relating to the change in fair value of such derivatives, substantially offsetting gains and losses from the change in fair value of intercompany loans to which the instruments relate.
For additional information related to the Company’s derivative financial instruments see notes 4 and 14.
(19) Restructuring Actions
During 2018 and 2020, the Company took certain restructuring actions including headcount reduction aimed at right-sizing the Company’s cost-structure and integration actions related to the acquisition of eOne. As of December 25, 2022, the Company had a remaining balance of $9.0 million in severance and other employee expenses related to these programs, after reflecting payments of $5.8 million during the year.
During 2022, in support of Blueprint 2.0, Hasbro announced an Operational Excellence program under which the Company took certain restructuring actions, including global workforce reductions, resulting in severance and other employee charges of $94.1 million recorded in Selling, Distribution and Administration within the Corporate and Other segment.
The detail of activity related to the Company's Operational Excellence program as of December 25, 2022 is as follows:
| | | | | | | | | | | | | |
| (In millions) | | | | | | | Total |
| | | | | | | |
| | | | | | | |
| | | | | | | |
| | | | | | | |
| 2022 Operational Excellence charges | | | | | | | $ | 94.1 | |
| | | | | | | |
| Payments made in 2022 | | | | | | | (9.2) | |
| Remaining amounts to be paid as of December 25, 2022 | | | | | | | $ | 84.9 | |
(20) Commitments and Contingencies
Hasbro had unused open letters of credit and related instruments of approximately $11.9 million and $13.6 million at December 25, 2022 and December 26, 2021, respectively.
HASBRO, INC. AND SUBSIDIARIES
Notes to Consolidated Financial Statements — (Continued)
The Company enters into license agreements with strategic partners, inventors, designers and others for the use of intellectual properties in its products. Certain of these agreements contain provisions for the payment of guaranteed or minimum royalty amounts. In addition, the Company enters into contractual commitments to obtain film and television content distribution rights and minimum guarantee commitments related to the purchase of film and television rights for content to be delivered in the future. Under terms of existing agreements as of December 25, 2022, Hasbro may, provided the other party meets their contractual commitment, be required to pay amounts as follows: 2023: $149.4 million; 2024: $64.8 million; 2025: $70.5 million; 2026: $73.0 million; 2027: $10.0 million; and thereafter: $13.0 million. At December 25, 2022, the Company had $12.9 million of prepaid royalties, all of which are included in prepaid expenses and other current assets
Interest payment obligations on the Company's fixed-rate long-term debt are as follows: 2023: $145.9 million; 2024: $145.9 million; 2025: $130.9 million; 2026: $130.9 million; 2027: $104.0 million; and thereafter: $719.1 million. See note 11 for information on repayment terms for the Company's variable rate term loans.
The Company enters into contracts with certain partners which among other things, provide the Company with the right of first refusal to purchase, distribute, or license certain entertainment projects or content. At December 25, 2022, the Company estimates that it may be obligated to pay $18.9 million and $4.5 million, in 2023 and 2024, respectively, related to such agreements.
In connection with the Company’s agreement to form a joint venture with Discovery, the Company is obligated to make future payments to Discovery under a tax sharing agreement. The Company estimates these payments may total approximately $15.6 million and may range from approximately $0.4 million to $6.4 million per year during the period 2023 to 2026, with no remaining payments due thereafter. These payments are contingent upon the Company having sufficient taxable income to realize the expected tax deductions of certain amounts related to the joint venture.
At December 25, 2022, the Company estimates payments related to inventory and tooling purchase commitments may total approximately $452.7 million, including the remaining contractual commitment of $85.0 million in 2023 under the manufacturing agreement with Cartamundi.
Hasbro is party to certain legal proceedings, as well as certain asserted and unasserted claims. Amounts accrued, as well as the total amount of reasonably possible losses with respect to such matters, individually and in the aggregate, are not deemed to be material to the consolidated financial statements.
See note 17 for additional information on the Company's future lease payment commitments. See note 11 for additional information on the Company's long-term debt and production financing repayments.
(21) Segment Reporting
Segment and Geographic Information
Hasbro is a global play and entertainment company with a broad portfolio of brands and entertainment content spanning toys, games, licensed products ranging from traditional to digital, as well as film and television entertainment. In the first quarter of 2020, the Company completed its acquisition of the global independent studio, eOne and throughout 2020, the Company successfully integrated the acquired eOne business and started to achieve synergies as a combined company. During the first quarter of 2021, the Company realigned its reportable segment structure to: (1) align with changes to its business structure subsequent to the integration of eOne; and (2) reflect changes to its reporting structure and provide transparency into how operating performance is measured. The Company's three principal reportable segments are (i) Consumer Products, (ii) Wizards of the Coast and Digital Gaming, and (iii) Entertainment.
The Consumer Products segment engages in the sourcing, marketing and sales of toy and game products around the world. The Consumer Products business also promotes the Company's brands through the out-licensing of our trademarks, characters and other brand and intellectual property rights to third parties, through the sale of branded consumer products such as toys and apparel. The Wizards of the Coast and Digital Gaming business engages in the promotion of the Company's brands through the development of trading card, role-playing and digital game experiences based on Hasbro and Wizards of the Coast games. The Entertainment segment engages in the development, acquisition, production, distribution and sale of world-class entertainment content including film, scripted and unscripted television, family programming, digital content and live entertainment.
HASBRO, INC. AND SUBSIDIARIES
Notes to Consolidated Financial Statements — (Continued)
Segment performance is measured at the operating profit level. Included in Corporate and eliminations are certain corporate expenses, including the elimination of intersegment transactions and certain assets benefiting more than one segment. Intersegment sales and transfers are reflected in management reports at amounts approximating cost. Certain shared costs, including global development and marketing expenses and corporate administration, are allocated to segments based upon expenses and foreign exchange rates fixed at the beginning of the year, with adjustments to actual expenses and foreign exchange rates included in Corporate and eliminations. The accounting policies of the segments are the same as those referenced in note 1.
Results shown for fiscal years 2022, 2021 and 2020 are not necessarily those which would be achieved if each segment was an unaffiliated business enterprise.
Reclassifications of certain prior year segment results and account balances have been made to conform to the current-year presentation. None of the segment changes impact the Company's previously reported consolidated net revenue, operating profits, net earnings or net earnings per share.
On June 29, 2021, the Company completed the sale of eOne Music. The financial results of eOne Music were recorded within the Company's Entertainment segment through the date of the closing of the sale. The assets and liabilities of eOne Music were de-consolidated as of the closing date and there are no remaining carrying amounts in the Company's Consolidated Balance Sheets as of December 26, 2021. The sale of eOne Music in 2021 did not impact the Company's previously reported 2020 net revenues, operating profit, earnings, assets or liabilities.
Information by segment and a reconciliation to reported amounts are as follows:
| | | | | | | | | | | | | | | | | | | | | | | | | | | | | | | | | | | |
| (In millions) | Revenues
from
External
Customers | | Affiliate
Revenue | | Operating
Profit
(Loss) | | Depreciation
and
Amortization | | Capital
Additions | | Total
Assets |
| 2022 | | | | | | | | | | | |
Consumer Products(a) | $ | 3,572.5 | | | 396.7 | | | 217.3 | | | 152.5 | | | 87.0 | | | 5,757.7 | |
| Wizards of the Coast and Digital Gaming | 1,325.1 | | | 172.5 | | | 538.3 | | | 14.6 | | | 52.5 | | | 2,968.7 | |
Entertainment(a) | 959.1 | | | 57.5 | | | 22.7 | | | 43.8 | | | 6.9 | | | 6,273.3 | |
Corporate and Other(b) | — | | | (626.7) | | | (370.6) | | | 21.6 | | | 27.8 | | | (5,703.8) | |
| Consolidated Total | $ | 5,856.7 | | | — | | | 407.7 | | | 232.5 | | | 174.2 | | | 9,295.9 | |
| 2021 | | | | | | | | | | | |
| Consumer Products | $ | 3,981.6 | | | 465.4 | | | 401.4 | | | 112.4 | | | 73.1 | | | 4,925.5 | |
| Wizards of the Coast and Digital Gaming | 1,286.6 | | | 121.6 | | | 547.0 | | | 48.5 | | | 35.1 | | | 1,585.1 | |
| Entertainment | 1,152.2 | | | 61.5 | | | (91.8) | | | 96.6 | | | 6.2 | | | 6,052.8 | |
Corporate and Other(b) | — | | | (648.5) | | | (93.3) | | | 22.6 | | | 18.3 | | | (2,525.6) | |
| Consolidated Total | $ | 6,420.4 | | | — | | | 763.3 | | | 280.1 | | | 132.7 | | | 10,037.8 | |
| 2020 | | | | | | | | | | | |
| Consumer Products | $ | 3,649.6 | | | 379.0 | | | 308.1 | | | 78.3 | | | 69.3 | | | 5,552.5 | |
| Wizards of the Coast and Digital Gaming | 906.7 | | | 77.3 | | | 420.4 | | | 9.0 | | | 35.9 | | | 585.7 | |
| Entertainment | 909.1 | | | 5.9 | | | (141.1) | | | 138.0 | | | 6.6 | | | 6,003.0 | |
Corporate and Other(b) | — | | | (462.2) | | | (85.6) | | | 39.7 | | | 14.0 | | | (1,322.8) | |
| Consolidated Total | $ | 5,465.4 | | | — | | | 501.8 | | | 265.0 | | | 125.8 | | | 10,818.4 | |
(a)Beginning in 2022, the Company has allocated certain of the intangible amortization costs related to the assets acquired in the eOne Acquisition, between the Consumer Products and Entertainment segments.
(b)Certain long-term assets, including property, plant and equipment, goodwill and other intangibles, which benefit multiple operating segments, are included in both Entertainment and Corporate and Other. Allocations of certain expenses, related assets within the individual operating segments, are done at the beginning of the
HASBRO, INC. AND SUBSIDIARIES
Notes to Consolidated Financial Statements — (Continued)
year based on budgeted amounts. Any differences between actual and budgeted amounts are reflected in Corporate and Other. Furthermore, Corporate and Other includes elimination of inter-company income statement transactions. Corporate and Other also includes the elimination of inter-company balance sheet amounts.
The following table represents consolidated Consumer Products segment net revenues by major geographic region for the three fiscal years ended December 25, 2022.
| | | | | | | | | | | | | | | | | |
| (In millions) | 2022 | | 2021 | | 2020 |
| North America | $ | 2,064.8 | | | 2,315.9 | | | 2,116.2 | |
| Europe | 899.5 | | | 1,067.7 | | | 989.2 | |
| Asia Pacific | 293.4 | | | 310.1 | | | 295.6 | |
| Latin America | 314.8 | | | 287.9 | | | 248.6 | |
| Net revenues | $ | 3,572.5 | | | 3,981.6 | | | 3,649.6 | |
The following table represents consolidated Wizards of the Coast and Digital Gaming segment net revenues by category for the three fiscal years ended December 25, 2022:
| | | | | | | | | | | | | | | | | |
| (In millions) | 2022 | | 2021 | | 2020 |
| Tabletop Gaming | $ | 1,067.0 | | | 950.6 | | | 659.6 | |
| Digital and Licensed Gaming | 258.1 | | | 336.0 | | | 247.1 | |
| Net revenues | $ | 1,325.1 | | | 1,286.6 | | | 906.7 | |
The following table represents consolidated Entertainment segment net revenues by category for the three fiscal years ended December 25, 2022.
| | | | | | | | | | | | | | | | | |
| (In millions) | 2022 | | 2021 | | 2020 |
| Film and TV | $ | 837.6 | | | 932.5 | | | 700.5 | |
| Family Brands | 79.4 | | | 132.9 | | | 86.5 | |
| Music and Other | 42.1 | | | 86.8 | | | 122.1 | |
| Net revenues | $ | 959.1 | | | 1,152.2 | | | 909.1 | |
The following table presents consolidated net revenues by brand portfolio for the three fiscal years ended December 25, 2022.
| | | | | | | | | | | | | | | | | |
| (In millions) | 2022 | | 2021 | | 2020 |
Franchise Brands (1) | $ | 2,830.6 | | | 2,955.6 | | | 2,394.3 | |
| Partner Brands | 1,052.0 | | | 1,161.0 | | | 1,079.4 | |
Hasbro Gaming (2) | 743.3 | | | 851.4 | | | 814.8 | |
Emerging Brands (1) | 402.1 | | | 454.7 | | | 372.2 | |
| TV/Film/Entertainment | 828.7 | | | 997.7 | | | 804.7 | |
| Net revenues | $ | 5,856.7 | | | 6,420.4 | | | 5,465.4 | |
(1) Effective in the first quarter of 2022, the Company moved PEPPA PIG into Franchise Brands from Emerging Brands. For comparability, the year ended December 26, 2021 net revenues have been restated to reflect the elevation of PEPPA PIG from Emerging Brands into Franchise Brands resulting in a change of $162.9 million.
(2) Hasbro’s total gaming category, including all gaming net revenues, most notably MAGIC: THE GATHERING and MONOPOLY, totaled $1,997.5 million, $2,098.9 million and $1,763.8 million for the years ended December 25, 2022, December 26, 2021 and December 27, 2020, respectively.
HASBRO, INC. AND SUBSIDIARIES
Notes to Consolidated Financial Statements — (Continued)
Information as to Hasbro’s operations in different geographical areas is presented below on the basis the Company uses to manage its business. Net revenues are categorized based on the location of the customer, while long-lived assets (property, plant and equipment, goodwill and other intangibles) are categorized based on their location.
| | | | | | | | | | | | | | | | | |
| (In millions) | 2022 | | 2021 | | 2020 |
| Net revenues | | | | | |
| United States | $ | 3,544.2 | | | 3,898.9 | | | 3,202.4 | |
| International | 2,312.5 | | | 2,521.5 | | | 2,263.0 | |
| $ | 5,856.7 | | | 6,420.4 | | | 5,465.4 | |
| Long-lived assets | | | | | |
| United States | $ | 1,042.3 | | | 1,359.6 | | | 1,491.3 | |
| International | 3,665.3 | | | 3,653.0 | | | 4,220.2 | |
| $ | 4,707.6 | | | 5,012.6 | | | 5,711.5 | |
Principal international markets include Europe, Canada, Mexico and Latin America, Australia, China and Hong Kong. Long-lived assets include property, plant and equipment, goodwill and other intangibles.
Other Information
Hasbro markets its tangible products primarily to customers in the retail sector. Although the Company closely monitors the creditworthiness of its customers, adjusting credit policies and limits as deemed appropriate, a substantial portion of its customers’ ability to discharge amounts owed is generally dependent upon the overall retail economic environment.
In 2022 and 2021 the Company’s largest customers were Walmart, Inc. and Amazon.com, Inc. Sales to each of these customers amounted to 11% and 10%, respectively, of consolidated net revenues in 2022 and 13% and 11%, respectively, of consolidated net revenues during 2021. In 2020 sales to these customers amounted to 15% and 10%, respectively, of consolidated net revenues. Net revenues from the Company’s major customers are reported within the Consumer Products segment, Wizards of the Coast & Digital Gaming segment and the Entertainment segment.
Hasbro purchases certain components used in its manufacturing process and certain finished products from manufacturers in the Far East. The Company’s reliance on external sources of manufacturing can be shifted, over a period of time, to alternative sources of supply for products it sells, should such changes be necessary. However, if the Company were prevented from obtaining products from a substantial number of its current Far East suppliers due to political, labor or other factors beyond its control, the Company’s operations would be disrupted, potentially for a significant period of time, while alternative sources of product were secured. The imposition of trade sanctions, tariffs, border adjustment taxes or other measures by the United States or the European Union against a class of products imported by Hasbro from, or the loss of “normal trade relations” status with, China, or other countries where we manufacture products, or other factors which increase the cost of manufacturing in China, or other countries where we manufacture products, such as higher labor costs or an appreciation in the Chinese Yuan, could significantly disrupt our operations and/or significantly increase the cost of the products which are manufactured and imported into other markets.
The Company has agreements which allow it to develop and market products based on properties owned by third parties including its license with Marvel Entertainment, LLC and Marvel Characters B.V. (together “Marvel”) and its license with Lucas Licensing Ltd. and Lucasfilm Ltd. (together “Lucas”). These licenses have multi-year terms and provide the Company with the right to market and sell designated classes of products based on Marvel’s portfolio of brands, including SPIDER-MAN and THE AVENGERS, and Lucas’s STAR WARS brand. Both Marvel and Lucas are owned by The Walt Disney Company.
HASBRO, INC. AND SUBSIDIARIES
Notes to Consolidated Financial Statements — (Continued)
(22) eOne Music Sale
On April 25, 2021, the Company entered into a definitive agreement to sell eOne Music for an aggregate sales price of $385.0 million, subject to certain closing adjustments related to working capital and net debt.
On June 29, 2021, the Company completed the sale of eOne Music for net proceeds of $397.0 million, including the sales price of $385.0 million and $12.0 million of closing adjustments related to working capital and net debt calculations. The final proceeds were subject to further adjustment upon completion of closing working capital, which resulted in a net outflow of $0.9 million. The Company acquired eOne Music through its acquisition of eOne in December 2019. Based on the value of the net assets held by eOne Music, which included goodwill and intangible assets allocated to eOne Music as part of the eOne acquisition, the Company recorded a pre-tax non-cash goodwill impairment charge of $108.8 million within Loss on Disposal of Business on the Consolidated Statements of Operations for the year ended December 26, 2021. The Company also recorded pre-tax cash transaction expenses of $9.5 million within Selling, Distribution and Administration expenses on the Consolidated Statements of Operations during the second quarter of 2021. The impairment charge was recorded within the Entertainment segment and the transaction costs were recorded within the Corporate and Other segment.
The operations of eOne Music did not meet the criteria to be presented as discontinued operations in accordance with Accounting Standards Update No. 2014-08 (ASU 2014-08) Presentation of Financial Statements (Topic 205) and Property, Plant and Equipment (Topic 360) - Reporting Discontinued Operations and Disclosures of Disposals of Components of an Entity and eOne Music did not represent an individually significant component of the Company’s business. Income from operations before income taxes, attributable to eOne Music, was recorded to the Company's Consolidated Statements of Operations, within the Entertainment segment through the sale transaction closing date. Assets of $473.5 million and liabilities of $77.3 million, attributable to eOne Music, were de-consolidated as of the closing date and, as of December 26, 2021, there are no remaining carrying amounts in the Company's Consolidated Balance Sheets.
The following table presents the carrying amounts of the major classes of eOne Music assets and liabilities sold on June 29, 2021 and reflects final working capital adjustments.
| | | | | |
| (In millions) | December 26, 2021 |
| Cash and Cash Equivalents | $ | 18.2 | |
| Goodwill and Other Intangible Assets | 410.3 | |
| Prepaid Expenses | 31.0 | |
| Other Assets | 14.0 | |
| Total Assets | $ | 473.5 | |
| |
| Accrued Liabilities | $ | 24.4 | |
| Deferred Taxes | 36.9 |
| Other Liabilities | 16.0 |
| Total Liabilities | $ | 77.3 | |
Item 9. Changes in and Disagreements with Accountants on Accounting and Financial Disclosure.
None.
Item 9A. Controls and Procedures.
Evaluation of Disclosure Controls and Procedures
The Company maintains disclosure controls and procedures, as defined in Rule 13a-15(e) promulgated under the Securities Exchange Act of 1934 (the “Exchange Act”), that are designed to ensure that information required to be disclosed by the Company in the reports that it files or submits under the Exchange Act is recorded, processed, summarized and reported within the time periods specified in the Securities and Exchange Commission’s rules and forms and that such information is accumulated and communicated to the Company’s management, including its Chief Executive Officer and Chief Financial Officer, as appropriate to allow timely decisions regarding required disclosure. The Company carried out an evaluation, under the supervision and with the participation of the Company’s management, including the Company’s Chief Executive Officer and Chief Financial Officer, of the effectiveness of the design and operation of the Company’s disclosure controls and procedures as of December 25, 2022. Based on the evaluation of these disclosure controls and procedures, the Chief Executive Officer and Chief Financial Officer concluded that the Company’s disclosure controls and procedures were effective.
Management’s Report on Internal Control over Financial Reporting
The Company’s management is responsible for establishing and maintaining adequate internal control over financial reporting, as defined in Rule 13a-15(f) promulgated under the Exchange Act. Hasbro’s internal control system is designed to provide reasonable assurance regarding the reliability of financial reporting and the preparation of the consolidated financial statements for external purposes in accordance with U.S. generally accepted accounting principles. Hasbro’s management assessed the effectiveness of its internal control over financial reporting as of December 25, 2022. In making its assessment, Hasbro’s management used the criteria set forth by the Committee of Sponsoring Organizations of the Treadway Commission in “Internal Control-Integrated Framework (2013)”. Based on this assessment, Hasbro’s management concluded that, as of December 25, 2022, its internal control over financial reporting is effective based on those criteria. Hasbro’s independent registered public accounting firm has issued an audit report on internal control over financial reporting, which is included herein.
Report of Independent Registered Public Accounting Firm
To the Shareholders and Board of Directors
Hasbro, Inc.:
Opinion on Internal Control Over Financial Reporting
We have audited Hasbro, Inc. and subsidiaries' (the Company) internal control over financial reporting as of December 25, 2022, based on criteria established in Internal Control – Integrated Framework (2013) issued by the Committee of Sponsoring Organizations of the Treadway Commission. In our opinion, the Company maintained, in all material respects, effective internal control over financial reporting as of December 25, 2022, based on criteria established in Internal Control – Integrated Framework (2013) issued by the Committee of Sponsoring Organizations of the Treadway Commission.
We also have audited, in accordance with the standards of the Public Company Accounting Oversight Board (United States) (PCAOB), the consolidated balance sheets of the Company as of December 25, 2022 and December 26, 2021, the related consolidated statements of operations, comprehensive earnings, cash flows, and shareholders’ equity and redeemable noncontrolling interests for each of the years in the three-year period ended December 25, 2022, and the related notes and financial statement schedule II - valuation and qualifying accounts (collectively, the consolidated financial statements), and our report dated February 22, 2023 expressed an unqualified opinion on those consolidated financial statements.
Basis for Opinion
The Company’s management is responsible for maintaining effective internal control over financial reporting and for its assessment of the effectiveness of internal control over financial reporting, included in the accompanying Management's Report on Internal Control over Financial Reporting. Our responsibility is to express an opinion on the Company’s internal control over financial reporting based on our audit. We are a public accounting firm registered with the PCAOB and are required to be independent with respect to the Company in accordance with the U.S. federal securities laws and the applicable rules and regulations of the Securities and Exchange Commission and the PCAOB.
We conducted our audit in accordance with the standards of the PCAOB. Those standards require that we plan and perform the audit to obtain reasonable assurance about whether effective internal control over financial reporting was maintained in all material respects. Our audit of internal control over financial reporting included obtaining an understanding of internal control over financial reporting, assessing the risk that a material weakness exists, and testing and evaluating the design and operating effectiveness of internal control based on the assessed risk. Our audit also included performing such other procedures as we considered necessary in the circumstances. We believe that our audit provides a reasonable basis for our opinion.
Definition and Limitations of Internal Control Over Financial Reporting
A company’s internal control over financial reporting is a process designed to provide reasonable assurance regarding the reliability of financial reporting and the preparation of financial statements for external purposes in accordance with generally accepted accounting principles. A company’s internal control over financial reporting includes those policies and procedures that (1) pertain to the maintenance of records that, in reasonable detail, accurately and fairly reflect the transactions and dispositions of the assets of the company; (2) provide reasonable assurance that transactions are recorded as necessary to permit preparation of financial statements in accordance with generally accepted accounting principles, and that receipts and expenditures of the company are being made only in accordance with authorizations of management and directors of the company; and (3) provide reasonable assurance regarding prevention or timely detection of unauthorized acquisition, use, or disposition of the company’s assets that could have a material effect on the financial statements.
Because of its inherent limitations, internal control over financial reporting may not prevent or detect misstatements. Also, projections of any evaluation of effectiveness to future periods are subject to the risk that controls may become inadequate because of changes in conditions, or that the degree of compliance with the policies or procedures may deteriorate.
/s/ KPMG LLP
Providence, Rhode Island
February 22, 2023
Changes in Internal Controls
There were no changes in the Company’s internal control over financial reporting, as defined in Rule 13a-15(f) promulgated under the Exchange Act, during the quarter ended December 25, 2022, that have materially affected, or are reasonably likely to materially affect, the Company’s internal controls over financial reporting.
Item 9B. Other Information.
None.
Item 9C. Disclosure Regarding Foreign Jurisdictions that Prevent Inspections.
Not applicable.
PART III
Item 10. Directors, Executive Officers and Corporate Governance.
Certain of the information required by this item is contained under the captions “Election of Directors”, “Governance of the Company” and, if applicable, under “Delinquent Section 16(a) Reports” in the Company’s definitive proxy statement for the 2023 Annual Meeting of Shareholders and is incorporated herein by reference.
The information required by this item with respect to executive officers of the Company is included in Part I, Item 1. Business, of this Form 10-K under the caption “Our Executive Officers” and is incorporated herein by reference.
The Company has a Code of Conduct, which is applicable to all of the Company’s employees, officers and directors, including the Company’s Chief Executive Officer, Chief Financial Officer and Controller. A copy of the Code of Conduct is available on the Company’s website under the Corporate, Investors, Corporate Governance tabs. The Company’s investor website address is http://hasbro.gcs-web.com. Although the Company does not generally intend to provide waivers of or amendments to the Code of Conduct for its Chief Executive Officer, Chief Financial Officer, Controller, or other officers or employees, information concerning any waiver of or amendment to the Code of Conduct for the Chief Executive Officer, Chief Financial Officer, Controller, or any other executive officers or directors of the Company, will be promptly disclosed on the Company’s website in the location where the Code of Conduct is posted.
The Company has also posted on its website, in the Corporate Governance location referred to above, copies of its Corporate Governance Principles and of the charters for its (i) Audit Committee, (ii) Compensation Committee, (iii) Finance and Capital Allocation Committee, (iv) Nominating, Governance and Social Responsibility Committee, and (v) Cybersecurity and Data Privacy Committee of its Board of Directors.
In addition to being accessible on the Company’s website, copies of the Company’s Code of Conduct, Corporate Governance Principles, and charters for the Company’s Board Committees, are all available free of charge upon request to the Company’s Executive Vice President, Chief Legal Officer and Corporate Secretary, Tarrant Sibley, at 1027 Newport Avenue, P.O. Box 1059, Pawtucket, R.I. 02861-1059.
Item 11. Executive Compensation.
The information required by this item is contained under the captions “Compensation of Directors”, “Executive Compensation”, “Compensation Committee Report”, “Compensation Discussion and Analysis” and “Compensation Committee Interlocks and Insider Participation” in the Company’s definitive proxy statement for the 2023 Annual Meeting of Shareholders and is incorporated herein by reference.
Item 12. Security Ownership of Certain Beneficial Owners and Management and Related Stockholder Matters.
The information required by this item is contained under the captions “Voting Securities and Principal Holders Thereof”, “Security Ownership of Management” and “Equity Compensation Plans” in the Company’s definitive proxy statement for the 2023 Annual Meeting of Shareholders and is incorporated herein by reference.
Item 13. Certain Relationships and Related Transactions, and Director Independence.
The information required by this item is contained under the captions “Governance of the Company” and “Certain Relationships and Related Party Transactions” in the Company’s definitive proxy statement for the 2023 Annual Meeting of Shareholders and is incorporated herein by reference.
Item 14. Principal Accountant Fees and Services.
Our independent registered public accounting firm is KPMG LLP, Providence, RI, Auditor ID: 185.
The information required by this item is contained under the caption “Additional Information Regarding Independent Registered Public Accounting Firm” in the Company’s definitive proxy statement for the 2023 Annual Meeting of Shareholders and is incorporated herein by reference.
PART IV
Item 15. Exhibits, and Financial Statement Schedules.
(a) Consolidated Financial Statements, Consolidated Financial Statement Schedules and Exhibits
(1) Consolidated Financial Statements
Included in PART II of this report:
Report of Independent Registered Public Accounting Firm (PCAOBID 185)
Consolidated Balance Sheets at December 25, 2022 and December 26, 2021
Consolidated Statements of Operations for the Three Fiscal Years Ended in December 2022, 2021 and 2020
Consolidated Statements of Comprehensive Earnings for the Three Fiscal Years Ended in December 2022, 2021 and 2020
Consolidated Statements of Cash Flows for the Three Fiscal Years Ended in December 2022, 2021 and 2020
Consolidated Statements of Shareholders’ Equity and Redeemable Noncontrolling Interests for the Three Fiscal Years Ended in December 2022, 2021 and 2020
Notes to Consolidated Financial Statements
(2) Consolidated Financial Statement Schedules
Included in PART IV of this report:
For the Three Fiscal Years Ended in December 2022, 2021 and 2020:
Schedule II—Valuation and Qualifying Accounts
Schedules other than those listed above are omitted for the reason that they are not required or are not applicable, or the required information is shown in the consolidated financial statements or notes thereto. Columns omitted from schedules filed have been omitted because the information is not applicable.
Item 16. Form 10-K Summary.
Not applicable.
| | | | | | | | | | | |
| Exhibit | | | |
| 2. | | Plan of Acquisition |
| | (a) | |
| | |
| 3. | | Articles of Incorporation and Bylaws |
| | (a) | |
| | (b) | |
| | (c) | |
| | (d) | |
| | (e) | |
| | (f) | |
| 4. | | Instruments defining the rights of security holders, including indentures. |
| | (a) | |
| | (b) | |
| | (c) | |
| | (d) | |
| | (e) | |
| | (f) | |
| | (g) | |
| | (h) | |
| | | | | | | | | | | |
| Exhibit | | | |
| | (i) | |
| 10. | | Material Contracts |
| | (a) | |
| | (b) | |
| | (c) | |
| | (d) | |
| | Executive Compensation Plans and Arrangements |
| | (e) | |
| | (f) | |
| | (g) | |
| | (h) | |
| | (i) | |
| | (j) | |
| | (k) | |
| | (l) | |
| | (m) | |
| | (n) | |
| | (o) | |
| | (p) | |
| | (q) | |
| | | | | | | | | | | |
| Exhibit | | | |
| | (r) | |
| | (s) | |
| | (t) | |
| | (u) | |
| | (v) | |
| | (w) | |
| | (x) | |
| | (y) | |
| | (z) | |
| 21. | | | |
| 23. | | | |
| 31.1 | | | |
| 31.2 | | | |
| 32.1* | | | |
| 32.2* | | | |
| 101.INS | | | XBRL Instance Document - the instance document does not appear in the Interactive Data File because its XBRL tags are embedded within the Inline XBRL document. |
| 101.SCH | | | XBRL Taxonomy Extension Schema Document |
| 101.CAL | | | XBRL Taxonomy Calculation Linkbase Document |
| 101.LAB | | | XBRL Taxonomy Extension Labels Linkbase Document |
| 101.PRE | | | XBRL Taxonomy Extension Presentation Linkbase Document |
| 101.DEF | | | XBRL Taxonomy Extension Definition Linkbase Document |
*Furnished herewith.
The Company agrees to furnish the Securities and Exchange Commission, upon request, a copy of each agreement with respect to long-term debt of the Company, the authorized principal amount of which does not exceed 10% of the total assets of the Company and its subsidiaries on a consolidated basis.
Schedule II-Valuation and Qualifying Accounts
Fiscal Years Ended in December
(Thousands of Dollars)
| | | | | | | | | | | | | | | | | | | | | | | | | | | | | |
| | | | | | | | | |
| Valuation accounts deducted from assets to which they apply — for credit losses for accounts receivable: | Balance at
Beginning of
Year | | Expense
(Benefit) | | Other
Additions | | Write-Offs
and Other | | Balance
at End
of Year |
| 2022 | $ | 22.9 | | | $ | 7.9 | | | $ | — | | | $ | (10.8) | | | $ | 20.0 | |
| 2021 | $ | 33.6 | | | $ | 5.3 | | | $ | — | | | $ | (16.0) | | | $ | 22.9 | |
| 2020 | $ | 17.2 | | | $ | 22.5 | | | $ | — | | | $ | (6.1) | | | $ | 33.6 | |
SIGNATURES
Pursuant to the requirements of Section 13 or 15(d) of the Securities Exchange Act of 1934, the registrant has duly caused this report to be signed on its behalf by the undersigned, thereunto duly authorized.
HASBRO, INC.
(Registrant)
| | | | | | | | | | | | | | |
| By: | | /s/ Christian P. Cocks | | Date: February 22, 2023 |
| | Christian P. Cocks
Chief Executive Officer | | |
Pursuant to the requirements of the Securities Exchange Act of 1934, this report has been signed below by the following persons on behalf of the registrant and in the capacities and on the dates indicated.
| | | | | | | | | | | | | | |
| Signature | | Title | | Date |
| | | | |
| /s/ Christian P. Cocks | | Chief Executive Officer | | February 22, 2023 |
| Christian P. Cocks | | |
| | | | |
| /s/ Deborah M. Thomas | | Executive Vice President and Chief Financial Officer (Principal Financial and Accounting Officer) | | February 22, 2023 |
| Deborah M. Thomas | | |
| | | | |
| /s/ Richard S. Stoddart | | Chair of the Board of Directors | | February 22, 2023 |
| Richard S. Stoddart | | |
| | | | |
| | | | |
| | |
| | | | |
| /s/ Kenneth A. Bronfin | | Director | | February 22, 2023 |
| Kenneth A. Bronfin | | |
| | | | |
| /s/ Michael R. Burns | | Director | | February 22, 2023 |
| Michael R. Burns | | |
| | | | |
| /s/ Hope F. Cochran | | Director | | February 22, 2023 |
| Hope F. Cochran | | |
| | | | |
| /s/ Lisa Gersh | | Director | | February 22, 2023 |
| Lisa Gersh | | |
| | | | |
| /s/ Elizabeth Hamren | | Director | | February 22, 2023 |
| Elizabeth Hamren | | |
| | | | |
| /s/ Blake Jorgensen | | Director | | February 22, 2023 |
| Blake Jorgensen | | |
| | | | |
| /s/ Tracy A. Leinbach | | Director | | February 22, 2023 |
| Tracy A. Leinbach | | |
| | | | |
| /s/ Edward M. Philip | | Director | | February 22, 2023 |
| Edward M. Philip | | |
| | | | |
| /s/ Laurel J. Richie | | Director | | February 22, 2023 |
| Laurel J. Richie | | |
| | | | |
| /s/ Mary Beth West | | Director | | February 22, 2023 |
| Mary Beth West | | |
| | | | |
| /s/ Linda K. Zecher Higgins | | Director | | February 22, 2023 |
| Linda K. Zecher Higgins | | |